Los Chaves, NM Map & Demographics
Los Chaves Map
Los Chaves Overview
$42,806
PER CAPITA INCOME
$81,849
AVG FAMILY INCOME
$77,364
AVG HOUSEHOLD INCOME
5.1%
WAGE / INCOME GAP [ % ]
94.9¢/ $1
WAGE / INCOME GAP [ $ ]
0.49
INEQUALITY / GINI INDEX
4,840
TOTAL POPULATION
2,323
MALE POPULATION
2,517
FEMALE POPULATION
92.29
MALES / 100 FEMALES
108.35
FEMALES / 100 MALES
40.3
MEDIAN AGE
3.2
AVG FAMILY SIZE
2.9
AVG HOUSEHOLD SIZE
2,243
LABOR FORCE [ PEOPLE ]
57.0%
PERCENT IN LABOR FORCE
3.6%
UNEMPLOYMENT RATE
Income in Los Chaves
Income Overview in Los Chaves
Per Capita Income in Los Chaves is $42,806, while median incomes of families and households are $81,849 and $77,364 respectively.
| Characteristic | Number | Measure |
| Per Capita Income | 4,840 | $42,806 |
| Median Family Income | 1,128 | $81,849 |
| Mean Family Income | 1,128 | $101,712 |
| Median Household Income | 1,693 | $77,364 |
| Mean Household Income | 1,693 | $108,753 |
| Income Deficit | 1,128 | $0 |
| Wage / Income Gap (%) | 4,840 | 5.11% |
| Wage / Income Gap ($) | 4,840 | 94.89¢ per $1 |
| Gini / Inequality Index | 4,840 | 0.49 |
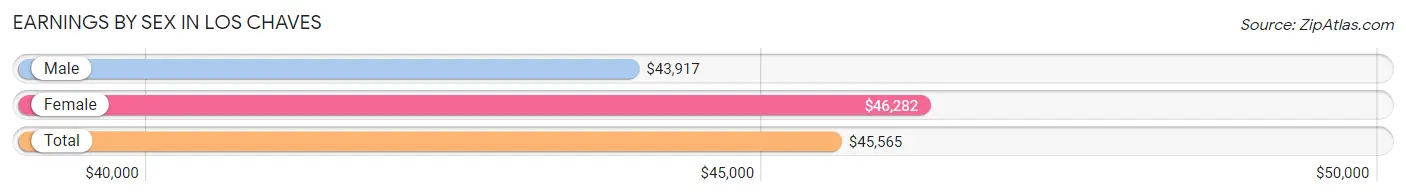
Earnings by Sex in Los Chaves
Average Earnings in Los Chaves are $45,565, $43,917 for men and $46,282 for women, a difference of 5.1%.
| Sex | Number | Average Earnings |
| Male | 1,129 (47.6%) | $43,917 |
| Female | 1,243 (52.4%) | $46,282 |
| Total | 2,372 (100.0%) | $45,565 |
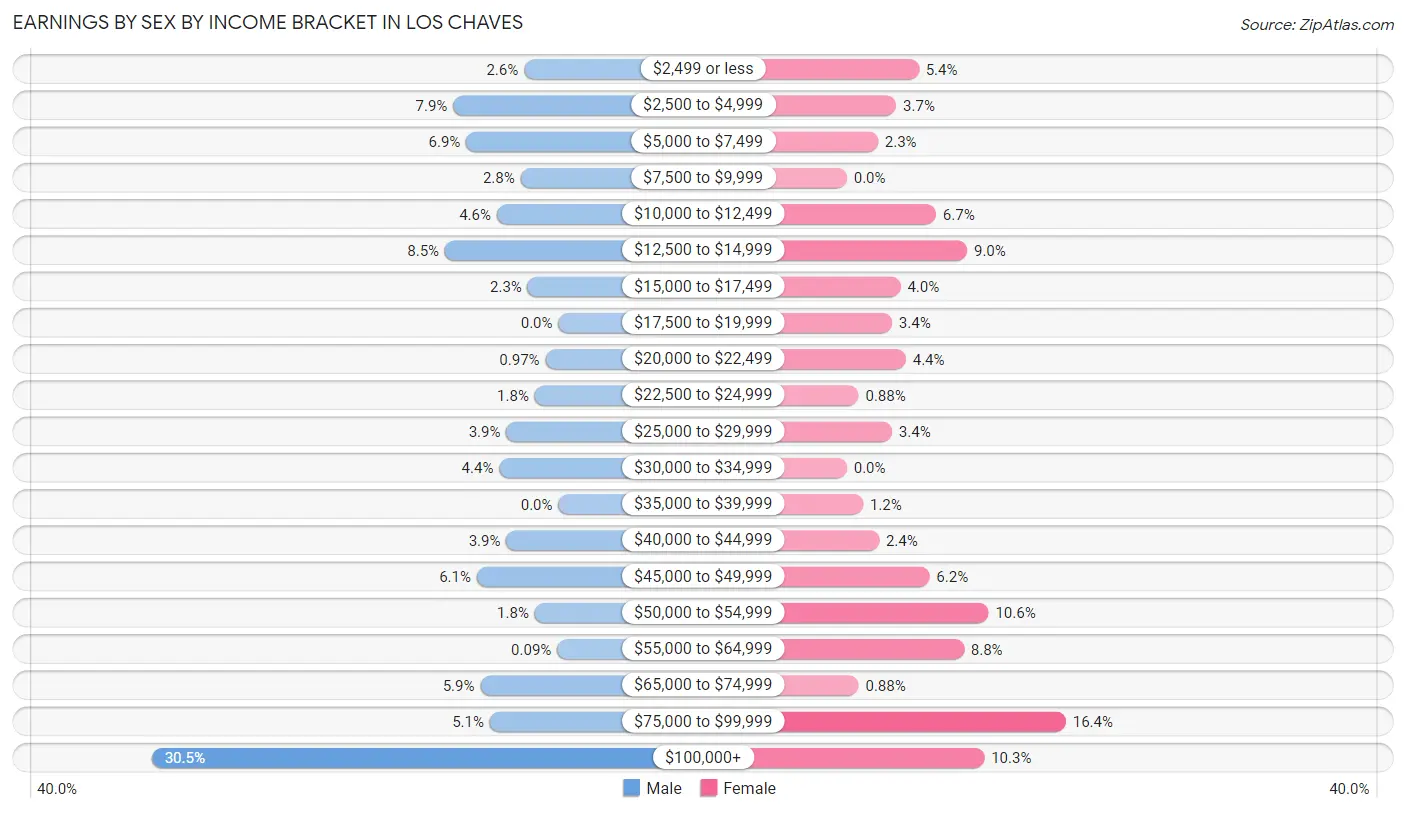
Earnings by Sex by Income Bracket in Los Chaves
The most common earnings brackets in Los Chaves are $100,000+ for men (344 | 30.5%) and $75,000 to $99,999 for women (204 | 16.4%).
| Income | Male | Female |
| $2,499 or less | 29 (2.6%) | 67 (5.4%) |
| $2,500 to $4,999 | 89 (7.9%) | 46 (3.7%) |
| $5,000 to $7,499 | 78 (6.9%) | 29 (2.3%) |
| $7,500 to $9,999 | 32 (2.8%) | 0 (0.0%) |
| $10,000 to $12,499 | 52 (4.6%) | 83 (6.7%) |
| $12,500 to $14,999 | 96 (8.5%) | 112 (9.0%) |
| $15,000 to $17,499 | 26 (2.3%) | 50 (4.0%) |
| $17,500 to $19,999 | 0 (0.0%) | 42 (3.4%) |
| $20,000 to $22,499 | 11 (1.0%) | 55 (4.4%) |
| $22,500 to $24,999 | 20 (1.8%) | 11 (0.9%) |
| $25,000 to $29,999 | 44 (3.9%) | 42 (3.4%) |
| $30,000 to $34,999 | 50 (4.4%) | 0 (0.0%) |
| $35,000 to $39,999 | 0 (0.0%) | 15 (1.2%) |
| $40,000 to $44,999 | 44 (3.9%) | 30 (2.4%) |
| $45,000 to $49,999 | 69 (6.1%) | 77 (6.2%) |
| $50,000 to $54,999 | 20 (1.8%) | 132 (10.6%) |
| $55,000 to $64,999 | 1 (0.1%) | 109 (8.8%) |
| $65,000 to $74,999 | 66 (5.9%) | 11 (0.9%) |
| $75,000 to $99,999 | 58 (5.1%) | 204 (16.4%) |
| $100,000+ | 344 (30.5%) | 128 (10.3%) |
| Total | 1,129 (100.0%) | 1,243 (100.0%) |
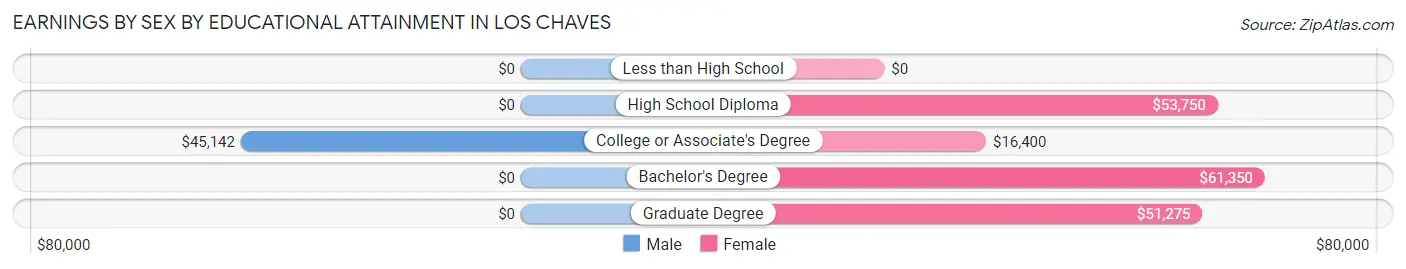
Earnings by Sex by Educational Attainment in Los Chaves
Average earnings in Los Chaves are $46,322 for men and $50,275 for women, a difference of 7.9%. Men with an educational attainment of college or associate's degree enjoy the highest average annual earnings of $45,142, while those with college or associate's degree education earn the least with $45,142. Women with an educational attainment of bachelor's degree earn the most with the average annual earnings of $61,350, while those with college or associate's degree education have the smallest earnings of $16,400.
| Educational Attainment | Male Income | Female Income |
| Less than High School | - | - |
| High School Diploma | - | - |
| College or Associate's Degree | $45,142 | $16,400 |
| Bachelor's Degree | - | - |
| Graduate Degree | - | - |
| Total | $46,322 | $50,275 |
Family Income in Los Chaves
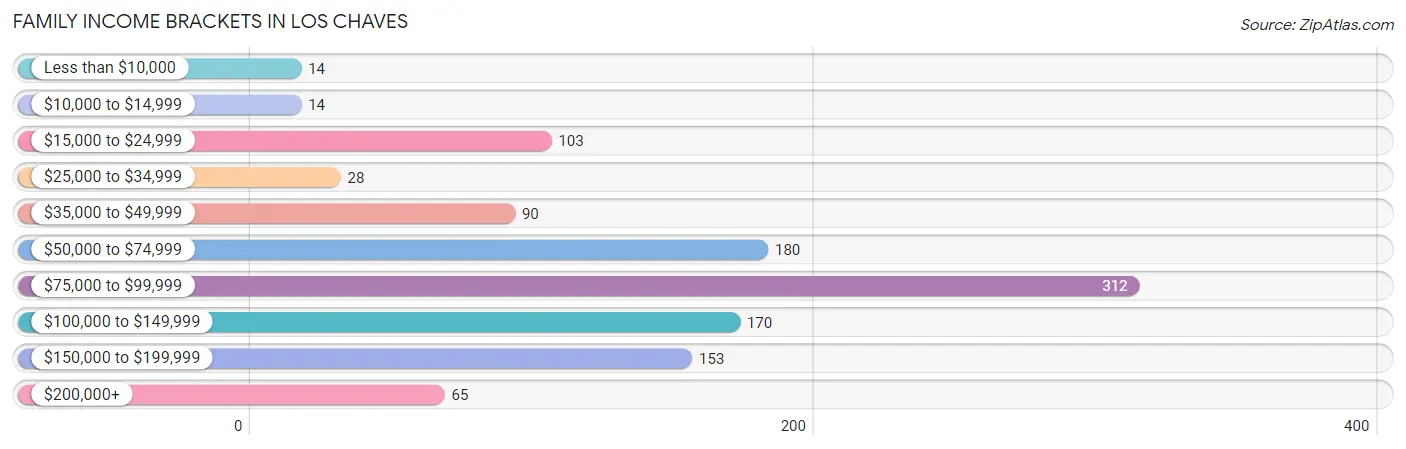
Family Income Brackets in Los Chaves
According to the Los Chaves family income data, there are 312 families falling into the $75,000 to $99,999 income range, which is the most common income bracket and makes up 27.7% of all families. Conversely, the less than $10,000 income bracket is the least frequent group with only 14 families (1.2%) belonging to this category.
| Income Bracket | # Families | % Families |
| Less than $10,000 | 14 | 1.2% |
| $10,000 to $14,999 | 14 | 1.2% |
| $15,000 to $24,999 | 103 | 9.1% |
| $25,000 to $34,999 | 28 | 2.5% |
| $35,000 to $49,999 | 90 | 8.0% |
| $50,000 to $74,999 | 180 | 16.0% |
| $75,000 to $99,999 | 312 | 27.7% |
| $100,000 to $149,999 | 170 | 15.1% |
| $150,000 to $199,999 | 153 | 13.6% |
| $200,000+ | 65 | 5.8% |
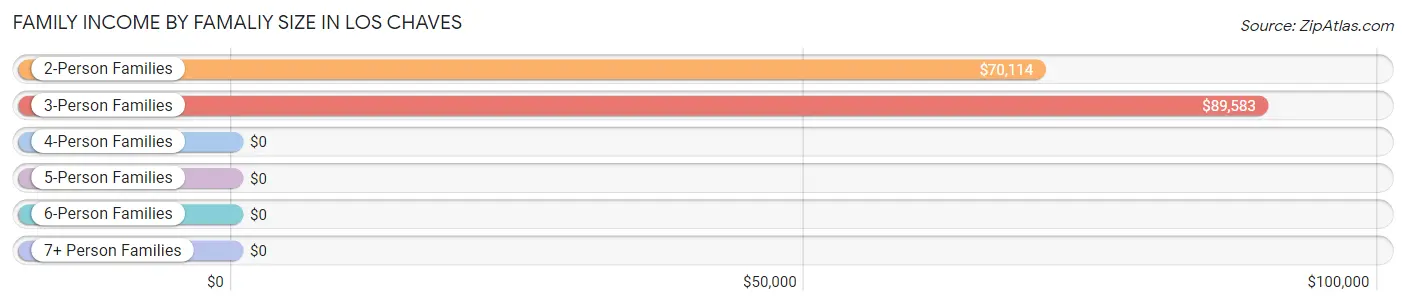
Family Income by Famaliy Size in Los Chaves
3-person families (211 | 18.7%) account for the highest median family income in Los Chaves with $89,583 per family, while 2-person families (637 | 56.5%) have the highest median income of $35,057 per family member.
| Income Bracket | # Families | Median Income |
| 2-Person Families | 637 (56.5%) | $70,114 |
| 3-Person Families | 211 (18.7%) | $89,583 |
| 4-Person Families | 125 (11.1%) | $0 |
| 5-Person Families | 107 (9.5%) | $0 |
| 6-Person Families | 22 (1.9%) | $0 |
| 7+ Person Families | 26 (2.3%) | $0 |
| Total | 1,128 (100.0%) | $81,849 |
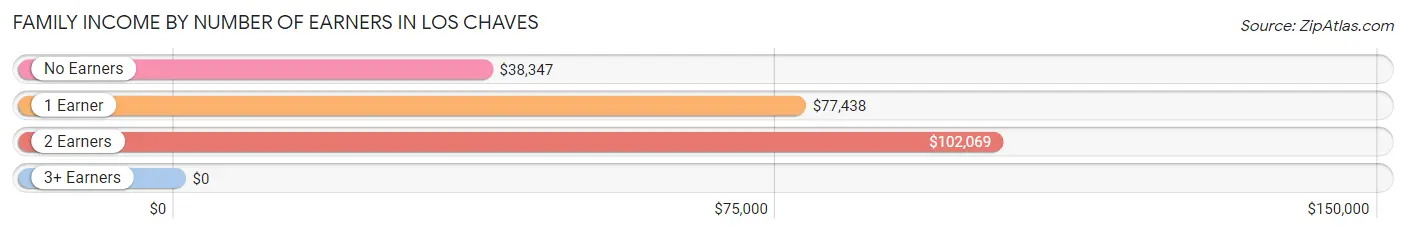
Family Income by Number of Earners in Los Chaves
| Number of Earners | # Families | Median Income |
| No Earners | 182 (16.1%) | $38,347 |
| 1 Earner | 405 (35.9%) | $77,438 |
| 2 Earners | 494 (43.8%) | $102,069 |
| 3+ Earners | 47 (4.2%) | $0 |
| Total | 1,128 (100.0%) | $81,849 |
Household Income in Los Chaves
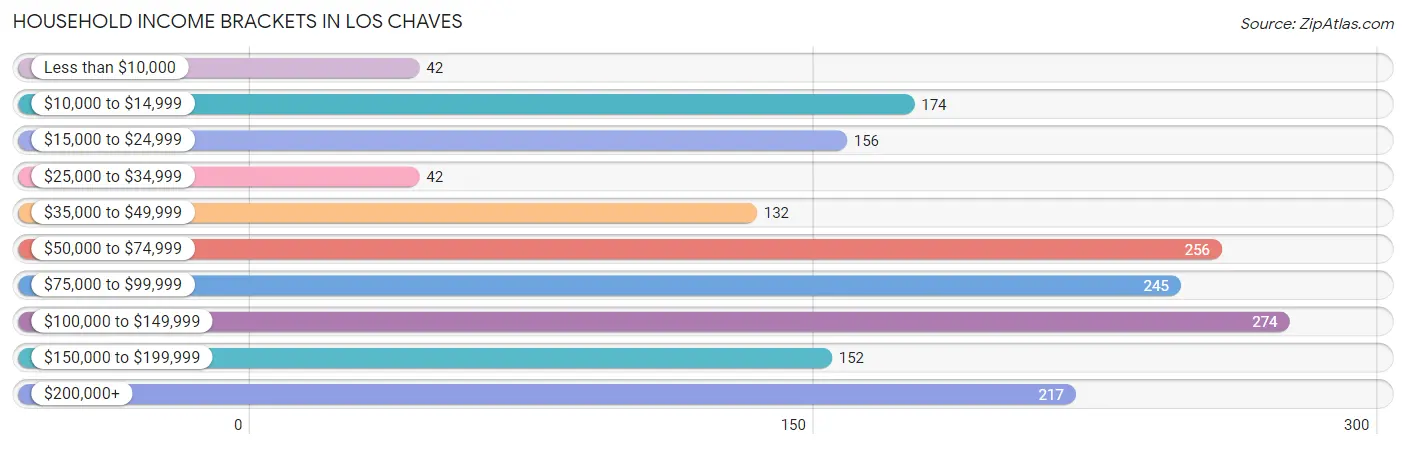
Household Income Brackets in Los Chaves
With 274 households falling in the category, the $100,000 to $149,999 income range is the most frequent in Los Chaves, accounting for 16.2% of all households. In contrast, only 42 households (2.5%) fall into the less than $10,000 income bracket, making it the least populous group.
| Income Bracket | # Households | % Households |
| Less than $10,000 | 42 | 2.5% |
| $10,000 to $14,999 | 174 | 10.3% |
| $15,000 to $24,999 | 156 | 9.2% |
| $25,000 to $34,999 | 42 | 2.5% |
| $35,000 to $49,999 | 132 | 7.8% |
| $50,000 to $74,999 | 256 | 15.1% |
| $75,000 to $99,999 | 245 | 14.5% |
| $100,000 to $149,999 | 274 | 16.2% |
| $150,000 to $199,999 | 152 | 9.0% |
| $200,000+ | 217 | 12.8% |
Household Income by Householder Age in Los Chaves
The median household income in Los Chaves is $77,364, with the highest median household income of $137,753 found in the 25 to 44 years age bracket for the primary householder. A total of 595 households (35.1%) fall into this category.
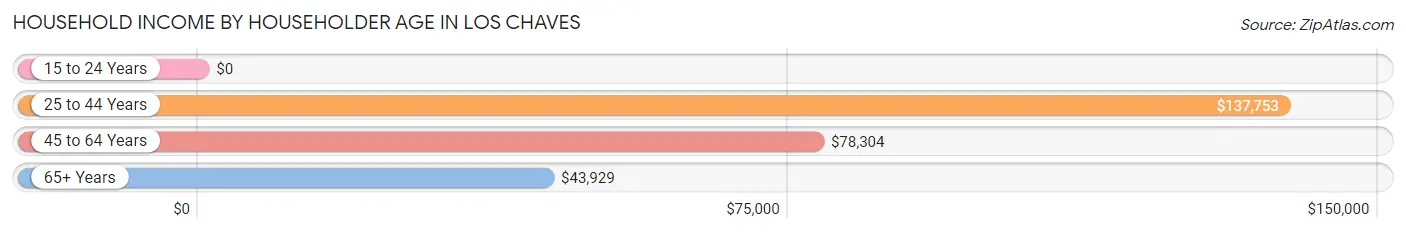
| Income Bracket | # Households | Median Income |
| 15 to 24 Years | 0 (0.0%) | $0 |
| 25 to 44 Years | 595 (35.1%) | $137,753 |
| 45 to 64 Years | 526 (31.1%) | $78,304 |
| 65+ Years | 572 (33.8%) | $43,929 |
| Total | 1,693 (100.0%) | $77,364 |
Poverty in Los Chaves
Income Below Poverty by Sex and Age in Los Chaves
With 12.5% poverty level for males and 22.3% for females among the residents of Los Chaves, 18 to 24 year old males and 55 to 64 year old females are the most vulnerable to poverty, with 68 males (65.4%) and 263 females (48.3%) in their respective age groups living below the poverty level.
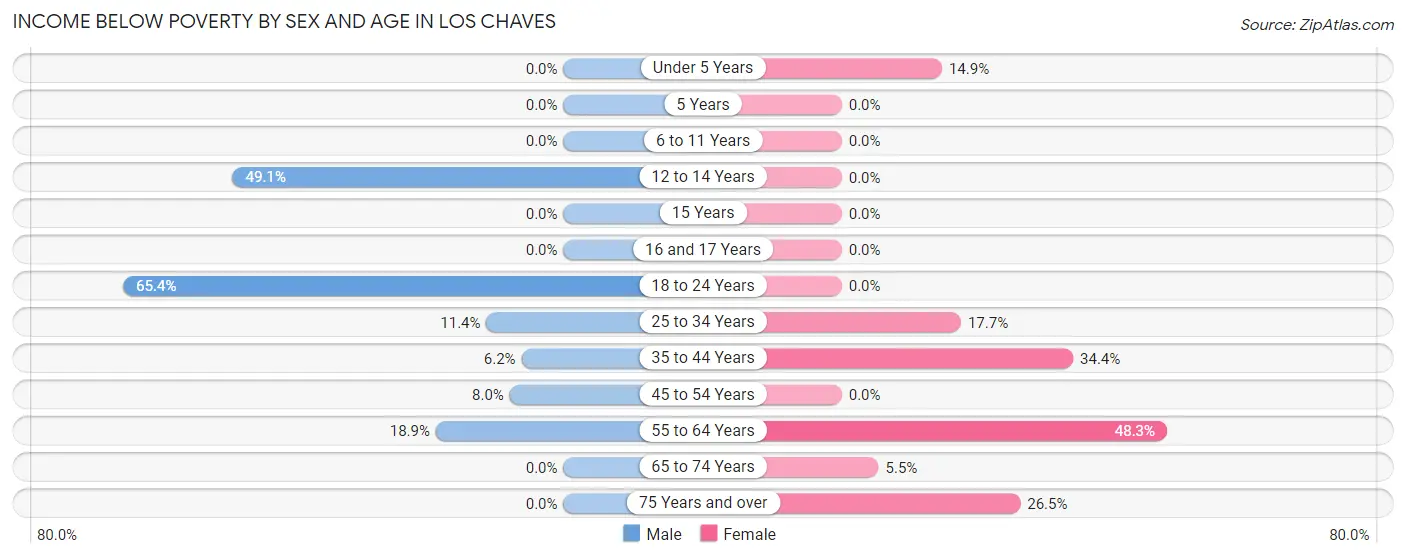
| Age Bracket | Male | Female |
| Under 5 Years | 0 (0.0%) | 25 (14.9%) |
| 5 Years | 0 (0.0%) | 0 (0.0%) |
| 6 to 11 Years | 0 (0.0%) | 0 (0.0%) |
| 12 to 14 Years | 55 (49.1%) | 0 (0.0%) |
| 15 Years | 0 (0.0%) | 0 (0.0%) |
| 16 and 17 Years | 0 (0.0%) | 0 (0.0%) |
| 18 to 24 Years | 68 (65.4%) | 0 (0.0%) |
| 25 to 34 Years | 28 (11.4%) | 63 (17.7%) |
| 35 to 44 Years | 28 (6.2%) | 135 (34.4%) |
| 45 to 54 Years | 20 (8.0%) | 0 (0.0%) |
| 55 to 64 Years | 89 (18.9%) | 263 (48.3%) |
| 65 to 74 Years | 0 (0.0%) | 13 (5.5%) |
| 75 Years and over | 0 (0.0%) | 62 (26.5%) |
| Total | 288 (12.5%) | 561 (22.3%) |
Income Above Poverty by Sex and Age in Los Chaves
According to the poverty statistics in Los Chaves, males aged under 5 years and females aged 5 years are the age groups that are most secure financially, with 100.0% of males and 100.0% of females in these age groups living above the poverty line.
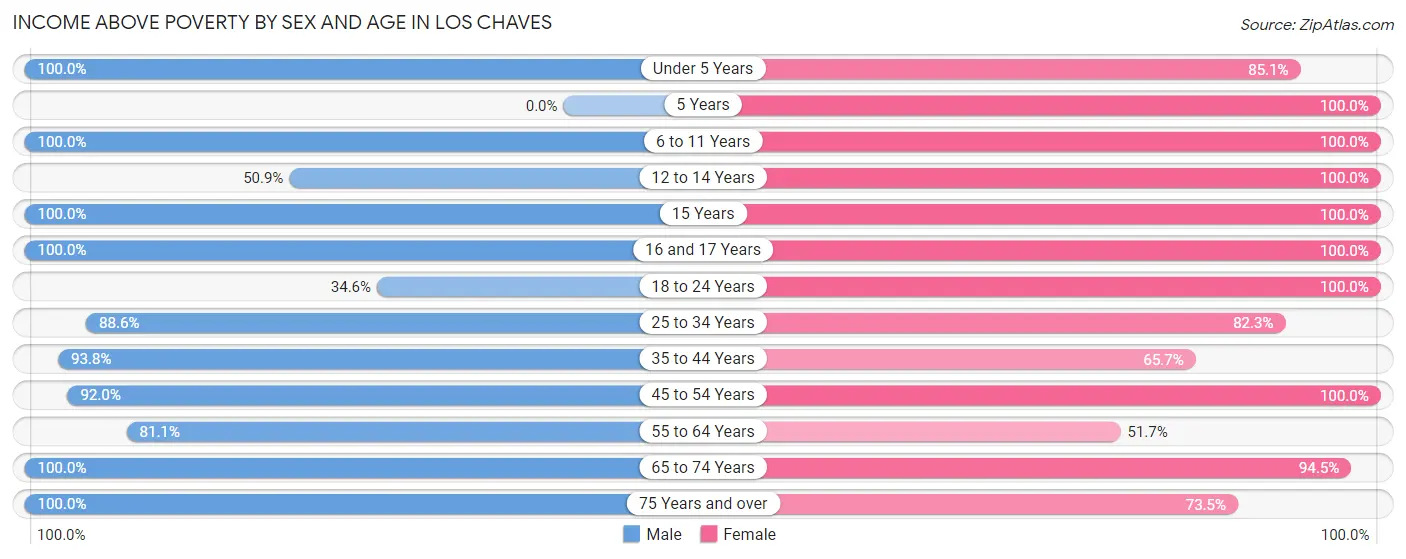
| Age Bracket | Male | Female |
| Under 5 Years | 50 (100.0%) | 143 (85.1%) |
| 5 Years | 0 (0.0%) | 72 (100.0%) |
| 6 to 11 Years | 197 (100.0%) | 207 (100.0%) |
| 12 to 14 Years | 57 (50.9%) | 35 (100.0%) |
| 15 Years | 15 (100.0%) | 37 (100.0%) |
| 16 and 17 Years | 15 (100.0%) | 47 (100.0%) |
| 18 to 24 Years | 36 (34.6%) | 57 (100.0%) |
| 25 to 34 Years | 217 (88.6%) | 293 (82.3%) |
| 35 to 44 Years | 422 (93.8%) | 258 (65.6%) |
| 45 to 54 Years | 231 (92.0%) | 128 (100.0%) |
| 55 to 64 Years | 381 (81.1%) | 282 (51.7%) |
| 65 to 74 Years | 327 (100.0%) | 225 (94.5%) |
| 75 Years and over | 75 (100.0%) | 172 (73.5%) |
| Total | 2,023 (87.5%) | 1,956 (77.7%) |
Income Below Poverty Among Married-Couple Families in Los Chaves
The poverty statistics for married-couple families in Los Chaves show that 3.2% or 26 of the total 825 families live below the poverty line. Families with 3 or 4 children have the highest poverty rate of 16.8%, comprising of 26 families. On the other hand, families with no children have the lowest poverty rate of 0.0%, which includes 0 families.
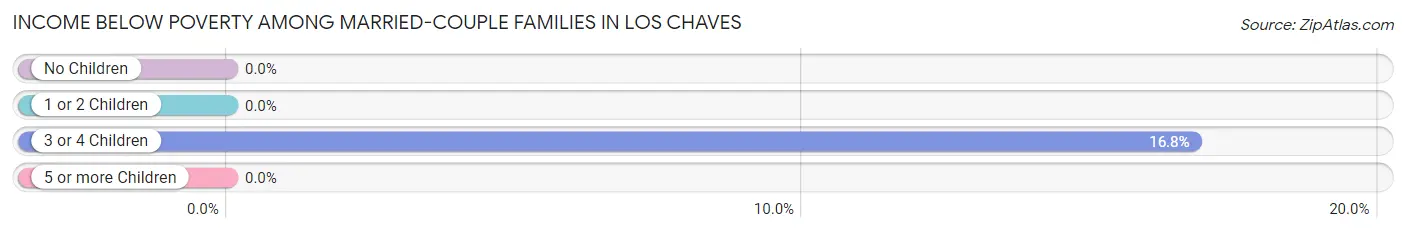
| Children | Above Poverty | Below Poverty |
| No Children | 536 (100.0%) | 0 (0.0%) |
| 1 or 2 Children | 134 (100.0%) | 0 (0.0%) |
| 3 or 4 Children | 129 (83.2%) | 26 (16.8%) |
| 5 or more Children | 0 (0.0%) | 0 (0.0%) |
| Total | 799 (96.9%) | 26 (3.2%) |
Income Below Poverty Among Single-Parent Households in Los Chaves
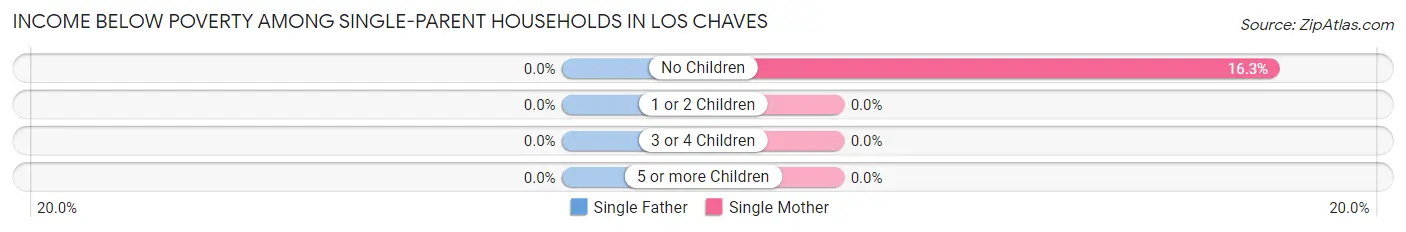
| Children | Single Father | Single Mother |
| No Children | 0 (0.0%) | 26 (16.3%) |
| 1 or 2 Children | 0 (0.0%) | 0 (0.0%) |
| 3 or 4 Children | 0 (0.0%) | 0 (0.0%) |
| 5 or more Children | 0 (0.0%) | 0 (0.0%) |
| Total | 0 (0.0%) | 26 (10.2%) |
Income Below Poverty Among Married-Couple vs Single-Parent Households in Los Chaves
The poverty data for Los Chaves shows that 26 of the married-couple family households (3.2%) and 26 of the single-parent households (8.6%) are living below the poverty level. Within the married-couple family households, those with 3 or 4 children have the highest poverty rate, with 26 households (16.8%) falling below the poverty line. Among the single-parent households, those with no children have the highest poverty rate, with 26 household (13.1%) living below poverty.
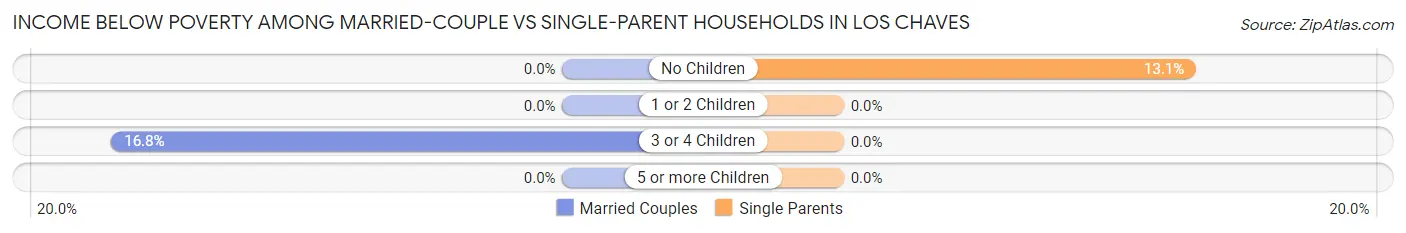
| Children | Married-Couple Families | Single-Parent Households |
| No Children | 0 (0.0%) | 26 (13.1%) |
| 1 or 2 Children | 0 (0.0%) | 0 (0.0%) |
| 3 or 4 Children | 26 (16.8%) | 0 (0.0%) |
| 5 or more Children | 0 (0.0%) | 0 (0.0%) |
| Total | 26 (3.2%) | 26 (8.6%) |
Race in Los Chaves
The most populous races in Los Chaves are White / Caucasian (3,117 | 64.4%), Hispanic or Latino (2,721 | 56.2%), and Two or more Races (1,142 | 23.6%).
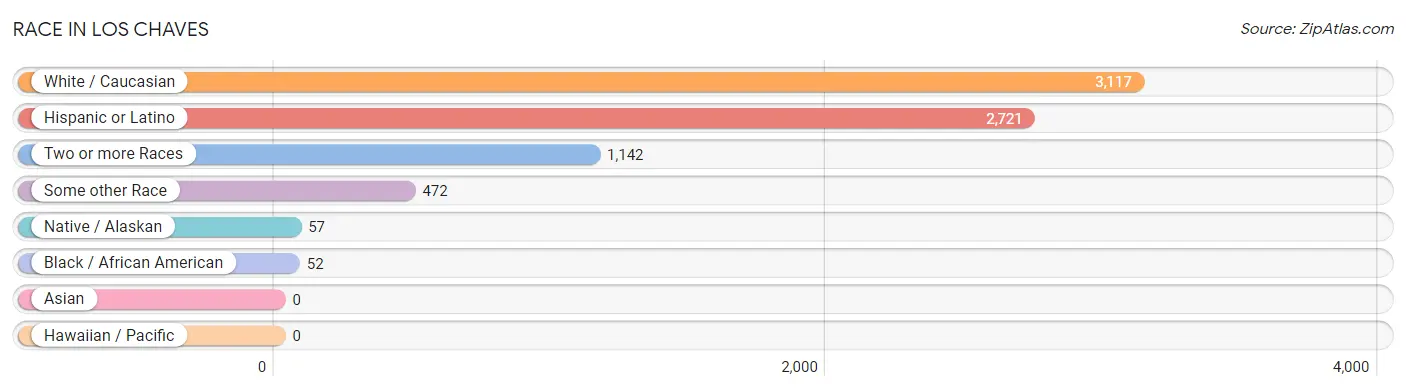
| Race | # Population | % Population |
| Asian | 0 | 0.0% |
| Black / African American | 52 | 1.1% |
| Hawaiian / Pacific | 0 | 0.0% |
| Hispanic or Latino | 2,721 | 56.2% |
| Native / Alaskan | 57 | 1.2% |
| White / Caucasian | 3,117 | 64.4% |
| Two or more Races | 1,142 | 23.6% |
| Some other Race | 472 | 9.8% |
| Total | 4,840 | 100.0% |
Ancestry in Los Chaves
The most populous ancestries reported in Los Chaves are Mexican (701 | 14.5%), German (553 | 11.4%), Spanish (526 | 10.9%), Spaniard (489 | 10.1%), and American (352 | 7.3%), together accounting for 54.1% of all Los Chaves residents.
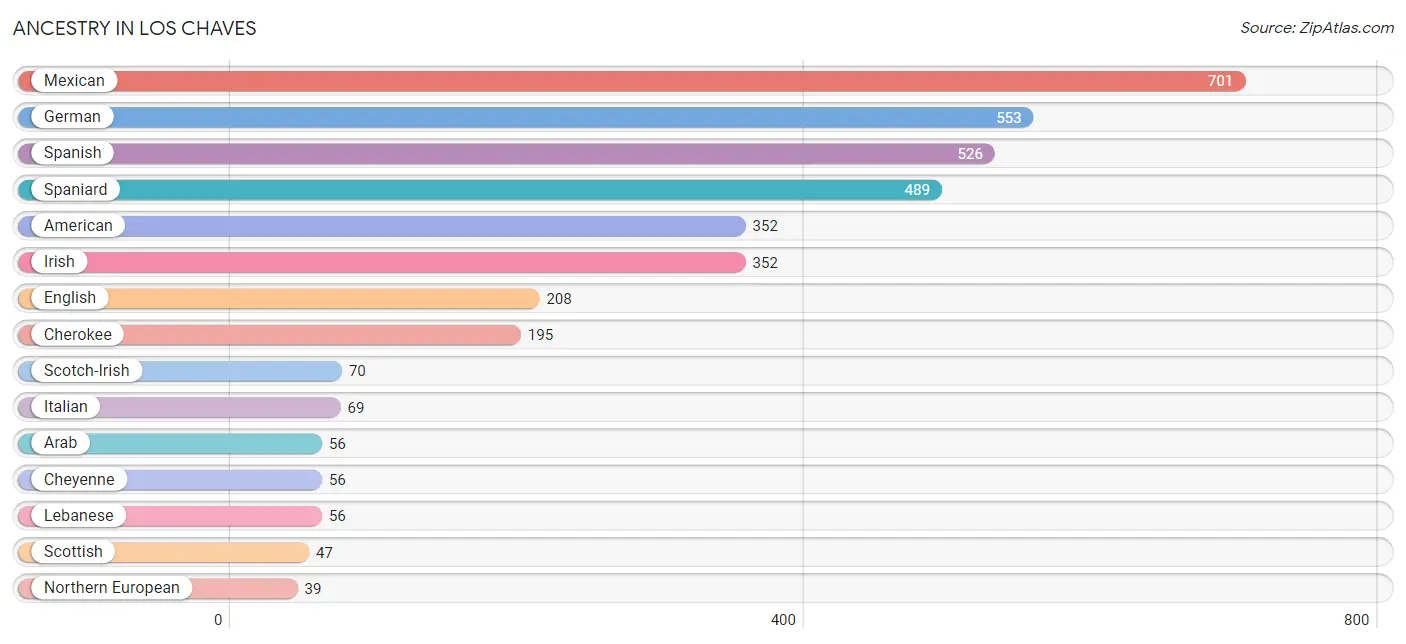
| Ancestry | # Population | % Population |
| American | 352 | 7.3% |
| Arab | 56 | 1.2% |
| Cherokee | 195 | 4.0% |
| Cheyenne | 56 | 1.2% |
| Chickasaw | 21 | 0.4% |
| Choctaw | 21 | 0.4% |
| Danish | 5 | 0.1% |
| Dutch | 30 | 0.6% |
| English | 208 | 4.3% |
| French | 31 | 0.6% |
| French Canadian | 18 | 0.4% |
| German | 553 | 11.4% |
| Greek | 10 | 0.2% |
| Hungarian | 22 | 0.4% |
| Indian (Asian) | 17 | 0.4% |
| Irish | 352 | 7.3% |
| Italian | 69 | 1.4% |
| Korean | 8 | 0.2% |
| Lebanese | 56 | 1.2% |
| Mexican | 701 | 14.5% |
| Native Hawaiian | 17 | 0.4% |
| Northern European | 39 | 0.8% |
| Norwegian | 15 | 0.3% |
| Portuguese | 4 | 0.1% |
| Pueblo | 1 | 0.0% |
| Russian | 22 | 0.4% |
| Scotch-Irish | 70 | 1.5% |
| Scottish | 47 | 1.0% |
| Spaniard | 489 | 10.1% |
| Spanish | 526 | 10.9% |
| Ukrainian | 8 | 0.2% |
| Welsh | 38 | 0.8% | View All 32 Rows |
Immigrants in Los Chaves
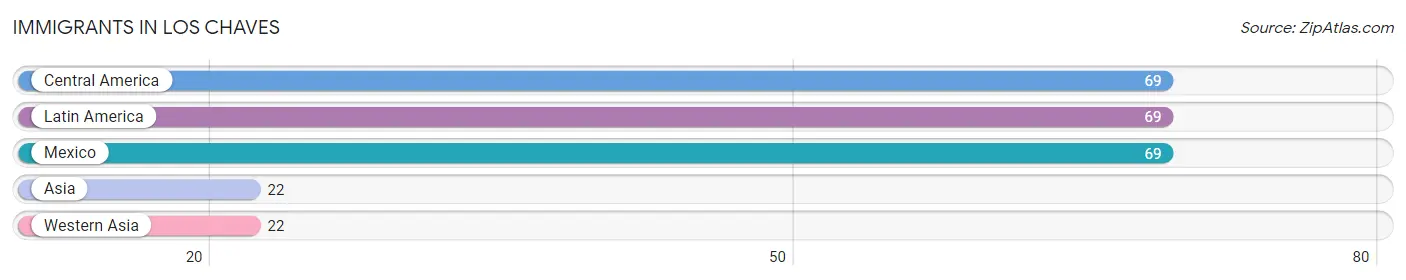
The most numerous immigrant groups reported in Los Chaves came from Central America (69 | 1.4%), Latin America (69 | 1.4%), Mexico (69 | 1.4%), Asia (22 | 0.4%), and Western Asia (22 | 0.4%), together accounting for 5.2% of all Los Chaves residents.
| Immigration Origin | # Population | % Population |
| Asia | 22 | 0.4% |
| Central America | 69 | 1.4% |
| Latin America | 69 | 1.4% |
| Mexico | 69 | 1.4% |
| Western Asia | 22 | 0.4% | View All 5 Rows |
Sex and Age in Los Chaves
Sex and Age in Los Chaves
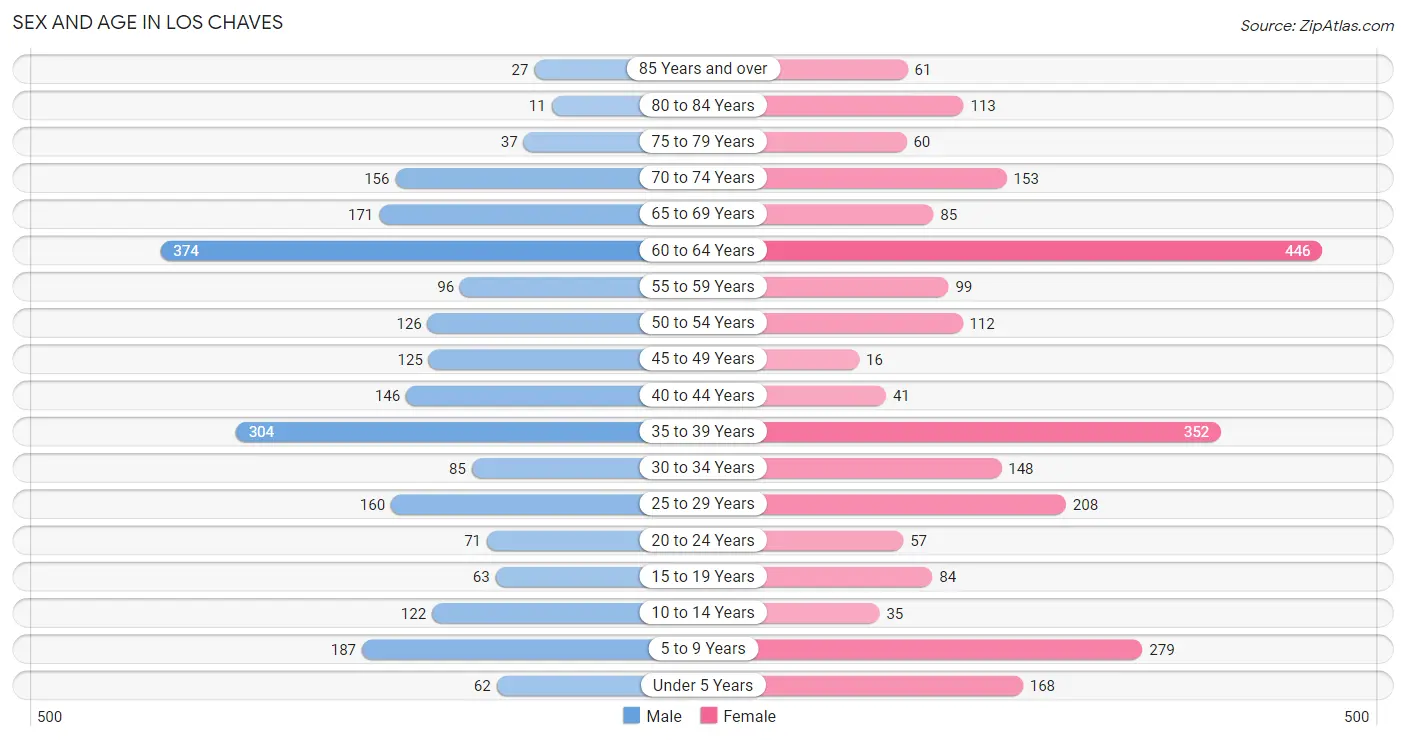
The most populous age groups in Los Chaves are 60 to 64 Years (374 | 16.1%) for men and 60 to 64 Years (446 | 17.7%) for women.
| Age Bracket | Male | Female |
| Under 5 Years | 62 (2.7%) | 168 (6.7%) |
| 5 to 9 Years | 187 (8.1%) | 279 (11.1%) |
| 10 to 14 Years | 122 (5.2%) | 35 (1.4%) |
| 15 to 19 Years | 63 (2.7%) | 84 (3.3%) |
| 20 to 24 Years | 71 (3.1%) | 57 (2.3%) |
| 25 to 29 Years | 160 (6.9%) | 208 (8.3%) |
| 30 to 34 Years | 85 (3.7%) | 148 (5.9%) |
| 35 to 39 Years | 304 (13.1%) | 352 (14.0%) |
| 40 to 44 Years | 146 (6.3%) | 41 (1.6%) |
| 45 to 49 Years | 125 (5.4%) | 16 (0.6%) |
| 50 to 54 Years | 126 (5.4%) | 112 (4.4%) |
| 55 to 59 Years | 96 (4.1%) | 99 (3.9%) |
| 60 to 64 Years | 374 (16.1%) | 446 (17.7%) |
| 65 to 69 Years | 171 (7.4%) | 85 (3.4%) |
| 70 to 74 Years | 156 (6.7%) | 153 (6.1%) |
| 75 to 79 Years | 37 (1.6%) | 60 (2.4%) |
| 80 to 84 Years | 11 (0.5%) | 113 (4.5%) |
| 85 Years and over | 27 (1.2%) | 61 (2.4%) |
| Total | 2,323 (100.0%) | 2,517 (100.0%) |
Families and Households in Los Chaves
Median Family Size in Los Chaves
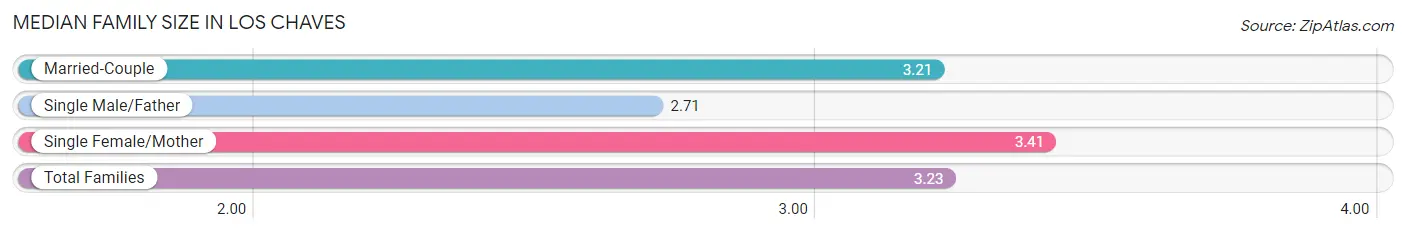
The median family size in Los Chaves is 3.23 persons per family, with single female/mother families (254 | 22.5%) accounting for the largest median family size of 3.41 persons per family. On the other hand, single male/father families (49 | 4.3%) represent the smallest median family size with 2.71 persons per family.
| Family Type | # Families | Family Size |
| Married-Couple | 825 (73.1%) | 3.21 |
| Single Male/Father | 49 (4.3%) | 2.71 |
| Single Female/Mother | 254 (22.5%) | 3.41 |
| Total Families | 1,128 (100.0%) | 3.23 |
Median Household Size in Los Chaves
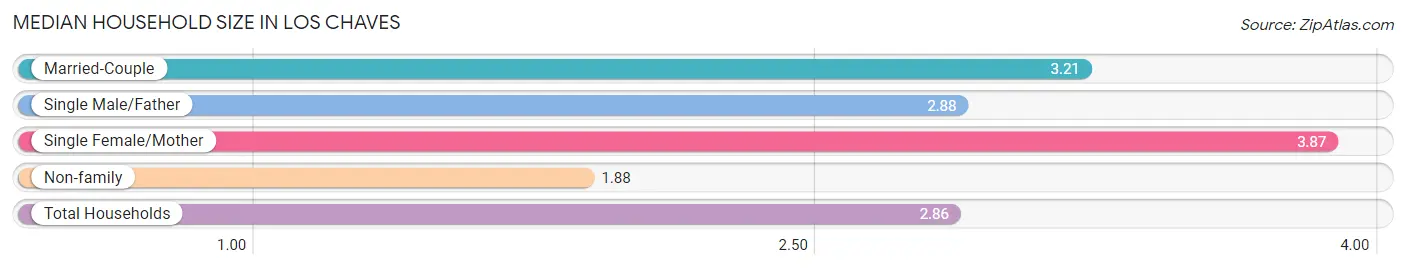
The median household size in Los Chaves is 2.86 persons per household, with single female/mother households (254 | 15.0%) accounting for the largest median household size of 3.87 persons per household. non-family households (565 | 33.4%) represent the smallest median household size with 1.88 persons per household.
| Household Type | # Households | Household Size |
| Married-Couple | 825 (48.7%) | 3.21 |
| Single Male/Father | 49 (2.9%) | 2.88 |
| Single Female/Mother | 254 (15.0%) | 3.87 |
| Non-family | 565 (33.4%) | 1.88 |
| Total Households | 1,693 (100.0%) | 2.86 |
Household Size by Marriage Status in Los Chaves
Out of a total of 1,693 households in Los Chaves, 1,128 (66.6%) are family households, while 565 (33.4%) are nonfamily households. The most numerous type of family households are 2-person households, comprising 613, and the most common type of nonfamily households are 1-person households, comprising 356.
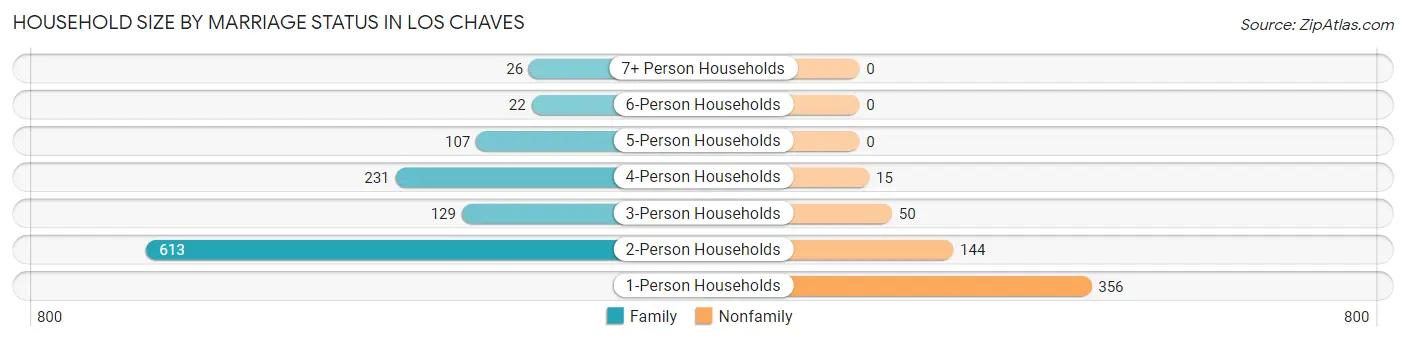
| Household Size | Family Households | Nonfamily Households |
| 1-Person Households | - | 356 (21.0%) |
| 2-Person Households | 613 (36.2%) | 144 (8.5%) |
| 3-Person Households | 129 (7.6%) | 50 (2.9%) |
| 4-Person Households | 231 (13.6%) | 15 (0.9%) |
| 5-Person Households | 107 (6.3%) | 0 (0.0%) |
| 6-Person Households | 22 (1.3%) | 0 (0.0%) |
| 7+ Person Households | 26 (1.5%) | 0 (0.0%) |
| Total | 1,128 (66.6%) | 565 (33.4%) |
Female Fertility in Los Chaves
Fertility by Age in Los Chaves
Average fertility rate in Los Chaves is 121.0 births per 1,000 women. Women in the age bracket of 20 to 34 years have the highest fertility rate with 165.0 births per 1,000 women. Women in the age bracket of 20 to 34 years acount for 61.8% of all women with births.
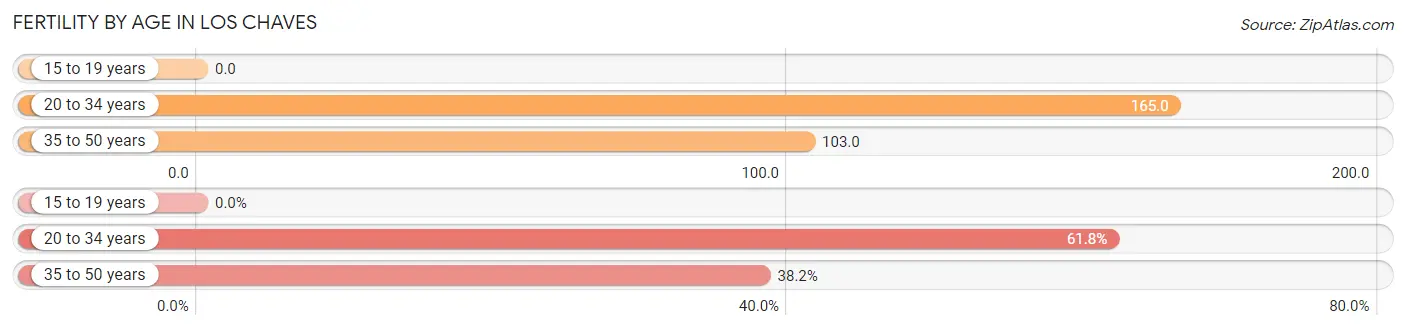
| Age Bracket | Women with Births | Births / 1,000 Women |
| 15 to 19 years | 0 (0.0%) | 0.0 |
| 20 to 34 years | 68 (61.8%) | 165.0 |
| 35 to 50 years | 42 (38.2%) | 103.0 |
| Total | 110 (100.0%) | 121.0 |
Fertility by Age by Marriage Status in Los Chaves
92.7% of women with births (110) in Los Chaves are married. The highest percentage of unmarried women with births falls into 20 to 34 years age bracket with 11.8% of them unmarried at the time of birth, while the lowest percentage of unmarried women with births belong to 35 to 50 years age bracket with 0.0% of them unmarried.
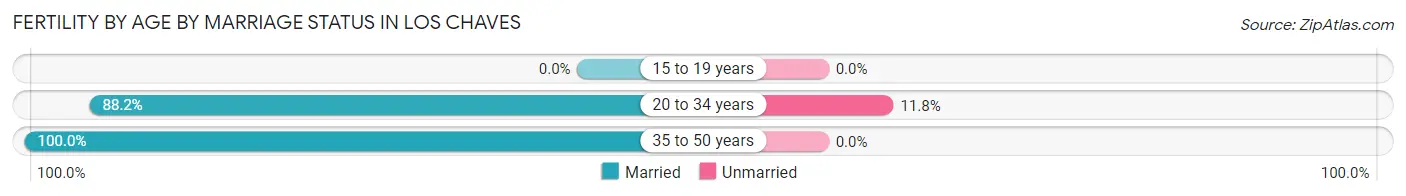
| Age Bracket | Married | Unmarried |
| 15 to 19 years | 0 (0.0%) | 0 (0.0%) |
| 20 to 34 years | 60 (88.2%) | 8 (11.8%) |
| 35 to 50 years | 42 (100.0%) | 0 (0.0%) |
| Total | 102 (92.7%) | 8 (7.3%) |
Fertility by Education in Los Chaves
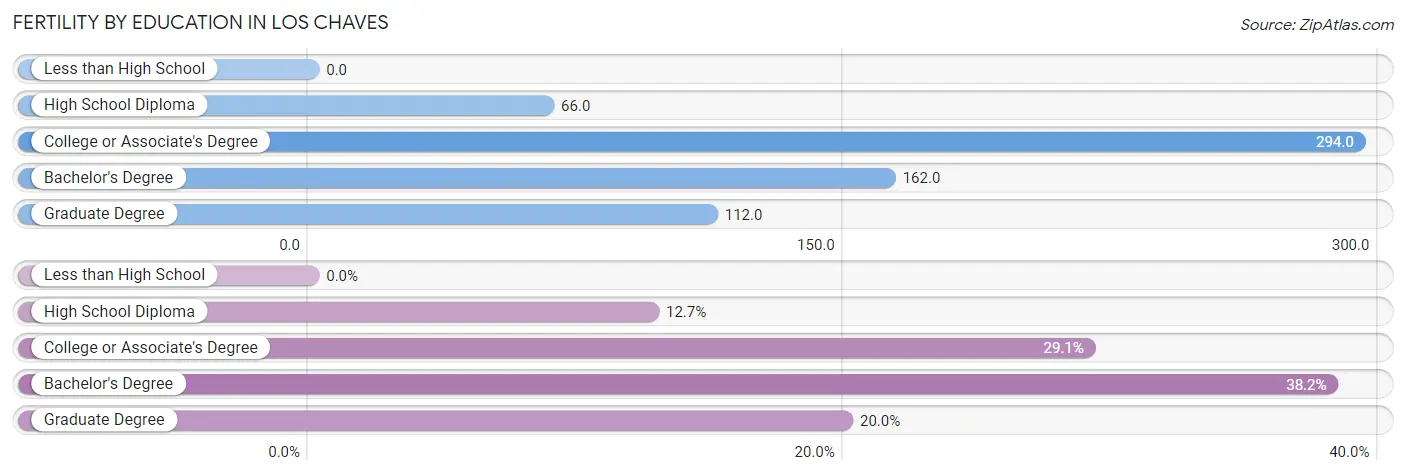
| Educational Attainment | Women with Births | Births / 1,000 Women |
| Less than High School | 0 (0.0%) | 0.0 |
| High School Diploma | 14 (12.7%) | 66.0 |
| College or Associate's Degree | 32 (29.1%) | 294.0 |
| Bachelor's Degree | 42 (38.2%) | 162.0 |
| Graduate Degree | 22 (20.0%) | 112.0 |
| Total | 110 (100.0%) | 121.0 |
Fertility by Education by Marriage Status in Los Chaves
7.3% of women with births in Los Chaves are unmarried. Women with the educational attainment of high school diploma are most likely to be married with 100.0% of them married at childbirth, while women with the educational attainment of college or associate's degree are least likely to be married with 25.0% of them unmarried at childbirth.
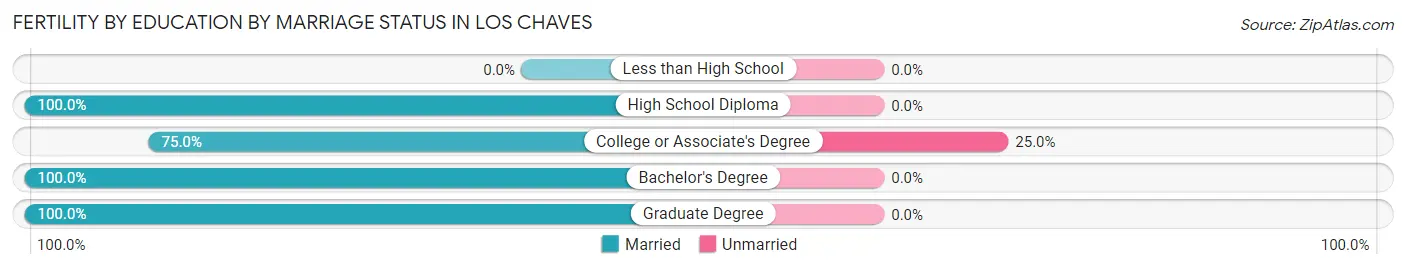
| Educational Attainment | Married | Unmarried |
| Less than High School | 0 (0.0%) | 0 (0.0%) |
| High School Diploma | 14 (100.0%) | 0 (0.0%) |
| College or Associate's Degree | 24 (75.0%) | 8 (25.0%) |
| Bachelor's Degree | 42 (100.0%) | 0 (0.0%) |
| Graduate Degree | 22 (100.0%) | 0 (0.0%) |
| Total | 102 (92.7%) | 8 (7.3%) |
Employment Characteristics in Los Chaves
Employment by Class of Employer in Los Chaves
Among the 2,130 employed individuals in Los Chaves, private company employees (1,255 | 58.9%), federal government employees (334 | 15.7%), and not-for-profit organizations (194 | 9.1%) make up the most common classes of employment.
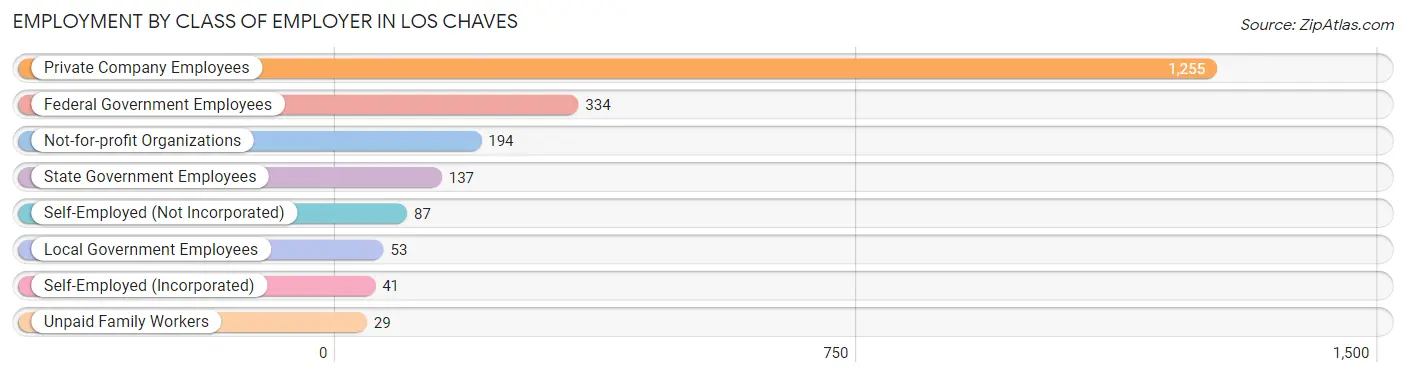
| Employer Class | # Employees | % Employees |
| Private Company Employees | 1,255 | 58.9% |
| Self-Employed (Incorporated) | 41 | 1.9% |
| Self-Employed (Not Incorporated) | 87 | 4.1% |
| Not-for-profit Organizations | 194 | 9.1% |
| Local Government Employees | 53 | 2.5% |
| State Government Employees | 137 | 6.4% |
| Federal Government Employees | 334 | 15.7% |
| Unpaid Family Workers | 29 | 1.4% |
| Total | 2,130 | 100.0% |
Employment Status by Age in Los Chaves
According to the labor force statistics for Los Chaves, out of the total population over 16 years of age (3,935), 57.0% or 2,243 individuals are in the labor force, with 3.6% or 81 of them unemployed. The age group with the highest labor force participation rate is 20 to 24 years, with 100.0% or 128 individuals in the labor force. Within the labor force, the 16 to 19 years age range has the highest percentage of unemployed individuals, with 65.9% or 29 of them being unemployed.
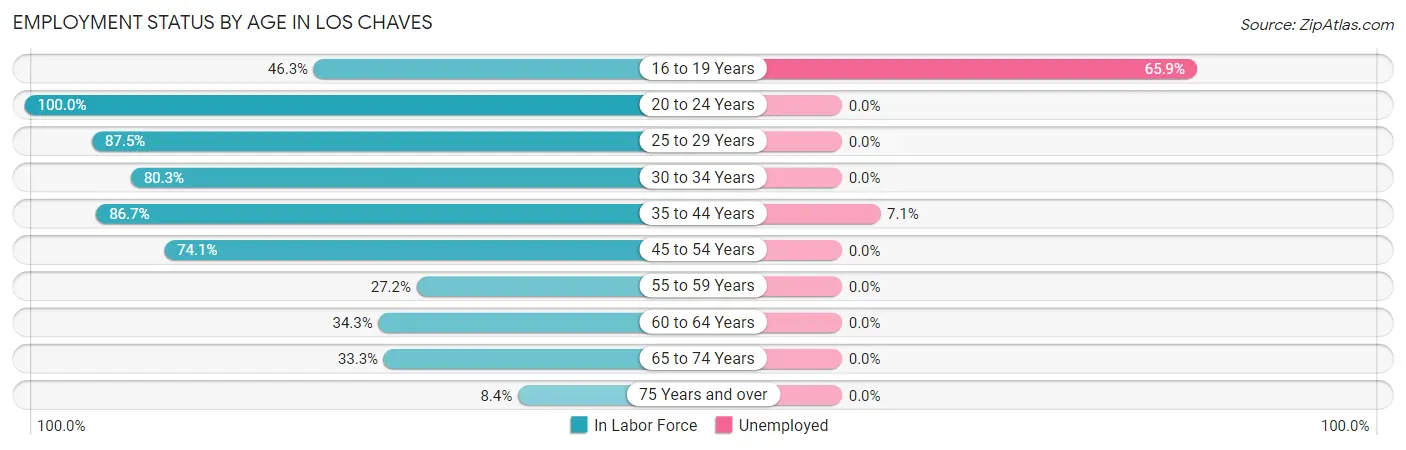
| Age Bracket | In Labor Force | Unemployed |
| 16 to 19 Years | 44 (46.3%) | 29 (65.9%) |
| 20 to 24 Years | 128 (100.0%) | 0 (0.0%) |
| 25 to 29 Years | 322 (87.5%) | 0 (0.0%) |
| 30 to 34 Years | 187 (80.3%) | 0 (0.0%) |
| 35 to 44 Years | 731 (86.7%) | 52 (7.1%) |
| 45 to 54 Years | 281 (74.1%) | 0 (0.0%) |
| 55 to 59 Years | 53 (27.2%) | 0 (0.0%) |
| 60 to 64 Years | 281 (34.3%) | 0 (0.0%) |
| 65 to 74 Years | 188 (33.3%) | 0 (0.0%) |
| 75 Years and over | 26 (8.4%) | 0 (0.0%) |
| Total | 2,243 (57.0%) | 81 (3.6%) |
Employment Status by Educational Attainment in Los Chaves
According to labor force statistics for Los Chaves, 65.4% of individuals (1,856) out of the total population between 25 and 64 years of age (2,838) are in the labor force, with 2.8% or 52 of them being unemployed. The group with the highest labor force participation rate are those with the educational attainment of bachelor's degree or higher, with 76.2% or 782 individuals in the labor force. Within the labor force, individuals with less than high school education have the highest percentage of unemployment, with 14.2% or 23 of them being unemployed.
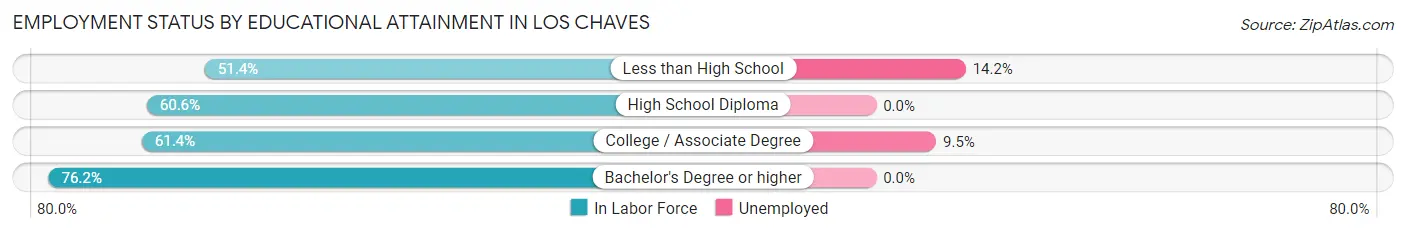
| Educational Attainment | In Labor Force | Unemployed |
| Less than High School | 162 (51.4%) | 45 (14.2%) |
| High School Diploma | 626 (60.6%) | 0 (0.0%) |
| College / Associate Degree | 285 (61.4%) | 44 (9.5%) |
| Bachelor's Degree or higher | 782 (76.2%) | 0 (0.0%) |
| Total | 1,856 (65.4%) | 79 (2.8%) |
Employment Occupations by Sex in Los Chaves
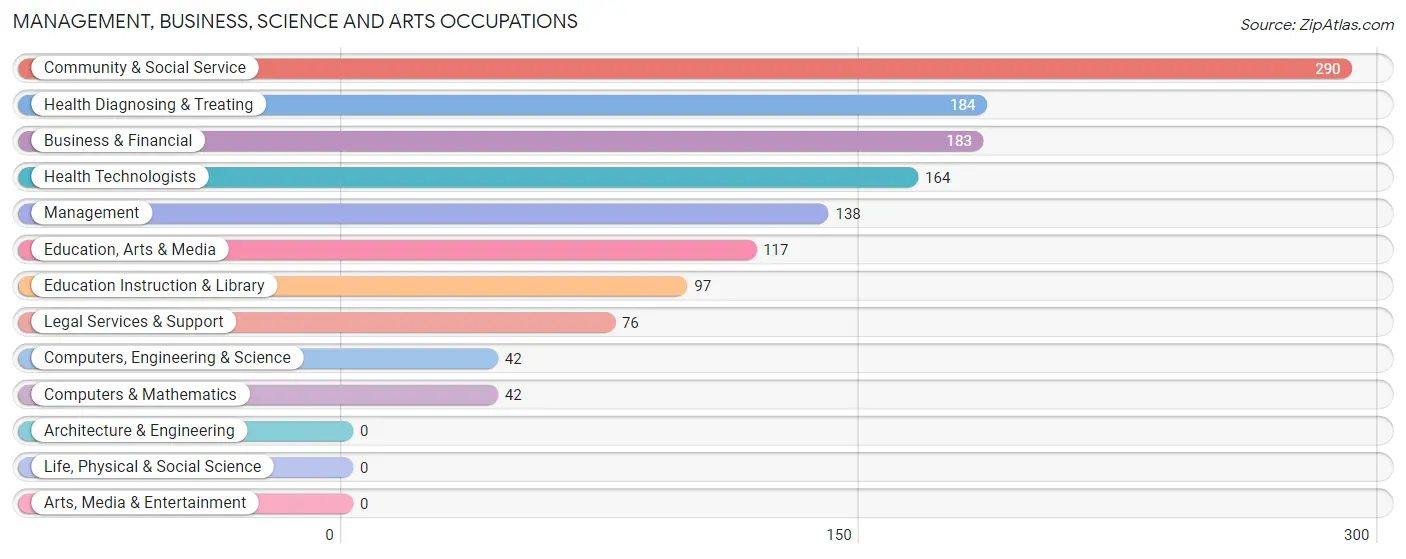
Management, Business, Science and Arts Occupations
The most common Management, Business, Science and Arts occupations in Los Chaves are Community & Social Service (290 | 13.8%), Health Diagnosing & Treating (184 | 8.7%), Business & Financial (183 | 8.7%), Health Technologists (164 | 7.8%), and Management (138 | 6.5%).
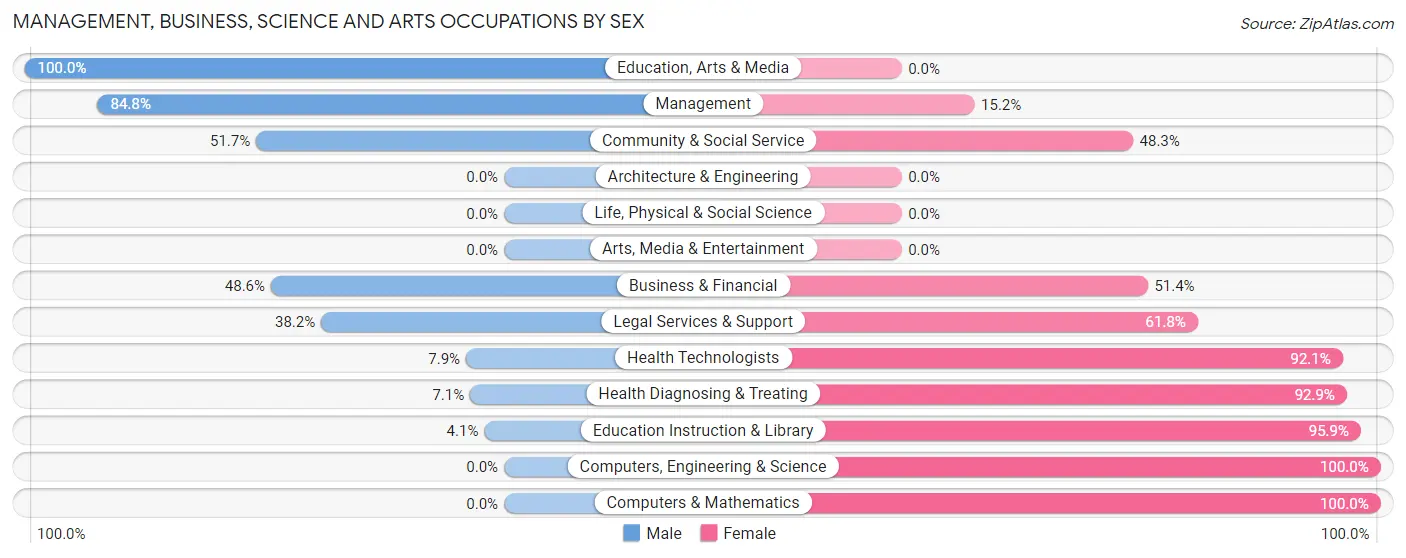
Management, Business, Science and Arts Occupations by Sex
Within the Management, Business, Science and Arts occupations in Los Chaves, the most male-oriented occupations are Education, Arts & Media (100.0%), Management (84.8%), and Community & Social Service (51.7%), while the most female-oriented occupations are Computers, Engineering & Science (100.0%), Computers & Mathematics (100.0%), and Education Instruction & Library (95.9%).
| Occupation | Male | Female |
| Management | 117 (84.8%) | 21 (15.2%) |
| Business & Financial | 89 (48.6%) | 94 (51.4%) |
| Computers, Engineering & Science | 0 (0.0%) | 42 (100.0%) |
| Computers & Mathematics | 0 (0.0%) | 42 (100.0%) |
| Architecture & Engineering | 0 (0.0%) | 0 (0.0%) |
| Life, Physical & Social Science | 0 (0.0%) | 0 (0.0%) |
| Community & Social Service | 150 (51.7%) | 140 (48.3%) |
| Education, Arts & Media | 117 (100.0%) | 0 (0.0%) |
| Legal Services & Support | 29 (38.2%) | 47 (61.8%) |
| Education Instruction & Library | 4 (4.1%) | 93 (95.9%) |
| Arts, Media & Entertainment | 0 (0.0%) | 0 (0.0%) |
| Health Diagnosing & Treating | 13 (7.1%) | 171 (92.9%) |
| Health Technologists | 13 (7.9%) | 151 (92.1%) |
| Total (Category) | 369 (44.1%) | 468 (55.9%) |
| Total (Overall) | 960 (45.5%) | 1,149 (54.5%) |
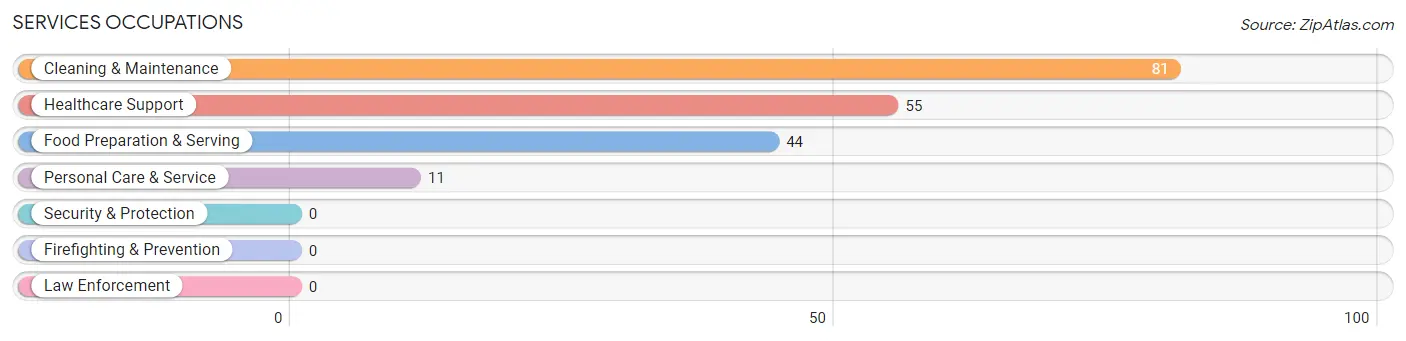
Services Occupations
The most common Services occupations in Los Chaves are Cleaning & Maintenance (81 | 3.8%), Healthcare Support (55 | 2.6%), Food Preparation & Serving (44 | 2.1%), and Personal Care & Service (11 | 0.5%).
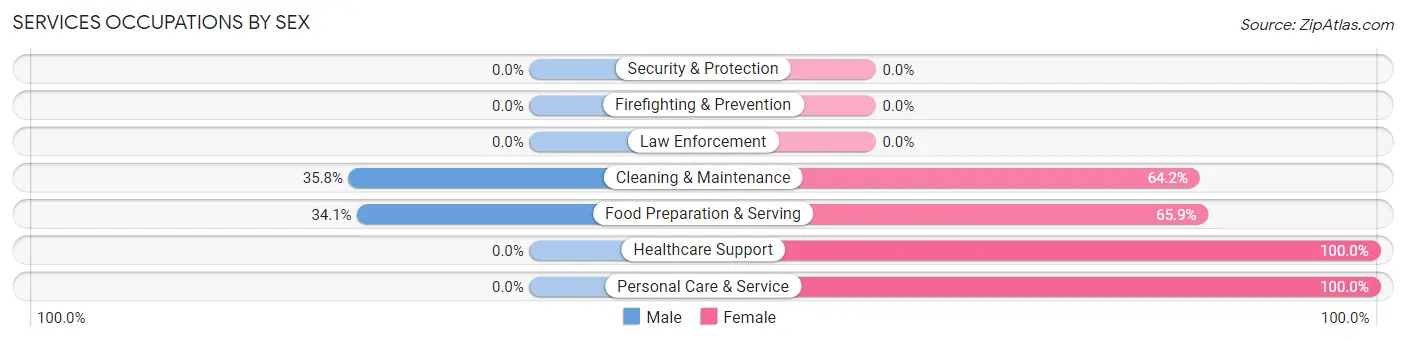
Services Occupations by Sex
Within the Services occupations in Los Chaves, the most male-oriented occupations are Cleaning & Maintenance (35.8%), and Food Preparation & Serving (34.1%), while the most female-oriented occupations are Healthcare Support (100.0%), Personal Care & Service (100.0%), and Food Preparation & Serving (65.9%).
| Occupation | Male | Female |
| Healthcare Support | 0 (0.0%) | 55 (100.0%) |
| Security & Protection | 0 (0.0%) | 0 (0.0%) |
| Firefighting & Prevention | 0 (0.0%) | 0 (0.0%) |
| Law Enforcement | 0 (0.0%) | 0 (0.0%) |
| Food Preparation & Serving | 15 (34.1%) | 29 (65.9%) |
| Cleaning & Maintenance | 29 (35.8%) | 52 (64.2%) |
| Personal Care & Service | 0 (0.0%) | 11 (100.0%) |
| Total (Category) | 44 (23.0%) | 147 (77.0%) |
| Total (Overall) | 960 (45.5%) | 1,149 (54.5%) |
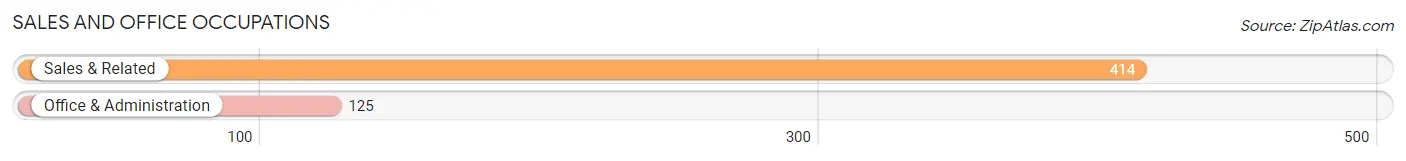
Sales and Office Occupations
The most common Sales and Office occupations in Los Chaves are Sales & Related (414 | 19.6%), and Office & Administration (125 | 5.9%).
Sales and Office Occupations by Sex
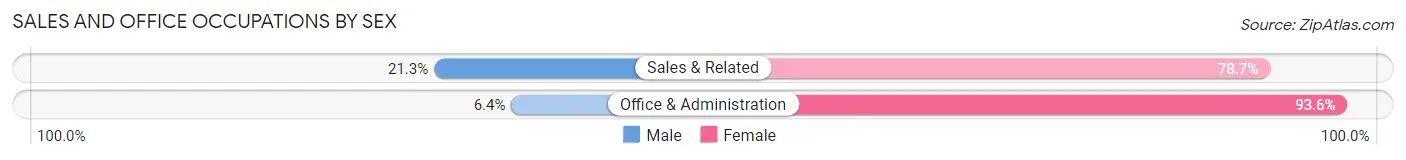
| Occupation | Male | Female |
| Sales & Related | 88 (21.3%) | 326 (78.7%) |
| Office & Administration | 8 (6.4%) | 117 (93.6%) |
| Total (Category) | 96 (17.8%) | 443 (82.2%) |
| Total (Overall) | 960 (45.5%) | 1,149 (54.5%) |
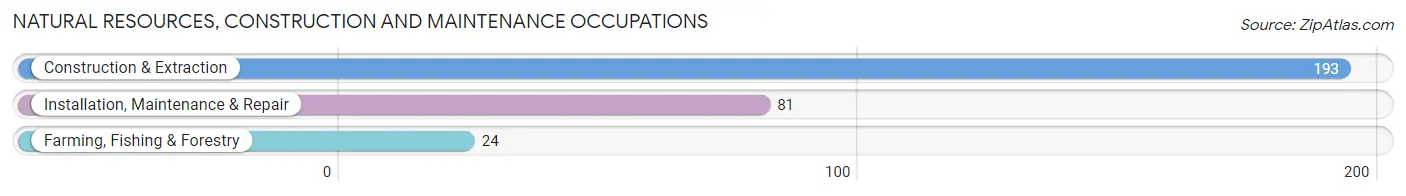
Natural Resources, Construction and Maintenance Occupations
The most common Natural Resources, Construction and Maintenance occupations in Los Chaves are Construction & Extraction (193 | 9.1%), Installation, Maintenance & Repair (81 | 3.8%), and Farming, Fishing & Forestry (24 | 1.1%).
Natural Resources, Construction and Maintenance Occupations by Sex
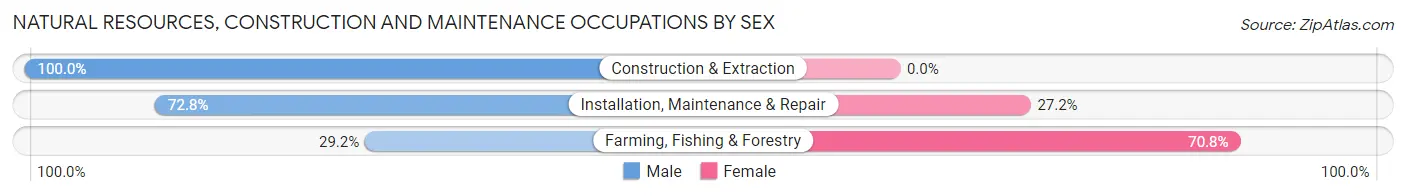
| Occupation | Male | Female |
| Farming, Fishing & Forestry | 7 (29.2%) | 17 (70.8%) |
| Construction & Extraction | 193 (100.0%) | 0 (0.0%) |
| Installation, Maintenance & Repair | 59 (72.8%) | 22 (27.2%) |
| Total (Category) | 259 (86.9%) | 39 (13.1%) |
| Total (Overall) | 960 (45.5%) | 1,149 (54.5%) |
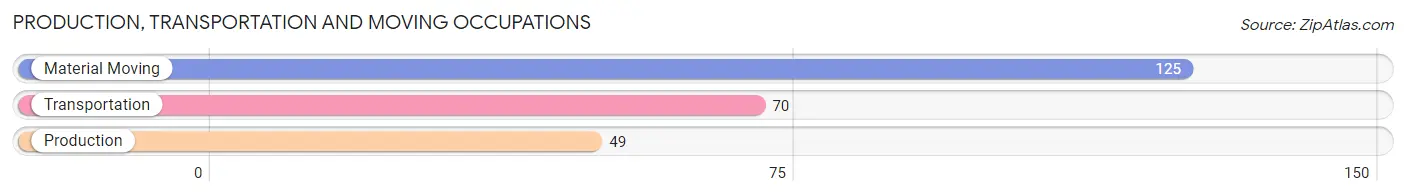
Production, Transportation and Moving Occupations
The most common Production, Transportation and Moving occupations in Los Chaves are Material Moving (125 | 5.9%), Transportation (70 | 3.3%), and Production (49 | 2.3%).
Production, Transportation and Moving Occupations by Sex
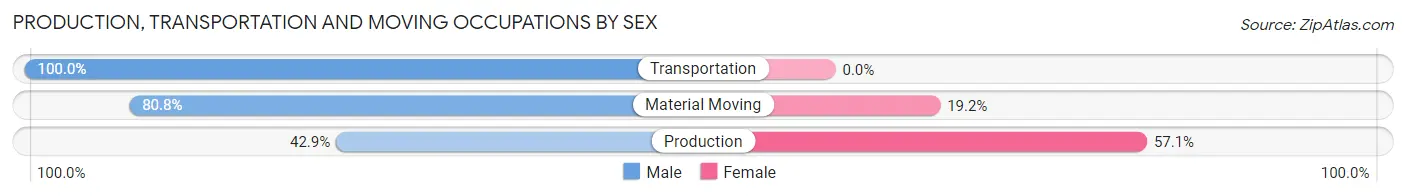
| Occupation | Male | Female |
| Production | 21 (42.9%) | 28 (57.1%) |
| Transportation | 70 (100.0%) | 0 (0.0%) |
| Material Moving | 101 (80.8%) | 24 (19.2%) |
| Total (Category) | 192 (78.7%) | 52 (21.3%) |
| Total (Overall) | 960 (45.5%) | 1,149 (54.5%) |
Employment Industries by Sex in Los Chaves
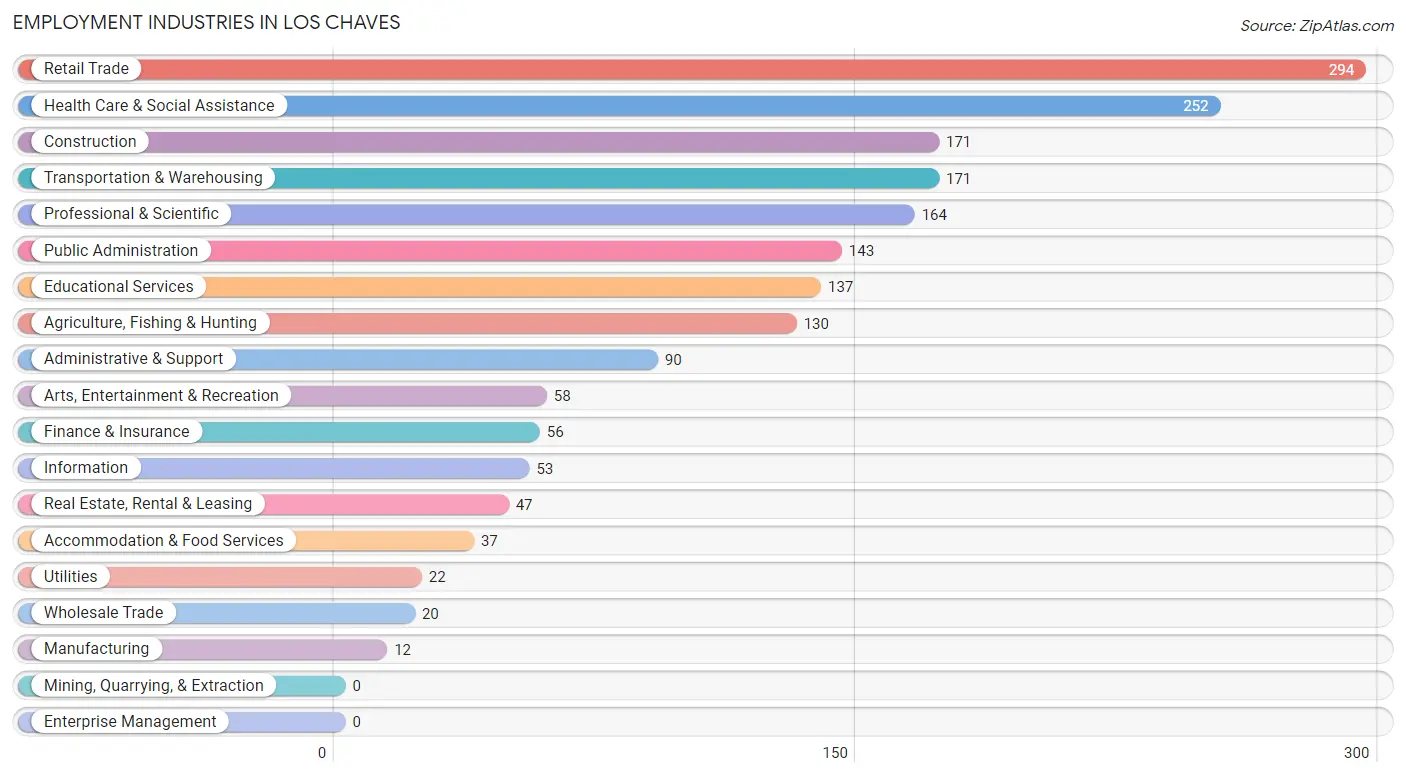
Employment Industries in Los Chaves
The major employment industries in Los Chaves include Retail Trade (294 | 13.9%), Health Care & Social Assistance (252 | 11.9%), Construction (171 | 8.1%), Transportation & Warehousing (171 | 8.1%), and Professional & Scientific (164 | 7.8%).
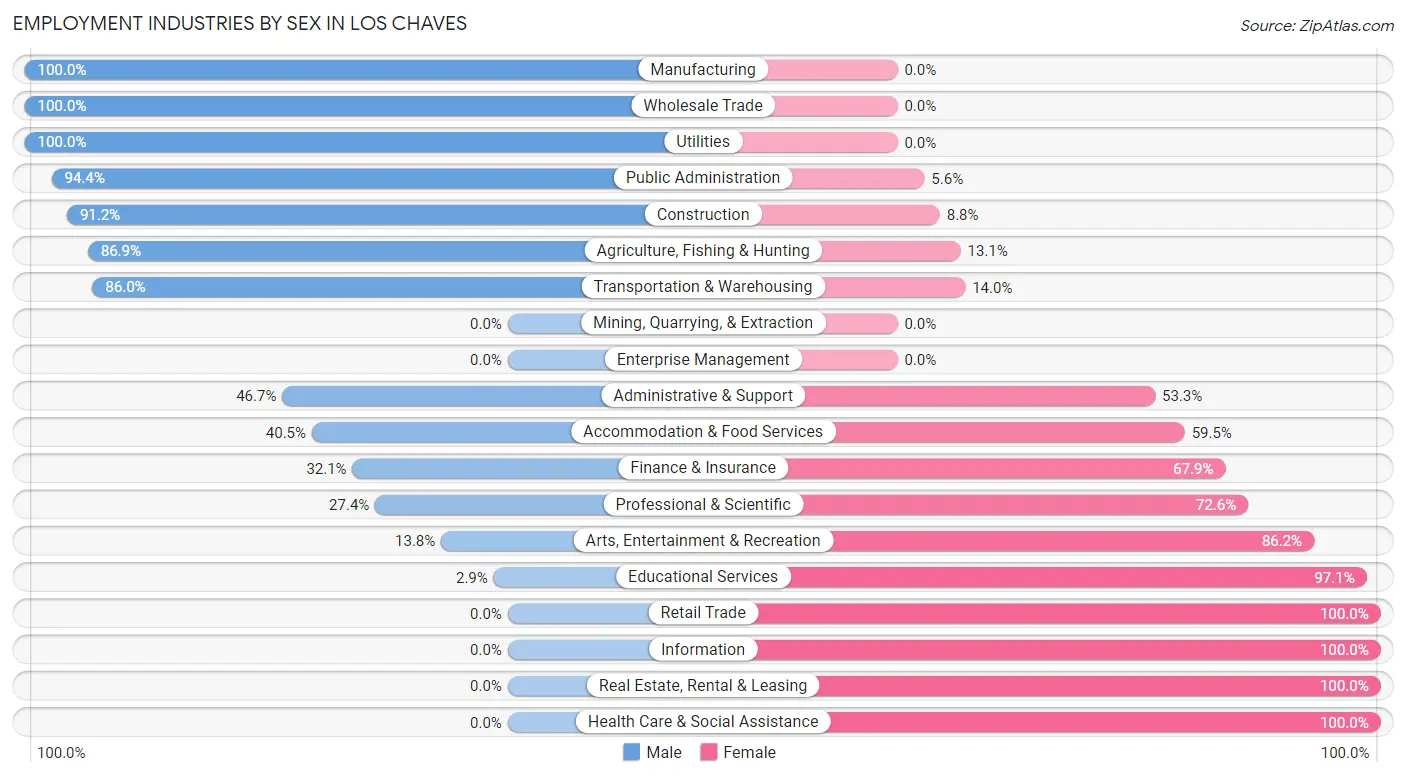
Employment Industries by Sex in Los Chaves
The Los Chaves industries that see more men than women are Manufacturing (100.0%), Wholesale Trade (100.0%), and Utilities (100.0%), whereas the industries that tend to have a higher number of women are Retail Trade (100.0%), Information (100.0%), and Real Estate, Rental & Leasing (100.0%).
| Industry | Male | Female |
| Agriculture, Fishing & Hunting | 113 (86.9%) | 17 (13.1%) |
| Mining, Quarrying, & Extraction | 0 (0.0%) | 0 (0.0%) |
| Construction | 156 (91.2%) | 15 (8.8%) |
| Manufacturing | 12 (100.0%) | 0 (0.0%) |
| Wholesale Trade | 20 (100.0%) | 0 (0.0%) |
| Retail Trade | 0 (0.0%) | 294 (100.0%) |
| Transportation & Warehousing | 147 (86.0%) | 24 (14.0%) |
| Utilities | 22 (100.0%) | 0 (0.0%) |
| Information | 0 (0.0%) | 53 (100.0%) |
| Finance & Insurance | 18 (32.1%) | 38 (67.9%) |
| Real Estate, Rental & Leasing | 0 (0.0%) | 47 (100.0%) |
| Professional & Scientific | 45 (27.4%) | 119 (72.6%) |
| Enterprise Management | 0 (0.0%) | 0 (0.0%) |
| Administrative & Support | 42 (46.7%) | 48 (53.3%) |
| Educational Services | 4 (2.9%) | 133 (97.1%) |
| Health Care & Social Assistance | 0 (0.0%) | 252 (100.0%) |
| Arts, Entertainment & Recreation | 8 (13.8%) | 50 (86.2%) |
| Accommodation & Food Services | 15 (40.5%) | 22 (59.5%) |
| Public Administration | 135 (94.4%) | 8 (5.6%) |
| Total | 960 (45.5%) | 1,149 (54.5%) |
Education in Los Chaves
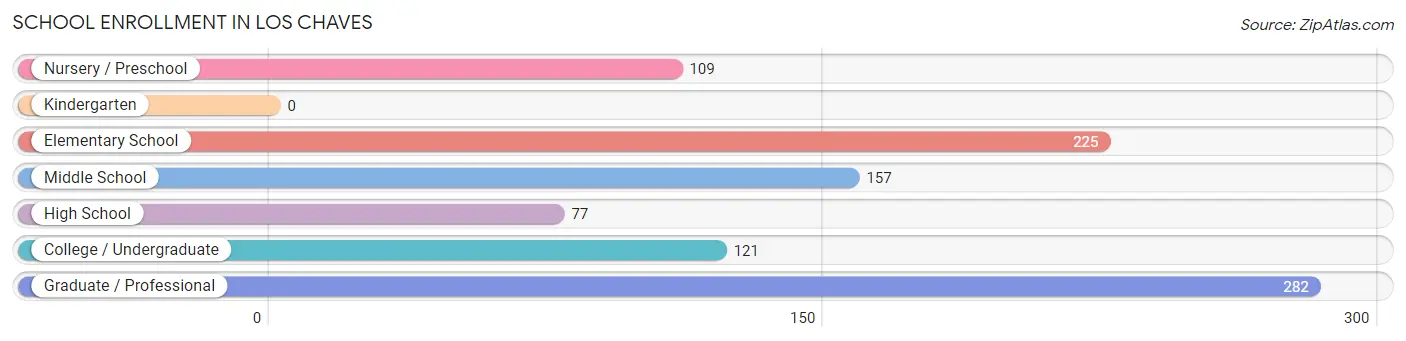
School Enrollment in Los Chaves
The most common levels of schooling among the 971 students in Los Chaves are graduate / professional (282 | 29.0%), elementary school (225 | 23.2%), and middle school (157 | 16.2%).
| School Level | # Students | % Students |
| Nursery / Preschool | 109 | 11.2% |
| Kindergarten | 0 | 0.0% |
| Elementary School | 225 | 23.2% |
| Middle School | 157 | 16.2% |
| High School | 77 | 7.9% |
| College / Undergraduate | 121 | 12.5% |
| Graduate / Professional | 282 | 29.0% |
| Total | 971 | 100.0% |
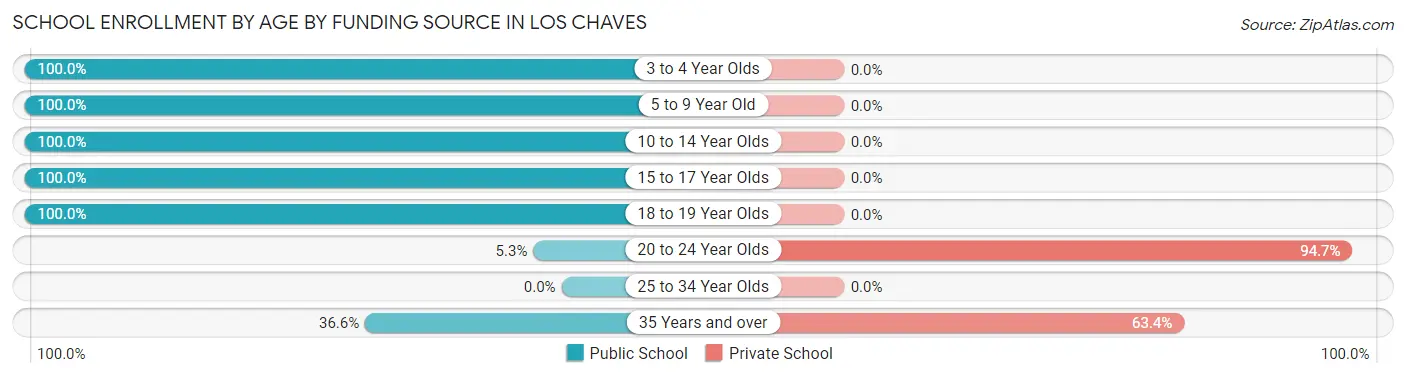
School Enrollment by Age by Funding Source in Los Chaves
Out of a total of 971 students who are enrolled in schools in Los Chaves, 262 (27.0%) attend a private institution, while the remaining 709 (73.0%) are enrolled in public schools. The age group of 20 to 24 year olds has the highest likelihood of being enrolled in private schools, with 54 (94.7% in the age bracket) enrolled. Conversely, the age group of 3 to 4 year olds has the lowest likelihood of being enrolled in a private school, with 37 (100.0% in the age bracket) attending a public institution.
| Age Bracket | Public School | Private School |
| 3 to 4 Year Olds | 37 (100.0%) | 0 (0.0%) |
| 5 to 9 Year Old | 297 (100.0%) | 0 (0.0%) |
| 10 to 14 Year Olds | 157 (100.0%) | 0 (0.0%) |
| 15 to 17 Year Olds | 77 (100.0%) | 0 (0.0%) |
| 18 to 19 Year Olds | 18 (100.0%) | 0 (0.0%) |
| 20 to 24 Year Olds | 3 (5.3%) | 54 (94.7%) |
| 25 to 34 Year Olds | 0 (0.0%) | 0 (0.0%) |
| 35 Years and over | 120 (36.6%) | 208 (63.4%) |
| Total | 709 (73.0%) | 262 (27.0%) |
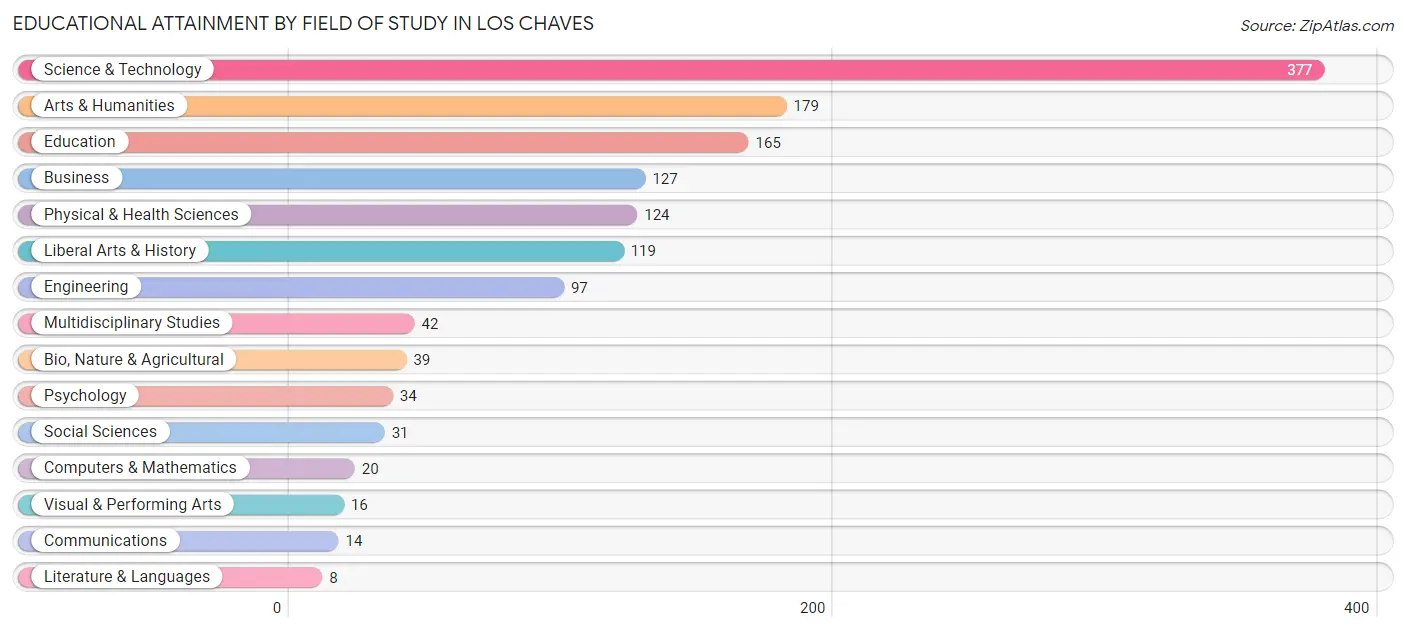
Educational Attainment by Field of Study in Los Chaves
Science & technology (377 | 27.1%), arts & humanities (179 | 12.9%), education (165 | 11.8%), business (127 | 9.1%), and physical & health sciences (124 | 8.9%) are the most common fields of study among 1,392 individuals in Los Chaves who have obtained a bachelor's degree or higher.
| Field of Study | # Graduates | % Graduates |
| Computers & Mathematics | 20 | 1.4% |
| Bio, Nature & Agricultural | 39 | 2.8% |
| Physical & Health Sciences | 124 | 8.9% |
| Psychology | 34 | 2.4% |
| Social Sciences | 31 | 2.2% |
| Engineering | 97 | 7.0% |
| Multidisciplinary Studies | 42 | 3.0% |
| Science & Technology | 377 | 27.1% |
| Business | 127 | 9.1% |
| Education | 165 | 11.8% |
| Literature & Languages | 8 | 0.6% |
| Liberal Arts & History | 119 | 8.6% |
| Visual & Performing Arts | 16 | 1.1% |
| Communications | 14 | 1.0% |
| Arts & Humanities | 179 | 12.9% |
| Total | 1,392 | 100.0% |
Transportation & Commute in Los Chaves
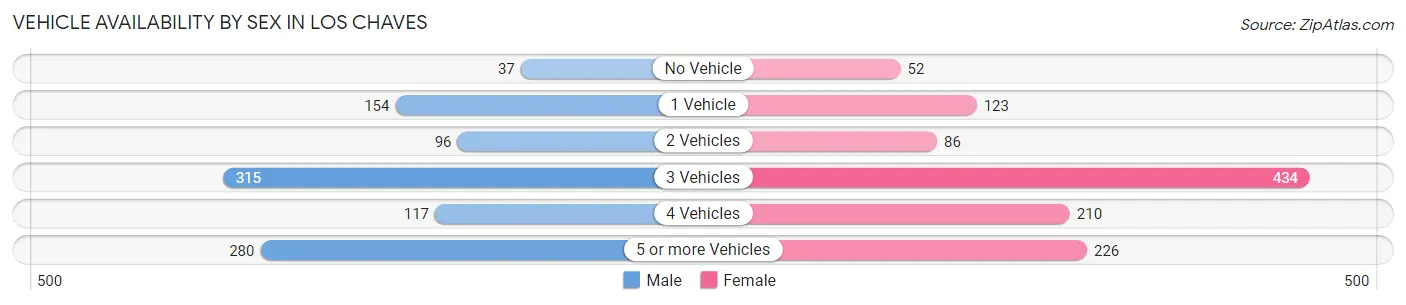
Vehicle Availability by Sex in Los Chaves
The most prevalent vehicle ownership categories in Los Chaves are males with 3 vehicles (315, accounting for 31.5%) and females with 3 vehicles (434, making up 27.9%).
| Vehicles Available | Male | Female |
| No Vehicle | 37 (3.7%) | 52 (4.6%) |
| 1 Vehicle | 154 (15.4%) | 123 (10.9%) |
| 2 Vehicles | 96 (9.6%) | 86 (7.6%) |
| 3 Vehicles | 315 (31.5%) | 434 (38.4%) |
| 4 Vehicles | 117 (11.7%) | 210 (18.6%) |
| 5 or more Vehicles | 280 (28.0%) | 226 (20.0%) |
| Total | 999 (100.0%) | 1,131 (100.0%) |
Commute Time in Los Chaves
The most frequently occuring commute durations in Los Chaves are 35 to 39 minutes (304 commuters, 16.0%), 5 to 9 minutes (277 commuters, 14.6%), and 10 to 14 minutes (227 commuters, 12.0%).
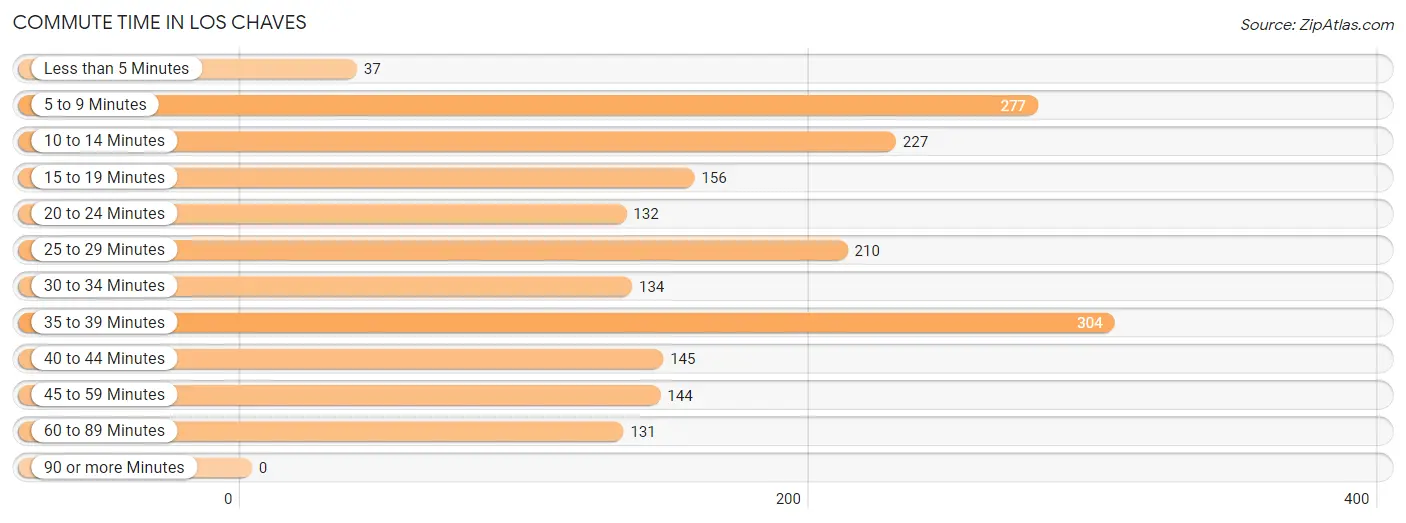
| Commute Time | # Commuters | % Commuters |
| Less than 5 Minutes | 37 | 1.9% |
| 5 to 9 Minutes | 277 | 14.6% |
| 10 to 14 Minutes | 227 | 12.0% |
| 15 to 19 Minutes | 156 | 8.2% |
| 20 to 24 Minutes | 132 | 7.0% |
| 25 to 29 Minutes | 210 | 11.1% |
| 30 to 34 Minutes | 134 | 7.1% |
| 35 to 39 Minutes | 304 | 16.0% |
| 40 to 44 Minutes | 145 | 7.6% |
| 45 to 59 Minutes | 144 | 7.6% |
| 60 to 89 Minutes | 131 | 6.9% |
| 90 or more Minutes | 0 | 0.0% |
Commute Time by Sex in Los Chaves
The most common commute times in Los Chaves are 35 to 39 minutes (166 commuters, 18.5%) for males and 5 to 9 minutes (241 commuters, 24.1%) for females.
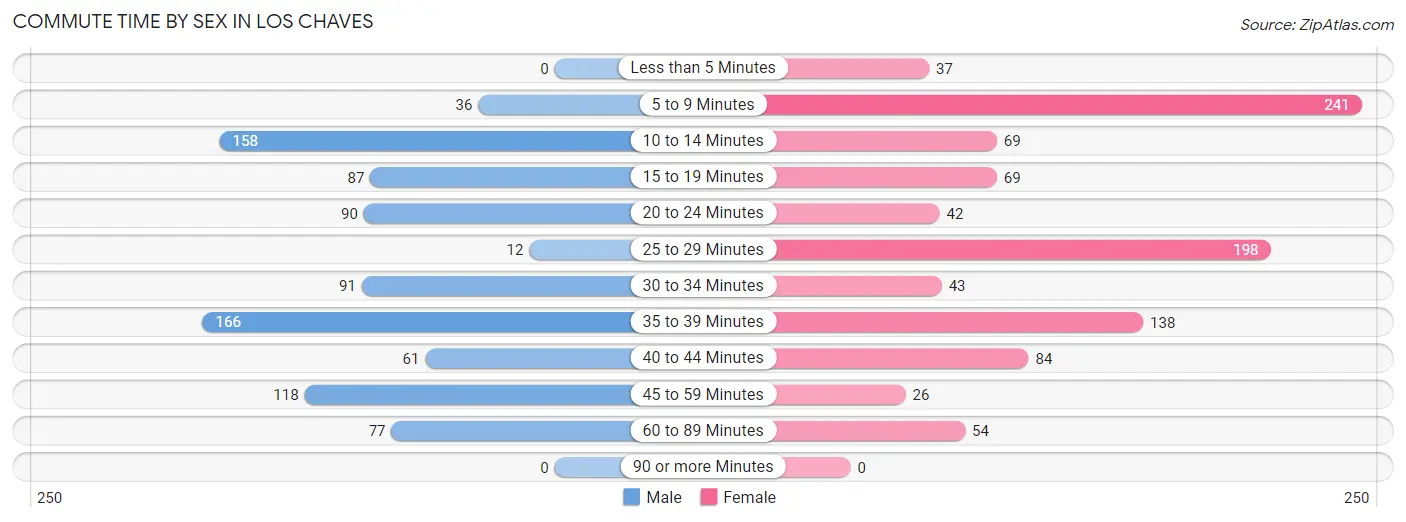
| Commute Time | Male | Female |
| Less than 5 Minutes | 0 (0.0%) | 37 (3.7%) |
| 5 to 9 Minutes | 36 (4.0%) | 241 (24.1%) |
| 10 to 14 Minutes | 158 (17.6%) | 69 (6.9%) |
| 15 to 19 Minutes | 87 (9.7%) | 69 (6.9%) |
| 20 to 24 Minutes | 90 (10.0%) | 42 (4.2%) |
| 25 to 29 Minutes | 12 (1.3%) | 198 (19.8%) |
| 30 to 34 Minutes | 91 (10.2%) | 43 (4.3%) |
| 35 to 39 Minutes | 166 (18.5%) | 138 (13.8%) |
| 40 to 44 Minutes | 61 (6.8%) | 84 (8.4%) |
| 45 to 59 Minutes | 118 (13.2%) | 26 (2.6%) |
| 60 to 89 Minutes | 77 (8.6%) | 54 (5.4%) |
| 90 or more Minutes | 0 (0.0%) | 0 (0.0%) |
Time of Departure to Work by Sex in Los Chaves
The most frequent times of departure to work in Los Chaves are 6:30 AM to 6:59 AM (126, 14.1%) for males and 7:00 AM to 7:29 AM (275, 27.5%) for females.
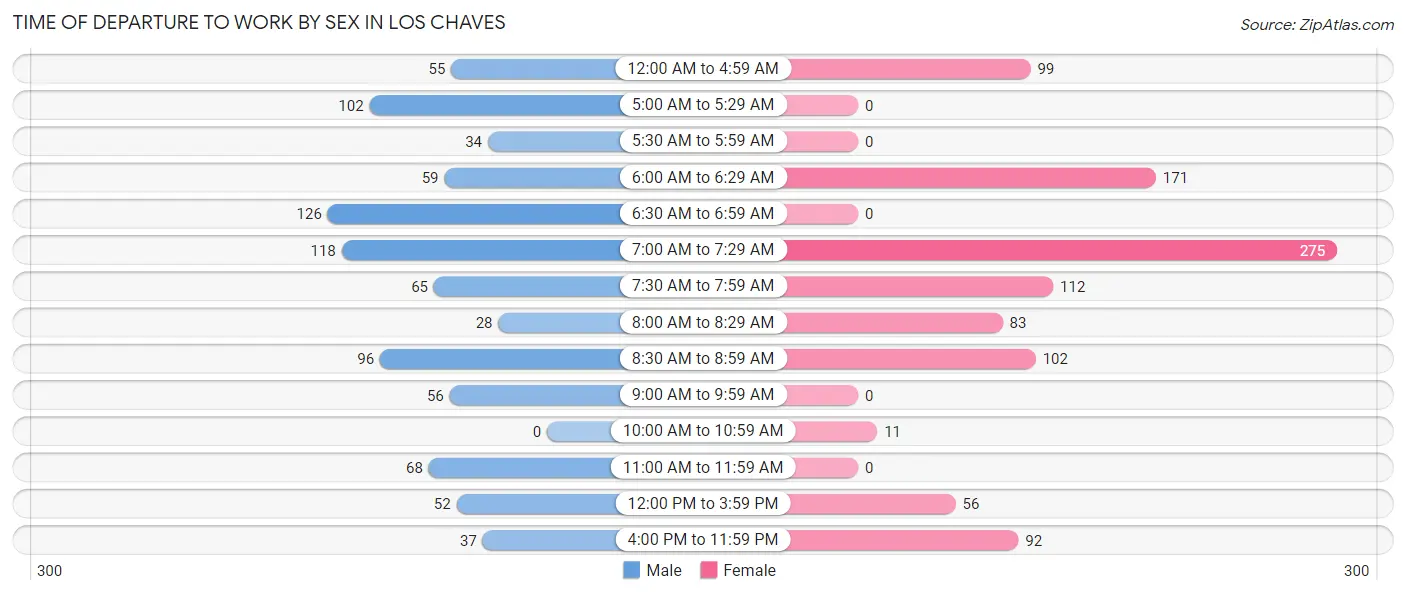
| Time of Departure | Male | Female |
| 12:00 AM to 4:59 AM | 55 (6.1%) | 99 (9.9%) |
| 5:00 AM to 5:29 AM | 102 (11.4%) | 0 (0.0%) |
| 5:30 AM to 5:59 AM | 34 (3.8%) | 0 (0.0%) |
| 6:00 AM to 6:29 AM | 59 (6.6%) | 171 (17.1%) |
| 6:30 AM to 6:59 AM | 126 (14.1%) | 0 (0.0%) |
| 7:00 AM to 7:29 AM | 118 (13.2%) | 275 (27.5%) |
| 7:30 AM to 7:59 AM | 65 (7.2%) | 112 (11.2%) |
| 8:00 AM to 8:29 AM | 28 (3.1%) | 83 (8.3%) |
| 8:30 AM to 8:59 AM | 96 (10.7%) | 102 (10.2%) |
| 9:00 AM to 9:59 AM | 56 (6.2%) | 0 (0.0%) |
| 10:00 AM to 10:59 AM | 0 (0.0%) | 11 (1.1%) |
| 11:00 AM to 11:59 AM | 68 (7.6%) | 0 (0.0%) |
| 12:00 PM to 3:59 PM | 52 (5.8%) | 56 (5.6%) |
| 4:00 PM to 11:59 PM | 37 (4.1%) | 92 (9.2%) |
| Total | 896 (100.0%) | 1,001 (100.0%) |
Housing Occupancy in Los Chaves
Occupancy by Ownership in Los Chaves
Of the total 1,693 dwellings in Los Chaves, owner-occupied units account for 1,638 (96.8%), while renter-occupied units make up 55 (3.3%).
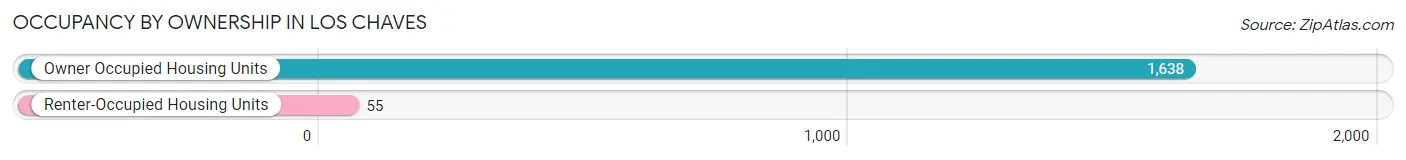
| Occupancy | # Housing Units | % Housing Units |
| Owner Occupied Housing Units | 1,638 | 96.8% |
| Renter-Occupied Housing Units | 55 | 3.3% |
| Total Occupied Housing Units | 1,693 | 100.0% |
Occupancy by Household Size in Los Chaves
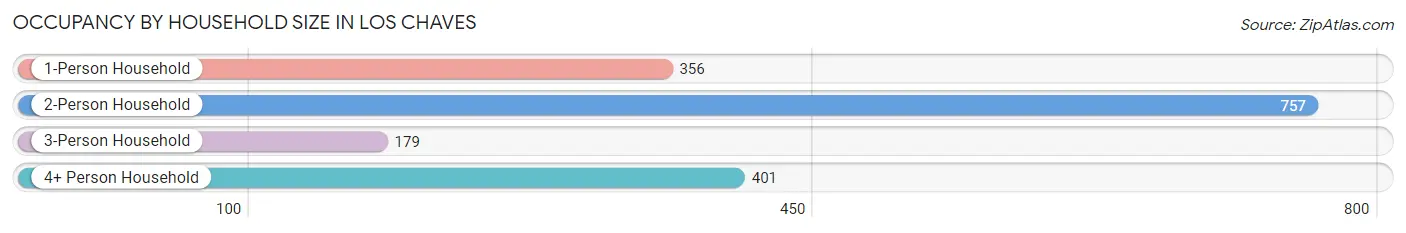
| Household Size | # Housing Units | % Housing Units |
| 1-Person Household | 356 | 21.0% |
| 2-Person Household | 757 | 44.7% |
| 3-Person Household | 179 | 10.6% |
| 4+ Person Household | 401 | 23.7% |
| Total Housing Units | 1,693 | 100.0% |
Occupancy by Ownership by Household Size in Los Chaves
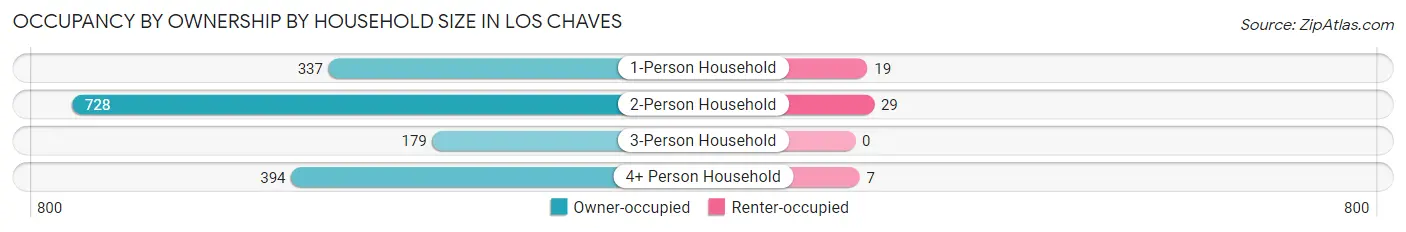
| Household Size | Owner-occupied | Renter-occupied |
| 1-Person Household | 337 (94.7%) | 19 (5.3%) |
| 2-Person Household | 728 (96.2%) | 29 (3.8%) |
| 3-Person Household | 179 (100.0%) | 0 (0.0%) |
| 4+ Person Household | 394 (98.3%) | 7 (1.8%) |
| Total Housing Units | 1,638 (96.8%) | 55 (3.3%) |
Occupancy by Educational Attainment in Los Chaves
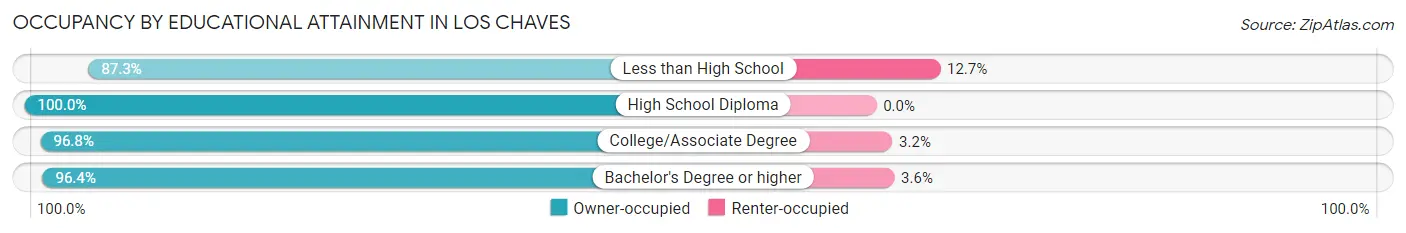
| Household Size | Owner-occupied | Renter-occupied |
| Less than High School | 200 (87.3%) | 29 (12.7%) |
| High School Diploma | 711 (100.0%) | 0 (0.0%) |
| College/Associate Degree | 214 (96.8%) | 7 (3.2%) |
| Bachelor's Degree or higher | 513 (96.4%) | 19 (3.6%) |
Occupancy by Age of Householder in Los Chaves
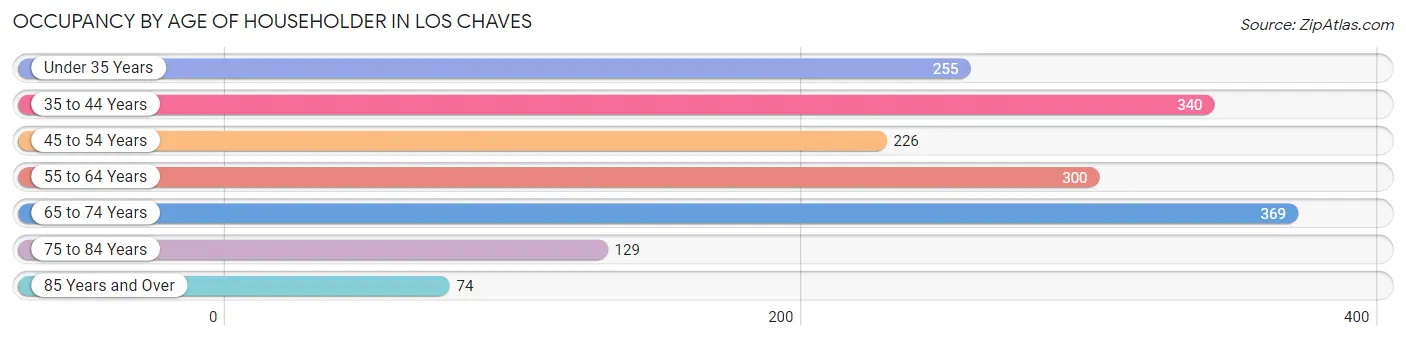
| Age Bracket | # Households | % Households |
| Under 35 Years | 255 | 15.1% |
| 35 to 44 Years | 340 | 20.1% |
| 45 to 54 Years | 226 | 13.4% |
| 55 to 64 Years | 300 | 17.7% |
| 65 to 74 Years | 369 | 21.8% |
| 75 to 84 Years | 129 | 7.6% |
| 85 Years and Over | 74 | 4.4% |
| Total | 1,693 | 100.0% |
Housing Finances in Los Chaves
Median Income by Occupancy in Los Chaves
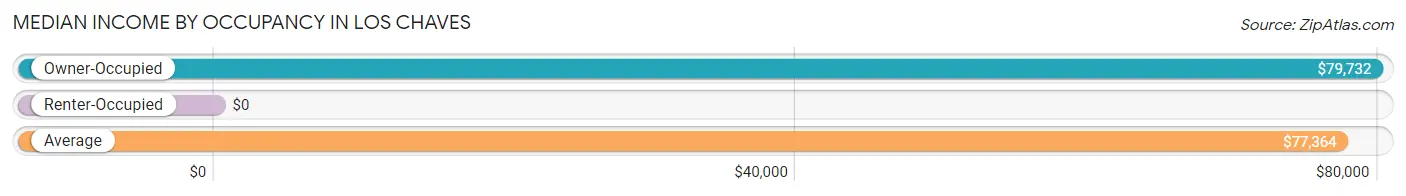
| Occupancy Type | # Households | Median Income |
| Owner-Occupied | 1,638 (96.8%) | $79,732 |
| Renter-Occupied | 55 (3.3%) | $0 |
| Average | 1,693 (100.0%) | $77,364 |
Occupancy by Householder Income Bracket in Los Chaves
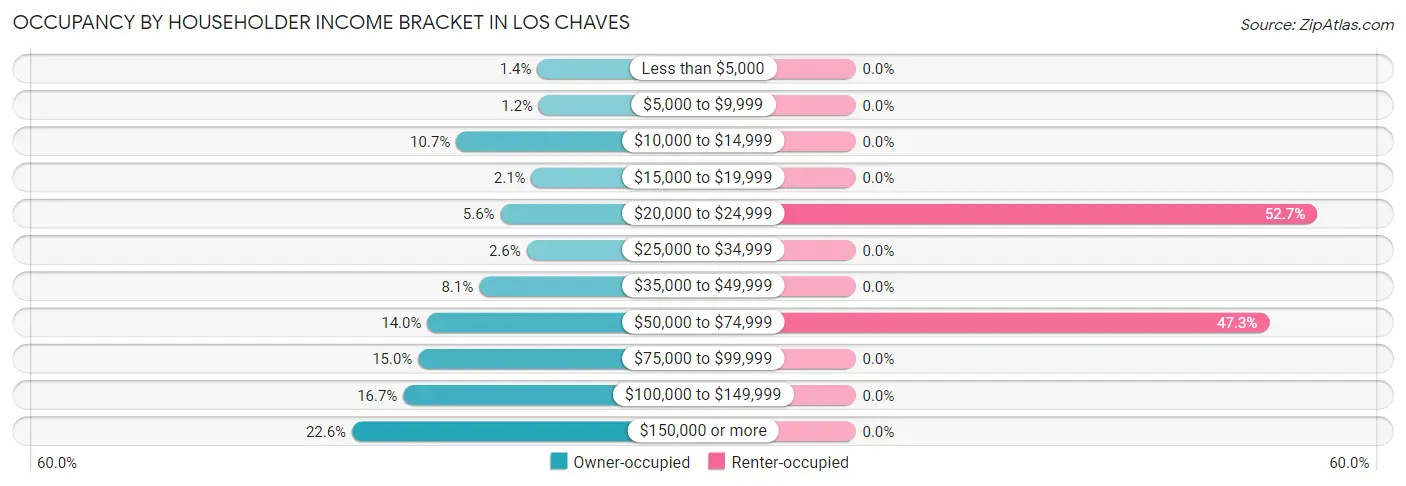
| Income Bracket | Owner-occupied | Renter-occupied |
| Less than $5,000 | 23 (1.4%) | 0 (0.0%) |
| $5,000 to $9,999 | 20 (1.2%) | 0 (0.0%) |
| $10,000 to $14,999 | 175 (10.7%) | 0 (0.0%) |
| $15,000 to $19,999 | 34 (2.1%) | 0 (0.0%) |
| $20,000 to $24,999 | 92 (5.6%) | 29 (52.7%) |
| $25,000 to $34,999 | 43 (2.6%) | 0 (0.0%) |
| $35,000 to $49,999 | 132 (8.1%) | 0 (0.0%) |
| $50,000 to $74,999 | 229 (14.0%) | 26 (47.3%) |
| $75,000 to $99,999 | 246 (15.0%) | 0 (0.0%) |
| $100,000 to $149,999 | 274 (16.7%) | 0 (0.0%) |
| $150,000 or more | 370 (22.6%) | 0 (0.0%) |
| Total | 1,638 (100.0%) | 55 (100.0%) |
Monthly Housing Cost Tiers in Los Chaves
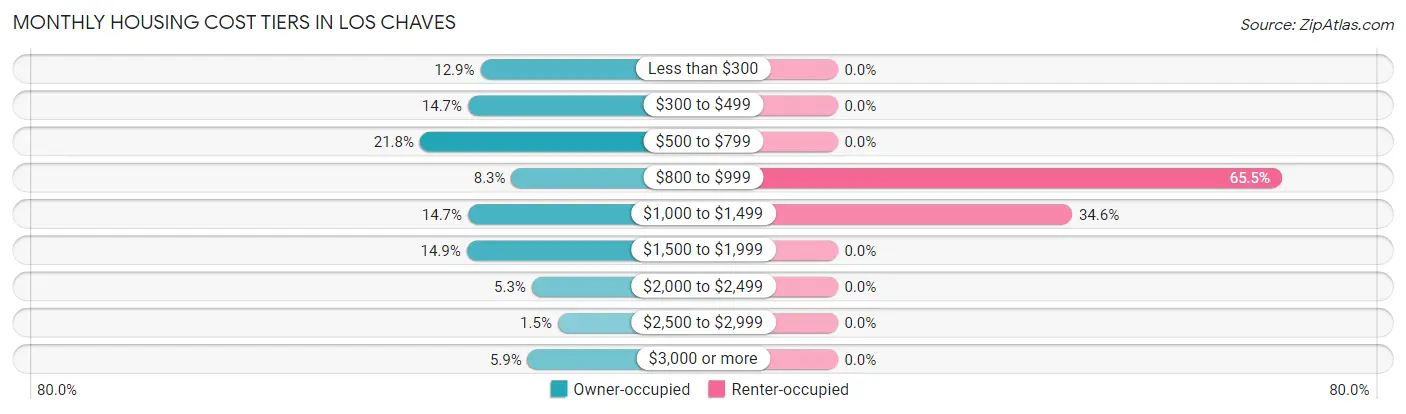
| Monthly Cost | Owner-occupied | Renter-occupied |
| Less than $300 | 211 (12.9%) | 0 (0.0%) |
| $300 to $499 | 241 (14.7%) | 0 (0.0%) |
| $500 to $799 | 357 (21.8%) | 0 (0.0%) |
| $800 to $999 | 136 (8.3%) | 36 (65.4%) |
| $1,000 to $1,499 | 241 (14.7%) | 19 (34.5%) |
| $1,500 to $1,999 | 244 (14.9%) | 0 (0.0%) |
| $2,000 to $2,499 | 87 (5.3%) | 0 (0.0%) |
| $2,500 to $2,999 | 24 (1.5%) | 0 (0.0%) |
| $3,000 or more | 97 (5.9%) | 0 (0.0%) |
| Total | 1,638 (100.0%) | 55 (100.0%) |
Physical Housing Characteristics in Los Chaves
Housing Structures in Los Chaves
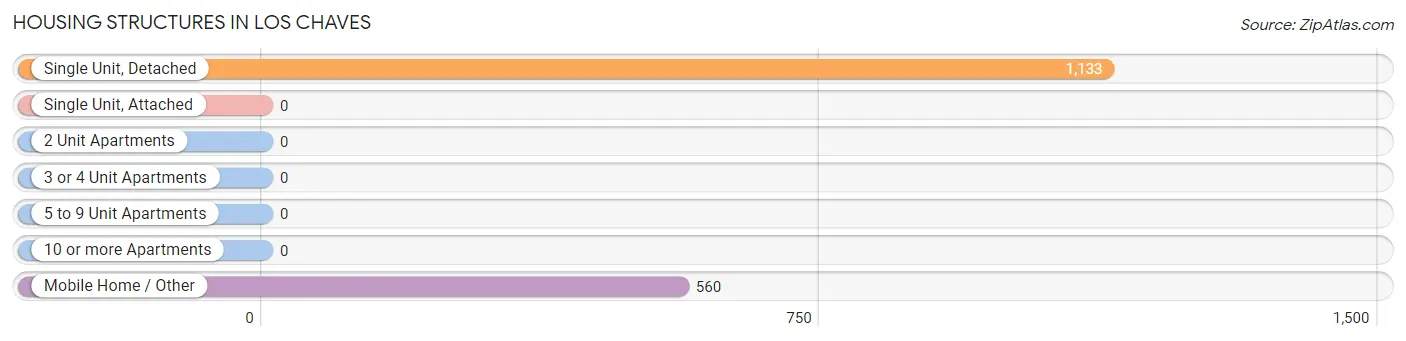
| Structure Type | # Housing Units | % Housing Units |
| Single Unit, Detached | 1,133 | 66.9% |
| Single Unit, Attached | 0 | 0.0% |
| 2 Unit Apartments | 0 | 0.0% |
| 3 or 4 Unit Apartments | 0 | 0.0% |
| 5 to 9 Unit Apartments | 0 | 0.0% |
| 10 or more Apartments | 0 | 0.0% |
| Mobile Home / Other | 560 | 33.1% |
| Total | 1,693 | 100.0% |
Housing Structures by Occupancy in Los Chaves
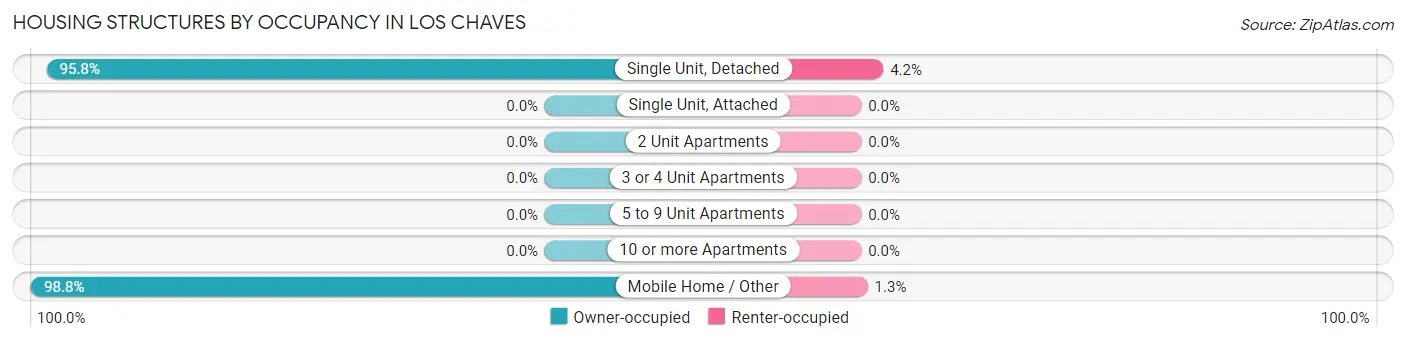
| Structure Type | Owner-occupied | Renter-occupied |
| Single Unit, Detached | 1,085 (95.8%) | 48 (4.2%) |
| Single Unit, Attached | 0 (0.0%) | 0 (0.0%) |
| 2 Unit Apartments | 0 (0.0%) | 0 (0.0%) |
| 3 or 4 Unit Apartments | 0 (0.0%) | 0 (0.0%) |
| 5 to 9 Unit Apartments | 0 (0.0%) | 0 (0.0%) |
| 10 or more Apartments | 0 (0.0%) | 0 (0.0%) |
| Mobile Home / Other | 553 (98.8%) | 7 (1.3%) |
| Total | 1,638 (96.8%) | 55 (3.3%) |
Housing Structures by Number of Rooms in Los Chaves
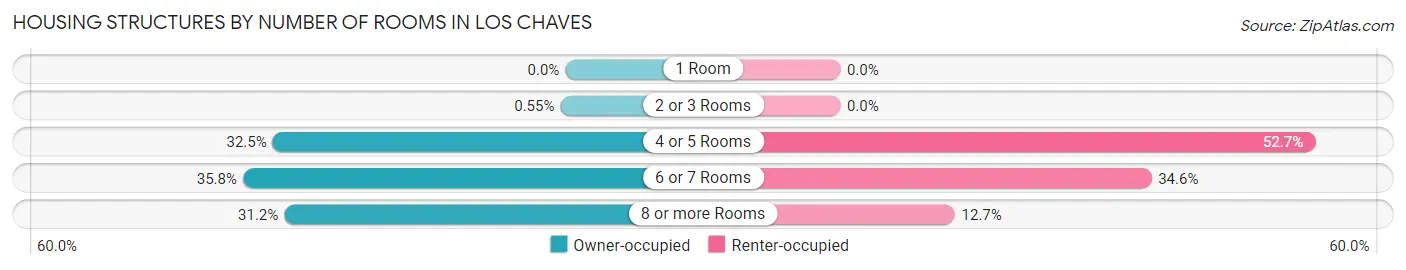
| Number of Rooms | Owner-occupied | Renter-occupied |
| 1 Room | 0 (0.0%) | 0 (0.0%) |
| 2 or 3 Rooms | 9 (0.5%) | 0 (0.0%) |
| 4 or 5 Rooms | 532 (32.5%) | 29 (52.7%) |
| 6 or 7 Rooms | 586 (35.8%) | 19 (34.5%) |
| 8 or more Rooms | 511 (31.2%) | 7 (12.7%) |
| Total | 1,638 (100.0%) | 55 (100.0%) |
Housing Structure by Heating Type in Los Chaves
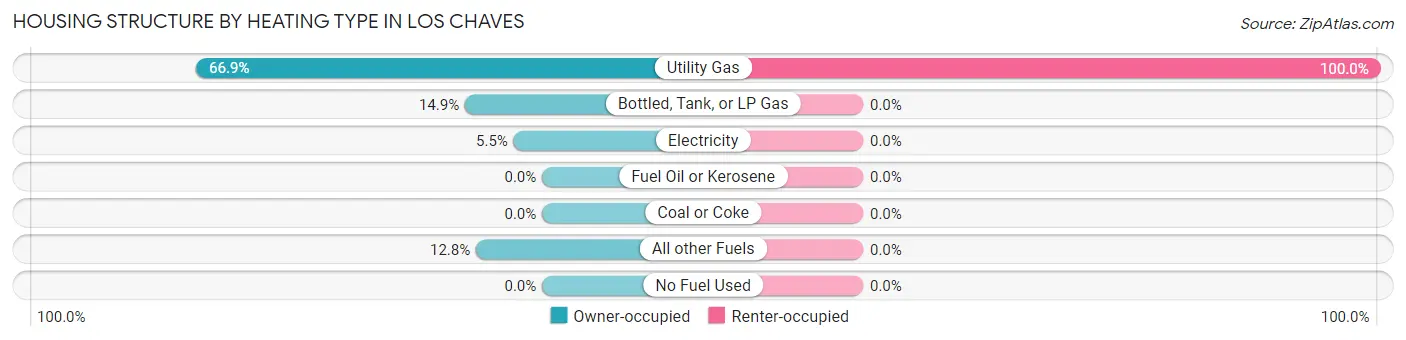
| Heating Type | Owner-occupied | Renter-occupied |
| Utility Gas | 1,095 (66.8%) | 55 (100.0%) |
| Bottled, Tank, or LP Gas | 244 (14.9%) | 0 (0.0%) |
| Electricity | 90 (5.5%) | 0 (0.0%) |
| Fuel Oil or Kerosene | 0 (0.0%) | 0 (0.0%) |
| Coal or Coke | 0 (0.0%) | 0 (0.0%) |
| All other Fuels | 209 (12.8%) | 0 (0.0%) |
| No Fuel Used | 0 (0.0%) | 0 (0.0%) |
| Total | 1,638 (100.0%) | 55 (100.0%) |
Household Vehicle Usage in Los Chaves
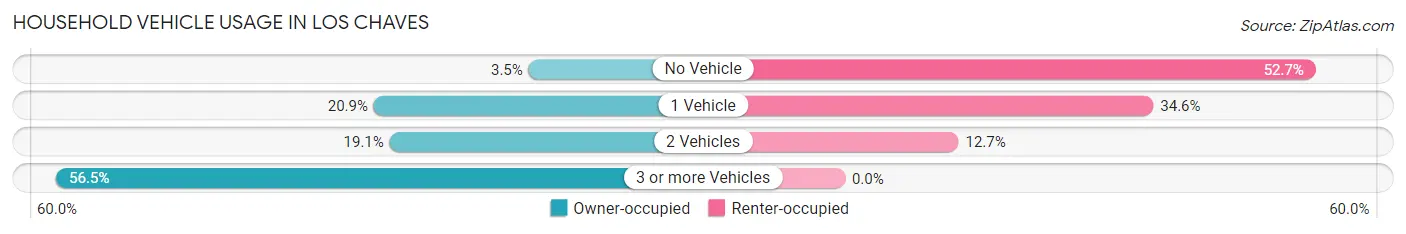
| Vehicles per Household | Owner-occupied | Renter-occupied |
| No Vehicle | 58 (3.5%) | 29 (52.7%) |
| 1 Vehicle | 342 (20.9%) | 19 (34.5%) |
| 2 Vehicles | 313 (19.1%) | 7 (12.7%) |
| 3 or more Vehicles | 925 (56.5%) | 0 (0.0%) |
| Total | 1,638 (100.0%) | 55 (100.0%) |
Real Estate & Mortgages in Los Chaves
Real Estate and Mortgage Overview in Los Chaves
| Characteristic | Without Mortgage | With Mortgage |
| Housing Units | 938 | 700 |
| Median Property Value | $192,100 | $237,700 |
| Median Household Income | $57,295 | $192 |
| Monthly Housing Costs | $515 | $97 |
| Real Estate Taxes | $1,627 | $0 |
Property Value by Mortgage Status in Los Chaves
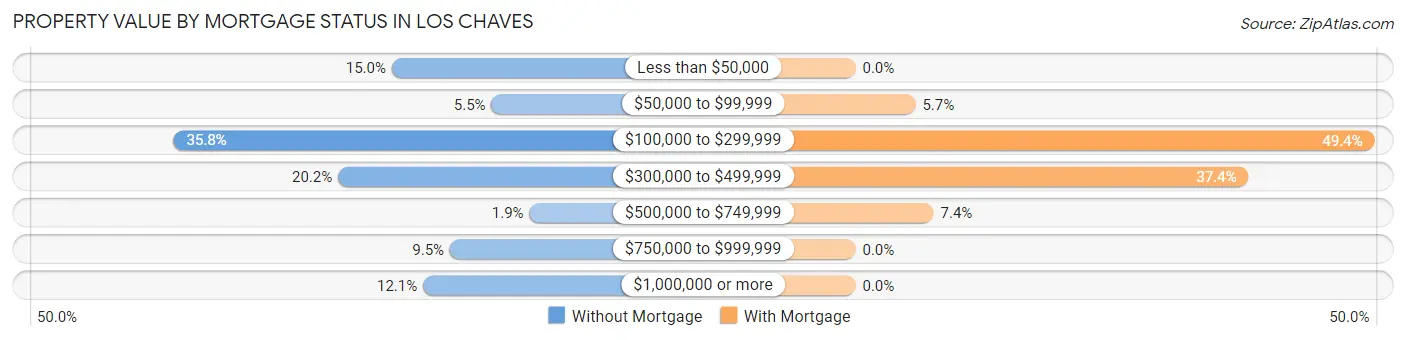
| Property Value | Without Mortgage | With Mortgage |
| Less than $50,000 | 141 (15.0%) | 0 (0.0%) |
| $50,000 to $99,999 | 52 (5.5%) | 40 (5.7%) |
| $100,000 to $299,999 | 336 (35.8%) | 346 (49.4%) |
| $300,000 to $499,999 | 189 (20.2%) | 262 (37.4%) |
| $500,000 to $749,999 | 18 (1.9%) | 52 (7.4%) |
| $750,000 to $999,999 | 89 (9.5%) | 0 (0.0%) |
| $1,000,000 or more | 113 (12.0%) | 0 (0.0%) |
| Total | 938 (100.0%) | 700 (100.0%) |
Household Income by Mortgage Status in Los Chaves
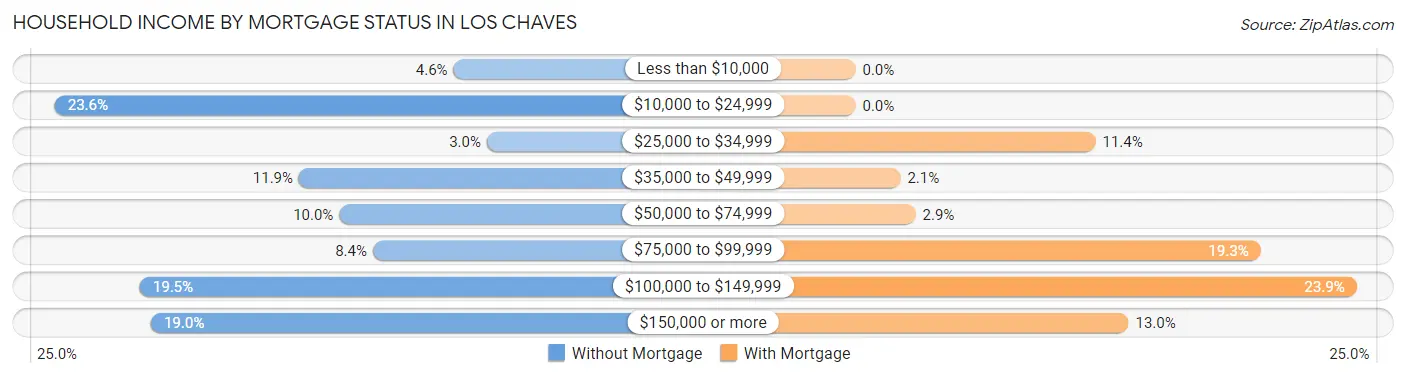
| Household Income | Without Mortgage | With Mortgage |
| Less than $10,000 | 43 (4.6%) | 0 (0.0%) |
| $10,000 to $24,999 | 221 (23.6%) | 0 (0.0%) |
| $25,000 to $34,999 | 28 (3.0%) | 80 (11.4%) |
| $35,000 to $49,999 | 112 (11.9%) | 15 (2.1%) |
| $50,000 to $74,999 | 94 (10.0%) | 20 (2.9%) |
| $75,000 to $99,999 | 79 (8.4%) | 135 (19.3%) |
| $100,000 to $149,999 | 183 (19.5%) | 167 (23.9%) |
| $150,000 or more | 178 (19.0%) | 91 (13.0%) |
| Total | 938 (100.0%) | 700 (100.0%) |
Property Value to Household Income Ratio in Los Chaves
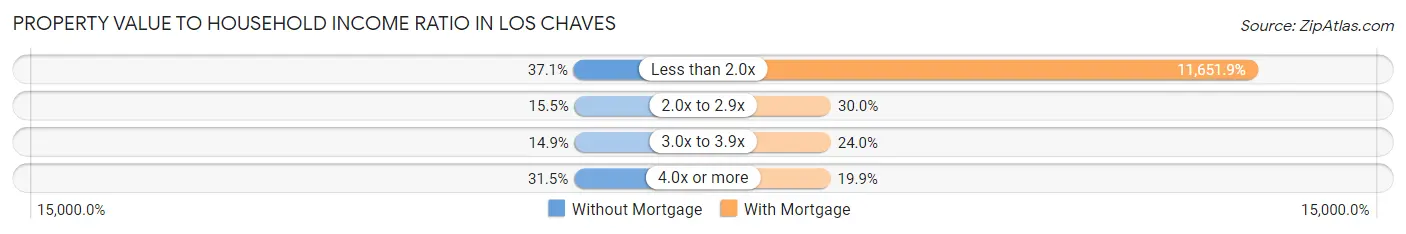
| Value-to-Income Ratio | Without Mortgage | With Mortgage |
| Less than 2.0x | 348 (37.1%) | 81,563 (11,651.9%) |
| 2.0x to 2.9x | 145 (15.5%) | 210 (30.0%) |
| 3.0x to 3.9x | 140 (14.9%) | 168 (24.0%) |
| 4.0x or more | 295 (31.5%) | 139 (19.9%) |
| Total | 938 (100.0%) | 700 (100.0%) |
Real Estate Taxes by Mortgage Status in Los Chaves
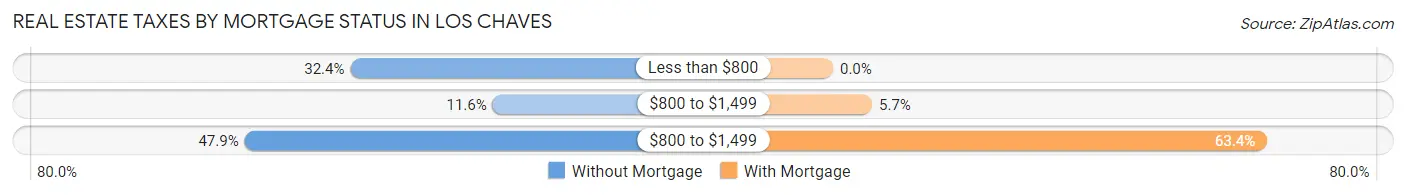
| Property Taxes | Without Mortgage | With Mortgage |
| Less than $800 | 304 (32.4%) | 0 (0.0%) |
| $800 to $1,499 | 109 (11.6%) | 40 (5.7%) |
| $800 to $1,499 | 449 (47.9%) | 444 (63.4%) |
| Total | 938 (100.0%) | 700 (100.0%) |
Health & Disability in Los Chaves
Health Insurance Coverage by Age in Los Chaves
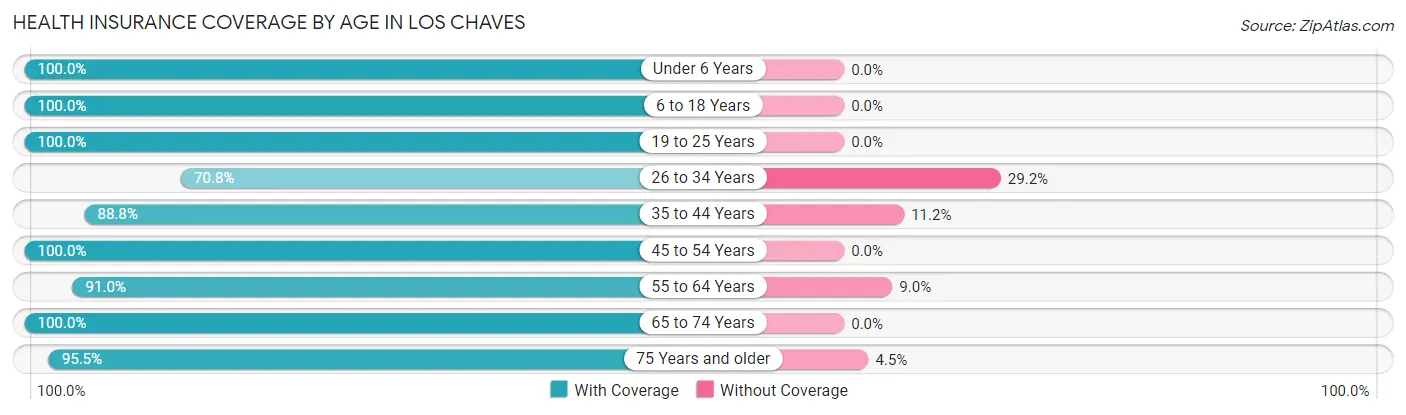
| Age Bracket | With Coverage | Without Coverage |
| Under 6 Years | 302 (100.0%) | 0 (0.0%) |
| 6 to 18 Years | 665 (100.0%) | 0 (0.0%) |
| 19 to 25 Years | 262 (100.0%) | 0 (0.0%) |
| 26 to 34 Years | 337 (70.8%) | 139 (29.2%) |
| 35 to 44 Years | 723 (88.8%) | 91 (11.2%) |
| 45 to 54 Years | 379 (100.0%) | 0 (0.0%) |
| 55 to 64 Years | 924 (91.0%) | 91 (9.0%) |
| 65 to 74 Years | 565 (100.0%) | 0 (0.0%) |
| 75 Years and older | 295 (95.5%) | 14 (4.5%) |
| Total | 4,452 (93.0%) | 335 (7.0%) |
Health Insurance Coverage by Citizenship Status in Los Chaves
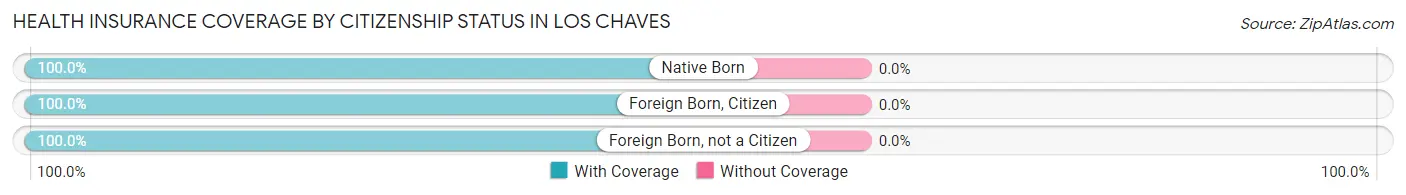
| Citizenship Status | With Coverage | Without Coverage |
| Native Born | 302 (100.0%) | 0 (0.0%) |
| Foreign Born, Citizen | 665 (100.0%) | 0 (0.0%) |
| Foreign Born, not a Citizen | 262 (100.0%) | 0 (0.0%) |
Health Insurance Coverage by Household Income in Los Chaves
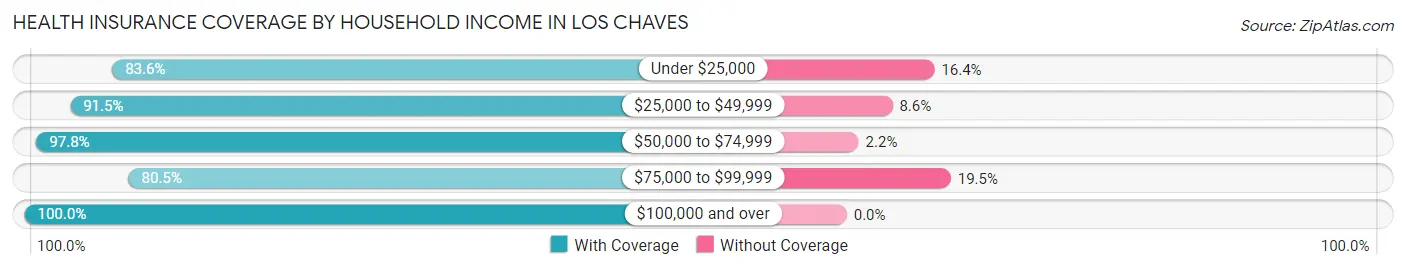
| Household Income | With Coverage | Without Coverage |
| Under $25,000 | 677 (83.6%) | 133 (16.4%) |
| $25,000 to $49,999 | 428 (91.4%) | 40 (8.6%) |
| $50,000 to $74,999 | 705 (97.8%) | 16 (2.2%) |
| $75,000 to $99,999 | 603 (80.5%) | 146 (19.5%) |
| $100,000 and over | 2,035 (100.0%) | 0 (0.0%) |
Public vs Private Health Insurance Coverage by Age in Los Chaves
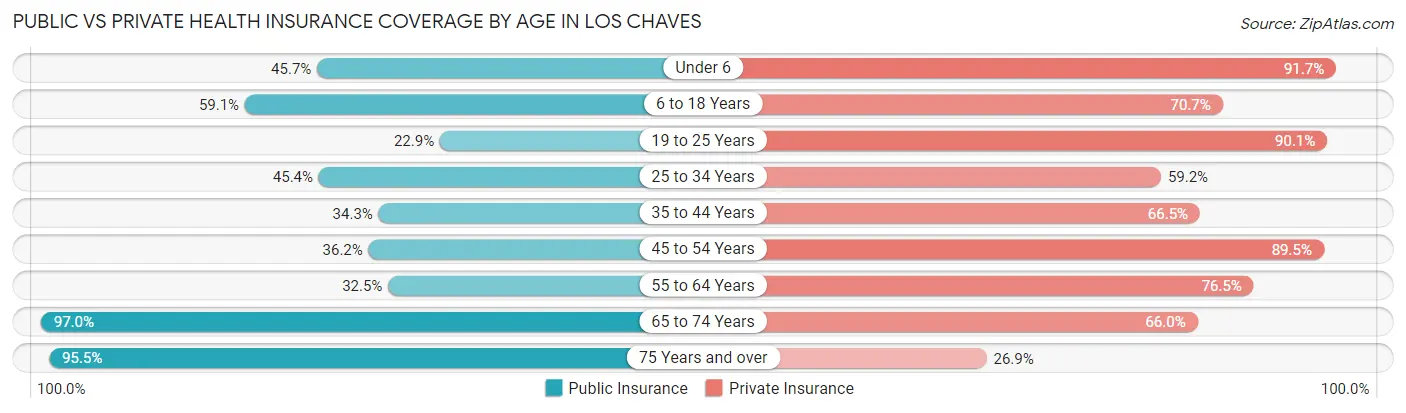
| Age Bracket | Public Insurance | Private Insurance |
| Under 6 | 138 (45.7%) | 277 (91.7%) |
| 6 to 18 Years | 393 (59.1%) | 470 (70.7%) |
| 19 to 25 Years | 60 (22.9%) | 236 (90.1%) |
| 25 to 34 Years | 216 (45.4%) | 282 (59.2%) |
| 35 to 44 Years | 279 (34.3%) | 541 (66.5%) |
| 45 to 54 Years | 137 (36.1%) | 339 (89.4%) |
| 55 to 64 Years | 330 (32.5%) | 776 (76.4%) |
| 65 to 74 Years | 548 (97.0%) | 373 (66.0%) |
| 75 Years and over | 295 (95.5%) | 83 (26.9%) |
| Total | 2,396 (50.0%) | 3,377 (70.6%) |
Disability Status by Sex by Age in Los Chaves
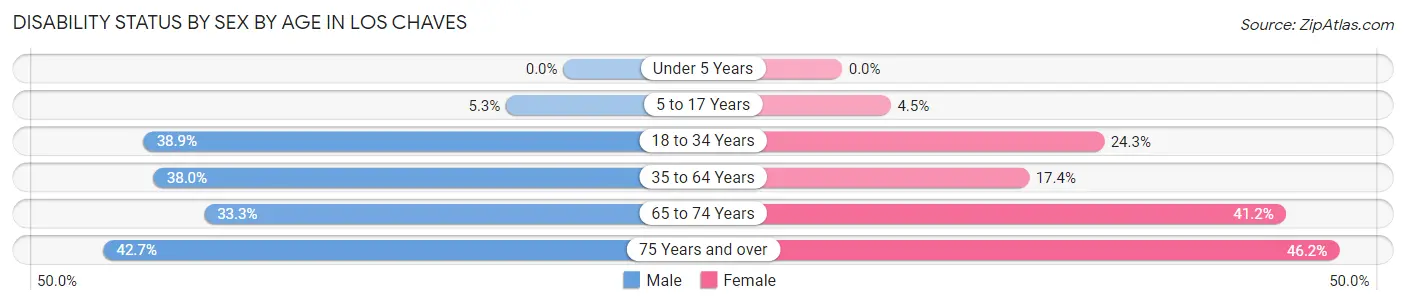
| Age Bracket | Male | Female |
| Under 5 Years | 0 (0.0%) | 0 (0.0%) |
| 5 to 17 Years | 18 (5.3%) | 18 (4.5%) |
| 18 to 34 Years | 132 (38.9%) | 97 (24.3%) |
| 35 to 64 Years | 434 (38.0%) | 185 (17.3%) |
| 65 to 74 Years | 109 (33.3%) | 98 (41.2%) |
| 75 Years and over | 32 (42.7%) | 108 (46.2%) |
Disability Class by Sex by Age in Los Chaves
Disability Class: Hearing Difficulty
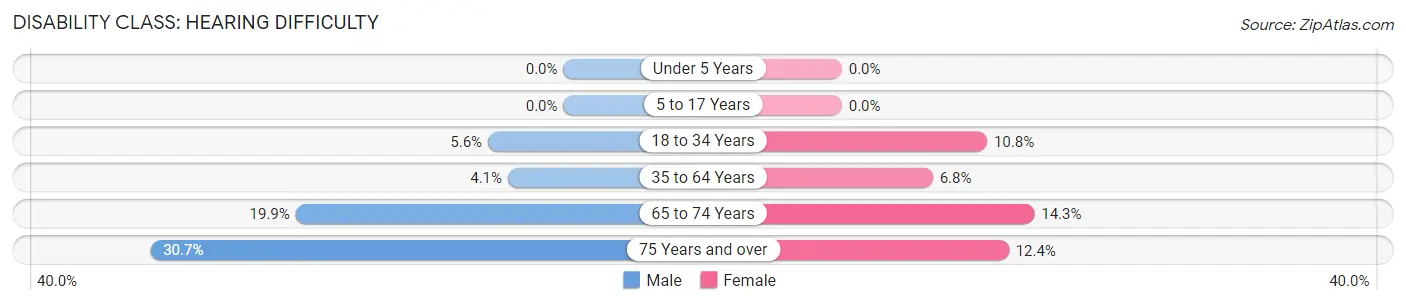
| Age Bracket | Male | Female |
| Under 5 Years | 0 (0.0%) | 0 (0.0%) |
| 5 to 17 Years | 0 (0.0%) | 0 (0.0%) |
| 18 to 34 Years | 19 (5.6%) | 43 (10.8%) |
| 35 to 64 Years | 47 (4.1%) | 72 (6.8%) |
| 65 to 74 Years | 65 (19.9%) | 34 (14.3%) |
| 75 Years and over | 23 (30.7%) | 29 (12.4%) |
Disability Class: Vision Difficulty
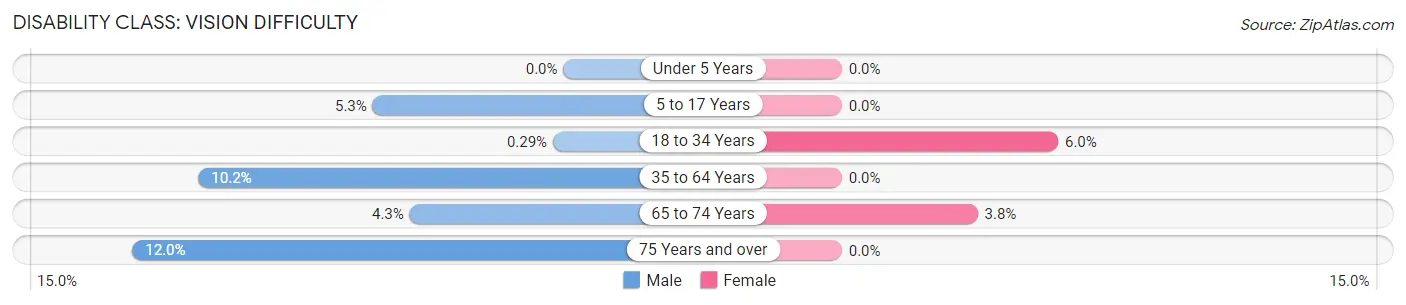
| Age Bracket | Male | Female |
| Under 5 Years | 0 (0.0%) | 0 (0.0%) |
| 5 to 17 Years | 18 (5.3%) | 0 (0.0%) |
| 18 to 34 Years | 1 (0.3%) | 24 (6.0%) |
| 35 to 64 Years | 116 (10.2%) | 0 (0.0%) |
| 65 to 74 Years | 14 (4.3%) | 9 (3.8%) |
| 75 Years and over | 9 (12.0%) | 0 (0.0%) |
Disability Class: Cognitive Difficulty
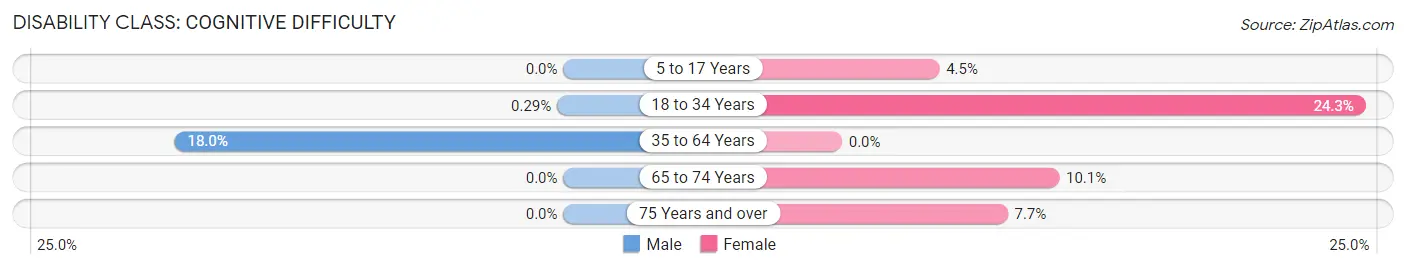
| Age Bracket | Male | Female |
| 5 to 17 Years | 0 (0.0%) | 18 (4.5%) |
| 18 to 34 Years | 1 (0.3%) | 97 (24.3%) |
| 35 to 64 Years | 206 (18.0%) | 0 (0.0%) |
| 65 to 74 Years | 0 (0.0%) | 24 (10.1%) |
| 75 Years and over | 0 (0.0%) | 18 (7.7%) |
Disability Class: Ambulatory Difficulty
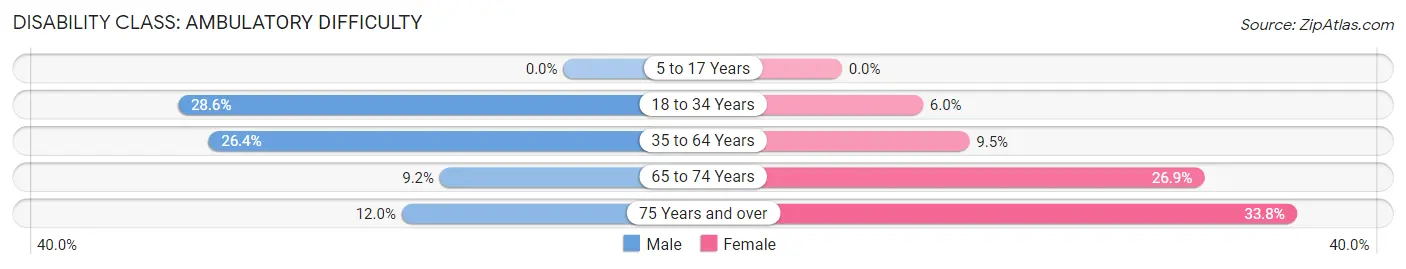
| Age Bracket | Male | Female |
| 5 to 17 Years | 0 (0.0%) | 0 (0.0%) |
| 18 to 34 Years | 97 (28.6%) | 24 (6.0%) |
| 35 to 64 Years | 301 (26.4%) | 101 (9.5%) |
| 65 to 74 Years | 30 (9.2%) | 64 (26.9%) |
| 75 Years and over | 9 (12.0%) | 79 (33.8%) |
Disability Class: Self-Care Difficulty
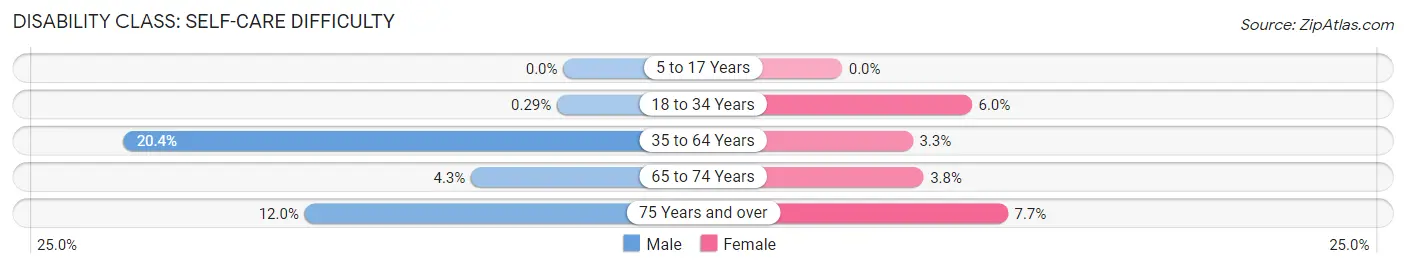
| Age Bracket | Male | Female |
| 5 to 17 Years | 0 (0.0%) | 0 (0.0%) |
| 18 to 34 Years | 1 (0.3%) | 24 (6.0%) |
| 35 to 64 Years | 233 (20.4%) | 35 (3.3%) |
| 65 to 74 Years | 14 (4.3%) | 9 (3.8%) |
| 75 Years and over | 9 (12.0%) | 18 (7.7%) |
Technology Access in Los Chaves
Computing Device Access in Los Chaves
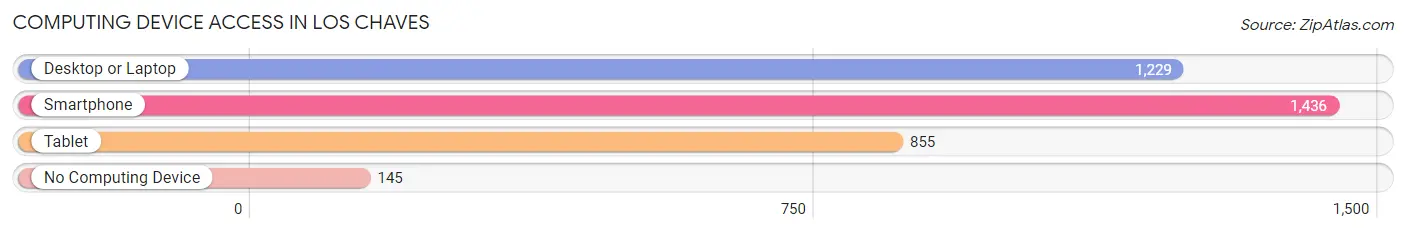
| Device Type | # Households | % Households |
| Desktop or Laptop | 1,229 | 72.6% |
| Smartphone | 1,436 | 84.8% |
| Tablet | 855 | 50.5% |
| No Computing Device | 145 | 8.6% |
| Total | 1,693 | 100.0% |
Internet Access in Los Chaves
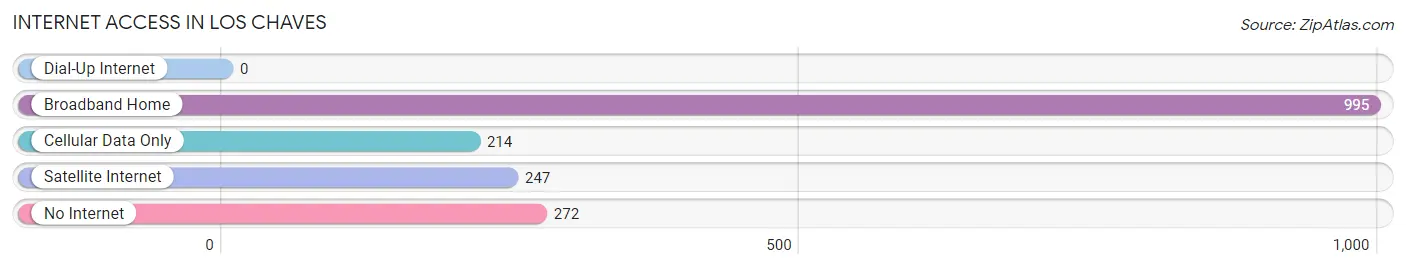
| Internet Type | # Households | % Households |
| Dial-Up Internet | 0 | 0.0% |
| Broadband Home | 995 | 58.8% |
| Cellular Data Only | 214 | 12.6% |
| Satellite Internet | 247 | 14.6% |
| No Internet | 272 | 16.1% |
| Total | 1,693 | 100.0% |
Los Chaves Summary
Chaves is a small unincorporated community located in Chaves County, New Mexico. It is situated in the southeastern corner of the state, approximately 30 miles south of Roswell and about 50 miles east of Carlsbad. The population of Chaves was estimated to be around 1,000 in 2020.
Geography
Chaves is located in the Chihuahuan Desert, which is characterized by hot, dry summers and mild winters. The terrain is mostly flat, with some rolling hills and mesas. The area is sparsely populated, with most of the population concentrated in the small towns of Chaves, Lake Arthur, and Hagerman. The nearest major city is Roswell, which is about 30 miles to the north.
The climate in Chaves is semi-arid, with hot summers and mild winters. The average high temperature in July is around 90°F, and the average low temperature in January is around 30°F. The area receives an average of about 10 inches of precipitation per year, most of which falls in the summer months.
Economy
The economy of Chaves is largely based on agriculture and ranching. The area is known for its production of cotton, alfalfa, and pecans. The area also has a thriving oil and gas industry, with several oil and gas wells located in the area.
In addition to agriculture and oil and gas, Chaves is home to several small businesses, including a grocery store, a hardware store, and a few restaurants. The town also has a small airport, which serves as a hub for private and commercial flights.
Demographics
As of the 2010 census, the population of Chaves was 1,000. The racial makeup of the town was 94.2% White, 0.7% African American, 0.3% Native American, 0.2% Asian, 0.1% Pacific Islander, and 4.5% from other races. Hispanic or Latino of any race were 8.2% of the population.
The median household income in Chaves was $30,000, and the median family income was $35,000. About 17.5% of the population was below the poverty line.
Conclusion
Chaves is a small unincorporated community located in Chaves County, New Mexico. It is situated in the southeastern corner of the state, approximately 30 miles south of Roswell and about 50 miles east of Carlsbad. The population of Chaves was estimated to be around 1,000 in 2020. The economy of Chaves is largely based on agriculture and ranching, with some oil and gas production and small businesses. The racial makeup of the town was 94.2% White, 0.7% African American, 0.3% Native American, 0.2% Asian, 0.1% Pacific Islander, and 4.5% from other races. Hispanic or Latino of any race were 8.2% of the population. The median household income in Chaves was $30,000, and the median family income was $35,000.
Common Questions
What is Per Capita Income in Los Chaves?
Per Capita income in Los Chaves is $42,806.
What is the Median Family Income in Los Chaves?
Median Family Income in Los Chaves is $81,849.
What is the Median Household income in Los Chaves?
Median Household Income in Los Chaves is $77,364.
What is Income or Wage Gap in Los Chaves?
Income or Wage Gap in Los Chaves is 5.1%.
Women in Los Chaves earn 94.9 cents for every dollar earned by a man.
What is Inequality or Gini Index in Los Chaves?
Inequality or Gini Index in Los Chaves is 0.49.
What is the Total Population of Los Chaves?
Total Population of Los Chaves is 4,840.
What is the Total Male Population of Los Chaves?
Total Male Population of Los Chaves is 2,323.
What is the Total Female Population of Los Chaves?
Total Female Population of Los Chaves is 2,517.
What is the Ratio of Males per 100 Females in Los Chaves?
There are 92.29 Males per 100 Females in Los Chaves.
What is the Ratio of Females per 100 Males in Los Chaves?
There are 108.35 Females per 100 Males in Los Chaves.
What is the Median Population Age in Los Chaves?
Median Population Age in Los Chaves is 40.3 Years.
What is the Average Family Size in Los Chaves
Average Family Size in Los Chaves is 3.2 People.
What is the Average Household Size in Los Chaves
Average Household Size in Los Chaves is 2.9 People.
How Large is the Labor Force in Los Chaves?
There are 2,243 People in the Labor Forcein in Los Chaves.
What is the Percentage of People in the Labor Force in Los Chaves?
57.0% of People are in the Labor Force in Los Chaves.
What is the Unemployment Rate in Los Chaves?
Unemployment Rate in Los Chaves is 3.6%.