Bayard, NM Map & Demographics
Bayard Map
Bayard Overview
$22,913
PER CAPITA INCOME
$34,699
AVG HOUSEHOLD INCOME
0.47
INEQUALITY / GINI INDEX
2,152
TOTAL POPULATION
1,094
MALE POPULATION
1,058
FEMALE POPULATION
103.40
MALES / 100 FEMALES
96.71
FEMALES / 100 MALES
37.1
MEDIAN AGE
3.7
AVG FAMILY SIZE
2.5
AVG HOUSEHOLD SIZE
602
LABOR FORCE [ PEOPLE ]
36.0%
PERCENT IN LABOR FORCE
7.6%
UNEMPLOYMENT RATE
Bayard Zip Codes
Bayard Area Codes
Income in Bayard
Income Overview in Bayard
| Characteristic | Number | Measure |
| Per Capita Income | 2,152 | $22,913 |
| Median Family Income | 394 | $0 |
| Mean Family Income | 394 | $81,498 |
| Median Household Income | 861 | $34,699 |
| Mean Household Income | 861 | $58,729 |
| Income Deficit | 394 | $0 |
| Wage / Income Gap (%) | 2,152 | 0.00% |
| Wage / Income Gap ($) | 2,152 | 100.00¢ per $1 |
| Gini / Inequality Index | 2,152 | 0.47 |
Earnings by Sex in Bayard
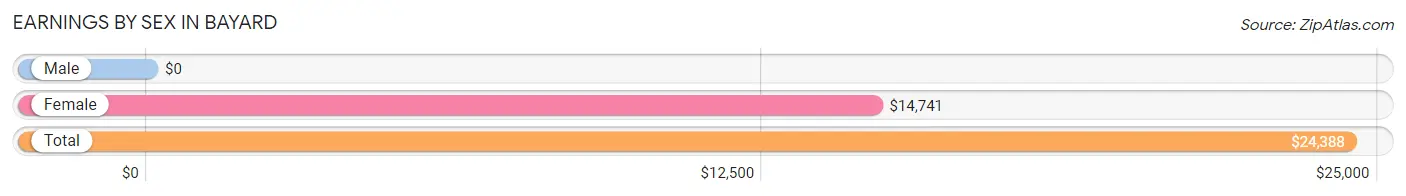
| Sex | Number | Average Earnings |
| Male | 368 (48.7%) | $0 |
| Female | 387 (51.3%) | $14,741 |
| Total | 755 (100.0%) | $24,388 |
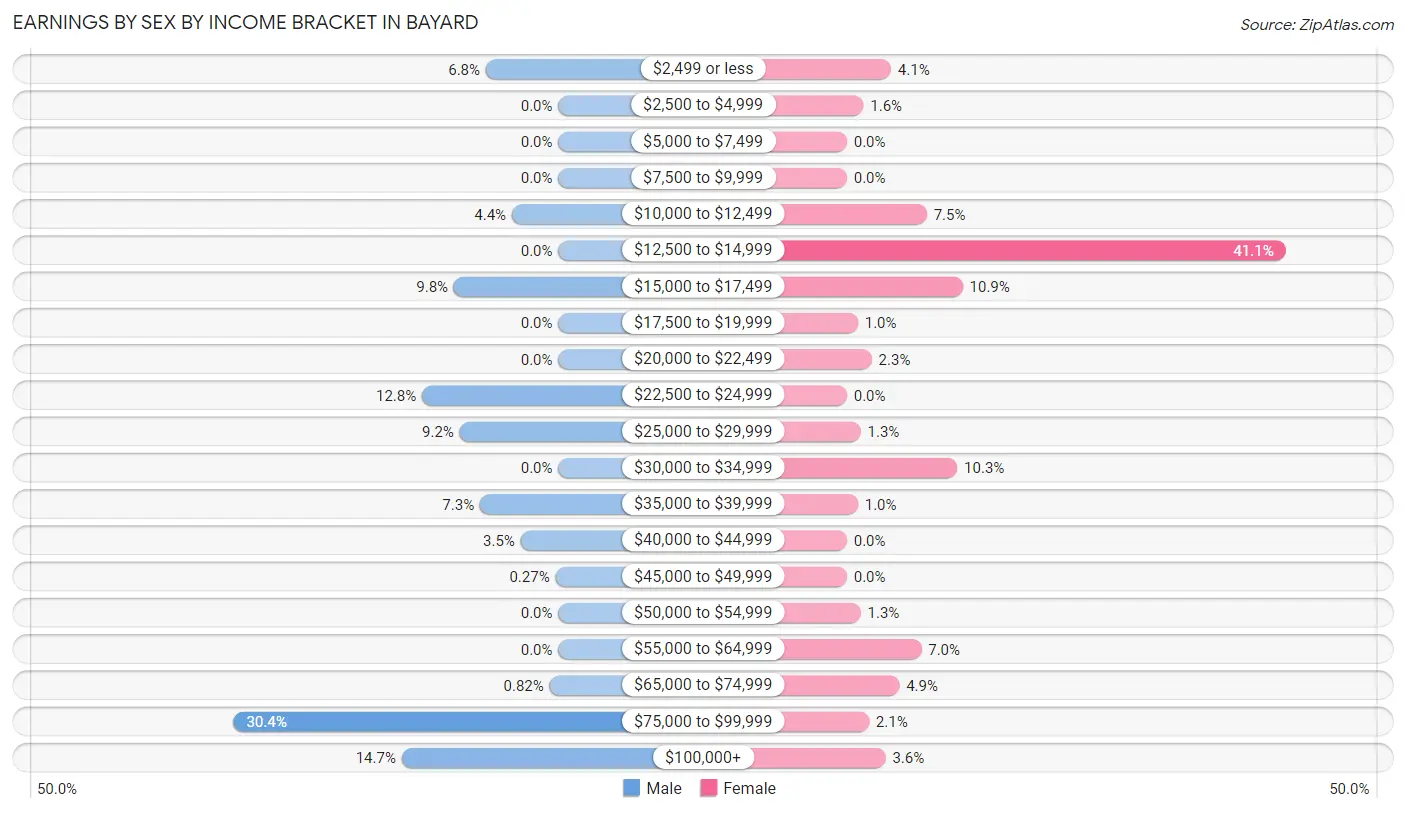
Earnings by Sex by Income Bracket in Bayard
The most common earnings brackets in Bayard are $75,000 to $99,999 for men (112 | 30.4%) and $12,500 to $14,999 for women (159 | 41.1%).
| Income | Male | Female |
| $2,499 or less | 25 (6.8%) | 16 (4.1%) |
| $2,500 to $4,999 | 0 (0.0%) | 6 (1.5%) |
| $5,000 to $7,499 | 0 (0.0%) | 0 (0.0%) |
| $7,500 to $9,999 | 0 (0.0%) | 0 (0.0%) |
| $10,000 to $12,499 | 16 (4.3%) | 29 (7.5%) |
| $12,500 to $14,999 | 0 (0.0%) | 159 (41.1%) |
| $15,000 to $17,499 | 36 (9.8%) | 42 (10.8%) |
| $17,500 to $19,999 | 0 (0.0%) | 4 (1.0%) |
| $20,000 to $22,499 | 0 (0.0%) | 9 (2.3%) |
| $22,500 to $24,999 | 47 (12.8%) | 0 (0.0%) |
| $25,000 to $29,999 | 34 (9.2%) | 5 (1.3%) |
| $30,000 to $34,999 | 0 (0.0%) | 40 (10.3%) |
| $35,000 to $39,999 | 27 (7.3%) | 4 (1.0%) |
| $40,000 to $44,999 | 13 (3.5%) | 0 (0.0%) |
| $45,000 to $49,999 | 1 (0.3%) | 0 (0.0%) |
| $50,000 to $54,999 | 0 (0.0%) | 5 (1.3%) |
| $55,000 to $64,999 | 0 (0.0%) | 27 (7.0%) |
| $65,000 to $74,999 | 3 (0.8%) | 19 (4.9%) |
| $75,000 to $99,999 | 112 (30.4%) | 8 (2.1%) |
| $100,000+ | 54 (14.7%) | 14 (3.6%) |
| Total | 368 (100.0%) | 387 (100.0%) |
Earnings by Sex by Educational Attainment in Bayard
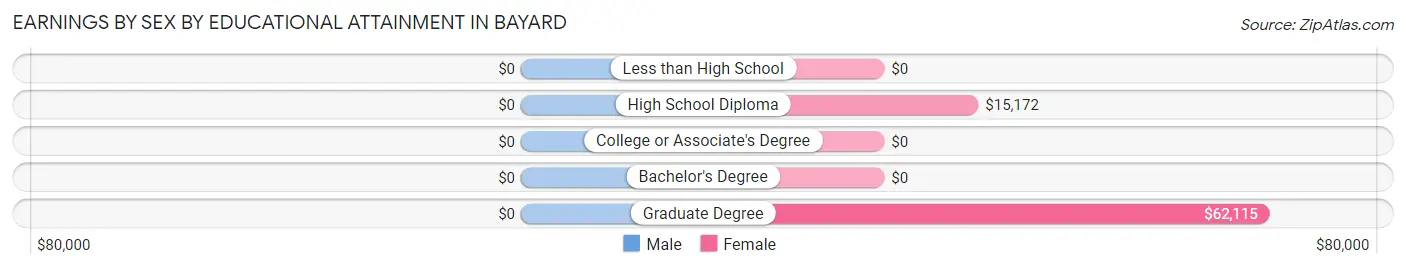
| Educational Attainment | Male Income | Female Income |
| Less than High School | - | - |
| High School Diploma | - | - |
| College or Associate's Degree | - | - |
| Bachelor's Degree | - | - |
| Graduate Degree | - | - |
| Total | $39,236 | $30,375 |
Family Income in Bayard
Family Income Brackets in Bayard
According to the Bayard family income data, there are 105 families falling into the $100,000 to $149,999 income range, which is the most common income bracket and makes up 26.7% of all families.
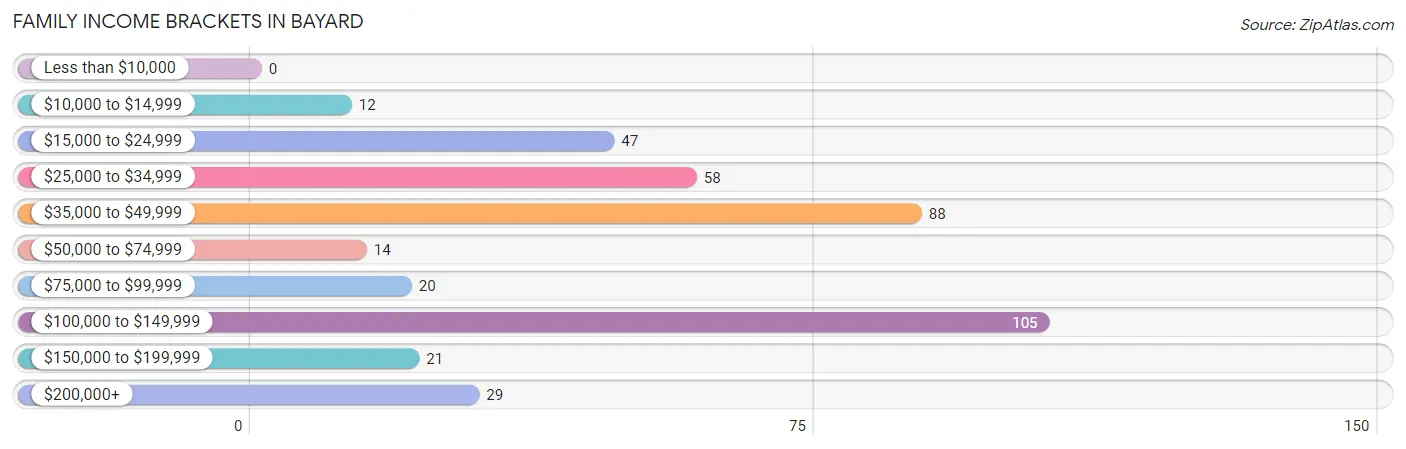
| Income Bracket | # Families | % Families |
| Less than $10,000 | 0 | 0.0% |
| $10,000 to $14,999 | 12 | 3.0% |
| $15,000 to $24,999 | 47 | 11.9% |
| $25,000 to $34,999 | 58 | 14.7% |
| $35,000 to $49,999 | 88 | 22.3% |
| $50,000 to $74,999 | 14 | 3.6% |
| $75,000 to $99,999 | 20 | 5.1% |
| $100,000 to $149,999 | 105 | 26.6% |
| $150,000 to $199,999 | 21 | 5.3% |
| $200,000+ | 29 | 7.4% |
Family Income by Famaliy Size in Bayard
5-person families (31 | 7.9%) account for the highest median family income in Bayard with $115,655 per family, while 5-person families (31 | 7.9%) have the highest median income of $23,131 per family member.
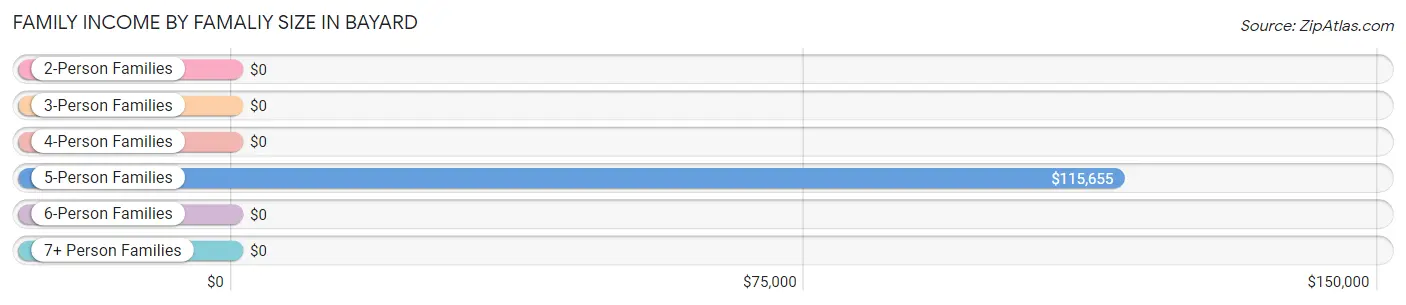
| Income Bracket | # Families | Median Income |
| 2-Person Families | 224 (56.9%) | $0 |
| 3-Person Families | 29 (7.4%) | $0 |
| 4-Person Families | 86 (21.8%) | $0 |
| 5-Person Families | 31 (7.9%) | $115,655 |
| 6-Person Families | 9 (2.3%) | $0 |
| 7+ Person Families | 15 (3.8%) | $0 |
| Total | 394 (100.0%) | $0 |
Family Income by Number of Earners in Bayard
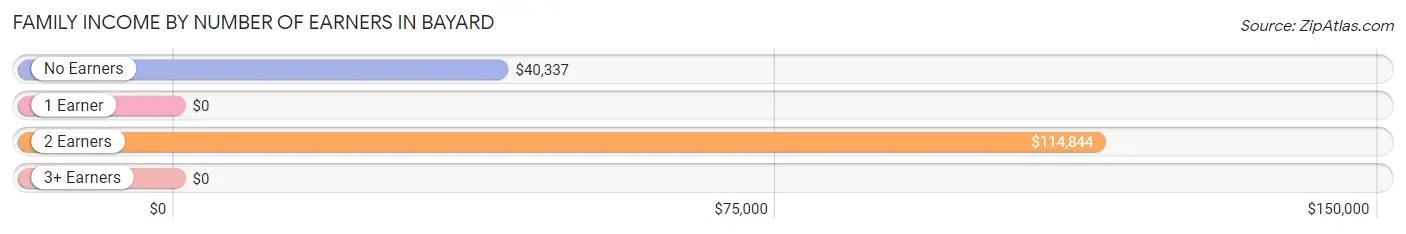
| Number of Earners | # Families | Median Income |
| No Earners | 115 (29.2%) | $40,337 |
| 1 Earner | 158 (40.1%) | $0 |
| 2 Earners | 99 (25.1%) | $114,844 |
| 3+ Earners | 22 (5.6%) | $0 |
| Total | 394 (100.0%) | $0 |
Household Income in Bayard
Household Income Brackets in Bayard
With 155 households falling in the category, the $25,000 to $34,999 income range is the most frequent in Bayard, accounting for 18.0% of all households. In contrast, only 12 households (1.4%) fall into the $50,000 to $74,999 income bracket, making it the least populous group.
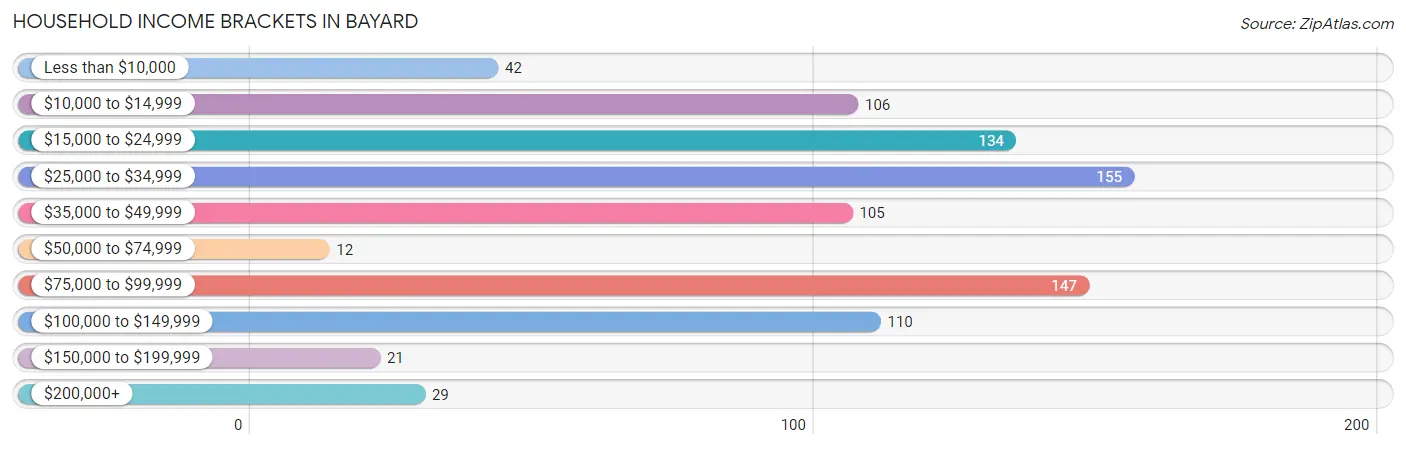
| Income Bracket | # Households | % Households |
| Less than $10,000 | 42 | 4.9% |
| $10,000 to $14,999 | 106 | 12.3% |
| $15,000 to $24,999 | 134 | 15.6% |
| $25,000 to $34,999 | 155 | 18.0% |
| $35,000 to $49,999 | 105 | 12.2% |
| $50,000 to $74,999 | 12 | 1.4% |
| $75,000 to $99,999 | 147 | 17.1% |
| $100,000 to $149,999 | 110 | 12.8% |
| $150,000 to $199,999 | 21 | 2.4% |
| $200,000+ | 29 | 3.4% |
Household Income by Householder Age in Bayard
The median household income in Bayard is $34,699, with the highest median household income of $31,218 found in the 45 to 64 years age bracket for the primary householder. A total of 210 households (24.4%) fall into this category. Meanwhile, the 15 to 24 years age bracket for the primary householder has the lowest median household income of $0, with 103 households (12.0%) in this group.
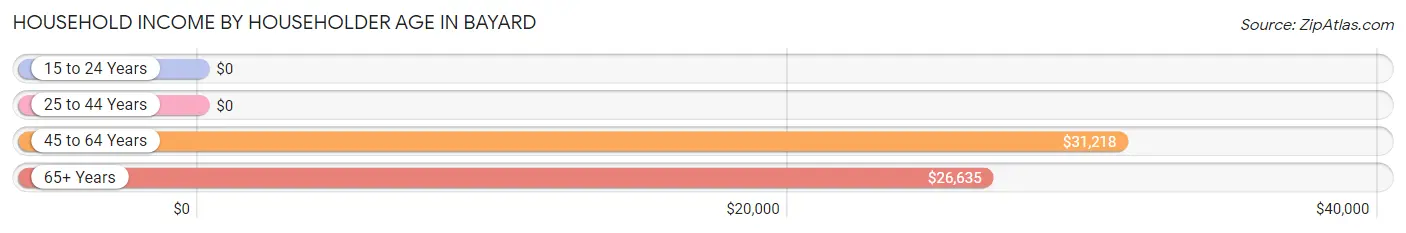
| Income Bracket | # Households | Median Income |
| 15 to 24 Years | 103 (12.0%) | $0 |
| 25 to 44 Years | 193 (22.4%) | $0 |
| 45 to 64 Years | 210 (24.4%) | $31,218 |
| 65+ Years | 355 (41.2%) | $26,635 |
| Total | 861 (100.0%) | $34,699 |
Poverty in Bayard
Income Below Poverty by Sex and Age in Bayard
With 17.1% poverty level for males and 39.4% for females among the residents of Bayard, 65 to 74 year old males and under 5 year old females are the most vulnerable to poverty, with 84 males (55.6%) and 43 females (100.0%) in their respective age groups living below the poverty level.
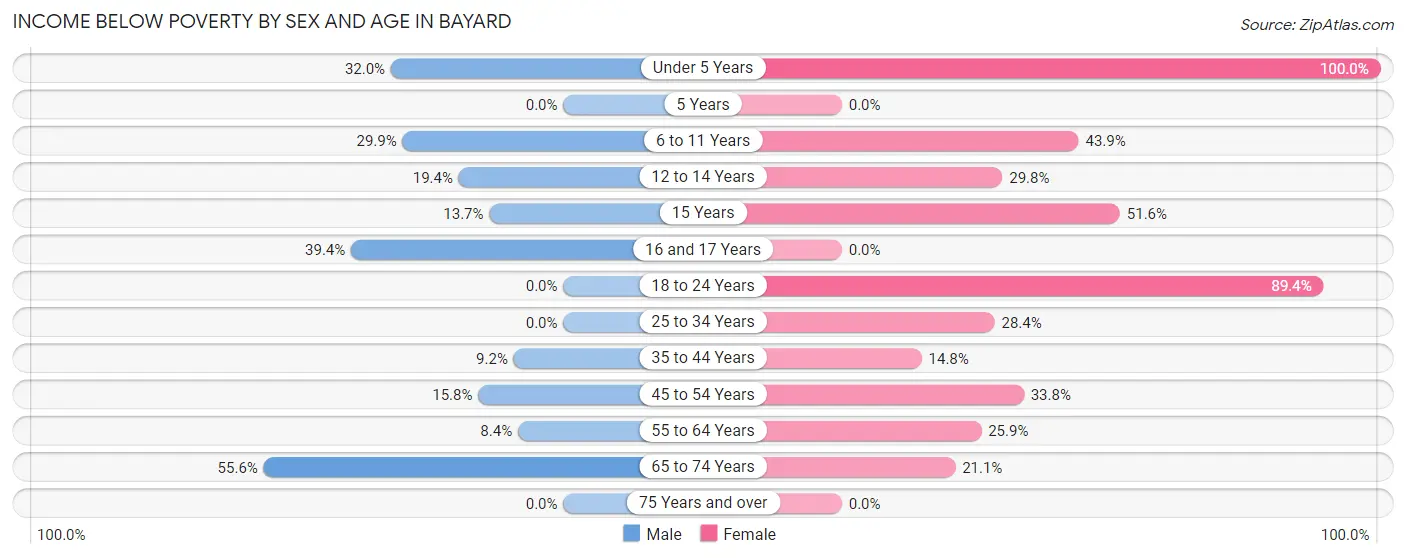
| Age Bracket | Male | Female |
| Under 5 Years | 16 (32.0%) | 43 (100.0%) |
| 5 Years | 0 (0.0%) | 0 (0.0%) |
| 6 to 11 Years | 20 (29.8%) | 29 (43.9%) |
| 12 to 14 Years | 13 (19.4%) | 28 (29.8%) |
| 15 Years | 7 (13.7%) | 16 (51.6%) |
| 16 and 17 Years | 13 (39.4%) | 0 (0.0%) |
| 18 to 24 Years | 0 (0.0%) | 186 (89.4%) |
| 25 to 34 Years | 0 (0.0%) | 19 (28.4%) |
| 35 to 44 Years | 14 (9.2%) | 20 (14.8%) |
| 45 to 54 Years | 12 (15.8%) | 26 (33.8%) |
| 55 to 64 Years | 8 (8.4%) | 22 (25.9%) |
| 65 to 74 Years | 84 (55.6%) | 28 (21.0%) |
| 75 Years and over | 0 (0.0%) | 0 (0.0%) |
| Total | 187 (17.1%) | 417 (39.4%) |
Income Above Poverty by Sex and Age in Bayard
According to the poverty statistics in Bayard, males aged 5 years and females aged 16 and 17 years are the age groups that are most secure financially, with 100.0% of males and 100.0% of females in these age groups living above the poverty line.
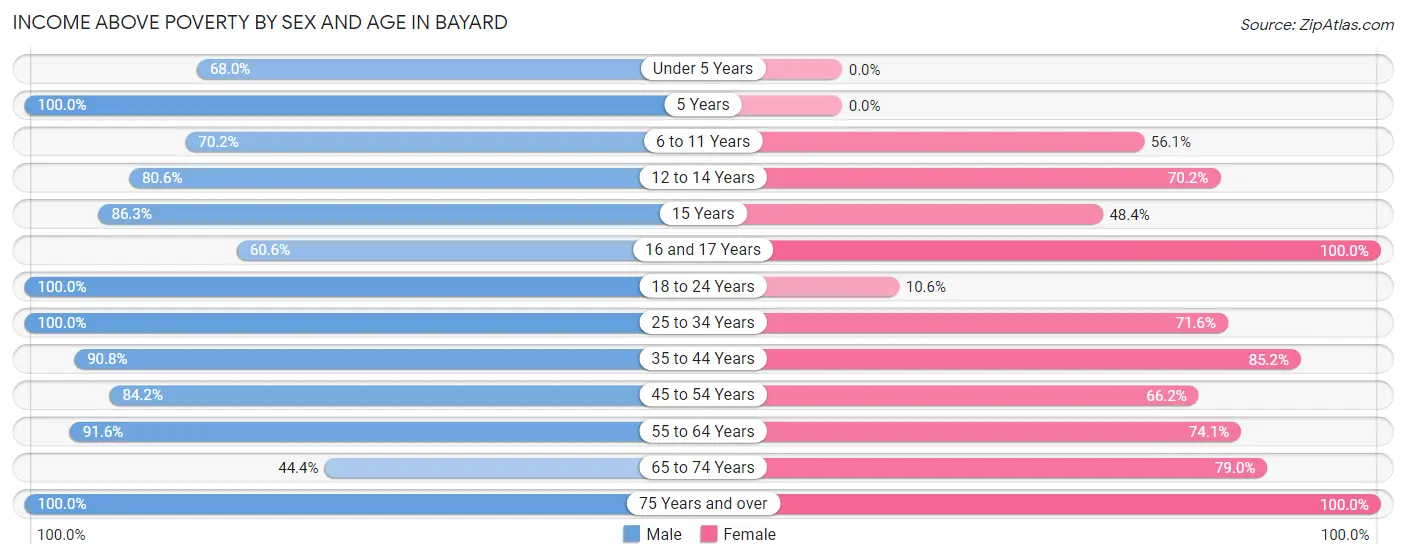
| Age Bracket | Male | Female |
| Under 5 Years | 34 (68.0%) | 0 (0.0%) |
| 5 Years | 11 (100.0%) | 0 (0.0%) |
| 6 to 11 Years | 47 (70.2%) | 37 (56.1%) |
| 12 to 14 Years | 54 (80.6%) | 66 (70.2%) |
| 15 Years | 44 (86.3%) | 15 (48.4%) |
| 16 and 17 Years | 20 (60.6%) | 44 (100.0%) |
| 18 to 24 Years | 205 (100.0%) | 22 (10.6%) |
| 25 to 34 Years | 26 (100.0%) | 48 (71.6%) |
| 35 to 44 Years | 138 (90.8%) | 115 (85.2%) |
| 45 to 54 Years | 64 (84.2%) | 51 (66.2%) |
| 55 to 64 Years | 87 (91.6%) | 63 (74.1%) |
| 65 to 74 Years | 67 (44.4%) | 105 (78.9%) |
| 75 Years and over | 110 (100.0%) | 75 (100.0%) |
| Total | 907 (82.9%) | 641 (60.6%) |
Income Below Poverty Among Married-Couple Families in Bayard
The poverty statistics for married-couple families in Bayard show that 8.5% or 24 of the total 284 families live below the poverty line. Families with 5 or more children have the highest poverty rate of 100.0%, comprising of 14 families. On the other hand, families with 1 or 2 children have the lowest poverty rate of 0.0%, which includes 0 families.
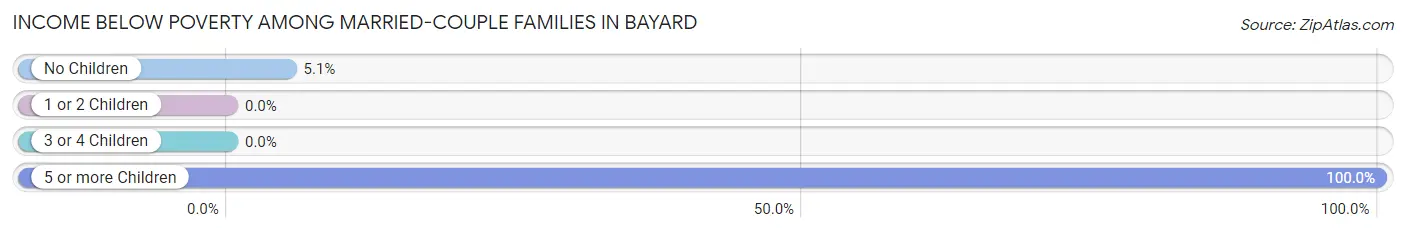
| Children | Above Poverty | Below Poverty |
| No Children | 186 (94.9%) | 10 (5.1%) |
| 1 or 2 Children | 43 (100.0%) | 0 (0.0%) |
| 3 or 4 Children | 31 (100.0%) | 0 (0.0%) |
| 5 or more Children | 0 (0.0%) | 14 (100.0%) |
| Total | 260 (91.5%) | 24 (8.5%) |
Income Below Poverty Among Single-Parent Households in Bayard
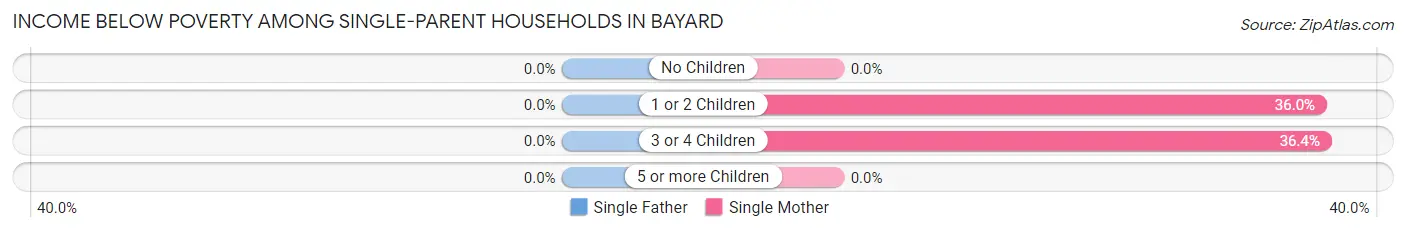
| Children | Single Father | Single Mother |
| No Children | 0 (0.0%) | 0 (0.0%) |
| 1 or 2 Children | 0 (0.0%) | 9 (36.0%) |
| 3 or 4 Children | 0 (0.0%) | 12 (36.4%) |
| 5 or more Children | 0 (0.0%) | 0 (0.0%) |
| Total | 0 (0.0%) | 21 (25.6%) |
Income Below Poverty Among Married-Couple vs Single-Parent Households in Bayard
The poverty data for Bayard shows that 24 of the married-couple family households (8.5%) and 21 of the single-parent households (19.1%) are living below the poverty level. Within the married-couple family households, those with 5 or more children have the highest poverty rate, with 14 households (100.0%) falling below the poverty line. Among the single-parent households, those with 3 or 4 children have the highest poverty rate, with 12 household (36.4%) living below poverty.
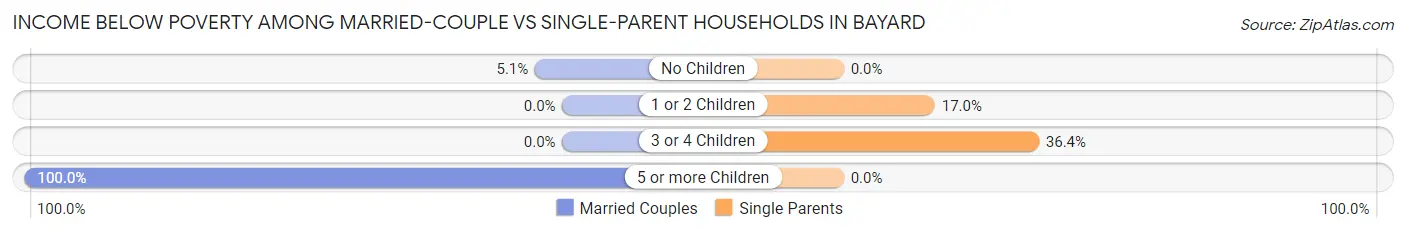
| Children | Married-Couple Families | Single-Parent Households |
| No Children | 10 (5.1%) | 0 (0.0%) |
| 1 or 2 Children | 0 (0.0%) | 9 (17.0%) |
| 3 or 4 Children | 0 (0.0%) | 12 (36.4%) |
| 5 or more Children | 14 (100.0%) | 0 (0.0%) |
| Total | 24 (8.5%) | 21 (19.1%) |
Race in Bayard
The most populous races in Bayard are Hispanic or Latino (1,743 | 81.0%), White / Caucasian (1,242 | 57.7%), and Two or more Races (812 | 37.7%).
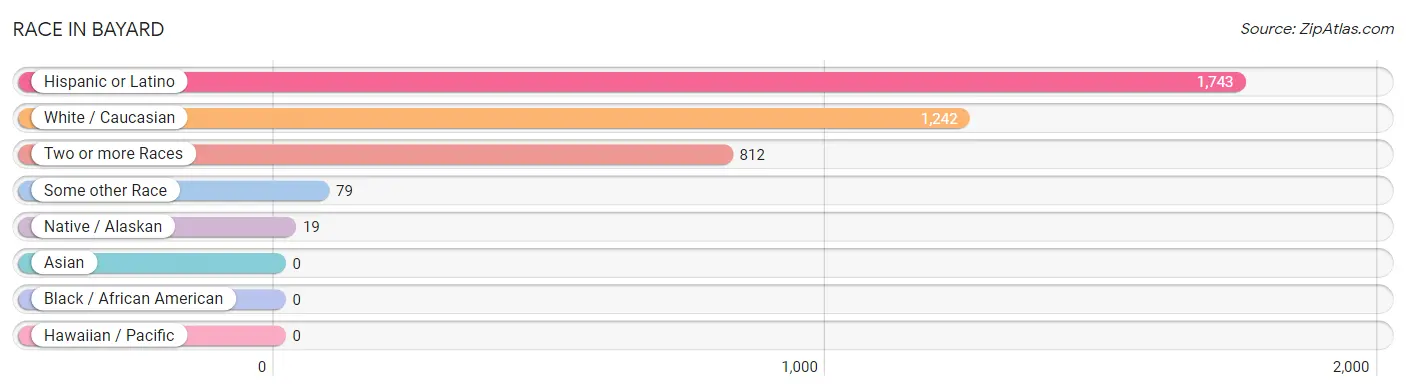
| Race | # Population | % Population |
| Asian | 0 | 0.0% |
| Black / African American | 0 | 0.0% |
| Hawaiian / Pacific | 0 | 0.0% |
| Hispanic or Latino | 1,743 | 81.0% |
| Native / Alaskan | 19 | 0.9% |
| White / Caucasian | 1,242 | 57.7% |
| Two or more Races | 812 | 37.7% |
| Some other Race | 79 | 3.7% |
| Total | 2,152 | 100.0% |
Ancestry in Bayard
The most populous ancestries reported in Bayard are Mexican (1,567 | 72.8%), German (181 | 8.4%), Irish (175 | 8.1%), English (152 | 7.1%), and Cuban (74 | 3.4%), together accounting for 99.9% of all Bayard residents.
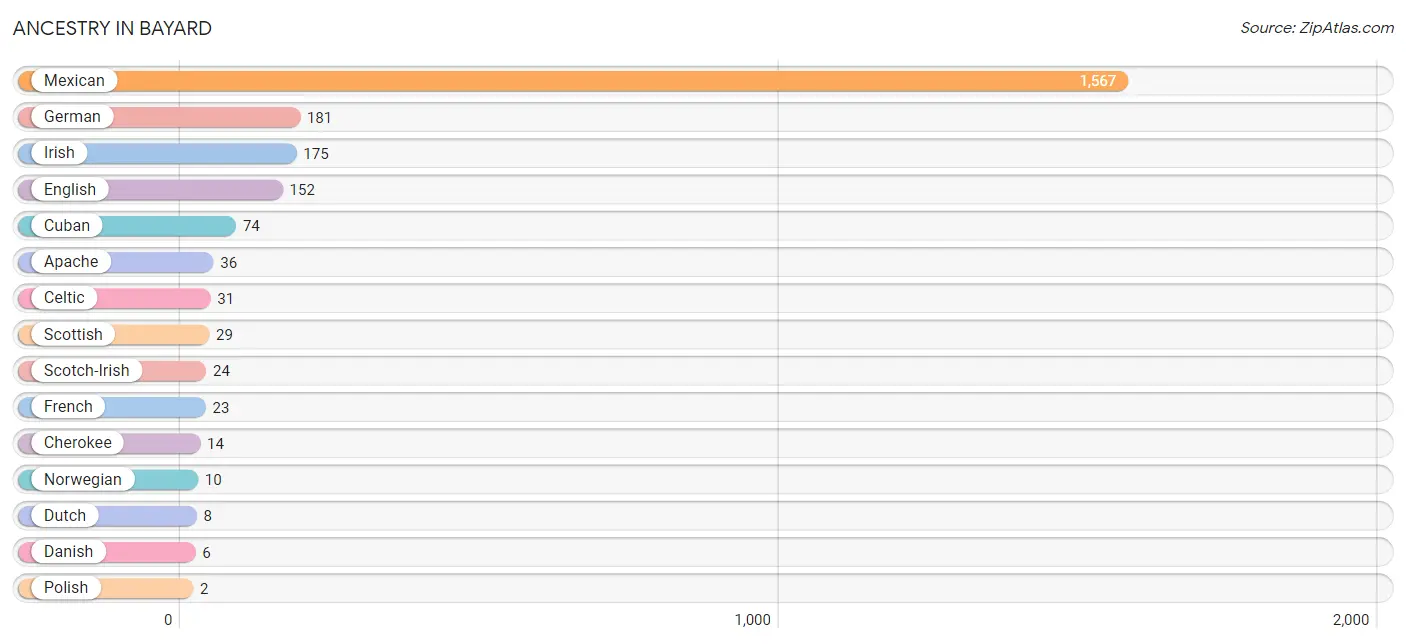
| Ancestry | # Population | % Population |
| Apache | 36 | 1.7% |
| Celtic | 31 | 1.4% |
| Cherokee | 14 | 0.6% |
| Cuban | 74 | 3.4% |
| Danish | 6 | 0.3% |
| Dutch | 8 | 0.4% |
| English | 152 | 7.1% |
| French | 23 | 1.1% |
| German | 181 | 8.4% |
| Irish | 175 | 8.1% |
| Mexican | 1,567 | 72.8% |
| Norwegian | 10 | 0.5% |
| Polish | 2 | 0.1% |
| Scotch-Irish | 24 | 1.1% |
| Scottish | 29 | 1.3% | View All 15 Rows |
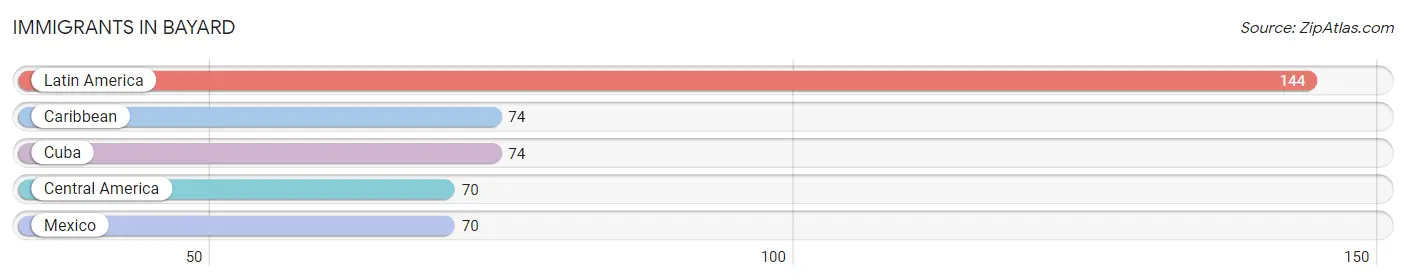
Immigrants in Bayard
The most numerous immigrant groups reported in Bayard came from Latin America (144 | 6.7%), Caribbean (74 | 3.4%), Cuba (74 | 3.4%), Central America (70 | 3.3%), and Mexico (70 | 3.3%), together accounting for 20.1% of all Bayard residents.
| Immigration Origin | # Population | % Population |
| Caribbean | 74 | 3.4% |
| Central America | 70 | 3.3% |
| Cuba | 74 | 3.4% |
| Latin America | 144 | 6.7% |
| Mexico | 70 | 3.3% | View All 5 Rows |
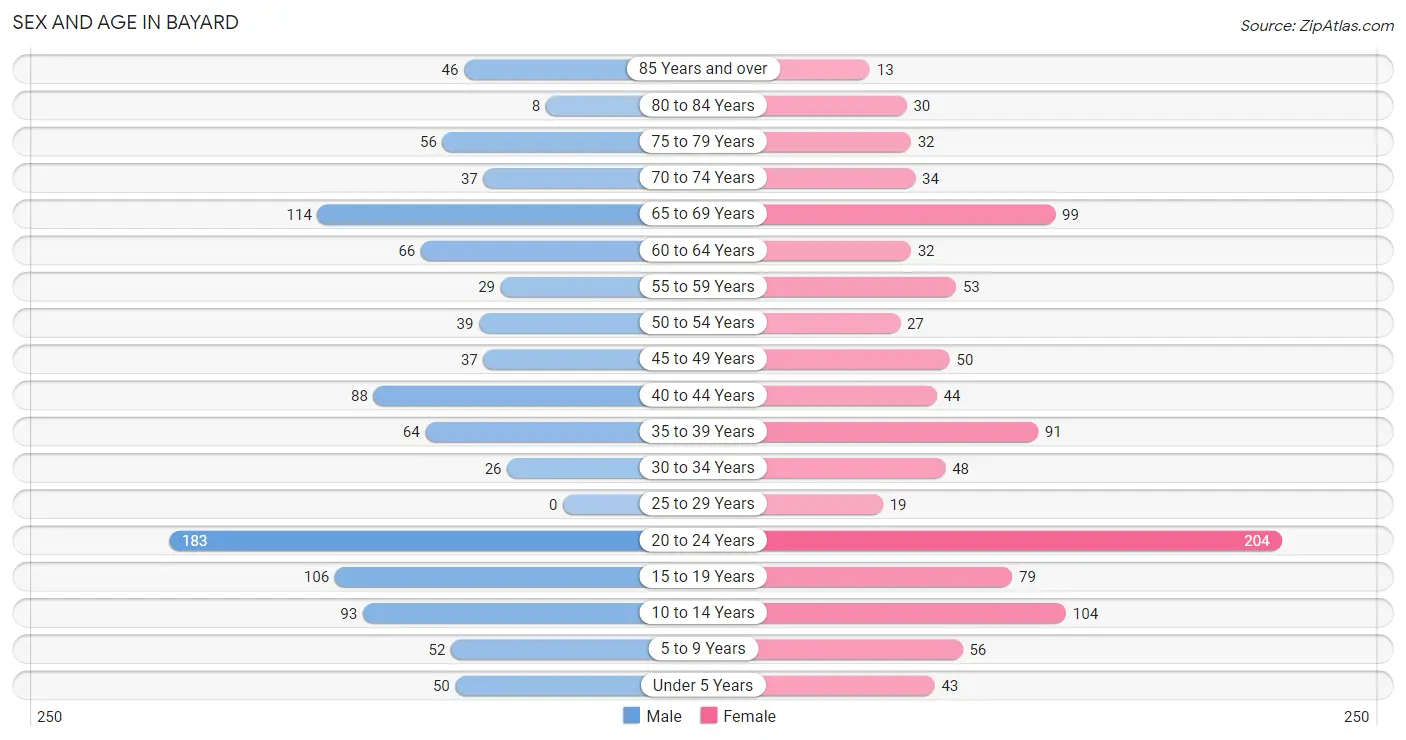
Sex and Age in Bayard
Sex and Age in Bayard
The most populous age groups in Bayard are 20 to 24 Years (183 | 16.7%) for men and 20 to 24 Years (204 | 19.3%) for women.
| Age Bracket | Male | Female |
| Under 5 Years | 50 (4.6%) | 43 (4.1%) |
| 5 to 9 Years | 52 (4.8%) | 56 (5.3%) |
| 10 to 14 Years | 93 (8.5%) | 104 (9.8%) |
| 15 to 19 Years | 106 (9.7%) | 79 (7.5%) |
| 20 to 24 Years | 183 (16.7%) | 204 (19.3%) |
| 25 to 29 Years | 0 (0.0%) | 19 (1.8%) |
| 30 to 34 Years | 26 (2.4%) | 48 (4.5%) |
| 35 to 39 Years | 64 (5.9%) | 91 (8.6%) |
| 40 to 44 Years | 88 (8.0%) | 44 (4.2%) |
| 45 to 49 Years | 37 (3.4%) | 50 (4.7%) |
| 50 to 54 Years | 39 (3.6%) | 27 (2.5%) |
| 55 to 59 Years | 29 (2.6%) | 53 (5.0%) |
| 60 to 64 Years | 66 (6.0%) | 32 (3.0%) |
| 65 to 69 Years | 114 (10.4%) | 99 (9.4%) |
| 70 to 74 Years | 37 (3.4%) | 34 (3.2%) |
| 75 to 79 Years | 56 (5.1%) | 32 (3.0%) |
| 80 to 84 Years | 8 (0.7%) | 30 (2.8%) |
| 85 Years and over | 46 (4.2%) | 13 (1.2%) |
| Total | 1,094 (100.0%) | 1,058 (100.0%) |
Families and Households in Bayard
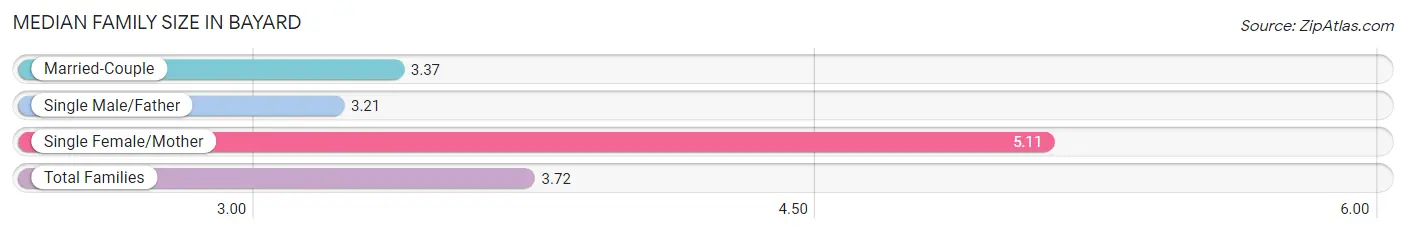
Median Family Size in Bayard
The median family size in Bayard is 3.72 persons per family, with single female/mother families (82 | 20.8%) accounting for the largest median family size of 5.11 persons per family. On the other hand, single male/father families (28 | 7.1%) represent the smallest median family size with 3.21 persons per family.
| Family Type | # Families | Family Size |
| Married-Couple | 284 (72.1%) | 3.37 |
| Single Male/Father | 28 (7.1%) | 3.21 |
| Single Female/Mother | 82 (20.8%) | 5.11 |
| Total Families | 394 (100.0%) | 3.72 |
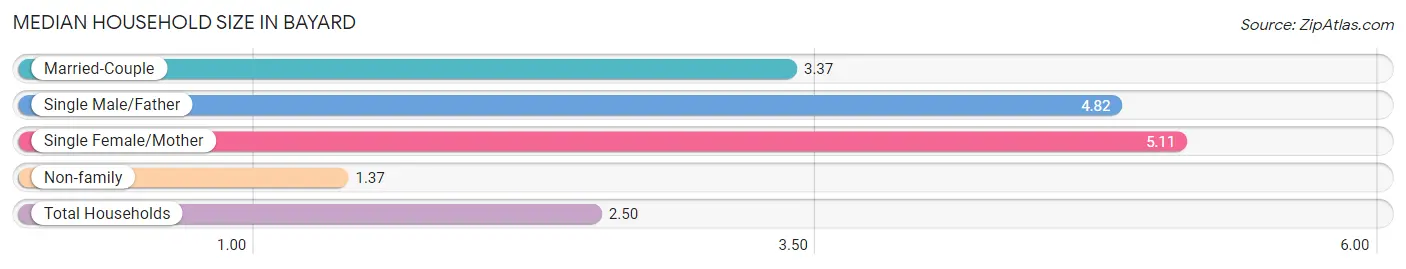
Median Household Size in Bayard
The median household size in Bayard is 2.50 persons per household, with single female/mother households (82 | 9.5%) accounting for the largest median household size of 5.11 persons per household. non-family households (467 | 54.2%) represent the smallest median household size with 1.37 persons per household.
| Household Type | # Households | Household Size |
| Married-Couple | 284 (33.0%) | 3.37 |
| Single Male/Father | 28 (3.3%) | 4.82 |
| Single Female/Mother | 82 (9.5%) | 5.11 |
| Non-family | 467 (54.2%) | 1.37 |
| Total Households | 861 (100.0%) | 2.50 |
Household Size by Marriage Status in Bayard
Out of a total of 861 households in Bayard, 394 (45.8%) are family households, while 467 (54.2%) are nonfamily households. The most numerous type of family households are 2-person households, comprising 209, and the most common type of nonfamily households are 1-person households, comprising 366.
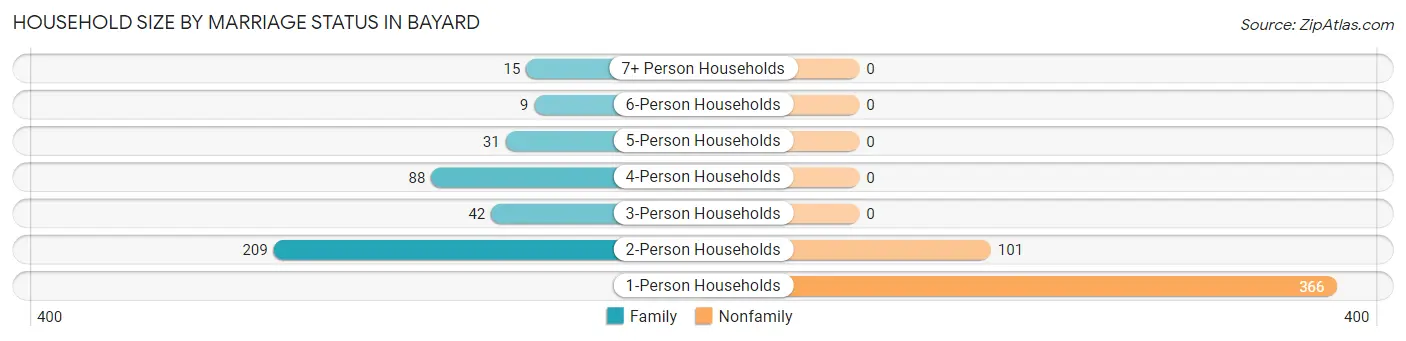
| Household Size | Family Households | Nonfamily Households |
| 1-Person Households | - | 366 (42.5%) |
| 2-Person Households | 209 (24.3%) | 101 (11.7%) |
| 3-Person Households | 42 (4.9%) | 0 (0.0%) |
| 4-Person Households | 88 (10.2%) | 0 (0.0%) |
| 5-Person Households | 31 (3.6%) | 0 (0.0%) |
| 6-Person Households | 9 (1.1%) | 0 (0.0%) |
| 7+ Person Households | 15 (1.7%) | 0 (0.0%) |
| Total | 394 (45.8%) | 467 (54.2%) |
Female Fertility in Bayard
Fertility by Age in Bayard
| Age Bracket | Women with Births | Births / 1,000 Women |
| 15 to 19 years | 0 (0.0%) | 0.0 |
| 20 to 34 years | 0 (0.0%) | 0.0 |
| 35 to 50 years | 0 (0.0%) | 0.0 |
| Total | 0 (0.0%) | 0.0 |
Fertility by Age by Marriage Status in Bayard
| Age Bracket | Married | Unmarried |
| 15 to 19 years | 0 (0.0%) | 0 (0.0%) |
| 20 to 34 years | 0 (0.0%) | 0 (0.0%) |
| 35 to 50 years | 0 (0.0%) | 0 (0.0%) |
| Total | 0 (0.0%) | 0 (0.0%) |
Fertility by Education in Bayard
| Educational Attainment | Women with Births | Births / 1,000 Women |
| Less than High School | 0 (0.0%) | 0.0 |
| High School Diploma | 0 (0.0%) | 0.0 |
| College or Associate's Degree | 0 (0.0%) | 0.0 |
| Bachelor's Degree | 0 (0.0%) | 0.0 |
| Graduate Degree | 0 (0.0%) | 0.0 |
| Total | 0 (0.0%) | 0.0 |
Fertility by Education by Marriage Status in Bayard
| Educational Attainment | Married | Unmarried |
| Less than High School | 0 (0.0%) | 0 (0.0%) |
| High School Diploma | 0 (0.0%) | 0 (0.0%) |
| College or Associate's Degree | 0 (0.0%) | 0 (0.0%) |
| Bachelor's Degree | 0 (0.0%) | 0 (0.0%) |
| Graduate Degree | 0 (0.0%) | 0 (0.0%) |
| Total | 0 (0.0%) | 0 (0.0%) |
Employment Characteristics in Bayard
Employment by Class of Employer in Bayard
Among the 556 employed individuals in Bayard, private company employees (351 | 63.1%), not-for-profit organizations (101 | 18.2%), and local government employees (95 | 17.1%) make up the most common classes of employment.
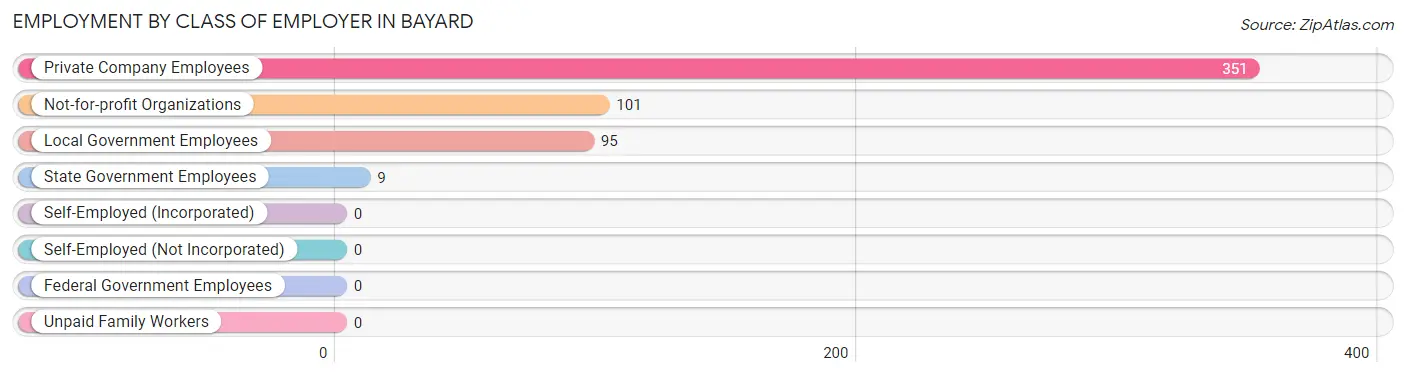
| Employer Class | # Employees | % Employees |
| Private Company Employees | 351 | 63.1% |
| Self-Employed (Incorporated) | 0 | 0.0% |
| Self-Employed (Not Incorporated) | 0 | 0.0% |
| Not-for-profit Organizations | 101 | 18.2% |
| Local Government Employees | 95 | 17.1% |
| State Government Employees | 9 | 1.6% |
| Federal Government Employees | 0 | 0.0% |
| Unpaid Family Workers | 0 | 0.0% |
| Total | 556 | 100.0% |
Employment Status by Age in Bayard
According to the labor force statistics for Bayard, out of the total population over 16 years of age (1,672), 36.0% or 602 individuals are in the labor force, with 7.6% or 46 of them unemployed. The age group with the highest labor force participation rate is 25 to 29 years, with 100.0% or 19 individuals in the labor force. Within the labor force, the 25 to 29 years age range has the highest percentage of unemployed individuals, with 100.0% or 19 of them being unemployed.
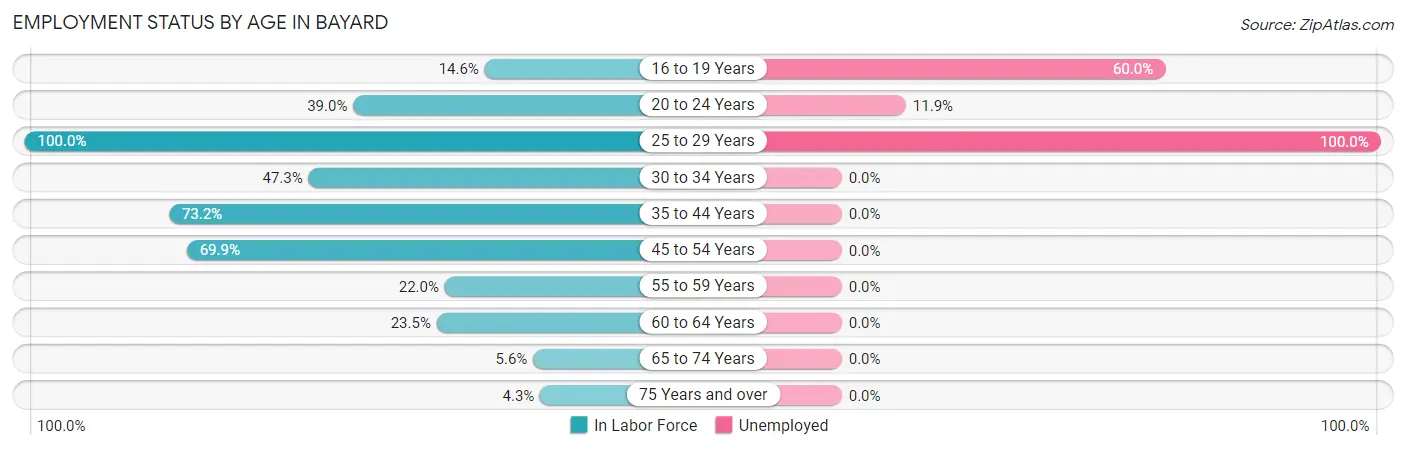
| Age Bracket | In Labor Force | Unemployed |
| 16 to 19 Years | 15 (14.6%) | 9 (60.0%) |
| 20 to 24 Years | 151 (39.0%) | 18 (11.9%) |
| 25 to 29 Years | 19 (100.0%) | 19 (100.0%) |
| 30 to 34 Years | 35 (47.3%) | 0 (0.0%) |
| 35 to 44 Years | 210 (73.2%) | 0 (0.0%) |
| 45 to 54 Years | 107 (69.9%) | 0 (0.0%) |
| 55 to 59 Years | 18 (22.0%) | 0 (0.0%) |
| 60 to 64 Years | 23 (23.5%) | 0 (0.0%) |
| 65 to 74 Years | 16 (5.6%) | 0 (0.0%) |
| 75 Years and over | 8 (4.3%) | 0 (0.0%) |
| Total | 602 (36.0%) | 46 (7.6%) |
Employment Status by Educational Attainment in Bayard
According to labor force statistics for Bayard, 57.8% of individuals (412) out of the total population between 25 and 64 years of age (713) are in the labor force, with 4.6% or 19 of them being unemployed. The group with the highest labor force participation rate are those with the educational attainment of college / associate degree, with 73.3% or 181 individuals in the labor force. Within the labor force, individuals with high school diploma education have the highest percentage of unemployment, with 11.4% or 19 of them being unemployed.
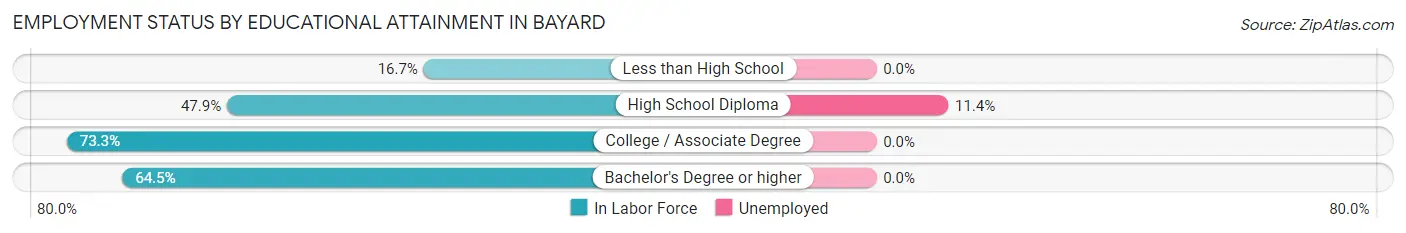
| Educational Attainment | In Labor Force | Unemployed |
| Less than High School | 4 (16.7%) | 0 (0.0%) |
| High School Diploma | 167 (47.9%) | 40 (11.4%) |
| College / Associate Degree | 181 (73.3%) | 0 (0.0%) |
| Bachelor's Degree or higher | 60 (64.5%) | 0 (0.0%) |
| Total | 412 (57.8%) | 33 (4.6%) |
Employment Occupations by Sex in Bayard
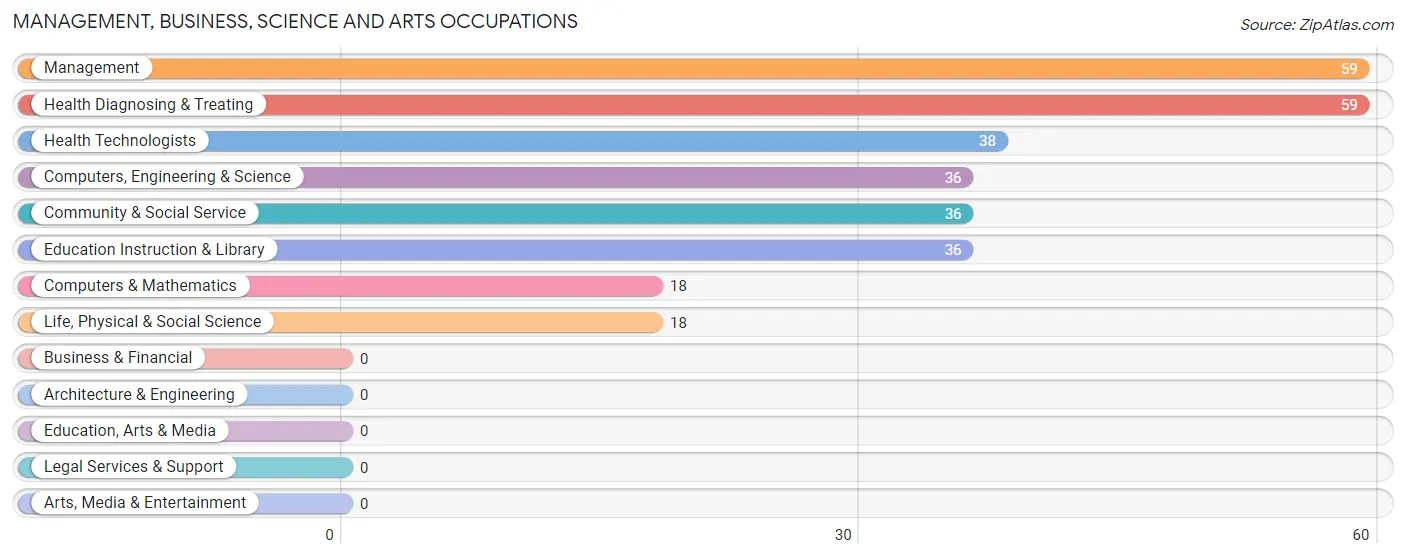
Management, Business, Science and Arts Occupations
The most common Management, Business, Science and Arts occupations in Bayard are Management (59 | 10.6%), Health Diagnosing & Treating (59 | 10.6%), Health Technologists (38 | 6.8%), Computers, Engineering & Science (36 | 6.5%), and Community & Social Service (36 | 6.5%).
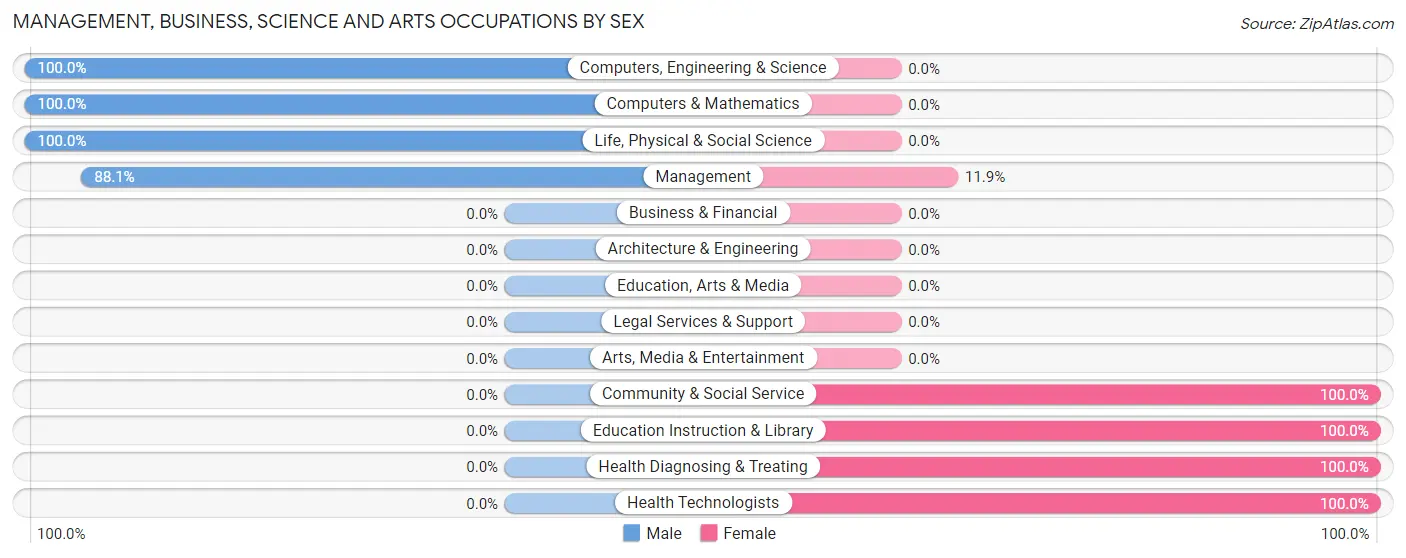
Management, Business, Science and Arts Occupations by Sex
Within the Management, Business, Science and Arts occupations in Bayard, the most male-oriented occupations are Computers, Engineering & Science (100.0%), Computers & Mathematics (100.0%), and Life, Physical & Social Science (100.0%), while the most female-oriented occupations are Community & Social Service (100.0%), Education Instruction & Library (100.0%), and Health Diagnosing & Treating (100.0%).
| Occupation | Male | Female |
| Management | 52 (88.1%) | 7 (11.9%) |
| Business & Financial | 0 (0.0%) | 0 (0.0%) |
| Computers, Engineering & Science | 36 (100.0%) | 0 (0.0%) |
| Computers & Mathematics | 18 (100.0%) | 0 (0.0%) |
| Architecture & Engineering | 0 (0.0%) | 0 (0.0%) |
| Life, Physical & Social Science | 18 (100.0%) | 0 (0.0%) |
| Community & Social Service | 0 (0.0%) | 36 (100.0%) |
| Education, Arts & Media | 0 (0.0%) | 0 (0.0%) |
| Legal Services & Support | 0 (0.0%) | 0 (0.0%) |
| Education Instruction & Library | 0 (0.0%) | 36 (100.0%) |
| Arts, Media & Entertainment | 0 (0.0%) | 0 (0.0%) |
| Health Diagnosing & Treating | 0 (0.0%) | 59 (100.0%) |
| Health Technologists | 0 (0.0%) | 38 (100.0%) |
| Total (Category) | 88 (46.3%) | 102 (53.7%) |
| Total (Overall) | 334 (60.1%) | 222 (39.9%) |
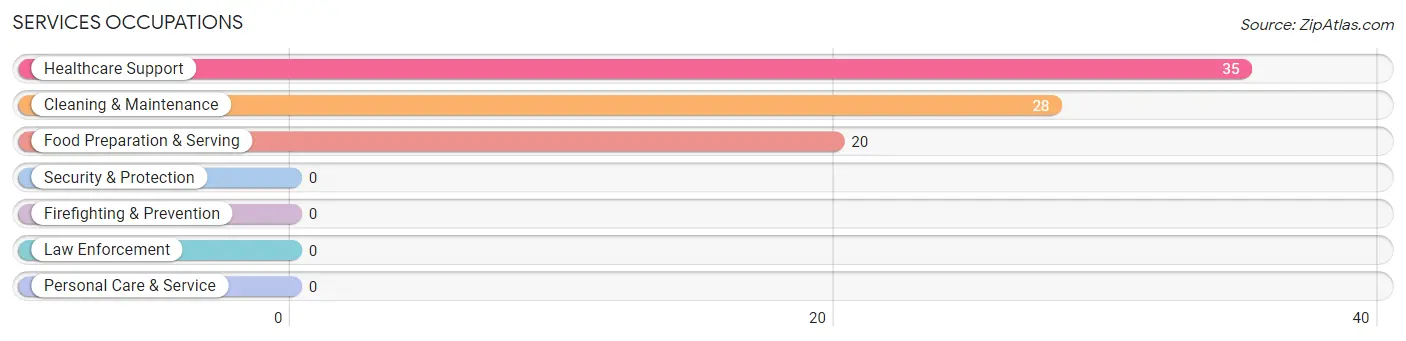
Services Occupations
The most common Services occupations in Bayard are Healthcare Support (35 | 6.3%), Cleaning & Maintenance (28 | 5.0%), and Food Preparation & Serving (20 | 3.6%).
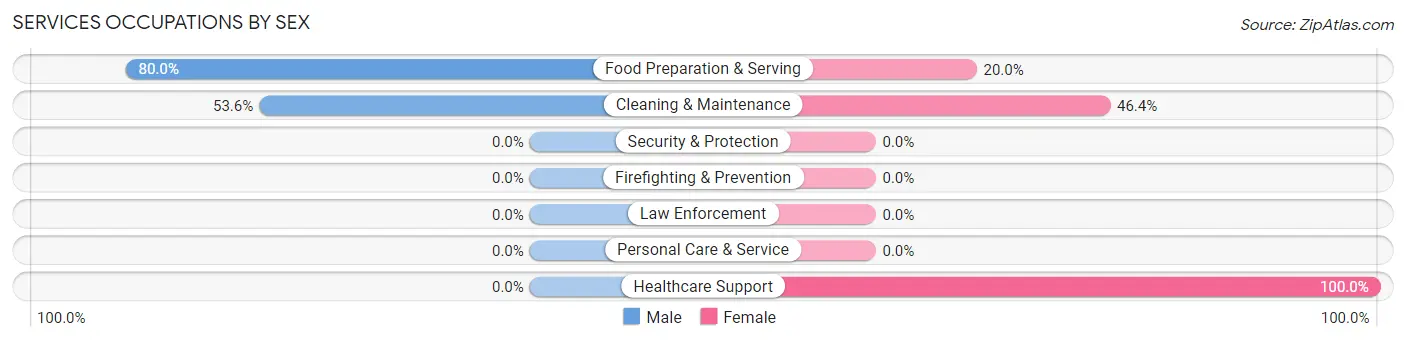
Services Occupations by Sex
Within the Services occupations in Bayard, the most male-oriented occupations are Food Preparation & Serving (80.0%), and Cleaning & Maintenance (53.6%), while the most female-oriented occupations are Healthcare Support (100.0%), Cleaning & Maintenance (46.4%), and Food Preparation & Serving (20.0%).
| Occupation | Male | Female |
| Healthcare Support | 0 (0.0%) | 35 (100.0%) |
| Security & Protection | 0 (0.0%) | 0 (0.0%) |
| Firefighting & Prevention | 0 (0.0%) | 0 (0.0%) |
| Law Enforcement | 0 (0.0%) | 0 (0.0%) |
| Food Preparation & Serving | 16 (80.0%) | 4 (20.0%) |
| Cleaning & Maintenance | 15 (53.6%) | 13 (46.4%) |
| Personal Care & Service | 0 (0.0%) | 0 (0.0%) |
| Total (Category) | 31 (37.3%) | 52 (62.6%) |
| Total (Overall) | 334 (60.1%) | 222 (39.9%) |
Sales and Office Occupations
The most common Sales and Office occupations in Bayard are Sales & Related (55 | 9.9%), and Office & Administration (50 | 9.0%).
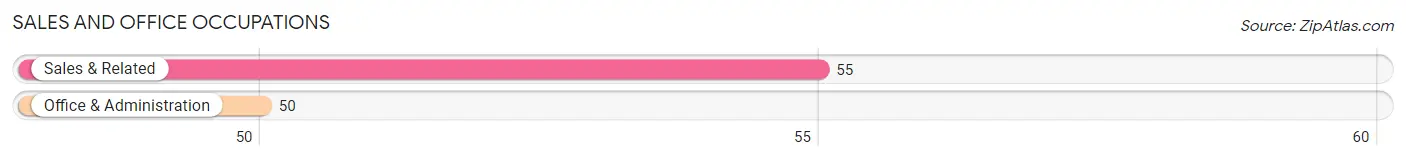
Sales and Office Occupations by Sex
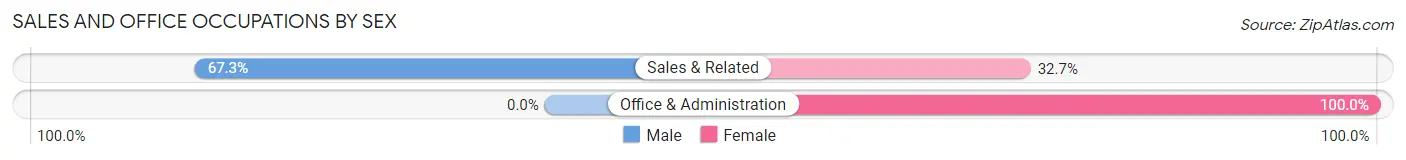
| Occupation | Male | Female |
| Sales & Related | 37 (67.3%) | 18 (32.7%) |
| Office & Administration | 0 (0.0%) | 50 (100.0%) |
| Total (Category) | 37 (35.2%) | 68 (64.8%) |
| Total (Overall) | 334 (60.1%) | 222 (39.9%) |
Natural Resources, Construction and Maintenance Occupations
The most common Natural Resources, Construction and Maintenance occupations in Bayard are Construction & Extraction (113 | 20.3%), and Farming, Fishing & Forestry (13 | 2.3%).
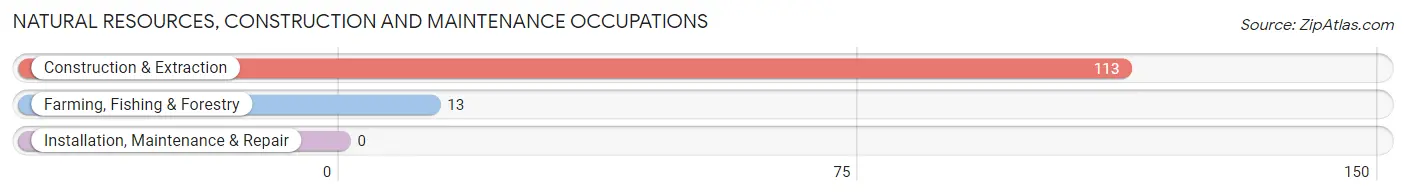
Natural Resources, Construction and Maintenance Occupations by Sex
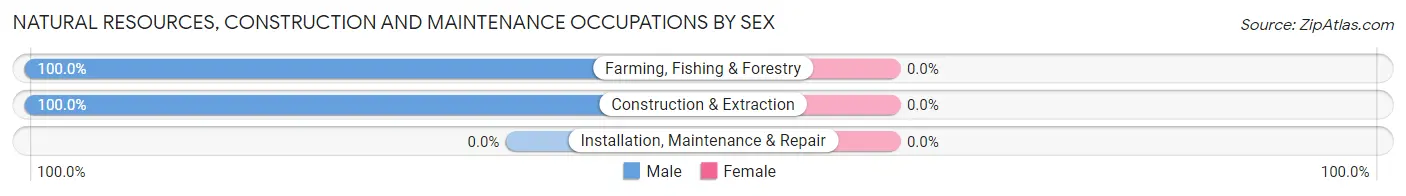
| Occupation | Male | Female |
| Farming, Fishing & Forestry | 13 (100.0%) | 0 (0.0%) |
| Construction & Extraction | 113 (100.0%) | 0 (0.0%) |
| Installation, Maintenance & Repair | 0 (0.0%) | 0 (0.0%) |
| Total (Category) | 126 (100.0%) | 0 (0.0%) |
| Total (Overall) | 334 (60.1%) | 222 (39.9%) |
Production, Transportation and Moving Occupations
The most common Production, Transportation and Moving occupations in Bayard are Material Moving (35 | 6.3%), Production (12 | 2.2%), and Transportation (5 | 0.9%).
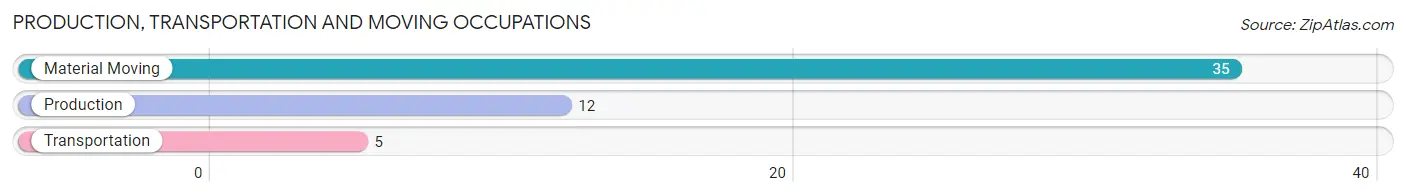
Production, Transportation and Moving Occupations by Sex
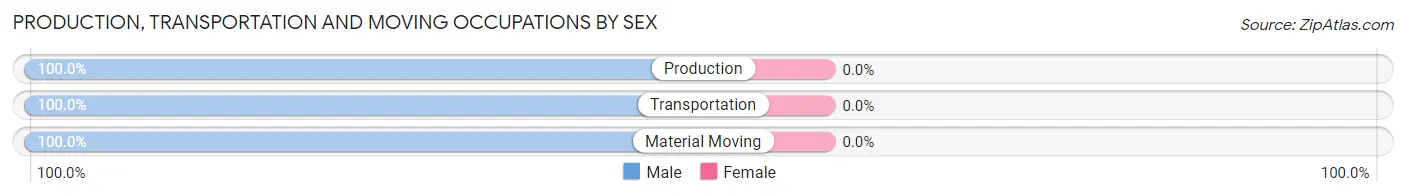
| Occupation | Male | Female |
| Production | 12 (100.0%) | 0 (0.0%) |
| Transportation | 5 (100.0%) | 0 (0.0%) |
| Material Moving | 35 (100.0%) | 0 (0.0%) |
| Total (Category) | 52 (100.0%) | 0 (0.0%) |
| Total (Overall) | 334 (60.1%) | 222 (39.9%) |
Employment Industries by Sex in Bayard
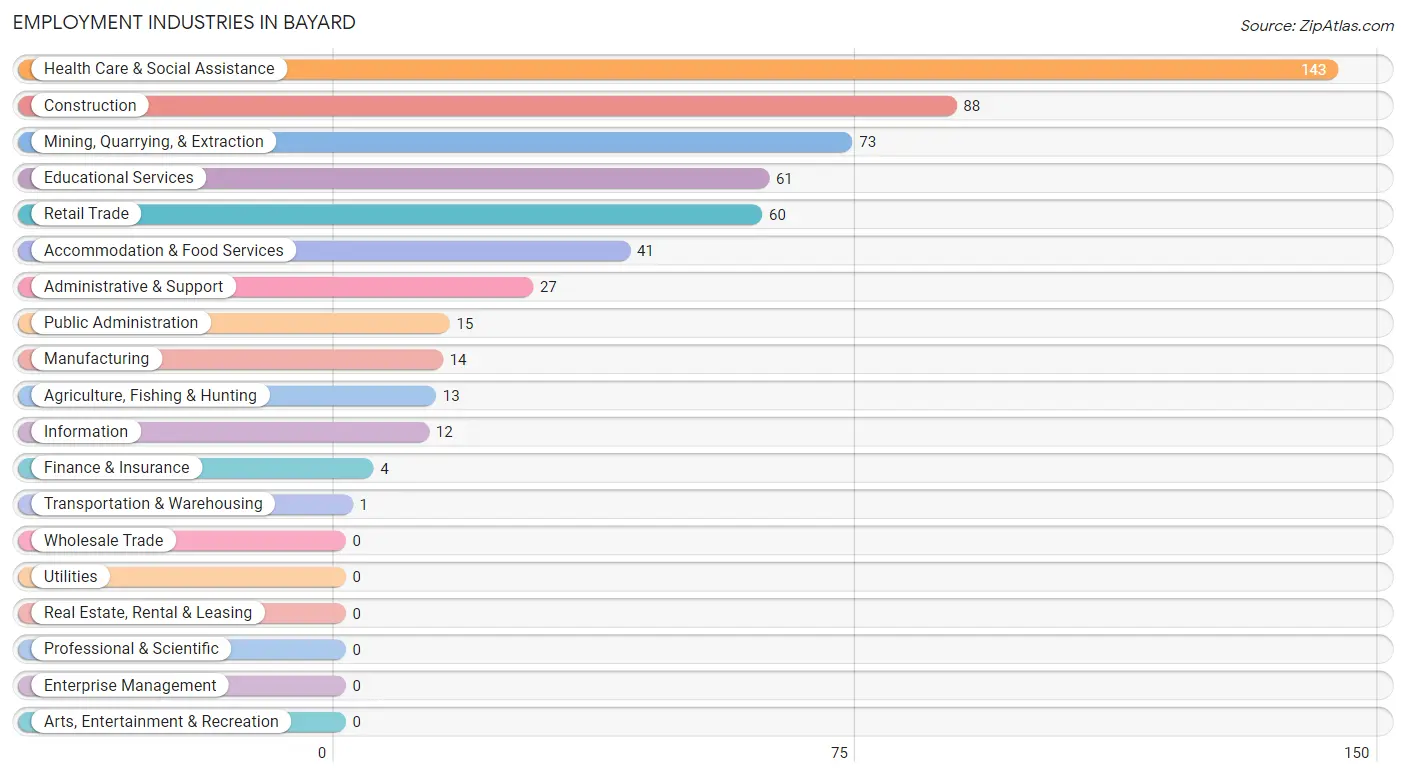
Employment Industries in Bayard
The major employment industries in Bayard include Health Care & Social Assistance (143 | 25.7%), Construction (88 | 15.8%), Mining, Quarrying, & Extraction (73 | 13.1%), Educational Services (61 | 11.0%), and Retail Trade (60 | 10.8%).
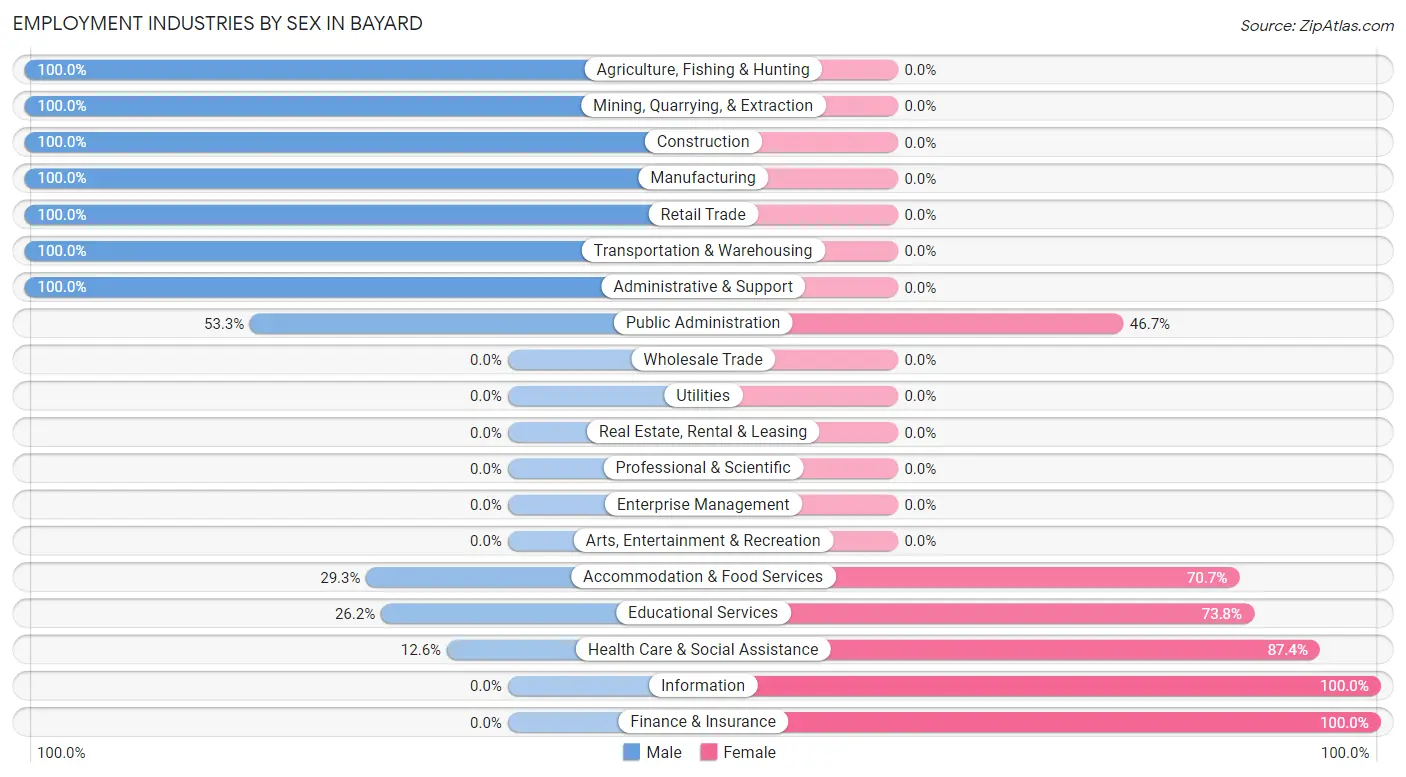
Employment Industries by Sex in Bayard
The Bayard industries that see more men than women are Agriculture, Fishing & Hunting (100.0%), Mining, Quarrying, & Extraction (100.0%), and Construction (100.0%), whereas the industries that tend to have a higher number of women are Information (100.0%), Finance & Insurance (100.0%), and Health Care & Social Assistance (87.4%).
| Industry | Male | Female |
| Agriculture, Fishing & Hunting | 13 (100.0%) | 0 (0.0%) |
| Mining, Quarrying, & Extraction | 73 (100.0%) | 0 (0.0%) |
| Construction | 88 (100.0%) | 0 (0.0%) |
| Manufacturing | 14 (100.0%) | 0 (0.0%) |
| Wholesale Trade | 0 (0.0%) | 0 (0.0%) |
| Retail Trade | 60 (100.0%) | 0 (0.0%) |
| Transportation & Warehousing | 1 (100.0%) | 0 (0.0%) |
| Utilities | 0 (0.0%) | 0 (0.0%) |
| Information | 0 (0.0%) | 12 (100.0%) |
| Finance & Insurance | 0 (0.0%) | 4 (100.0%) |
| Real Estate, Rental & Leasing | 0 (0.0%) | 0 (0.0%) |
| Professional & Scientific | 0 (0.0%) | 0 (0.0%) |
| Enterprise Management | 0 (0.0%) | 0 (0.0%) |
| Administrative & Support | 27 (100.0%) | 0 (0.0%) |
| Educational Services | 16 (26.2%) | 45 (73.8%) |
| Health Care & Social Assistance | 18 (12.6%) | 125 (87.4%) |
| Arts, Entertainment & Recreation | 0 (0.0%) | 0 (0.0%) |
| Accommodation & Food Services | 12 (29.3%) | 29 (70.7%) |
| Public Administration | 8 (53.3%) | 7 (46.7%) |
| Total | 334 (60.1%) | 222 (39.9%) |
Education in Bayard
School Enrollment in Bayard
The most common levels of schooling among the 462 students in Bayard are high school (175 | 37.9%), middle school (144 | 31.2%), and elementary school (66 | 14.3%).
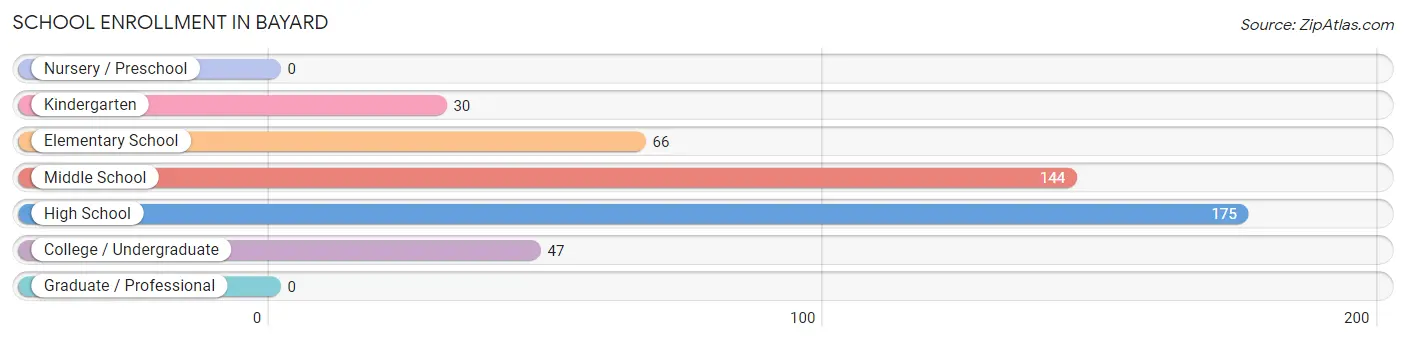
| School Level | # Students | % Students |
| Nursery / Preschool | 0 | 0.0% |
| Kindergarten | 30 | 6.5% |
| Elementary School | 66 | 14.3% |
| Middle School | 144 | 31.2% |
| High School | 175 | 37.9% |
| College / Undergraduate | 47 | 10.2% |
| Graduate / Professional | 0 | 0.0% |
| Total | 462 | 100.0% |
School Enrollment by Age by Funding Source in Bayard
Out of a total of 462 students who are enrolled in schools in Bayard, 13 (2.8%) attend a private institution, while the remaining 449 (97.2%) are enrolled in public schools. The age group of 18 to 19 year olds has the highest likelihood of being enrolled in private schools, with 4 (25.0% in the age bracket) enrolled. Conversely, the age group of 5 to 9 year old has the lowest likelihood of being enrolled in a private school, with 84 (100.0% in the age bracket) attending a public institution.
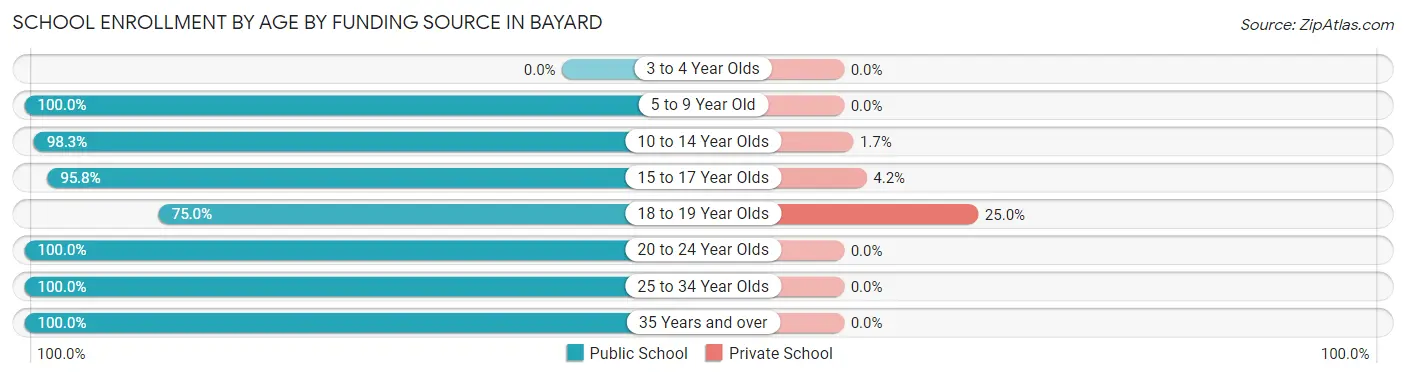
| Age Bracket | Public School | Private School |
| 3 to 4 Year Olds | 0 (0.0%) | 0 (0.0%) |
| 5 to 9 Year Old | 84 (100.0%) | 0 (0.0%) |
| 10 to 14 Year Olds | 170 (98.3%) | 3 (1.7%) |
| 15 to 17 Year Olds | 136 (95.8%) | 6 (4.2%) |
| 18 to 19 Year Olds | 12 (75.0%) | 4 (25.0%) |
| 20 to 24 Year Olds | 18 (100.0%) | 0 (0.0%) |
| 25 to 34 Year Olds | 4 (100.0%) | 0 (0.0%) |
| 35 Years and over | 25 (100.0%) | 0 (0.0%) |
| Total | 449 (97.2%) | 13 (2.8%) |
Educational Attainment by Field of Study in Bayard
Education (86 | 43.6%), psychology (33 | 16.8%), arts & humanities (22 | 11.2%), social sciences (19 | 9.6%), and business (15 | 7.6%) are the most common fields of study among 197 individuals in Bayard who have obtained a bachelor's degree or higher.
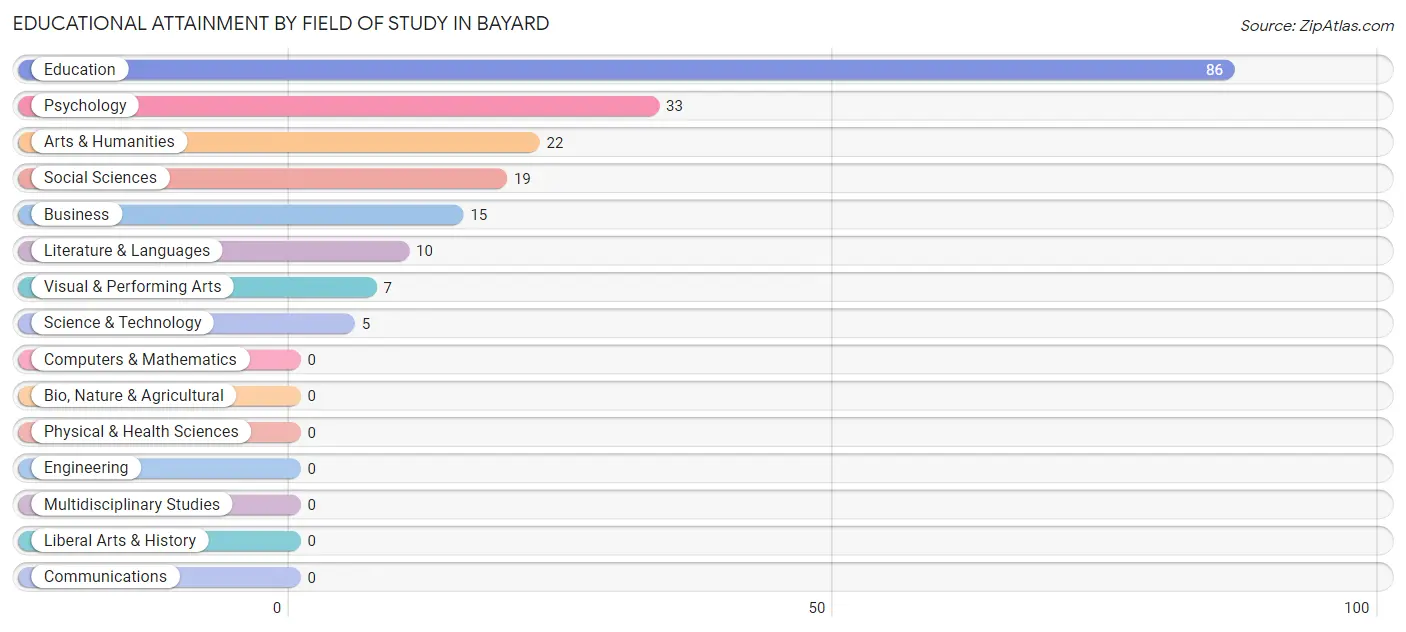
| Field of Study | # Graduates | % Graduates |
| Computers & Mathematics | 0 | 0.0% |
| Bio, Nature & Agricultural | 0 | 0.0% |
| Physical & Health Sciences | 0 | 0.0% |
| Psychology | 33 | 16.8% |
| Social Sciences | 19 | 9.6% |
| Engineering | 0 | 0.0% |
| Multidisciplinary Studies | 0 | 0.0% |
| Science & Technology | 5 | 2.5% |
| Business | 15 | 7.6% |
| Education | 86 | 43.6% |
| Literature & Languages | 10 | 5.1% |
| Liberal Arts & History | 0 | 0.0% |
| Visual & Performing Arts | 7 | 3.5% |
| Communications | 0 | 0.0% |
| Arts & Humanities | 22 | 11.2% |
| Total | 197 | 100.0% |
Transportation & Commute in Bayard
Vehicle Availability by Sex in Bayard
The most prevalent vehicle ownership categories in Bayard are males with 2 vehicles (132, accounting for 39.5%) and females with 2 vehicles (95, making up 59.5%).
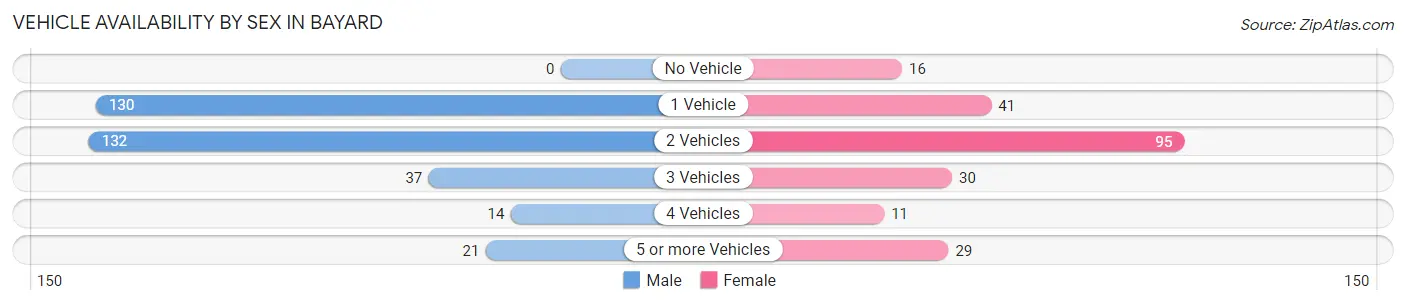
| Vehicles Available | Male | Female |
| No Vehicle | 0 (0.0%) | 16 (7.2%) |
| 1 Vehicle | 130 (38.9%) | 41 (18.5%) |
| 2 Vehicles | 132 (39.5%) | 95 (42.8%) |
| 3 Vehicles | 37 (11.1%) | 30 (13.5%) |
| 4 Vehicles | 14 (4.2%) | 11 (5.0%) |
| 5 or more Vehicles | 21 (6.3%) | 29 (13.1%) |
| Total | 334 (100.0%) | 222 (100.0%) |
Commute Time in Bayard
The most frequently occuring commute durations in Bayard are 15 to 19 minutes (161 commuters, 29.4%), 5 to 9 minutes (89 commuters, 16.2%), and 25 to 29 minutes (88 commuters, 16.1%).
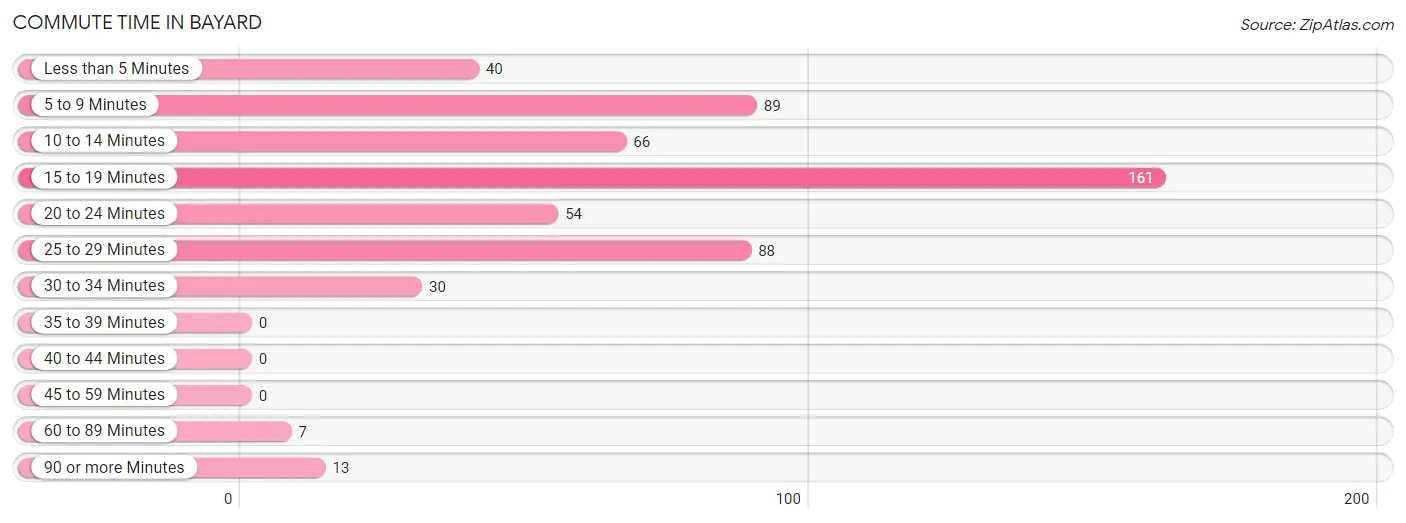
| Commute Time | # Commuters | % Commuters |
| Less than 5 Minutes | 40 | 7.3% |
| 5 to 9 Minutes | 89 | 16.2% |
| 10 to 14 Minutes | 66 | 12.0% |
| 15 to 19 Minutes | 161 | 29.4% |
| 20 to 24 Minutes | 54 | 9.9% |
| 25 to 29 Minutes | 88 | 16.1% |
| 30 to 34 Minutes | 30 | 5.5% |
| 35 to 39 Minutes | 0 | 0.0% |
| 40 to 44 Minutes | 0 | 0.0% |
| 45 to 59 Minutes | 0 | 0.0% |
| 60 to 89 Minutes | 7 | 1.3% |
| 90 or more Minutes | 13 | 2.4% |
Commute Time by Sex in Bayard
The most common commute times in Bayard are 15 to 19 minutes (117 commuters, 35.0%) for males and 5 to 9 minutes (52 commuters, 24.3%) for females.
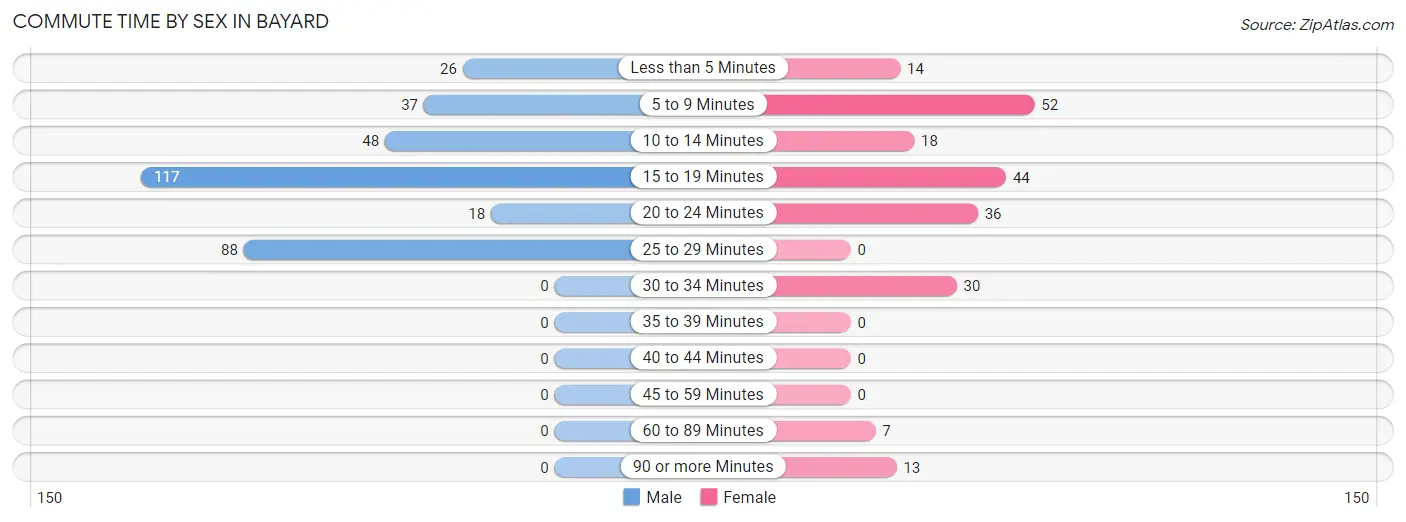
| Commute Time | Male | Female |
| Less than 5 Minutes | 26 (7.8%) | 14 (6.5%) |
| 5 to 9 Minutes | 37 (11.1%) | 52 (24.3%) |
| 10 to 14 Minutes | 48 (14.4%) | 18 (8.4%) |
| 15 to 19 Minutes | 117 (35.0%) | 44 (20.6%) |
| 20 to 24 Minutes | 18 (5.4%) | 36 (16.8%) |
| 25 to 29 Minutes | 88 (26.4%) | 0 (0.0%) |
| 30 to 34 Minutes | 0 (0.0%) | 30 (14.0%) |
| 35 to 39 Minutes | 0 (0.0%) | 0 (0.0%) |
| 40 to 44 Minutes | 0 (0.0%) | 0 (0.0%) |
| 45 to 59 Minutes | 0 (0.0%) | 0 (0.0%) |
| 60 to 89 Minutes | 0 (0.0%) | 7 (3.3%) |
| 90 or more Minutes | 0 (0.0%) | 13 (6.1%) |
Time of Departure to Work by Sex in Bayard
The most frequent times of departure to work in Bayard are 12:00 PM to 3:59 PM (100, 29.9%) for males and 7:00 AM to 7:29 AM (46, 21.5%) for females.
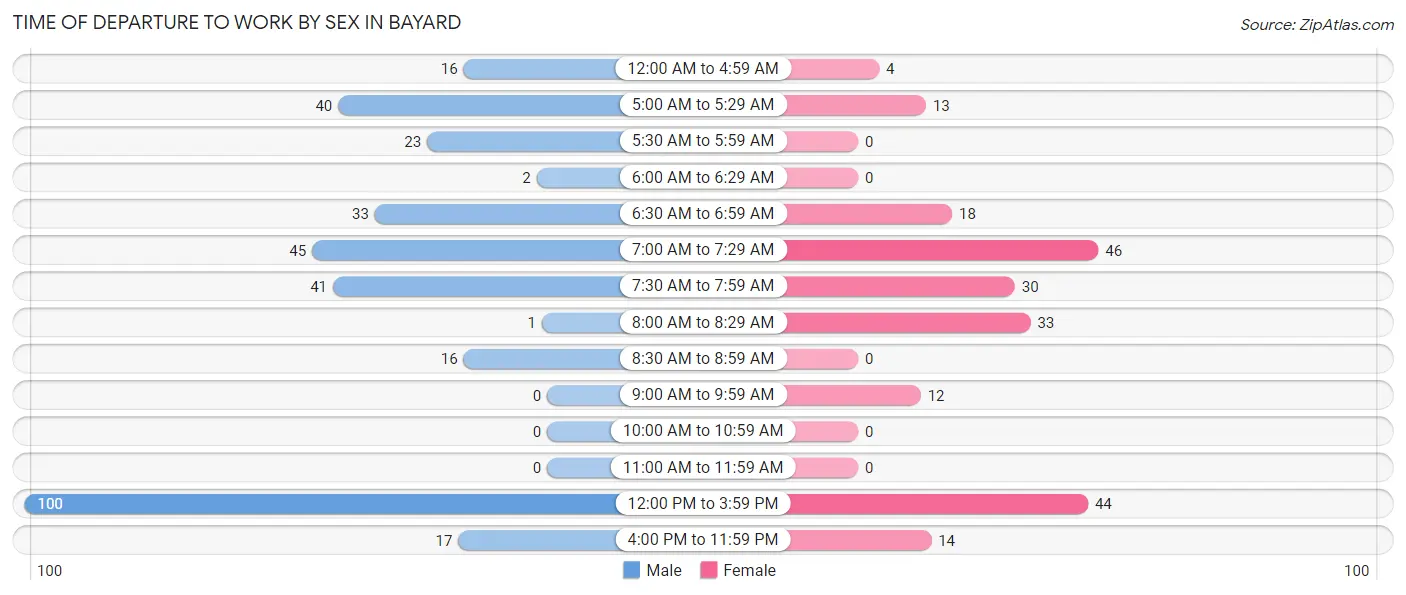
| Time of Departure | Male | Female |
| 12:00 AM to 4:59 AM | 16 (4.8%) | 4 (1.9%) |
| 5:00 AM to 5:29 AM | 40 (12.0%) | 13 (6.1%) |
| 5:30 AM to 5:59 AM | 23 (6.9%) | 0 (0.0%) |
| 6:00 AM to 6:29 AM | 2 (0.6%) | 0 (0.0%) |
| 6:30 AM to 6:59 AM | 33 (9.9%) | 18 (8.4%) |
| 7:00 AM to 7:29 AM | 45 (13.5%) | 46 (21.5%) |
| 7:30 AM to 7:59 AM | 41 (12.3%) | 30 (14.0%) |
| 8:00 AM to 8:29 AM | 1 (0.3%) | 33 (15.4%) |
| 8:30 AM to 8:59 AM | 16 (4.8%) | 0 (0.0%) |
| 9:00 AM to 9:59 AM | 0 (0.0%) | 12 (5.6%) |
| 10:00 AM to 10:59 AM | 0 (0.0%) | 0 (0.0%) |
| 11:00 AM to 11:59 AM | 0 (0.0%) | 0 (0.0%) |
| 12:00 PM to 3:59 PM | 100 (29.9%) | 44 (20.6%) |
| 4:00 PM to 11:59 PM | 17 (5.1%) | 14 (6.5%) |
| Total | 334 (100.0%) | 214 (100.0%) |
Housing Occupancy in Bayard
Occupancy by Ownership in Bayard
Of the total 861 dwellings in Bayard, owner-occupied units account for 545 (63.3%), while renter-occupied units make up 316 (36.7%).
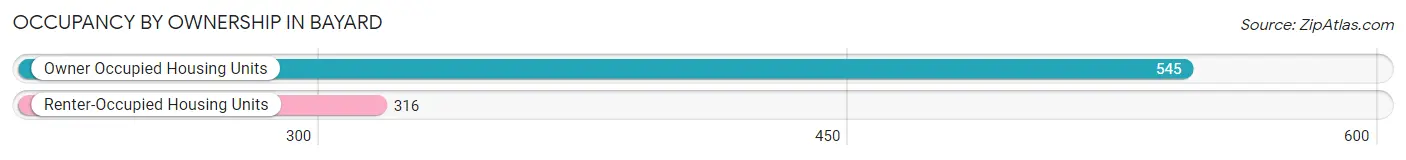
| Occupancy | # Housing Units | % Housing Units |
| Owner Occupied Housing Units | 545 | 63.3% |
| Renter-Occupied Housing Units | 316 | 36.7% |
| Total Occupied Housing Units | 861 | 100.0% |
Occupancy by Household Size in Bayard
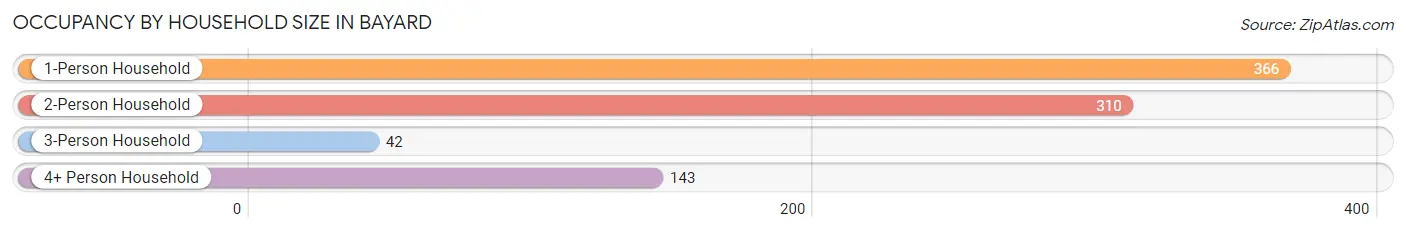
| Household Size | # Housing Units | % Housing Units |
| 1-Person Household | 366 | 42.5% |
| 2-Person Household | 310 | 36.0% |
| 3-Person Household | 42 | 4.9% |
| 4+ Person Household | 143 | 16.6% |
| Total Housing Units | 861 | 100.0% |
Occupancy by Ownership by Household Size in Bayard
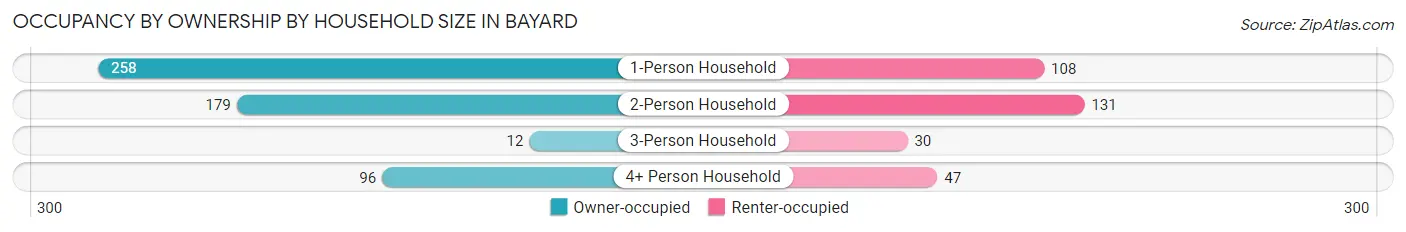
| Household Size | Owner-occupied | Renter-occupied |
| 1-Person Household | 258 (70.5%) | 108 (29.5%) |
| 2-Person Household | 179 (57.7%) | 131 (42.3%) |
| 3-Person Household | 12 (28.6%) | 30 (71.4%) |
| 4+ Person Household | 96 (67.1%) | 47 (32.9%) |
| Total Housing Units | 545 (63.3%) | 316 (36.7%) |
Occupancy by Educational Attainment in Bayard
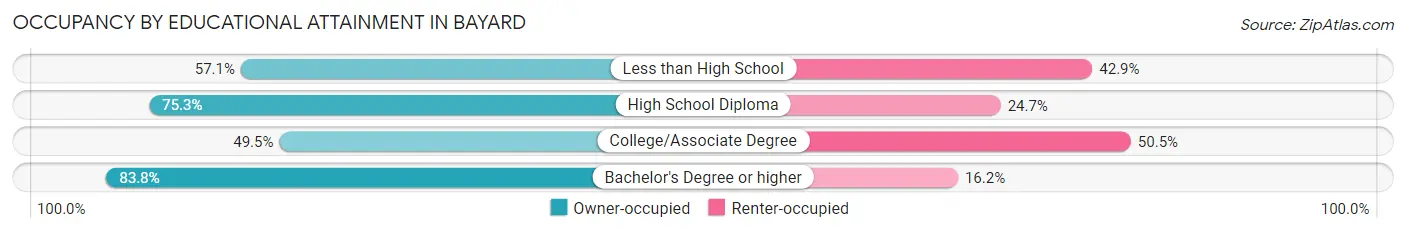
| Household Size | Owner-occupied | Renter-occupied |
| Less than High School | 40 (57.1%) | 30 (42.9%) |
| High School Diploma | 183 (75.3%) | 60 (24.7%) |
| College/Associate Degree | 198 (49.5%) | 202 (50.5%) |
| Bachelor's Degree or higher | 124 (83.8%) | 24 (16.2%) |
Occupancy by Age of Householder in Bayard
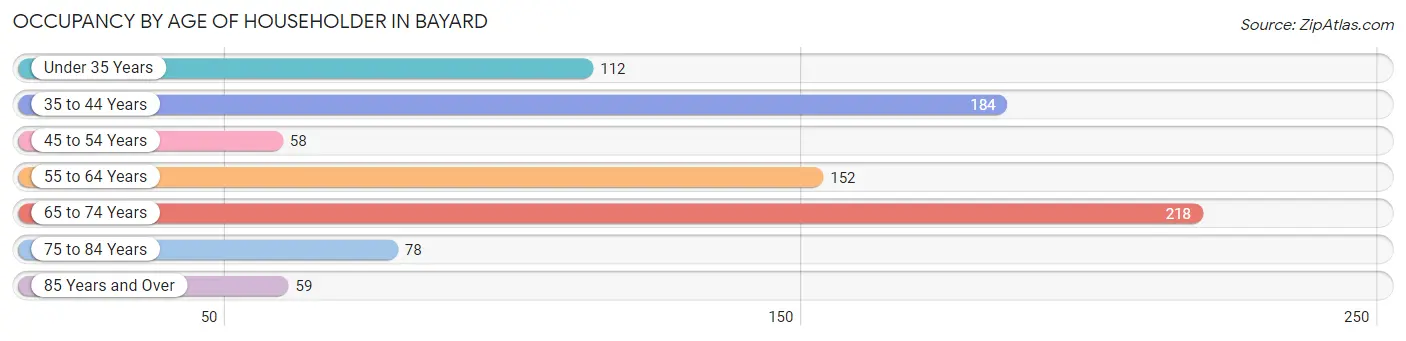
| Age Bracket | # Households | % Households |
| Under 35 Years | 112 | 13.0% |
| 35 to 44 Years | 184 | 21.4% |
| 45 to 54 Years | 58 | 6.7% |
| 55 to 64 Years | 152 | 17.6% |
| 65 to 74 Years | 218 | 25.3% |
| 75 to 84 Years | 78 | 9.1% |
| 85 Years and Over | 59 | 6.9% |
| Total | 861 | 100.0% |
Housing Finances in Bayard
Median Income by Occupancy in Bayard
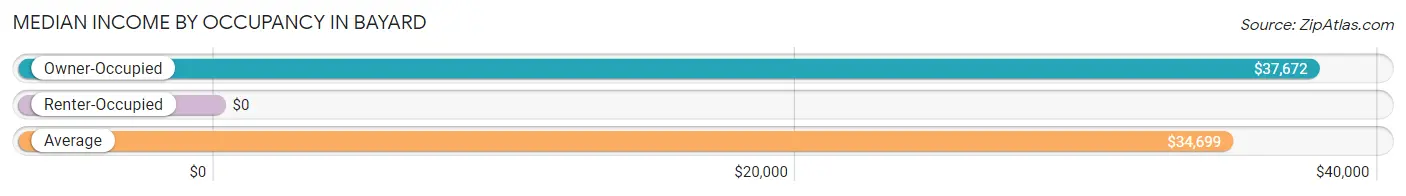
| Occupancy Type | # Households | Median Income |
| Owner-Occupied | 545 (63.3%) | $37,672 |
| Renter-Occupied | 316 (36.7%) | $0 |
| Average | 861 (100.0%) | $34,699 |
Occupancy by Householder Income Bracket in Bayard
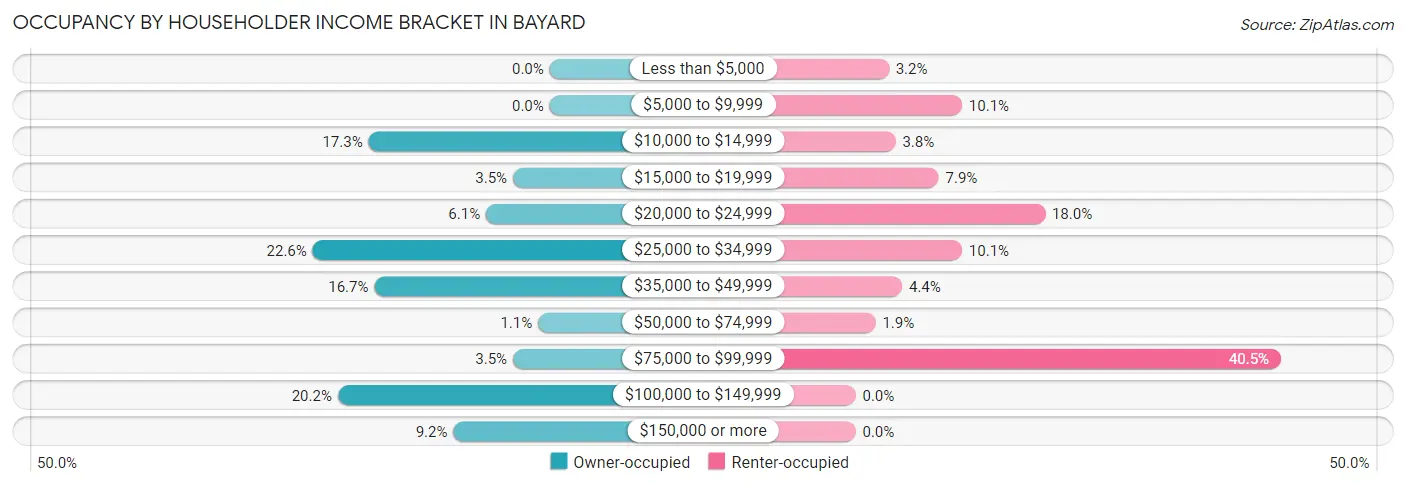
| Income Bracket | Owner-occupied | Renter-occupied |
| Less than $5,000 | 0 (0.0%) | 10 (3.2%) |
| $5,000 to $9,999 | 0 (0.0%) | 32 (10.1%) |
| $10,000 to $14,999 | 94 (17.2%) | 12 (3.8%) |
| $15,000 to $19,999 | 19 (3.5%) | 25 (7.9%) |
| $20,000 to $24,999 | 33 (6.1%) | 57 (18.0%) |
| $25,000 to $34,999 | 123 (22.6%) | 32 (10.1%) |
| $35,000 to $49,999 | 91 (16.7%) | 14 (4.4%) |
| $50,000 to $74,999 | 6 (1.1%) | 6 (1.9%) |
| $75,000 to $99,999 | 19 (3.5%) | 128 (40.5%) |
| $100,000 to $149,999 | 110 (20.2%) | 0 (0.0%) |
| $150,000 or more | 50 (9.2%) | 0 (0.0%) |
| Total | 545 (100.0%) | 316 (100.0%) |
Monthly Housing Cost Tiers in Bayard
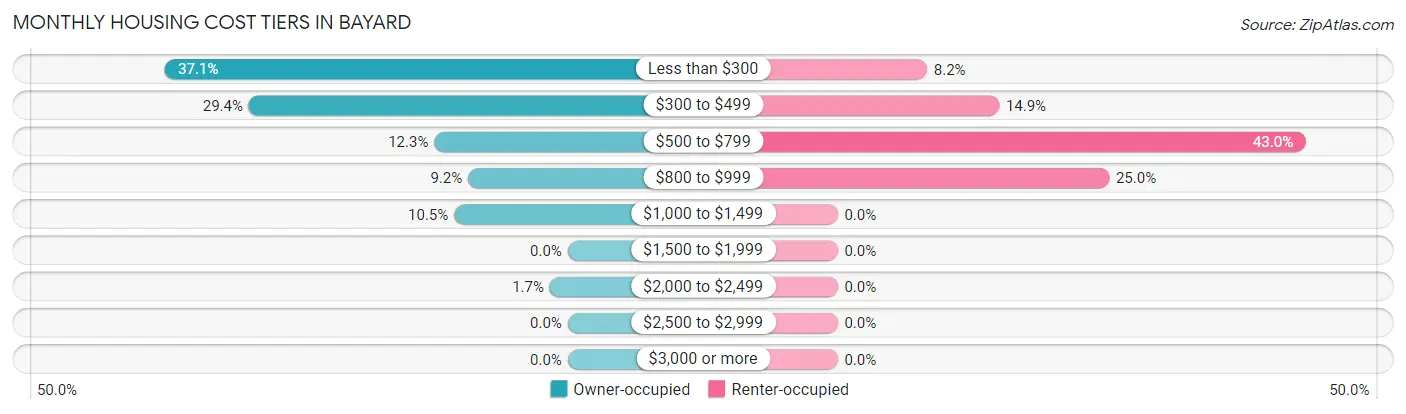
| Monthly Cost | Owner-occupied | Renter-occupied |
| Less than $300 | 202 (37.1%) | 26 (8.2%) |
| $300 to $499 | 160 (29.4%) | 47 (14.9%) |
| $500 to $799 | 67 (12.3%) | 136 (43.0%) |
| $800 to $999 | 50 (9.2%) | 79 (25.0%) |
| $1,000 to $1,499 | 57 (10.5%) | 0 (0.0%) |
| $1,500 to $1,999 | 0 (0.0%) | 0 (0.0%) |
| $2,000 to $2,499 | 9 (1.7%) | 0 (0.0%) |
| $2,500 to $2,999 | 0 (0.0%) | 0 (0.0%) |
| $3,000 or more | 0 (0.0%) | 0 (0.0%) |
| Total | 545 (100.0%) | 316 (100.0%) |
Physical Housing Characteristics in Bayard
Housing Structures in Bayard
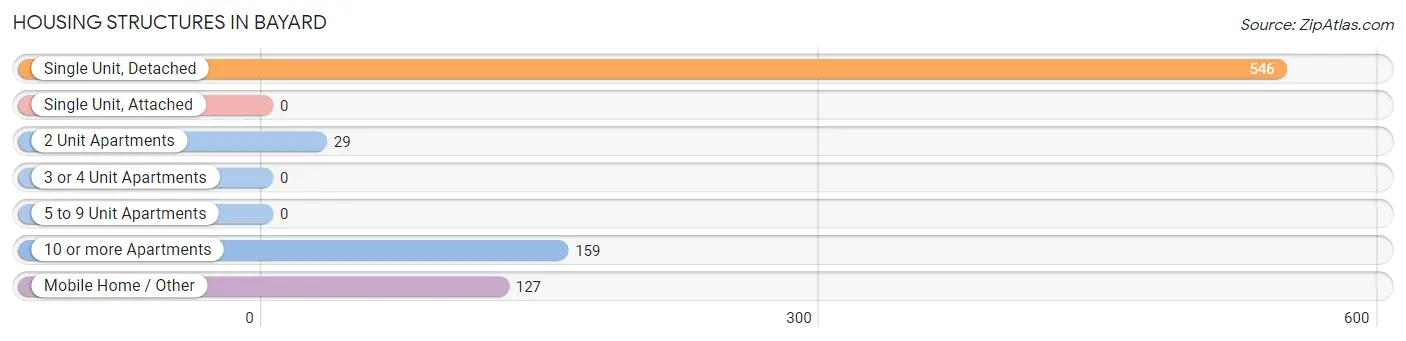
| Structure Type | # Housing Units | % Housing Units |
| Single Unit, Detached | 546 | 63.4% |
| Single Unit, Attached | 0 | 0.0% |
| 2 Unit Apartments | 29 | 3.4% |
| 3 or 4 Unit Apartments | 0 | 0.0% |
| 5 to 9 Unit Apartments | 0 | 0.0% |
| 10 or more Apartments | 159 | 18.5% |
| Mobile Home / Other | 127 | 14.7% |
| Total | 861 | 100.0% |
Housing Structures by Occupancy in Bayard
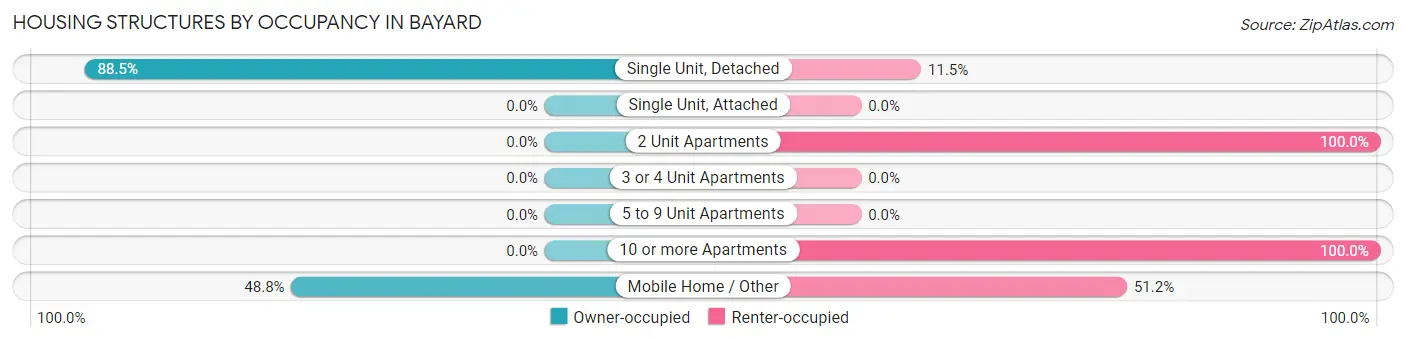
| Structure Type | Owner-occupied | Renter-occupied |
| Single Unit, Detached | 483 (88.5%) | 63 (11.5%) |
| Single Unit, Attached | 0 (0.0%) | 0 (0.0%) |
| 2 Unit Apartments | 0 (0.0%) | 29 (100.0%) |
| 3 or 4 Unit Apartments | 0 (0.0%) | 0 (0.0%) |
| 5 to 9 Unit Apartments | 0 (0.0%) | 0 (0.0%) |
| 10 or more Apartments | 0 (0.0%) | 159 (100.0%) |
| Mobile Home / Other | 62 (48.8%) | 65 (51.2%) |
| Total | 545 (63.3%) | 316 (36.7%) |
Housing Structures by Number of Rooms in Bayard
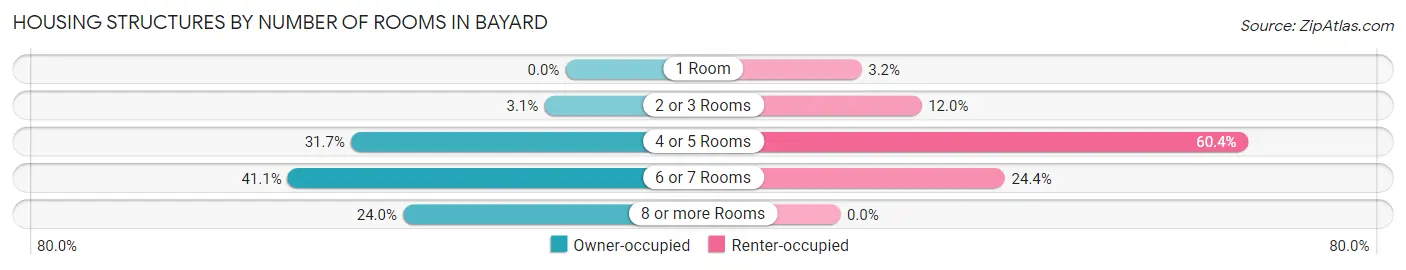
| Number of Rooms | Owner-occupied | Renter-occupied |
| 1 Room | 0 (0.0%) | 10 (3.2%) |
| 2 or 3 Rooms | 17 (3.1%) | 38 (12.0%) |
| 4 or 5 Rooms | 173 (31.7%) | 191 (60.4%) |
| 6 or 7 Rooms | 224 (41.1%) | 77 (24.4%) |
| 8 or more Rooms | 131 (24.0%) | 0 (0.0%) |
| Total | 545 (100.0%) | 316 (100.0%) |
Housing Structure by Heating Type in Bayard
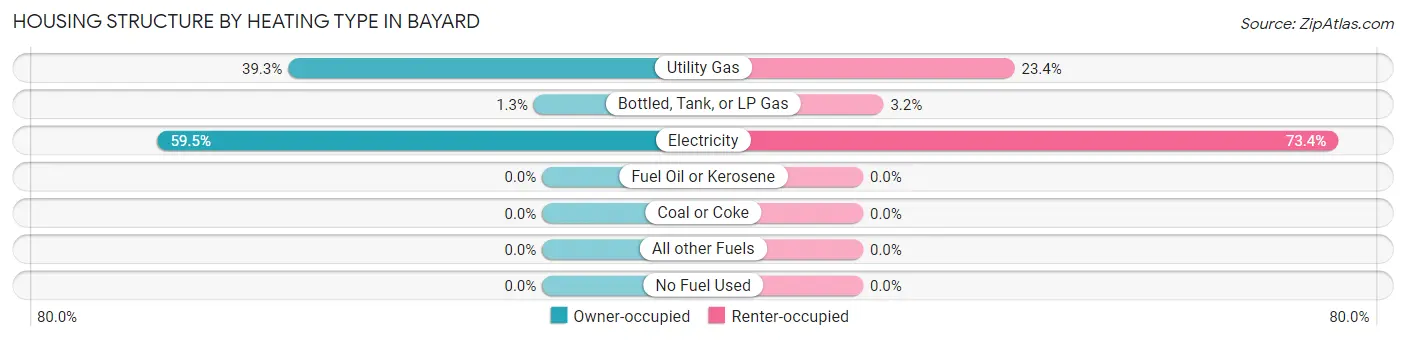
| Heating Type | Owner-occupied | Renter-occupied |
| Utility Gas | 214 (39.3%) | 74 (23.4%) |
| Bottled, Tank, or LP Gas | 7 (1.3%) | 10 (3.2%) |
| Electricity | 324 (59.5%) | 232 (73.4%) |
| Fuel Oil or Kerosene | 0 (0.0%) | 0 (0.0%) |
| Coal or Coke | 0 (0.0%) | 0 (0.0%) |
| All other Fuels | 0 (0.0%) | 0 (0.0%) |
| No Fuel Used | 0 (0.0%) | 0 (0.0%) |
| Total | 545 (100.0%) | 316 (100.0%) |
Household Vehicle Usage in Bayard
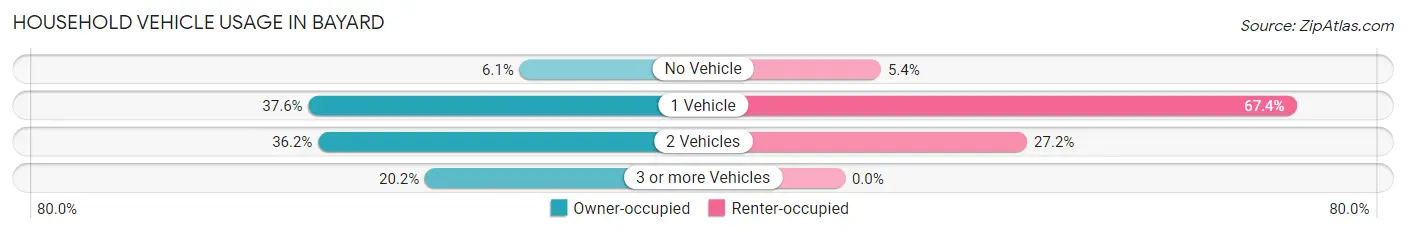
| Vehicles per Household | Owner-occupied | Renter-occupied |
| No Vehicle | 33 (6.1%) | 17 (5.4%) |
| 1 Vehicle | 205 (37.6%) | 213 (67.4%) |
| 2 Vehicles | 197 (36.1%) | 86 (27.2%) |
| 3 or more Vehicles | 110 (20.2%) | 0 (0.0%) |
| Total | 545 (100.0%) | 316 (100.0%) |
Real Estate & Mortgages in Bayard
Real Estate and Mortgage Overview in Bayard
| Characteristic | Without Mortgage | With Mortgage |
| Housing Units | 390 | 155 |
| Median Property Value | $95,200 | $120,100 |
| Median Household Income | $31,538 | $50 |
| Monthly Housing Costs | $296 | $0 |
| Real Estate Taxes | $453 | $0 |
Property Value by Mortgage Status in Bayard
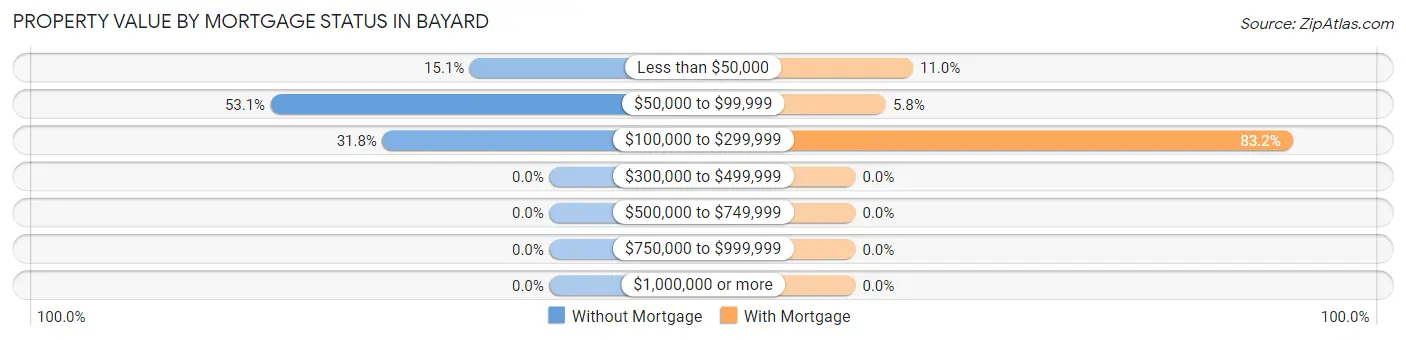
| Property Value | Without Mortgage | With Mortgage |
| Less than $50,000 | 59 (15.1%) | 17 (11.0%) |
| $50,000 to $99,999 | 207 (53.1%) | 9 (5.8%) |
| $100,000 to $299,999 | 124 (31.8%) | 129 (83.2%) |
| $300,000 to $499,999 | 0 (0.0%) | 0 (0.0%) |
| $500,000 to $749,999 | 0 (0.0%) | 0 (0.0%) |
| $750,000 to $999,999 | 0 (0.0%) | 0 (0.0%) |
| $1,000,000 or more | 0 (0.0%) | 0 (0.0%) |
| Total | 390 (100.0%) | 155 (100.0%) |
Household Income by Mortgage Status in Bayard
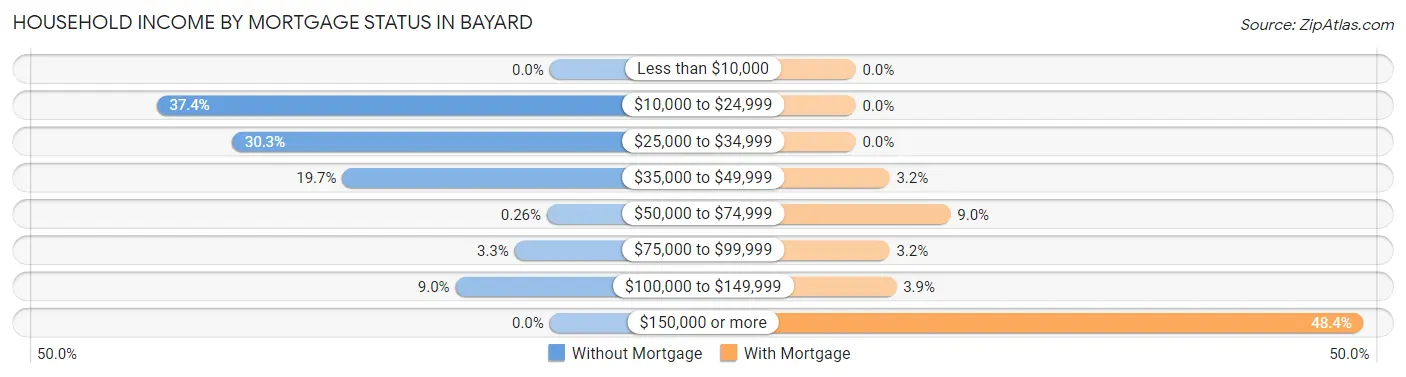
| Household Income | Without Mortgage | With Mortgage |
| Less than $10,000 | 0 (0.0%) | 0 (0.0%) |
| $10,000 to $24,999 | 146 (37.4%) | 0 (0.0%) |
| $25,000 to $34,999 | 118 (30.3%) | 0 (0.0%) |
| $35,000 to $49,999 | 77 (19.7%) | 5 (3.2%) |
| $50,000 to $74,999 | 1 (0.3%) | 14 (9.0%) |
| $75,000 to $99,999 | 13 (3.3%) | 5 (3.2%) |
| $100,000 to $149,999 | 35 (9.0%) | 6 (3.9%) |
| $150,000 or more | 0 (0.0%) | 75 (48.4%) |
| Total | 390 (100.0%) | 155 (100.0%) |
Property Value to Household Income Ratio in Bayard
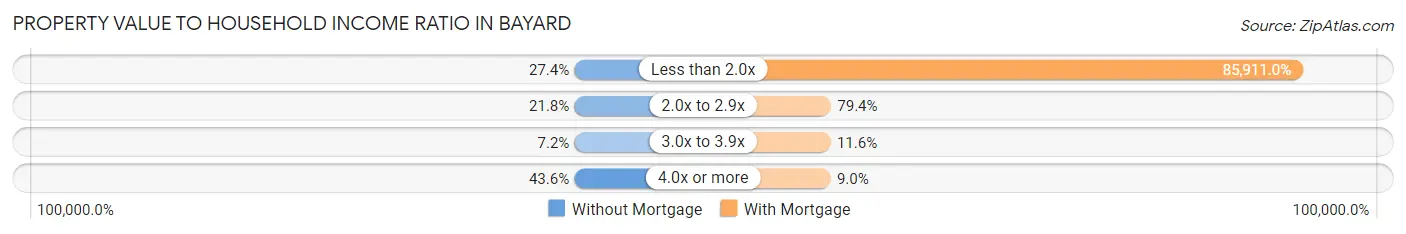
| Value-to-Income Ratio | Without Mortgage | With Mortgage |
| Less than 2.0x | 107 (27.4%) | 133,162 (85,911.0%) |
| 2.0x to 2.9x | 85 (21.8%) | 123 (79.3%) |
| 3.0x to 3.9x | 28 (7.2%) | 18 (11.6%) |
| 4.0x or more | 170 (43.6%) | 14 (9.0%) |
| Total | 390 (100.0%) | 155 (100.0%) |
Real Estate Taxes by Mortgage Status in Bayard
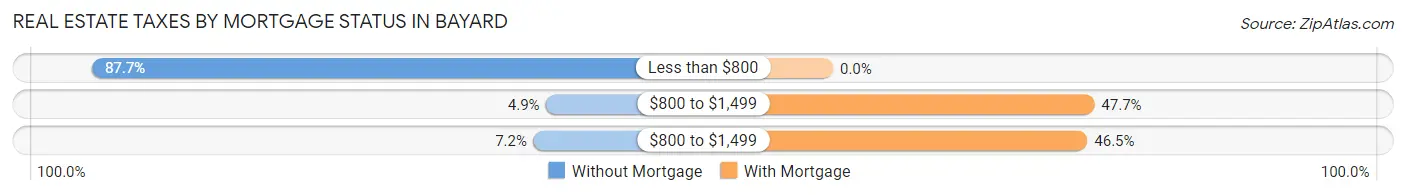
| Property Taxes | Without Mortgage | With Mortgage |
| Less than $800 | 342 (87.7%) | 0 (0.0%) |
| $800 to $1,499 | 19 (4.9%) | 74 (47.7%) |
| $800 to $1,499 | 28 (7.2%) | 72 (46.5%) |
| Total | 390 (100.0%) | 155 (100.0%) |
Health & Disability in Bayard
Health Insurance Coverage by Age in Bayard
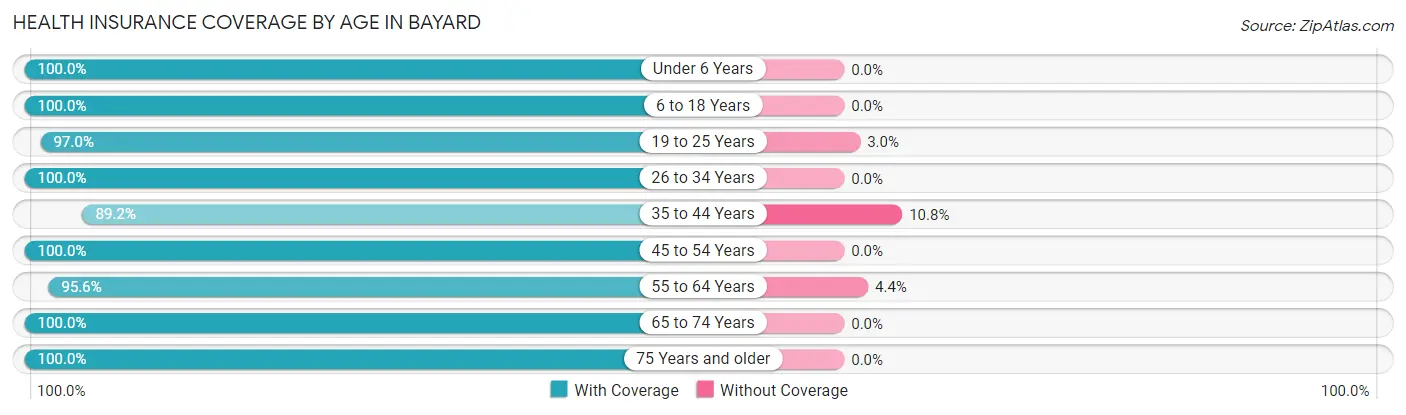
| Age Bracket | With Coverage | Without Coverage |
| Under 6 Years | 104 (100.0%) | 0 (0.0%) |
| 6 to 18 Years | 462 (100.0%) | 0 (0.0%) |
| 19 to 25 Years | 392 (97.0%) | 12 (3.0%) |
| 26 to 34 Years | 93 (100.0%) | 0 (0.0%) |
| 35 to 44 Years | 256 (89.2%) | 31 (10.8%) |
| 45 to 54 Years | 153 (100.0%) | 0 (0.0%) |
| 55 to 64 Years | 172 (95.6%) | 8 (4.4%) |
| 65 to 74 Years | 284 (100.0%) | 0 (0.0%) |
| 75 Years and older | 185 (100.0%) | 0 (0.0%) |
| Total | 2,101 (97.6%) | 51 (2.4%) |
Health Insurance Coverage by Citizenship Status in Bayard
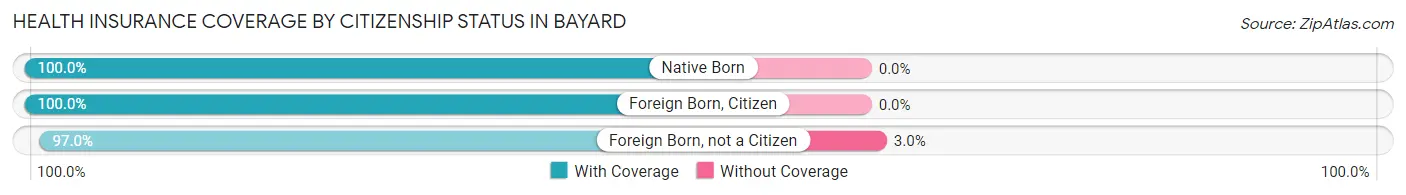
| Citizenship Status | With Coverage | Without Coverage |
| Native Born | 104 (100.0%) | 0 (0.0%) |
| Foreign Born, Citizen | 462 (100.0%) | 0 (0.0%) |
| Foreign Born, not a Citizen | 392 (97.0%) | 12 (3.0%) |
Health Insurance Coverage by Household Income in Bayard
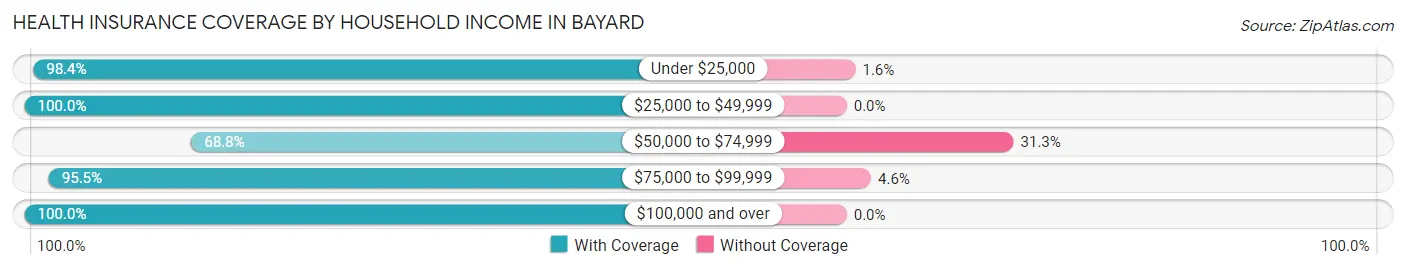
| Household Income | With Coverage | Without Coverage |
| Under $25,000 | 481 (98.4%) | 8 (1.6%) |
| $25,000 to $49,999 | 671 (100.0%) | 0 (0.0%) |
| $50,000 to $74,999 | 55 (68.8%) | 25 (31.2%) |
| $75,000 to $99,999 | 378 (95.5%) | 18 (4.5%) |
| $100,000 and over | 516 (100.0%) | 0 (0.0%) |
Public vs Private Health Insurance Coverage by Age in Bayard
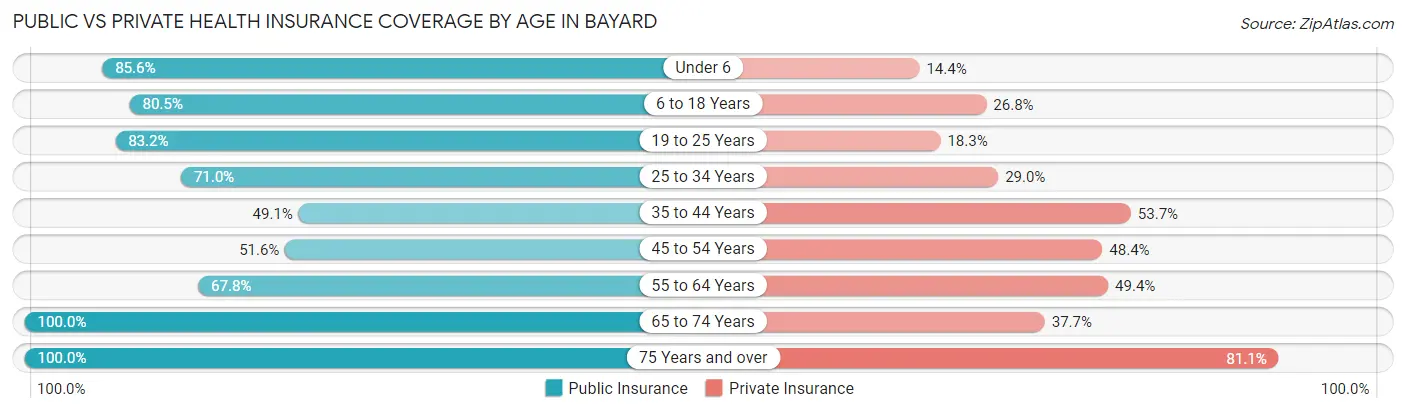
| Age Bracket | Public Insurance | Private Insurance |
| Under 6 | 89 (85.6%) | 15 (14.4%) |
| 6 to 18 Years | 372 (80.5%) | 124 (26.8%) |
| 19 to 25 Years | 336 (83.2%) | 74 (18.3%) |
| 25 to 34 Years | 66 (71.0%) | 27 (29.0%) |
| 35 to 44 Years | 141 (49.1%) | 154 (53.7%) |
| 45 to 54 Years | 79 (51.6%) | 74 (48.4%) |
| 55 to 64 Years | 122 (67.8%) | 89 (49.4%) |
| 65 to 74 Years | 284 (100.0%) | 107 (37.7%) |
| 75 Years and over | 185 (100.0%) | 150 (81.1%) |
| Total | 1,674 (77.8%) | 814 (37.8%) |
Disability Status by Sex by Age in Bayard
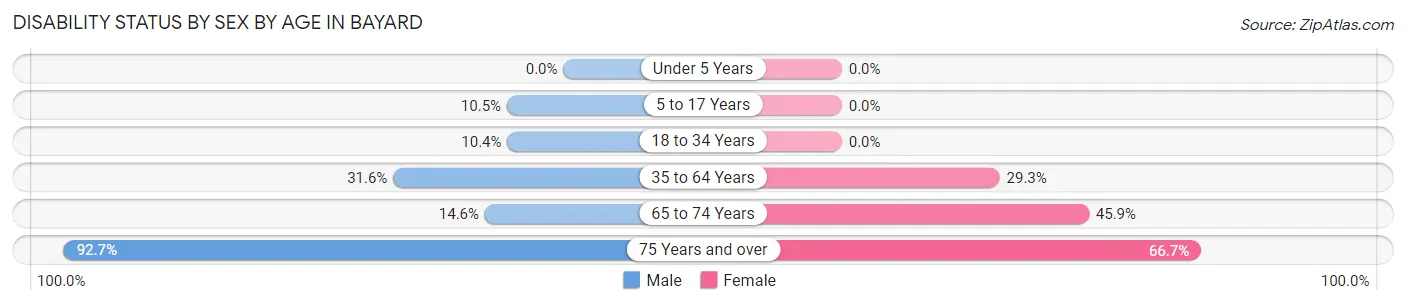
| Age Bracket | Male | Female |
| Under 5 Years | 0 (0.0%) | 0 (0.0%) |
| 5 to 17 Years | 24 (10.5%) | 0 (0.0%) |
| 18 to 34 Years | 24 (10.4%) | 0 (0.0%) |
| 35 to 64 Years | 102 (31.6%) | 87 (29.3%) |
| 65 to 74 Years | 22 (14.6%) | 61 (45.9%) |
| 75 Years and over | 102 (92.7%) | 50 (66.7%) |
Disability Class by Sex by Age in Bayard
Disability Class: Hearing Difficulty
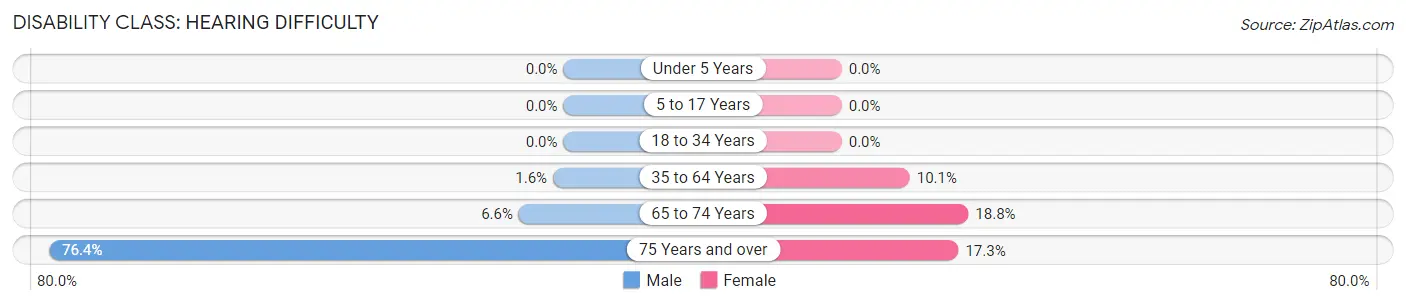
| Age Bracket | Male | Female |
| Under 5 Years | 0 (0.0%) | 0 (0.0%) |
| 5 to 17 Years | 0 (0.0%) | 0 (0.0%) |
| 18 to 34 Years | 0 (0.0%) | 0 (0.0%) |
| 35 to 64 Years | 5 (1.5%) | 30 (10.1%) |
| 65 to 74 Years | 10 (6.6%) | 25 (18.8%) |
| 75 Years and over | 84 (76.4%) | 13 (17.3%) |
Disability Class: Vision Difficulty
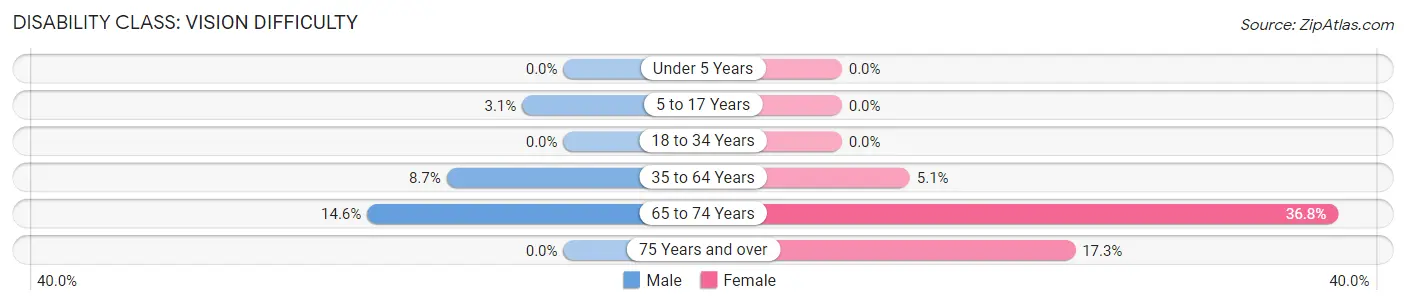
| Age Bracket | Male | Female |
| Under 5 Years | 0 (0.0%) | 0 (0.0%) |
| 5 to 17 Years | 7 (3.1%) | 0 (0.0%) |
| 18 to 34 Years | 0 (0.0%) | 0 (0.0%) |
| 35 to 64 Years | 28 (8.7%) | 15 (5.1%) |
| 65 to 74 Years | 22 (14.6%) | 49 (36.8%) |
| 75 Years and over | 0 (0.0%) | 13 (17.3%) |
Disability Class: Cognitive Difficulty
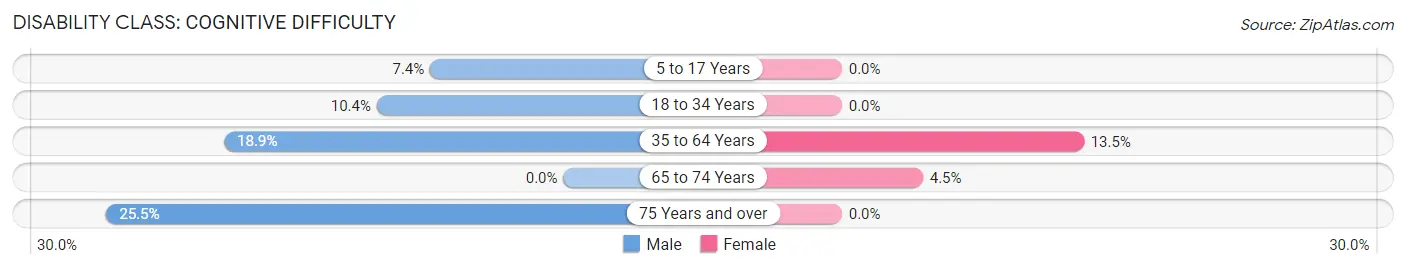
| Age Bracket | Male | Female |
| 5 to 17 Years | 17 (7.4%) | 0 (0.0%) |
| 18 to 34 Years | 24 (10.4%) | 0 (0.0%) |
| 35 to 64 Years | 61 (18.9%) | 40 (13.5%) |
| 65 to 74 Years | 0 (0.0%) | 6 (4.5%) |
| 75 Years and over | 28 (25.5%) | 0 (0.0%) |
Disability Class: Ambulatory Difficulty
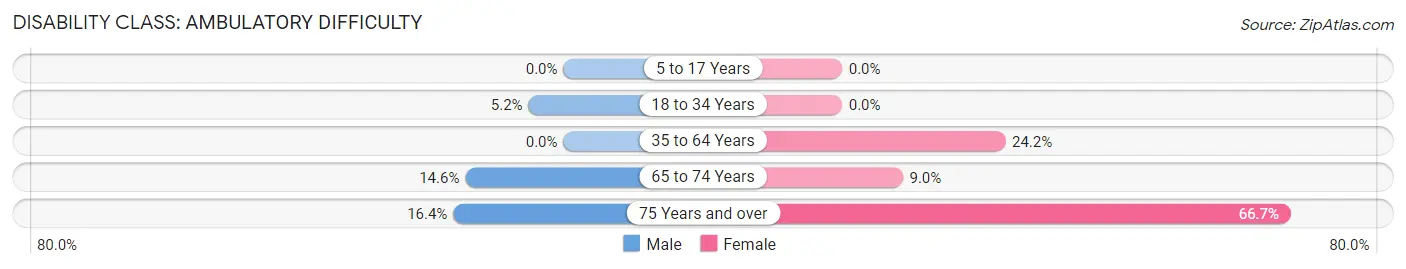
| Age Bracket | Male | Female |
| 5 to 17 Years | 0 (0.0%) | 0 (0.0%) |
| 18 to 34 Years | 12 (5.2%) | 0 (0.0%) |
| 35 to 64 Years | 0 (0.0%) | 72 (24.2%) |
| 65 to 74 Years | 22 (14.6%) | 12 (9.0%) |
| 75 Years and over | 18 (16.4%) | 50 (66.7%) |
Disability Class: Self-Care Difficulty
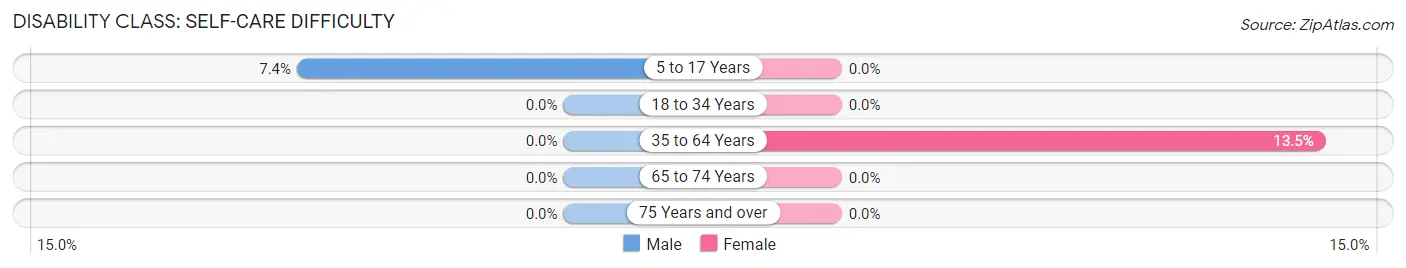
| Age Bracket | Male | Female |
| 5 to 17 Years | 17 (7.4%) | 0 (0.0%) |
| 18 to 34 Years | 0 (0.0%) | 0 (0.0%) |
| 35 to 64 Years | 0 (0.0%) | 40 (13.5%) |
| 65 to 74 Years | 0 (0.0%) | 0 (0.0%) |
| 75 Years and over | 0 (0.0%) | 0 (0.0%) |
Technology Access in Bayard
Computing Device Access in Bayard
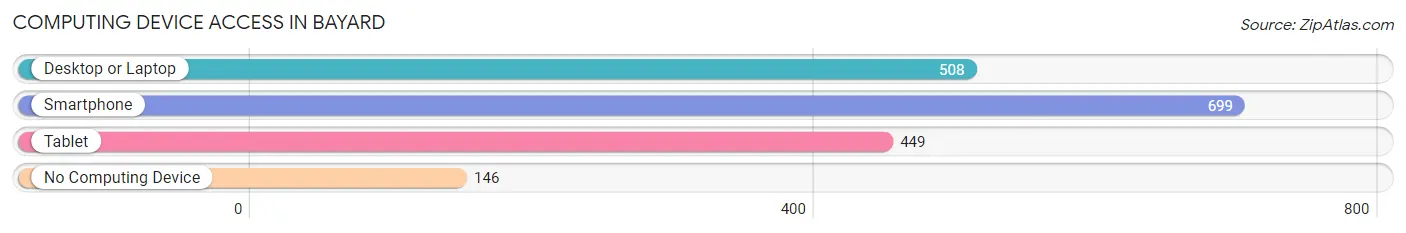
| Device Type | # Households | % Households |
| Desktop or Laptop | 508 | 59.0% |
| Smartphone | 699 | 81.2% |
| Tablet | 449 | 52.1% |
| No Computing Device | 146 | 17.0% |
| Total | 861 | 100.0% |
Internet Access in Bayard
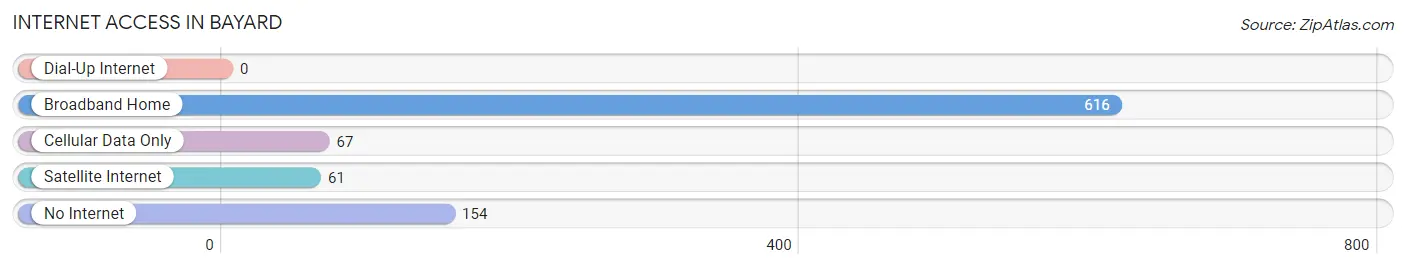
| Internet Type | # Households | % Households |
| Dial-Up Internet | 0 | 0.0% |
| Broadband Home | 616 | 71.5% |
| Cellular Data Only | 67 | 7.8% |
| Satellite Internet | 61 | 7.1% |
| No Internet | 154 | 17.9% |
| Total | 861 | 100.0% |
Bayard Summary
Bayard, New Mexico is a small city located in Grant County in the southwestern part of the state. It is situated at the base of the Mogollon Mountains, and is the county seat of Grant County. The city has a population of approximately 4,000 people, and is part of the Silver City Metropolitan Statistical Area.
History
The area that is now Bayard was first settled in the late 1800s by miners and ranchers. The town was originally known as Central, and was renamed Bayard in 1891 after a local mine owner, Henry Bayard. The town was incorporated in 1901, and the first post office was established in 1902.
In the early 1900s, Bayard was a bustling mining town, with several large mines in the area. The mines produced copper, lead, zinc, and silver, and the town was home to several smelters. The mining industry declined in the mid-1900s, and the town shifted its focus to agriculture and tourism.
Geography
Bayard is located in southwestern New Mexico, in Grant County. It is situated at the base of the Mogollon Mountains, and is surrounded by the Gila National Forest. The city is located at an elevation of 5,400 feet, and has a total area of 2.2 square miles.
The climate in Bayard is semi-arid, with hot summers and mild winters. The average annual temperature is 64 degrees Fahrenheit, and the average annual precipitation is 12.5 inches.
Economy
The economy of Bayard is largely based on agriculture and tourism. The city is home to several farms and ranches, and produces a variety of crops, including alfalfa, hay, and pecans. The city is also home to several tourist attractions, including the Gila Cliff Dwellings National Monument and the City of Rocks State Park.
The city is also home to several manufacturing companies, including a copper smelter and a lead smelter. The city is also home to several retail stores, restaurants, and other businesses.
Demographics
As of the 2010 census, the population of Bayard was 4,000. The racial makeup of the city was 75.3% White, 0.7% African American, 1.2% Native American, 0.3% Asian, 0.1% Pacific Islander, 19.2% from other races, and 3.4% from two or more races. Hispanic or Latino of any race were 44.2% of the population.
The median household income in Bayard was $30,000, and the median family income was $35,000. The per capita income was $14,000. About 18.2% of the population was below the poverty line.
Common Questions
What is Per Capita Income in Bayard?
Per Capita income in Bayard is $22,913.
What is the Median Household income in Bayard?
Median Household Income in Bayard is $34,699.
What is Inequality or Gini Index in Bayard?
Inequality or Gini Index in Bayard is 0.47.
What is the Total Population of Bayard?
Total Population of Bayard is 2,152.
What is the Total Male Population of Bayard?
Total Male Population of Bayard is 1,094.
What is the Total Female Population of Bayard?
Total Female Population of Bayard is 1,058.
What is the Ratio of Males per 100 Females in Bayard?
There are 103.40 Males per 100 Females in Bayard.
What is the Ratio of Females per 100 Males in Bayard?
There are 96.71 Females per 100 Males in Bayard.
What is the Median Population Age in Bayard?
Median Population Age in Bayard is 37.1 Years.
What is the Average Family Size in Bayard
Average Family Size in Bayard is 3.7 People.
What is the Average Household Size in Bayard
Average Household Size in Bayard is 2.5 People.
How Large is the Labor Force in Bayard?
There are 602 People in the Labor Forcein in Bayard.
What is the Percentage of People in the Labor Force in Bayard?
36.0% of People are in the Labor Force in Bayard.
What is the Unemployment Rate in Bayard?
Unemployment Rate in Bayard is 7.6%.