Madrid, NM Map & Demographics
Madrid Map
Madrid Overview
$25,228
PER CAPITA INCOME
$67,375
AVG FAMILY INCOME
87.4%
WAGE / INCOME GAP [ % ]
12.6¢/ $1
WAGE / INCOME GAP [ $ ]
0.68
INEQUALITY / GINI INDEX
287
TOTAL POPULATION
179
MALE POPULATION
108
FEMALE POPULATION
165.74
MALES / 100 FEMALES
60.34
FEMALES / 100 MALES
59.6
MEDIAN AGE
2.3
AVG FAMILY SIZE
1.3
AVG HOUSEHOLD SIZE
76
LABOR FORCE [ PEOPLE ]
27.4%
PERCENT IN LABOR FORCE
Madrid Area Codes
Income in Madrid
Income Overview in Madrid
| Characteristic | Number | Measure |
| Per Capita Income | 287 | $25,228 |
| Median Family Income | 37 | $67,375 |
| Mean Family Income | 37 | $95,373 |
| Median Household Income | 226 | $0 |
| Mean Household Income | 226 | $29,883 |
| Income Deficit | 37 | $0 |
| Wage / Income Gap (%) | 287 | 87.39% |
| Wage / Income Gap ($) | 287 | 12.61¢ per $1 |
| Gini / Inequality Index | 287 | 0.68 |
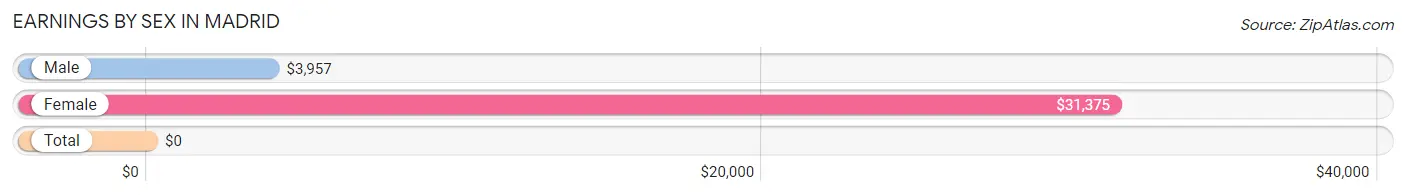
Earnings by Sex in Madrid
| Sex | Number | Average Earnings |
| Male | 152 (75.6%) | $3,957 |
| Female | 49 (24.4%) | $31,375 |
| Total | 201 (100.0%) | $0 |
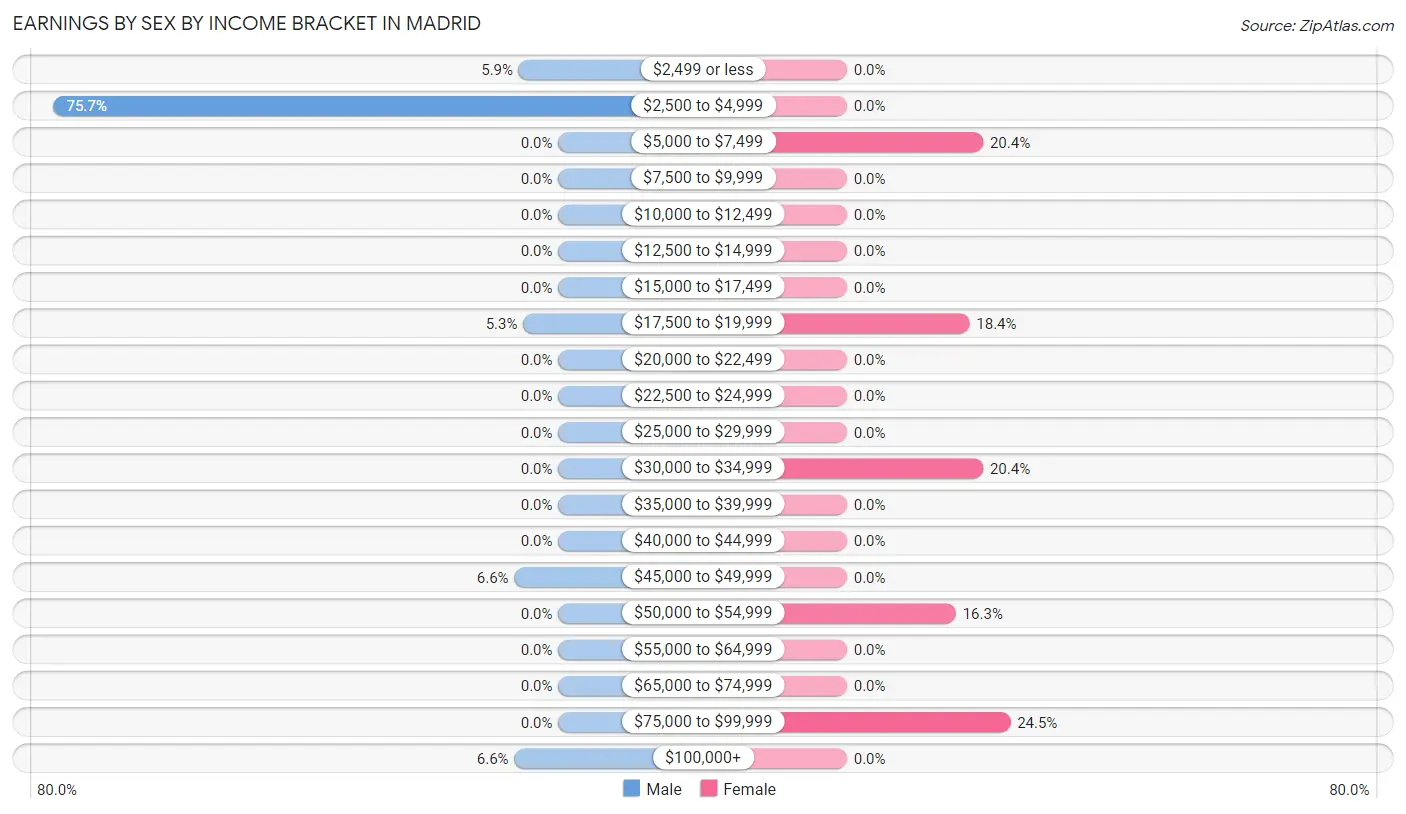
Earnings by Sex by Income Bracket in Madrid
The most common earnings brackets in Madrid are $2,500 to $4,999 for men (115 | 75.7%) and $75,000 to $99,999 for women (12 | 24.5%).
| Income | Male | Female |
| $2,499 or less | 9 (5.9%) | 0 (0.0%) |
| $2,500 to $4,999 | 115 (75.7%) | 0 (0.0%) |
| $5,000 to $7,499 | 0 (0.0%) | 10 (20.4%) |
| $7,500 to $9,999 | 0 (0.0%) | 0 (0.0%) |
| $10,000 to $12,499 | 0 (0.0%) | 0 (0.0%) |
| $12,500 to $14,999 | 0 (0.0%) | 0 (0.0%) |
| $15,000 to $17,499 | 0 (0.0%) | 0 (0.0%) |
| $17,500 to $19,999 | 8 (5.3%) | 9 (18.4%) |
| $20,000 to $22,499 | 0 (0.0%) | 0 (0.0%) |
| $22,500 to $24,999 | 0 (0.0%) | 0 (0.0%) |
| $25,000 to $29,999 | 0 (0.0%) | 0 (0.0%) |
| $30,000 to $34,999 | 0 (0.0%) | 10 (20.4%) |
| $35,000 to $39,999 | 0 (0.0%) | 0 (0.0%) |
| $40,000 to $44,999 | 0 (0.0%) | 0 (0.0%) |
| $45,000 to $49,999 | 10 (6.6%) | 0 (0.0%) |
| $50,000 to $54,999 | 0 (0.0%) | 8 (16.3%) |
| $55,000 to $64,999 | 0 (0.0%) | 0 (0.0%) |
| $65,000 to $74,999 | 0 (0.0%) | 0 (0.0%) |
| $75,000 to $99,999 | 0 (0.0%) | 12 (24.5%) |
| $100,000+ | 10 (6.6%) | 0 (0.0%) |
| Total | 152 (100.0%) | 49 (100.0%) |
Earnings by Sex by Educational Attainment in Madrid
| Educational Attainment | Male Income | Female Income |
| Less than High School | - | - |
| High School Diploma | - | - |
| College or Associate's Degree | - | - |
| Bachelor's Degree | - | - |
| Graduate Degree | - | - |
| Total | $3,957 | $31,375 |
Family Income in Madrid
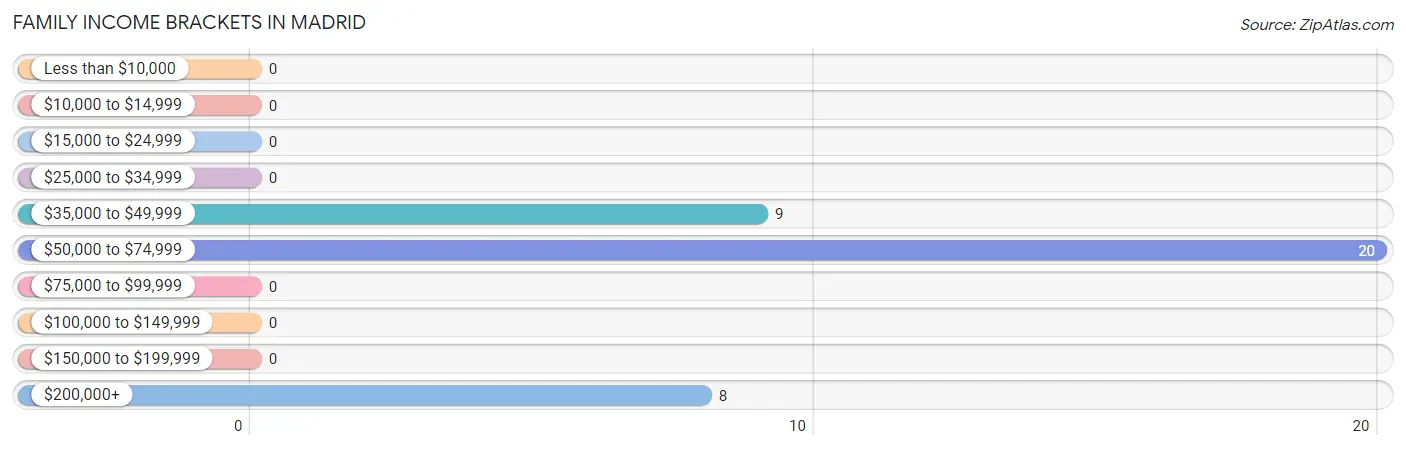
Family Income Brackets in Madrid
According to the Madrid family income data, there are 20 families falling into the $50,000 to $74,999 income range, which is the most common income bracket and makes up 54.0% of all families.
| Income Bracket | # Families | % Families |
| Less than $10,000 | 0 | 0.0% |
| $10,000 to $14,999 | 0 | 0.0% |
| $15,000 to $24,999 | 0 | 0.0% |
| $25,000 to $34,999 | 0 | 0.0% |
| $35,000 to $49,999 | 9 | 24.3% |
| $50,000 to $74,999 | 20 | 54.1% |
| $75,000 to $99,999 | 0 | 0.0% |
| $100,000 to $149,999 | 0 | 0.0% |
| $150,000 to $199,999 | 0 | 0.0% |
| $200,000+ | 8 | 21.6% |
Family Income by Famaliy Size in Madrid
| Income Bracket | # Families | Median Income |
| 2-Person Families | 27 (73.0%) | $0 |
| 3-Person Families | 10 (27.0%) | $0 |
| 4-Person Families | 0 (0.0%) | $0 |
| 5-Person Families | 0 (0.0%) | $0 |
| 6-Person Families | 0 (0.0%) | $0 |
| 7+ Person Families | 0 (0.0%) | $0 |
| Total | 37 (100.0%) | $67,375 |
Family Income by Number of Earners in Madrid
| Number of Earners | # Families | Median Income |
| No Earners | 0 (0.0%) | $0 |
| 1 Earner | 19 (51.3%) | $0 |
| 2 Earners | 18 (48.6%) | $0 |
| 3+ Earners | 0 (0.0%) | $0 |
| Total | 37 (100.0%) | $67,375 |
Household Income in Madrid
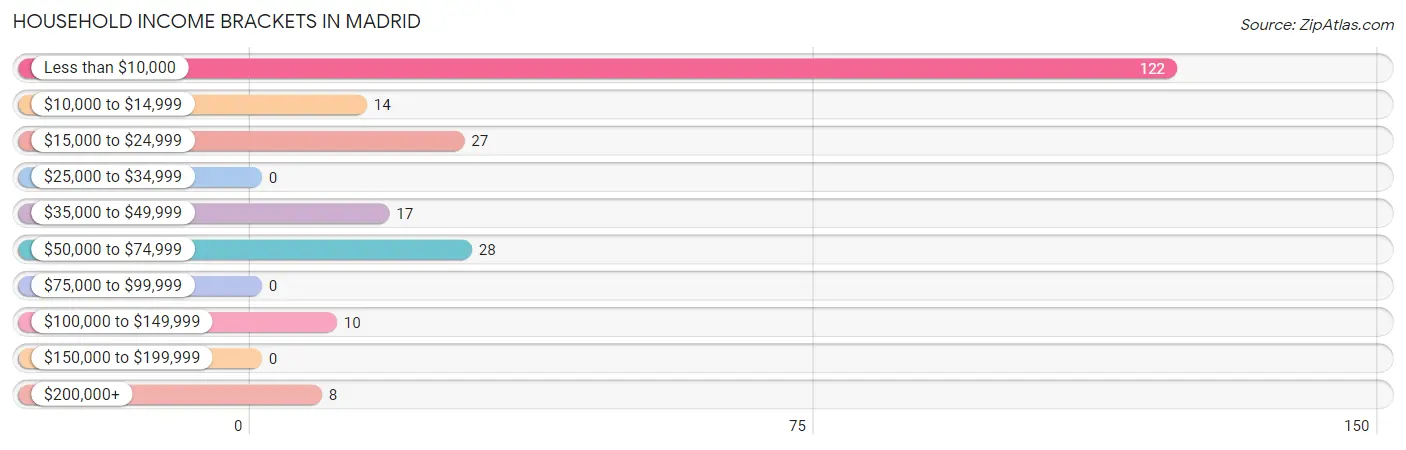
Household Income Brackets in Madrid
With 122 households falling in the category, the less than $10,000 income range is the most frequent in Madrid, accounting for 54.0% of all households.
| Income Bracket | # Households | % Households |
| Less than $10,000 | 122 | 54.0% |
| $10,000 to $14,999 | 14 | 6.2% |
| $15,000 to $24,999 | 27 | 11.9% |
| $25,000 to $34,999 | 0 | 0.0% |
| $35,000 to $49,999 | 17 | 7.5% |
| $50,000 to $74,999 | 28 | 12.4% |
| $75,000 to $99,999 | 0 | 0.0% |
| $100,000 to $149,999 | 10 | 4.4% |
| $150,000 to $199,999 | 0 | 0.0% |
| $200,000+ | 8 | 3.5% |
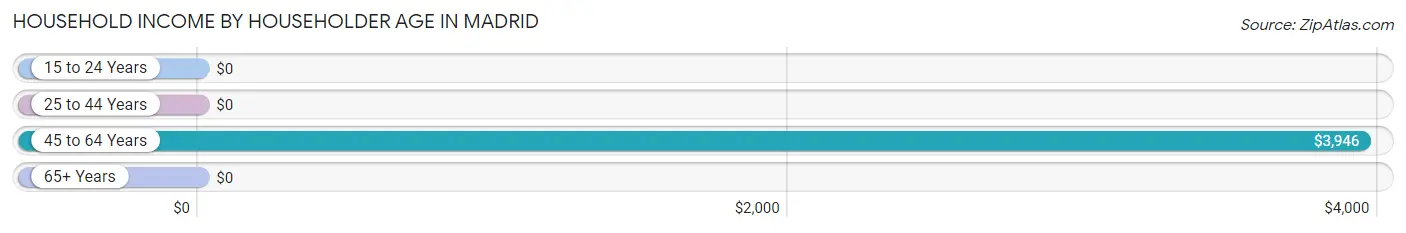
Household Income by Householder Age in Madrid
The median household income in Madrid is $0, with the highest median household income of $3,946 found in the 45 to 64 years age bracket for the primary householder. A total of 133 households (58.9%) fall into this category.
| Income Bracket | # Households | Median Income |
| 15 to 24 Years | 0 (0.0%) | $0 |
| 25 to 44 Years | 10 (4.4%) | $0 |
| 45 to 64 Years | 133 (58.9%) | $3,946 |
| 65+ Years | 83 (36.7%) | $0 |
| Total | 226 (100.0%) | $0 |
Poverty in Madrid
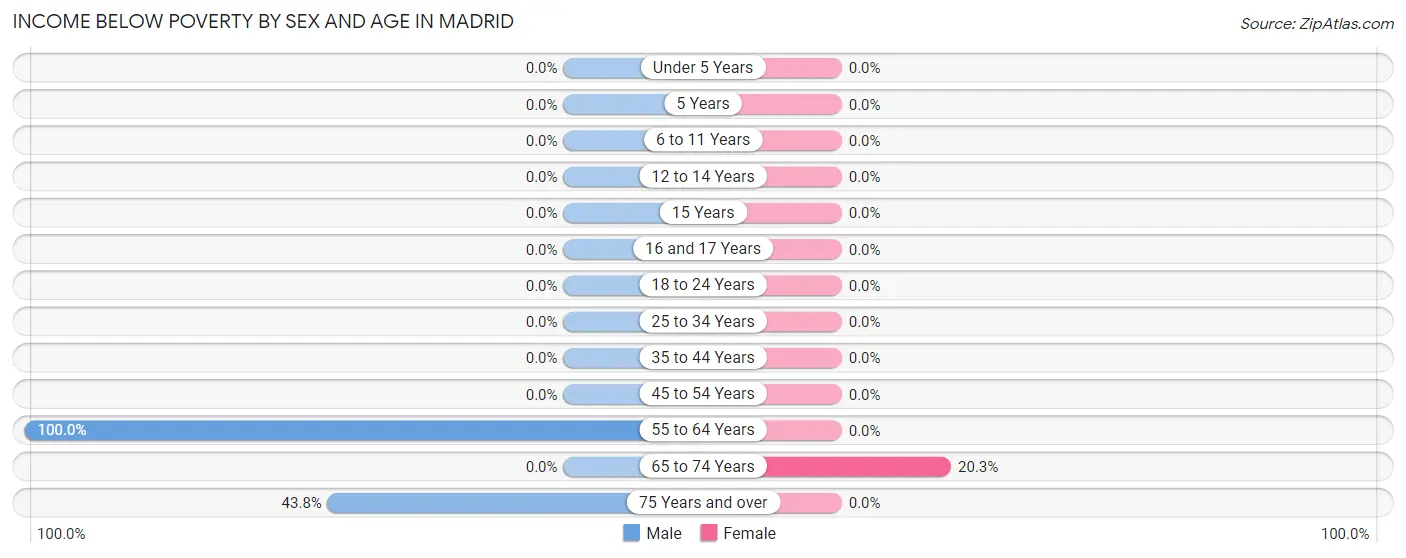
Income Below Poverty by Sex and Age in Madrid
With 68.2% poverty level for males and 13.0% for females among the residents of Madrid, 55 to 64 year old males and 65 to 74 year old females are the most vulnerable to poverty, with 115 males (100.0%) and 14 females (20.3%) in their respective age groups living below the poverty level.
| Age Bracket | Male | Female |
| Under 5 Years | 0 (0.0%) | 0 (0.0%) |
| 5 Years | 0 (0.0%) | 0 (0.0%) |
| 6 to 11 Years | 0 (0.0%) | 0 (0.0%) |
| 12 to 14 Years | 0 (0.0%) | 0 (0.0%) |
| 15 Years | 0 (0.0%) | 0 (0.0%) |
| 16 and 17 Years | 0 (0.0%) | 0 (0.0%) |
| 18 to 24 Years | 0 (0.0%) | 0 (0.0%) |
| 25 to 34 Years | 0 (0.0%) | 0 (0.0%) |
| 35 to 44 Years | 0 (0.0%) | 0 (0.0%) |
| 45 to 54 Years | 0 (0.0%) | 0 (0.0%) |
| 55 to 64 Years | 115 (100.0%) | 0 (0.0%) |
| 65 to 74 Years | 0 (0.0%) | 14 (20.3%) |
| 75 Years and over | 7 (43.8%) | 0 (0.0%) |
| Total | 122 (68.2%) | 14 (13.0%) |
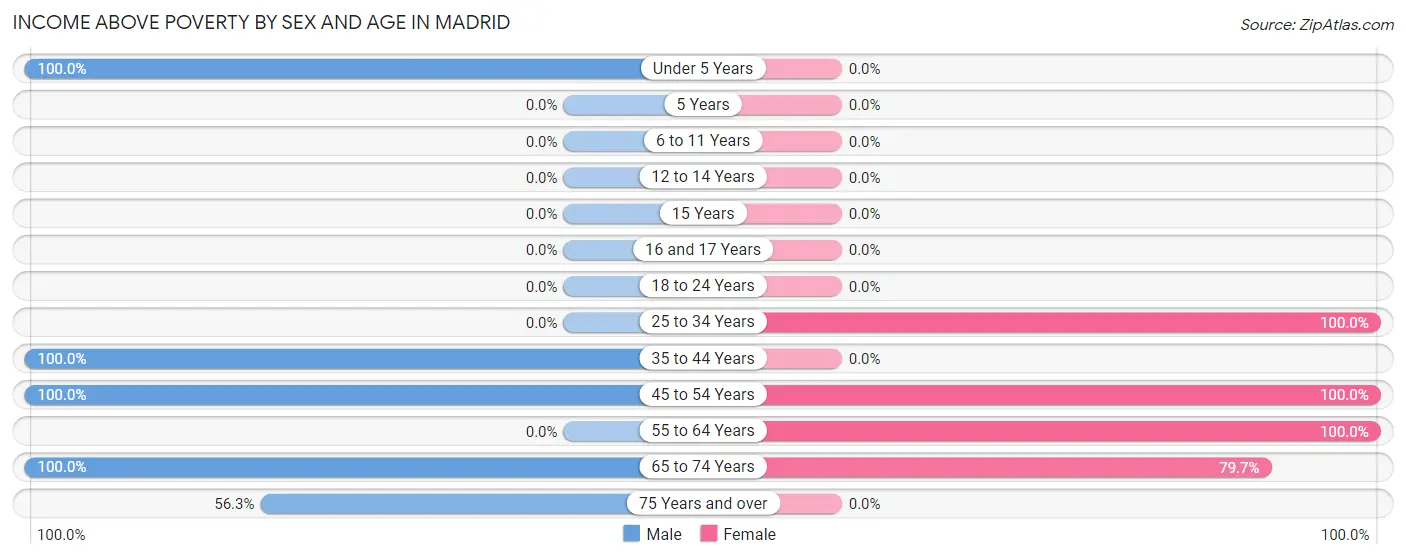
Income Above Poverty by Sex and Age in Madrid
According to the poverty statistics in Madrid, males aged under 5 years and females aged 25 to 34 years are the age groups that are most secure financially, with 100.0% of males and 100.0% of females in these age groups living above the poverty line.
| Age Bracket | Male | Female |
| Under 5 Years | 10 (100.0%) | 0 (0.0%) |
| 5 Years | 0 (0.0%) | 0 (0.0%) |
| 6 to 11 Years | 0 (0.0%) | 0 (0.0%) |
| 12 to 14 Years | 0 (0.0%) | 0 (0.0%) |
| 15 Years | 0 (0.0%) | 0 (0.0%) |
| 16 and 17 Years | 0 (0.0%) | 0 (0.0%) |
| 18 to 24 Years | 0 (0.0%) | 0 (0.0%) |
| 25 to 34 Years | 0 (0.0%) | 9 (100.0%) |
| 35 to 44 Years | 10 (100.0%) | 0 (0.0%) |
| 45 to 54 Years | 10 (100.0%) | 20 (100.0%) |
| 55 to 64 Years | 0 (0.0%) | 10 (100.0%) |
| 65 to 74 Years | 18 (100.0%) | 55 (79.7%) |
| 75 Years and over | 9 (56.2%) | 0 (0.0%) |
| Total | 57 (31.8%) | 94 (87.0%) |
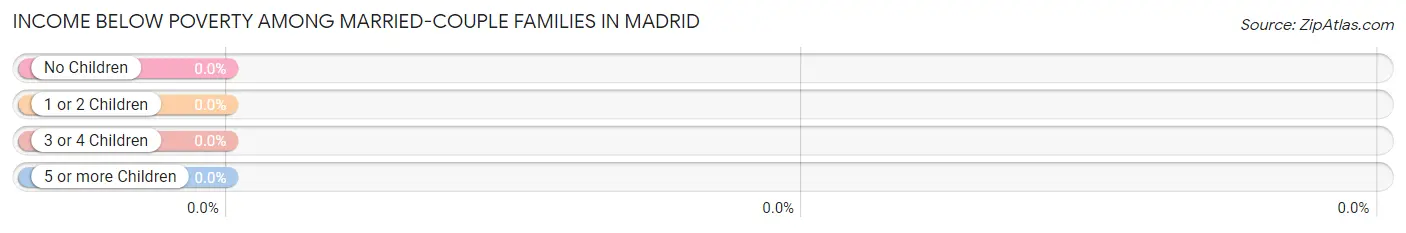
Income Below Poverty Among Married-Couple Families in Madrid
| Children | Above Poverty | Below Poverty |
| No Children | 27 (100.0%) | 0 (0.0%) |
| 1 or 2 Children | 10 (100.0%) | 0 (0.0%) |
| 3 or 4 Children | 0 (0.0%) | 0 (0.0%) |
| 5 or more Children | 0 (0.0%) | 0 (0.0%) |
| Total | 37 (100.0%) | 0 (0.0%) |
Income Below Poverty Among Single-Parent Households in Madrid
| Children | Single Father | Single Mother |
| No Children | 0 (0.0%) | 0 (0.0%) |
| 1 or 2 Children | 0 (0.0%) | 0 (0.0%) |
| 3 or 4 Children | 0 (0.0%) | 0 (0.0%) |
| 5 or more Children | 0 (0.0%) | 0 (0.0%) |
| Total | 0 (0.0%) | 0 (0.0%) |
Income Below Poverty Among Married-Couple vs Single-Parent Households in Madrid
| Children | Married-Couple Families | Single-Parent Households |
| No Children | 0 (0.0%) | 0 (0.0%) |
| 1 or 2 Children | 0 (0.0%) | 0 (0.0%) |
| 3 or 4 Children | 0 (0.0%) | 0 (0.0%) |
| 5 or more Children | 0 (0.0%) | 0 (0.0%) |
| Total | 0 (0.0%) | 0 (0.0%) |
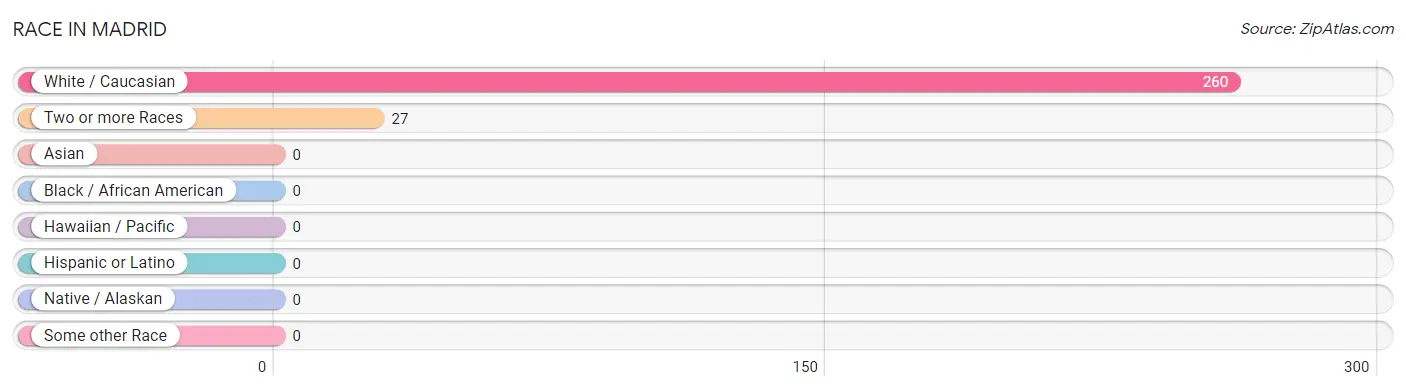
Race in Madrid
The most populous races in Madrid are White / Caucasian (260 | 90.6%), and Two or more Races (27 | 9.4%).
| Race | # Population | % Population |
| Asian | 0 | 0.0% |
| Black / African American | 0 | 0.0% |
| Hawaiian / Pacific | 0 | 0.0% |
| Hispanic or Latino | 0 | 0.0% |
| Native / Alaskan | 0 | 0.0% |
| White / Caucasian | 260 | 90.6% |
| Two or more Races | 27 | 9.4% |
| Some other Race | 0 | 0.0% |
| Total | 287 | 100.0% |
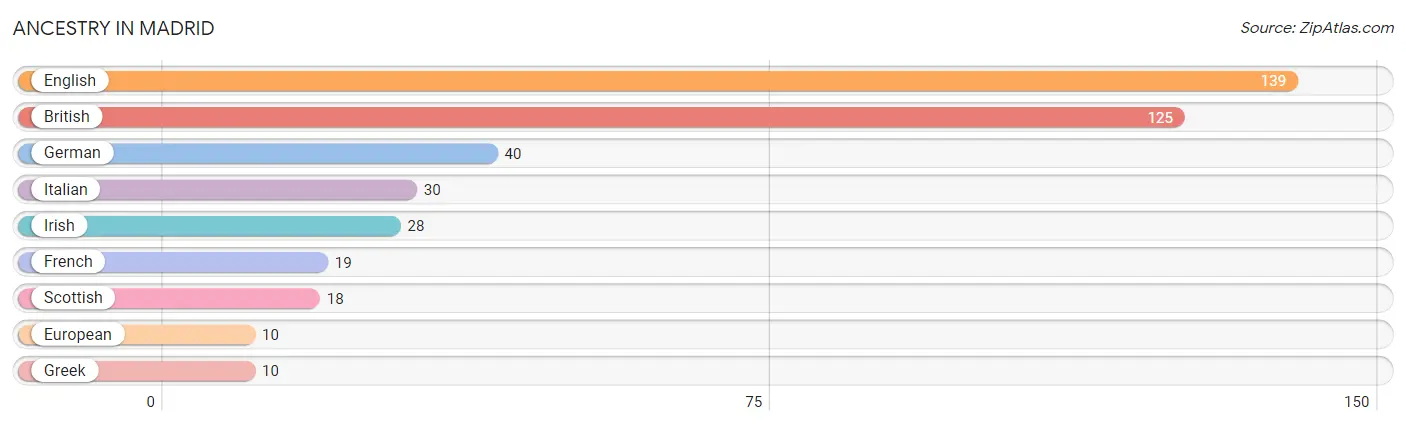
Ancestry in Madrid
The most populous ancestries reported in Madrid are English (139 | 48.4%), British (125 | 43.5%), German (40 | 13.9%), Italian (30 | 10.4%), and Irish (28 | 9.8%), together accounting for 126.1% of all Madrid residents.
| Ancestry | # Population | % Population |
| British | 125 | 43.5% |
| English | 139 | 48.4% |
| European | 10 | 3.5% |
| French | 19 | 6.6% |
| German | 40 | 13.9% |
| Greek | 10 | 3.5% |
| Irish | 28 | 9.8% |
| Italian | 30 | 10.4% |
| Scottish | 18 | 6.3% | View All 9 Rows |
Immigrants in Madrid
The most numerous immigrant groups reported in Madrid came from , and Oceania (9 | 3.1%), together accounting for 3.1% of all Madrid residents.

| Immigration Origin | # Population | % Population |
| Oceania | 9 | 3.1% | View All 1 Rows |
Sex and Age in Madrid
Sex and Age in Madrid
The most populous age groups in Madrid are 55 to 59 Years (115 | 64.2%) for men and 65 to 69 Years (59 | 54.6%) for women.
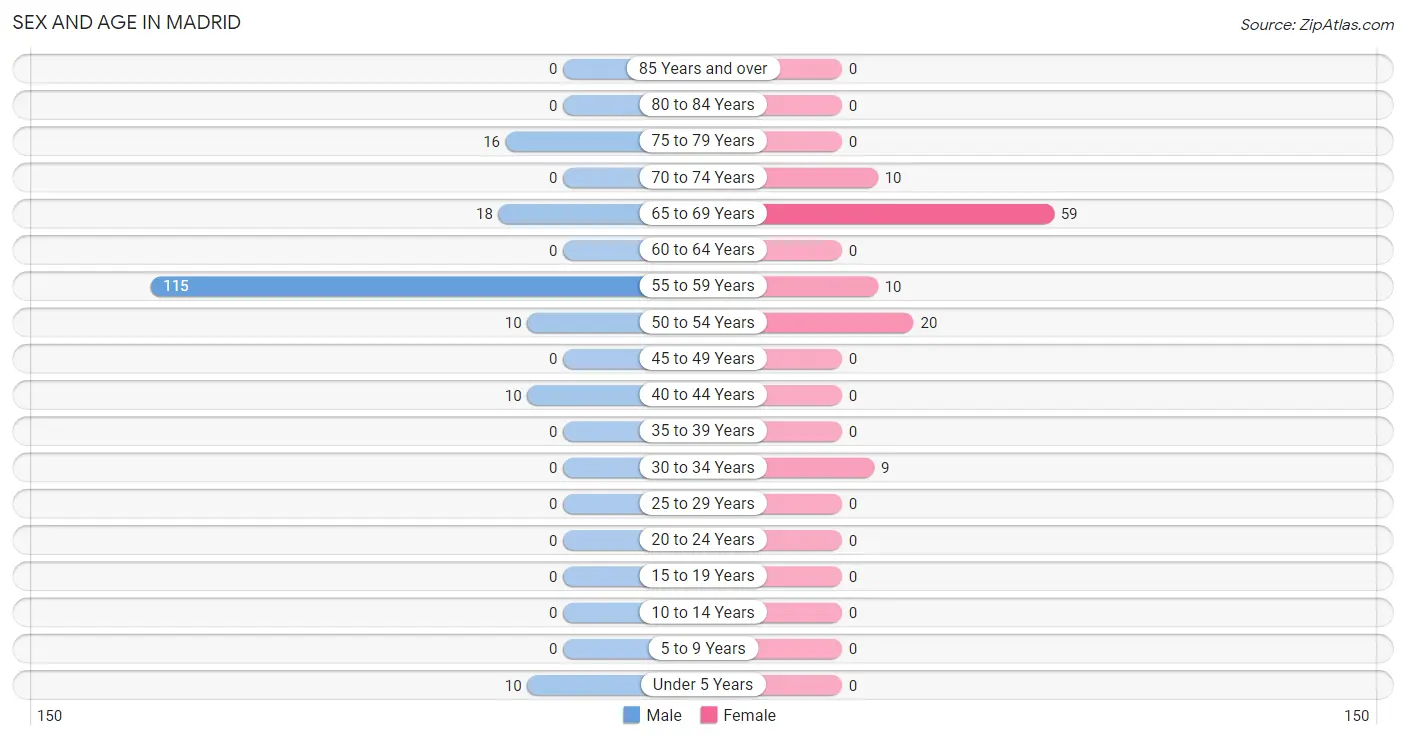
| Age Bracket | Male | Female |
| Under 5 Years | 10 (5.6%) | 0 (0.0%) |
| 5 to 9 Years | 0 (0.0%) | 0 (0.0%) |
| 10 to 14 Years | 0 (0.0%) | 0 (0.0%) |
| 15 to 19 Years | 0 (0.0%) | 0 (0.0%) |
| 20 to 24 Years | 0 (0.0%) | 0 (0.0%) |
| 25 to 29 Years | 0 (0.0%) | 0 (0.0%) |
| 30 to 34 Years | 0 (0.0%) | 9 (8.3%) |
| 35 to 39 Years | 0 (0.0%) | 0 (0.0%) |
| 40 to 44 Years | 10 (5.6%) | 0 (0.0%) |
| 45 to 49 Years | 0 (0.0%) | 0 (0.0%) |
| 50 to 54 Years | 10 (5.6%) | 20 (18.5%) |
| 55 to 59 Years | 115 (64.2%) | 10 (9.3%) |
| 60 to 64 Years | 0 (0.0%) | 0 (0.0%) |
| 65 to 69 Years | 18 (10.1%) | 59 (54.6%) |
| 70 to 74 Years | 0 (0.0%) | 10 (9.3%) |
| 75 to 79 Years | 16 (8.9%) | 0 (0.0%) |
| 80 to 84 Years | 0 (0.0%) | 0 (0.0%) |
| 85 Years and over | 0 (0.0%) | 0 (0.0%) |
| Total | 179 (100.0%) | 108 (100.0%) |
Families and Households in Madrid
Median Family Size in Madrid
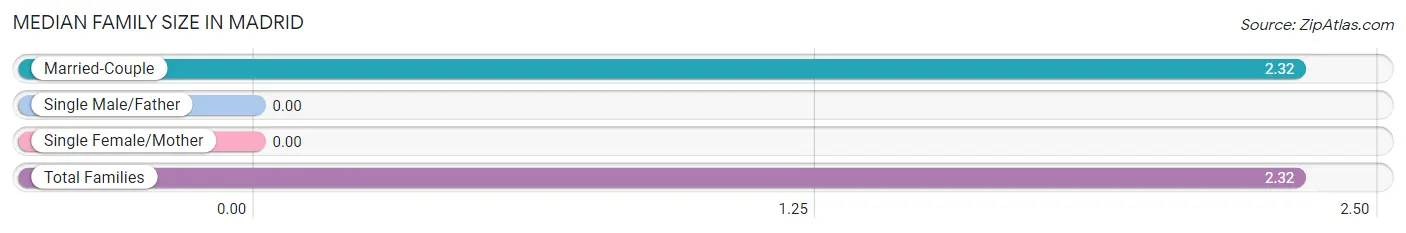
| Family Type | # Families | Family Size |
| Married-Couple | 37 (100.0%) | 2.32 |
| Single Male/Father | 0 (0.0%) | - |
| Single Female/Mother | 0 (0.0%) | - |
| Total Families | 37 (100.0%) | 2.32 |
Median Household Size in Madrid
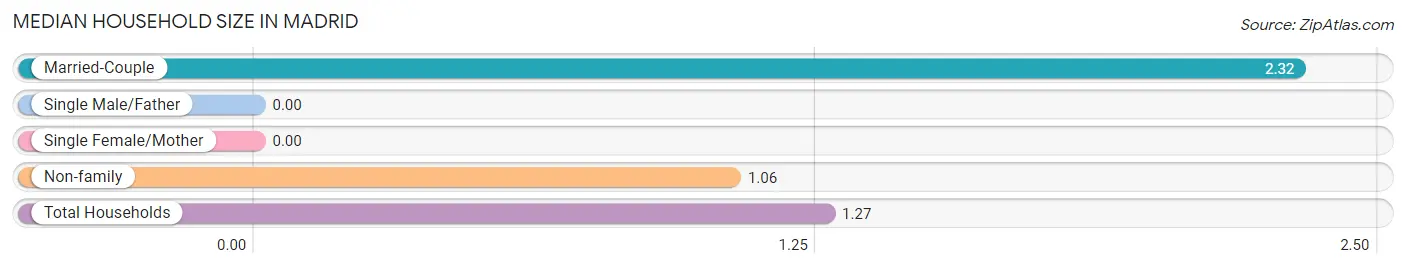
| Household Type | # Households | Household Size |
| Married-Couple | 37 (16.4%) | 2.32 |
| Single Male/Father | 0 (0.0%) | - |
| Single Female/Mother | 0 (0.0%) | - |
| Non-family | 189 (83.6%) | 1.06 |
| Total Households | 226 (100.0%) | 1.27 |
Household Size by Marriage Status in Madrid
Out of a total of 226 households in Madrid, 37 (16.4%) are family households, while 189 (83.6%) are nonfamily households. The most numerous type of family households are 2-person households, comprising 27, and the most common type of nonfamily households are 1-person households, comprising 179.
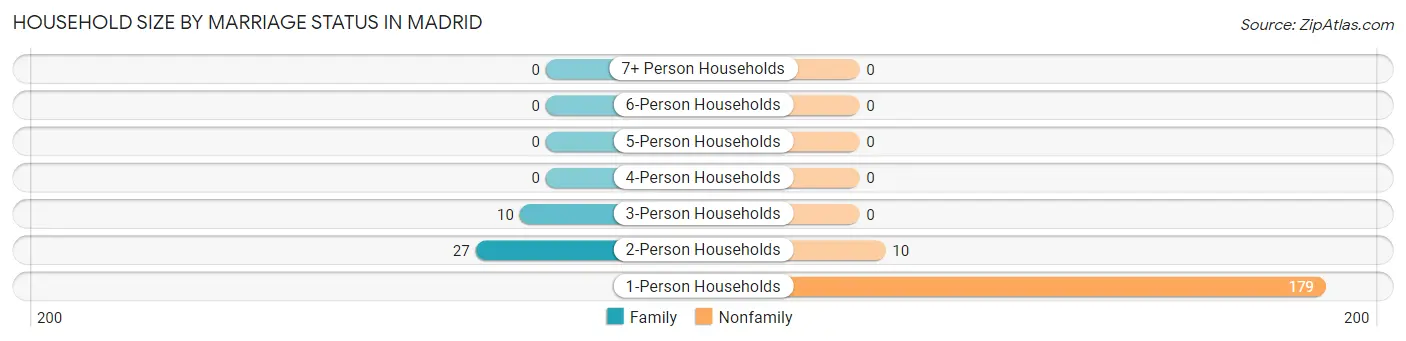
| Household Size | Family Households | Nonfamily Households |
| 1-Person Households | - | 179 (79.2%) |
| 2-Person Households | 27 (11.9%) | 10 (4.4%) |
| 3-Person Households | 10 (4.4%) | 0 (0.0%) |
| 4-Person Households | 0 (0.0%) | 0 (0.0%) |
| 5-Person Households | 0 (0.0%) | 0 (0.0%) |
| 6-Person Households | 0 (0.0%) | 0 (0.0%) |
| 7+ Person Households | 0 (0.0%) | 0 (0.0%) |
| Total | 37 (16.4%) | 189 (83.6%) |
Female Fertility in Madrid
Fertility by Age in Madrid
| Age Bracket | Women with Births | Births / 1,000 Women |
| 15 to 19 years | 0 (0.0%) | 0.0 |
| 20 to 34 years | 0 (0.0%) | 0.0 |
| 35 to 50 years | 0 (0.0%) | 0.0 |
| Total | 0 (0.0%) | 0.0 |
Fertility by Age by Marriage Status in Madrid
| Age Bracket | Married | Unmarried |
| 15 to 19 years | 0 (0.0%) | 0 (0.0%) |
| 20 to 34 years | 0 (0.0%) | 0 (0.0%) |
| 35 to 50 years | 0 (0.0%) | 0 (0.0%) |
| Total | 0 (0.0%) | 0 (0.0%) |
Fertility by Education in Madrid
| Educational Attainment | Women with Births | Births / 1,000 Women |
| Less than High School | 0 (0.0%) | 0.0 |
| High School Diploma | 0 (0.0%) | 0.0 |
| College or Associate's Degree | 0 (0.0%) | 0.0 |
| Bachelor's Degree | 0 (0.0%) | 0.0 |
| Graduate Degree | 0 (0.0%) | 0.0 |
| Total | 0 (0.0%) | 0.0 |
Fertility by Education by Marriage Status in Madrid
| Educational Attainment | Married | Unmarried |
| Less than High School | 0 (0.0%) | 0 (0.0%) |
| High School Diploma | 0 (0.0%) | 0 (0.0%) |
| College or Associate's Degree | 0 (0.0%) | 0 (0.0%) |
| Bachelor's Degree | 0 (0.0%) | 0 (0.0%) |
| Graduate Degree | 0 (0.0%) | 0 (0.0%) |
| Total | 0 (0.0%) | 0 (0.0%) |
Employment Characteristics in Madrid
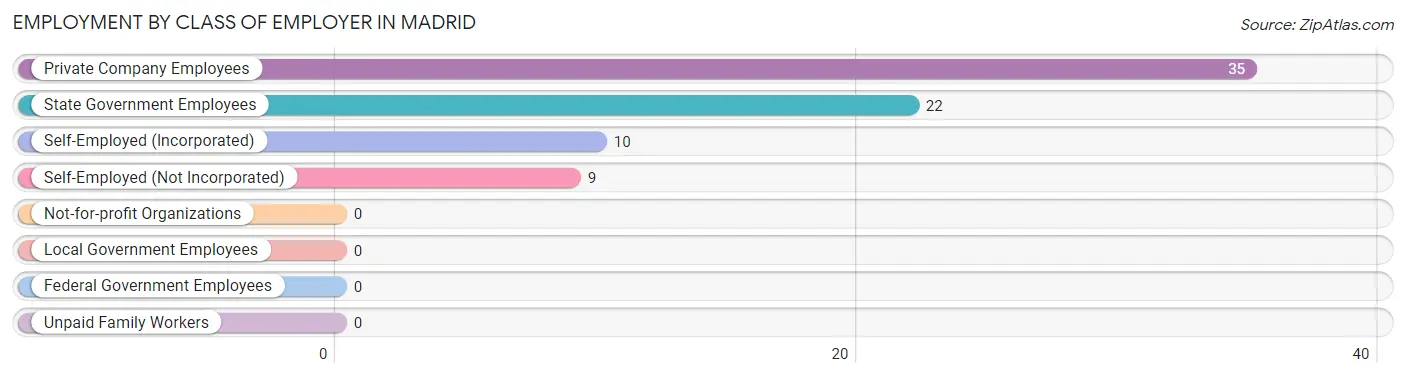
Employment by Class of Employer in Madrid
Among the 76 employed individuals in Madrid, private company employees (35 | 46.1%), state government employees (22 | 28.9%), and self-employed (incorporated) (10 | 13.2%) make up the most common classes of employment.
| Employer Class | # Employees | % Employees |
| Private Company Employees | 35 | 46.1% |
| Self-Employed (Incorporated) | 10 | 13.2% |
| Self-Employed (Not Incorporated) | 9 | 11.8% |
| Not-for-profit Organizations | 0 | 0.0% |
| Local Government Employees | 0 | 0.0% |
| State Government Employees | 22 | 28.9% |
| Federal Government Employees | 0 | 0.0% |
| Unpaid Family Workers | 0 | 0.0% |
| Total | 76 | 100.0% |
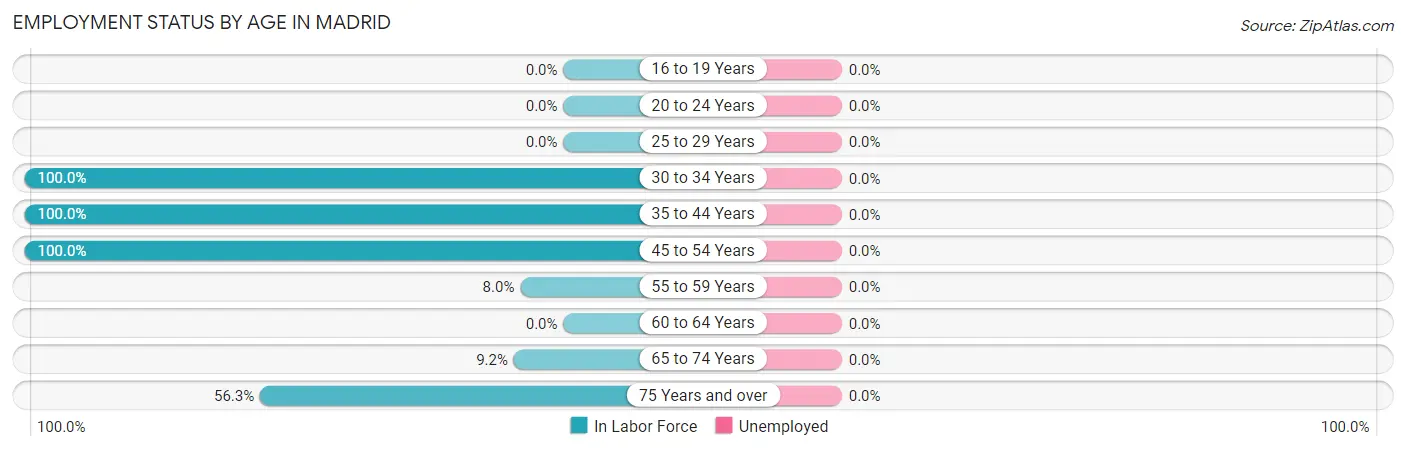
Employment Status by Age in Madrid
| Age Bracket | In Labor Force | Unemployed |
| 16 to 19 Years | 0 (0.0%) | 0 (0.0%) |
| 20 to 24 Years | 0 (0.0%) | 0 (0.0%) |
| 25 to 29 Years | 0 (0.0%) | 0 (0.0%) |
| 30 to 34 Years | 9 (100.0%) | 0 (0.0%) |
| 35 to 44 Years | 10 (100.0%) | 0 (0.0%) |
| 45 to 54 Years | 30 (100.0%) | 0 (0.0%) |
| 55 to 59 Years | 10 (8.0%) | 0 (0.0%) |
| 60 to 64 Years | 0 (0.0%) | 0 (0.0%) |
| 65 to 74 Years | 8 (9.2%) | 0 (0.0%) |
| 75 Years and over | 9 (56.3%) | 0 (0.0%) |
| Total | 76 (27.4%) | 0 (0.0%) |
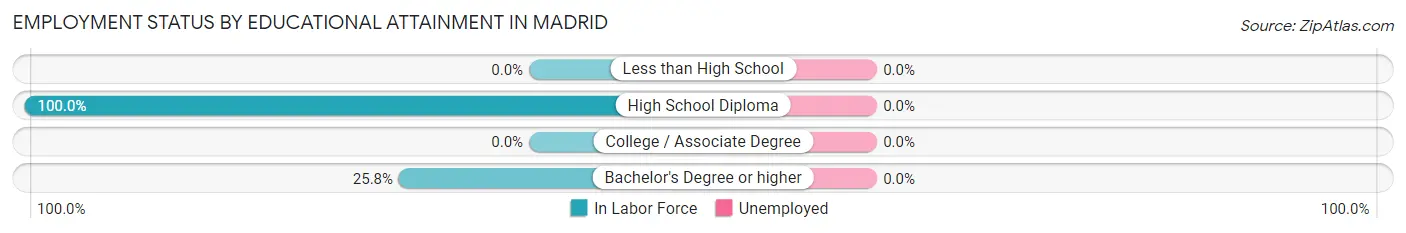
Employment Status by Educational Attainment in Madrid
| Educational Attainment | In Labor Force | Unemployed |
| Less than High School | 0 (0.0%) | 0 (0.0%) |
| High School Diploma | 19 (100.0%) | 0 (0.0%) |
| College / Associate Degree | 0 (0.0%) | 0 (0.0%) |
| Bachelor's Degree or higher | 40 (25.8%) | 0 (0.0%) |
| Total | 59 (33.9%) | 0 (0.0%) |
Employment Occupations by Sex in Madrid
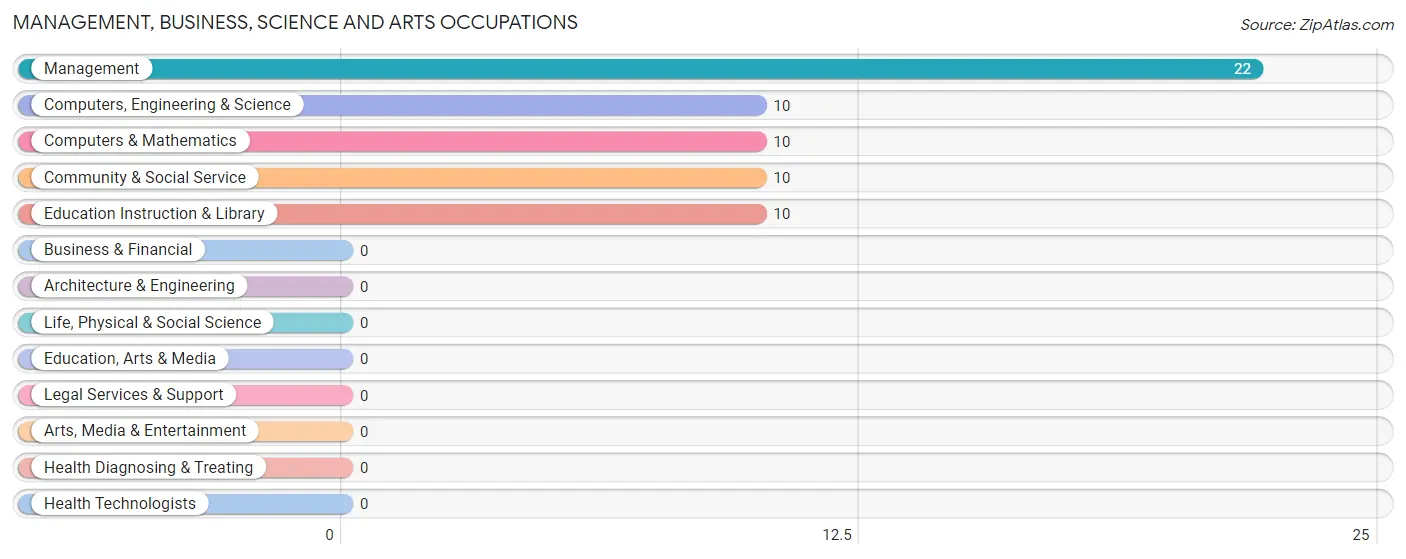
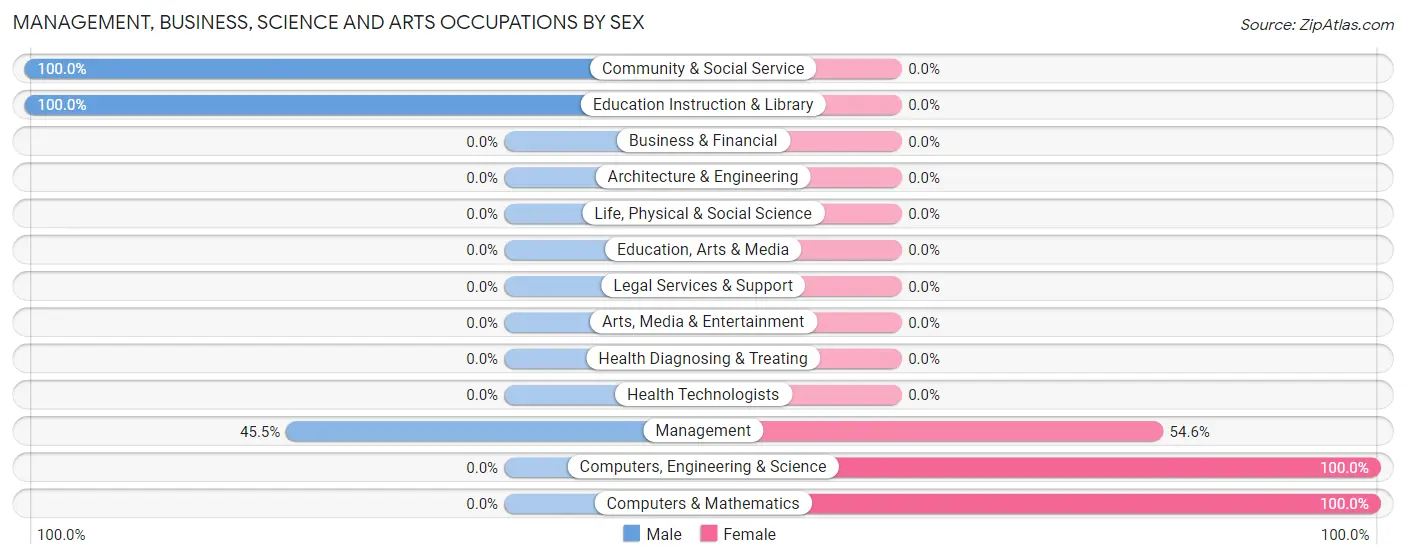
Management, Business, Science and Arts Occupations
The most common Management, Business, Science and Arts occupations in Madrid are Management (22 | 28.9%), Computers, Engineering & Science (10 | 13.2%), Computers & Mathematics (10 | 13.2%), Community & Social Service (10 | 13.2%), and Education Instruction & Library (10 | 13.2%).
Management, Business, Science and Arts Occupations by Sex
Within the Management, Business, Science and Arts occupations in Madrid, the most male-oriented occupations are Community & Social Service (100.0%), Education Instruction & Library (100.0%), and Management (45.5%), while the most female-oriented occupations are Computers, Engineering & Science (100.0%), Computers & Mathematics (100.0%), and Management (54.5%).
| Occupation | Male | Female |
| Management | 10 (45.5%) | 12 (54.5%) |
| Business & Financial | 0 (0.0%) | 0 (0.0%) |
| Computers, Engineering & Science | 0 (0.0%) | 10 (100.0%) |
| Computers & Mathematics | 0 (0.0%) | 10 (100.0%) |
| Architecture & Engineering | 0 (0.0%) | 0 (0.0%) |
| Life, Physical & Social Science | 0 (0.0%) | 0 (0.0%) |
| Community & Social Service | 10 (100.0%) | 0 (0.0%) |
| Education, Arts & Media | 0 (0.0%) | 0 (0.0%) |
| Legal Services & Support | 0 (0.0%) | 0 (0.0%) |
| Education Instruction & Library | 10 (100.0%) | 0 (0.0%) |
| Arts, Media & Entertainment | 0 (0.0%) | 0 (0.0%) |
| Health Diagnosing & Treating | 0 (0.0%) | 0 (0.0%) |
| Health Technologists | 0 (0.0%) | 0 (0.0%) |
| Total (Category) | 20 (47.6%) | 22 (52.4%) |
| Total (Overall) | 37 (48.7%) | 39 (51.3%) |
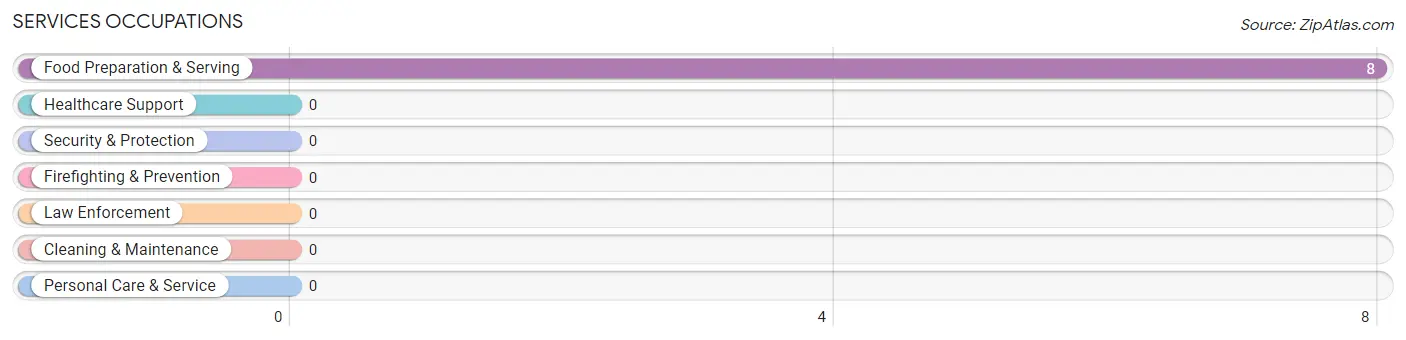
Services Occupations
The most common Services occupations in Madrid are , and Food Preparation & Serving (8 | 10.5%).
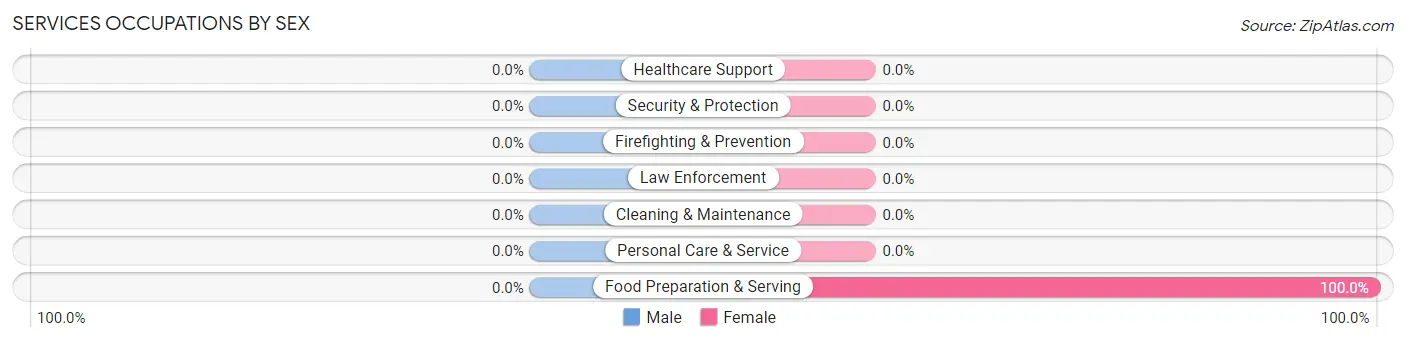
Services Occupations by Sex
| Occupation | Male | Female |
| Healthcare Support | 0 (0.0%) | 0 (0.0%) |
| Security & Protection | 0 (0.0%) | 0 (0.0%) |
| Firefighting & Prevention | 0 (0.0%) | 0 (0.0%) |
| Law Enforcement | 0 (0.0%) | 0 (0.0%) |
| Food Preparation & Serving | 0 (0.0%) | 8 (100.0%) |
| Cleaning & Maintenance | 0 (0.0%) | 0 (0.0%) |
| Personal Care & Service | 0 (0.0%) | 0 (0.0%) |
| Total (Category) | 0 (0.0%) | 8 (100.0%) |
| Total (Overall) | 37 (48.7%) | 39 (51.3%) |
Sales and Office Occupations
The most common Sales and Office occupations in Madrid are , and Sales & Related (17 | 22.4%).

Sales and Office Occupations by Sex

| Occupation | Male | Female |
| Sales & Related | 8 (47.1%) | 9 (52.9%) |
| Office & Administration | 0 (0.0%) | 0 (0.0%) |
| Total (Category) | 8 (47.1%) | 9 (52.9%) |
| Total (Overall) | 37 (48.7%) | 39 (51.3%) |
Natural Resources, Construction and Maintenance Occupations
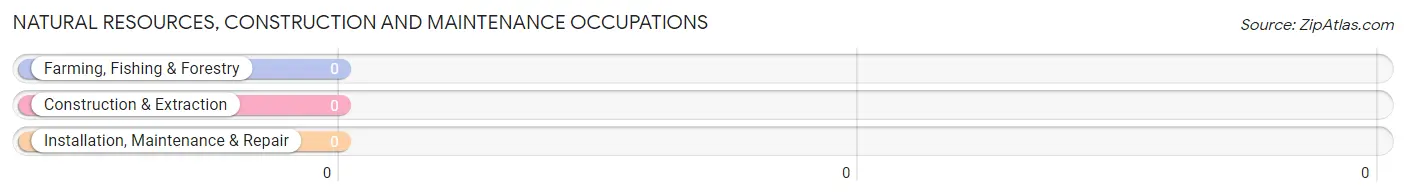
Natural Resources, Construction and Maintenance Occupations by Sex
| Occupation | Male | Female |
| Farming, Fishing & Forestry | 0 (0.0%) | 0 (0.0%) |
| Construction & Extraction | 0 (0.0%) | 0 (0.0%) |
| Installation, Maintenance & Repair | 0 (0.0%) | 0 (0.0%) |
| Total (Category) | 0 (0.0%) | 0 (0.0%) |
| Total (Overall) | 37 (48.7%) | 39 (51.3%) |
Production, Transportation and Moving Occupations
The most common Production, Transportation and Moving occupations in Madrid are , and Production (9 | 11.8%).
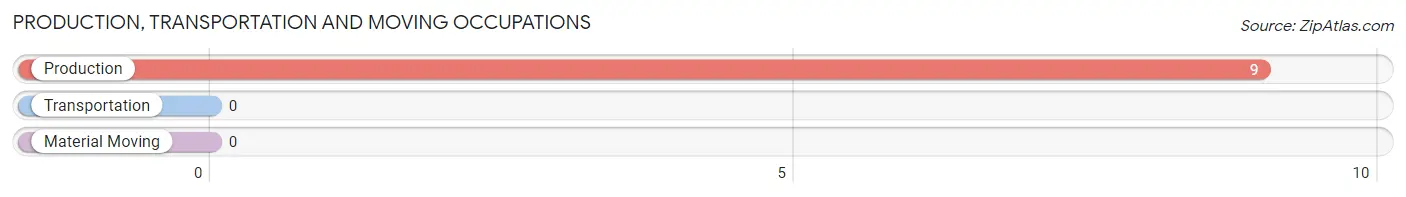
Production, Transportation and Moving Occupations by Sex
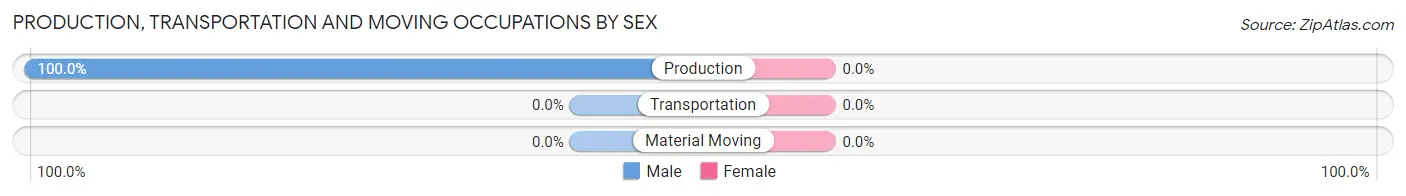
| Occupation | Male | Female |
| Production | 9 (100.0%) | 0 (0.0%) |
| Transportation | 0 (0.0%) | 0 (0.0%) |
| Material Moving | 0 (0.0%) | 0 (0.0%) |
| Total (Category) | 9 (100.0%) | 0 (0.0%) |
| Total (Overall) | 37 (48.7%) | 39 (51.3%) |
Employment Industries by Sex in Madrid
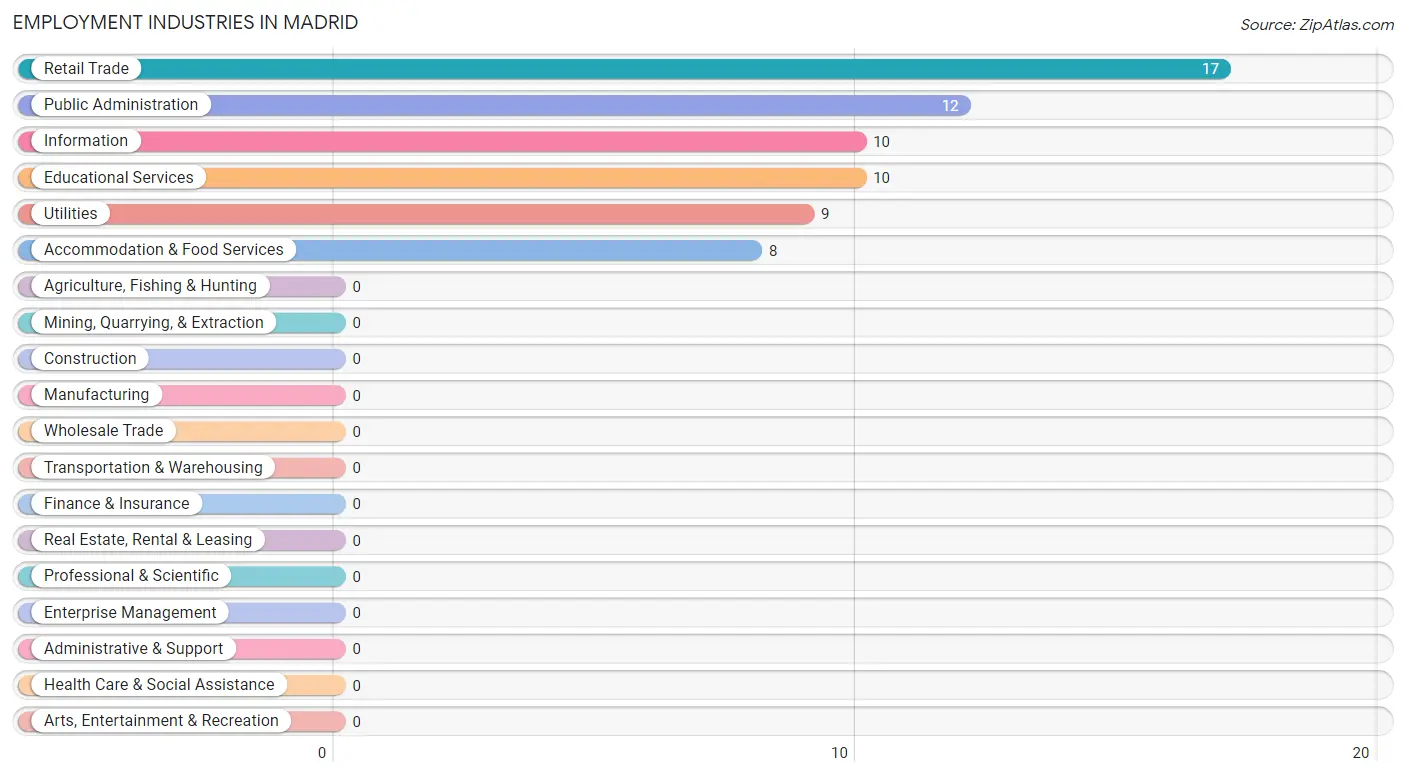
Employment Industries in Madrid
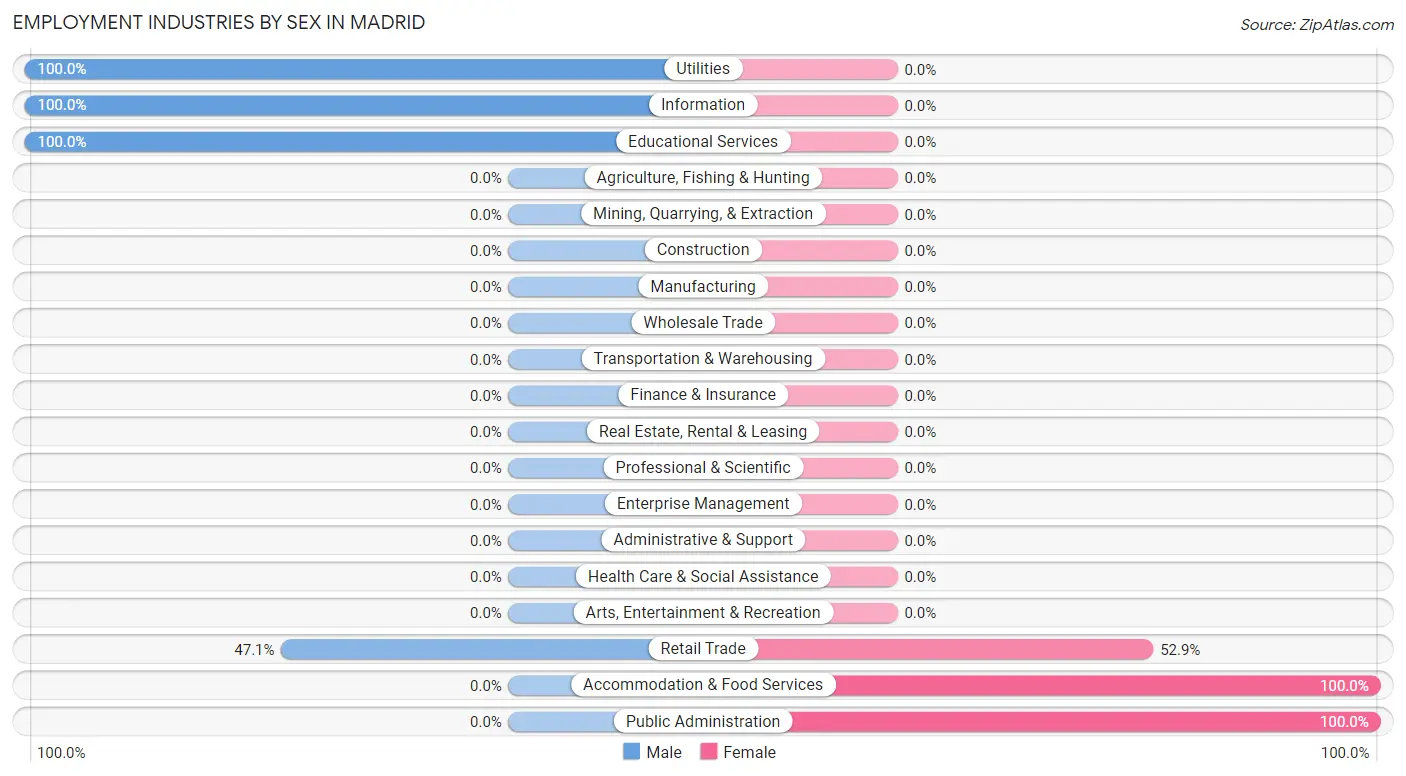
The major employment industries in Madrid include Retail Trade (17 | 22.4%), Public Administration (12 | 15.8%), Information (10 | 13.2%), Educational Services (10 | 13.2%), and Utilities (9 | 11.8%).
Employment Industries by Sex in Madrid
The Madrid industries that see more men than women are Utilities (100.0%), Information (100.0%), and Educational Services (100.0%), whereas the industries that tend to have a higher number of women are Accommodation & Food Services (100.0%), Public Administration (100.0%), and Retail Trade (52.9%).
| Industry | Male | Female |
| Agriculture, Fishing & Hunting | 0 (0.0%) | 0 (0.0%) |
| Mining, Quarrying, & Extraction | 0 (0.0%) | 0 (0.0%) |
| Construction | 0 (0.0%) | 0 (0.0%) |
| Manufacturing | 0 (0.0%) | 0 (0.0%) |
| Wholesale Trade | 0 (0.0%) | 0 (0.0%) |
| Retail Trade | 8 (47.1%) | 9 (52.9%) |
| Transportation & Warehousing | 0 (0.0%) | 0 (0.0%) |
| Utilities | 9 (100.0%) | 0 (0.0%) |
| Information | 10 (100.0%) | 0 (0.0%) |
| Finance & Insurance | 0 (0.0%) | 0 (0.0%) |
| Real Estate, Rental & Leasing | 0 (0.0%) | 0 (0.0%) |
| Professional & Scientific | 0 (0.0%) | 0 (0.0%) |
| Enterprise Management | 0 (0.0%) | 0 (0.0%) |
| Administrative & Support | 0 (0.0%) | 0 (0.0%) |
| Educational Services | 10 (100.0%) | 0 (0.0%) |
| Health Care & Social Assistance | 0 (0.0%) | 0 (0.0%) |
| Arts, Entertainment & Recreation | 0 (0.0%) | 0 (0.0%) |
| Accommodation & Food Services | 0 (0.0%) | 8 (100.0%) |
| Public Administration | 0 (0.0%) | 12 (100.0%) |
| Total | 37 (48.7%) | 39 (51.3%) |
Education in Madrid
School Enrollment in Madrid
| School Level | # Students | % Students |
| Nursery / Preschool | 0 | 0.0% |
| Kindergarten | 0 | 0.0% |
| Elementary School | 0 | 0.0% |
| Middle School | 0 | 0.0% |
| High School | 0 | 0.0% |
| College / Undergraduate | 0 | 0.0% |
| Graduate / Professional | 0 | 0.0% |
| Total | 0 | 0.0% |
School Enrollment by Age by Funding Source in Madrid
| Age Bracket | Public School | Private School |
| 3 to 4 Year Olds | 0 (0.0%) | 0 (0.0%) |
| 5 to 9 Year Old | 0 (0.0%) | 0 (0.0%) |
| 10 to 14 Year Olds | 0 (0.0%) | 0 (0.0%) |
| 15 to 17 Year Olds | 0 (0.0%) | 0 (0.0%) |
| 18 to 19 Year Olds | 0 (0.0%) | 0 (0.0%) |
| 20 to 24 Year Olds | 0 (0.0%) | 0 (0.0%) |
| 25 to 34 Year Olds | 0 (0.0%) | 0 (0.0%) |
| 35 Years and over | 0 (0.0%) | 0 (0.0%) |
| Total | 0 (0.0%) | 0 (0.0%) |
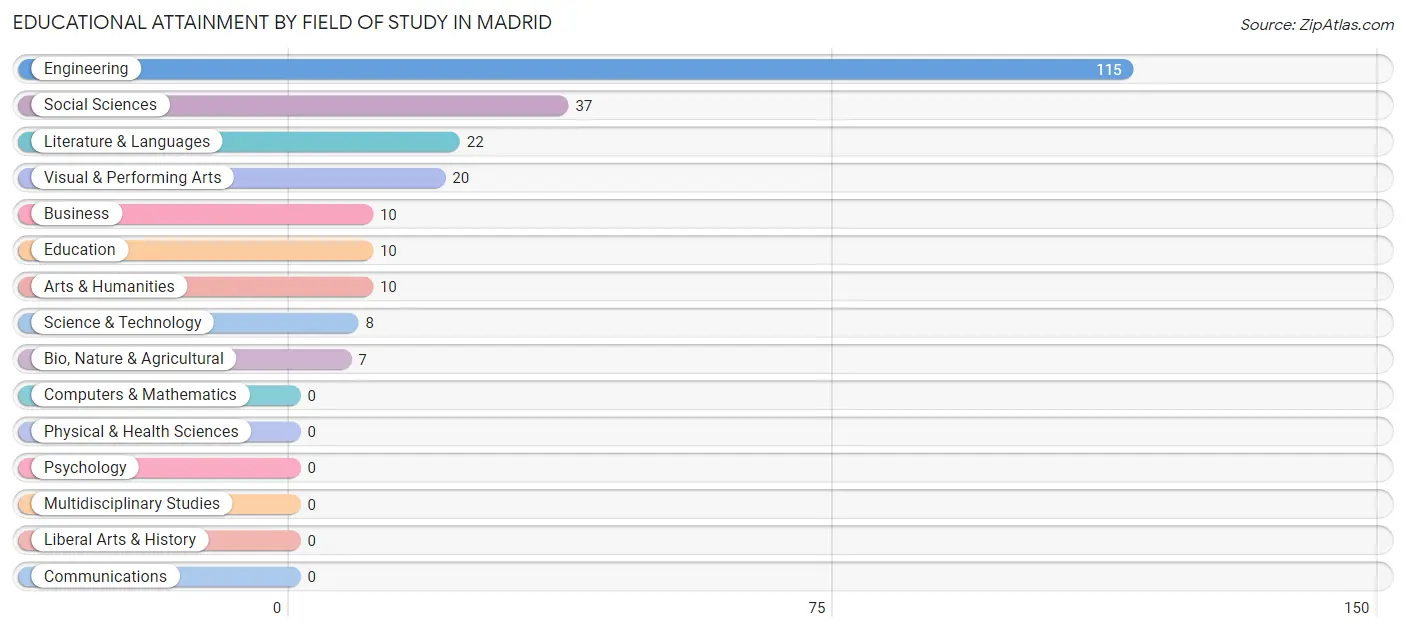
Educational Attainment by Field of Study in Madrid
Engineering (115 | 48.1%), social sciences (37 | 15.5%), literature & languages (22 | 9.2%), visual & performing arts (20 | 8.4%), and business (10 | 4.2%) are the most common fields of study among 239 individuals in Madrid who have obtained a bachelor's degree or higher.
| Field of Study | # Graduates | % Graduates |
| Computers & Mathematics | 0 | 0.0% |
| Bio, Nature & Agricultural | 7 | 2.9% |
| Physical & Health Sciences | 0 | 0.0% |
| Psychology | 0 | 0.0% |
| Social Sciences | 37 | 15.5% |
| Engineering | 115 | 48.1% |
| Multidisciplinary Studies | 0 | 0.0% |
| Science & Technology | 8 | 3.4% |
| Business | 10 | 4.2% |
| Education | 10 | 4.2% |
| Literature & Languages | 22 | 9.2% |
| Liberal Arts & History | 0 | 0.0% |
| Visual & Performing Arts | 20 | 8.4% |
| Communications | 0 | 0.0% |
| Arts & Humanities | 10 | 4.2% |
| Total | 239 | 100.0% |
Transportation & Commute in Madrid
Vehicle Availability by Sex in Madrid
The most prevalent vehicle ownership categories in Madrid are males with 2 vehicles (10, accounting for 27.0%) and females with 2 vehicles (9, making up 25.6%).
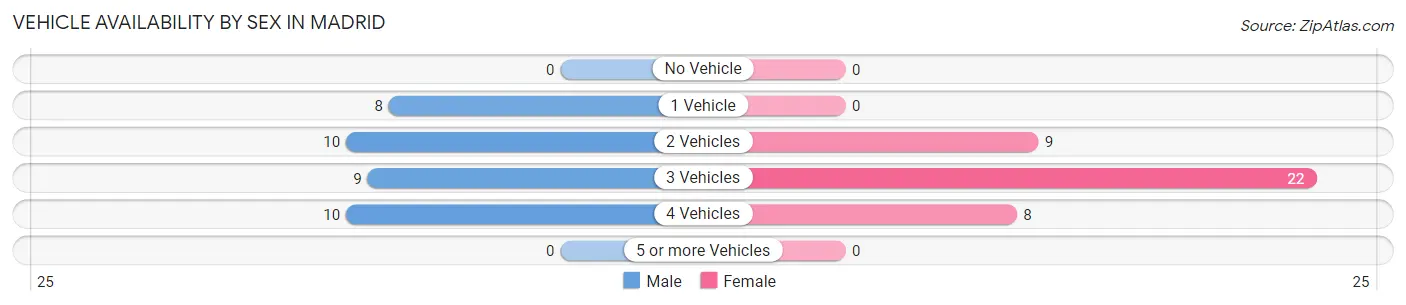
| Vehicles Available | Male | Female |
| No Vehicle | 0 (0.0%) | 0 (0.0%) |
| 1 Vehicle | 8 (21.6%) | 0 (0.0%) |
| 2 Vehicles | 10 (27.0%) | 9 (23.1%) |
| 3 Vehicles | 9 (24.3%) | 22 (56.4%) |
| 4 Vehicles | 10 (27.0%) | 8 (20.5%) |
| 5 or more Vehicles | 0 (0.0%) | 0 (0.0%) |
| Total | 37 (100.0%) | 39 (100.0%) |
Commute Time in Madrid
The most frequently occuring commute durations in Madrid are 10 to 14 minutes (22 commuters, 28.9%), 30 to 34 minutes (19 commuters, 25.0%), and less than 5 minutes (18 commuters, 23.7%).
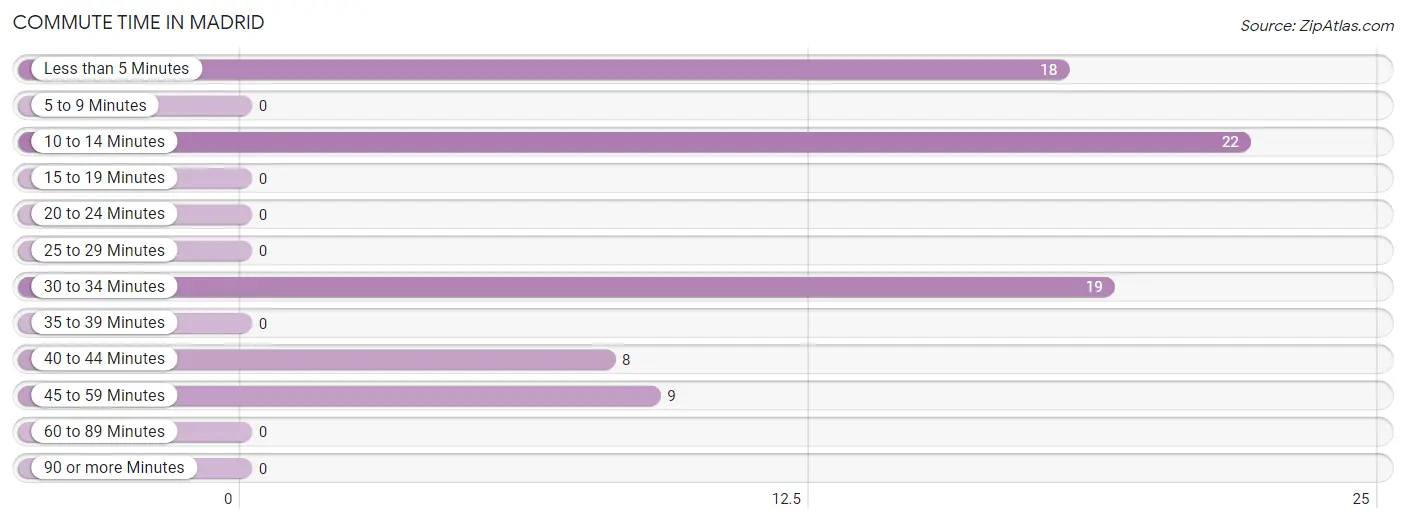
| Commute Time | # Commuters | % Commuters |
| Less than 5 Minutes | 18 | 23.7% |
| 5 to 9 Minutes | 0 | 0.0% |
| 10 to 14 Minutes | 22 | 28.9% |
| 15 to 19 Minutes | 0 | 0.0% |
| 20 to 24 Minutes | 0 | 0.0% |
| 25 to 29 Minutes | 0 | 0.0% |
| 30 to 34 Minutes | 19 | 25.0% |
| 35 to 39 Minutes | 0 | 0.0% |
| 40 to 44 Minutes | 8 | 10.5% |
| 45 to 59 Minutes | 9 | 11.8% |
| 60 to 89 Minutes | 0 | 0.0% |
| 90 or more Minutes | 0 | 0.0% |
Commute Time by Sex in Madrid
The most common commute times in Madrid are less than 5 minutes (10 commuters, 27.0%) for males and 10 to 14 minutes (22 commuters, 56.4%) for females.
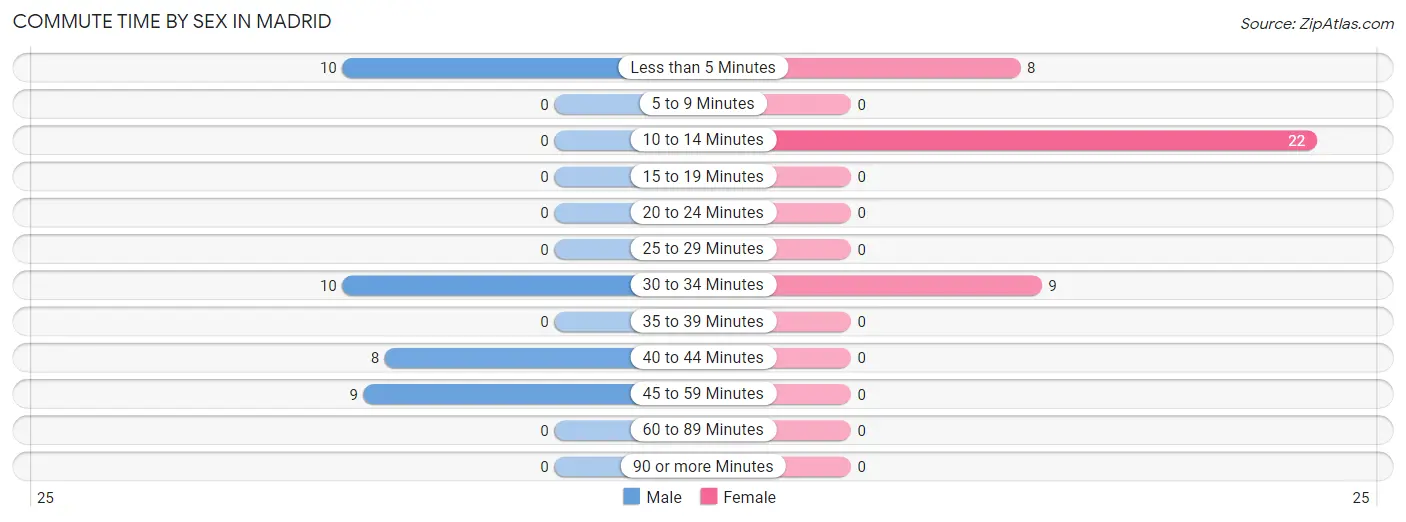
| Commute Time | Male | Female |
| Less than 5 Minutes | 10 (27.0%) | 8 (20.5%) |
| 5 to 9 Minutes | 0 (0.0%) | 0 (0.0%) |
| 10 to 14 Minutes | 0 (0.0%) | 22 (56.4%) |
| 15 to 19 Minutes | 0 (0.0%) | 0 (0.0%) |
| 20 to 24 Minutes | 0 (0.0%) | 0 (0.0%) |
| 25 to 29 Minutes | 0 (0.0%) | 0 (0.0%) |
| 30 to 34 Minutes | 10 (27.0%) | 9 (23.1%) |
| 35 to 39 Minutes | 0 (0.0%) | 0 (0.0%) |
| 40 to 44 Minutes | 8 (21.6%) | 0 (0.0%) |
| 45 to 59 Minutes | 9 (24.3%) | 0 (0.0%) |
| 60 to 89 Minutes | 0 (0.0%) | 0 (0.0%) |
| 90 or more Minutes | 0 (0.0%) | 0 (0.0%) |
Time of Departure to Work by Sex in Madrid
The most frequent times of departure to work in Madrid are 8:00 AM to 8:29 AM (20, 54.0%) for males and 12:00 PM to 3:59 PM (22, 56.4%) for females.
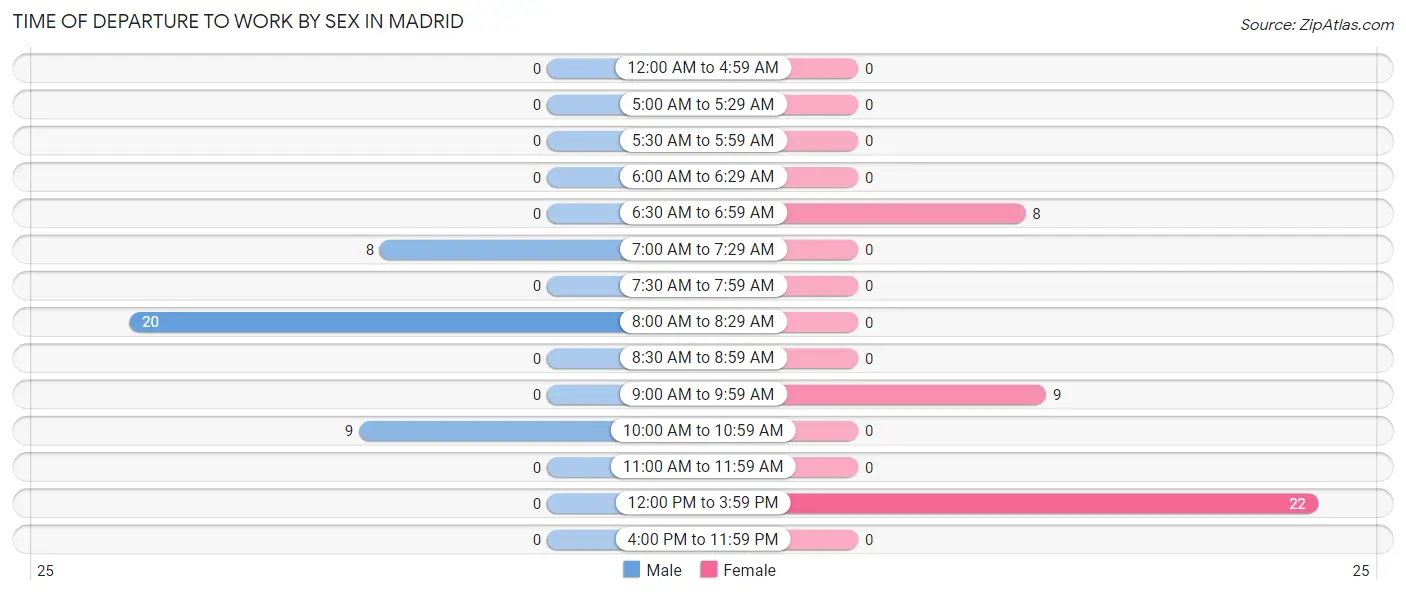
| Time of Departure | Male | Female |
| 12:00 AM to 4:59 AM | 0 (0.0%) | 0 (0.0%) |
| 5:00 AM to 5:29 AM | 0 (0.0%) | 0 (0.0%) |
| 5:30 AM to 5:59 AM | 0 (0.0%) | 0 (0.0%) |
| 6:00 AM to 6:29 AM | 0 (0.0%) | 0 (0.0%) |
| 6:30 AM to 6:59 AM | 0 (0.0%) | 8 (20.5%) |
| 7:00 AM to 7:29 AM | 8 (21.6%) | 0 (0.0%) |
| 7:30 AM to 7:59 AM | 0 (0.0%) | 0 (0.0%) |
| 8:00 AM to 8:29 AM | 20 (54.0%) | 0 (0.0%) |
| 8:30 AM to 8:59 AM | 0 (0.0%) | 0 (0.0%) |
| 9:00 AM to 9:59 AM | 0 (0.0%) | 9 (23.1%) |
| 10:00 AM to 10:59 AM | 9 (24.3%) | 0 (0.0%) |
| 11:00 AM to 11:59 AM | 0 (0.0%) | 0 (0.0%) |
| 12:00 PM to 3:59 PM | 0 (0.0%) | 22 (56.4%) |
| 4:00 PM to 11:59 PM | 0 (0.0%) | 0 (0.0%) |
| Total | 37 (100.0%) | 39 (100.0%) |
Housing Occupancy in Madrid
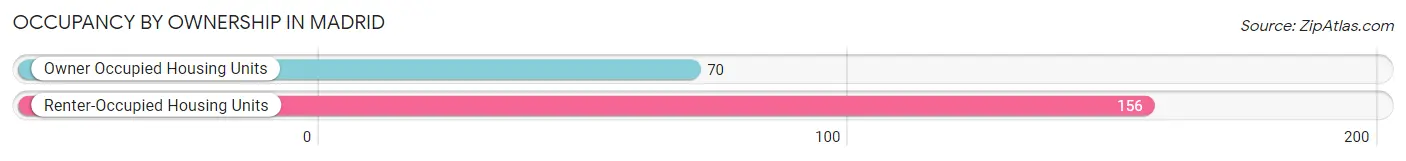
Occupancy by Ownership in Madrid
Of the total 226 dwellings in Madrid, owner-occupied units account for 70 (31.0%), while renter-occupied units make up 156 (69.0%).
| Occupancy | # Housing Units | % Housing Units |
| Owner Occupied Housing Units | 70 | 31.0% |
| Renter-Occupied Housing Units | 156 | 69.0% |
| Total Occupied Housing Units | 226 | 100.0% |
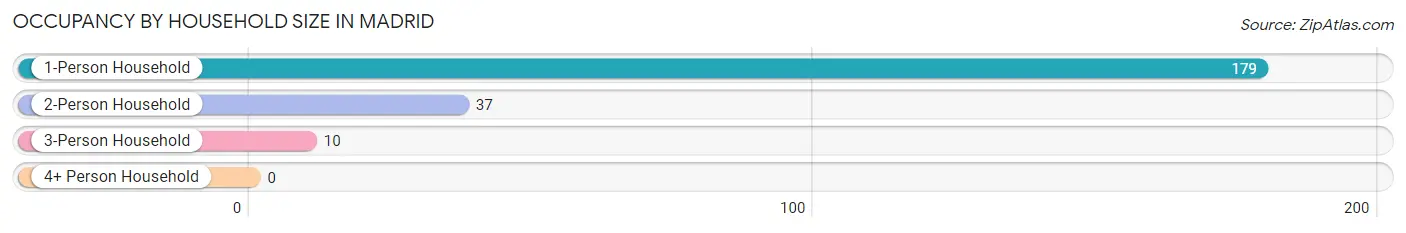
Occupancy by Household Size in Madrid
| Household Size | # Housing Units | % Housing Units |
| 1-Person Household | 179 | 79.2% |
| 2-Person Household | 37 | 16.4% |
| 3-Person Household | 10 | 4.4% |
| 4+ Person Household | 0 | 0.0% |
| Total Housing Units | 226 | 100.0% |
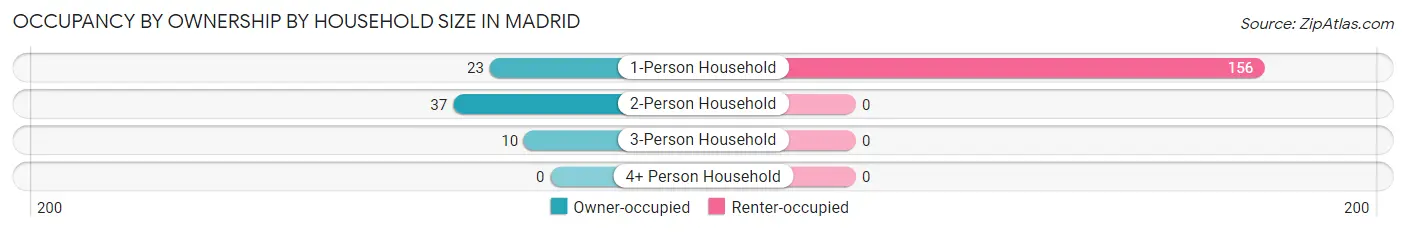
Occupancy by Ownership by Household Size in Madrid
| Household Size | Owner-occupied | Renter-occupied |
| 1-Person Household | 23 (12.9%) | 156 (87.2%) |
| 2-Person Household | 37 (100.0%) | 0 (0.0%) |
| 3-Person Household | 10 (100.0%) | 0 (0.0%) |
| 4+ Person Household | 0 (0.0%) | 0 (0.0%) |
| Total Housing Units | 70 (31.0%) | 156 (69.0%) |
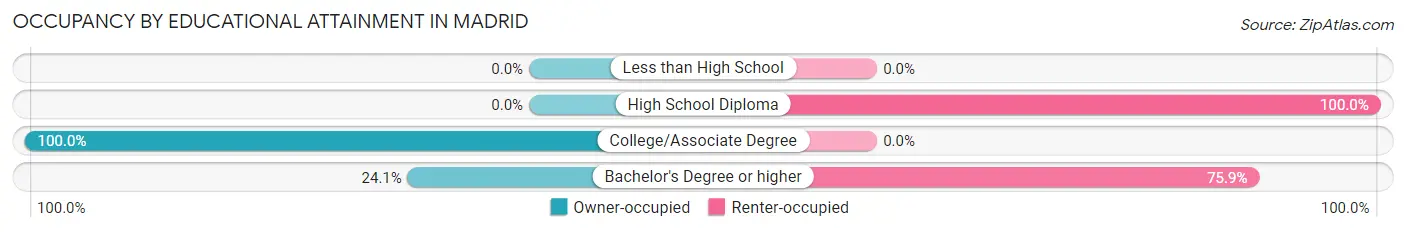
Occupancy by Educational Attainment in Madrid
| Household Size | Owner-occupied | Renter-occupied |
| Less than High School | 0 (0.0%) | 0 (0.0%) |
| High School Diploma | 0 (0.0%) | 14 (100.0%) |
| College/Associate Degree | 25 (100.0%) | 0 (0.0%) |
| Bachelor's Degree or higher | 45 (24.1%) | 142 (75.9%) |
Occupancy by Age of Householder in Madrid
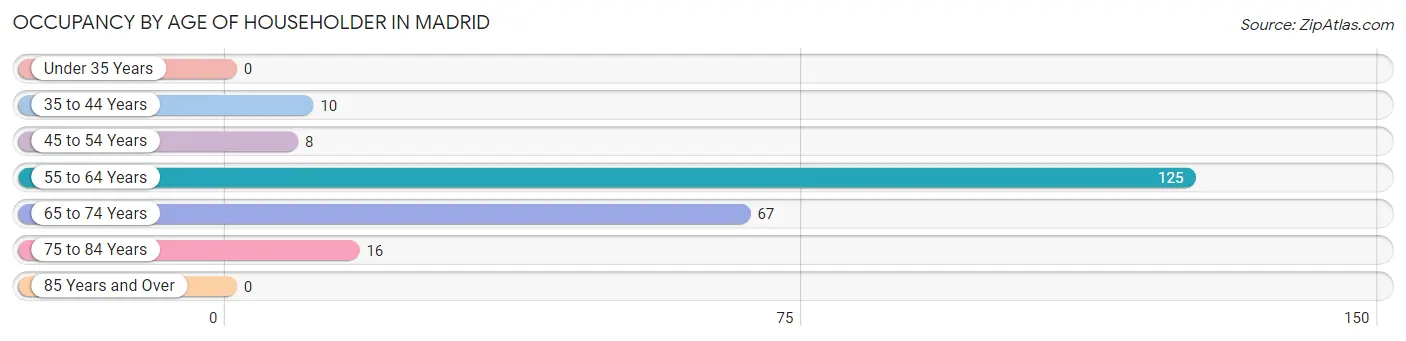
| Age Bracket | # Households | % Households |
| Under 35 Years | 0 | 0.0% |
| 35 to 44 Years | 10 | 4.4% |
| 45 to 54 Years | 8 | 3.5% |
| 55 to 64 Years | 125 | 55.3% |
| 65 to 74 Years | 67 | 29.6% |
| 75 to 84 Years | 16 | 7.1% |
| 85 Years and Over | 0 | 0.0% |
| Total | 226 | 100.0% |
Housing Finances in Madrid
Median Income by Occupancy in Madrid
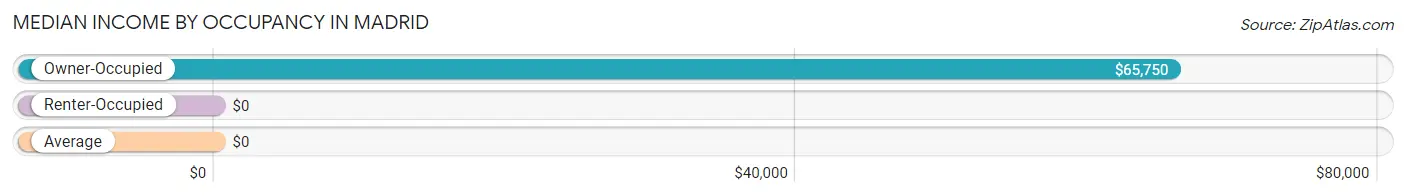
| Occupancy Type | # Households | Median Income |
| Owner-Occupied | 70 (31.0%) | $65,750 |
| Renter-Occupied | 156 (69.0%) | $0 |
| Average | 226 (100.0%) | $0 |
Occupancy by Householder Income Bracket in Madrid
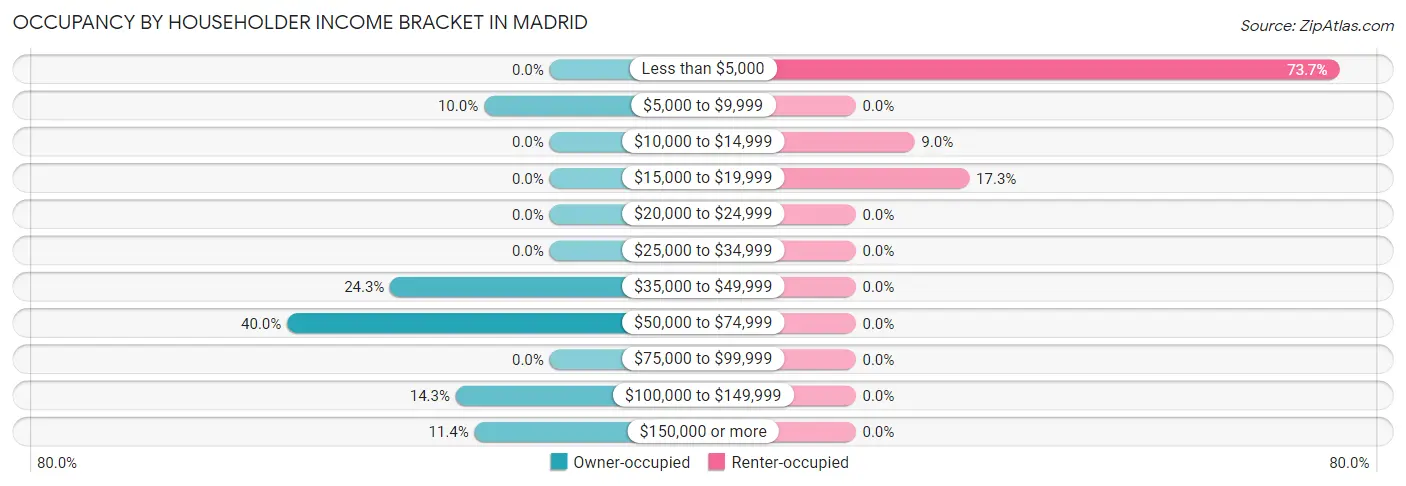
| Income Bracket | Owner-occupied | Renter-occupied |
| Less than $5,000 | 0 (0.0%) | 115 (73.7%) |
| $5,000 to $9,999 | 7 (10.0%) | 0 (0.0%) |
| $10,000 to $14,999 | 0 (0.0%) | 14 (9.0%) |
| $15,000 to $19,999 | 0 (0.0%) | 27 (17.3%) |
| $20,000 to $24,999 | 0 (0.0%) | 0 (0.0%) |
| $25,000 to $34,999 | 0 (0.0%) | 0 (0.0%) |
| $35,000 to $49,999 | 17 (24.3%) | 0 (0.0%) |
| $50,000 to $74,999 | 28 (40.0%) | 0 (0.0%) |
| $75,000 to $99,999 | 0 (0.0%) | 0 (0.0%) |
| $100,000 to $149,999 | 10 (14.3%) | 0 (0.0%) |
| $150,000 or more | 8 (11.4%) | 0 (0.0%) |
| Total | 70 (100.0%) | 156 (100.0%) |
Monthly Housing Cost Tiers in Madrid
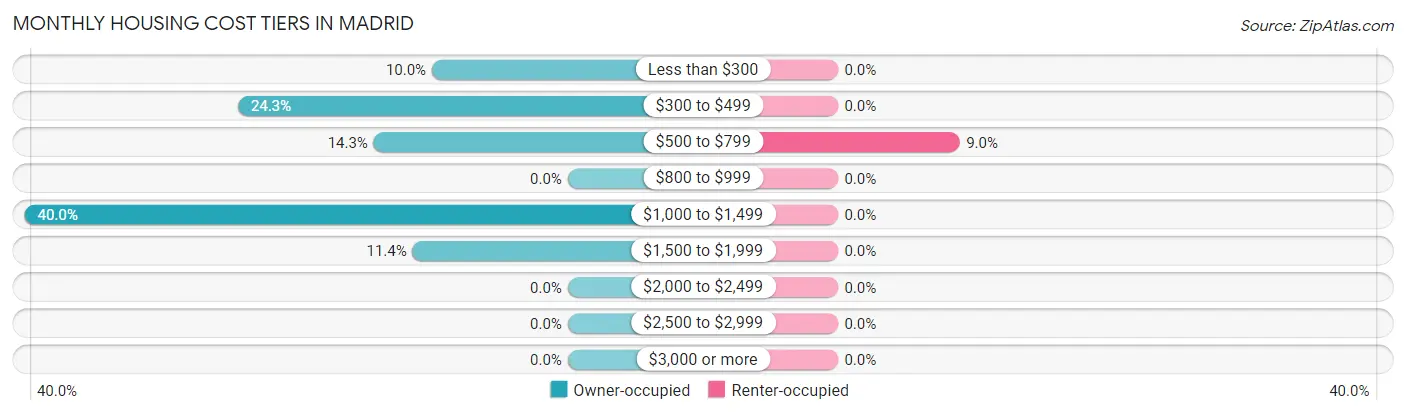
| Monthly Cost | Owner-occupied | Renter-occupied |
| Less than $300 | 7 (10.0%) | 0 (0.0%) |
| $300 to $499 | 17 (24.3%) | 0 (0.0%) |
| $500 to $799 | 10 (14.3%) | 14 (9.0%) |
| $800 to $999 | 0 (0.0%) | 0 (0.0%) |
| $1,000 to $1,499 | 28 (40.0%) | 0 (0.0%) |
| $1,500 to $1,999 | 8 (11.4%) | 0 (0.0%) |
| $2,000 to $2,499 | 0 (0.0%) | 0 (0.0%) |
| $2,500 to $2,999 | 0 (0.0%) | 0 (0.0%) |
| $3,000 or more | 0 (0.0%) | 0 (0.0%) |
| Total | 70 (100.0%) | 156 (100.0%) |
Physical Housing Characteristics in Madrid
Housing Structures in Madrid
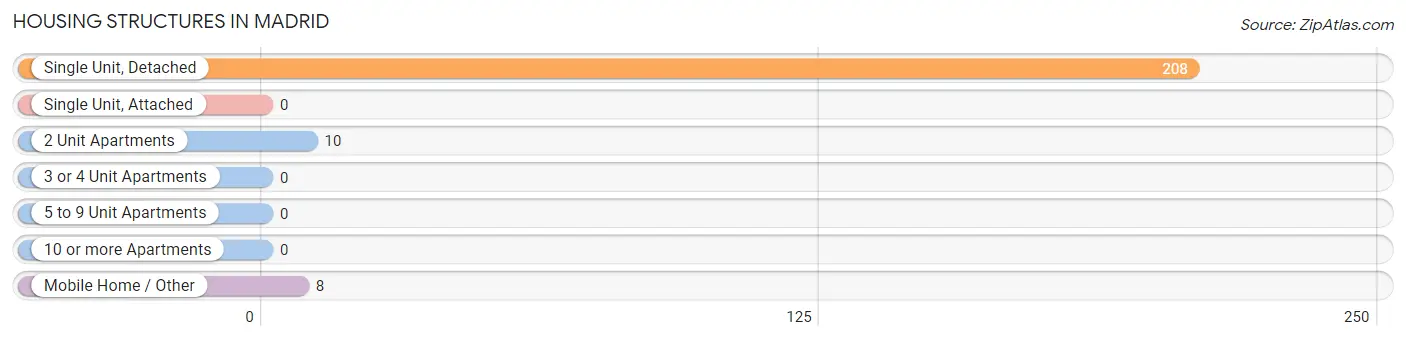
| Structure Type | # Housing Units | % Housing Units |
| Single Unit, Detached | 208 | 92.0% |
| Single Unit, Attached | 0 | 0.0% |
| 2 Unit Apartments | 10 | 4.4% |
| 3 or 4 Unit Apartments | 0 | 0.0% |
| 5 to 9 Unit Apartments | 0 | 0.0% |
| 10 or more Apartments | 0 | 0.0% |
| Mobile Home / Other | 8 | 3.5% |
| Total | 226 | 100.0% |
Housing Structures by Occupancy in Madrid
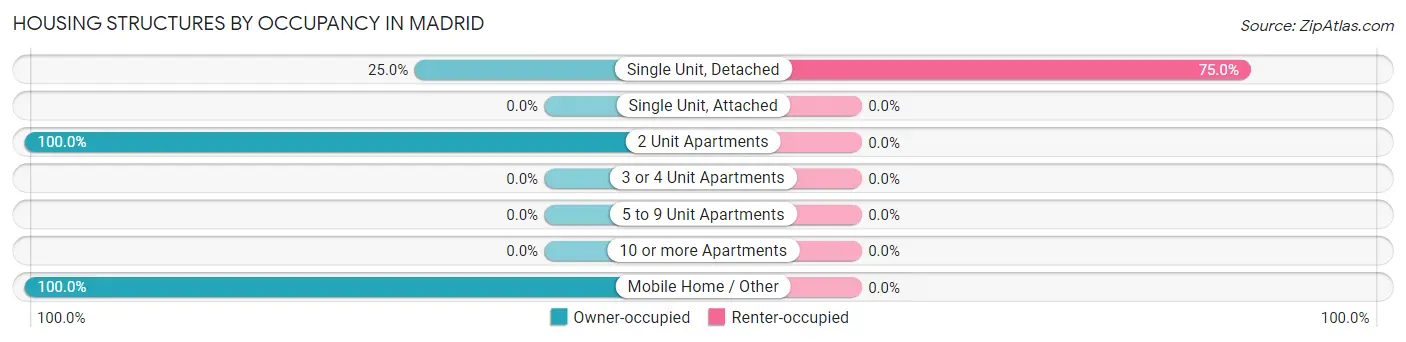
| Structure Type | Owner-occupied | Renter-occupied |
| Single Unit, Detached | 52 (25.0%) | 156 (75.0%) |
| Single Unit, Attached | 0 (0.0%) | 0 (0.0%) |
| 2 Unit Apartments | 10 (100.0%) | 0 (0.0%) |
| 3 or 4 Unit Apartments | 0 (0.0%) | 0 (0.0%) |
| 5 to 9 Unit Apartments | 0 (0.0%) | 0 (0.0%) |
| 10 or more Apartments | 0 (0.0%) | 0 (0.0%) |
| Mobile Home / Other | 8 (100.0%) | 0 (0.0%) |
| Total | 70 (31.0%) | 156 (69.0%) |
Housing Structures by Number of Rooms in Madrid
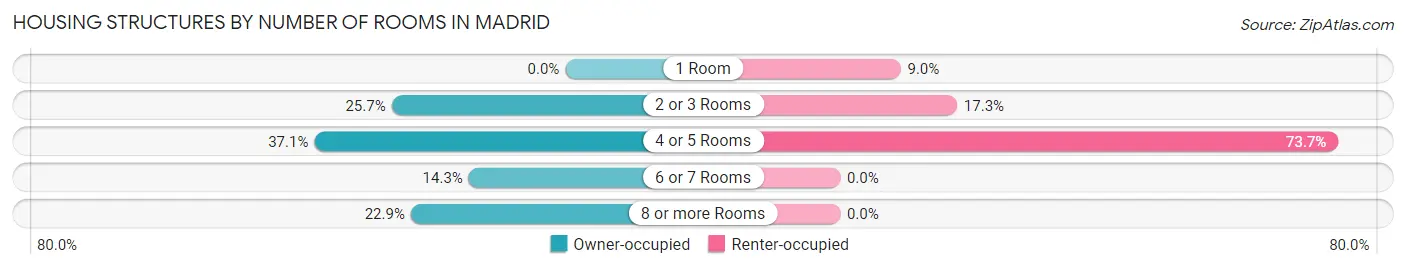
| Number of Rooms | Owner-occupied | Renter-occupied |
| 1 Room | 0 (0.0%) | 14 (9.0%) |
| 2 or 3 Rooms | 18 (25.7%) | 27 (17.3%) |
| 4 or 5 Rooms | 26 (37.1%) | 115 (73.7%) |
| 6 or 7 Rooms | 10 (14.3%) | 0 (0.0%) |
| 8 or more Rooms | 16 (22.9%) | 0 (0.0%) |
| Total | 70 (100.0%) | 156 (100.0%) |
Housing Structure by Heating Type in Madrid
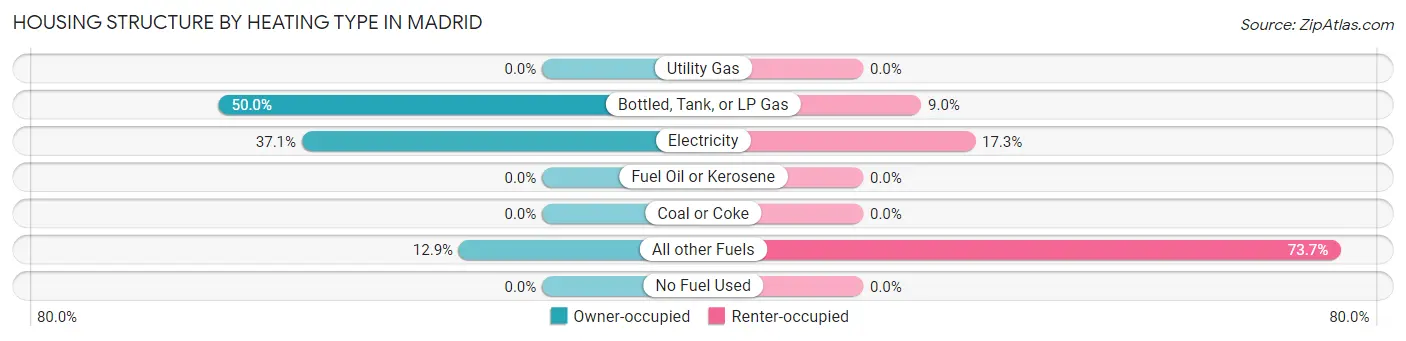
| Heating Type | Owner-occupied | Renter-occupied |
| Utility Gas | 0 (0.0%) | 0 (0.0%) |
| Bottled, Tank, or LP Gas | 35 (50.0%) | 14 (9.0%) |
| Electricity | 26 (37.1%) | 27 (17.3%) |
| Fuel Oil or Kerosene | 0 (0.0%) | 0 (0.0%) |
| Coal or Coke | 0 (0.0%) | 0 (0.0%) |
| All other Fuels | 9 (12.9%) | 115 (73.7%) |
| No Fuel Used | 0 (0.0%) | 0 (0.0%) |
| Total | 70 (100.0%) | 156 (100.0%) |
Household Vehicle Usage in Madrid
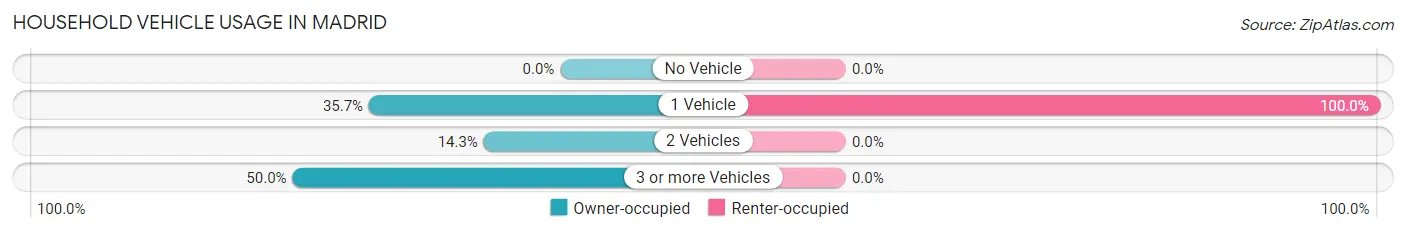
| Vehicles per Household | Owner-occupied | Renter-occupied |
| No Vehicle | 0 (0.0%) | 0 (0.0%) |
| 1 Vehicle | 25 (35.7%) | 156 (100.0%) |
| 2 Vehicles | 10 (14.3%) | 0 (0.0%) |
| 3 or more Vehicles | 35 (50.0%) | 0 (0.0%) |
| Total | 70 (100.0%) | 156 (100.0%) |
Real Estate & Mortgages in Madrid
Real Estate and Mortgage Overview in Madrid
| Characteristic | Without Mortgage | With Mortgage |
| Housing Units | 34 | 36 |
| Median Property Value | - | - |
| Median Household Income | $47,813 | $8 |
| Monthly Housing Costs | $361 | $0 |
| Real Estate Taxes | $658 | $0 |
Property Value by Mortgage Status in Madrid
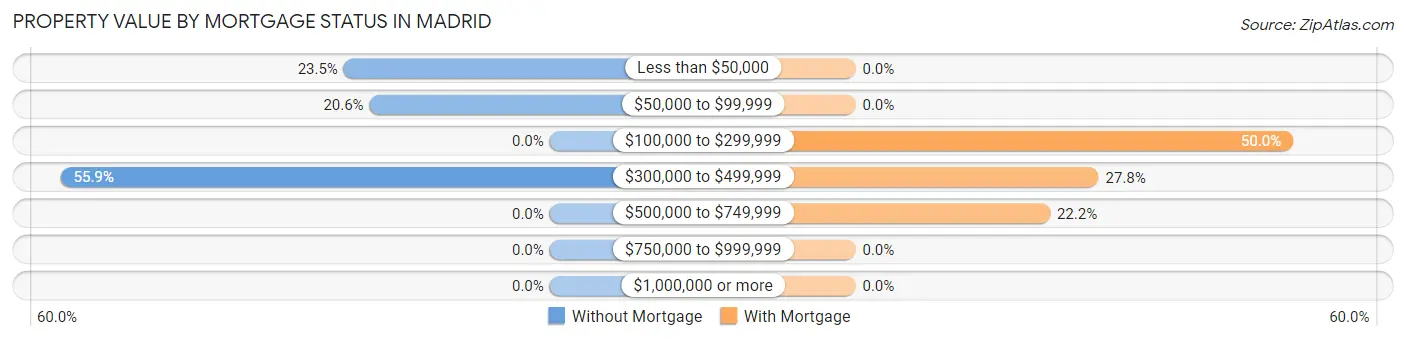
| Property Value | Without Mortgage | With Mortgage |
| Less than $50,000 | 8 (23.5%) | 0 (0.0%) |
| $50,000 to $99,999 | 7 (20.6%) | 0 (0.0%) |
| $100,000 to $299,999 | 0 (0.0%) | 18 (50.0%) |
| $300,000 to $499,999 | 19 (55.9%) | 10 (27.8%) |
| $500,000 to $749,999 | 0 (0.0%) | 8 (22.2%) |
| $750,000 to $999,999 | 0 (0.0%) | 0 (0.0%) |
| $1,000,000 or more | 0 (0.0%) | 0 (0.0%) |
| Total | 34 (100.0%) | 36 (100.0%) |
Household Income by Mortgage Status in Madrid
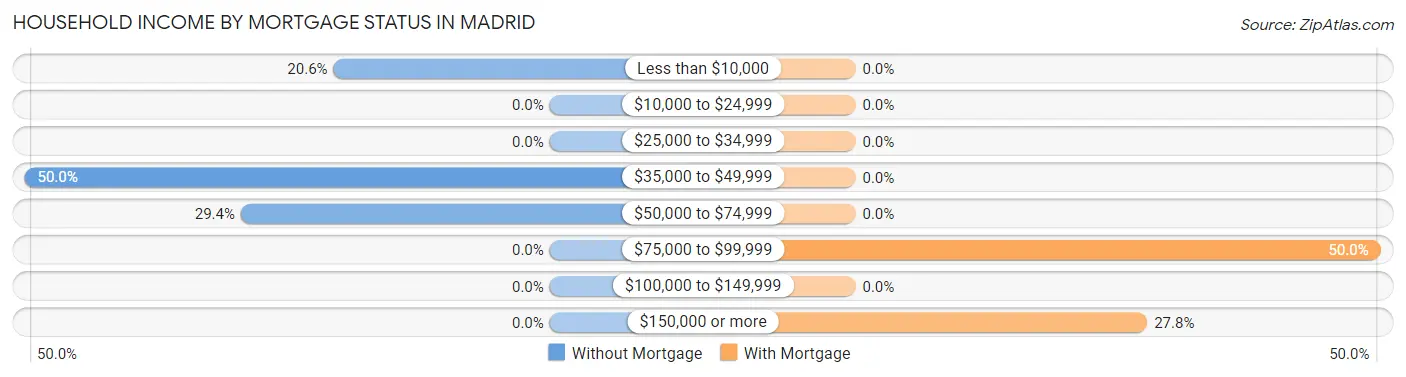
| Household Income | Without Mortgage | With Mortgage |
| Less than $10,000 | 7 (20.6%) | 0 (0.0%) |
| $10,000 to $24,999 | 0 (0.0%) | 0 (0.0%) |
| $25,000 to $34,999 | 0 (0.0%) | 0 (0.0%) |
| $35,000 to $49,999 | 17 (50.0%) | 0 (0.0%) |
| $50,000 to $74,999 | 10 (29.4%) | 0 (0.0%) |
| $75,000 to $99,999 | 0 (0.0%) | 18 (50.0%) |
| $100,000 to $149,999 | 0 (0.0%) | 0 (0.0%) |
| $150,000 or more | 0 (0.0%) | 10 (27.8%) |
| Total | 34 (100.0%) | 36 (100.0%) |
Property Value to Household Income Ratio in Madrid
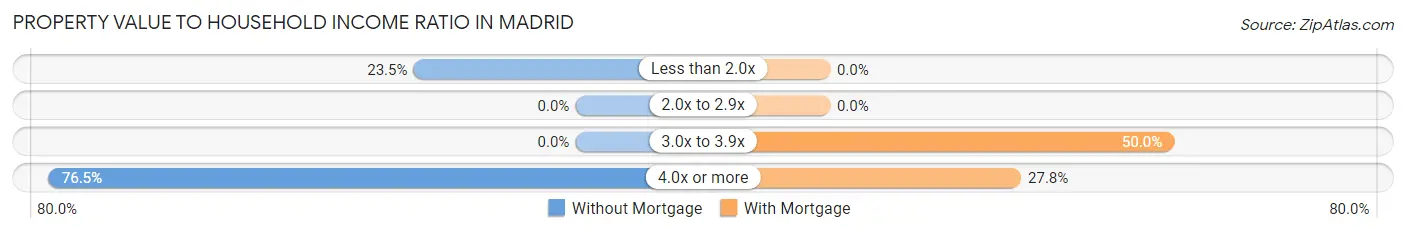
| Value-to-Income Ratio | Without Mortgage | With Mortgage |
| Less than 2.0x | 8 (23.5%) | 0 (0.0%) |
| 2.0x to 2.9x | 0 (0.0%) | 0 (0.0%) |
| 3.0x to 3.9x | 0 (0.0%) | 18 (50.0%) |
| 4.0x or more | 26 (76.5%) | 10 (27.8%) |
| Total | 34 (100.0%) | 36 (100.0%) |
Real Estate Taxes by Mortgage Status in Madrid
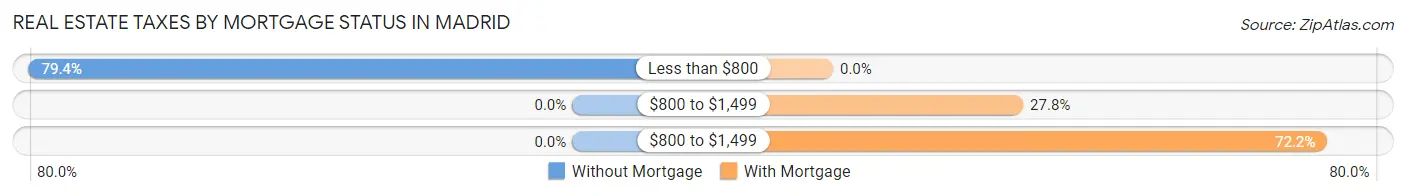
| Property Taxes | Without Mortgage | With Mortgage |
| Less than $800 | 27 (79.4%) | 0 (0.0%) |
| $800 to $1,499 | 0 (0.0%) | 10 (27.8%) |
| $800 to $1,499 | 0 (0.0%) | 26 (72.2%) |
| Total | 34 (100.0%) | 36 (100.0%) |
Health & Disability in Madrid
Health Insurance Coverage by Age in Madrid
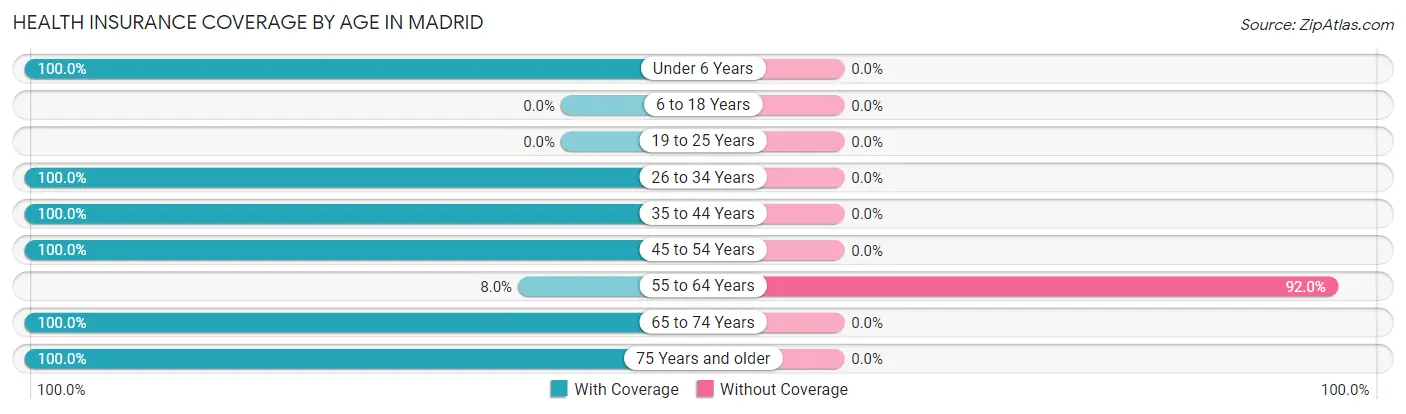
| Age Bracket | With Coverage | Without Coverage |
| Under 6 Years | 10 (100.0%) | 0 (0.0%) |
| 6 to 18 Years | 0 (0.0%) | 0 (0.0%) |
| 19 to 25 Years | 0 (0.0%) | 0 (0.0%) |
| 26 to 34 Years | 9 (100.0%) | 0 (0.0%) |
| 35 to 44 Years | 10 (100.0%) | 0 (0.0%) |
| 45 to 54 Years | 30 (100.0%) | 0 (0.0%) |
| 55 to 64 Years | 10 (8.0%) | 115 (92.0%) |
| 65 to 74 Years | 87 (100.0%) | 0 (0.0%) |
| 75 Years and older | 16 (100.0%) | 0 (0.0%) |
| Total | 172 (59.9%) | 115 (40.1%) |
Health Insurance Coverage by Citizenship Status in Madrid

| Citizenship Status | With Coverage | Without Coverage |
| Native Born | 10 (100.0%) | 0 (0.0%) |
| Foreign Born, Citizen | 0 (0.0%) | 0 (0.0%) |
| Foreign Born, not a Citizen | 0 (0.0%) | 0 (0.0%) |
Health Insurance Coverage by Household Income in Madrid
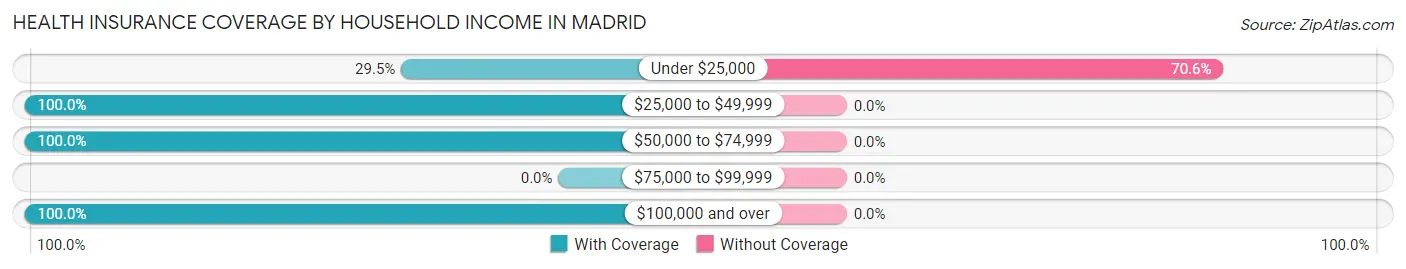
| Household Income | With Coverage | Without Coverage |
| Under $25,000 | 48 (29.4%) | 115 (70.6%) |
| $25,000 to $49,999 | 27 (100.0%) | 0 (0.0%) |
| $50,000 to $74,999 | 57 (100.0%) | 0 (0.0%) |
| $75,000 to $99,999 | 0 (0.0%) | 0 (0.0%) |
| $100,000 and over | 40 (100.0%) | 0 (0.0%) |
Public vs Private Health Insurance Coverage by Age in Madrid
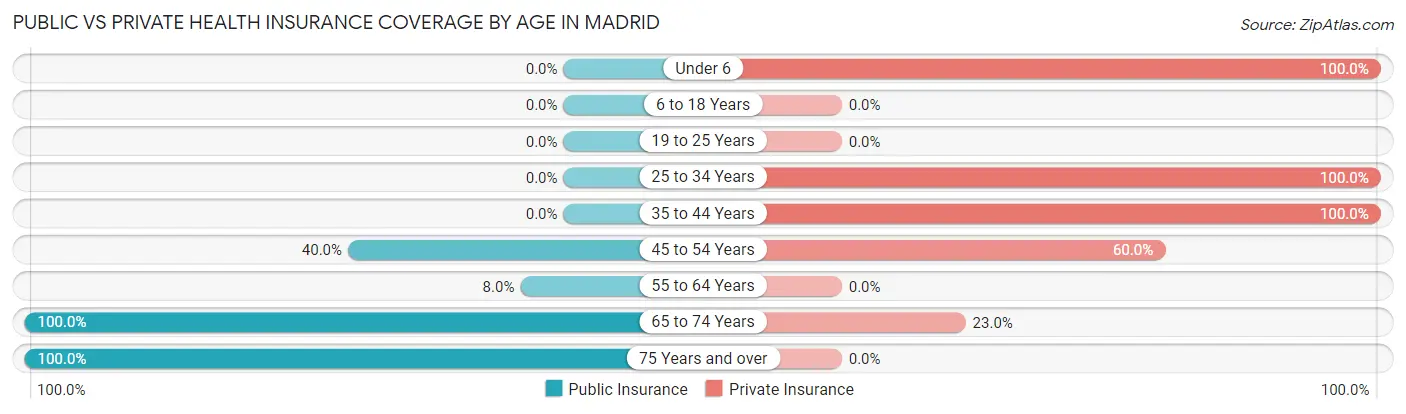
| Age Bracket | Public Insurance | Private Insurance |
| Under 6 | 0 (0.0%) | 10 (100.0%) |
| 6 to 18 Years | 0 (0.0%) | 0 (0.0%) |
| 19 to 25 Years | 0 (0.0%) | 0 (0.0%) |
| 25 to 34 Years | 0 (0.0%) | 9 (100.0%) |
| 35 to 44 Years | 0 (0.0%) | 10 (100.0%) |
| 45 to 54 Years | 12 (40.0%) | 18 (60.0%) |
| 55 to 64 Years | 10 (8.0%) | 0 (0.0%) |
| 65 to 74 Years | 87 (100.0%) | 20 (23.0%) |
| 75 Years and over | 16 (100.0%) | 0 (0.0%) |
| Total | 125 (43.5%) | 67 (23.3%) |
Disability Status by Sex by Age in Madrid
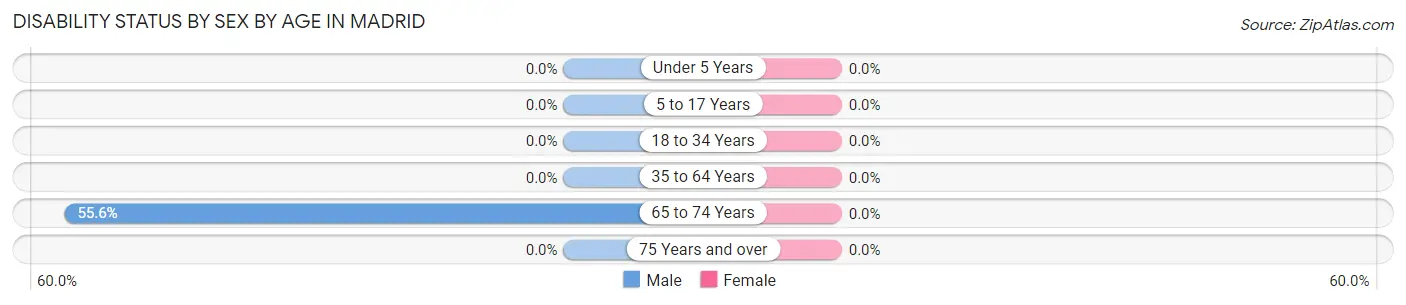
| Age Bracket | Male | Female |
| Under 5 Years | 0 (0.0%) | 0 (0.0%) |
| 5 to 17 Years | 0 (0.0%) | 0 (0.0%) |
| 18 to 34 Years | 0 (0.0%) | 0 (0.0%) |
| 35 to 64 Years | 0 (0.0%) | 0 (0.0%) |
| 65 to 74 Years | 10 (55.6%) | 0 (0.0%) |
| 75 Years and over | 0 (0.0%) | 0 (0.0%) |
Disability Class by Sex by Age in Madrid
Disability Class: Hearing Difficulty
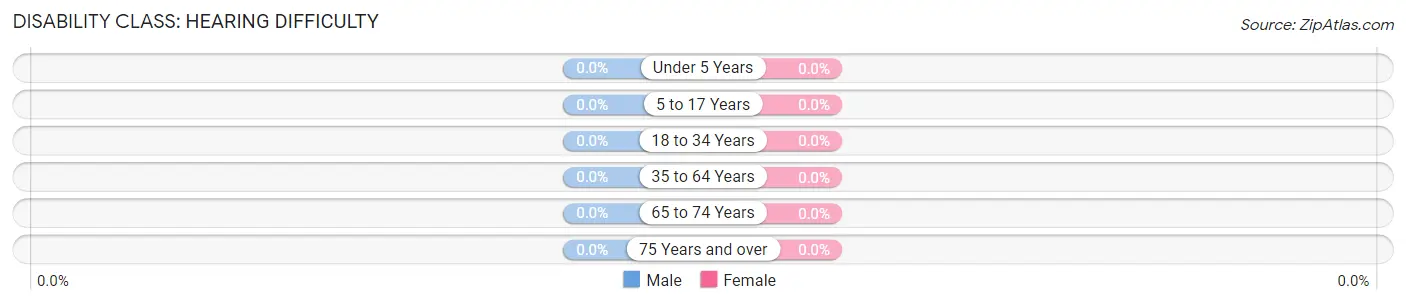
| Age Bracket | Male | Female |
| Under 5 Years | 0 (0.0%) | 0 (0.0%) |
| 5 to 17 Years | 0 (0.0%) | 0 (0.0%) |
| 18 to 34 Years | 0 (0.0%) | 0 (0.0%) |
| 35 to 64 Years | 0 (0.0%) | 0 (0.0%) |
| 65 to 74 Years | 0 (0.0%) | 0 (0.0%) |
| 75 Years and over | 0 (0.0%) | 0 (0.0%) |
Disability Class: Vision Difficulty
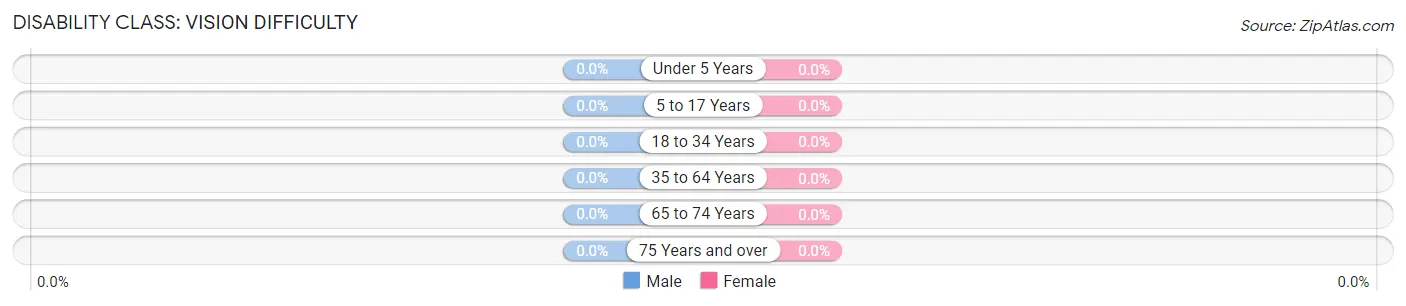
| Age Bracket | Male | Female |
| Under 5 Years | 0 (0.0%) | 0 (0.0%) |
| 5 to 17 Years | 0 (0.0%) | 0 (0.0%) |
| 18 to 34 Years | 0 (0.0%) | 0 (0.0%) |
| 35 to 64 Years | 0 (0.0%) | 0 (0.0%) |
| 65 to 74 Years | 0 (0.0%) | 0 (0.0%) |
| 75 Years and over | 0 (0.0%) | 0 (0.0%) |
Disability Class: Cognitive Difficulty
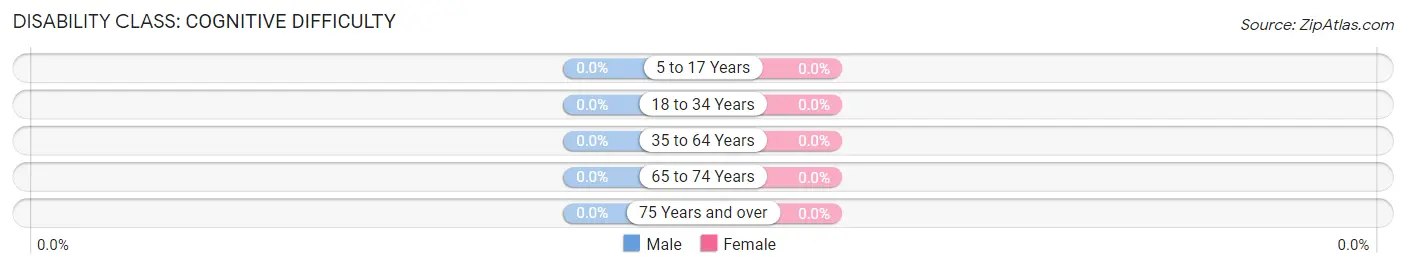
| Age Bracket | Male | Female |
| 5 to 17 Years | 0 (0.0%) | 0 (0.0%) |
| 18 to 34 Years | 0 (0.0%) | 0 (0.0%) |
| 35 to 64 Years | 0 (0.0%) | 0 (0.0%) |
| 65 to 74 Years | 0 (0.0%) | 0 (0.0%) |
| 75 Years and over | 0 (0.0%) | 0 (0.0%) |
Disability Class: Ambulatory Difficulty
| Age Bracket | Male | Female |
| 5 to 17 Years | 0 (0.0%) | 0 (0.0%) |
| 18 to 34 Years | 0 (0.0%) | 0 (0.0%) |
| 35 to 64 Years | 0 (0.0%) | 0 (0.0%) |
| 65 to 74 Years | 0 (0.0%) | 0 (0.0%) |
| 75 Years and over | 0 (0.0%) | 0 (0.0%) |
Disability Class: Self-Care Difficulty
| Age Bracket | Male | Female |
| 5 to 17 Years | 0 (0.0%) | 0 (0.0%) |
| 18 to 34 Years | 0 (0.0%) | 0 (0.0%) |
| 35 to 64 Years | 0 (0.0%) | 0 (0.0%) |
| 65 to 74 Years | 0 (0.0%) | 0 (0.0%) |
| 75 Years and over | 0 (0.0%) | 0 (0.0%) |
Technology Access in Madrid
Computing Device Access in Madrid
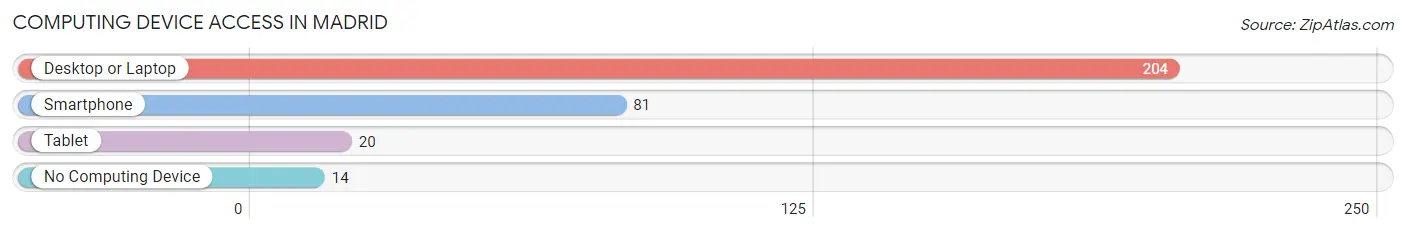
| Device Type | # Households | % Households |
| Desktop or Laptop | 204 | 90.3% |
| Smartphone | 81 | 35.8% |
| Tablet | 20 | 8.8% |
| No Computing Device | 14 | 6.2% |
| Total | 226 | 100.0% |
Internet Access in Madrid
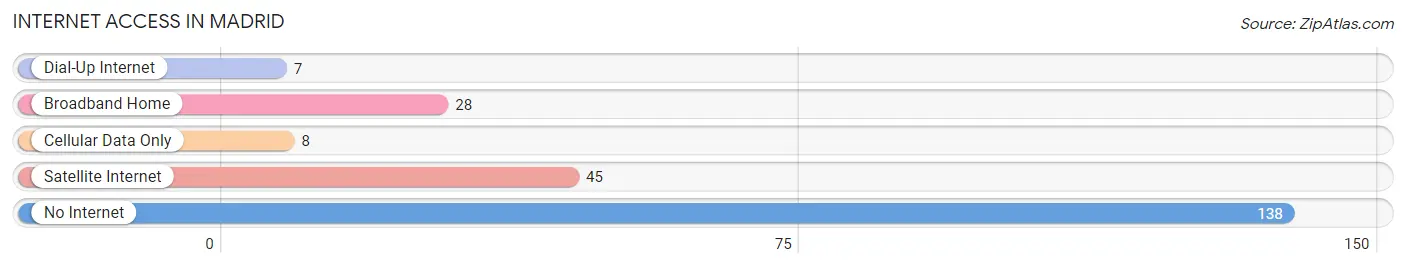
| Internet Type | # Households | % Households |
| Dial-Up Internet | 7 | 3.1% |
| Broadband Home | 28 | 12.4% |
| Cellular Data Only | 8 | 3.5% |
| Satellite Internet | 45 | 19.9% |
| No Internet | 138 | 61.1% |
| Total | 226 | 100.0% |
Madrid Summary
Madrid, New Mexico is a small town located in the foothills of the Sandia Mountains in the central part of the state. It is situated in the Rio Grande Valley, about 25 miles south of Albuquerque. The town was founded in 1835 and has a population of about 1,000 people.
History
Madrid was founded in 1835 by a group of settlers from Spain. The town was originally called "New Madrid" after the Spanish city of the same name. The settlers were attracted to the area by its fertile soil and abundant water supply. The town was incorporated in 1876 and was named after the Spanish city.
In the late 1800s, Madrid became a popular tourist destination due to its proximity to Albuquerque and the nearby hot springs. The town was also known for its coal mining industry, which provided jobs for many of the town's residents.
In the early 1900s, Madrid experienced a period of growth and prosperity. The town was home to several businesses, including a hotel, a bank, a newspaper, and a movie theater. The town also had a thriving arts and culture scene, with several galleries and theaters.
In the 1950s, Madrid began to decline as the coal mining industry declined and the town's population began to dwindle. The town was further impacted by the construction of Interstate 25, which bypassed the town and diverted traffic away from it.
Geography
Madrid is located in the Rio Grande Valley, about 25 miles south of Albuquerque. The town is situated in the foothills of the Sandia Mountains and is surrounded by desert and mountain terrain. The town is located at an elevation of 5,000 feet and has a semi-arid climate with hot summers and cold winters.
Economy
Madrid's economy is largely based on tourism and agriculture. The town is home to several tourist attractions, including the Madrid Old Town Museum, the Madrid Old Town Art Gallery, and the Madrid Old Town Theater. The town also has several restaurants, cafes, and shops.
Agriculture is also an important part of the town's economy. The town is home to several farms and ranches, which produce a variety of crops, including alfalfa, corn, and wheat.
Demographics
As of the 2010 census, Madrid had a population of 1,037 people. The town has a median age of 39.7 years and a median household income of $37,917. The town is predominantly Hispanic, with about 75% of the population identifying as Hispanic or Latino. The town also has a small Native American population, with about 5% of the population identifying as Native American.
Common Questions
What is Per Capita Income in Madrid?
Per Capita income in Madrid is $25,228.
What is the Median Family Income in Madrid?
Median Family Income in Madrid is $67,375.
What is Income or Wage Gap in Madrid?
Income or Wage Gap in Madrid is 87.4%.
Women in Madrid earn 12.6 cents for every dollar earned by a man.
What is Inequality or Gini Index in Madrid?
Inequality or Gini Index in Madrid is 0.68.
What is the Total Population of Madrid?
Total Population of Madrid is 287.
What is the Total Male Population of Madrid?
Total Male Population of Madrid is 179.
What is the Total Female Population of Madrid?
Total Female Population of Madrid is 108.
What is the Ratio of Males per 100 Females in Madrid?
There are 165.74 Males per 100 Females in Madrid.
What is the Ratio of Females per 100 Males in Madrid?
There are 60.34 Females per 100 Males in Madrid.
What is the Median Population Age in Madrid?
Median Population Age in Madrid is 59.6 Years.
What is the Average Family Size in Madrid
Average Family Size in Madrid is 2.3 People.
What is the Average Household Size in Madrid
Average Household Size in Madrid is 1.3 People.
How Large is the Labor Force in Madrid?
There are 76 People in the Labor Forcein in Madrid.
What is the Percentage of People in the Labor Force in Madrid?
27.4% of People are in the Labor Force in Madrid.