Chamita, NM Map & Demographics
Chamita Map
Chamita Overview
$32,895
PER CAPITA INCOME
$81,667
AVG FAMILY INCOME
$62,292
AVG HOUSEHOLD INCOME
38.4%
WAGE / INCOME GAP [ % ]
61.6¢/ $1
WAGE / INCOME GAP [ $ ]
0.44
INEQUALITY / GINI INDEX
841
TOTAL POPULATION
426
MALE POPULATION
415
FEMALE POPULATION
102.65
MALES / 100 FEMALES
97.42
FEMALES / 100 MALES
45.4
MEDIAN AGE
3.7
AVG FAMILY SIZE
2.6
AVG HOUSEHOLD SIZE
374
LABOR FORCE [ PEOPLE ]
55.7%
PERCENT IN LABOR FORCE
7.5%
UNEMPLOYMENT RATE
Income in Chamita
Income Overview in Chamita
Per Capita Income in Chamita is $32,895, while median incomes of families and households are $81,667 and $62,292 respectively.
| Characteristic | Number | Measure |
| Per Capita Income | 841 | $32,895 |
| Median Family Income | 180 | $81,667 |
| Mean Family Income | 180 | $94,924 |
| Median Household Income | 323 | $62,292 |
| Mean Household Income | 323 | $72,743 |
| Income Deficit | 180 | $0 |
| Wage / Income Gap (%) | 841 | 38.38% |
| Wage / Income Gap ($) | 841 | 61.62¢ per $1 |
| Gini / Inequality Index | 841 | 0.44 |
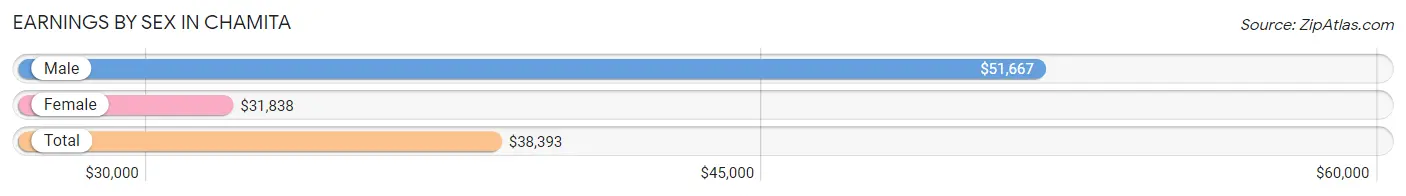
Earnings by Sex in Chamita
Average Earnings in Chamita are $38,393, $51,667 for men and $31,838 for women, a difference of 38.4%.
| Sex | Number | Average Earnings |
| Male | 194 (54.6%) | $51,667 |
| Female | 161 (45.4%) | $31,838 |
| Total | 355 (100.0%) | $38,393 |
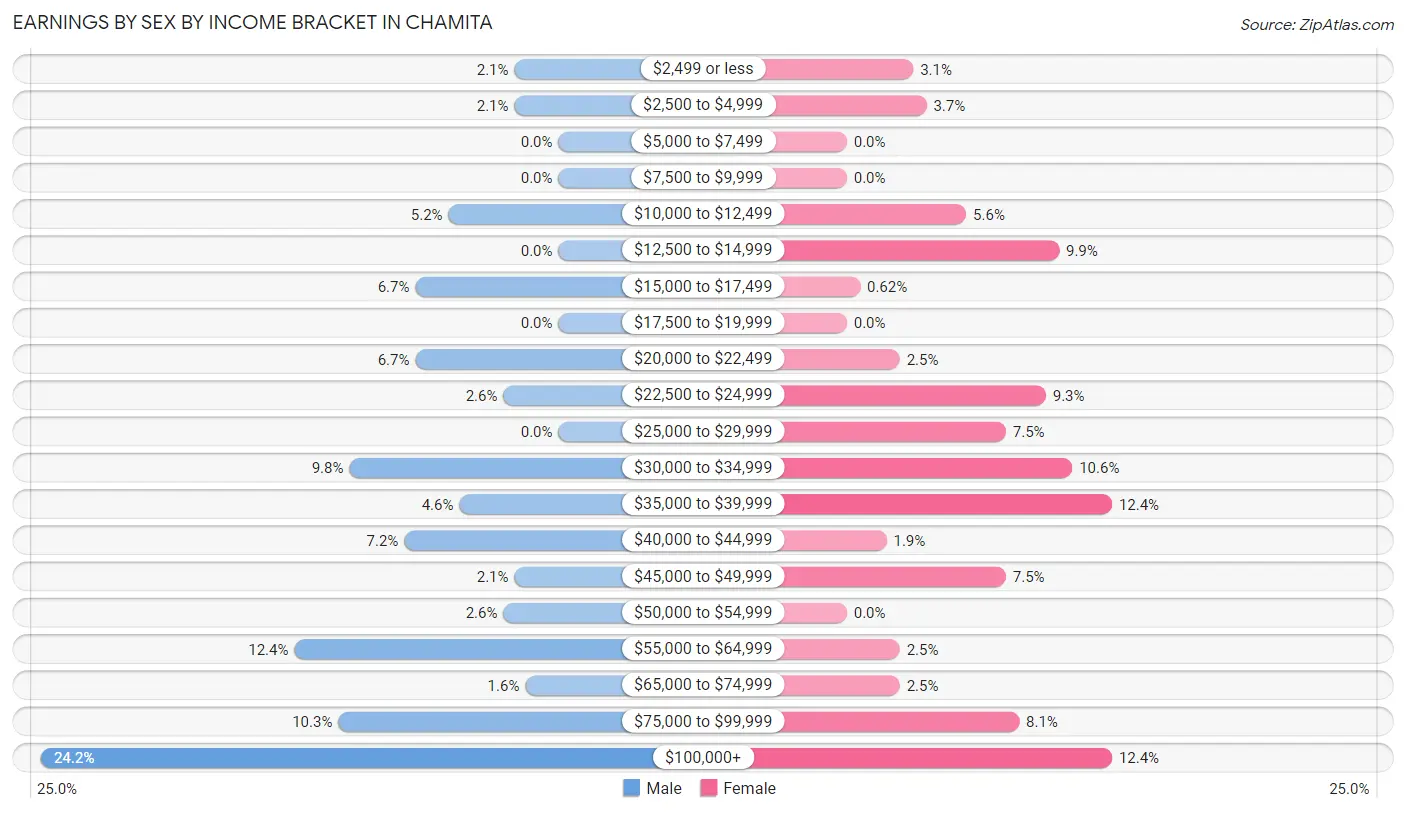
Earnings by Sex by Income Bracket in Chamita
The most common earnings brackets in Chamita are $100,000+ for men (47 | 24.2%) and $35,000 to $39,999 for women (20 | 12.4%).
| Income | Male | Female |
| $2,499 or less | 4 (2.1%) | 5 (3.1%) |
| $2,500 to $4,999 | 4 (2.1%) | 6 (3.7%) |
| $5,000 to $7,499 | 0 (0.0%) | 0 (0.0%) |
| $7,500 to $9,999 | 0 (0.0%) | 0 (0.0%) |
| $10,000 to $12,499 | 10 (5.1%) | 9 (5.6%) |
| $12,500 to $14,999 | 0 (0.0%) | 16 (9.9%) |
| $15,000 to $17,499 | 13 (6.7%) | 1 (0.6%) |
| $17,500 to $19,999 | 0 (0.0%) | 0 (0.0%) |
| $20,000 to $22,499 | 13 (6.7%) | 4 (2.5%) |
| $22,500 to $24,999 | 5 (2.6%) | 15 (9.3%) |
| $25,000 to $29,999 | 0 (0.0%) | 12 (7.4%) |
| $30,000 to $34,999 | 19 (9.8%) | 17 (10.6%) |
| $35,000 to $39,999 | 9 (4.6%) | 20 (12.4%) |
| $40,000 to $44,999 | 14 (7.2%) | 3 (1.9%) |
| $45,000 to $49,999 | 4 (2.1%) | 12 (7.4%) |
| $50,000 to $54,999 | 5 (2.6%) | 0 (0.0%) |
| $55,000 to $64,999 | 24 (12.4%) | 4 (2.5%) |
| $65,000 to $74,999 | 3 (1.5%) | 4 (2.5%) |
| $75,000 to $99,999 | 20 (10.3%) | 13 (8.1%) |
| $100,000+ | 47 (24.2%) | 20 (12.4%) |
| Total | 194 (100.0%) | 161 (100.0%) |
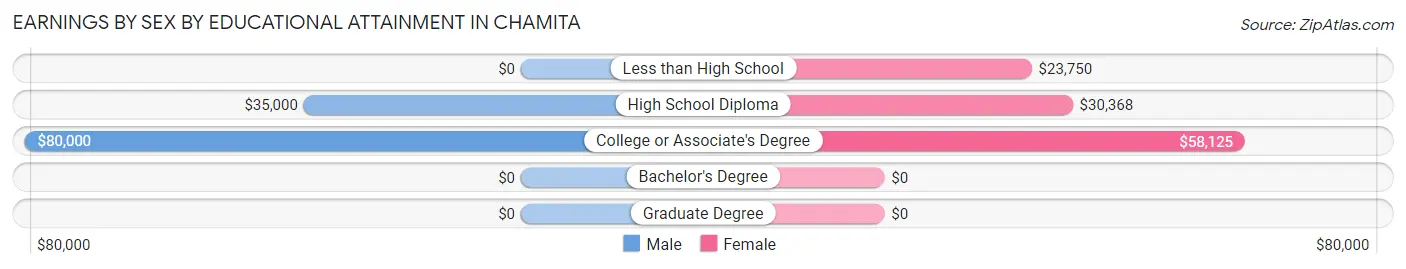
Earnings by Sex by Educational Attainment in Chamita
Average earnings in Chamita are $55,375 for men and $35,577 for women, a difference of 35.7%. Men with an educational attainment of college or associate's degree enjoy the highest average annual earnings of $80,000, while those with high school diploma education earn the least with $35,000. Women with an educational attainment of college or associate's degree earn the most with the average annual earnings of $58,125, while those with less than high school education have the smallest earnings of $23,750.
| Educational Attainment | Male Income | Female Income |
| Less than High School | - | - |
| High School Diploma | $35,000 | $30,368 |
| College or Associate's Degree | $80,000 | $58,125 |
| Bachelor's Degree | - | - |
| Graduate Degree | - | - |
| Total | $55,375 | $35,577 |
Family Income in Chamita
Family Income Brackets in Chamita
According to the Chamita family income data, there are 37 families falling into the $100,000 to $149,999 income range, which is the most common income bracket and makes up 20.6% of all families.
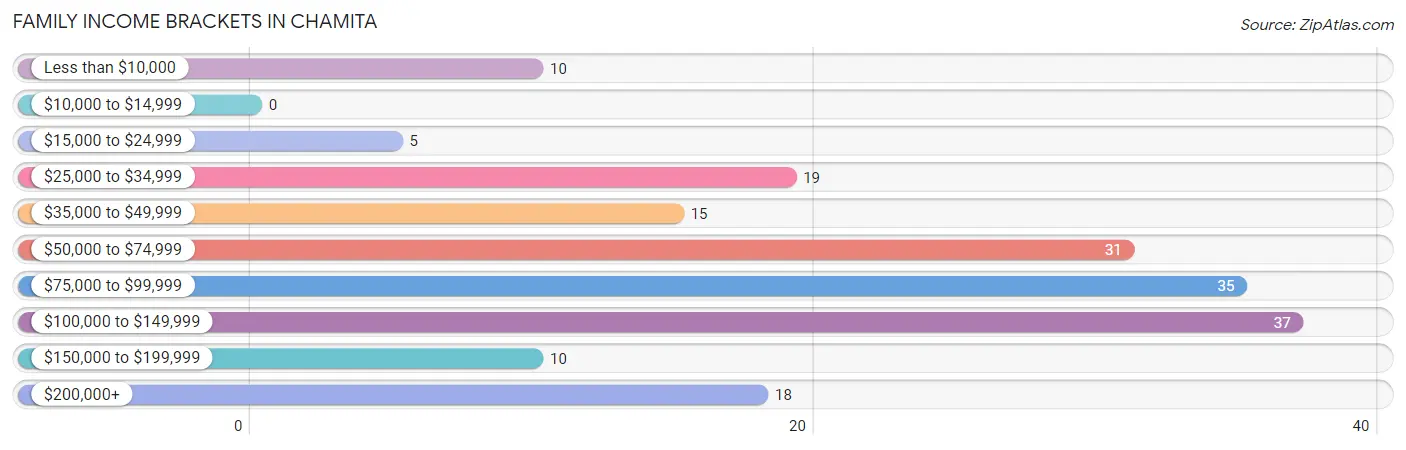
| Income Bracket | # Families | % Families |
| Less than $10,000 | 10 | 5.6% |
| $10,000 to $14,999 | 0 | 0.0% |
| $15,000 to $24,999 | 5 | 2.8% |
| $25,000 to $34,999 | 19 | 10.6% |
| $35,000 to $49,999 | 15 | 8.3% |
| $50,000 to $74,999 | 31 | 17.2% |
| $75,000 to $99,999 | 35 | 19.4% |
| $100,000 to $149,999 | 37 | 20.6% |
| $150,000 to $199,999 | 10 | 5.6% |
| $200,000+ | 18 | 10.0% |
Family Income by Famaliy Size in Chamita
2-person families (105 | 58.3%) account for the highest median family income in Chamita with $90,288 per family, while 2-person families (105 | 58.3%) have the highest median income of $45,144 per family member.
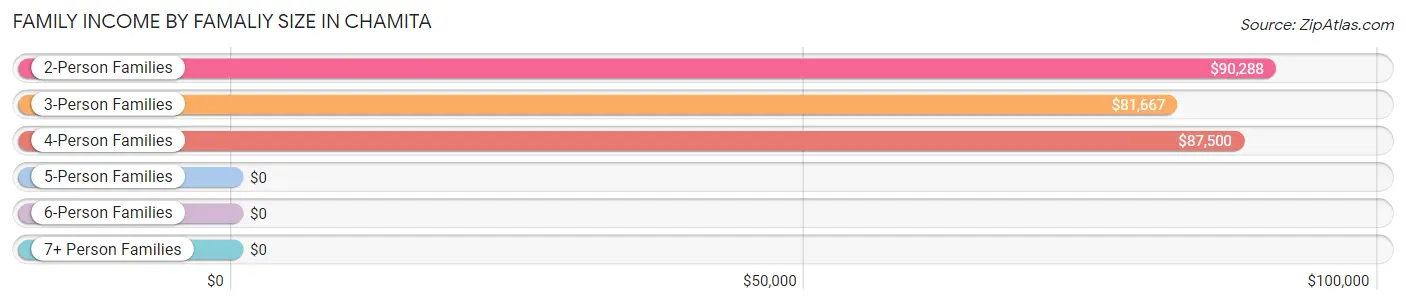
| Income Bracket | # Families | Median Income |
| 2-Person Families | 105 (58.3%) | $90,288 |
| 3-Person Families | 46 (25.6%) | $81,667 |
| 4-Person Families | 14 (7.8%) | $87,500 |
| 5-Person Families | 11 (6.1%) | $0 |
| 6-Person Families | 4 (2.2%) | $0 |
| 7+ Person Families | 0 (0.0%) | $0 |
| Total | 180 (100.0%) | $81,667 |
Family Income by Number of Earners in Chamita
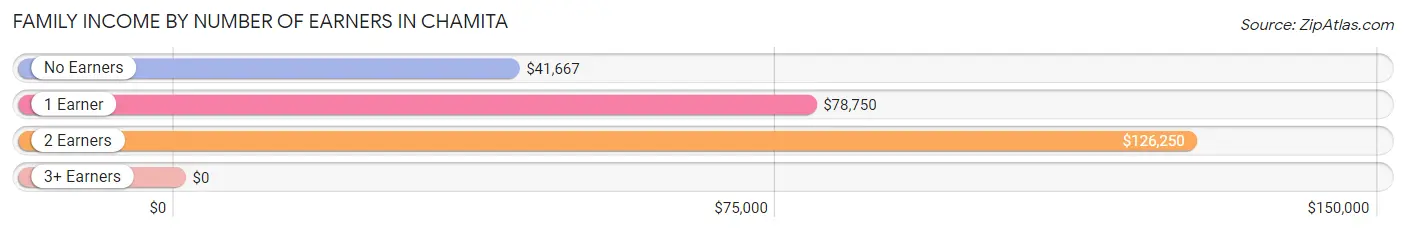
| Number of Earners | # Families | Median Income |
| No Earners | 44 (24.4%) | $41,667 |
| 1 Earner | 74 (41.1%) | $78,750 |
| 2 Earners | 58 (32.2%) | $126,250 |
| 3+ Earners | 4 (2.2%) | $0 |
| Total | 180 (100.0%) | $81,667 |
Household Income in Chamita
Household Income Brackets in Chamita
With 58 households falling in the category, the $75,000 to $99,999 income range is the most frequent in Chamita, accounting for 18.0% of all households. In contrast, only 10 households (3.1%) fall into the $15,000 to $24,999 income bracket, making it the least populous group.
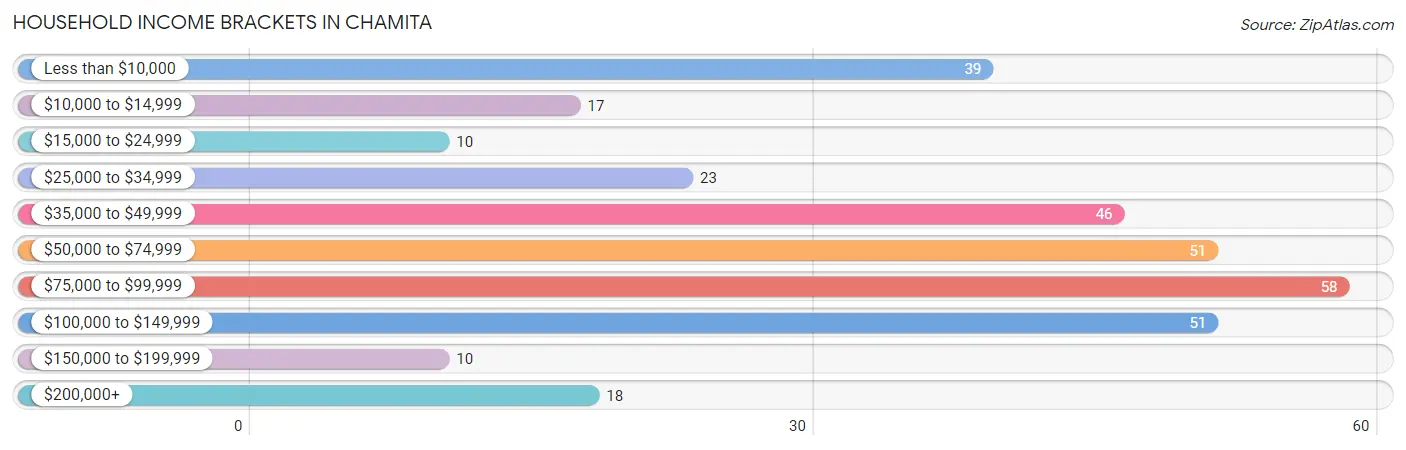
| Income Bracket | # Households | % Households |
| Less than $10,000 | 39 | 12.1% |
| $10,000 to $14,999 | 17 | 5.3% |
| $15,000 to $24,999 | 10 | 3.1% |
| $25,000 to $34,999 | 23 | 7.1% |
| $35,000 to $49,999 | 46 | 14.2% |
| $50,000 to $74,999 | 51 | 15.8% |
| $75,000 to $99,999 | 58 | 18.0% |
| $100,000 to $149,999 | 51 | 15.8% |
| $150,000 to $199,999 | 10 | 3.1% |
| $200,000+ | 18 | 5.6% |
Household Income by Householder Age in Chamita
The median household income in Chamita is $62,292, with the highest median household income of $76,042 found in the 45 to 64 years age bracket for the primary householder. A total of 143 households (44.3%) fall into this category. Meanwhile, the 15 to 24 years age bracket for the primary householder has the lowest median household income of $0, with 5 households (1.5%) in this group.
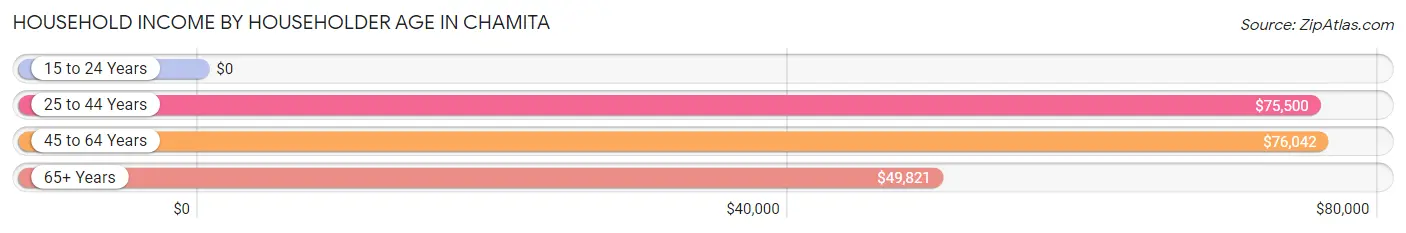
| Income Bracket | # Households | Median Income |
| 15 to 24 Years | 5 (1.5%) | $0 |
| 25 to 44 Years | 54 (16.7%) | $75,500 |
| 45 to 64 Years | 143 (44.3%) | $76,042 |
| 65+ Years | 121 (37.5%) | $49,821 |
| Total | 323 (100.0%) | $62,292 |
Poverty in Chamita
Income Below Poverty by Sex and Age in Chamita
With 20.4% poverty level for males and 20.2% for females among the residents of Chamita, under 5 year old males and 12 to 14 year old females are the most vulnerable to poverty, with 19 males (67.9%) and 36 females (83.7%) in their respective age groups living below the poverty level.
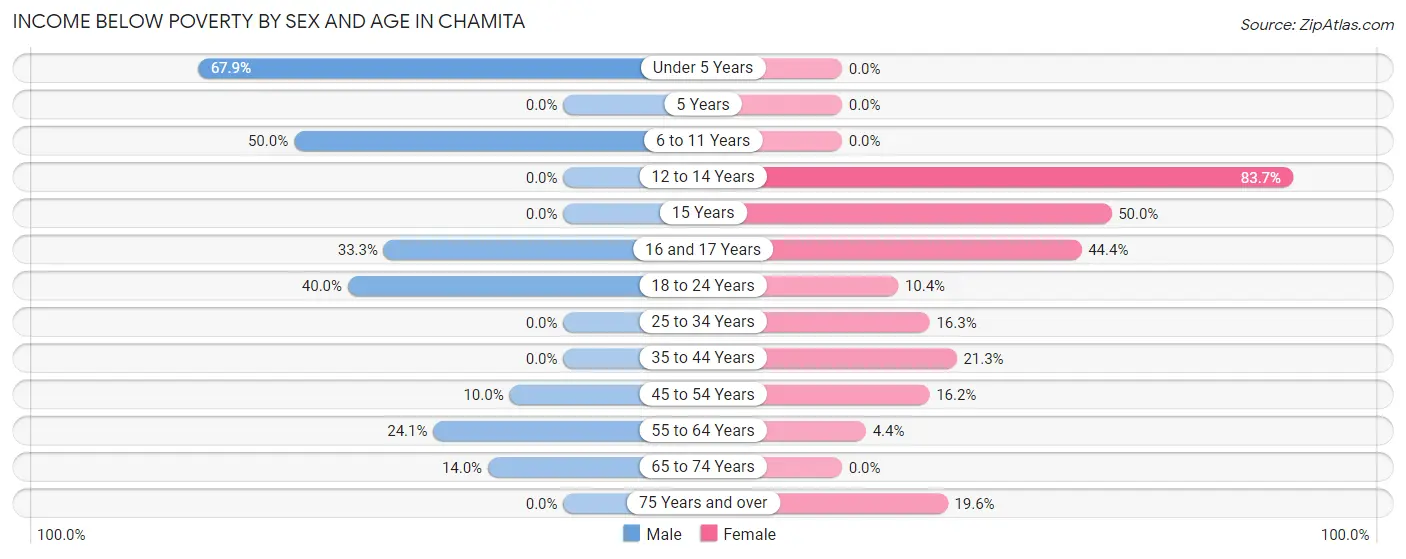
| Age Bracket | Male | Female |
| Under 5 Years | 19 (67.9%) | 0 (0.0%) |
| 5 Years | 0 (0.0%) | 0 (0.0%) |
| 6 to 11 Years | 16 (50.0%) | 0 (0.0%) |
| 12 to 14 Years | 0 (0.0%) | 36 (83.7%) |
| 15 Years | 0 (0.0%) | 4 (50.0%) |
| 16 and 17 Years | 4 (33.3%) | 4 (44.4%) |
| 18 to 24 Years | 8 (40.0%) | 5 (10.4%) |
| 25 to 34 Years | 0 (0.0%) | 7 (16.3%) |
| 35 to 44 Years | 0 (0.0%) | 10 (21.3%) |
| 45 to 54 Years | 5 (10.0%) | 6 (16.2%) |
| 55 to 64 Years | 28 (24.1%) | 2 (4.4%) |
| 65 to 74 Years | 7 (14.0%) | 0 (0.0%) |
| 75 Years and over | 0 (0.0%) | 10 (19.6%) |
| Total | 87 (20.4%) | 84 (20.2%) |
Income Above Poverty by Sex and Age in Chamita
According to the poverty statistics in Chamita, males aged 12 to 14 years and females aged under 5 years are the age groups that are most secure financially, with 100.0% of males and 100.0% of females in these age groups living above the poverty line.
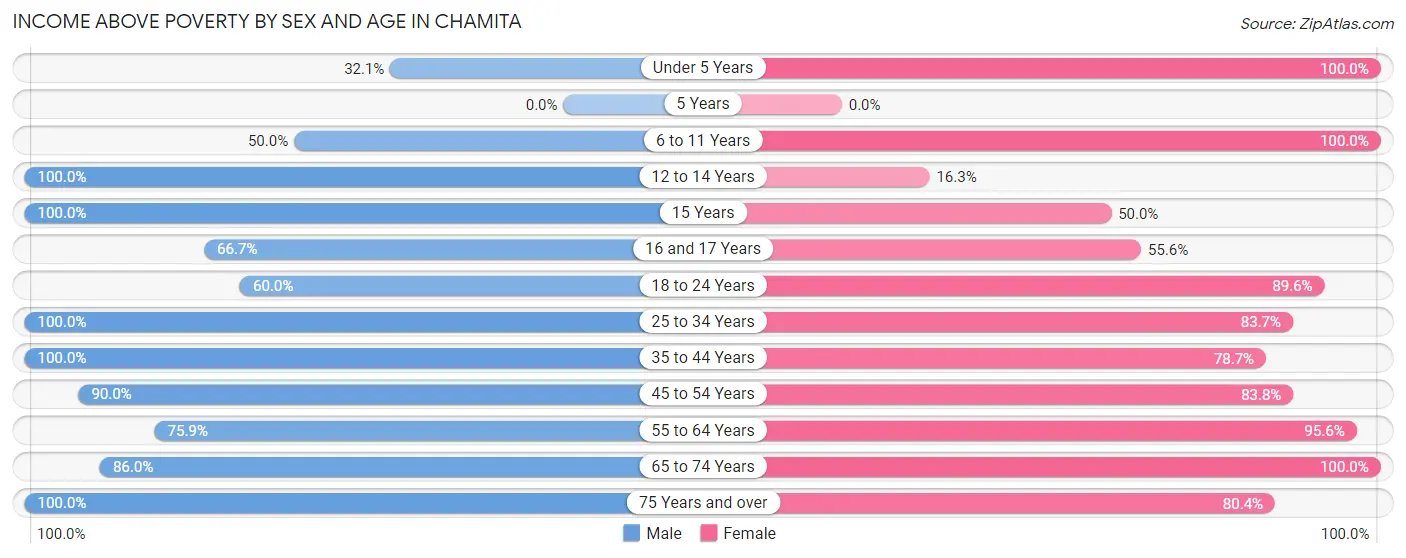
| Age Bracket | Male | Female |
| Under 5 Years | 9 (32.1%) | 18 (100.0%) |
| 5 Years | 0 (0.0%) | 0 (0.0%) |
| 6 to 11 Years | 16 (50.0%) | 20 (100.0%) |
| 12 to 14 Years | 16 (100.0%) | 7 (16.3%) |
| 15 Years | 4 (100.0%) | 4 (50.0%) |
| 16 and 17 Years | 8 (66.7%) | 5 (55.6%) |
| 18 to 24 Years | 12 (60.0%) | 43 (89.6%) |
| 25 to 34 Years | 24 (100.0%) | 36 (83.7%) |
| 35 to 44 Years | 43 (100.0%) | 37 (78.7%) |
| 45 to 54 Years | 45 (90.0%) | 31 (83.8%) |
| 55 to 64 Years | 88 (75.9%) | 43 (95.6%) |
| 65 to 74 Years | 43 (86.0%) | 46 (100.0%) |
| 75 Years and over | 31 (100.0%) | 41 (80.4%) |
| Total | 339 (79.6%) | 331 (79.8%) |
Income Below Poverty Among Married-Couple Families in Chamita
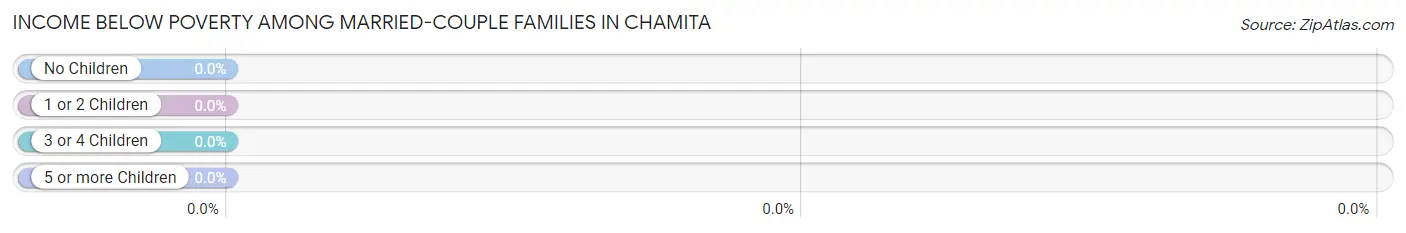
| Children | Above Poverty | Below Poverty |
| No Children | 83 (100.0%) | 0 (0.0%) |
| 1 or 2 Children | 18 (100.0%) | 0 (0.0%) |
| 3 or 4 Children | 11 (100.0%) | 0 (0.0%) |
| 5 or more Children | 0 (0.0%) | 0 (0.0%) |
| Total | 112 (100.0%) | 0 (0.0%) |
Income Below Poverty Among Single-Parent Households in Chamita
According to the poverty data in Chamita, 21.4% or 6 single-father households and 42.5% or 17 single-mother households are living below the poverty line. Among single-father households, those with no children have the highest poverty rate, with 6 households (28.6%) experiencing poverty. Likewise, among single-mother households, those with 3 or 4 children have the highest poverty rate, with 4 households (100.0%) falling below the poverty line.
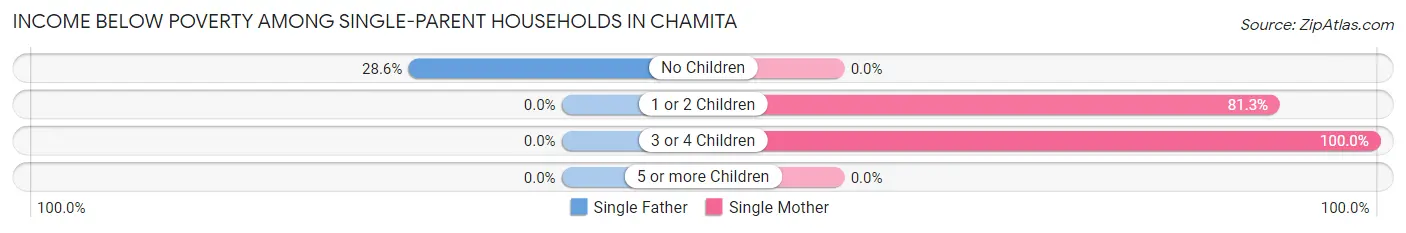
| Children | Single Father | Single Mother |
| No Children | 6 (28.6%) | 0 (0.0%) |
| 1 or 2 Children | 0 (0.0%) | 13 (81.2%) |
| 3 or 4 Children | 0 (0.0%) | 4 (100.0%) |
| 5 or more Children | 0 (0.0%) | 0 (0.0%) |
| Total | 6 (21.4%) | 17 (42.5%) |
Income Below Poverty Among Married-Couple vs Single-Parent Households in Chamita
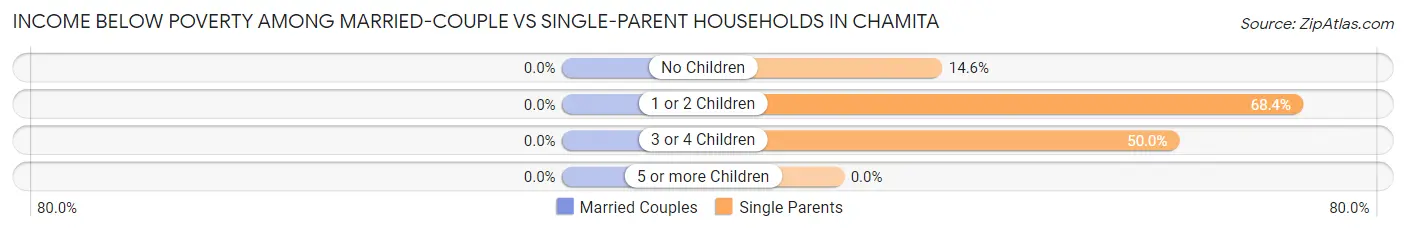
| Children | Married-Couple Families | Single-Parent Households |
| No Children | 0 (0.0%) | 6 (14.6%) |
| 1 or 2 Children | 0 (0.0%) | 13 (68.4%) |
| 3 or 4 Children | 0 (0.0%) | 4 (50.0%) |
| 5 or more Children | 0 (0.0%) | 0 (0.0%) |
| Total | 0 (0.0%) | 23 (33.8%) |
Race in Chamita
The most populous races in Chamita are Hispanic or Latino (773 | 91.9%), Some other Race (597 | 71.0%), and White / Caucasian (117 | 13.9%).
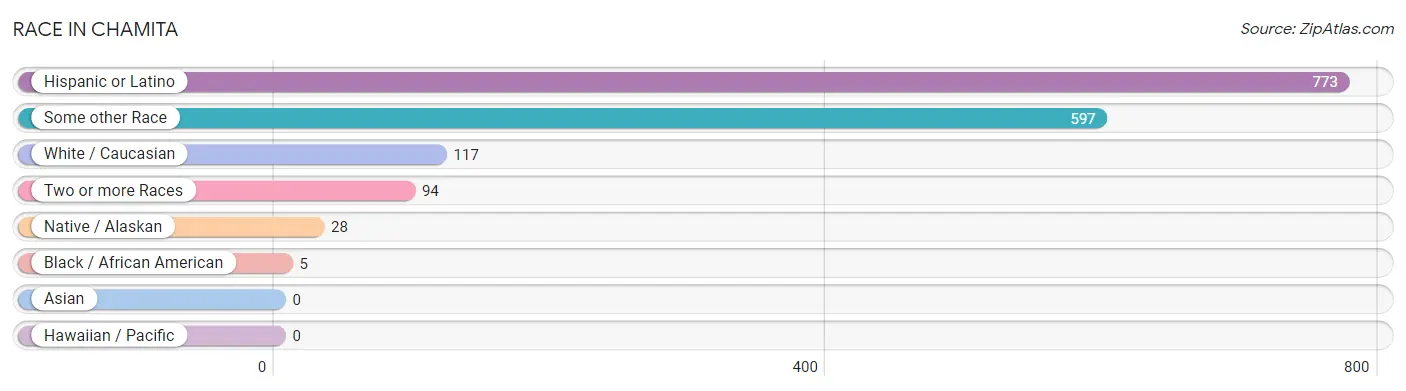
| Race | # Population | % Population |
| Asian | 0 | 0.0% |
| Black / African American | 5 | 0.6% |
| Hawaiian / Pacific | 0 | 0.0% |
| Hispanic or Latino | 773 | 91.9% |
| Native / Alaskan | 28 | 3.3% |
| White / Caucasian | 117 | 13.9% |
| Two or more Races | 94 | 11.2% |
| Some other Race | 597 | 71.0% |
| Total | 841 | 100.0% |
Ancestry in Chamita
The most populous ancestries reported in Chamita are Mexican (290 | 34.5%), Spaniard (260 | 30.9%), Spanish (90 | 10.7%), Pueblo (37 | 4.4%), and American (26 | 3.1%), together accounting for 83.6% of all Chamita residents.
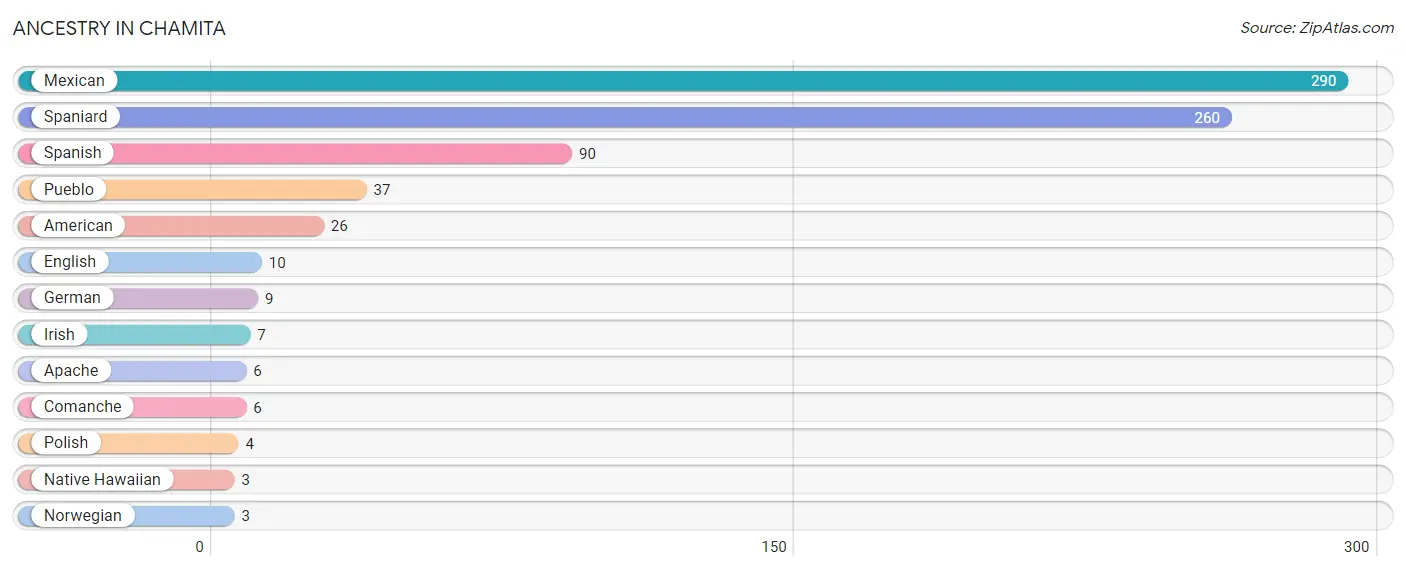
| Ancestry | # Population | % Population |
| American | 26 | 3.1% |
| Apache | 6 | 0.7% |
| Comanche | 6 | 0.7% |
| English | 10 | 1.2% |
| German | 9 | 1.1% |
| Irish | 7 | 0.8% |
| Mexican | 290 | 34.5% |
| Native Hawaiian | 3 | 0.4% |
| Norwegian | 3 | 0.4% |
| Polish | 4 | 0.5% |
| Pueblo | 37 | 4.4% |
| Spaniard | 260 | 30.9% |
| Spanish | 90 | 10.7% | View All 13 Rows |
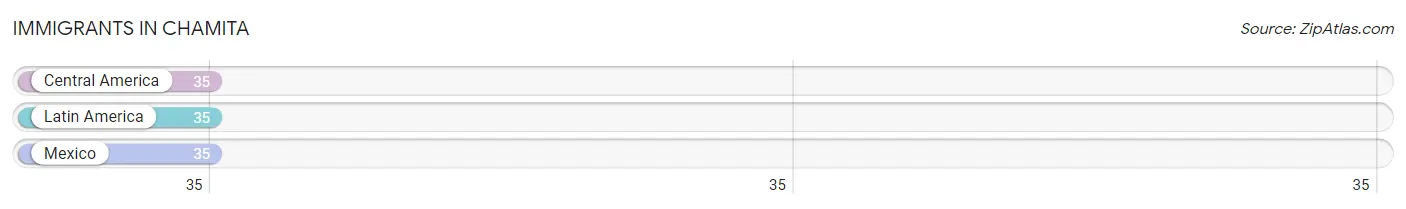
Immigrants in Chamita
The most numerous immigrant groups reported in Chamita came from Central America (35 | 4.2%), Latin America (35 | 4.2%), and Mexico (35 | 4.2%), together accounting for 12.5% of all Chamita residents.
| Immigration Origin | # Population | % Population |
| Central America | 35 | 4.2% |
| Latin America | 35 | 4.2% |
| Mexico | 35 | 4.2% | View All 3 Rows |
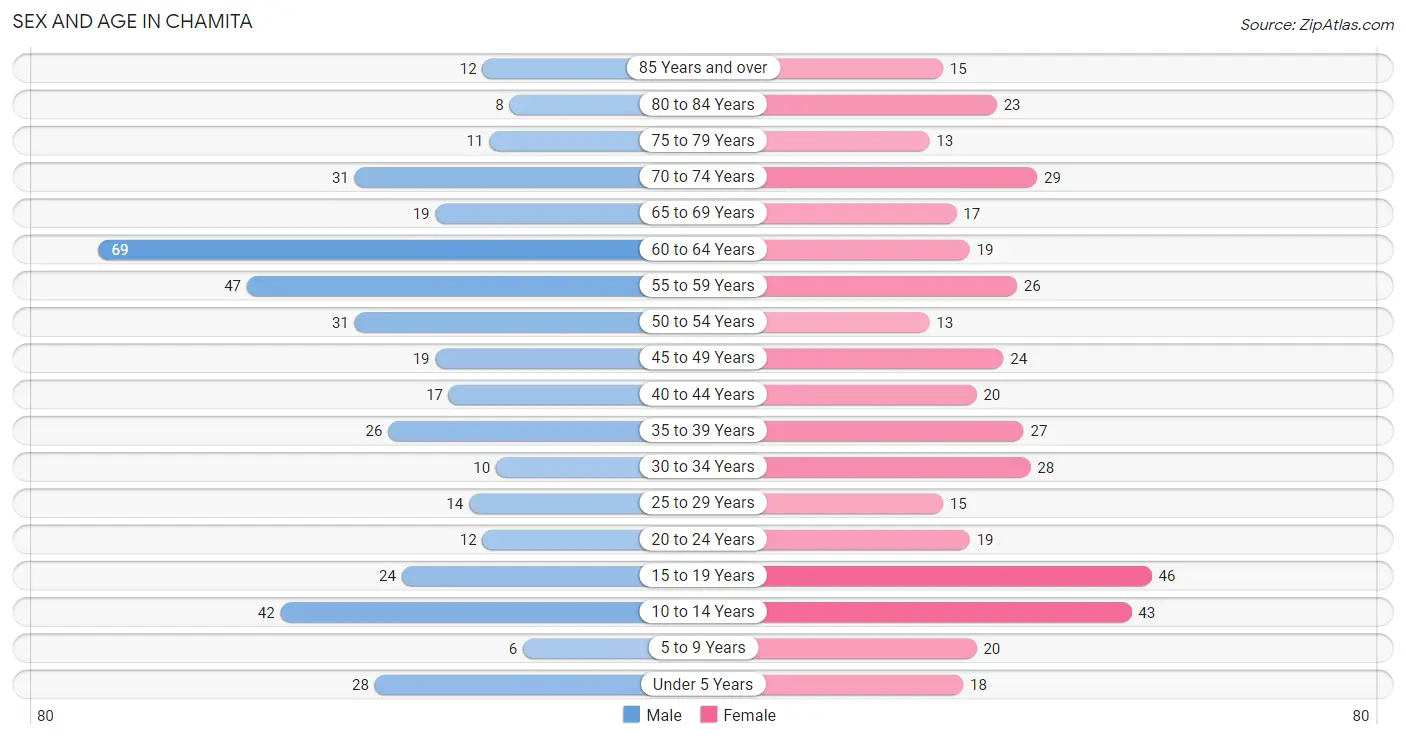
Sex and Age in Chamita
Sex and Age in Chamita
The most populous age groups in Chamita are 60 to 64 Years (69 | 16.2%) for men and 15 to 19 Years (46 | 11.1%) for women.
| Age Bracket | Male | Female |
| Under 5 Years | 28 (6.6%) | 18 (4.3%) |
| 5 to 9 Years | 6 (1.4%) | 20 (4.8%) |
| 10 to 14 Years | 42 (9.9%) | 43 (10.4%) |
| 15 to 19 Years | 24 (5.6%) | 46 (11.1%) |
| 20 to 24 Years | 12 (2.8%) | 19 (4.6%) |
| 25 to 29 Years | 14 (3.3%) | 15 (3.6%) |
| 30 to 34 Years | 10 (2.4%) | 28 (6.8%) |
| 35 to 39 Years | 26 (6.1%) | 27 (6.5%) |
| 40 to 44 Years | 17 (4.0%) | 20 (4.8%) |
| 45 to 49 Years | 19 (4.5%) | 24 (5.8%) |
| 50 to 54 Years | 31 (7.3%) | 13 (3.1%) |
| 55 to 59 Years | 47 (11.0%) | 26 (6.3%) |
| 60 to 64 Years | 69 (16.2%) | 19 (4.6%) |
| 65 to 69 Years | 19 (4.5%) | 17 (4.1%) |
| 70 to 74 Years | 31 (7.3%) | 29 (7.0%) |
| 75 to 79 Years | 11 (2.6%) | 13 (3.1%) |
| 80 to 84 Years | 8 (1.9%) | 23 (5.5%) |
| 85 Years and over | 12 (2.8%) | 15 (3.6%) |
| Total | 426 (100.0%) | 415 (100.0%) |
Families and Households in Chamita
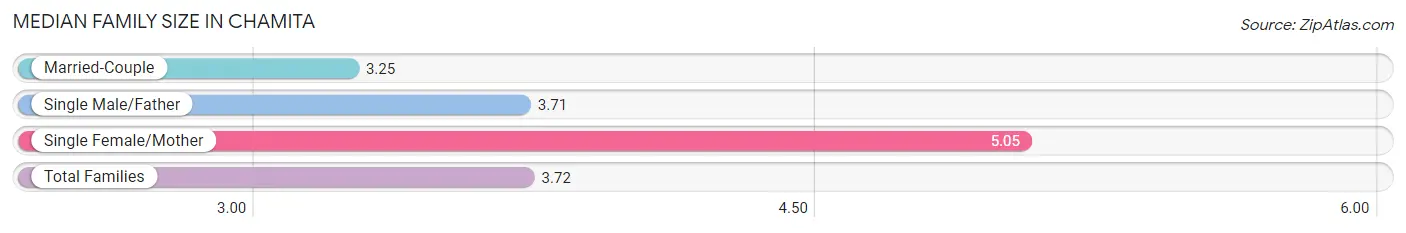
Median Family Size in Chamita
The median family size in Chamita is 3.72 persons per family, with single female/mother families (40 | 22.2%) accounting for the largest median family size of 5.05 persons per family. On the other hand, married-couple families (112 | 62.2%) represent the smallest median family size with 3.25 persons per family.
| Family Type | # Families | Family Size |
| Married-Couple | 112 (62.2%) | 3.25 |
| Single Male/Father | 28 (15.6%) | 3.71 |
| Single Female/Mother | 40 (22.2%) | 5.05 |
| Total Families | 180 (100.0%) | 3.72 |
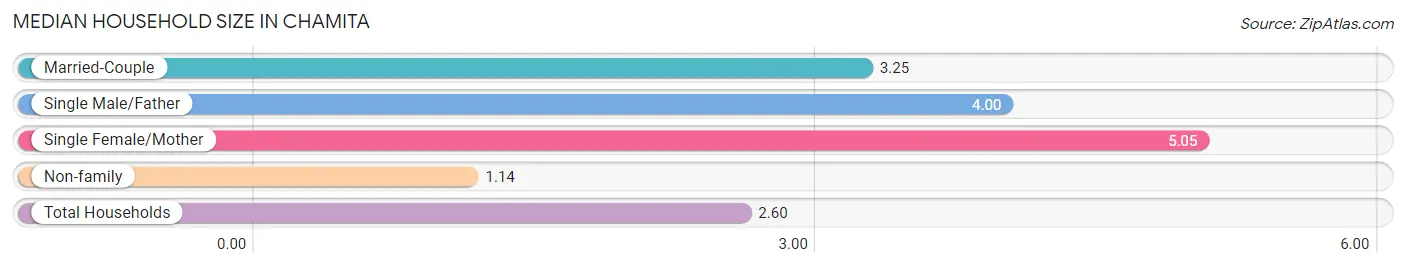
Median Household Size in Chamita
The median household size in Chamita is 2.60 persons per household, with single female/mother households (40 | 12.4%) accounting for the largest median household size of 5.05 persons per household. non-family households (143 | 44.3%) represent the smallest median household size with 1.14 persons per household.
| Household Type | # Households | Household Size |
| Married-Couple | 112 (34.7%) | 3.25 |
| Single Male/Father | 28 (8.7%) | 4.00 |
| Single Female/Mother | 40 (12.4%) | 5.05 |
| Non-family | 143 (44.3%) | 1.14 |
| Total Households | 323 (100.0%) | 2.60 |
Household Size by Marriage Status in Chamita
Out of a total of 323 households in Chamita, 180 (55.7%) are family households, while 143 (44.3%) are nonfamily households. The most numerous type of family households are 2-person households, comprising 101, and the most common type of nonfamily households are 1-person households, comprising 131.
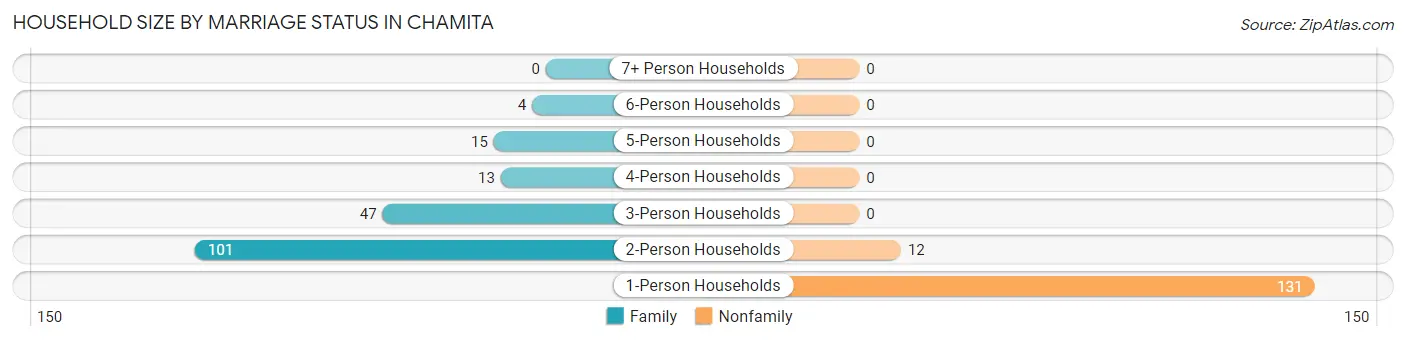
| Household Size | Family Households | Nonfamily Households |
| 1-Person Households | - | 131 (40.6%) |
| 2-Person Households | 101 (31.3%) | 12 (3.7%) |
| 3-Person Households | 47 (14.5%) | 0 (0.0%) |
| 4-Person Households | 13 (4.0%) | 0 (0.0%) |
| 5-Person Households | 15 (4.6%) | 0 (0.0%) |
| 6-Person Households | 4 (1.2%) | 0 (0.0%) |
| 7+ Person Households | 0 (0.0%) | 0 (0.0%) |
| Total | 180 (55.7%) | 143 (44.3%) |
Female Fertility in Chamita
Fertility by Age in Chamita
Average fertility rate in Chamita is 39.0 births per 1,000 women. Women in the age bracket of 35 to 50 years have the highest fertility rate with 55.0 births per 1,000 women. Women in the age bracket of 35 to 50 years acount for 57.1% of all women with births.
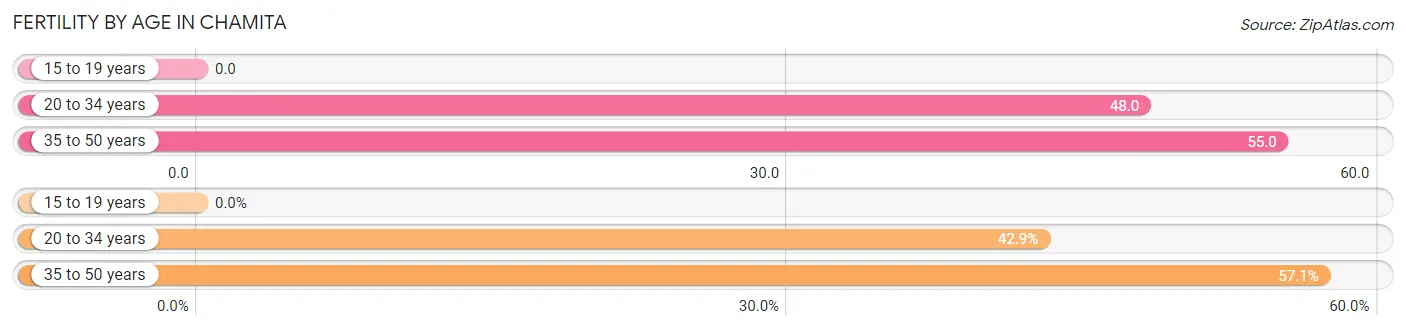
| Age Bracket | Women with Births | Births / 1,000 Women |
| 15 to 19 years | 0 (0.0%) | 0.0 |
| 20 to 34 years | 3 (42.9%) | 48.0 |
| 35 to 50 years | 4 (57.1%) | 55.0 |
| Total | 7 (100.0%) | 39.0 |
Fertility by Age by Marriage Status in Chamita
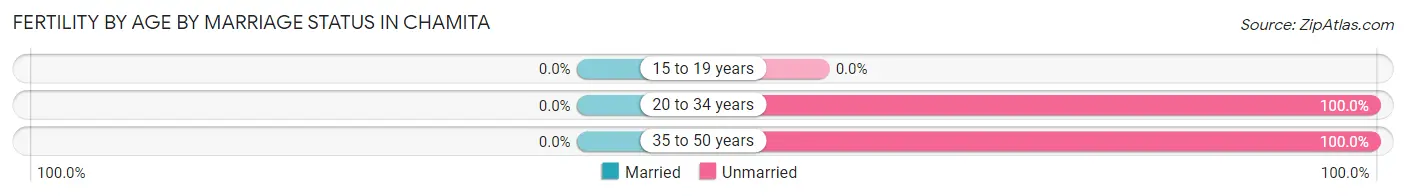
| Age Bracket | Married | Unmarried |
| 15 to 19 years | 0 (0.0%) | 0 (0.0%) |
| 20 to 34 years | 0 (0.0%) | 3 (100.0%) |
| 35 to 50 years | 0 (0.0%) | 4 (100.0%) |
| Total | 0 (0.0%) | 7 (100.0%) |
Fertility by Education in Chamita
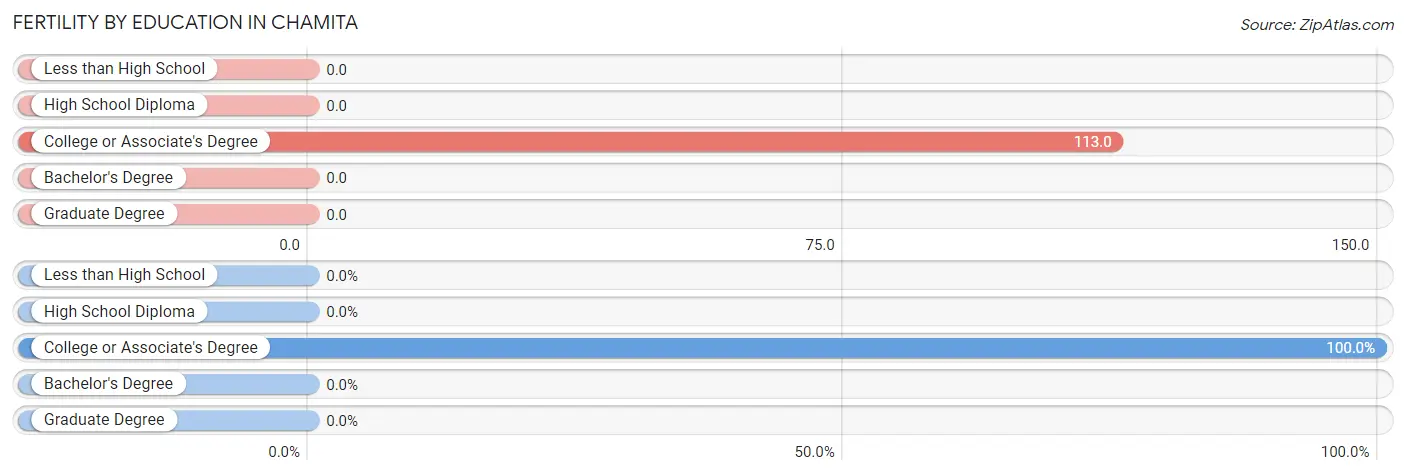
| Educational Attainment | Women with Births | Births / 1,000 Women |
| Less than High School | 0 (0.0%) | 0.0 |
| High School Diploma | 0 (0.0%) | 0.0 |
| College or Associate's Degree | 7 (100.0%) | 113.0 |
| Bachelor's Degree | 0 (0.0%) | 0.0 |
| Graduate Degree | 0 (0.0%) | 0.0 |
| Total | 7 (100.0%) | 39.0 |
Fertility by Education by Marriage Status in Chamita
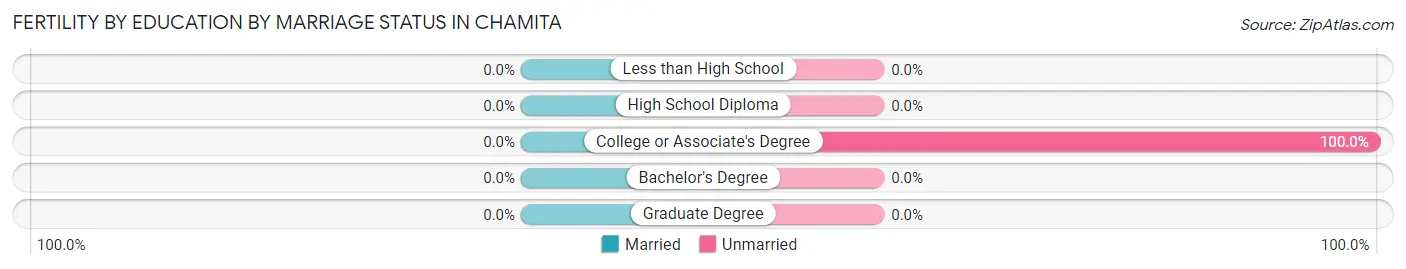
| Educational Attainment | Married | Unmarried |
| Less than High School | 0 (0.0%) | 0 (0.0%) |
| High School Diploma | 0 (0.0%) | 0 (0.0%) |
| College or Associate's Degree | 0 (0.0%) | 7 (100.0%) |
| Bachelor's Degree | 0 (0.0%) | 0 (0.0%) |
| Graduate Degree | 0 (0.0%) | 0 (0.0%) |
| Total | 0 (0.0%) | 7 (100.0%) |
Employment Characteristics in Chamita
Employment by Class of Employer in Chamita
Among the 346 employed individuals in Chamita, private company employees (225 | 65.0%), local government employees (37 | 10.7%), and state government employees (37 | 10.7%) make up the most common classes of employment.
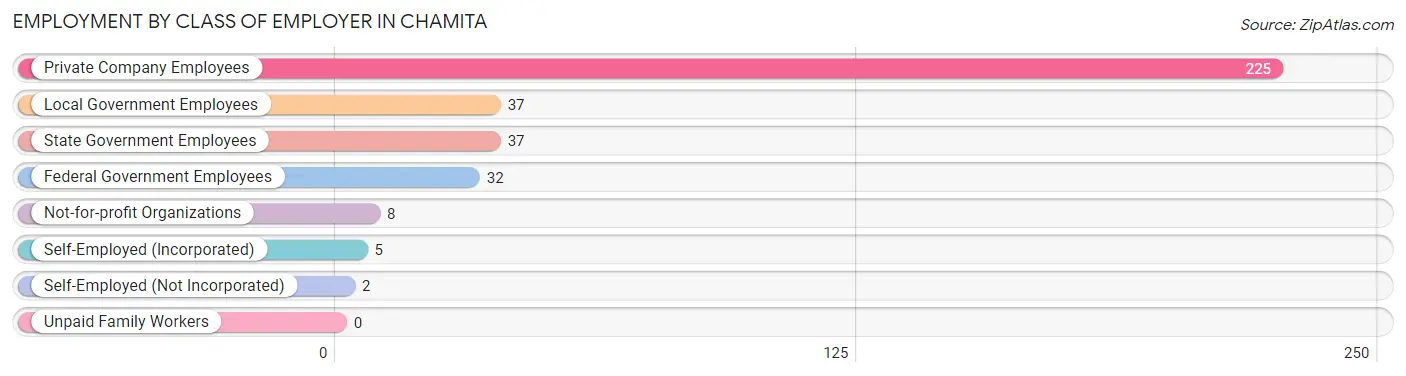
| Employer Class | # Employees | % Employees |
| Private Company Employees | 225 | 65.0% |
| Self-Employed (Incorporated) | 5 | 1.5% |
| Self-Employed (Not Incorporated) | 2 | 0.6% |
| Not-for-profit Organizations | 8 | 2.3% |
| Local Government Employees | 37 | 10.7% |
| State Government Employees | 37 | 10.7% |
| Federal Government Employees | 32 | 9.2% |
| Unpaid Family Workers | 0 | 0.0% |
| Total | 346 | 100.0% |
Employment Status by Age in Chamita
According to the labor force statistics for Chamita, out of the total population over 16 years of age (672), 55.7% or 374 individuals are in the labor force, with 7.5% or 28 of them unemployed. The age group with the highest labor force participation rate is 30 to 34 years, with 100.0% or 38 individuals in the labor force. Within the labor force, the 20 to 24 years age range has the highest percentage of unemployed individuals, with 29.2% or 7 of them being unemployed.
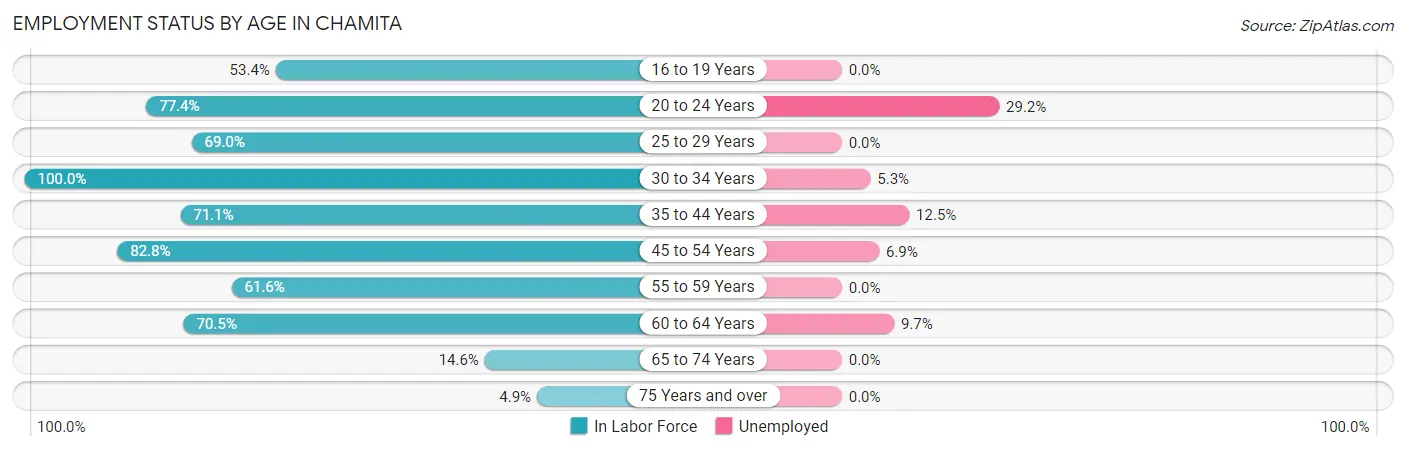
| Age Bracket | In Labor Force | Unemployed |
| 16 to 19 Years | 31 (53.4%) | 0 (0.0%) |
| 20 to 24 Years | 24 (77.4%) | 7 (29.2%) |
| 25 to 29 Years | 20 (69.0%) | 0 (0.0%) |
| 30 to 34 Years | 38 (100.0%) | 2 (5.3%) |
| 35 to 44 Years | 64 (71.1%) | 8 (12.5%) |
| 45 to 54 Years | 72 (82.8%) | 5 (6.9%) |
| 55 to 59 Years | 45 (61.6%) | 0 (0.0%) |
| 60 to 64 Years | 62 (70.5%) | 6 (9.7%) |
| 65 to 74 Years | 14 (14.6%) | 0 (0.0%) |
| 75 Years and over | 4 (4.9%) | 0 (0.0%) |
| Total | 374 (55.7%) | 28 (7.5%) |
Employment Status by Educational Attainment in Chamita
According to labor force statistics for Chamita, 74.3% of individuals (301) out of the total population between 25 and 64 years of age (405) are in the labor force, with 7.0% or 21 of them being unemployed. The group with the highest labor force participation rate are those with the educational attainment of bachelor's degree or higher, with 96.6% or 28 individuals in the labor force. Within the labor force, individuals with high school diploma education have the highest percentage of unemployment, with 11.2% or 12 of them being unemployed.
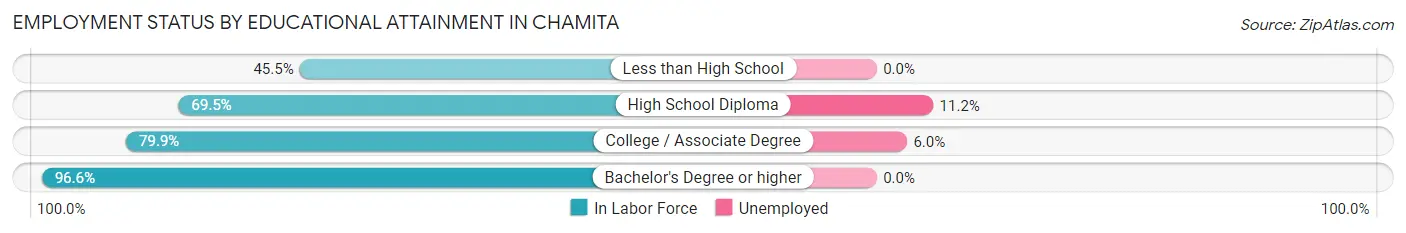
| Educational Attainment | In Labor Force | Unemployed |
| Less than High School | 15 (45.5%) | 0 (0.0%) |
| High School Diploma | 107 (69.5%) | 17 (11.2%) |
| College / Associate Degree | 151 (79.9%) | 11 (6.0%) |
| Bachelor's Degree or higher | 28 (96.6%) | 0 (0.0%) |
| Total | 301 (74.3%) | 28 (7.0%) |
Employment Occupations by Sex in Chamita
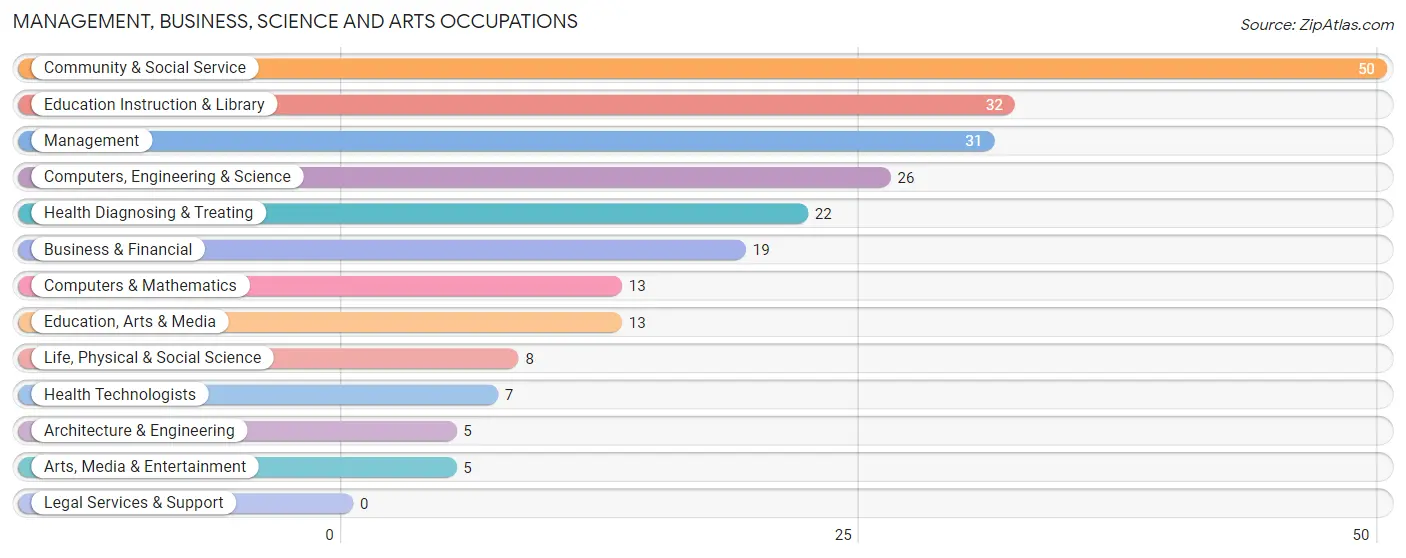
Management, Business, Science and Arts Occupations
The most common Management, Business, Science and Arts occupations in Chamita are Community & Social Service (50 | 14.4%), Education Instruction & Library (32 | 9.2%), Management (31 | 9.0%), Computers, Engineering & Science (26 | 7.5%), and Health Diagnosing & Treating (22 | 6.4%).
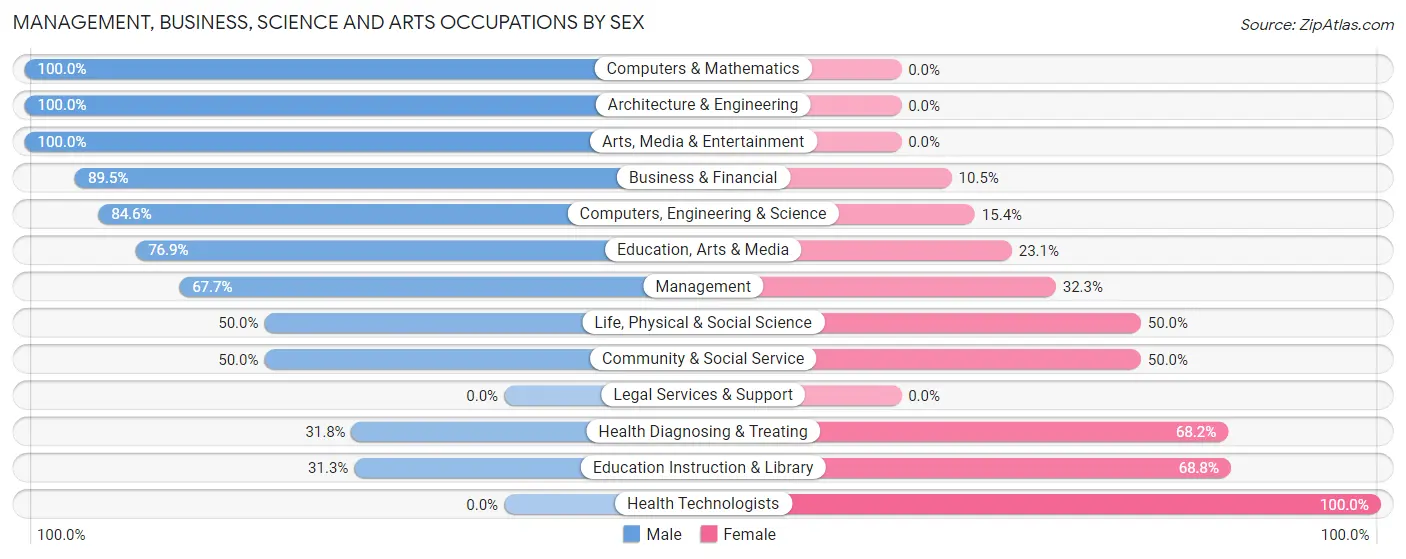
Management, Business, Science and Arts Occupations by Sex
Within the Management, Business, Science and Arts occupations in Chamita, the most male-oriented occupations are Computers & Mathematics (100.0%), Architecture & Engineering (100.0%), and Arts, Media & Entertainment (100.0%), while the most female-oriented occupations are Health Technologists (100.0%), Education Instruction & Library (68.8%), and Health Diagnosing & Treating (68.2%).
| Occupation | Male | Female |
| Management | 21 (67.7%) | 10 (32.3%) |
| Business & Financial | 17 (89.5%) | 2 (10.5%) |
| Computers, Engineering & Science | 22 (84.6%) | 4 (15.4%) |
| Computers & Mathematics | 13 (100.0%) | 0 (0.0%) |
| Architecture & Engineering | 5 (100.0%) | 0 (0.0%) |
| Life, Physical & Social Science | 4 (50.0%) | 4 (50.0%) |
| Community & Social Service | 25 (50.0%) | 25 (50.0%) |
| Education, Arts & Media | 10 (76.9%) | 3 (23.1%) |
| Legal Services & Support | 0 (0.0%) | 0 (0.0%) |
| Education Instruction & Library | 10 (31.2%) | 22 (68.8%) |
| Arts, Media & Entertainment | 5 (100.0%) | 0 (0.0%) |
| Health Diagnosing & Treating | 7 (31.8%) | 15 (68.2%) |
| Health Technologists | 0 (0.0%) | 7 (100.0%) |
| Total (Category) | 92 (62.2%) | 56 (37.8%) |
| Total (Overall) | 192 (55.5%) | 154 (44.5%) |
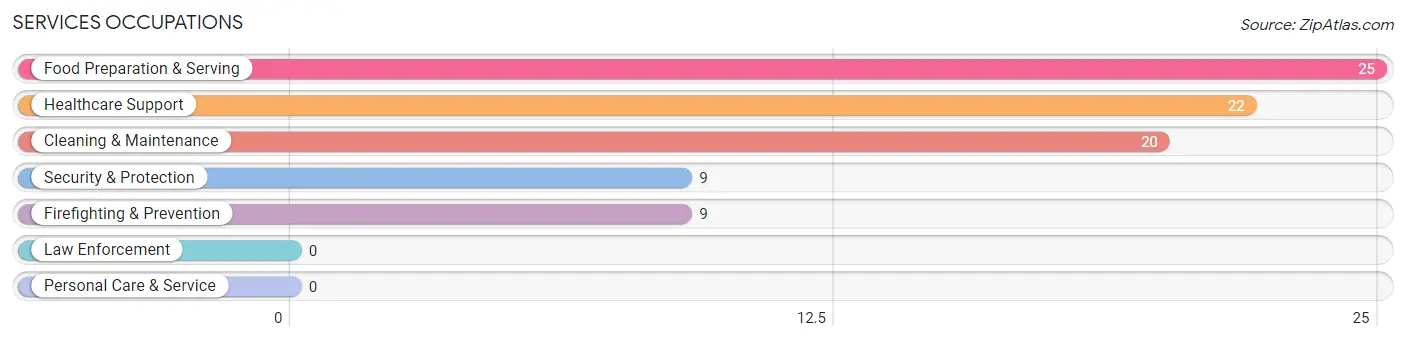
Services Occupations
The most common Services occupations in Chamita are Food Preparation & Serving (25 | 7.2%), Healthcare Support (22 | 6.4%), Cleaning & Maintenance (20 | 5.8%), Security & Protection (9 | 2.6%), and Firefighting & Prevention (9 | 2.6%).
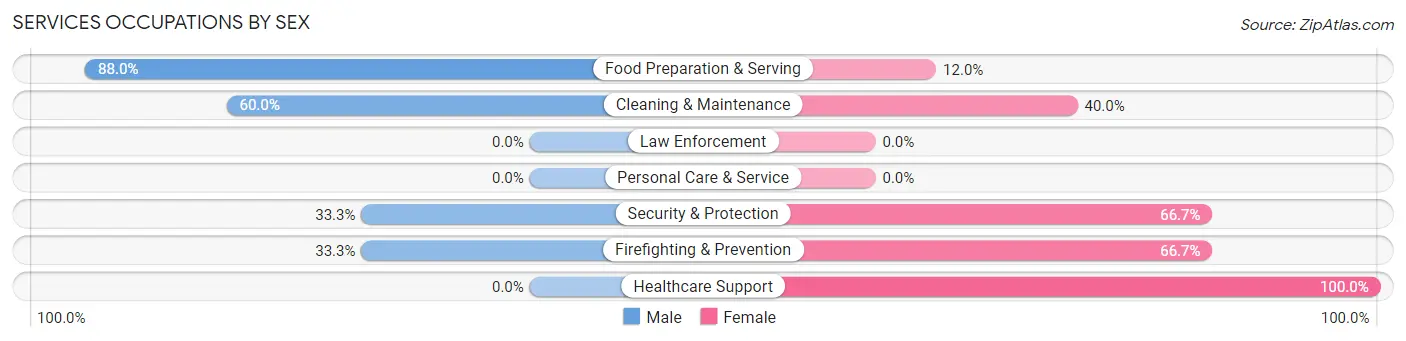
Services Occupations by Sex
Within the Services occupations in Chamita, the most male-oriented occupations are Food Preparation & Serving (88.0%), Cleaning & Maintenance (60.0%), and Security & Protection (33.3%), while the most female-oriented occupations are Healthcare Support (100.0%), Security & Protection (66.7%), and Firefighting & Prevention (66.7%).
| Occupation | Male | Female |
| Healthcare Support | 0 (0.0%) | 22 (100.0%) |
| Security & Protection | 3 (33.3%) | 6 (66.7%) |
| Firefighting & Prevention | 3 (33.3%) | 6 (66.7%) |
| Law Enforcement | 0 (0.0%) | 0 (0.0%) |
| Food Preparation & Serving | 22 (88.0%) | 3 (12.0%) |
| Cleaning & Maintenance | 12 (60.0%) | 8 (40.0%) |
| Personal Care & Service | 0 (0.0%) | 0 (0.0%) |
| Total (Category) | 37 (48.7%) | 39 (51.3%) |
| Total (Overall) | 192 (55.5%) | 154 (44.5%) |
Sales and Office Occupations
The most common Sales and Office occupations in Chamita are Office & Administration (32 | 9.2%), and Sales & Related (9 | 2.6%).
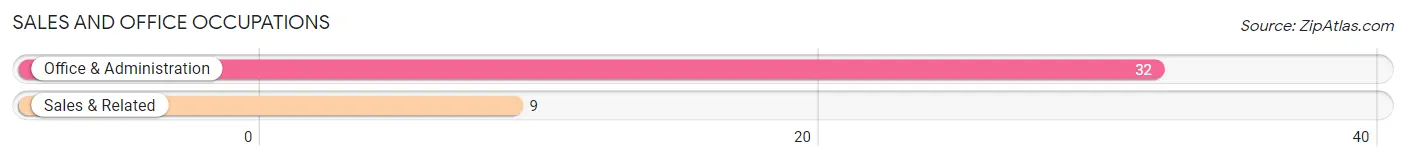
Sales and Office Occupations by Sex
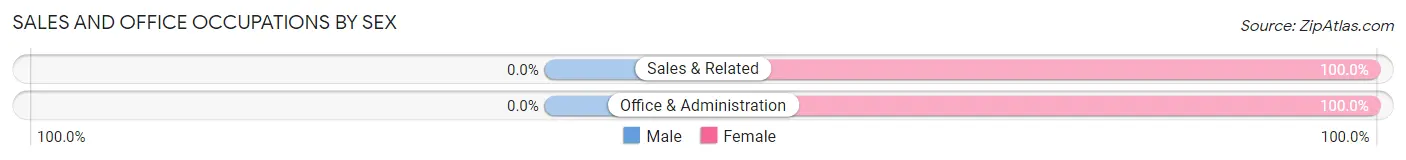
| Occupation | Male | Female |
| Sales & Related | 0 (0.0%) | 9 (100.0%) |
| Office & Administration | 0 (0.0%) | 32 (100.0%) |
| Total (Category) | 0 (0.0%) | 41 (100.0%) |
| Total (Overall) | 192 (55.5%) | 154 (44.5%) |
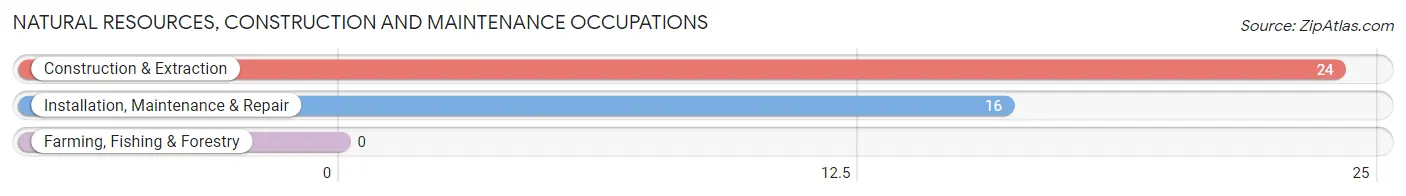
Natural Resources, Construction and Maintenance Occupations
The most common Natural Resources, Construction and Maintenance occupations in Chamita are Construction & Extraction (24 | 6.9%), and Installation, Maintenance & Repair (16 | 4.6%).
Natural Resources, Construction and Maintenance Occupations by Sex
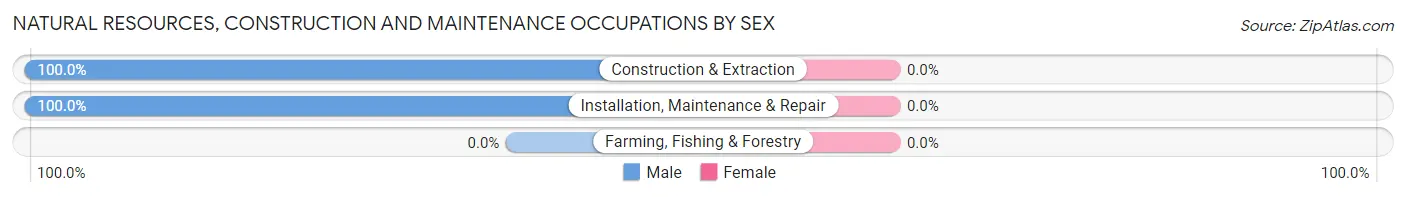
| Occupation | Male | Female |
| Farming, Fishing & Forestry | 0 (0.0%) | 0 (0.0%) |
| Construction & Extraction | 24 (100.0%) | 0 (0.0%) |
| Installation, Maintenance & Repair | 16 (100.0%) | 0 (0.0%) |
| Total (Category) | 40 (100.0%) | 0 (0.0%) |
| Total (Overall) | 192 (55.5%) | 154 (44.5%) |
Production, Transportation and Moving Occupations
The most common Production, Transportation and Moving occupations in Chamita are Material Moving (21 | 6.1%), and Transportation (20 | 5.8%).
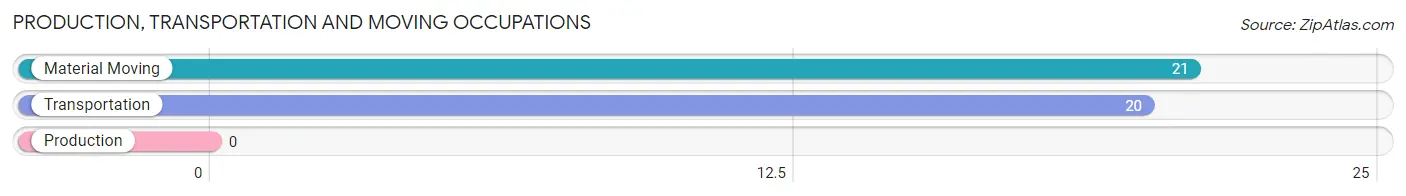
Production, Transportation and Moving Occupations by Sex
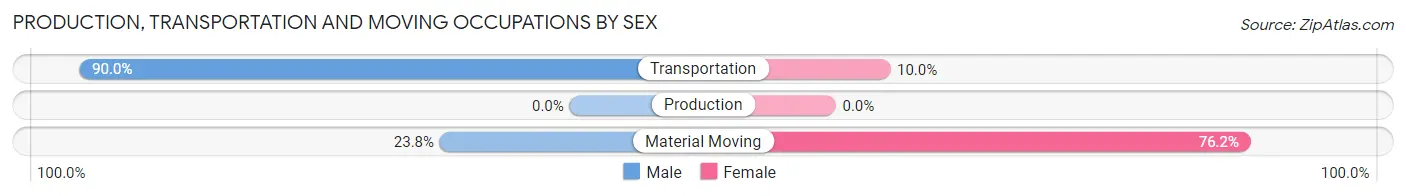
| Occupation | Male | Female |
| Production | 0 (0.0%) | 0 (0.0%) |
| Transportation | 18 (90.0%) | 2 (10.0%) |
| Material Moving | 5 (23.8%) | 16 (76.2%) |
| Total (Category) | 23 (56.1%) | 18 (43.9%) |
| Total (Overall) | 192 (55.5%) | 154 (44.5%) |
Employment Industries by Sex in Chamita
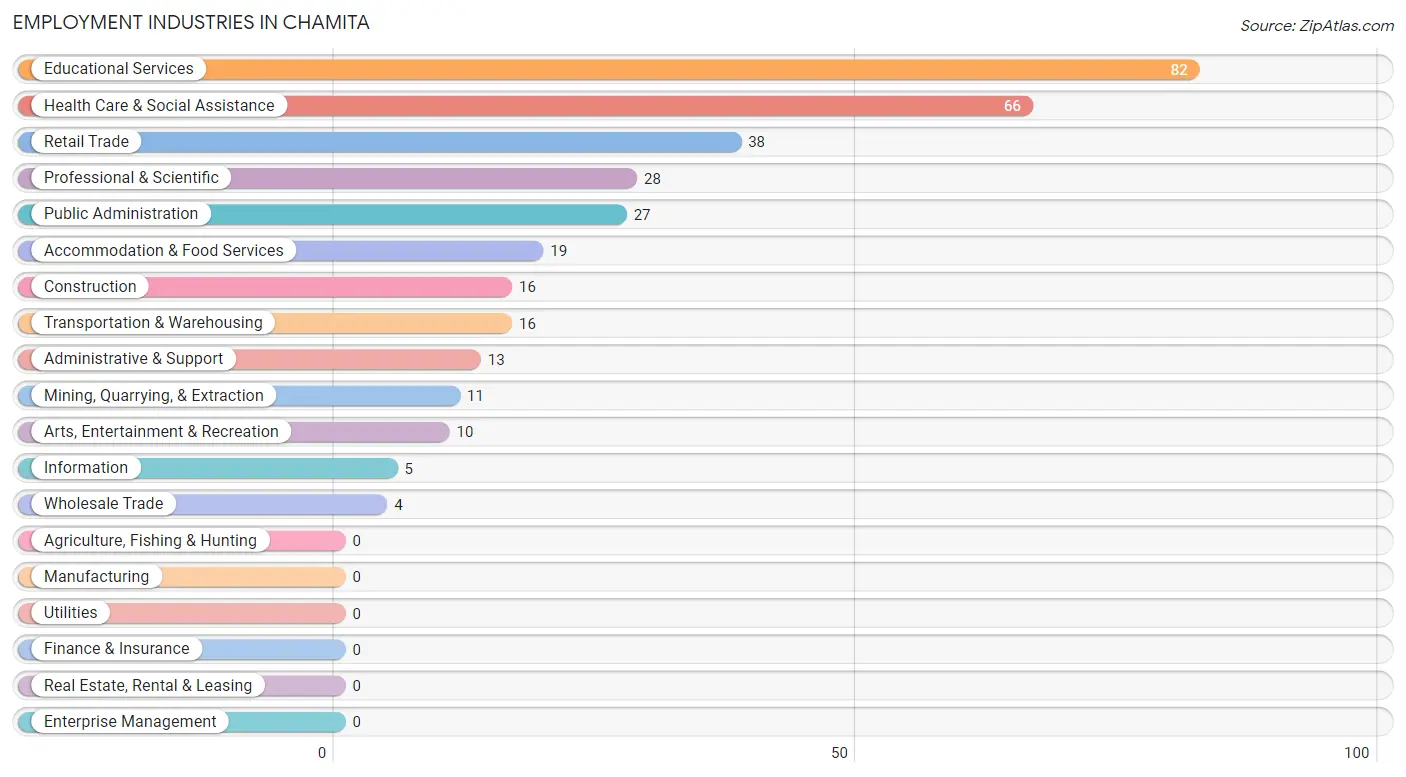
Employment Industries in Chamita
The major employment industries in Chamita include Educational Services (82 | 23.7%), Health Care & Social Assistance (66 | 19.1%), Retail Trade (38 | 11.0%), Professional & Scientific (28 | 8.1%), and Public Administration (27 | 7.8%).
Employment Industries by Sex in Chamita
The Chamita industries that see more men than women are Mining, Quarrying, & Extraction (100.0%), Transportation & Warehousing (100.0%), and Information (100.0%), whereas the industries that tend to have a higher number of women are Wholesale Trade (100.0%), Administrative & Support (100.0%), and Retail Trade (92.1%).
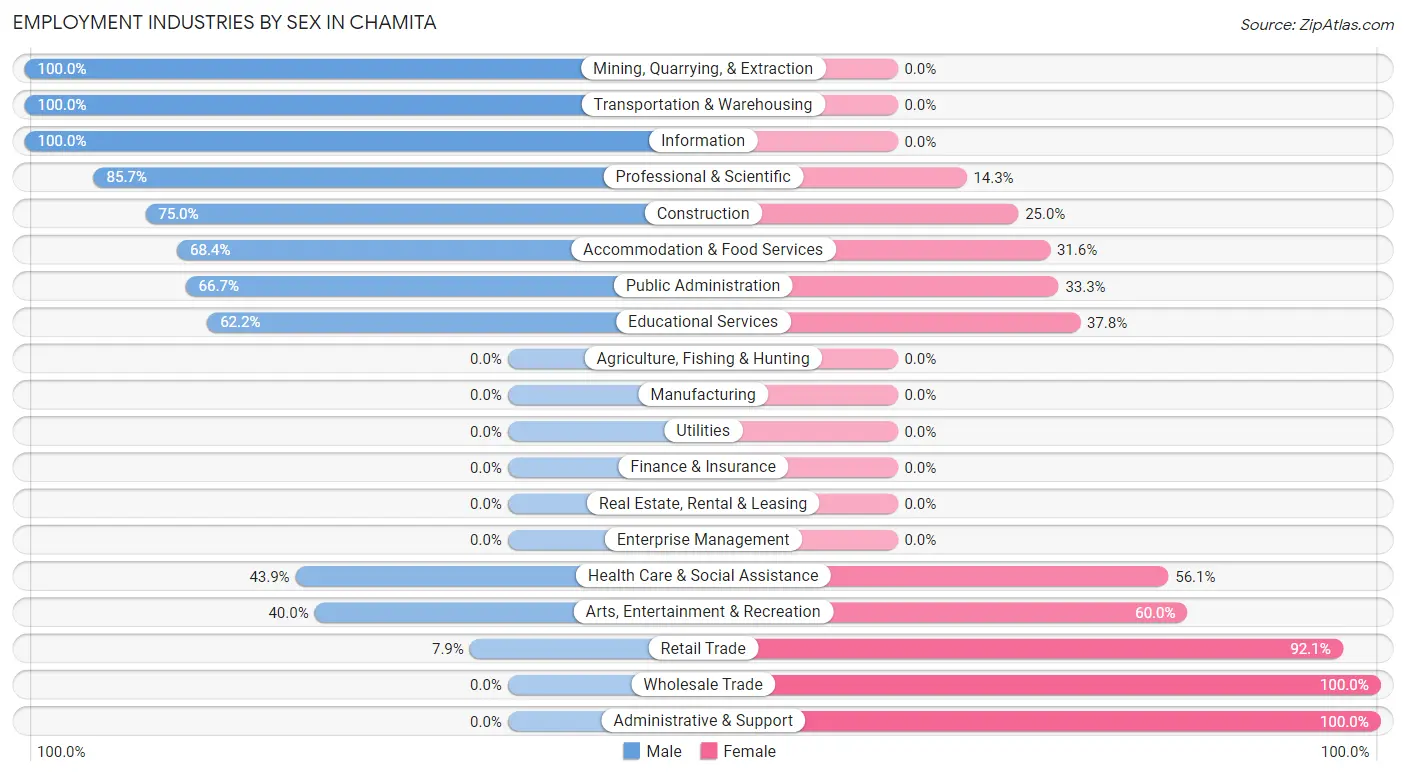
| Industry | Male | Female |
| Agriculture, Fishing & Hunting | 0 (0.0%) | 0 (0.0%) |
| Mining, Quarrying, & Extraction | 11 (100.0%) | 0 (0.0%) |
| Construction | 12 (75.0%) | 4 (25.0%) |
| Manufacturing | 0 (0.0%) | 0 (0.0%) |
| Wholesale Trade | 0 (0.0%) | 4 (100.0%) |
| Retail Trade | 3 (7.9%) | 35 (92.1%) |
| Transportation & Warehousing | 16 (100.0%) | 0 (0.0%) |
| Utilities | 0 (0.0%) | 0 (0.0%) |
| Information | 5 (100.0%) | 0 (0.0%) |
| Finance & Insurance | 0 (0.0%) | 0 (0.0%) |
| Real Estate, Rental & Leasing | 0 (0.0%) | 0 (0.0%) |
| Professional & Scientific | 24 (85.7%) | 4 (14.3%) |
| Enterprise Management | 0 (0.0%) | 0 (0.0%) |
| Administrative & Support | 0 (0.0%) | 13 (100.0%) |
| Educational Services | 51 (62.2%) | 31 (37.8%) |
| Health Care & Social Assistance | 29 (43.9%) | 37 (56.1%) |
| Arts, Entertainment & Recreation | 4 (40.0%) | 6 (60.0%) |
| Accommodation & Food Services | 13 (68.4%) | 6 (31.6%) |
| Public Administration | 18 (66.7%) | 9 (33.3%) |
| Total | 192 (55.5%) | 154 (44.5%) |
Education in Chamita
School Enrollment in Chamita
The most common levels of schooling among the 207 students in Chamita are high school (70 | 33.8%), middle school (63 | 30.4%), and college / undergraduate (48 | 23.2%).
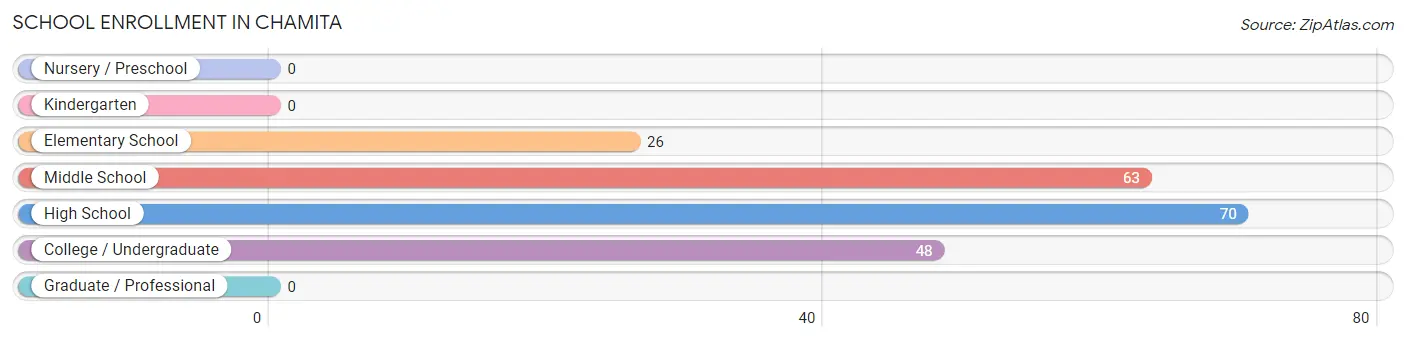
| School Level | # Students | % Students |
| Nursery / Preschool | 0 | 0.0% |
| Kindergarten | 0 | 0.0% |
| Elementary School | 26 | 12.6% |
| Middle School | 63 | 30.4% |
| High School | 70 | 33.8% |
| College / Undergraduate | 48 | 23.2% |
| Graduate / Professional | 0 | 0.0% |
| Total | 207 | 100.0% |
School Enrollment by Age by Funding Source in Chamita

| Age Bracket | Public School | Private School |
| 3 to 4 Year Olds | 0 (0.0%) | 0 (0.0%) |
| 5 to 9 Year Old | 26 (100.0%) | 0 (0.0%) |
| 10 to 14 Year Olds | 85 (100.0%) | 0 (0.0%) |
| 15 to 17 Year Olds | 33 (100.0%) | 0 (0.0%) |
| 18 to 19 Year Olds | 26 (100.0%) | 0 (0.0%) |
| 20 to 24 Year Olds | 7 (100.0%) | 0 (0.0%) |
| 25 to 34 Year Olds | 22 (100.0%) | 0 (0.0%) |
| 35 Years and over | 8 (100.0%) | 0 (0.0%) |
| Total | 207 (100.0%) | 0 (0.0%) |
Educational Attainment by Field of Study in Chamita
Computers & mathematics (9 | 24.3%), science & technology (8 | 21.6%), business (7 | 18.9%), psychology (4 | 10.8%), and engineering (4 | 10.8%) are the most common fields of study among 37 individuals in Chamita who have obtained a bachelor's degree or higher.
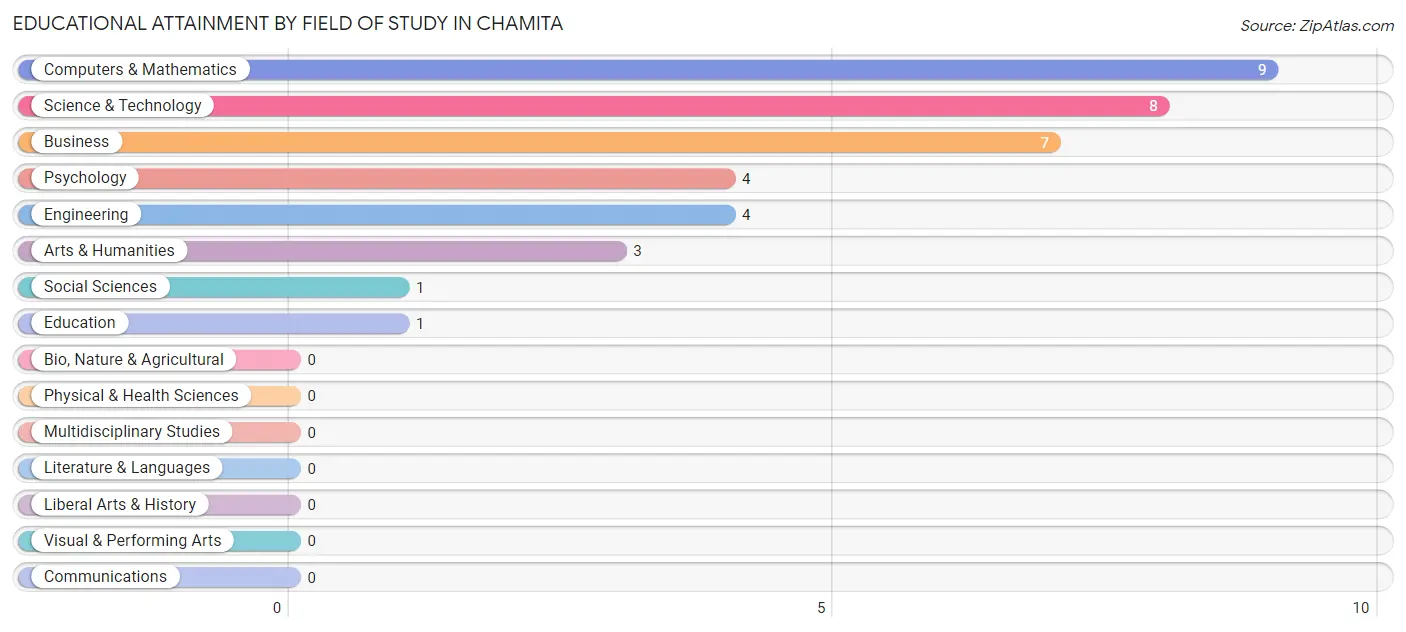
| Field of Study | # Graduates | % Graduates |
| Computers & Mathematics | 9 | 24.3% |
| Bio, Nature & Agricultural | 0 | 0.0% |
| Physical & Health Sciences | 0 | 0.0% |
| Psychology | 4 | 10.8% |
| Social Sciences | 1 | 2.7% |
| Engineering | 4 | 10.8% |
| Multidisciplinary Studies | 0 | 0.0% |
| Science & Technology | 8 | 21.6% |
| Business | 7 | 18.9% |
| Education | 1 | 2.7% |
| Literature & Languages | 0 | 0.0% |
| Liberal Arts & History | 0 | 0.0% |
| Visual & Performing Arts | 0 | 0.0% |
| Communications | 0 | 0.0% |
| Arts & Humanities | 3 | 8.1% |
| Total | 37 | 100.0% |
Transportation & Commute in Chamita
Vehicle Availability by Sex in Chamita
The most prevalent vehicle ownership categories in Chamita are males with 2 vehicles (61, accounting for 31.8%) and females with 2 vehicles (31, making up 39.6%).
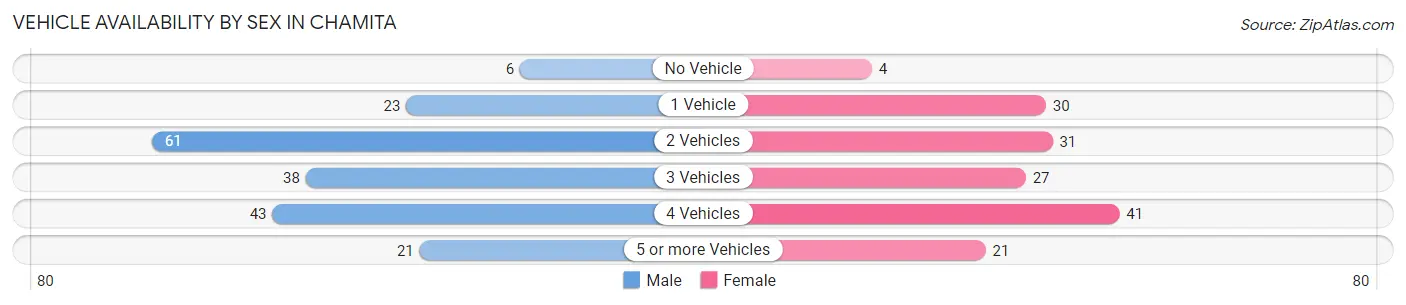
| Vehicles Available | Male | Female |
| No Vehicle | 6 (3.1%) | 4 (2.6%) |
| 1 Vehicle | 23 (12.0%) | 30 (19.5%) |
| 2 Vehicles | 61 (31.8%) | 31 (20.1%) |
| 3 Vehicles | 38 (19.8%) | 27 (17.5%) |
| 4 Vehicles | 43 (22.4%) | 41 (26.6%) |
| 5 or more Vehicles | 21 (10.9%) | 21 (13.6%) |
| Total | 192 (100.0%) | 154 (100.0%) |
Commute Time in Chamita
The most frequently occuring commute durations in Chamita are 15 to 19 minutes (70 commuters, 23.2%), 45 to 59 minutes (66 commuters, 21.8%), and 10 to 14 minutes (53 commuters, 17.5%).
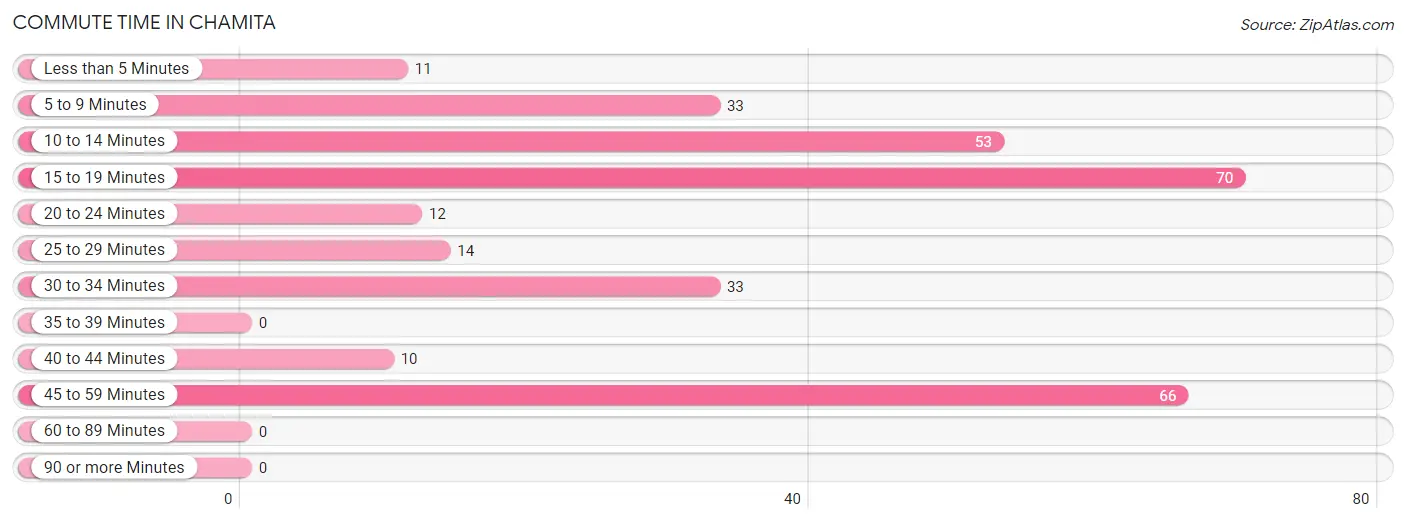
| Commute Time | # Commuters | % Commuters |
| Less than 5 Minutes | 11 | 3.6% |
| 5 to 9 Minutes | 33 | 10.9% |
| 10 to 14 Minutes | 53 | 17.5% |
| 15 to 19 Minutes | 70 | 23.2% |
| 20 to 24 Minutes | 12 | 4.0% |
| 25 to 29 Minutes | 14 | 4.6% |
| 30 to 34 Minutes | 33 | 10.9% |
| 35 to 39 Minutes | 0 | 0.0% |
| 40 to 44 Minutes | 10 | 3.3% |
| 45 to 59 Minutes | 66 | 21.8% |
| 60 to 89 Minutes | 0 | 0.0% |
| 90 or more Minutes | 0 | 0.0% |
Commute Time by Sex in Chamita
The most common commute times in Chamita are 45 to 59 minutes (54 commuters, 29.5%) for males and 15 to 19 minutes (37 commuters, 31.1%) for females.
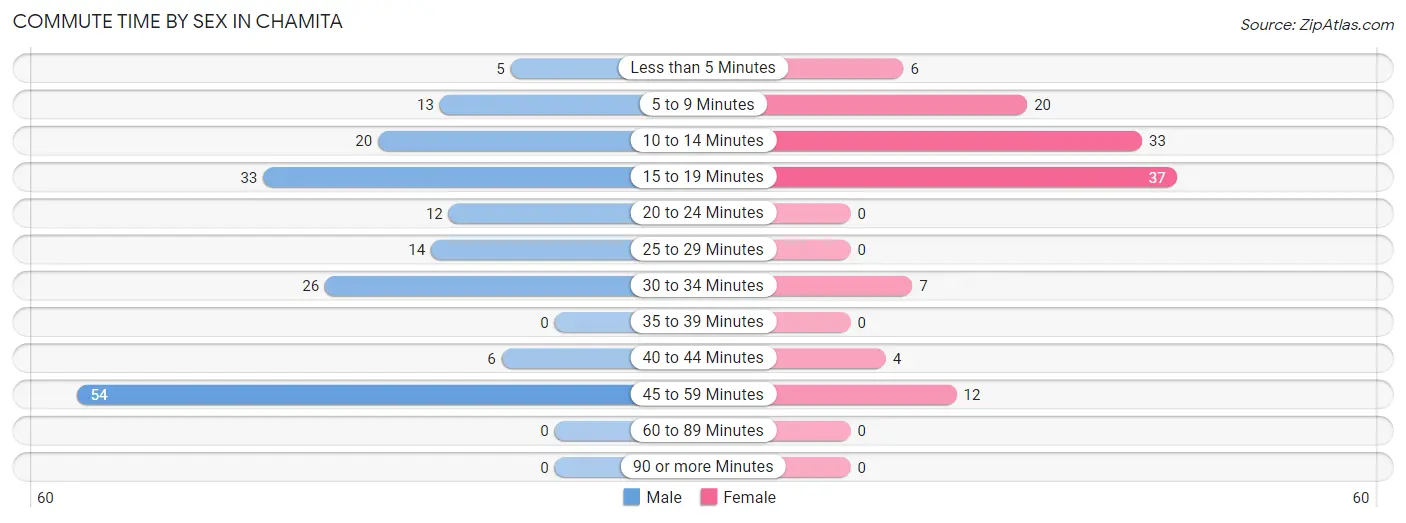
| Commute Time | Male | Female |
| Less than 5 Minutes | 5 (2.7%) | 6 (5.0%) |
| 5 to 9 Minutes | 13 (7.1%) | 20 (16.8%) |
| 10 to 14 Minutes | 20 (10.9%) | 33 (27.7%) |
| 15 to 19 Minutes | 33 (18.0%) | 37 (31.1%) |
| 20 to 24 Minutes | 12 (6.6%) | 0 (0.0%) |
| 25 to 29 Minutes | 14 (7.6%) | 0 (0.0%) |
| 30 to 34 Minutes | 26 (14.2%) | 7 (5.9%) |
| 35 to 39 Minutes | 0 (0.0%) | 0 (0.0%) |
| 40 to 44 Minutes | 6 (3.3%) | 4 (3.4%) |
| 45 to 59 Minutes | 54 (29.5%) | 12 (10.1%) |
| 60 to 89 Minutes | 0 (0.0%) | 0 (0.0%) |
| 90 or more Minutes | 0 (0.0%) | 0 (0.0%) |
Time of Departure to Work by Sex in Chamita
The most frequent times of departure to work in Chamita are 7:00 AM to 7:29 AM (49, 26.8%) for males and 7:30 AM to 7:59 AM (28, 23.5%) for females.
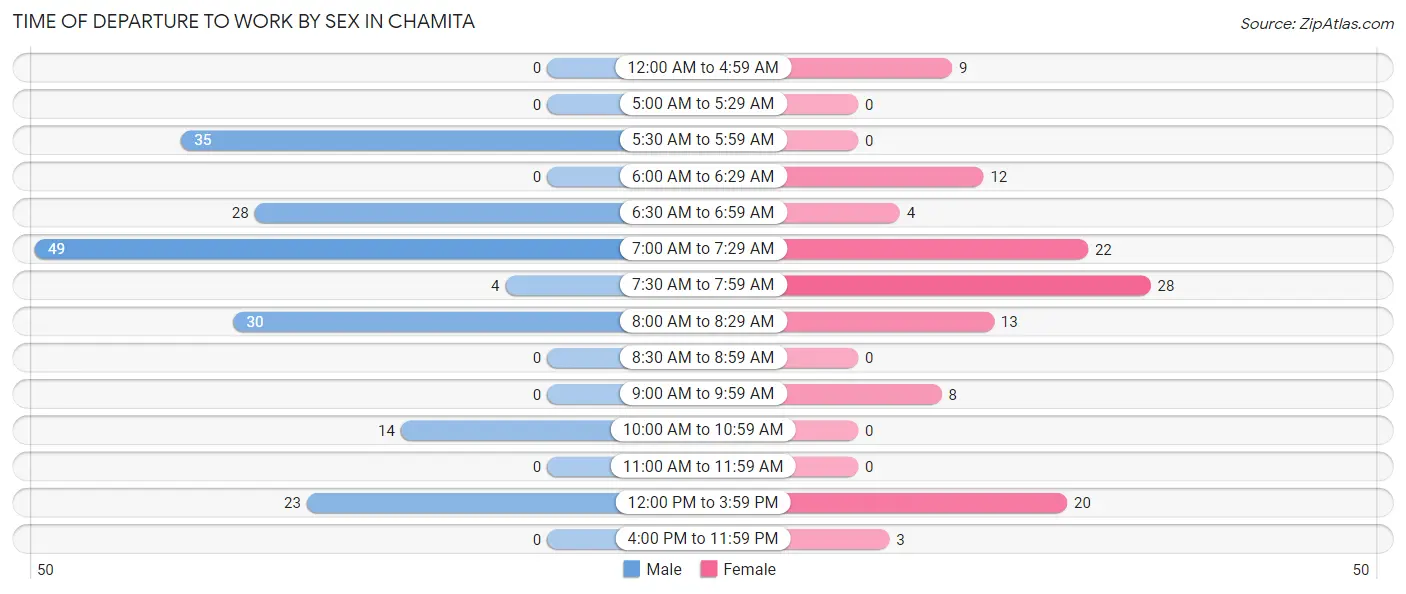
| Time of Departure | Male | Female |
| 12:00 AM to 4:59 AM | 0 (0.0%) | 9 (7.6%) |
| 5:00 AM to 5:29 AM | 0 (0.0%) | 0 (0.0%) |
| 5:30 AM to 5:59 AM | 35 (19.1%) | 0 (0.0%) |
| 6:00 AM to 6:29 AM | 0 (0.0%) | 12 (10.1%) |
| 6:30 AM to 6:59 AM | 28 (15.3%) | 4 (3.4%) |
| 7:00 AM to 7:29 AM | 49 (26.8%) | 22 (18.5%) |
| 7:30 AM to 7:59 AM | 4 (2.2%) | 28 (23.5%) |
| 8:00 AM to 8:29 AM | 30 (16.4%) | 13 (10.9%) |
| 8:30 AM to 8:59 AM | 0 (0.0%) | 0 (0.0%) |
| 9:00 AM to 9:59 AM | 0 (0.0%) | 8 (6.7%) |
| 10:00 AM to 10:59 AM | 14 (7.6%) | 0 (0.0%) |
| 11:00 AM to 11:59 AM | 0 (0.0%) | 0 (0.0%) |
| 12:00 PM to 3:59 PM | 23 (12.6%) | 20 (16.8%) |
| 4:00 PM to 11:59 PM | 0 (0.0%) | 3 (2.5%) |
| Total | 183 (100.0%) | 119 (100.0%) |
Housing Occupancy in Chamita
Occupancy by Ownership in Chamita
Of the total 323 dwellings in Chamita, owner-occupied units account for 282 (87.3%), while renter-occupied units make up 41 (12.7%).
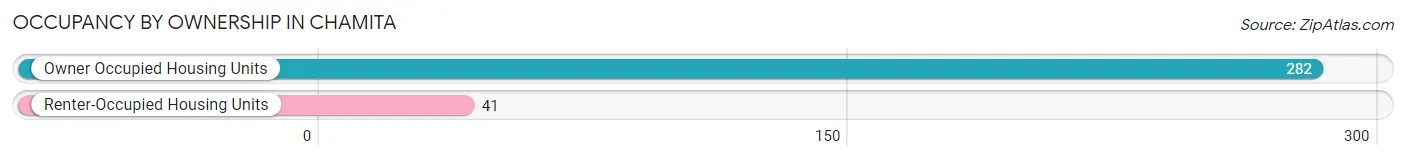
| Occupancy | # Housing Units | % Housing Units |
| Owner Occupied Housing Units | 282 | 87.3% |
| Renter-Occupied Housing Units | 41 | 12.7% |
| Total Occupied Housing Units | 323 | 100.0% |
Occupancy by Household Size in Chamita
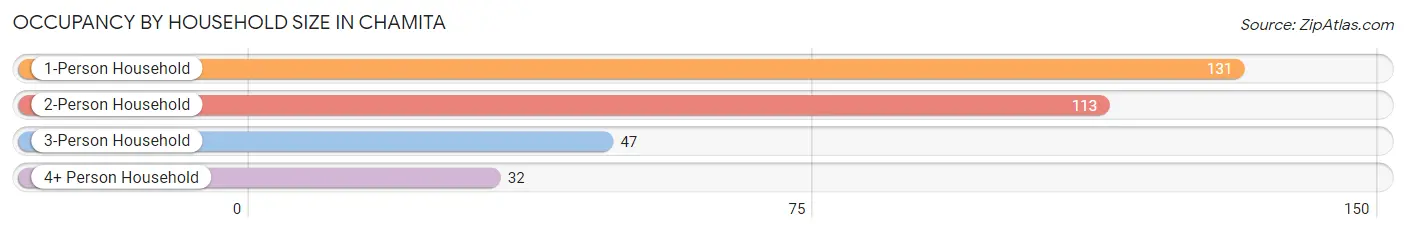
| Household Size | # Housing Units | % Housing Units |
| 1-Person Household | 131 | 40.6% |
| 2-Person Household | 113 | 35.0% |
| 3-Person Household | 47 | 14.5% |
| 4+ Person Household | 32 | 9.9% |
| Total Housing Units | 323 | 100.0% |
Occupancy by Ownership by Household Size in Chamita
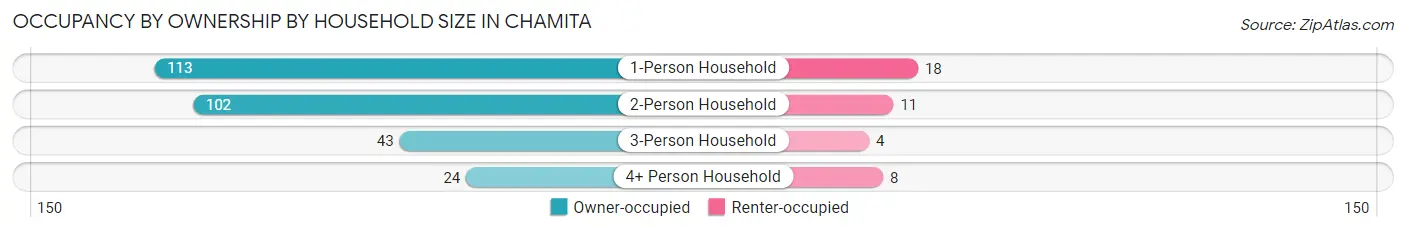
| Household Size | Owner-occupied | Renter-occupied |
| 1-Person Household | 113 (86.3%) | 18 (13.7%) |
| 2-Person Household | 102 (90.3%) | 11 (9.7%) |
| 3-Person Household | 43 (91.5%) | 4 (8.5%) |
| 4+ Person Household | 24 (75.0%) | 8 (25.0%) |
| Total Housing Units | 282 (87.3%) | 41 (12.7%) |
Occupancy by Educational Attainment in Chamita
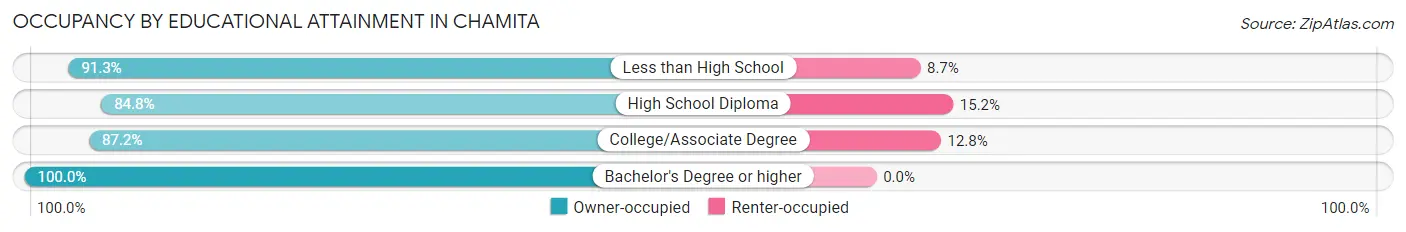
| Household Size | Owner-occupied | Renter-occupied |
| Less than High School | 42 (91.3%) | 4 (8.7%) |
| High School Diploma | 106 (84.8%) | 19 (15.2%) |
| College/Associate Degree | 123 (87.2%) | 18 (12.8%) |
| Bachelor's Degree or higher | 11 (100.0%) | 0 (0.0%) |
Occupancy by Age of Householder in Chamita
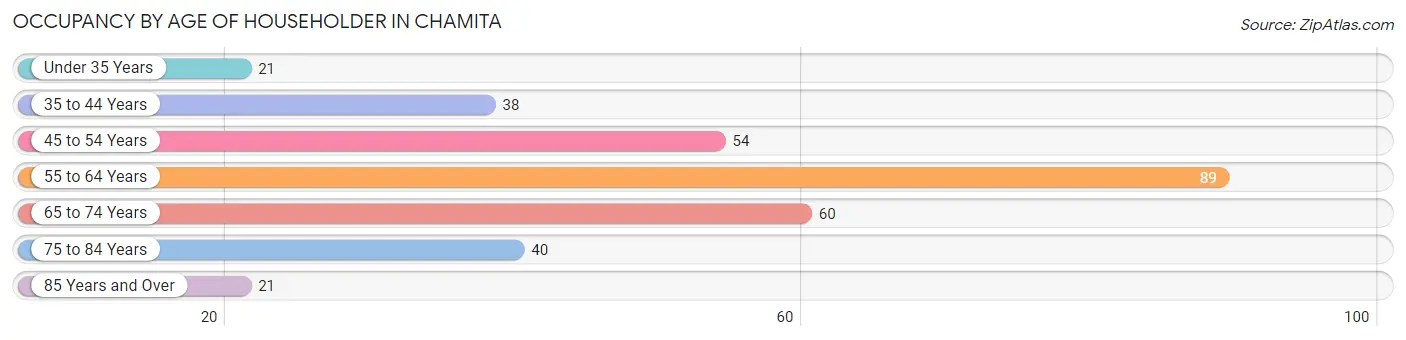
| Age Bracket | # Households | % Households |
| Under 35 Years | 21 | 6.5% |
| 35 to 44 Years | 38 | 11.8% |
| 45 to 54 Years | 54 | 16.7% |
| 55 to 64 Years | 89 | 27.6% |
| 65 to 74 Years | 60 | 18.6% |
| 75 to 84 Years | 40 | 12.4% |
| 85 Years and Over | 21 | 6.5% |
| Total | 323 | 100.0% |
Housing Finances in Chamita
Median Income by Occupancy in Chamita
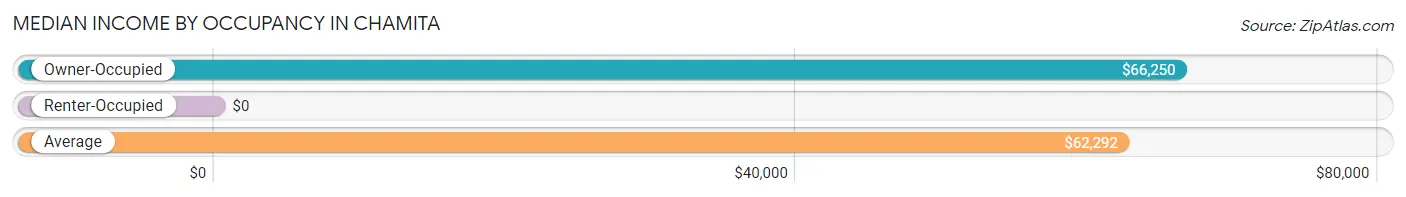
| Occupancy Type | # Households | Median Income |
| Owner-Occupied | 282 (87.3%) | $66,250 |
| Renter-Occupied | 41 (12.7%) | $0 |
| Average | 323 (100.0%) | $62,292 |
Occupancy by Householder Income Bracket in Chamita
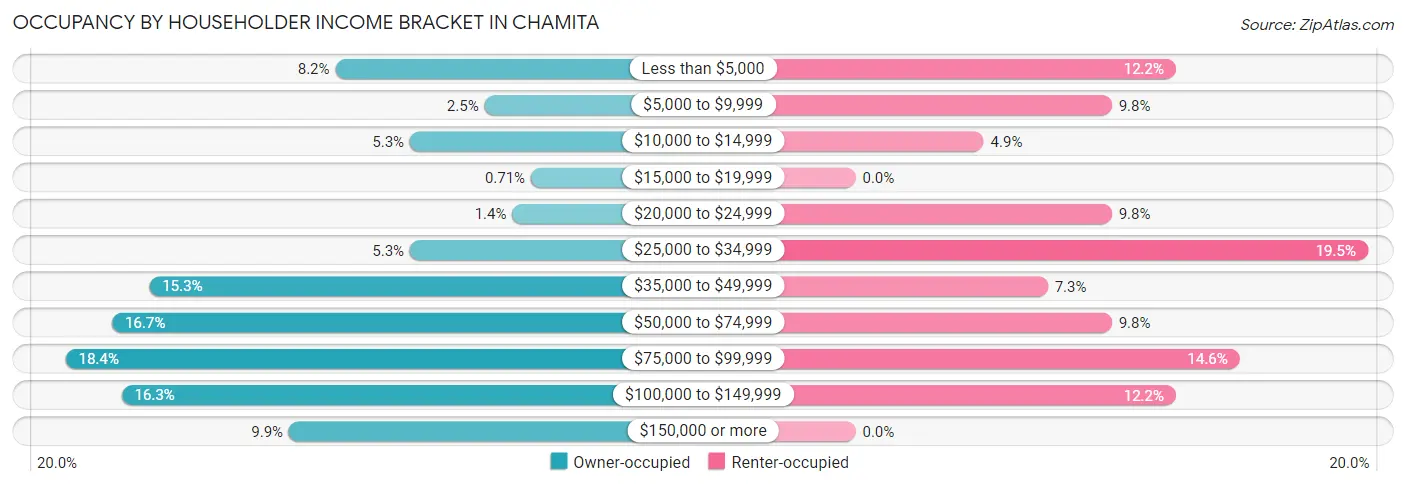
| Income Bracket | Owner-occupied | Renter-occupied |
| Less than $5,000 | 23 (8.2%) | 5 (12.2%) |
| $5,000 to $9,999 | 7 (2.5%) | 4 (9.8%) |
| $10,000 to $14,999 | 15 (5.3%) | 2 (4.9%) |
| $15,000 to $19,999 | 2 (0.7%) | 0 (0.0%) |
| $20,000 to $24,999 | 4 (1.4%) | 4 (9.8%) |
| $25,000 to $34,999 | 15 (5.3%) | 8 (19.5%) |
| $35,000 to $49,999 | 43 (15.2%) | 3 (7.3%) |
| $50,000 to $74,999 | 47 (16.7%) | 4 (9.8%) |
| $75,000 to $99,999 | 52 (18.4%) | 6 (14.6%) |
| $100,000 to $149,999 | 46 (16.3%) | 5 (12.2%) |
| $150,000 or more | 28 (9.9%) | 0 (0.0%) |
| Total | 282 (100.0%) | 41 (100.0%) |
Monthly Housing Cost Tiers in Chamita
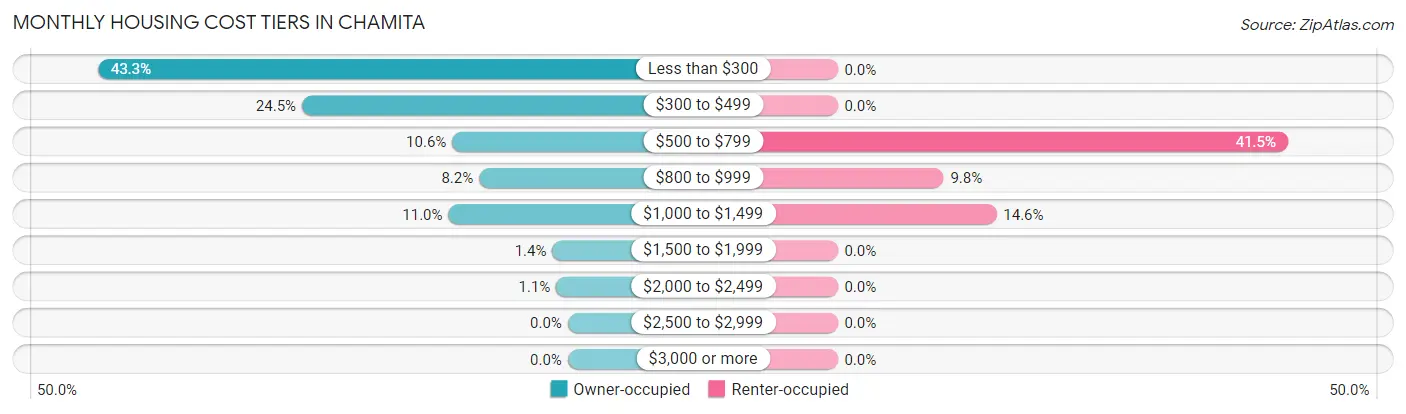
| Monthly Cost | Owner-occupied | Renter-occupied |
| Less than $300 | 122 (43.3%) | 0 (0.0%) |
| $300 to $499 | 69 (24.5%) | 0 (0.0%) |
| $500 to $799 | 30 (10.6%) | 17 (41.5%) |
| $800 to $999 | 23 (8.2%) | 4 (9.8%) |
| $1,000 to $1,499 | 31 (11.0%) | 6 (14.6%) |
| $1,500 to $1,999 | 4 (1.4%) | 0 (0.0%) |
| $2,000 to $2,499 | 3 (1.1%) | 0 (0.0%) |
| $2,500 to $2,999 | 0 (0.0%) | 0 (0.0%) |
| $3,000 or more | 0 (0.0%) | 0 (0.0%) |
| Total | 282 (100.0%) | 41 (100.0%) |
Physical Housing Characteristics in Chamita
Housing Structures in Chamita
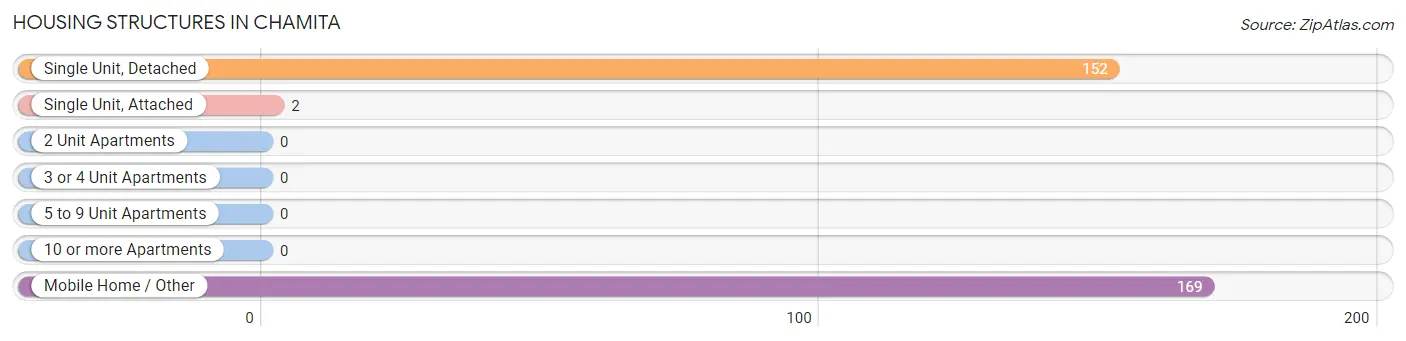
| Structure Type | # Housing Units | % Housing Units |
| Single Unit, Detached | 152 | 47.1% |
| Single Unit, Attached | 2 | 0.6% |
| 2 Unit Apartments | 0 | 0.0% |
| 3 or 4 Unit Apartments | 0 | 0.0% |
| 5 to 9 Unit Apartments | 0 | 0.0% |
| 10 or more Apartments | 0 | 0.0% |
| Mobile Home / Other | 169 | 52.3% |
| Total | 323 | 100.0% |
Housing Structures by Occupancy in Chamita
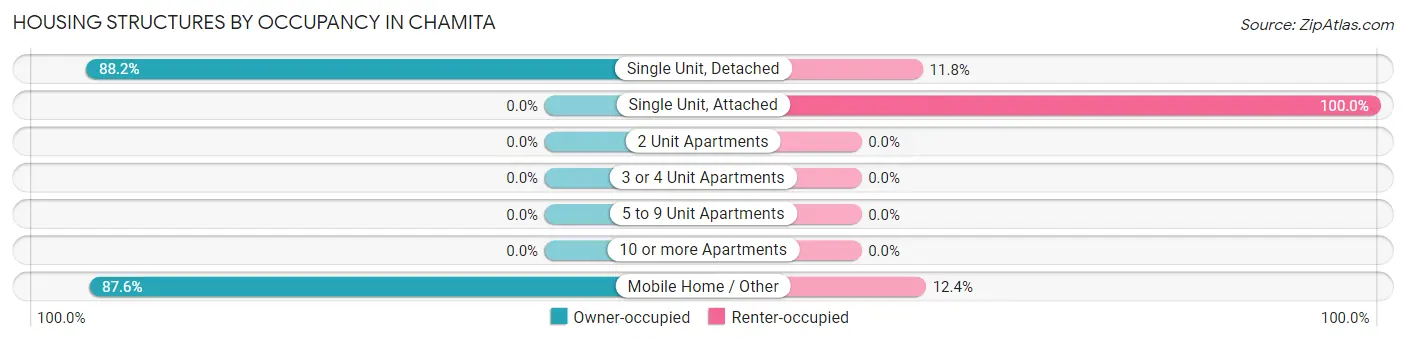
| Structure Type | Owner-occupied | Renter-occupied |
| Single Unit, Detached | 134 (88.2%) | 18 (11.8%) |
| Single Unit, Attached | 0 (0.0%) | 2 (100.0%) |
| 2 Unit Apartments | 0 (0.0%) | 0 (0.0%) |
| 3 or 4 Unit Apartments | 0 (0.0%) | 0 (0.0%) |
| 5 to 9 Unit Apartments | 0 (0.0%) | 0 (0.0%) |
| 10 or more Apartments | 0 (0.0%) | 0 (0.0%) |
| Mobile Home / Other | 148 (87.6%) | 21 (12.4%) |
| Total | 282 (87.3%) | 41 (12.7%) |
Housing Structures by Number of Rooms in Chamita
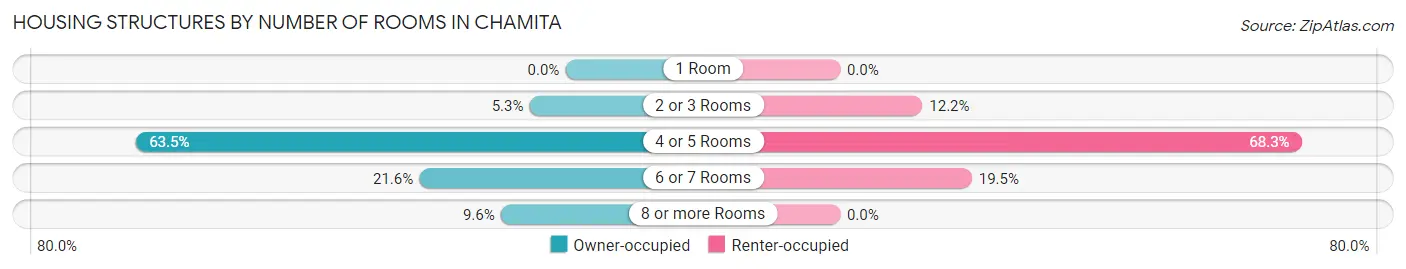
| Number of Rooms | Owner-occupied | Renter-occupied |
| 1 Room | 0 (0.0%) | 0 (0.0%) |
| 2 or 3 Rooms | 15 (5.3%) | 5 (12.2%) |
| 4 or 5 Rooms | 179 (63.5%) | 28 (68.3%) |
| 6 or 7 Rooms | 61 (21.6%) | 8 (19.5%) |
| 8 or more Rooms | 27 (9.6%) | 0 (0.0%) |
| Total | 282 (100.0%) | 41 (100.0%) |
Housing Structure by Heating Type in Chamita
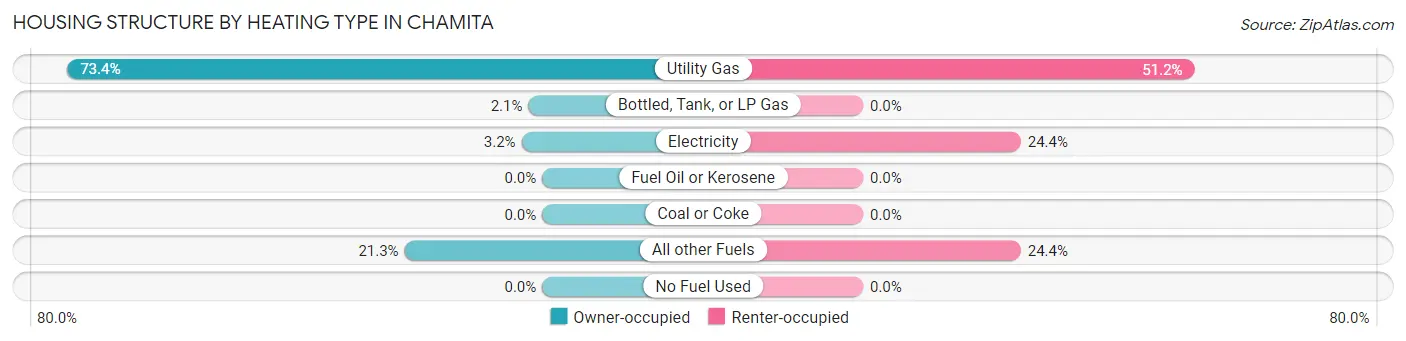
| Heating Type | Owner-occupied | Renter-occupied |
| Utility Gas | 207 (73.4%) | 21 (51.2%) |
| Bottled, Tank, or LP Gas | 6 (2.1%) | 0 (0.0%) |
| Electricity | 9 (3.2%) | 10 (24.4%) |
| Fuel Oil or Kerosene | 0 (0.0%) | 0 (0.0%) |
| Coal or Coke | 0 (0.0%) | 0 (0.0%) |
| All other Fuels | 60 (21.3%) | 10 (24.4%) |
| No Fuel Used | 0 (0.0%) | 0 (0.0%) |
| Total | 282 (100.0%) | 41 (100.0%) |
Household Vehicle Usage in Chamita
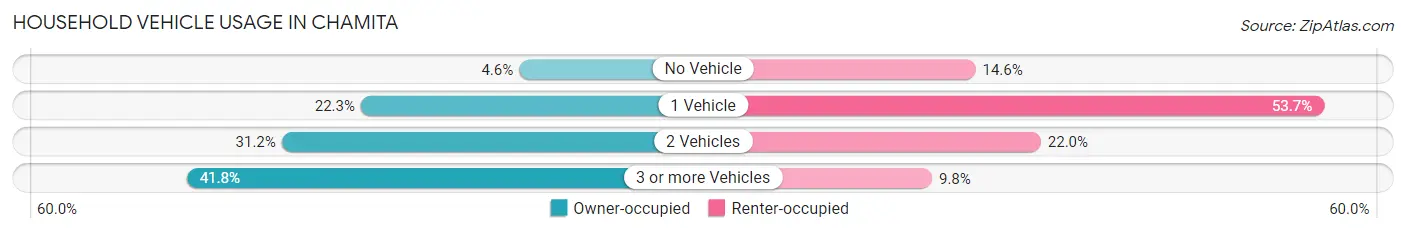
| Vehicles per Household | Owner-occupied | Renter-occupied |
| No Vehicle | 13 (4.6%) | 6 (14.6%) |
| 1 Vehicle | 63 (22.3%) | 22 (53.7%) |
| 2 Vehicles | 88 (31.2%) | 9 (22.0%) |
| 3 or more Vehicles | 118 (41.8%) | 4 (9.8%) |
| Total | 282 (100.0%) | 41 (100.0%) |
Real Estate & Mortgages in Chamita
Real Estate and Mortgage Overview in Chamita
| Characteristic | Without Mortgage | With Mortgage |
| Housing Units | 222 | 60 |
| Median Property Value | $253,100 | $191,700 |
| Median Household Income | $65,000 | $10 |
| Monthly Housing Costs | $287 | $0 |
| Real Estate Taxes | $725 | $0 |
Property Value by Mortgage Status in Chamita
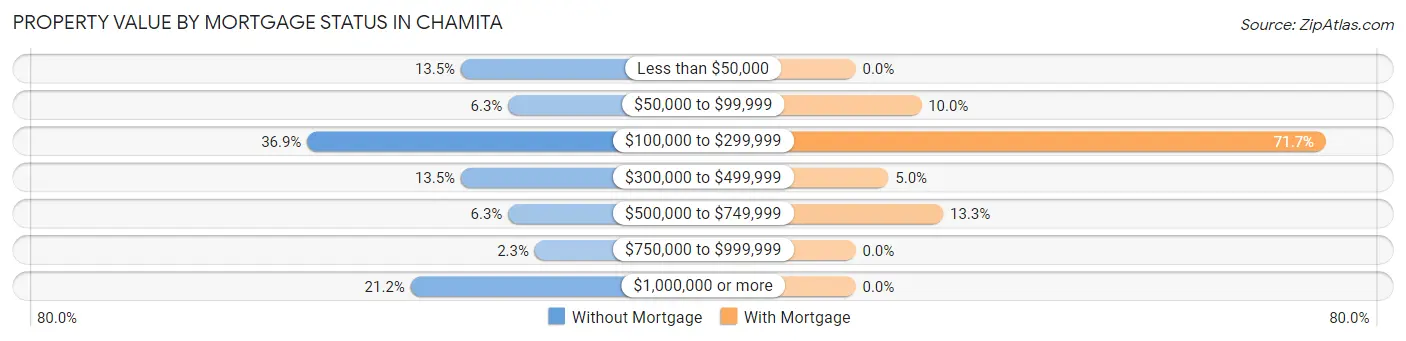
| Property Value | Without Mortgage | With Mortgage |
| Less than $50,000 | 30 (13.5%) | 0 (0.0%) |
| $50,000 to $99,999 | 14 (6.3%) | 6 (10.0%) |
| $100,000 to $299,999 | 82 (36.9%) | 43 (71.7%) |
| $300,000 to $499,999 | 30 (13.5%) | 3 (5.0%) |
| $500,000 to $749,999 | 14 (6.3%) | 8 (13.3%) |
| $750,000 to $999,999 | 5 (2.2%) | 0 (0.0%) |
| $1,000,000 or more | 47 (21.2%) | 0 (0.0%) |
| Total | 222 (100.0%) | 60 (100.0%) |
Household Income by Mortgage Status in Chamita
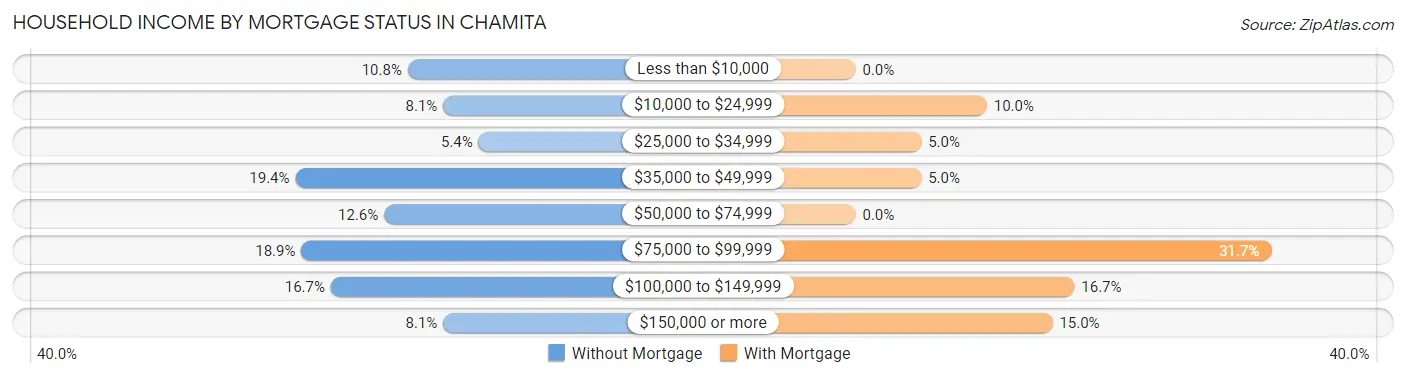
| Household Income | Without Mortgage | With Mortgage |
| Less than $10,000 | 24 (10.8%) | 0 (0.0%) |
| $10,000 to $24,999 | 18 (8.1%) | 6 (10.0%) |
| $25,000 to $34,999 | 12 (5.4%) | 3 (5.0%) |
| $35,000 to $49,999 | 43 (19.4%) | 3 (5.0%) |
| $50,000 to $74,999 | 28 (12.6%) | 0 (0.0%) |
| $75,000 to $99,999 | 42 (18.9%) | 19 (31.7%) |
| $100,000 to $149,999 | 37 (16.7%) | 10 (16.7%) |
| $150,000 or more | 18 (8.1%) | 9 (15.0%) |
| Total | 222 (100.0%) | 60 (100.0%) |
Property Value to Household Income Ratio in Chamita
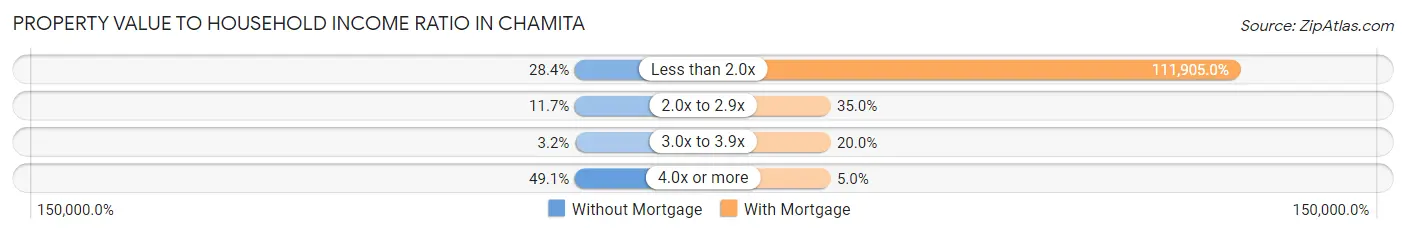
| Value-to-Income Ratio | Without Mortgage | With Mortgage |
| Less than 2.0x | 63 (28.4%) | 67,143 (111,905.0%) |
| 2.0x to 2.9x | 26 (11.7%) | 21 (35.0%) |
| 3.0x to 3.9x | 7 (3.2%) | 12 (20.0%) |
| 4.0x or more | 109 (49.1%) | 3 (5.0%) |
| Total | 222 (100.0%) | 60 (100.0%) |
Real Estate Taxes by Mortgage Status in Chamita
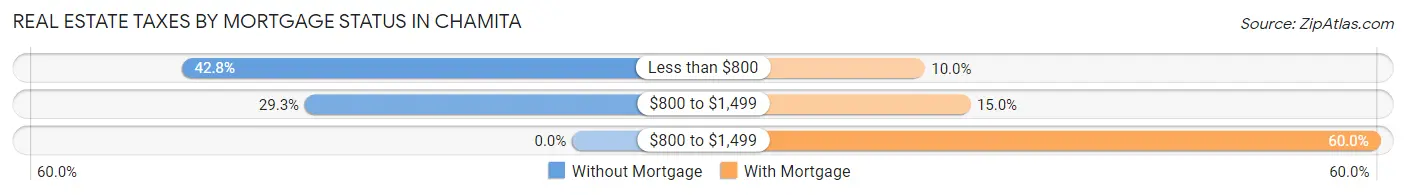
| Property Taxes | Without Mortgage | With Mortgage |
| Less than $800 | 95 (42.8%) | 6 (10.0%) |
| $800 to $1,499 | 65 (29.3%) | 9 (15.0%) |
| $800 to $1,499 | 0 (0.0%) | 36 (60.0%) |
| Total | 222 (100.0%) | 60 (100.0%) |
Health & Disability in Chamita
Health Insurance Coverage by Age in Chamita
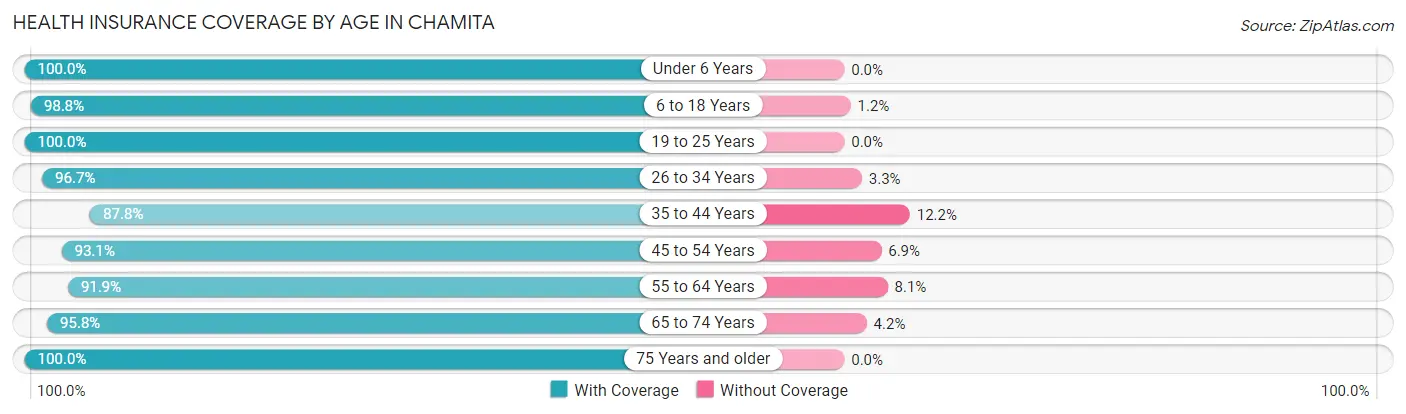
| Age Bracket | With Coverage | Without Coverage |
| Under 6 Years | 46 (100.0%) | 0 (0.0%) |
| 6 to 18 Years | 168 (98.8%) | 2 (1.2%) |
| 19 to 25 Years | 48 (100.0%) | 0 (0.0%) |
| 26 to 34 Years | 59 (96.7%) | 2 (3.3%) |
| 35 to 44 Years | 79 (87.8%) | 11 (12.2%) |
| 45 to 54 Years | 81 (93.1%) | 6 (6.9%) |
| 55 to 64 Years | 148 (91.9%) | 13 (8.1%) |
| 65 to 74 Years | 92 (95.8%) | 4 (4.2%) |
| 75 Years and older | 82 (100.0%) | 0 (0.0%) |
| Total | 803 (95.5%) | 38 (4.5%) |
Health Insurance Coverage by Citizenship Status in Chamita
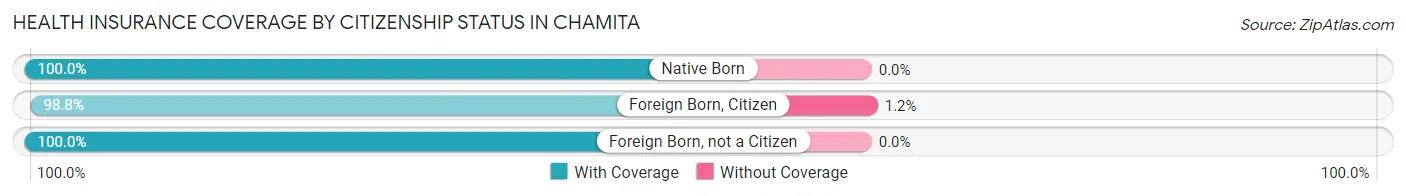
| Citizenship Status | With Coverage | Without Coverage |
| Native Born | 46 (100.0%) | 0 (0.0%) |
| Foreign Born, Citizen | 168 (98.8%) | 2 (1.2%) |
| Foreign Born, not a Citizen | 48 (100.0%) | 0 (0.0%) |
Health Insurance Coverage by Household Income in Chamita
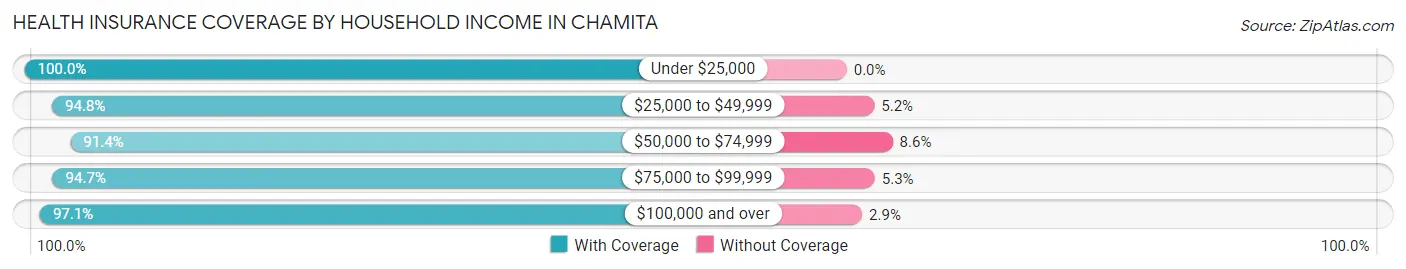
| Household Income | With Coverage | Without Coverage |
| Under $25,000 | 131 (100.0%) | 0 (0.0%) |
| $25,000 to $49,999 | 147 (94.8%) | 8 (5.2%) |
| $50,000 to $74,999 | 181 (91.4%) | 17 (8.6%) |
| $75,000 to $99,999 | 108 (94.7%) | 6 (5.3%) |
| $100,000 and over | 236 (97.1%) | 7 (2.9%) |
Public vs Private Health Insurance Coverage by Age in Chamita
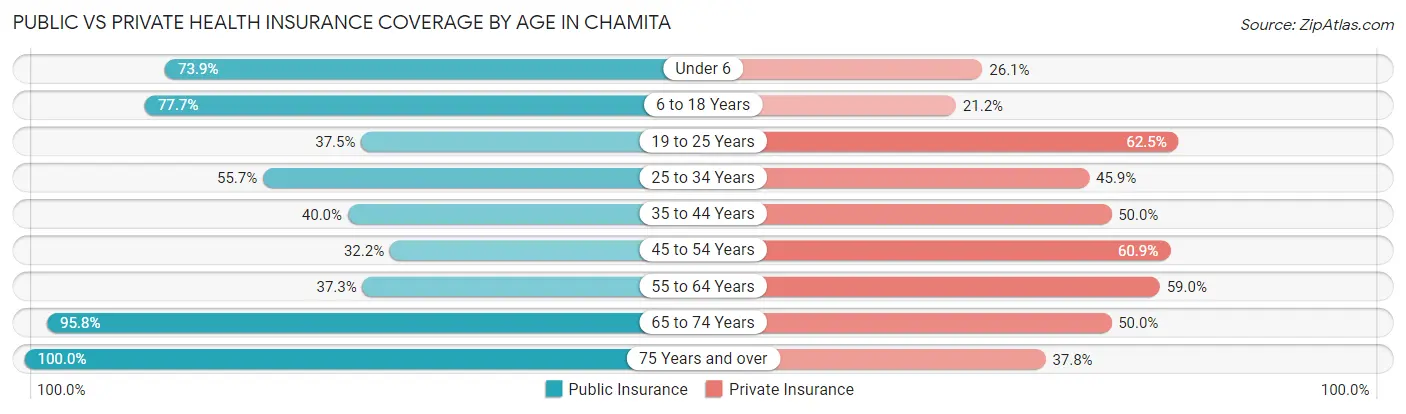
| Age Bracket | Public Insurance | Private Insurance |
| Under 6 | 34 (73.9%) | 12 (26.1%) |
| 6 to 18 Years | 132 (77.6%) | 36 (21.2%) |
| 19 to 25 Years | 18 (37.5%) | 30 (62.5%) |
| 25 to 34 Years | 34 (55.7%) | 28 (45.9%) |
| 35 to 44 Years | 36 (40.0%) | 45 (50.0%) |
| 45 to 54 Years | 28 (32.2%) | 53 (60.9%) |
| 55 to 64 Years | 60 (37.3%) | 95 (59.0%) |
| 65 to 74 Years | 92 (95.8%) | 48 (50.0%) |
| 75 Years and over | 82 (100.0%) | 31 (37.8%) |
| Total | 516 (61.4%) | 378 (45.0%) |
Disability Status by Sex by Age in Chamita
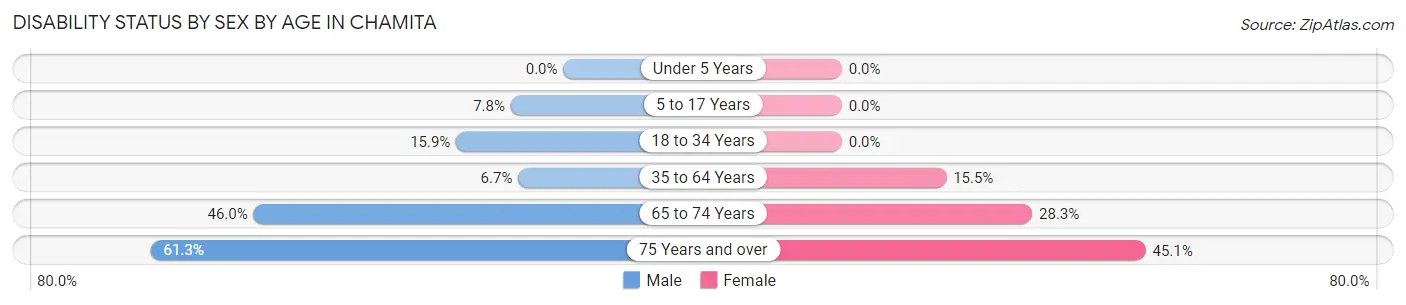
| Age Bracket | Male | Female |
| Under 5 Years | 0 (0.0%) | 0 (0.0%) |
| 5 to 17 Years | 5 (7.8%) | 0 (0.0%) |
| 18 to 34 Years | 7 (15.9%) | 0 (0.0%) |
| 35 to 64 Years | 14 (6.7%) | 20 (15.5%) |
| 65 to 74 Years | 23 (46.0%) | 13 (28.3%) |
| 75 Years and over | 19 (61.3%) | 23 (45.1%) |
Disability Class by Sex by Age in Chamita
Disability Class: Hearing Difficulty
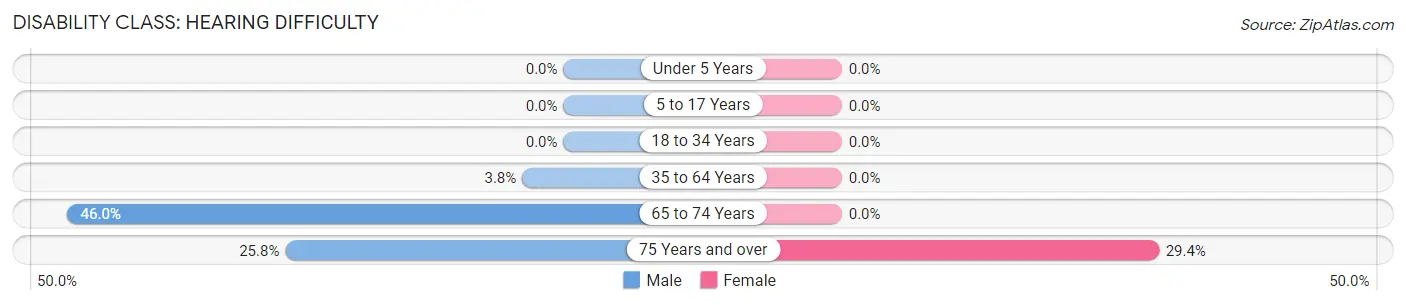
| Age Bracket | Male | Female |
| Under 5 Years | 0 (0.0%) | 0 (0.0%) |
| 5 to 17 Years | 0 (0.0%) | 0 (0.0%) |
| 18 to 34 Years | 0 (0.0%) | 0 (0.0%) |
| 35 to 64 Years | 8 (3.8%) | 0 (0.0%) |
| 65 to 74 Years | 23 (46.0%) | 0 (0.0%) |
| 75 Years and over | 8 (25.8%) | 15 (29.4%) |
Disability Class: Vision Difficulty
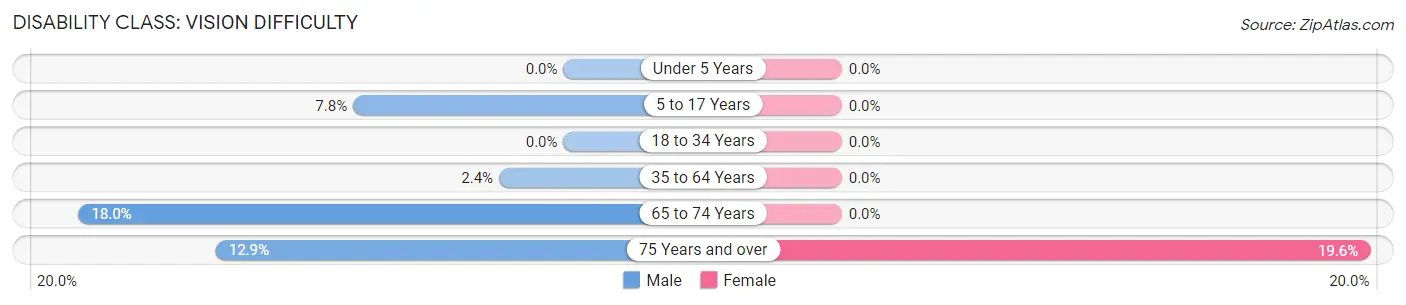
| Age Bracket | Male | Female |
| Under 5 Years | 0 (0.0%) | 0 (0.0%) |
| 5 to 17 Years | 5 (7.8%) | 0 (0.0%) |
| 18 to 34 Years | 0 (0.0%) | 0 (0.0%) |
| 35 to 64 Years | 5 (2.4%) | 0 (0.0%) |
| 65 to 74 Years | 9 (18.0%) | 0 (0.0%) |
| 75 Years and over | 4 (12.9%) | 10 (19.6%) |
Disability Class: Cognitive Difficulty
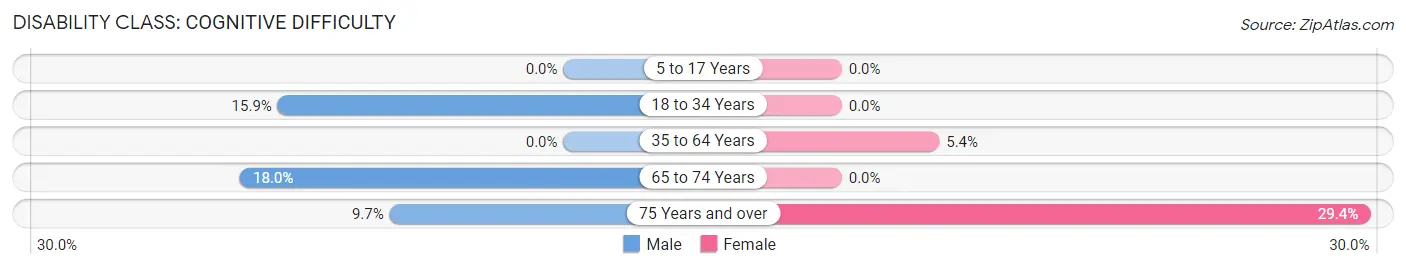
| Age Bracket | Male | Female |
| 5 to 17 Years | 0 (0.0%) | 0 (0.0%) |
| 18 to 34 Years | 7 (15.9%) | 0 (0.0%) |
| 35 to 64 Years | 0 (0.0%) | 7 (5.4%) |
| 65 to 74 Years | 9 (18.0%) | 0 (0.0%) |
| 75 Years and over | 3 (9.7%) | 15 (29.4%) |
Disability Class: Ambulatory Difficulty
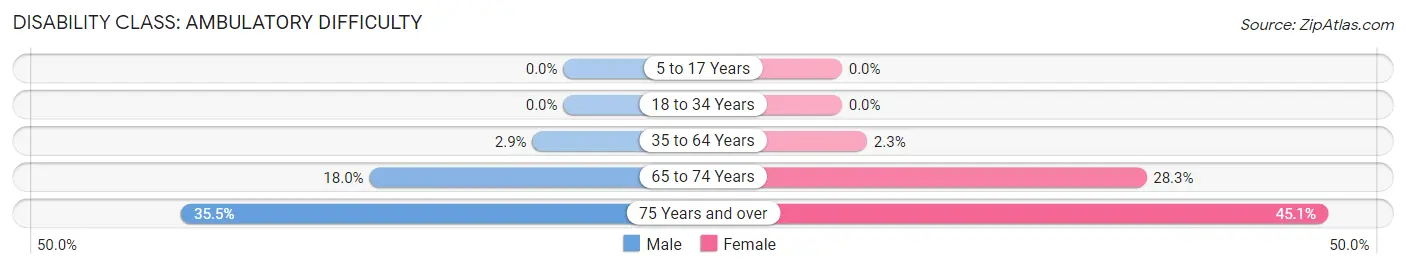
| Age Bracket | Male | Female |
| 5 to 17 Years | 0 (0.0%) | 0 (0.0%) |
| 18 to 34 Years | 0 (0.0%) | 0 (0.0%) |
| 35 to 64 Years | 6 (2.9%) | 3 (2.3%) |
| 65 to 74 Years | 9 (18.0%) | 13 (28.3%) |
| 75 Years and over | 11 (35.5%) | 23 (45.1%) |
Disability Class: Self-Care Difficulty
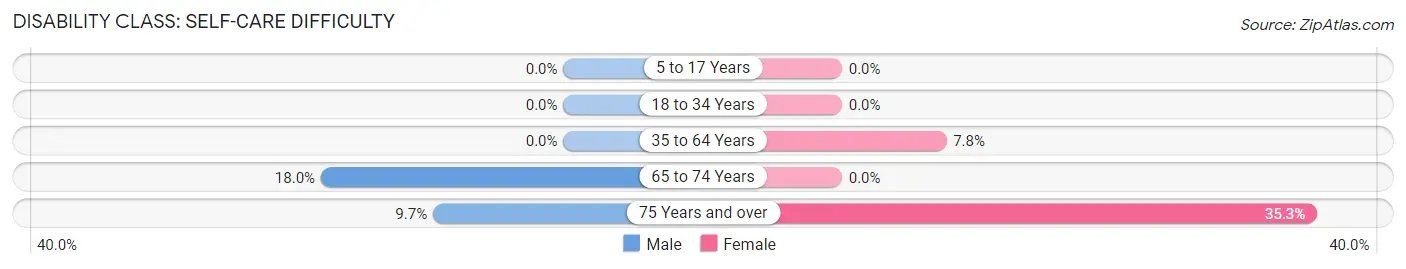
| Age Bracket | Male | Female |
| 5 to 17 Years | 0 (0.0%) | 0 (0.0%) |
| 18 to 34 Years | 0 (0.0%) | 0 (0.0%) |
| 35 to 64 Years | 0 (0.0%) | 10 (7.7%) |
| 65 to 74 Years | 9 (18.0%) | 0 (0.0%) |
| 75 Years and over | 3 (9.7%) | 18 (35.3%) |
Technology Access in Chamita
Computing Device Access in Chamita
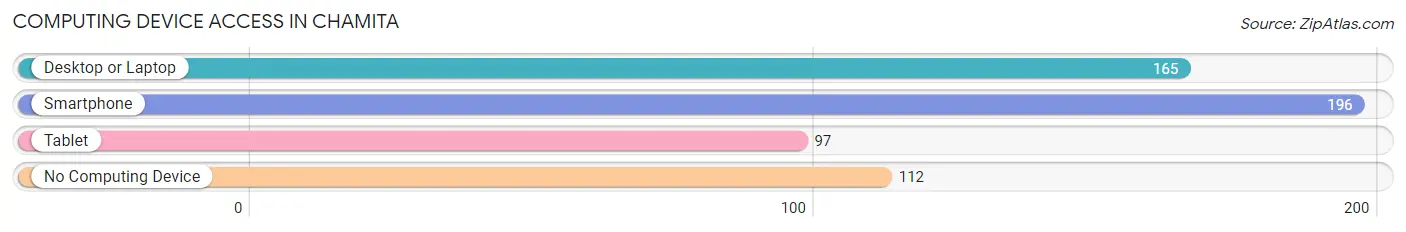
| Device Type | # Households | % Households |
| Desktop or Laptop | 165 | 51.1% |
| Smartphone | 196 | 60.7% |
| Tablet | 97 | 30.0% |
| No Computing Device | 112 | 34.7% |
| Total | 323 | 100.0% |
Internet Access in Chamita
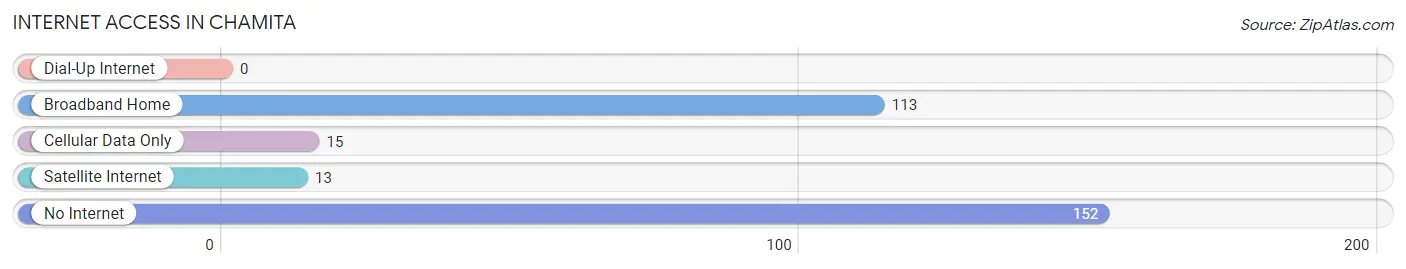
| Internet Type | # Households | % Households |
| Dial-Up Internet | 0 | 0.0% |
| Broadband Home | 113 | 35.0% |
| Cellular Data Only | 15 | 4.6% |
| Satellite Internet | 13 | 4.0% |
| No Internet | 152 | 47.1% |
| Total | 323 | 100.0% |
Chamita Summary
Chamita is a small unincorporated community located in Rio Arriba County, New Mexico. It is situated in the northern part of the state, about 25 miles northwest of Santa Fe. The population of Chamita was estimated to be around 1,000 people in 2000.
Geography
Chamita is located in the northern part of New Mexico, in the foothills of the Sangre de Cristo Mountains. The area is characterized by rolling hills, mesas, and canyons. The climate is semi-arid, with hot summers and cold winters. The average annual precipitation is about 12 inches.
The main economic activity in the area is ranching and farming. The land is mostly used for grazing cattle and sheep, and for growing hay and alfalfa. There are also some small-scale vegetable farms in the area.
History
Chamita was founded in the late 19th century by settlers from Mexico. The area was originally part of the Spanish land grant of San Miguel del Bado. The settlement was named after the nearby Chamita Creek.
In the early 20th century, the area was home to a large number of sheep and cattle ranches. The town was also home to a number of small businesses, including a general store, a blacksmith shop, and a saloon.
In the 1950s, the population of Chamita began to decline as many of the local ranches were sold off or abandoned. The town was eventually incorporated in the 1970s.
Economy
The economy of Chamita is largely based on ranching and farming. The area is home to a number of small-scale vegetable farms, as well as cattle and sheep ranches. The town also has a few small businesses, including a general store, a gas station, and a restaurant.
Demographics
As of the 2000 census, the population of Chamita was estimated to be around 1,000 people. The racial makeup of the town was 94.3% Hispanic, 4.3% White, and 1.4% Native American. The median household income was $25,000, and the median family income was $30,000. The per capita income was $13,000.
Conclusion
Chamita is a small unincorporated community located in Rio Arriba County, New Mexico. It is situated in the northern part of the state, about 25 miles northwest of Santa Fe. The population of Chamita was estimated to be around 1,000 people in 2000. The economy of the town is largely based on ranching and farming, and the area is home to a number of small-scale vegetable farms, as well as cattle and sheep ranches. The racial makeup of the town was 94.3% Hispanic, 4.3% White, and 1.4% Native American. The median household income was $25,000, and the median family income was $30,000.
Common Questions
What is Per Capita Income in Chamita?
Per Capita income in Chamita is $32,895.
What is the Median Family Income in Chamita?
Median Family Income in Chamita is $81,667.
What is the Median Household income in Chamita?
Median Household Income in Chamita is $62,292.
What is Income or Wage Gap in Chamita?
Income or Wage Gap in Chamita is 38.4%.
Women in Chamita earn 61.6 cents for every dollar earned by a man.
What is Inequality or Gini Index in Chamita?
Inequality or Gini Index in Chamita is 0.44.
What is the Total Population of Chamita?
Total Population of Chamita is 841.
What is the Total Male Population of Chamita?
Total Male Population of Chamita is 426.
What is the Total Female Population of Chamita?
Total Female Population of Chamita is 415.
What is the Ratio of Males per 100 Females in Chamita?
There are 102.65 Males per 100 Females in Chamita.
What is the Ratio of Females per 100 Males in Chamita?
There are 97.42 Females per 100 Males in Chamita.
What is the Median Population Age in Chamita?
Median Population Age in Chamita is 45.4 Years.
What is the Average Family Size in Chamita
Average Family Size in Chamita is 3.7 People.
What is the Average Household Size in Chamita
Average Household Size in Chamita is 2.6 People.
How Large is the Labor Force in Chamita?
There are 374 People in the Labor Forcein in Chamita.
What is the Percentage of People in the Labor Force in Chamita?
55.7% of People are in the Labor Force in Chamita.
What is the Unemployment Rate in Chamita?
Unemployment Rate in Chamita is 7.5%.