Vadito, NM Map & Demographics
Vadito Map
Vadito Overview
$27,548
PER CAPITA INCOME
$71,250
AVG FAMILY INCOME
$50,833
AVG HOUSEHOLD INCOME
1.1%
WAGE / INCOME GAP [ % ]
98.9¢/ $1
WAGE / INCOME GAP [ $ ]
0.40
INEQUALITY / GINI INDEX
362
TOTAL POPULATION
192
MALE POPULATION
170
FEMALE POPULATION
112.94
MALES / 100 FEMALES
88.54
FEMALES / 100 MALES
41.6
MEDIAN AGE
3.8
AVG FAMILY SIZE
3.1
AVG HOUSEHOLD SIZE
150
LABOR FORCE [ PEOPLE ]
49.5%
PERCENT IN LABOR FORCE
1.3%
UNEMPLOYMENT RATE
Vadito Zip Codes
Vadito Area Codes
Income in Vadito
Income Overview in Vadito
Per Capita Income in Vadito is $27,548, while median incomes of families and households are $71,250 and $50,833 respectively.
| Characteristic | Number | Measure |
| Per Capita Income | 362 | $27,548 |
| Median Family Income | 79 | $71,250 |
| Mean Family Income | 79 | $77,701 |
| Median Household Income | 118 | $50,833 |
| Mean Household Income | 118 | $64,068 |
| Income Deficit | 79 | $0 |
| Wage / Income Gap (%) | 362 | 1.10% |
| Wage / Income Gap ($) | 362 | 98.90¢ per $1 |
| Gini / Inequality Index | 362 | 0.40 |
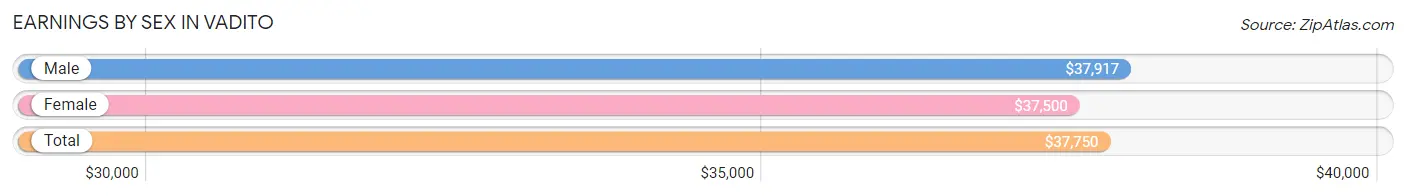
Earnings by Sex in Vadito
Average Earnings in Vadito are $37,750, $37,917 for men and $37,500 for women, a difference of 1.1%.
| Sex | Number | Average Earnings |
| Male | 92 (59.0%) | $37,917 |
| Female | 64 (41.0%) | $37,500 |
| Total | 156 (100.0%) | $37,750 |
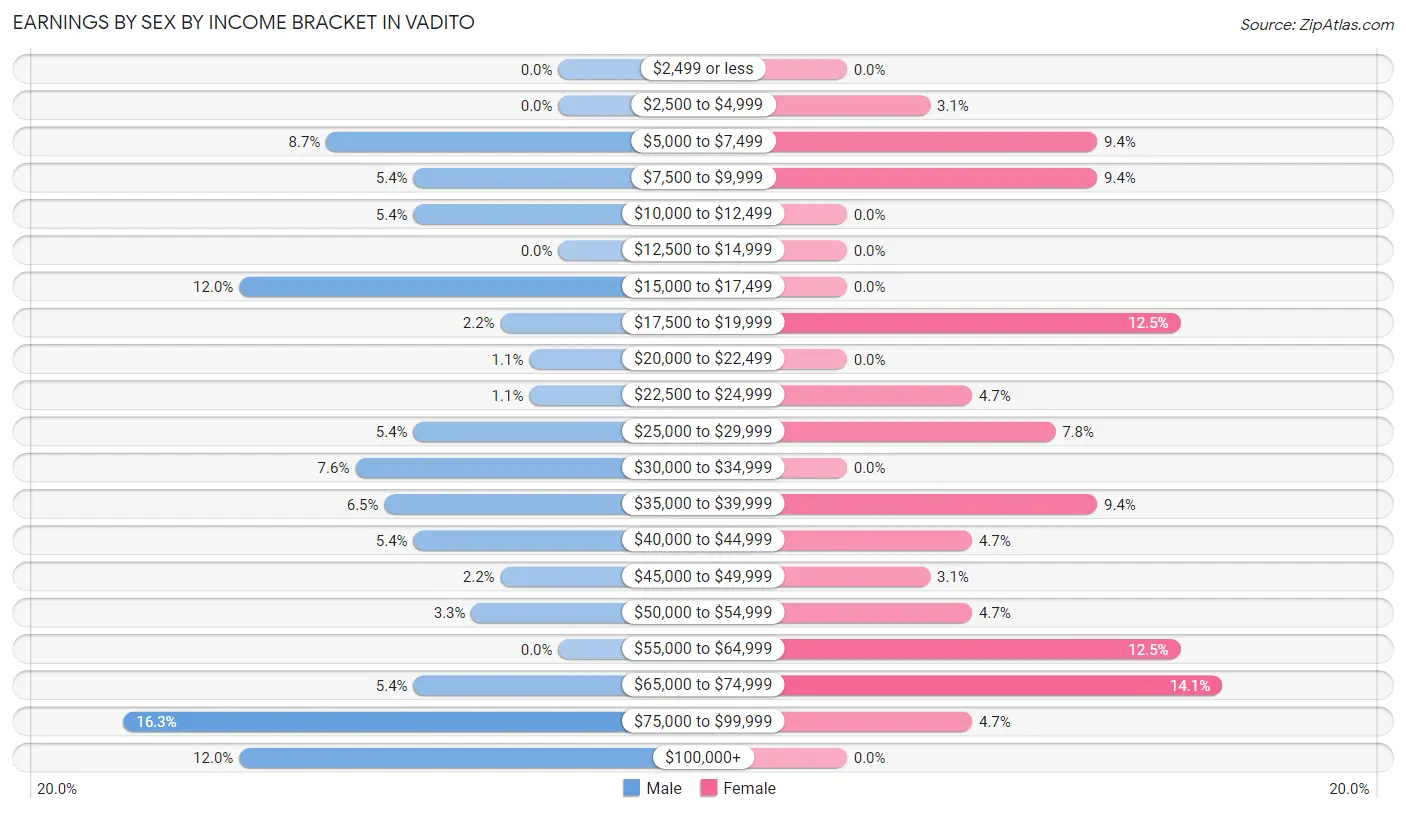
Earnings by Sex by Income Bracket in Vadito
The most common earnings brackets in Vadito are $75,000 to $99,999 for men (15 | 16.3%) and $65,000 to $74,999 for women (9 | 14.1%).
| Income | Male | Female |
| $2,499 or less | 0 (0.0%) | 0 (0.0%) |
| $2,500 to $4,999 | 0 (0.0%) | 2 (3.1%) |
| $5,000 to $7,499 | 8 (8.7%) | 6 (9.4%) |
| $7,500 to $9,999 | 5 (5.4%) | 6 (9.4%) |
| $10,000 to $12,499 | 5 (5.4%) | 0 (0.0%) |
| $12,500 to $14,999 | 0 (0.0%) | 0 (0.0%) |
| $15,000 to $17,499 | 11 (12.0%) | 0 (0.0%) |
| $17,500 to $19,999 | 2 (2.2%) | 8 (12.5%) |
| $20,000 to $22,499 | 1 (1.1%) | 0 (0.0%) |
| $22,500 to $24,999 | 1 (1.1%) | 3 (4.7%) |
| $25,000 to $29,999 | 5 (5.4%) | 5 (7.8%) |
| $30,000 to $34,999 | 7 (7.6%) | 0 (0.0%) |
| $35,000 to $39,999 | 6 (6.5%) | 6 (9.4%) |
| $40,000 to $44,999 | 5 (5.4%) | 3 (4.7%) |
| $45,000 to $49,999 | 2 (2.2%) | 2 (3.1%) |
| $50,000 to $54,999 | 3 (3.3%) | 3 (4.7%) |
| $55,000 to $64,999 | 0 (0.0%) | 8 (12.5%) |
| $65,000 to $74,999 | 5 (5.4%) | 9 (14.1%) |
| $75,000 to $99,999 | 15 (16.3%) | 3 (4.7%) |
| $100,000+ | 11 (12.0%) | 0 (0.0%) |
| Total | 92 (100.0%) | 64 (100.0%) |
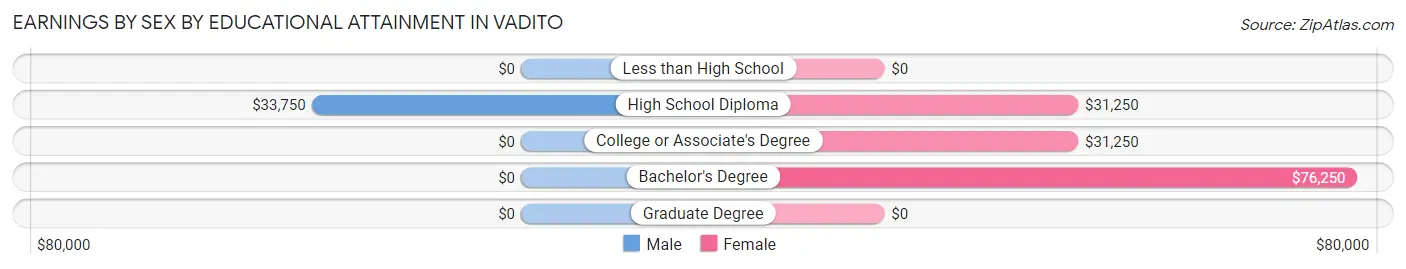
Earnings by Sex by Educational Attainment in Vadito
Average earnings in Vadito are $38,333 for men and $39,063 for women, a difference of 1.9%. Men with an educational attainment of high school diploma enjoy the highest average annual earnings of $33,750, while those with high school diploma education earn the least with $33,750. Women with an educational attainment of bachelor's degree earn the most with the average annual earnings of $76,250, while those with high school diploma education have the smallest earnings of $31,250.
| Educational Attainment | Male Income | Female Income |
| Less than High School | - | - |
| High School Diploma | $33,750 | $31,250 |
| College or Associate's Degree | - | - |
| Bachelor's Degree | - | - |
| Graduate Degree | - | - |
| Total | $38,333 | $39,063 |
Family Income in Vadito
Family Income Brackets in Vadito
According to the Vadito family income data, there are 15 families falling into the $75,000 to $99,999 income range, which is the most common income bracket and makes up 19.0% of all families. Conversely, the less than $10,000 income bracket is the least frequent group with only 2 families (2.5%) belonging to this category.
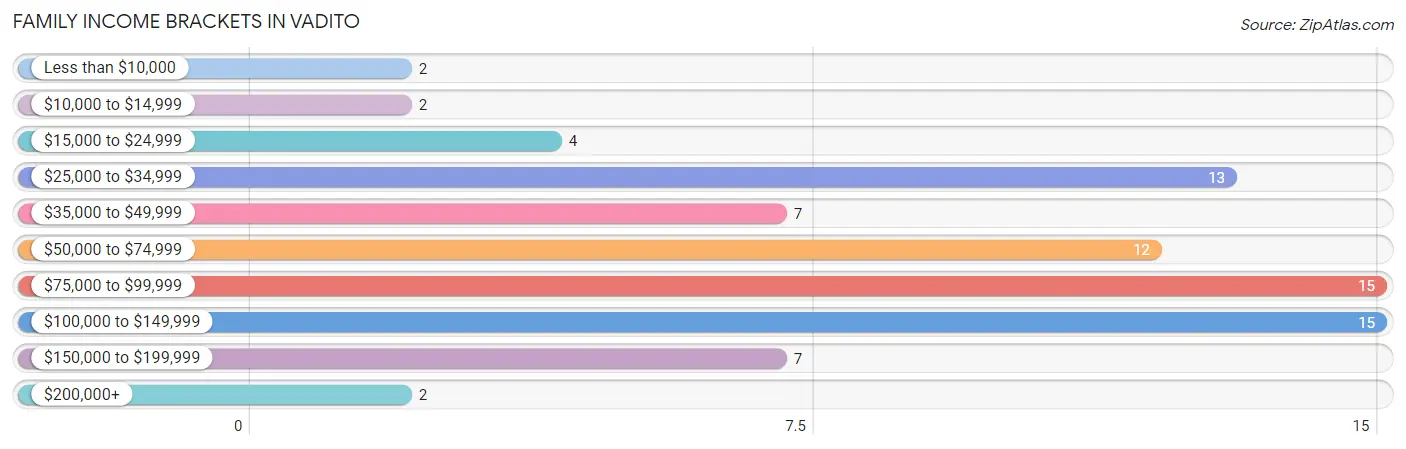
| Income Bracket | # Families | % Families |
| Less than $10,000 | 2 | 2.5% |
| $10,000 to $14,999 | 2 | 2.5% |
| $15,000 to $24,999 | 4 | 5.1% |
| $25,000 to $34,999 | 13 | 16.5% |
| $35,000 to $49,999 | 7 | 8.9% |
| $50,000 to $74,999 | 12 | 15.2% |
| $75,000 to $99,999 | 15 | 19.0% |
| $100,000 to $149,999 | 15 | 19.0% |
| $150,000 to $199,999 | 7 | 8.9% |
| $200,000+ | 2 | 2.5% |
Family Income by Famaliy Size in Vadito
4-person families (15 | 19.0%) account for the highest median family income in Vadito with $84,583 per family, while 2-person families (34 | 43.0%) have the highest median income of $26,250 per family member.
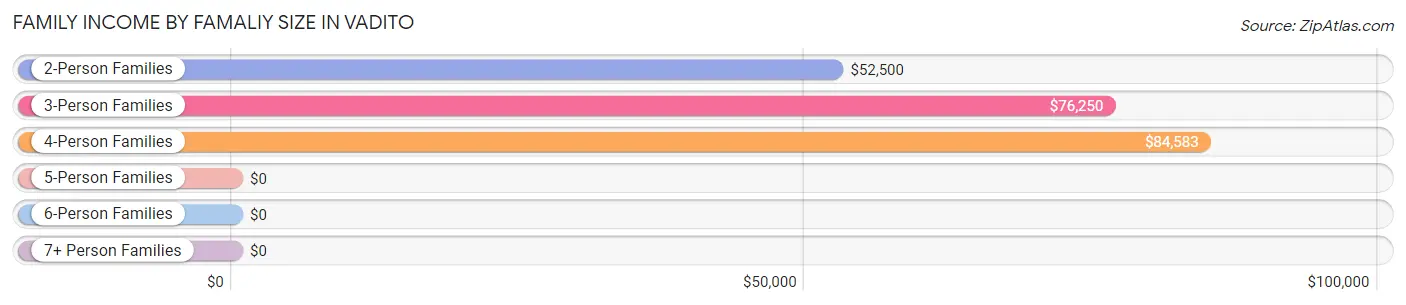
| Income Bracket | # Families | Median Income |
| 2-Person Families | 34 (43.0%) | $52,500 |
| 3-Person Families | 26 (32.9%) | $76,250 |
| 4-Person Families | 15 (19.0%) | $84,583 |
| 5-Person Families | 4 (5.1%) | $0 |
| 6-Person Families | 0 (0.0%) | $0 |
| 7+ Person Families | 0 (0.0%) | $0 |
| Total | 79 (100.0%) | $71,250 |
Family Income by Number of Earners in Vadito
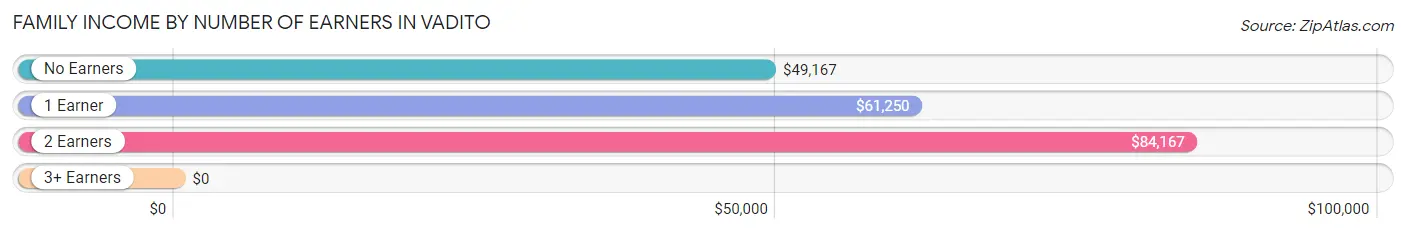
| Number of Earners | # Families | Median Income |
| No Earners | 10 (12.7%) | $49,167 |
| 1 Earner | 48 (60.8%) | $61,250 |
| 2 Earners | 16 (20.3%) | $84,167 |
| 3+ Earners | 5 (6.3%) | $0 |
| Total | 79 (100.0%) | $71,250 |
Household Income in Vadito
Household Income Brackets in Vadito
With 20 households falling in the category, the $25,000 to $34,999 income range is the most frequent in Vadito, accounting for 17.0% of all households. In contrast, only 2 households (1.7%) fall into the $200,000+ income bracket, making it the least populous group.
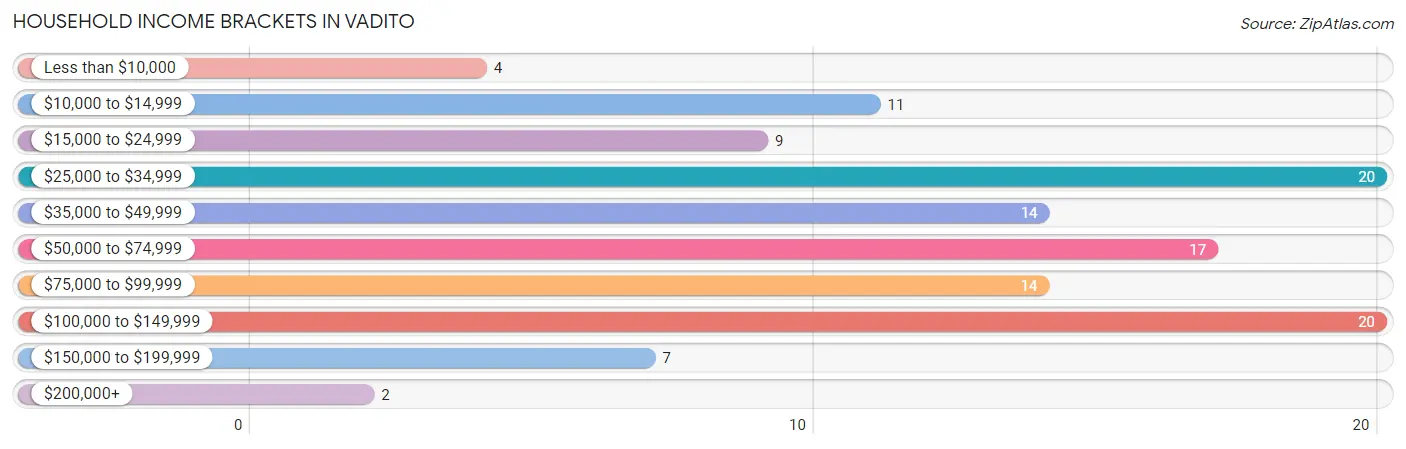
| Income Bracket | # Households | % Households |
| Less than $10,000 | 4 | 3.4% |
| $10,000 to $14,999 | 11 | 9.3% |
| $15,000 to $24,999 | 9 | 7.6% |
| $25,000 to $34,999 | 20 | 16.9% |
| $35,000 to $49,999 | 14 | 11.9% |
| $50,000 to $74,999 | 17 | 14.4% |
| $75,000 to $99,999 | 14 | 11.9% |
| $100,000 to $149,999 | 20 | 16.9% |
| $150,000 to $199,999 | 7 | 5.9% |
| $200,000+ | 2 | 1.7% |
Household Income by Householder Age in Vadito
The median household income in Vadito is $50,833, with the highest median household income of $73,750 found in the 25 to 44 years age bracket for the primary householder. A total of 34 households (28.8%) fall into this category. Meanwhile, the 15 to 24 years age bracket for the primary householder has the lowest median household income of $0, with 4 households (3.4%) in this group.
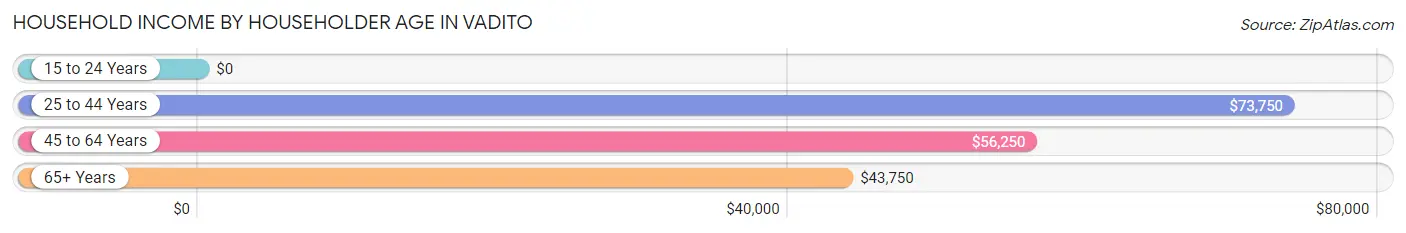
| Income Bracket | # Households | Median Income |
| 15 to 24 Years | 4 (3.4%) | $0 |
| 25 to 44 Years | 34 (28.8%) | $73,750 |
| 45 to 64 Years | 36 (30.5%) | $56,250 |
| 65+ Years | 44 (37.3%) | $43,750 |
| Total | 118 (100.0%) | $50,833 |
Poverty in Vadito
Income Below Poverty by Sex and Age in Vadito
With 6.9% poverty level for males and 11.5% for females among the residents of Vadito, 18 to 24 year old males and 16 and 17 year old females are the most vulnerable to poverty, with 6 males (54.5%) and 2 females (33.3%) in their respective age groups living below the poverty level.
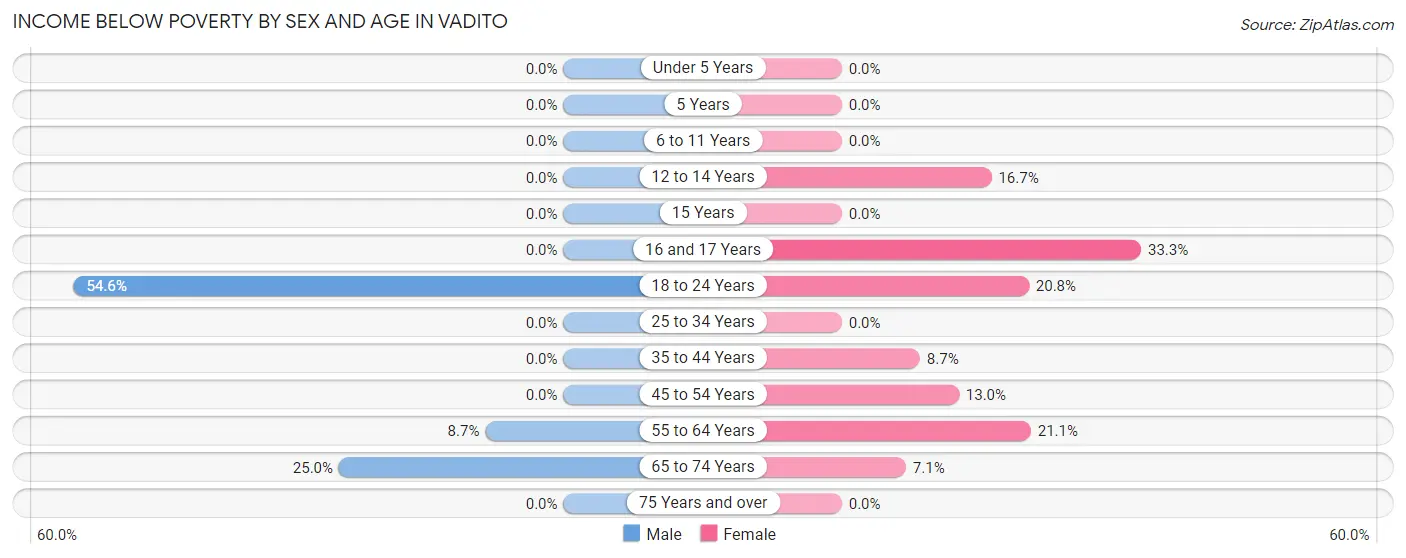
| Age Bracket | Male | Female |
| Under 5 Years | 0 (0.0%) | 0 (0.0%) |
| 5 Years | 0 (0.0%) | 0 (0.0%) |
| 6 to 11 Years | 0 (0.0%) | 0 (0.0%) |
| 12 to 14 Years | 0 (0.0%) | 1 (16.7%) |
| 15 Years | 0 (0.0%) | 0 (0.0%) |
| 16 and 17 Years | 0 (0.0%) | 2 (33.3%) |
| 18 to 24 Years | 6 (54.5%) | 5 (20.8%) |
| 25 to 34 Years | 0 (0.0%) | 0 (0.0%) |
| 35 to 44 Years | 0 (0.0%) | 2 (8.7%) |
| 45 to 54 Years | 0 (0.0%) | 3 (13.0%) |
| 55 to 64 Years | 2 (8.7%) | 4 (21.0%) |
| 65 to 74 Years | 5 (25.0%) | 2 (7.1%) |
| 75 Years and over | 0 (0.0%) | 0 (0.0%) |
| Total | 13 (6.9%) | 19 (11.5%) |
Income Above Poverty by Sex and Age in Vadito
According to the poverty statistics in Vadito, males aged under 5 years and females aged under 5 years are the age groups that are most secure financially, with 100.0% of males and 100.0% of females in these age groups living above the poverty line.
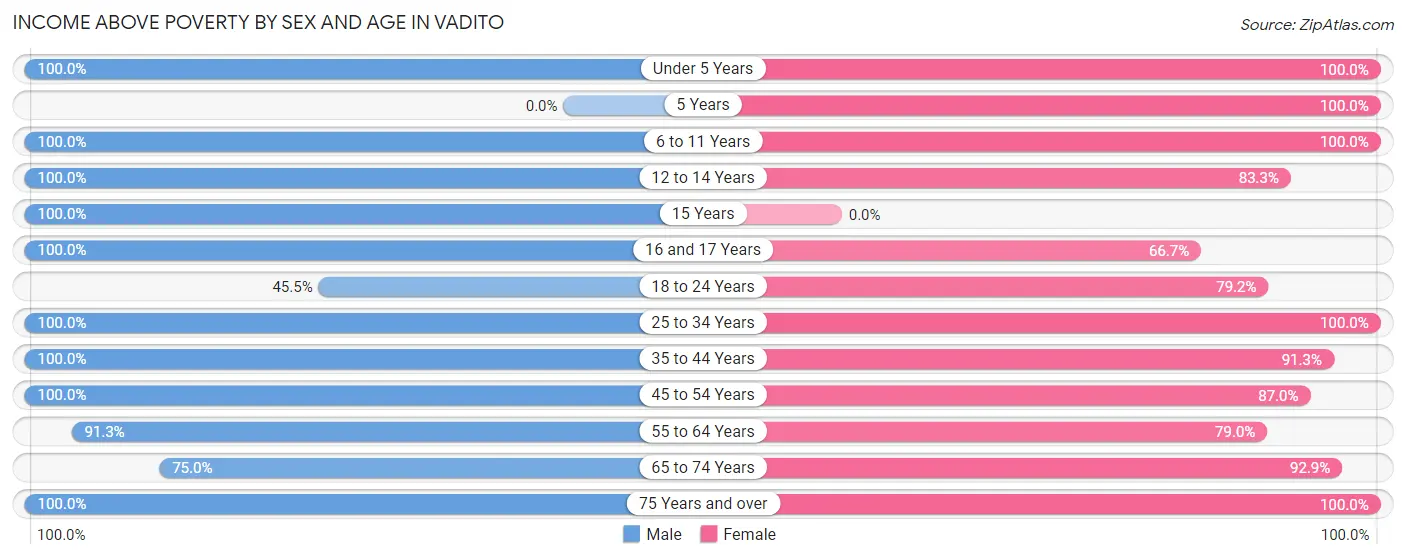
| Age Bracket | Male | Female |
| Under 5 Years | 6 (100.0%) | 4 (100.0%) |
| 5 Years | 0 (0.0%) | 2 (100.0%) |
| 6 to 11 Years | 8 (100.0%) | 2 (100.0%) |
| 12 to 14 Years | 15 (100.0%) | 5 (83.3%) |
| 15 Years | 9 (100.0%) | 0 (0.0%) |
| 16 and 17 Years | 6 (100.0%) | 4 (66.7%) |
| 18 to 24 Years | 5 (45.5%) | 19 (79.2%) |
| 25 to 34 Years | 23 (100.0%) | 16 (100.0%) |
| 35 to 44 Years | 35 (100.0%) | 21 (91.3%) |
| 45 to 54 Years | 26 (100.0%) | 20 (87.0%) |
| 55 to 64 Years | 21 (91.3%) | 15 (78.9%) |
| 65 to 74 Years | 15 (75.0%) | 26 (92.9%) |
| 75 Years and over | 7 (100.0%) | 13 (100.0%) |
| Total | 176 (93.1%) | 147 (88.5%) |
Income Below Poverty Among Married-Couple Families in Vadito
The poverty statistics for married-couple families in Vadito show that 4.6% or 2 of the total 43 families live below the poverty line. Families with no children have the highest poverty rate of 7.1%, comprising of 2 families. On the other hand, families with 1 or 2 children have the lowest poverty rate of 0.0%, which includes 0 families.
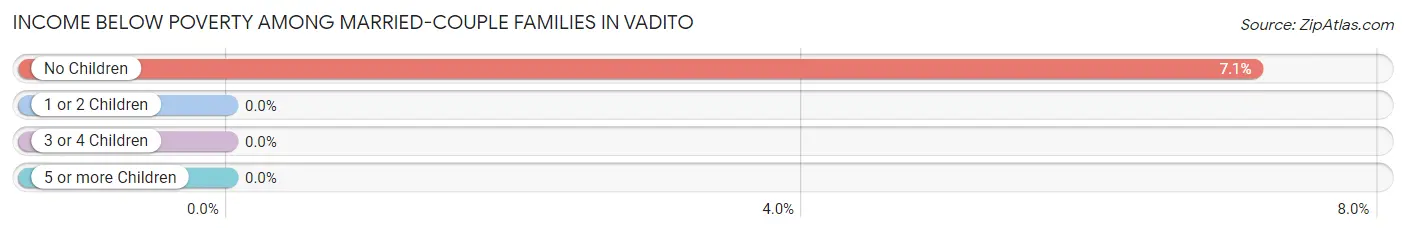
| Children | Above Poverty | Below Poverty |
| No Children | 26 (92.9%) | 2 (7.1%) |
| 1 or 2 Children | 13 (100.0%) | 0 (0.0%) |
| 3 or 4 Children | 2 (100.0%) | 0 (0.0%) |
| 5 or more Children | 0 (0.0%) | 0 (0.0%) |
| Total | 41 (95.4%) | 2 (4.6%) |
Income Below Poverty Among Single-Parent Households in Vadito
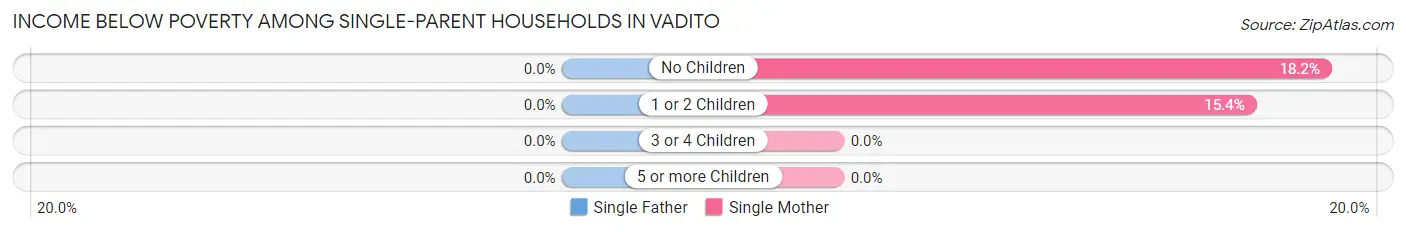
| Children | Single Father | Single Mother |
| No Children | 0 (0.0%) | 2 (18.2%) |
| 1 or 2 Children | 0 (0.0%) | 2 (15.4%) |
| 3 or 4 Children | 0 (0.0%) | 0 (0.0%) |
| 5 or more Children | 0 (0.0%) | 0 (0.0%) |
| Total | 0 (0.0%) | 4 (16.7%) |
Income Below Poverty Among Married-Couple vs Single-Parent Households in Vadito
The poverty data for Vadito shows that 2 of the married-couple family households (4.6%) and 4 of the single-parent households (11.1%) are living below the poverty level. Within the married-couple family households, those with no children have the highest poverty rate, with 2 households (7.1%) falling below the poverty line. Among the single-parent households, those with no children have the highest poverty rate, with 2 household (13.3%) living below poverty.
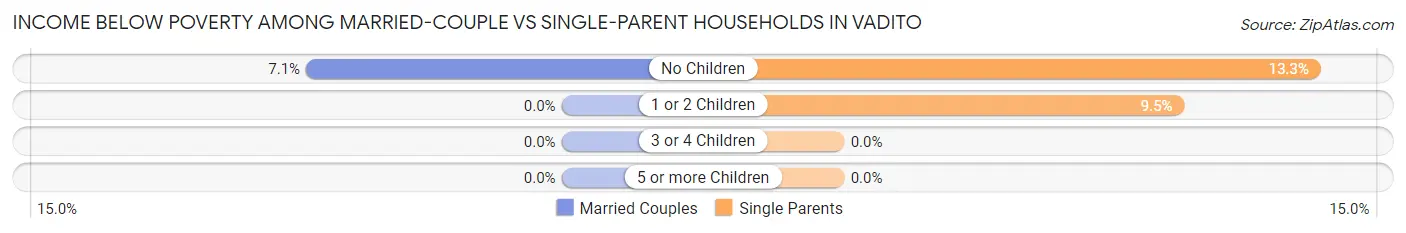
| Children | Married-Couple Families | Single-Parent Households |
| No Children | 2 (7.1%) | 2 (13.3%) |
| 1 or 2 Children | 0 (0.0%) | 2 (9.5%) |
| 3 or 4 Children | 0 (0.0%) | 0 (0.0%) |
| 5 or more Children | 0 (0.0%) | 0 (0.0%) |
| Total | 2 (4.6%) | 4 (11.1%) |
Race in Vadito
The most populous races in Vadito are Hispanic or Latino (318 | 87.8%), White / Caucasian (195 | 53.9%), and Two or more Races (156 | 43.1%).
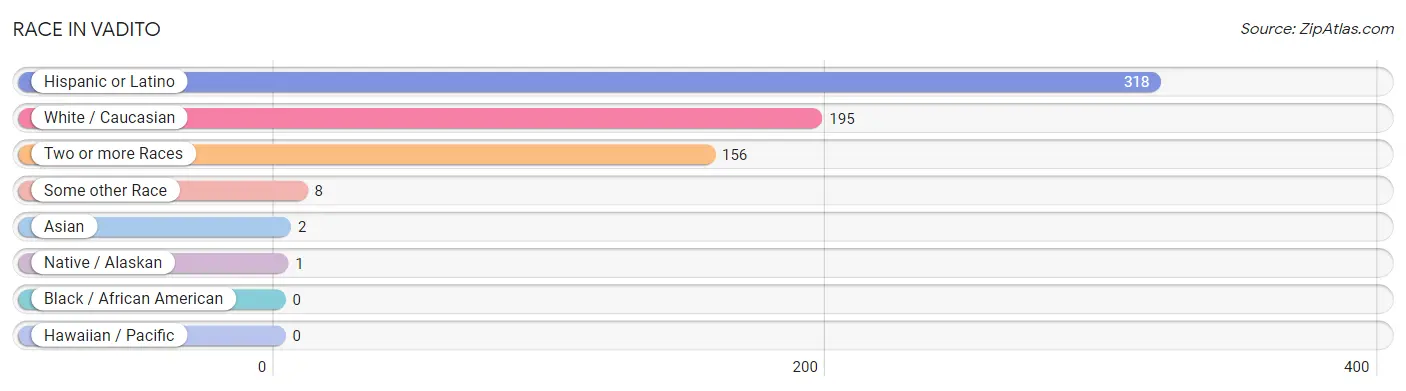
| Race | # Population | % Population |
| Asian | 2 | 0.5% |
| Black / African American | 0 | 0.0% |
| Hawaiian / Pacific | 0 | 0.0% |
| Hispanic or Latino | 318 | 87.8% |
| Native / Alaskan | 1 | 0.3% |
| White / Caucasian | 195 | 53.9% |
| Two or more Races | 156 | 43.1% |
| Some other Race | 8 | 2.2% |
| Total | 362 | 100.0% |
Ancestry in Vadito
The most populous ancestries reported in Vadito are Spanish (175 | 48.3%), English (27 | 7.5%), Scottish (17 | 4.7%), Mexican (16 | 4.4%), and Scotch-Irish (11 | 3.0%), together accounting for 68.0% of all Vadito residents.
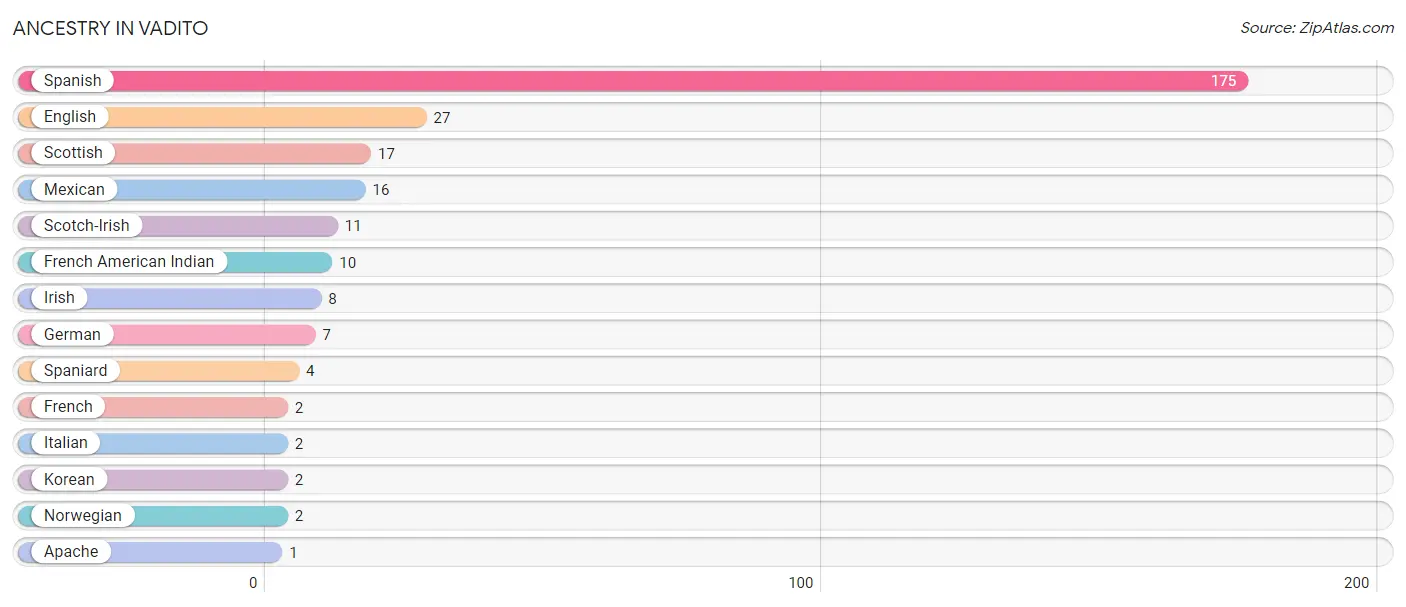
| Ancestry | # Population | % Population |
| Apache | 1 | 0.3% |
| English | 27 | 7.5% |
| French | 2 | 0.5% |
| French American Indian | 10 | 2.8% |
| German | 7 | 1.9% |
| Irish | 8 | 2.2% |
| Italian | 2 | 0.5% |
| Korean | 2 | 0.5% |
| Mexican | 16 | 4.4% |
| Norwegian | 2 | 0.5% |
| Scotch-Irish | 11 | 3.0% |
| Scottish | 17 | 4.7% |
| Spaniard | 4 | 1.1% |
| Spanish | 175 | 48.3% | View All 14 Rows |
Immigrants in Vadito
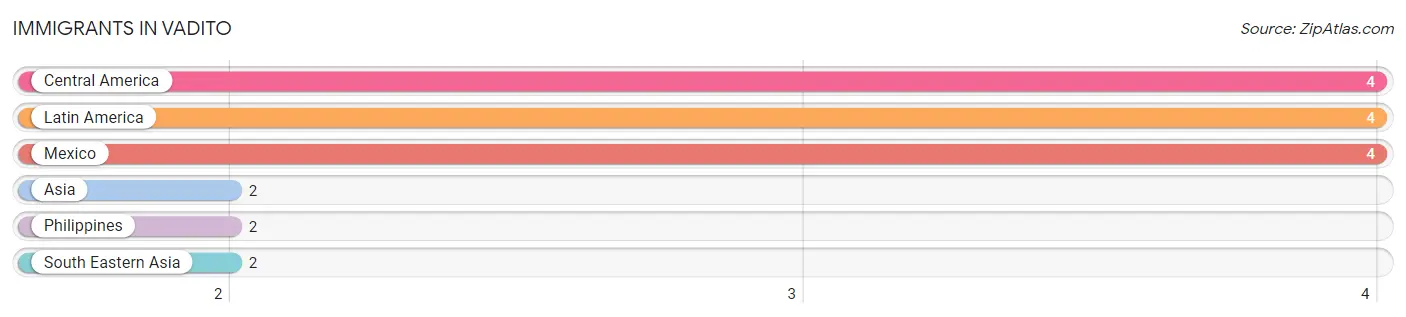
The most numerous immigrant groups reported in Vadito came from Central America (4 | 1.1%), Latin America (4 | 1.1%), Mexico (4 | 1.1%), Asia (2 | 0.5%), and Philippines (2 | 0.5%), together accounting for 4.4% of all Vadito residents.
| Immigration Origin | # Population | % Population |
| Asia | 2 | 0.5% |
| Central America | 4 | 1.1% |
| Latin America | 4 | 1.1% |
| Mexico | 4 | 1.1% |
| Philippines | 2 | 0.5% |
| South Eastern Asia | 2 | 0.5% | View All 6 Rows |
Sex and Age in Vadito
Sex and Age in Vadito
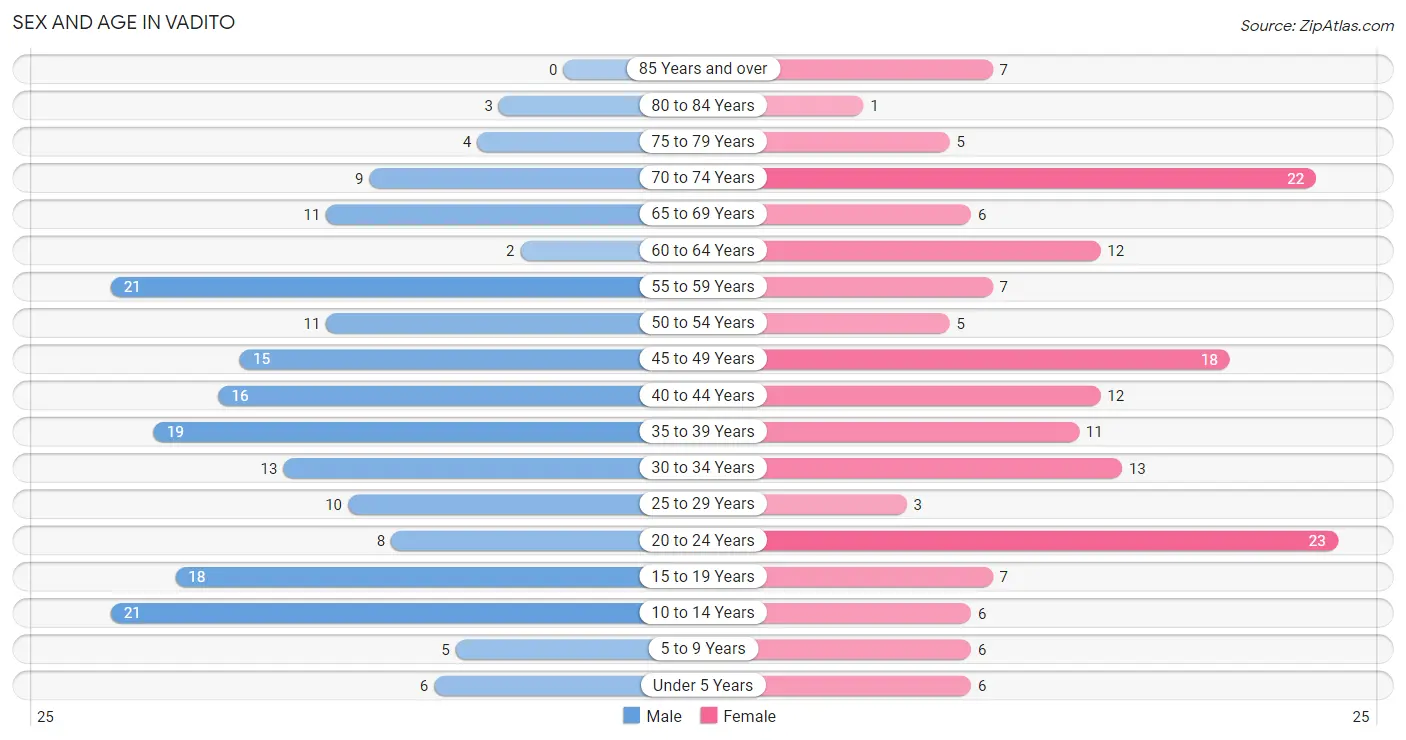
The most populous age groups in Vadito are 10 to 14 Years (21 | 10.9%) for men and 20 to 24 Years (23 | 13.5%) for women.
| Age Bracket | Male | Female |
| Under 5 Years | 6 (3.1%) | 6 (3.5%) |
| 5 to 9 Years | 5 (2.6%) | 6 (3.5%) |
| 10 to 14 Years | 21 (10.9%) | 6 (3.5%) |
| 15 to 19 Years | 18 (9.4%) | 7 (4.1%) |
| 20 to 24 Years | 8 (4.2%) | 23 (13.5%) |
| 25 to 29 Years | 10 (5.2%) | 3 (1.8%) |
| 30 to 34 Years | 13 (6.8%) | 13 (7.6%) |
| 35 to 39 Years | 19 (9.9%) | 11 (6.5%) |
| 40 to 44 Years | 16 (8.3%) | 12 (7.1%) |
| 45 to 49 Years | 15 (7.8%) | 18 (10.6%) |
| 50 to 54 Years | 11 (5.7%) | 5 (2.9%) |
| 55 to 59 Years | 21 (10.9%) | 7 (4.1%) |
| 60 to 64 Years | 2 (1.0%) | 12 (7.1%) |
| 65 to 69 Years | 11 (5.7%) | 6 (3.5%) |
| 70 to 74 Years | 9 (4.7%) | 22 (12.9%) |
| 75 to 79 Years | 4 (2.1%) | 5 (2.9%) |
| 80 to 84 Years | 3 (1.6%) | 1 (0.6%) |
| 85 Years and over | 0 (0.0%) | 7 (4.1%) |
| Total | 192 (100.0%) | 170 (100.0%) |
Families and Households in Vadito
Median Family Size in Vadito
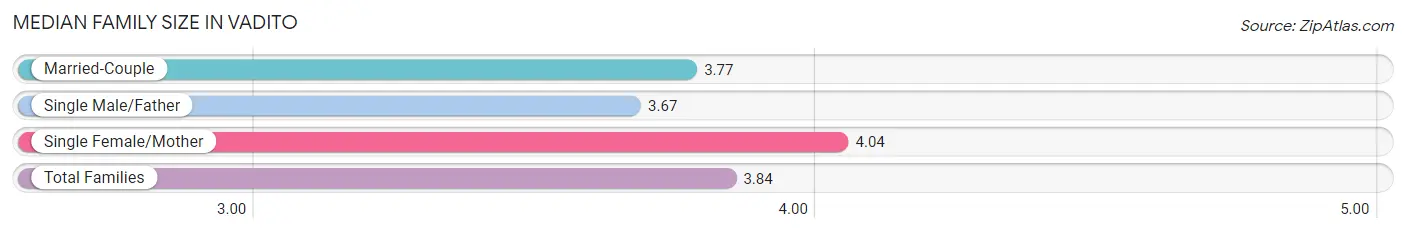
The median family size in Vadito is 3.84 persons per family, with single female/mother families (24 | 30.4%) accounting for the largest median family size of 4.04 persons per family. On the other hand, single male/father families (12 | 15.2%) represent the smallest median family size with 3.67 persons per family.
| Family Type | # Families | Family Size |
| Married-Couple | 43 (54.4%) | 3.77 |
| Single Male/Father | 12 (15.2%) | 3.67 |
| Single Female/Mother | 24 (30.4%) | 4.04 |
| Total Families | 79 (100.0%) | 3.84 |
Median Household Size in Vadito
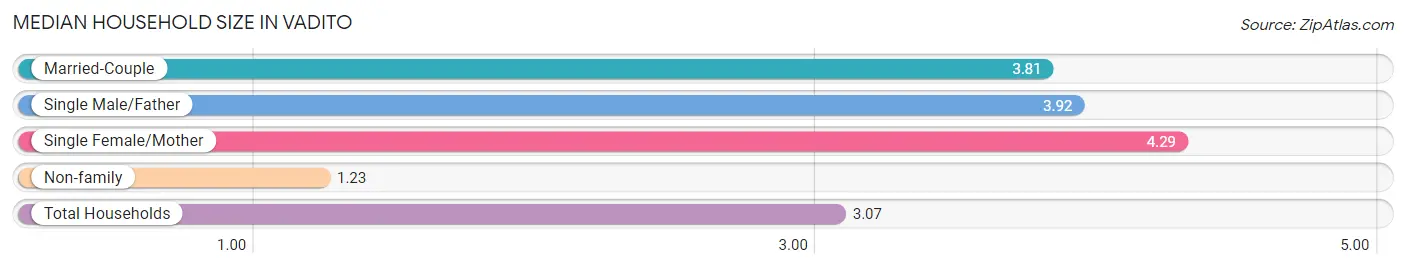
The median household size in Vadito is 3.07 persons per household, with single female/mother households (24 | 20.3%) accounting for the largest median household size of 4.29 persons per household. non-family households (39 | 33.1%) represent the smallest median household size with 1.23 persons per household.
| Household Type | # Households | Household Size |
| Married-Couple | 43 (36.4%) | 3.81 |
| Single Male/Father | 12 (10.2%) | 3.92 |
| Single Female/Mother | 24 (20.3%) | 4.29 |
| Non-family | 39 (33.1%) | 1.23 |
| Total Households | 118 (100.0%) | 3.07 |
Household Size by Marriage Status in Vadito
Out of a total of 118 households in Vadito, 79 (66.9%) are family households, while 39 (33.1%) are nonfamily households. The most numerous type of family households are 2-person households, comprising 31, and the most common type of nonfamily households are 1-person households, comprising 35.
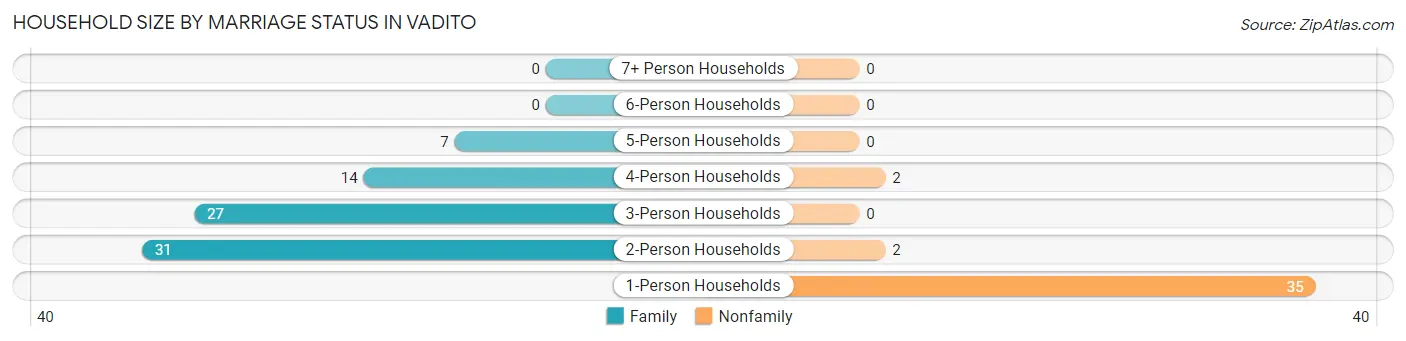
| Household Size | Family Households | Nonfamily Households |
| 1-Person Households | - | 35 (29.7%) |
| 2-Person Households | 31 (26.3%) | 2 (1.7%) |
| 3-Person Households | 27 (22.9%) | 0 (0.0%) |
| 4-Person Households | 14 (11.9%) | 2 (1.7%) |
| 5-Person Households | 7 (5.9%) | 0 (0.0%) |
| 6-Person Households | 0 (0.0%) | 0 (0.0%) |
| 7+ Person Households | 0 (0.0%) | 0 (0.0%) |
| Total | 79 (66.9%) | 39 (33.1%) |
Female Fertility in Vadito
Fertility by Age in Vadito
Average fertility rate in Vadito is 11.0 births per 1,000 women. Women in the age bracket of 20 to 34 years have the highest fertility rate with 26.0 births per 1,000 women. Women in the age bracket of 20 to 34 years acount for 100.0% of all women with births.
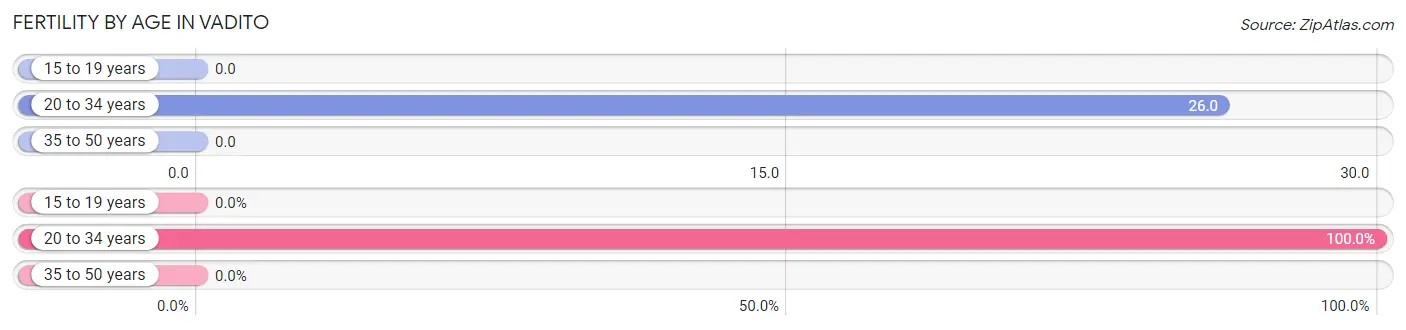
| Age Bracket | Women with Births | Births / 1,000 Women |
| 15 to 19 years | 0 (0.0%) | 0.0 |
| 20 to 34 years | 1 (100.0%) | 26.0 |
| 35 to 50 years | 0 (0.0%) | 0.0 |
| Total | 1 (100.0%) | 11.0 |
Fertility by Age by Marriage Status in Vadito
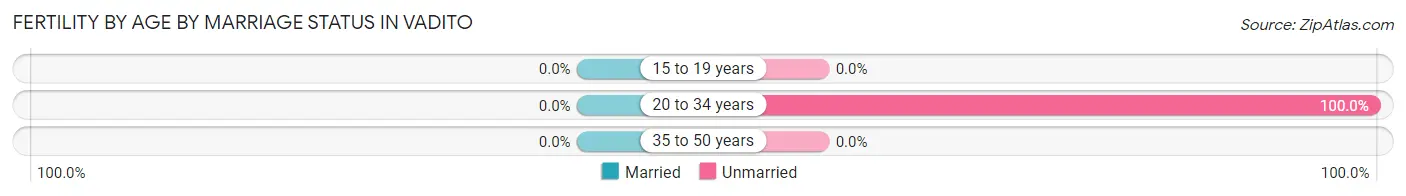
| Age Bracket | Married | Unmarried |
| 15 to 19 years | 0 (0.0%) | 0 (0.0%) |
| 20 to 34 years | 0 (0.0%) | 1 (100.0%) |
| 35 to 50 years | 0 (0.0%) | 0 (0.0%) |
| Total | 0 (0.0%) | 1 (100.0%) |
Fertility by Education in Vadito
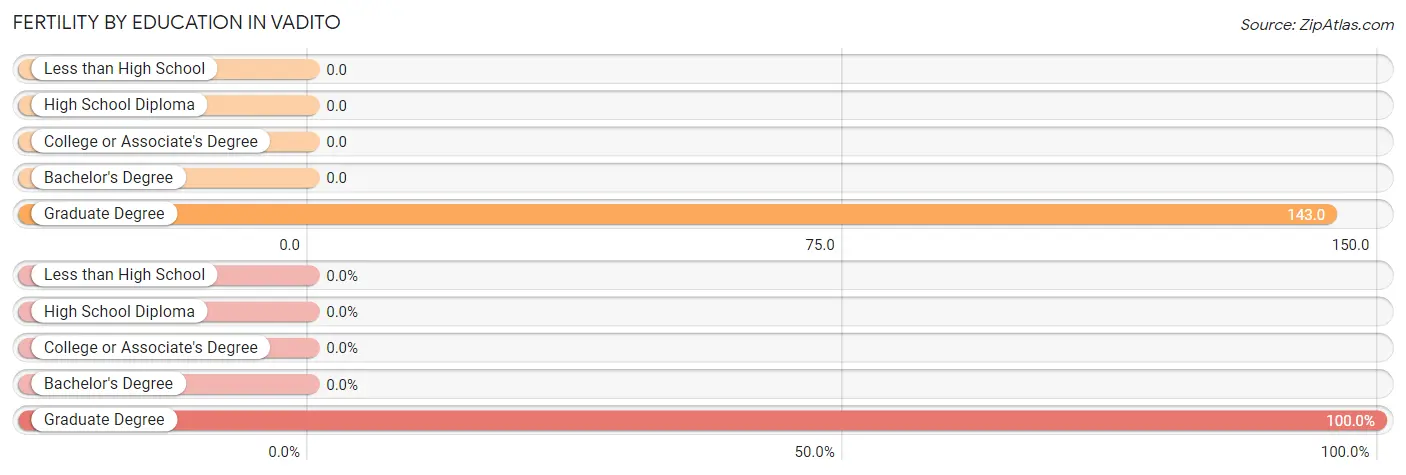
| Educational Attainment | Women with Births | Births / 1,000 Women |
| Less than High School | 0 (0.0%) | 0.0 |
| High School Diploma | 0 (0.0%) | 0.0 |
| College or Associate's Degree | 0 (0.0%) | 0.0 |
| Bachelor's Degree | 0 (0.0%) | 0.0 |
| Graduate Degree | 1 (100.0%) | 143.0 |
| Total | 1 (100.0%) | 11.0 |
Fertility by Education by Marriage Status in Vadito
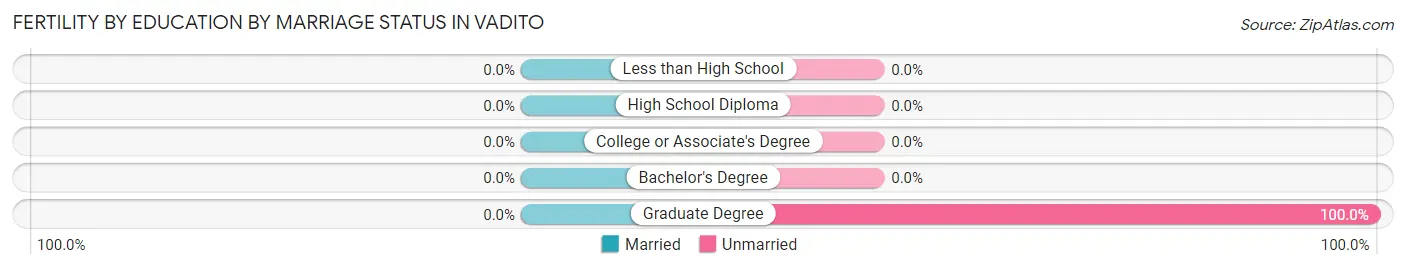
| Educational Attainment | Married | Unmarried |
| Less than High School | 0 (0.0%) | 0 (0.0%) |
| High School Diploma | 0 (0.0%) | 0 (0.0%) |
| College or Associate's Degree | 0 (0.0%) | 0 (0.0%) |
| Bachelor's Degree | 0 (0.0%) | 0 (0.0%) |
| Graduate Degree | 0 (0.0%) | 1 (100.0%) |
| Total | 0 (0.0%) | 1 (100.0%) |
Employment Characteristics in Vadito
Employment by Class of Employer in Vadito
Among the 137 employed individuals in Vadito, private company employees (60 | 43.8%), federal government employees (19 | 13.9%), and local government employees (18 | 13.1%) make up the most common classes of employment.
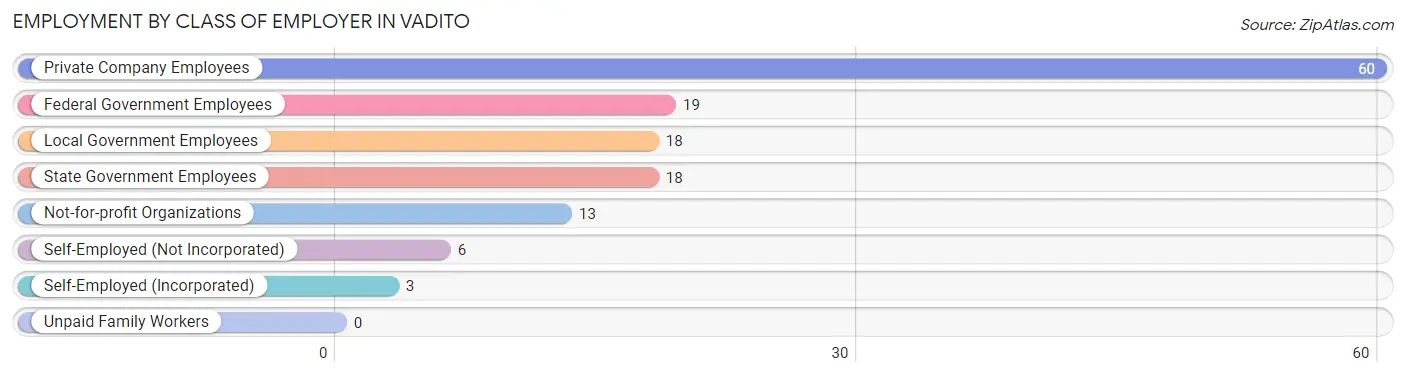
| Employer Class | # Employees | % Employees |
| Private Company Employees | 60 | 43.8% |
| Self-Employed (Incorporated) | 3 | 2.2% |
| Self-Employed (Not Incorporated) | 6 | 4.4% |
| Not-for-profit Organizations | 13 | 9.5% |
| Local Government Employees | 18 | 13.1% |
| State Government Employees | 18 | 13.1% |
| Federal Government Employees | 19 | 13.9% |
| Unpaid Family Workers | 0 | 0.0% |
| Total | 137 | 100.0% |
Employment Status by Age in Vadito
According to the labor force statistics for Vadito, out of the total population over 16 years of age (303), 49.5% or 150 individuals are in the labor force, with 1.3% or 2 of them unemployed. The age group with the highest labor force participation rate is 35 to 44 years, with 96.6% or 56 individuals in the labor force. Within the labor force, the 55 to 59 years age range has the highest percentage of unemployed individuals, with 22.2% or 2 of them being unemployed.
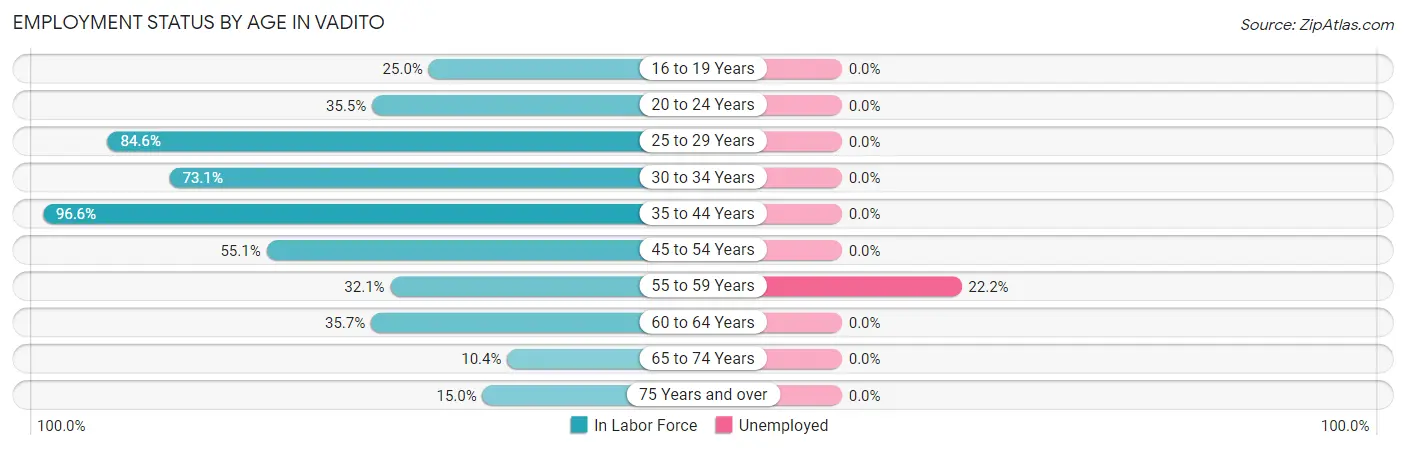
| Age Bracket | In Labor Force | Unemployed |
| 16 to 19 Years | 4 (25.0%) | 0 (0.0%) |
| 20 to 24 Years | 11 (35.5%) | 0 (0.0%) |
| 25 to 29 Years | 11 (84.6%) | 0 (0.0%) |
| 30 to 34 Years | 19 (73.1%) | 0 (0.0%) |
| 35 to 44 Years | 56 (96.6%) | 0 (0.0%) |
| 45 to 54 Years | 27 (55.1%) | 0 (0.0%) |
| 55 to 59 Years | 9 (32.1%) | 2 (22.2%) |
| 60 to 64 Years | 5 (35.7%) | 0 (0.0%) |
| 65 to 74 Years | 5 (10.4%) | 0 (0.0%) |
| 75 Years and over | 3 (15.0%) | 0 (0.0%) |
| Total | 150 (49.5%) | 2 (1.3%) |
Employment Status by Educational Attainment in Vadito
According to labor force statistics for Vadito, 67.6% of individuals (127) out of the total population between 25 and 64 years of age (188) are in the labor force, with 1.6% or 2 of them being unemployed. The group with the highest labor force participation rate are those with the educational attainment of college / associate degree, with 84.2% or 64 individuals in the labor force. Within the labor force, individuals with high school diploma education have the highest percentage of unemployment, with 4.7% or 2 of them being unemployed.
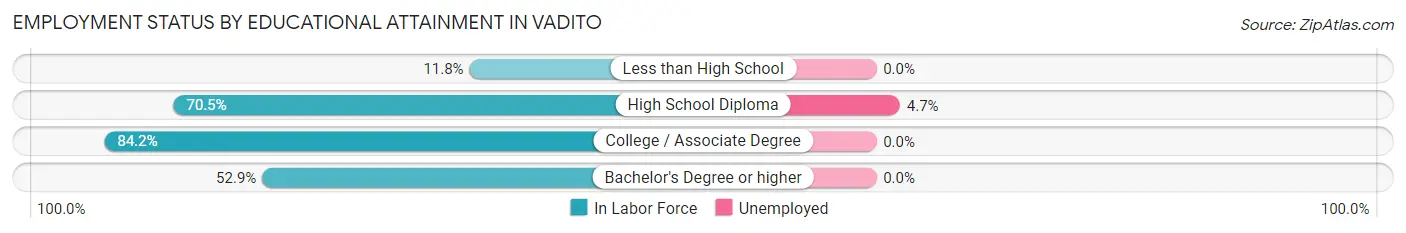
| Educational Attainment | In Labor Force | Unemployed |
| Less than High School | 2 (11.8%) | 0 (0.0%) |
| High School Diploma | 43 (70.5%) | 3 (4.7%) |
| College / Associate Degree | 64 (84.2%) | 0 (0.0%) |
| Bachelor's Degree or higher | 18 (52.9%) | 0 (0.0%) |
| Total | 127 (67.6%) | 3 (1.6%) |
Employment Occupations by Sex in Vadito
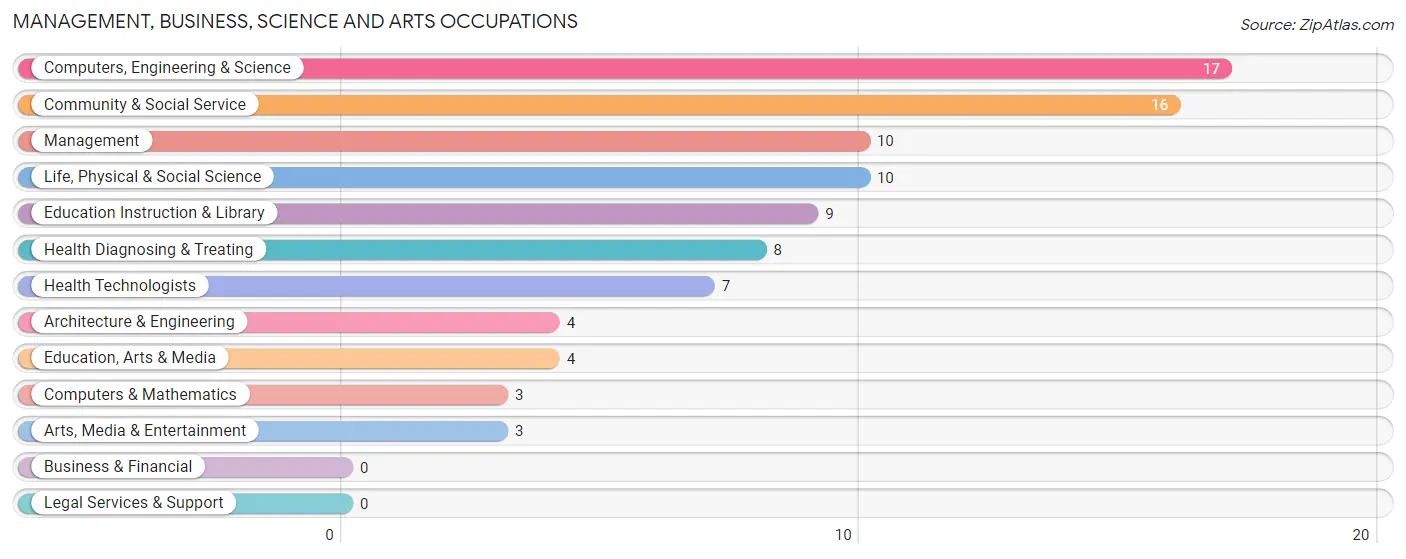
Management, Business, Science and Arts Occupations
The most common Management, Business, Science and Arts occupations in Vadito are Computers, Engineering & Science (17 | 11.5%), Community & Social Service (16 | 10.8%), Management (10 | 6.8%), Life, Physical & Social Science (10 | 6.8%), and Education Instruction & Library (9 | 6.1%).
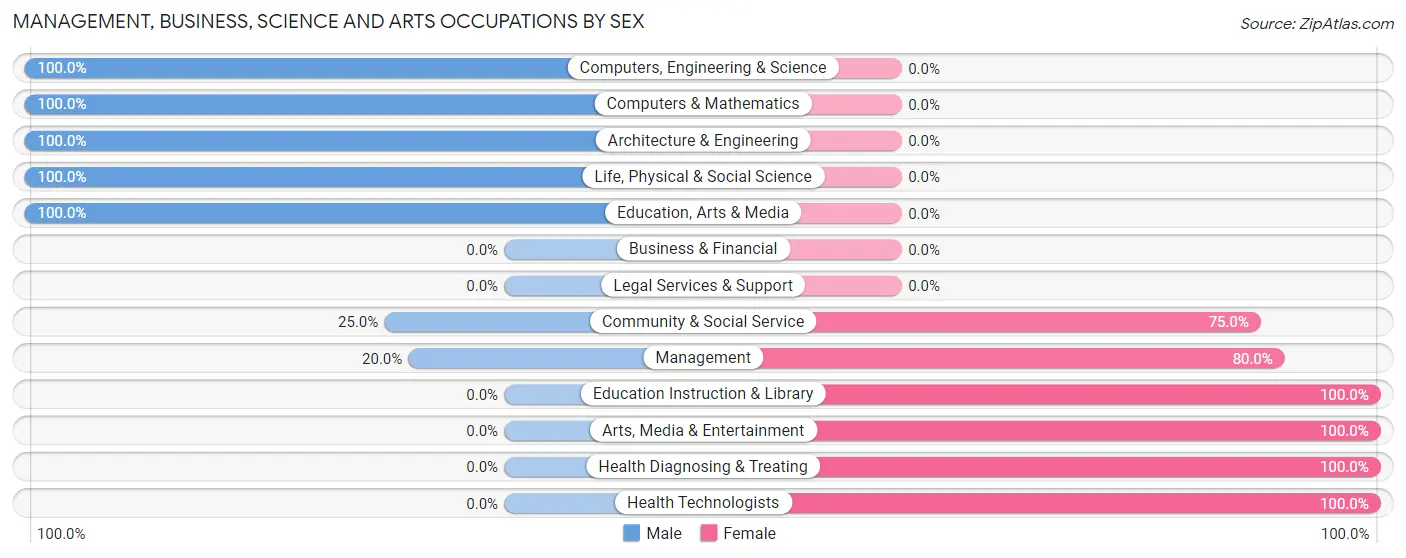
Management, Business, Science and Arts Occupations by Sex
Within the Management, Business, Science and Arts occupations in Vadito, the most male-oriented occupations are Computers, Engineering & Science (100.0%), Computers & Mathematics (100.0%), and Architecture & Engineering (100.0%), while the most female-oriented occupations are Education Instruction & Library (100.0%), Arts, Media & Entertainment (100.0%), and Health Diagnosing & Treating (100.0%).
| Occupation | Male | Female |
| Management | 2 (20.0%) | 8 (80.0%) |
| Business & Financial | 0 (0.0%) | 0 (0.0%) |
| Computers, Engineering & Science | 17 (100.0%) | 0 (0.0%) |
| Computers & Mathematics | 3 (100.0%) | 0 (0.0%) |
| Architecture & Engineering | 4 (100.0%) | 0 (0.0%) |
| Life, Physical & Social Science | 10 (100.0%) | 0 (0.0%) |
| Community & Social Service | 4 (25.0%) | 12 (75.0%) |
| Education, Arts & Media | 4 (100.0%) | 0 (0.0%) |
| Legal Services & Support | 0 (0.0%) | 0 (0.0%) |
| Education Instruction & Library | 0 (0.0%) | 9 (100.0%) |
| Arts, Media & Entertainment | 0 (0.0%) | 3 (100.0%) |
| Health Diagnosing & Treating | 0 (0.0%) | 8 (100.0%) |
| Health Technologists | 0 (0.0%) | 7 (100.0%) |
| Total (Category) | 23 (45.1%) | 28 (54.9%) |
| Total (Overall) | 90 (60.8%) | 58 (39.2%) |
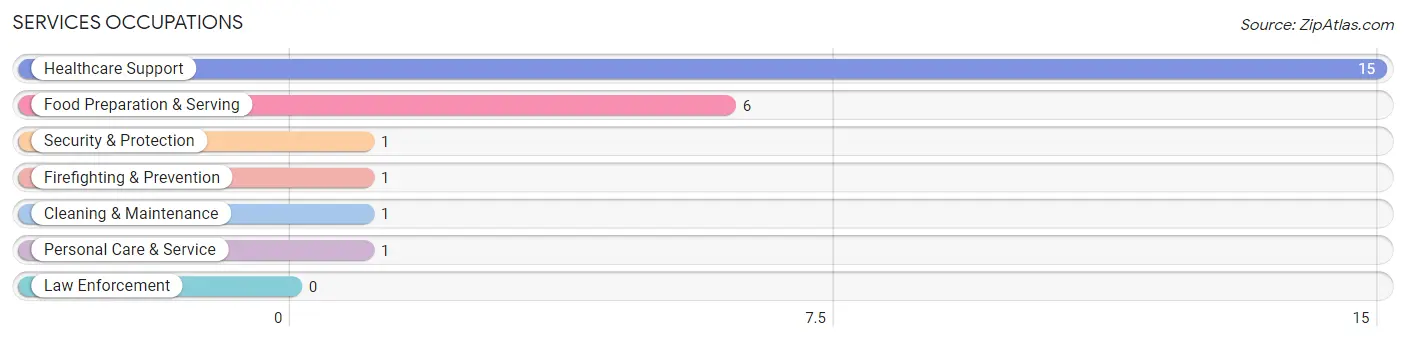
Services Occupations
The most common Services occupations in Vadito are Healthcare Support (15 | 10.1%), Food Preparation & Serving (6 | 4.1%), Security & Protection (1 | 0.7%), Firefighting & Prevention (1 | 0.7%), and Cleaning & Maintenance (1 | 0.7%).
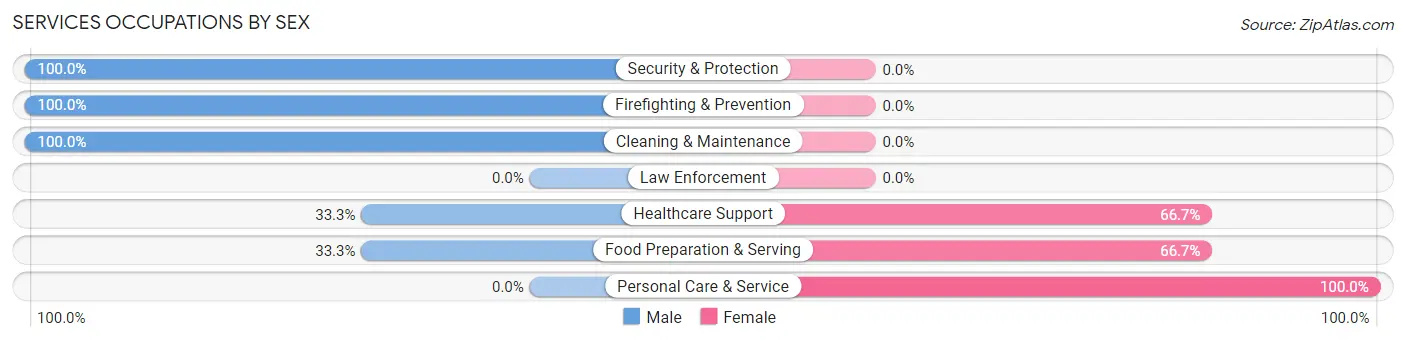
Services Occupations by Sex
Within the Services occupations in Vadito, the most male-oriented occupations are Security & Protection (100.0%), Firefighting & Prevention (100.0%), and Cleaning & Maintenance (100.0%), while the most female-oriented occupations are Personal Care & Service (100.0%), Healthcare Support (66.7%), and Food Preparation & Serving (66.7%).
| Occupation | Male | Female |
| Healthcare Support | 5 (33.3%) | 10 (66.7%) |
| Security & Protection | 1 (100.0%) | 0 (0.0%) |
| Firefighting & Prevention | 1 (100.0%) | 0 (0.0%) |
| Law Enforcement | 0 (0.0%) | 0 (0.0%) |
| Food Preparation & Serving | 2 (33.3%) | 4 (66.7%) |
| Cleaning & Maintenance | 1 (100.0%) | 0 (0.0%) |
| Personal Care & Service | 0 (0.0%) | 1 (100.0%) |
| Total (Category) | 9 (37.5%) | 15 (62.5%) |
| Total (Overall) | 90 (60.8%) | 58 (39.2%) |
Sales and Office Occupations
The most common Sales and Office occupations in Vadito are Office & Administration (31 | 20.9%), and Sales & Related (4 | 2.7%).
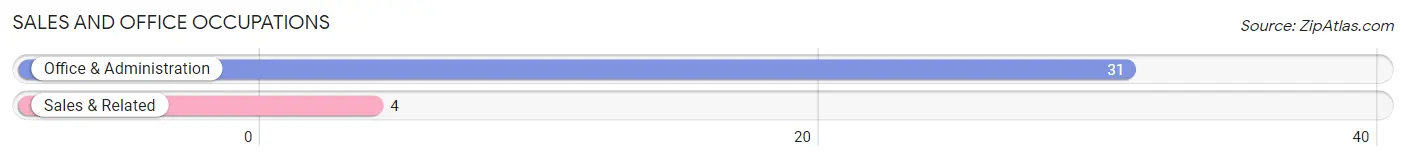
Sales and Office Occupations by Sex

| Occupation | Male | Female |
| Sales & Related | 4 (100.0%) | 0 (0.0%) |
| Office & Administration | 16 (51.6%) | 15 (48.4%) |
| Total (Category) | 20 (57.1%) | 15 (42.9%) |
| Total (Overall) | 90 (60.8%) | 58 (39.2%) |
Natural Resources, Construction and Maintenance Occupations
The most common Natural Resources, Construction and Maintenance occupations in Vadito are , and Construction & Extraction (10 | 6.8%).
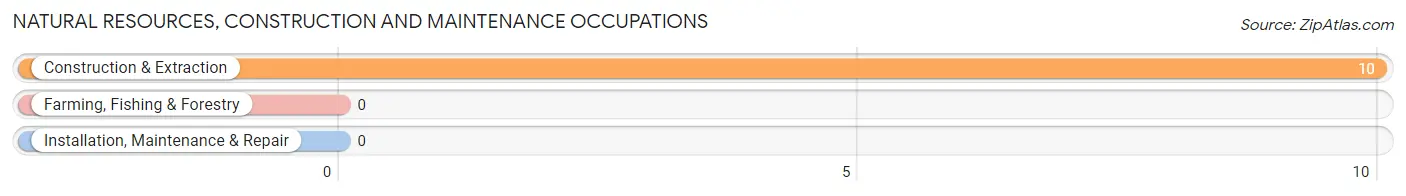
Natural Resources, Construction and Maintenance Occupations by Sex
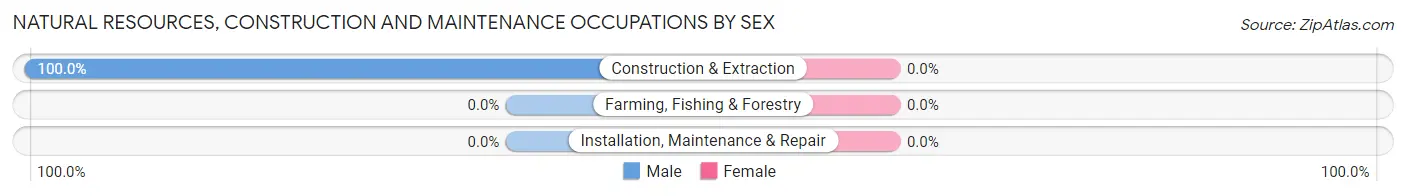
| Occupation | Male | Female |
| Farming, Fishing & Forestry | 0 (0.0%) | 0 (0.0%) |
| Construction & Extraction | 10 (100.0%) | 0 (0.0%) |
| Installation, Maintenance & Repair | 0 (0.0%) | 0 (0.0%) |
| Total (Category) | 10 (100.0%) | 0 (0.0%) |
| Total (Overall) | 90 (60.8%) | 58 (39.2%) |
Production, Transportation and Moving Occupations
The most common Production, Transportation and Moving occupations in Vadito are Material Moving (18 | 12.2%), Production (9 | 6.1%), and Transportation (1 | 0.7%).
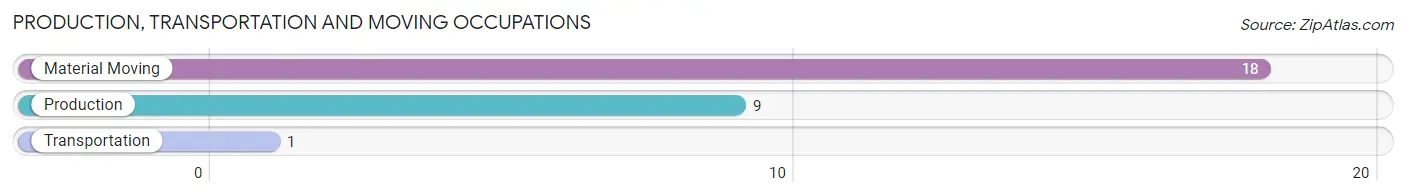
Production, Transportation and Moving Occupations by Sex
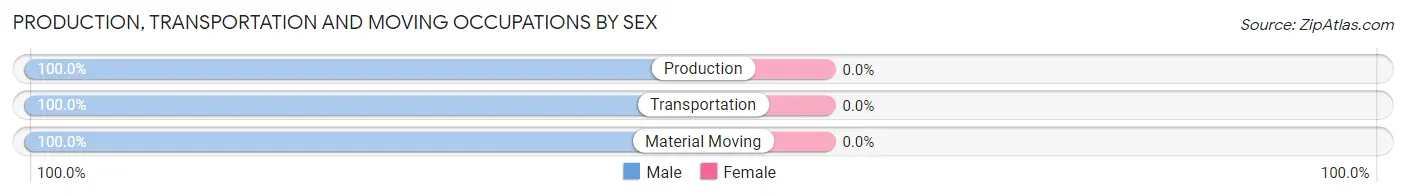
| Occupation | Male | Female |
| Production | 9 (100.0%) | 0 (0.0%) |
| Transportation | 1 (100.0%) | 0 (0.0%) |
| Material Moving | 18 (100.0%) | 0 (0.0%) |
| Total (Category) | 28 (100.0%) | 0 (0.0%) |
| Total (Overall) | 90 (60.8%) | 58 (39.2%) |
Employment Industries by Sex in Vadito
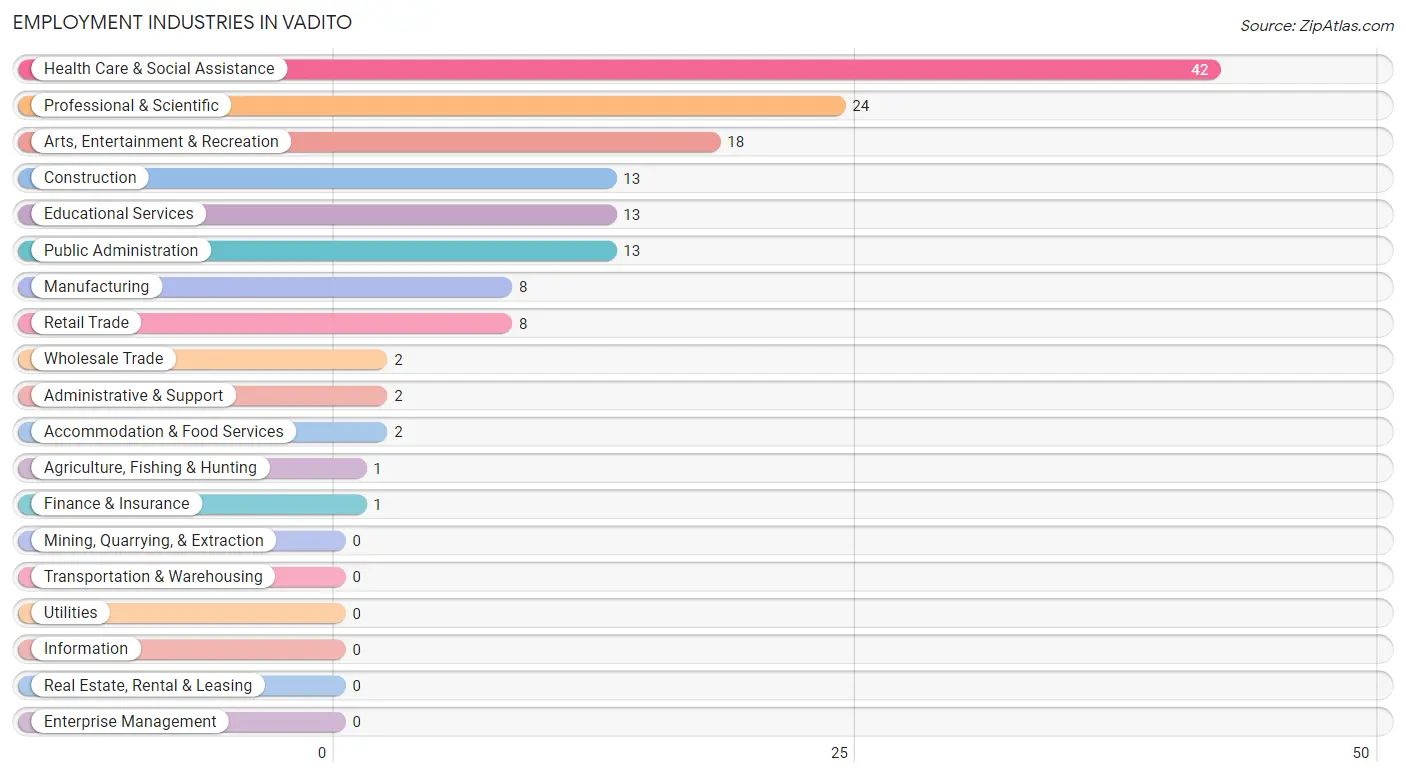
Employment Industries in Vadito
The major employment industries in Vadito include Health Care & Social Assistance (42 | 28.4%), Professional & Scientific (24 | 16.2%), Arts, Entertainment & Recreation (18 | 12.2%), Construction (13 | 8.8%), and Educational Services (13 | 8.8%).
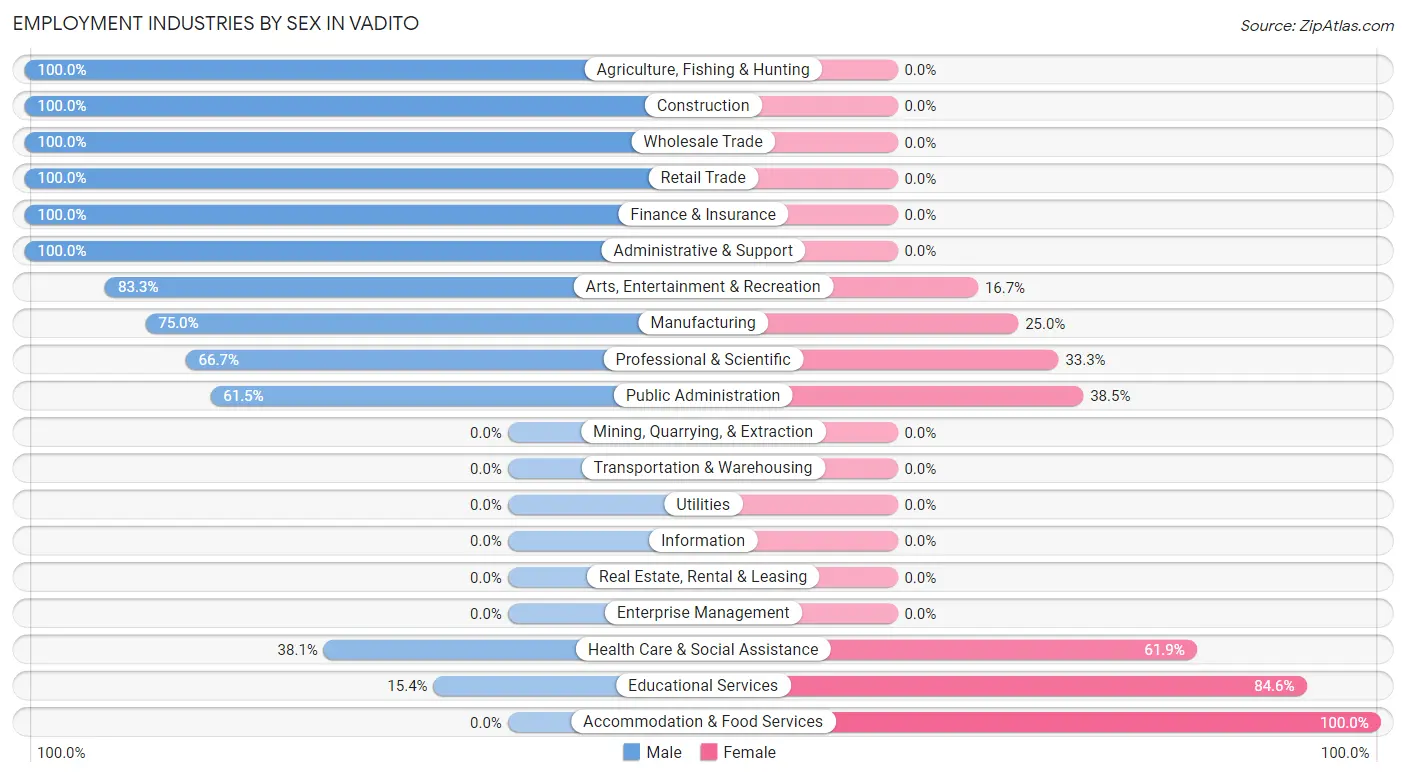
Employment Industries by Sex in Vadito
The Vadito industries that see more men than women are Agriculture, Fishing & Hunting (100.0%), Construction (100.0%), and Wholesale Trade (100.0%), whereas the industries that tend to have a higher number of women are Accommodation & Food Services (100.0%), Educational Services (84.6%), and Health Care & Social Assistance (61.9%).
| Industry | Male | Female |
| Agriculture, Fishing & Hunting | 1 (100.0%) | 0 (0.0%) |
| Mining, Quarrying, & Extraction | 0 (0.0%) | 0 (0.0%) |
| Construction | 13 (100.0%) | 0 (0.0%) |
| Manufacturing | 6 (75.0%) | 2 (25.0%) |
| Wholesale Trade | 2 (100.0%) | 0 (0.0%) |
| Retail Trade | 8 (100.0%) | 0 (0.0%) |
| Transportation & Warehousing | 0 (0.0%) | 0 (0.0%) |
| Utilities | 0 (0.0%) | 0 (0.0%) |
| Information | 0 (0.0%) | 0 (0.0%) |
| Finance & Insurance | 1 (100.0%) | 0 (0.0%) |
| Real Estate, Rental & Leasing | 0 (0.0%) | 0 (0.0%) |
| Professional & Scientific | 16 (66.7%) | 8 (33.3%) |
| Enterprise Management | 0 (0.0%) | 0 (0.0%) |
| Administrative & Support | 2 (100.0%) | 0 (0.0%) |
| Educational Services | 2 (15.4%) | 11 (84.6%) |
| Health Care & Social Assistance | 16 (38.1%) | 26 (61.9%) |
| Arts, Entertainment & Recreation | 15 (83.3%) | 3 (16.7%) |
| Accommodation & Food Services | 0 (0.0%) | 2 (100.0%) |
| Public Administration | 8 (61.5%) | 5 (38.5%) |
| Total | 90 (60.8%) | 58 (39.2%) |
Education in Vadito
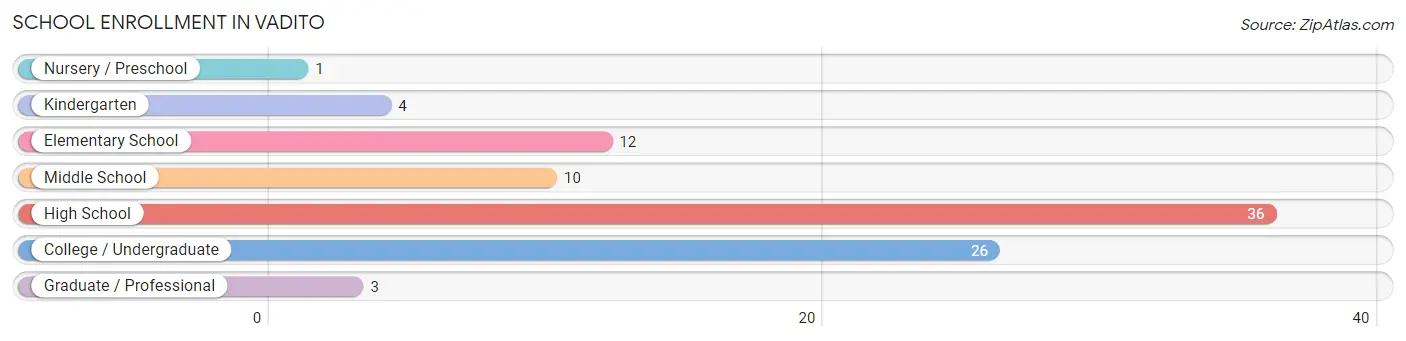
School Enrollment in Vadito
The most common levels of schooling among the 92 students in Vadito are high school (36 | 39.1%), college / undergraduate (26 | 28.3%), and elementary school (12 | 13.0%).
| School Level | # Students | % Students |
| Nursery / Preschool | 1 | 1.1% |
| Kindergarten | 4 | 4.3% |
| Elementary School | 12 | 13.0% |
| Middle School | 10 | 10.9% |
| High School | 36 | 39.1% |
| College / Undergraduate | 26 | 28.3% |
| Graduate / Professional | 3 | 3.3% |
| Total | 92 | 100.0% |
School Enrollment by Age by Funding Source in Vadito
Out of a total of 92 students who are enrolled in schools in Vadito, 6 (6.5%) attend a private institution, while the remaining 86 (93.5%) are enrolled in public schools. The age group of 18 to 19 year olds has the highest likelihood of being enrolled in private schools, with 3 (75.0% in the age bracket) enrolled. Conversely, the age group of 3 to 4 year olds has the lowest likelihood of being enrolled in a private school, with 3 (100.0% in the age bracket) attending a public institution.
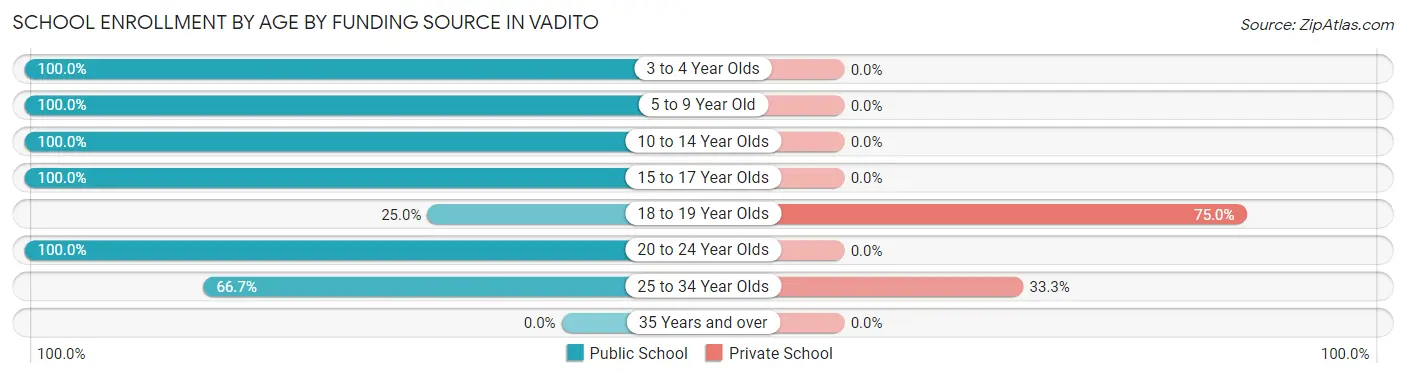
| Age Bracket | Public School | Private School |
| 3 to 4 Year Olds | 3 (100.0%) | 0 (0.0%) |
| 5 to 9 Year Old | 11 (100.0%) | 0 (0.0%) |
| 10 to 14 Year Olds | 27 (100.0%) | 0 (0.0%) |
| 15 to 17 Year Olds | 21 (100.0%) | 0 (0.0%) |
| 18 to 19 Year Olds | 1 (25.0%) | 3 (75.0%) |
| 20 to 24 Year Olds | 17 (100.0%) | 0 (0.0%) |
| 25 to 34 Year Olds | 6 (66.7%) | 3 (33.3%) |
| 35 Years and over | 0 (0.0%) | 0 (0.0%) |
| Total | 86 (93.5%) | 6 (6.5%) |
Educational Attainment by Field of Study in Vadito
Business (14 | 32.6%), education (7 | 16.3%), social sciences (4 | 9.3%), arts & humanities (4 | 9.3%), and computers & mathematics (3 | 7.0%) are the most common fields of study among 43 individuals in Vadito who have obtained a bachelor's degree or higher.
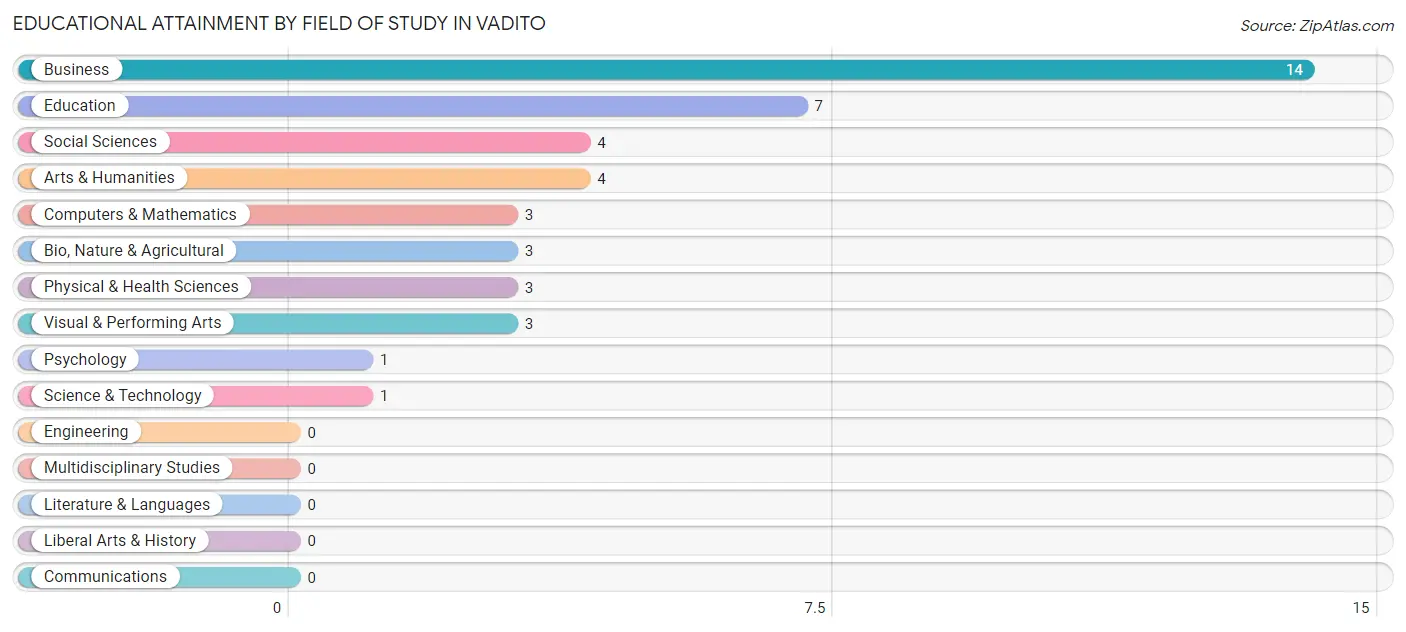
| Field of Study | # Graduates | % Graduates |
| Computers & Mathematics | 3 | 7.0% |
| Bio, Nature & Agricultural | 3 | 7.0% |
| Physical & Health Sciences | 3 | 7.0% |
| Psychology | 1 | 2.3% |
| Social Sciences | 4 | 9.3% |
| Engineering | 0 | 0.0% |
| Multidisciplinary Studies | 0 | 0.0% |
| Science & Technology | 1 | 2.3% |
| Business | 14 | 32.6% |
| Education | 7 | 16.3% |
| Literature & Languages | 0 | 0.0% |
| Liberal Arts & History | 0 | 0.0% |
| Visual & Performing Arts | 3 | 7.0% |
| Communications | 0 | 0.0% |
| Arts & Humanities | 4 | 9.3% |
| Total | 43 | 100.0% |
Transportation & Commute in Vadito
Vehicle Availability by Sex in Vadito
The most prevalent vehicle ownership categories in Vadito are males with 3 vehicles (28, accounting for 33.3%) and females with 3 vehicles (20, making up 52.8%).
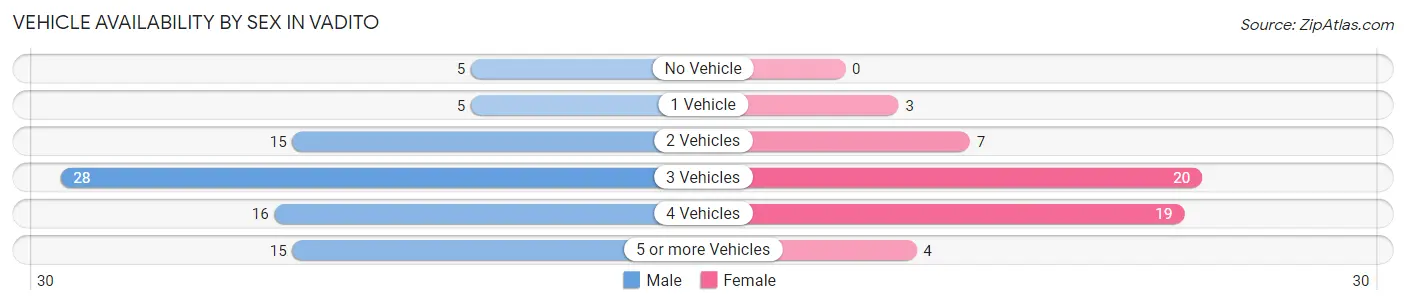
| Vehicles Available | Male | Female |
| No Vehicle | 5 (5.9%) | 0 (0.0%) |
| 1 Vehicle | 5 (5.9%) | 3 (5.7%) |
| 2 Vehicles | 15 (17.9%) | 7 (13.2%) |
| 3 Vehicles | 28 (33.3%) | 20 (37.7%) |
| 4 Vehicles | 16 (19.1%) | 19 (35.8%) |
| 5 or more Vehicles | 15 (17.9%) | 4 (7.5%) |
| Total | 84 (100.0%) | 53 (100.0%) |
Commute Time in Vadito
The most frequently occuring commute durations in Vadito are 60 to 89 minutes (51 commuters, 38.1%), 30 to 34 minutes (15 commuters, 11.2%), and 45 to 59 minutes (14 commuters, 10.4%).
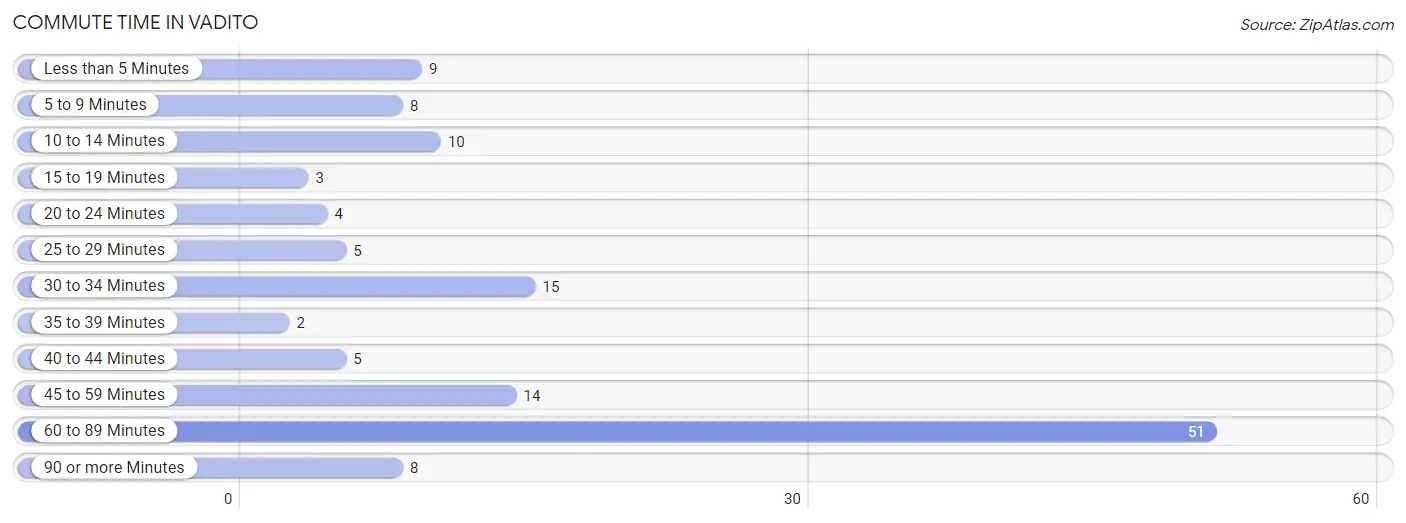
| Commute Time | # Commuters | % Commuters |
| Less than 5 Minutes | 9 | 6.7% |
| 5 to 9 Minutes | 8 | 6.0% |
| 10 to 14 Minutes | 10 | 7.5% |
| 15 to 19 Minutes | 3 | 2.2% |
| 20 to 24 Minutes | 4 | 3.0% |
| 25 to 29 Minutes | 5 | 3.7% |
| 30 to 34 Minutes | 15 | 11.2% |
| 35 to 39 Minutes | 2 | 1.5% |
| 40 to 44 Minutes | 5 | 3.7% |
| 45 to 59 Minutes | 14 | 10.4% |
| 60 to 89 Minutes | 51 | 38.1% |
| 90 or more Minutes | 8 | 6.0% |
Commute Time by Sex in Vadito
The most common commute times in Vadito are 60 to 89 minutes (41 commuters, 49.4%) for males and 60 to 89 minutes (10 commuters, 19.6%) for females.
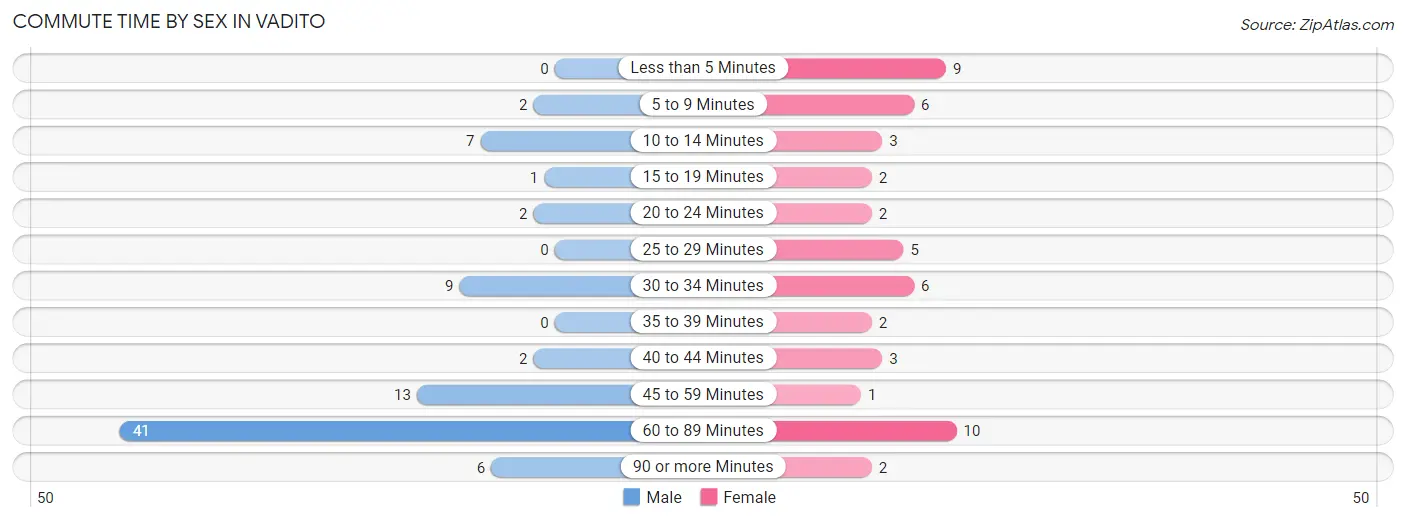
| Commute Time | Male | Female |
| Less than 5 Minutes | 0 (0.0%) | 9 (17.6%) |
| 5 to 9 Minutes | 2 (2.4%) | 6 (11.8%) |
| 10 to 14 Minutes | 7 (8.4%) | 3 (5.9%) |
| 15 to 19 Minutes | 1 (1.2%) | 2 (3.9%) |
| 20 to 24 Minutes | 2 (2.4%) | 2 (3.9%) |
| 25 to 29 Minutes | 0 (0.0%) | 5 (9.8%) |
| 30 to 34 Minutes | 9 (10.8%) | 6 (11.8%) |
| 35 to 39 Minutes | 0 (0.0%) | 2 (3.9%) |
| 40 to 44 Minutes | 2 (2.4%) | 3 (5.9%) |
| 45 to 59 Minutes | 13 (15.7%) | 1 (2.0%) |
| 60 to 89 Minutes | 41 (49.4%) | 10 (19.6%) |
| 90 or more Minutes | 6 (7.2%) | 2 (3.9%) |
Time of Departure to Work by Sex in Vadito
The most frequent times of departure to work in Vadito are 7:00 AM to 7:29 AM (23, 27.7%) for males and 7:00 AM to 7:29 AM (20, 39.2%) for females.
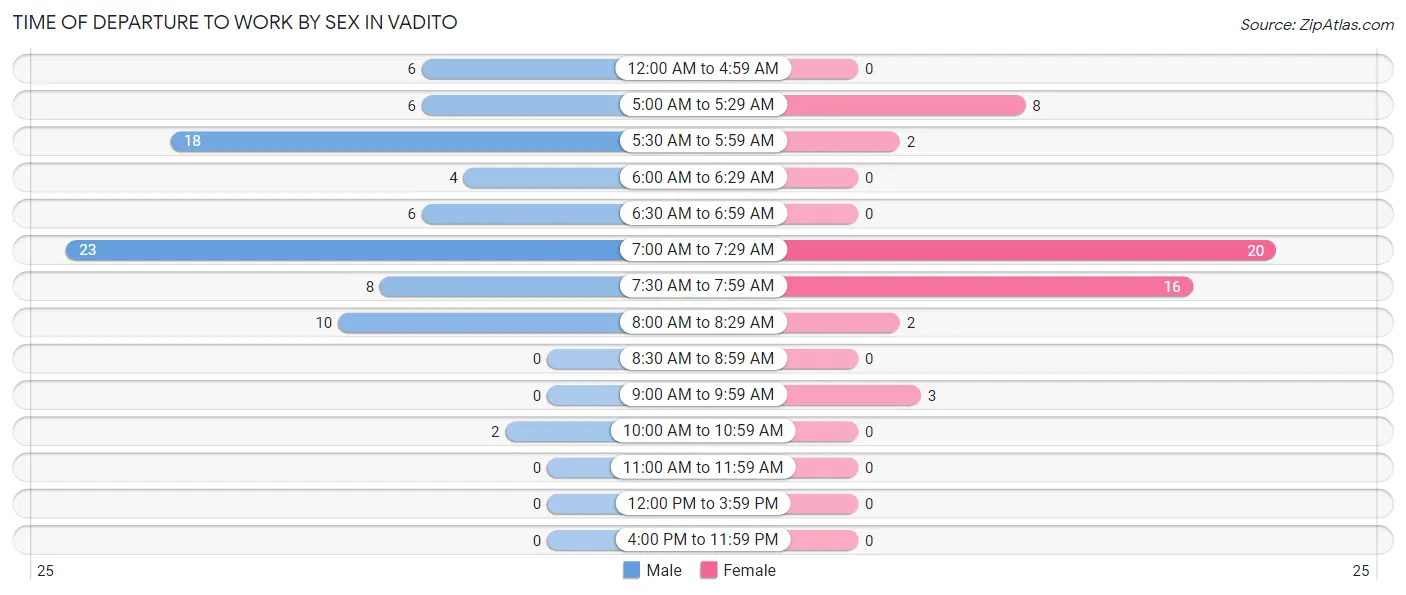
| Time of Departure | Male | Female |
| 12:00 AM to 4:59 AM | 6 (7.2%) | 0 (0.0%) |
| 5:00 AM to 5:29 AM | 6 (7.2%) | 8 (15.7%) |
| 5:30 AM to 5:59 AM | 18 (21.7%) | 2 (3.9%) |
| 6:00 AM to 6:29 AM | 4 (4.8%) | 0 (0.0%) |
| 6:30 AM to 6:59 AM | 6 (7.2%) | 0 (0.0%) |
| 7:00 AM to 7:29 AM | 23 (27.7%) | 20 (39.2%) |
| 7:30 AM to 7:59 AM | 8 (9.6%) | 16 (31.4%) |
| 8:00 AM to 8:29 AM | 10 (12.0%) | 2 (3.9%) |
| 8:30 AM to 8:59 AM | 0 (0.0%) | 0 (0.0%) |
| 9:00 AM to 9:59 AM | 0 (0.0%) | 3 (5.9%) |
| 10:00 AM to 10:59 AM | 2 (2.4%) | 0 (0.0%) |
| 11:00 AM to 11:59 AM | 0 (0.0%) | 0 (0.0%) |
| 12:00 PM to 3:59 PM | 0 (0.0%) | 0 (0.0%) |
| 4:00 PM to 11:59 PM | 0 (0.0%) | 0 (0.0%) |
| Total | 83 (100.0%) | 51 (100.0%) |
Housing Occupancy in Vadito
Occupancy by Ownership in Vadito
Of the total 118 dwellings in Vadito, owner-occupied units account for 93 (78.8%), while renter-occupied units make up 25 (21.2%).
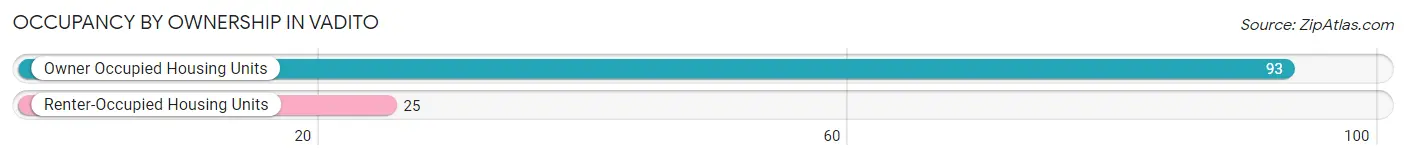
| Occupancy | # Housing Units | % Housing Units |
| Owner Occupied Housing Units | 93 | 78.8% |
| Renter-Occupied Housing Units | 25 | 21.2% |
| Total Occupied Housing Units | 118 | 100.0% |
Occupancy by Household Size in Vadito
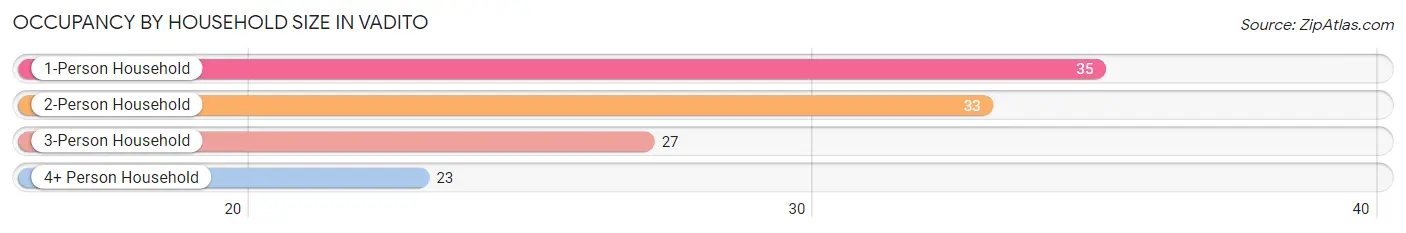
| Household Size | # Housing Units | % Housing Units |
| 1-Person Household | 35 | 29.7% |
| 2-Person Household | 33 | 28.0% |
| 3-Person Household | 27 | 22.9% |
| 4+ Person Household | 23 | 19.5% |
| Total Housing Units | 118 | 100.0% |
Occupancy by Ownership by Household Size in Vadito
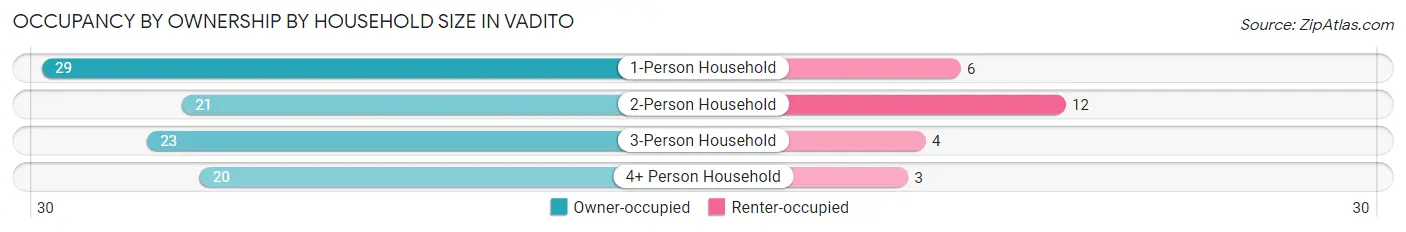
| Household Size | Owner-occupied | Renter-occupied |
| 1-Person Household | 29 (82.9%) | 6 (17.1%) |
| 2-Person Household | 21 (63.6%) | 12 (36.4%) |
| 3-Person Household | 23 (85.2%) | 4 (14.8%) |
| 4+ Person Household | 20 (87.0%) | 3 (13.0%) |
| Total Housing Units | 93 (78.8%) | 25 (21.2%) |
Occupancy by Educational Attainment in Vadito
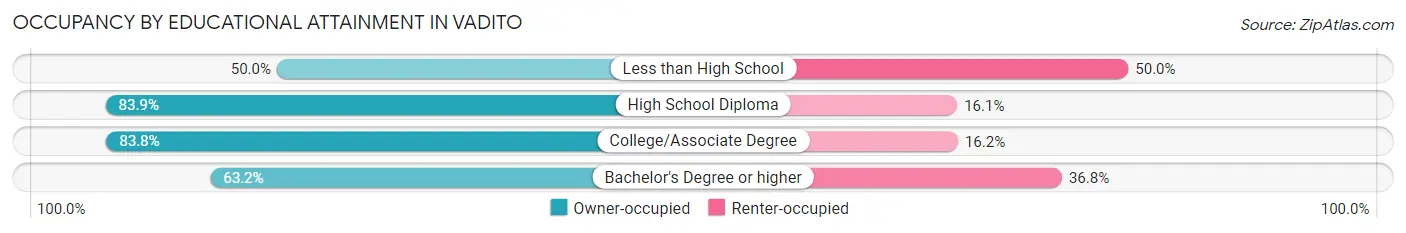
| Household Size | Owner-occupied | Renter-occupied |
| Less than High School | 3 (50.0%) | 3 (50.0%) |
| High School Diploma | 47 (83.9%) | 9 (16.1%) |
| College/Associate Degree | 31 (83.8%) | 6 (16.2%) |
| Bachelor's Degree or higher | 12 (63.2%) | 7 (36.8%) |
Occupancy by Age of Householder in Vadito
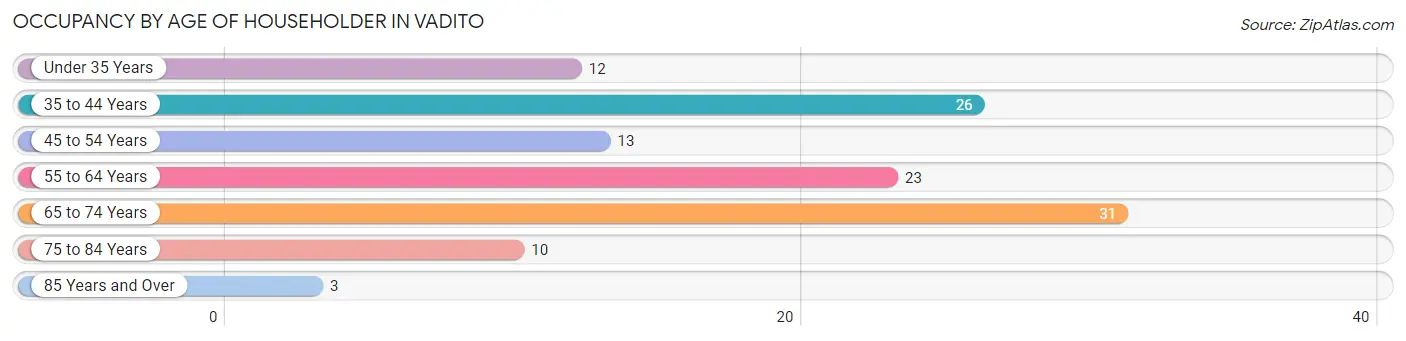
| Age Bracket | # Households | % Households |
| Under 35 Years | 12 | 10.2% |
| 35 to 44 Years | 26 | 22.0% |
| 45 to 54 Years | 13 | 11.0% |
| 55 to 64 Years | 23 | 19.5% |
| 65 to 74 Years | 31 | 26.3% |
| 75 to 84 Years | 10 | 8.5% |
| 85 Years and Over | 3 | 2.5% |
| Total | 118 | 100.0% |
Housing Finances in Vadito
Median Income by Occupancy in Vadito
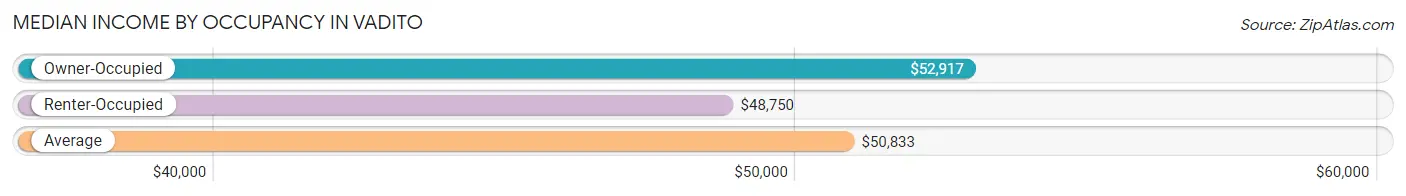
| Occupancy Type | # Households | Median Income |
| Owner-Occupied | 93 (78.8%) | $52,917 |
| Renter-Occupied | 25 (21.2%) | $48,750 |
| Average | 118 (100.0%) | $50,833 |
Occupancy by Householder Income Bracket in Vadito
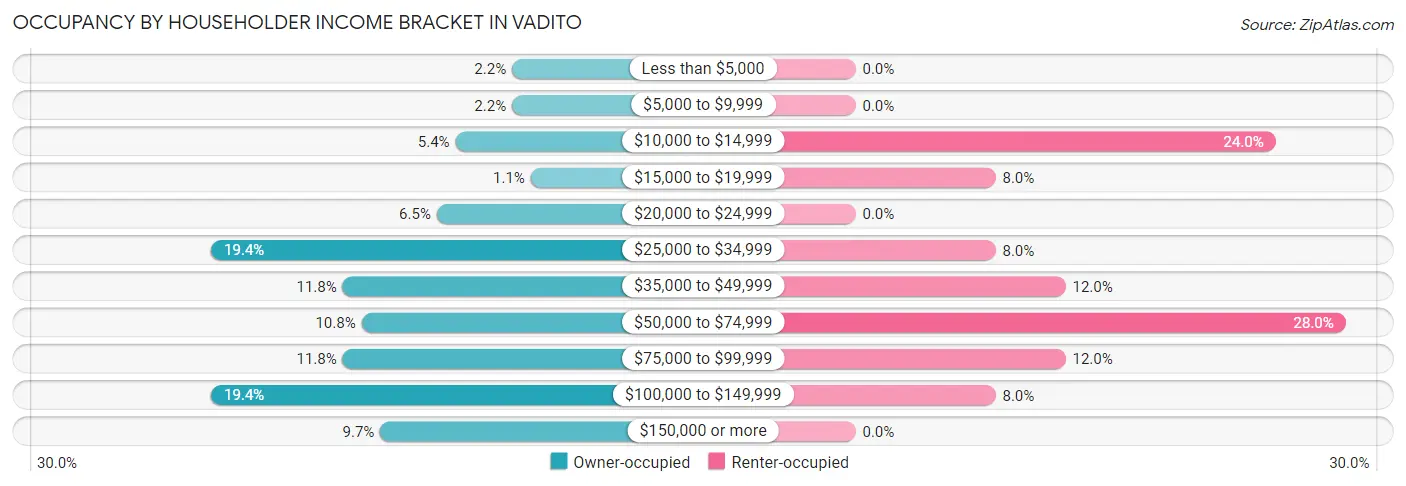
| Income Bracket | Owner-occupied | Renter-occupied |
| Less than $5,000 | 2 (2.1%) | 0 (0.0%) |
| $5,000 to $9,999 | 2 (2.1%) | 0 (0.0%) |
| $10,000 to $14,999 | 5 (5.4%) | 6 (24.0%) |
| $15,000 to $19,999 | 1 (1.1%) | 2 (8.0%) |
| $20,000 to $24,999 | 6 (6.5%) | 0 (0.0%) |
| $25,000 to $34,999 | 18 (19.4%) | 2 (8.0%) |
| $35,000 to $49,999 | 11 (11.8%) | 3 (12.0%) |
| $50,000 to $74,999 | 10 (10.7%) | 7 (28.0%) |
| $75,000 to $99,999 | 11 (11.8%) | 3 (12.0%) |
| $100,000 to $149,999 | 18 (19.4%) | 2 (8.0%) |
| $150,000 or more | 9 (9.7%) | 0 (0.0%) |
| Total | 93 (100.0%) | 25 (100.0%) |
Monthly Housing Cost Tiers in Vadito
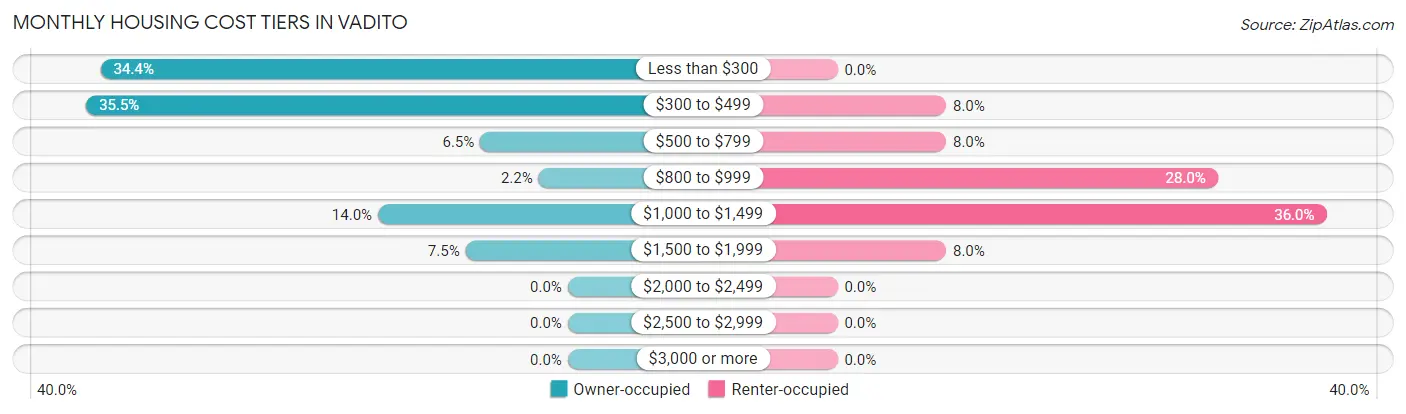
| Monthly Cost | Owner-occupied | Renter-occupied |
| Less than $300 | 32 (34.4%) | 0 (0.0%) |
| $300 to $499 | 33 (35.5%) | 2 (8.0%) |
| $500 to $799 | 6 (6.5%) | 2 (8.0%) |
| $800 to $999 | 2 (2.1%) | 7 (28.0%) |
| $1,000 to $1,499 | 13 (14.0%) | 9 (36.0%) |
| $1,500 to $1,999 | 7 (7.5%) | 2 (8.0%) |
| $2,000 to $2,499 | 0 (0.0%) | 0 (0.0%) |
| $2,500 to $2,999 | 0 (0.0%) | 0 (0.0%) |
| $3,000 or more | 0 (0.0%) | 0 (0.0%) |
| Total | 93 (100.0%) | 25 (100.0%) |
Physical Housing Characteristics in Vadito
Housing Structures in Vadito
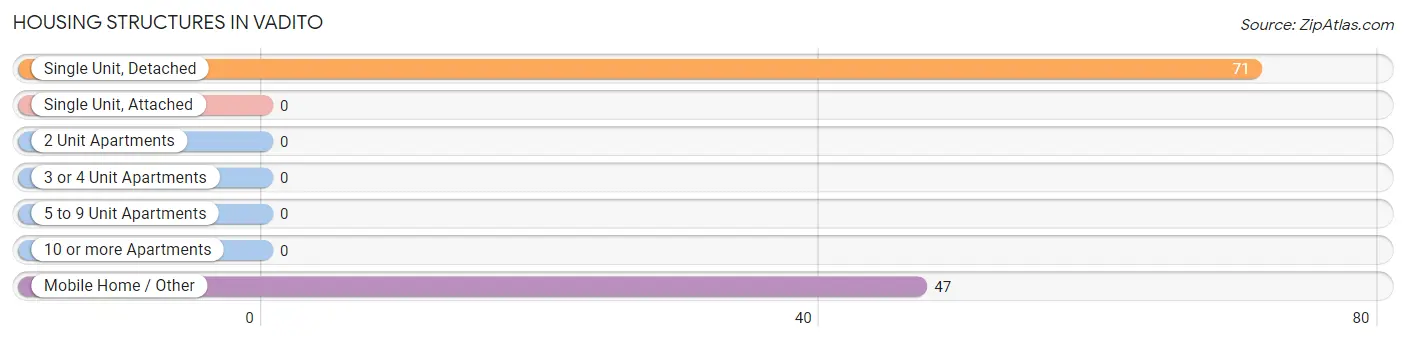
| Structure Type | # Housing Units | % Housing Units |
| Single Unit, Detached | 71 | 60.2% |
| Single Unit, Attached | 0 | 0.0% |
| 2 Unit Apartments | 0 | 0.0% |
| 3 or 4 Unit Apartments | 0 | 0.0% |
| 5 to 9 Unit Apartments | 0 | 0.0% |
| 10 or more Apartments | 0 | 0.0% |
| Mobile Home / Other | 47 | 39.8% |
| Total | 118 | 100.0% |
Housing Structures by Occupancy in Vadito
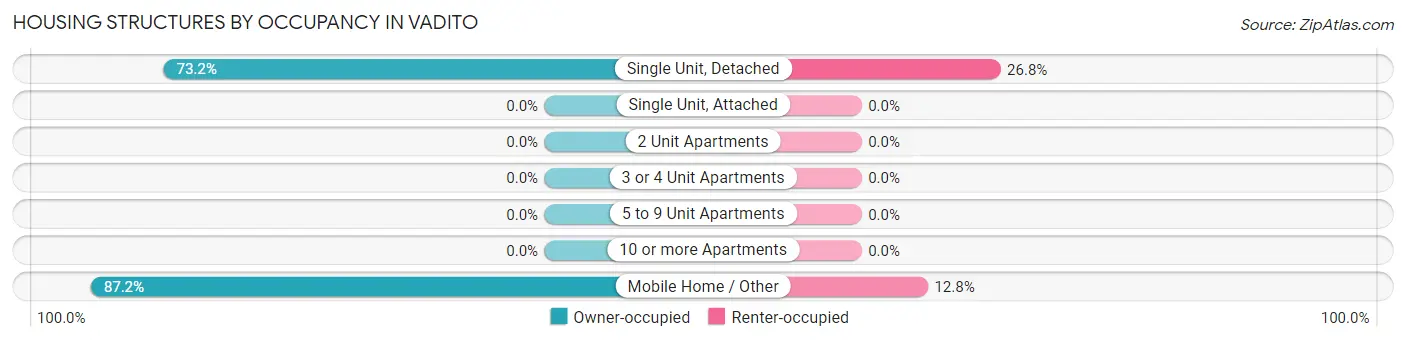
| Structure Type | Owner-occupied | Renter-occupied |
| Single Unit, Detached | 52 (73.2%) | 19 (26.8%) |
| Single Unit, Attached | 0 (0.0%) | 0 (0.0%) |
| 2 Unit Apartments | 0 (0.0%) | 0 (0.0%) |
| 3 or 4 Unit Apartments | 0 (0.0%) | 0 (0.0%) |
| 5 to 9 Unit Apartments | 0 (0.0%) | 0 (0.0%) |
| 10 or more Apartments | 0 (0.0%) | 0 (0.0%) |
| Mobile Home / Other | 41 (87.2%) | 6 (12.8%) |
| Total | 93 (78.8%) | 25 (21.2%) |
Housing Structures by Number of Rooms in Vadito
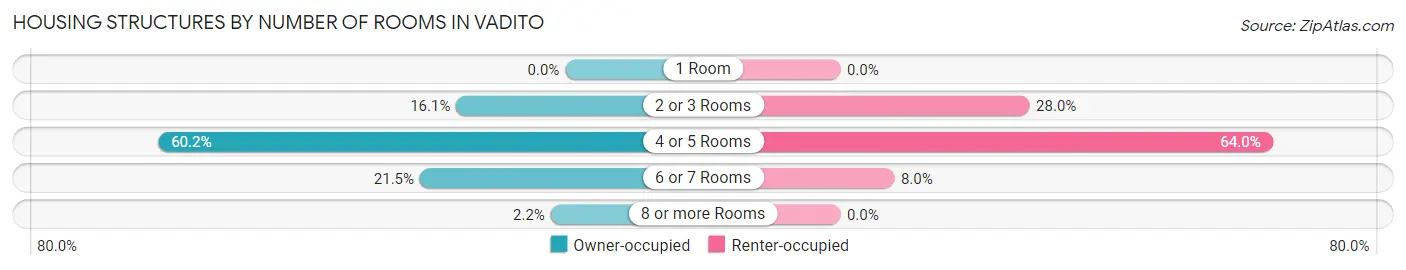
| Number of Rooms | Owner-occupied | Renter-occupied |
| 1 Room | 0 (0.0%) | 0 (0.0%) |
| 2 or 3 Rooms | 15 (16.1%) | 7 (28.0%) |
| 4 or 5 Rooms | 56 (60.2%) | 16 (64.0%) |
| 6 or 7 Rooms | 20 (21.5%) | 2 (8.0%) |
| 8 or more Rooms | 2 (2.1%) | 0 (0.0%) |
| Total | 93 (100.0%) | 25 (100.0%) |
Housing Structure by Heating Type in Vadito
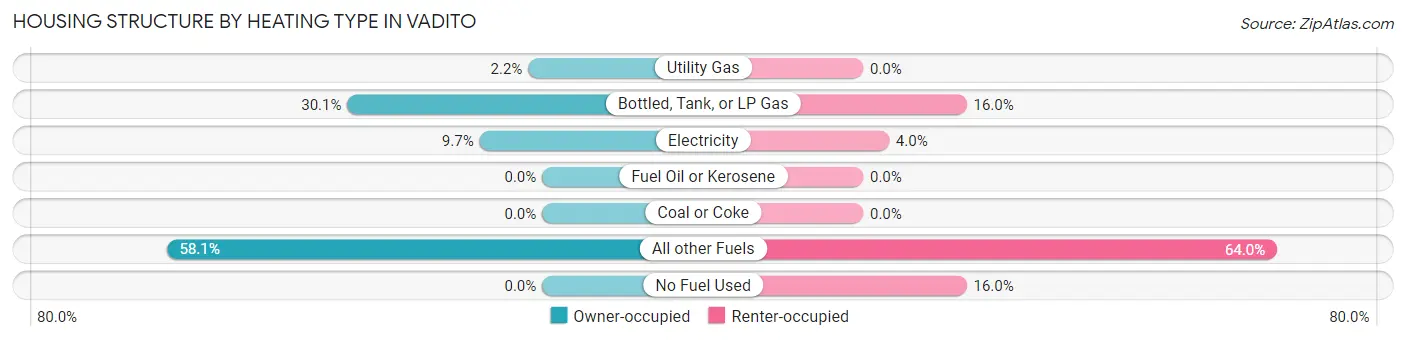
| Heating Type | Owner-occupied | Renter-occupied |
| Utility Gas | 2 (2.1%) | 0 (0.0%) |
| Bottled, Tank, or LP Gas | 28 (30.1%) | 4 (16.0%) |
| Electricity | 9 (9.7%) | 1 (4.0%) |
| Fuel Oil or Kerosene | 0 (0.0%) | 0 (0.0%) |
| Coal or Coke | 0 (0.0%) | 0 (0.0%) |
| All other Fuels | 54 (58.1%) | 16 (64.0%) |
| No Fuel Used | 0 (0.0%) | 4 (16.0%) |
| Total | 93 (100.0%) | 25 (100.0%) |
Household Vehicle Usage in Vadito
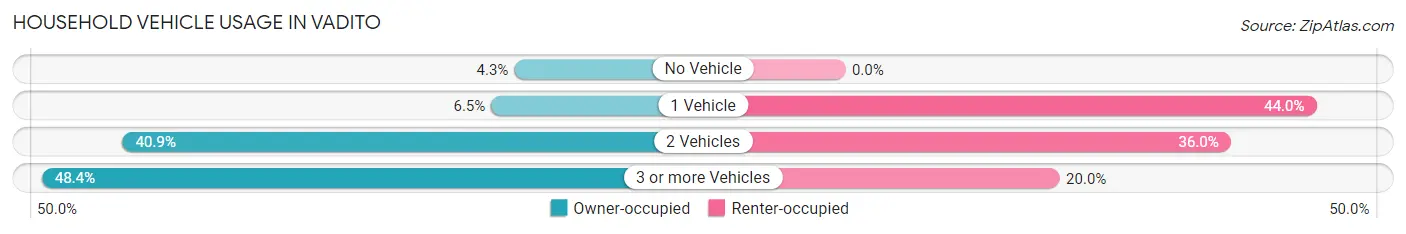
| Vehicles per Household | Owner-occupied | Renter-occupied |
| No Vehicle | 4 (4.3%) | 0 (0.0%) |
| 1 Vehicle | 6 (6.5%) | 11 (44.0%) |
| 2 Vehicles | 38 (40.9%) | 9 (36.0%) |
| 3 or more Vehicles | 45 (48.4%) | 5 (20.0%) |
| Total | 93 (100.0%) | 25 (100.0%) |
Real Estate & Mortgages in Vadito
Real Estate and Mortgage Overview in Vadito
| Characteristic | Without Mortgage | With Mortgage |
| Housing Units | 70 | 23 |
| Median Property Value | $154,500 | $225,000 |
| Median Household Income | $41,250 | $8 |
| Monthly Housing Costs | $312 | $0 |
| Real Estate Taxes | $470 | $5 |
Property Value by Mortgage Status in Vadito
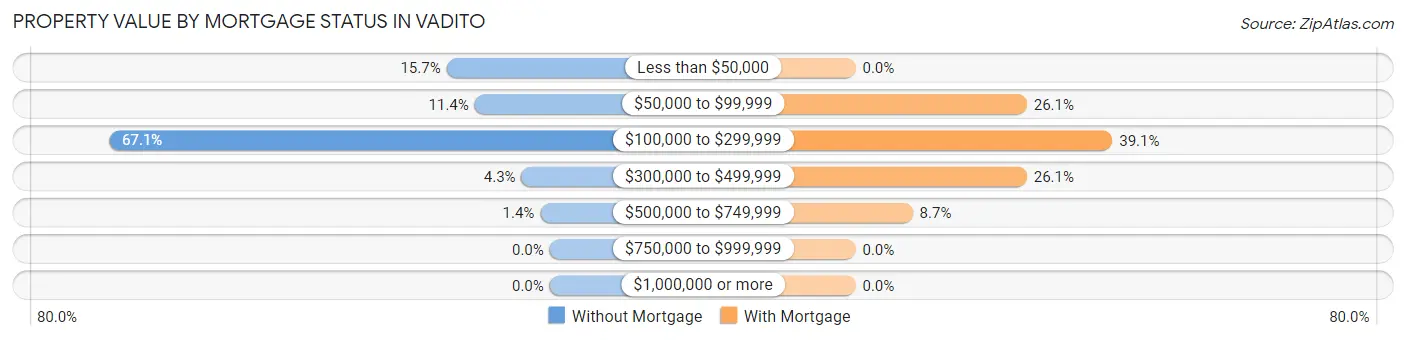
| Property Value | Without Mortgage | With Mortgage |
| Less than $50,000 | 11 (15.7%) | 0 (0.0%) |
| $50,000 to $99,999 | 8 (11.4%) | 6 (26.1%) |
| $100,000 to $299,999 | 47 (67.1%) | 9 (39.1%) |
| $300,000 to $499,999 | 3 (4.3%) | 6 (26.1%) |
| $500,000 to $749,999 | 1 (1.4%) | 2 (8.7%) |
| $750,000 to $999,999 | 0 (0.0%) | 0 (0.0%) |
| $1,000,000 or more | 0 (0.0%) | 0 (0.0%) |
| Total | 70 (100.0%) | 23 (100.0%) |
Household Income by Mortgage Status in Vadito
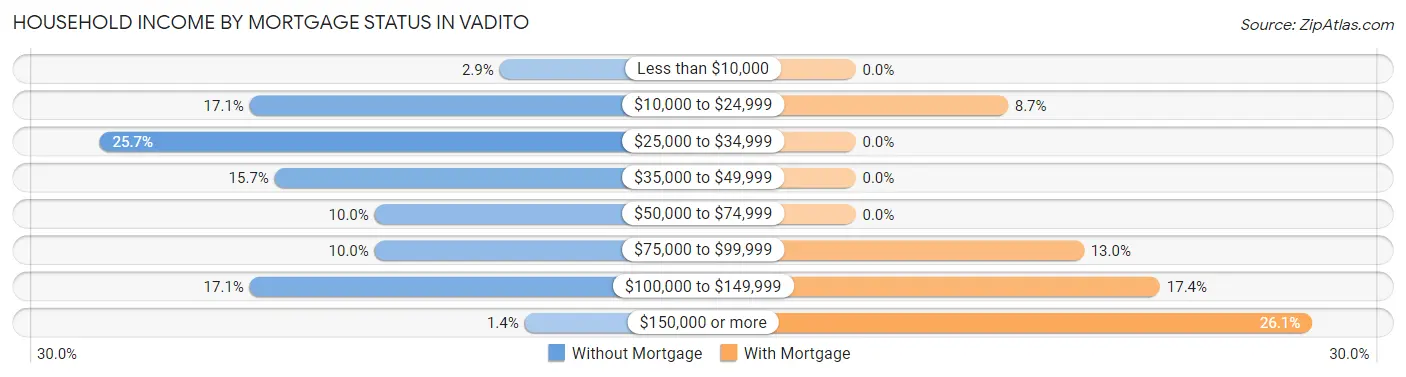
| Household Income | Without Mortgage | With Mortgage |
| Less than $10,000 | 2 (2.9%) | 0 (0.0%) |
| $10,000 to $24,999 | 12 (17.1%) | 2 (8.7%) |
| $25,000 to $34,999 | 18 (25.7%) | 0 (0.0%) |
| $35,000 to $49,999 | 11 (15.7%) | 0 (0.0%) |
| $50,000 to $74,999 | 7 (10.0%) | 0 (0.0%) |
| $75,000 to $99,999 | 7 (10.0%) | 3 (13.0%) |
| $100,000 to $149,999 | 12 (17.1%) | 4 (17.4%) |
| $150,000 or more | 1 (1.4%) | 6 (26.1%) |
| Total | 70 (100.0%) | 23 (100.0%) |
Property Value to Household Income Ratio in Vadito
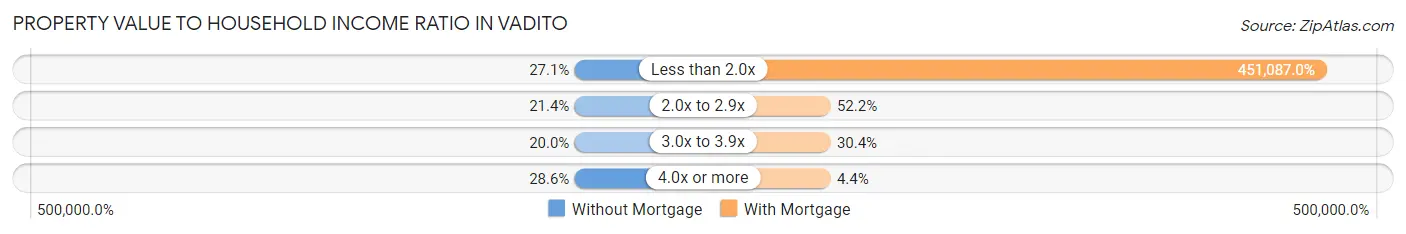
| Value-to-Income Ratio | Without Mortgage | With Mortgage |
| Less than 2.0x | 19 (27.1%) | 103,750 (451,087.0%) |
| 2.0x to 2.9x | 15 (21.4%) | 12 (52.2%) |
| 3.0x to 3.9x | 14 (20.0%) | 7 (30.4%) |
| 4.0x or more | 20 (28.6%) | 1 (4.3%) |
| Total | 70 (100.0%) | 23 (100.0%) |
Real Estate Taxes by Mortgage Status in Vadito
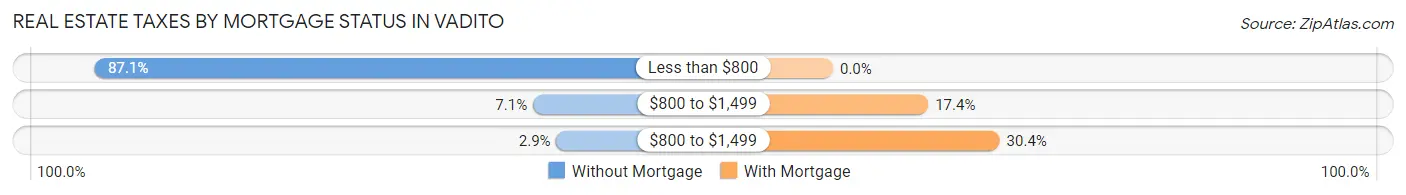
| Property Taxes | Without Mortgage | With Mortgage |
| Less than $800 | 61 (87.1%) | 0 (0.0%) |
| $800 to $1,499 | 5 (7.1%) | 4 (17.4%) |
| $800 to $1,499 | 2 (2.9%) | 7 (30.4%) |
| Total | 70 (100.0%) | 23 (100.0%) |
Health & Disability in Vadito
Health Insurance Coverage by Age in Vadito
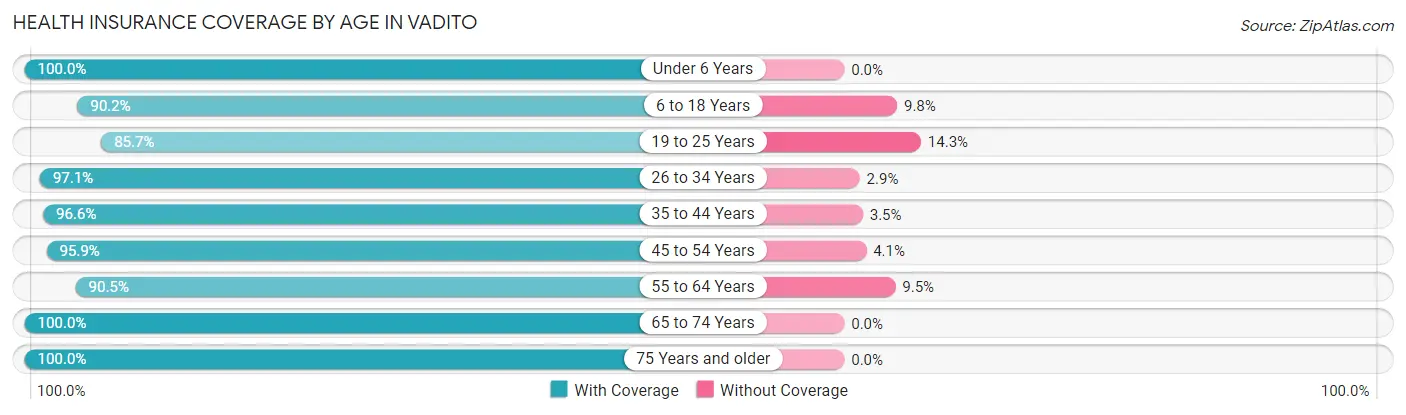
| Age Bracket | With Coverage | Without Coverage |
| Under 6 Years | 14 (100.0%) | 0 (0.0%) |
| 6 to 18 Years | 55 (90.2%) | 6 (9.8%) |
| 19 to 25 Years | 30 (85.7%) | 5 (14.3%) |
| 26 to 34 Years | 34 (97.1%) | 1 (2.9%) |
| 35 to 44 Years | 56 (96.6%) | 2 (3.5%) |
| 45 to 54 Years | 47 (95.9%) | 2 (4.1%) |
| 55 to 64 Years | 38 (90.5%) | 4 (9.5%) |
| 65 to 74 Years | 48 (100.0%) | 0 (0.0%) |
| 75 Years and older | 20 (100.0%) | 0 (0.0%) |
| Total | 342 (94.5%) | 20 (5.5%) |
Health Insurance Coverage by Citizenship Status in Vadito
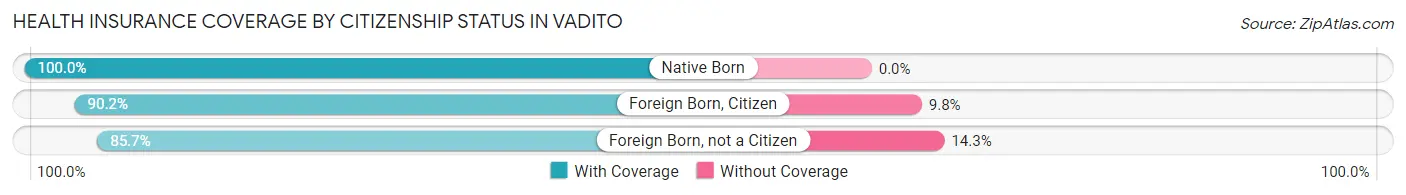
| Citizenship Status | With Coverage | Without Coverage |
| Native Born | 14 (100.0%) | 0 (0.0%) |
| Foreign Born, Citizen | 55 (90.2%) | 6 (9.8%) |
| Foreign Born, not a Citizen | 30 (85.7%) | 5 (14.3%) |
Health Insurance Coverage by Household Income in Vadito
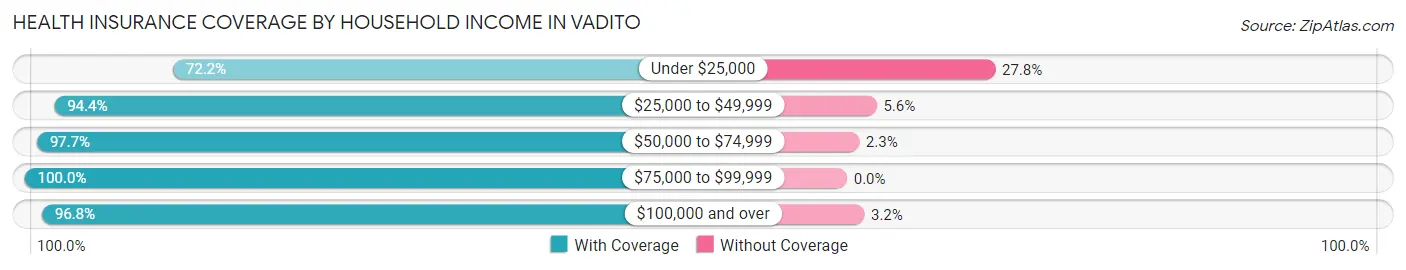
| Household Income | With Coverage | Without Coverage |
| Under $25,000 | 26 (72.2%) | 10 (27.8%) |
| $25,000 to $49,999 | 68 (94.4%) | 4 (5.6%) |
| $50,000 to $74,999 | 43 (97.7%) | 1 (2.3%) |
| $75,000 to $99,999 | 55 (100.0%) | 0 (0.0%) |
| $100,000 and over | 150 (96.8%) | 5 (3.2%) |
Public vs Private Health Insurance Coverage by Age in Vadito
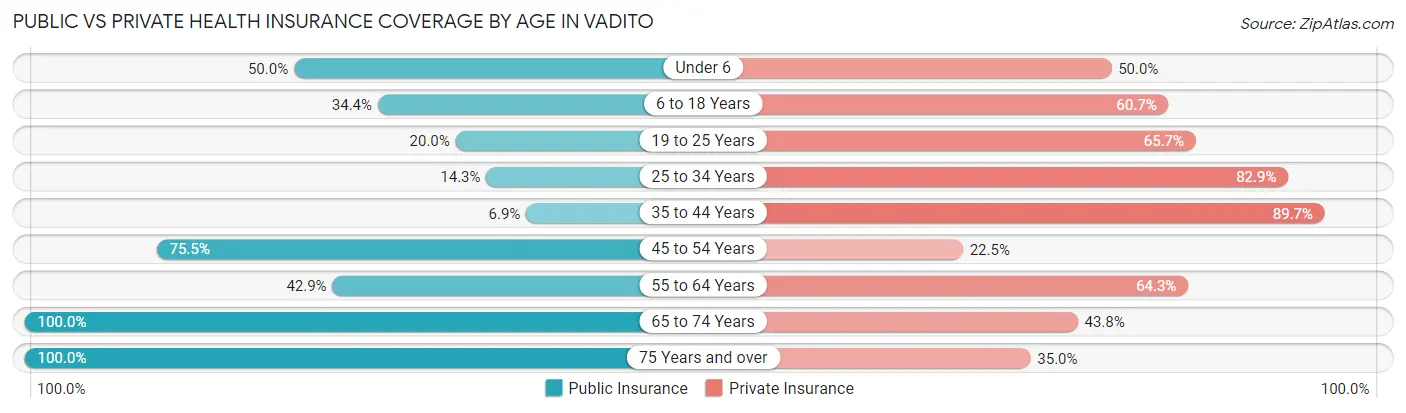
| Age Bracket | Public Insurance | Private Insurance |
| Under 6 | 7 (50.0%) | 7 (50.0%) |
| 6 to 18 Years | 21 (34.4%) | 37 (60.7%) |
| 19 to 25 Years | 7 (20.0%) | 23 (65.7%) |
| 25 to 34 Years | 5 (14.3%) | 29 (82.9%) |
| 35 to 44 Years | 4 (6.9%) | 52 (89.7%) |
| 45 to 54 Years | 37 (75.5%) | 11 (22.5%) |
| 55 to 64 Years | 18 (42.9%) | 27 (64.3%) |
| 65 to 74 Years | 48 (100.0%) | 21 (43.8%) |
| 75 Years and over | 20 (100.0%) | 7 (35.0%) |
| Total | 167 (46.1%) | 214 (59.1%) |
Disability Status by Sex by Age in Vadito
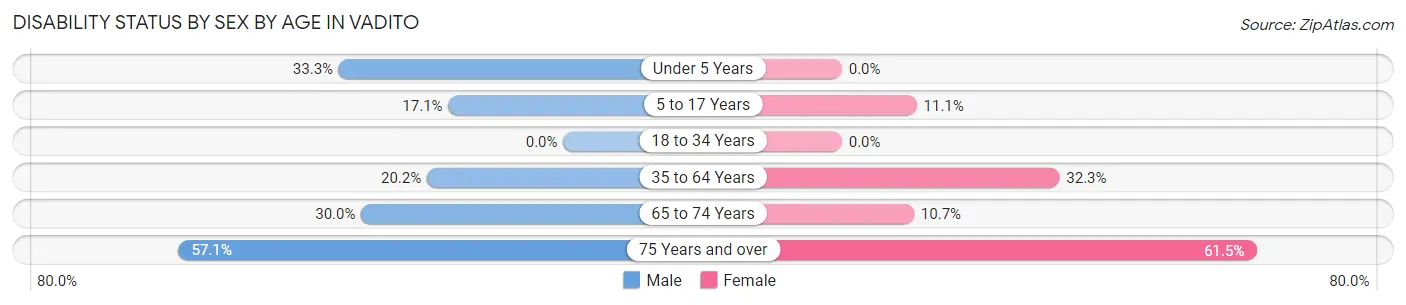
| Age Bracket | Male | Female |
| Under 5 Years | 2 (33.3%) | 0 (0.0%) |
| 5 to 17 Years | 7 (17.1%) | 2 (11.1%) |
| 18 to 34 Years | 0 (0.0%) | 0 (0.0%) |
| 35 to 64 Years | 17 (20.2%) | 21 (32.3%) |
| 65 to 74 Years | 6 (30.0%) | 3 (10.7%) |
| 75 Years and over | 4 (57.1%) | 8 (61.5%) |
Disability Class by Sex by Age in Vadito
Disability Class: Hearing Difficulty
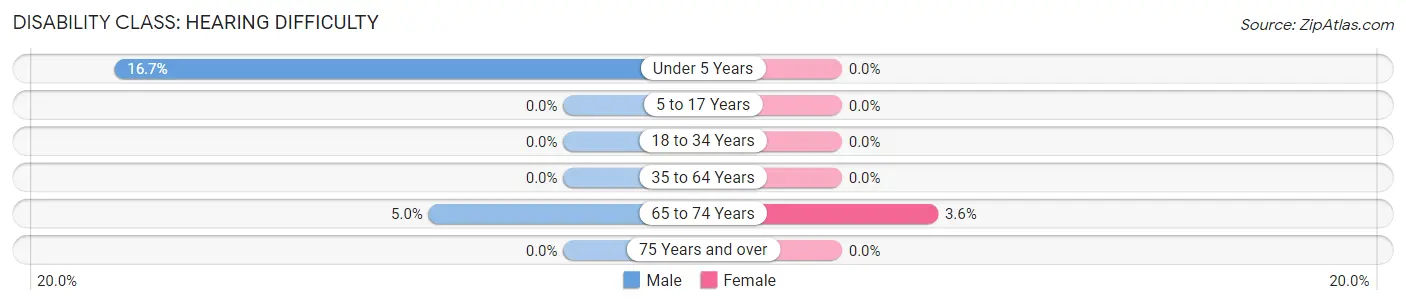
| Age Bracket | Male | Female |
| Under 5 Years | 1 (16.7%) | 0 (0.0%) |
| 5 to 17 Years | 0 (0.0%) | 0 (0.0%) |
| 18 to 34 Years | 0 (0.0%) | 0 (0.0%) |
| 35 to 64 Years | 0 (0.0%) | 0 (0.0%) |
| 65 to 74 Years | 1 (5.0%) | 1 (3.6%) |
| 75 Years and over | 0 (0.0%) | 0 (0.0%) |
Disability Class: Vision Difficulty
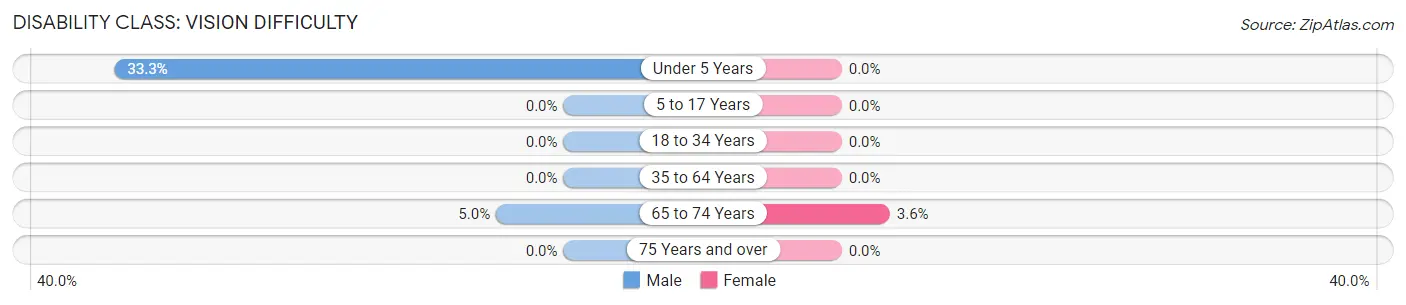
| Age Bracket | Male | Female |
| Under 5 Years | 2 (33.3%) | 0 (0.0%) |
| 5 to 17 Years | 0 (0.0%) | 0 (0.0%) |
| 18 to 34 Years | 0 (0.0%) | 0 (0.0%) |
| 35 to 64 Years | 0 (0.0%) | 0 (0.0%) |
| 65 to 74 Years | 1 (5.0%) | 1 (3.6%) |
| 75 Years and over | 0 (0.0%) | 0 (0.0%) |
Disability Class: Cognitive Difficulty
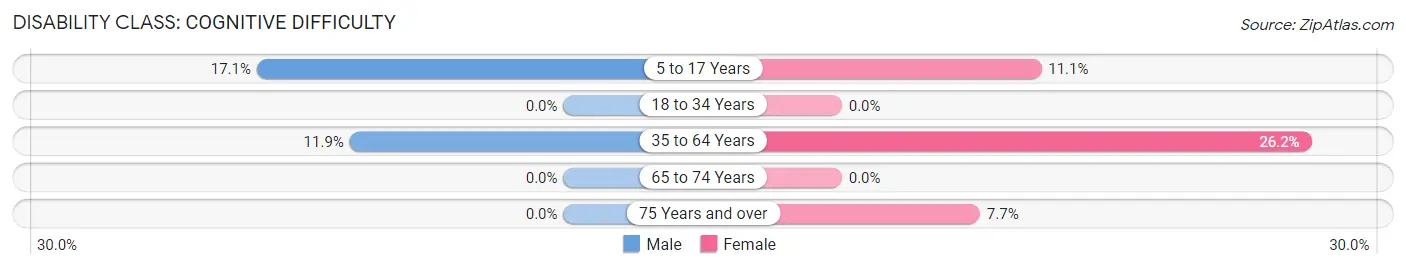
| Age Bracket | Male | Female |
| 5 to 17 Years | 7 (17.1%) | 2 (11.1%) |
| 18 to 34 Years | 0 (0.0%) | 0 (0.0%) |
| 35 to 64 Years | 10 (11.9%) | 17 (26.2%) |
| 65 to 74 Years | 0 (0.0%) | 0 (0.0%) |
| 75 Years and over | 0 (0.0%) | 1 (7.7%) |
Disability Class: Ambulatory Difficulty
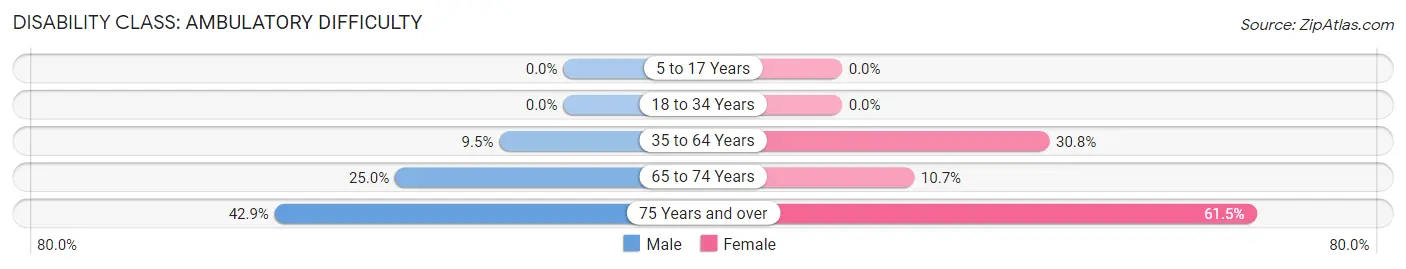
| Age Bracket | Male | Female |
| 5 to 17 Years | 0 (0.0%) | 0 (0.0%) |
| 18 to 34 Years | 0 (0.0%) | 0 (0.0%) |
| 35 to 64 Years | 8 (9.5%) | 20 (30.8%) |
| 65 to 74 Years | 5 (25.0%) | 3 (10.7%) |
| 75 Years and over | 3 (42.9%) | 8 (61.5%) |
Disability Class: Self-Care Difficulty
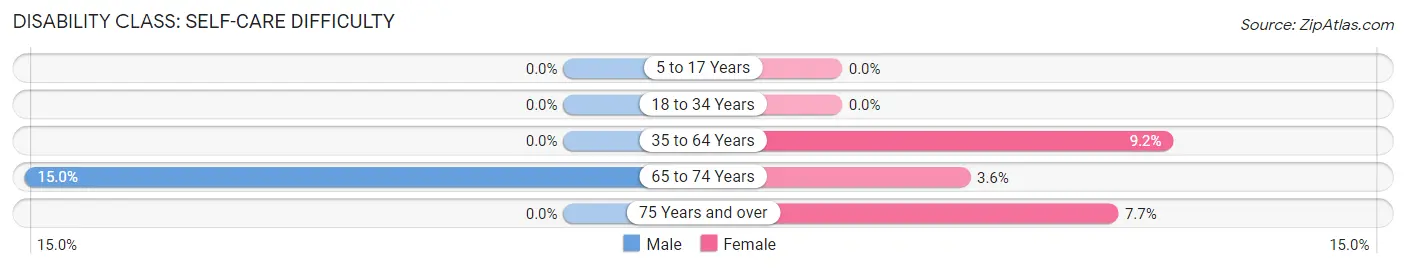
| Age Bracket | Male | Female |
| 5 to 17 Years | 0 (0.0%) | 0 (0.0%) |
| 18 to 34 Years | 0 (0.0%) | 0 (0.0%) |
| 35 to 64 Years | 0 (0.0%) | 6 (9.2%) |
| 65 to 74 Years | 3 (15.0%) | 1 (3.6%) |
| 75 Years and over | 0 (0.0%) | 1 (7.7%) |
Technology Access in Vadito
Computing Device Access in Vadito
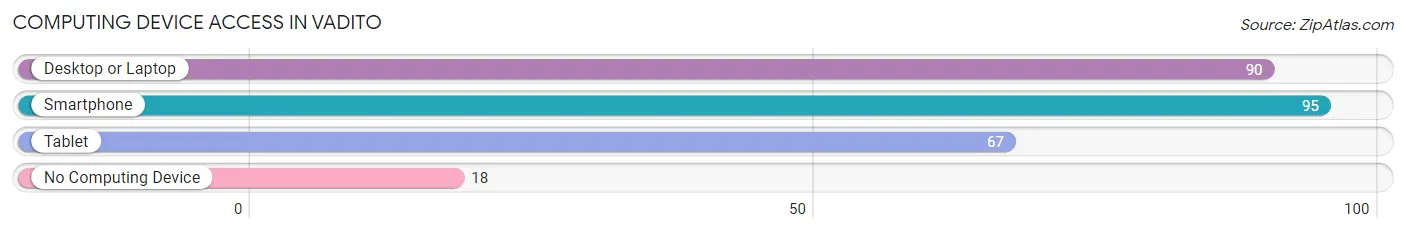
| Device Type | # Households | % Households |
| Desktop or Laptop | 90 | 76.3% |
| Smartphone | 95 | 80.5% |
| Tablet | 67 | 56.8% |
| No Computing Device | 18 | 15.2% |
| Total | 118 | 100.0% |
Internet Access in Vadito
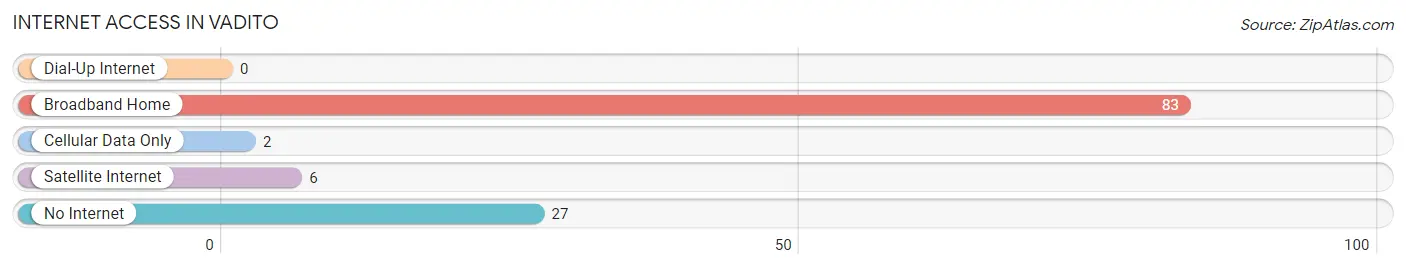
| Internet Type | # Households | % Households |
| Dial-Up Internet | 0 | 0.0% |
| Broadband Home | 83 | 70.3% |
| Cellular Data Only | 2 | 1.7% |
| Satellite Internet | 6 | 5.1% |
| No Internet | 27 | 22.9% |
| Total | 118 | 100.0% |
Vadito Summary
Vadito is a small unincorporated community located in Taos County, New Mexico. It is situated in the Sangre de Cristo Mountains, approximately 25 miles north of Taos. The community is located along State Road 75, which is the main road connecting Taos to the nearby towns of Questa and Red River.
History
Vadito was founded in the late 1800s by Spanish settlers who were drawn to the area by its fertile soil and abundant water sources. The town was originally called “Vado de los Taos”, which translates to “ford of the Taos”. The name was later changed to Vadito, which is derived from the Spanish word “vado”, meaning “ford”.
The town was initially populated by farmers and ranchers, who grew crops such as corn, beans, and squash. The area was also known for its sheep and cattle ranching. In the early 1900s, the town began to attract more settlers, including miners and loggers.
Geography
Vadito is located in the Sangre de Cristo Mountains, which are part of the Rocky Mountains. The town is situated at an elevation of 7,000 feet, and is surrounded by rolling hills and lush forests. The area is known for its mild climate, with temperatures ranging from the mid-50s in the winter to the mid-80s in the summer.
The town is located near the Rio Grande, which is the longest river in the United States. The Rio Grande is a major source of irrigation for the area, and is also a popular destination for fishing and rafting.
Economy
The economy of Vadito is largely based on agriculture and tourism. The town is home to several small farms, which produce a variety of crops, including corn, beans, squash, and hay. The area is also known for its sheep and cattle ranching.
Tourism is an important part of the local economy, as the town is located near several popular attractions, including the Rio Grande, the Taos Ski Valley, and the Rio Grande Gorge Bridge. The town is also home to several art galleries, restaurants, and shops.
Demographics
As of the 2010 census, the population of Vadito was 1,072. The town is predominantly Hispanic, with a population that is 97.3% Hispanic or Latino. The median household income in the town is $30,000, and the median age is 37.
Vadito is a small, rural community that is known for its friendly atmosphere and close-knit community. The town is home to several churches, a library, and a community center. The town is also home to a number of small businesses, including restaurants, shops, and art galleries.
Conclusion
Vadito is a small, unincorporated community located in Taos County, New Mexico. The town was founded in the late 1800s by Spanish settlers, and is now home to a predominantly Hispanic population. The economy of Vadito is largely based on agriculture and tourism, and the town is known for its mild climate and close-knit community.
Common Questions
What is Per Capita Income in Vadito?
Per Capita income in Vadito is $27,548.
What is the Median Family Income in Vadito?
Median Family Income in Vadito is $71,250.
What is the Median Household income in Vadito?
Median Household Income in Vadito is $50,833.
What is Income or Wage Gap in Vadito?
Income or Wage Gap in Vadito is 1.1%.
Women in Vadito earn 98.9 cents for every dollar earned by a man.
What is Inequality or Gini Index in Vadito?
Inequality or Gini Index in Vadito is 0.40.
What is the Total Population of Vadito?
Total Population of Vadito is 362.
What is the Total Male Population of Vadito?
Total Male Population of Vadito is 192.
What is the Total Female Population of Vadito?
Total Female Population of Vadito is 170.
What is the Ratio of Males per 100 Females in Vadito?
There are 112.94 Males per 100 Females in Vadito.
What is the Ratio of Females per 100 Males in Vadito?
There are 88.54 Females per 100 Males in Vadito.
What is the Median Population Age in Vadito?
Median Population Age in Vadito is 41.6 Years.
What is the Average Family Size in Vadito
Average Family Size in Vadito is 3.8 People.
What is the Average Household Size in Vadito
Average Household Size in Vadito is 3.1 People.
How Large is the Labor Force in Vadito?
There are 150 People in the Labor Forcein in Vadito.
What is the Percentage of People in the Labor Force in Vadito?
49.5% of People are in the Labor Force in Vadito.
What is the Unemployment Rate in Vadito?
Unemployment Rate in Vadito is 1.3%.