Cedar Hill, NM Map & Demographics
Cedar Hill Map
Cedar Hill Overview
$30,634
PER CAPITA INCOME
$69,833
AVG FAMILY INCOME
$68,958
AVG HOUSEHOLD INCOME
0.38
INEQUALITY / GINI INDEX
931
TOTAL POPULATION
514
MALE POPULATION
417
FEMALE POPULATION
123.26
MALES / 100 FEMALES
81.13
FEMALES / 100 MALES
52.2
MEDIAN AGE
3.5
AVG FAMILY SIZE
2.8
AVG HOUSEHOLD SIZE
436
LABOR FORCE [ PEOPLE ]
53.4%
PERCENT IN LABOR FORCE
12.8%
UNEMPLOYMENT RATE
Income in Cedar Hill
Income Overview in Cedar Hill
Per Capita Income in Cedar Hill is $30,634, while median incomes of families and households are $69,833 and $68,958 respectively.
| Characteristic | Number | Measure |
| Per Capita Income | 931 | $30,634 |
| Median Family Income | 236 | $69,833 |
| Mean Family Income | 236 | $81,649 |
| Median Household Income | 339 | $68,958 |
| Mean Household Income | 339 | $80,699 |
| Income Deficit | 236 | $0 |
| Wage / Income Gap (%) | 931 | 0.00% |
| Wage / Income Gap ($) | 931 | 100.00¢ per $1 |
| Gini / Inequality Index | 931 | 0.38 |
Earnings by Sex in Cedar Hill
| Sex | Number | Average Earnings |
| Male | 228 (43.6%) | $0 |
| Female | 295 (56.4%) | $0 |
| Total | 523 (100.0%) | $0 |
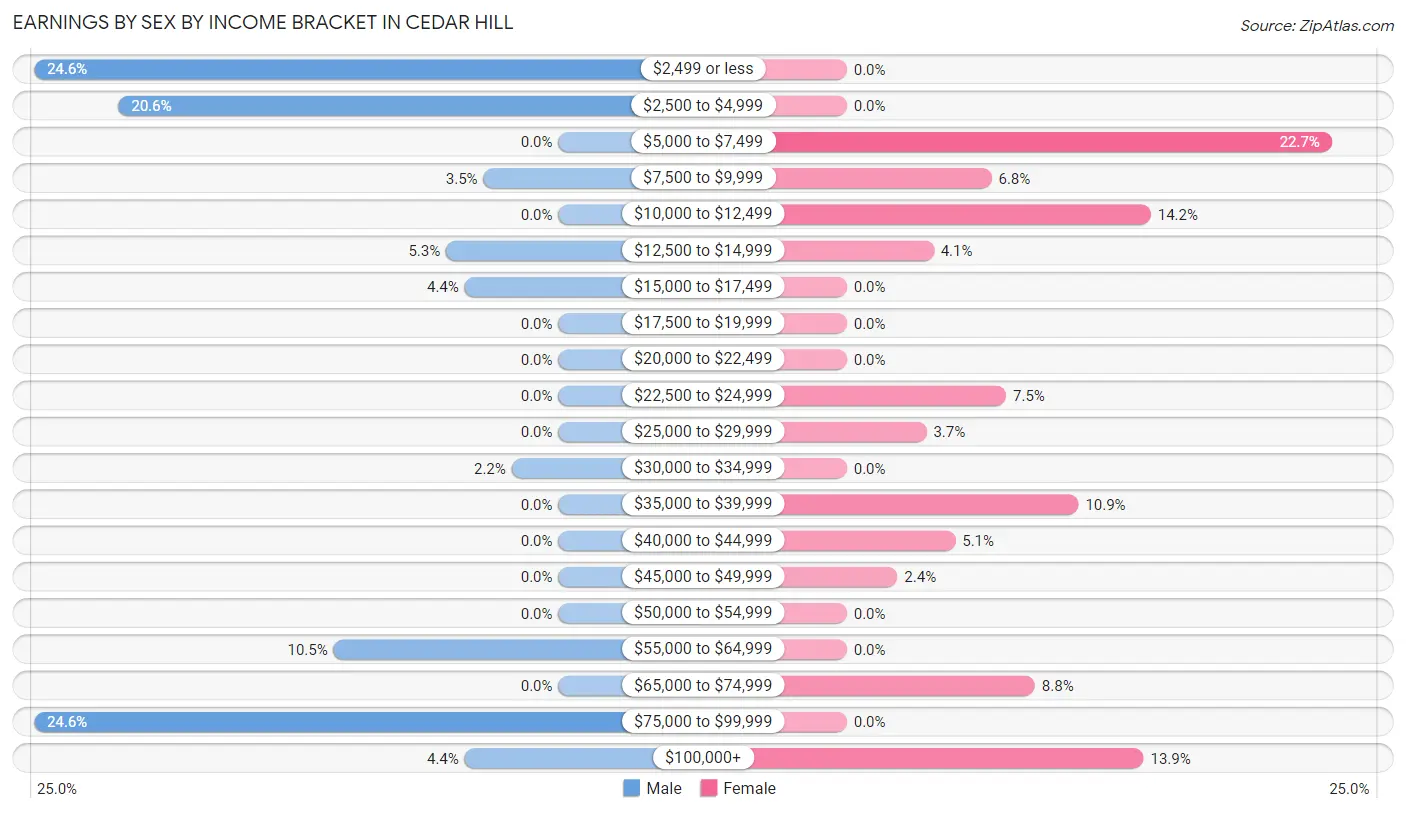
Earnings by Sex by Income Bracket in Cedar Hill
The most common earnings brackets in Cedar Hill are $2,499 or less for men (56 | 24.6%) and $5,000 to $7,499 for women (67 | 22.7%).
| Income | Male | Female |
| $2,499 or less | 56 (24.6%) | 0 (0.0%) |
| $2,500 to $4,999 | 47 (20.6%) | 0 (0.0%) |
| $5,000 to $7,499 | 0 (0.0%) | 67 (22.7%) |
| $7,500 to $9,999 | 8 (3.5%) | 20 (6.8%) |
| $10,000 to $12,499 | 0 (0.0%) | 42 (14.2%) |
| $12,500 to $14,999 | 12 (5.3%) | 12 (4.1%) |
| $15,000 to $17,499 | 10 (4.4%) | 0 (0.0%) |
| $17,500 to $19,999 | 0 (0.0%) | 0 (0.0%) |
| $20,000 to $22,499 | 0 (0.0%) | 0 (0.0%) |
| $22,500 to $24,999 | 0 (0.0%) | 22 (7.5%) |
| $25,000 to $29,999 | 0 (0.0%) | 11 (3.7%) |
| $30,000 to $34,999 | 5 (2.2%) | 0 (0.0%) |
| $35,000 to $39,999 | 0 (0.0%) | 32 (10.8%) |
| $40,000 to $44,999 | 0 (0.0%) | 15 (5.1%) |
| $45,000 to $49,999 | 0 (0.0%) | 7 (2.4%) |
| $50,000 to $54,999 | 0 (0.0%) | 0 (0.0%) |
| $55,000 to $64,999 | 24 (10.5%) | 0 (0.0%) |
| $65,000 to $74,999 | 0 (0.0%) | 26 (8.8%) |
| $75,000 to $99,999 | 56 (24.6%) | 0 (0.0%) |
| $100,000+ | 10 (4.4%) | 41 (13.9%) |
| Total | 228 (100.0%) | 295 (100.0%) |
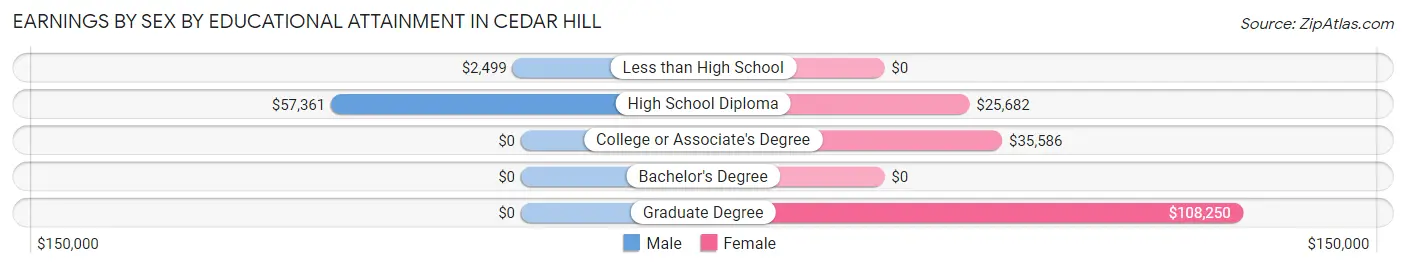
Earnings by Sex by Educational Attainment in Cedar Hill
| Educational Attainment | Male Income | Female Income |
| Less than High School | $2,499 | $0 |
| High School Diploma | $57,361 | $25,682 |
| College or Associate's Degree | - | - |
| Bachelor's Degree | - | - |
| Graduate Degree | - | - |
| Total | - | - |
Family Income in Cedar Hill
Family Income Brackets in Cedar Hill
According to the Cedar Hill family income data, there are 55 families falling into the $35,000 to $49,999 income range, which is the most common income bracket and makes up 23.3% of all families.
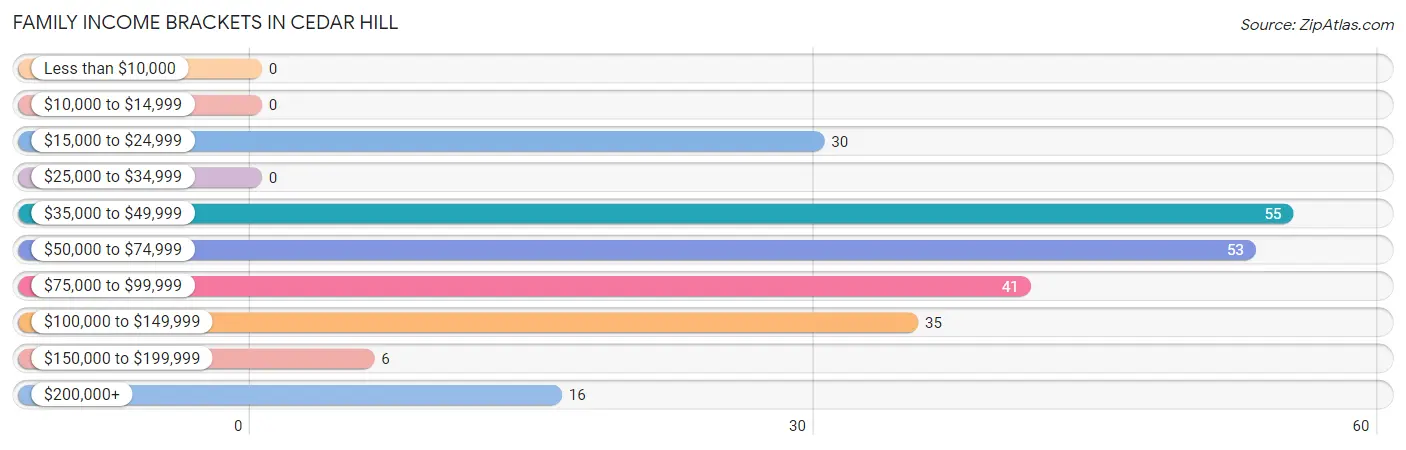
| Income Bracket | # Families | % Families |
| Less than $10,000 | 0 | 0.0% |
| $10,000 to $14,999 | 0 | 0.0% |
| $15,000 to $24,999 | 30 | 12.7% |
| $25,000 to $34,999 | 0 | 0.0% |
| $35,000 to $49,999 | 55 | 23.3% |
| $50,000 to $74,999 | 53 | 22.5% |
| $75,000 to $99,999 | 41 | 17.4% |
| $100,000 to $149,999 | 35 | 14.8% |
| $150,000 to $199,999 | 6 | 2.5% |
| $200,000+ | 16 | 6.8% |
Family Income by Famaliy Size in Cedar Hill
3-person families (63 | 26.7%) account for the highest median family income in Cedar Hill with $80,950 per family, while 2-person families (126 | 53.4%) have the highest median income of $34,916 per family member.
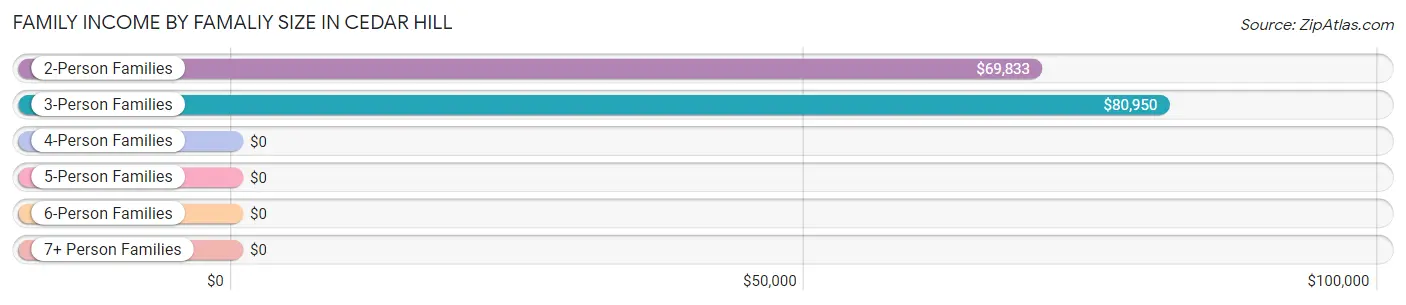
| Income Bracket | # Families | Median Income |
| 2-Person Families | 126 (53.4%) | $69,833 |
| 3-Person Families | 63 (26.7%) | $80,950 |
| 4-Person Families | 0 (0.0%) | $0 |
| 5-Person Families | 37 (15.7%) | $0 |
| 6-Person Families | 10 (4.2%) | $0 |
| 7+ Person Families | 0 (0.0%) | $0 |
| Total | 236 (100.0%) | $69,833 |
Family Income by Number of Earners in Cedar Hill
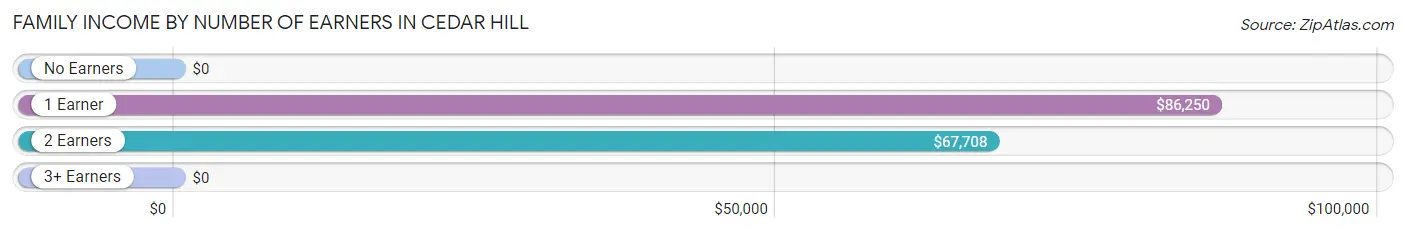
| Number of Earners | # Families | Median Income |
| No Earners | 49 (20.8%) | $0 |
| 1 Earner | 92 (39.0%) | $86,250 |
| 2 Earners | 36 (15.2%) | $67,708 |
| 3+ Earners | 59 (25.0%) | $0 |
| Total | 236 (100.0%) | $69,833 |
Household Income in Cedar Hill
Household Income Brackets in Cedar Hill
With 71 households falling in the category, the $50,000 to $74,999 income range is the most frequent in Cedar Hill, accounting for 20.9% of all households.
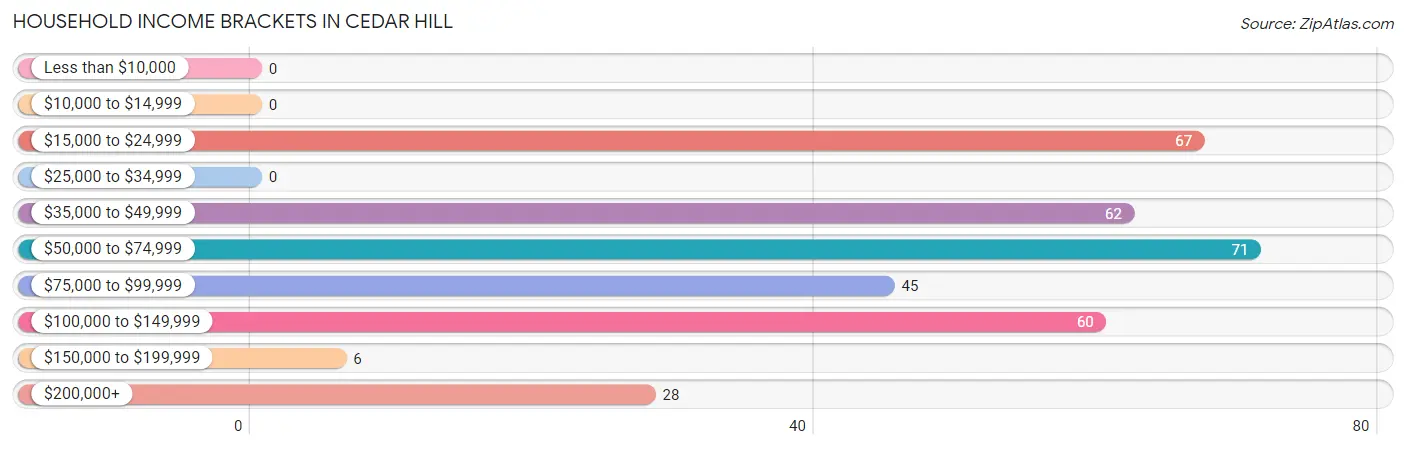
| Income Bracket | # Households | % Households |
| Less than $10,000 | 0 | 0.0% |
| $10,000 to $14,999 | 0 | 0.0% |
| $15,000 to $24,999 | 67 | 19.8% |
| $25,000 to $34,999 | 0 | 0.0% |
| $35,000 to $49,999 | 62 | 18.3% |
| $50,000 to $74,999 | 71 | 20.9% |
| $75,000 to $99,999 | 45 | 13.3% |
| $100,000 to $149,999 | 60 | 17.7% |
| $150,000 to $199,999 | 6 | 1.8% |
| $200,000+ | 28 | 8.3% |
Household Income by Householder Age in Cedar Hill
The median household income in Cedar Hill is $68,958, with the highest median household income of $81,150 found in the 25 to 44 years age bracket for the primary householder. A total of 77 households (22.7%) fall into this category.
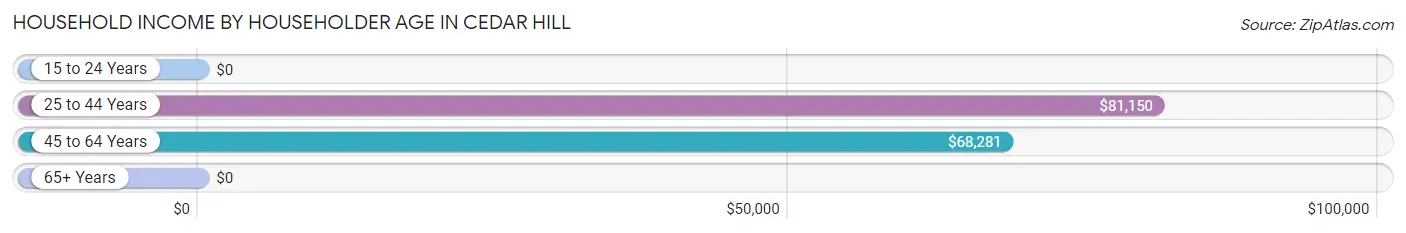
| Income Bracket | # Households | Median Income |
| 15 to 24 Years | 0 (0.0%) | $0 |
| 25 to 44 Years | 77 (22.7%) | $81,150 |
| 45 to 64 Years | 151 (44.5%) | $68,281 |
| 65+ Years | 111 (32.7%) | $0 |
| Total | 339 (100.0%) | $68,958 |
Poverty in Cedar Hill
Income Below Poverty by Sex and Age in Cedar Hill
With 27.8% poverty level for males and 18.7% for females among the residents of Cedar Hill, 16 and 17 year old males and 18 to 24 year old females are the most vulnerable to poverty, with 40 males (100.0%) and 50 females (78.1%) in their respective age groups living below the poverty level.
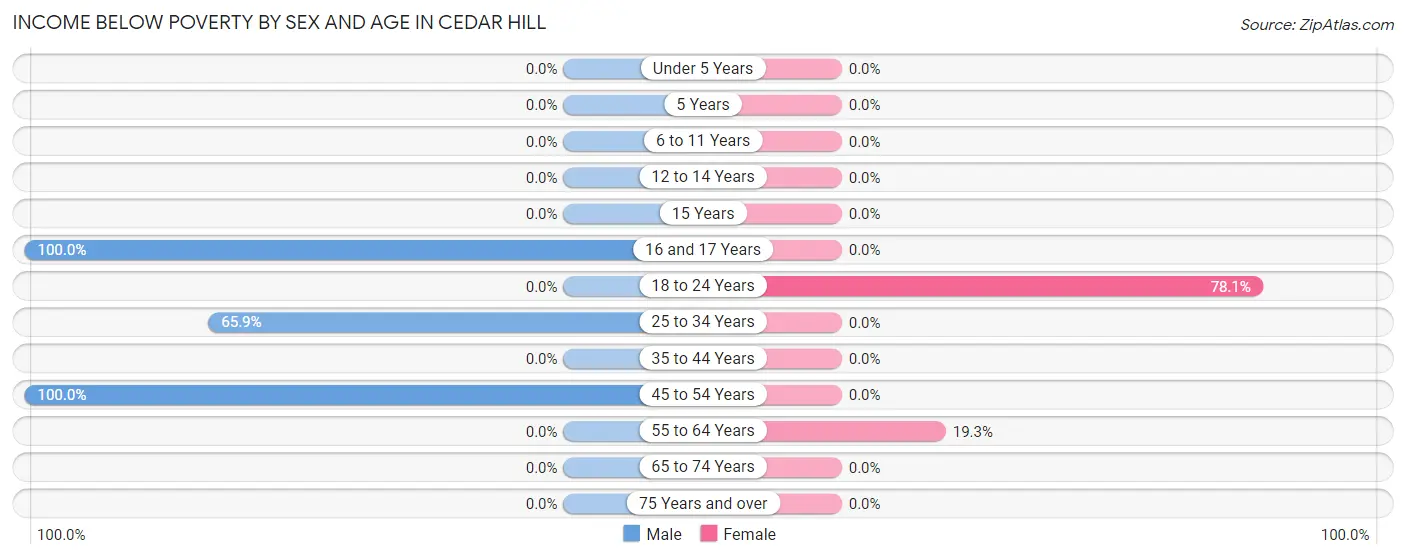
| Age Bracket | Male | Female |
| Under 5 Years | 0 (0.0%) | 0 (0.0%) |
| 5 Years | 0 (0.0%) | 0 (0.0%) |
| 6 to 11 Years | 0 (0.0%) | 0 (0.0%) |
| 12 to 14 Years | 0 (0.0%) | 0 (0.0%) |
| 15 Years | 0 (0.0%) | 0 (0.0%) |
| 16 and 17 Years | 40 (100.0%) | 0 (0.0%) |
| 18 to 24 Years | 0 (0.0%) | 50 (78.1%) |
| 25 to 34 Years | 56 (65.9%) | 0 (0.0%) |
| 35 to 44 Years | 0 (0.0%) | 0 (0.0%) |
| 45 to 54 Years | 47 (100.0%) | 0 (0.0%) |
| 55 to 64 Years | 0 (0.0%) | 28 (19.3%) |
| 65 to 74 Years | 0 (0.0%) | 0 (0.0%) |
| 75 Years and over | 0 (0.0%) | 0 (0.0%) |
| Total | 143 (27.8%) | 78 (18.7%) |
Income Above Poverty by Sex and Age in Cedar Hill
According to the poverty statistics in Cedar Hill, males aged under 5 years and females aged under 5 years are the age groups that are most secure financially, with 100.0% of males and 100.0% of females in these age groups living above the poverty line.
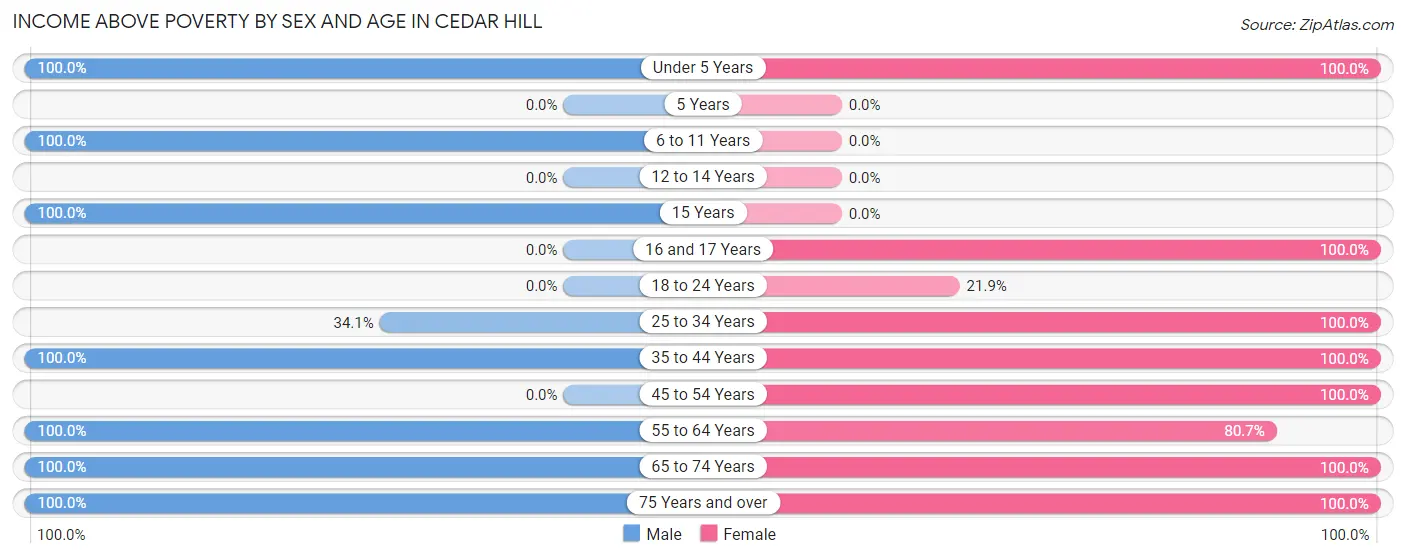
| Age Bracket | Male | Female |
| Under 5 Years | 8 (100.0%) | 19 (100.0%) |
| 5 Years | 0 (0.0%) | 0 (0.0%) |
| 6 to 11 Years | 48 (100.0%) | 0 (0.0%) |
| 12 to 14 Years | 0 (0.0%) | 0 (0.0%) |
| 15 Years | 39 (100.0%) | 0 (0.0%) |
| 16 and 17 Years | 0 (0.0%) | 13 (100.0%) |
| 18 to 24 Years | 0 (0.0%) | 14 (21.9%) |
| 25 to 34 Years | 29 (34.1%) | 35 (100.0%) |
| 35 to 44 Years | 40 (100.0%) | 52 (100.0%) |
| 45 to 54 Years | 0 (0.0%) | 25 (100.0%) |
| 55 to 64 Years | 112 (100.0%) | 117 (80.7%) |
| 65 to 74 Years | 44 (100.0%) | 39 (100.0%) |
| 75 Years and over | 51 (100.0%) | 25 (100.0%) |
| Total | 371 (72.2%) | 339 (81.3%) |
Income Below Poverty Among Married-Couple Families in Cedar Hill
The poverty statistics for married-couple families in Cedar Hill show that 18.3% or 28 of the total 153 families live below the poverty line. Families with 1 or 2 children have the highest poverty rate of 52.8%, comprising of 28 families. On the other hand, families with no children have the lowest poverty rate of 0.0%, which includes 0 families.
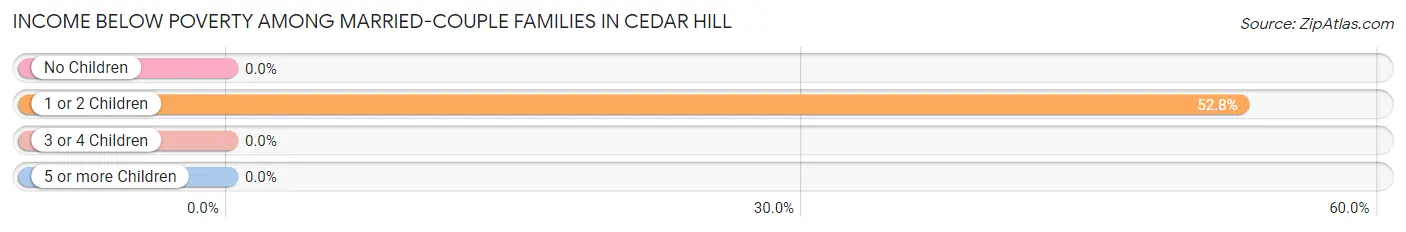
| Children | Above Poverty | Below Poverty |
| No Children | 100 (100.0%) | 0 (0.0%) |
| 1 or 2 Children | 25 (47.2%) | 28 (52.8%) |
| 3 or 4 Children | 0 (0.0%) | 0 (0.0%) |
| 5 or more Children | 0 (0.0%) | 0 (0.0%) |
| Total | 125 (81.7%) | 28 (18.3%) |
Income Below Poverty Among Single-Parent Households in Cedar Hill
| Children | Single Father | Single Mother |
| No Children | 0 (0.0%) | 0 (0.0%) |
| 1 or 2 Children | 0 (0.0%) | 0 (0.0%) |
| 3 or 4 Children | 0 (0.0%) | 0 (0.0%) |
| 5 or more Children | 0 (0.0%) | 0 (0.0%) |
| Total | 0 (0.0%) | 0 (0.0%) |
Income Below Poverty Among Married-Couple vs Single-Parent Households in Cedar Hill
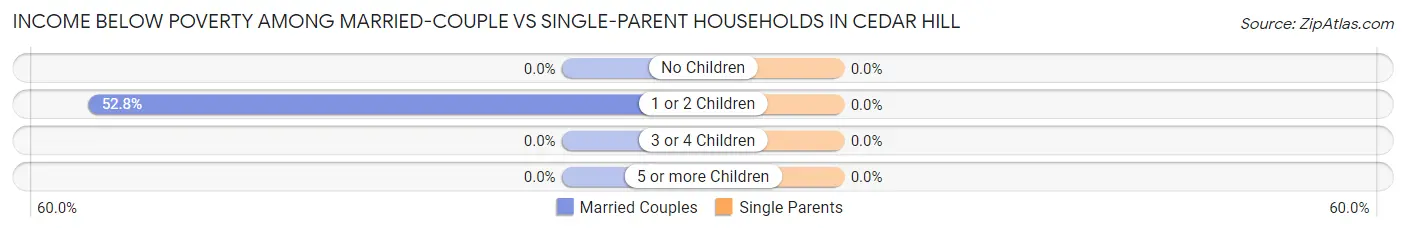
| Children | Married-Couple Families | Single-Parent Households |
| No Children | 0 (0.0%) | 0 (0.0%) |
| 1 or 2 Children | 28 (52.8%) | 0 (0.0%) |
| 3 or 4 Children | 0 (0.0%) | 0 (0.0%) |
| 5 or more Children | 0 (0.0%) | 0 (0.0%) |
| Total | 28 (18.3%) | 0 (0.0%) |
Race in Cedar Hill
The most populous races in Cedar Hill are White / Caucasian (691 | 74.2%), Hispanic or Latino (295 | 31.7%), and Some other Race (164 | 17.6%).
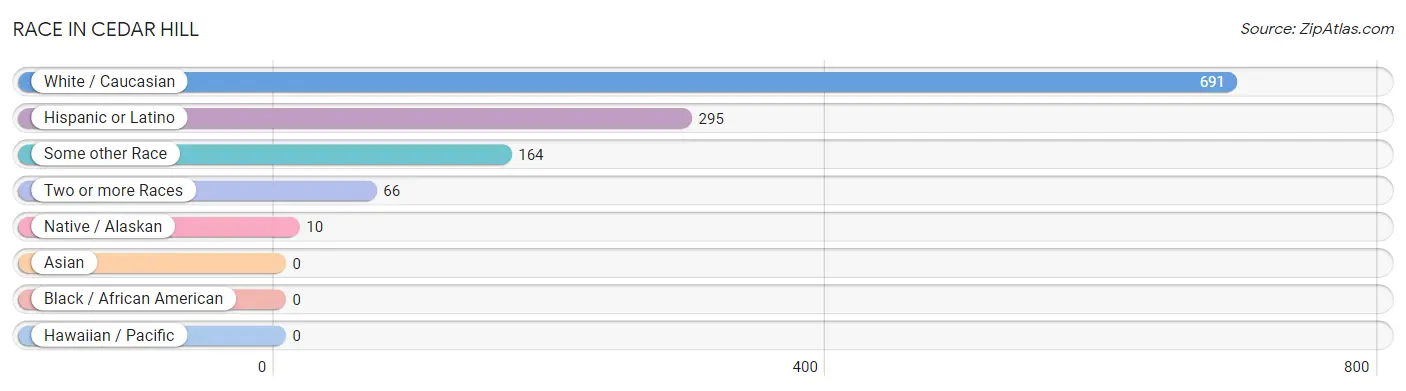
| Race | # Population | % Population |
| Asian | 0 | 0.0% |
| Black / African American | 0 | 0.0% |
| Hawaiian / Pacific | 0 | 0.0% |
| Hispanic or Latino | 295 | 31.7% |
| Native / Alaskan | 10 | 1.1% |
| White / Caucasian | 691 | 74.2% |
| Two or more Races | 66 | 7.1% |
| Some other Race | 164 | 17.6% |
| Total | 931 | 100.0% |
Ancestry in Cedar Hill
The most populous ancestries reported in Cedar Hill are Mexican (249 | 26.8%), German (133 | 14.3%), Irish (117 | 12.6%), English (59 | 6.3%), and French (46 | 4.9%), together accounting for 64.9% of all Cedar Hill residents.
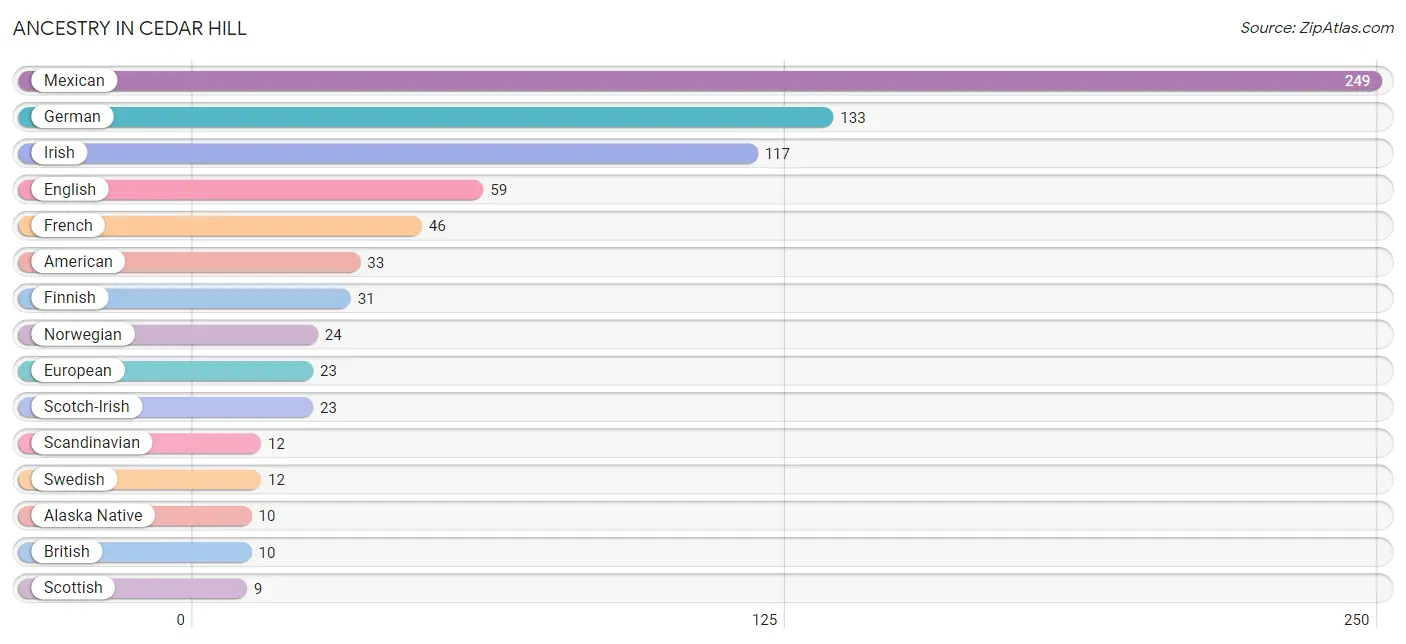
| Ancestry | # Population | % Population |
| Alaska Native | 10 | 1.1% |
| American | 33 | 3.5% |
| British | 10 | 1.1% |
| English | 59 | 6.3% |
| European | 23 | 2.5% |
| Finnish | 31 | 3.3% |
| French | 46 | 4.9% |
| German | 133 | 14.3% |
| Irish | 117 | 12.6% |
| Mexican | 249 | 26.8% |
| Norwegian | 24 | 2.6% |
| Polish | 7 | 0.7% |
| Scandinavian | 12 | 1.3% |
| Scotch-Irish | 23 | 2.5% |
| Scottish | 9 | 1.0% |
| Swedish | 12 | 1.3% | View All 16 Rows |
Immigrants in Cedar Hill
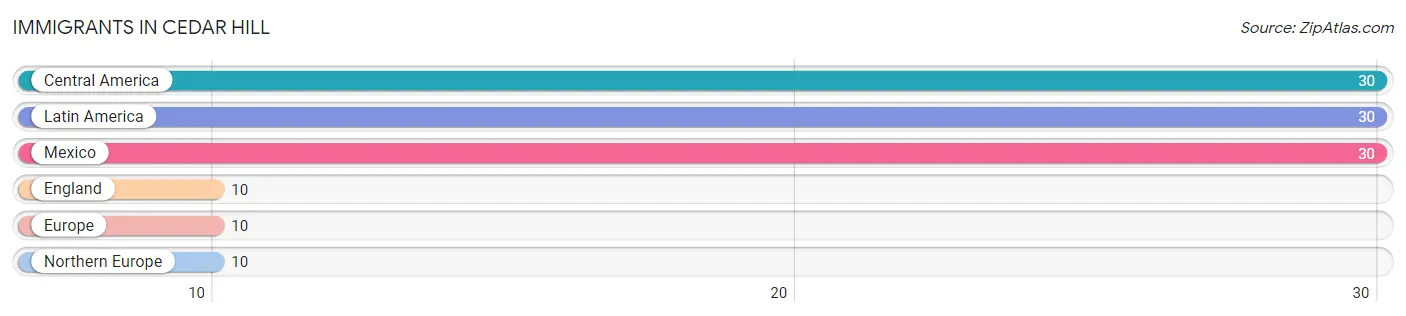
The most numerous immigrant groups reported in Cedar Hill came from Central America (30 | 3.2%), Latin America (30 | 3.2%), Mexico (30 | 3.2%), England (10 | 1.1%), and Europe (10 | 1.1%), together accounting for 11.8% of all Cedar Hill residents.
| Immigration Origin | # Population | % Population |
| Central America | 30 | 3.2% |
| England | 10 | 1.1% |
| Europe | 10 | 1.1% |
| Latin America | 30 | 3.2% |
| Mexico | 30 | 3.2% |
| Northern Europe | 10 | 1.1% | View All 6 Rows |
Sex and Age in Cedar Hill
Sex and Age in Cedar Hill
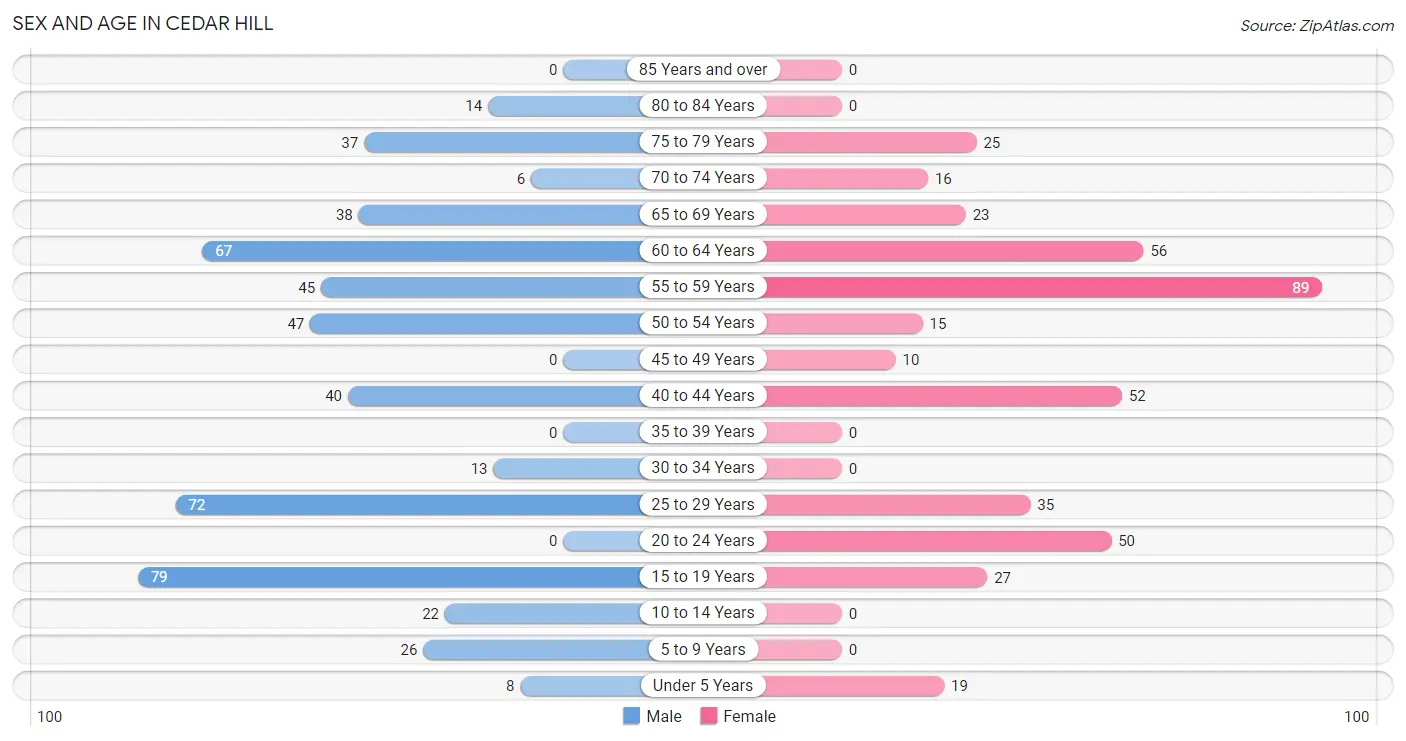
The most populous age groups in Cedar Hill are 15 to 19 Years (79 | 15.4%) for men and 55 to 59 Years (89 | 21.3%) for women.
| Age Bracket | Male | Female |
| Under 5 Years | 8 (1.6%) | 19 (4.6%) |
| 5 to 9 Years | 26 (5.1%) | 0 (0.0%) |
| 10 to 14 Years | 22 (4.3%) | 0 (0.0%) |
| 15 to 19 Years | 79 (15.4%) | 27 (6.5%) |
| 20 to 24 Years | 0 (0.0%) | 50 (12.0%) |
| 25 to 29 Years | 72 (14.0%) | 35 (8.4%) |
| 30 to 34 Years | 13 (2.5%) | 0 (0.0%) |
| 35 to 39 Years | 0 (0.0%) | 0 (0.0%) |
| 40 to 44 Years | 40 (7.8%) | 52 (12.5%) |
| 45 to 49 Years | 0 (0.0%) | 10 (2.4%) |
| 50 to 54 Years | 47 (9.1%) | 15 (3.6%) |
| 55 to 59 Years | 45 (8.7%) | 89 (21.3%) |
| 60 to 64 Years | 67 (13.0%) | 56 (13.4%) |
| 65 to 69 Years | 38 (7.4%) | 23 (5.5%) |
| 70 to 74 Years | 6 (1.2%) | 16 (3.8%) |
| 75 to 79 Years | 37 (7.2%) | 25 (6.0%) |
| 80 to 84 Years | 14 (2.7%) | 0 (0.0%) |
| 85 Years and over | 0 (0.0%) | 0 (0.0%) |
| Total | 514 (100.0%) | 417 (100.0%) |
Families and Households in Cedar Hill
Median Family Size in Cedar Hill
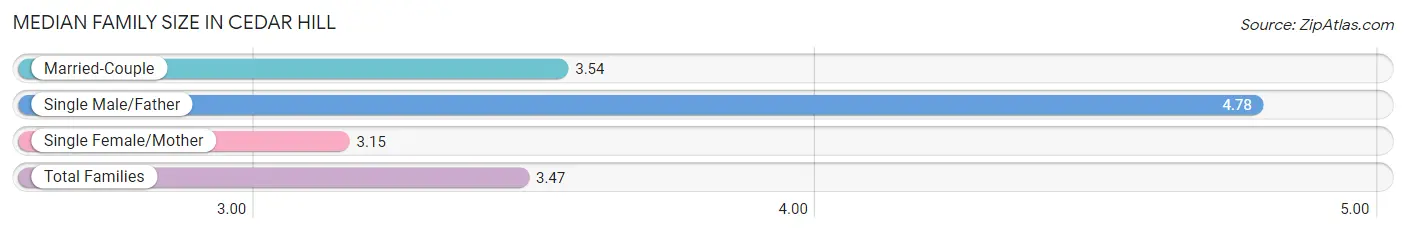
The median family size in Cedar Hill is 3.47 persons per family, with single male/father families (9 | 3.8%) accounting for the largest median family size of 4.78 persons per family. On the other hand, single female/mother families (74 | 31.4%) represent the smallest median family size with 3.15 persons per family.
| Family Type | # Families | Family Size |
| Married-Couple | 153 (64.8%) | 3.54 |
| Single Male/Father | 9 (3.8%) | 4.78 |
| Single Female/Mother | 74 (31.4%) | 3.15 |
| Total Families | 236 (100.0%) | 3.47 |
Median Household Size in Cedar Hill
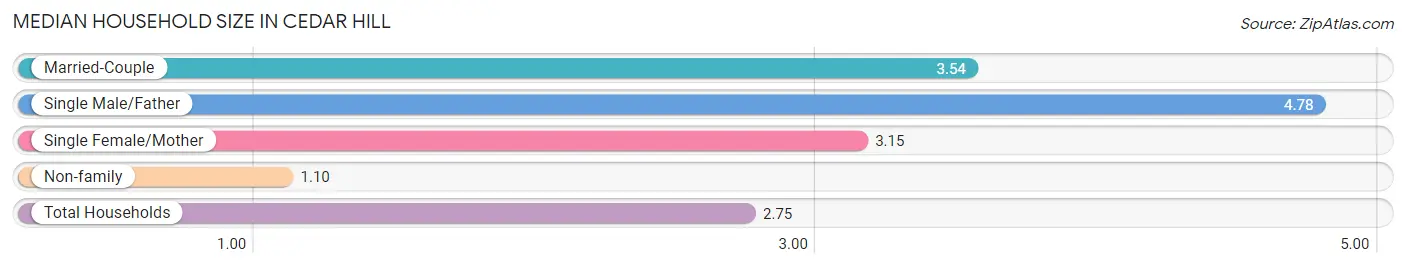
The median household size in Cedar Hill is 2.75 persons per household, with single male/father households (9 | 2.6%) accounting for the largest median household size of 4.78 persons per household. non-family households (103 | 30.4%) represent the smallest median household size with 1.10 persons per household.
| Household Type | # Households | Household Size |
| Married-Couple | 153 (45.1%) | 3.54 |
| Single Male/Father | 9 (2.6%) | 4.78 |
| Single Female/Mother | 74 (21.8%) | 3.15 |
| Non-family | 103 (30.4%) | 1.10 |
| Total Households | 339 (100.0%) | 2.75 |
Household Size by Marriage Status in Cedar Hill
Out of a total of 339 households in Cedar Hill, 236 (69.6%) are family households, while 103 (30.4%) are nonfamily households. The most numerous type of family households are 2-person households, comprising 126, and the most common type of nonfamily households are 1-person households, comprising 88.
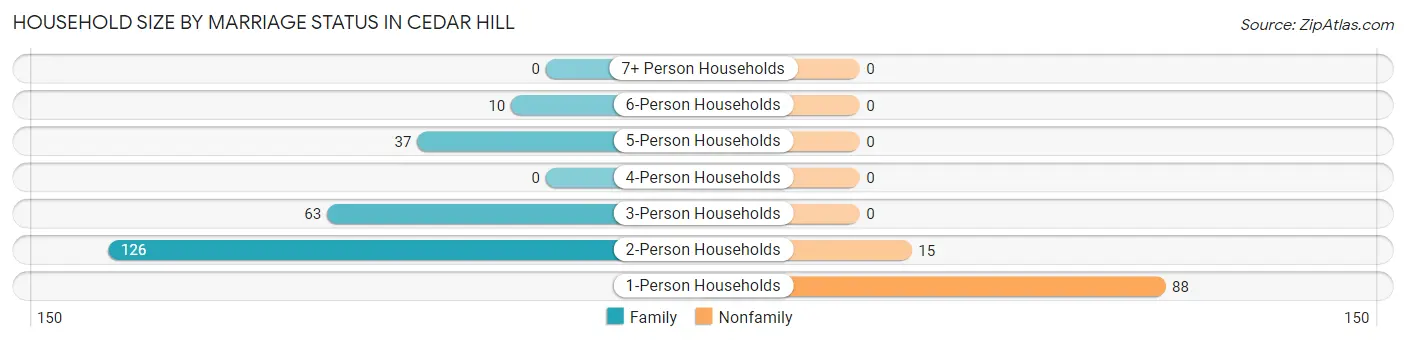
| Household Size | Family Households | Nonfamily Households |
| 1-Person Households | - | 88 (26.0%) |
| 2-Person Households | 126 (37.2%) | 15 (4.4%) |
| 3-Person Households | 63 (18.6%) | 0 (0.0%) |
| 4-Person Households | 0 (0.0%) | 0 (0.0%) |
| 5-Person Households | 37 (10.9%) | 0 (0.0%) |
| 6-Person Households | 10 (2.9%) | 0 (0.0%) |
| 7+ Person Households | 0 (0.0%) | 0 (0.0%) |
| Total | 236 (69.6%) | 103 (30.4%) |
Female Fertility in Cedar Hill
Fertility by Age in Cedar Hill
| Age Bracket | Women with Births | Births / 1,000 Women |
| 15 to 19 years | 0 (0.0%) | 0.0 |
| 20 to 34 years | 0 (0.0%) | 0.0 |
| 35 to 50 years | 0 (0.0%) | 0.0 |
| Total | 0 (0.0%) | 0.0 |
Fertility by Age by Marriage Status in Cedar Hill
| Age Bracket | Married | Unmarried |
| 15 to 19 years | 0 (0.0%) | 0 (0.0%) |
| 20 to 34 years | 0 (0.0%) | 0 (0.0%) |
| 35 to 50 years | 0 (0.0%) | 0 (0.0%) |
| Total | 0 (0.0%) | 0 (0.0%) |
Fertility by Education in Cedar Hill
| Educational Attainment | Women with Births | Births / 1,000 Women |
| Less than High School | 0 (0.0%) | 0.0 |
| High School Diploma | 0 (0.0%) | 0.0 |
| College or Associate's Degree | 0 (0.0%) | 0.0 |
| Bachelor's Degree | 0 (0.0%) | 0.0 |
| Graduate Degree | 0 (0.0%) | 0.0 |
| Total | 0 (0.0%) | 0.0 |
Fertility by Education by Marriage Status in Cedar Hill
| Educational Attainment | Married | Unmarried |
| Less than High School | 0 (0.0%) | 0 (0.0%) |
| High School Diploma | 0 (0.0%) | 0 (0.0%) |
| College or Associate's Degree | 0 (0.0%) | 0 (0.0%) |
| Bachelor's Degree | 0 (0.0%) | 0 (0.0%) |
| Graduate Degree | 0 (0.0%) | 0 (0.0%) |
| Total | 0 (0.0%) | 0 (0.0%) |
Employment Characteristics in Cedar Hill
Employment by Class of Employer in Cedar Hill
Among the 330 employed individuals in Cedar Hill, private company employees (184 | 55.8%), self-employed (not incorporated) (46 | 13.9%), and self-employed (incorporated) (36 | 10.9%) make up the most common classes of employment.
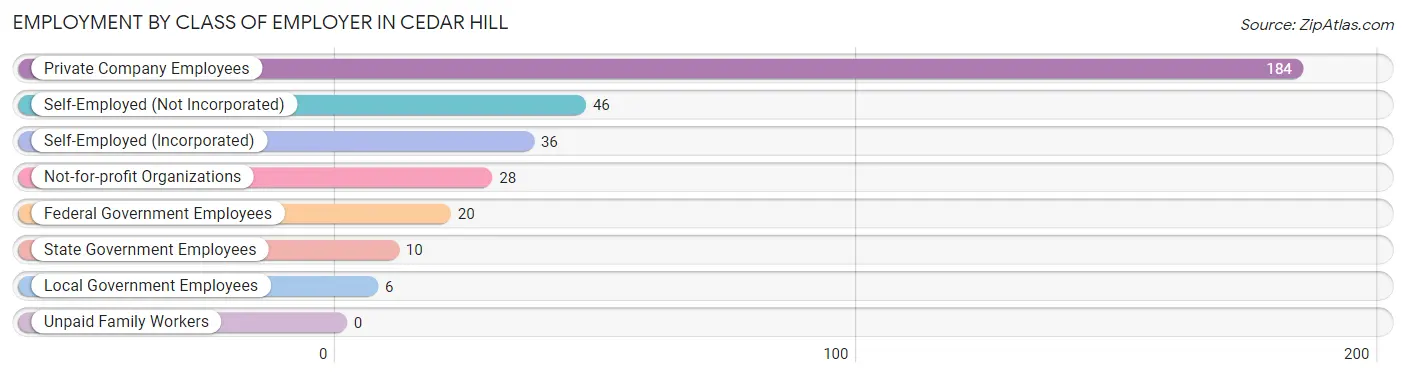
| Employer Class | # Employees | % Employees |
| Private Company Employees | 184 | 55.8% |
| Self-Employed (Incorporated) | 36 | 10.9% |
| Self-Employed (Not Incorporated) | 46 | 13.9% |
| Not-for-profit Organizations | 28 | 8.5% |
| Local Government Employees | 6 | 1.8% |
| State Government Employees | 10 | 3.0% |
| Federal Government Employees | 20 | 6.1% |
| Unpaid Family Workers | 0 | 0.0% |
| Total | 330 | 100.0% |
Employment Status by Age in Cedar Hill
According to the labor force statistics for Cedar Hill, out of the total population over 16 years of age (817), 53.4% or 436 individuals are in the labor force, with 12.8% or 56 of them unemployed. The age group with the highest labor force participation rate is 20 to 24 years, with 100.0% or 50 individuals in the labor force. Within the labor force, the 25 to 29 years age range has the highest percentage of unemployed individuals, with 64.4% or 56 of them being unemployed.
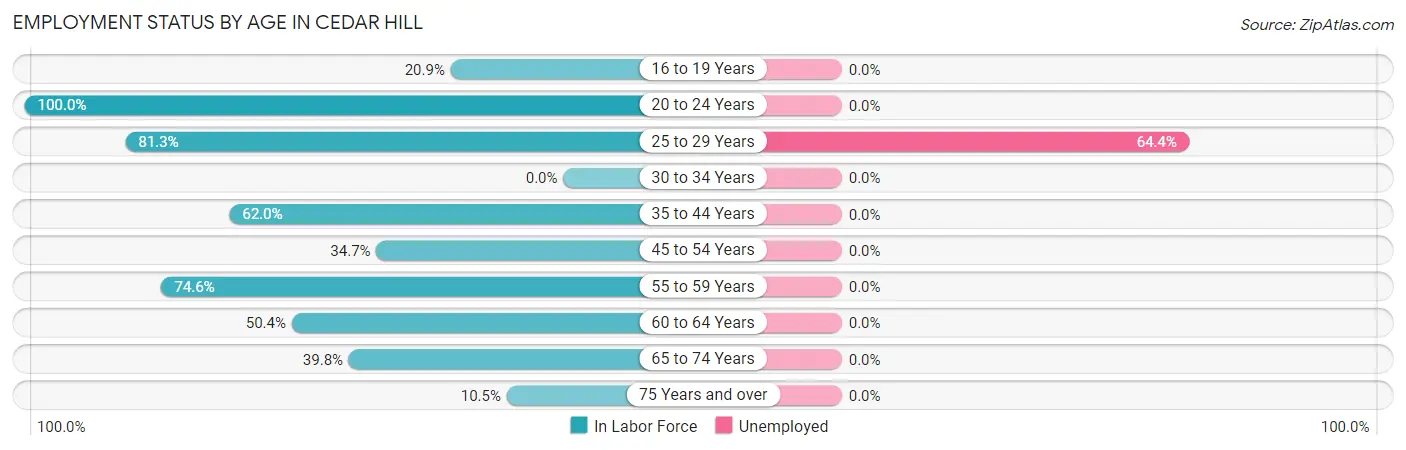
| Age Bracket | In Labor Force | Unemployed |
| 16 to 19 Years | 14 (20.9%) | 0 (0.0%) |
| 20 to 24 Years | 50 (100.0%) | 0 (0.0%) |
| 25 to 29 Years | 87 (81.3%) | 56 (64.4%) |
| 30 to 34 Years | 0 (0.0%) | 0 (0.0%) |
| 35 to 44 Years | 57 (62.0%) | 0 (0.0%) |
| 45 to 54 Years | 25 (34.7%) | 0 (0.0%) |
| 55 to 59 Years | 100 (74.6%) | 0 (0.0%) |
| 60 to 64 Years | 62 (50.4%) | 0 (0.0%) |
| 65 to 74 Years | 33 (39.8%) | 0 (0.0%) |
| 75 Years and over | 8 (10.5%) | 0 (0.0%) |
| Total | 436 (53.4%) | 56 (12.8%) |
Employment Status by Educational Attainment in Cedar Hill
According to labor force statistics for Cedar Hill, 61.2% of individuals (331) out of the total population between 25 and 64 years of age (541) are in the labor force, with 16.9% or 56 of them being unemployed. The group with the highest labor force participation rate are those with the educational attainment of high school diploma, with 100.0% or 74 individuals in the labor force. Within the labor force, individuals with less than high school education have the highest percentage of unemployment, with 71.8% or 56 of them being unemployed.
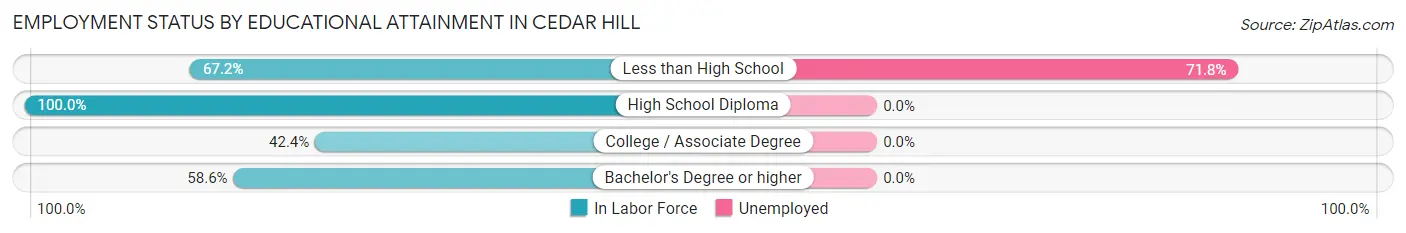
| Educational Attainment | In Labor Force | Unemployed |
| Less than High School | 78 (67.2%) | 83 (71.8%) |
| High School Diploma | 74 (100.0%) | 0 (0.0%) |
| College / Associate Degree | 70 (42.4%) | 0 (0.0%) |
| Bachelor's Degree or higher | 109 (58.6%) | 0 (0.0%) |
| Total | 331 (61.2%) | 91 (16.9%) |
Employment Occupations by Sex in Cedar Hill
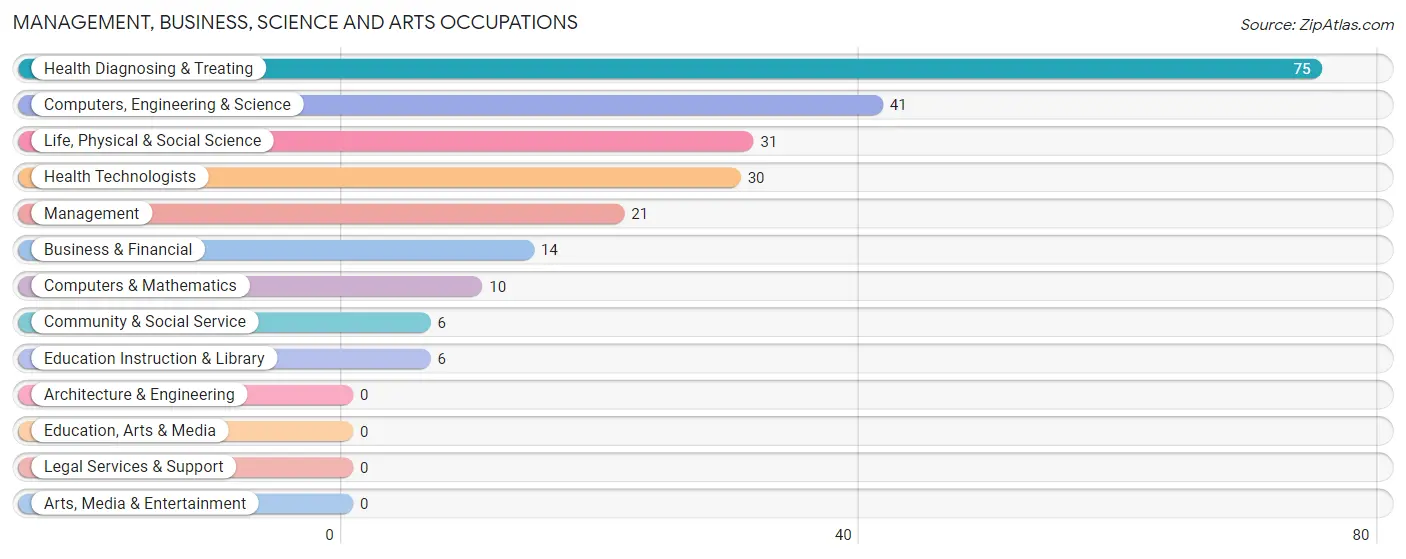
Management, Business, Science and Arts Occupations
The most common Management, Business, Science and Arts occupations in Cedar Hill are Health Diagnosing & Treating (75 | 19.7%), Computers, Engineering & Science (41 | 10.8%), Life, Physical & Social Science (31 | 8.2%), Health Technologists (30 | 7.9%), and Management (21 | 5.5%).
Management, Business, Science and Arts Occupations by Sex
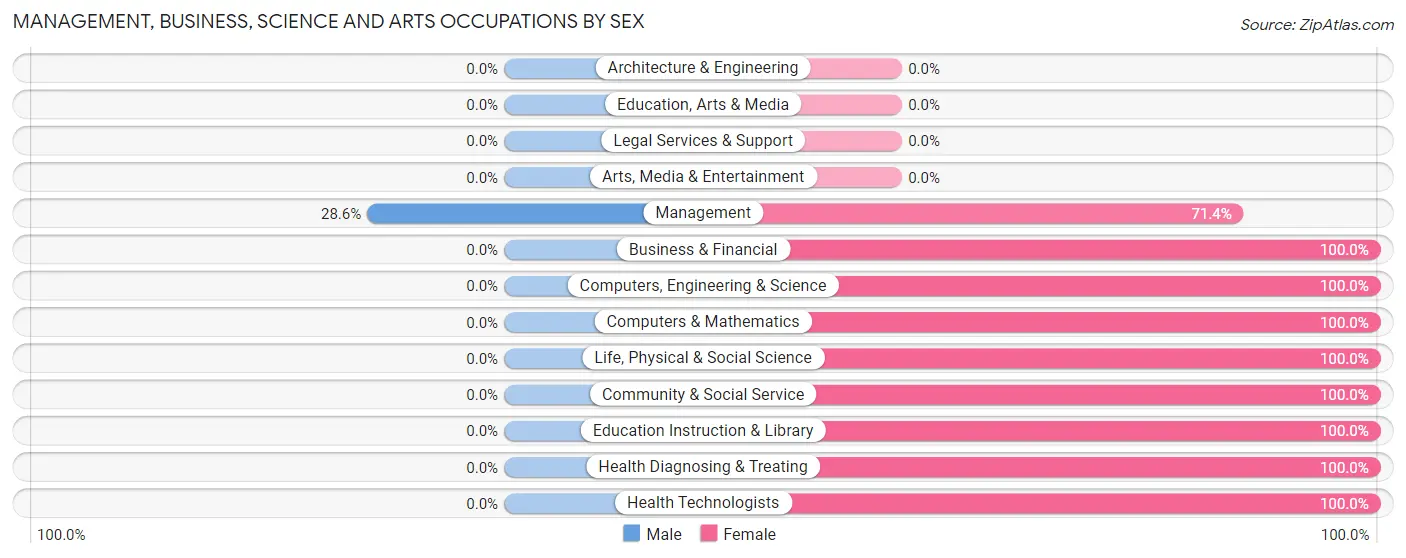
| Occupation | Male | Female |
| Management | 6 (28.6%) | 15 (71.4%) |
| Business & Financial | 0 (0.0%) | 14 (100.0%) |
| Computers, Engineering & Science | 0 (0.0%) | 41 (100.0%) |
| Computers & Mathematics | 0 (0.0%) | 10 (100.0%) |
| Architecture & Engineering | 0 (0.0%) | 0 (0.0%) |
| Life, Physical & Social Science | 0 (0.0%) | 31 (100.0%) |
| Community & Social Service | 0 (0.0%) | 6 (100.0%) |
| Education, Arts & Media | 0 (0.0%) | 0 (0.0%) |
| Legal Services & Support | 0 (0.0%) | 0 (0.0%) |
| Education Instruction & Library | 0 (0.0%) | 6 (100.0%) |
| Arts, Media & Entertainment | 0 (0.0%) | 0 (0.0%) |
| Health Diagnosing & Treating | 0 (0.0%) | 75 (100.0%) |
| Health Technologists | 0 (0.0%) | 30 (100.0%) |
| Total (Category) | 6 (3.8%) | 151 (96.2%) |
| Total (Overall) | 115 (30.3%) | 265 (69.7%) |
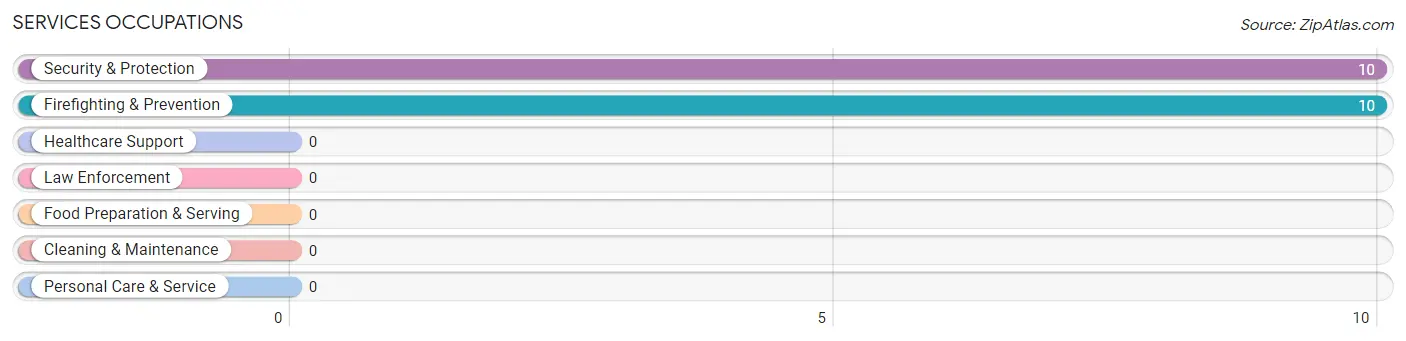
Services Occupations
The most common Services occupations in Cedar Hill are Security & Protection (10 | 2.6%), and Firefighting & Prevention (10 | 2.6%).
Services Occupations by Sex
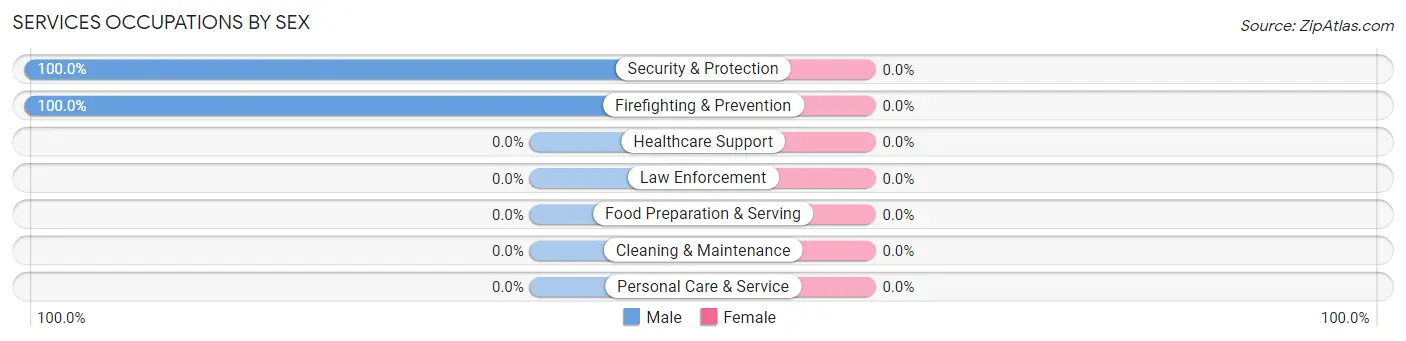
| Occupation | Male | Female |
| Healthcare Support | 0 (0.0%) | 0 (0.0%) |
| Security & Protection | 10 (100.0%) | 0 (0.0%) |
| Firefighting & Prevention | 10 (100.0%) | 0 (0.0%) |
| Law Enforcement | 0 (0.0%) | 0 (0.0%) |
| Food Preparation & Serving | 0 (0.0%) | 0 (0.0%) |
| Cleaning & Maintenance | 0 (0.0%) | 0 (0.0%) |
| Personal Care & Service | 0 (0.0%) | 0 (0.0%) |
| Total (Category) | 10 (100.0%) | 0 (0.0%) |
| Total (Overall) | 115 (30.3%) | 265 (69.7%) |
Sales and Office Occupations
The most common Sales and Office occupations in Cedar Hill are Office & Administration (95 | 25.0%), and Sales & Related (34 | 8.9%).
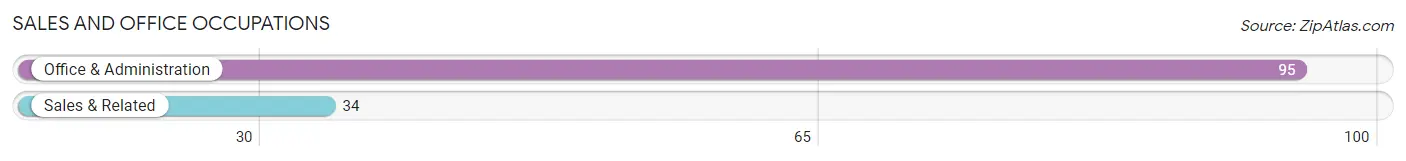
Sales and Office Occupations by Sex
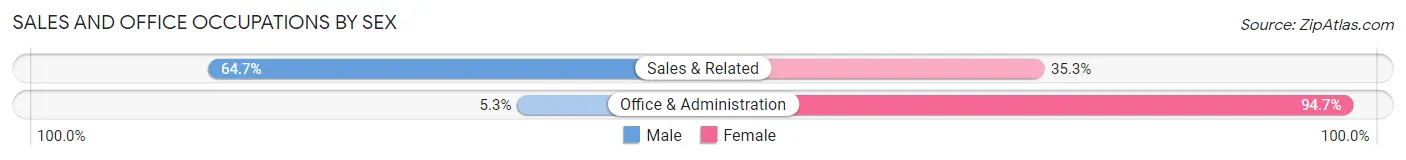
| Occupation | Male | Female |
| Sales & Related | 22 (64.7%) | 12 (35.3%) |
| Office & Administration | 5 (5.3%) | 90 (94.7%) |
| Total (Category) | 27 (20.9%) | 102 (79.1%) |
| Total (Overall) | 115 (30.3%) | 265 (69.7%) |
Natural Resources, Construction and Maintenance Occupations
The most common Natural Resources, Construction and Maintenance occupations in Cedar Hill are Construction & Extraction (68 | 17.9%), and Installation, Maintenance & Repair (16 | 4.2%).
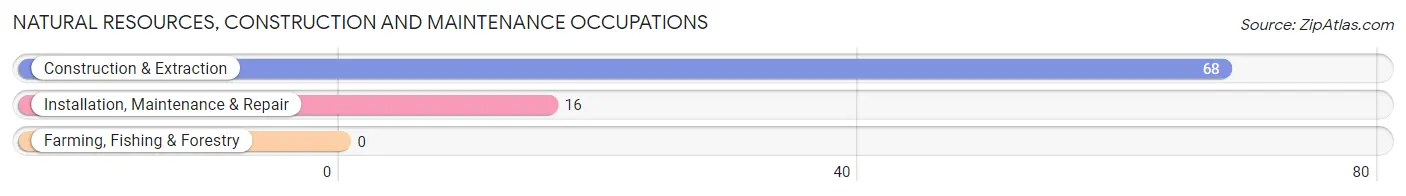
Natural Resources, Construction and Maintenance Occupations by Sex
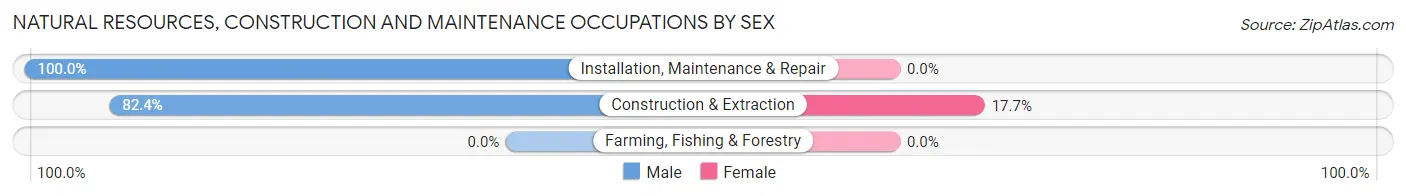
| Occupation | Male | Female |
| Farming, Fishing & Forestry | 0 (0.0%) | 0 (0.0%) |
| Construction & Extraction | 56 (82.4%) | 12 (17.6%) |
| Installation, Maintenance & Repair | 16 (100.0%) | 0 (0.0%) |
| Total (Category) | 72 (85.7%) | 12 (14.3%) |
| Total (Overall) | 115 (30.3%) | 265 (69.7%) |
Production, Transportation and Moving Occupations
Production, Transportation and Moving Occupations by Sex
| Occupation | Male | Female |
| Production | 0 (0.0%) | 0 (0.0%) |
| Transportation | 0 (0.0%) | 0 (0.0%) |
| Material Moving | 0 (0.0%) | 0 (0.0%) |
| Total (Category) | 0 (0.0%) | 0 (0.0%) |
| Total (Overall) | 115 (30.3%) | 265 (69.7%) |
Employment Industries by Sex in Cedar Hill
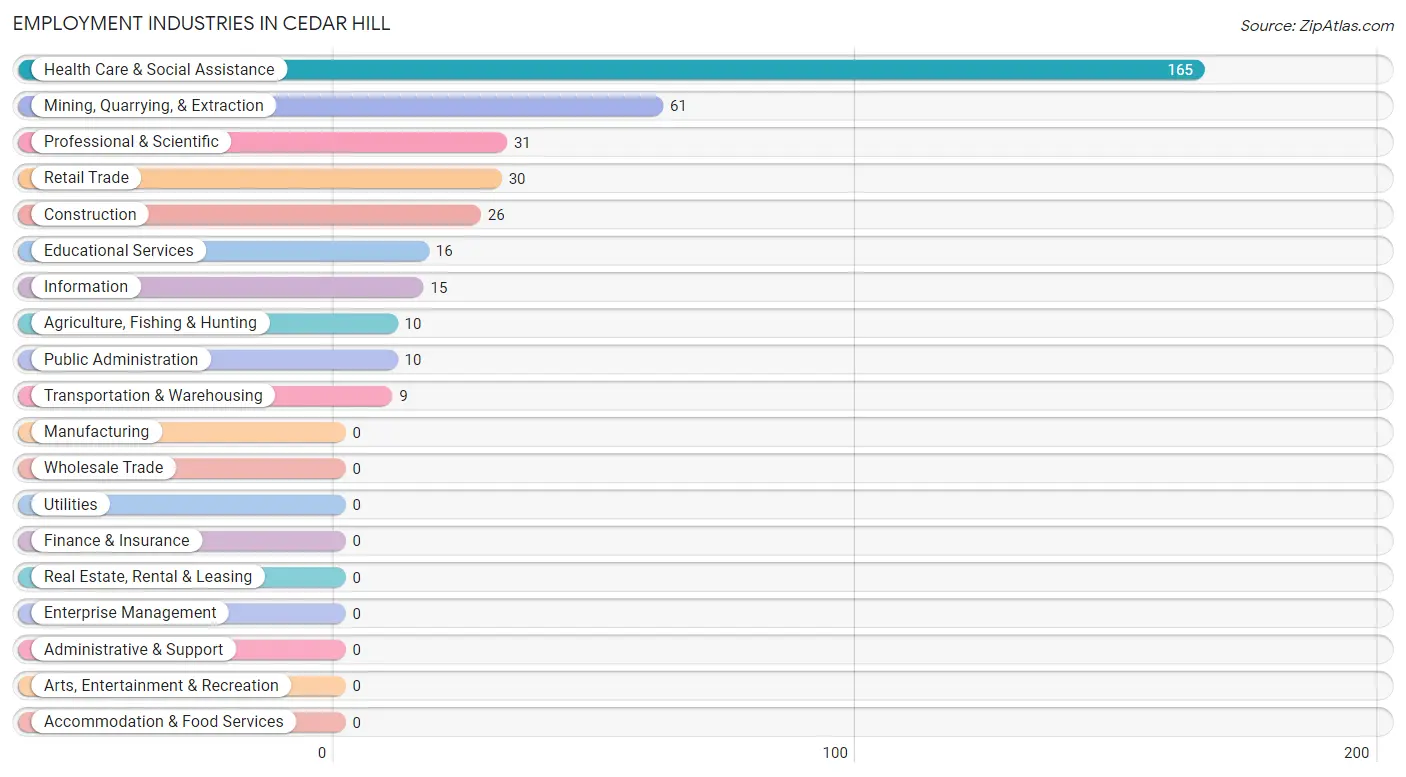
Employment Industries in Cedar Hill
The major employment industries in Cedar Hill include Health Care & Social Assistance (165 | 43.4%), Mining, Quarrying, & Extraction (61 | 16.1%), Professional & Scientific (31 | 8.2%), Retail Trade (30 | 7.9%), and Construction (26 | 6.8%).
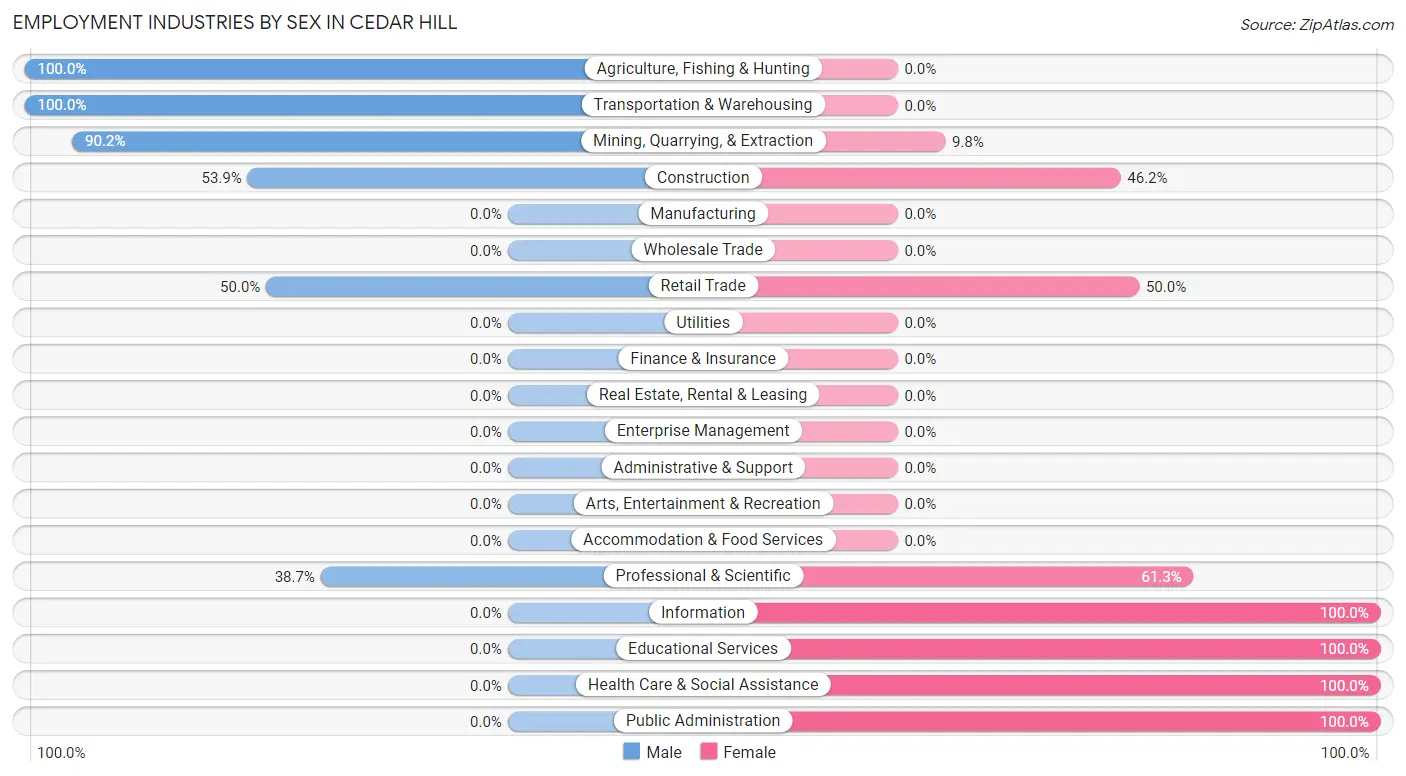
Employment Industries by Sex in Cedar Hill
The Cedar Hill industries that see more men than women are Agriculture, Fishing & Hunting (100.0%), Transportation & Warehousing (100.0%), and Mining, Quarrying, & Extraction (90.2%), whereas the industries that tend to have a higher number of women are Information (100.0%), Educational Services (100.0%), and Health Care & Social Assistance (100.0%).
| Industry | Male | Female |
| Agriculture, Fishing & Hunting | 10 (100.0%) | 0 (0.0%) |
| Mining, Quarrying, & Extraction | 55 (90.2%) | 6 (9.8%) |
| Construction | 14 (53.8%) | 12 (46.2%) |
| Manufacturing | 0 (0.0%) | 0 (0.0%) |
| Wholesale Trade | 0 (0.0%) | 0 (0.0%) |
| Retail Trade | 15 (50.0%) | 15 (50.0%) |
| Transportation & Warehousing | 9 (100.0%) | 0 (0.0%) |
| Utilities | 0 (0.0%) | 0 (0.0%) |
| Information | 0 (0.0%) | 15 (100.0%) |
| Finance & Insurance | 0 (0.0%) | 0 (0.0%) |
| Real Estate, Rental & Leasing | 0 (0.0%) | 0 (0.0%) |
| Professional & Scientific | 12 (38.7%) | 19 (61.3%) |
| Enterprise Management | 0 (0.0%) | 0 (0.0%) |
| Administrative & Support | 0 (0.0%) | 0 (0.0%) |
| Educational Services | 0 (0.0%) | 16 (100.0%) |
| Health Care & Social Assistance | 0 (0.0%) | 165 (100.0%) |
| Arts, Entertainment & Recreation | 0 (0.0%) | 0 (0.0%) |
| Accommodation & Food Services | 0 (0.0%) | 0 (0.0%) |
| Public Administration | 0 (0.0%) | 10 (100.0%) |
| Total | 115 (30.3%) | 265 (69.7%) |
Education in Cedar Hill
School Enrollment in Cedar Hill
The most common levels of schooling among the 175 students in Cedar Hill are high school (77 | 44.0%), college / undergraduate (50 | 28.6%), and elementary school (39 | 22.3%).
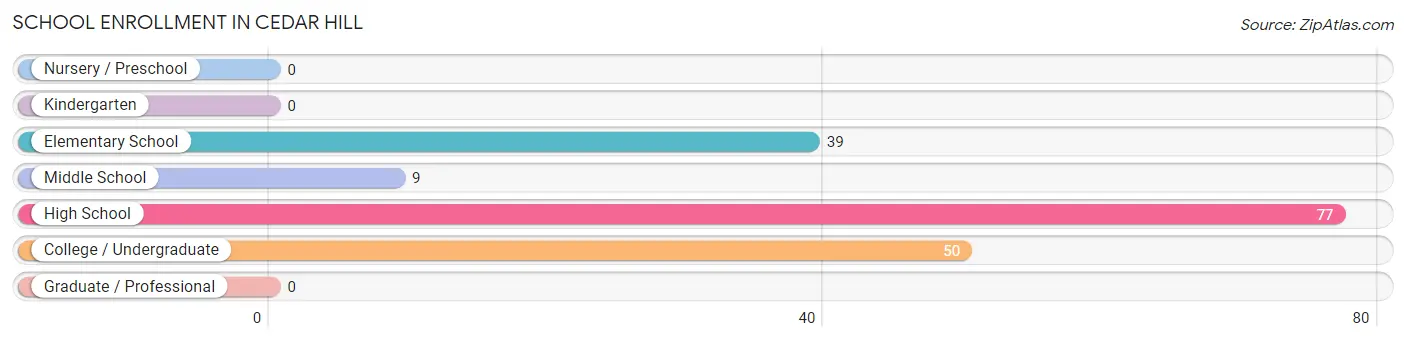
| School Level | # Students | % Students |
| Nursery / Preschool | 0 | 0.0% |
| Kindergarten | 0 | 0.0% |
| Elementary School | 39 | 22.3% |
| Middle School | 9 | 5.1% |
| High School | 77 | 44.0% |
| College / Undergraduate | 50 | 28.6% |
| Graduate / Professional | 0 | 0.0% |
| Total | 175 | 100.0% |
School Enrollment by Age by Funding Source in Cedar Hill
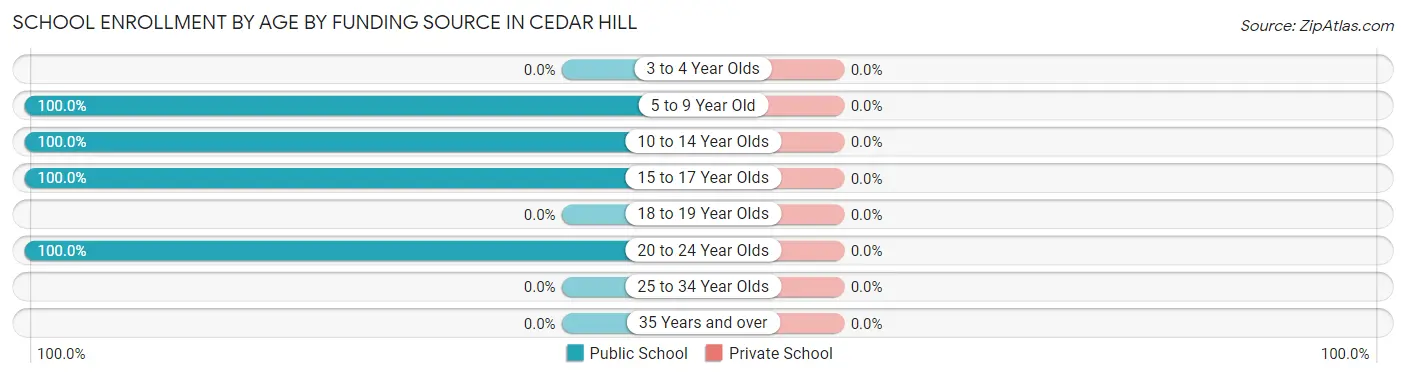
| Age Bracket | Public School | Private School |
| 3 to 4 Year Olds | 0 (0.0%) | 0 (0.0%) |
| 5 to 9 Year Old | 26 (100.0%) | 0 (0.0%) |
| 10 to 14 Year Olds | 22 (100.0%) | 0 (0.0%) |
| 15 to 17 Year Olds | 77 (100.0%) | 0 (0.0%) |
| 18 to 19 Year Olds | 0 (0.0%) | 0 (0.0%) |
| 20 to 24 Year Olds | 50 (100.0%) | 0 (0.0%) |
| 25 to 34 Year Olds | 0 (0.0%) | 0 (0.0%) |
| 35 Years and over | 0 (0.0%) | 0 (0.0%) |
| Total | 175 (100.0%) | 0 (0.0%) |
Educational Attainment by Field of Study in Cedar Hill
Psychology (106 | 40.9%), business (50 | 19.3%), social sciences (28 | 10.8%), visual & performing arts (20 | 7.7%), and liberal arts & history (19 | 7.3%) are the most common fields of study among 259 individuals in Cedar Hill who have obtained a bachelor's degree or higher.

| Field of Study | # Graduates | % Graduates |
| Computers & Mathematics | 0 | 0.0% |
| Bio, Nature & Agricultural | 10 | 3.9% |
| Physical & Health Sciences | 0 | 0.0% |
| Psychology | 106 | 40.9% |
| Social Sciences | 28 | 10.8% |
| Engineering | 0 | 0.0% |
| Multidisciplinary Studies | 0 | 0.0% |
| Science & Technology | 10 | 3.9% |
| Business | 50 | 19.3% |
| Education | 16 | 6.2% |
| Literature & Languages | 0 | 0.0% |
| Liberal Arts & History | 19 | 7.3% |
| Visual & Performing Arts | 20 | 7.7% |
| Communications | 0 | 0.0% |
| Arts & Humanities | 0 | 0.0% |
| Total | 259 | 100.0% |
Transportation & Commute in Cedar Hill
Vehicle Availability by Sex in Cedar Hill
The most prevalent vehicle ownership categories in Cedar Hill are males with 3 vehicles (71, accounting for 61.7%) and females with 3 vehicles (58, making up 33.0%).
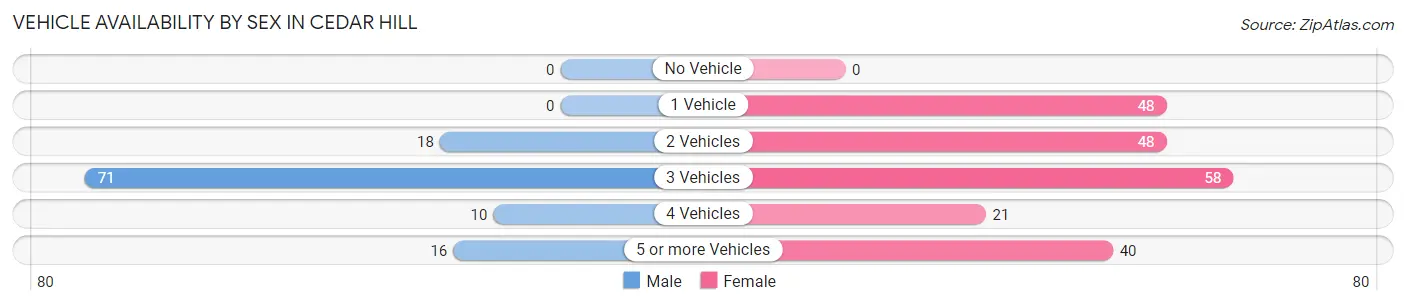
| Vehicles Available | Male | Female |
| No Vehicle | 0 (0.0%) | 0 (0.0%) |
| 1 Vehicle | 0 (0.0%) | 48 (22.3%) |
| 2 Vehicles | 18 (15.7%) | 48 (22.3%) |
| 3 Vehicles | 71 (61.7%) | 58 (27.0%) |
| 4 Vehicles | 10 (8.7%) | 21 (9.8%) |
| 5 or more Vehicles | 16 (13.9%) | 40 (18.6%) |
| Total | 115 (100.0%) | 215 (100.0%) |
Commute Time in Cedar Hill
The most frequently occuring commute durations in Cedar Hill are 30 to 34 minutes (153 commuters, 50.2%), 35 to 39 minutes (45 commuters, 14.7%), and 45 to 59 minutes (27 commuters, 8.8%).
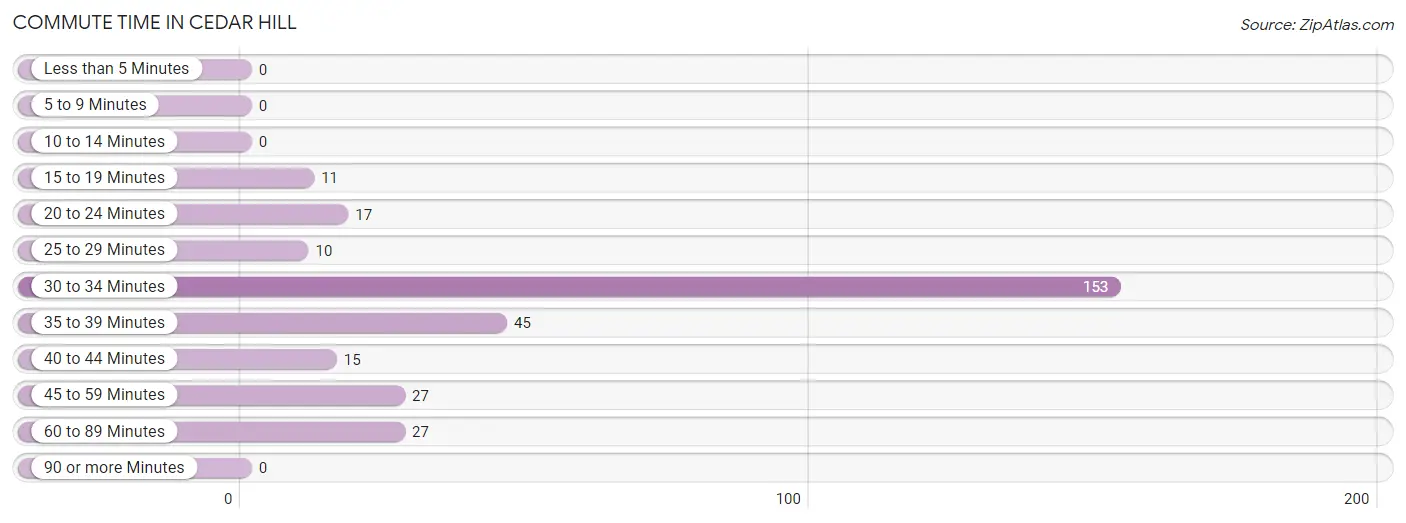
| Commute Time | # Commuters | % Commuters |
| Less than 5 Minutes | 0 | 0.0% |
| 5 to 9 Minutes | 0 | 0.0% |
| 10 to 14 Minutes | 0 | 0.0% |
| 15 to 19 Minutes | 11 | 3.6% |
| 20 to 24 Minutes | 17 | 5.6% |
| 25 to 29 Minutes | 10 | 3.3% |
| 30 to 34 Minutes | 153 | 50.2% |
| 35 to 39 Minutes | 45 | 14.7% |
| 40 to 44 Minutes | 15 | 4.9% |
| 45 to 59 Minutes | 27 | 8.8% |
| 60 to 89 Minutes | 27 | 8.8% |
| 90 or more Minutes | 0 | 0.0% |
Commute Time by Sex in Cedar Hill
The most common commute times in Cedar Hill are 30 to 34 minutes (61 commuters, 53.0%) for males and 30 to 34 minutes (92 commuters, 48.4%) for females.
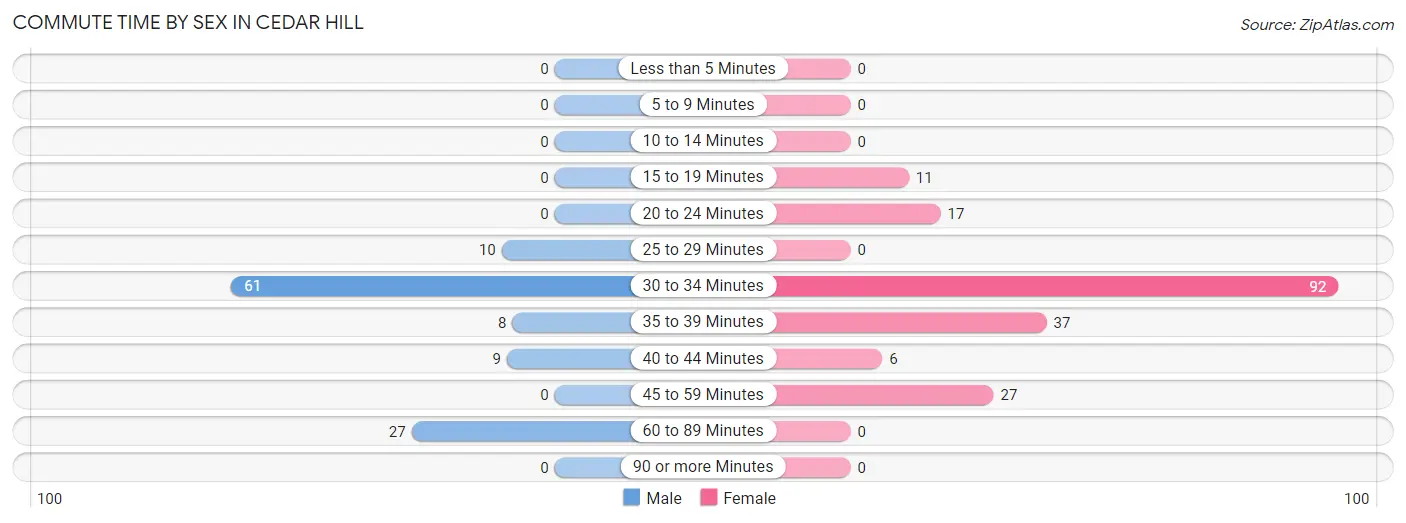
| Commute Time | Male | Female |
| Less than 5 Minutes | 0 (0.0%) | 0 (0.0%) |
| 5 to 9 Minutes | 0 (0.0%) | 0 (0.0%) |
| 10 to 14 Minutes | 0 (0.0%) | 0 (0.0%) |
| 15 to 19 Minutes | 0 (0.0%) | 11 (5.8%) |
| 20 to 24 Minutes | 0 (0.0%) | 17 (8.9%) |
| 25 to 29 Minutes | 10 (8.7%) | 0 (0.0%) |
| 30 to 34 Minutes | 61 (53.0%) | 92 (48.4%) |
| 35 to 39 Minutes | 8 (7.0%) | 37 (19.5%) |
| 40 to 44 Minutes | 9 (7.8%) | 6 (3.2%) |
| 45 to 59 Minutes | 0 (0.0%) | 27 (14.2%) |
| 60 to 89 Minutes | 27 (23.5%) | 0 (0.0%) |
| 90 or more Minutes | 0 (0.0%) | 0 (0.0%) |
Time of Departure to Work by Sex in Cedar Hill
The most frequent times of departure to work in Cedar Hill are 9:00 AM to 9:59 AM (21, 18.3%) for males and 9:00 AM to 9:59 AM (50, 26.3%) for females.
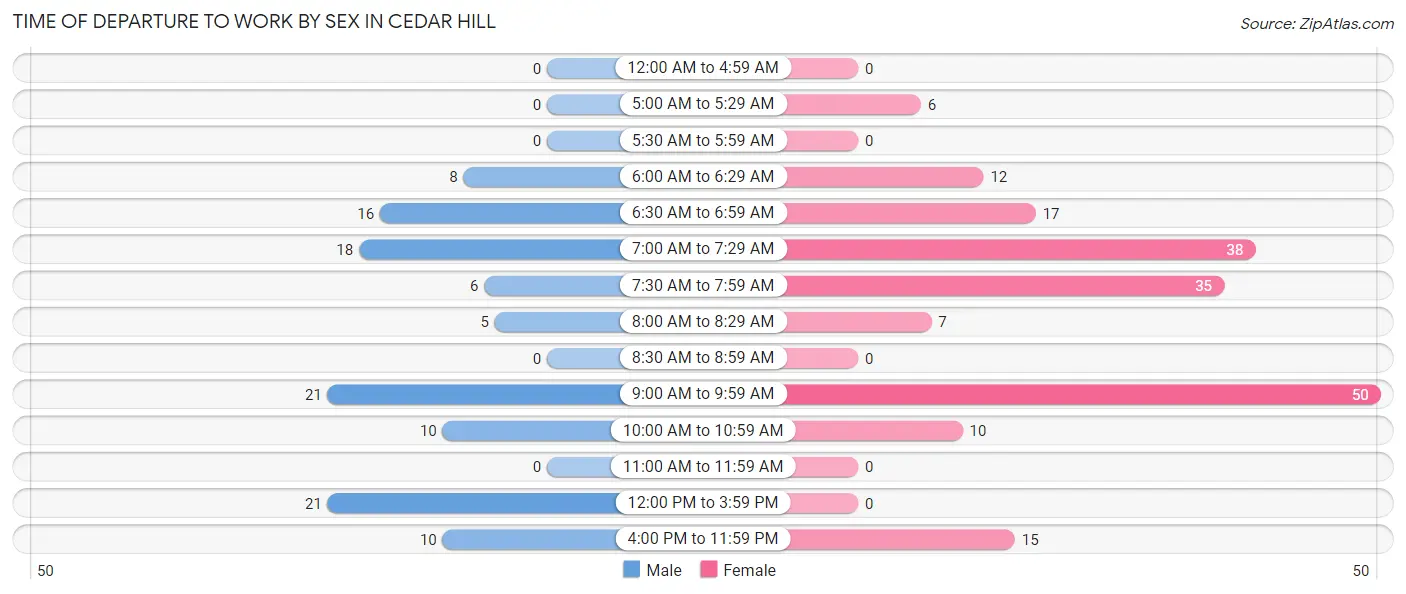
| Time of Departure | Male | Female |
| 12:00 AM to 4:59 AM | 0 (0.0%) | 0 (0.0%) |
| 5:00 AM to 5:29 AM | 0 (0.0%) | 6 (3.2%) |
| 5:30 AM to 5:59 AM | 0 (0.0%) | 0 (0.0%) |
| 6:00 AM to 6:29 AM | 8 (7.0%) | 12 (6.3%) |
| 6:30 AM to 6:59 AM | 16 (13.9%) | 17 (8.9%) |
| 7:00 AM to 7:29 AM | 18 (15.7%) | 38 (20.0%) |
| 7:30 AM to 7:59 AM | 6 (5.2%) | 35 (18.4%) |
| 8:00 AM to 8:29 AM | 5 (4.3%) | 7 (3.7%) |
| 8:30 AM to 8:59 AM | 0 (0.0%) | 0 (0.0%) |
| 9:00 AM to 9:59 AM | 21 (18.3%) | 50 (26.3%) |
| 10:00 AM to 10:59 AM | 10 (8.7%) | 10 (5.3%) |
| 11:00 AM to 11:59 AM | 0 (0.0%) | 0 (0.0%) |
| 12:00 PM to 3:59 PM | 21 (18.3%) | 0 (0.0%) |
| 4:00 PM to 11:59 PM | 10 (8.7%) | 15 (7.9%) |
| Total | 115 (100.0%) | 190 (100.0%) |
Housing Occupancy in Cedar Hill
Occupancy by Ownership in Cedar Hill
Of the total 339 dwellings in Cedar Hill, owner-occupied units account for 314 (92.6%), while renter-occupied units make up 25 (7.4%).
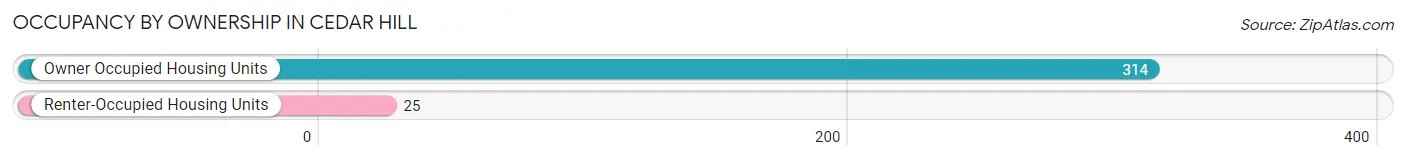
| Occupancy | # Housing Units | % Housing Units |
| Owner Occupied Housing Units | 314 | 92.6% |
| Renter-Occupied Housing Units | 25 | 7.4% |
| Total Occupied Housing Units | 339 | 100.0% |
Occupancy by Household Size in Cedar Hill
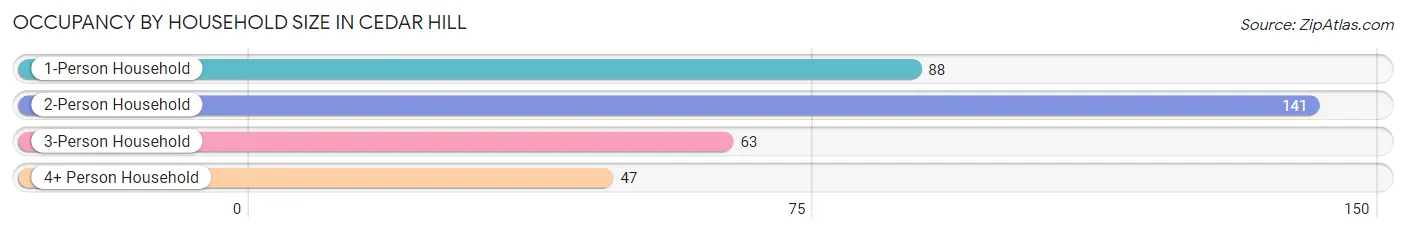
| Household Size | # Housing Units | % Housing Units |
| 1-Person Household | 88 | 26.0% |
| 2-Person Household | 141 | 41.6% |
| 3-Person Household | 63 | 18.6% |
| 4+ Person Household | 47 | 13.9% |
| Total Housing Units | 339 | 100.0% |
Occupancy by Ownership by Household Size in Cedar Hill
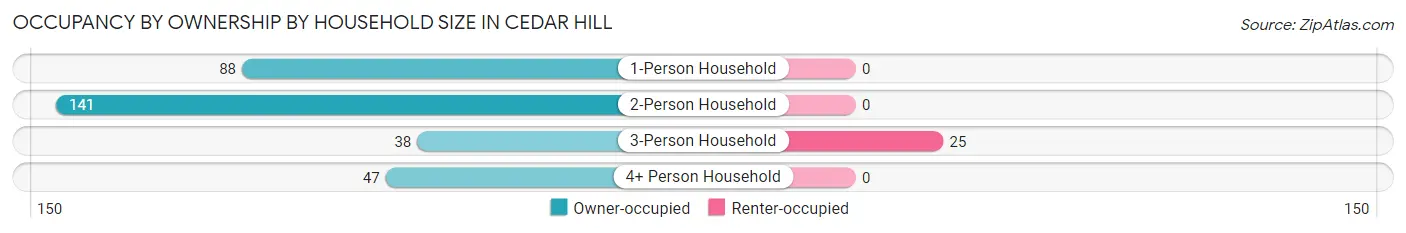
| Household Size | Owner-occupied | Renter-occupied |
| 1-Person Household | 88 (100.0%) | 0 (0.0%) |
| 2-Person Household | 141 (100.0%) | 0 (0.0%) |
| 3-Person Household | 38 (60.3%) | 25 (39.7%) |
| 4+ Person Household | 47 (100.0%) | 0 (0.0%) |
| Total Housing Units | 314 (92.6%) | 25 (7.4%) |
Occupancy by Educational Attainment in Cedar Hill
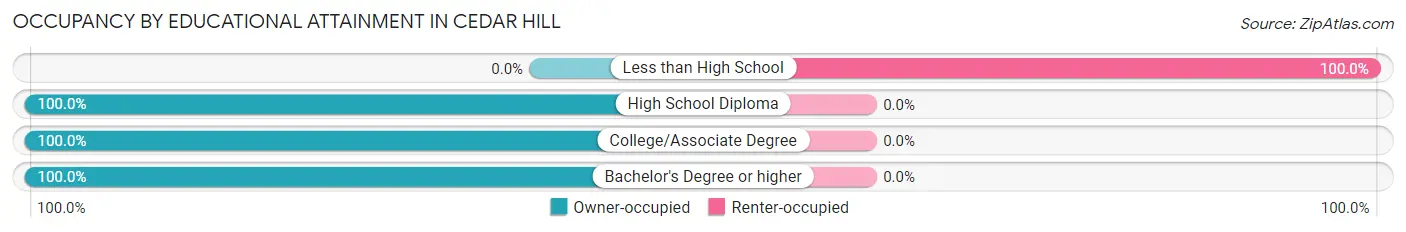
| Household Size | Owner-occupied | Renter-occupied |
| Less than High School | 0 (0.0%) | 25 (100.0%) |
| High School Diploma | 60 (100.0%) | 0 (0.0%) |
| College/Associate Degree | 182 (100.0%) | 0 (0.0%) |
| Bachelor's Degree or higher | 72 (100.0%) | 0 (0.0%) |
Occupancy by Age of Householder in Cedar Hill
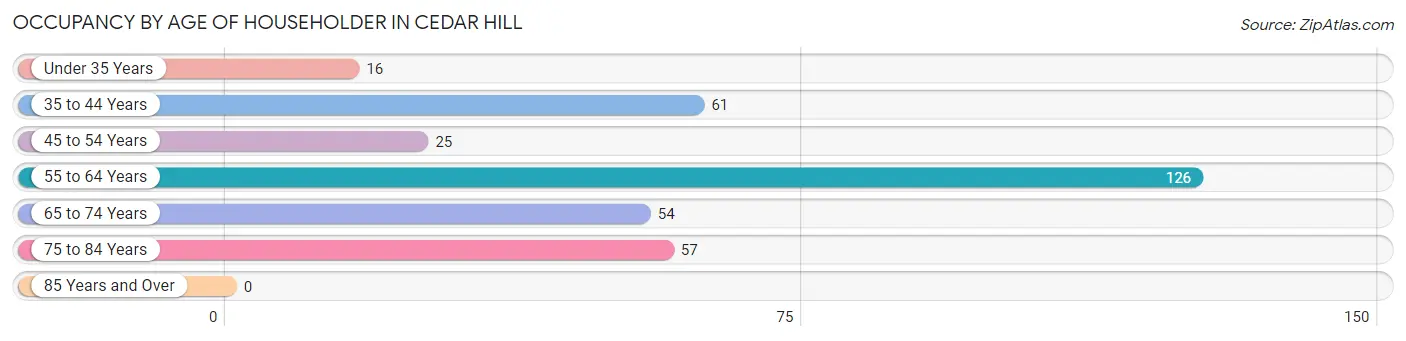
| Age Bracket | # Households | % Households |
| Under 35 Years | 16 | 4.7% |
| 35 to 44 Years | 61 | 18.0% |
| 45 to 54 Years | 25 | 7.4% |
| 55 to 64 Years | 126 | 37.2% |
| 65 to 74 Years | 54 | 15.9% |
| 75 to 84 Years | 57 | 16.8% |
| 85 Years and Over | 0 | 0.0% |
| Total | 339 | 100.0% |
Housing Finances in Cedar Hill
Median Income by Occupancy in Cedar Hill
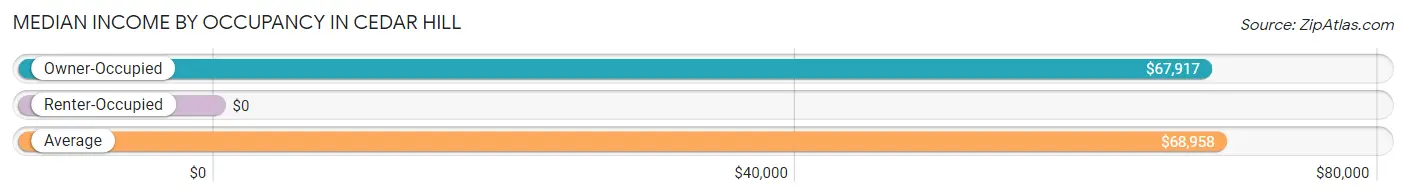
| Occupancy Type | # Households | Median Income |
| Owner-Occupied | 314 (92.6%) | $67,917 |
| Renter-Occupied | 25 (7.4%) | $0 |
| Average | 339 (100.0%) | $68,958 |
Occupancy by Householder Income Bracket in Cedar Hill
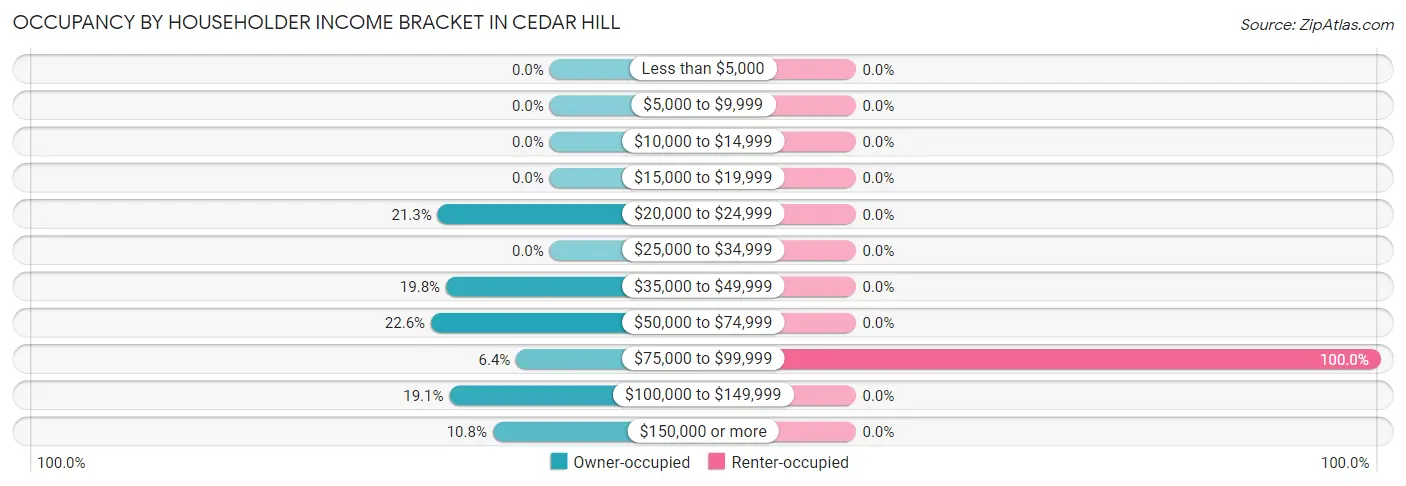
| Income Bracket | Owner-occupied | Renter-occupied |
| Less than $5,000 | 0 (0.0%) | 0 (0.0%) |
| $5,000 to $9,999 | 0 (0.0%) | 0 (0.0%) |
| $10,000 to $14,999 | 0 (0.0%) | 0 (0.0%) |
| $15,000 to $19,999 | 0 (0.0%) | 0 (0.0%) |
| $20,000 to $24,999 | 67 (21.3%) | 0 (0.0%) |
| $25,000 to $34,999 | 0 (0.0%) | 0 (0.0%) |
| $35,000 to $49,999 | 62 (19.8%) | 0 (0.0%) |
| $50,000 to $74,999 | 71 (22.6%) | 0 (0.0%) |
| $75,000 to $99,999 | 20 (6.4%) | 25 (100.0%) |
| $100,000 to $149,999 | 60 (19.1%) | 0 (0.0%) |
| $150,000 or more | 34 (10.8%) | 0 (0.0%) |
| Total | 314 (100.0%) | 25 (100.0%) |
Monthly Housing Cost Tiers in Cedar Hill
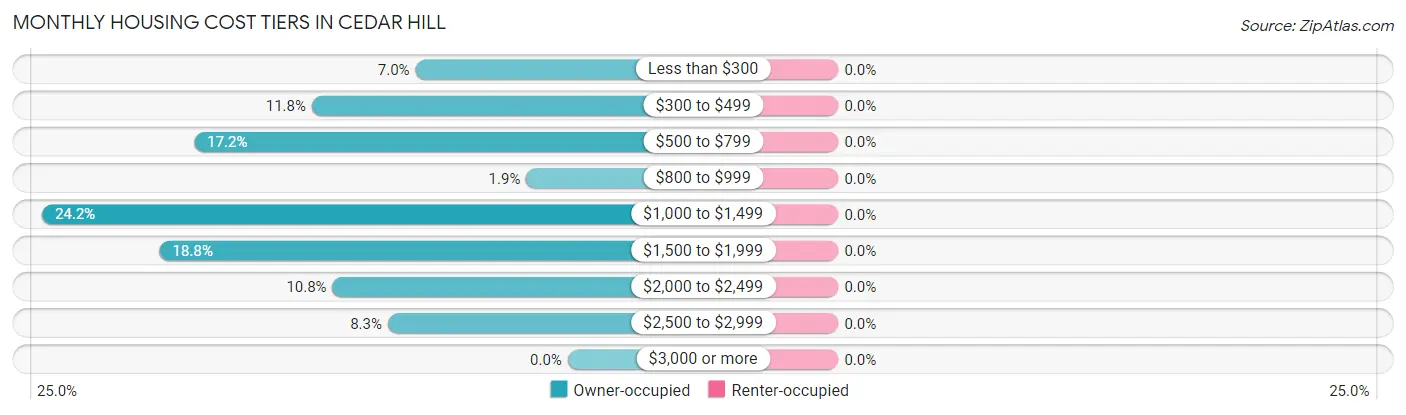
| Monthly Cost | Owner-occupied | Renter-occupied |
| Less than $300 | 22 (7.0%) | 0 (0.0%) |
| $300 to $499 | 37 (11.8%) | 0 (0.0%) |
| $500 to $799 | 54 (17.2%) | 0 (0.0%) |
| $800 to $999 | 6 (1.9%) | 0 (0.0%) |
| $1,000 to $1,499 | 76 (24.2%) | 0 (0.0%) |
| $1,500 to $1,999 | 59 (18.8%) | 0 (0.0%) |
| $2,000 to $2,499 | 34 (10.8%) | 0 (0.0%) |
| $2,500 to $2,999 | 26 (8.3%) | 0 (0.0%) |
| $3,000 or more | 0 (0.0%) | 0 (0.0%) |
| Total | 314 (100.0%) | 25 (100.0%) |
Physical Housing Characteristics in Cedar Hill
Housing Structures in Cedar Hill
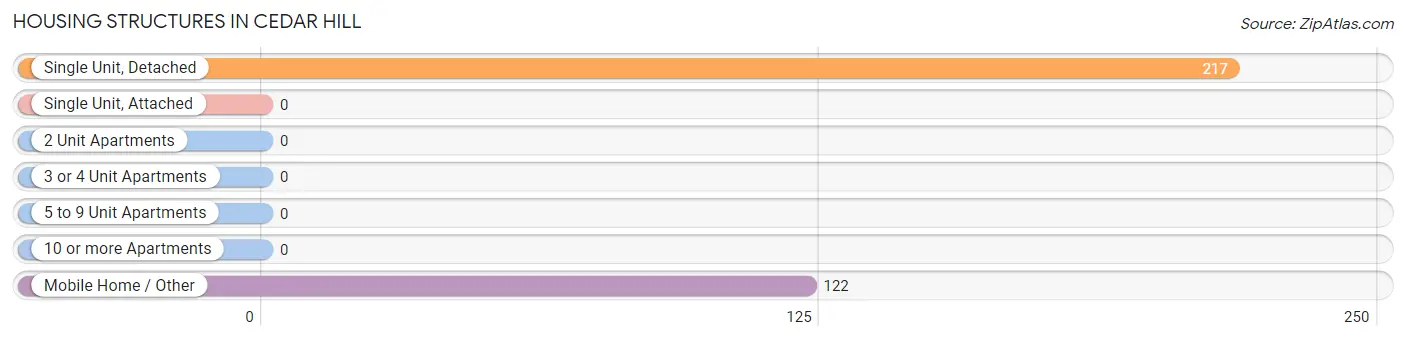
| Structure Type | # Housing Units | % Housing Units |
| Single Unit, Detached | 217 | 64.0% |
| Single Unit, Attached | 0 | 0.0% |
| 2 Unit Apartments | 0 | 0.0% |
| 3 or 4 Unit Apartments | 0 | 0.0% |
| 5 to 9 Unit Apartments | 0 | 0.0% |
| 10 or more Apartments | 0 | 0.0% |
| Mobile Home / Other | 122 | 36.0% |
| Total | 339 | 100.0% |
Housing Structures by Occupancy in Cedar Hill
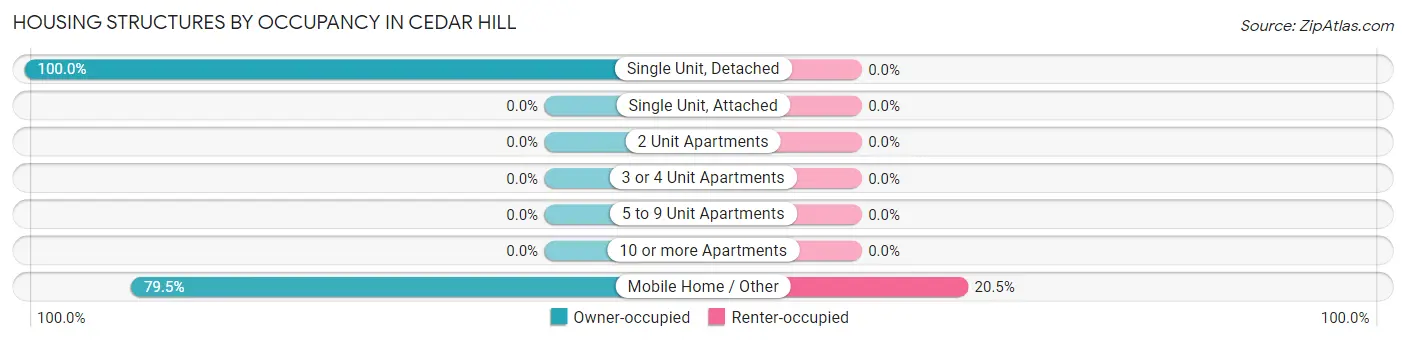
| Structure Type | Owner-occupied | Renter-occupied |
| Single Unit, Detached | 217 (100.0%) | 0 (0.0%) |
| Single Unit, Attached | 0 (0.0%) | 0 (0.0%) |
| 2 Unit Apartments | 0 (0.0%) | 0 (0.0%) |
| 3 or 4 Unit Apartments | 0 (0.0%) | 0 (0.0%) |
| 5 to 9 Unit Apartments | 0 (0.0%) | 0 (0.0%) |
| 10 or more Apartments | 0 (0.0%) | 0 (0.0%) |
| Mobile Home / Other | 97 (79.5%) | 25 (20.5%) |
| Total | 314 (92.6%) | 25 (7.4%) |
Housing Structures by Number of Rooms in Cedar Hill
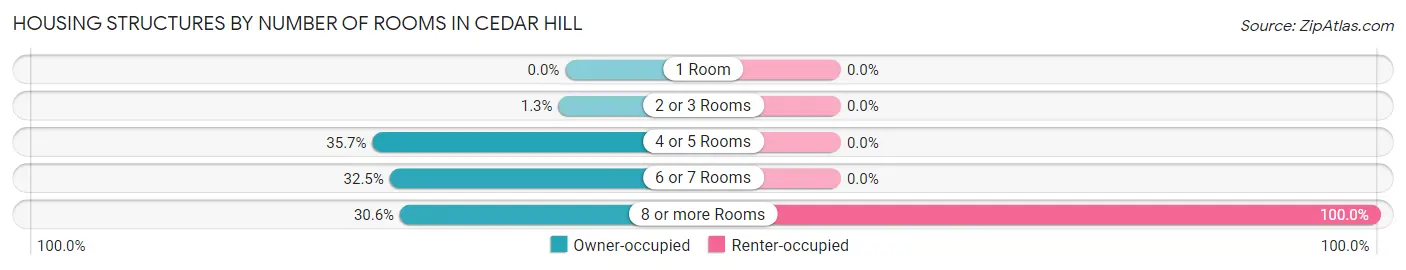
| Number of Rooms | Owner-occupied | Renter-occupied |
| 1 Room | 0 (0.0%) | 0 (0.0%) |
| 2 or 3 Rooms | 4 (1.3%) | 0 (0.0%) |
| 4 or 5 Rooms | 112 (35.7%) | 0 (0.0%) |
| 6 or 7 Rooms | 102 (32.5%) | 0 (0.0%) |
| 8 or more Rooms | 96 (30.6%) | 25 (100.0%) |
| Total | 314 (100.0%) | 25 (100.0%) |
Housing Structure by Heating Type in Cedar Hill
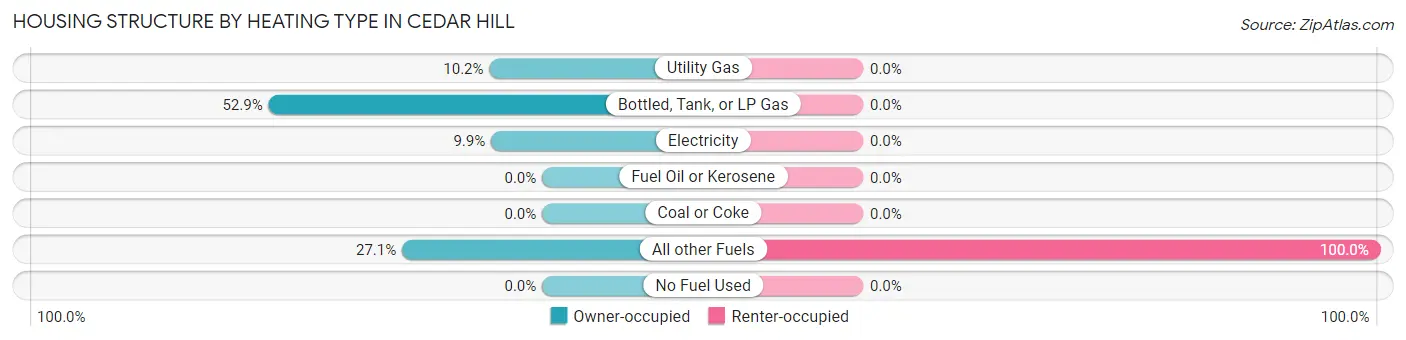
| Heating Type | Owner-occupied | Renter-occupied |
| Utility Gas | 32 (10.2%) | 0 (0.0%) |
| Bottled, Tank, or LP Gas | 166 (52.9%) | 0 (0.0%) |
| Electricity | 31 (9.9%) | 0 (0.0%) |
| Fuel Oil or Kerosene | 0 (0.0%) | 0 (0.0%) |
| Coal or Coke | 0 (0.0%) | 0 (0.0%) |
| All other Fuels | 85 (27.1%) | 25 (100.0%) |
| No Fuel Used | 0 (0.0%) | 0 (0.0%) |
| Total | 314 (100.0%) | 25 (100.0%) |
Household Vehicle Usage in Cedar Hill
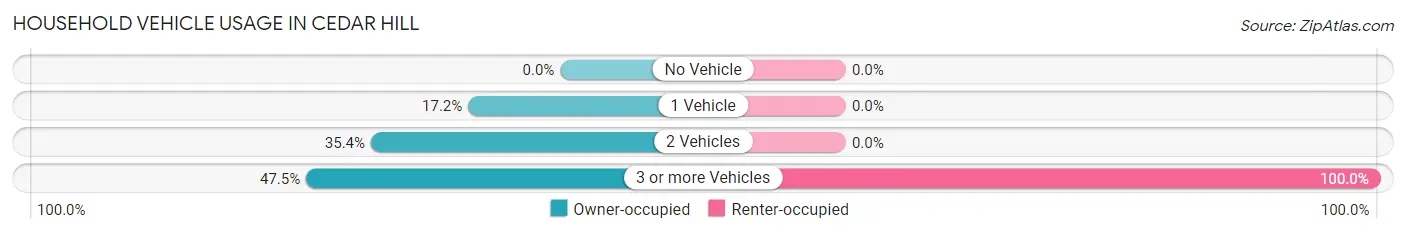
| Vehicles per Household | Owner-occupied | Renter-occupied |
| No Vehicle | 0 (0.0%) | 0 (0.0%) |
| 1 Vehicle | 54 (17.2%) | 0 (0.0%) |
| 2 Vehicles | 111 (35.3%) | 0 (0.0%) |
| 3 or more Vehicles | 149 (47.4%) | 25 (100.0%) |
| Total | 314 (100.0%) | 25 (100.0%) |
Real Estate & Mortgages in Cedar Hill
Real Estate and Mortgage Overview in Cedar Hill
| Characteristic | Without Mortgage | With Mortgage |
| Housing Units | 113 | 201 |
| Median Property Value | - | - |
| Median Household Income | $57,014 | $22 |
| Monthly Housing Costs | $450 | $0 |
| Real Estate Taxes | $1,493 | $0 |
Property Value by Mortgage Status in Cedar Hill
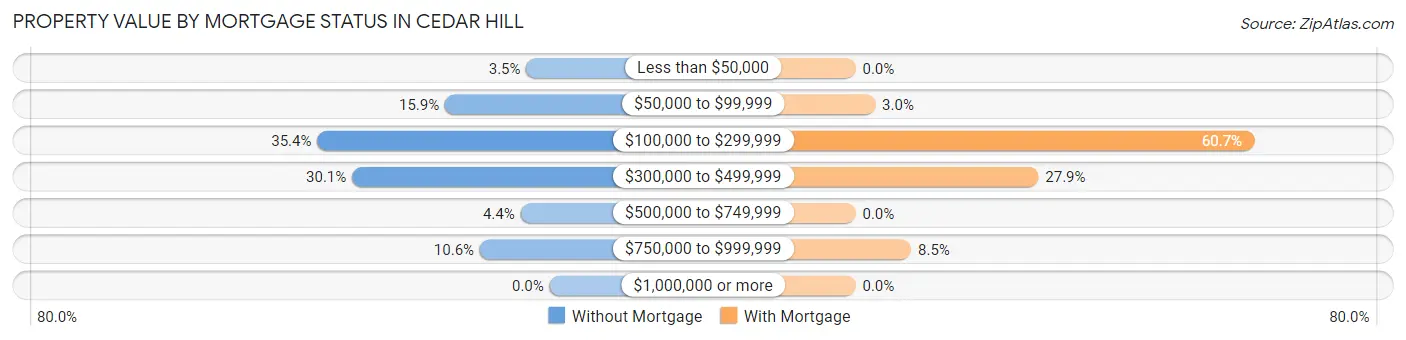
| Property Value | Without Mortgage | With Mortgage |
| Less than $50,000 | 4 (3.5%) | 0 (0.0%) |
| $50,000 to $99,999 | 18 (15.9%) | 6 (3.0%) |
| $100,000 to $299,999 | 40 (35.4%) | 122 (60.7%) |
| $300,000 to $499,999 | 34 (30.1%) | 56 (27.9%) |
| $500,000 to $749,999 | 5 (4.4%) | 0 (0.0%) |
| $750,000 to $999,999 | 12 (10.6%) | 17 (8.5%) |
| $1,000,000 or more | 0 (0.0%) | 0 (0.0%) |
| Total | 113 (100.0%) | 201 (100.0%) |
Household Income by Mortgage Status in Cedar Hill
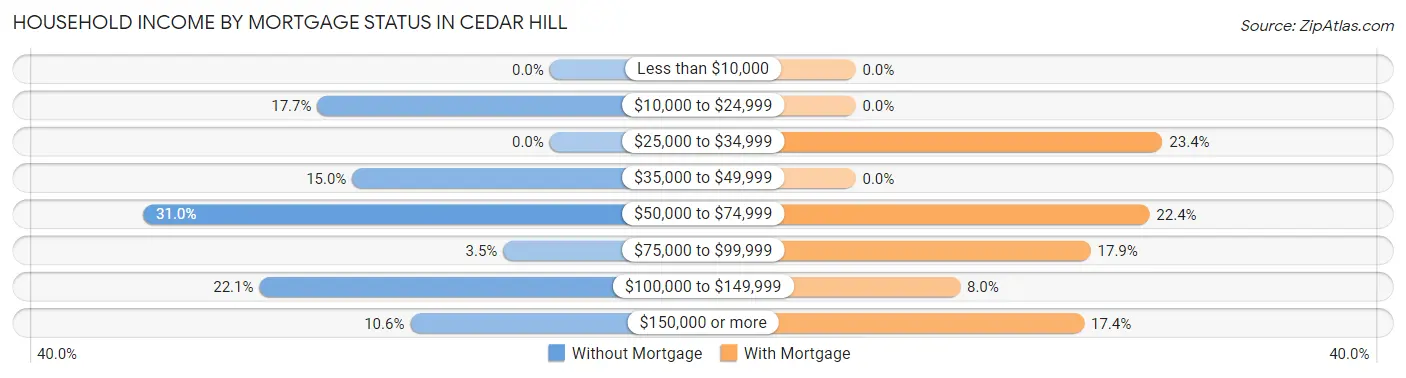
| Household Income | Without Mortgage | With Mortgage |
| Less than $10,000 | 0 (0.0%) | 0 (0.0%) |
| $10,000 to $24,999 | 20 (17.7%) | 0 (0.0%) |
| $25,000 to $34,999 | 0 (0.0%) | 47 (23.4%) |
| $35,000 to $49,999 | 17 (15.0%) | 0 (0.0%) |
| $50,000 to $74,999 | 35 (31.0%) | 45 (22.4%) |
| $75,000 to $99,999 | 4 (3.5%) | 36 (17.9%) |
| $100,000 to $149,999 | 25 (22.1%) | 16 (8.0%) |
| $150,000 or more | 12 (10.6%) | 35 (17.4%) |
| Total | 113 (100.0%) | 201 (100.0%) |
Property Value to Household Income Ratio in Cedar Hill
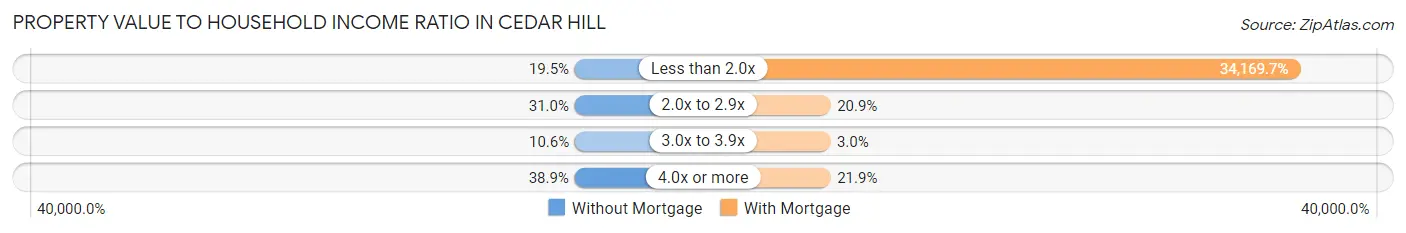
| Value-to-Income Ratio | Without Mortgage | With Mortgage |
| Less than 2.0x | 22 (19.5%) | 68,681 (34,169.7%) |
| 2.0x to 2.9x | 35 (31.0%) | 42 (20.9%) |
| 3.0x to 3.9x | 12 (10.6%) | 6 (3.0%) |
| 4.0x or more | 44 (38.9%) | 44 (21.9%) |
| Total | 113 (100.0%) | 201 (100.0%) |
Real Estate Taxes by Mortgage Status in Cedar Hill
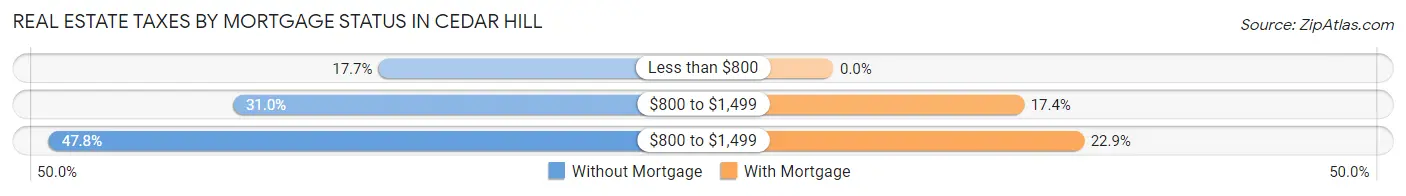
| Property Taxes | Without Mortgage | With Mortgage |
| Less than $800 | 20 (17.7%) | 0 (0.0%) |
| $800 to $1,499 | 35 (31.0%) | 35 (17.4%) |
| $800 to $1,499 | 54 (47.8%) | 46 (22.9%) |
| Total | 113 (100.0%) | 201 (100.0%) |
Health & Disability in Cedar Hill
Health Insurance Coverage by Age in Cedar Hill
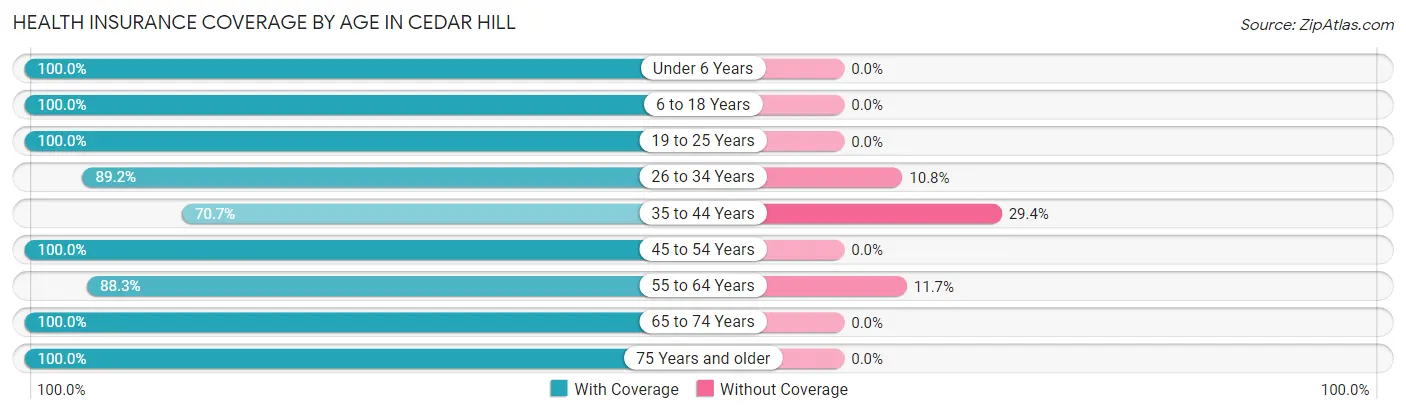
| Age Bracket | With Coverage | Without Coverage |
| Under 6 Years | 27 (100.0%) | 0 (0.0%) |
| 6 to 18 Years | 140 (100.0%) | 0 (0.0%) |
| 19 to 25 Years | 64 (100.0%) | 0 (0.0%) |
| 26 to 34 Years | 107 (89.2%) | 13 (10.8%) |
| 35 to 44 Years | 65 (70.7%) | 27 (29.3%) |
| 45 to 54 Years | 72 (100.0%) | 0 (0.0%) |
| 55 to 64 Years | 227 (88.3%) | 30 (11.7%) |
| 65 to 74 Years | 83 (100.0%) | 0 (0.0%) |
| 75 Years and older | 76 (100.0%) | 0 (0.0%) |
| Total | 861 (92.5%) | 70 (7.5%) |
Health Insurance Coverage by Citizenship Status in Cedar Hill
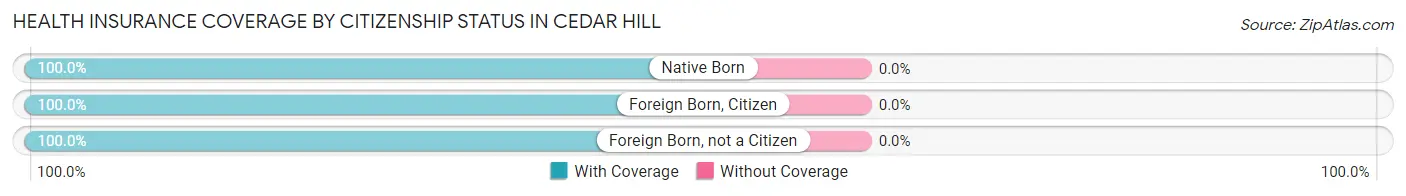
| Citizenship Status | With Coverage | Without Coverage |
| Native Born | 27 (100.0%) | 0 (0.0%) |
| Foreign Born, Citizen | 140 (100.0%) | 0 (0.0%) |
| Foreign Born, not a Citizen | 64 (100.0%) | 0 (0.0%) |
Health Insurance Coverage by Household Income in Cedar Hill
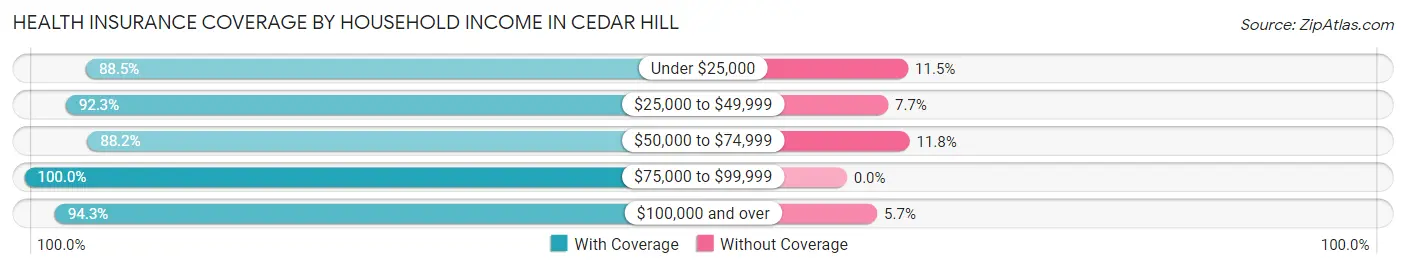
| Household Income | With Coverage | Without Coverage |
| Under $25,000 | 100 (88.5%) | 13 (11.5%) |
| $25,000 to $49,999 | 322 (92.3%) | 27 (7.7%) |
| $50,000 to $74,999 | 135 (88.2%) | 18 (11.8%) |
| $75,000 to $99,999 | 105 (100.0%) | 0 (0.0%) |
| $100,000 and over | 199 (94.3%) | 12 (5.7%) |
Public vs Private Health Insurance Coverage by Age in Cedar Hill
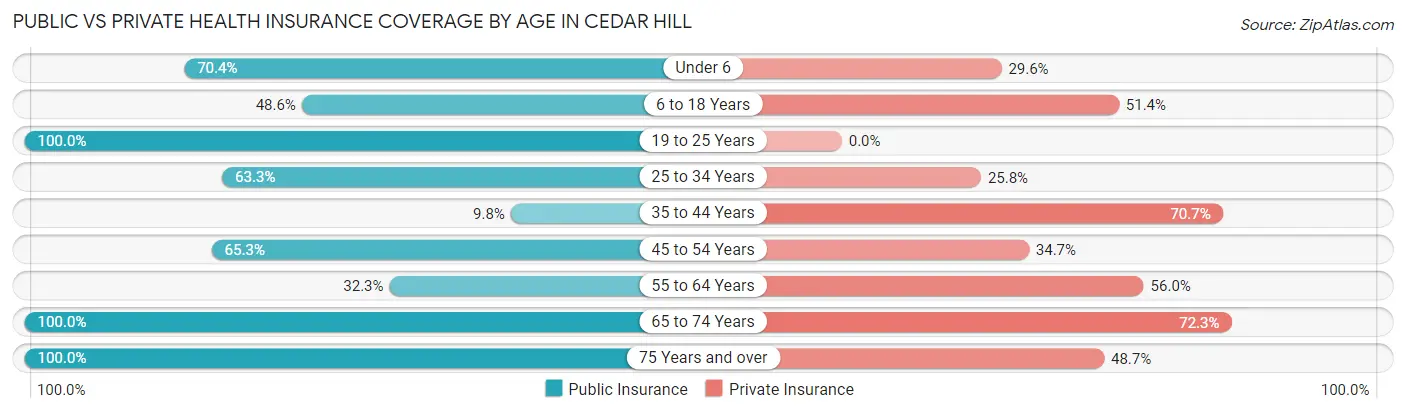
| Age Bracket | Public Insurance | Private Insurance |
| Under 6 | 19 (70.4%) | 8 (29.6%) |
| 6 to 18 Years | 68 (48.6%) | 72 (51.4%) |
| 19 to 25 Years | 64 (100.0%) | 0 (0.0%) |
| 25 to 34 Years | 76 (63.3%) | 31 (25.8%) |
| 35 to 44 Years | 9 (9.8%) | 65 (70.7%) |
| 45 to 54 Years | 47 (65.3%) | 25 (34.7%) |
| 55 to 64 Years | 83 (32.3%) | 144 (56.0%) |
| 65 to 74 Years | 83 (100.0%) | 60 (72.3%) |
| 75 Years and over | 76 (100.0%) | 37 (48.7%) |
| Total | 525 (56.4%) | 442 (47.5%) |
Disability Status by Sex by Age in Cedar Hill
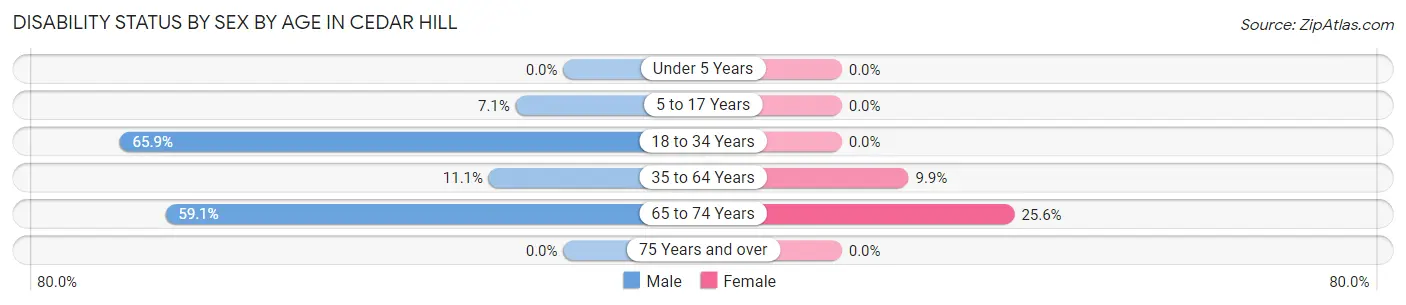
| Age Bracket | Male | Female |
| Under 5 Years | 0 (0.0%) | 0 (0.0%) |
| 5 to 17 Years | 9 (7.1%) | 0 (0.0%) |
| 18 to 34 Years | 56 (65.9%) | 0 (0.0%) |
| 35 to 64 Years | 22 (11.1%) | 22 (9.9%) |
| 65 to 74 Years | 26 (59.1%) | 10 (25.6%) |
| 75 Years and over | 0 (0.0%) | 0 (0.0%) |
Disability Class by Sex by Age in Cedar Hill
Disability Class: Hearing Difficulty
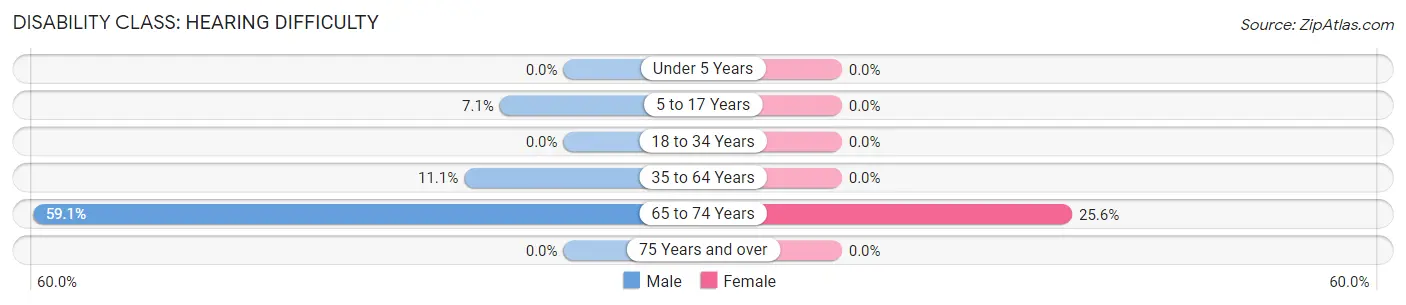
| Age Bracket | Male | Female |
| Under 5 Years | 0 (0.0%) | 0 (0.0%) |
| 5 to 17 Years | 9 (7.1%) | 0 (0.0%) |
| 18 to 34 Years | 0 (0.0%) | 0 (0.0%) |
| 35 to 64 Years | 22 (11.1%) | 0 (0.0%) |
| 65 to 74 Years | 26 (59.1%) | 10 (25.6%) |
| 75 Years and over | 0 (0.0%) | 0 (0.0%) |
Disability Class: Vision Difficulty
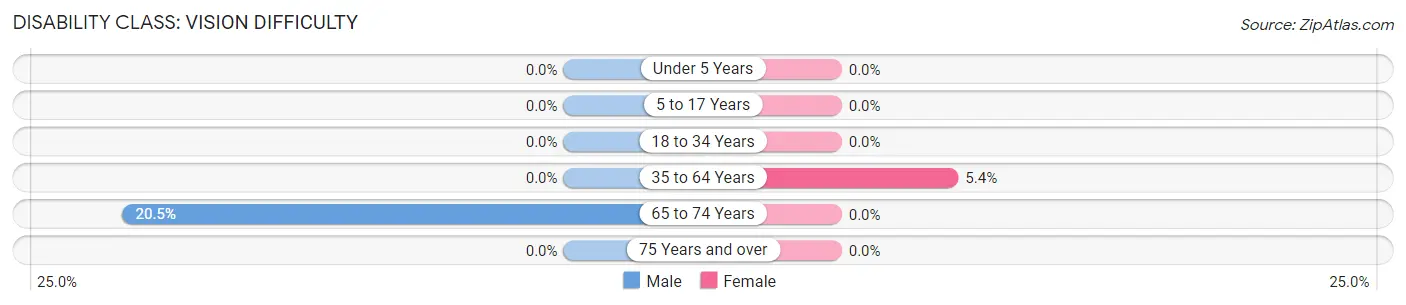
| Age Bracket | Male | Female |
| Under 5 Years | 0 (0.0%) | 0 (0.0%) |
| 5 to 17 Years | 0 (0.0%) | 0 (0.0%) |
| 18 to 34 Years | 0 (0.0%) | 0 (0.0%) |
| 35 to 64 Years | 0 (0.0%) | 12 (5.4%) |
| 65 to 74 Years | 9 (20.4%) | 0 (0.0%) |
| 75 Years and over | 0 (0.0%) | 0 (0.0%) |
Disability Class: Cognitive Difficulty
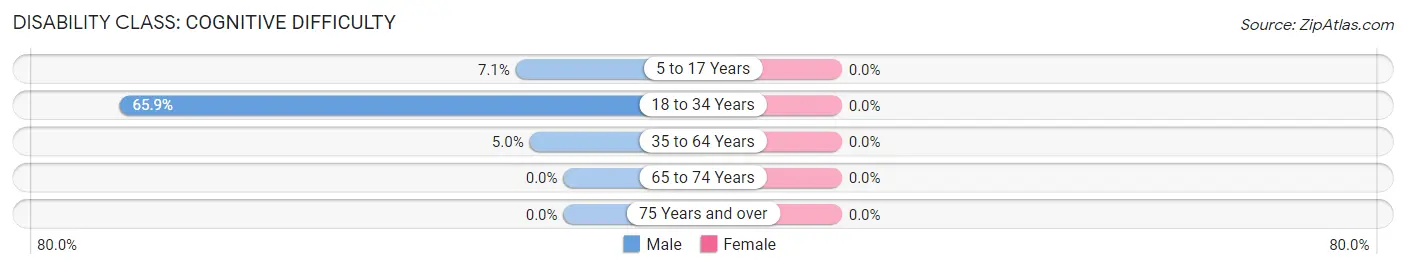
| Age Bracket | Male | Female |
| 5 to 17 Years | 9 (7.1%) | 0 (0.0%) |
| 18 to 34 Years | 56 (65.9%) | 0 (0.0%) |
| 35 to 64 Years | 10 (5.0%) | 0 (0.0%) |
| 65 to 74 Years | 0 (0.0%) | 0 (0.0%) |
| 75 Years and over | 0 (0.0%) | 0 (0.0%) |
Disability Class: Ambulatory Difficulty
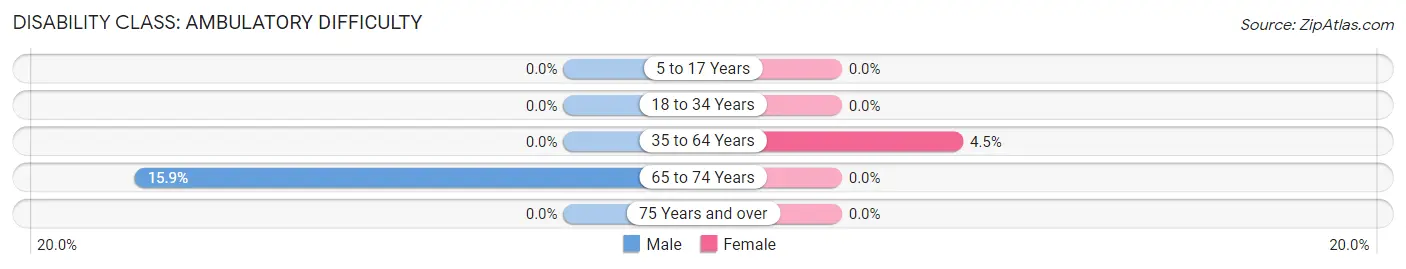
| Age Bracket | Male | Female |
| 5 to 17 Years | 0 (0.0%) | 0 (0.0%) |
| 18 to 34 Years | 0 (0.0%) | 0 (0.0%) |
| 35 to 64 Years | 0 (0.0%) | 10 (4.5%) |
| 65 to 74 Years | 7 (15.9%) | 0 (0.0%) |
| 75 Years and over | 0 (0.0%) | 0 (0.0%) |
Disability Class: Self-Care Difficulty
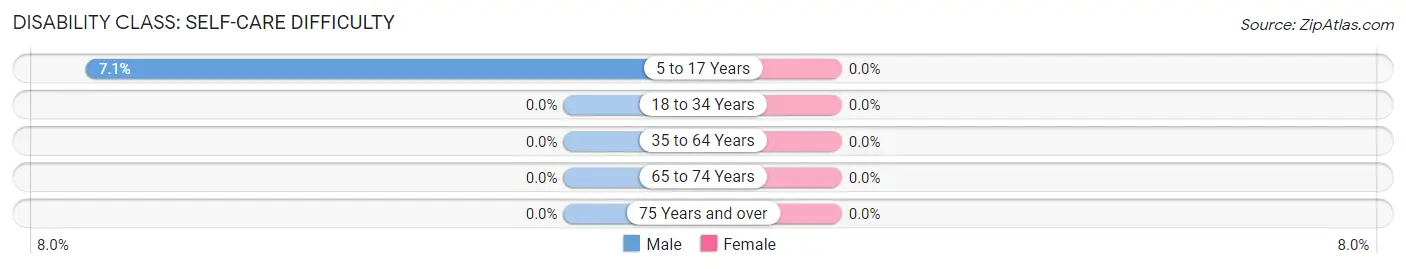
| Age Bracket | Male | Female |
| 5 to 17 Years | 9 (7.1%) | 0 (0.0%) |
| 18 to 34 Years | 0 (0.0%) | 0 (0.0%) |
| 35 to 64 Years | 0 (0.0%) | 0 (0.0%) |
| 65 to 74 Years | 0 (0.0%) | 0 (0.0%) |
| 75 Years and over | 0 (0.0%) | 0 (0.0%) |
Technology Access in Cedar Hill
Computing Device Access in Cedar Hill
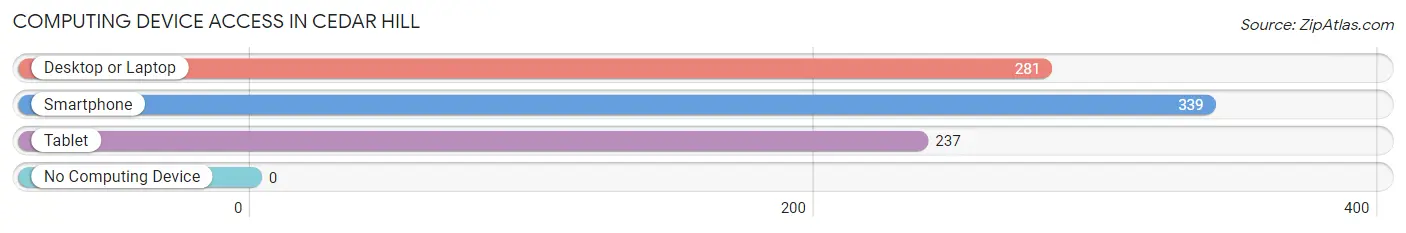
| Device Type | # Households | % Households |
| Desktop or Laptop | 281 | 82.9% |
| Smartphone | 339 | 100.0% |
| Tablet | 237 | 69.9% |
| No Computing Device | 0 | 0.0% |
| Total | 339 | 100.0% |
Internet Access in Cedar Hill
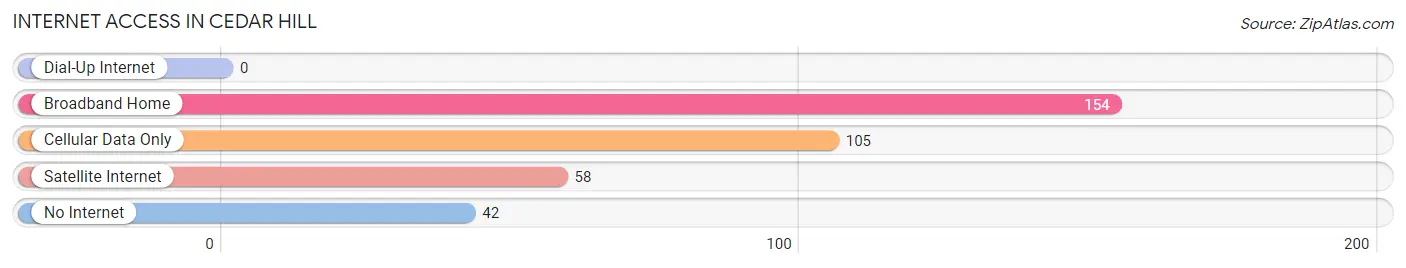
| Internet Type | # Households | % Households |
| Dial-Up Internet | 0 | 0.0% |
| Broadband Home | 154 | 45.4% |
| Cellular Data Only | 105 | 31.0% |
| Satellite Internet | 58 | 17.1% |
| No Internet | 42 | 12.4% |
| Total | 339 | 100.0% |
Cedar Hill Summary
Cedar Hill is a small unincorporated community located in the state of New Mexico, United States. It is situated in the foothills of the Sangre de Cristo Mountains, approximately 25 miles (40 km) northeast of Santa Fe. The community is located in the Santa Fe National Forest and is home to a population of approximately 200 people.
History
The area that is now Cedar Hill was originally inhabited by the Tewa people, who were part of the Pueblo culture. The Tewa people lived in the area for centuries before the arrival of the Spanish in the 16th century. The Spanish established a mission in the area in 1610, and the Tewa people were forced to convert to Catholicism. The mission was abandoned in 1680, and the Tewa people returned to their traditional lifestyle.
In the late 19th century, the area was settled by Anglo-American settlers. The first settlers were ranchers, who established large cattle ranches in the area. The community of Cedar Hill was established in the early 20th century, and the town was named after the cedar trees that grew in the area.
Geography
Cedar Hill is located in the foothills of the Sangre de Cristo Mountains, approximately 25 miles (40 km) northeast of Santa Fe. The community is situated at an elevation of 6,400 feet (1,950 m). The area is characterized by rolling hills, grassy meadows, and dense forests of pine and juniper. The climate is semi-arid, with hot summers and cold winters.
Economy
The economy of Cedar Hill is largely based on agriculture and tourism. The area is home to several small farms and ranches, which produce hay, alfalfa, and other crops. The area is also popular with tourists, who come to enjoy the area’s natural beauty and outdoor activities.
Demographics
As of the 2010 census, the population of Cedar Hill was 200. The racial makeup of the town was 95.5% White, 0.5% African American, 0.5% Native American, 0.5% Asian, and 2.5% from other races. The median household income was $37,500, and the median family income was $41,250. The per capita income was $17,500.
Conclusion
Cedar Hill is a small unincorporated community located in the state of New Mexico, United States. It is situated in the foothills of the Sangre de Cristo Mountains, approximately 25 miles (40 km) northeast of Santa Fe. The community is located in the Santa Fe National Forest and is home to a population of approximately 200 people. The economy of Cedar Hill is largely based on agriculture and tourism, and the area is popular with tourists who come to enjoy the area’s natural beauty and outdoor activities. The racial makeup of the town is 95.5% White, 0.5% African American, 0.5% Native American, 0.5% Asian, and 2.5% from other races. The median household income was $37,500, and the median family income was $41,250.
Common Questions
What is Per Capita Income in Cedar Hill?
Per Capita income in Cedar Hill is $30,634.
What is the Median Family Income in Cedar Hill?
Median Family Income in Cedar Hill is $69,833.
What is the Median Household income in Cedar Hill?
Median Household Income in Cedar Hill is $68,958.
What is Inequality or Gini Index in Cedar Hill?
Inequality or Gini Index in Cedar Hill is 0.38.
What is the Total Population of Cedar Hill?
Total Population of Cedar Hill is 931.
What is the Total Male Population of Cedar Hill?
Total Male Population of Cedar Hill is 514.
What is the Total Female Population of Cedar Hill?
Total Female Population of Cedar Hill is 417.
What is the Ratio of Males per 100 Females in Cedar Hill?
There are 123.26 Males per 100 Females in Cedar Hill.
What is the Ratio of Females per 100 Males in Cedar Hill?
There are 81.13 Females per 100 Males in Cedar Hill.
What is the Median Population Age in Cedar Hill?
Median Population Age in Cedar Hill is 52.2 Years.
What is the Average Family Size in Cedar Hill
Average Family Size in Cedar Hill is 3.5 People.
What is the Average Household Size in Cedar Hill
Average Household Size in Cedar Hill is 2.8 People.
How Large is the Labor Force in Cedar Hill?
There are 436 People in the Labor Forcein in Cedar Hill.
What is the Percentage of People in the Labor Force in Cedar Hill?
53.4% of People are in the Labor Force in Cedar Hill.
What is the Unemployment Rate in Cedar Hill?
Unemployment Rate in Cedar Hill is 12.8%.