Sandia Heights, NM Map & Demographics
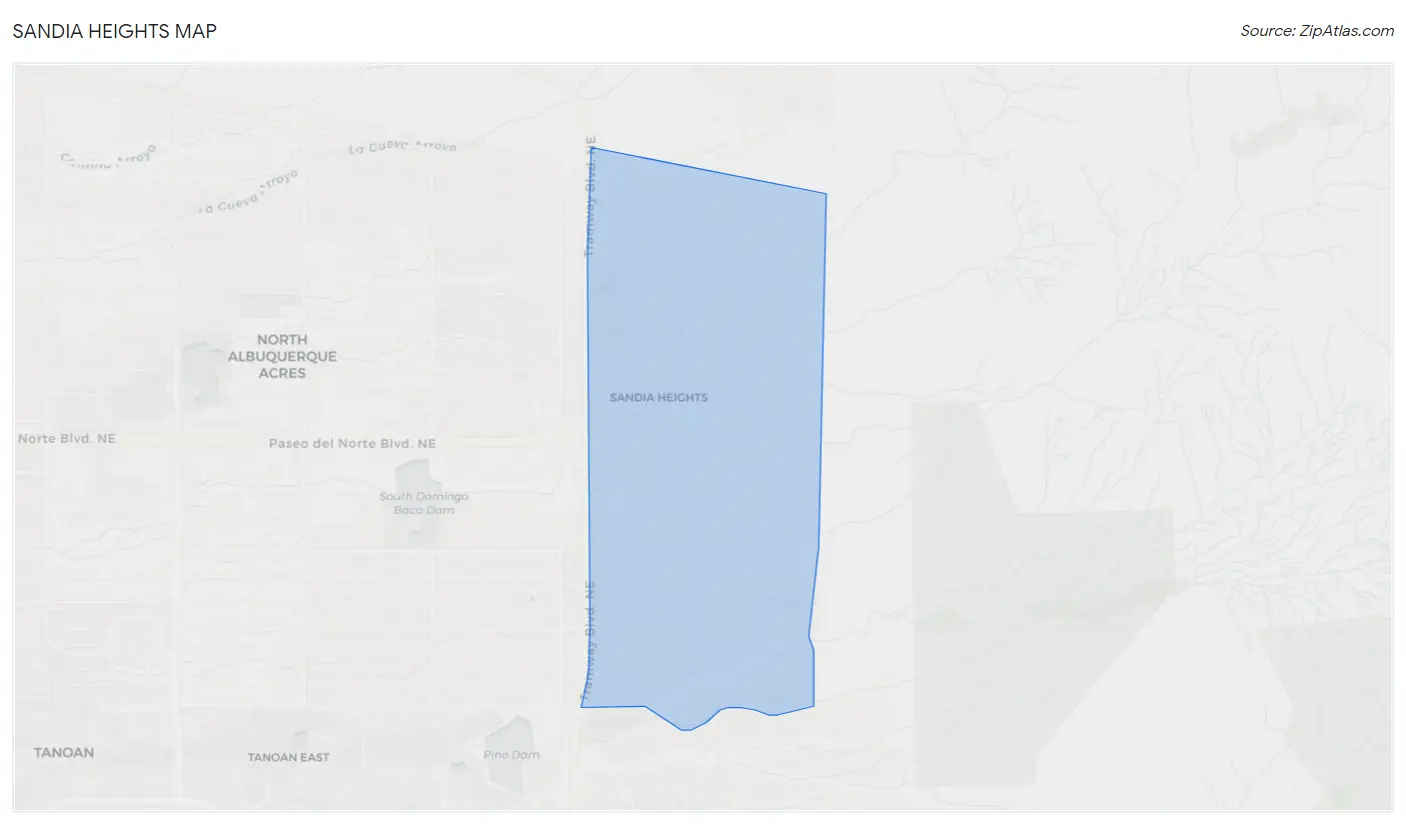
Sandia Heights Map
Sandia Heights Overview
$83,359
PER CAPITA INCOME
$178,075
AVG FAMILY INCOME
$151,991
AVG HOUSEHOLD INCOME
55.5%
WAGE / INCOME GAP [ % ]
44.5¢/ $1
WAGE / INCOME GAP [ $ ]
0.41
INEQUALITY / GINI INDEX
3,205
TOTAL POPULATION
1,577
MALE POPULATION
1,628
FEMALE POPULATION
96.87
MALES / 100 FEMALES
103.23
FEMALES / 100 MALES
61.7
MEDIAN AGE
2.5
AVG FAMILY SIZE
2.2
AVG HOUSEHOLD SIZE
1,185
LABOR FORCE [ PEOPLE ]
41.9%
PERCENT IN LABOR FORCE
1.7%
UNEMPLOYMENT RATE
Income in Sandia Heights
Income Overview in Sandia Heights
Per Capita Income in Sandia Heights is $83,359, while median incomes of families and households are $178,075 and $151,991 respectively.
| Characteristic | Number | Measure |
| Per Capita Income | 3,205 | $83,359 |
| Median Family Income | 1,061 | $178,075 |
| Mean Family Income | 1,061 | $206,197 |
| Median Household Income | 1,455 | $151,991 |
| Mean Household Income | 1,455 | $181,773 |
| Income Deficit | 1,061 | $0 |
| Wage / Income Gap (%) | 3,205 | 55.48% |
| Wage / Income Gap ($) | 3,205 | 44.52¢ per $1 |
| Gini / Inequality Index | 3,205 | 0.41 |
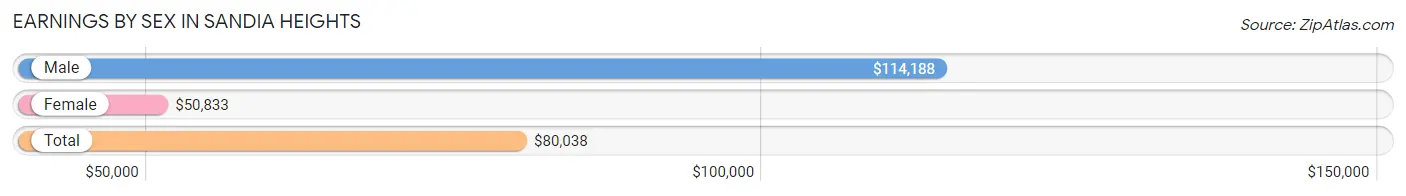
Earnings by Sex in Sandia Heights
Average Earnings in Sandia Heights are $80,038, $114,188 for men and $50,833 for women, a difference of 55.5%.
| Sex | Number | Average Earnings |
| Male | 721 (53.0%) | $114,188 |
| Female | 638 (46.9%) | $50,833 |
| Total | 1,359 (100.0%) | $80,038 |
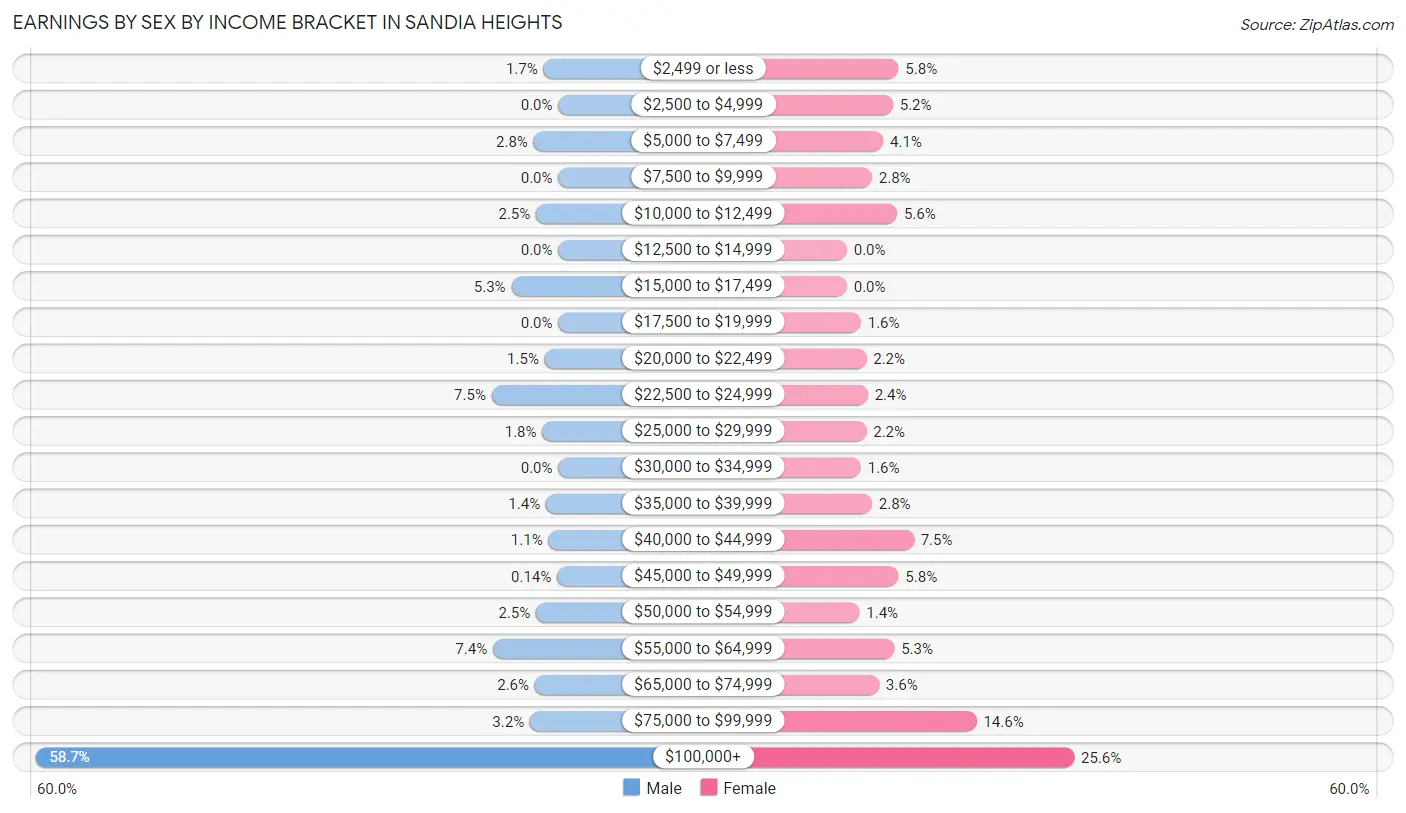
Earnings by Sex by Income Bracket in Sandia Heights
The most common earnings brackets in Sandia Heights are $100,000+ for men (423 | 58.7%) and $100,000+ for women (163 | 25.6%).
| Income | Male | Female |
| $2,499 or less | 12 (1.7%) | 37 (5.8%) |
| $2,500 to $4,999 | 0 (0.0%) | 33 (5.2%) |
| $5,000 to $7,499 | 20 (2.8%) | 26 (4.1%) |
| $7,500 to $9,999 | 0 (0.0%) | 18 (2.8%) |
| $10,000 to $12,499 | 18 (2.5%) | 36 (5.6%) |
| $12,500 to $14,999 | 0 (0.0%) | 0 (0.0%) |
| $15,000 to $17,499 | 38 (5.3%) | 0 (0.0%) |
| $17,500 to $19,999 | 0 (0.0%) | 10 (1.6%) |
| $20,000 to $22,499 | 11 (1.5%) | 14 (2.2%) |
| $22,500 to $24,999 | 54 (7.5%) | 15 (2.4%) |
| $25,000 to $29,999 | 13 (1.8%) | 14 (2.2%) |
| $30,000 to $34,999 | 0 (0.0%) | 10 (1.6%) |
| $35,000 to $39,999 | 10 (1.4%) | 18 (2.8%) |
| $40,000 to $44,999 | 8 (1.1%) | 48 (7.5%) |
| $45,000 to $49,999 | 1 (0.1%) | 37 (5.8%) |
| $50,000 to $54,999 | 18 (2.5%) | 9 (1.4%) |
| $55,000 to $64,999 | 53 (7.3%) | 34 (5.3%) |
| $65,000 to $74,999 | 19 (2.6%) | 23 (3.6%) |
| $75,000 to $99,999 | 23 (3.2%) | 93 (14.6%) |
| $100,000+ | 423 (58.7%) | 163 (25.6%) |
| Total | 721 (100.0%) | 638 (100.0%) |
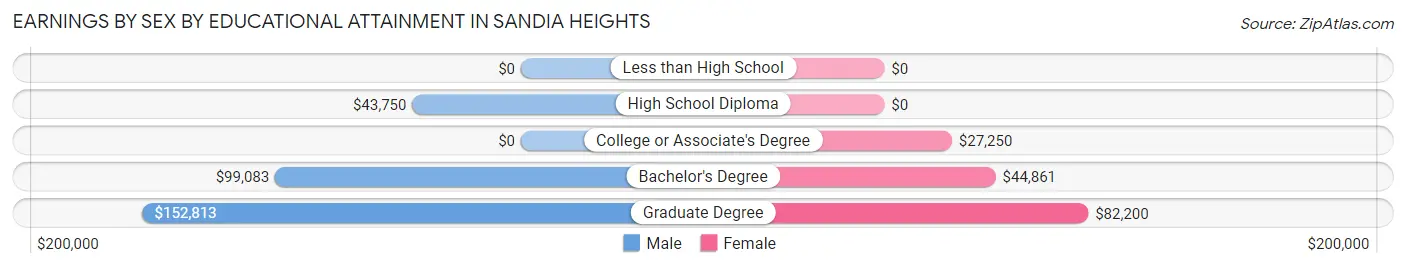
Earnings by Sex by Educational Attainment in Sandia Heights
Average earnings in Sandia Heights are $117,174 for men and $63,300 for women, a difference of 46.0%. Men with an educational attainment of graduate degree enjoy the highest average annual earnings of $152,813, while those with high school diploma education earn the least with $43,750. Women with an educational attainment of graduate degree earn the most with the average annual earnings of $82,200, while those with college or associate's degree education have the smallest earnings of $27,250.
| Educational Attainment | Male Income | Female Income |
| Less than High School | - | - |
| High School Diploma | $43,750 | $0 |
| College or Associate's Degree | - | - |
| Bachelor's Degree | $99,083 | $44,861 |
| Graduate Degree | $152,813 | $82,200 |
| Total | $117,174 | $63,300 |
Family Income in Sandia Heights
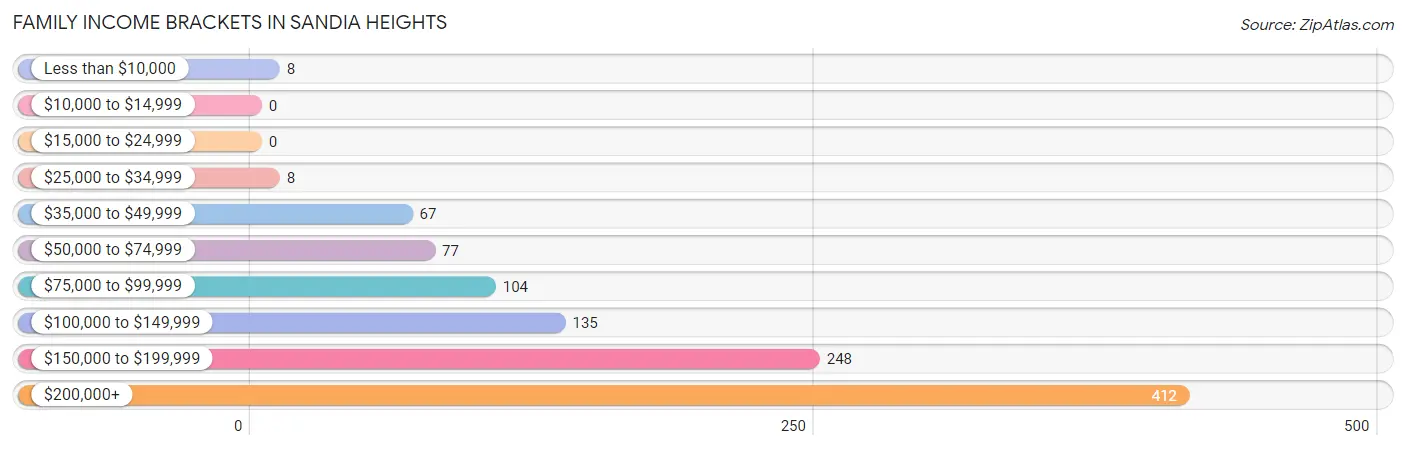
Family Income Brackets in Sandia Heights
According to the Sandia Heights family income data, there are 412 families falling into the $200,000+ income range, which is the most common income bracket and makes up 38.8% of all families.
| Income Bracket | # Families | % Families |
| Less than $10,000 | 8 | 0.8% |
| $10,000 to $14,999 | 0 | 0.0% |
| $15,000 to $24,999 | 0 | 0.0% |
| $25,000 to $34,999 | 8 | 0.8% |
| $35,000 to $49,999 | 67 | 6.3% |
| $50,000 to $74,999 | 77 | 7.3% |
| $75,000 to $99,999 | 104 | 9.8% |
| $100,000 to $149,999 | 135 | 12.7% |
| $150,000 to $199,999 | 248 | 23.4% |
| $200,000+ | 412 | 38.8% |
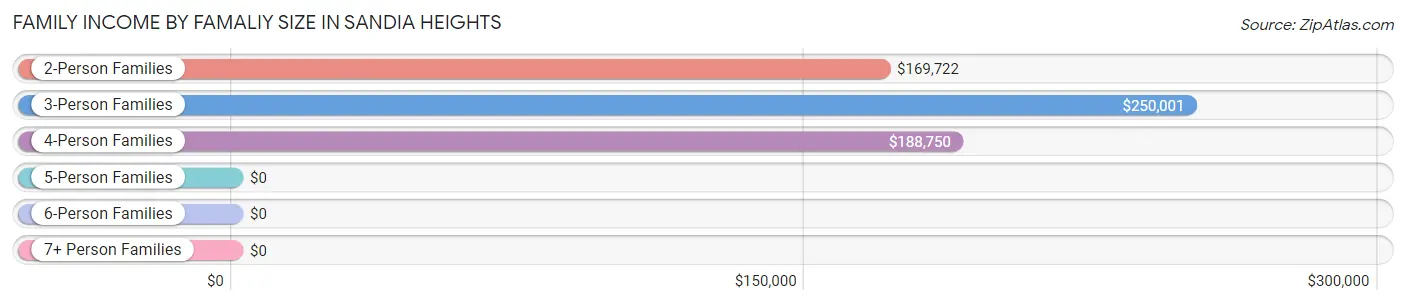
Family Income by Famaliy Size in Sandia Heights
3-person families (49 | 4.6%) account for the highest median family income in Sandia Heights with $250,001 per family, while 2-person families (814 | 76.7%) have the highest median income of $84,861 per family member.
| Income Bracket | # Families | Median Income |
| 2-Person Families | 814 (76.7%) | $169,722 |
| 3-Person Families | 49 (4.6%) | $250,001 |
| 4-Person Families | 177 (16.7%) | $188,750 |
| 5-Person Families | 21 (2.0%) | $0 |
| 6-Person Families | 0 (0.0%) | $0 |
| 7+ Person Families | 0 (0.0%) | $0 |
| Total | 1,061 (100.0%) | $178,075 |
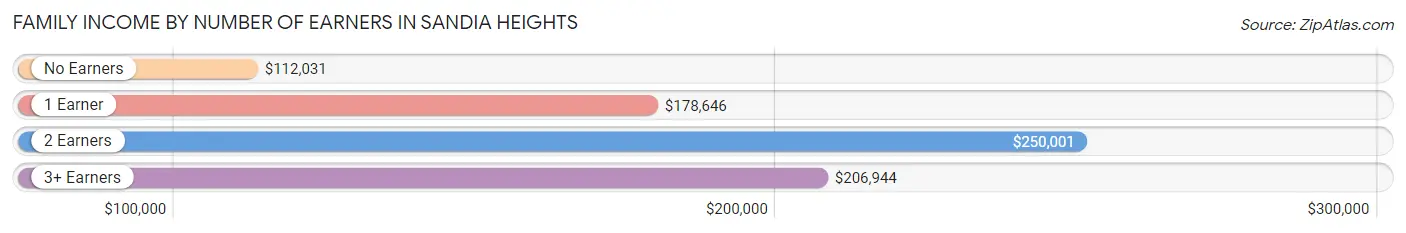
Family Income by Number of Earners in Sandia Heights
The median family income in Sandia Heights is $178,075, with families comprising 2 earners (290) having the highest median family income of $250,001, while families with no earners (471) have the lowest median family income of $112,031, accounting for 27.3% and 44.4% of families, respectively.
| Number of Earners | # Families | Median Income |
| No Earners | 471 (44.4%) | $112,031 |
| 1 Earner | 262 (24.7%) | $178,646 |
| 2 Earners | 290 (27.3%) | $250,001 |
| 3+ Earners | 38 (3.6%) | $206,944 |
| Total | 1,061 (100.0%) | $178,075 |
Household Income in Sandia Heights
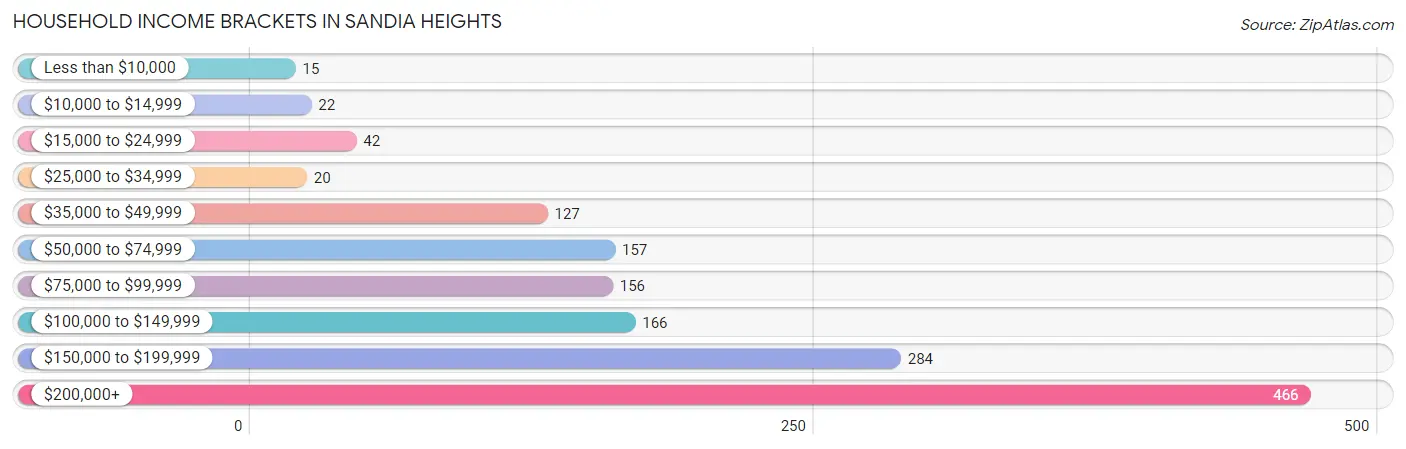
Household Income Brackets in Sandia Heights
With 466 households falling in the category, the $200,000+ income range is the most frequent in Sandia Heights, accounting for 32.0% of all households. In contrast, only 15 households (1.0%) fall into the less than $10,000 income bracket, making it the least populous group.
| Income Bracket | # Households | % Households |
| Less than $10,000 | 15 | 1.0% |
| $10,000 to $14,999 | 22 | 1.5% |
| $15,000 to $24,999 | 42 | 2.9% |
| $25,000 to $34,999 | 20 | 1.4% |
| $35,000 to $49,999 | 127 | 8.7% |
| $50,000 to $74,999 | 157 | 10.8% |
| $75,000 to $99,999 | 156 | 10.7% |
| $100,000 to $149,999 | 166 | 11.4% |
| $150,000 to $199,999 | 284 | 19.5% |
| $200,000+ | 466 | 32.0% |
Household Income by Householder Age in Sandia Heights
The median household income in Sandia Heights is $151,991, with the highest median household income of $179,388 found in the 45 to 64 years age bracket for the primary householder. A total of 352 households (24.2%) fall into this category.
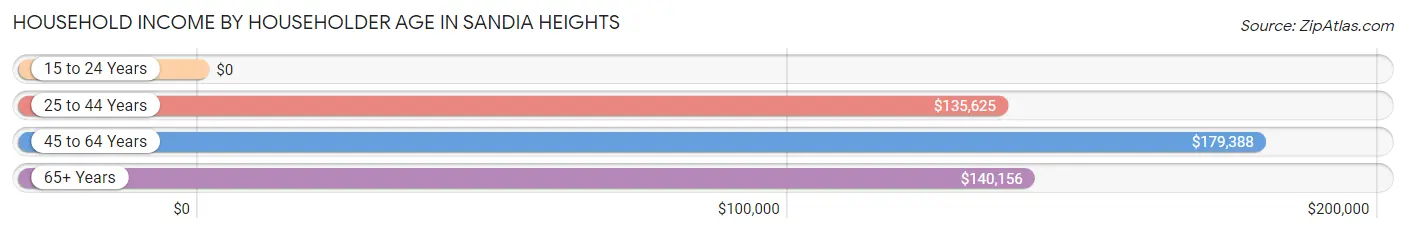
| Income Bracket | # Households | Median Income |
| 15 to 24 Years | 0 (0.0%) | $0 |
| 25 to 44 Years | 278 (19.1%) | $135,625 |
| 45 to 64 Years | 352 (24.2%) | $179,388 |
| 65+ Years | 825 (56.7%) | $140,156 |
| Total | 1,455 (100.0%) | $151,991 |
Poverty in Sandia Heights
Income Below Poverty by Sex and Age in Sandia Heights
With 4.0% poverty level for males and 3.0% for females among the residents of Sandia Heights, 65 to 74 year old males and 25 to 34 year old females are the most vulnerable to poverty, with 42 males (9.6%) and 9 females (12.3%) in their respective age groups living below the poverty level.
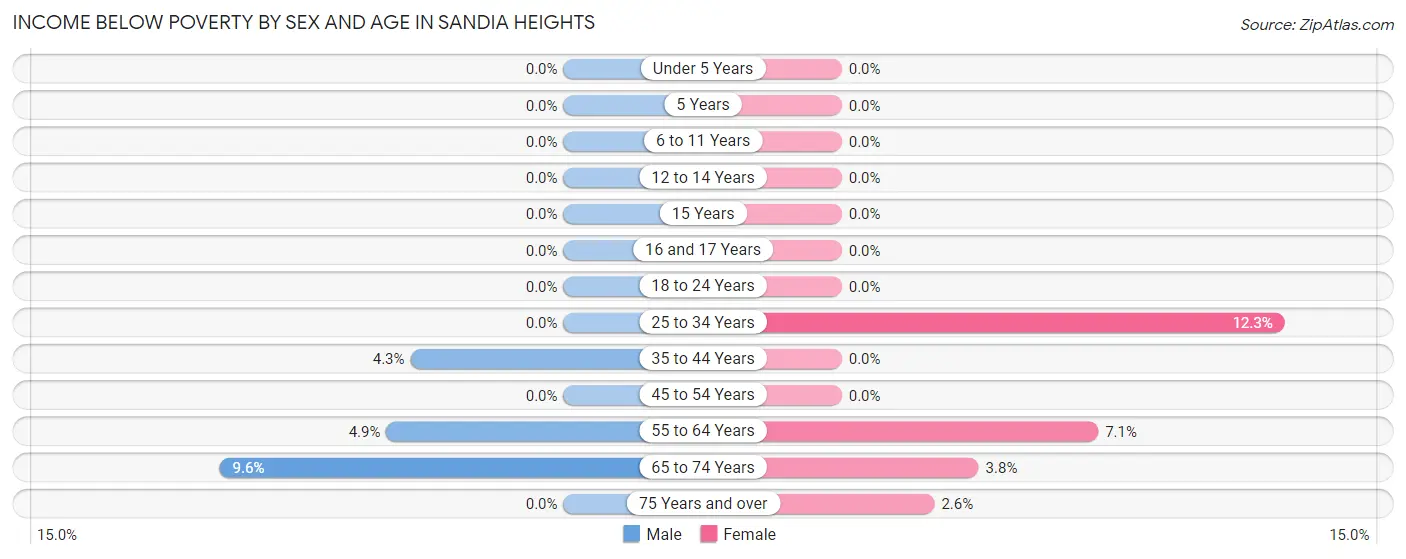
| Age Bracket | Male | Female |
| Under 5 Years | 0 (0.0%) | 0 (0.0%) |
| 5 Years | 0 (0.0%) | 0 (0.0%) |
| 6 to 11 Years | 0 (0.0%) | 0 (0.0%) |
| 12 to 14 Years | 0 (0.0%) | 0 (0.0%) |
| 15 Years | 0 (0.0%) | 0 (0.0%) |
| 16 and 17 Years | 0 (0.0%) | 0 (0.0%) |
| 18 to 24 Years | 0 (0.0%) | 0 (0.0%) |
| 25 to 34 Years | 0 (0.0%) | 9 (12.3%) |
| 35 to 44 Years | 11 (4.3%) | 0 (0.0%) |
| 45 to 54 Years | 0 (0.0%) | 0 (0.0%) |
| 55 to 64 Years | 10 (4.9%) | 18 (7.1%) |
| 65 to 74 Years | 42 (9.6%) | 11 (3.8%) |
| 75 Years and over | 0 (0.0%) | 11 (2.6%) |
| Total | 63 (4.0%) | 49 (3.0%) |
Income Above Poverty by Sex and Age in Sandia Heights
According to the poverty statistics in Sandia Heights, males aged under 5 years and females aged under 5 years are the age groups that are most secure financially, with 100.0% of males and 100.0% of females in these age groups living above the poverty line.
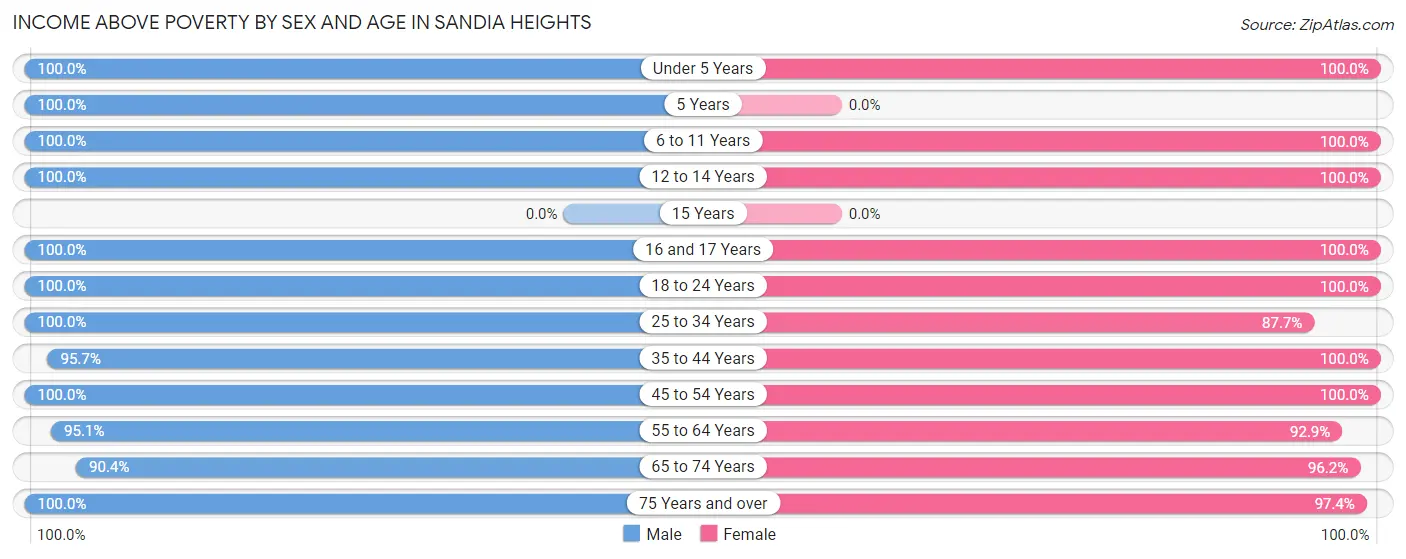
| Age Bracket | Male | Female |
| Under 5 Years | 103 (100.0%) | 59 (100.0%) |
| 5 Years | 17 (100.0%) | 0 (0.0%) |
| 6 to 11 Years | 40 (100.0%) | 92 (100.0%) |
| 12 to 14 Years | 21 (100.0%) | 30 (100.0%) |
| 15 Years | 0 (0.0%) | 0 (0.0%) |
| 16 and 17 Years | 12 (100.0%) | 21 (100.0%) |
| 18 to 24 Years | 41 (100.0%) | 32 (100.0%) |
| 25 to 34 Years | 97 (100.0%) | 64 (87.7%) |
| 35 to 44 Years | 247 (95.7%) | 168 (100.0%) |
| 45 to 54 Years | 67 (100.0%) | 179 (100.0%) |
| 55 to 64 Years | 193 (95.1%) | 234 (92.9%) |
| 65 to 74 Years | 397 (90.4%) | 278 (96.2%) |
| 75 Years and over | 271 (100.0%) | 415 (97.4%) |
| Total | 1,506 (96.0%) | 1,572 (97.0%) |
Income Below Poverty Among Married-Couple Families in Sandia Heights
The poverty statistics for married-couple families in Sandia Heights show that 0.9% or 9 of the total 1,000 families live below the poverty line. Families with no children have the highest poverty rate of 1.1%, comprising of 9 families. On the other hand, families with 1 or 2 children have the lowest poverty rate of 0.0%, which includes 0 families.
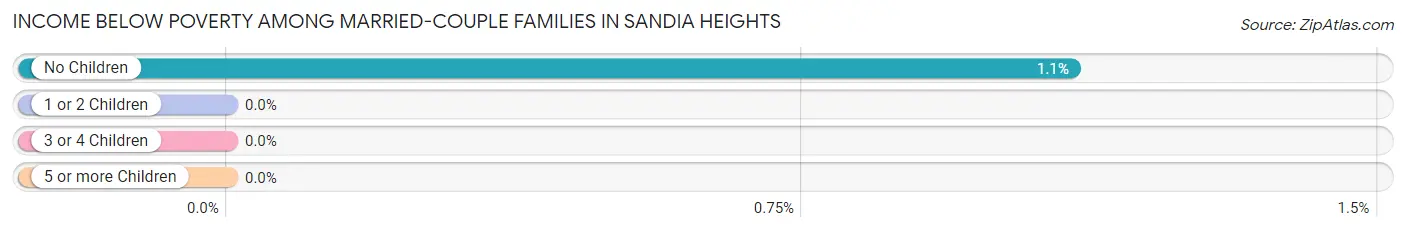
| Children | Above Poverty | Below Poverty |
| No Children | 806 (98.9%) | 9 (1.1%) |
| 1 or 2 Children | 164 (100.0%) | 0 (0.0%) |
| 3 or 4 Children | 21 (100.0%) | 0 (0.0%) |
| 5 or more Children | 0 (0.0%) | 0 (0.0%) |
| Total | 991 (99.1%) | 9 (0.9%) |
Income Below Poverty Among Single-Parent Households in Sandia Heights
| Children | Single Father | Single Mother |
| No Children | 0 (0.0%) | 0 (0.0%) |
| 1 or 2 Children | 0 (0.0%) | 0 (0.0%) |
| 3 or 4 Children | 0 (0.0%) | 0 (0.0%) |
| 5 or more Children | 0 (0.0%) | 0 (0.0%) |
| Total | 0 (0.0%) | 0 (0.0%) |
Income Below Poverty Among Married-Couple vs Single-Parent Households in Sandia Heights
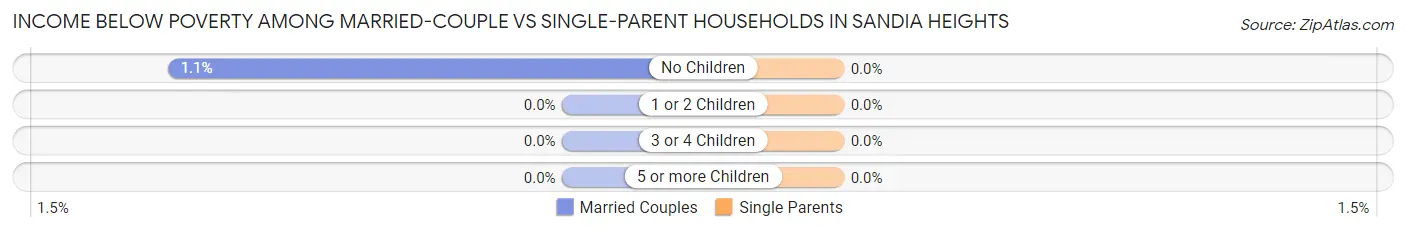
| Children | Married-Couple Families | Single-Parent Households |
| No Children | 9 (1.1%) | 0 (0.0%) |
| 1 or 2 Children | 0 (0.0%) | 0 (0.0%) |
| 3 or 4 Children | 0 (0.0%) | 0 (0.0%) |
| 5 or more Children | 0 (0.0%) | 0 (0.0%) |
| Total | 9 (0.9%) | 0 (0.0%) |
Race in Sandia Heights
The most populous races in Sandia Heights are White / Caucasian (2,459 | 76.7%), Hispanic or Latino (427 | 13.3%), and Two or more Races (308 | 9.6%).
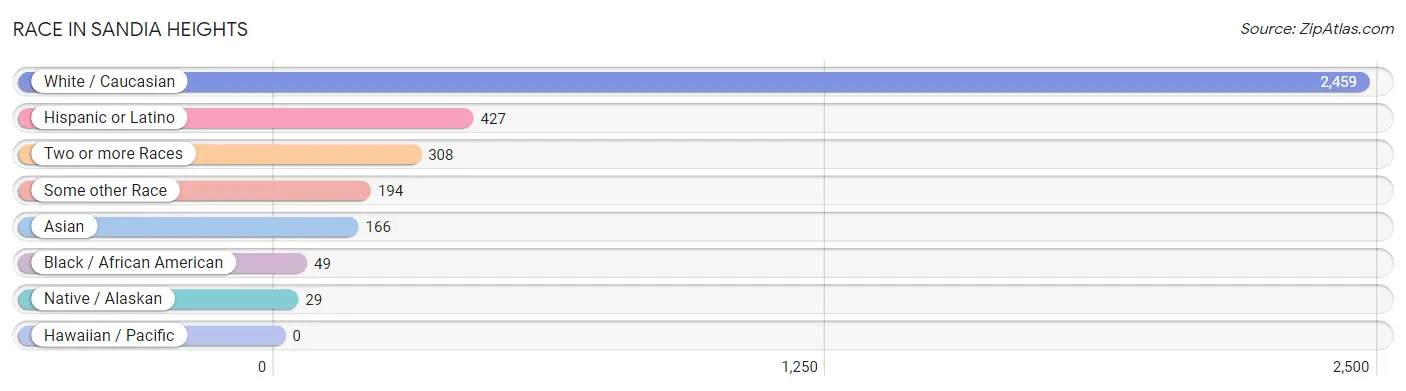
| Race | # Population | % Population |
| Asian | 166 | 5.2% |
| Black / African American | 49 | 1.5% |
| Hawaiian / Pacific | 0 | 0.0% |
| Hispanic or Latino | 427 | 13.3% |
| Native / Alaskan | 29 | 0.9% |
| White / Caucasian | 2,459 | 76.7% |
| Two or more Races | 308 | 9.6% |
| Some other Race | 194 | 6.0% |
| Total | 3,205 | 100.0% |
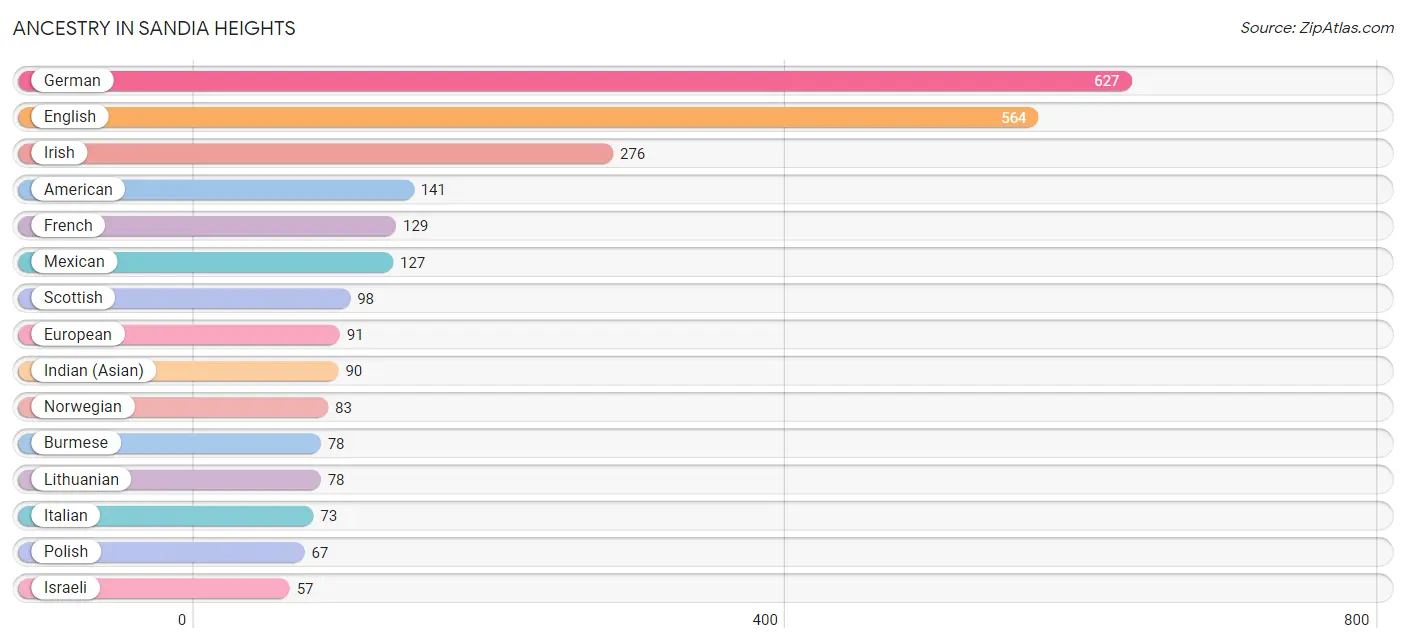
Ancestry in Sandia Heights
The most populous ancestries reported in Sandia Heights are German (627 | 19.6%), English (564 | 17.6%), Irish (276 | 8.6%), American (141 | 4.4%), and French (129 | 4.0%), together accounting for 54.2% of all Sandia Heights residents.
| Ancestry | # Population | % Population |
| American | 141 | 4.4% |
| Apache | 9 | 0.3% |
| Arab | 20 | 0.6% |
| Austrian | 32 | 1.0% |
| Basque | 32 | 1.0% |
| Belgian | 9 | 0.3% |
| Bhutanese | 11 | 0.3% |
| Blackfeet | 10 | 0.3% |
| Brazilian | 14 | 0.4% |
| Burmese | 78 | 2.4% |
| Central American | 39 | 1.2% |
| Chippewa | 10 | 0.3% |
| Costa Rican | 20 | 0.6% |
| Cuban | 9 | 0.3% |
| Czech | 7 | 0.2% |
| Danish | 34 | 1.1% |
| Dutch | 49 | 1.5% |
| Eastern European | 28 | 0.9% |
| English | 564 | 17.6% |
| European | 91 | 2.8% |
| French | 129 | 4.0% |
| French Canadian | 3 | 0.1% |
| German | 627 | 19.6% |
| Guatemalan | 19 | 0.6% |
| Hungarian | 11 | 0.3% |
| Indian (Asian) | 90 | 2.8% |
| Irish | 276 | 8.6% |
| Israeli | 57 | 1.8% |
| Italian | 73 | 2.3% |
| Korean | 19 | 0.6% |
| Laotian | 7 | 0.2% |
| Latvian | 6 | 0.2% |
| Lebanese | 20 | 0.6% |
| Lithuanian | 78 | 2.4% |
| Mexican | 127 | 4.0% |
| Northern European | 56 | 1.8% |
| Norwegian | 83 | 2.6% |
| Pakistani | 6 | 0.2% |
| Polish | 67 | 2.1% |
| Portuguese | 9 | 0.3% |
| Puerto Rican | 11 | 0.3% |
| Russian | 10 | 0.3% |
| Scandinavian | 9 | 0.3% |
| Scotch-Irish | 47 | 1.5% |
| Scottish | 98 | 3.1% |
| Slovak | 17 | 0.5% |
| Spaniard | 29 | 0.9% |
| Spanish | 45 | 1.4% |
| Swedish | 37 | 1.1% |
| Swiss | 50 | 1.6% |
| Ukrainian | 53 | 1.7% |
| Welsh | 19 | 0.6% | View All 52 Rows |
Immigrants in Sandia Heights
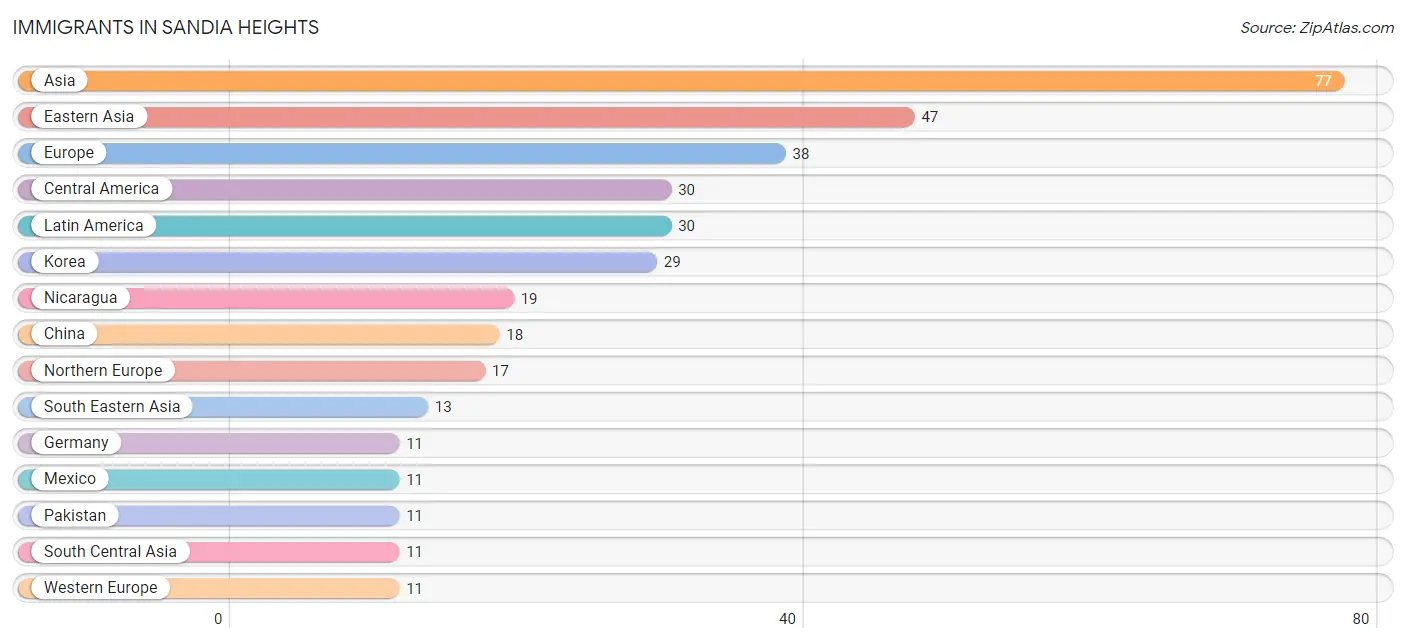
The most numerous immigrant groups reported in Sandia Heights came from Asia (77 | 2.4%), Eastern Asia (47 | 1.5%), Europe (38 | 1.2%), Central America (30 | 0.9%), and Latin America (30 | 0.9%), together accounting for 6.9% of all Sandia Heights residents.
| Immigration Origin | # Population | % Population |
| Asia | 77 | 2.4% |
| Canada | 6 | 0.2% |
| Central America | 30 | 0.9% |
| China | 18 | 0.6% |
| Czechoslovakia | 10 | 0.3% |
| Eastern Asia | 47 | 1.5% |
| Eastern Europe | 10 | 0.3% |
| England | 8 | 0.3% |
| Europe | 38 | 1.2% |
| Germany | 11 | 0.3% |
| Indonesia | 7 | 0.2% |
| Ireland | 9 | 0.3% |
| Korea | 29 | 0.9% |
| Latin America | 30 | 0.9% |
| Lebanon | 6 | 0.2% |
| Mexico | 11 | 0.3% |
| Nicaragua | 19 | 0.6% |
| Northern Europe | 17 | 0.5% |
| Pakistan | 11 | 0.3% |
| South Central Asia | 11 | 0.3% |
| South Eastern Asia | 13 | 0.4% |
| Taiwan | 2 | 0.1% |
| Thailand | 6 | 0.2% |
| Western Asia | 6 | 0.2% |
| Western Europe | 11 | 0.3% | View All 25 Rows |
Sex and Age in Sandia Heights
Sex and Age in Sandia Heights
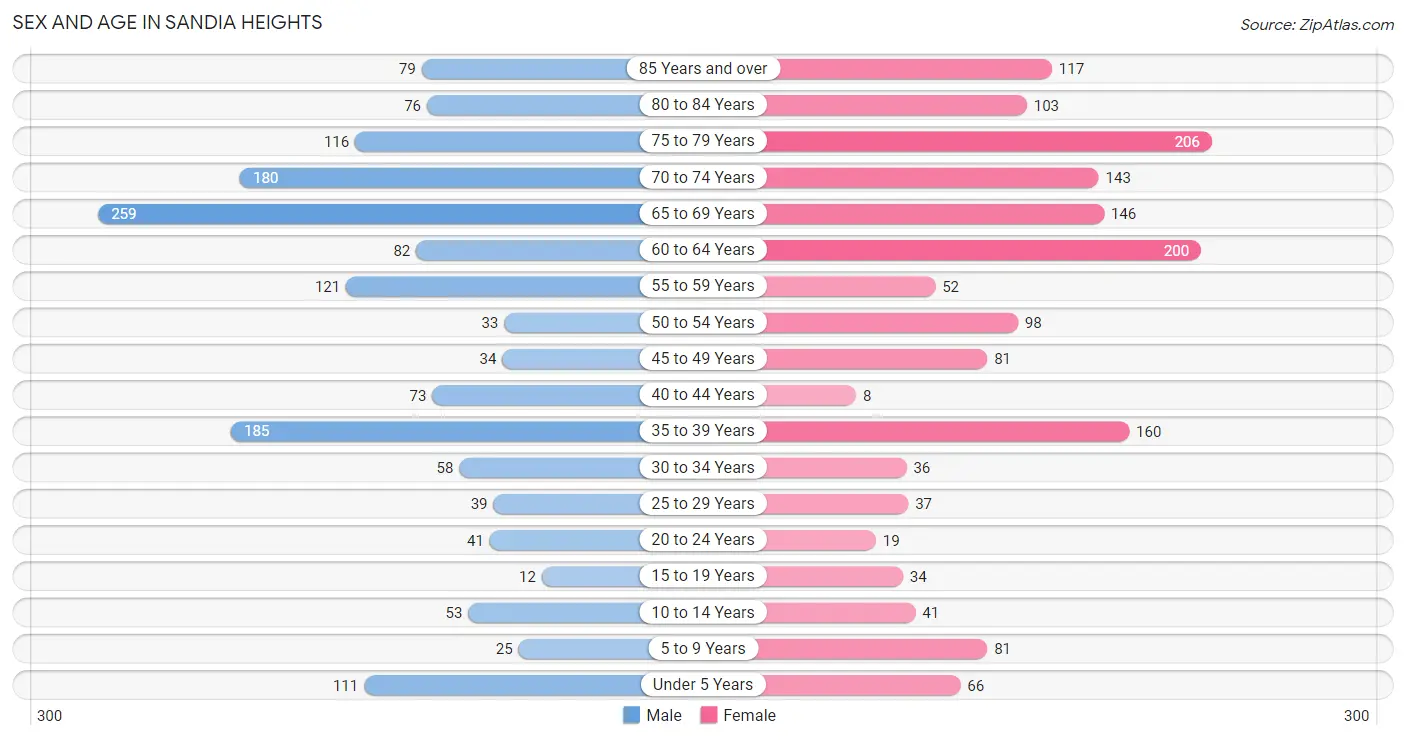
The most populous age groups in Sandia Heights are 65 to 69 Years (259 | 16.4%) for men and 75 to 79 Years (206 | 12.7%) for women.
| Age Bracket | Male | Female |
| Under 5 Years | 111 (7.0%) | 66 (4.1%) |
| 5 to 9 Years | 25 (1.6%) | 81 (5.0%) |
| 10 to 14 Years | 53 (3.4%) | 41 (2.5%) |
| 15 to 19 Years | 12 (0.8%) | 34 (2.1%) |
| 20 to 24 Years | 41 (2.6%) | 19 (1.2%) |
| 25 to 29 Years | 39 (2.5%) | 37 (2.3%) |
| 30 to 34 Years | 58 (3.7%) | 36 (2.2%) |
| 35 to 39 Years | 185 (11.7%) | 160 (9.8%) |
| 40 to 44 Years | 73 (4.6%) | 8 (0.5%) |
| 45 to 49 Years | 34 (2.2%) | 81 (5.0%) |
| 50 to 54 Years | 33 (2.1%) | 98 (6.0%) |
| 55 to 59 Years | 121 (7.7%) | 52 (3.2%) |
| 60 to 64 Years | 82 (5.2%) | 200 (12.3%) |
| 65 to 69 Years | 259 (16.4%) | 146 (9.0%) |
| 70 to 74 Years | 180 (11.4%) | 143 (8.8%) |
| 75 to 79 Years | 116 (7.4%) | 206 (12.7%) |
| 80 to 84 Years | 76 (4.8%) | 103 (6.3%) |
| 85 Years and over | 79 (5.0%) | 117 (7.2%) |
| Total | 1,577 (100.0%) | 1,628 (100.0%) |
Families and Households in Sandia Heights
Median Family Size in Sandia Heights
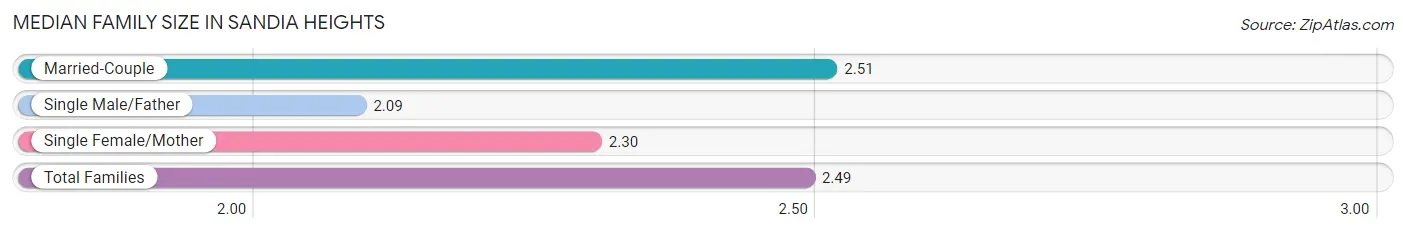
The median family size in Sandia Heights is 2.49 persons per family, with married-couple families (1,000 | 94.3%) accounting for the largest median family size of 2.51 persons per family. On the other hand, single male/father families (34 | 3.2%) represent the smallest median family size with 2.09 persons per family.
| Family Type | # Families | Family Size |
| Married-Couple | 1,000 (94.3%) | 2.51 |
| Single Male/Father | 34 (3.2%) | 2.09 |
| Single Female/Mother | 27 (2.5%) | 2.30 |
| Total Families | 1,061 (100.0%) | 2.49 |
Median Household Size in Sandia Heights
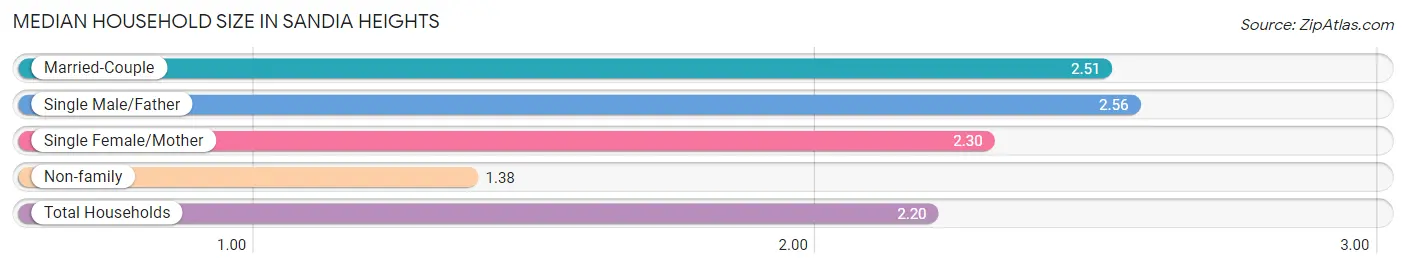
The median household size in Sandia Heights is 2.20 persons per household, with single male/father households (34 | 2.3%) accounting for the largest median household size of 2.56 persons per household. non-family households (394 | 27.1%) represent the smallest median household size with 1.38 persons per household.
| Household Type | # Households | Household Size |
| Married-Couple | 1,000 (68.7%) | 2.51 |
| Single Male/Father | 34 (2.3%) | 2.56 |
| Single Female/Mother | 27 (1.9%) | 2.30 |
| Non-family | 394 (27.1%) | 1.38 |
| Total Households | 1,455 (100.0%) | 2.20 |
Household Size by Marriage Status in Sandia Heights
Out of a total of 1,455 households in Sandia Heights, 1,061 (72.9%) are family households, while 394 (27.1%) are nonfamily households. The most numerous type of family households are 2-person households, comprising 794, and the most common type of nonfamily households are 1-person households, comprising 289.
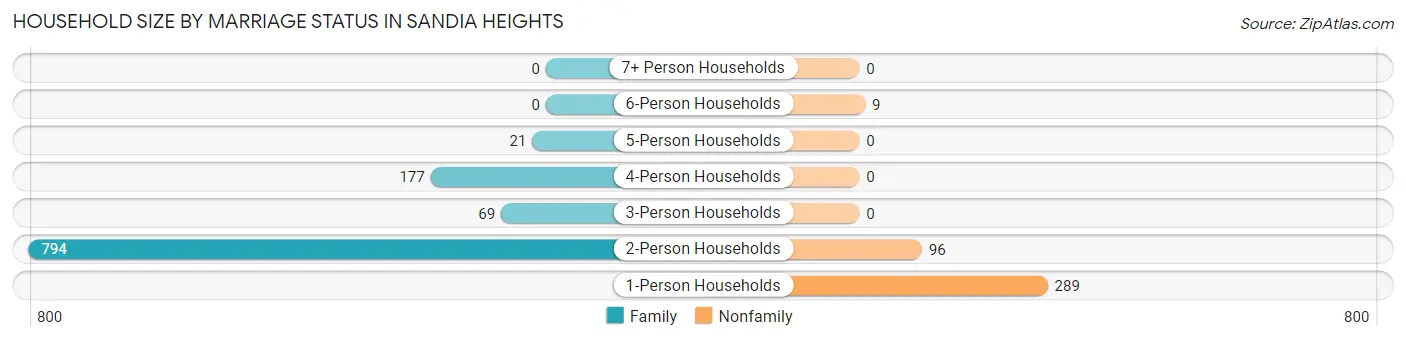
| Household Size | Family Households | Nonfamily Households |
| 1-Person Households | - | 289 (19.9%) |
| 2-Person Households | 794 (54.6%) | 96 (6.6%) |
| 3-Person Households | 69 (4.7%) | 0 (0.0%) |
| 4-Person Households | 177 (12.2%) | 0 (0.0%) |
| 5-Person Households | 21 (1.4%) | 0 (0.0%) |
| 6-Person Households | 0 (0.0%) | 9 (0.6%) |
| 7+ Person Households | 0 (0.0%) | 0 (0.0%) |
| Total | 1,061 (72.9%) | 394 (27.1%) |
Female Fertility in Sandia Heights
Fertility by Age in Sandia Heights
Average fertility rate in Sandia Heights is 63.0 births per 1,000 women. Women in the age bracket of 35 to 50 years have the highest fertility rate with 94.0 births per 1,000 women. Women in the age bracket of 35 to 50 years acount for 100.0% of all women with births.
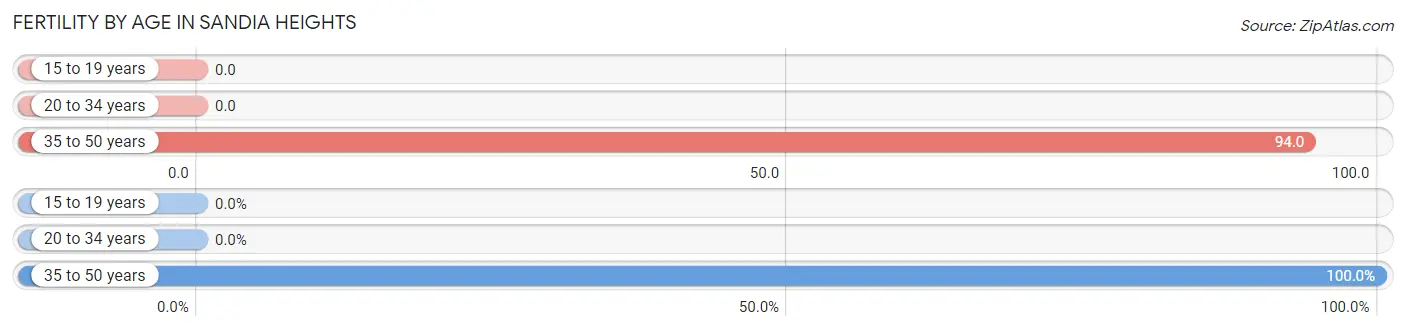
| Age Bracket | Women with Births | Births / 1,000 Women |
| 15 to 19 years | 0 (0.0%) | 0.0 |
| 20 to 34 years | 0 (0.0%) | 0.0 |
| 35 to 50 years | 24 (100.0%) | 94.0 |
| Total | 24 (100.0%) | 63.0 |
Fertility by Age by Marriage Status in Sandia Heights
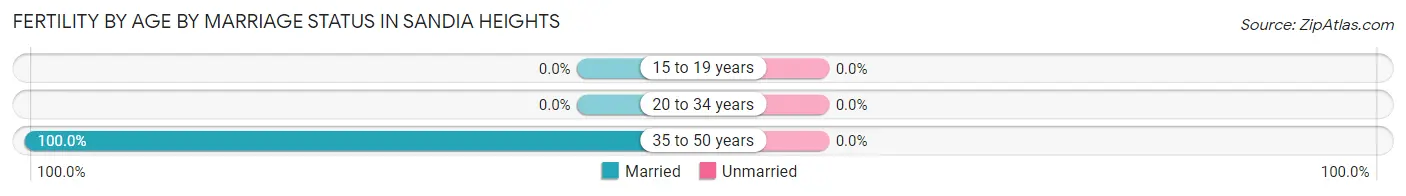
| Age Bracket | Married | Unmarried |
| 15 to 19 years | 0 (0.0%) | 0 (0.0%) |
| 20 to 34 years | 0 (0.0%) | 0 (0.0%) |
| 35 to 50 years | 24 (100.0%) | 0 (0.0%) |
| Total | 24 (100.0%) | 0 (0.0%) |
Fertility by Education in Sandia Heights
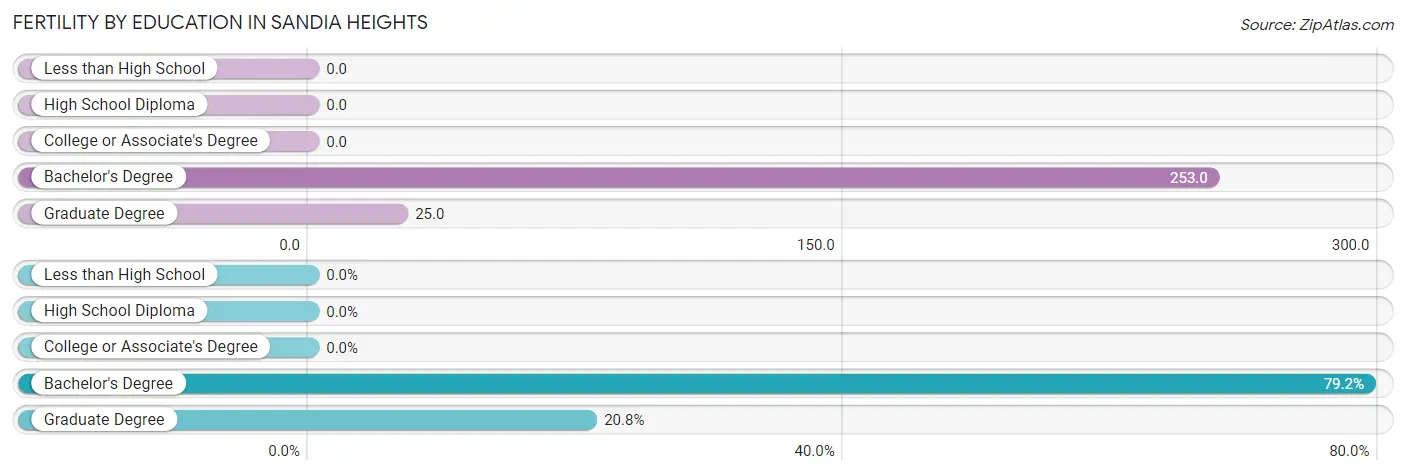
| Educational Attainment | Women with Births | Births / 1,000 Women |
| Less than High School | 0 (0.0%) | 0.0 |
| High School Diploma | 0 (0.0%) | 0.0 |
| College or Associate's Degree | 0 (0.0%) | 0.0 |
| Bachelor's Degree | 19 (79.2%) | 253.0 |
| Graduate Degree | 5 (20.8%) | 25.0 |
| Total | 24 (100.0%) | 63.0 |
Fertility by Education by Marriage Status in Sandia Heights
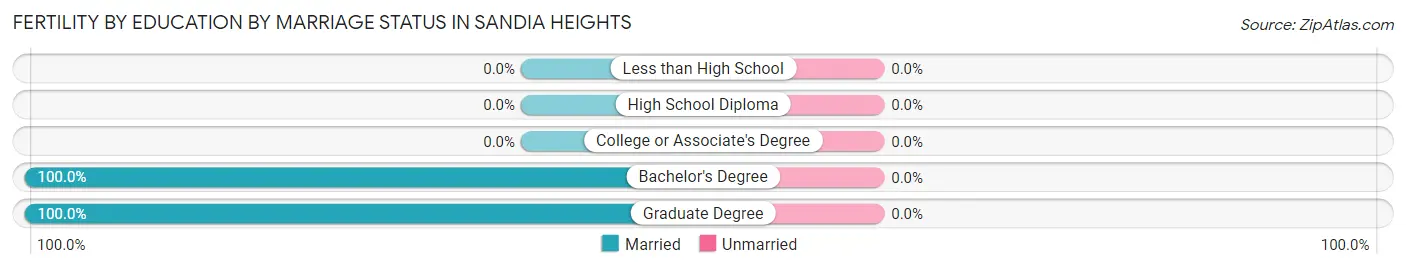
| Educational Attainment | Married | Unmarried |
| Less than High School | 0 (0.0%) | 0 (0.0%) |
| High School Diploma | 0 (0.0%) | 0 (0.0%) |
| College or Associate's Degree | 0 (0.0%) | 0 (0.0%) |
| Bachelor's Degree | 19 (100.0%) | 0 (0.0%) |
| Graduate Degree | 5 (100.0%) | 0 (0.0%) |
| Total | 24 (100.0%) | 0 (0.0%) |
Employment Characteristics in Sandia Heights
Employment by Class of Employer in Sandia Heights
Among the 1,158 employed individuals in Sandia Heights, private company employees (492 | 42.5%), not-for-profit organizations (233 | 20.1%), and federal government employees (116 | 10.0%) make up the most common classes of employment.
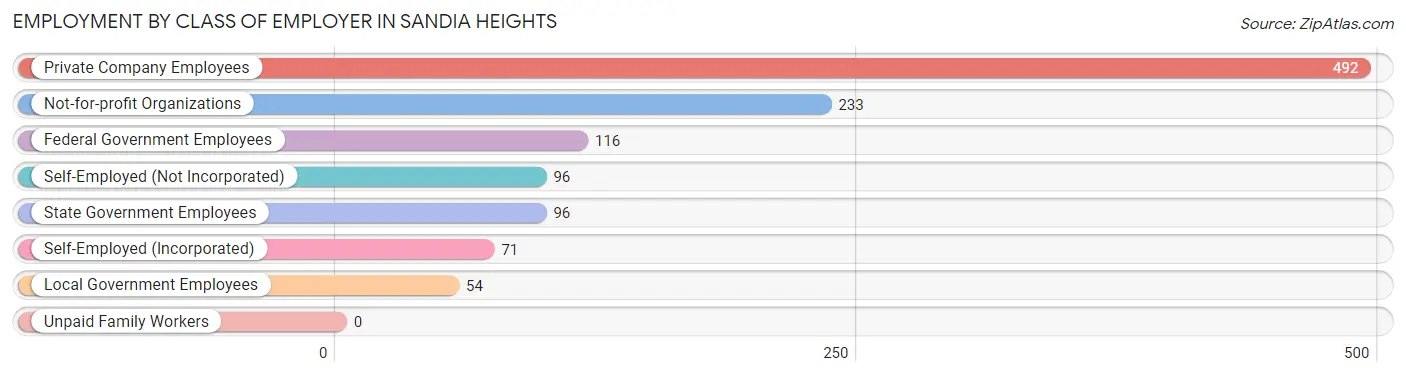
| Employer Class | # Employees | % Employees |
| Private Company Employees | 492 | 42.5% |
| Self-Employed (Incorporated) | 71 | 6.1% |
| Self-Employed (Not Incorporated) | 96 | 8.3% |
| Not-for-profit Organizations | 233 | 20.1% |
| Local Government Employees | 54 | 4.7% |
| State Government Employees | 96 | 8.3% |
| Federal Government Employees | 116 | 10.0% |
| Unpaid Family Workers | 0 | 0.0% |
| Total | 1,158 | 100.0% |
Employment Status by Age in Sandia Heights
According to the labor force statistics for Sandia Heights, out of the total population over 16 years of age (2,828), 41.9% or 1,185 individuals are in the labor force, with 1.7% or 20 of them unemployed. The age group with the highest labor force participation rate is 25 to 29 years, with 100.0% or 76 individuals in the labor force. Within the labor force, the 55 to 59 years age range has the highest percentage of unemployed individuals, with 5.7% or 6 of them being unemployed.
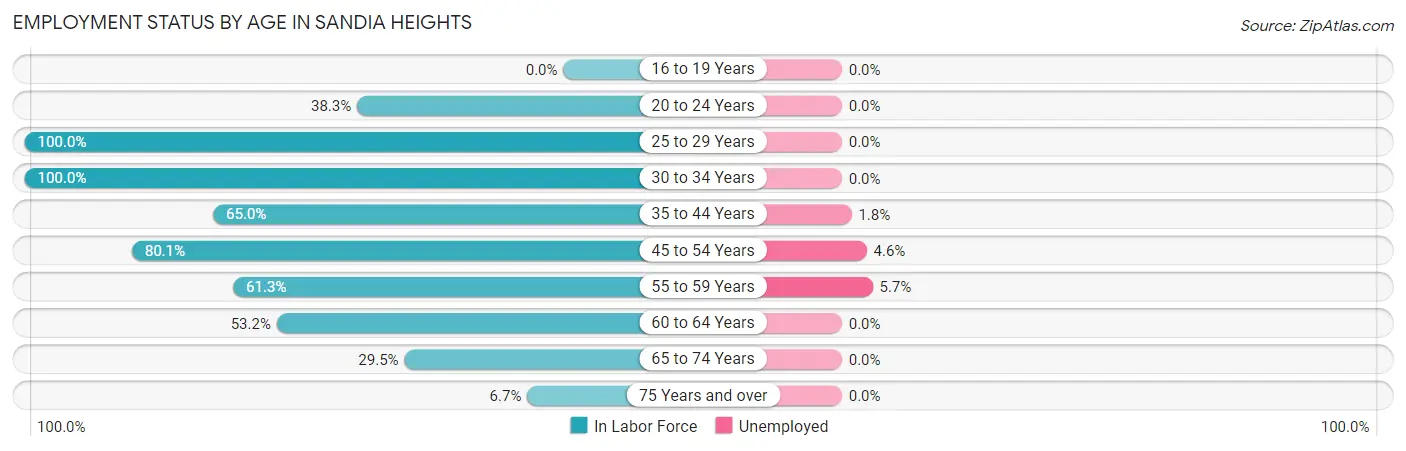
| Age Bracket | In Labor Force | Unemployed |
| 16 to 19 Years | 0 (0.0%) | 0 (0.0%) |
| 20 to 24 Years | 23 (38.3%) | 0 (0.0%) |
| 25 to 29 Years | 76 (100.0%) | 0 (0.0%) |
| 30 to 34 Years | 94 (100.0%) | 0 (0.0%) |
| 35 to 44 Years | 277 (65.0%) | 5 (1.8%) |
| 45 to 54 Years | 197 (80.1%) | 9 (4.6%) |
| 55 to 59 Years | 106 (61.3%) | 6 (5.7%) |
| 60 to 64 Years | 150 (53.2%) | 0 (0.0%) |
| 65 to 74 Years | 215 (29.5%) | 0 (0.0%) |
| 75 Years and over | 47 (6.7%) | 0 (0.0%) |
| Total | 1,185 (41.9%) | 20 (1.7%) |
Employment Status by Educational Attainment in Sandia Heights
According to labor force statistics for Sandia Heights, 69.4% of individuals (900) out of the total population between 25 and 64 years of age (1,297) are in the labor force, with 2.2% or 20 of them being unemployed. The group with the highest labor force participation rate are those with the educational attainment of high school diploma, with 94.9% or 37 individuals in the labor force. Within the labor force, individuals with college / associate degree education have the highest percentage of unemployment, with 5.5% or 6 of them being unemployed.
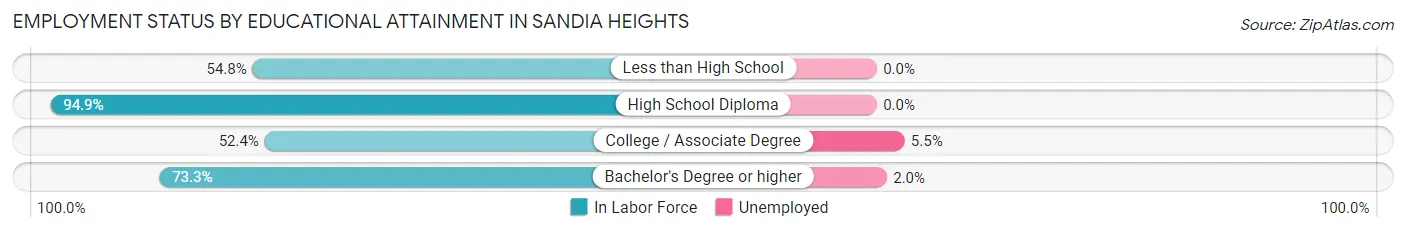
| Educational Attainment | In Labor Force | Unemployed |
| Less than High School | 46 (54.8%) | 0 (0.0%) |
| High School Diploma | 37 (94.9%) | 0 (0.0%) |
| College / Associate Degree | 110 (52.4%) | 12 (5.5%) |
| Bachelor's Degree or higher | 707 (73.3%) | 19 (2.0%) |
| Total | 900 (69.4%) | 29 (2.2%) |
Employment Occupations by Sex in Sandia Heights
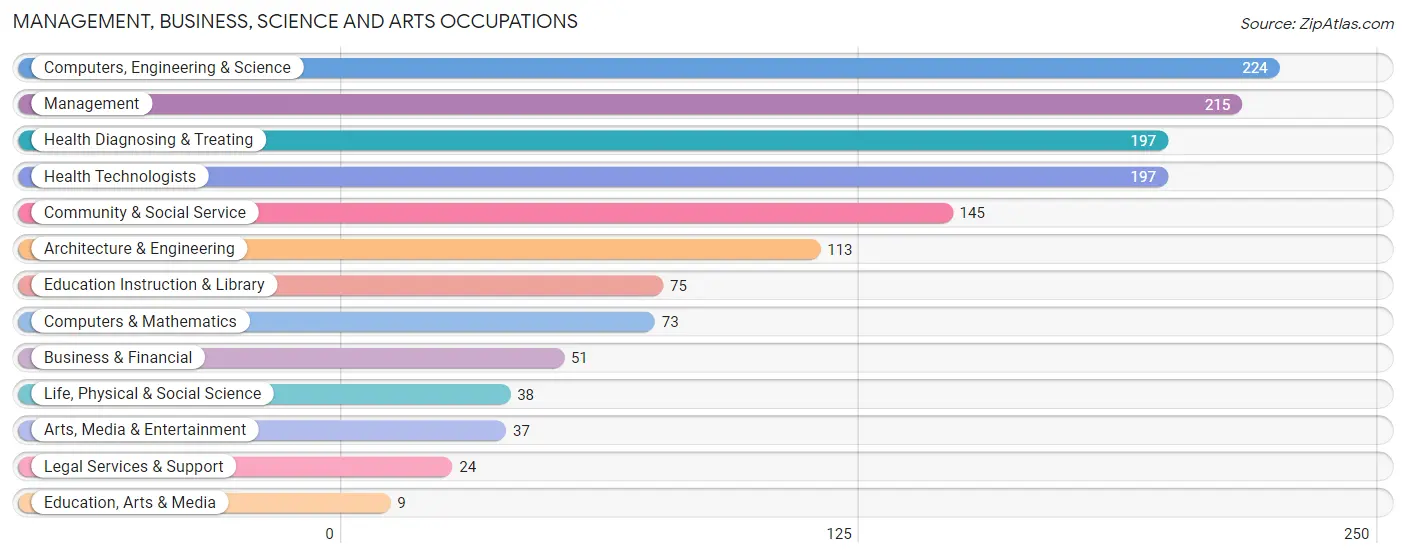
Management, Business, Science and Arts Occupations
The most common Management, Business, Science and Arts occupations in Sandia Heights are Computers, Engineering & Science (224 | 19.2%), Management (215 | 18.4%), Health Diagnosing & Treating (197 | 16.9%), Health Technologists (197 | 16.9%), and Community & Social Service (145 | 12.4%).
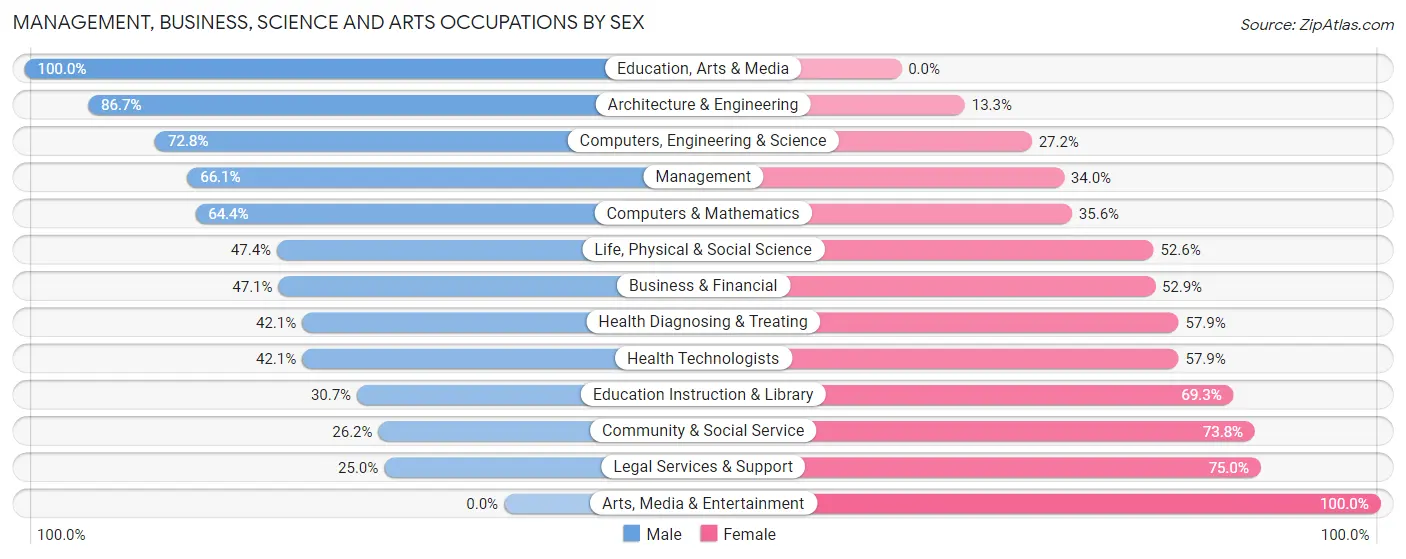
Management, Business, Science and Arts Occupations by Sex
Within the Management, Business, Science and Arts occupations in Sandia Heights, the most male-oriented occupations are Education, Arts & Media (100.0%), Architecture & Engineering (86.7%), and Computers, Engineering & Science (72.8%), while the most female-oriented occupations are Arts, Media & Entertainment (100.0%), Legal Services & Support (75.0%), and Community & Social Service (73.8%).
| Occupation | Male | Female |
| Management | 142 (66.0%) | 73 (34.0%) |
| Business & Financial | 24 (47.1%) | 27 (52.9%) |
| Computers, Engineering & Science | 163 (72.8%) | 61 (27.2%) |
| Computers & Mathematics | 47 (64.4%) | 26 (35.6%) |
| Architecture & Engineering | 98 (86.7%) | 15 (13.3%) |
| Life, Physical & Social Science | 18 (47.4%) | 20 (52.6%) |
| Community & Social Service | 38 (26.2%) | 107 (73.8%) |
| Education, Arts & Media | 9 (100.0%) | 0 (0.0%) |
| Legal Services & Support | 6 (25.0%) | 18 (75.0%) |
| Education Instruction & Library | 23 (30.7%) | 52 (69.3%) |
| Arts, Media & Entertainment | 0 (0.0%) | 37 (100.0%) |
| Health Diagnosing & Treating | 83 (42.1%) | 114 (57.9%) |
| Health Technologists | 83 (42.1%) | 114 (57.9%) |
| Total (Category) | 450 (54.1%) | 382 (45.9%) |
| Total (Overall) | 643 (55.2%) | 522 (44.8%) |
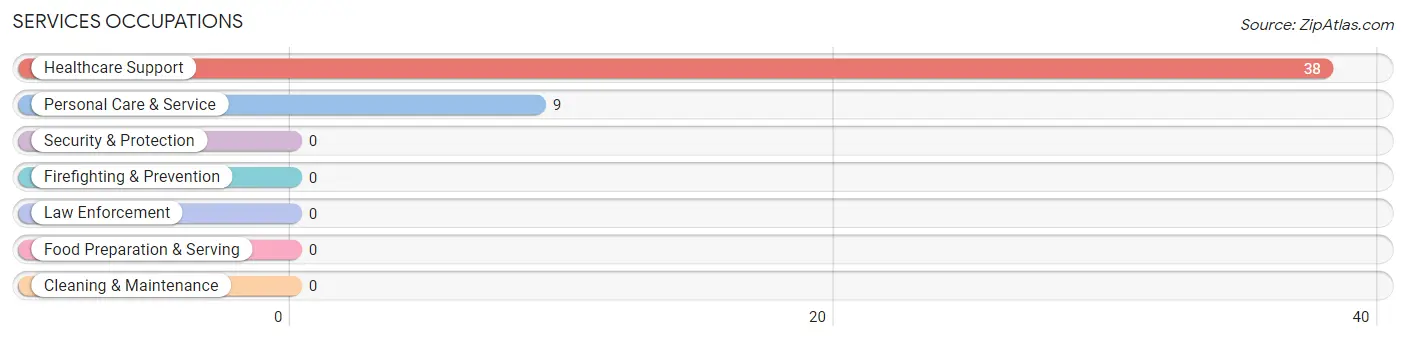
Services Occupations
The most common Services occupations in Sandia Heights are Healthcare Support (38 | 3.3%), and Personal Care & Service (9 | 0.8%).
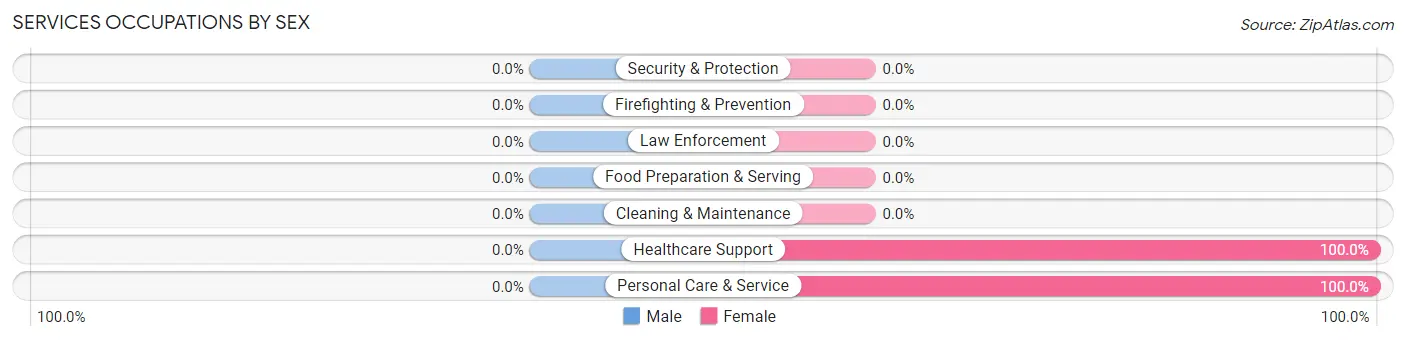
Services Occupations by Sex
| Occupation | Male | Female |
| Healthcare Support | 0 (0.0%) | 38 (100.0%) |
| Security & Protection | 0 (0.0%) | 0 (0.0%) |
| Firefighting & Prevention | 0 (0.0%) | 0 (0.0%) |
| Law Enforcement | 0 (0.0%) | 0 (0.0%) |
| Food Preparation & Serving | 0 (0.0%) | 0 (0.0%) |
| Cleaning & Maintenance | 0 (0.0%) | 0 (0.0%) |
| Personal Care & Service | 0 (0.0%) | 9 (100.0%) |
| Total (Category) | 0 (0.0%) | 47 (100.0%) |
| Total (Overall) | 643 (55.2%) | 522 (44.8%) |
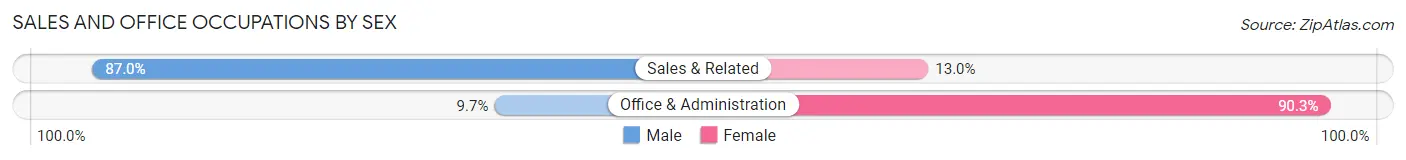
Sales and Office Occupations
The most common Sales and Office occupations in Sandia Heights are Office & Administration (93 | 8.0%), and Sales & Related (69 | 5.9%).
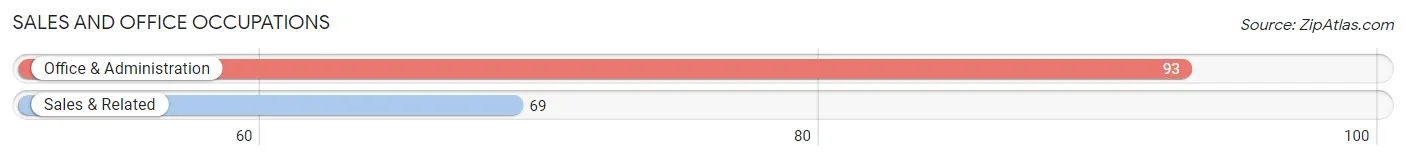
Sales and Office Occupations by Sex
| Occupation | Male | Female |
| Sales & Related | 60 (87.0%) | 9 (13.0%) |
| Office & Administration | 9 (9.7%) | 84 (90.3%) |
| Total (Category) | 69 (42.6%) | 93 (57.4%) |
| Total (Overall) | 643 (55.2%) | 522 (44.8%) |
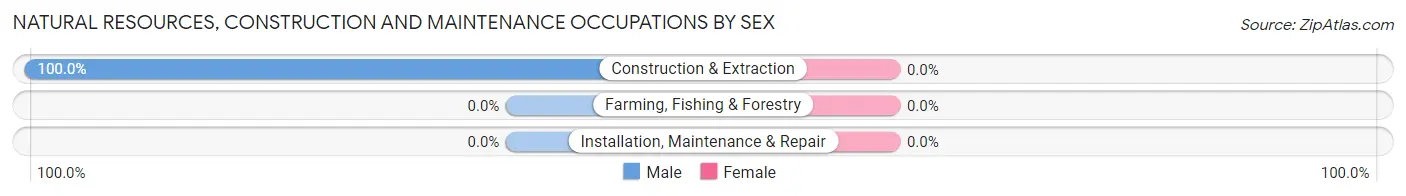
Natural Resources, Construction and Maintenance Occupations
The most common Natural Resources, Construction and Maintenance occupations in Sandia Heights are , and Construction & Extraction (50 | 4.3%).
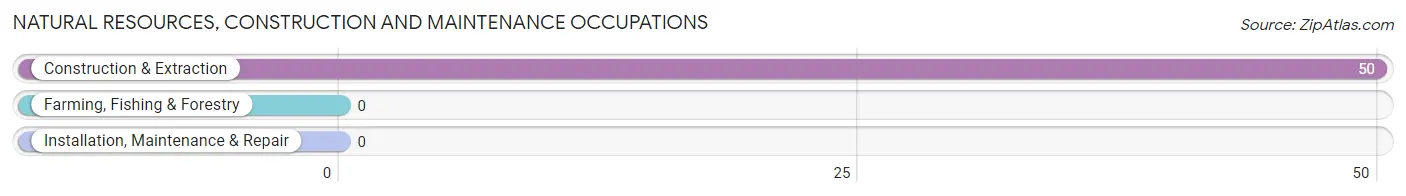
Natural Resources, Construction and Maintenance Occupations by Sex
| Occupation | Male | Female |
| Farming, Fishing & Forestry | 0 (0.0%) | 0 (0.0%) |
| Construction & Extraction | 50 (100.0%) | 0 (0.0%) |
| Installation, Maintenance & Repair | 0 (0.0%) | 0 (0.0%) |
| Total (Category) | 50 (100.0%) | 0 (0.0%) |
| Total (Overall) | 643 (55.2%) | 522 (44.8%) |
Production, Transportation and Moving Occupations
The most common Production, Transportation and Moving occupations in Sandia Heights are Material Moving (42 | 3.6%), Production (24 | 2.1%), and Transportation (8 | 0.7%).
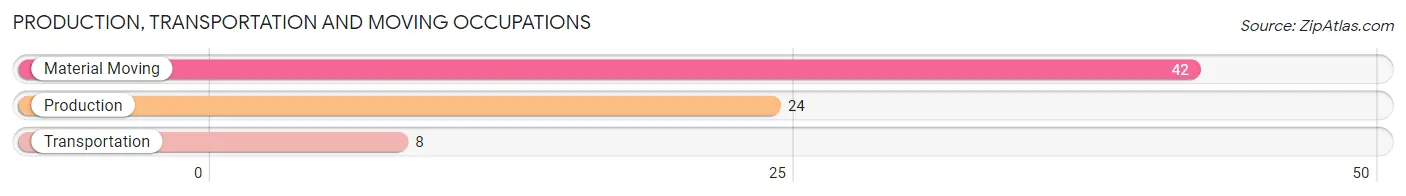
Production, Transportation and Moving Occupations by Sex
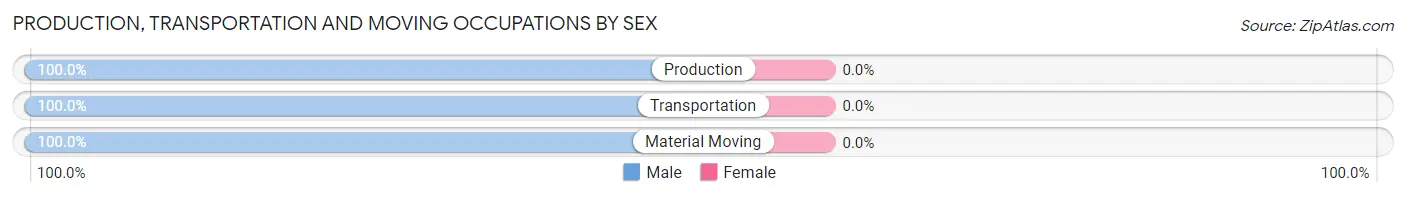
| Occupation | Male | Female |
| Production | 24 (100.0%) | 0 (0.0%) |
| Transportation | 8 (100.0%) | 0 (0.0%) |
| Material Moving | 42 (100.0%) | 0 (0.0%) |
| Total (Category) | 74 (100.0%) | 0 (0.0%) |
| Total (Overall) | 643 (55.2%) | 522 (44.8%) |
Employment Industries by Sex in Sandia Heights
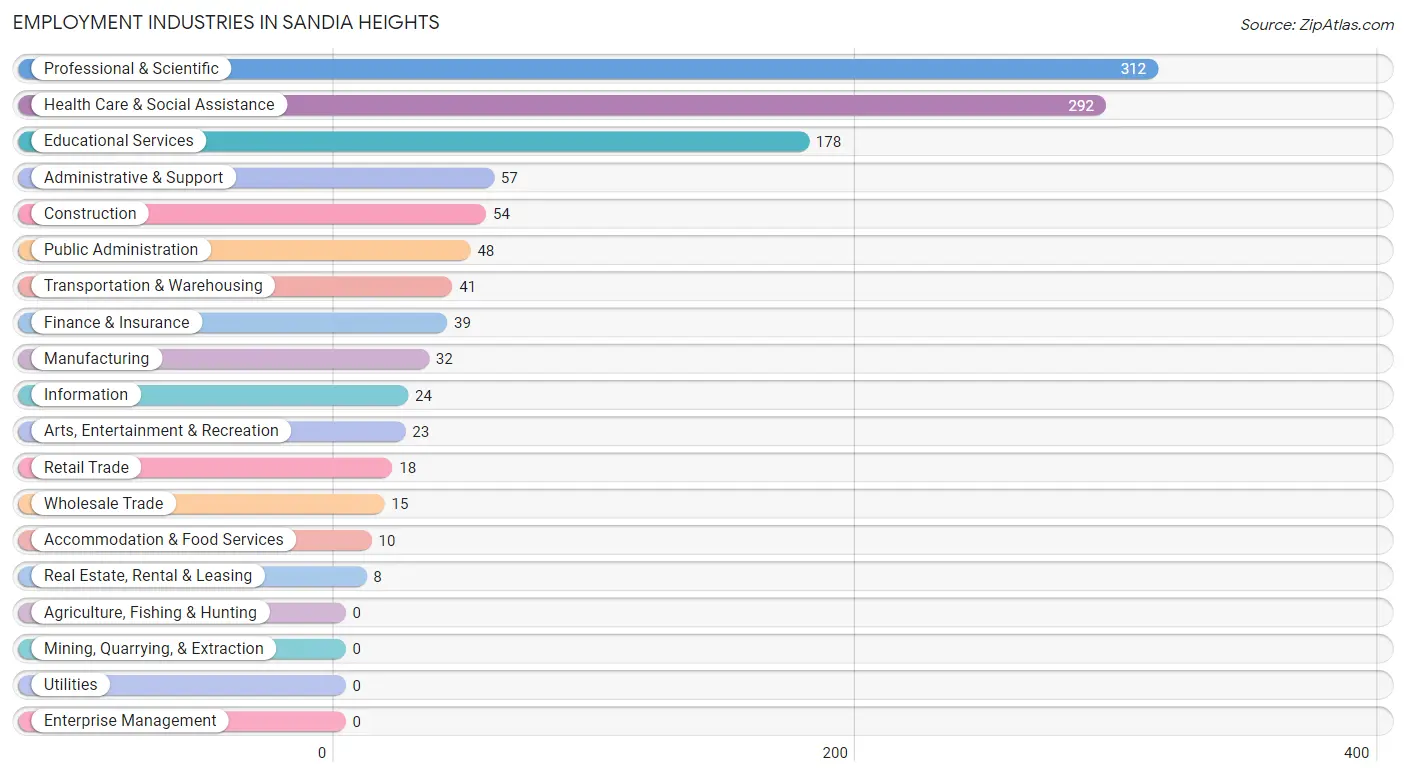
Employment Industries in Sandia Heights
The major employment industries in Sandia Heights include Professional & Scientific (312 | 26.8%), Health Care & Social Assistance (292 | 25.1%), Educational Services (178 | 15.3%), Administrative & Support (57 | 4.9%), and Construction (54 | 4.6%).
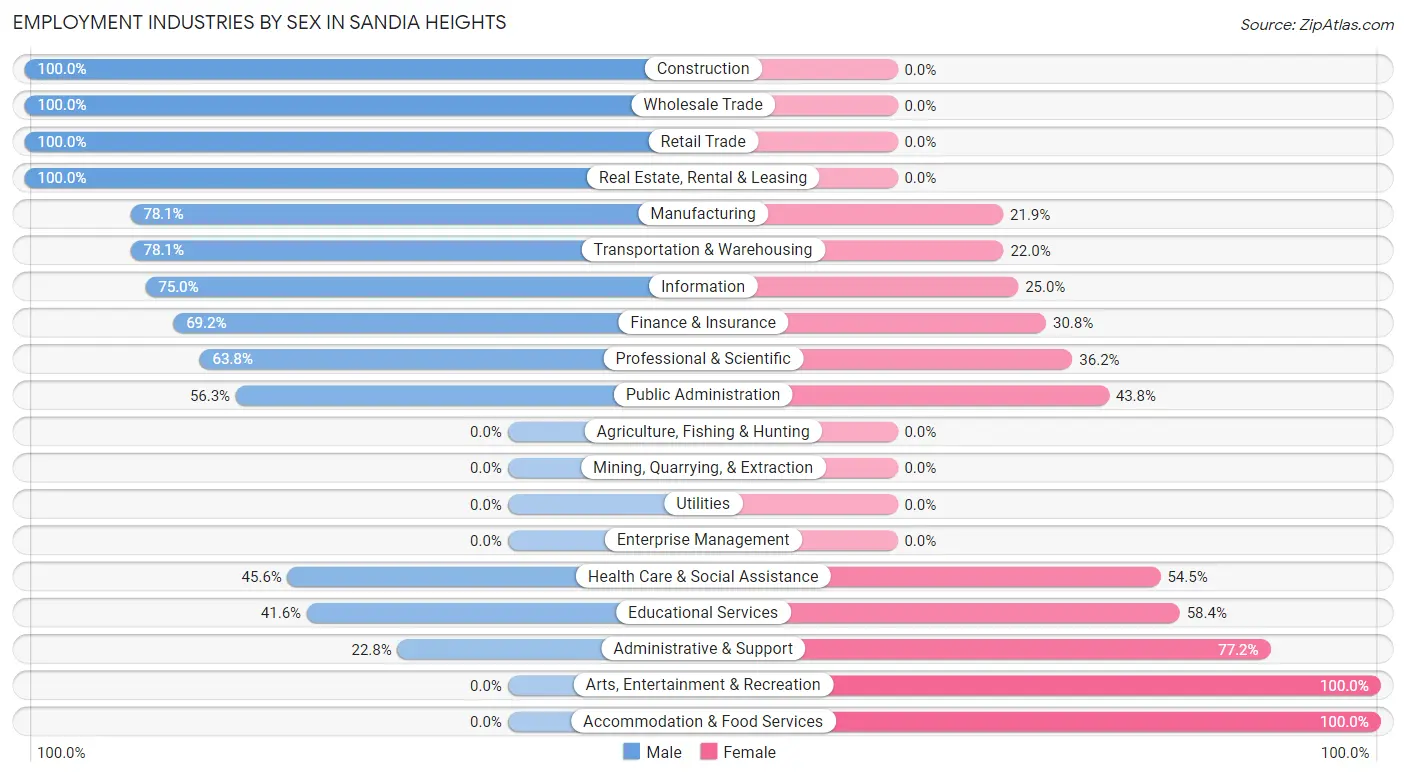
Employment Industries by Sex in Sandia Heights
The Sandia Heights industries that see more men than women are Construction (100.0%), Wholesale Trade (100.0%), and Retail Trade (100.0%), whereas the industries that tend to have a higher number of women are Arts, Entertainment & Recreation (100.0%), Accommodation & Food Services (100.0%), and Administrative & Support (77.2%).
| Industry | Male | Female |
| Agriculture, Fishing & Hunting | 0 (0.0%) | 0 (0.0%) |
| Mining, Quarrying, & Extraction | 0 (0.0%) | 0 (0.0%) |
| Construction | 54 (100.0%) | 0 (0.0%) |
| Manufacturing | 25 (78.1%) | 7 (21.9%) |
| Wholesale Trade | 15 (100.0%) | 0 (0.0%) |
| Retail Trade | 18 (100.0%) | 0 (0.0%) |
| Transportation & Warehousing | 32 (78.0%) | 9 (22.0%) |
| Utilities | 0 (0.0%) | 0 (0.0%) |
| Information | 18 (75.0%) | 6 (25.0%) |
| Finance & Insurance | 27 (69.2%) | 12 (30.8%) |
| Real Estate, Rental & Leasing | 8 (100.0%) | 0 (0.0%) |
| Professional & Scientific | 199 (63.8%) | 113 (36.2%) |
| Enterprise Management | 0 (0.0%) | 0 (0.0%) |
| Administrative & Support | 13 (22.8%) | 44 (77.2%) |
| Educational Services | 74 (41.6%) | 104 (58.4%) |
| Health Care & Social Assistance | 133 (45.6%) | 159 (54.4%) |
| Arts, Entertainment & Recreation | 0 (0.0%) | 23 (100.0%) |
| Accommodation & Food Services | 0 (0.0%) | 10 (100.0%) |
| Public Administration | 27 (56.2%) | 21 (43.8%) |
| Total | 643 (55.2%) | 522 (44.8%) |
Education in Sandia Heights
School Enrollment in Sandia Heights
The most common levels of schooling among the 444 students in Sandia Heights are college / undergraduate (111 | 25.0%), nursery / preschool (83 | 18.7%), and elementary school (74 | 16.7%).
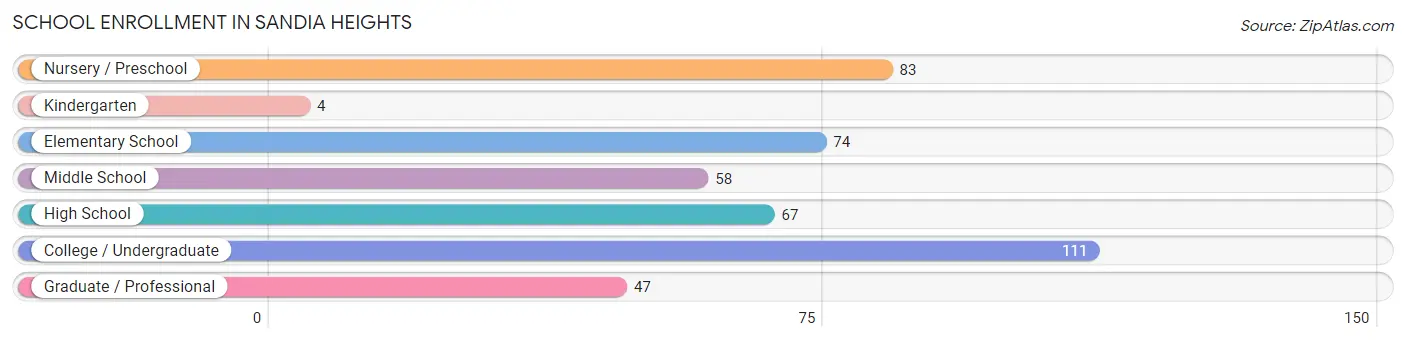
| School Level | # Students | % Students |
| Nursery / Preschool | 83 | 18.7% |
| Kindergarten | 4 | 0.9% |
| Elementary School | 74 | 16.7% |
| Middle School | 58 | 13.1% |
| High School | 67 | 15.1% |
| College / Undergraduate | 111 | 25.0% |
| Graduate / Professional | 47 | 10.6% |
| Total | 444 | 100.0% |
School Enrollment by Age by Funding Source in Sandia Heights
Out of a total of 444 students who are enrolled in schools in Sandia Heights, 154 (34.7%) attend a private institution, while the remaining 290 (65.3%) are enrolled in public schools. The age group of 18 to 19 year olds has the highest likelihood of being enrolled in private schools, with 13 (100.0% in the age bracket) enrolled. Conversely, the age group of 20 to 24 year olds has the lowest likelihood of being enrolled in a private school, with 47 (100.0% in the age bracket) attending a public institution.
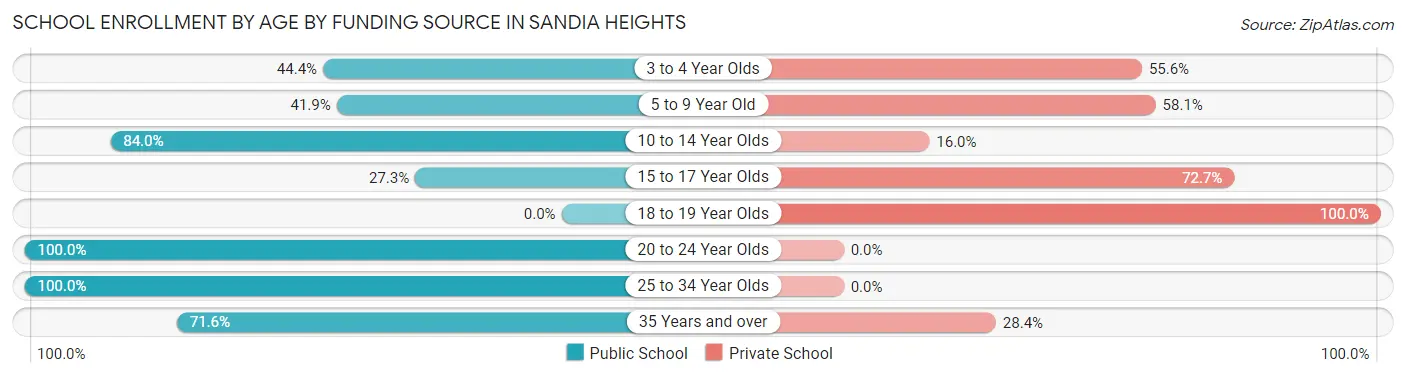
| Age Bracket | Public School | Private School |
| 3 to 4 Year Olds | 32 (44.4%) | 40 (55.6%) |
| 5 to 9 Year Old | 31 (41.9%) | 43 (58.1%) |
| 10 to 14 Year Olds | 79 (84.0%) | 15 (16.0%) |
| 15 to 17 Year Olds | 9 (27.3%) | 24 (72.7%) |
| 18 to 19 Year Olds | 0 (0.0%) | 13 (100.0%) |
| 20 to 24 Year Olds | 47 (100.0%) | 0 (0.0%) |
| 25 to 34 Year Olds | 44 (100.0%) | 0 (0.0%) |
| 35 Years and over | 48 (71.6%) | 19 (28.4%) |
| Total | 290 (65.3%) | 154 (34.7%) |
Educational Attainment by Field of Study in Sandia Heights
Bio, nature & agricultural (256 | 11.9%), engineering (253 | 11.7%), business (237 | 11.0%), education (220 | 10.2%), and social sciences (203 | 9.4%) are the most common fields of study among 2,157 individuals in Sandia Heights who have obtained a bachelor's degree or higher.
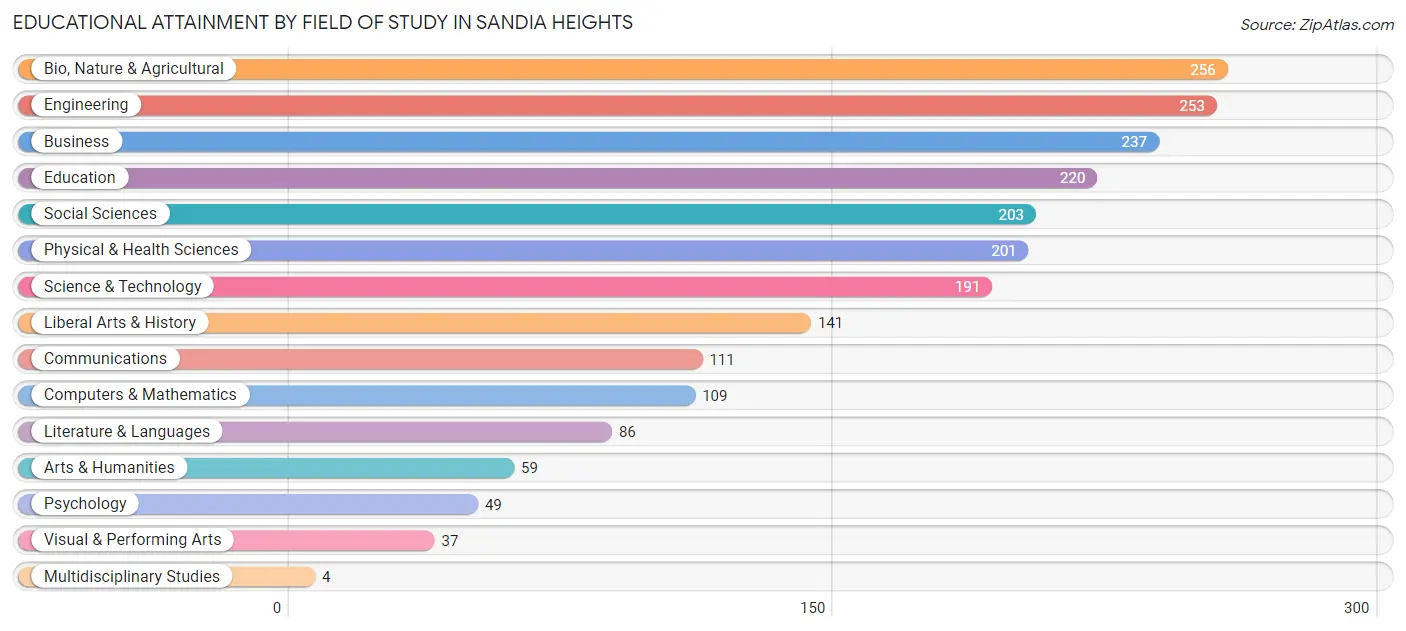
| Field of Study | # Graduates | % Graduates |
| Computers & Mathematics | 109 | 5.1% |
| Bio, Nature & Agricultural | 256 | 11.9% |
| Physical & Health Sciences | 201 | 9.3% |
| Psychology | 49 | 2.3% |
| Social Sciences | 203 | 9.4% |
| Engineering | 253 | 11.7% |
| Multidisciplinary Studies | 4 | 0.2% |
| Science & Technology | 191 | 8.8% |
| Business | 237 | 11.0% |
| Education | 220 | 10.2% |
| Literature & Languages | 86 | 4.0% |
| Liberal Arts & History | 141 | 6.5% |
| Visual & Performing Arts | 37 | 1.7% |
| Communications | 111 | 5.1% |
| Arts & Humanities | 59 | 2.7% |
| Total | 2,157 | 100.0% |
Transportation & Commute in Sandia Heights
Vehicle Availability by Sex in Sandia Heights
The most prevalent vehicle ownership categories in Sandia Heights are males with 2 vehicles (344, accounting for 53.5%) and females with 2 vehicles (301, making up 66.8%).
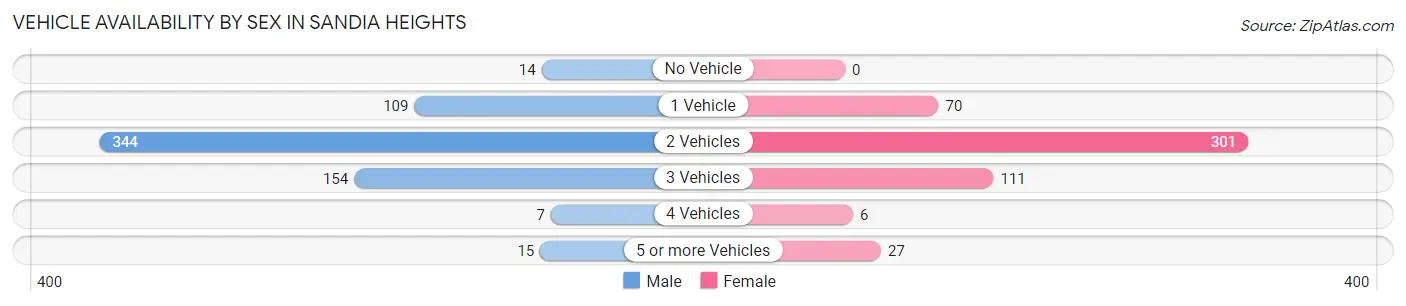
| Vehicles Available | Male | Female |
| No Vehicle | 14 (2.2%) | 0 (0.0%) |
| 1 Vehicle | 109 (17.0%) | 70 (13.6%) |
| 2 Vehicles | 344 (53.5%) | 301 (58.5%) |
| 3 Vehicles | 154 (23.9%) | 111 (21.5%) |
| 4 Vehicles | 7 (1.1%) | 6 (1.2%) |
| 5 or more Vehicles | 15 (2.3%) | 27 (5.2%) |
| Total | 643 (100.0%) | 515 (100.0%) |
Commute Time in Sandia Heights
The most frequently occuring commute durations in Sandia Heights are 20 to 24 minutes (317 commuters, 38.4%), 25 to 29 minutes (202 commuters, 24.5%), and 30 to 34 minutes (120 commuters, 14.5%).
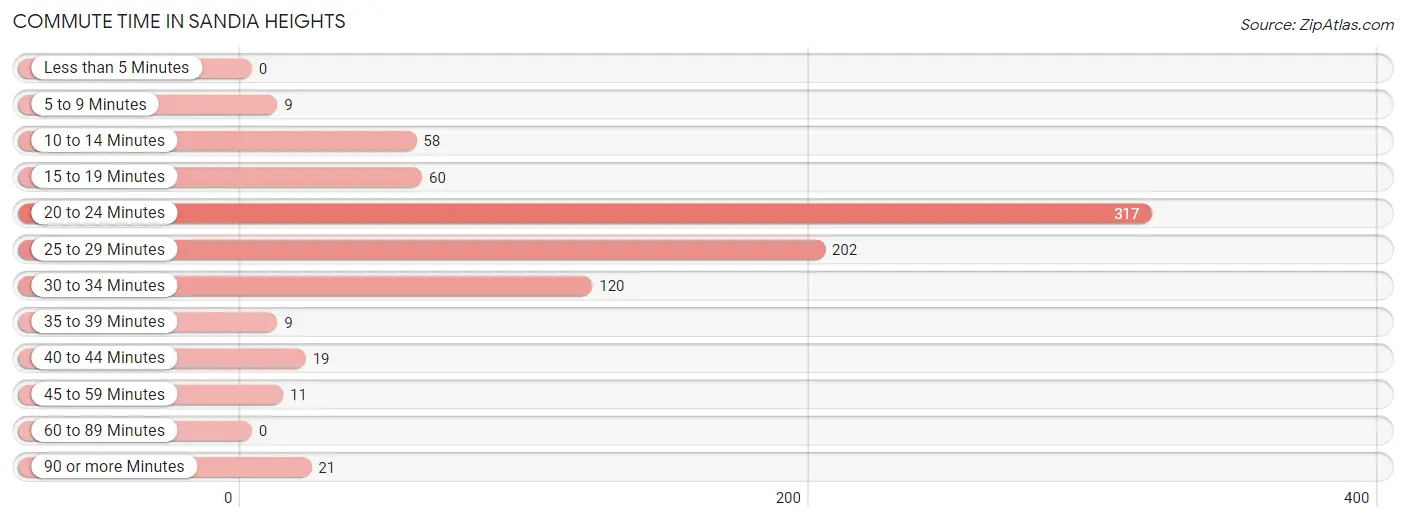
| Commute Time | # Commuters | % Commuters |
| Less than 5 Minutes | 0 | 0.0% |
| 5 to 9 Minutes | 9 | 1.1% |
| 10 to 14 Minutes | 58 | 7.0% |
| 15 to 19 Minutes | 60 | 7.3% |
| 20 to 24 Minutes | 317 | 38.4% |
| 25 to 29 Minutes | 202 | 24.5% |
| 30 to 34 Minutes | 120 | 14.5% |
| 35 to 39 Minutes | 9 | 1.1% |
| 40 to 44 Minutes | 19 | 2.3% |
| 45 to 59 Minutes | 11 | 1.3% |
| 60 to 89 Minutes | 0 | 0.0% |
| 90 or more Minutes | 21 | 2.5% |
Commute Time by Sex in Sandia Heights
The most common commute times in Sandia Heights are 20 to 24 minutes (177 commuters, 41.5%) for males and 20 to 24 minutes (140 commuters, 35.0%) for females.
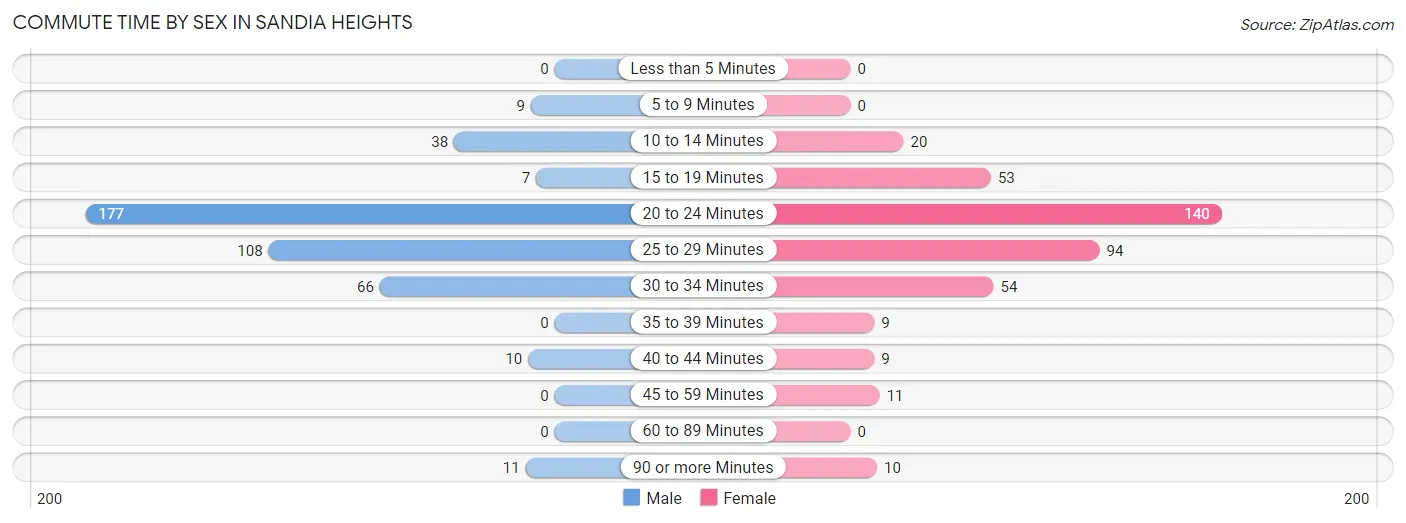
| Commute Time | Male | Female |
| Less than 5 Minutes | 0 (0.0%) | 0 (0.0%) |
| 5 to 9 Minutes | 9 (2.1%) | 0 (0.0%) |
| 10 to 14 Minutes | 38 (8.9%) | 20 (5.0%) |
| 15 to 19 Minutes | 7 (1.6%) | 53 (13.3%) |
| 20 to 24 Minutes | 177 (41.5%) | 140 (35.0%) |
| 25 to 29 Minutes | 108 (25.4%) | 94 (23.5%) |
| 30 to 34 Minutes | 66 (15.5%) | 54 (13.5%) |
| 35 to 39 Minutes | 0 (0.0%) | 9 (2.2%) |
| 40 to 44 Minutes | 10 (2.4%) | 9 (2.2%) |
| 45 to 59 Minutes | 0 (0.0%) | 11 (2.8%) |
| 60 to 89 Minutes | 0 (0.0%) | 0 (0.0%) |
| 90 or more Minutes | 11 (2.6%) | 10 (2.5%) |
Time of Departure to Work by Sex in Sandia Heights
The most frequent times of departure to work in Sandia Heights are 7:00 AM to 7:29 AM (106, 24.9%) for males and 7:00 AM to 7:29 AM (120, 30.0%) for females.
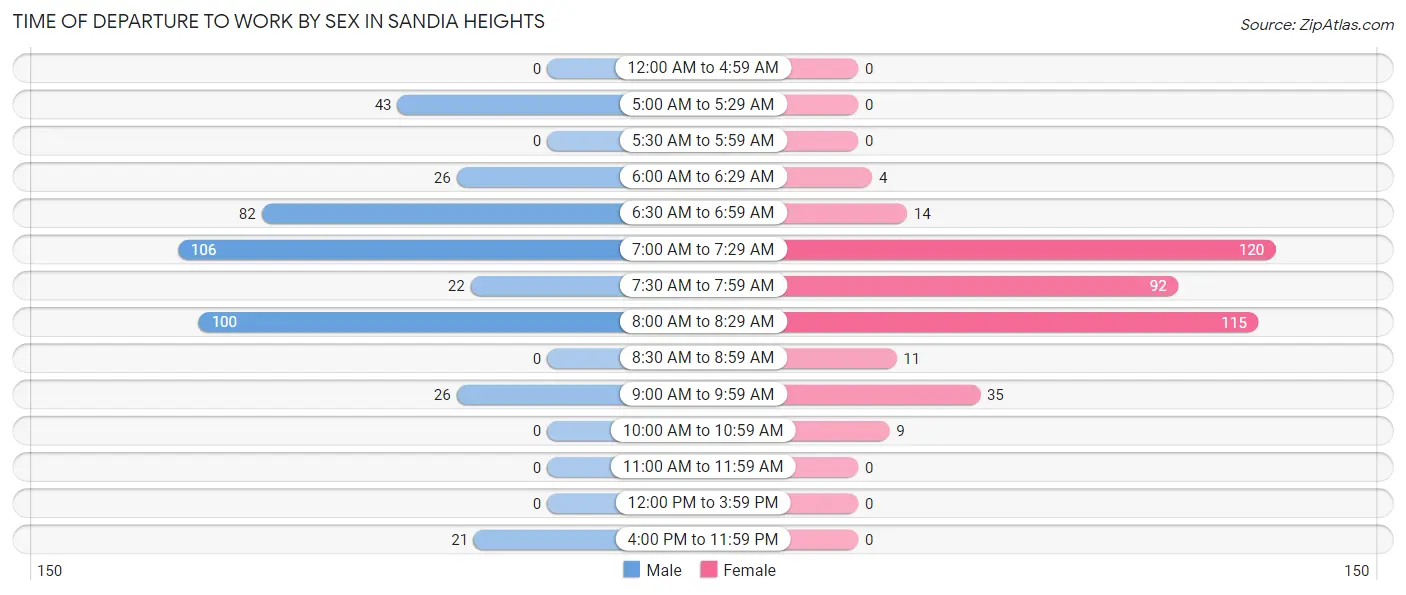
| Time of Departure | Male | Female |
| 12:00 AM to 4:59 AM | 0 (0.0%) | 0 (0.0%) |
| 5:00 AM to 5:29 AM | 43 (10.1%) | 0 (0.0%) |
| 5:30 AM to 5:59 AM | 0 (0.0%) | 0 (0.0%) |
| 6:00 AM to 6:29 AM | 26 (6.1%) | 4 (1.0%) |
| 6:30 AM to 6:59 AM | 82 (19.3%) | 14 (3.5%) |
| 7:00 AM to 7:29 AM | 106 (24.9%) | 120 (30.0%) |
| 7:30 AM to 7:59 AM | 22 (5.2%) | 92 (23.0%) |
| 8:00 AM to 8:29 AM | 100 (23.5%) | 115 (28.7%) |
| 8:30 AM to 8:59 AM | 0 (0.0%) | 11 (2.8%) |
| 9:00 AM to 9:59 AM | 26 (6.1%) | 35 (8.7%) |
| 10:00 AM to 10:59 AM | 0 (0.0%) | 9 (2.2%) |
| 11:00 AM to 11:59 AM | 0 (0.0%) | 0 (0.0%) |
| 12:00 PM to 3:59 PM | 0 (0.0%) | 0 (0.0%) |
| 4:00 PM to 11:59 PM | 21 (4.9%) | 0 (0.0%) |
| Total | 426 (100.0%) | 400 (100.0%) |
Housing Occupancy in Sandia Heights
Occupancy by Ownership in Sandia Heights
Of the total 1,455 dwellings in Sandia Heights, owner-occupied units account for 1,390 (95.5%), while renter-occupied units make up 65 (4.5%).
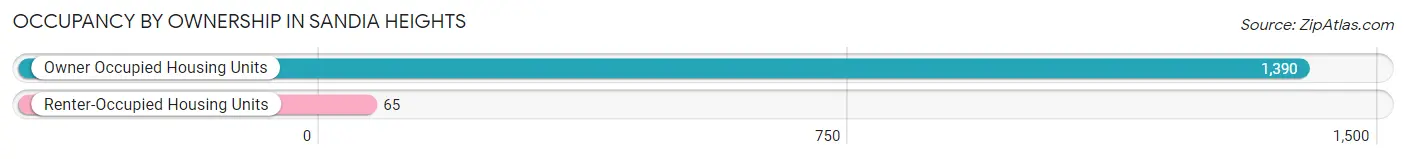
| Occupancy | # Housing Units | % Housing Units |
| Owner Occupied Housing Units | 1,390 | 95.5% |
| Renter-Occupied Housing Units | 65 | 4.5% |
| Total Occupied Housing Units | 1,455 | 100.0% |
Occupancy by Household Size in Sandia Heights
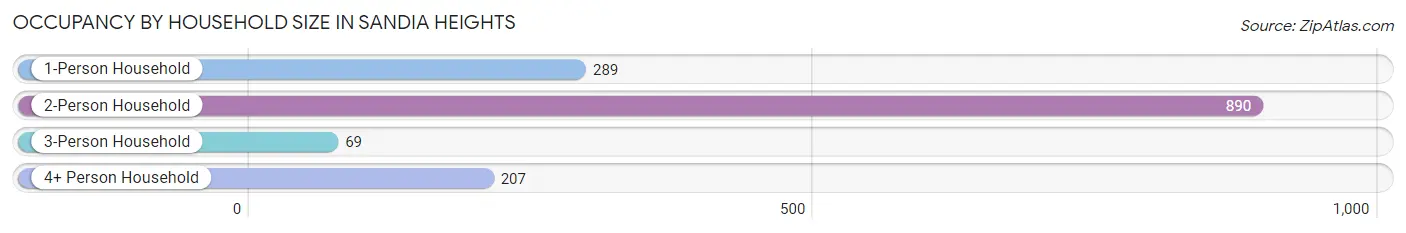
| Household Size | # Housing Units | % Housing Units |
| 1-Person Household | 289 | 19.9% |
| 2-Person Household | 890 | 61.2% |
| 3-Person Household | 69 | 4.7% |
| 4+ Person Household | 207 | 14.2% |
| Total Housing Units | 1,455 | 100.0% |
Occupancy by Ownership by Household Size in Sandia Heights
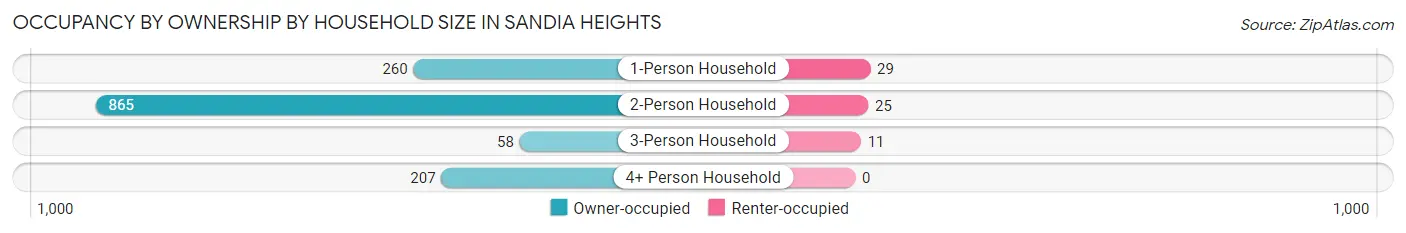
| Household Size | Owner-occupied | Renter-occupied |
| 1-Person Household | 260 (90.0%) | 29 (10.0%) |
| 2-Person Household | 865 (97.2%) | 25 (2.8%) |
| 3-Person Household | 58 (84.1%) | 11 (15.9%) |
| 4+ Person Household | 207 (100.0%) | 0 (0.0%) |
| Total Housing Units | 1,390 (95.5%) | 65 (4.5%) |
Occupancy by Educational Attainment in Sandia Heights
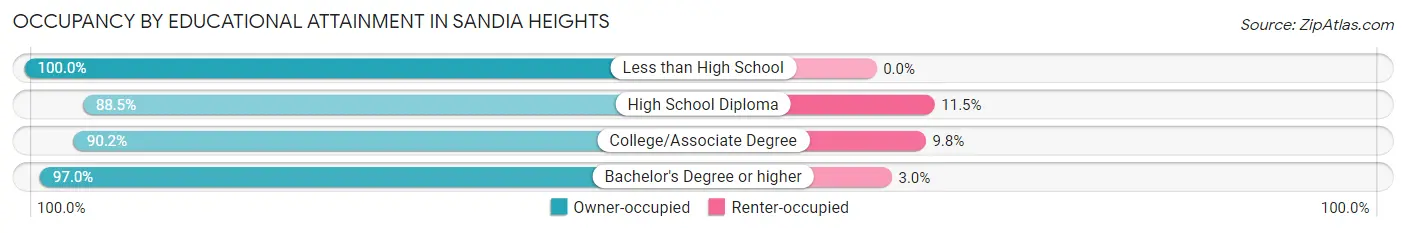
| Household Size | Owner-occupied | Renter-occupied |
| Less than High School | 9 (100.0%) | 0 (0.0%) |
| High School Diploma | 69 (88.5%) | 9 (11.5%) |
| College/Associate Degree | 194 (90.2%) | 21 (9.8%) |
| Bachelor's Degree or higher | 1,118 (97.0%) | 35 (3.0%) |
Occupancy by Age of Householder in Sandia Heights
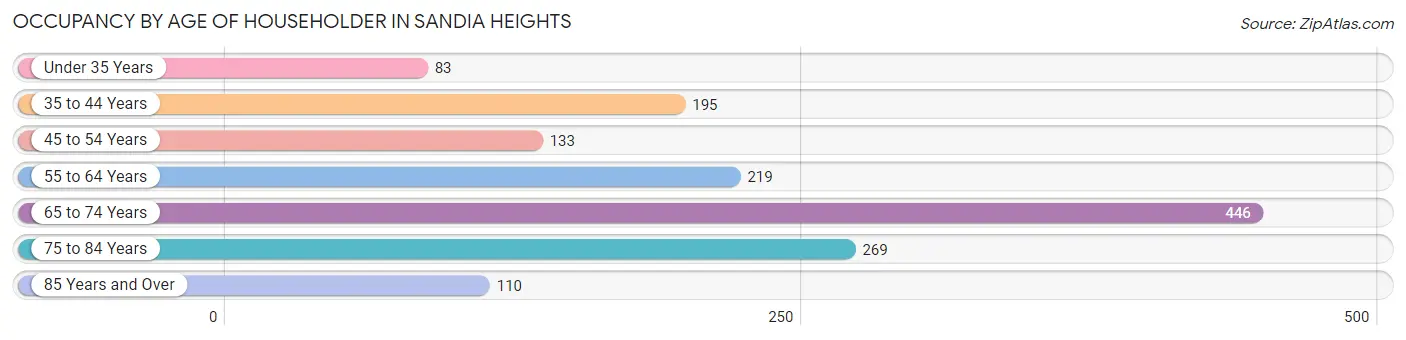
| Age Bracket | # Households | % Households |
| Under 35 Years | 83 | 5.7% |
| 35 to 44 Years | 195 | 13.4% |
| 45 to 54 Years | 133 | 9.1% |
| 55 to 64 Years | 219 | 15.0% |
| 65 to 74 Years | 446 | 30.6% |
| 75 to 84 Years | 269 | 18.5% |
| 85 Years and Over | 110 | 7.6% |
| Total | 1,455 | 100.0% |
Housing Finances in Sandia Heights
Median Income by Occupancy in Sandia Heights
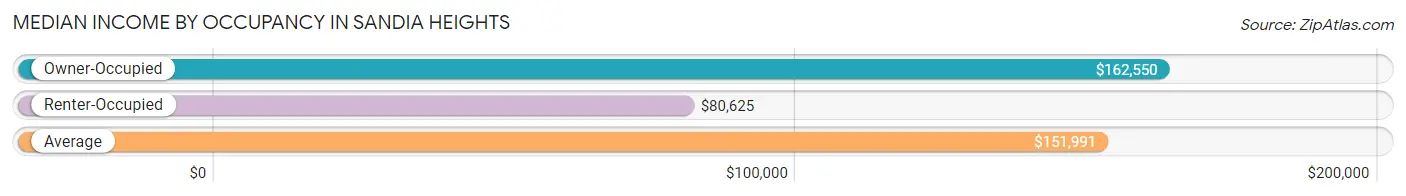
| Occupancy Type | # Households | Median Income |
| Owner-Occupied | 1,390 (95.5%) | $162,550 |
| Renter-Occupied | 65 (4.5%) | $80,625 |
| Average | 1,455 (100.0%) | $151,991 |
Occupancy by Householder Income Bracket in Sandia Heights
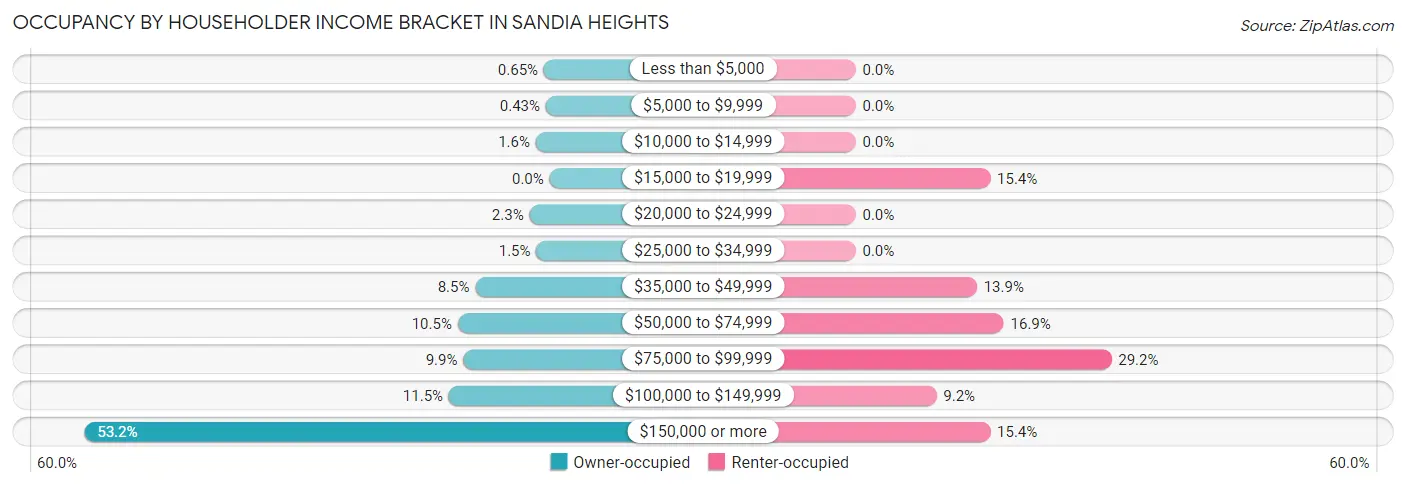
| Income Bracket | Owner-occupied | Renter-occupied |
| Less than $5,000 | 9 (0.6%) | 0 (0.0%) |
| $5,000 to $9,999 | 6 (0.4%) | 0 (0.0%) |
| $10,000 to $14,999 | 22 (1.6%) | 0 (0.0%) |
| $15,000 to $19,999 | 0 (0.0%) | 10 (15.4%) |
| $20,000 to $24,999 | 32 (2.3%) | 0 (0.0%) |
| $25,000 to $34,999 | 21 (1.5%) | 0 (0.0%) |
| $35,000 to $49,999 | 118 (8.5%) | 9 (13.9%) |
| $50,000 to $74,999 | 146 (10.5%) | 11 (16.9%) |
| $75,000 to $99,999 | 137 (9.9%) | 19 (29.2%) |
| $100,000 to $149,999 | 160 (11.5%) | 6 (9.2%) |
| $150,000 or more | 739 (53.2%) | 10 (15.4%) |
| Total | 1,390 (100.0%) | 65 (100.0%) |
Monthly Housing Cost Tiers in Sandia Heights
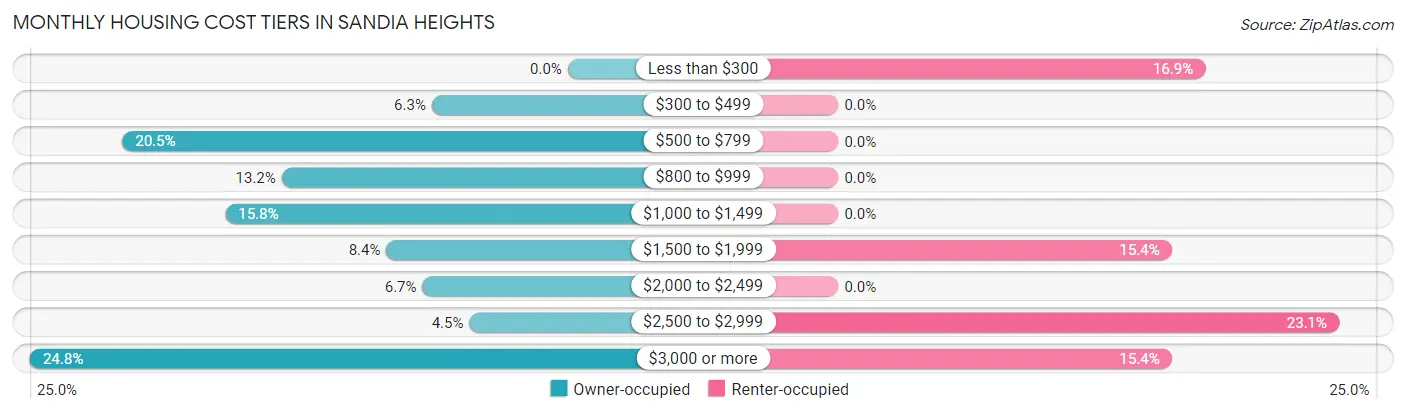
| Monthly Cost | Owner-occupied | Renter-occupied |
| Less than $300 | 0 (0.0%) | 11 (16.9%) |
| $300 to $499 | 87 (6.3%) | 0 (0.0%) |
| $500 to $799 | 285 (20.5%) | 0 (0.0%) |
| $800 to $999 | 183 (13.2%) | 0 (0.0%) |
| $1,000 to $1,499 | 219 (15.8%) | 0 (0.0%) |
| $1,500 to $1,999 | 116 (8.4%) | 10 (15.4%) |
| $2,000 to $2,499 | 93 (6.7%) | 0 (0.0%) |
| $2,500 to $2,999 | 63 (4.5%) | 15 (23.1%) |
| $3,000 or more | 344 (24.7%) | 10 (15.4%) |
| Total | 1,390 (100.0%) | 65 (100.0%) |
Physical Housing Characteristics in Sandia Heights
Housing Structures in Sandia Heights
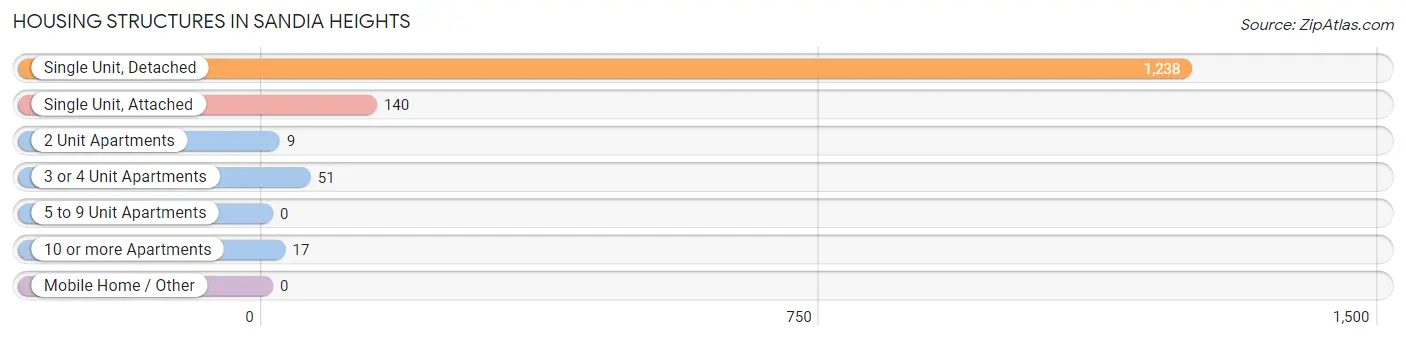
| Structure Type | # Housing Units | % Housing Units |
| Single Unit, Detached | 1,238 | 85.1% |
| Single Unit, Attached | 140 | 9.6% |
| 2 Unit Apartments | 9 | 0.6% |
| 3 or 4 Unit Apartments | 51 | 3.5% |
| 5 to 9 Unit Apartments | 0 | 0.0% |
| 10 or more Apartments | 17 | 1.2% |
| Mobile Home / Other | 0 | 0.0% |
| Total | 1,455 | 100.0% |
Housing Structures by Occupancy in Sandia Heights
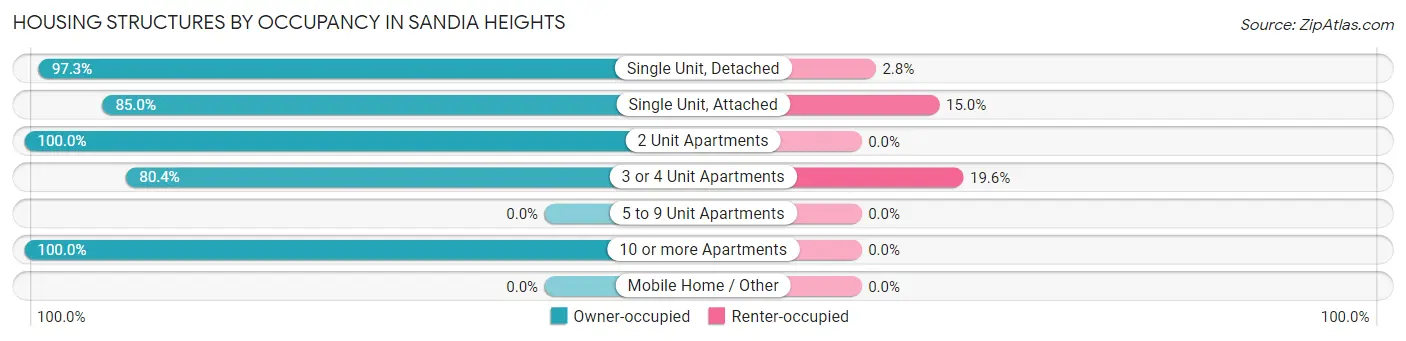
| Structure Type | Owner-occupied | Renter-occupied |
| Single Unit, Detached | 1,204 (97.3%) | 34 (2.8%) |
| Single Unit, Attached | 119 (85.0%) | 21 (15.0%) |
| 2 Unit Apartments | 9 (100.0%) | 0 (0.0%) |
| 3 or 4 Unit Apartments | 41 (80.4%) | 10 (19.6%) |
| 5 to 9 Unit Apartments | 0 (0.0%) | 0 (0.0%) |
| 10 or more Apartments | 17 (100.0%) | 0 (0.0%) |
| Mobile Home / Other | 0 (0.0%) | 0 (0.0%) |
| Total | 1,390 (95.5%) | 65 (4.5%) |
Housing Structures by Number of Rooms in Sandia Heights
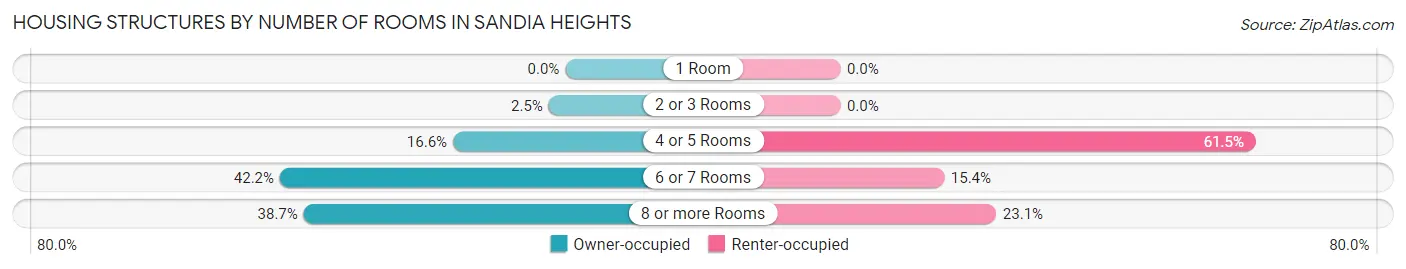
| Number of Rooms | Owner-occupied | Renter-occupied |
| 1 Room | 0 (0.0%) | 0 (0.0%) |
| 2 or 3 Rooms | 34 (2.5%) | 0 (0.0%) |
| 4 or 5 Rooms | 231 (16.6%) | 40 (61.5%) |
| 6 or 7 Rooms | 587 (42.2%) | 10 (15.4%) |
| 8 or more Rooms | 538 (38.7%) | 15 (23.1%) |
| Total | 1,390 (100.0%) | 65 (100.0%) |
Housing Structure by Heating Type in Sandia Heights
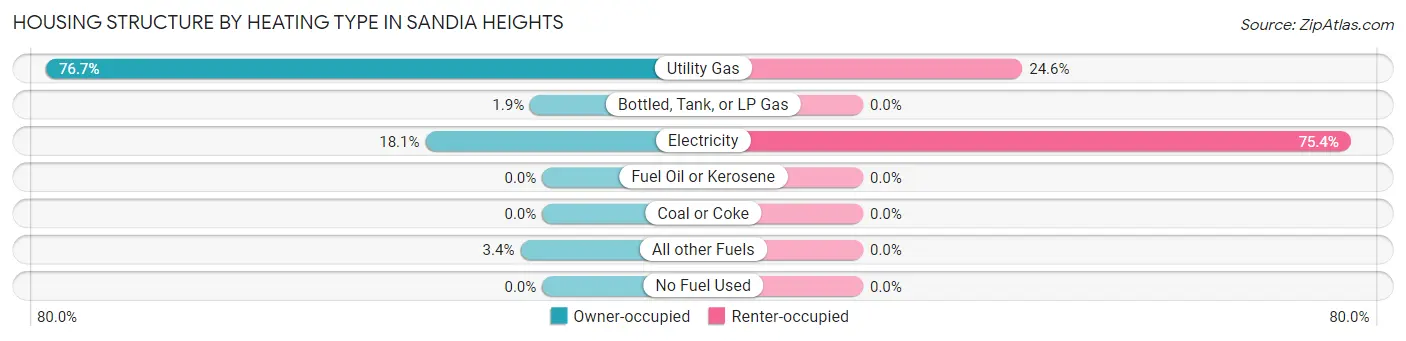
| Heating Type | Owner-occupied | Renter-occupied |
| Utility Gas | 1,066 (76.7%) | 16 (24.6%) |
| Bottled, Tank, or LP Gas | 26 (1.9%) | 0 (0.0%) |
| Electricity | 251 (18.1%) | 49 (75.4%) |
| Fuel Oil or Kerosene | 0 (0.0%) | 0 (0.0%) |
| Coal or Coke | 0 (0.0%) | 0 (0.0%) |
| All other Fuels | 47 (3.4%) | 0 (0.0%) |
| No Fuel Used | 0 (0.0%) | 0 (0.0%) |
| Total | 1,390 (100.0%) | 65 (100.0%) |
Household Vehicle Usage in Sandia Heights
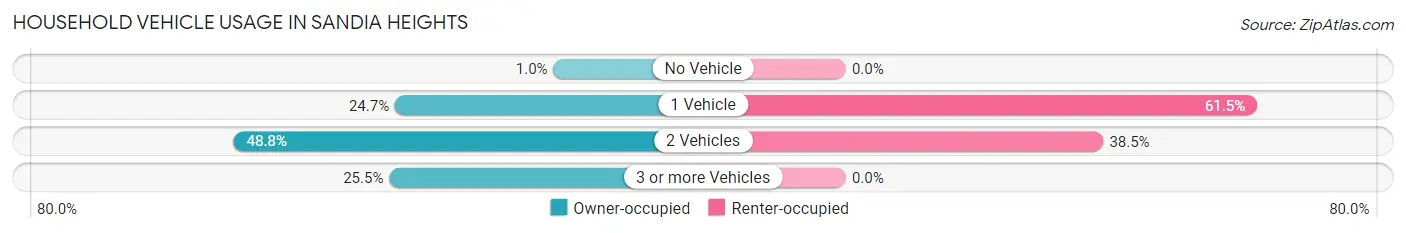
| Vehicles per Household | Owner-occupied | Renter-occupied |
| No Vehicle | 14 (1.0%) | 0 (0.0%) |
| 1 Vehicle | 343 (24.7%) | 40 (61.5%) |
| 2 Vehicles | 678 (48.8%) | 25 (38.5%) |
| 3 or more Vehicles | 355 (25.5%) | 0 (0.0%) |
| Total | 1,390 (100.0%) | 65 (100.0%) |
Real Estate & Mortgages in Sandia Heights
Real Estate and Mortgage Overview in Sandia Heights
| Characteristic | Without Mortgage | With Mortgage |
| Housing Units | 730 | 660 |
| Median Property Value | $558,700 | $646,500 |
| Median Household Income | $128,889 | $428 |
| Monthly Housing Costs | $802 | $335 |
| Real Estate Taxes | $4,901 | $8 |
Property Value by Mortgage Status in Sandia Heights
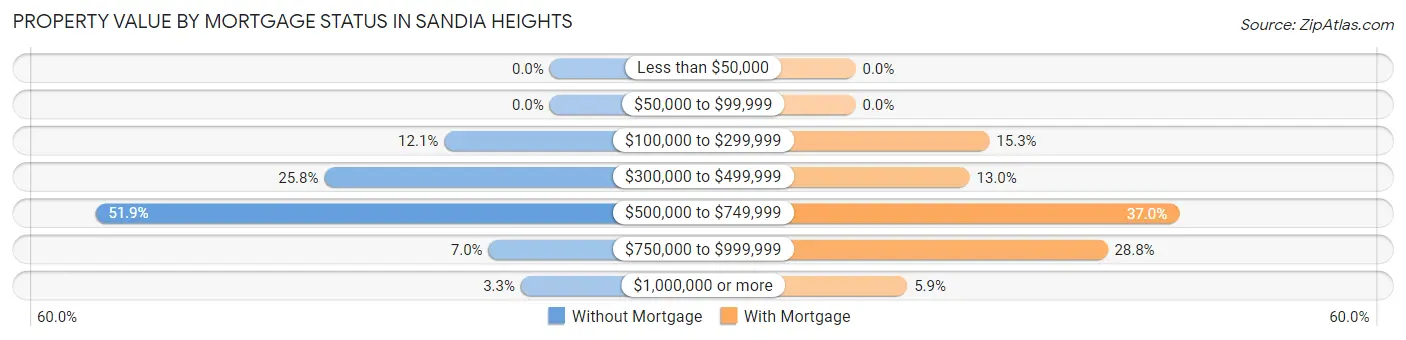
| Property Value | Without Mortgage | With Mortgage |
| Less than $50,000 | 0 (0.0%) | 0 (0.0%) |
| $50,000 to $99,999 | 0 (0.0%) | 0 (0.0%) |
| $100,000 to $299,999 | 88 (12.0%) | 101 (15.3%) |
| $300,000 to $499,999 | 188 (25.8%) | 86 (13.0%) |
| $500,000 to $749,999 | 379 (51.9%) | 244 (37.0%) |
| $750,000 to $999,999 | 51 (7.0%) | 190 (28.8%) |
| $1,000,000 or more | 24 (3.3%) | 39 (5.9%) |
| Total | 730 (100.0%) | 660 (100.0%) |
Household Income by Mortgage Status in Sandia Heights
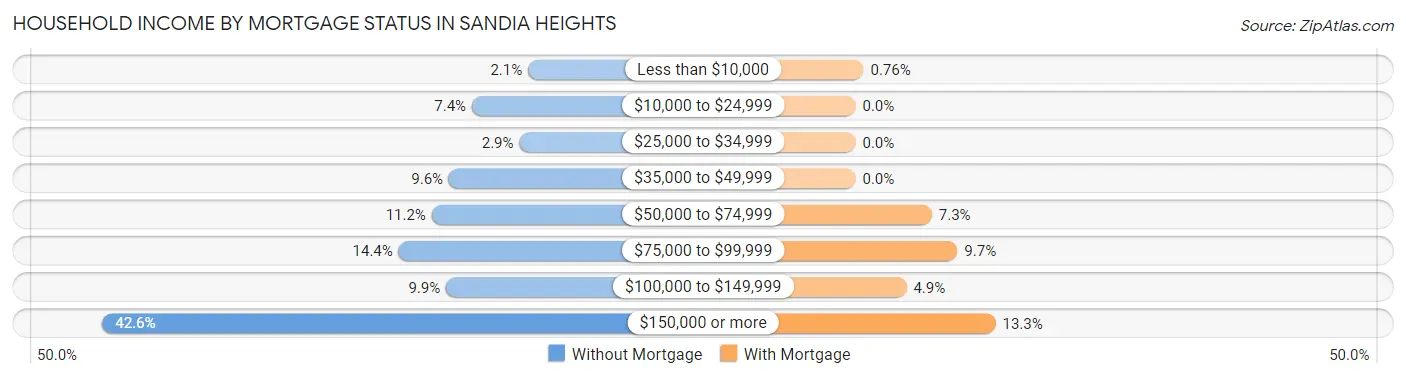
| Household Income | Without Mortgage | With Mortgage |
| Less than $10,000 | 15 (2.1%) | 5 (0.8%) |
| $10,000 to $24,999 | 54 (7.4%) | 0 (0.0%) |
| $25,000 to $34,999 | 21 (2.9%) | 0 (0.0%) |
| $35,000 to $49,999 | 70 (9.6%) | 0 (0.0%) |
| $50,000 to $74,999 | 82 (11.2%) | 48 (7.3%) |
| $75,000 to $99,999 | 105 (14.4%) | 64 (9.7%) |
| $100,000 to $149,999 | 72 (9.9%) | 32 (4.9%) |
| $150,000 or more | 311 (42.6%) | 88 (13.3%) |
| Total | 730 (100.0%) | 660 (100.0%) |
Property Value to Household Income Ratio in Sandia Heights
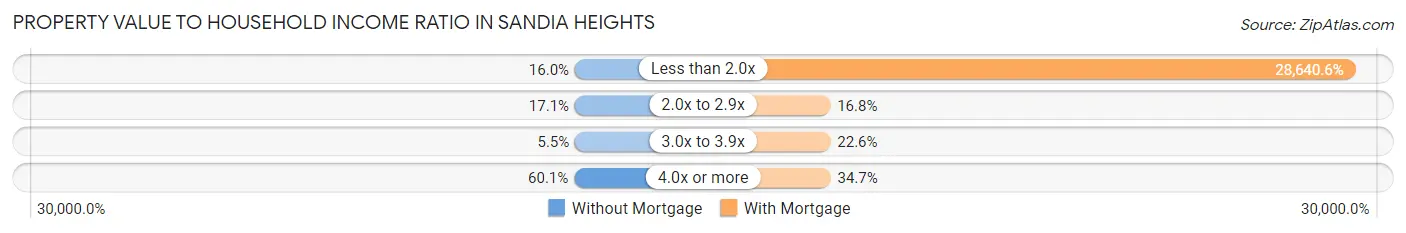
| Value-to-Income Ratio | Without Mortgage | With Mortgage |
| Less than 2.0x | 117 (16.0%) | 189,028 (28,640.6%) |
| 2.0x to 2.9x | 125 (17.1%) | 111 (16.8%) |
| 3.0x to 3.9x | 40 (5.5%) | 149 (22.6%) |
| 4.0x or more | 439 (60.1%) | 229 (34.7%) |
| Total | 730 (100.0%) | 660 (100.0%) |
Real Estate Taxes by Mortgage Status in Sandia Heights
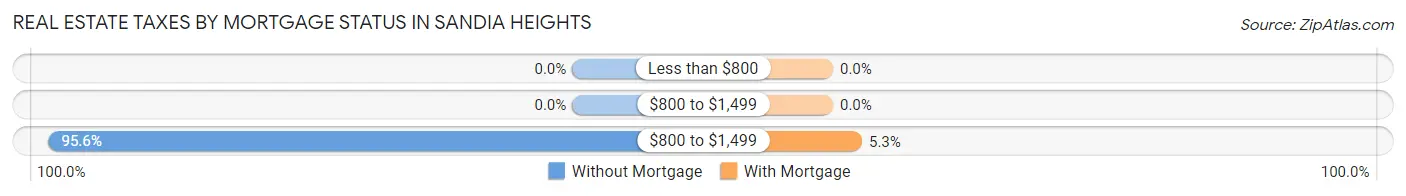
| Property Taxes | Without Mortgage | With Mortgage |
| Less than $800 | 0 (0.0%) | 0 (0.0%) |
| $800 to $1,499 | 0 (0.0%) | 0 (0.0%) |
| $800 to $1,499 | 698 (95.6%) | 35 (5.3%) |
| Total | 730 (100.0%) | 660 (100.0%) |
Health & Disability in Sandia Heights
Health Insurance Coverage by Age in Sandia Heights
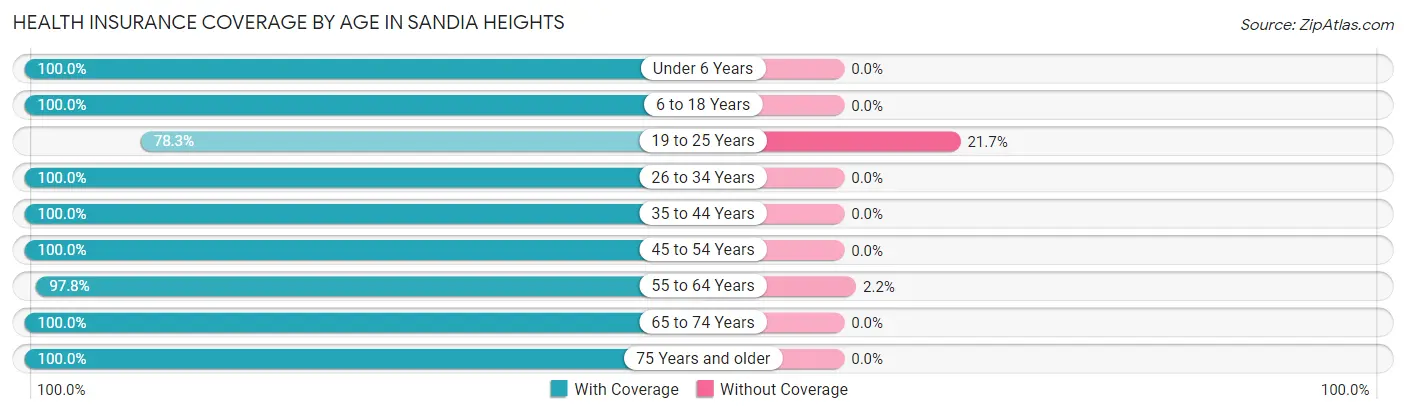
| Age Bracket | With Coverage | Without Coverage |
| Under 6 Years | 194 (100.0%) | 0 (0.0%) |
| 6 to 18 Years | 229 (100.0%) | 0 (0.0%) |
| 19 to 25 Years | 47 (78.3%) | 13 (21.7%) |
| 26 to 34 Years | 170 (100.0%) | 0 (0.0%) |
| 35 to 44 Years | 426 (100.0%) | 0 (0.0%) |
| 45 to 54 Years | 246 (100.0%) | 0 (0.0%) |
| 55 to 64 Years | 445 (97.8%) | 10 (2.2%) |
| 65 to 74 Years | 728 (100.0%) | 0 (0.0%) |
| 75 Years and older | 697 (100.0%) | 0 (0.0%) |
| Total | 3,182 (99.3%) | 23 (0.7%) |
Health Insurance Coverage by Citizenship Status in Sandia Heights
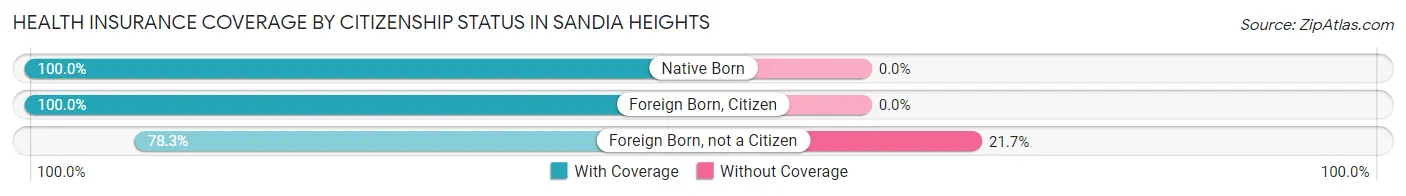
| Citizenship Status | With Coverage | Without Coverage |
| Native Born | 194 (100.0%) | 0 (0.0%) |
| Foreign Born, Citizen | 229 (100.0%) | 0 (0.0%) |
| Foreign Born, not a Citizen | 47 (78.3%) | 13 (21.7%) |
Health Insurance Coverage by Household Income in Sandia Heights
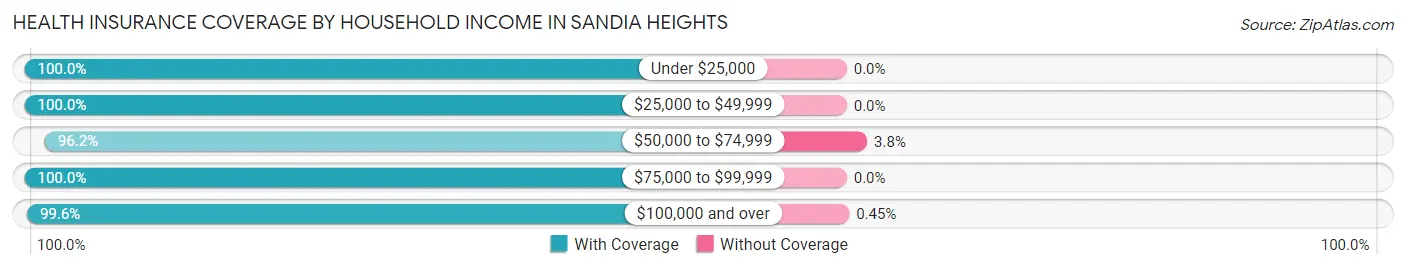
| Household Income | With Coverage | Without Coverage |
| Under $25,000 | 91 (100.0%) | 0 (0.0%) |
| $25,000 to $49,999 | 267 (100.0%) | 0 (0.0%) |
| $50,000 to $74,999 | 328 (96.2%) | 13 (3.8%) |
| $75,000 to $99,999 | 292 (100.0%) | 0 (0.0%) |
| $100,000 and over | 2,204 (99.6%) | 10 (0.4%) |
Public vs Private Health Insurance Coverage by Age in Sandia Heights
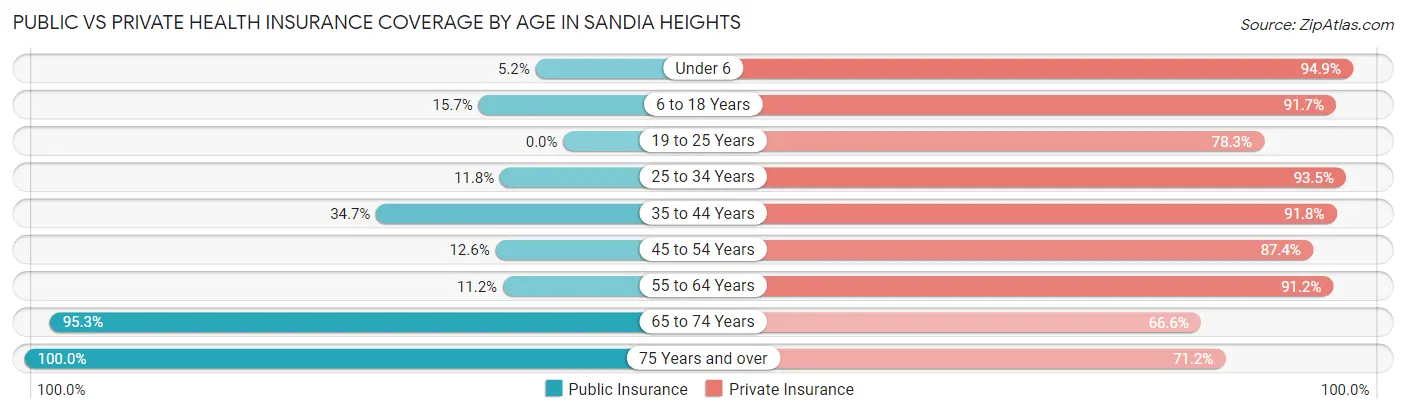
| Age Bracket | Public Insurance | Private Insurance |
| Under 6 | 10 (5.1%) | 184 (94.9%) |
| 6 to 18 Years | 36 (15.7%) | 210 (91.7%) |
| 19 to 25 Years | 0 (0.0%) | 47 (78.3%) |
| 25 to 34 Years | 20 (11.8%) | 159 (93.5%) |
| 35 to 44 Years | 148 (34.7%) | 391 (91.8%) |
| 45 to 54 Years | 31 (12.6%) | 215 (87.4%) |
| 55 to 64 Years | 51 (11.2%) | 415 (91.2%) |
| 65 to 74 Years | 694 (95.3%) | 485 (66.6%) |
| 75 Years and over | 697 (100.0%) | 496 (71.2%) |
| Total | 1,687 (52.6%) | 2,602 (81.2%) |
Disability Status by Sex by Age in Sandia Heights
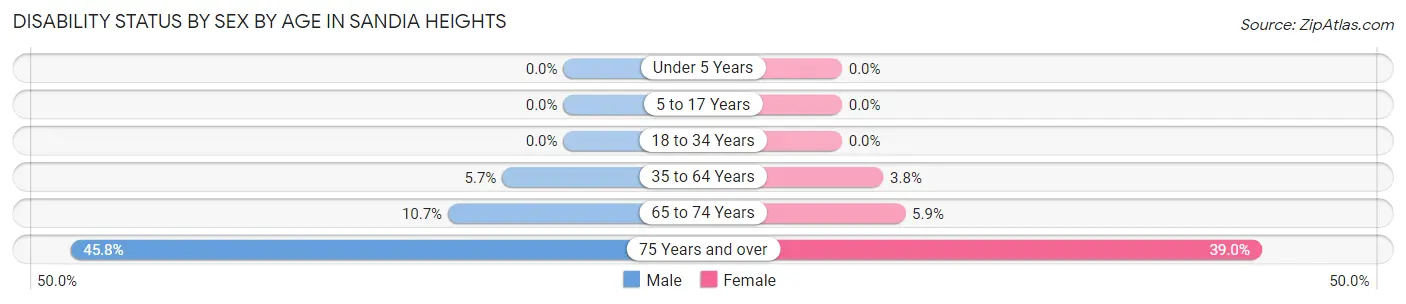
| Age Bracket | Male | Female |
| Under 5 Years | 0 (0.0%) | 0 (0.0%) |
| 5 to 17 Years | 0 (0.0%) | 0 (0.0%) |
| 18 to 34 Years | 0 (0.0%) | 0 (0.0%) |
| 35 to 64 Years | 30 (5.7%) | 23 (3.8%) |
| 65 to 74 Years | 47 (10.7%) | 17 (5.9%) |
| 75 Years and over | 124 (45.8%) | 166 (39.0%) |
Disability Class by Sex by Age in Sandia Heights
Disability Class: Hearing Difficulty
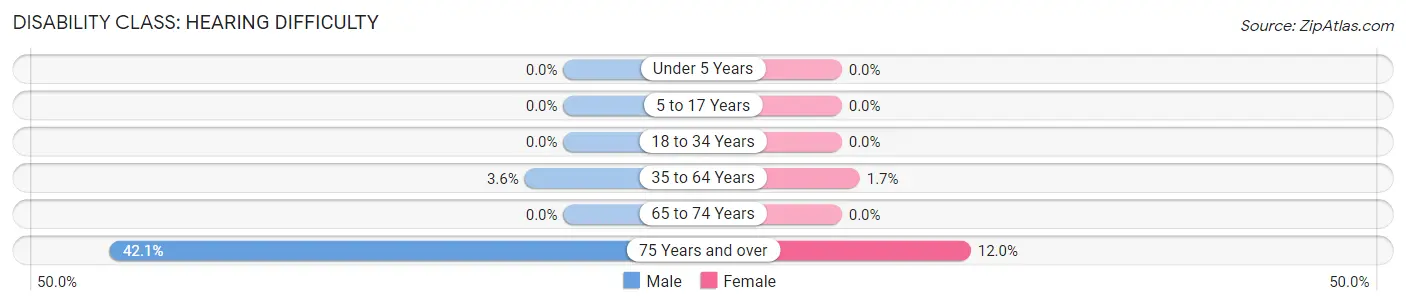
| Age Bracket | Male | Female |
| Under 5 Years | 0 (0.0%) | 0 (0.0%) |
| 5 to 17 Years | 0 (0.0%) | 0 (0.0%) |
| 18 to 34 Years | 0 (0.0%) | 0 (0.0%) |
| 35 to 64 Years | 19 (3.6%) | 10 (1.7%) |
| 65 to 74 Years | 0 (0.0%) | 0 (0.0%) |
| 75 Years and over | 114 (42.1%) | 51 (12.0%) |
Disability Class: Vision Difficulty

| Age Bracket | Male | Female |
| Under 5 Years | 0 (0.0%) | 0 (0.0%) |
| 5 to 17 Years | 0 (0.0%) | 0 (0.0%) |
| 18 to 34 Years | 0 (0.0%) | 0 (0.0%) |
| 35 to 64 Years | 21 (4.0%) | 0 (0.0%) |
| 65 to 74 Years | 0 (0.0%) | 0 (0.0%) |
| 75 Years and over | 9 (3.3%) | 0 (0.0%) |
Disability Class: Cognitive Difficulty
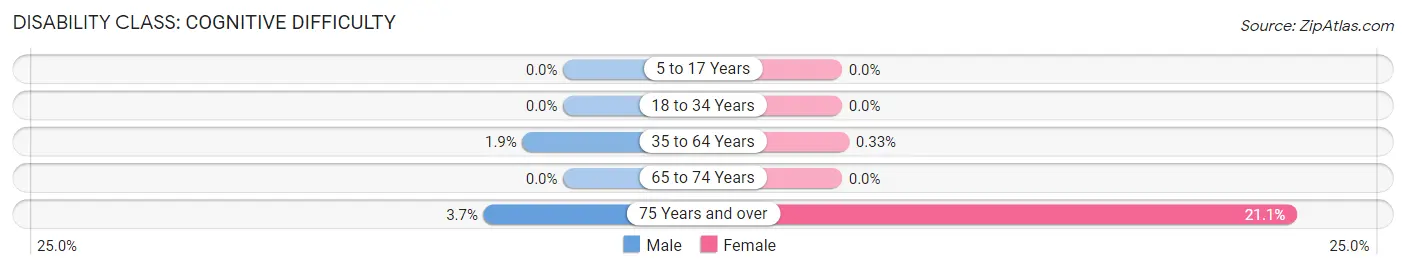
| Age Bracket | Male | Female |
| 5 to 17 Years | 0 (0.0%) | 0 (0.0%) |
| 18 to 34 Years | 0 (0.0%) | 0 (0.0%) |
| 35 to 64 Years | 10 (1.9%) | 2 (0.3%) |
| 65 to 74 Years | 0 (0.0%) | 0 (0.0%) |
| 75 Years and over | 10 (3.7%) | 90 (21.1%) |
Disability Class: Ambulatory Difficulty
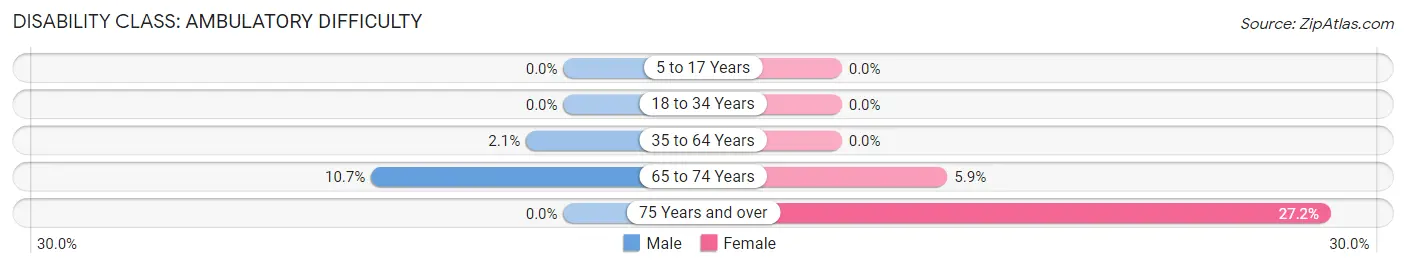
| Age Bracket | Male | Female |
| 5 to 17 Years | 0 (0.0%) | 0 (0.0%) |
| 18 to 34 Years | 0 (0.0%) | 0 (0.0%) |
| 35 to 64 Years | 11 (2.1%) | 0 (0.0%) |
| 65 to 74 Years | 47 (10.7%) | 17 (5.9%) |
| 75 Years and over | 0 (0.0%) | 116 (27.2%) |
Disability Class: Self-Care Difficulty
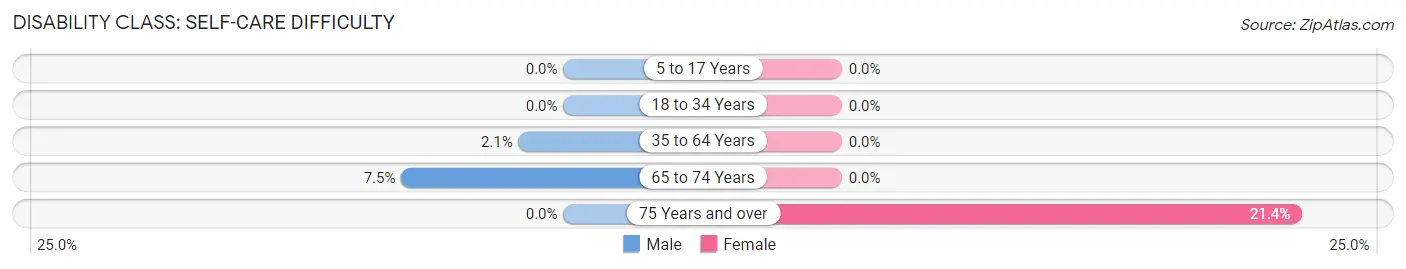
| Age Bracket | Male | Female |
| 5 to 17 Years | 0 (0.0%) | 0 (0.0%) |
| 18 to 34 Years | 0 (0.0%) | 0 (0.0%) |
| 35 to 64 Years | 11 (2.1%) | 0 (0.0%) |
| 65 to 74 Years | 33 (7.5%) | 0 (0.0%) |
| 75 Years and over | 0 (0.0%) | 91 (21.4%) |
Technology Access in Sandia Heights
Computing Device Access in Sandia Heights
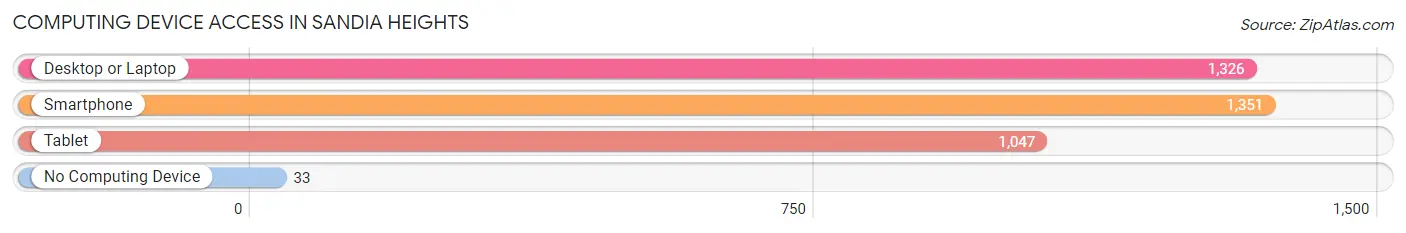
| Device Type | # Households | % Households |
| Desktop or Laptop | 1,326 | 91.1% |
| Smartphone | 1,351 | 92.8% |
| Tablet | 1,047 | 72.0% |
| No Computing Device | 33 | 2.3% |
| Total | 1,455 | 100.0% |
Internet Access in Sandia Heights
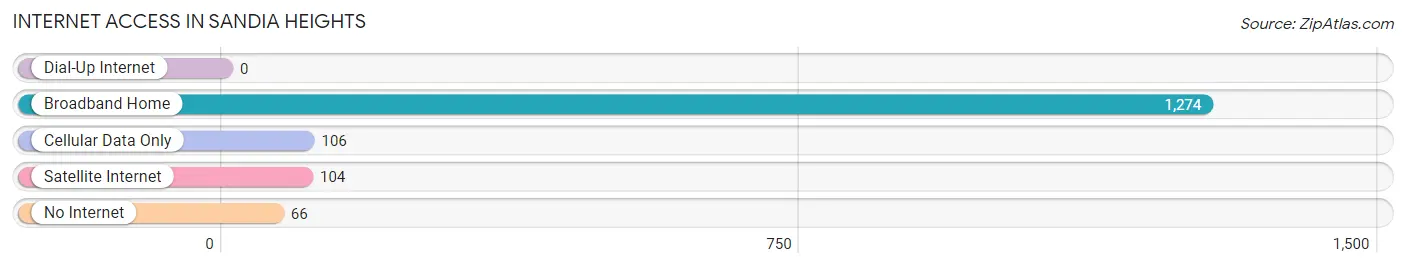
| Internet Type | # Households | % Households |
| Dial-Up Internet | 0 | 0.0% |
| Broadband Home | 1,274 | 87.6% |
| Cellular Data Only | 106 | 7.3% |
| Satellite Internet | 104 | 7.1% |
| No Internet | 66 | 4.5% |
| Total | 1,455 | 100.0% |
Sandia Heights Summary
Sandia Heights is a census-designated place (CDP) located in Bernalillo County, New Mexico. It is situated in the foothills of the Sandia Mountains, just north of Albuquerque. The area is known for its stunning views of the city and the surrounding mountains.
History
The area now known as Sandia Heights was originally inhabited by the Pueblo Indians. The first Europeans to settle in the area were Spanish settlers in the late 1700s. The area was part of the Spanish land grant known as the Alameda Land Grant. The land was later sold to the United States in 1848 as part of the Treaty of Guadalupe Hidalgo.
In the early 1900s, the area was developed as a residential area for wealthy families. The area was known as the “Alameda Heights” and was home to some of the most prominent families in Albuquerque. The area was later renamed “Sandia Heights” in the 1950s.
Geography
Sandia Heights is located in the foothills of the Sandia Mountains, just north of Albuquerque. The area is characterized by its rolling hills and stunning views of the city and the surrounding mountains. The area is also home to a variety of wildlife, including coyotes, bobcats, and deer.
The climate in Sandia Heights is semi-arid, with hot summers and mild winters. The average annual temperature is around 60 degrees Fahrenheit. The area receives an average of 12 inches of precipitation per year.
Economy
The economy of Sandia Heights is largely based on tourism and real estate. The area is home to a variety of luxury homes and is a popular destination for tourists. The area is also home to a number of businesses, including restaurants, retail stores, and professional services.
Demographics
As of the 2010 census, the population of Sandia Heights was 4,845. The population is largely white (83.3%), with smaller percentages of Hispanic (7.7%), African American (2.2%), and Native American (1.2%) residents. The median household income is $90,945, and the median home value is $521,000.
Conclusion
Sandia Heights is a census-designated place located in Bernalillo County, New Mexico. It is situated in the foothills of the Sandia Mountains, just north of Albuquerque. The area is known for its stunning views of the city and the surrounding mountains. The economy of Sandia Heights is largely based on tourism and real estate, and the population is largely white. The area is home to a variety of luxury homes and is a popular destination for tourists.
Common Questions
What is Per Capita Income in Sandia Heights?
Per Capita income in Sandia Heights is $83,359.
What is the Median Family Income in Sandia Heights?
Median Family Income in Sandia Heights is $178,075.
What is the Median Household income in Sandia Heights?
Median Household Income in Sandia Heights is $151,991.
What is Income or Wage Gap in Sandia Heights?
Income or Wage Gap in Sandia Heights is 55.5%.
Women in Sandia Heights earn 44.5 cents for every dollar earned by a man.
What is Inequality or Gini Index in Sandia Heights?
Inequality or Gini Index in Sandia Heights is 0.41.
What is the Total Population of Sandia Heights?
Total Population of Sandia Heights is 3,205.
What is the Total Male Population of Sandia Heights?
Total Male Population of Sandia Heights is 1,577.
What is the Total Female Population of Sandia Heights?
Total Female Population of Sandia Heights is 1,628.
What is the Ratio of Males per 100 Females in Sandia Heights?
There are 96.87 Males per 100 Females in Sandia Heights.
What is the Ratio of Females per 100 Males in Sandia Heights?
There are 103.23 Females per 100 Males in Sandia Heights.
What is the Median Population Age in Sandia Heights?
Median Population Age in Sandia Heights is 61.7 Years.
What is the Average Family Size in Sandia Heights
Average Family Size in Sandia Heights is 2.5 People.
What is the Average Household Size in Sandia Heights
Average Household Size in Sandia Heights is 2.2 People.
How Large is the Labor Force in Sandia Heights?
There are 1,185 People in the Labor Forcein in Sandia Heights.
What is the Percentage of People in the Labor Force in Sandia Heights?
41.9% of People are in the Labor Force in Sandia Heights.
What is the Unemployment Rate in Sandia Heights?
Unemployment Rate in Sandia Heights is 1.7%.