Alcalde, NM Map & Demographics
Alcalde Map
Alcalde Overview
$25,915
PER CAPITA INCOME
$57,500
AVG FAMILY INCOME
$42,813
AVG HOUSEHOLD INCOME
27.8%
WAGE / INCOME GAP [ % ]
72.2¢/ $1
WAGE / INCOME GAP [ $ ]
0.48
INEQUALITY / GINI INDEX
235
TOTAL POPULATION
92
MALE POPULATION
143
FEMALE POPULATION
64.34
MALES / 100 FEMALES
155.43
FEMALES / 100 MALES
38.1
MEDIAN AGE
3.6
AVG FAMILY SIZE
2.7
AVG HOUSEHOLD SIZE
92
LABOR FORCE [ PEOPLE ]
48.4%
PERCENT IN LABOR FORCE
2.2%
UNEMPLOYMENT RATE
Alcalde Zip Codes
Alcalde Area Codes
Income in Alcalde
Income Overview in Alcalde
Per Capita Income in Alcalde is $25,915, while median incomes of families and households are $57,500 and $42,813 respectively.
| Characteristic | Number | Measure |
| Per Capita Income | 235 | $25,915 |
| Median Family Income | 54 | $57,500 |
| Mean Family Income | 54 | $83,252 |
| Median Household Income | 87 | $42,813 |
| Mean Household Income | 87 | $68,697 |
| Income Deficit | 54 | $0 |
| Wage / Income Gap (%) | 235 | 27.78% |
| Wage / Income Gap ($) | 235 | 72.22¢ per $1 |
| Gini / Inequality Index | 235 | 0.48 |
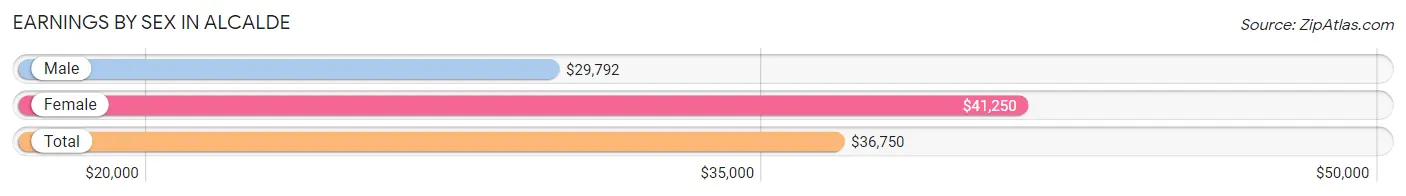
Earnings by Sex in Alcalde
Average Earnings in Alcalde are $36,750, $29,792 for men and $41,250 for women, a difference of 27.8%.
| Sex | Number | Average Earnings |
| Male | 59 (58.4%) | $29,792 |
| Female | 42 (41.6%) | $41,250 |
| Total | 101 (100.0%) | $36,750 |
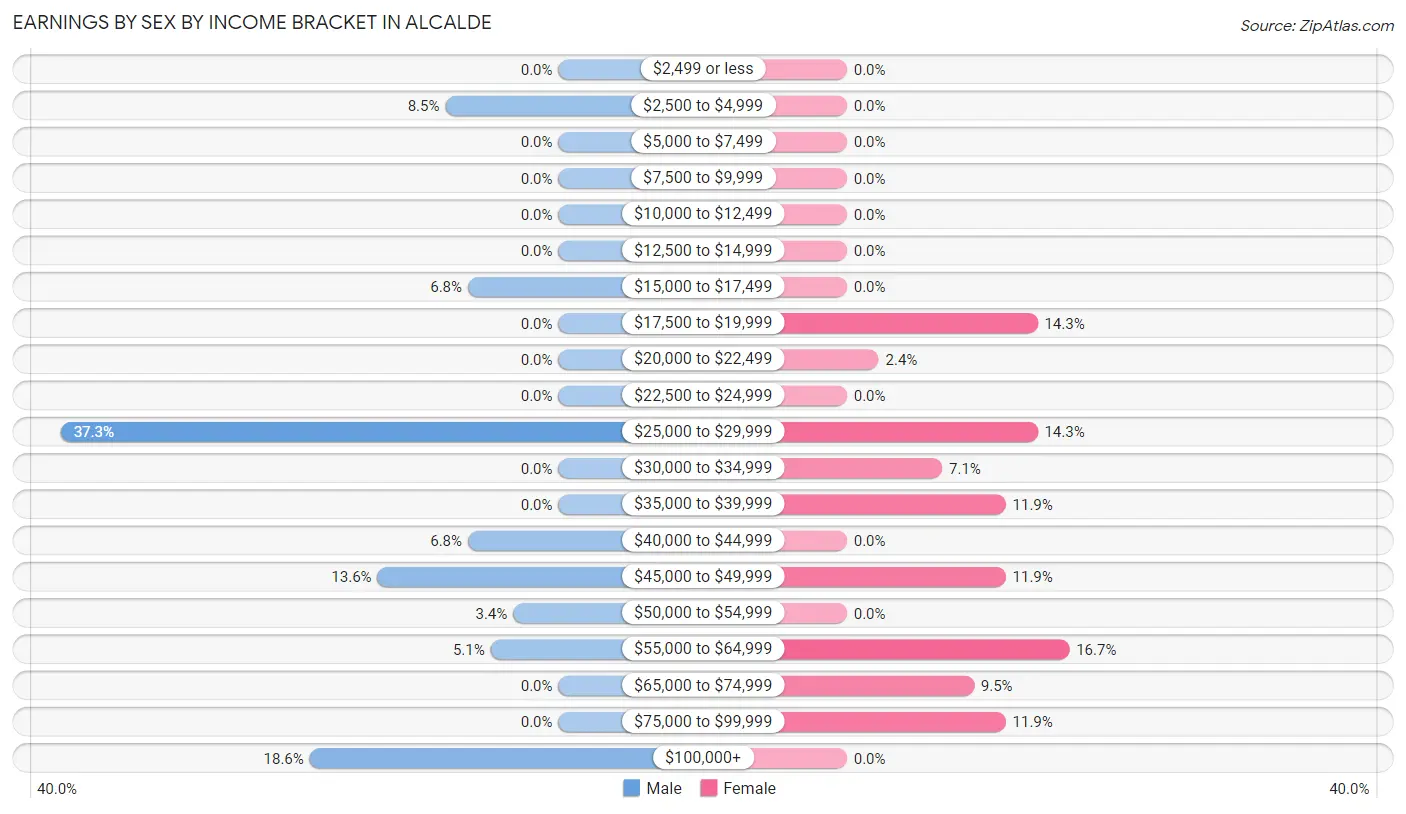
Earnings by Sex by Income Bracket in Alcalde
The most common earnings brackets in Alcalde are $25,000 to $29,999 for men (22 | 37.3%) and $55,000 to $64,999 for women (7 | 16.7%).
| Income | Male | Female |
| $2,499 or less | 0 (0.0%) | 0 (0.0%) |
| $2,500 to $4,999 | 5 (8.5%) | 0 (0.0%) |
| $5,000 to $7,499 | 0 (0.0%) | 0 (0.0%) |
| $7,500 to $9,999 | 0 (0.0%) | 0 (0.0%) |
| $10,000 to $12,499 | 0 (0.0%) | 0 (0.0%) |
| $12,500 to $14,999 | 0 (0.0%) | 0 (0.0%) |
| $15,000 to $17,499 | 4 (6.8%) | 0 (0.0%) |
| $17,500 to $19,999 | 0 (0.0%) | 6 (14.3%) |
| $20,000 to $22,499 | 0 (0.0%) | 1 (2.4%) |
| $22,500 to $24,999 | 0 (0.0%) | 0 (0.0%) |
| $25,000 to $29,999 | 22 (37.3%) | 6 (14.3%) |
| $30,000 to $34,999 | 0 (0.0%) | 3 (7.1%) |
| $35,000 to $39,999 | 0 (0.0%) | 5 (11.9%) |
| $40,000 to $44,999 | 4 (6.8%) | 0 (0.0%) |
| $45,000 to $49,999 | 8 (13.6%) | 5 (11.9%) |
| $50,000 to $54,999 | 2 (3.4%) | 0 (0.0%) |
| $55,000 to $64,999 | 3 (5.1%) | 7 (16.7%) |
| $65,000 to $74,999 | 0 (0.0%) | 4 (9.5%) |
| $75,000 to $99,999 | 0 (0.0%) | 5 (11.9%) |
| $100,000+ | 11 (18.6%) | 0 (0.0%) |
| Total | 59 (100.0%) | 42 (100.0%) |
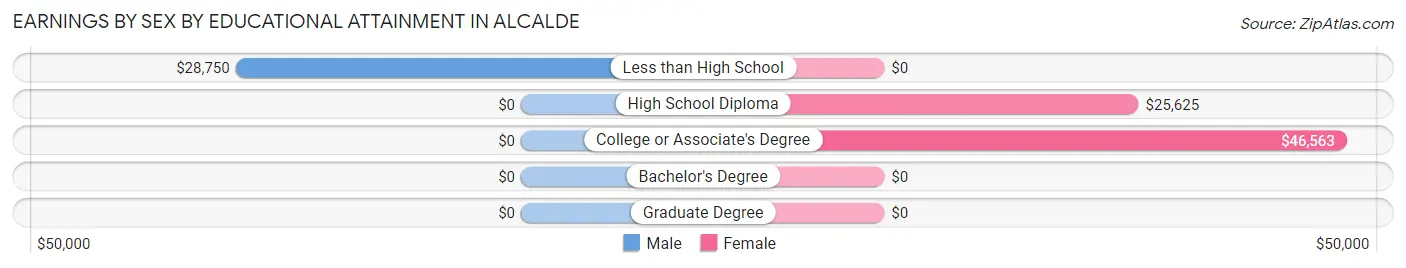
Earnings by Sex by Educational Attainment in Alcalde
Average earnings in Alcalde are $29,236 for men and $41,250 for women, a difference of 29.1%. Men with an educational attainment of less than high school enjoy the highest average annual earnings of $28,750, while those with less than high school education earn the least with $28,750. Women with an educational attainment of college or associate's degree earn the most with the average annual earnings of $46,563, while those with high school diploma education have the smallest earnings of $25,625.
| Educational Attainment | Male Income | Female Income |
| Less than High School | $28,750 | $0 |
| High School Diploma | - | - |
| College or Associate's Degree | - | - |
| Bachelor's Degree | - | - |
| Graduate Degree | - | - |
| Total | $29,236 | $41,250 |
Family Income in Alcalde
Family Income Brackets in Alcalde
According to the Alcalde family income data, there are 16 families falling into the $50,000 to $74,999 income range, which is the most common income bracket and makes up 29.6% of all families.
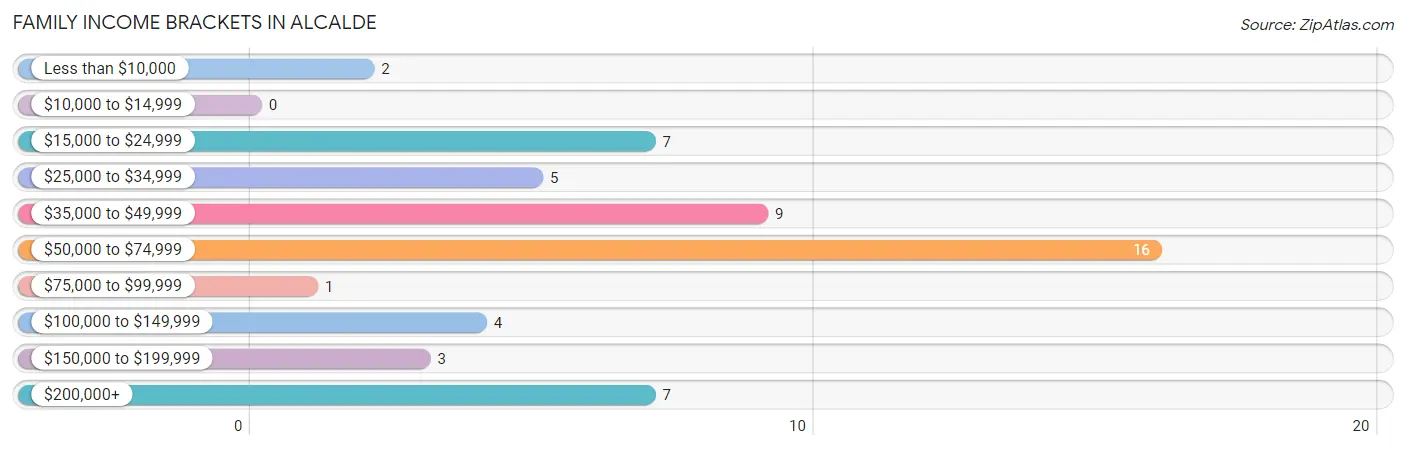
| Income Bracket | # Families | % Families |
| Less than $10,000 | 2 | 3.7% |
| $10,000 to $14,999 | 0 | 0.0% |
| $15,000 to $24,999 | 7 | 13.0% |
| $25,000 to $34,999 | 5 | 9.3% |
| $35,000 to $49,999 | 9 | 16.7% |
| $50,000 to $74,999 | 16 | 29.6% |
| $75,000 to $99,999 | 1 | 1.9% |
| $100,000 to $149,999 | 4 | 7.4% |
| $150,000 to $199,999 | 3 | 5.6% |
| $200,000+ | 7 | 13.0% |
Family Income by Famaliy Size in Alcalde
2-person families (39 | 72.2%) account for the highest median family income in Alcalde with $57,188 per family, while 2-person families (39 | 72.2%) have the highest median income of $28,594 per family member.
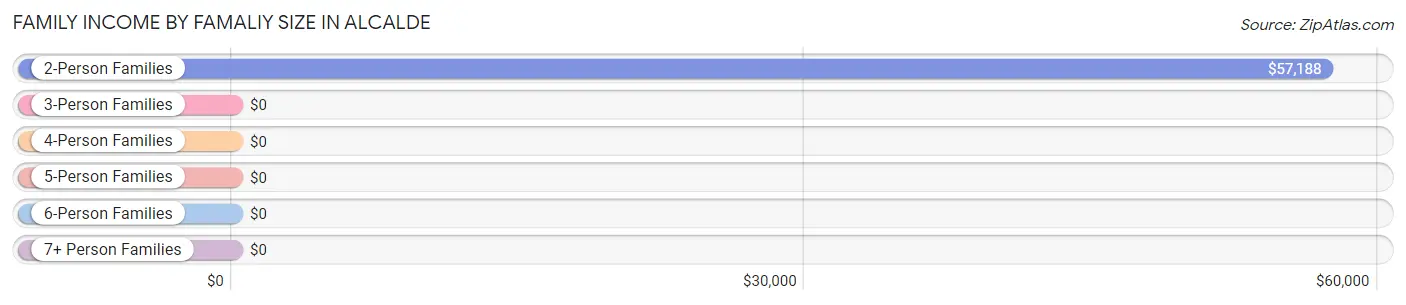
| Income Bracket | # Families | Median Income |
| 2-Person Families | 39 (72.2%) | $57,188 |
| 3-Person Families | 5 (9.3%) | $0 |
| 4-Person Families | 8 (14.8%) | $0 |
| 5-Person Families | 2 (3.7%) | $0 |
| 6-Person Families | 0 (0.0%) | $0 |
| 7+ Person Families | 0 (0.0%) | $0 |
| Total | 54 (100.0%) | $57,500 |
Family Income by Number of Earners in Alcalde
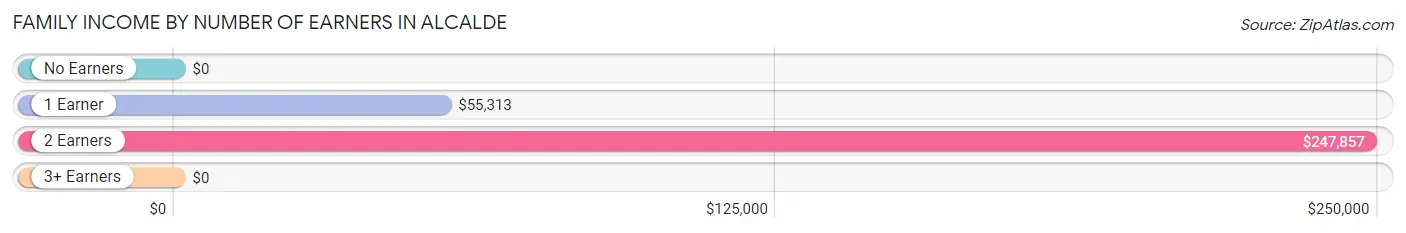
| Number of Earners | # Families | Median Income |
| No Earners | 8 (14.8%) | $0 |
| 1 Earner | 31 (57.4%) | $55,313 |
| 2 Earners | 12 (22.2%) | $247,857 |
| 3+ Earners | 3 (5.6%) | $0 |
| Total | 54 (100.0%) | $57,500 |
Household Income in Alcalde
Household Income Brackets in Alcalde
With 17 households falling in the category, the $35,000 to $49,999 income range is the most frequent in Alcalde, accounting for 19.5% of all households.
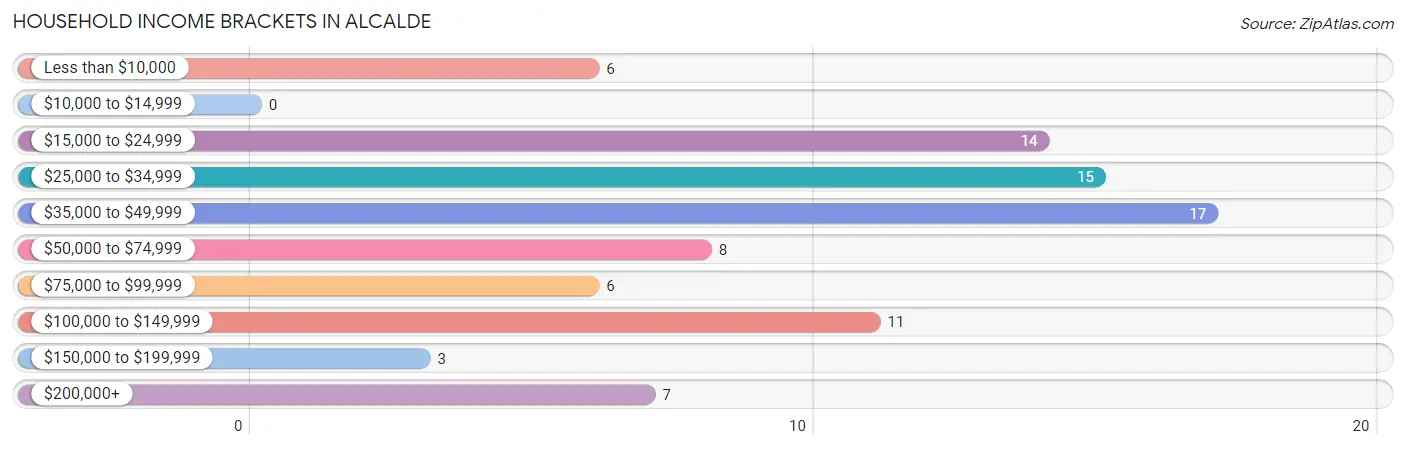
| Income Bracket | # Households | % Households |
| Less than $10,000 | 6 | 6.9% |
| $10,000 to $14,999 | 0 | 0.0% |
| $15,000 to $24,999 | 14 | 16.1% |
| $25,000 to $34,999 | 15 | 17.2% |
| $35,000 to $49,999 | 17 | 19.5% |
| $50,000 to $74,999 | 8 | 9.2% |
| $75,000 to $99,999 | 6 | 6.9% |
| $100,000 to $149,999 | 11 | 12.6% |
| $150,000 to $199,999 | 3 | 3.4% |
| $200,000+ | 7 | 8.0% |
Household Income by Householder Age in Alcalde
The median household income in Alcalde is $42,813, with the highest median household income of $42,188 found in the 25 to 44 years age bracket for the primary householder. A total of 33 households (37.9%) fall into this category.
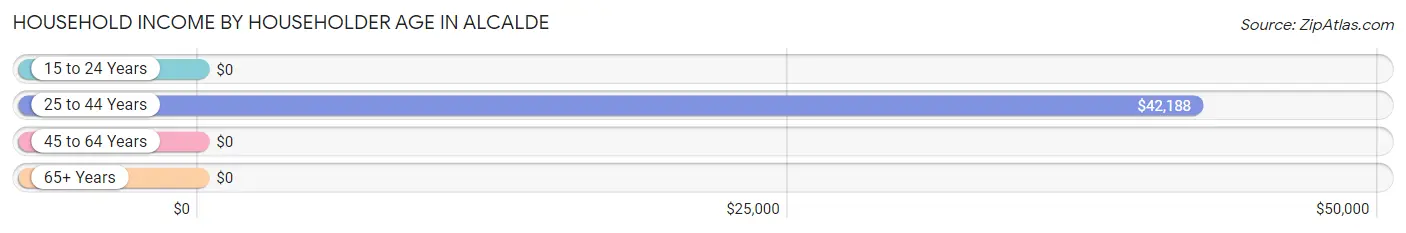
| Income Bracket | # Households | Median Income |
| 15 to 24 Years | 0 (0.0%) | $0 |
| 25 to 44 Years | 33 (37.9%) | $42,188 |
| 45 to 64 Years | 29 (33.3%) | $0 |
| 65+ Years | 25 (28.7%) | $0 |
| Total | 87 (100.0%) | $42,813 |
Poverty in Alcalde
Income Below Poverty by Sex and Age in Alcalde
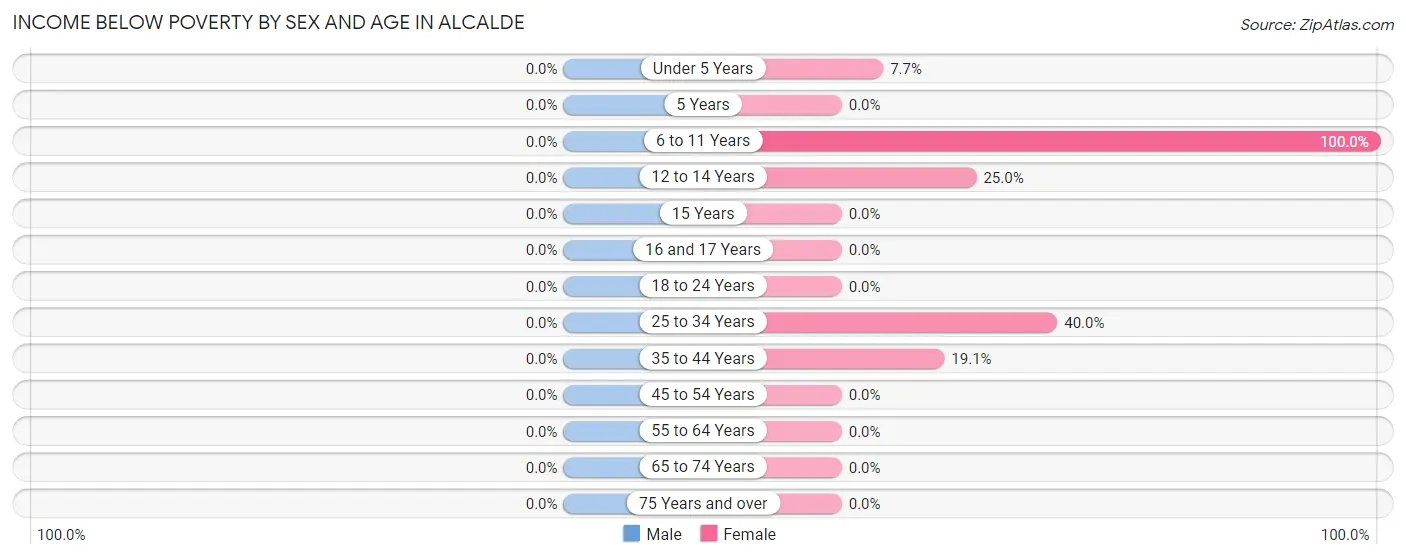
| Age Bracket | Male | Female |
| Under 5 Years | 0 (0.0%) | 1 (7.7%) |
| 5 Years | 0 (0.0%) | 0 (0.0%) |
| 6 to 11 Years | 0 (0.0%) | 10 (100.0%) |
| 12 to 14 Years | 0 (0.0%) | 3 (25.0%) |
| 15 Years | 0 (0.0%) | 0 (0.0%) |
| 16 and 17 Years | 0 (0.0%) | 0 (0.0%) |
| 18 to 24 Years | 0 (0.0%) | 0 (0.0%) |
| 25 to 34 Years | 0 (0.0%) | 2 (40.0%) |
| 35 to 44 Years | 0 (0.0%) | 4 (19.1%) |
| 45 to 54 Years | 0 (0.0%) | 0 (0.0%) |
| 55 to 64 Years | 0 (0.0%) | 0 (0.0%) |
| 65 to 74 Years | 0 (0.0%) | 0 (0.0%) |
| 75 Years and over | 0 (0.0%) | 0 (0.0%) |
| Total | 0 (0.0%) | 20 (14.0%) |
Income Above Poverty by Sex and Age in Alcalde
According to the poverty statistics in Alcalde, males aged under 5 years and females aged 16 and 17 years are the age groups that are most secure financially, with 100.0% of males and 100.0% of females in these age groups living above the poverty line.
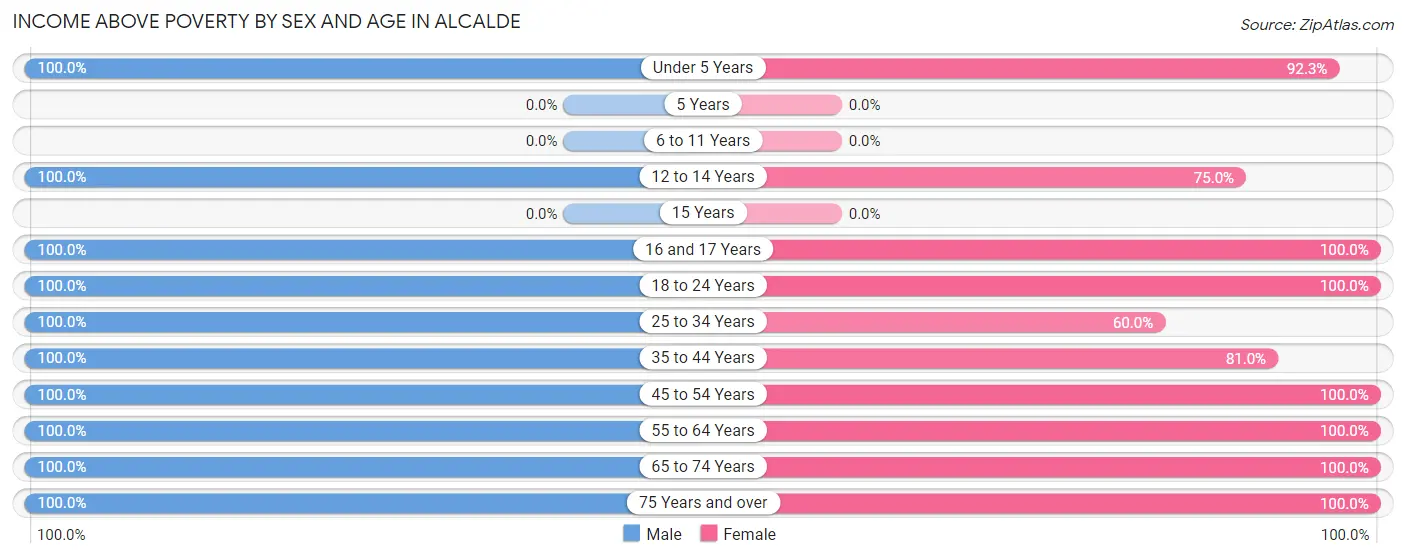
| Age Bracket | Male | Female |
| Under 5 Years | 5 (100.0%) | 12 (92.3%) |
| 5 Years | 0 (0.0%) | 0 (0.0%) |
| 6 to 11 Years | 0 (0.0%) | 0 (0.0%) |
| 12 to 14 Years | 5 (100.0%) | 9 (75.0%) |
| 15 Years | 0 (0.0%) | 0 (0.0%) |
| 16 and 17 Years | 4 (100.0%) | 4 (100.0%) |
| 18 to 24 Years | 8 (100.0%) | 34 (100.0%) |
| 25 to 34 Years | 13 (100.0%) | 3 (60.0%) |
| 35 to 44 Years | 19 (100.0%) | 17 (80.9%) |
| 45 to 54 Years | 14 (100.0%) | 11 (100.0%) |
| 55 to 64 Years | 16 (100.0%) | 16 (100.0%) |
| 65 to 74 Years | 4 (100.0%) | 13 (100.0%) |
| 75 Years and over | 4 (100.0%) | 4 (100.0%) |
| Total | 92 (100.0%) | 123 (86.0%) |
Income Below Poverty Among Married-Couple Families in Alcalde
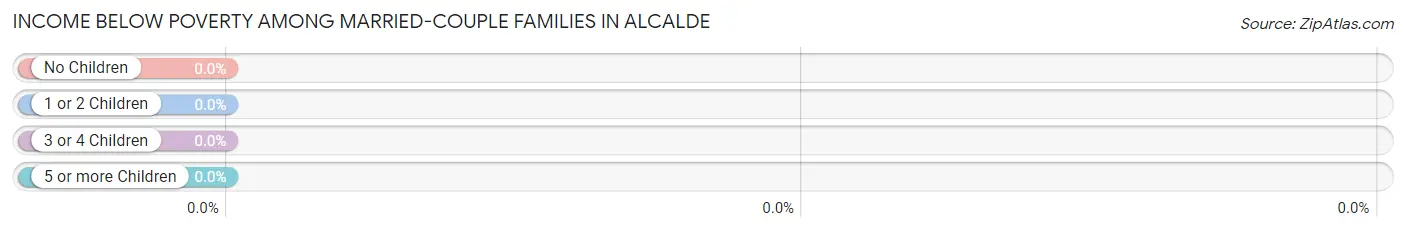
| Children | Above Poverty | Below Poverty |
| No Children | 15 (100.0%) | 0 (0.0%) |
| 1 or 2 Children | 8 (100.0%) | 0 (0.0%) |
| 3 or 4 Children | 0 (0.0%) | 0 (0.0%) |
| 5 or more Children | 0 (0.0%) | 0 (0.0%) |
| Total | 23 (100.0%) | 0 (0.0%) |
Income Below Poverty Among Single-Parent Households in Alcalde
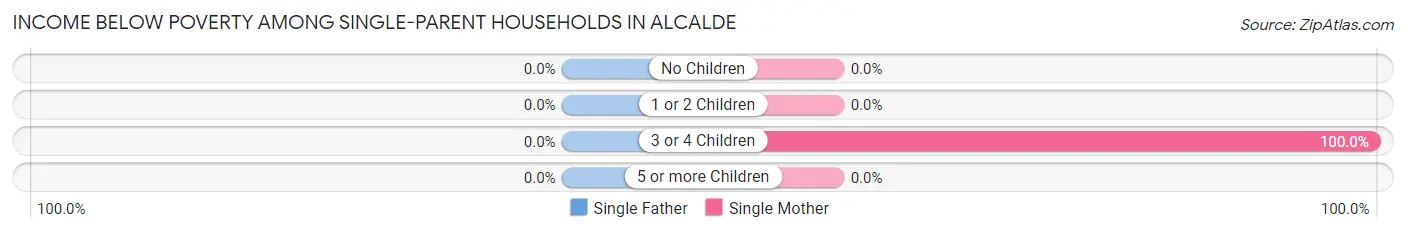
| Children | Single Father | Single Mother |
| No Children | 0 (0.0%) | 0 (0.0%) |
| 1 or 2 Children | 0 (0.0%) | 0 (0.0%) |
| 3 or 4 Children | 0 (0.0%) | 2 (100.0%) |
| 5 or more Children | 0 (0.0%) | 0 (0.0%) |
| Total | 0 (0.0%) | 2 (9.5%) |
Income Below Poverty Among Married-Couple vs Single-Parent Households in Alcalde
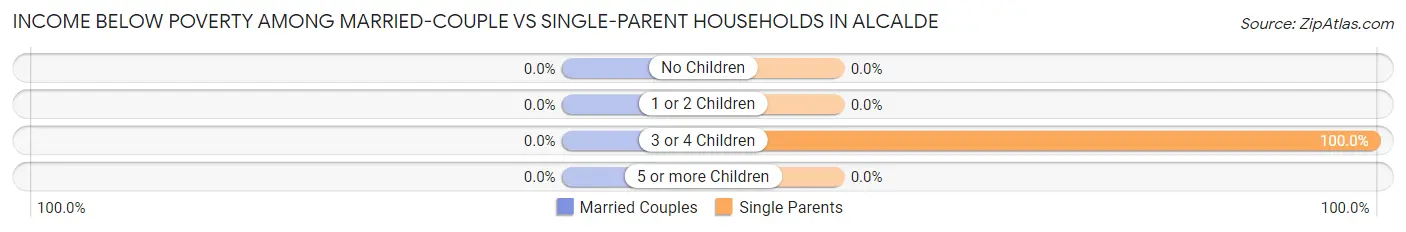
| Children | Married-Couple Families | Single-Parent Households |
| No Children | 0 (0.0%) | 0 (0.0%) |
| 1 or 2 Children | 0 (0.0%) | 0 (0.0%) |
| 3 or 4 Children | 0 (0.0%) | 2 (100.0%) |
| 5 or more Children | 0 (0.0%) | 0 (0.0%) |
| Total | 0 (0.0%) | 2 (6.5%) |
Race in Alcalde
The most populous races in Alcalde are Hispanic or Latino (232 | 98.7%), Some other Race (96 | 40.8%), and Two or more Races (79 | 33.6%).
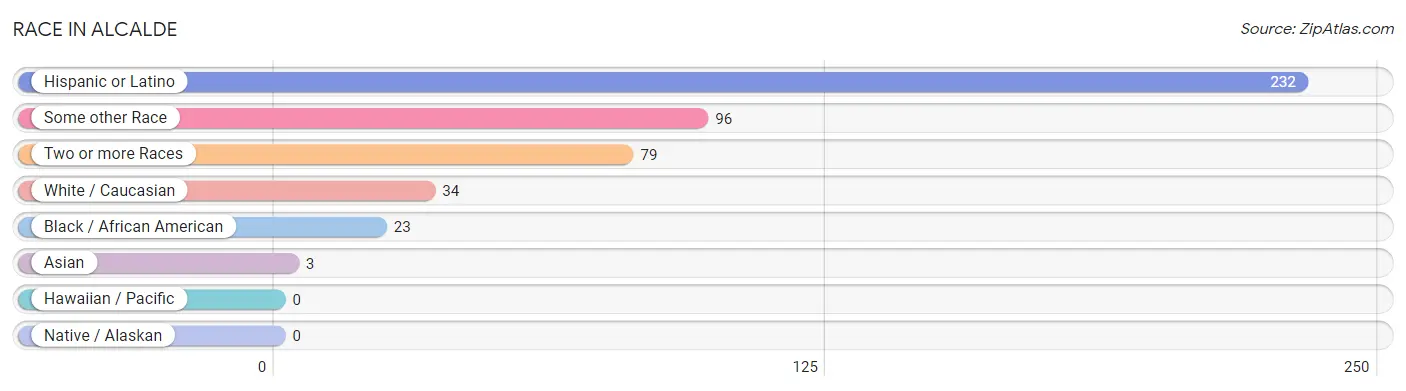
| Race | # Population | % Population |
| Asian | 3 | 1.3% |
| Black / African American | 23 | 9.8% |
| Hawaiian / Pacific | 0 | 0.0% |
| Hispanic or Latino | 232 | 98.7% |
| Native / Alaskan | 0 | 0.0% |
| White / Caucasian | 34 | 14.5% |
| Two or more Races | 79 | 33.6% |
| Some other Race | 96 | 40.8% |
| Total | 235 | 100.0% |
Ancestry in Alcalde
The most populous ancestries reported in Alcalde are Spanish (81 | 34.5%), Mexican (66 | 28.1%), Spaniard (39 | 16.6%), Spanish American (26 | 11.1%), and African (8 | 3.4%), together accounting for 93.6% of all Alcalde residents.
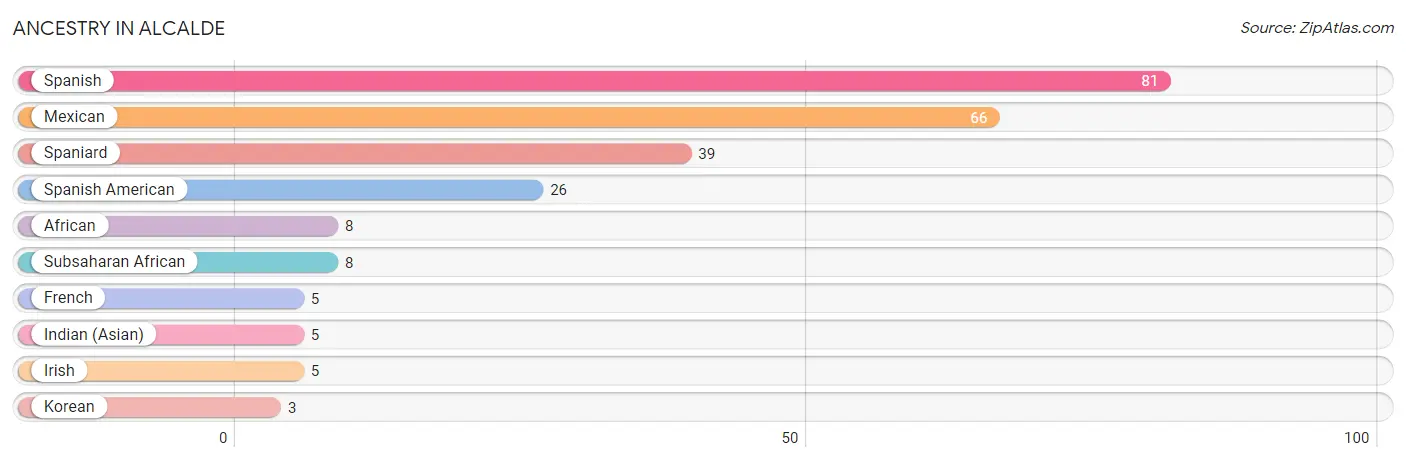
| Ancestry | # Population | % Population |
| African | 8 | 3.4% |
| French | 5 | 2.1% |
| Indian (Asian) | 5 | 2.1% |
| Irish | 5 | 2.1% |
| Korean | 3 | 1.3% |
| Mexican | 66 | 28.1% |
| Spaniard | 39 | 16.6% |
| Spanish | 81 | 34.5% |
| Spanish American | 26 | 11.1% |
| Subsaharan African | 8 | 3.4% | View All 10 Rows |
Immigrants in Alcalde
The most numerous immigrant groups reported in Alcalde came from Africa (2 | 0.9%), Eastern Africa (2 | 0.9%), and Kenya (2 | 0.9%), together accounting for 2.6% of all Alcalde residents.
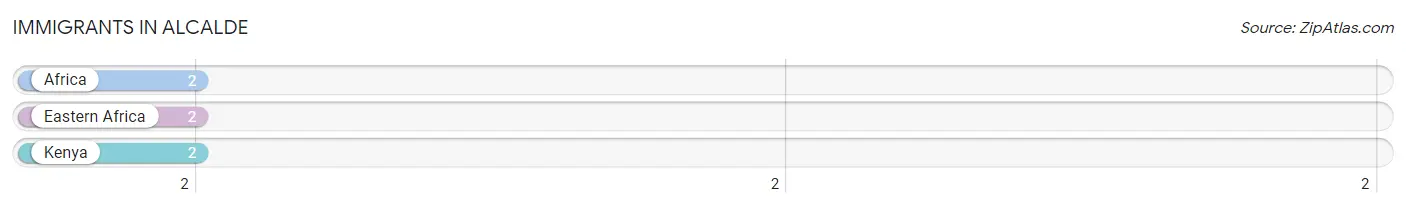
| Immigration Origin | # Population | % Population |
| Africa | 2 | 0.9% |
| Eastern Africa | 2 | 0.9% |
| Kenya | 2 | 0.9% | View All 3 Rows |
Sex and Age in Alcalde
Sex and Age in Alcalde
The most populous age groups in Alcalde are 25 to 29 Years (13 | 14.1%) for men and 20 to 24 Years (23 | 16.1%) for women.
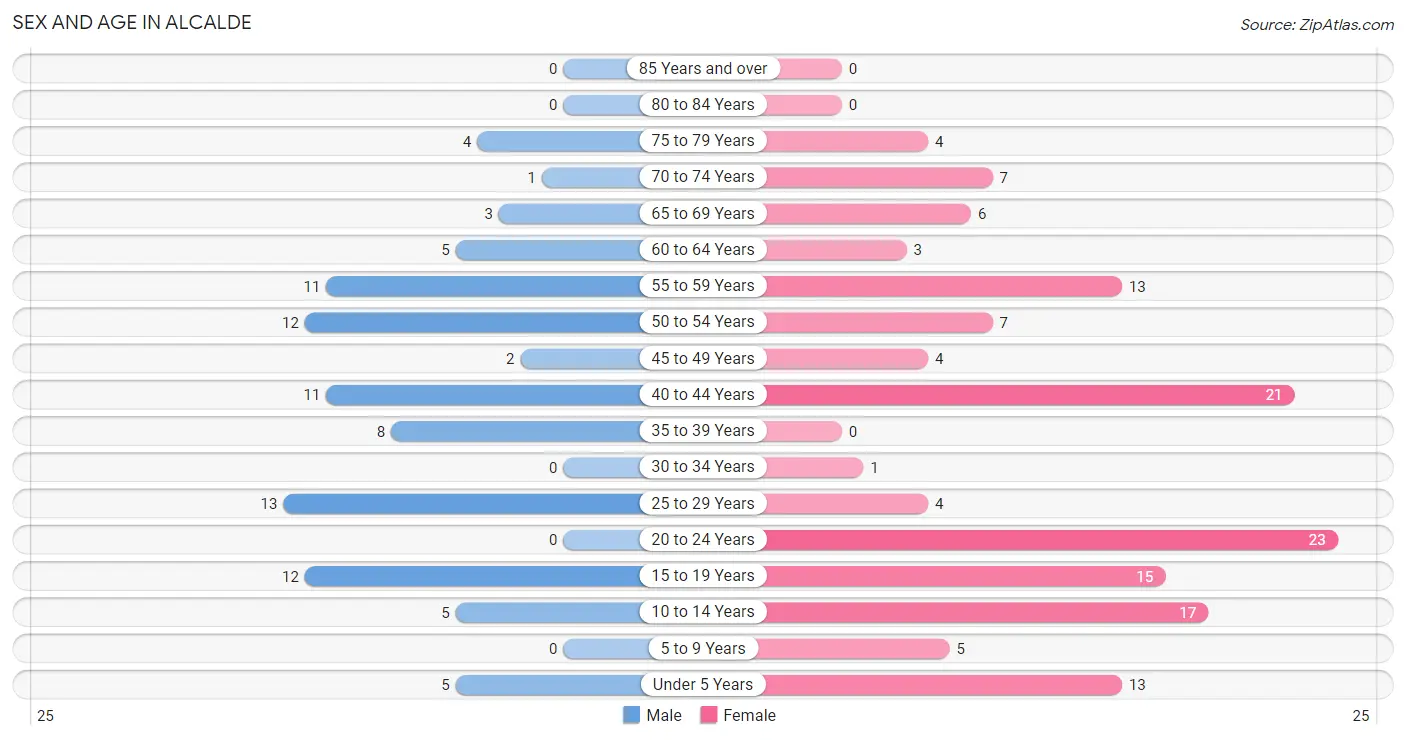
| Age Bracket | Male | Female |
| Under 5 Years | 5 (5.4%) | 13 (9.1%) |
| 5 to 9 Years | 0 (0.0%) | 5 (3.5%) |
| 10 to 14 Years | 5 (5.4%) | 17 (11.9%) |
| 15 to 19 Years | 12 (13.0%) | 15 (10.5%) |
| 20 to 24 Years | 0 (0.0%) | 23 (16.1%) |
| 25 to 29 Years | 13 (14.1%) | 4 (2.8%) |
| 30 to 34 Years | 0 (0.0%) | 1 (0.7%) |
| 35 to 39 Years | 8 (8.7%) | 0 (0.0%) |
| 40 to 44 Years | 11 (12.0%) | 21 (14.7%) |
| 45 to 49 Years | 2 (2.2%) | 4 (2.8%) |
| 50 to 54 Years | 12 (13.0%) | 7 (4.9%) |
| 55 to 59 Years | 11 (12.0%) | 13 (9.1%) |
| 60 to 64 Years | 5 (5.4%) | 3 (2.1%) |
| 65 to 69 Years | 3 (3.3%) | 6 (4.2%) |
| 70 to 74 Years | 1 (1.1%) | 7 (4.9%) |
| 75 to 79 Years | 4 (4.3%) | 4 (2.8%) |
| 80 to 84 Years | 0 (0.0%) | 0 (0.0%) |
| 85 Years and over | 0 (0.0%) | 0 (0.0%) |
| Total | 92 (100.0%) | 143 (100.0%) |
Families and Households in Alcalde
Median Family Size in Alcalde
The median family size in Alcalde is 3.56 persons per family, with single female/mother families (21 | 38.9%) accounting for the largest median family size of 4.52 persons per family. On the other hand, married-couple families (23 | 42.6%) represent the smallest median family size with 2.87 persons per family.
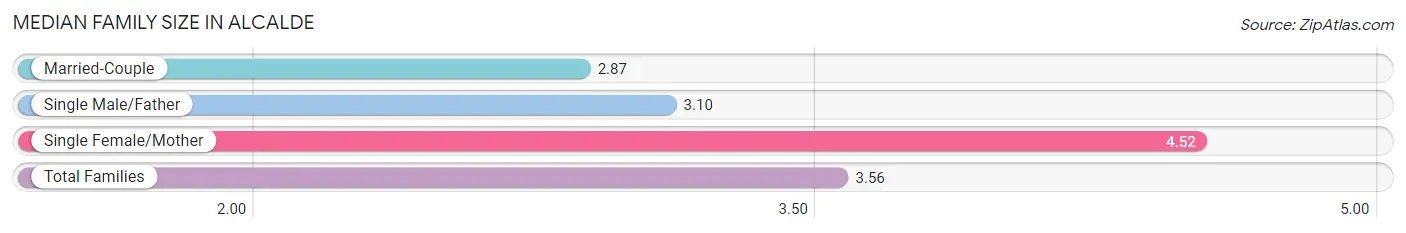
| Family Type | # Families | Family Size |
| Married-Couple | 23 (42.6%) | 2.87 |
| Single Male/Father | 10 (18.5%) | 3.10 |
| Single Female/Mother | 21 (38.9%) | 4.52 |
| Total Families | 54 (100.0%) | 3.56 |
Median Household Size in Alcalde
The median household size in Alcalde is 2.70 persons per household, with single female/mother households (21 | 24.1%) accounting for the largest median household size of 4.81 persons per household. non-family households (33 | 37.9%) represent the smallest median household size with 1.12 persons per household.
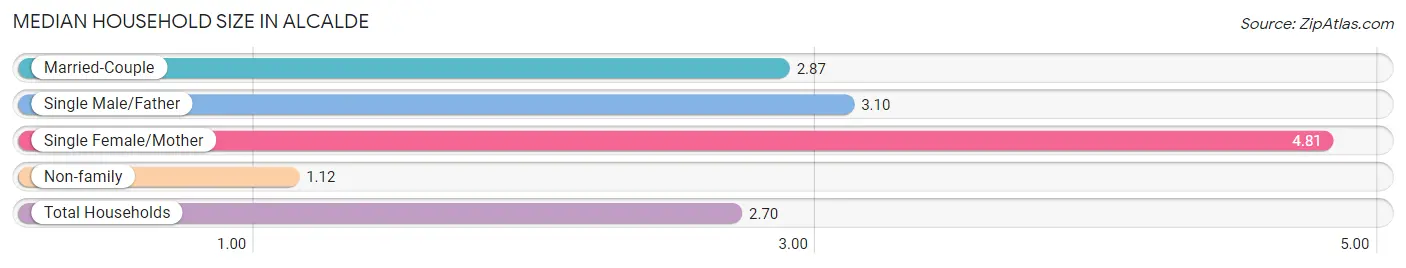
| Household Type | # Households | Household Size |
| Married-Couple | 23 (26.4%) | 2.87 |
| Single Male/Father | 10 (11.5%) | 3.10 |
| Single Female/Mother | 21 (24.1%) | 4.81 |
| Non-family | 33 (37.9%) | 1.12 |
| Total Households | 87 (100.0%) | 2.70 |
Household Size by Marriage Status in Alcalde
Out of a total of 87 households in Alcalde, 54 (62.1%) are family households, while 33 (37.9%) are nonfamily households. The most numerous type of family households are 2-person households, comprising 31, and the most common type of nonfamily households are 1-person households, comprising 30.
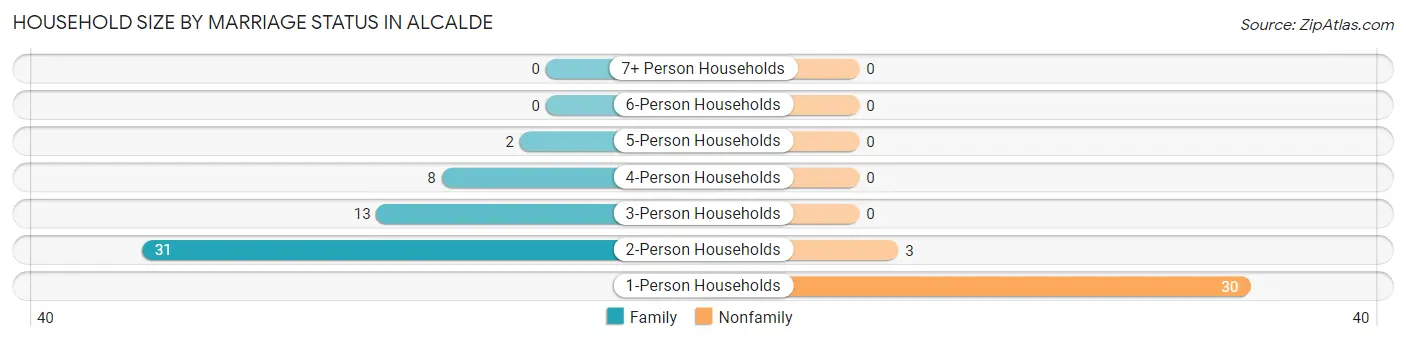
| Household Size | Family Households | Nonfamily Households |
| 1-Person Households | - | 30 (34.5%) |
| 2-Person Households | 31 (35.6%) | 3 (3.5%) |
| 3-Person Households | 13 (14.9%) | 0 (0.0%) |
| 4-Person Households | 8 (9.2%) | 0 (0.0%) |
| 5-Person Households | 2 (2.3%) | 0 (0.0%) |
| 6-Person Households | 0 (0.0%) | 0 (0.0%) |
| 7+ Person Households | 0 (0.0%) | 0 (0.0%) |
| Total | 54 (62.1%) | 33 (37.9%) |
Female Fertility in Alcalde
Fertility by Age in Alcalde
Average fertility rate in Alcalde is 59.0 births per 1,000 women. Women in the age bracket of 35 to 50 years have the highest fertility rate with 160.0 births per 1,000 women. Women in the age bracket of 35 to 50 years acount for 100.0% of all women with births.
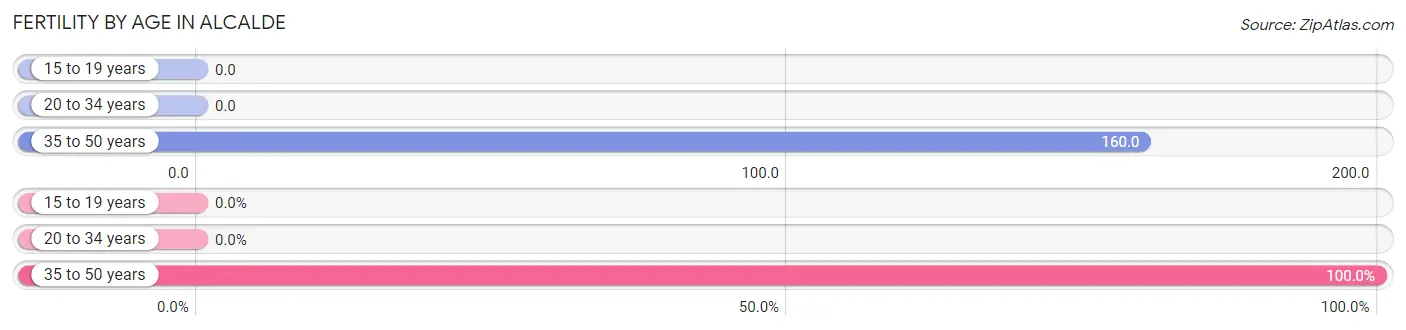
| Age Bracket | Women with Births | Births / 1,000 Women |
| 15 to 19 years | 0 (0.0%) | 0.0 |
| 20 to 34 years | 0 (0.0%) | 0.0 |
| 35 to 50 years | 4 (100.0%) | 160.0 |
| Total | 4 (100.0%) | 59.0 |
Fertility by Age by Marriage Status in Alcalde
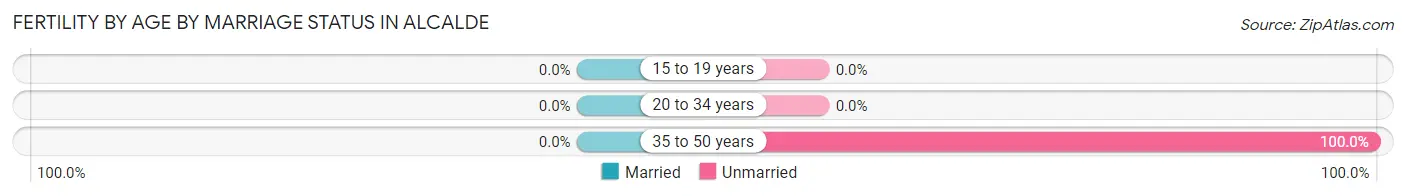
| Age Bracket | Married | Unmarried |
| 15 to 19 years | 0 (0.0%) | 0 (0.0%) |
| 20 to 34 years | 0 (0.0%) | 0 (0.0%) |
| 35 to 50 years | 0 (0.0%) | 4 (100.0%) |
| Total | 0 (0.0%) | 4 (100.0%) |
Fertility by Education in Alcalde
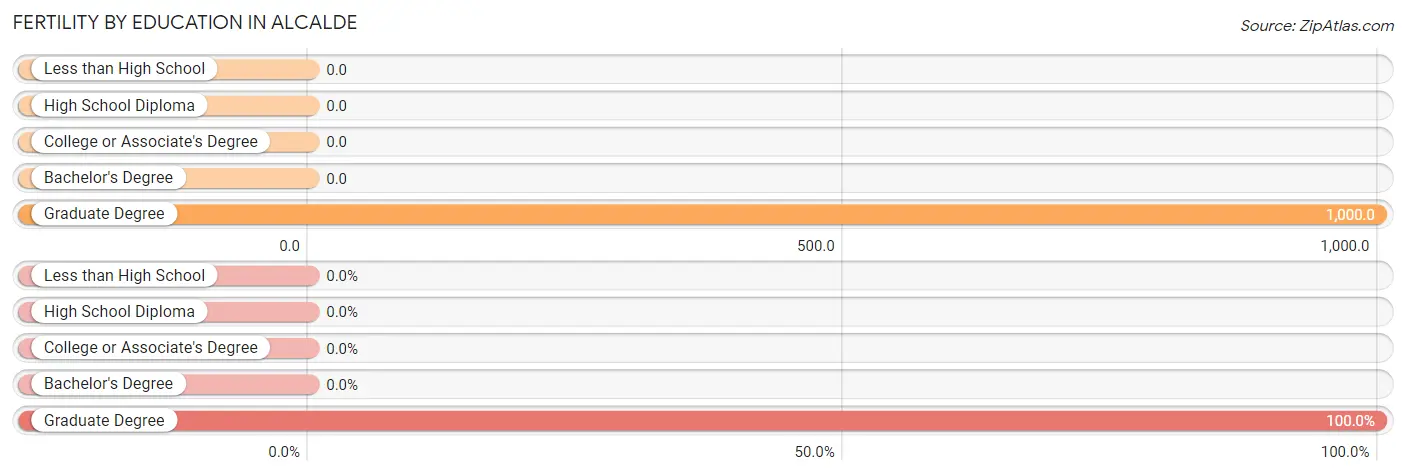
| Educational Attainment | Women with Births | Births / 1,000 Women |
| Less than High School | 0 (0.0%) | 0.0 |
| High School Diploma | 0 (0.0%) | 0.0 |
| College or Associate's Degree | 0 (0.0%) | 0.0 |
| Bachelor's Degree | 0 (0.0%) | 0.0 |
| Graduate Degree | 4 (100.0%) | 1,000.0 |
| Total | 4 (100.0%) | 59.0 |
Fertility by Education by Marriage Status in Alcalde
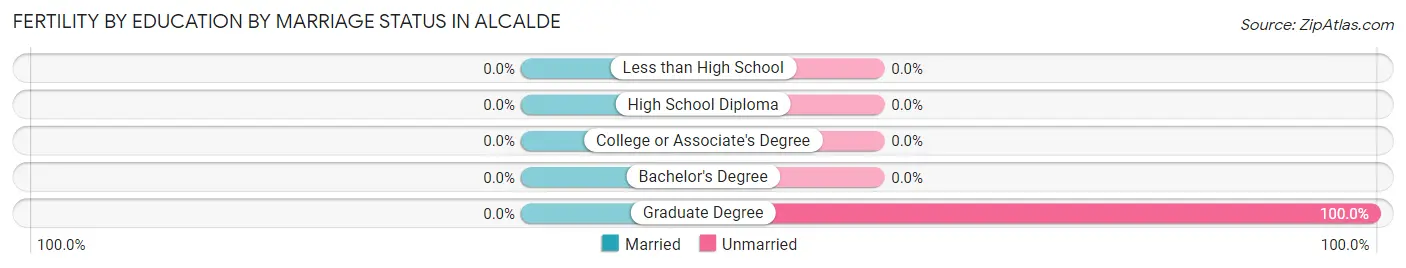
| Educational Attainment | Married | Unmarried |
| Less than High School | 0 (0.0%) | 0 (0.0%) |
| High School Diploma | 0 (0.0%) | 0 (0.0%) |
| College or Associate's Degree | 0 (0.0%) | 0 (0.0%) |
| Bachelor's Degree | 0 (0.0%) | 0 (0.0%) |
| Graduate Degree | 0 (0.0%) | 4 (100.0%) |
| Total | 0 (0.0%) | 4 (100.0%) |
Employment Characteristics in Alcalde
Employment by Class of Employer in Alcalde
Among the 90 employed individuals in Alcalde, private company employees (35 | 38.9%), not-for-profit organizations (17 | 18.9%), and state government employees (13 | 14.4%) make up the most common classes of employment.
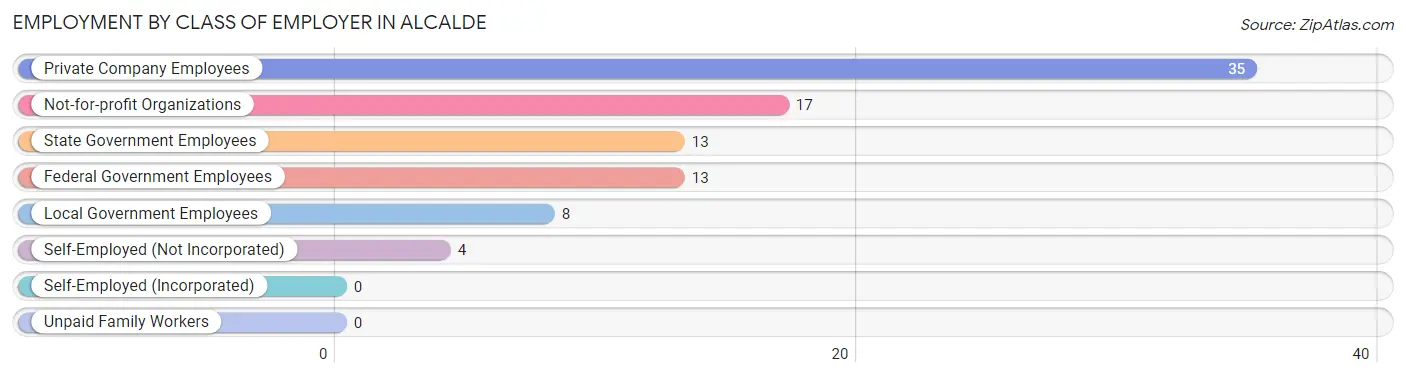
| Employer Class | # Employees | % Employees |
| Private Company Employees | 35 | 38.9% |
| Self-Employed (Incorporated) | 0 | 0.0% |
| Self-Employed (Not Incorporated) | 4 | 4.4% |
| Not-for-profit Organizations | 17 | 18.9% |
| Local Government Employees | 8 | 8.9% |
| State Government Employees | 13 | 14.4% |
| Federal Government Employees | 13 | 14.4% |
| Unpaid Family Workers | 0 | 0.0% |
| Total | 90 | 100.0% |
Employment Status by Age in Alcalde
According to the labor force statistics for Alcalde, out of the total population over 16 years of age (190), 48.4% or 92 individuals are in the labor force, with 2.2% or 2 of them unemployed. The age group with the highest labor force participation rate is 25 to 29 years, with 100.0% or 17 individuals in the labor force. Within the labor force, the 25 to 29 years age range has the highest percentage of unemployed individuals, with 11.8% or 2 of them being unemployed.
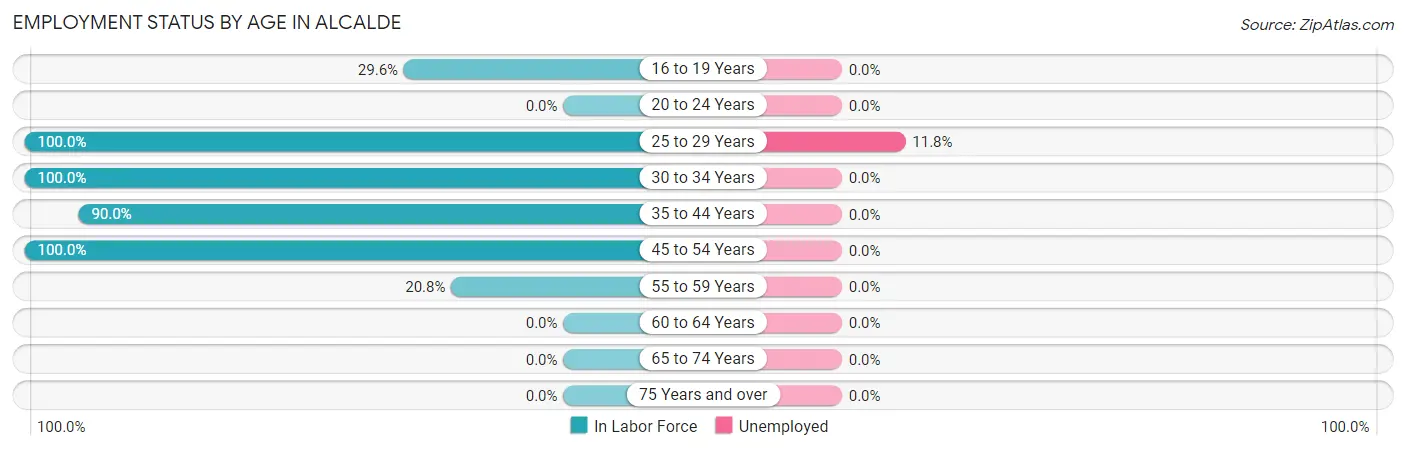
| Age Bracket | In Labor Force | Unemployed |
| 16 to 19 Years | 8 (29.6%) | 0 (0.0%) |
| 20 to 24 Years | 0 (0.0%) | 0 (0.0%) |
| 25 to 29 Years | 17 (100.0%) | 2 (11.8%) |
| 30 to 34 Years | 1 (100.0%) | 0 (0.0%) |
| 35 to 44 Years | 36 (90.0%) | 0 (0.0%) |
| 45 to 54 Years | 25 (100.0%) | 0 (0.0%) |
| 55 to 59 Years | 5 (20.8%) | 0 (0.0%) |
| 60 to 64 Years | 0 (0.0%) | 0 (0.0%) |
| 65 to 74 Years | 0 (0.0%) | 0 (0.0%) |
| 75 Years and over | 0 (0.0%) | 0 (0.0%) |
| Total | 92 (48.4%) | 2 (2.2%) |
Employment Status by Educational Attainment in Alcalde
According to labor force statistics for Alcalde, 73.0% of individuals (84) out of the total population between 25 and 64 years of age (115) are in the labor force, with 2.4% or 2 of them being unemployed. The group with the highest labor force participation rate are those with the educational attainment of college / associate degree, with 100.0% or 33 individuals in the labor force. Within the labor force, individuals with high school diploma education have the highest percentage of unemployment, with 10.0% or 2 of them being unemployed.
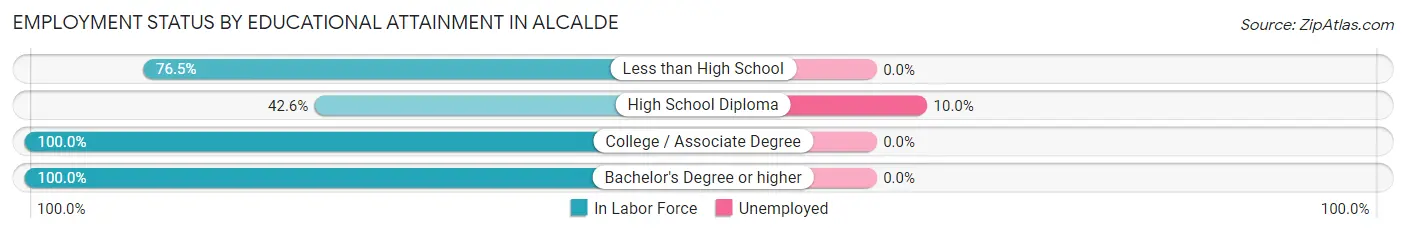
| Educational Attainment | In Labor Force | Unemployed |
| Less than High School | 13 (76.5%) | 0 (0.0%) |
| High School Diploma | 20 (42.6%) | 5 (10.0%) |
| College / Associate Degree | 33 (100.0%) | 0 (0.0%) |
| Bachelor's Degree or higher | 18 (100.0%) | 0 (0.0%) |
| Total | 84 (73.0%) | 3 (2.4%) |
Employment Occupations by Sex in Alcalde
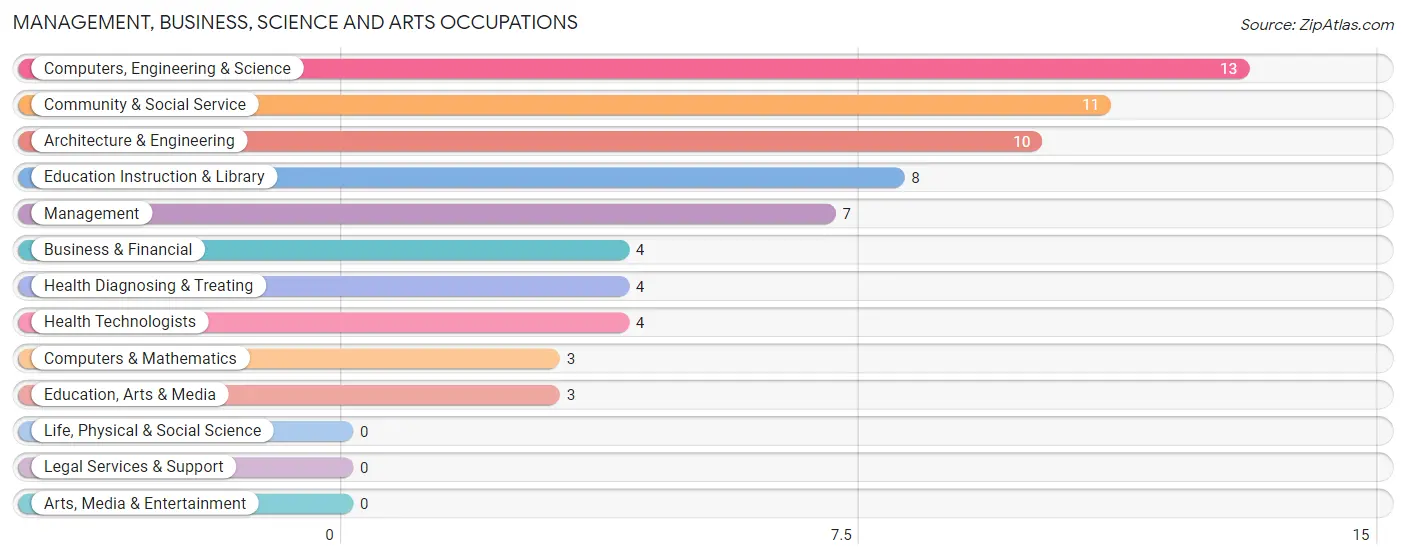
Management, Business, Science and Arts Occupations
The most common Management, Business, Science and Arts occupations in Alcalde are Computers, Engineering & Science (13 | 14.4%), Community & Social Service (11 | 12.2%), Architecture & Engineering (10 | 11.1%), Education Instruction & Library (8 | 8.9%), and Management (7 | 7.8%).
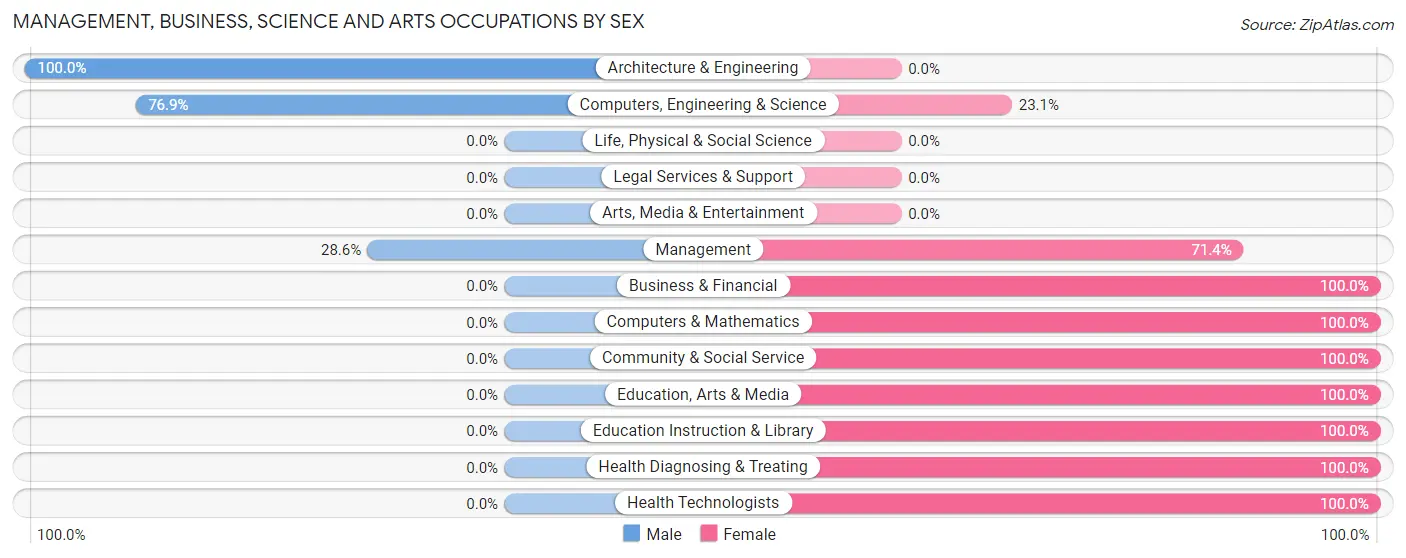
Management, Business, Science and Arts Occupations by Sex
Within the Management, Business, Science and Arts occupations in Alcalde, the most male-oriented occupations are Architecture & Engineering (100.0%), Computers, Engineering & Science (76.9%), and Management (28.6%), while the most female-oriented occupations are Business & Financial (100.0%), Computers & Mathematics (100.0%), and Community & Social Service (100.0%).
| Occupation | Male | Female |
| Management | 2 (28.6%) | 5 (71.4%) |
| Business & Financial | 0 (0.0%) | 4 (100.0%) |
| Computers, Engineering & Science | 10 (76.9%) | 3 (23.1%) |
| Computers & Mathematics | 0 (0.0%) | 3 (100.0%) |
| Architecture & Engineering | 10 (100.0%) | 0 (0.0%) |
| Life, Physical & Social Science | 0 (0.0%) | 0 (0.0%) |
| Community & Social Service | 0 (0.0%) | 11 (100.0%) |
| Education, Arts & Media | 0 (0.0%) | 3 (100.0%) |
| Legal Services & Support | 0 (0.0%) | 0 (0.0%) |
| Education Instruction & Library | 0 (0.0%) | 8 (100.0%) |
| Arts, Media & Entertainment | 0 (0.0%) | 0 (0.0%) |
| Health Diagnosing & Treating | 0 (0.0%) | 4 (100.0%) |
| Health Technologists | 0 (0.0%) | 4 (100.0%) |
| Total (Category) | 12 (30.8%) | 27 (69.2%) |
| Total (Overall) | 54 (60.0%) | 36 (40.0%) |
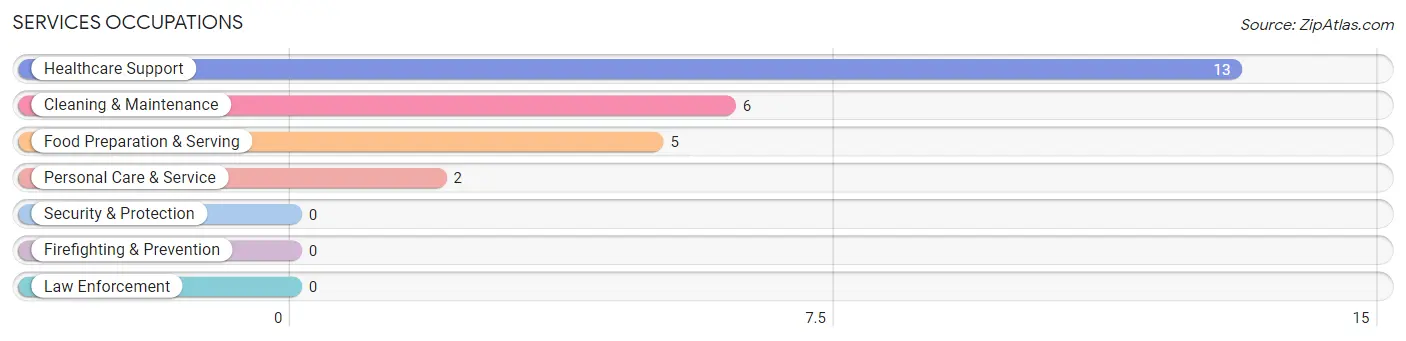
Services Occupations
The most common Services occupations in Alcalde are Healthcare Support (13 | 14.4%), Cleaning & Maintenance (6 | 6.7%), Food Preparation & Serving (5 | 5.6%), and Personal Care & Service (2 | 2.2%).
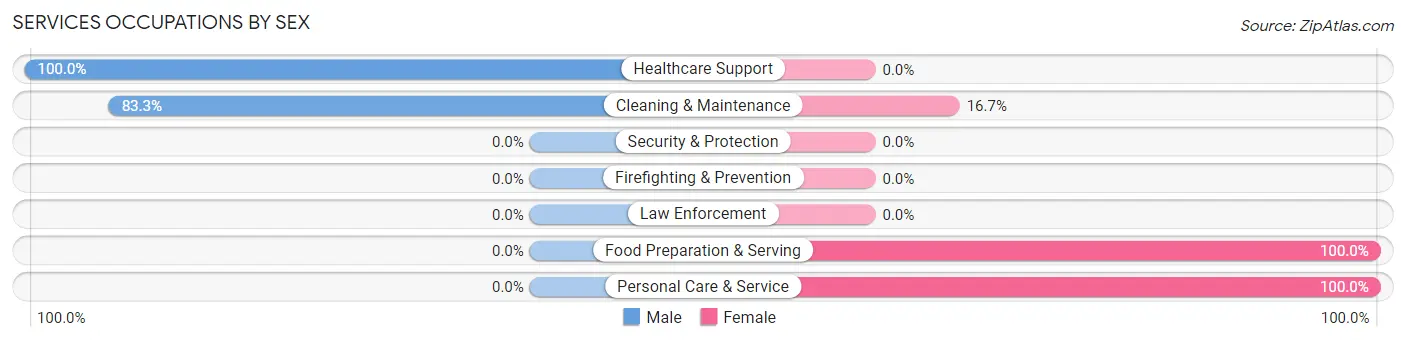
Services Occupations by Sex
Within the Services occupations in Alcalde, the most male-oriented occupations are Healthcare Support (100.0%), and Cleaning & Maintenance (83.3%), while the most female-oriented occupations are Food Preparation & Serving (100.0%), Personal Care & Service (100.0%), and Cleaning & Maintenance (16.7%).
| Occupation | Male | Female |
| Healthcare Support | 13 (100.0%) | 0 (0.0%) |
| Security & Protection | 0 (0.0%) | 0 (0.0%) |
| Firefighting & Prevention | 0 (0.0%) | 0 (0.0%) |
| Law Enforcement | 0 (0.0%) | 0 (0.0%) |
| Food Preparation & Serving | 0 (0.0%) | 5 (100.0%) |
| Cleaning & Maintenance | 5 (83.3%) | 1 (16.7%) |
| Personal Care & Service | 0 (0.0%) | 2 (100.0%) |
| Total (Category) | 18 (69.2%) | 8 (30.8%) |
| Total (Overall) | 54 (60.0%) | 36 (40.0%) |
Sales and Office Occupations
The most common Sales and Office occupations in Alcalde are , and Office & Administration (5 | 5.6%).
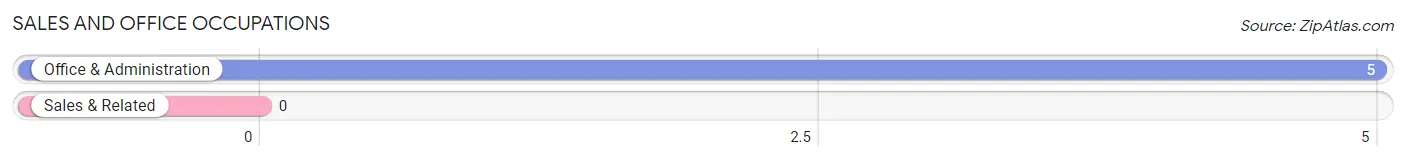
Sales and Office Occupations by Sex
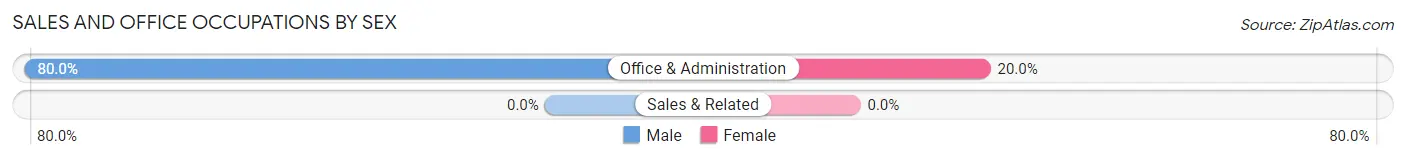
| Occupation | Male | Female |
| Sales & Related | 0 (0.0%) | 0 (0.0%) |
| Office & Administration | 4 (80.0%) | 1 (20.0%) |
| Total (Category) | 4 (80.0%) | 1 (20.0%) |
| Total (Overall) | 54 (60.0%) | 36 (40.0%) |
Natural Resources, Construction and Maintenance Occupations
The most common Natural Resources, Construction and Maintenance occupations in Alcalde are Installation, Maintenance & Repair (12 | 13.3%), and Construction & Extraction (8 | 8.9%).
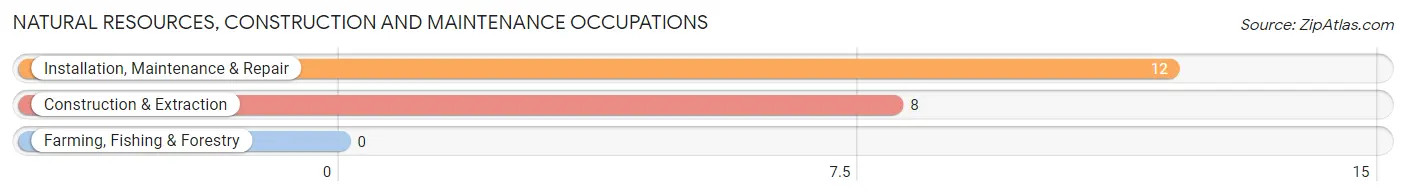
Natural Resources, Construction and Maintenance Occupations by Sex
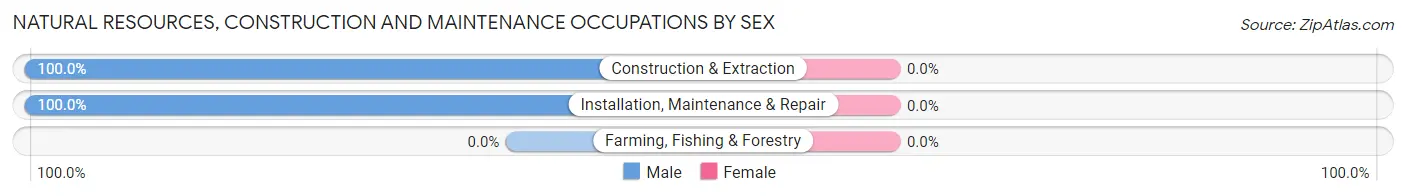
| Occupation | Male | Female |
| Farming, Fishing & Forestry | 0 (0.0%) | 0 (0.0%) |
| Construction & Extraction | 8 (100.0%) | 0 (0.0%) |
| Installation, Maintenance & Repair | 12 (100.0%) | 0 (0.0%) |
| Total (Category) | 20 (100.0%) | 0 (0.0%) |
| Total (Overall) | 54 (60.0%) | 36 (40.0%) |
Production, Transportation and Moving Occupations
Production, Transportation and Moving Occupations by Sex
| Occupation | Male | Female |
| Production | 0 (0.0%) | 0 (0.0%) |
| Transportation | 0 (0.0%) | 0 (0.0%) |
| Material Moving | 0 (0.0%) | 0 (0.0%) |
| Total (Category) | 0 (0.0%) | 0 (0.0%) |
| Total (Overall) | 54 (60.0%) | 36 (40.0%) |
Employment Industries by Sex in Alcalde
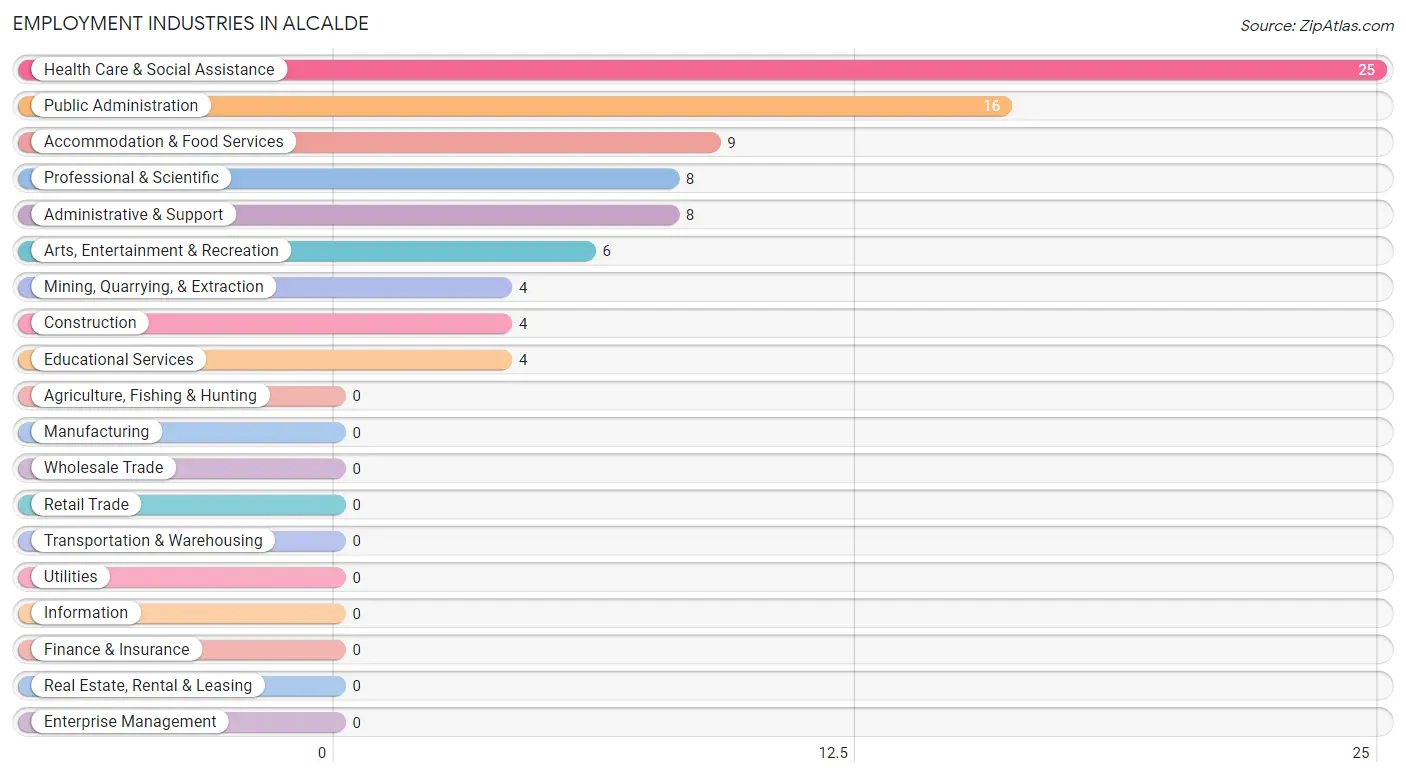
Employment Industries in Alcalde
The major employment industries in Alcalde include Health Care & Social Assistance (25 | 27.8%), Public Administration (16 | 17.8%), Accommodation & Food Services (9 | 10.0%), Professional & Scientific (8 | 8.9%), and Administrative & Support (8 | 8.9%).
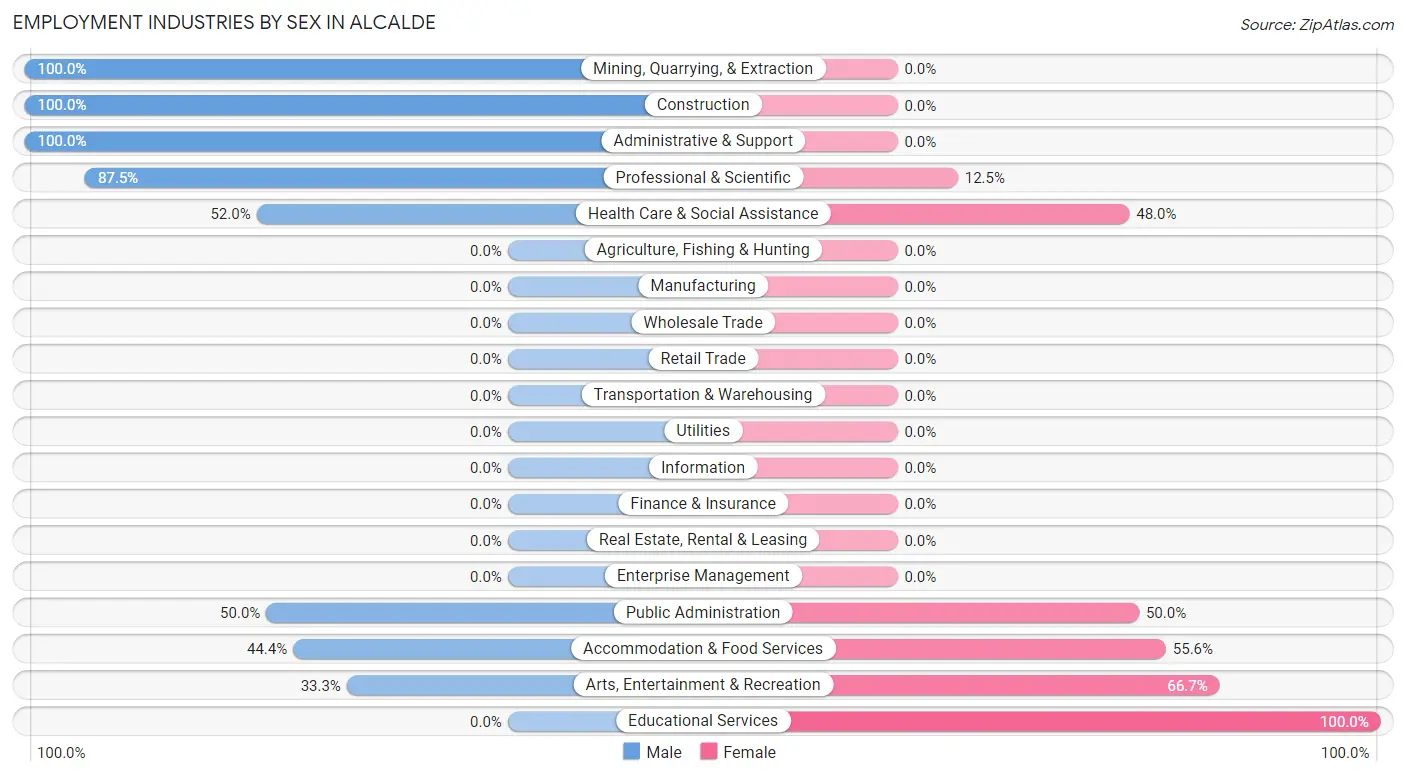
Employment Industries by Sex in Alcalde
The Alcalde industries that see more men than women are Mining, Quarrying, & Extraction (100.0%), Construction (100.0%), and Administrative & Support (100.0%), whereas the industries that tend to have a higher number of women are Educational Services (100.0%), Arts, Entertainment & Recreation (66.7%), and Accommodation & Food Services (55.6%).
| Industry | Male | Female |
| Agriculture, Fishing & Hunting | 0 (0.0%) | 0 (0.0%) |
| Mining, Quarrying, & Extraction | 4 (100.0%) | 0 (0.0%) |
| Construction | 4 (100.0%) | 0 (0.0%) |
| Manufacturing | 0 (0.0%) | 0 (0.0%) |
| Wholesale Trade | 0 (0.0%) | 0 (0.0%) |
| Retail Trade | 0 (0.0%) | 0 (0.0%) |
| Transportation & Warehousing | 0 (0.0%) | 0 (0.0%) |
| Utilities | 0 (0.0%) | 0 (0.0%) |
| Information | 0 (0.0%) | 0 (0.0%) |
| Finance & Insurance | 0 (0.0%) | 0 (0.0%) |
| Real Estate, Rental & Leasing | 0 (0.0%) | 0 (0.0%) |
| Professional & Scientific | 7 (87.5%) | 1 (12.5%) |
| Enterprise Management | 0 (0.0%) | 0 (0.0%) |
| Administrative & Support | 8 (100.0%) | 0 (0.0%) |
| Educational Services | 0 (0.0%) | 4 (100.0%) |
| Health Care & Social Assistance | 13 (52.0%) | 12 (48.0%) |
| Arts, Entertainment & Recreation | 2 (33.3%) | 4 (66.7%) |
| Accommodation & Food Services | 4 (44.4%) | 5 (55.6%) |
| Public Administration | 8 (50.0%) | 8 (50.0%) |
| Total | 54 (60.0%) | 36 (40.0%) |
Education in Alcalde
School Enrollment in Alcalde
The most common levels of schooling among the 68 students in Alcalde are high school (24 | 35.3%), middle school (17 | 25.0%), and college / undergraduate (11 | 16.2%).
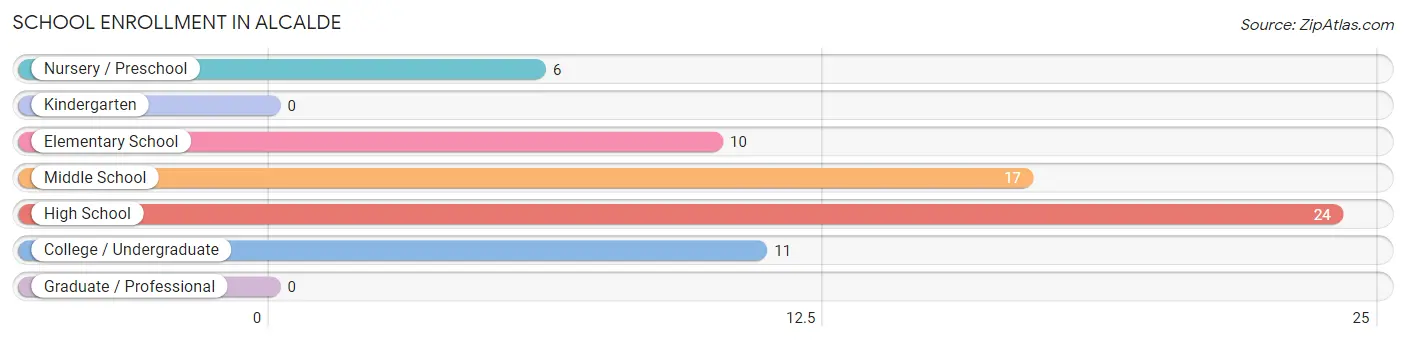
| School Level | # Students | % Students |
| Nursery / Preschool | 6 | 8.8% |
| Kindergarten | 0 | 0.0% |
| Elementary School | 10 | 14.7% |
| Middle School | 17 | 25.0% |
| High School | 24 | 35.3% |
| College / Undergraduate | 11 | 16.2% |
| Graduate / Professional | 0 | 0.0% |
| Total | 68 | 100.0% |
School Enrollment by Age by Funding Source in Alcalde
Out of a total of 68 students who are enrolled in schools in Alcalde, 8 (11.8%) attend a private institution, while the remaining 60 (88.2%) are enrolled in public schools. The age group of 5 to 9 year old has the highest likelihood of being enrolled in private schools, with 5 (100.0% in the age bracket) enrolled. Conversely, the age group of 3 to 4 year olds has the lowest likelihood of being enrolled in a private school, with 6 (100.0% in the age bracket) attending a public institution.
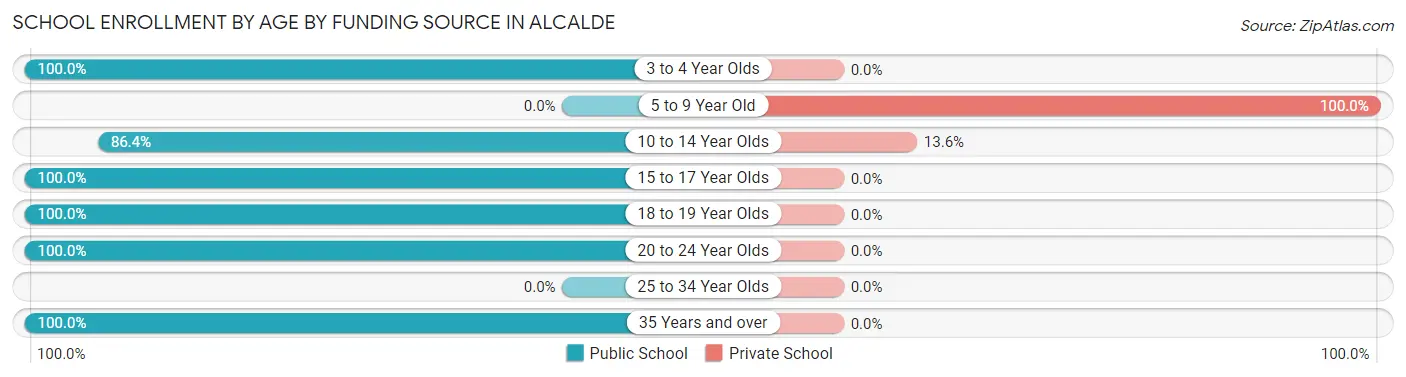
| Age Bracket | Public School | Private School |
| 3 to 4 Year Olds | 6 (100.0%) | 0 (0.0%) |
| 5 to 9 Year Old | 0 (0.0%) | 5 (100.0%) |
| 10 to 14 Year Olds | 19 (86.4%) | 3 (13.6%) |
| 15 to 17 Year Olds | 8 (100.0%) | 0 (0.0%) |
| 18 to 19 Year Olds | 11 (100.0%) | 0 (0.0%) |
| 20 to 24 Year Olds | 11 (100.0%) | 0 (0.0%) |
| 25 to 34 Year Olds | 0 (0.0%) | 0 (0.0%) |
| 35 Years and over | 5 (100.0%) | 0 (0.0%) |
| Total | 60 (88.2%) | 8 (11.8%) |
Educational Attainment by Field of Study in Alcalde
Engineering (7 | 36.8%), education (5 | 26.3%), business (4 | 21.0%), and communications (3 | 15.8%) are the most common fields of study among 19 individuals in Alcalde who have obtained a bachelor's degree or higher.
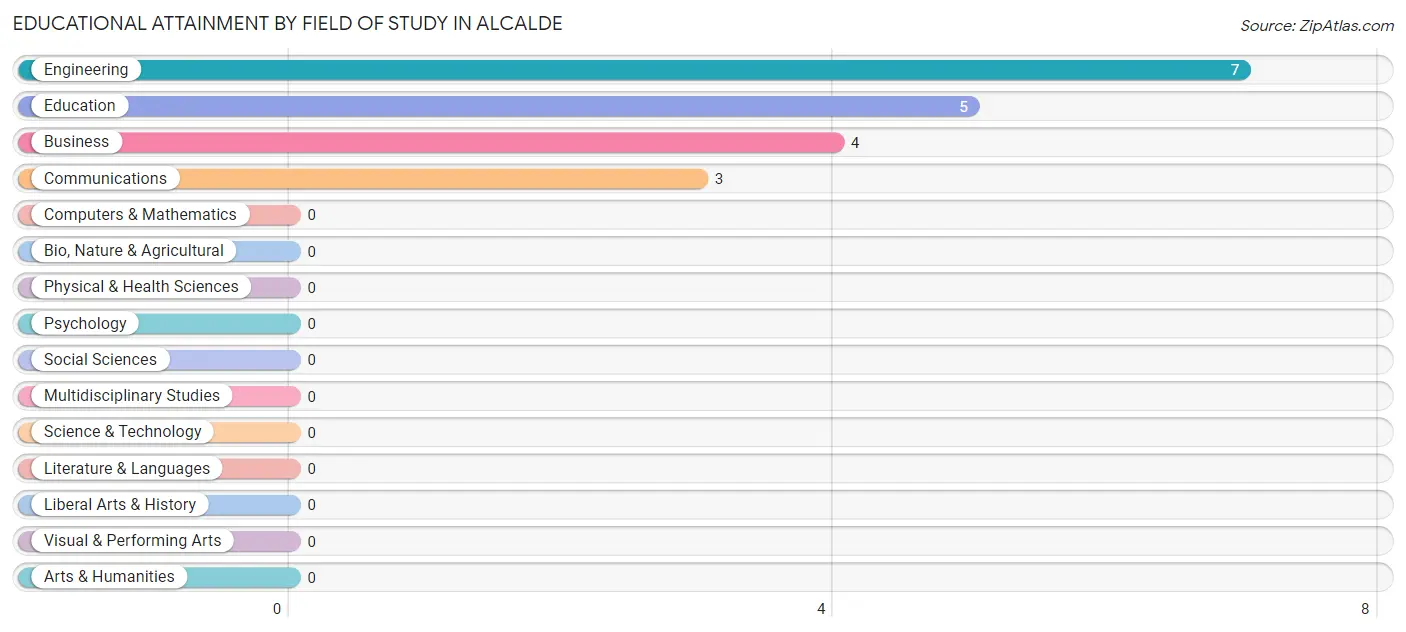
| Field of Study | # Graduates | % Graduates |
| Computers & Mathematics | 0 | 0.0% |
| Bio, Nature & Agricultural | 0 | 0.0% |
| Physical & Health Sciences | 0 | 0.0% |
| Psychology | 0 | 0.0% |
| Social Sciences | 0 | 0.0% |
| Engineering | 7 | 36.8% |
| Multidisciplinary Studies | 0 | 0.0% |
| Science & Technology | 0 | 0.0% |
| Business | 4 | 21.0% |
| Education | 5 | 26.3% |
| Literature & Languages | 0 | 0.0% |
| Liberal Arts & History | 0 | 0.0% |
| Visual & Performing Arts | 0 | 0.0% |
| Communications | 3 | 15.8% |
| Arts & Humanities | 0 | 0.0% |
| Total | 19 | 100.0% |
Transportation & Commute in Alcalde
Vehicle Availability by Sex in Alcalde
The most prevalent vehicle ownership categories in Alcalde are males with 2 vehicles (28, accounting for 51.8%) and females with 2 vehicles (19, making up 77.8%).
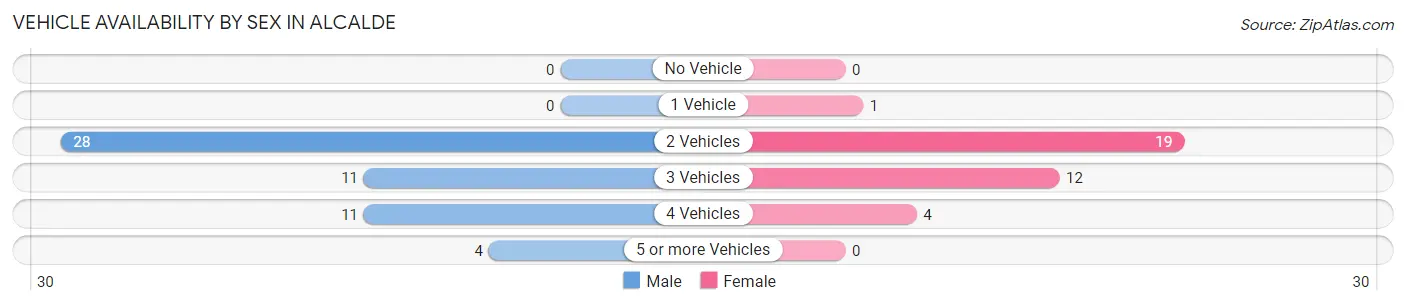
| Vehicles Available | Male | Female |
| No Vehicle | 0 (0.0%) | 0 (0.0%) |
| 1 Vehicle | 0 (0.0%) | 1 (2.8%) |
| 2 Vehicles | 28 (51.8%) | 19 (52.8%) |
| 3 Vehicles | 11 (20.4%) | 12 (33.3%) |
| 4 Vehicles | 11 (20.4%) | 4 (11.1%) |
| 5 or more Vehicles | 4 (7.4%) | 0 (0.0%) |
| Total | 54 (100.0%) | 36 (100.0%) |
Commute Time in Alcalde
The most frequently occuring commute durations in Alcalde are 40 to 44 minutes (23 commuters, 34.8%), 10 to 14 minutes (17 commuters, 25.8%), and 45 to 59 minutes (17 commuters, 25.8%).
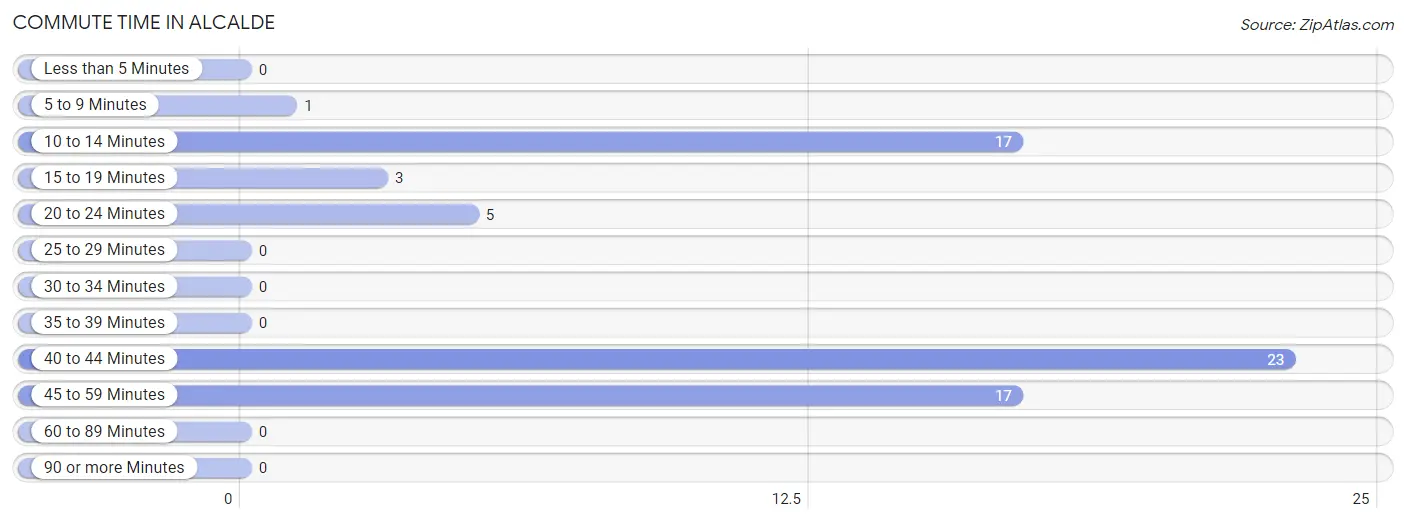
| Commute Time | # Commuters | % Commuters |
| Less than 5 Minutes | 0 | 0.0% |
| 5 to 9 Minutes | 1 | 1.5% |
| 10 to 14 Minutes | 17 | 25.8% |
| 15 to 19 Minutes | 3 | 4.5% |
| 20 to 24 Minutes | 5 | 7.6% |
| 25 to 29 Minutes | 0 | 0.0% |
| 30 to 34 Minutes | 0 | 0.0% |
| 35 to 39 Minutes | 0 | 0.0% |
| 40 to 44 Minutes | 23 | 34.8% |
| 45 to 59 Minutes | 17 | 25.8% |
| 60 to 89 Minutes | 0 | 0.0% |
| 90 or more Minutes | 0 | 0.0% |
Commute Time by Sex in Alcalde
The most common commute times in Alcalde are 10 to 14 minutes (12 commuters, 35.3%) for males and 40 to 44 minutes (17 commuters, 53.1%) for females.
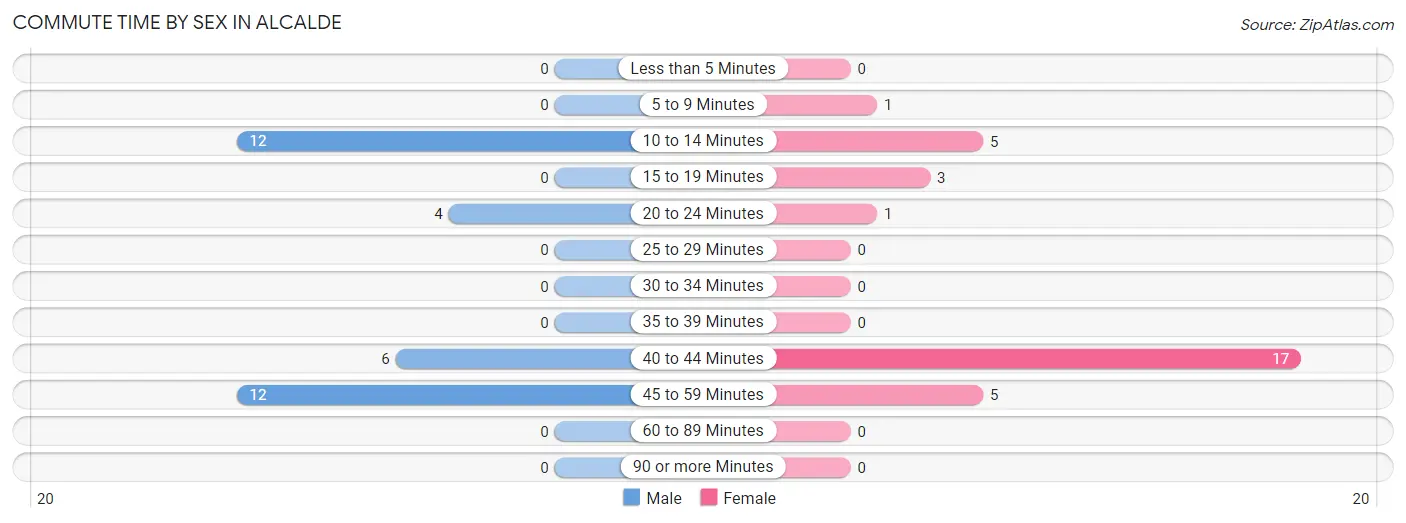
| Commute Time | Male | Female |
| Less than 5 Minutes | 0 (0.0%) | 0 (0.0%) |
| 5 to 9 Minutes | 0 (0.0%) | 1 (3.1%) |
| 10 to 14 Minutes | 12 (35.3%) | 5 (15.6%) |
| 15 to 19 Minutes | 0 (0.0%) | 3 (9.4%) |
| 20 to 24 Minutes | 4 (11.8%) | 1 (3.1%) |
| 25 to 29 Minutes | 0 (0.0%) | 0 (0.0%) |
| 30 to 34 Minutes | 0 (0.0%) | 0 (0.0%) |
| 35 to 39 Minutes | 0 (0.0%) | 0 (0.0%) |
| 40 to 44 Minutes | 6 (17.6%) | 17 (53.1%) |
| 45 to 59 Minutes | 12 (35.3%) | 5 (15.6%) |
| 60 to 89 Minutes | 0 (0.0%) | 0 (0.0%) |
| 90 or more Minutes | 0 (0.0%) | 0 (0.0%) |
Time of Departure to Work by Sex in Alcalde
The most frequent times of departure to work in Alcalde are 6:00 AM to 6:29 AM (9, 26.5%) for males and 7:00 AM to 7:29 AM (11, 34.4%) for females.
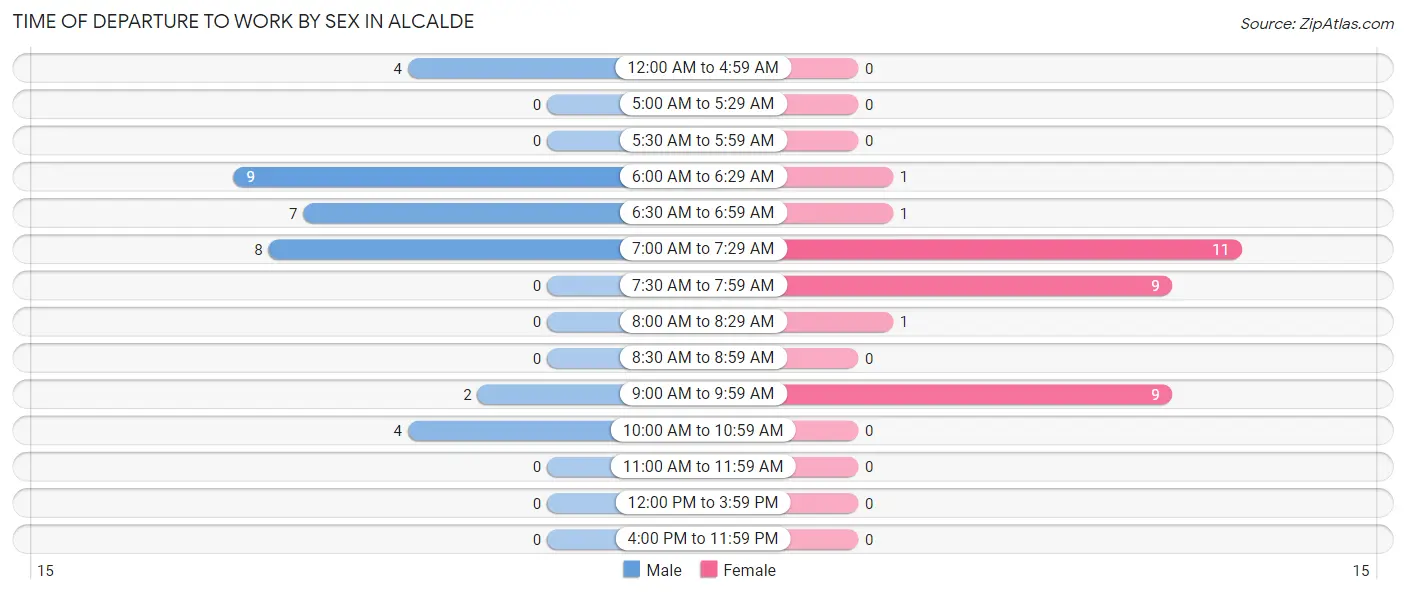
| Time of Departure | Male | Female |
| 12:00 AM to 4:59 AM | 4 (11.8%) | 0 (0.0%) |
| 5:00 AM to 5:29 AM | 0 (0.0%) | 0 (0.0%) |
| 5:30 AM to 5:59 AM | 0 (0.0%) | 0 (0.0%) |
| 6:00 AM to 6:29 AM | 9 (26.5%) | 1 (3.1%) |
| 6:30 AM to 6:59 AM | 7 (20.6%) | 1 (3.1%) |
| 7:00 AM to 7:29 AM | 8 (23.5%) | 11 (34.4%) |
| 7:30 AM to 7:59 AM | 0 (0.0%) | 9 (28.1%) |
| 8:00 AM to 8:29 AM | 0 (0.0%) | 1 (3.1%) |
| 8:30 AM to 8:59 AM | 0 (0.0%) | 0 (0.0%) |
| 9:00 AM to 9:59 AM | 2 (5.9%) | 9 (28.1%) |
| 10:00 AM to 10:59 AM | 4 (11.8%) | 0 (0.0%) |
| 11:00 AM to 11:59 AM | 0 (0.0%) | 0 (0.0%) |
| 12:00 PM to 3:59 PM | 0 (0.0%) | 0 (0.0%) |
| 4:00 PM to 11:59 PM | 0 (0.0%) | 0 (0.0%) |
| Total | 34 (100.0%) | 32 (100.0%) |
Housing Occupancy in Alcalde
Occupancy by Ownership in Alcalde
Of the total 87 dwellings in Alcalde, owner-occupied units account for 68 (78.2%), while renter-occupied units make up 19 (21.8%).
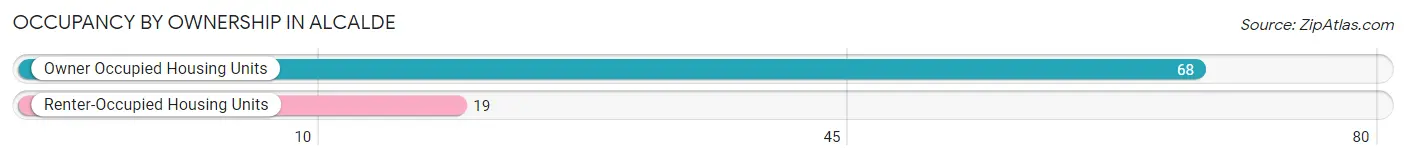
| Occupancy | # Housing Units | % Housing Units |
| Owner Occupied Housing Units | 68 | 78.2% |
| Renter-Occupied Housing Units | 19 | 21.8% |
| Total Occupied Housing Units | 87 | 100.0% |
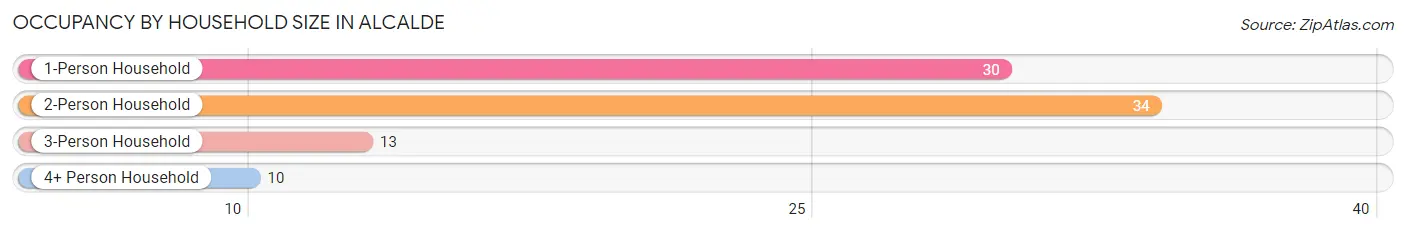
Occupancy by Household Size in Alcalde
| Household Size | # Housing Units | % Housing Units |
| 1-Person Household | 30 | 34.5% |
| 2-Person Household | 34 | 39.1% |
| 3-Person Household | 13 | 14.9% |
| 4+ Person Household | 10 | 11.5% |
| Total Housing Units | 87 | 100.0% |
Occupancy by Ownership by Household Size in Alcalde
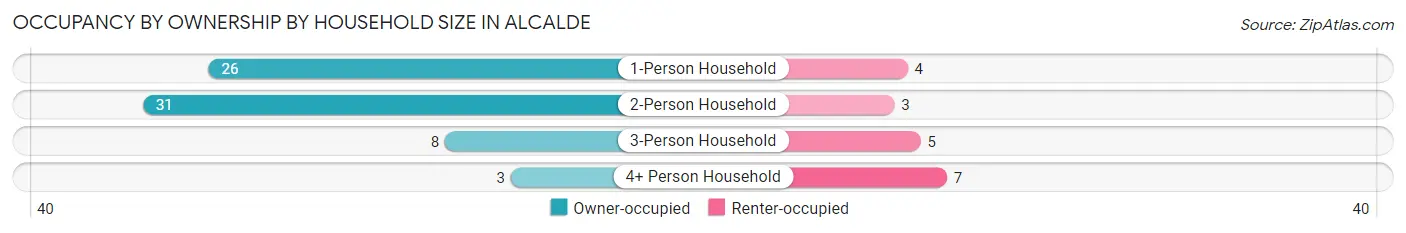
| Household Size | Owner-occupied | Renter-occupied |
| 1-Person Household | 26 (86.7%) | 4 (13.3%) |
| 2-Person Household | 31 (91.2%) | 3 (8.8%) |
| 3-Person Household | 8 (61.5%) | 5 (38.5%) |
| 4+ Person Household | 3 (30.0%) | 7 (70.0%) |
| Total Housing Units | 68 (78.2%) | 19 (21.8%) |
Occupancy by Educational Attainment in Alcalde
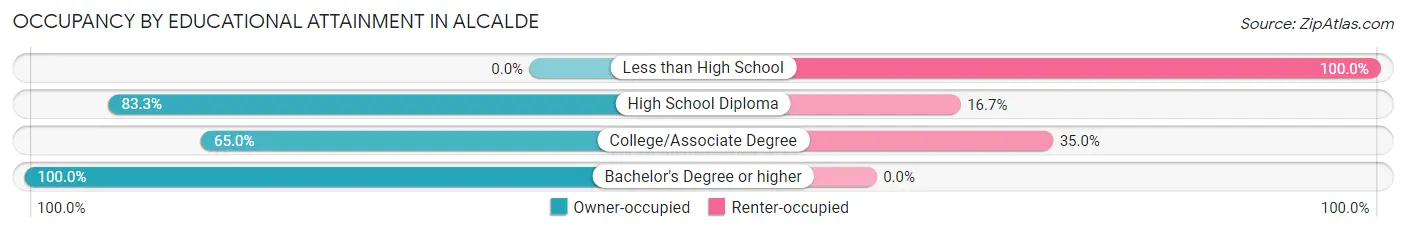
| Household Size | Owner-occupied | Renter-occupied |
| Less than High School | 0 (0.0%) | 4 (100.0%) |
| High School Diploma | 40 (83.3%) | 8 (16.7%) |
| College/Associate Degree | 13 (65.0%) | 7 (35.0%) |
| Bachelor's Degree or higher | 15 (100.0%) | 0 (0.0%) |
Occupancy by Age of Householder in Alcalde
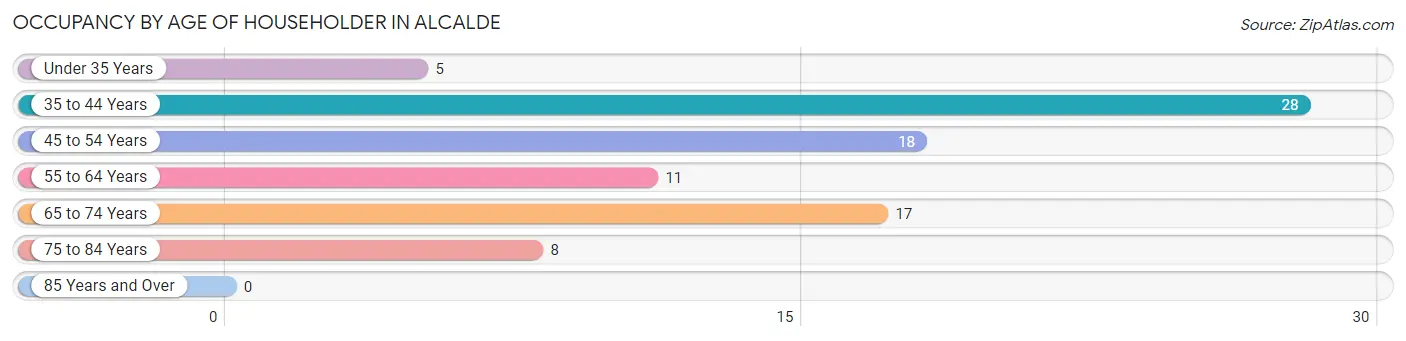
| Age Bracket | # Households | % Households |
| Under 35 Years | 5 | 5.8% |
| 35 to 44 Years | 28 | 32.2% |
| 45 to 54 Years | 18 | 20.7% |
| 55 to 64 Years | 11 | 12.6% |
| 65 to 74 Years | 17 | 19.5% |
| 75 to 84 Years | 8 | 9.2% |
| 85 Years and Over | 0 | 0.0% |
| Total | 87 | 100.0% |
Housing Finances in Alcalde
Median Income by Occupancy in Alcalde
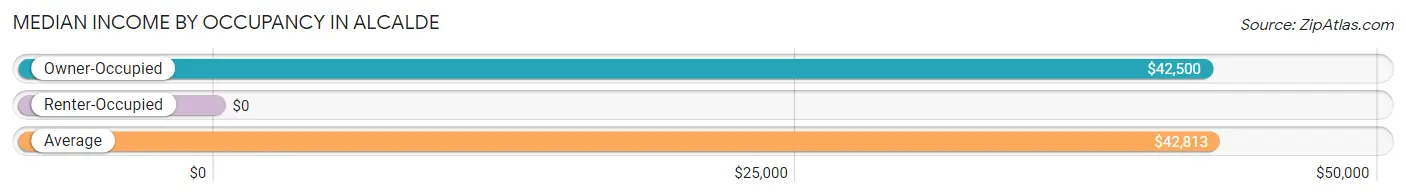
| Occupancy Type | # Households | Median Income |
| Owner-Occupied | 68 (78.2%) | $42,500 |
| Renter-Occupied | 19 (21.8%) | $0 |
| Average | 87 (100.0%) | $42,813 |
Occupancy by Householder Income Bracket in Alcalde
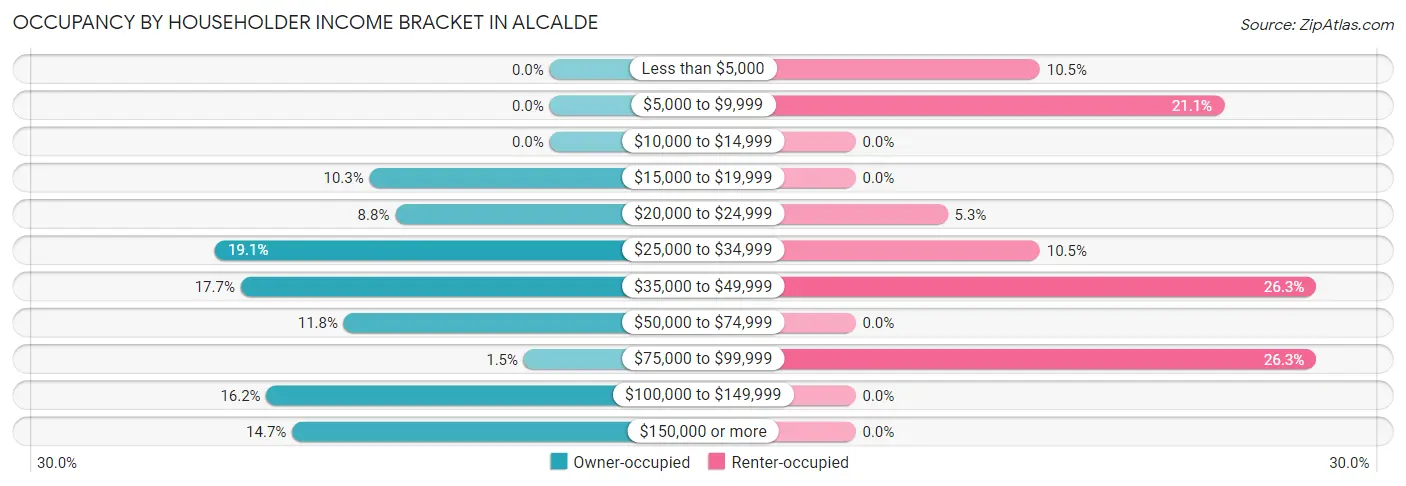
| Income Bracket | Owner-occupied | Renter-occupied |
| Less than $5,000 | 0 (0.0%) | 2 (10.5%) |
| $5,000 to $9,999 | 0 (0.0%) | 4 (21.0%) |
| $10,000 to $14,999 | 0 (0.0%) | 0 (0.0%) |
| $15,000 to $19,999 | 7 (10.3%) | 0 (0.0%) |
| $20,000 to $24,999 | 6 (8.8%) | 1 (5.3%) |
| $25,000 to $34,999 | 13 (19.1%) | 2 (10.5%) |
| $35,000 to $49,999 | 12 (17.6%) | 5 (26.3%) |
| $50,000 to $74,999 | 8 (11.8%) | 0 (0.0%) |
| $75,000 to $99,999 | 1 (1.5%) | 5 (26.3%) |
| $100,000 to $149,999 | 11 (16.2%) | 0 (0.0%) |
| $150,000 or more | 10 (14.7%) | 0 (0.0%) |
| Total | 68 (100.0%) | 19 (100.0%) |
Monthly Housing Cost Tiers in Alcalde
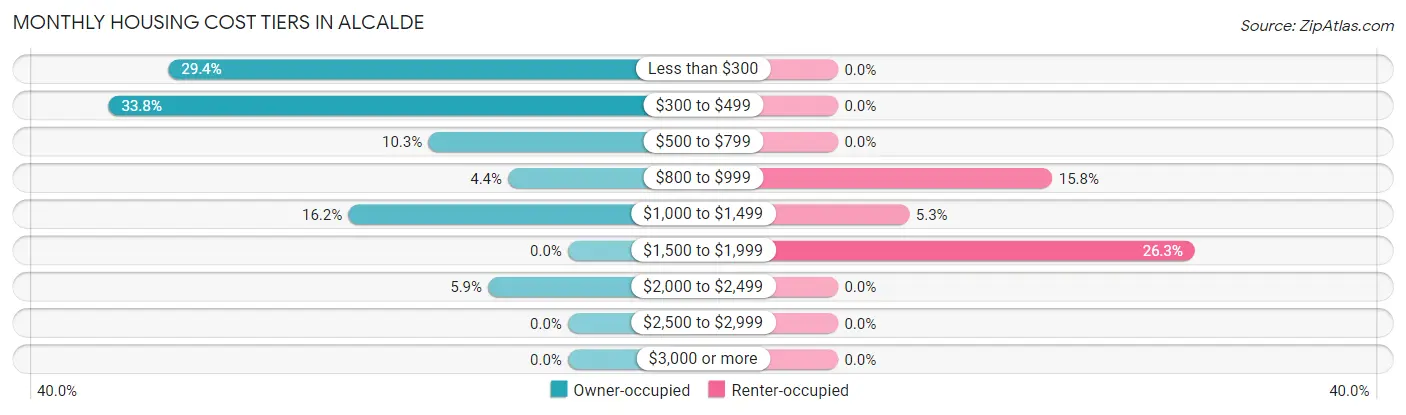
| Monthly Cost | Owner-occupied | Renter-occupied |
| Less than $300 | 20 (29.4%) | 0 (0.0%) |
| $300 to $499 | 23 (33.8%) | 0 (0.0%) |
| $500 to $799 | 7 (10.3%) | 0 (0.0%) |
| $800 to $999 | 3 (4.4%) | 3 (15.8%) |
| $1,000 to $1,499 | 11 (16.2%) | 1 (5.3%) |
| $1,500 to $1,999 | 0 (0.0%) | 5 (26.3%) |
| $2,000 to $2,499 | 4 (5.9%) | 0 (0.0%) |
| $2,500 to $2,999 | 0 (0.0%) | 0 (0.0%) |
| $3,000 or more | 0 (0.0%) | 0 (0.0%) |
| Total | 68 (100.0%) | 19 (100.0%) |
Physical Housing Characteristics in Alcalde
Housing Structures in Alcalde
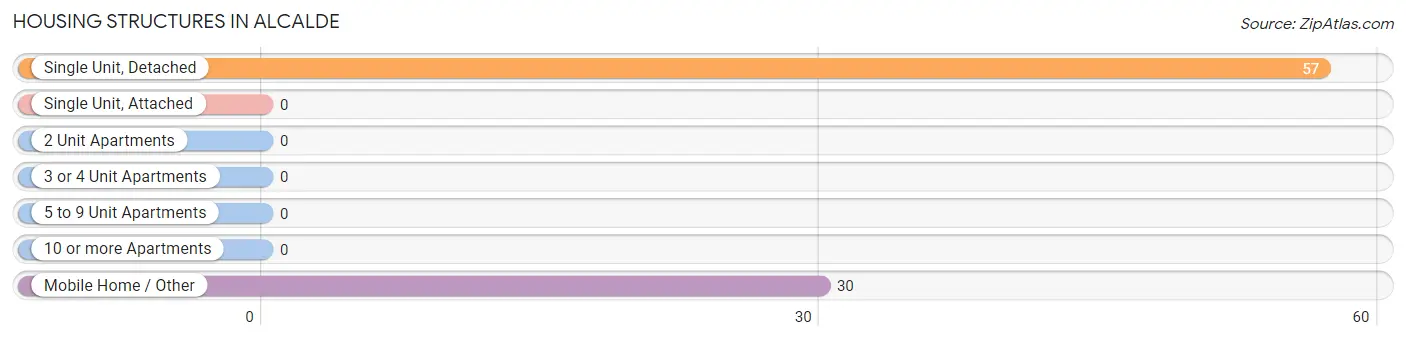
| Structure Type | # Housing Units | % Housing Units |
| Single Unit, Detached | 57 | 65.5% |
| Single Unit, Attached | 0 | 0.0% |
| 2 Unit Apartments | 0 | 0.0% |
| 3 or 4 Unit Apartments | 0 | 0.0% |
| 5 to 9 Unit Apartments | 0 | 0.0% |
| 10 or more Apartments | 0 | 0.0% |
| Mobile Home / Other | 30 | 34.5% |
| Total | 87 | 100.0% |
Housing Structures by Occupancy in Alcalde
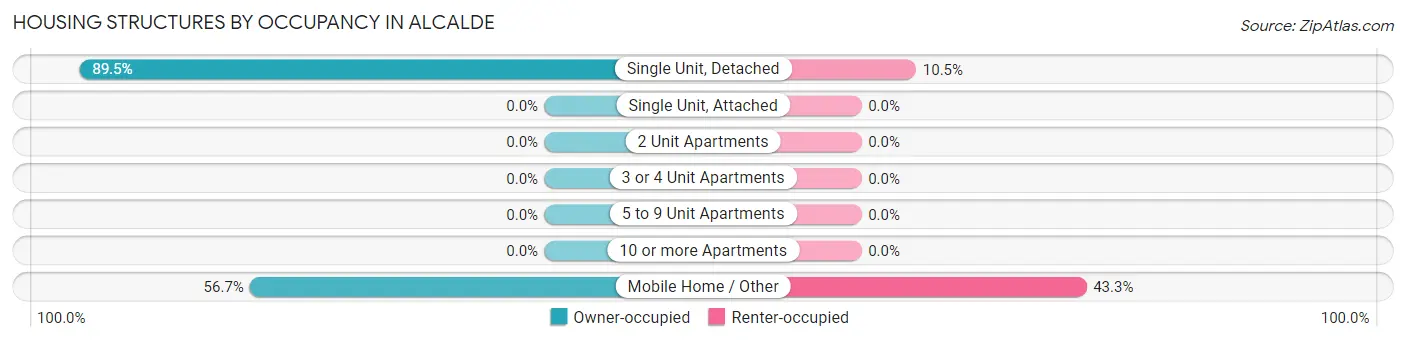
| Structure Type | Owner-occupied | Renter-occupied |
| Single Unit, Detached | 51 (89.5%) | 6 (10.5%) |
| Single Unit, Attached | 0 (0.0%) | 0 (0.0%) |
| 2 Unit Apartments | 0 (0.0%) | 0 (0.0%) |
| 3 or 4 Unit Apartments | 0 (0.0%) | 0 (0.0%) |
| 5 to 9 Unit Apartments | 0 (0.0%) | 0 (0.0%) |
| 10 or more Apartments | 0 (0.0%) | 0 (0.0%) |
| Mobile Home / Other | 17 (56.7%) | 13 (43.3%) |
| Total | 68 (78.2%) | 19 (21.8%) |
Housing Structures by Number of Rooms in Alcalde
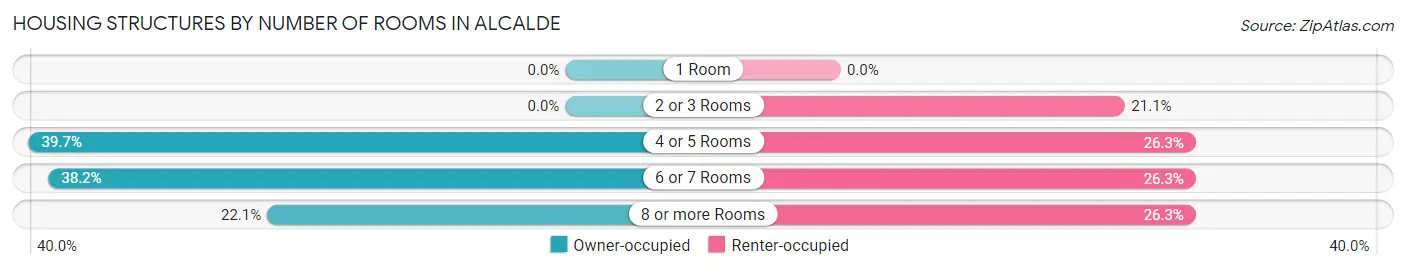
| Number of Rooms | Owner-occupied | Renter-occupied |
| 1 Room | 0 (0.0%) | 0 (0.0%) |
| 2 or 3 Rooms | 0 (0.0%) | 4 (21.0%) |
| 4 or 5 Rooms | 27 (39.7%) | 5 (26.3%) |
| 6 or 7 Rooms | 26 (38.2%) | 5 (26.3%) |
| 8 or more Rooms | 15 (22.1%) | 5 (26.3%) |
| Total | 68 (100.0%) | 19 (100.0%) |
Housing Structure by Heating Type in Alcalde
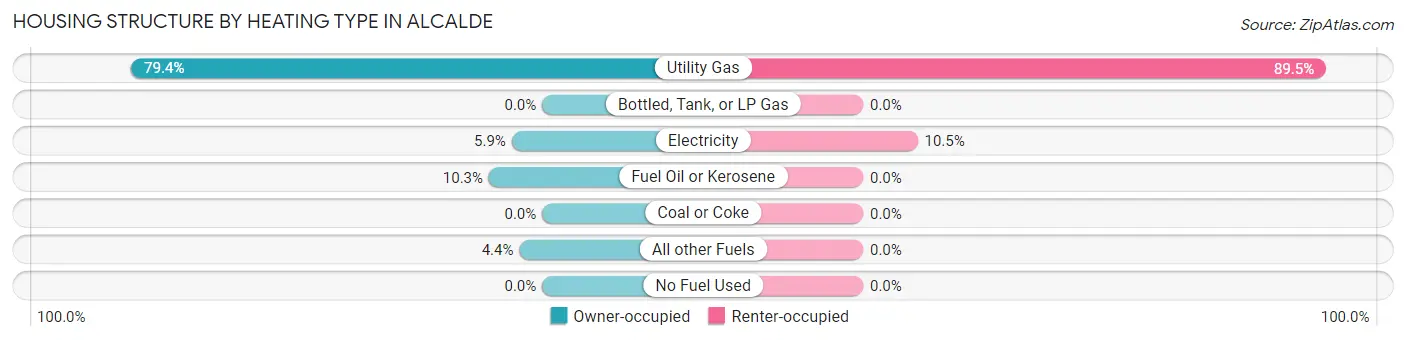
| Heating Type | Owner-occupied | Renter-occupied |
| Utility Gas | 54 (79.4%) | 17 (89.5%) |
| Bottled, Tank, or LP Gas | 0 (0.0%) | 0 (0.0%) |
| Electricity | 4 (5.9%) | 2 (10.5%) |
| Fuel Oil or Kerosene | 7 (10.3%) | 0 (0.0%) |
| Coal or Coke | 0 (0.0%) | 0 (0.0%) |
| All other Fuels | 3 (4.4%) | 0 (0.0%) |
| No Fuel Used | 0 (0.0%) | 0 (0.0%) |
| Total | 68 (100.0%) | 19 (100.0%) |
Household Vehicle Usage in Alcalde
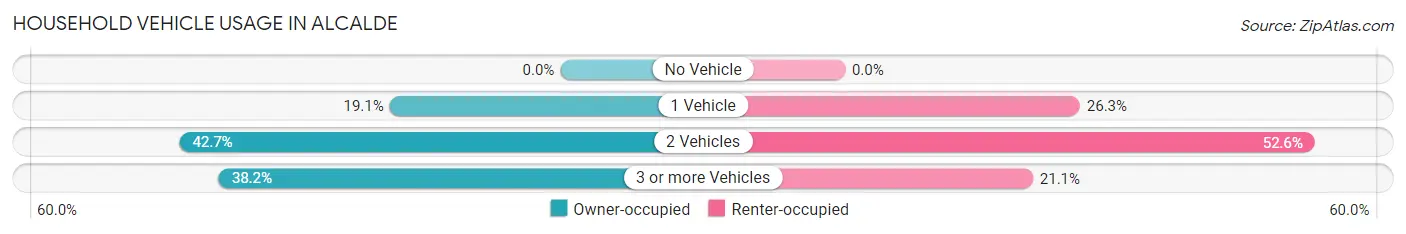
| Vehicles per Household | Owner-occupied | Renter-occupied |
| No Vehicle | 0 (0.0%) | 0 (0.0%) |
| 1 Vehicle | 13 (19.1%) | 5 (26.3%) |
| 2 Vehicles | 29 (42.6%) | 10 (52.6%) |
| 3 or more Vehicles | 26 (38.2%) | 4 (21.0%) |
| Total | 68 (100.0%) | 19 (100.0%) |
Real Estate & Mortgages in Alcalde
Real Estate and Mortgage Overview in Alcalde
| Characteristic | Without Mortgage | With Mortgage |
| Housing Units | 50 | 18 |
| Median Property Value | $223,100 | $196,400 |
| Median Household Income | $41,875 | $3 |
| Monthly Housing Costs | $378 | $0 |
| Real Estate Taxes | $760 | $4 |
Property Value by Mortgage Status in Alcalde
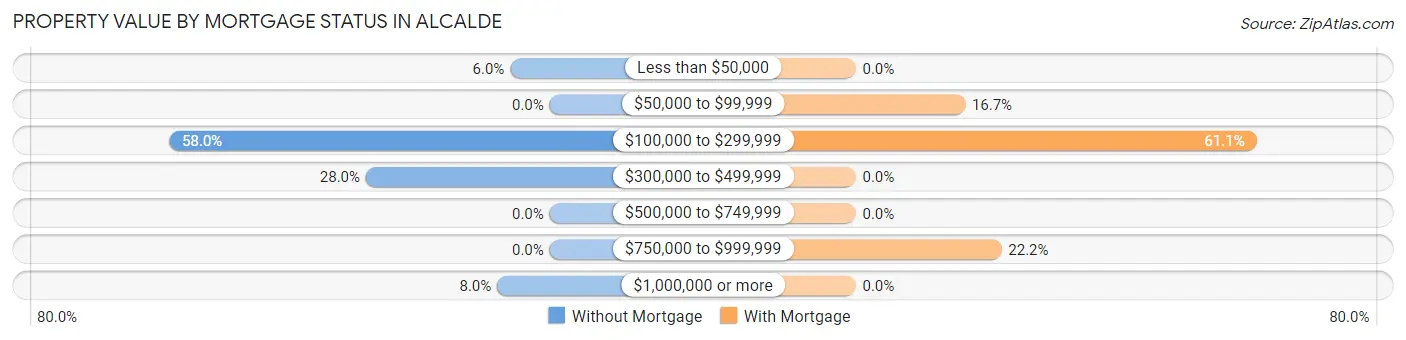
| Property Value | Without Mortgage | With Mortgage |
| Less than $50,000 | 3 (6.0%) | 0 (0.0%) |
| $50,000 to $99,999 | 0 (0.0%) | 3 (16.7%) |
| $100,000 to $299,999 | 29 (58.0%) | 11 (61.1%) |
| $300,000 to $499,999 | 14 (28.0%) | 0 (0.0%) |
| $500,000 to $749,999 | 0 (0.0%) | 0 (0.0%) |
| $750,000 to $999,999 | 0 (0.0%) | 4 (22.2%) |
| $1,000,000 or more | 4 (8.0%) | 0 (0.0%) |
| Total | 50 (100.0%) | 18 (100.0%) |
Household Income by Mortgage Status in Alcalde
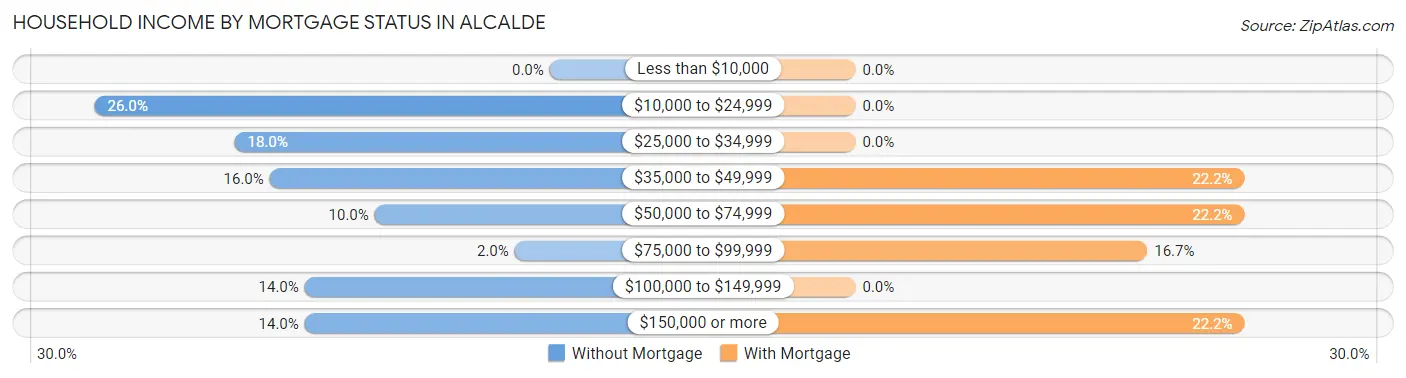
| Household Income | Without Mortgage | With Mortgage |
| Less than $10,000 | 0 (0.0%) | 0 (0.0%) |
| $10,000 to $24,999 | 13 (26.0%) | 0 (0.0%) |
| $25,000 to $34,999 | 9 (18.0%) | 0 (0.0%) |
| $35,000 to $49,999 | 8 (16.0%) | 4 (22.2%) |
| $50,000 to $74,999 | 5 (10.0%) | 4 (22.2%) |
| $75,000 to $99,999 | 1 (2.0%) | 3 (16.7%) |
| $100,000 to $149,999 | 7 (14.0%) | 0 (0.0%) |
| $150,000 or more | 7 (14.0%) | 4 (22.2%) |
| Total | 50 (100.0%) | 18 (100.0%) |
Property Value to Household Income Ratio in Alcalde
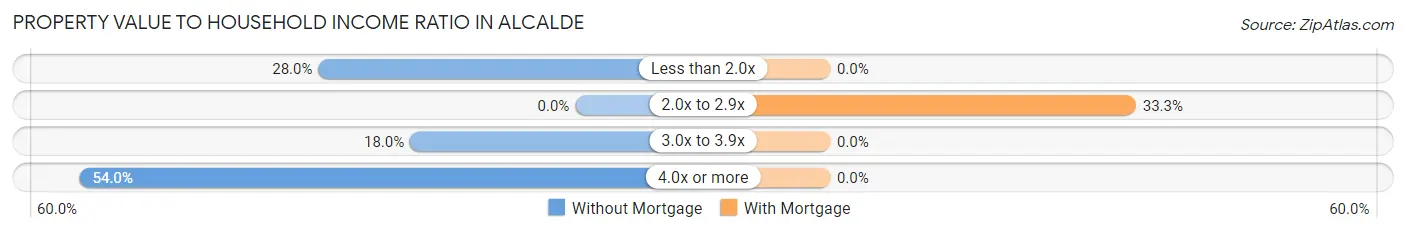
| Value-to-Income Ratio | Without Mortgage | With Mortgage |
| Less than 2.0x | 14 (28.0%) | 0 (0.0%) |
| 2.0x to 2.9x | 0 (0.0%) | 6 (33.3%) |
| 3.0x to 3.9x | 9 (18.0%) | 0 (0.0%) |
| 4.0x or more | 27 (54.0%) | 0 (0.0%) |
| Total | 50 (100.0%) | 18 (100.0%) |
Real Estate Taxes by Mortgage Status in Alcalde
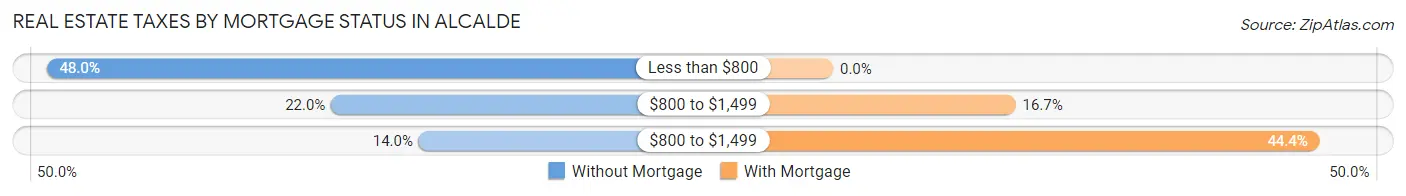
| Property Taxes | Without Mortgage | With Mortgage |
| Less than $800 | 24 (48.0%) | 0 (0.0%) |
| $800 to $1,499 | 11 (22.0%) | 3 (16.7%) |
| $800 to $1,499 | 7 (14.0%) | 8 (44.4%) |
| Total | 50 (100.0%) | 18 (100.0%) |
Health & Disability in Alcalde
Health Insurance Coverage by Age in Alcalde
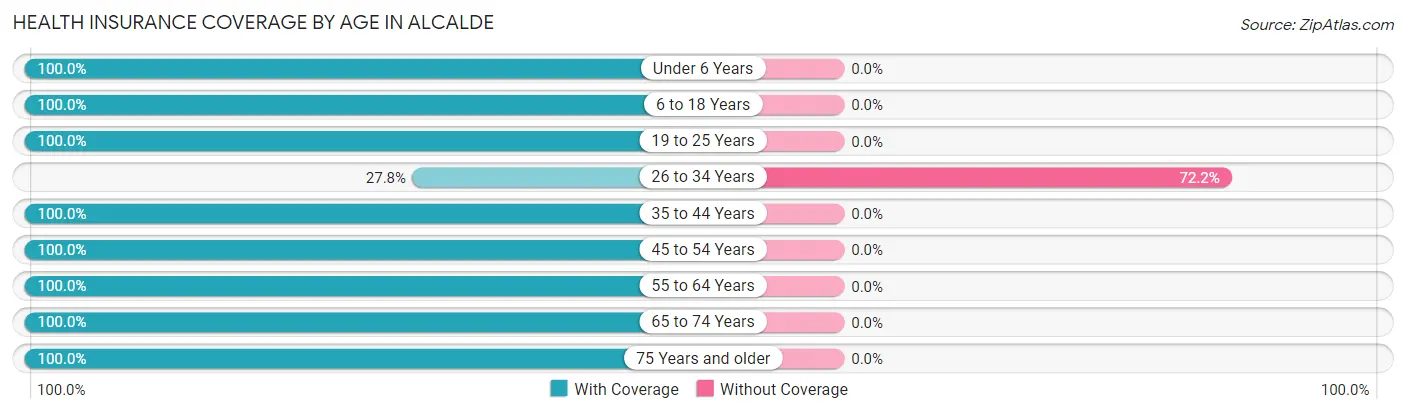
| Age Bracket | With Coverage | Without Coverage |
| Under 6 Years | 18 (100.0%) | 0 (0.0%) |
| 6 to 18 Years | 46 (100.0%) | 0 (0.0%) |
| 19 to 25 Years | 31 (100.0%) | 0 (0.0%) |
| 26 to 34 Years | 5 (27.8%) | 13 (72.2%) |
| 35 to 44 Years | 40 (100.0%) | 0 (0.0%) |
| 45 to 54 Years | 25 (100.0%) | 0 (0.0%) |
| 55 to 64 Years | 32 (100.0%) | 0 (0.0%) |
| 65 to 74 Years | 17 (100.0%) | 0 (0.0%) |
| 75 Years and older | 8 (100.0%) | 0 (0.0%) |
| Total | 222 (94.5%) | 13 (5.5%) |
Health Insurance Coverage by Citizenship Status in Alcalde
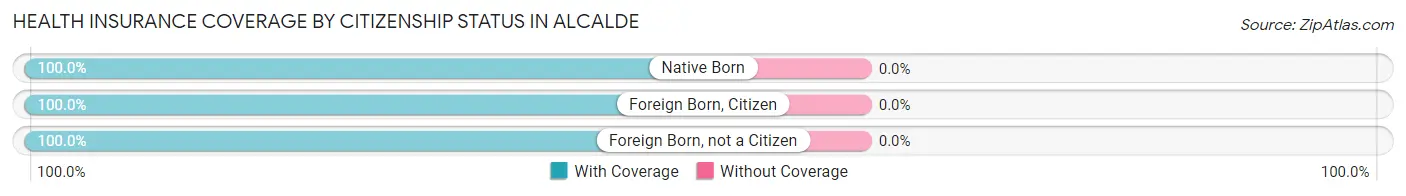
| Citizenship Status | With Coverage | Without Coverage |
| Native Born | 18 (100.0%) | 0 (0.0%) |
| Foreign Born, Citizen | 46 (100.0%) | 0 (0.0%) |
| Foreign Born, not a Citizen | 31 (100.0%) | 0 (0.0%) |
Health Insurance Coverage by Household Income in Alcalde
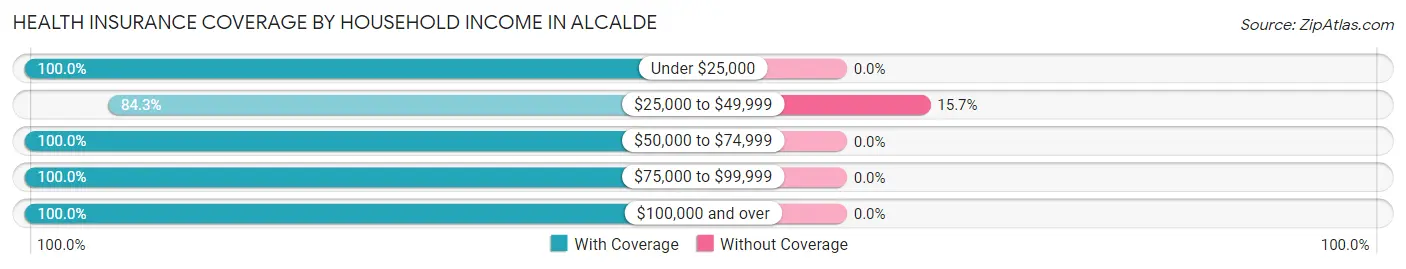
| Household Income | With Coverage | Without Coverage |
| Under $25,000 | 47 (100.0%) | 0 (0.0%) |
| $25,000 to $49,999 | 70 (84.3%) | 13 (15.7%) |
| $50,000 to $74,999 | 16 (100.0%) | 0 (0.0%) |
| $75,000 to $99,999 | 30 (100.0%) | 0 (0.0%) |
| $100,000 and over | 59 (100.0%) | 0 (0.0%) |
Public vs Private Health Insurance Coverage by Age in Alcalde
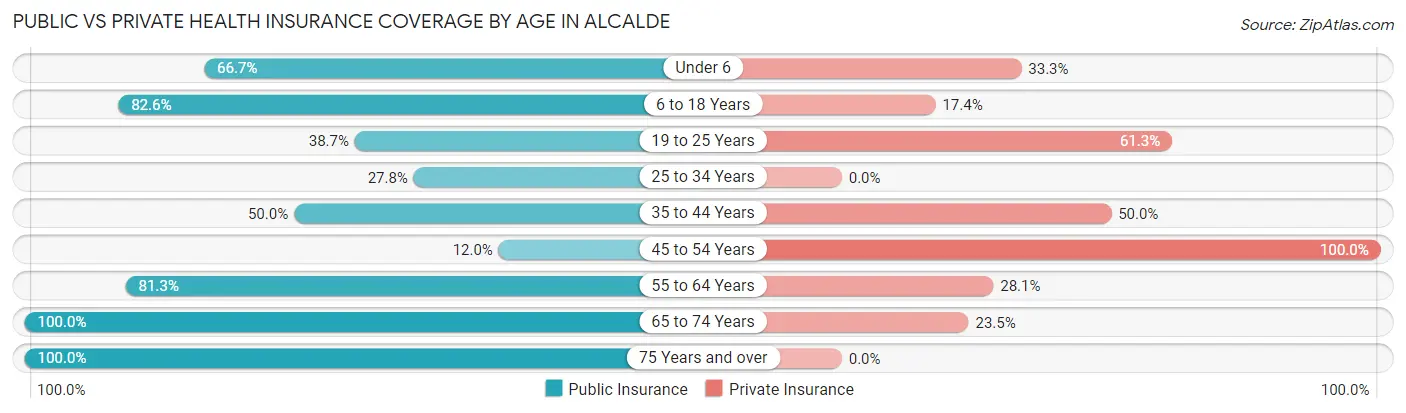
| Age Bracket | Public Insurance | Private Insurance |
| Under 6 | 12 (66.7%) | 6 (33.3%) |
| 6 to 18 Years | 38 (82.6%) | 8 (17.4%) |
| 19 to 25 Years | 12 (38.7%) | 19 (61.3%) |
| 25 to 34 Years | 5 (27.8%) | 0 (0.0%) |
| 35 to 44 Years | 20 (50.0%) | 20 (50.0%) |
| 45 to 54 Years | 3 (12.0%) | 25 (100.0%) |
| 55 to 64 Years | 26 (81.2%) | 9 (28.1%) |
| 65 to 74 Years | 17 (100.0%) | 4 (23.5%) |
| 75 Years and over | 8 (100.0%) | 0 (0.0%) |
| Total | 141 (60.0%) | 91 (38.7%) |
Disability Status by Sex by Age in Alcalde
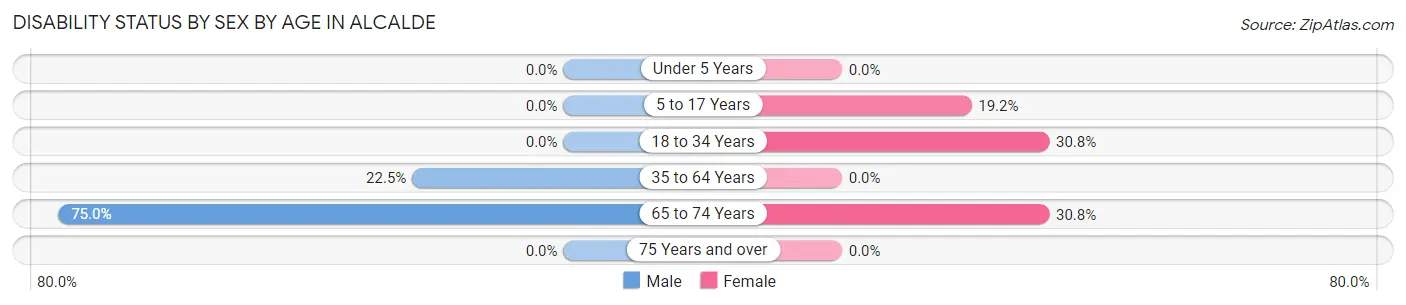
| Age Bracket | Male | Female |
| Under 5 Years | 0 (0.0%) | 0 (0.0%) |
| 5 to 17 Years | 0 (0.0%) | 5 (19.2%) |
| 18 to 34 Years | 0 (0.0%) | 12 (30.8%) |
| 35 to 64 Years | 11 (22.5%) | 0 (0.0%) |
| 65 to 74 Years | 3 (75.0%) | 4 (30.8%) |
| 75 Years and over | 0 (0.0%) | 0 (0.0%) |
Disability Class by Sex by Age in Alcalde
Disability Class: Hearing Difficulty
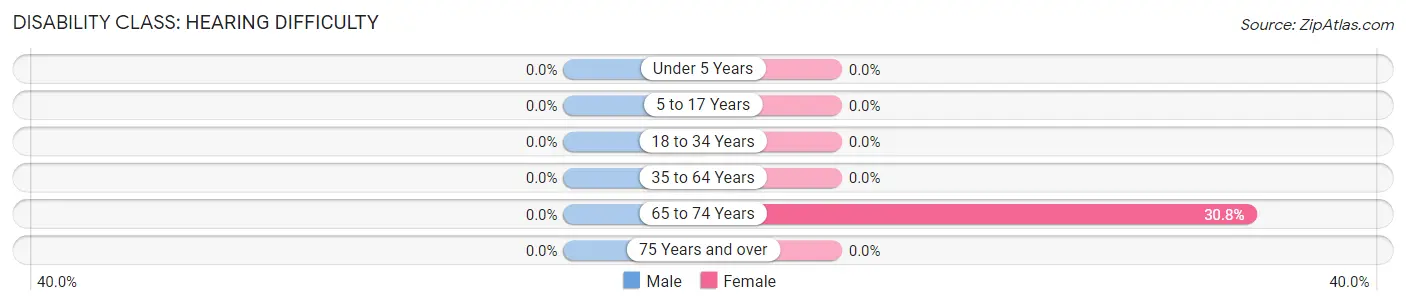
| Age Bracket | Male | Female |
| Under 5 Years | 0 (0.0%) | 0 (0.0%) |
| 5 to 17 Years | 0 (0.0%) | 0 (0.0%) |
| 18 to 34 Years | 0 (0.0%) | 0 (0.0%) |
| 35 to 64 Years | 0 (0.0%) | 0 (0.0%) |
| 65 to 74 Years | 0 (0.0%) | 4 (30.8%) |
| 75 Years and over | 0 (0.0%) | 0 (0.0%) |
Disability Class: Vision Difficulty
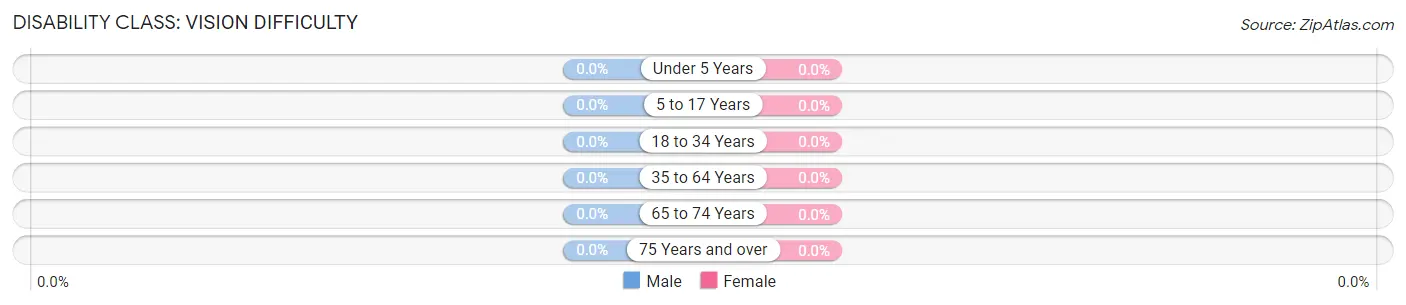
| Age Bracket | Male | Female |
| Under 5 Years | 0 (0.0%) | 0 (0.0%) |
| 5 to 17 Years | 0 (0.0%) | 0 (0.0%) |
| 18 to 34 Years | 0 (0.0%) | 0 (0.0%) |
| 35 to 64 Years | 0 (0.0%) | 0 (0.0%) |
| 65 to 74 Years | 0 (0.0%) | 0 (0.0%) |
| 75 Years and over | 0 (0.0%) | 0 (0.0%) |
Disability Class: Cognitive Difficulty
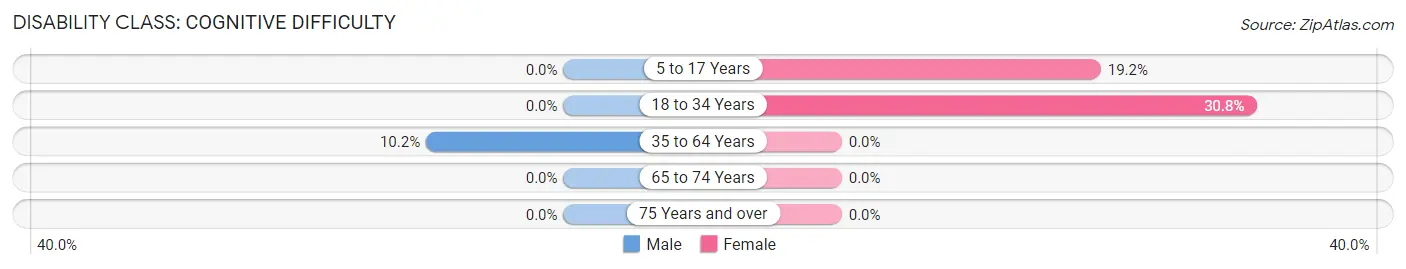
| Age Bracket | Male | Female |
| 5 to 17 Years | 0 (0.0%) | 5 (19.2%) |
| 18 to 34 Years | 0 (0.0%) | 12 (30.8%) |
| 35 to 64 Years | 5 (10.2%) | 0 (0.0%) |
| 65 to 74 Years | 0 (0.0%) | 0 (0.0%) |
| 75 Years and over | 0 (0.0%) | 0 (0.0%) |
Disability Class: Ambulatory Difficulty
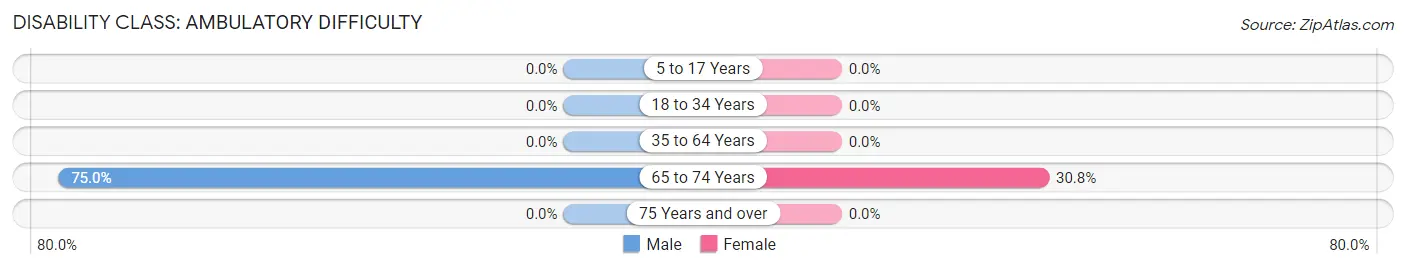
| Age Bracket | Male | Female |
| 5 to 17 Years | 0 (0.0%) | 0 (0.0%) |
| 18 to 34 Years | 0 (0.0%) | 0 (0.0%) |
| 35 to 64 Years | 0 (0.0%) | 0 (0.0%) |
| 65 to 74 Years | 3 (75.0%) | 4 (30.8%) |
| 75 Years and over | 0 (0.0%) | 0 (0.0%) |
Disability Class: Self-Care Difficulty
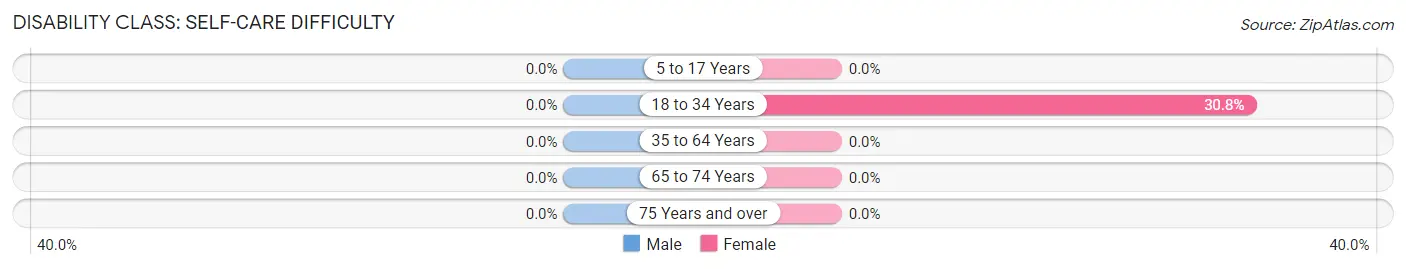
| Age Bracket | Male | Female |
| 5 to 17 Years | 0 (0.0%) | 0 (0.0%) |
| 18 to 34 Years | 0 (0.0%) | 12 (30.8%) |
| 35 to 64 Years | 0 (0.0%) | 0 (0.0%) |
| 65 to 74 Years | 0 (0.0%) | 0 (0.0%) |
| 75 Years and over | 0 (0.0%) | 0 (0.0%) |
Technology Access in Alcalde
Computing Device Access in Alcalde
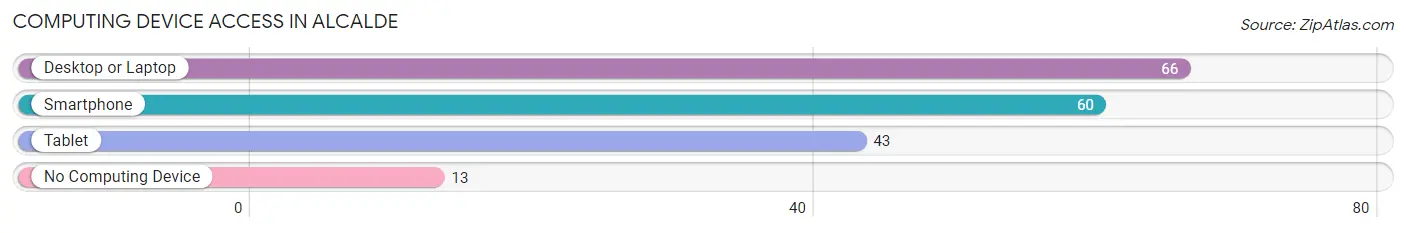
| Device Type | # Households | % Households |
| Desktop or Laptop | 66 | 75.9% |
| Smartphone | 60 | 69.0% |
| Tablet | 43 | 49.4% |
| No Computing Device | 13 | 14.9% |
| Total | 87 | 100.0% |
Internet Access in Alcalde
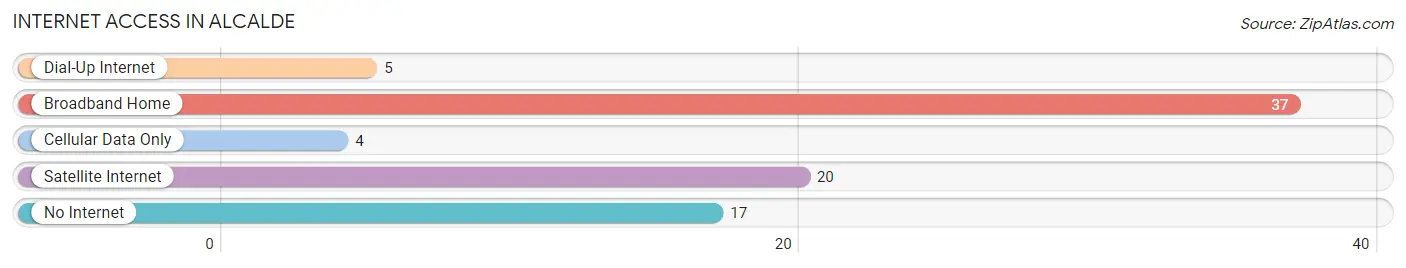
| Internet Type | # Households | % Households |
| Dial-Up Internet | 5 | 5.8% |
| Broadband Home | 37 | 42.5% |
| Cellular Data Only | 4 | 4.6% |
| Satellite Internet | 20 | 23.0% |
| No Internet | 17 | 19.5% |
| Total | 87 | 100.0% |
Alcalde Summary
Alcalde is a small unincorporated community located in Rio Arriba County, New Mexico. It is situated in the northern part of the state, approximately 30 miles north of Santa Fe. The population of Alcalde was estimated to be 1,072 in 2019.
Geography
Alcalde is located in the northern part of New Mexico, in the Rio Arriba County. It is situated at an elevation of 6,845 feet above sea level. The area is characterized by a semi-arid climate, with hot summers and cold winters. The average annual temperature is approximately 50°F. The area receives an average of 12 inches of precipitation annually.
The landscape of Alcalde is dominated by the Sangre de Cristo Mountains, which are part of the Rocky Mountains. The area is also home to the Rio Grande, which flows through the region.
History
Alcalde was founded in 1881 by a group of settlers from the nearby town of Abiquiu. The settlers were attracted to the area due to its fertile soil and abundant water supply. The town was named after the Spanish word for mayor, alcalde.
The town quickly grew and by the early 1900s, it had become a thriving agricultural community. The town was home to several businesses, including a general store, a blacksmith shop, and a hotel.
In the early 20th century, Alcalde was a popular destination for tourists. The town was home to several resorts, including the Alcalde Hotel and the Alcalde Springs Resort.
Economy
The economy of Alcalde is largely based on agriculture. The area is home to several farms, which produce a variety of crops, including corn, wheat, and hay. The town is also home to several small businesses, including restaurants, stores, and a gas station.
The town is also home to several tourist attractions, including the Alcalde Museum and the Alcalde Springs Resort. The town is also home to several art galleries, which feature works by local artists.
Demographics
As of 2019, the population of Alcalde was estimated to be 1,072. The population is predominantly Hispanic, with approximately 95% of the population identifying as Hispanic or Latino. The median household income in Alcalde is $30,000, which is lower than the national average.
The town is home to several churches, including the Church of Jesus Christ of Latter-day Saints, the Catholic Church, and the United Methodist Church. The town is also home to several schools, including the Alcalde Elementary School and the Alcalde High School.
Conclusion
Alcalde is a small unincorporated community located in Rio Arriba County, New Mexico. It is situated in the northern part of the state, approximately 30 miles north of Santa Fe. The population of Alcalde was estimated to be 1,072 in 2019. The economy of Alcalde is largely based on agriculture, with several farms producing a variety of crops. The town is also home to several small businesses, tourist attractions, and art galleries. The population is predominantly Hispanic, with approximately 95% of the population identifying as Hispanic or Latino.
Common Questions
What is Per Capita Income in Alcalde?
Per Capita income in Alcalde is $25,915.
What is the Median Family Income in Alcalde?
Median Family Income in Alcalde is $57,500.
What is the Median Household income in Alcalde?
Median Household Income in Alcalde is $42,813.
What is Income or Wage Gap in Alcalde?
Income or Wage Gap in Alcalde is 27.8%.
Women in Alcalde earn 72.2 cents for every dollar earned by a man.
What is Inequality or Gini Index in Alcalde?
Inequality or Gini Index in Alcalde is 0.48.
What is the Total Population of Alcalde?
Total Population of Alcalde is 235.
What is the Total Male Population of Alcalde?
Total Male Population of Alcalde is 92.
What is the Total Female Population of Alcalde?
Total Female Population of Alcalde is 143.
What is the Ratio of Males per 100 Females in Alcalde?
There are 64.34 Males per 100 Females in Alcalde.
What is the Ratio of Females per 100 Males in Alcalde?
There are 155.43 Females per 100 Males in Alcalde.
What is the Median Population Age in Alcalde?
Median Population Age in Alcalde is 38.1 Years.
What is the Average Family Size in Alcalde
Average Family Size in Alcalde is 3.6 People.
What is the Average Household Size in Alcalde
Average Household Size in Alcalde is 2.7 People.
How Large is the Labor Force in Alcalde?
There are 92 People in the Labor Forcein in Alcalde.
What is the Percentage of People in the Labor Force in Alcalde?
48.4% of People are in the Labor Force in Alcalde.
What is the Unemployment Rate in Alcalde?
Unemployment Rate in Alcalde is 2.2%.