Pojoaque, NM Map & Demographics
Pojoaque Map
Pojoaque Overview
$33,584
PER CAPITA INCOME
$70,391
AVG FAMILY INCOME
$61,583
AVG HOUSEHOLD INCOME
20.5%
WAGE / INCOME GAP [ % ]
79.5¢/ $1
WAGE / INCOME GAP [ $ ]
$9,610
FAMILY INCOME DEFICIT
0.41
INEQUALITY / GINI INDEX
2,336
TOTAL POPULATION
1,162
MALE POPULATION
1,174
FEMALE POPULATION
98.98
MALES / 100 FEMALES
101.03
FEMALES / 100 MALES
36.8
MEDIAN AGE
3.1
AVG FAMILY SIZE
2.4
AVG HOUSEHOLD SIZE
1,278
LABOR FORCE [ PEOPLE ]
67.9%
PERCENT IN LABOR FORCE
4.6%
UNEMPLOYMENT RATE
Pojoaque Area Codes
Income in Pojoaque
Income Overview in Pojoaque
Per Capita Income in Pojoaque is $33,584, while median incomes of families and households are $70,391 and $61,583 respectively.
| Characteristic | Number | Measure |
| Per Capita Income | 2,336 | $33,584 |
| Median Family Income | 583 | $70,391 |
| Mean Family Income | 583 | $84,491 |
| Median Household Income | 968 | $61,583 |
| Mean Household Income | 968 | $78,607 |
| Income Deficit | 583 | $9,610 |
| Wage / Income Gap (%) | 2,336 | 20.46% |
| Wage / Income Gap ($) | 2,336 | 79.54¢ per $1 |
| Gini / Inequality Index | 2,336 | 0.41 |
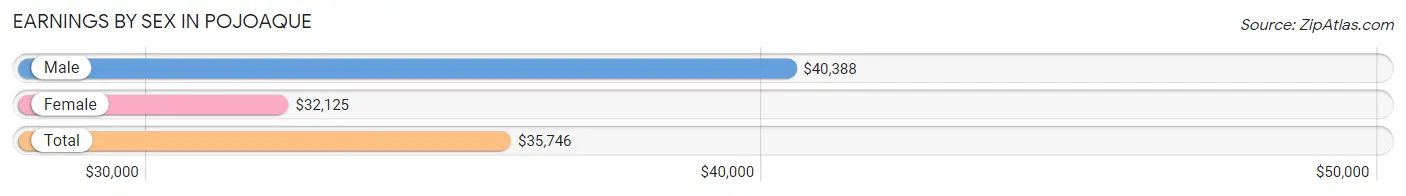
Earnings by Sex in Pojoaque
Average Earnings in Pojoaque are $35,746, $40,388 for men and $32,125 for women, a difference of 20.5%.
| Sex | Number | Average Earnings |
| Male | 587 (46.2%) | $40,388 |
| Female | 685 (53.8%) | $32,125 |
| Total | 1,272 (100.0%) | $35,746 |
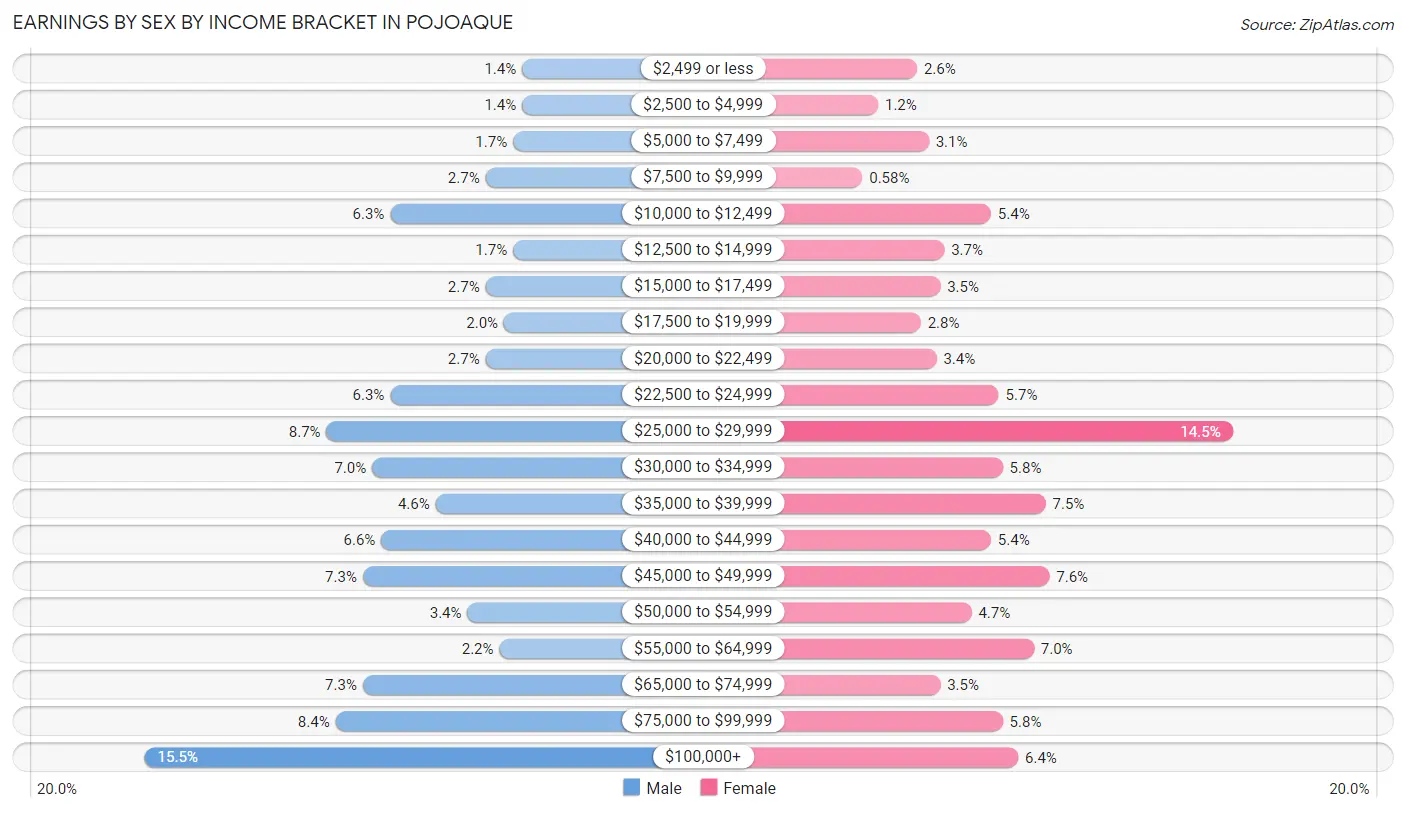
Earnings by Sex by Income Bracket in Pojoaque
The most common earnings brackets in Pojoaque are $100,000+ for men (91 | 15.5%) and $25,000 to $29,999 for women (99 | 14.4%).
| Income | Male | Female |
| $2,499 or less | 8 (1.4%) | 18 (2.6%) |
| $2,500 to $4,999 | 8 (1.4%) | 8 (1.2%) |
| $5,000 to $7,499 | 10 (1.7%) | 21 (3.1%) |
| $7,500 to $9,999 | 16 (2.7%) | 4 (0.6%) |
| $10,000 to $12,499 | 37 (6.3%) | 37 (5.4%) |
| $12,500 to $14,999 | 10 (1.7%) | 25 (3.6%) |
| $15,000 to $17,499 | 16 (2.7%) | 24 (3.5%) |
| $17,500 to $19,999 | 12 (2.0%) | 19 (2.8%) |
| $20,000 to $22,499 | 16 (2.7%) | 23 (3.4%) |
| $22,500 to $24,999 | 37 (6.3%) | 39 (5.7%) |
| $25,000 to $29,999 | 51 (8.7%) | 99 (14.4%) |
| $30,000 to $34,999 | 41 (7.0%) | 40 (5.8%) |
| $35,000 to $39,999 | 27 (4.6%) | 51 (7.4%) |
| $40,000 to $44,999 | 39 (6.6%) | 37 (5.4%) |
| $45,000 to $49,999 | 43 (7.3%) | 52 (7.6%) |
| $50,000 to $54,999 | 20 (3.4%) | 32 (4.7%) |
| $55,000 to $64,999 | 13 (2.2%) | 48 (7.0%) |
| $65,000 to $74,999 | 43 (7.3%) | 24 (3.5%) |
| $75,000 to $99,999 | 49 (8.4%) | 40 (5.8%) |
| $100,000+ | 91 (15.5%) | 44 (6.4%) |
| Total | 587 (100.0%) | 685 (100.0%) |
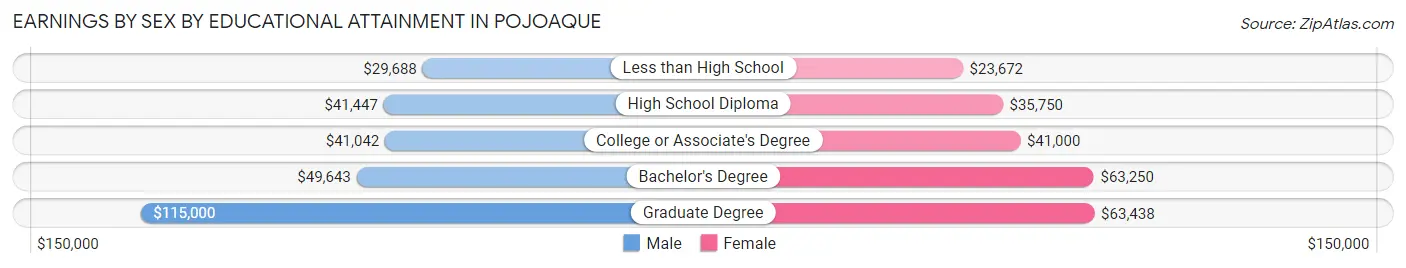
Earnings by Sex by Educational Attainment in Pojoaque
Average earnings in Pojoaque are $42,328 for men and $40,972 for women, a difference of 3.2%. Men with an educational attainment of graduate degree enjoy the highest average annual earnings of $115,000, while those with less than high school education earn the least with $29,688. Women with an educational attainment of graduate degree earn the most with the average annual earnings of $63,438, while those with less than high school education have the smallest earnings of $23,672.
| Educational Attainment | Male Income | Female Income |
| Less than High School | $29,688 | $23,672 |
| High School Diploma | $41,447 | $35,750 |
| College or Associate's Degree | $41,042 | $41,000 |
| Bachelor's Degree | $49,643 | $63,250 |
| Graduate Degree | $115,000 | $63,438 |
| Total | $42,328 | $40,972 |
Family Income in Pojoaque
Family Income Brackets in Pojoaque
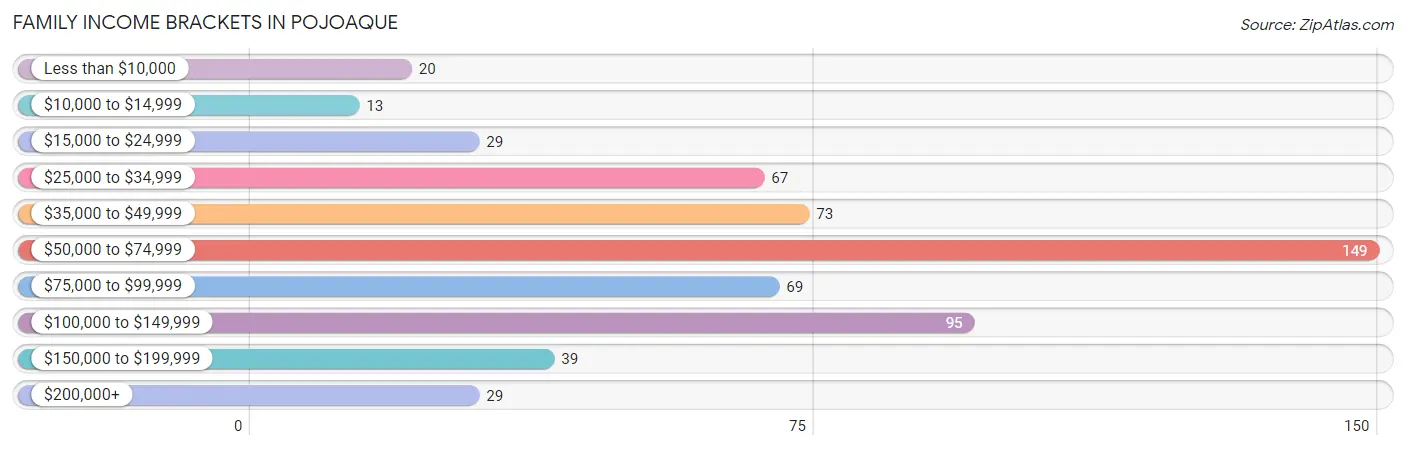
According to the Pojoaque family income data, there are 149 families falling into the $50,000 to $74,999 income range, which is the most common income bracket and makes up 25.6% of all families. Conversely, the $10,000 to $14,999 income bracket is the least frequent group with only 13 families (2.2%) belonging to this category.
| Income Bracket | # Families | % Families |
| Less than $10,000 | 20 | 3.4% |
| $10,000 to $14,999 | 13 | 2.2% |
| $15,000 to $24,999 | 29 | 5.0% |
| $25,000 to $34,999 | 67 | 11.5% |
| $35,000 to $49,999 | 73 | 12.5% |
| $50,000 to $74,999 | 149 | 25.6% |
| $75,000 to $99,999 | 69 | 11.8% |
| $100,000 to $149,999 | 95 | 16.3% |
| $150,000 to $199,999 | 39 | 6.7% |
| $200,000+ | 29 | 5.0% |
Family Income by Famaliy Size in Pojoaque
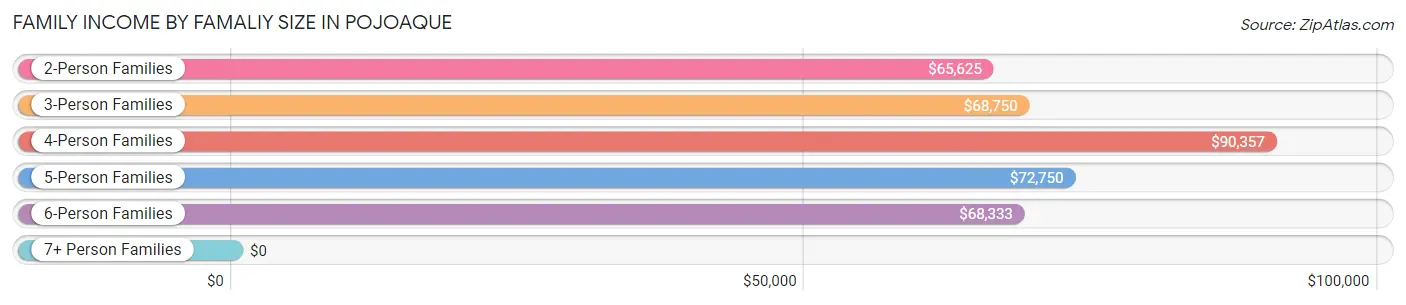
4-person families (112 | 19.2%) account for the highest median family income in Pojoaque with $90,357 per family, while 2-person families (265 | 45.5%) have the highest median income of $32,812 per family member.
| Income Bracket | # Families | Median Income |
| 2-Person Families | 265 (45.5%) | $65,625 |
| 3-Person Families | 132 (22.6%) | $68,750 |
| 4-Person Families | 112 (19.2%) | $90,357 |
| 5-Person Families | 53 (9.1%) | $72,750 |
| 6-Person Families | 18 (3.1%) | $68,333 |
| 7+ Person Families | 3 (0.5%) | $0 |
| Total | 583 (100.0%) | $70,391 |
Family Income by Number of Earners in Pojoaque
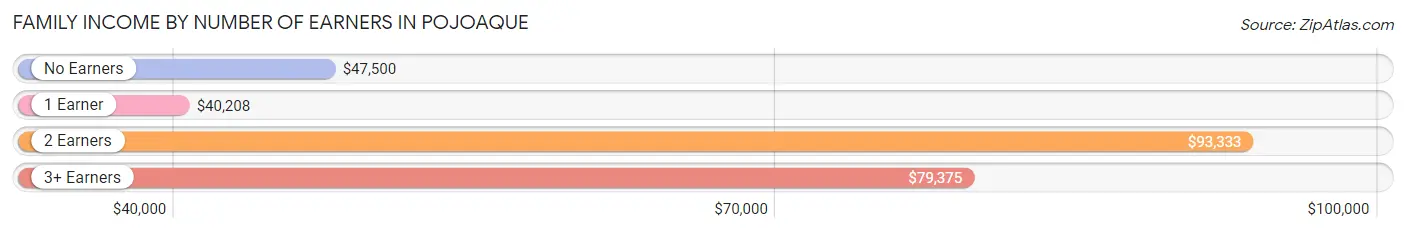
The median family income in Pojoaque is $70,391, with families comprising 2 earners (228) having the highest median family income of $93,333, while families with 1 earner (215) have the lowest median family income of $40,208, accounting for 39.1% and 36.9% of families, respectively.
| Number of Earners | # Families | Median Income |
| No Earners | 86 (14.7%) | $47,500 |
| 1 Earner | 215 (36.9%) | $40,208 |
| 2 Earners | 228 (39.1%) | $93,333 |
| 3+ Earners | 54 (9.3%) | $79,375 |
| Total | 583 (100.0%) | $70,391 |
Household Income in Pojoaque
Household Income Brackets in Pojoaque
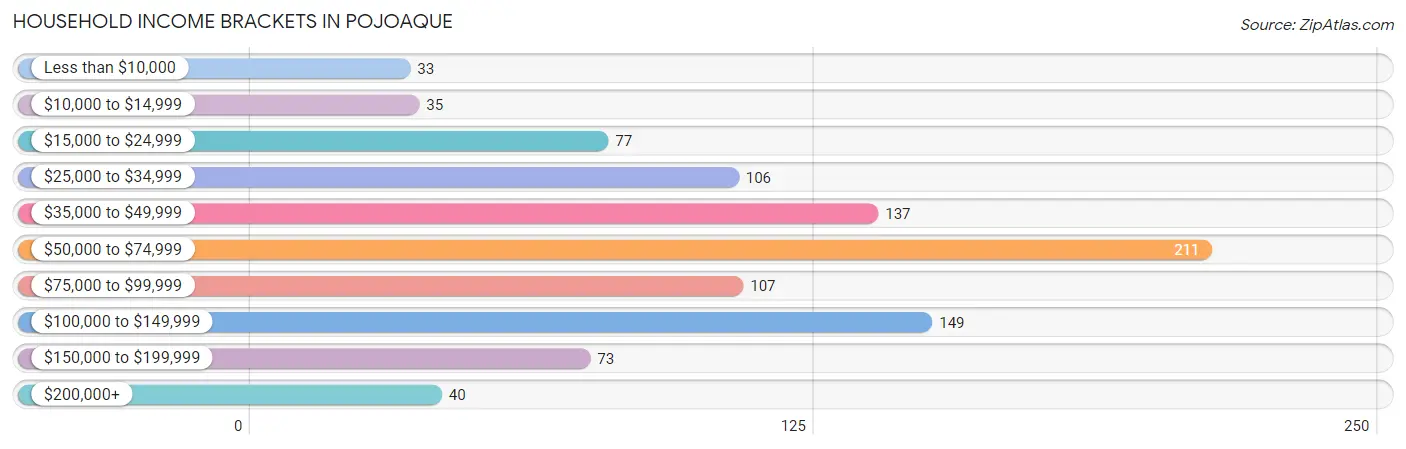
With 211 households falling in the category, the $50,000 to $74,999 income range is the most frequent in Pojoaque, accounting for 21.8% of all households. In contrast, only 33 households (3.4%) fall into the less than $10,000 income bracket, making it the least populous group.
| Income Bracket | # Households | % Households |
| Less than $10,000 | 33 | 3.4% |
| $10,000 to $14,999 | 35 | 3.6% |
| $15,000 to $24,999 | 77 | 8.0% |
| $25,000 to $34,999 | 106 | 11.0% |
| $35,000 to $49,999 | 137 | 14.2% |
| $50,000 to $74,999 | 211 | 21.8% |
| $75,000 to $99,999 | 107 | 11.1% |
| $100,000 to $149,999 | 149 | 15.4% |
| $150,000 to $199,999 | 73 | 7.5% |
| $200,000+ | 40 | 4.1% |
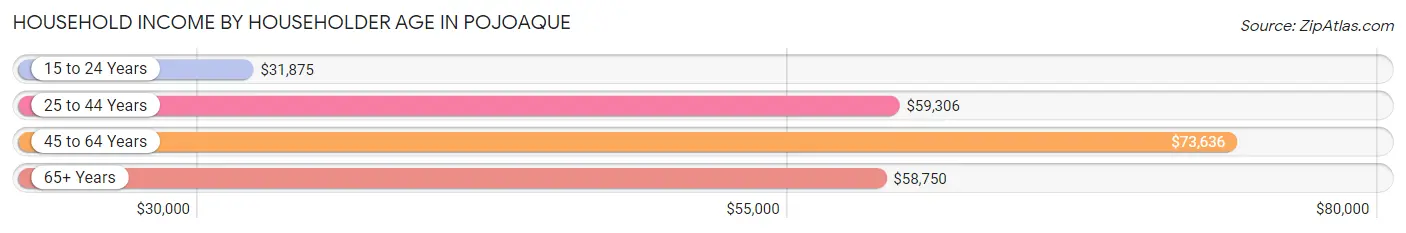
Household Income by Householder Age in Pojoaque
The median household income in Pojoaque is $61,583, with the highest median household income of $73,636 found in the 45 to 64 years age bracket for the primary householder. A total of 418 households (43.2%) fall into this category. Meanwhile, the 15 to 24 years age bracket for the primary householder has the lowest median household income of $31,875, with 65 households (6.7%) in this group.
| Income Bracket | # Households | Median Income |
| 15 to 24 Years | 65 (6.7%) | $31,875 |
| 25 to 44 Years | 267 (27.6%) | $59,306 |
| 45 to 64 Years | 418 (43.2%) | $73,636 |
| 65+ Years | 218 (22.5%) | $58,750 |
| Total | 968 (100.0%) | $61,583 |
Poverty in Pojoaque
Income Below Poverty by Sex and Age in Pojoaque
With 14.7% poverty level for males and 12.3% for females among the residents of Pojoaque, 5 year old males and under 5 year old females are the most vulnerable to poverty, with 5 males (38.5%) and 23 females (35.4%) in their respective age groups living below the poverty level.
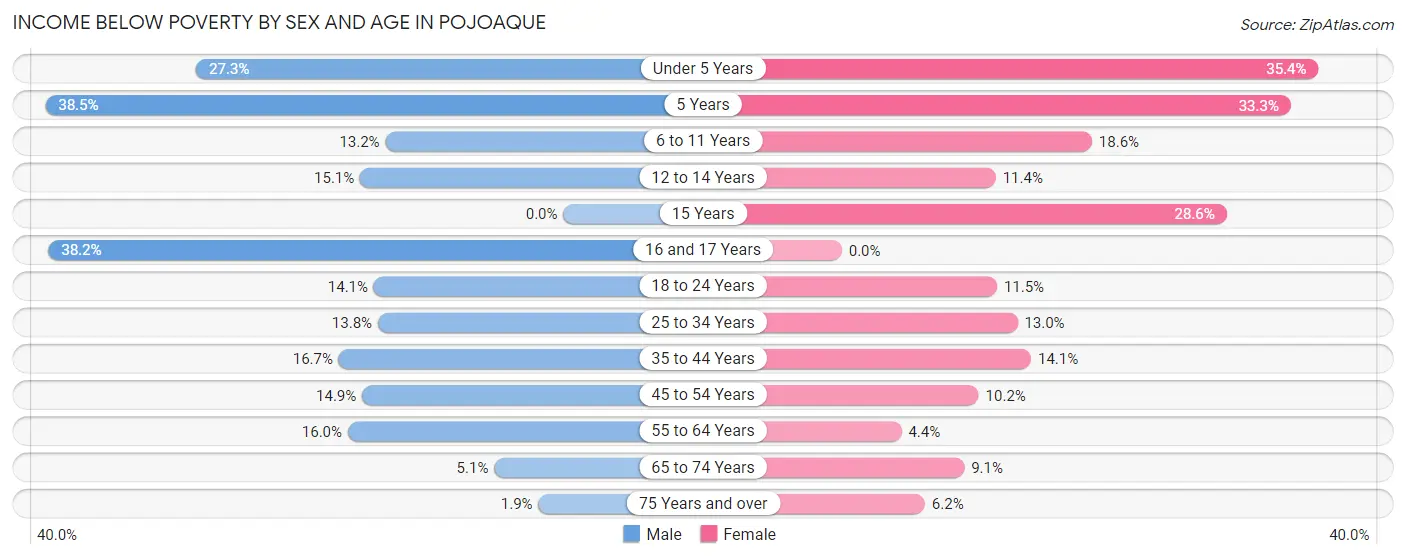
| Age Bracket | Male | Female |
| Under 5 Years | 18 (27.3%) | 23 (35.4%) |
| 5 Years | 5 (38.5%) | 5 (33.3%) |
| 6 to 11 Years | 14 (13.2%) | 13 (18.6%) |
| 12 to 14 Years | 8 (15.1%) | 4 (11.4%) |
| 15 Years | 0 (0.0%) | 2 (28.6%) |
| 16 and 17 Years | 13 (38.2%) | 0 (0.0%) |
| 18 to 24 Years | 19 (14.1%) | 25 (11.5%) |
| 25 to 34 Years | 19 (13.8%) | 18 (13.0%) |
| 35 to 44 Years | 20 (16.7%) | 17 (14.1%) |
| 45 to 54 Years | 23 (14.9%) | 19 (10.2%) |
| 55 to 64 Years | 24 (16.0%) | 7 (4.4%) |
| 65 to 74 Years | 6 (5.1%) | 6 (9.1%) |
| 75 Years and over | 1 (1.8%) | 5 (6.2%) |
| Total | 170 (14.7%) | 144 (12.3%) |
Income Above Poverty by Sex and Age in Pojoaque
According to the poverty statistics in Pojoaque, males aged 15 years and females aged 16 and 17 years are the age groups that are most secure financially, with 100.0% of males and 100.0% of females in these age groups living above the poverty line.
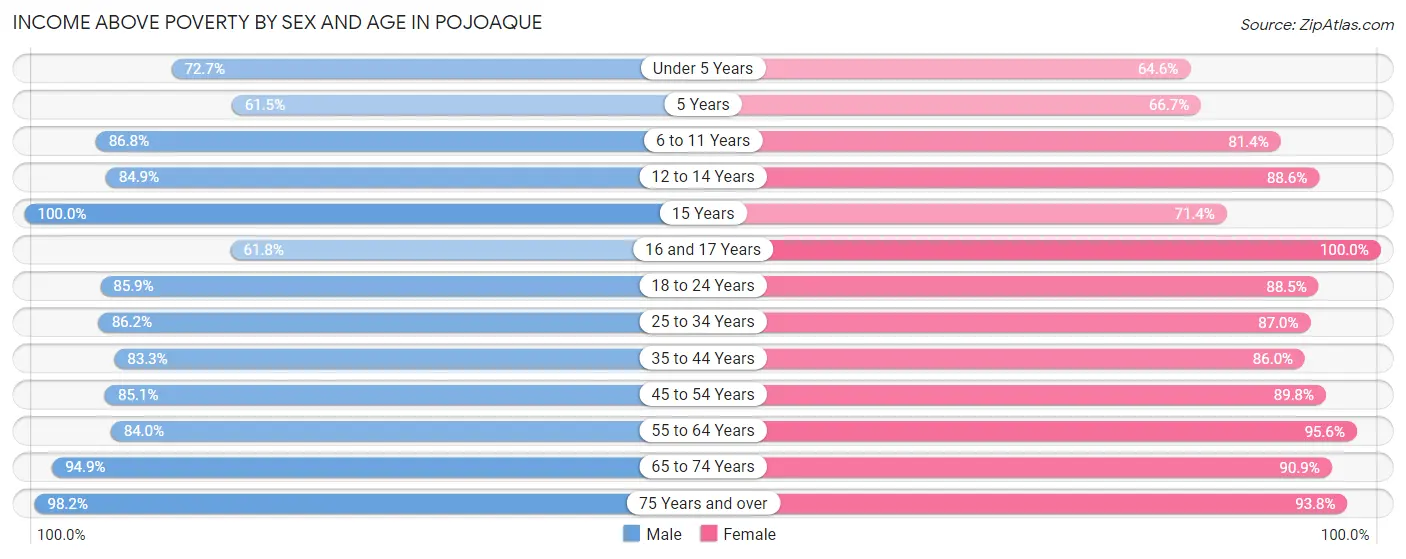
| Age Bracket | Male | Female |
| Under 5 Years | 48 (72.7%) | 42 (64.6%) |
| 5 Years | 8 (61.5%) | 10 (66.7%) |
| 6 to 11 Years | 92 (86.8%) | 57 (81.4%) |
| 12 to 14 Years | 45 (84.9%) | 31 (88.6%) |
| 15 Years | 19 (100.0%) | 5 (71.4%) |
| 16 and 17 Years | 21 (61.8%) | 12 (100.0%) |
| 18 to 24 Years | 116 (85.9%) | 192 (88.5%) |
| 25 to 34 Years | 119 (86.2%) | 120 (87.0%) |
| 35 to 44 Years | 100 (83.3%) | 104 (86.0%) |
| 45 to 54 Years | 131 (85.1%) | 168 (89.8%) |
| 55 to 64 Years | 126 (84.0%) | 151 (95.6%) |
| 65 to 74 Years | 111 (94.9%) | 60 (90.9%) |
| 75 Years and over | 53 (98.2%) | 76 (93.8%) |
| Total | 989 (85.3%) | 1,028 (87.7%) |
Income Below Poverty Among Married-Couple Families in Pojoaque
The poverty statistics for married-couple families in Pojoaque show that 5.7% or 17 of the total 298 families live below the poverty line. Families with 3 or 4 children have the highest poverty rate of 20.0%, comprising of 4 families. On the other hand, families with no children have the lowest poverty rate of 4.6%, which includes 9 families.
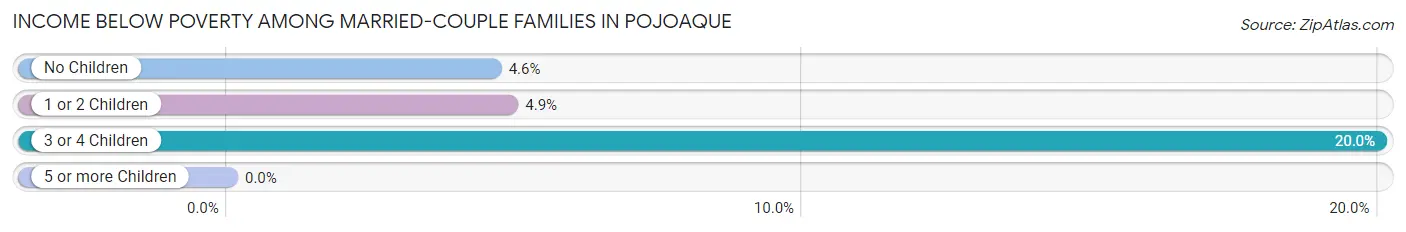
| Children | Above Poverty | Below Poverty |
| No Children | 187 (95.4%) | 9 (4.6%) |
| 1 or 2 Children | 78 (95.1%) | 4 (4.9%) |
| 3 or 4 Children | 16 (80.0%) | 4 (20.0%) |
| 5 or more Children | 0 (0.0%) | 0 (0.0%) |
| Total | 281 (94.3%) | 17 (5.7%) |
Income Below Poverty Among Single-Parent Households in Pojoaque
According to the poverty data in Pojoaque, 13.6% or 17 single-father households and 20.6% or 33 single-mother households are living below the poverty line. Among single-father households, those with 1 or 2 children have the highest poverty rate, with 13 households (22.4%) experiencing poverty. Likewise, among single-mother households, those with 3 or 4 children have the highest poverty rate, with 6 households (28.6%) falling below the poverty line.
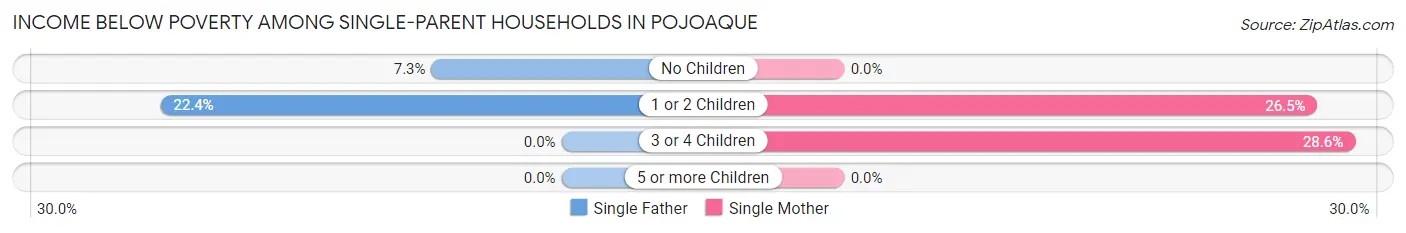
| Children | Single Father | Single Mother |
| No Children | 4 (7.3%) | 0 (0.0%) |
| 1 or 2 Children | 13 (22.4%) | 27 (26.5%) |
| 3 or 4 Children | 0 (0.0%) | 6 (28.6%) |
| 5 or more Children | 0 (0.0%) | 0 (0.0%) |
| Total | 17 (13.6%) | 33 (20.6%) |
Income Below Poverty Among Married-Couple vs Single-Parent Households in Pojoaque
The poverty data for Pojoaque shows that 17 of the married-couple family households (5.7%) and 50 of the single-parent households (17.5%) are living below the poverty level. Within the married-couple family households, those with 3 or 4 children have the highest poverty rate, with 4 households (20.0%) falling below the poverty line. Among the single-parent households, those with 1 or 2 children have the highest poverty rate, with 40 household (25.0%) living below poverty.
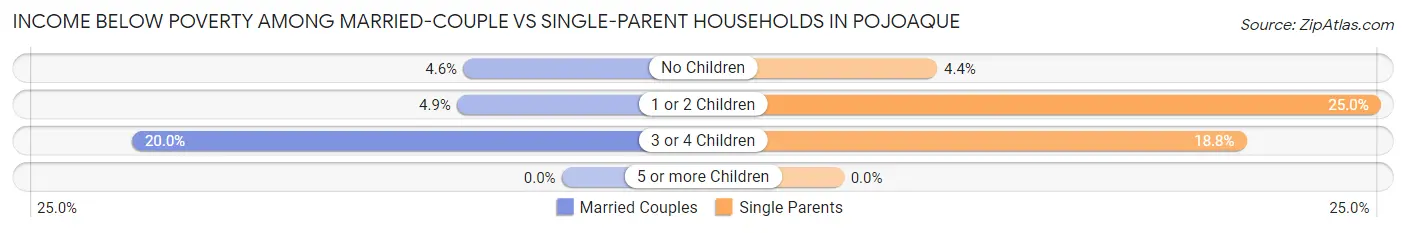
| Children | Married-Couple Families | Single-Parent Households |
| No Children | 9 (4.6%) | 4 (4.3%) |
| 1 or 2 Children | 4 (4.9%) | 40 (25.0%) |
| 3 or 4 Children | 4 (20.0%) | 6 (18.8%) |
| 5 or more Children | 0 (0.0%) | 0 (0.0%) |
| Total | 17 (5.7%) | 50 (17.5%) |
Race in Pojoaque
The most populous races in Pojoaque are Hispanic or Latino (1,540 | 65.9%), White / Caucasian (810 | 34.7%), and Some other Race (588 | 25.2%).
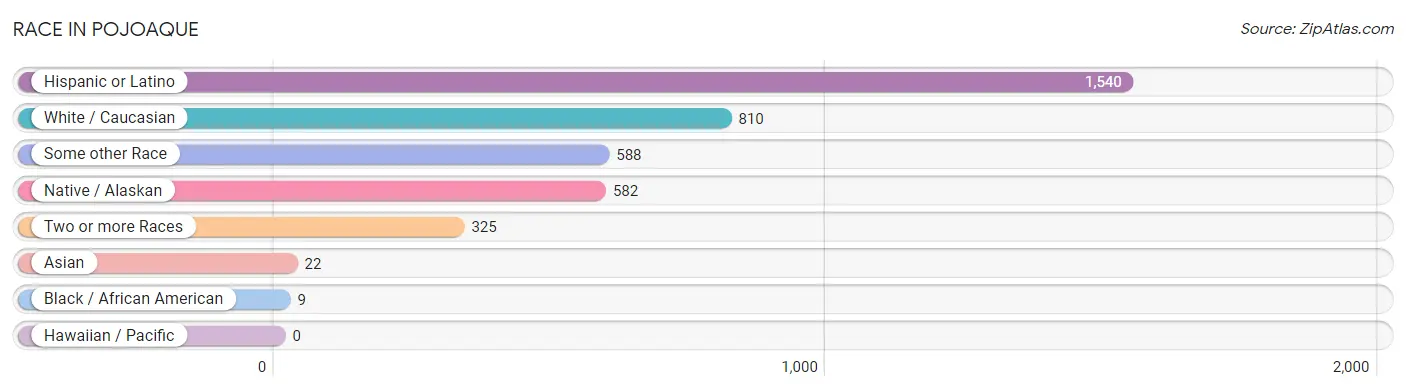
| Race | # Population | % Population |
| Asian | 22 | 0.9% |
| Black / African American | 9 | 0.4% |
| Hawaiian / Pacific | 0 | 0.0% |
| Hispanic or Latino | 1,540 | 65.9% |
| Native / Alaskan | 582 | 24.9% |
| White / Caucasian | 810 | 34.7% |
| Two or more Races | 325 | 13.9% |
| Some other Race | 588 | 25.2% |
| Total | 2,336 | 100.0% |
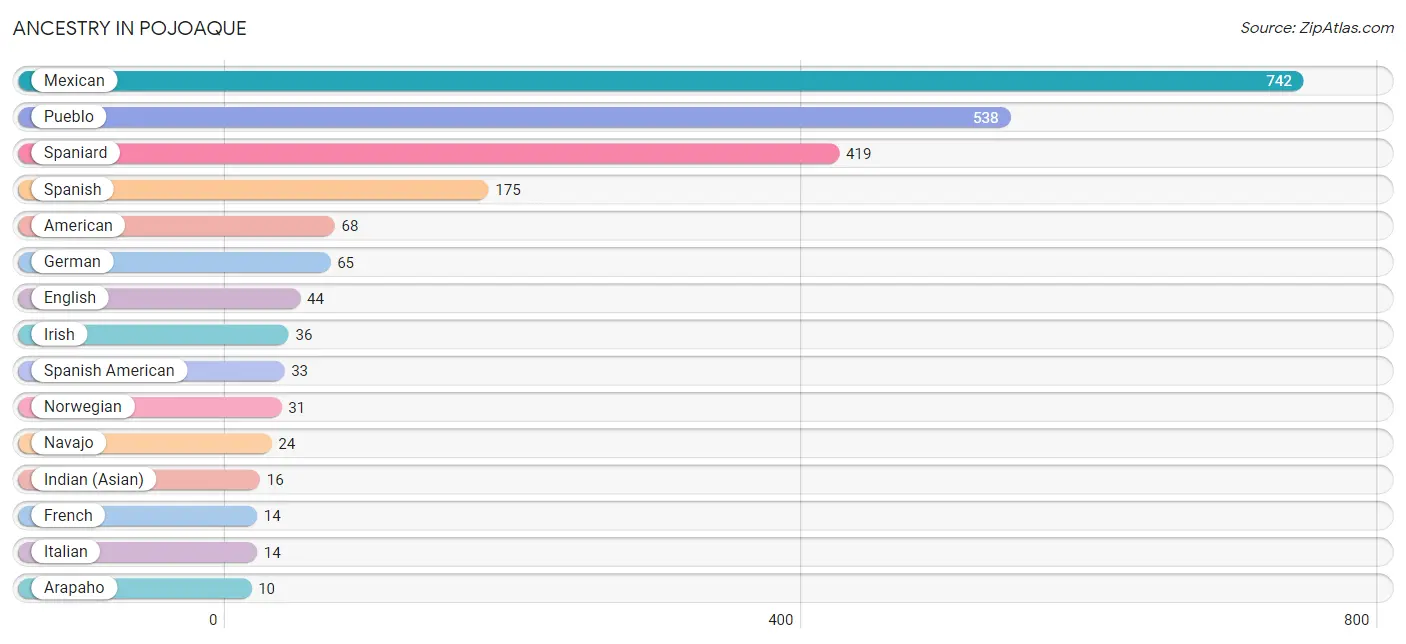
Ancestry in Pojoaque
The most populous ancestries reported in Pojoaque are Mexican (742 | 31.8%), Pueblo (538 | 23.0%), Spaniard (419 | 17.9%), Spanish (175 | 7.5%), and American (68 | 2.9%), together accounting for 83.1% of all Pojoaque residents.
| Ancestry | # Population | % Population |
| Alaska Native | 2 | 0.1% |
| American | 68 | 2.9% |
| Apache | 7 | 0.3% |
| Arab | 4 | 0.2% |
| Arapaho | 10 | 0.4% |
| Bangladeshi | 3 | 0.1% |
| Bhutanese | 6 | 0.3% |
| British | 6 | 0.3% |
| Central American | 1 | 0.0% |
| Cheyenne | 10 | 0.4% |
| Chickasaw | 2 | 0.1% |
| Choctaw | 2 | 0.1% |
| Czech | 2 | 0.1% |
| Dominican | 2 | 0.1% |
| Dutch | 4 | 0.2% |
| English | 44 | 1.9% |
| European | 7 | 0.3% |
| French | 14 | 0.6% |
| German | 65 | 2.8% |
| Greek | 2 | 0.1% |
| Hopi | 1 | 0.0% |
| Hungarian | 2 | 0.1% |
| Indian (Asian) | 16 | 0.7% |
| Irish | 36 | 1.5% |
| Iroquois | 2 | 0.1% |
| Italian | 14 | 0.6% |
| Kiowa | 2 | 0.1% |
| Lebanese | 4 | 0.2% |
| Malaysian | 2 | 0.1% |
| Mexican | 742 | 31.8% |
| Mexican American Indian | 1 | 0.0% |
| Navajo | 24 | 1.0% |
| Northern European | 4 | 0.2% |
| Norwegian | 31 | 1.3% |
| Peruvian | 2 | 0.1% |
| Polish | 5 | 0.2% |
| Pueblo | 538 | 23.0% |
| Puerto Rican | 2 | 0.1% |
| Russian | 7 | 0.3% |
| Salvadoran | 1 | 0.0% |
| Scandinavian | 2 | 0.1% |
| Scottish | 8 | 0.3% |
| Slavic | 1 | 0.0% |
| South American | 2 | 0.1% |
| Spaniard | 419 | 17.9% |
| Spanish | 175 | 7.5% |
| Spanish American | 33 | 1.4% |
| Swedish | 3 | 0.1% |
| Welsh | 4 | 0.2% | View All 49 Rows |
Immigrants in Pojoaque
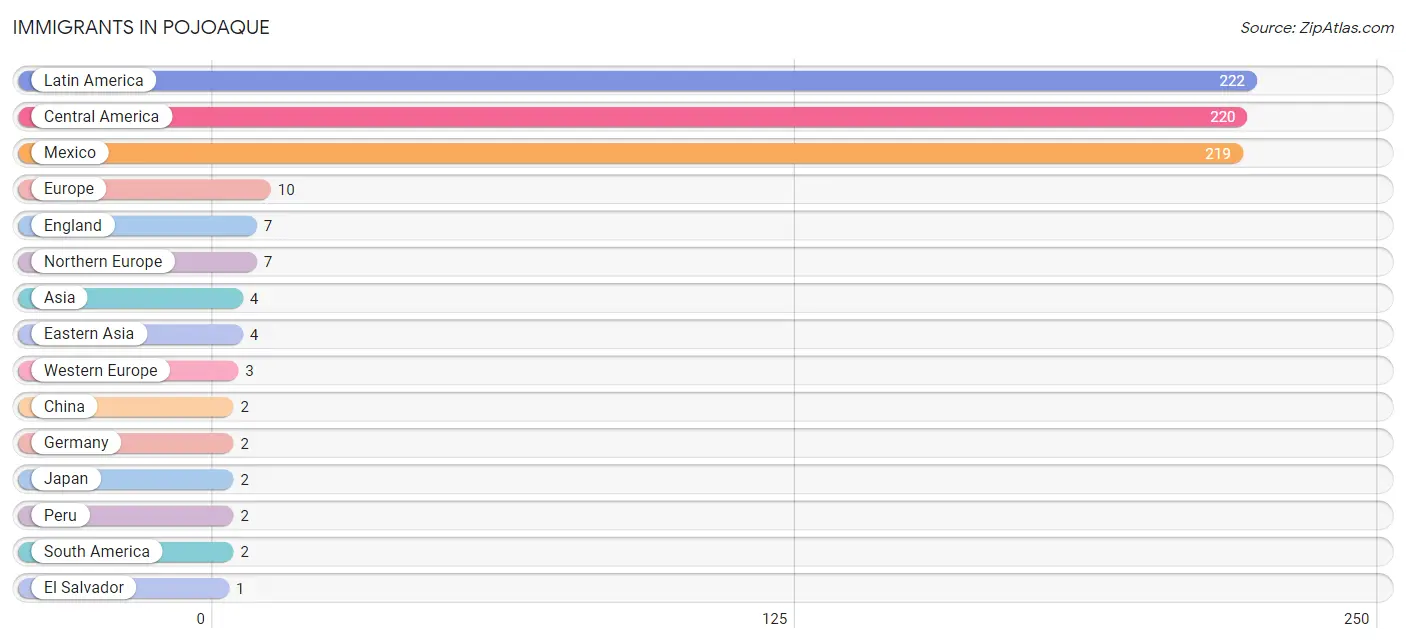
The most numerous immigrant groups reported in Pojoaque came from Latin America (222 | 9.5%), Central America (220 | 9.4%), Mexico (219 | 9.4%), Europe (10 | 0.4%), and England (7 | 0.3%), together accounting for 29.0% of all Pojoaque residents.
| Immigration Origin | # Population | % Population |
| Asia | 4 | 0.2% |
| Central America | 220 | 9.4% |
| China | 2 | 0.1% |
| Eastern Asia | 4 | 0.2% |
| El Salvador | 1 | 0.0% |
| England | 7 | 0.3% |
| Europe | 10 | 0.4% |
| France | 1 | 0.0% |
| Germany | 2 | 0.1% |
| Japan | 2 | 0.1% |
| Latin America | 222 | 9.5% |
| Mexico | 219 | 9.4% |
| Northern Europe | 7 | 0.3% |
| Peru | 2 | 0.1% |
| South America | 2 | 0.1% |
| Western Europe | 3 | 0.1% | View All 16 Rows |
Sex and Age in Pojoaque
Sex and Age in Pojoaque
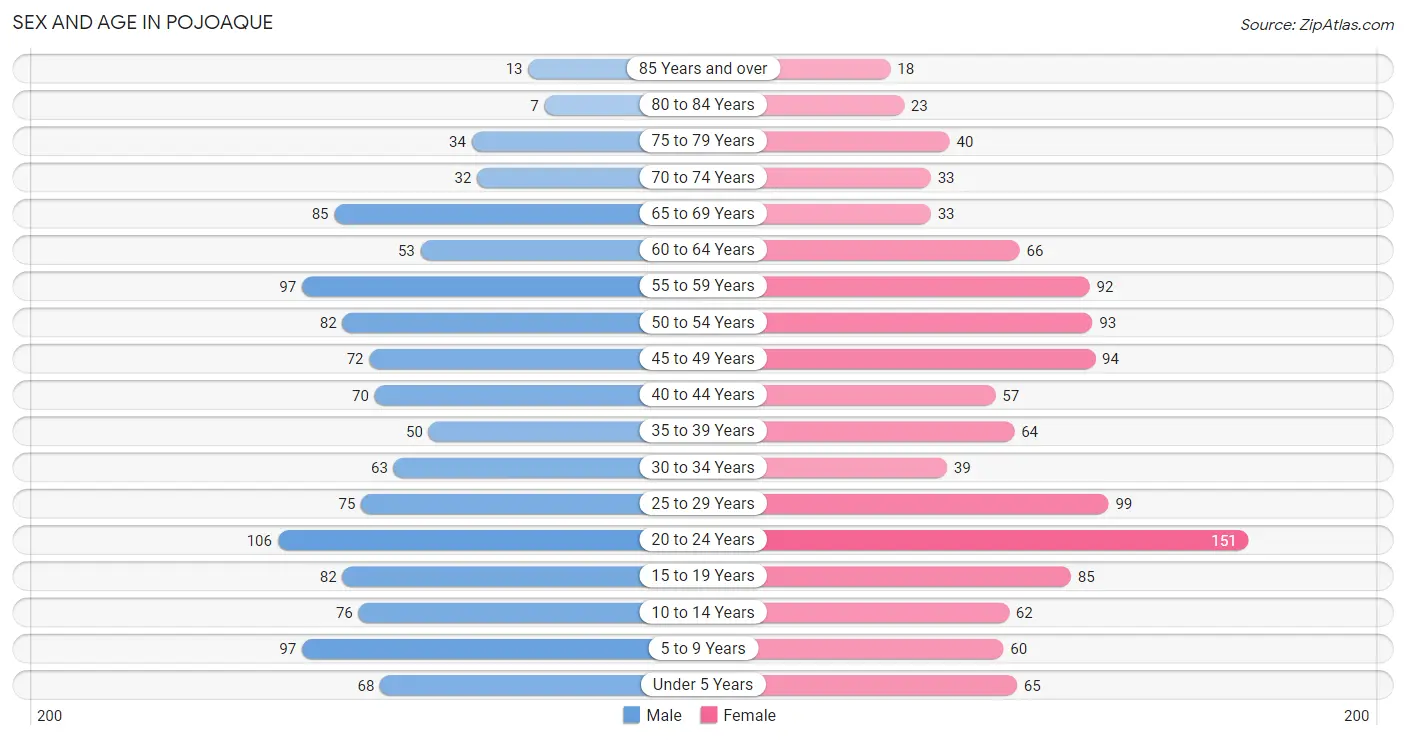
The most populous age groups in Pojoaque are 20 to 24 Years (106 | 9.1%) for men and 20 to 24 Years (151 | 12.9%) for women.
| Age Bracket | Male | Female |
| Under 5 Years | 68 (5.9%) | 65 (5.5%) |
| 5 to 9 Years | 97 (8.4%) | 60 (5.1%) |
| 10 to 14 Years | 76 (6.5%) | 62 (5.3%) |
| 15 to 19 Years | 82 (7.1%) | 85 (7.2%) |
| 20 to 24 Years | 106 (9.1%) | 151 (12.9%) |
| 25 to 29 Years | 75 (6.5%) | 99 (8.4%) |
| 30 to 34 Years | 63 (5.4%) | 39 (3.3%) |
| 35 to 39 Years | 50 (4.3%) | 64 (5.4%) |
| 40 to 44 Years | 70 (6.0%) | 57 (4.9%) |
| 45 to 49 Years | 72 (6.2%) | 94 (8.0%) |
| 50 to 54 Years | 82 (7.1%) | 93 (7.9%) |
| 55 to 59 Years | 97 (8.4%) | 92 (7.8%) |
| 60 to 64 Years | 53 (4.6%) | 66 (5.6%) |
| 65 to 69 Years | 85 (7.3%) | 33 (2.8%) |
| 70 to 74 Years | 32 (2.8%) | 33 (2.8%) |
| 75 to 79 Years | 34 (2.9%) | 40 (3.4%) |
| 80 to 84 Years | 7 (0.6%) | 23 (2.0%) |
| 85 Years and over | 13 (1.1%) | 18 (1.5%) |
| Total | 1,162 (100.0%) | 1,174 (100.0%) |
Families and Households in Pojoaque
Median Family Size in Pojoaque
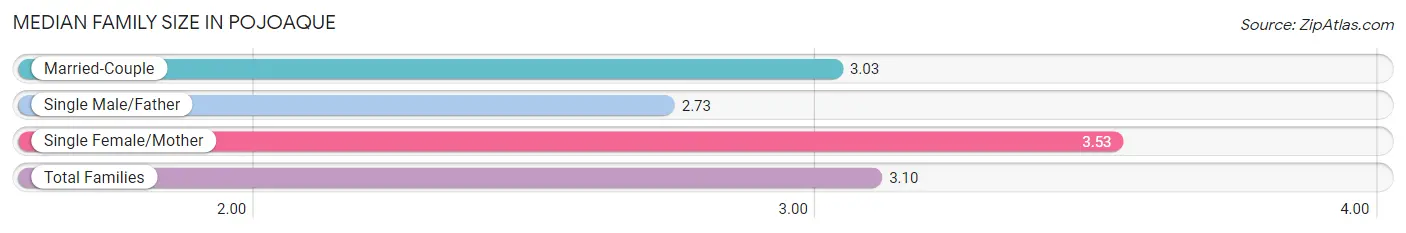
The median family size in Pojoaque is 3.10 persons per family, with single female/mother families (160 | 27.4%) accounting for the largest median family size of 3.53 persons per family. On the other hand, single male/father families (125 | 21.4%) represent the smallest median family size with 2.73 persons per family.
| Family Type | # Families | Family Size |
| Married-Couple | 298 (51.1%) | 3.03 |
| Single Male/Father | 125 (21.4%) | 2.73 |
| Single Female/Mother | 160 (27.4%) | 3.53 |
| Total Families | 583 (100.0%) | 3.10 |
Median Household Size in Pojoaque
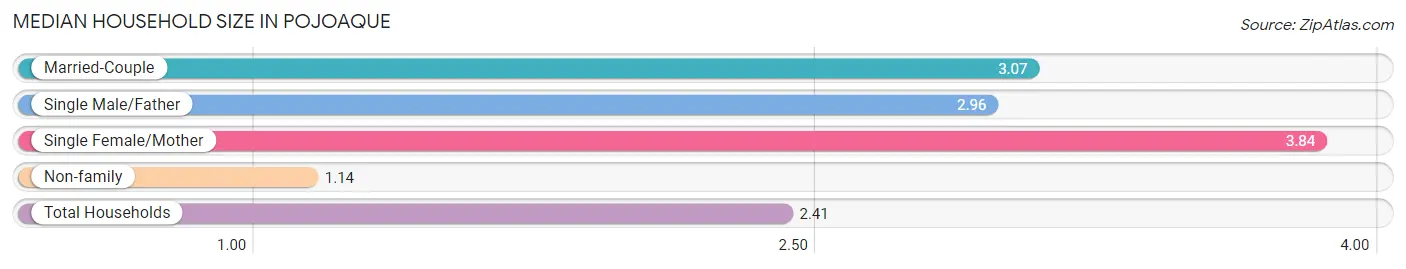
The median household size in Pojoaque is 2.41 persons per household, with single female/mother households (160 | 16.5%) accounting for the largest median household size of 3.84 persons per household. non-family households (385 | 39.8%) represent the smallest median household size with 1.14 persons per household.
| Household Type | # Households | Household Size |
| Married-Couple | 298 (30.8%) | 3.07 |
| Single Male/Father | 125 (12.9%) | 2.96 |
| Single Female/Mother | 160 (16.5%) | 3.84 |
| Non-family | 385 (39.8%) | 1.14 |
| Total Households | 968 (100.0%) | 2.41 |
Household Size by Marriage Status in Pojoaque
Out of a total of 968 households in Pojoaque, 583 (60.2%) are family households, while 385 (39.8%) are nonfamily households. The most numerous type of family households are 2-person households, comprising 237, and the most common type of nonfamily households are 1-person households, comprising 319.
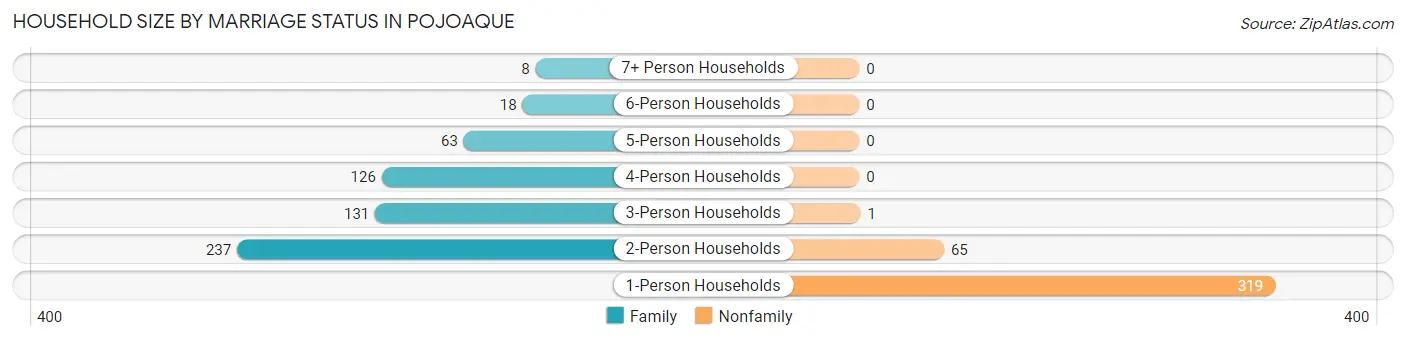
| Household Size | Family Households | Nonfamily Households |
| 1-Person Households | - | 319 (33.0%) |
| 2-Person Households | 237 (24.5%) | 65 (6.7%) |
| 3-Person Households | 131 (13.5%) | 1 (0.1%) |
| 4-Person Households | 126 (13.0%) | 0 (0.0%) |
| 5-Person Households | 63 (6.5%) | 0 (0.0%) |
| 6-Person Households | 18 (1.9%) | 0 (0.0%) |
| 7+ Person Households | 8 (0.8%) | 0 (0.0%) |
| Total | 583 (60.2%) | 385 (39.8%) |
Female Fertility in Pojoaque
Fertility by Age in Pojoaque
Average fertility rate in Pojoaque is 148.0 births per 1,000 women. Women in the age bracket of 20 to 34 years have the highest fertility rate with 287.0 births per 1,000 women. Women in the age bracket of 20 to 34 years acount for 91.2% of all women with births.
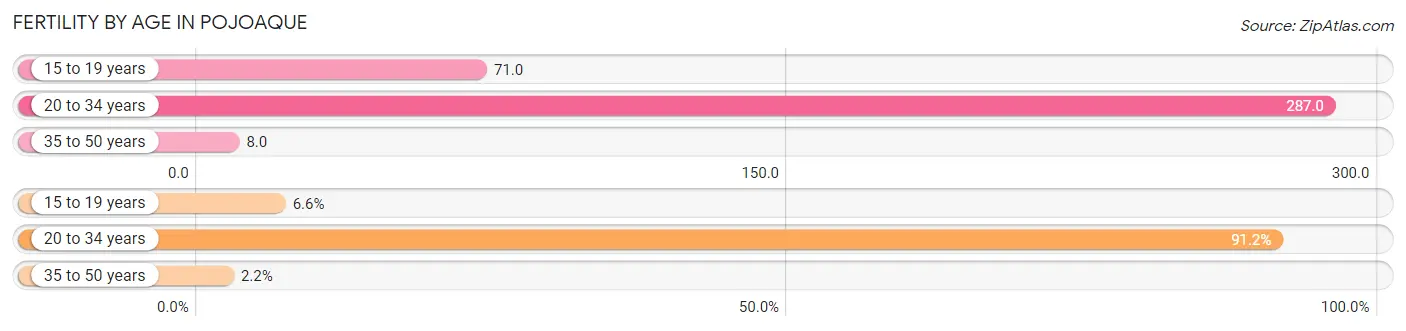
| Age Bracket | Women with Births | Births / 1,000 Women |
| 15 to 19 years | 6 (6.6%) | 71.0 |
| 20 to 34 years | 83 (91.2%) | 287.0 |
| 35 to 50 years | 2 (2.2%) | 8.0 |
| Total | 91 (100.0%) | 148.0 |
Fertility by Age by Marriage Status in Pojoaque
17.6% of women with births (91) in Pojoaque are married. The highest percentage of unmarried women with births falls into 15 to 19 years age bracket with 100.0% of them unmarried at the time of birth, while the lowest percentage of unmarried women with births belong to 35 to 50 years age bracket with 0.0% of them unmarried.
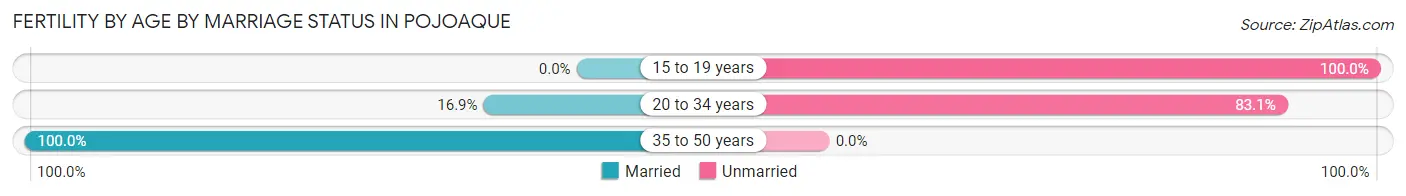
| Age Bracket | Married | Unmarried |
| 15 to 19 years | 0 (0.0%) | 6 (100.0%) |
| 20 to 34 years | 14 (16.9%) | 69 (83.1%) |
| 35 to 50 years | 2 (100.0%) | 0 (0.0%) |
| Total | 16 (17.6%) | 75 (82.4%) |
Fertility by Education in Pojoaque
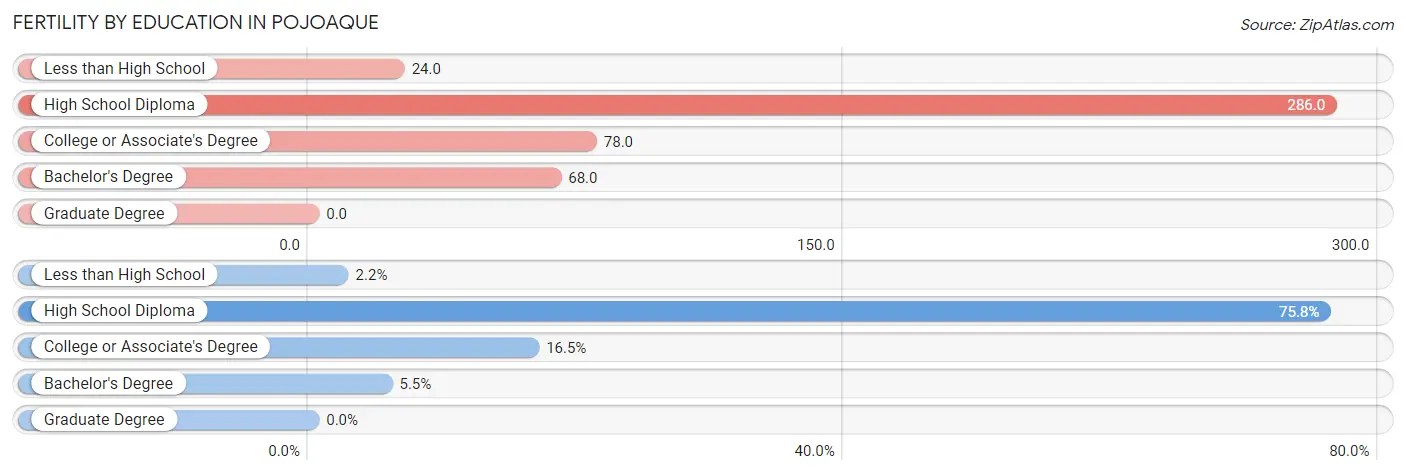
| Educational Attainment | Women with Births | Births / 1,000 Women |
| Less than High School | 2 (2.2%) | 24.0 |
| High School Diploma | 69 (75.8%) | 286.0 |
| College or Associate's Degree | 15 (16.5%) | 78.0 |
| Bachelor's Degree | 5 (5.5%) | 68.0 |
| Graduate Degree | 0 (0.0%) | 0.0 |
| Total | 91 (100.0%) | 148.0 |
Fertility by Education by Marriage Status in Pojoaque
82.4% of women with births in Pojoaque are unmarried. Women with the educational attainment of bachelor's degree are most likely to be married with 100.0% of them married at childbirth, while women with the educational attainment of less than high school are least likely to be married with 100.0% of them unmarried at childbirth.
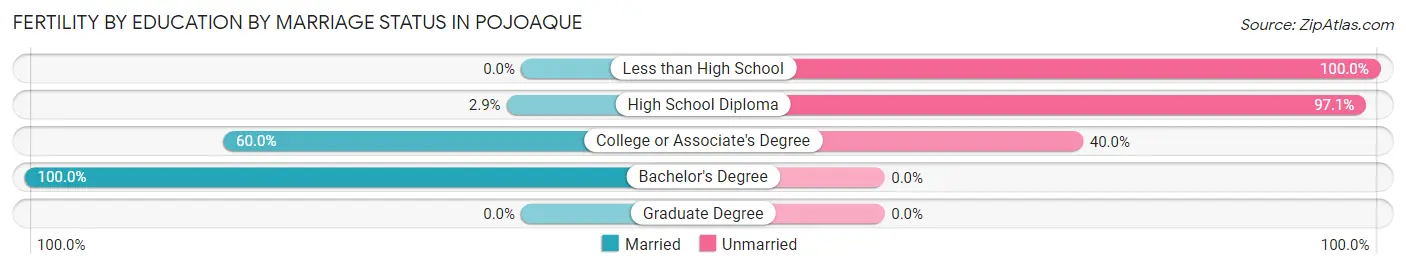
| Educational Attainment | Married | Unmarried |
| Less than High School | 0 (0.0%) | 2 (100.0%) |
| High School Diploma | 2 (2.9%) | 67 (97.1%) |
| College or Associate's Degree | 9 (60.0%) | 6 (40.0%) |
| Bachelor's Degree | 5 (100.0%) | 0 (0.0%) |
| Graduate Degree | 0 (0.0%) | 0 (0.0%) |
| Total | 16 (17.6%) | 75 (82.4%) |
Employment Characteristics in Pojoaque
Employment by Class of Employer in Pojoaque
Among the 1,195 employed individuals in Pojoaque, private company employees (522 | 43.7%), local government employees (229 | 19.2%), and federal government employees (181 | 15.1%) make up the most common classes of employment.
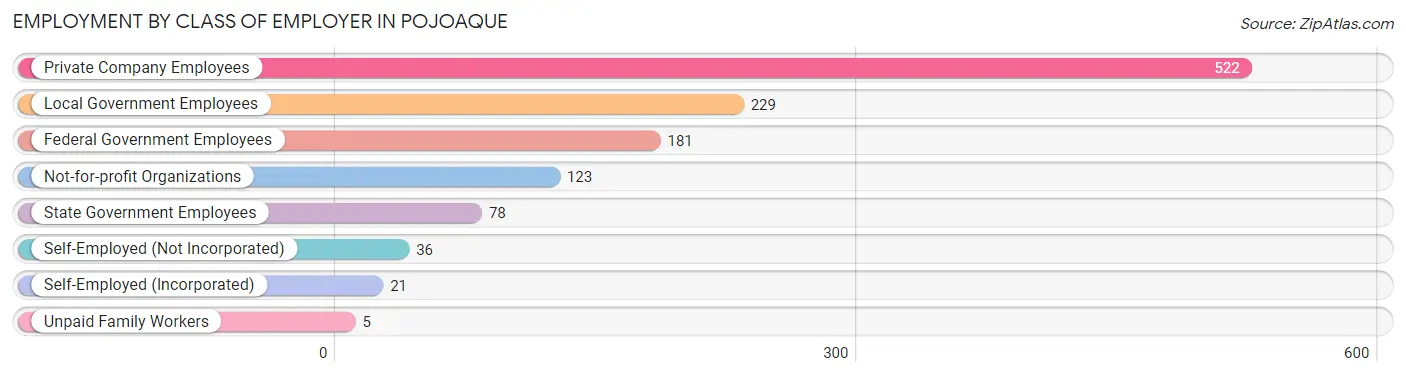
| Employer Class | # Employees | % Employees |
| Private Company Employees | 522 | 43.7% |
| Self-Employed (Incorporated) | 21 | 1.8% |
| Self-Employed (Not Incorporated) | 36 | 3.0% |
| Not-for-profit Organizations | 123 | 10.3% |
| Local Government Employees | 229 | 19.2% |
| State Government Employees | 78 | 6.5% |
| Federal Government Employees | 181 | 15.1% |
| Unpaid Family Workers | 5 | 0.4% |
| Total | 1,195 | 100.0% |
Employment Status by Age in Pojoaque
According to the labor force statistics for Pojoaque, out of the total population over 16 years of age (1,882), 67.9% or 1,278 individuals are in the labor force, with 4.6% or 59 of them unemployed. The age group with the highest labor force participation rate is 35 to 44 years, with 91.3% or 220 individuals in the labor force. Within the labor force, the 20 to 24 years age range has the highest percentage of unemployed individuals, with 11.4% or 24 of them being unemployed.
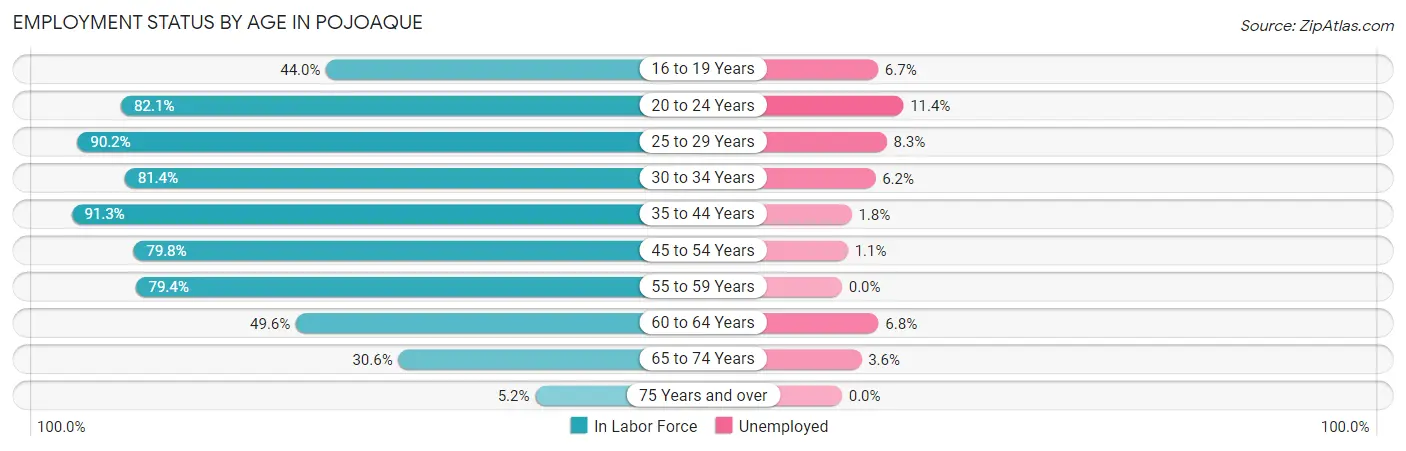
| Age Bracket | In Labor Force | Unemployed |
| 16 to 19 Years | 62 (44.0%) | 4 (6.7%) |
| 20 to 24 Years | 211 (82.1%) | 24 (11.4%) |
| 25 to 29 Years | 157 (90.2%) | 13 (8.3%) |
| 30 to 34 Years | 83 (81.4%) | 5 (6.2%) |
| 35 to 44 Years | 220 (91.3%) | 4 (1.8%) |
| 45 to 54 Years | 272 (79.8%) | 3 (1.1%) |
| 55 to 59 Years | 150 (79.4%) | 0 (0.0%) |
| 60 to 64 Years | 59 (49.6%) | 4 (6.8%) |
| 65 to 74 Years | 56 (30.6%) | 2 (3.6%) |
| 75 Years and over | 7 (5.2%) | 0 (0.0%) |
| Total | 1,278 (67.9%) | 59 (4.6%) |
Employment Status by Educational Attainment in Pojoaque
According to labor force statistics for Pojoaque, 80.7% of individuals (941) out of the total population between 25 and 64 years of age (1,166) are in the labor force, with 3.1% or 29 of them being unemployed. The group with the highest labor force participation rate are those with the educational attainment of bachelor's degree or higher, with 86.4% or 209 individuals in the labor force. Within the labor force, individuals with less than high school education have the highest percentage of unemployment, with 6.6% or 7 of them being unemployed.
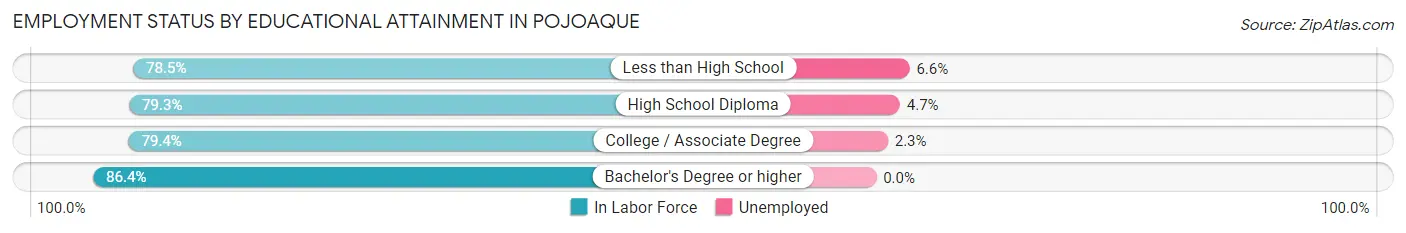
| Educational Attainment | In Labor Force | Unemployed |
| Less than High School | 106 (78.5%) | 9 (6.6%) |
| High School Diploma | 318 (79.3%) | 19 (4.7%) |
| College / Associate Degree | 308 (79.4%) | 9 (2.3%) |
| Bachelor's Degree or higher | 209 (86.4%) | 0 (0.0%) |
| Total | 941 (80.7%) | 36 (3.1%) |
Employment Occupations by Sex in Pojoaque
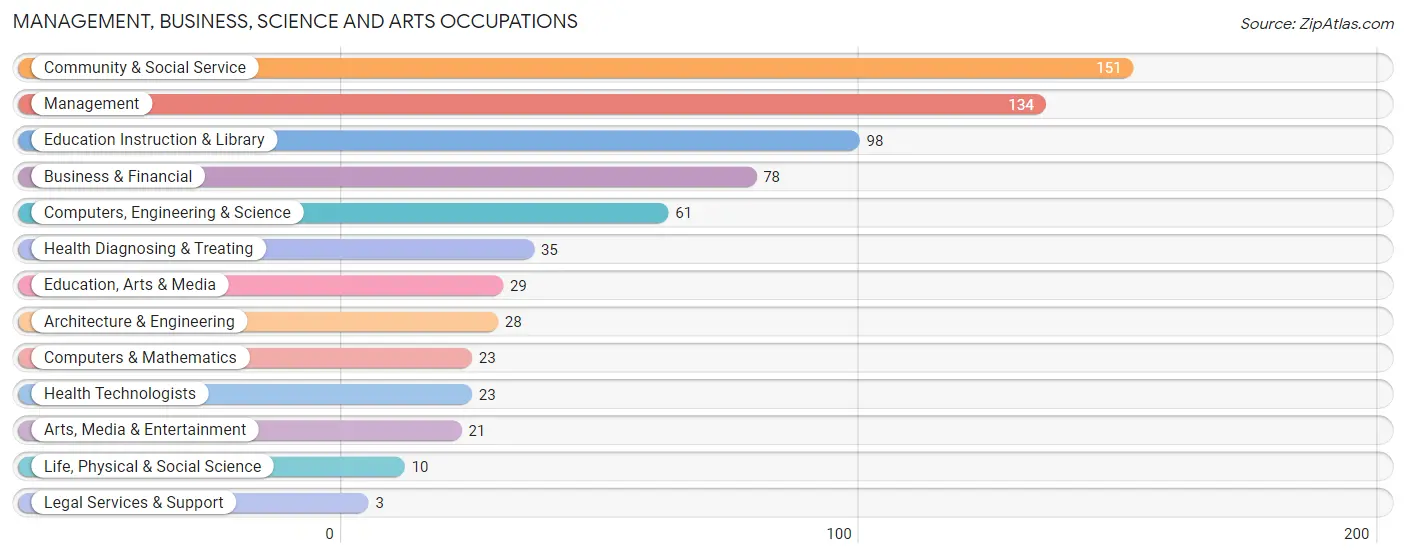
Management, Business, Science and Arts Occupations
The most common Management, Business, Science and Arts occupations in Pojoaque are Community & Social Service (151 | 12.4%), Management (134 | 11.0%), Education Instruction & Library (98 | 8.1%), Business & Financial (78 | 6.4%), and Computers, Engineering & Science (61 | 5.0%).
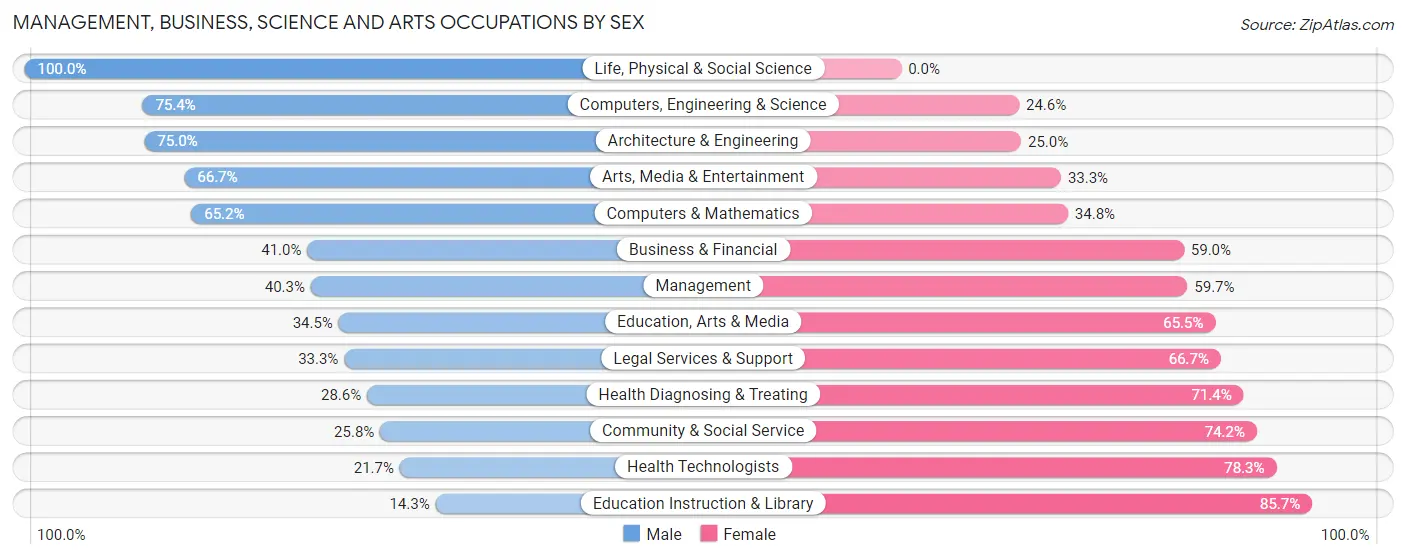
Management, Business, Science and Arts Occupations by Sex
Within the Management, Business, Science and Arts occupations in Pojoaque, the most male-oriented occupations are Life, Physical & Social Science (100.0%), Computers, Engineering & Science (75.4%), and Architecture & Engineering (75.0%), while the most female-oriented occupations are Education Instruction & Library (85.7%), Health Technologists (78.3%), and Community & Social Service (74.2%).
| Occupation | Male | Female |
| Management | 54 (40.3%) | 80 (59.7%) |
| Business & Financial | 32 (41.0%) | 46 (59.0%) |
| Computers, Engineering & Science | 46 (75.4%) | 15 (24.6%) |
| Computers & Mathematics | 15 (65.2%) | 8 (34.8%) |
| Architecture & Engineering | 21 (75.0%) | 7 (25.0%) |
| Life, Physical & Social Science | 10 (100.0%) | 0 (0.0%) |
| Community & Social Service | 39 (25.8%) | 112 (74.2%) |
| Education, Arts & Media | 10 (34.5%) | 19 (65.5%) |
| Legal Services & Support | 1 (33.3%) | 2 (66.7%) |
| Education Instruction & Library | 14 (14.3%) | 84 (85.7%) |
| Arts, Media & Entertainment | 14 (66.7%) | 7 (33.3%) |
| Health Diagnosing & Treating | 10 (28.6%) | 25 (71.4%) |
| Health Technologists | 5 (21.7%) | 18 (78.3%) |
| Total (Category) | 181 (39.4%) | 278 (60.6%) |
| Total (Overall) | 553 (45.6%) | 661 (54.4%) |
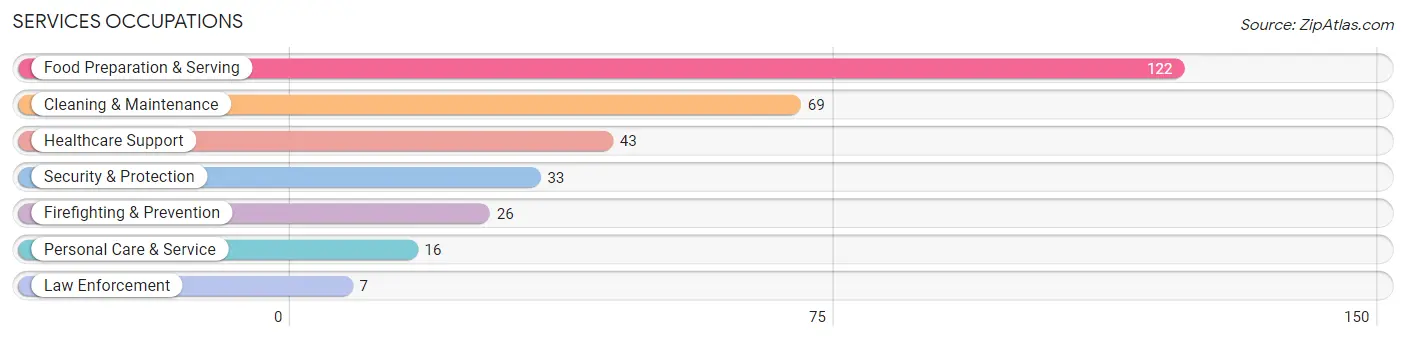
Services Occupations
The most common Services occupations in Pojoaque are Food Preparation & Serving (122 | 10.1%), Cleaning & Maintenance (69 | 5.7%), Healthcare Support (43 | 3.5%), Security & Protection (33 | 2.7%), and Firefighting & Prevention (26 | 2.1%).
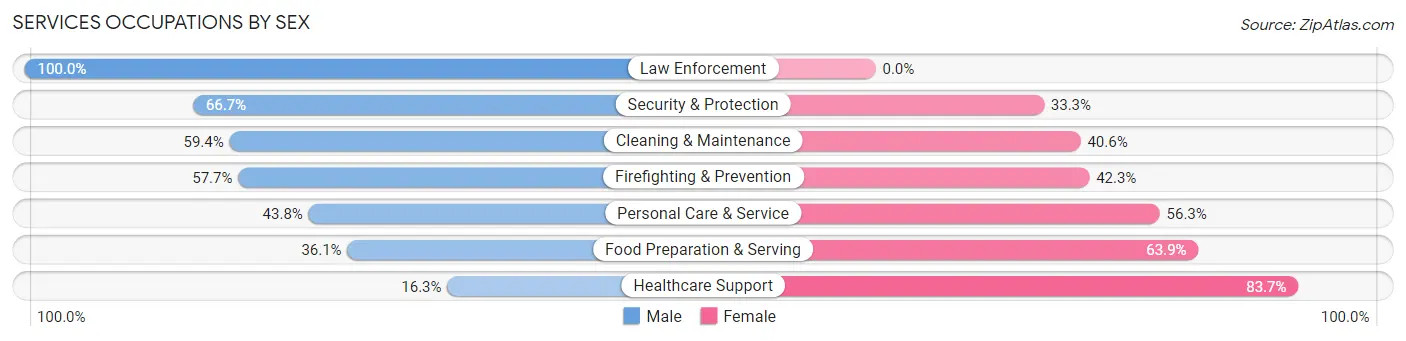
Services Occupations by Sex
Within the Services occupations in Pojoaque, the most male-oriented occupations are Law Enforcement (100.0%), Security & Protection (66.7%), and Cleaning & Maintenance (59.4%), while the most female-oriented occupations are Healthcare Support (83.7%), Food Preparation & Serving (63.9%), and Personal Care & Service (56.2%).
| Occupation | Male | Female |
| Healthcare Support | 7 (16.3%) | 36 (83.7%) |
| Security & Protection | 22 (66.7%) | 11 (33.3%) |
| Firefighting & Prevention | 15 (57.7%) | 11 (42.3%) |
| Law Enforcement | 7 (100.0%) | 0 (0.0%) |
| Food Preparation & Serving | 44 (36.1%) | 78 (63.9%) |
| Cleaning & Maintenance | 41 (59.4%) | 28 (40.6%) |
| Personal Care & Service | 7 (43.8%) | 9 (56.2%) |
| Total (Category) | 121 (42.8%) | 162 (57.2%) |
| Total (Overall) | 553 (45.6%) | 661 (54.4%) |
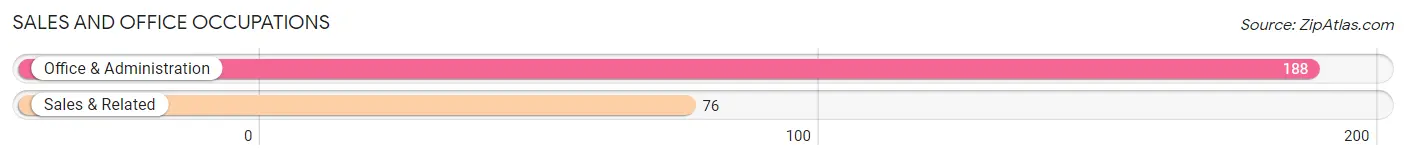
Sales and Office Occupations
The most common Sales and Office occupations in Pojoaque are Office & Administration (188 | 15.5%), and Sales & Related (76 | 6.3%).
Sales and Office Occupations by Sex
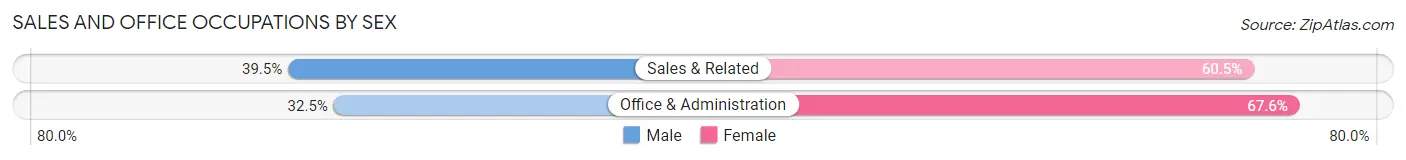
| Occupation | Male | Female |
| Sales & Related | 30 (39.5%) | 46 (60.5%) |
| Office & Administration | 61 (32.5%) | 127 (67.5%) |
| Total (Category) | 91 (34.5%) | 173 (65.5%) |
| Total (Overall) | 553 (45.6%) | 661 (54.4%) |
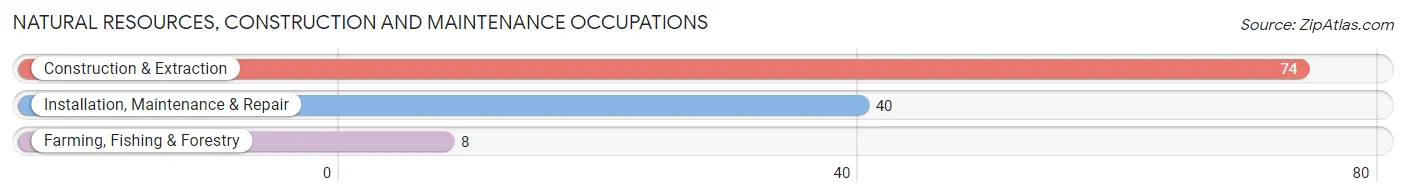
Natural Resources, Construction and Maintenance Occupations
The most common Natural Resources, Construction and Maintenance occupations in Pojoaque are Construction & Extraction (74 | 6.1%), Installation, Maintenance & Repair (40 | 3.3%), and Farming, Fishing & Forestry (8 | 0.7%).
Natural Resources, Construction and Maintenance Occupations by Sex
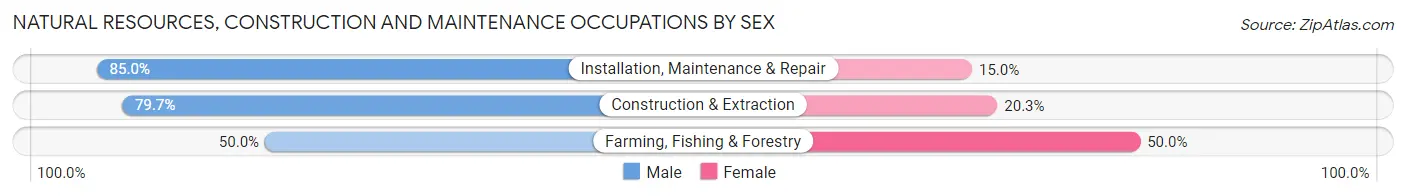
| Occupation | Male | Female |
| Farming, Fishing & Forestry | 4 (50.0%) | 4 (50.0%) |
| Construction & Extraction | 59 (79.7%) | 15 (20.3%) |
| Installation, Maintenance & Repair | 34 (85.0%) | 6 (15.0%) |
| Total (Category) | 97 (79.5%) | 25 (20.5%) |
| Total (Overall) | 553 (45.6%) | 661 (54.4%) |
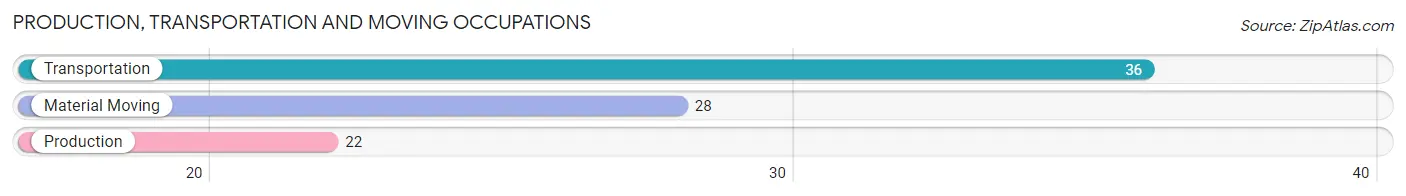
Production, Transportation and Moving Occupations
The most common Production, Transportation and Moving occupations in Pojoaque are Transportation (36 | 3.0%), Material Moving (28 | 2.3%), and Production (22 | 1.8%).
Production, Transportation and Moving Occupations by Sex
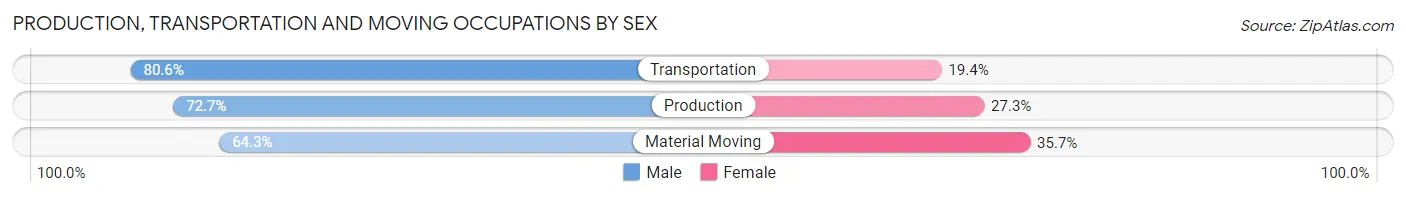
| Occupation | Male | Female |
| Production | 16 (72.7%) | 6 (27.3%) |
| Transportation | 29 (80.6%) | 7 (19.4%) |
| Material Moving | 18 (64.3%) | 10 (35.7%) |
| Total (Category) | 63 (73.3%) | 23 (26.7%) |
| Total (Overall) | 553 (45.6%) | 661 (54.4%) |
Employment Industries by Sex in Pojoaque
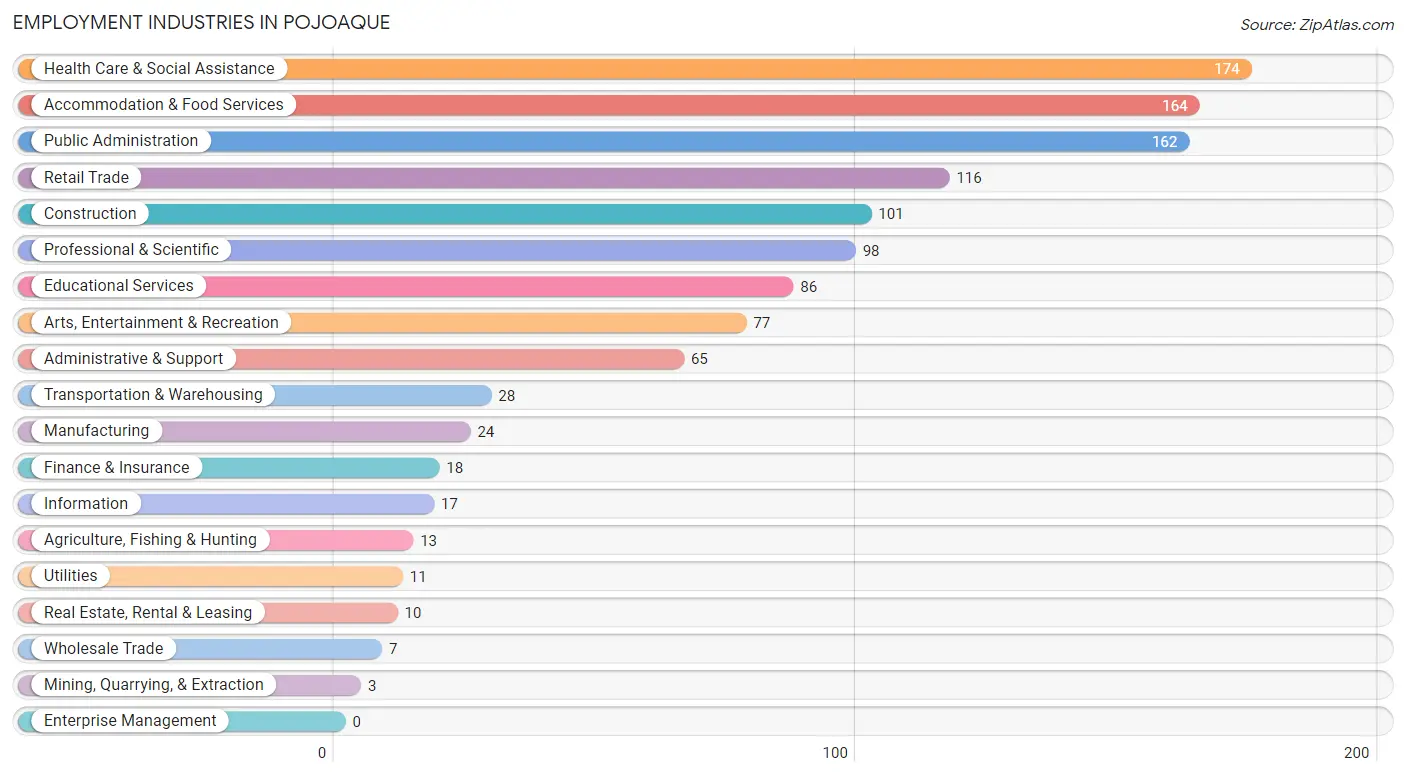
Employment Industries in Pojoaque
The major employment industries in Pojoaque include Health Care & Social Assistance (174 | 14.3%), Accommodation & Food Services (164 | 13.5%), Public Administration (162 | 13.3%), Retail Trade (116 | 9.6%), and Construction (101 | 8.3%).
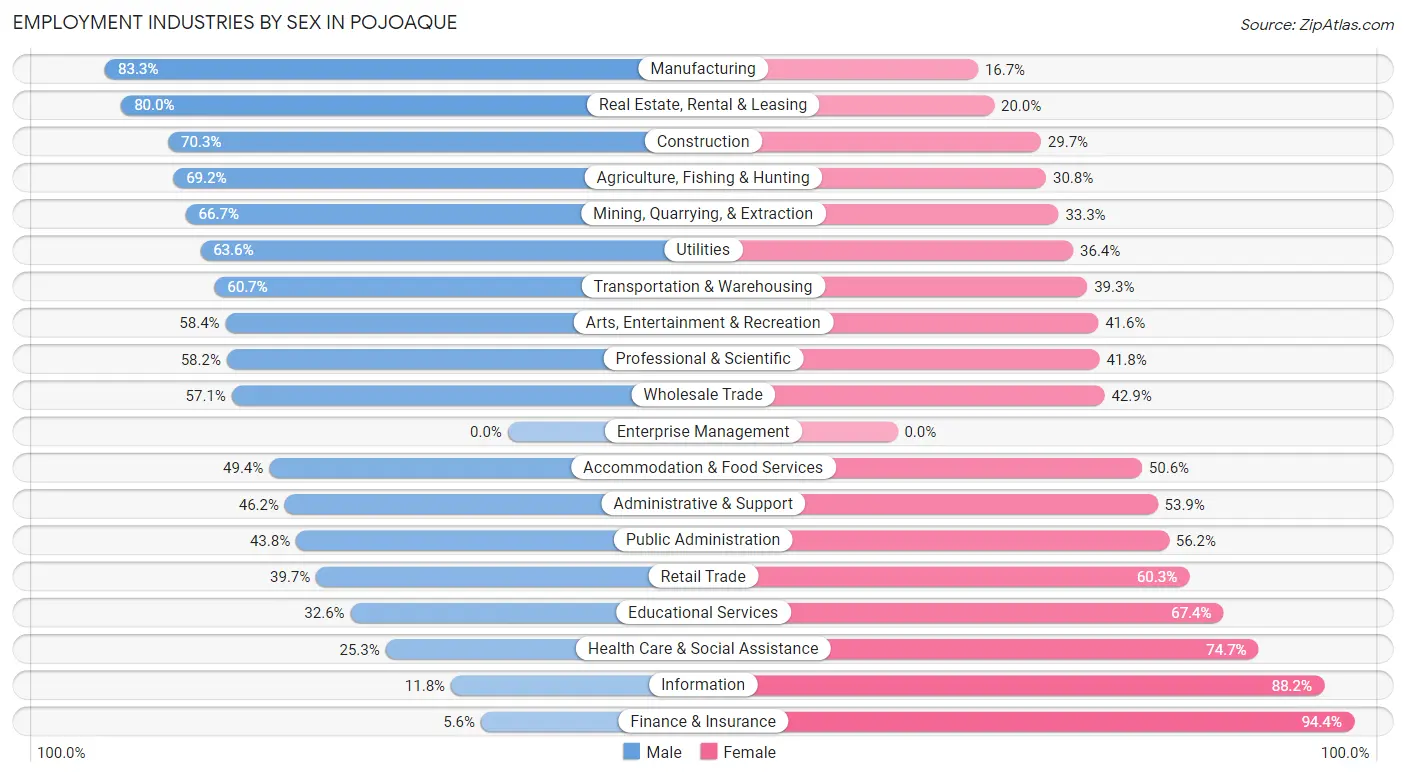
Employment Industries by Sex in Pojoaque
The Pojoaque industries that see more men than women are Manufacturing (83.3%), Real Estate, Rental & Leasing (80.0%), and Construction (70.3%), whereas the industries that tend to have a higher number of women are Finance & Insurance (94.4%), Information (88.2%), and Health Care & Social Assistance (74.7%).
| Industry | Male | Female |
| Agriculture, Fishing & Hunting | 9 (69.2%) | 4 (30.8%) |
| Mining, Quarrying, & Extraction | 2 (66.7%) | 1 (33.3%) |
| Construction | 71 (70.3%) | 30 (29.7%) |
| Manufacturing | 20 (83.3%) | 4 (16.7%) |
| Wholesale Trade | 4 (57.1%) | 3 (42.9%) |
| Retail Trade | 46 (39.7%) | 70 (60.3%) |
| Transportation & Warehousing | 17 (60.7%) | 11 (39.3%) |
| Utilities | 7 (63.6%) | 4 (36.4%) |
| Information | 2 (11.8%) | 15 (88.2%) |
| Finance & Insurance | 1 (5.6%) | 17 (94.4%) |
| Real Estate, Rental & Leasing | 8 (80.0%) | 2 (20.0%) |
| Professional & Scientific | 57 (58.2%) | 41 (41.8%) |
| Enterprise Management | 0 (0.0%) | 0 (0.0%) |
| Administrative & Support | 30 (46.2%) | 35 (53.8%) |
| Educational Services | 28 (32.6%) | 58 (67.4%) |
| Health Care & Social Assistance | 44 (25.3%) | 130 (74.7%) |
| Arts, Entertainment & Recreation | 45 (58.4%) | 32 (41.6%) |
| Accommodation & Food Services | 81 (49.4%) | 83 (50.6%) |
| Public Administration | 71 (43.8%) | 91 (56.2%) |
| Total | 553 (45.6%) | 661 (54.4%) |
Education in Pojoaque
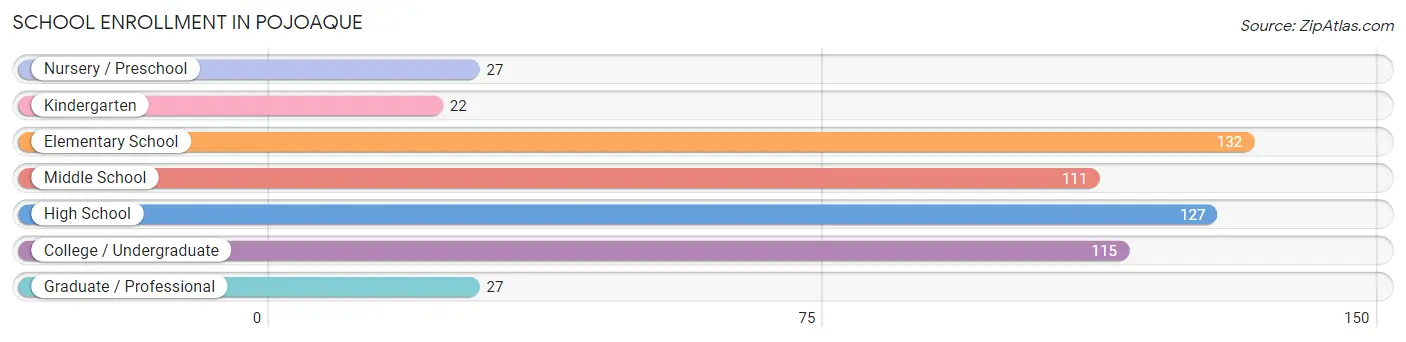
School Enrollment in Pojoaque
The most common levels of schooling among the 561 students in Pojoaque are elementary school (132 | 23.5%), high school (127 | 22.6%), and college / undergraduate (115 | 20.5%).
| School Level | # Students | % Students |
| Nursery / Preschool | 27 | 4.8% |
| Kindergarten | 22 | 3.9% |
| Elementary School | 132 | 23.5% |
| Middle School | 111 | 19.8% |
| High School | 127 | 22.6% |
| College / Undergraduate | 115 | 20.5% |
| Graduate / Professional | 27 | 4.8% |
| Total | 561 | 100.0% |
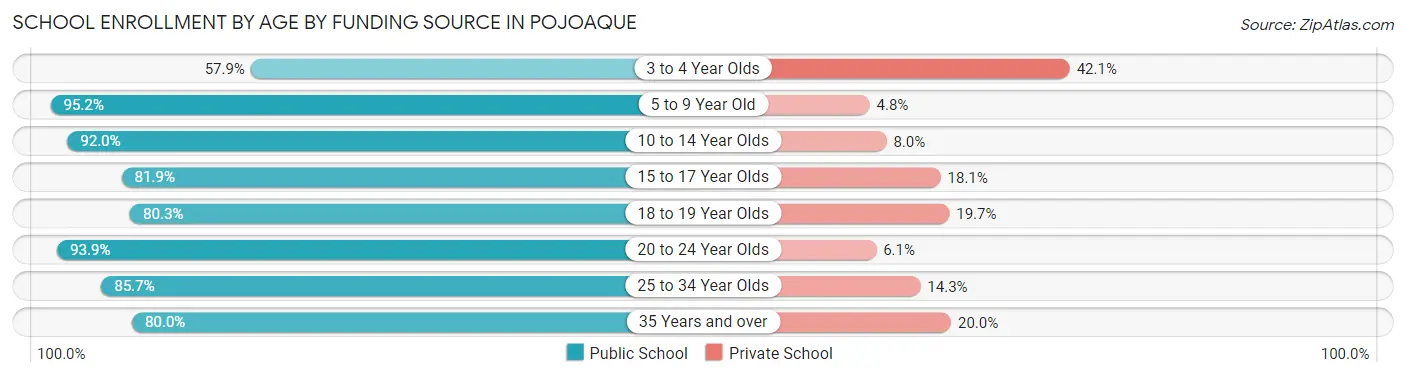
School Enrollment by Age by Funding Source in Pojoaque
Out of a total of 561 students who are enrolled in schools in Pojoaque, 65 (11.6%) attend a private institution, while the remaining 496 (88.4%) are enrolled in public schools. The age group of 3 to 4 year olds has the highest likelihood of being enrolled in private schools, with 8 (42.1% in the age bracket) enrolled. Conversely, the age group of 5 to 9 year old has the lowest likelihood of being enrolled in a private school, with 138 (95.2% in the age bracket) attending a public institution.
| Age Bracket | Public School | Private School |
| 3 to 4 Year Olds | 11 (57.9%) | 8 (42.1%) |
| 5 to 9 Year Old | 138 (95.2%) | 7 (4.8%) |
| 10 to 14 Year Olds | 127 (92.0%) | 11 (8.0%) |
| 15 to 17 Year Olds | 59 (81.9%) | 13 (18.1%) |
| 18 to 19 Year Olds | 49 (80.3%) | 12 (19.7%) |
| 20 to 24 Year Olds | 62 (93.9%) | 4 (6.1%) |
| 25 to 34 Year Olds | 30 (85.7%) | 5 (14.3%) |
| 35 Years and over | 20 (80.0%) | 5 (20.0%) |
| Total | 496 (88.4%) | 65 (11.6%) |
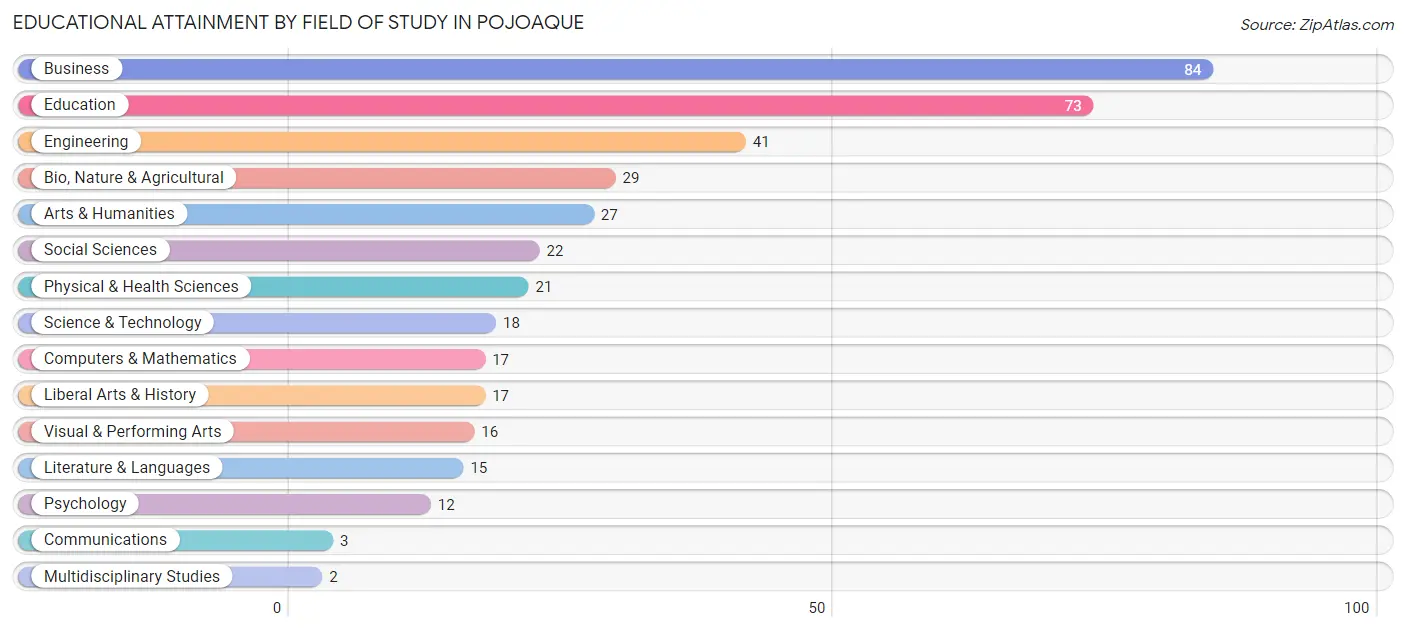
Educational Attainment by Field of Study in Pojoaque
Business (84 | 21.2%), education (73 | 18.4%), engineering (41 | 10.3%), bio, nature & agricultural (29 | 7.3%), and arts & humanities (27 | 6.8%) are the most common fields of study among 397 individuals in Pojoaque who have obtained a bachelor's degree or higher.
| Field of Study | # Graduates | % Graduates |
| Computers & Mathematics | 17 | 4.3% |
| Bio, Nature & Agricultural | 29 | 7.3% |
| Physical & Health Sciences | 21 | 5.3% |
| Psychology | 12 | 3.0% |
| Social Sciences | 22 | 5.5% |
| Engineering | 41 | 10.3% |
| Multidisciplinary Studies | 2 | 0.5% |
| Science & Technology | 18 | 4.5% |
| Business | 84 | 21.2% |
| Education | 73 | 18.4% |
| Literature & Languages | 15 | 3.8% |
| Liberal Arts & History | 17 | 4.3% |
| Visual & Performing Arts | 16 | 4.0% |
| Communications | 3 | 0.8% |
| Arts & Humanities | 27 | 6.8% |
| Total | 397 | 100.0% |
Transportation & Commute in Pojoaque
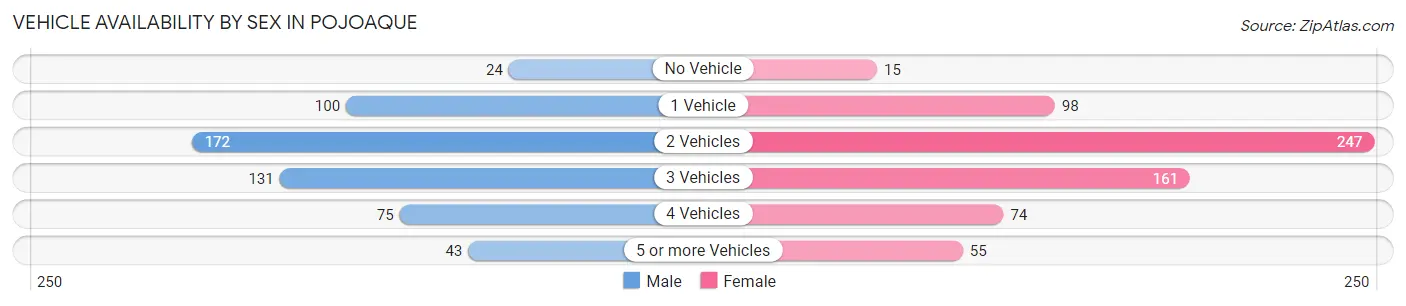
Vehicle Availability by Sex in Pojoaque
The most prevalent vehicle ownership categories in Pojoaque are males with 2 vehicles (172, accounting for 31.6%) and females with 2 vehicles (247, making up 26.5%).
| Vehicles Available | Male | Female |
| No Vehicle | 24 (4.4%) | 15 (2.3%) |
| 1 Vehicle | 100 (18.3%) | 98 (15.1%) |
| 2 Vehicles | 172 (31.6%) | 247 (38.0%) |
| 3 Vehicles | 131 (24.0%) | 161 (24.8%) |
| 4 Vehicles | 75 (13.8%) | 74 (11.4%) |
| 5 or more Vehicles | 43 (7.9%) | 55 (8.5%) |
| Total | 545 (100.0%) | 650 (100.0%) |
Commute Time in Pojoaque
The most frequently occuring commute durations in Pojoaque are 30 to 34 minutes (260 commuters, 23.5%), 5 to 9 minutes (235 commuters, 21.2%), and 20 to 24 minutes (169 commuters, 15.3%).
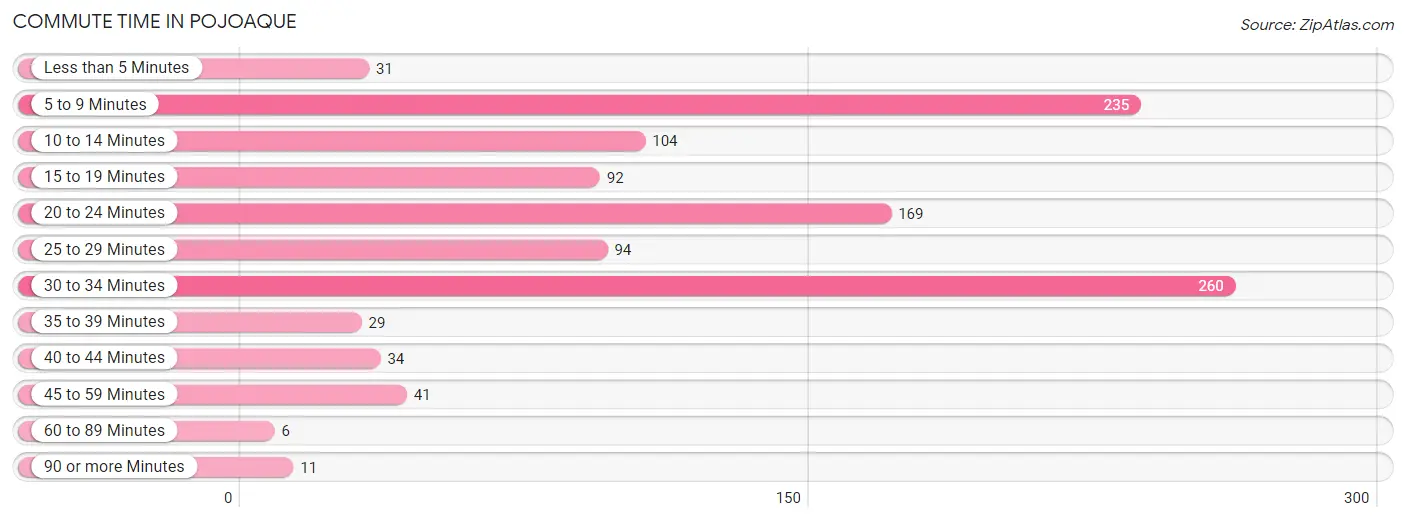
| Commute Time | # Commuters | % Commuters |
| Less than 5 Minutes | 31 | 2.8% |
| 5 to 9 Minutes | 235 | 21.2% |
| 10 to 14 Minutes | 104 | 9.4% |
| 15 to 19 Minutes | 92 | 8.3% |
| 20 to 24 Minutes | 169 | 15.3% |
| 25 to 29 Minutes | 94 | 8.5% |
| 30 to 34 Minutes | 260 | 23.5% |
| 35 to 39 Minutes | 29 | 2.6% |
| 40 to 44 Minutes | 34 | 3.1% |
| 45 to 59 Minutes | 41 | 3.7% |
| 60 to 89 Minutes | 6 | 0.5% |
| 90 or more Minutes | 11 | 1.0% |
Commute Time by Sex in Pojoaque
The most common commute times in Pojoaque are 30 to 34 minutes (125 commuters, 24.7%) for males and 5 to 9 minutes (165 commuters, 27.5%) for females.
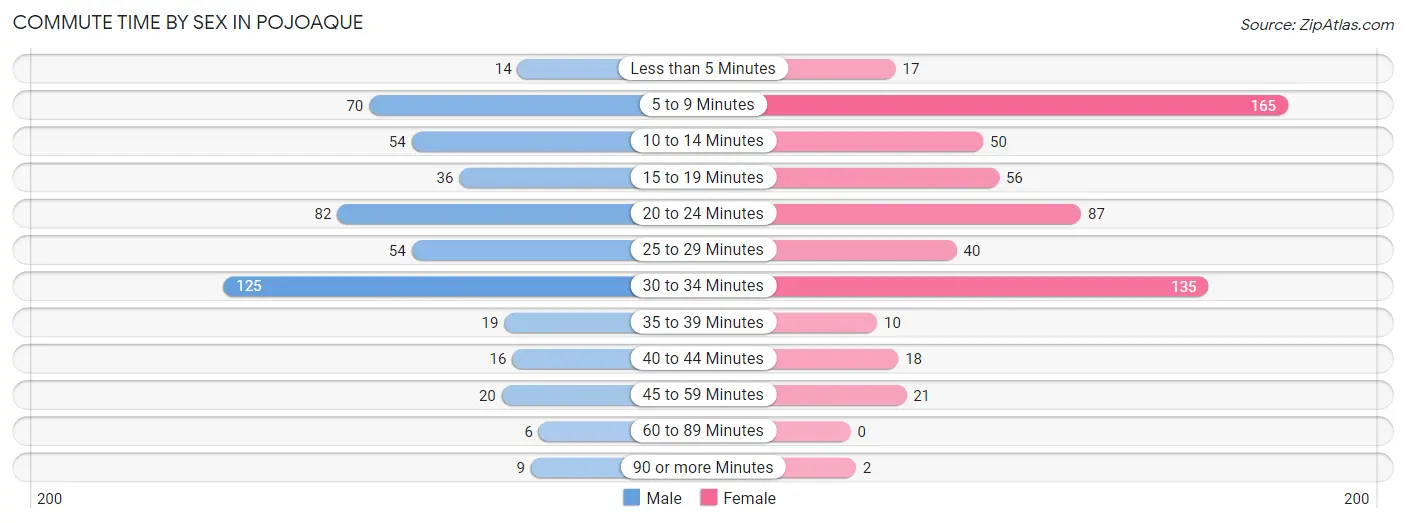
| Commute Time | Male | Female |
| Less than 5 Minutes | 14 (2.8%) | 17 (2.8%) |
| 5 to 9 Minutes | 70 (13.9%) | 165 (27.5%) |
| 10 to 14 Minutes | 54 (10.7%) | 50 (8.3%) |
| 15 to 19 Minutes | 36 (7.1%) | 56 (9.3%) |
| 20 to 24 Minutes | 82 (16.2%) | 87 (14.5%) |
| 25 to 29 Minutes | 54 (10.7%) | 40 (6.7%) |
| 30 to 34 Minutes | 125 (24.7%) | 135 (22.5%) |
| 35 to 39 Minutes | 19 (3.8%) | 10 (1.7%) |
| 40 to 44 Minutes | 16 (3.2%) | 18 (3.0%) |
| 45 to 59 Minutes | 20 (4.0%) | 21 (3.5%) |
| 60 to 89 Minutes | 6 (1.2%) | 0 (0.0%) |
| 90 or more Minutes | 9 (1.8%) | 2 (0.3%) |
Time of Departure to Work by Sex in Pojoaque
The most frequent times of departure to work in Pojoaque are 7:30 AM to 7:59 AM (85, 16.8%) for males and 7:30 AM to 7:59 AM (120, 20.0%) for females.
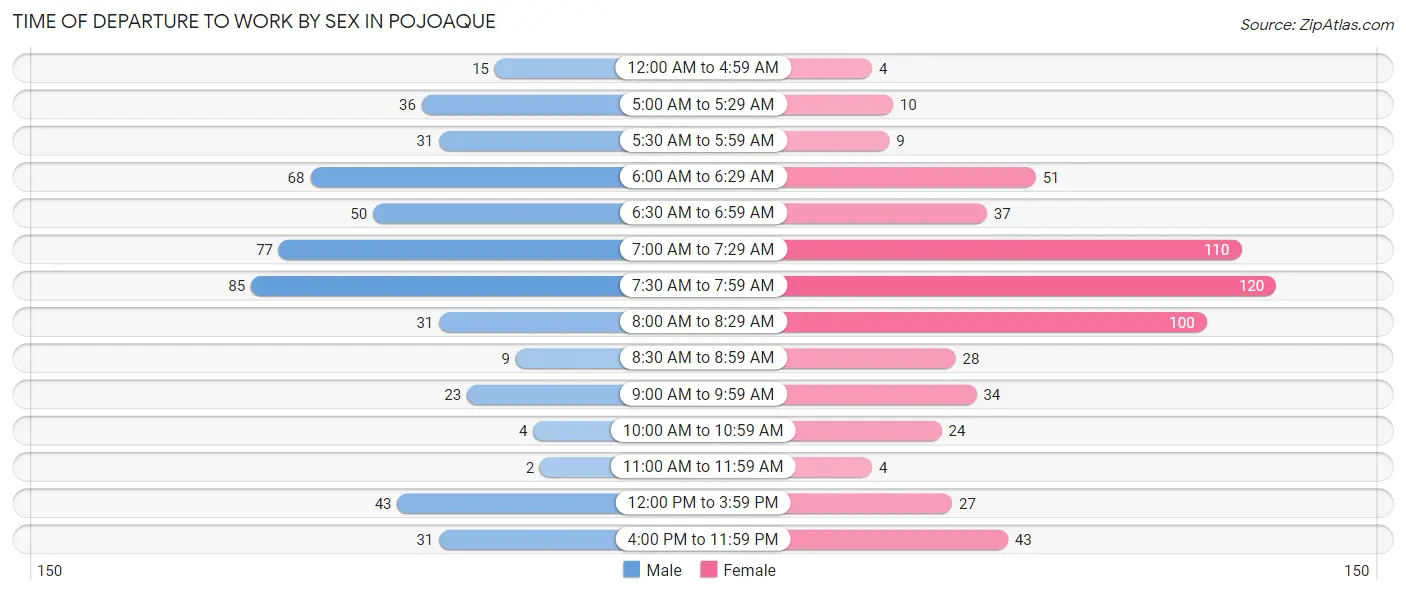
| Time of Departure | Male | Female |
| 12:00 AM to 4:59 AM | 15 (3.0%) | 4 (0.7%) |
| 5:00 AM to 5:29 AM | 36 (7.1%) | 10 (1.7%) |
| 5:30 AM to 5:59 AM | 31 (6.1%) | 9 (1.5%) |
| 6:00 AM to 6:29 AM | 68 (13.5%) | 51 (8.5%) |
| 6:30 AM to 6:59 AM | 50 (9.9%) | 37 (6.2%) |
| 7:00 AM to 7:29 AM | 77 (15.2%) | 110 (18.3%) |
| 7:30 AM to 7:59 AM | 85 (16.8%) | 120 (20.0%) |
| 8:00 AM to 8:29 AM | 31 (6.1%) | 100 (16.6%) |
| 8:30 AM to 8:59 AM | 9 (1.8%) | 28 (4.7%) |
| 9:00 AM to 9:59 AM | 23 (4.5%) | 34 (5.7%) |
| 10:00 AM to 10:59 AM | 4 (0.8%) | 24 (4.0%) |
| 11:00 AM to 11:59 AM | 2 (0.4%) | 4 (0.7%) |
| 12:00 PM to 3:59 PM | 43 (8.5%) | 27 (4.5%) |
| 4:00 PM to 11:59 PM | 31 (6.1%) | 43 (7.1%) |
| Total | 505 (100.0%) | 601 (100.0%) |
Housing Occupancy in Pojoaque
Occupancy by Ownership in Pojoaque
Of the total 968 dwellings in Pojoaque, owner-occupied units account for 663 (68.5%), while renter-occupied units make up 305 (31.5%).
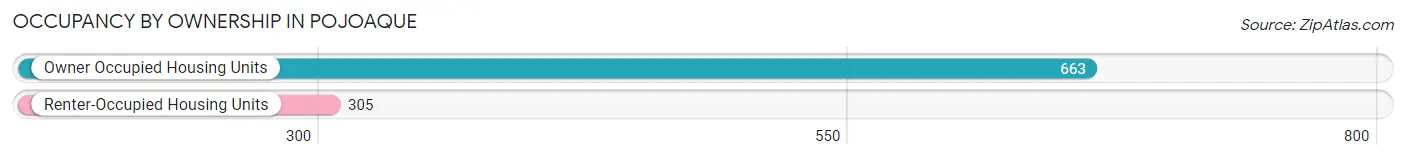
| Occupancy | # Housing Units | % Housing Units |
| Owner Occupied Housing Units | 663 | 68.5% |
| Renter-Occupied Housing Units | 305 | 31.5% |
| Total Occupied Housing Units | 968 | 100.0% |
Occupancy by Household Size in Pojoaque
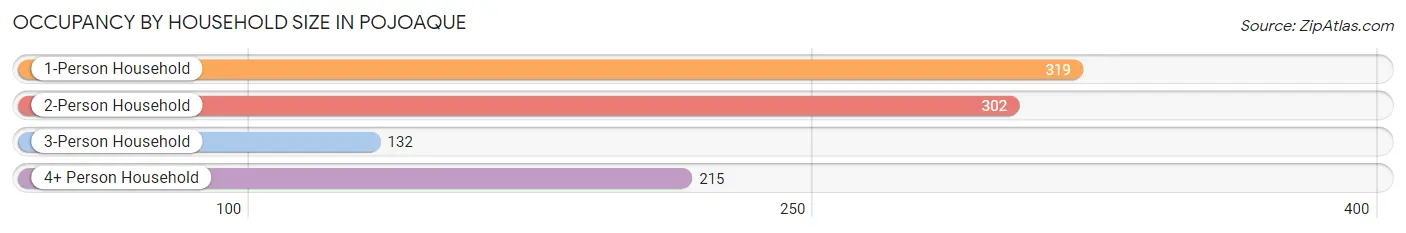
| Household Size | # Housing Units | % Housing Units |
| 1-Person Household | 319 | 33.0% |
| 2-Person Household | 302 | 31.2% |
| 3-Person Household | 132 | 13.6% |
| 4+ Person Household | 215 | 22.2% |
| Total Housing Units | 968 | 100.0% |
Occupancy by Ownership by Household Size in Pojoaque
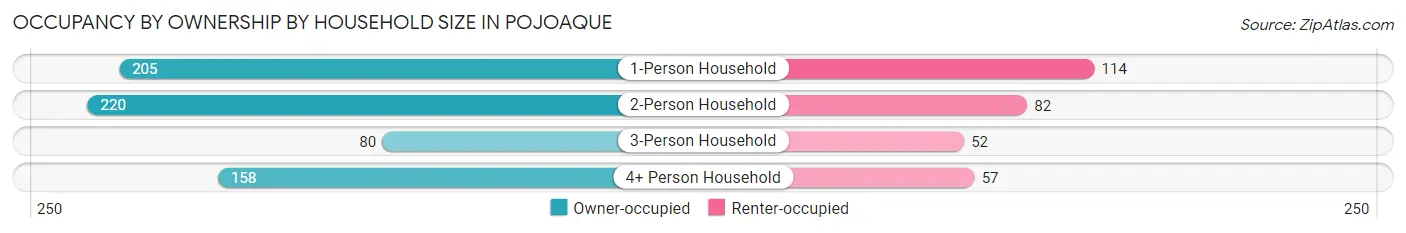
| Household Size | Owner-occupied | Renter-occupied |
| 1-Person Household | 205 (64.3%) | 114 (35.7%) |
| 2-Person Household | 220 (72.9%) | 82 (27.2%) |
| 3-Person Household | 80 (60.6%) | 52 (39.4%) |
| 4+ Person Household | 158 (73.5%) | 57 (26.5%) |
| Total Housing Units | 663 (68.5%) | 305 (31.5%) |
Occupancy by Educational Attainment in Pojoaque
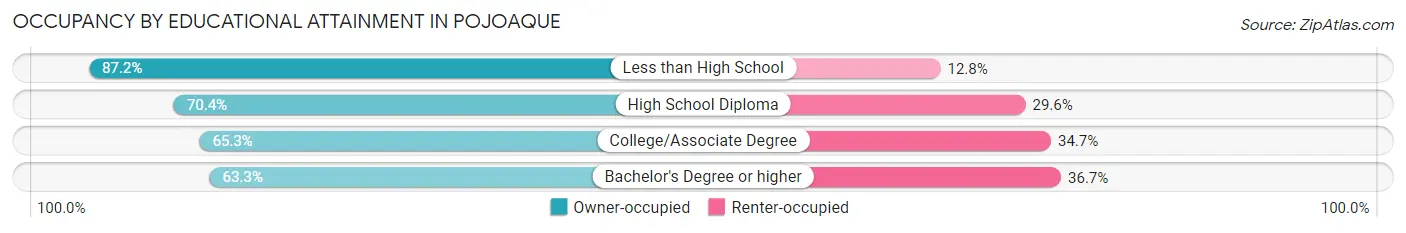
| Household Size | Owner-occupied | Renter-occupied |
| Less than High School | 82 (87.2%) | 12 (12.8%) |
| High School Diploma | 214 (70.4%) | 90 (29.6%) |
| College/Associate Degree | 196 (65.3%) | 104 (34.7%) |
| Bachelor's Degree or higher | 171 (63.3%) | 99 (36.7%) |
Occupancy by Age of Householder in Pojoaque
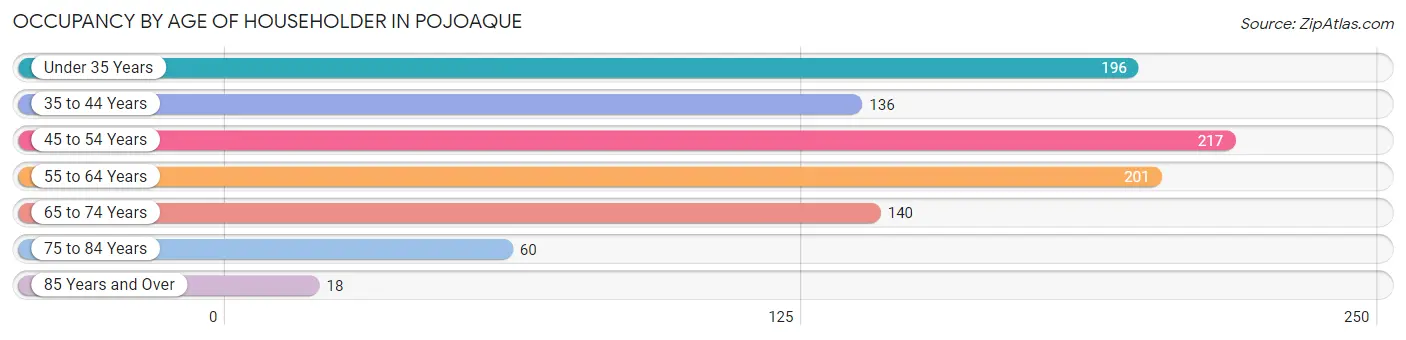
| Age Bracket | # Households | % Households |
| Under 35 Years | 196 | 20.3% |
| 35 to 44 Years | 136 | 14.1% |
| 45 to 54 Years | 217 | 22.4% |
| 55 to 64 Years | 201 | 20.8% |
| 65 to 74 Years | 140 | 14.5% |
| 75 to 84 Years | 60 | 6.2% |
| 85 Years and Over | 18 | 1.9% |
| Total | 968 | 100.0% |
Housing Finances in Pojoaque
Median Income by Occupancy in Pojoaque
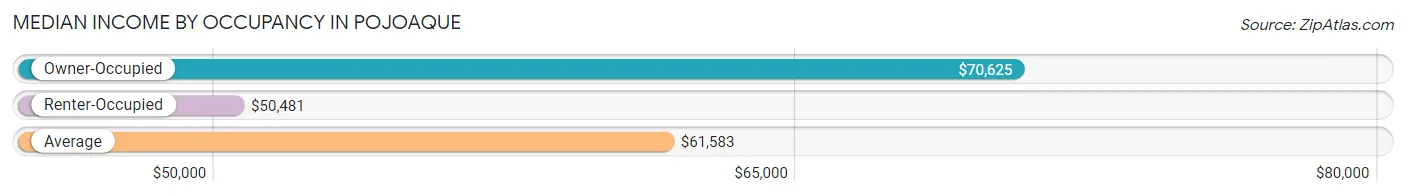
| Occupancy Type | # Households | Median Income |
| Owner-Occupied | 663 (68.5%) | $70,625 |
| Renter-Occupied | 305 (31.5%) | $50,481 |
| Average | 968 (100.0%) | $61,583 |
Occupancy by Householder Income Bracket in Pojoaque
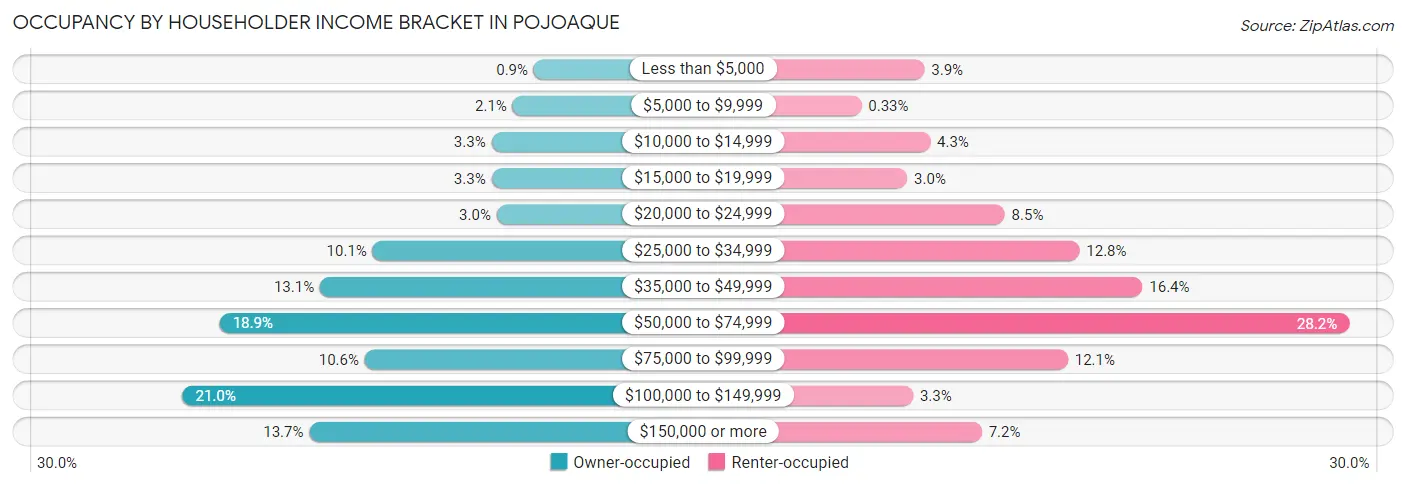
| Income Bracket | Owner-occupied | Renter-occupied |
| Less than $5,000 | 6 (0.9%) | 12 (3.9%) |
| $5,000 to $9,999 | 14 (2.1%) | 1 (0.3%) |
| $10,000 to $14,999 | 22 (3.3%) | 13 (4.3%) |
| $15,000 to $19,999 | 22 (3.3%) | 9 (2.9%) |
| $20,000 to $24,999 | 20 (3.0%) | 26 (8.5%) |
| $25,000 to $34,999 | 67 (10.1%) | 39 (12.8%) |
| $35,000 to $49,999 | 87 (13.1%) | 50 (16.4%) |
| $50,000 to $74,999 | 125 (18.9%) | 86 (28.2%) |
| $75,000 to $99,999 | 70 (10.6%) | 37 (12.1%) |
| $100,000 to $149,999 | 139 (21.0%) | 10 (3.3%) |
| $150,000 or more | 91 (13.7%) | 22 (7.2%) |
| Total | 663 (100.0%) | 305 (100.0%) |
Monthly Housing Cost Tiers in Pojoaque
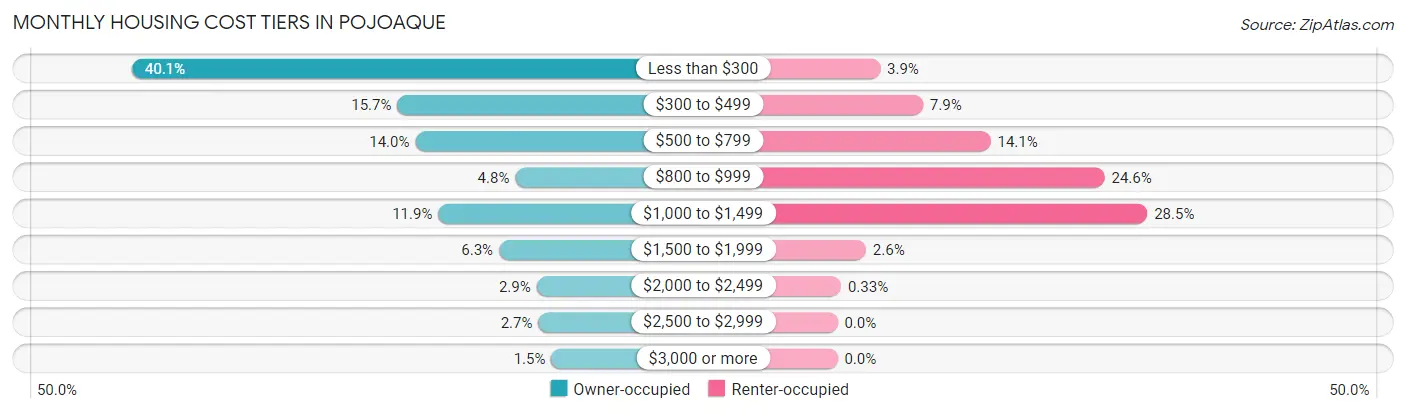
| Monthly Cost | Owner-occupied | Renter-occupied |
| Less than $300 | 266 (40.1%) | 12 (3.9%) |
| $300 to $499 | 104 (15.7%) | 24 (7.9%) |
| $500 to $799 | 93 (14.0%) | 43 (14.1%) |
| $800 to $999 | 32 (4.8%) | 75 (24.6%) |
| $1,000 to $1,499 | 79 (11.9%) | 87 (28.5%) |
| $1,500 to $1,999 | 42 (6.3%) | 8 (2.6%) |
| $2,000 to $2,499 | 19 (2.9%) | 1 (0.3%) |
| $2,500 to $2,999 | 18 (2.7%) | 0 (0.0%) |
| $3,000 or more | 10 (1.5%) | 0 (0.0%) |
| Total | 663 (100.0%) | 305 (100.0%) |
Physical Housing Characteristics in Pojoaque
Housing Structures in Pojoaque
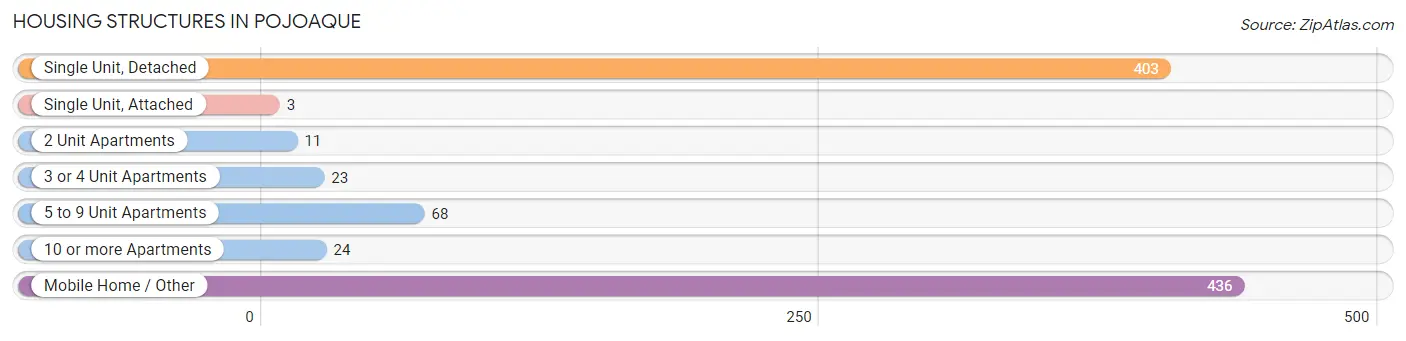
| Structure Type | # Housing Units | % Housing Units |
| Single Unit, Detached | 403 | 41.6% |
| Single Unit, Attached | 3 | 0.3% |
| 2 Unit Apartments | 11 | 1.1% |
| 3 or 4 Unit Apartments | 23 | 2.4% |
| 5 to 9 Unit Apartments | 68 | 7.0% |
| 10 or more Apartments | 24 | 2.5% |
| Mobile Home / Other | 436 | 45.0% |
| Total | 968 | 100.0% |
Housing Structures by Occupancy in Pojoaque
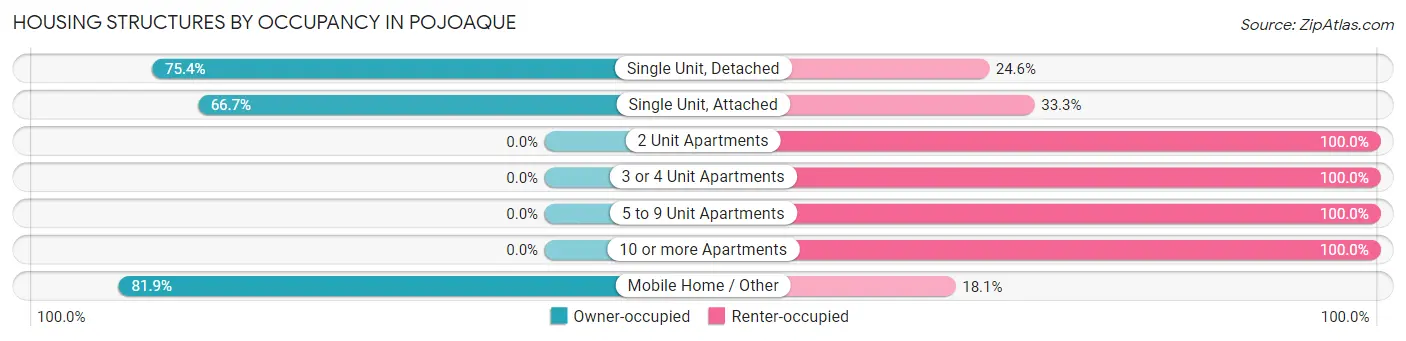
| Structure Type | Owner-occupied | Renter-occupied |
| Single Unit, Detached | 304 (75.4%) | 99 (24.6%) |
| Single Unit, Attached | 2 (66.7%) | 1 (33.3%) |
| 2 Unit Apartments | 0 (0.0%) | 11 (100.0%) |
| 3 or 4 Unit Apartments | 0 (0.0%) | 23 (100.0%) |
| 5 to 9 Unit Apartments | 0 (0.0%) | 68 (100.0%) |
| 10 or more Apartments | 0 (0.0%) | 24 (100.0%) |
| Mobile Home / Other | 357 (81.9%) | 79 (18.1%) |
| Total | 663 (68.5%) | 305 (31.5%) |
Housing Structures by Number of Rooms in Pojoaque
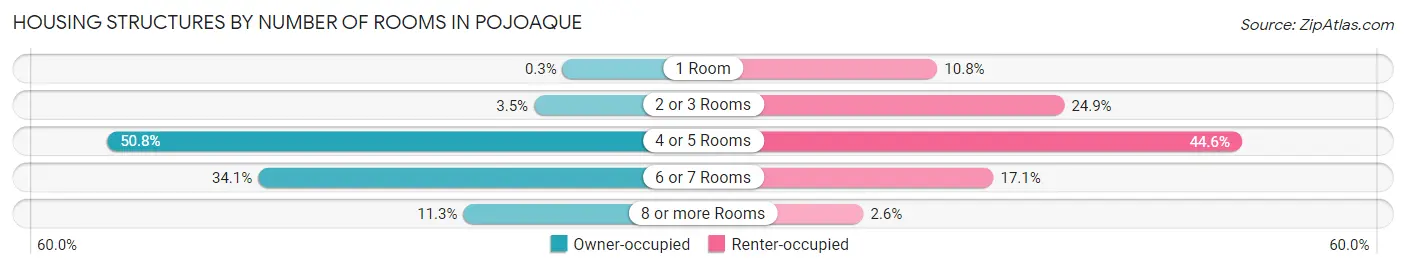
| Number of Rooms | Owner-occupied | Renter-occupied |
| 1 Room | 2 (0.3%) | 33 (10.8%) |
| 2 or 3 Rooms | 23 (3.5%) | 76 (24.9%) |
| 4 or 5 Rooms | 337 (50.8%) | 136 (44.6%) |
| 6 or 7 Rooms | 226 (34.1%) | 52 (17.1%) |
| 8 or more Rooms | 75 (11.3%) | 8 (2.6%) |
| Total | 663 (100.0%) | 305 (100.0%) |
Housing Structure by Heating Type in Pojoaque
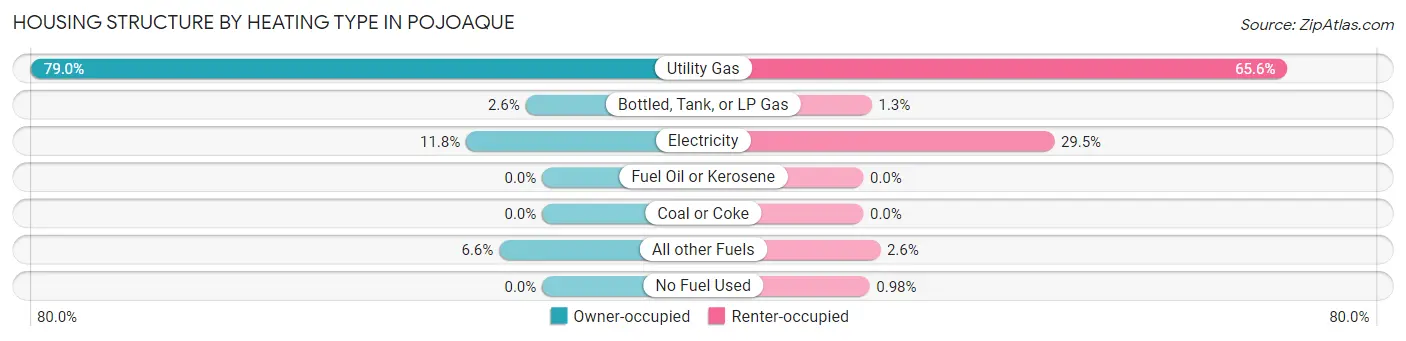
| Heating Type | Owner-occupied | Renter-occupied |
| Utility Gas | 524 (79.0%) | 200 (65.6%) |
| Bottled, Tank, or LP Gas | 17 (2.6%) | 4 (1.3%) |
| Electricity | 78 (11.8%) | 90 (29.5%) |
| Fuel Oil or Kerosene | 0 (0.0%) | 0 (0.0%) |
| Coal or Coke | 0 (0.0%) | 0 (0.0%) |
| All other Fuels | 44 (6.6%) | 8 (2.6%) |
| No Fuel Used | 0 (0.0%) | 3 (1.0%) |
| Total | 663 (100.0%) | 305 (100.0%) |
Household Vehicle Usage in Pojoaque
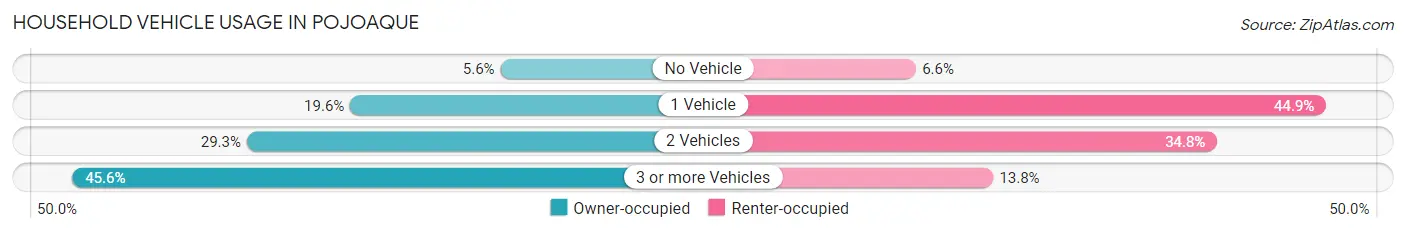
| Vehicles per Household | Owner-occupied | Renter-occupied |
| No Vehicle | 37 (5.6%) | 20 (6.6%) |
| 1 Vehicle | 130 (19.6%) | 137 (44.9%) |
| 2 Vehicles | 194 (29.3%) | 106 (34.7%) |
| 3 or more Vehicles | 302 (45.6%) | 42 (13.8%) |
| Total | 663 (100.0%) | 305 (100.0%) |
Real Estate & Mortgages in Pojoaque
Real Estate and Mortgage Overview in Pojoaque
| Characteristic | Without Mortgage | With Mortgage |
| Housing Units | 463 | 200 |
| Median Property Value | $32,600 | $275,000 |
| Median Household Income | $63,125 | $56 |
| Monthly Housing Costs | $268 | $10 |
| Real Estate Taxes | $971 | $45 |
Property Value by Mortgage Status in Pojoaque
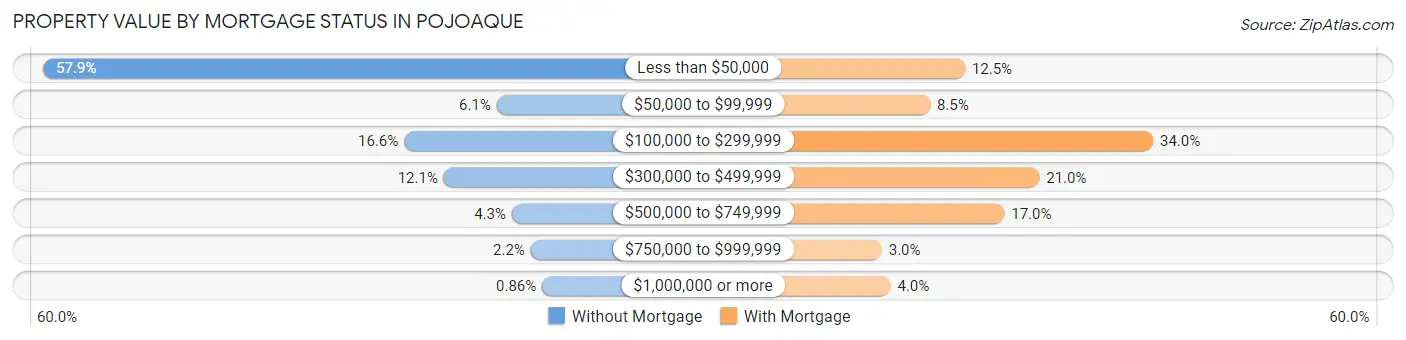
| Property Value | Without Mortgage | With Mortgage |
| Less than $50,000 | 268 (57.9%) | 25 (12.5%) |
| $50,000 to $99,999 | 28 (6.0%) | 17 (8.5%) |
| $100,000 to $299,999 | 77 (16.6%) | 68 (34.0%) |
| $300,000 to $499,999 | 56 (12.1%) | 42 (21.0%) |
| $500,000 to $749,999 | 20 (4.3%) | 34 (17.0%) |
| $750,000 to $999,999 | 10 (2.2%) | 6 (3.0%) |
| $1,000,000 or more | 4 (0.9%) | 8 (4.0%) |
| Total | 463 (100.0%) | 200 (100.0%) |
Household Income by Mortgage Status in Pojoaque
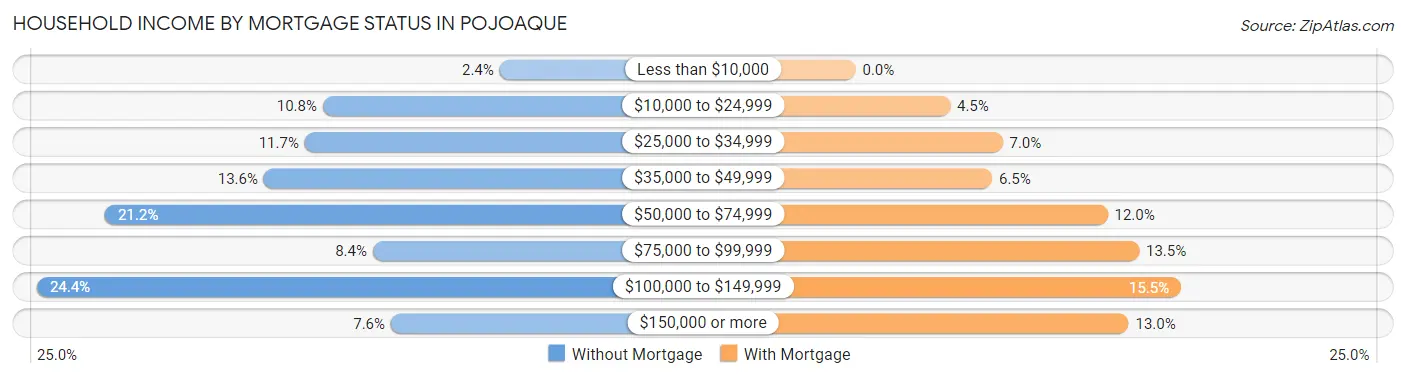
| Household Income | Without Mortgage | With Mortgage |
| Less than $10,000 | 11 (2.4%) | 0 (0.0%) |
| $10,000 to $24,999 | 50 (10.8%) | 9 (4.5%) |
| $25,000 to $34,999 | 54 (11.7%) | 14 (7.0%) |
| $35,000 to $49,999 | 63 (13.6%) | 13 (6.5%) |
| $50,000 to $74,999 | 98 (21.2%) | 24 (12.0%) |
| $75,000 to $99,999 | 39 (8.4%) | 27 (13.5%) |
| $100,000 to $149,999 | 113 (24.4%) | 31 (15.5%) |
| $150,000 or more | 35 (7.6%) | 26 (13.0%) |
| Total | 463 (100.0%) | 200 (100.0%) |
Property Value to Household Income Ratio in Pojoaque
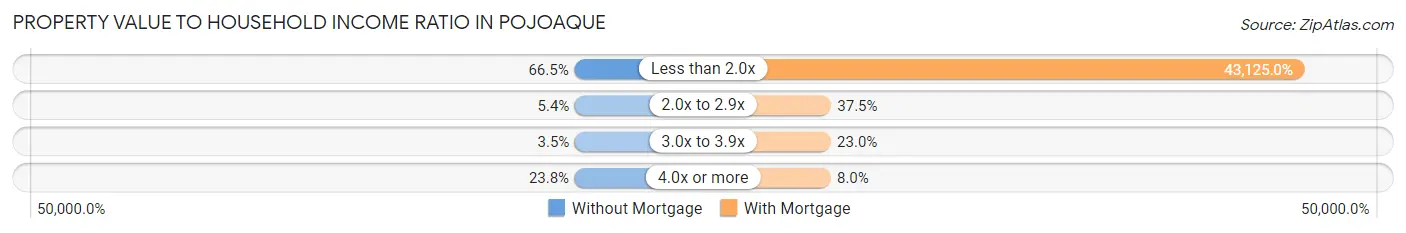
| Value-to-Income Ratio | Without Mortgage | With Mortgage |
| Less than 2.0x | 308 (66.5%) | 86,250 (43,125.0%) |
| 2.0x to 2.9x | 25 (5.4%) | 75 (37.5%) |
| 3.0x to 3.9x | 16 (3.5%) | 46 (23.0%) |
| 4.0x or more | 110 (23.8%) | 16 (8.0%) |
| Total | 463 (100.0%) | 200 (100.0%) |
Real Estate Taxes by Mortgage Status in Pojoaque
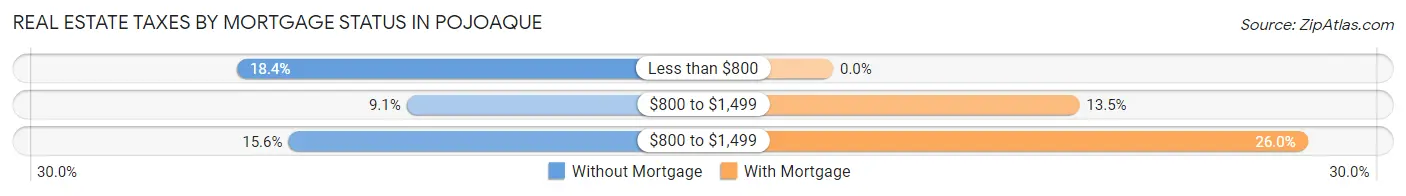
| Property Taxes | Without Mortgage | With Mortgage |
| Less than $800 | 85 (18.4%) | 0 (0.0%) |
| $800 to $1,499 | 42 (9.1%) | 27 (13.5%) |
| $800 to $1,499 | 72 (15.5%) | 52 (26.0%) |
| Total | 463 (100.0%) | 200 (100.0%) |
Health & Disability in Pojoaque
Health Insurance Coverage by Age in Pojoaque
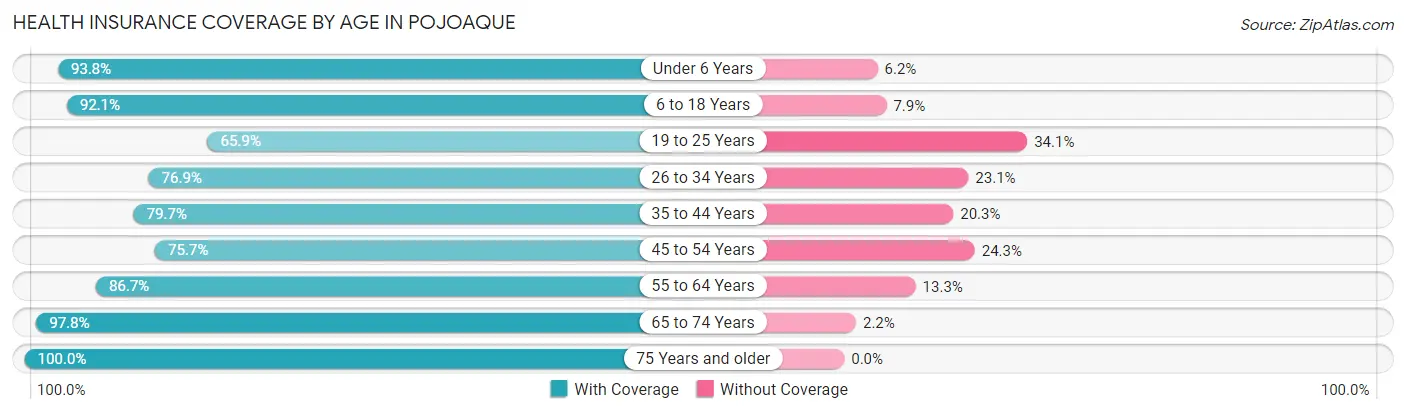
| Age Bracket | With Coverage | Without Coverage |
| Under 6 Years | 151 (93.8%) | 10 (6.2%) |
| 6 to 18 Years | 351 (92.1%) | 30 (7.9%) |
| 19 to 25 Years | 224 (65.9%) | 116 (34.1%) |
| 26 to 34 Years | 186 (76.9%) | 56 (23.1%) |
| 35 to 44 Years | 192 (79.7%) | 49 (20.3%) |
| 45 to 54 Years | 258 (75.7%) | 83 (24.3%) |
| 55 to 64 Years | 267 (86.7%) | 41 (13.3%) |
| 65 to 74 Years | 179 (97.8%) | 4 (2.2%) |
| 75 Years and older | 135 (100.0%) | 0 (0.0%) |
| Total | 1,943 (83.3%) | 389 (16.7%) |
Health Insurance Coverage by Citizenship Status in Pojoaque
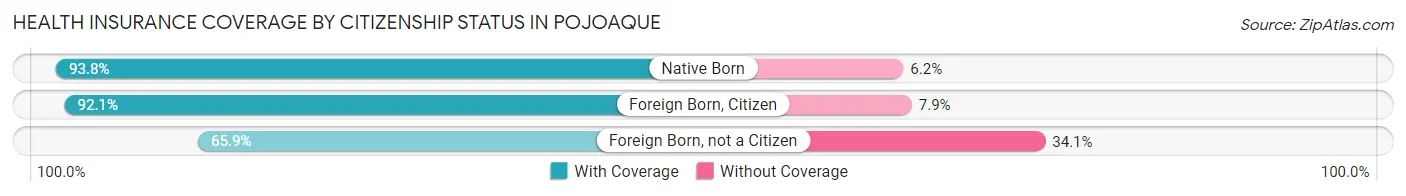
| Citizenship Status | With Coverage | Without Coverage |
| Native Born | 151 (93.8%) | 10 (6.2%) |
| Foreign Born, Citizen | 351 (92.1%) | 30 (7.9%) |
| Foreign Born, not a Citizen | 224 (65.9%) | 116 (34.1%) |
Health Insurance Coverage by Household Income in Pojoaque
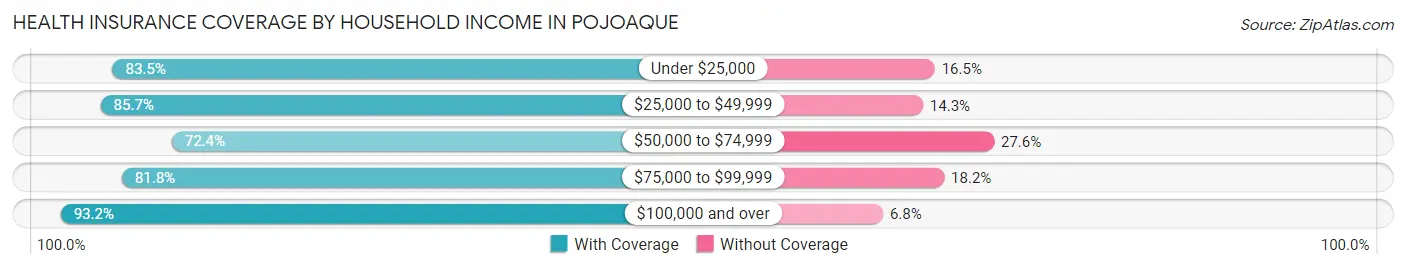
| Household Income | With Coverage | Without Coverage |
| Under $25,000 | 218 (83.5%) | 43 (16.5%) |
| $25,000 to $49,999 | 421 (85.7%) | 70 (14.3%) |
| $50,000 to $74,999 | 457 (72.4%) | 174 (27.6%) |
| $75,000 to $99,999 | 269 (81.8%) | 60 (18.2%) |
| $100,000 and over | 578 (93.2%) | 42 (6.8%) |
Public vs Private Health Insurance Coverage by Age in Pojoaque
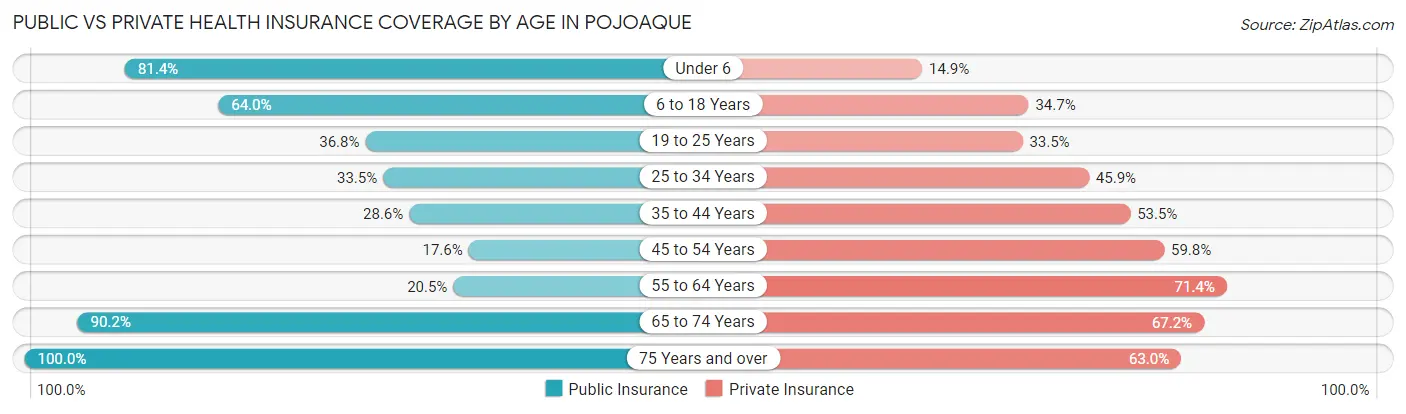
| Age Bracket | Public Insurance | Private Insurance |
| Under 6 | 131 (81.4%) | 24 (14.9%) |
| 6 to 18 Years | 244 (64.0%) | 132 (34.6%) |
| 19 to 25 Years | 125 (36.8%) | 114 (33.5%) |
| 25 to 34 Years | 81 (33.5%) | 111 (45.9%) |
| 35 to 44 Years | 69 (28.6%) | 129 (53.5%) |
| 45 to 54 Years | 60 (17.6%) | 204 (59.8%) |
| 55 to 64 Years | 63 (20.4%) | 220 (71.4%) |
| 65 to 74 Years | 165 (90.2%) | 123 (67.2%) |
| 75 Years and over | 135 (100.0%) | 85 (63.0%) |
| Total | 1,073 (46.0%) | 1,142 (49.0%) |
Disability Status by Sex by Age in Pojoaque
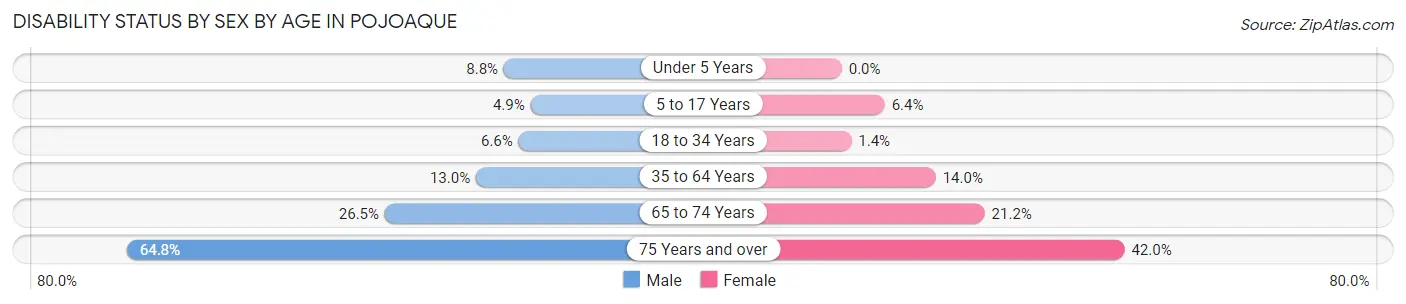
| Age Bracket | Male | Female |
| Under 5 Years | 6 (8.8%) | 0 (0.0%) |
| 5 to 17 Years | 11 (4.9%) | 9 (6.4%) |
| 18 to 34 Years | 18 (6.6%) | 5 (1.4%) |
| 35 to 64 Years | 55 (13.0%) | 65 (14.0%) |
| 65 to 74 Years | 31 (26.5%) | 14 (21.2%) |
| 75 Years and over | 35 (64.8%) | 34 (42.0%) |
Disability Class by Sex by Age in Pojoaque
Disability Class: Hearing Difficulty
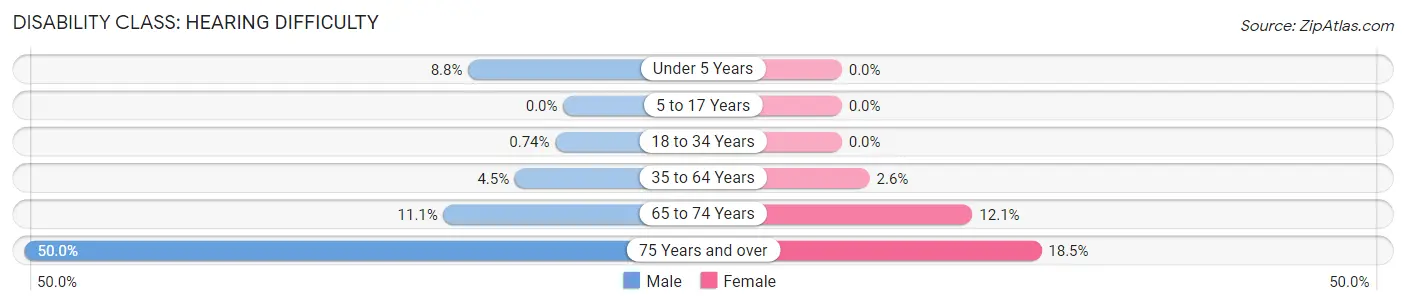
| Age Bracket | Male | Female |
| Under 5 Years | 6 (8.8%) | 0 (0.0%) |
| 5 to 17 Years | 0 (0.0%) | 0 (0.0%) |
| 18 to 34 Years | 2 (0.7%) | 0 (0.0%) |
| 35 to 64 Years | 19 (4.5%) | 12 (2.6%) |
| 65 to 74 Years | 13 (11.1%) | 8 (12.1%) |
| 75 Years and over | 27 (50.0%) | 15 (18.5%) |
Disability Class: Vision Difficulty
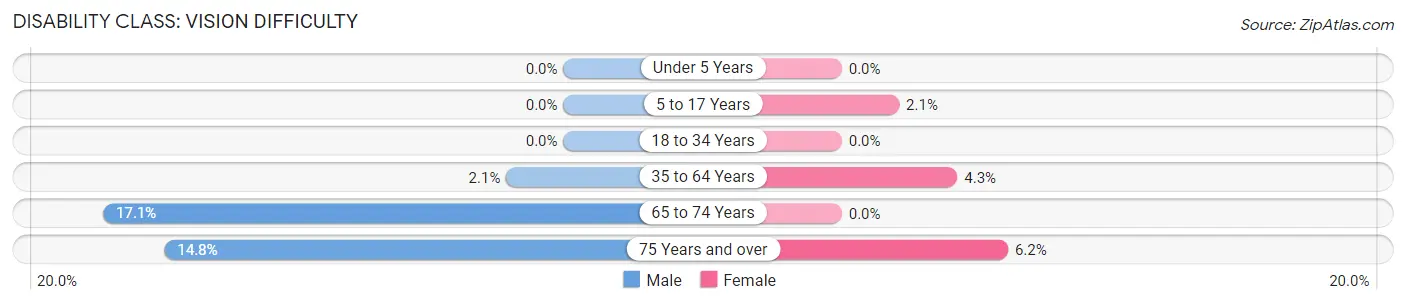
| Age Bracket | Male | Female |
| Under 5 Years | 0 (0.0%) | 0 (0.0%) |
| 5 to 17 Years | 0 (0.0%) | 3 (2.1%) |
| 18 to 34 Years | 0 (0.0%) | 0 (0.0%) |
| 35 to 64 Years | 9 (2.1%) | 20 (4.3%) |
| 65 to 74 Years | 20 (17.1%) | 0 (0.0%) |
| 75 Years and over | 8 (14.8%) | 5 (6.2%) |
Disability Class: Cognitive Difficulty
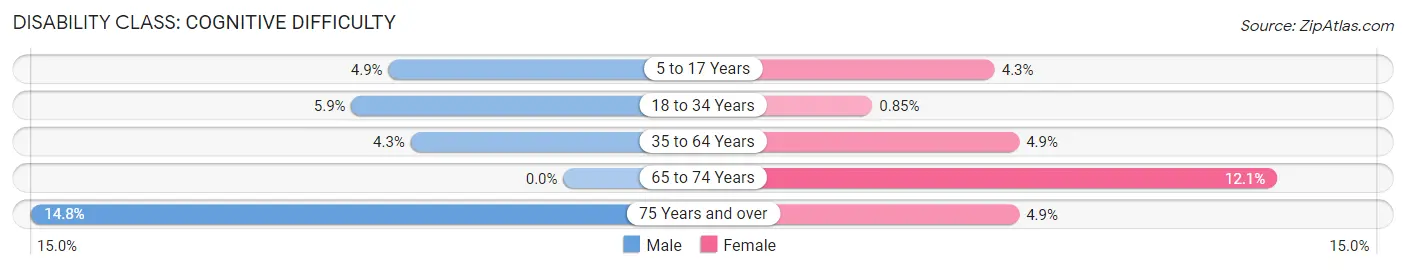
| Age Bracket | Male | Female |
| 5 to 17 Years | 11 (4.9%) | 6 (4.3%) |
| 18 to 34 Years | 16 (5.9%) | 3 (0.9%) |
| 35 to 64 Years | 18 (4.3%) | 23 (4.9%) |
| 65 to 74 Years | 0 (0.0%) | 8 (12.1%) |
| 75 Years and over | 8 (14.8%) | 4 (4.9%) |
Disability Class: Ambulatory Difficulty
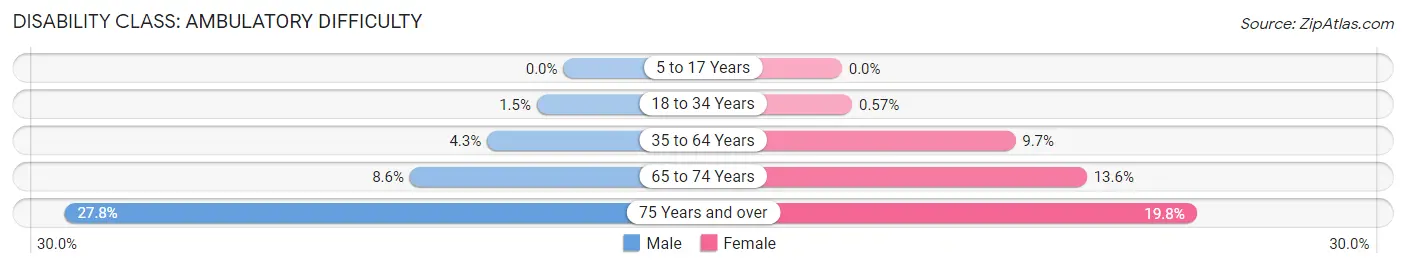
| Age Bracket | Male | Female |
| 5 to 17 Years | 0 (0.0%) | 0 (0.0%) |
| 18 to 34 Years | 4 (1.5%) | 2 (0.6%) |
| 35 to 64 Years | 18 (4.3%) | 45 (9.7%) |
| 65 to 74 Years | 10 (8.6%) | 9 (13.6%) |
| 75 Years and over | 15 (27.8%) | 16 (19.8%) |
Disability Class: Self-Care Difficulty
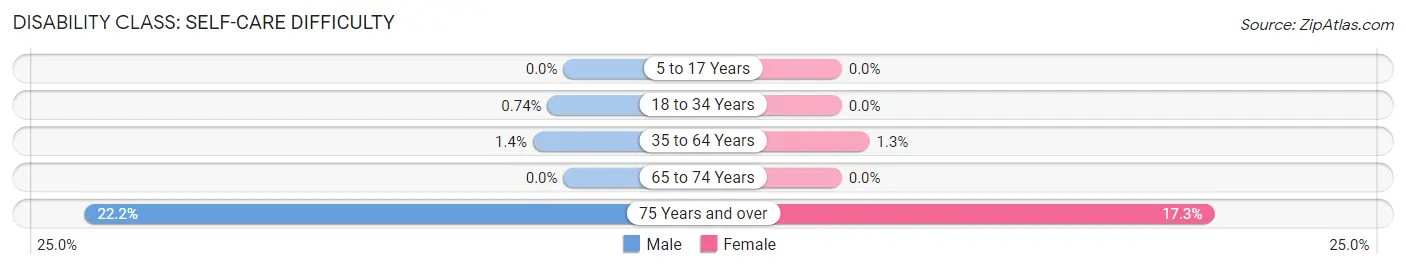
| Age Bracket | Male | Female |
| 5 to 17 Years | 0 (0.0%) | 0 (0.0%) |
| 18 to 34 Years | 2 (0.7%) | 0 (0.0%) |
| 35 to 64 Years | 6 (1.4%) | 6 (1.3%) |
| 65 to 74 Years | 0 (0.0%) | 0 (0.0%) |
| 75 Years and over | 12 (22.2%) | 14 (17.3%) |
Technology Access in Pojoaque
Computing Device Access in Pojoaque
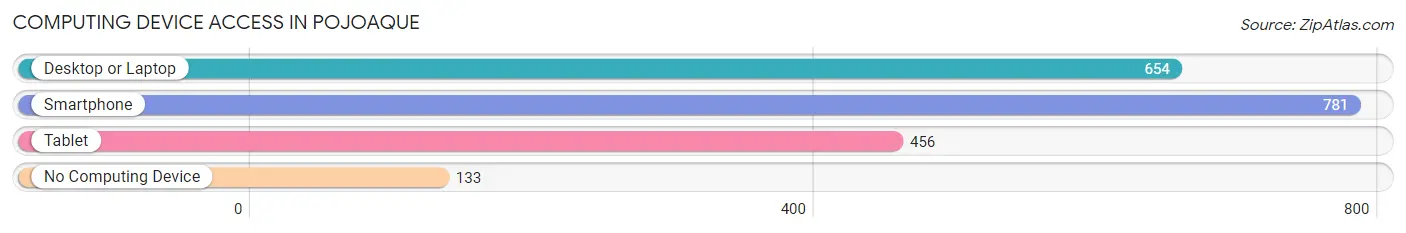
| Device Type | # Households | % Households |
| Desktop or Laptop | 654 | 67.6% |
| Smartphone | 781 | 80.7% |
| Tablet | 456 | 47.1% |
| No Computing Device | 133 | 13.7% |
| Total | 968 | 100.0% |
Internet Access in Pojoaque
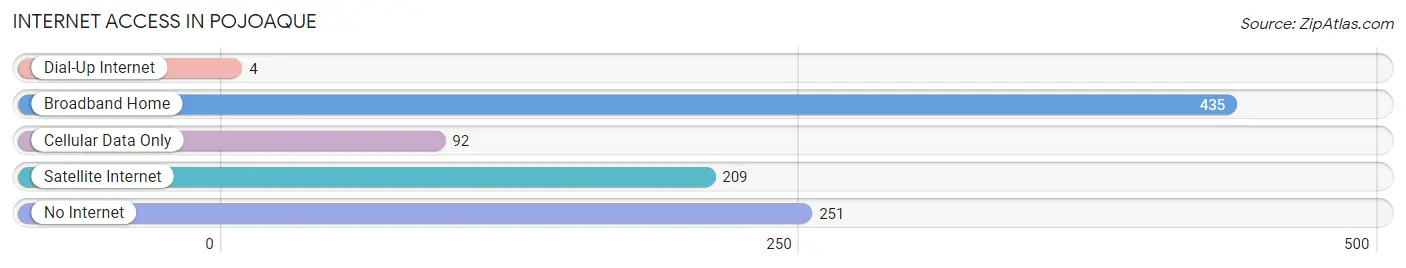
| Internet Type | # Households | % Households |
| Dial-Up Internet | 4 | 0.4% |
| Broadband Home | 435 | 44.9% |
| Cellular Data Only | 92 | 9.5% |
| Satellite Internet | 209 | 21.6% |
| No Internet | 251 | 25.9% |
| Total | 968 | 100.0% |
Pojoaque Summary
Pojoaque, New Mexico is a small town located in Santa Fe County, in the northern part of the state. It is situated at the base of the Sangre de Cristo Mountains, and is part of the Santa Fe metropolitan area. The town has a population of approximately 2,000 people, and is home to the Pojoaque Pueblo, a federally recognized Native American tribe.
History
The area that is now Pojoaque was originally inhabited by the Tewa people, a Native American tribe that has lived in the area for centuries. The Tewa were a semi-nomadic people who lived in small villages and hunted and gathered food from the surrounding area. In the late 16th century, Spanish explorers arrived in the area and established a mission in the area. The mission was abandoned in the early 19th century, and the Tewa people returned to the area.
In the late 19th century, the area was settled by Anglo-American settlers, who established a small farming community. The town was officially founded in 1881, and was named after the nearby Pojoaque Pueblo. The town grew slowly over the next few decades, and by the early 20th century, it had become a small but thriving community.
Geography
Pojoaque is located in northern New Mexico, in Santa Fe County. It is situated at the base of the Sangre de Cristo Mountains, and is part of the Santa Fe metropolitan area. The town is located at an elevation of 6,000 feet, and has a total area of 4.2 square miles. The climate is semi-arid, with hot summers and cold winters.
Economy
The economy of Pojoaque is largely based on tourism and agriculture. The town is home to the Pojoaque Pueblo, which operates a number of tourist attractions, including a casino, a golf course, and a cultural center. The town is also home to a number of small businesses, including restaurants, shops, and art galleries. Agriculture is also an important part of the local economy, with the surrounding area being used for cattle ranching and farming.
Demographics
As of the 2010 census, Pojoaque had a population of 2,037 people. The racial makeup of the town was 73.3% White, 0.7% African American, 1.2% Native American, 0.3% Asian, 0.1% Pacific Islander, and 22.4% from other races. The median household income was $30,938, and the median family income was $35,938. The per capita income was $17,938.
Conclusion
Pojoaque, New Mexico is a small town located in Santa Fe County, in the northern part of the state. It is home to the Pojoaque Pueblo, a federally recognized Native American tribe, and has a population of approximately 2,000 people. The economy of Pojoaque is largely based on tourism and agriculture, and the town is home to a number of small businesses, including restaurants, shops, and art galleries. The racial makeup of the town is 73.3% White, 0.7% African American, 1.2% Native American, 0.3% Asian, 0.1% Pacific Islander, and 22.4% from other races. The median household income was $30,938, and the median family income was $35,938.
Common Questions
What is Per Capita Income in Pojoaque?
Per Capita income in Pojoaque is $33,584.
What is the Median Family Income in Pojoaque?
Median Family Income in Pojoaque is $70,391.
What is the Median Household income in Pojoaque?
Median Household Income in Pojoaque is $61,583.
What is Income or Wage Gap in Pojoaque?
Income or Wage Gap in Pojoaque is 20.5%.
Women in Pojoaque earn 79.5 cents for every dollar earned by a man.
What is Family Income Deficit in Pojoaque?
Family Income Deficit in Pojoaque is $9,610.
Families that are below poverty line in Pojoaque earn $9,610 less on average than the poverty threshold level.
What is Inequality or Gini Index in Pojoaque?
Inequality or Gini Index in Pojoaque is 0.41.
What is the Total Population of Pojoaque?
Total Population of Pojoaque is 2,336.
What is the Total Male Population of Pojoaque?
Total Male Population of Pojoaque is 1,162.
What is the Total Female Population of Pojoaque?
Total Female Population of Pojoaque is 1,174.
What is the Ratio of Males per 100 Females in Pojoaque?
There are 98.98 Males per 100 Females in Pojoaque.
What is the Ratio of Females per 100 Males in Pojoaque?
There are 101.03 Females per 100 Males in Pojoaque.
What is the Median Population Age in Pojoaque?
Median Population Age in Pojoaque is 36.8 Years.
What is the Average Family Size in Pojoaque
Average Family Size in Pojoaque is 3.1 People.
What is the Average Household Size in Pojoaque
Average Household Size in Pojoaque is 2.4 People.
How Large is the Labor Force in Pojoaque?
There are 1,278 People in the Labor Forcein in Pojoaque.
What is the Percentage of People in the Labor Force in Pojoaque?
67.9% of People are in the Labor Force in Pojoaque.
What is the Unemployment Rate in Pojoaque?
Unemployment Rate in Pojoaque is 4.6%.