Carnuel, NM Map & Demographics
Carnuel Map
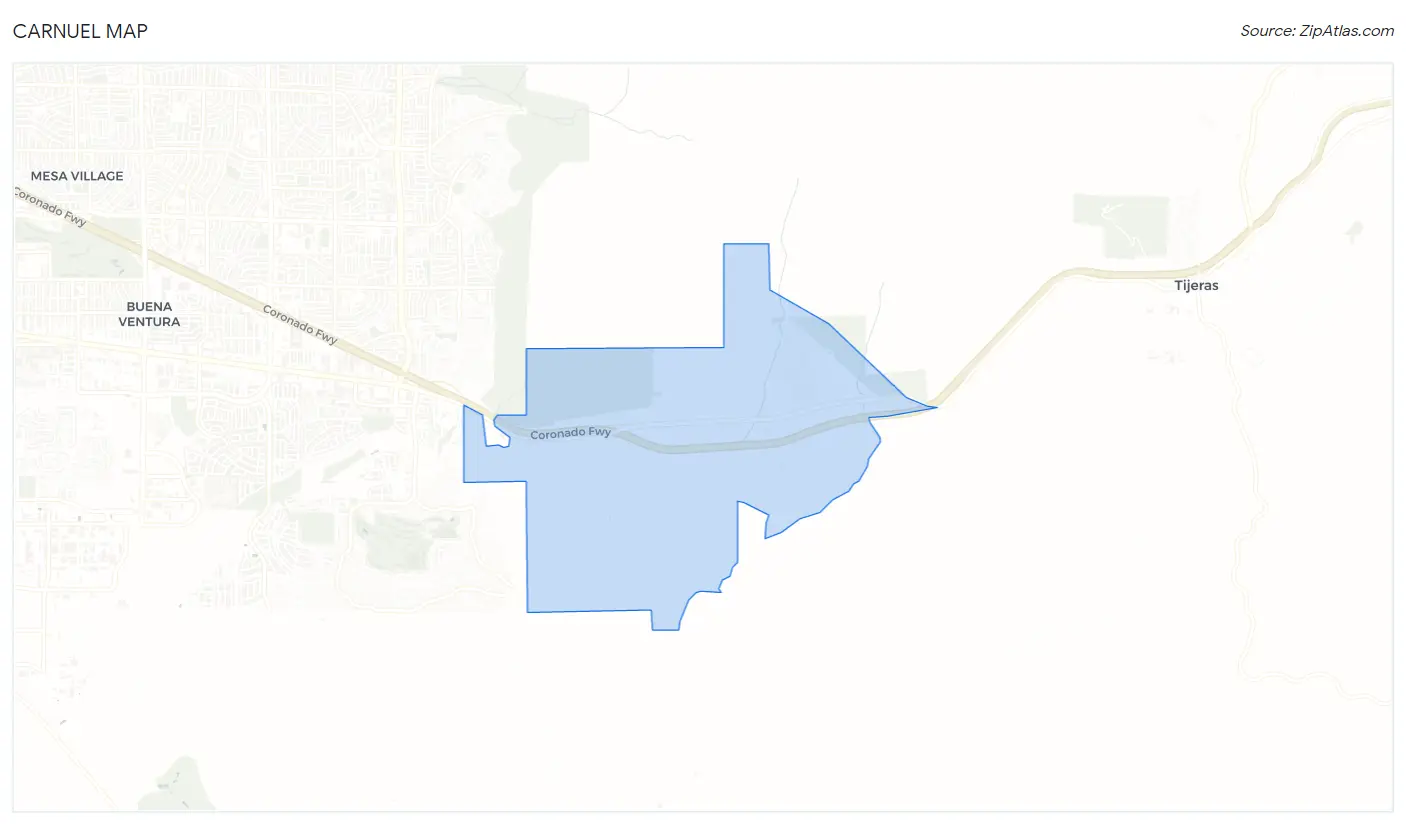
Carnuel Overview
$43,834
PER CAPITA INCOME
$94,875
AVG FAMILY INCOME
$86,681
AVG HOUSEHOLD INCOME
0.43
INEQUALITY / GINI INDEX
626
TOTAL POPULATION
332
MALE POPULATION
294
FEMALE POPULATION
112.93
MALES / 100 FEMALES
88.55
FEMALES / 100 MALES
63.3
MEDIAN AGE
2.4
AVG FAMILY SIZE
2.1
AVG HOUSEHOLD SIZE
229
LABOR FORCE [ PEOPLE ]
39.0%
PERCENT IN LABOR FORCE
Income in Carnuel
Income Overview in Carnuel
Per Capita Income in Carnuel is $43,834, while median incomes of families and households are $94,875 and $86,681 respectively.
| Characteristic | Number | Measure |
| Per Capita Income | 626 | $43,834 |
| Median Family Income | 223 | $94,875 |
| Mean Family Income | 223 | $109,339 |
| Median Household Income | 293 | $86,681 |
| Mean Household Income | 293 | $88,873 |
| Income Deficit | 223 | $0 |
| Wage / Income Gap (%) | 626 | 0.00% |
| Wage / Income Gap ($) | 626 | 100.00¢ per $1 |
| Gini / Inequality Index | 626 | 0.43 |
Earnings by Sex in Carnuel
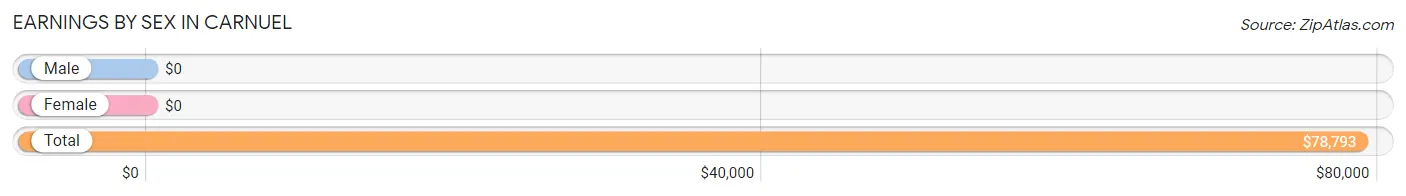
| Sex | Number | Average Earnings |
| Male | 121 (47.3%) | $0 |
| Female | 135 (52.7%) | $0 |
| Total | 256 (100.0%) | $78,793 |
Earnings by Sex by Income Bracket in Carnuel
The most common earnings brackets in Carnuel are $100,000+ for men (57 | 47.1%) and $100,000+ for women (41 | 30.4%).
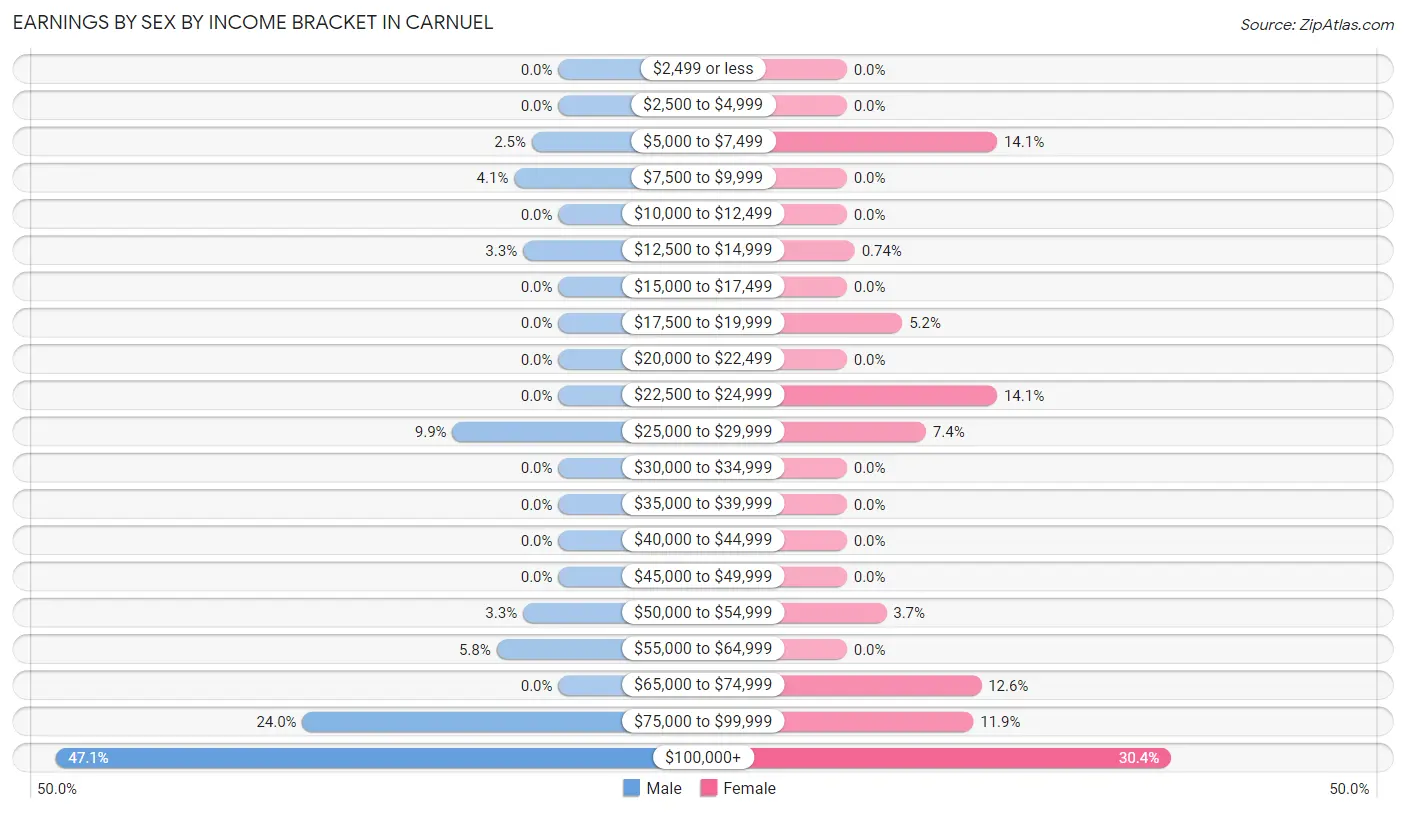
| Income | Male | Female |
| $2,499 or less | 0 (0.0%) | 0 (0.0%) |
| $2,500 to $4,999 | 0 (0.0%) | 0 (0.0%) |
| $5,000 to $7,499 | 3 (2.5%) | 19 (14.1%) |
| $7,500 to $9,999 | 5 (4.1%) | 0 (0.0%) |
| $10,000 to $12,499 | 0 (0.0%) | 0 (0.0%) |
| $12,500 to $14,999 | 4 (3.3%) | 1 (0.7%) |
| $15,000 to $17,499 | 0 (0.0%) | 0 (0.0%) |
| $17,500 to $19,999 | 0 (0.0%) | 7 (5.2%) |
| $20,000 to $22,499 | 0 (0.0%) | 0 (0.0%) |
| $22,500 to $24,999 | 0 (0.0%) | 19 (14.1%) |
| $25,000 to $29,999 | 12 (9.9%) | 10 (7.4%) |
| $30,000 to $34,999 | 0 (0.0%) | 0 (0.0%) |
| $35,000 to $39,999 | 0 (0.0%) | 0 (0.0%) |
| $40,000 to $44,999 | 0 (0.0%) | 0 (0.0%) |
| $45,000 to $49,999 | 0 (0.0%) | 0 (0.0%) |
| $50,000 to $54,999 | 4 (3.3%) | 5 (3.7%) |
| $55,000 to $64,999 | 7 (5.8%) | 0 (0.0%) |
| $65,000 to $74,999 | 0 (0.0%) | 17 (12.6%) |
| $75,000 to $99,999 | 29 (24.0%) | 16 (11.8%) |
| $100,000+ | 57 (47.1%) | 41 (30.4%) |
| Total | 121 (100.0%) | 135 (100.0%) |
Earnings by Sex by Educational Attainment in Carnuel
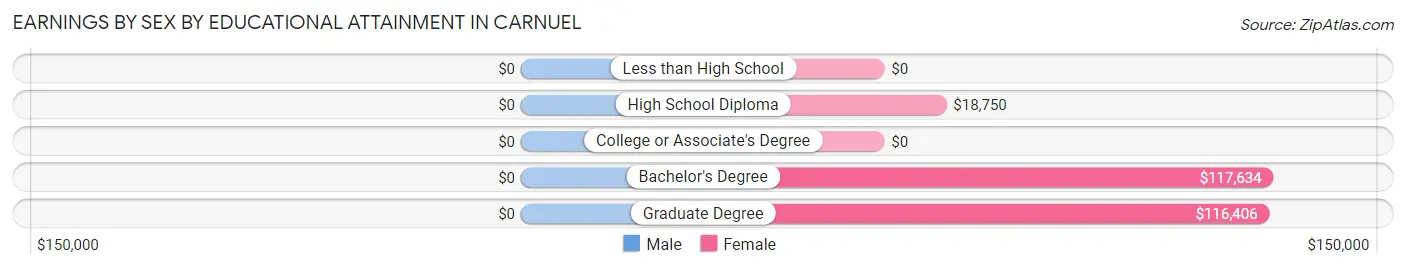
| Educational Attainment | Male Income | Female Income |
| Less than High School | - | - |
| High School Diploma | - | - |
| College or Associate's Degree | - | - |
| Bachelor's Degree | - | - |
| Graduate Degree | - | - |
| Total | - | - |
Family Income in Carnuel
Family Income Brackets in Carnuel
According to the Carnuel family income data, there are 47 families falling into the $100,000 to $149,999 income range, which is the most common income bracket and makes up 21.1% of all families.
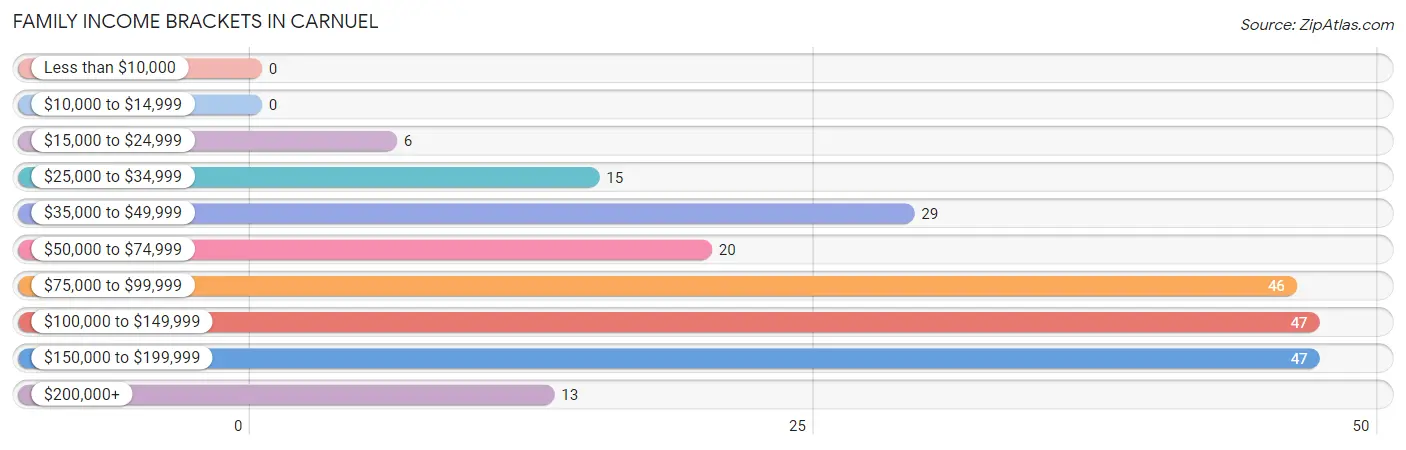
| Income Bracket | # Families | % Families |
| Less than $10,000 | 0 | 0.0% |
| $10,000 to $14,999 | 0 | 0.0% |
| $15,000 to $24,999 | 6 | 2.7% |
| $25,000 to $34,999 | 15 | 6.7% |
| $35,000 to $49,999 | 29 | 13.0% |
| $50,000 to $74,999 | 20 | 9.0% |
| $75,000 to $99,999 | 46 | 20.6% |
| $100,000 to $149,999 | 47 | 21.1% |
| $150,000 to $199,999 | 47 | 21.1% |
| $200,000+ | 13 | 5.8% |
Family Income by Famaliy Size in Carnuel
2-person families (180 | 80.7%) account for the highest median family income in Carnuel with $93,750 per family, while 2-person families (180 | 80.7%) have the highest median income of $46,875 per family member.
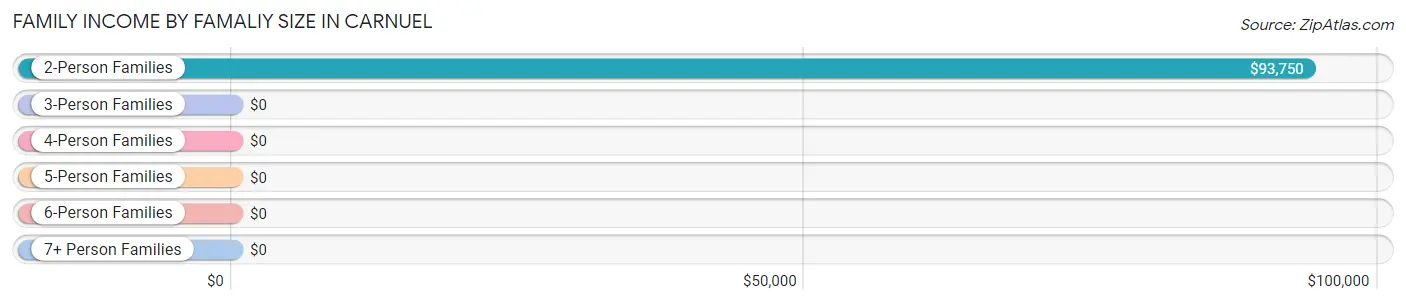
| Income Bracket | # Families | Median Income |
| 2-Person Families | 180 (80.7%) | $93,750 |
| 3-Person Families | 38 (17.0%) | $0 |
| 4-Person Families | 5 (2.2%) | $0 |
| 5-Person Families | 0 (0.0%) | $0 |
| 6-Person Families | 0 (0.0%) | $0 |
| 7+ Person Families | 0 (0.0%) | $0 |
| Total | 223 (100.0%) | $94,875 |
Family Income by Number of Earners in Carnuel
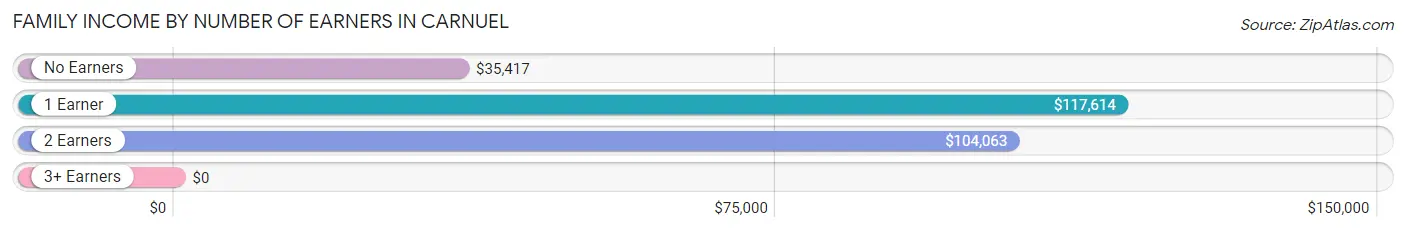
| Number of Earners | # Families | Median Income |
| No Earners | 47 (21.1%) | $35,417 |
| 1 Earner | 138 (61.9%) | $117,614 |
| 2 Earners | 33 (14.8%) | $104,063 |
| 3+ Earners | 5 (2.2%) | $0 |
| Total | 223 (100.0%) | $94,875 |
Household Income in Carnuel
Household Income Brackets in Carnuel
With 59 households falling in the category, the $75,000 to $99,999 income range is the most frequent in Carnuel, accounting for 20.1% of all households. In contrast, only 6 households (2.1%) fall into the $15,000 to $24,999 income bracket, making it the least populous group.
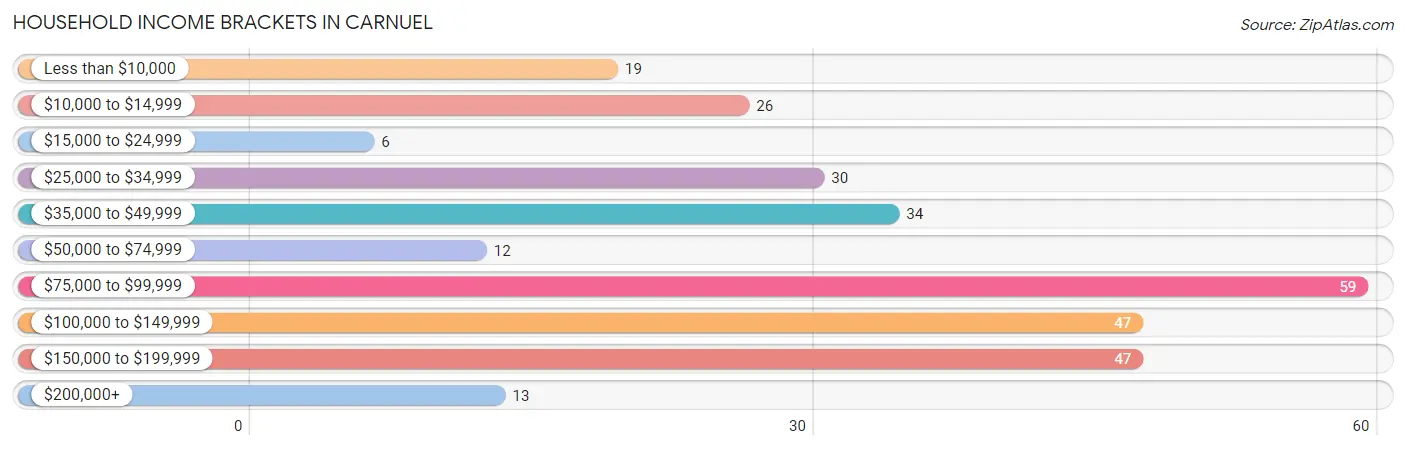
| Income Bracket | # Households | % Households |
| Less than $10,000 | 19 | 6.5% |
| $10,000 to $14,999 | 26 | 8.9% |
| $15,000 to $24,999 | 6 | 2.0% |
| $25,000 to $34,999 | 30 | 10.2% |
| $35,000 to $49,999 | 34 | 11.6% |
| $50,000 to $74,999 | 12 | 4.1% |
| $75,000 to $99,999 | 59 | 20.1% |
| $100,000 to $149,999 | 47 | 16.0% |
| $150,000 to $199,999 | 47 | 16.0% |
| $200,000+ | 13 | 4.4% |
Household Income by Householder Age in Carnuel
The median household income in Carnuel is $86,681, with the highest median household income of $190,833 found in the 25 to 44 years age bracket for the primary householder. A total of 70 households (23.9%) fall into this category.
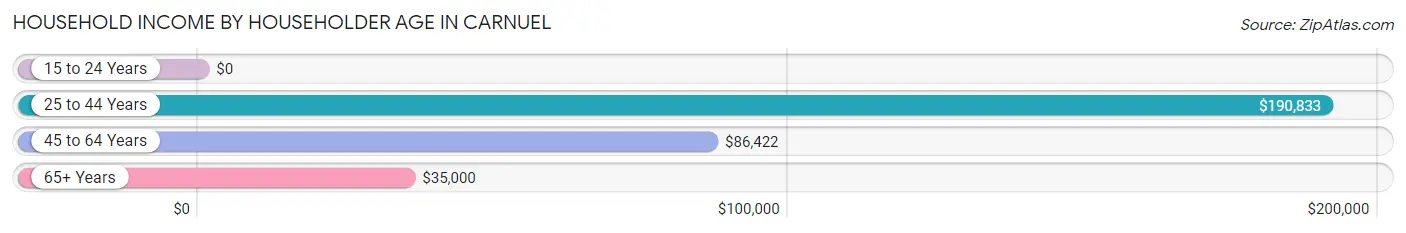
| Income Bracket | # Households | Median Income |
| 15 to 24 Years | 0 (0.0%) | $0 |
| 25 to 44 Years | 70 (23.9%) | $190,833 |
| 45 to 64 Years | 61 (20.8%) | $86,422 |
| 65+ Years | 162 (55.3%) | $35,000 |
| Total | 293 (100.0%) | $86,681 |
Poverty in Carnuel
Income Below Poverty by Sex and Age in Carnuel
With 7.8% poverty level for males and 11.2% for females among the residents of Carnuel, 65 to 74 year old males and 12 to 14 year old females are the most vulnerable to poverty, with 26 males (24.8%) and 8 females (100.0%) in their respective age groups living below the poverty level.
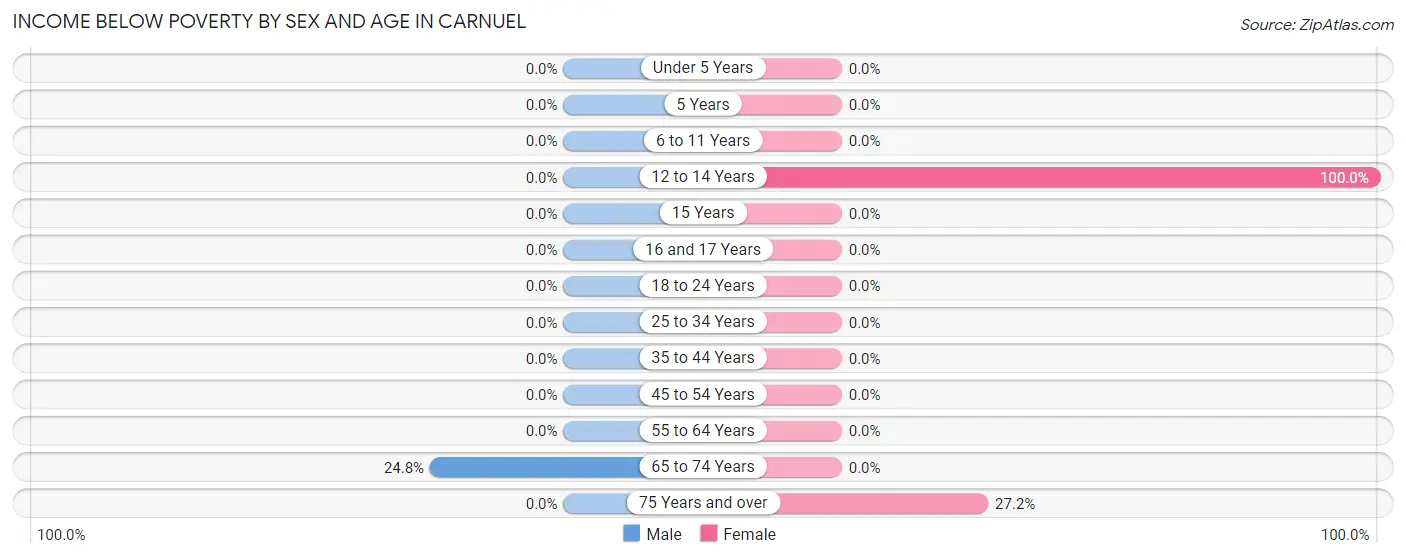
| Age Bracket | Male | Female |
| Under 5 Years | 0 (0.0%) | 0 (0.0%) |
| 5 Years | 0 (0.0%) | 0 (0.0%) |
| 6 to 11 Years | 0 (0.0%) | 0 (0.0%) |
| 12 to 14 Years | 0 (0.0%) | 8 (100.0%) |
| 15 Years | 0 (0.0%) | 0 (0.0%) |
| 16 and 17 Years | 0 (0.0%) | 0 (0.0%) |
| 18 to 24 Years | 0 (0.0%) | 0 (0.0%) |
| 25 to 34 Years | 0 (0.0%) | 0 (0.0%) |
| 35 to 44 Years | 0 (0.0%) | 0 (0.0%) |
| 45 to 54 Years | 0 (0.0%) | 0 (0.0%) |
| 55 to 64 Years | 0 (0.0%) | 0 (0.0%) |
| 65 to 74 Years | 26 (24.8%) | 0 (0.0%) |
| 75 Years and over | 0 (0.0%) | 25 (27.2%) |
| Total | 26 (7.8%) | 33 (11.2%) |
Income Above Poverty by Sex and Age in Carnuel
According to the poverty statistics in Carnuel, males aged 6 to 11 years and females aged 25 to 34 years are the age groups that are most secure financially, with 100.0% of males and 100.0% of females in these age groups living above the poverty line.
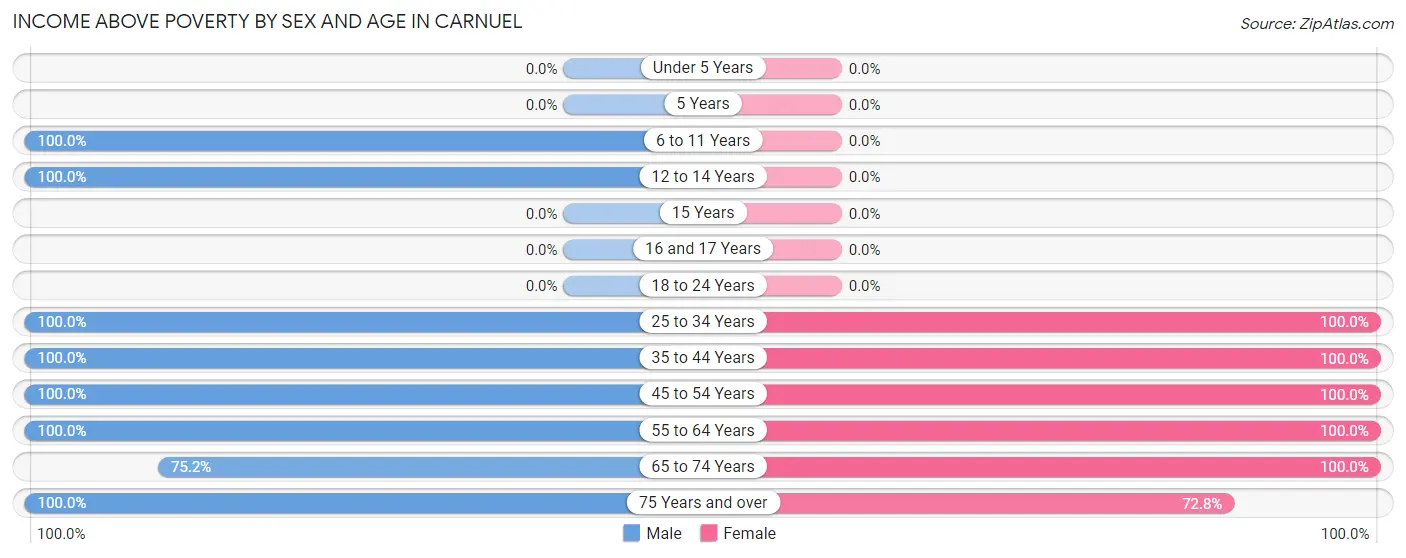
| Age Bracket | Male | Female |
| Under 5 Years | 0 (0.0%) | 0 (0.0%) |
| 5 Years | 0 (0.0%) | 0 (0.0%) |
| 6 to 11 Years | 14 (100.0%) | 0 (0.0%) |
| 12 to 14 Years | 17 (100.0%) | 0 (0.0%) |
| 15 Years | 0 (0.0%) | 0 (0.0%) |
| 16 and 17 Years | 0 (0.0%) | 0 (0.0%) |
| 18 to 24 Years | 0 (0.0%) | 0 (0.0%) |
| 25 to 34 Years | 57 (100.0%) | 21 (100.0%) |
| 35 to 44 Years | 11 (100.0%) | 15 (100.0%) |
| 45 to 54 Years | 22 (100.0%) | 40 (100.0%) |
| 55 to 64 Years | 95 (100.0%) | 64 (100.0%) |
| 65 to 74 Years | 79 (75.2%) | 54 (100.0%) |
| 75 Years and over | 11 (100.0%) | 67 (72.8%) |
| Total | 306 (92.2%) | 261 (88.8%) |
Income Below Poverty Among Married-Couple Families in Carnuel
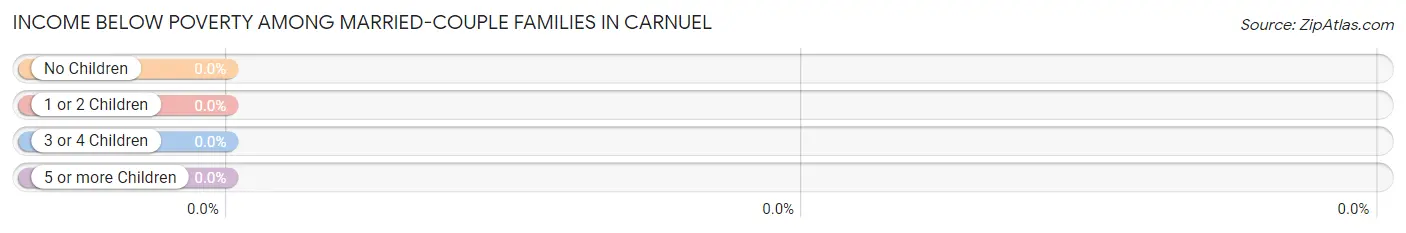
| Children | Above Poverty | Below Poverty |
| No Children | 126 (100.0%) | 0 (0.0%) |
| 1 or 2 Children | 14 (100.0%) | 0 (0.0%) |
| 3 or 4 Children | 0 (0.0%) | 0 (0.0%) |
| 5 or more Children | 0 (0.0%) | 0 (0.0%) |
| Total | 140 (100.0%) | 0 (0.0%) |
Income Below Poverty Among Single-Parent Households in Carnuel
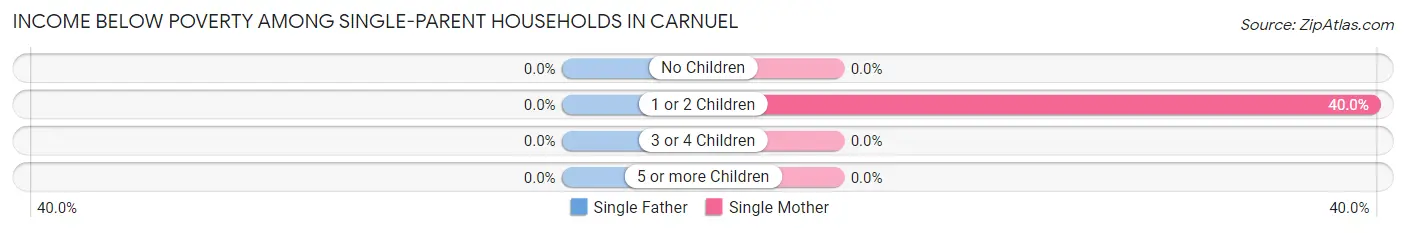
| Children | Single Father | Single Mother |
| No Children | 0 (0.0%) | 0 (0.0%) |
| 1 or 2 Children | 0 (0.0%) | 6 (40.0%) |
| 3 or 4 Children | 0 (0.0%) | 0 (0.0%) |
| 5 or more Children | 0 (0.0%) | 0 (0.0%) |
| Total | 0 (0.0%) | 6 (16.2%) |
Income Below Poverty Among Married-Couple vs Single-Parent Households in Carnuel
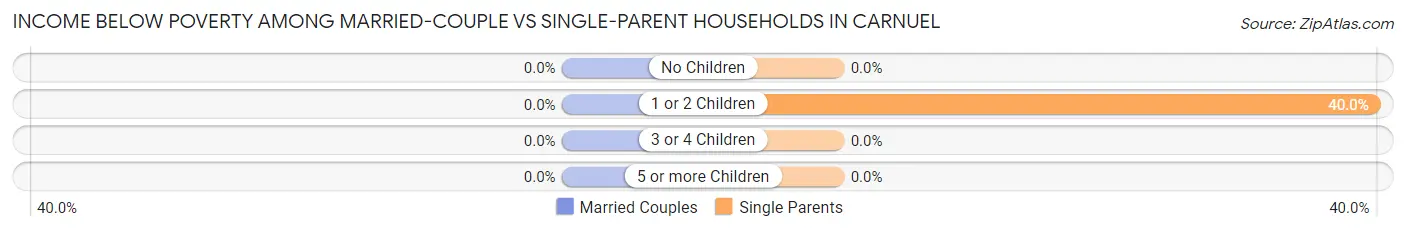
| Children | Married-Couple Families | Single-Parent Households |
| No Children | 0 (0.0%) | 0 (0.0%) |
| 1 or 2 Children | 0 (0.0%) | 6 (40.0%) |
| 3 or 4 Children | 0 (0.0%) | 0 (0.0%) |
| 5 or more Children | 0 (0.0%) | 0 (0.0%) |
| Total | 0 (0.0%) | 6 (7.2%) |
Race in Carnuel
The most populous races in Carnuel are White / Caucasian (445 | 71.1%), Hispanic or Latino (342 | 54.6%), and Two or more Races (132 | 21.1%).
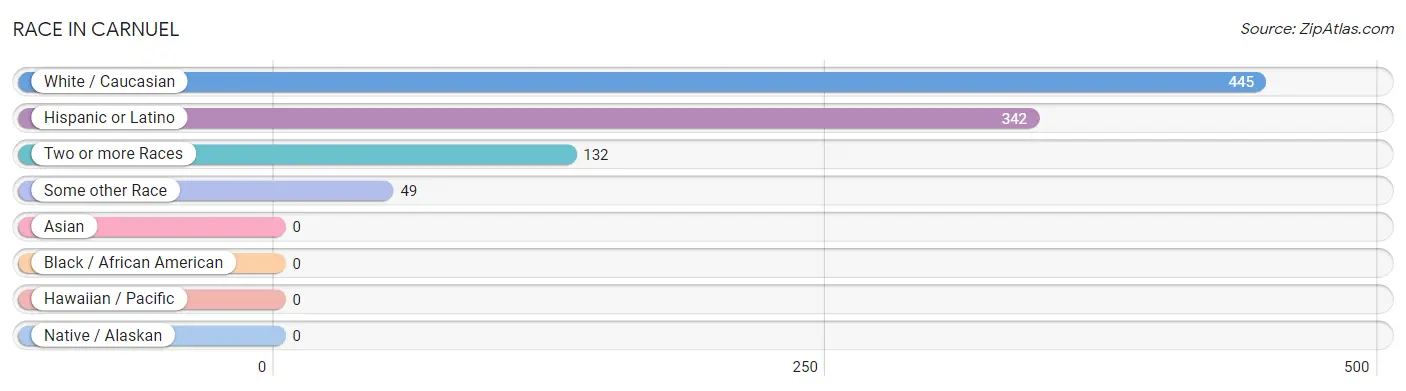
| Race | # Population | % Population |
| Asian | 0 | 0.0% |
| Black / African American | 0 | 0.0% |
| Hawaiian / Pacific | 0 | 0.0% |
| Hispanic or Latino | 342 | 54.6% |
| Native / Alaskan | 0 | 0.0% |
| White / Caucasian | 445 | 71.1% |
| Two or more Races | 132 | 21.1% |
| Some other Race | 49 | 7.8% |
| Total | 626 | 100.0% |
Ancestry in Carnuel
The most populous ancestries reported in Carnuel are Irish (119 | 19.0%), Mexican (95 | 15.2%), German (77 | 12.3%), Spaniard (65 | 10.4%), and English (46 | 7.3%), together accounting for 64.2% of all Carnuel residents.
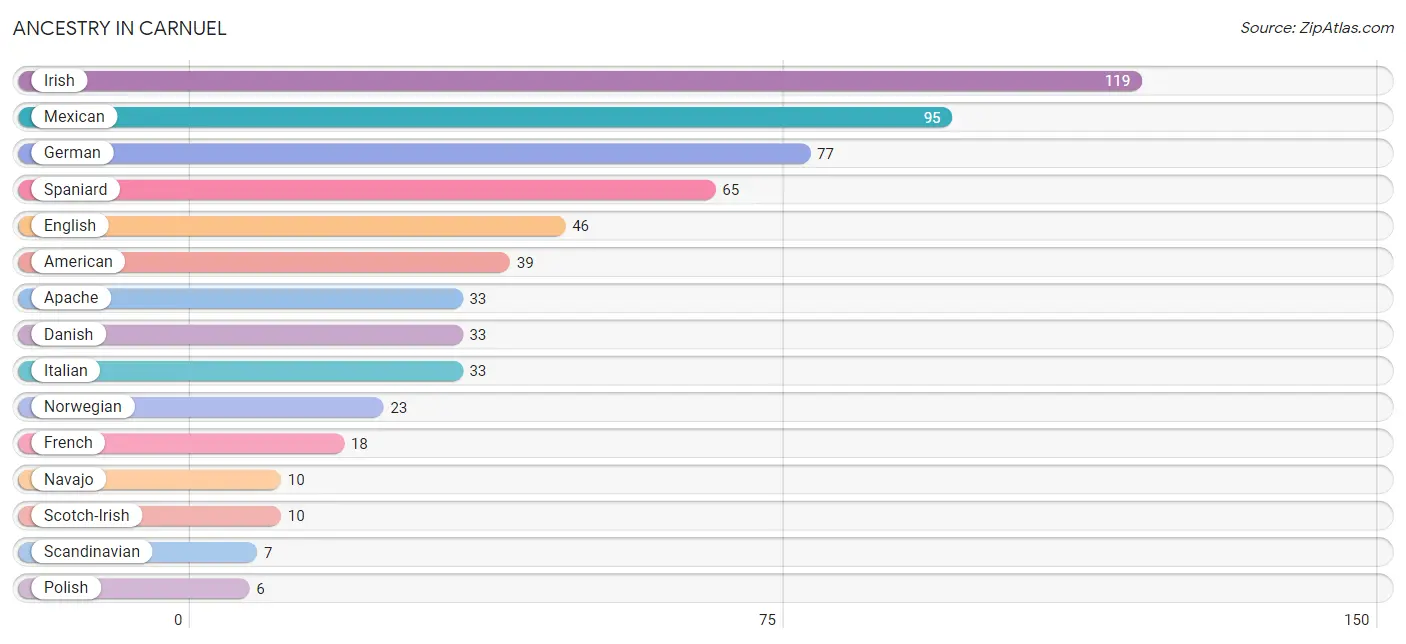
| Ancestry | # Population | % Population |
| American | 39 | 6.2% |
| Apache | 33 | 5.3% |
| Cherokee | 1 | 0.2% |
| Choctaw | 2 | 0.3% |
| Danish | 33 | 5.3% |
| Dutch | 3 | 0.5% |
| English | 46 | 7.3% |
| French | 18 | 2.9% |
| German | 77 | 12.3% |
| Irish | 119 | 19.0% |
| Italian | 33 | 5.3% |
| Mexican | 95 | 15.2% |
| Navajo | 10 | 1.6% |
| Norwegian | 23 | 3.7% |
| Polish | 6 | 1.0% |
| Scandinavian | 7 | 1.1% |
| Scotch-Irish | 10 | 1.6% |
| Spaniard | 65 | 10.4% |
| Spanish | 6 | 1.0% | View All 19 Rows |
Immigrants in Carnuel

| Immigration Origin | # Population | % Population | View All 0 Rows |
Sex and Age in Carnuel
Sex and Age in Carnuel
The most populous age groups in Carnuel are 60 to 64 Years (79 | 23.8%) for men and 85 Years and over (64 | 21.8%) for women.
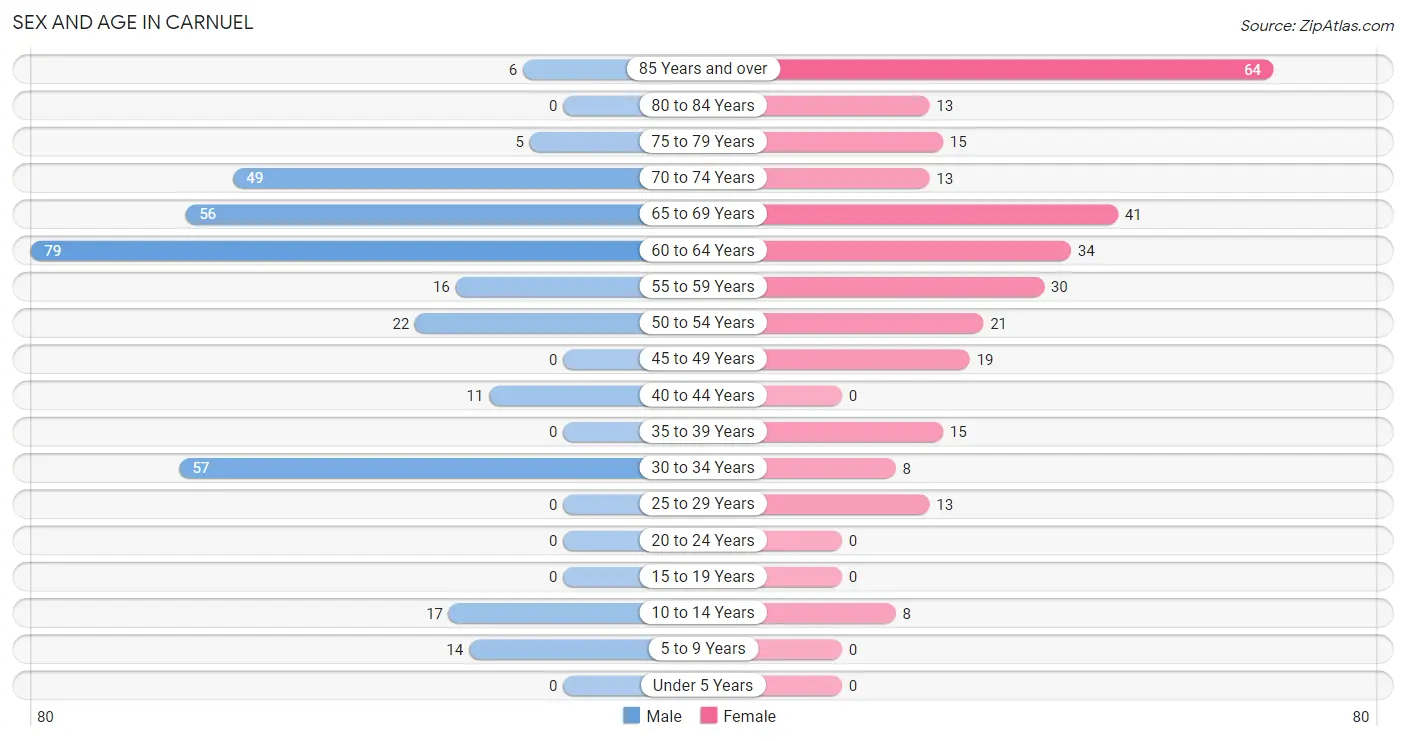
| Age Bracket | Male | Female |
| Under 5 Years | 0 (0.0%) | 0 (0.0%) |
| 5 to 9 Years | 14 (4.2%) | 0 (0.0%) |
| 10 to 14 Years | 17 (5.1%) | 8 (2.7%) |
| 15 to 19 Years | 0 (0.0%) | 0 (0.0%) |
| 20 to 24 Years | 0 (0.0%) | 0 (0.0%) |
| 25 to 29 Years | 0 (0.0%) | 13 (4.4%) |
| 30 to 34 Years | 57 (17.2%) | 8 (2.7%) |
| 35 to 39 Years | 0 (0.0%) | 15 (5.1%) |
| 40 to 44 Years | 11 (3.3%) | 0 (0.0%) |
| 45 to 49 Years | 0 (0.0%) | 19 (6.5%) |
| 50 to 54 Years | 22 (6.6%) | 21 (7.1%) |
| 55 to 59 Years | 16 (4.8%) | 30 (10.2%) |
| 60 to 64 Years | 79 (23.8%) | 34 (11.6%) |
| 65 to 69 Years | 56 (16.9%) | 41 (14.0%) |
| 70 to 74 Years | 49 (14.8%) | 13 (4.4%) |
| 75 to 79 Years | 5 (1.5%) | 15 (5.1%) |
| 80 to 84 Years | 0 (0.0%) | 13 (4.4%) |
| 85 Years and over | 6 (1.8%) | 64 (21.8%) |
| Total | 332 (100.0%) | 294 (100.0%) |
Families and Households in Carnuel
Median Family Size in Carnuel
The median family size in Carnuel is 2.38 persons per family, with single female/mother families (37 | 16.6%) accounting for the largest median family size of 3.7 persons per family. On the other hand, married-couple families (140 | 62.8%) represent the smallest median family size with 2.07 persons per family.
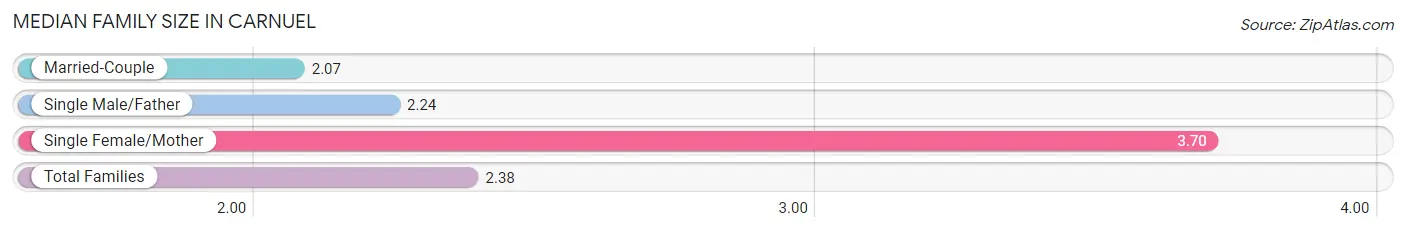
| Family Type | # Families | Family Size |
| Married-Couple | 140 (62.8%) | 2.07 |
| Single Male/Father | 46 (20.6%) | 2.24 |
| Single Female/Mother | 37 (16.6%) | 3.70 |
| Total Families | 223 (100.0%) | 2.38 |
Median Household Size in Carnuel
The median household size in Carnuel is 2.14 persons per household, with single female/mother households (37 | 12.6%) accounting for the largest median household size of 3.7 persons per household. non-family households (70 | 23.9%) represent the smallest median household size with 1.10 persons per household.
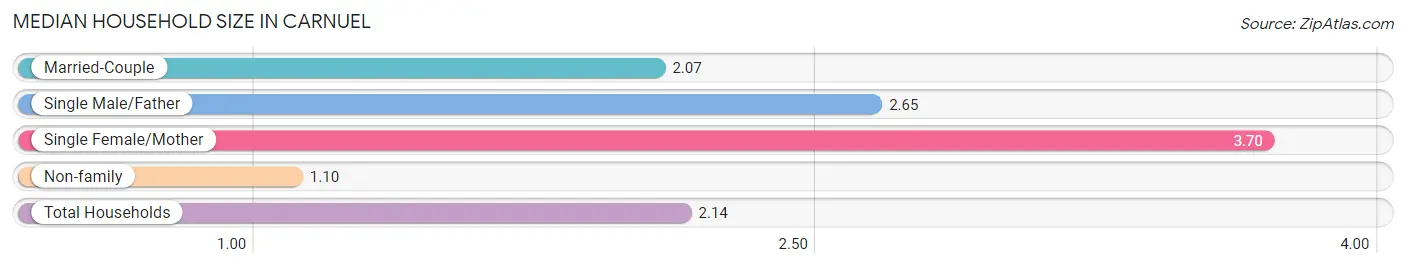
| Household Type | # Households | Household Size |
| Married-Couple | 140 (47.8%) | 2.07 |
| Single Male/Father | 46 (15.7%) | 2.65 |
| Single Female/Mother | 37 (12.6%) | 3.70 |
| Non-family | 70 (23.9%) | 1.10 |
| Total Households | 293 (100.0%) | 2.14 |
Household Size by Marriage Status in Carnuel
Out of a total of 293 households in Carnuel, 223 (76.1%) are family households, while 70 (23.9%) are nonfamily households. The most numerous type of family households are 2-person households, comprising 180, and the most common type of nonfamily households are 1-person households, comprising 65.
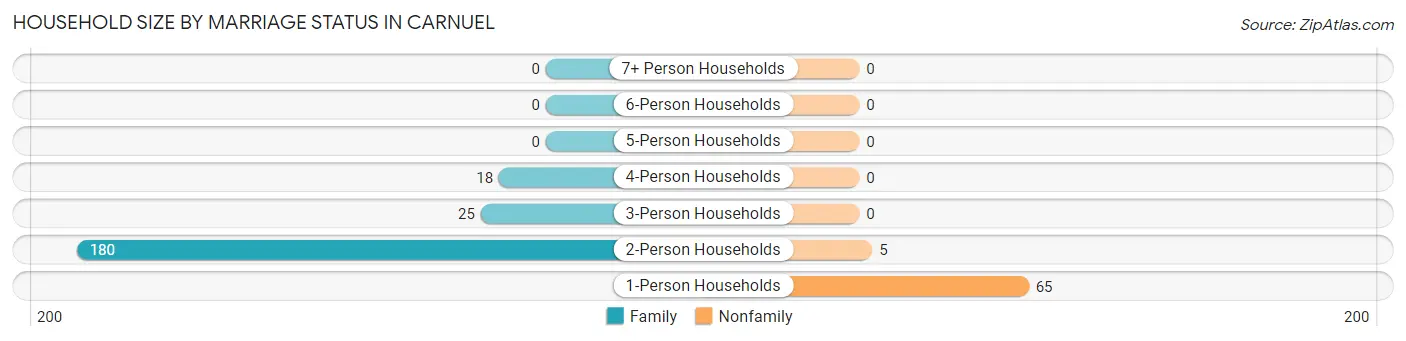
| Household Size | Family Households | Nonfamily Households |
| 1-Person Households | - | 65 (22.2%) |
| 2-Person Households | 180 (61.4%) | 5 (1.7%) |
| 3-Person Households | 25 (8.5%) | 0 (0.0%) |
| 4-Person Households | 18 (6.1%) | 0 (0.0%) |
| 5-Person Households | 0 (0.0%) | 0 (0.0%) |
| 6-Person Households | 0 (0.0%) | 0 (0.0%) |
| 7+ Person Households | 0 (0.0%) | 0 (0.0%) |
| Total | 223 (76.1%) | 70 (23.9%) |
Female Fertility in Carnuel
Fertility by Age in Carnuel
| Age Bracket | Women with Births | Births / 1,000 Women |
| 15 to 19 years | 0 (0.0%) | 0.0 |
| 20 to 34 years | 0 (0.0%) | 0.0 |
| 35 to 50 years | 0 (0.0%) | 0.0 |
| Total | 0 (0.0%) | 0.0 |
Fertility by Age by Marriage Status in Carnuel
| Age Bracket | Married | Unmarried |
| 15 to 19 years | 0 (0.0%) | 0 (0.0%) |
| 20 to 34 years | 0 (0.0%) | 0 (0.0%) |
| 35 to 50 years | 0 (0.0%) | 0 (0.0%) |
| Total | 0 (0.0%) | 0 (0.0%) |
Fertility by Education in Carnuel
| Educational Attainment | Women with Births | Births / 1,000 Women |
| Less than High School | 0 (0.0%) | 0.0 |
| High School Diploma | 0 (0.0%) | 0.0 |
| College or Associate's Degree | 0 (0.0%) | 0.0 |
| Bachelor's Degree | 0 (0.0%) | 0.0 |
| Graduate Degree | 0 (0.0%) | 0.0 |
| Total | 0 (0.0%) | 0.0 |
Fertility by Education by Marriage Status in Carnuel
| Educational Attainment | Married | Unmarried |
| Less than High School | 0 (0.0%) | 0 (0.0%) |
| High School Diploma | 0 (0.0%) | 0 (0.0%) |
| College or Associate's Degree | 0 (0.0%) | 0 (0.0%) |
| Bachelor's Degree | 0 (0.0%) | 0 (0.0%) |
| Graduate Degree | 0 (0.0%) | 0 (0.0%) |
| Total | 0 (0.0%) | 0 (0.0%) |
Employment Characteristics in Carnuel
Employment by Class of Employer in Carnuel
Among the 228 employed individuals in Carnuel, private company employees (93 | 40.8%), self-employed (incorporated) (42 | 18.4%), and local government employees (38 | 16.7%) make up the most common classes of employment.
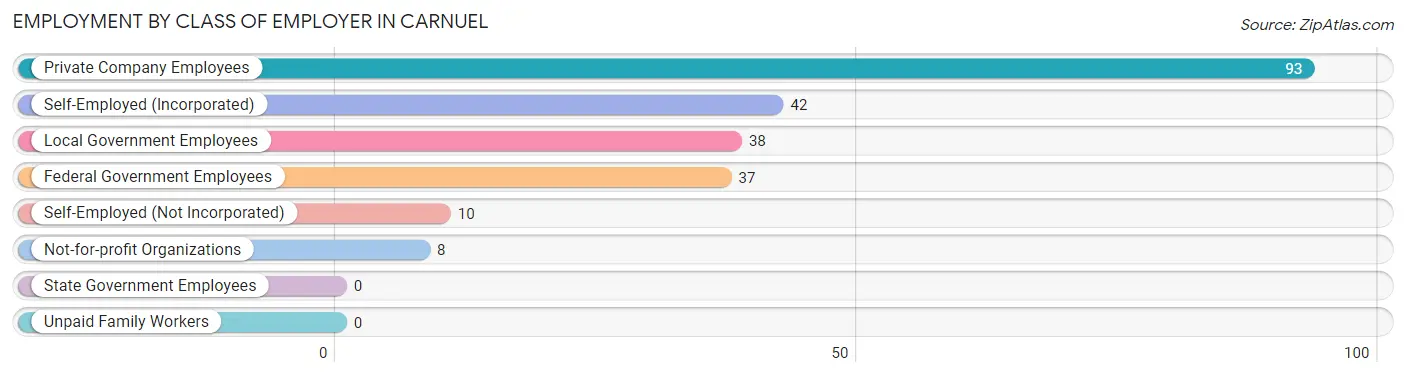
| Employer Class | # Employees | % Employees |
| Private Company Employees | 93 | 40.8% |
| Self-Employed (Incorporated) | 42 | 18.4% |
| Self-Employed (Not Incorporated) | 10 | 4.4% |
| Not-for-profit Organizations | 8 | 3.5% |
| Local Government Employees | 38 | 16.7% |
| State Government Employees | 0 | 0.0% |
| Federal Government Employees | 37 | 16.2% |
| Unpaid Family Workers | 0 | 0.0% |
| Total | 228 | 100.0% |
Employment Status by Age in Carnuel
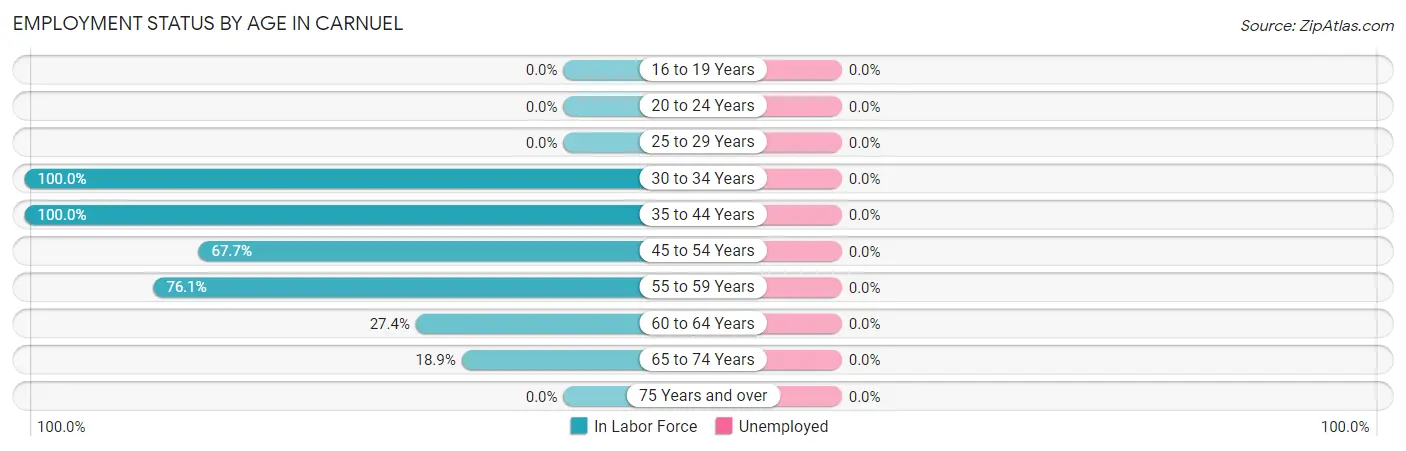
| Age Bracket | In Labor Force | Unemployed |
| 16 to 19 Years | 0 (0.0%) | 0 (0.0%) |
| 20 to 24 Years | 0 (0.0%) | 0 (0.0%) |
| 25 to 29 Years | 0 (0.0%) | 0 (0.0%) |
| 30 to 34 Years | 65 (100.0%) | 0 (0.0%) |
| 35 to 44 Years | 26 (100.0%) | 0 (0.0%) |
| 45 to 54 Years | 42 (67.7%) | 0 (0.0%) |
| 55 to 59 Years | 35 (76.1%) | 0 (0.0%) |
| 60 to 64 Years | 31 (27.4%) | 0 (0.0%) |
| 65 to 74 Years | 30 (18.9%) | 0 (0.0%) |
| 75 Years and over | 0 (0.0%) | 0 (0.0%) |
| Total | 229 (39.0%) | 0 (0.0%) |
Employment Status by Educational Attainment in Carnuel
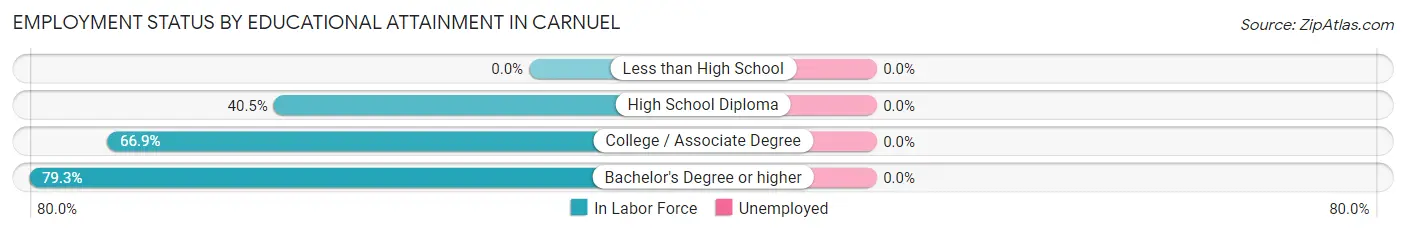
| Educational Attainment | In Labor Force | Unemployed |
| Less than High School | 0 (0.0%) | 0 (0.0%) |
| High School Diploma | 45 (40.5%) | 0 (0.0%) |
| College / Associate Degree | 85 (66.9%) | 0 (0.0%) |
| Bachelor's Degree or higher | 69 (79.3%) | 0 (0.0%) |
| Total | 199 (61.2%) | 0 (0.0%) |
Employment Occupations by Sex in Carnuel
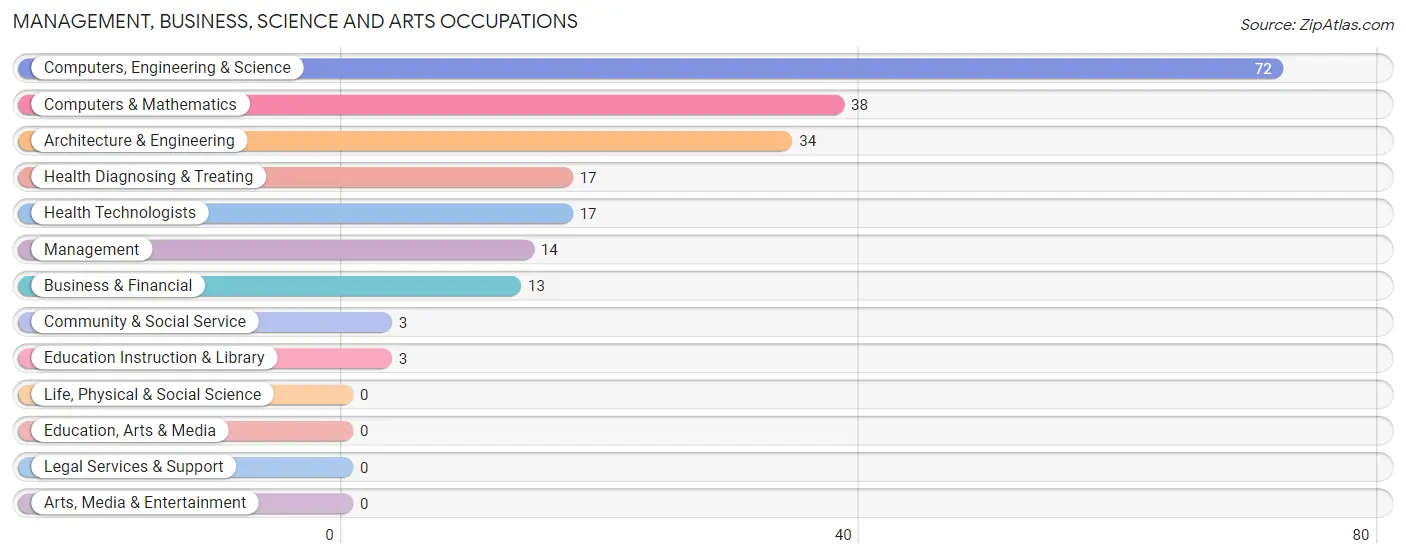
Management, Business, Science and Arts Occupations
The most common Management, Business, Science and Arts occupations in Carnuel are Computers, Engineering & Science (72 | 31.4%), Computers & Mathematics (38 | 16.6%), Architecture & Engineering (34 | 14.8%), Health Diagnosing & Treating (17 | 7.4%), and Health Technologists (17 | 7.4%).
Management, Business, Science and Arts Occupations by Sex
Within the Management, Business, Science and Arts occupations in Carnuel, the most male-oriented occupations are Architecture & Engineering (85.3%), Computers, Engineering & Science (54.2%), and Computers & Mathematics (26.3%), while the most female-oriented occupations are Management (100.0%), Business & Financial (100.0%), and Community & Social Service (100.0%).
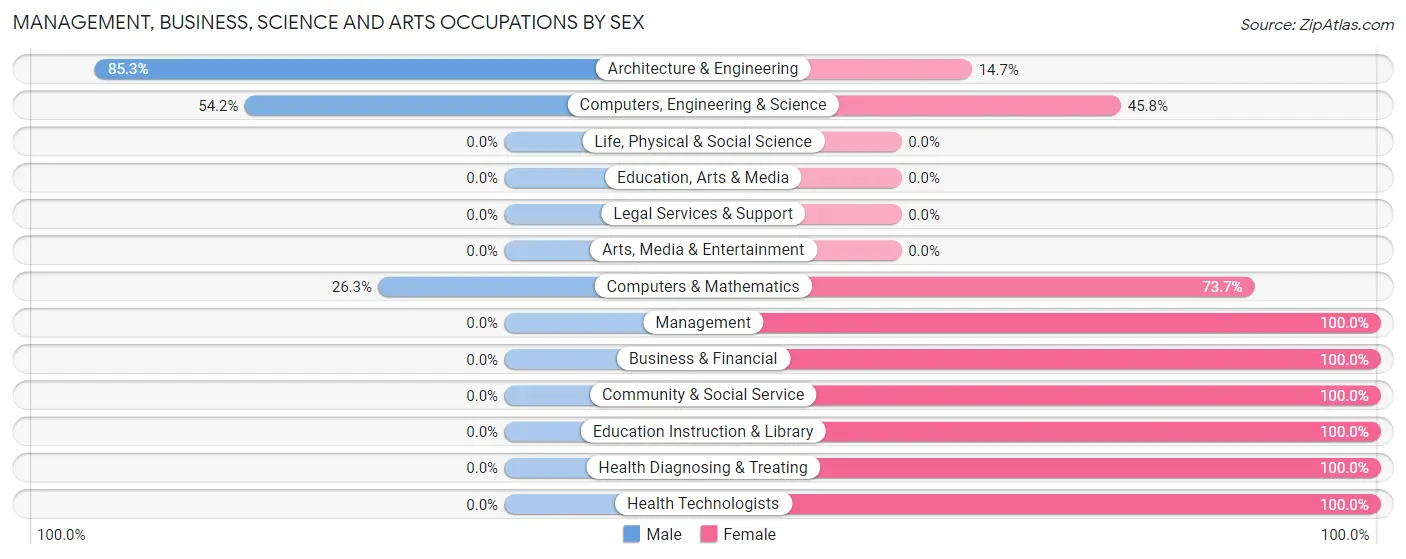
| Occupation | Male | Female |
| Management | 0 (0.0%) | 14 (100.0%) |
| Business & Financial | 0 (0.0%) | 13 (100.0%) |
| Computers, Engineering & Science | 39 (54.2%) | 33 (45.8%) |
| Computers & Mathematics | 10 (26.3%) | 28 (73.7%) |
| Architecture & Engineering | 29 (85.3%) | 5 (14.7%) |
| Life, Physical & Social Science | 0 (0.0%) | 0 (0.0%) |
| Community & Social Service | 0 (0.0%) | 3 (100.0%) |
| Education, Arts & Media | 0 (0.0%) | 0 (0.0%) |
| Legal Services & Support | 0 (0.0%) | 0 (0.0%) |
| Education Instruction & Library | 0 (0.0%) | 3 (100.0%) |
| Arts, Media & Entertainment | 0 (0.0%) | 0 (0.0%) |
| Health Diagnosing & Treating | 0 (0.0%) | 17 (100.0%) |
| Health Technologists | 0 (0.0%) | 17 (100.0%) |
| Total (Category) | 39 (32.8%) | 80 (67.2%) |
| Total (Overall) | 94 (41.0%) | 135 (59.0%) |
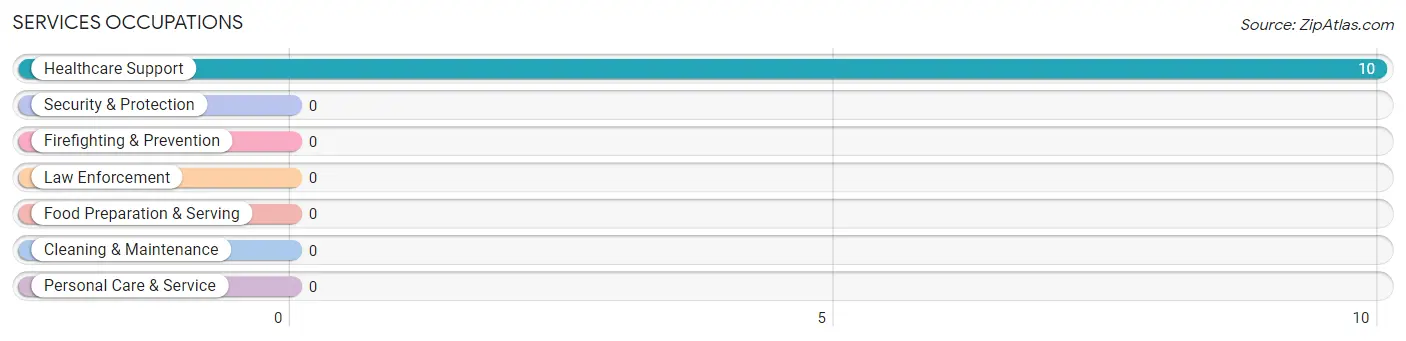
Services Occupations
The most common Services occupations in Carnuel are , and Healthcare Support (10 | 4.4%).
Services Occupations by Sex
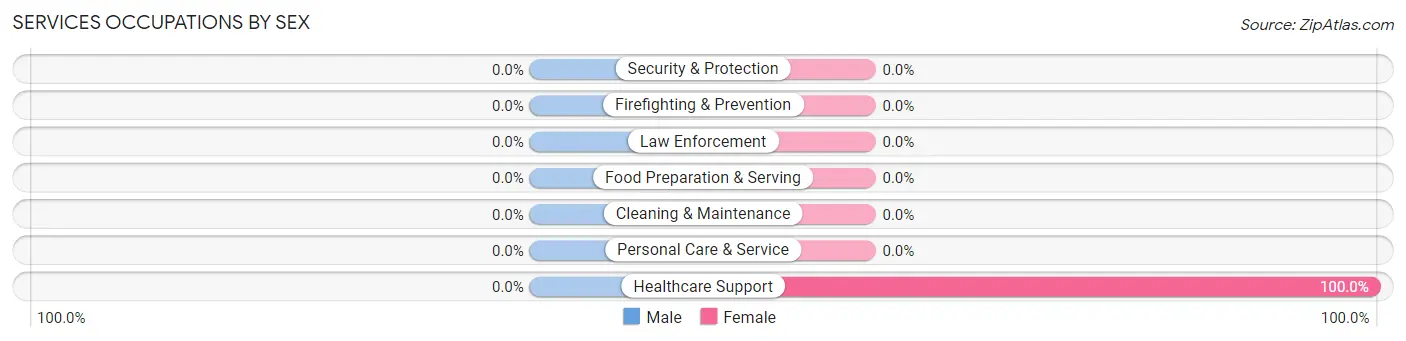
| Occupation | Male | Female |
| Healthcare Support | 0 (0.0%) | 10 (100.0%) |
| Security & Protection | 0 (0.0%) | 0 (0.0%) |
| Firefighting & Prevention | 0 (0.0%) | 0 (0.0%) |
| Law Enforcement | 0 (0.0%) | 0 (0.0%) |
| Food Preparation & Serving | 0 (0.0%) | 0 (0.0%) |
| Cleaning & Maintenance | 0 (0.0%) | 0 (0.0%) |
| Personal Care & Service | 0 (0.0%) | 0 (0.0%) |
| Total (Category) | 0 (0.0%) | 10 (100.0%) |
| Total (Overall) | 94 (41.0%) | 135 (59.0%) |
Sales and Office Occupations
The most common Sales and Office occupations in Carnuel are , and Office & Administration (7 | 3.1%).
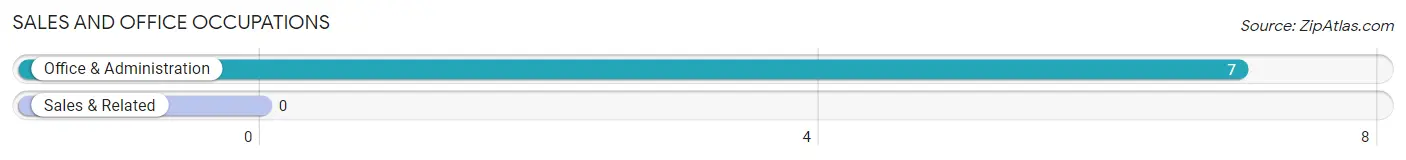
Sales and Office Occupations by Sex
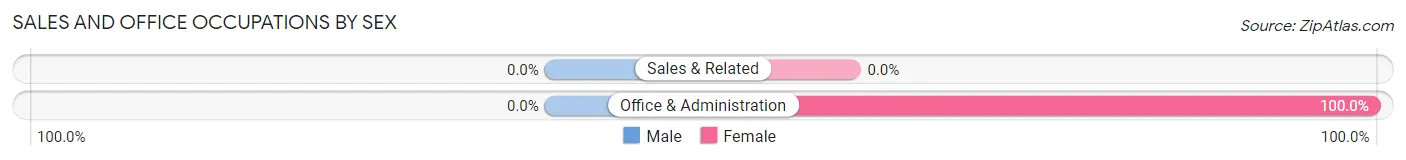
| Occupation | Male | Female |
| Sales & Related | 0 (0.0%) | 0 (0.0%) |
| Office & Administration | 0 (0.0%) | 7 (100.0%) |
| Total (Category) | 0 (0.0%) | 7 (100.0%) |
| Total (Overall) | 94 (41.0%) | 135 (59.0%) |
Natural Resources, Construction and Maintenance Occupations
The most common Natural Resources, Construction and Maintenance occupations in Carnuel are , and Construction & Extraction (44 | 19.2%).
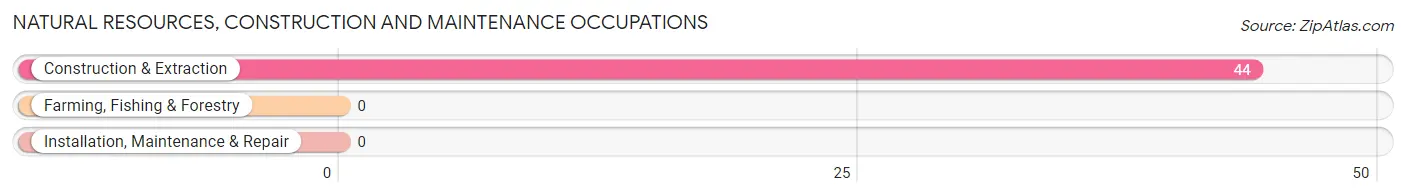
Natural Resources, Construction and Maintenance Occupations by Sex
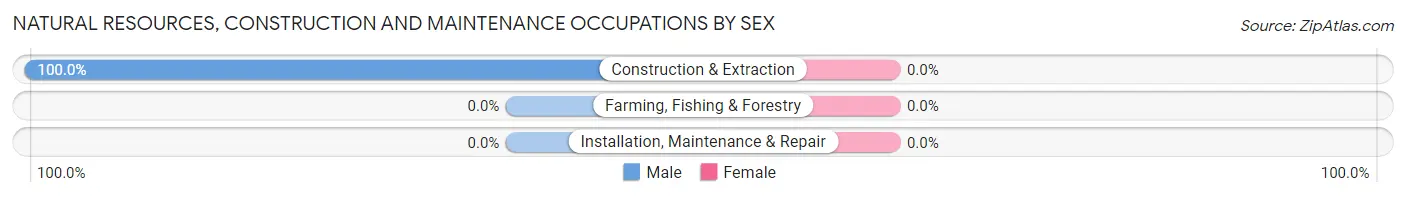
| Occupation | Male | Female |
| Farming, Fishing & Forestry | 0 (0.0%) | 0 (0.0%) |
| Construction & Extraction | 44 (100.0%) | 0 (0.0%) |
| Installation, Maintenance & Repair | 0 (0.0%) | 0 (0.0%) |
| Total (Category) | 44 (100.0%) | 0 (0.0%) |
| Total (Overall) | 94 (41.0%) | 135 (59.0%) |
Production, Transportation and Moving Occupations
The most common Production, Transportation and Moving occupations in Carnuel are Transportation (45 | 19.7%), and Production (4 | 1.8%).
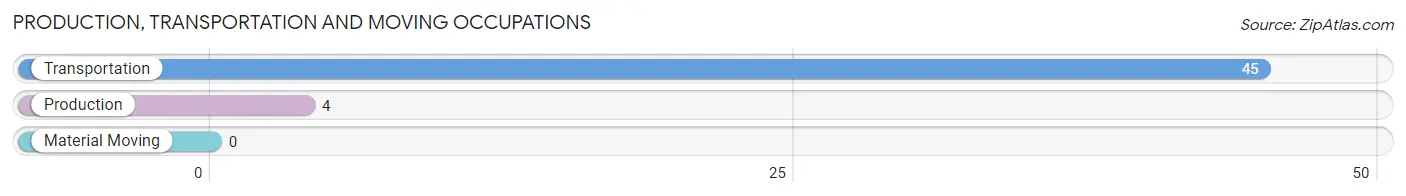
Production, Transportation and Moving Occupations by Sex
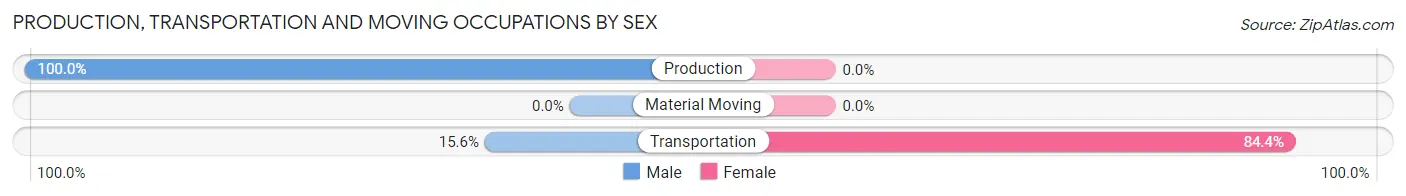
| Occupation | Male | Female |
| Production | 4 (100.0%) | 0 (0.0%) |
| Transportation | 7 (15.6%) | 38 (84.4%) |
| Material Moving | 0 (0.0%) | 0 (0.0%) |
| Total (Category) | 11 (22.5%) | 38 (77.5%) |
| Total (Overall) | 94 (41.0%) | 135 (59.0%) |
Employment Industries by Sex in Carnuel
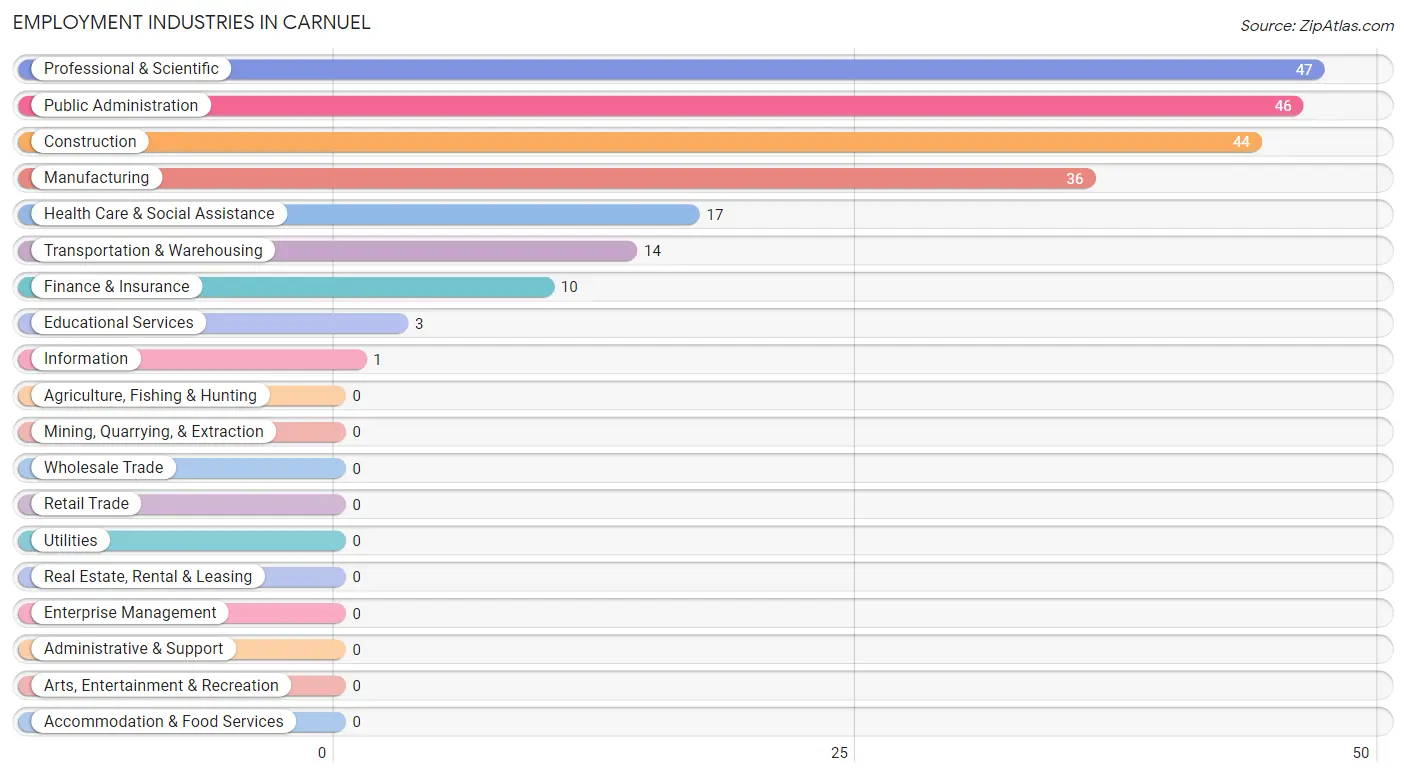
Employment Industries in Carnuel
The major employment industries in Carnuel include Professional & Scientific (47 | 20.5%), Public Administration (46 | 20.1%), Construction (44 | 19.2%), Manufacturing (36 | 15.7%), and Health Care & Social Assistance (17 | 7.4%).
Employment Industries by Sex in Carnuel
The Carnuel industries that see more men than women are Construction (100.0%), Information (100.0%), and Finance & Insurance (100.0%), whereas the industries that tend to have a higher number of women are Educational Services (100.0%), Health Care & Social Assistance (100.0%), and Public Administration (100.0%).
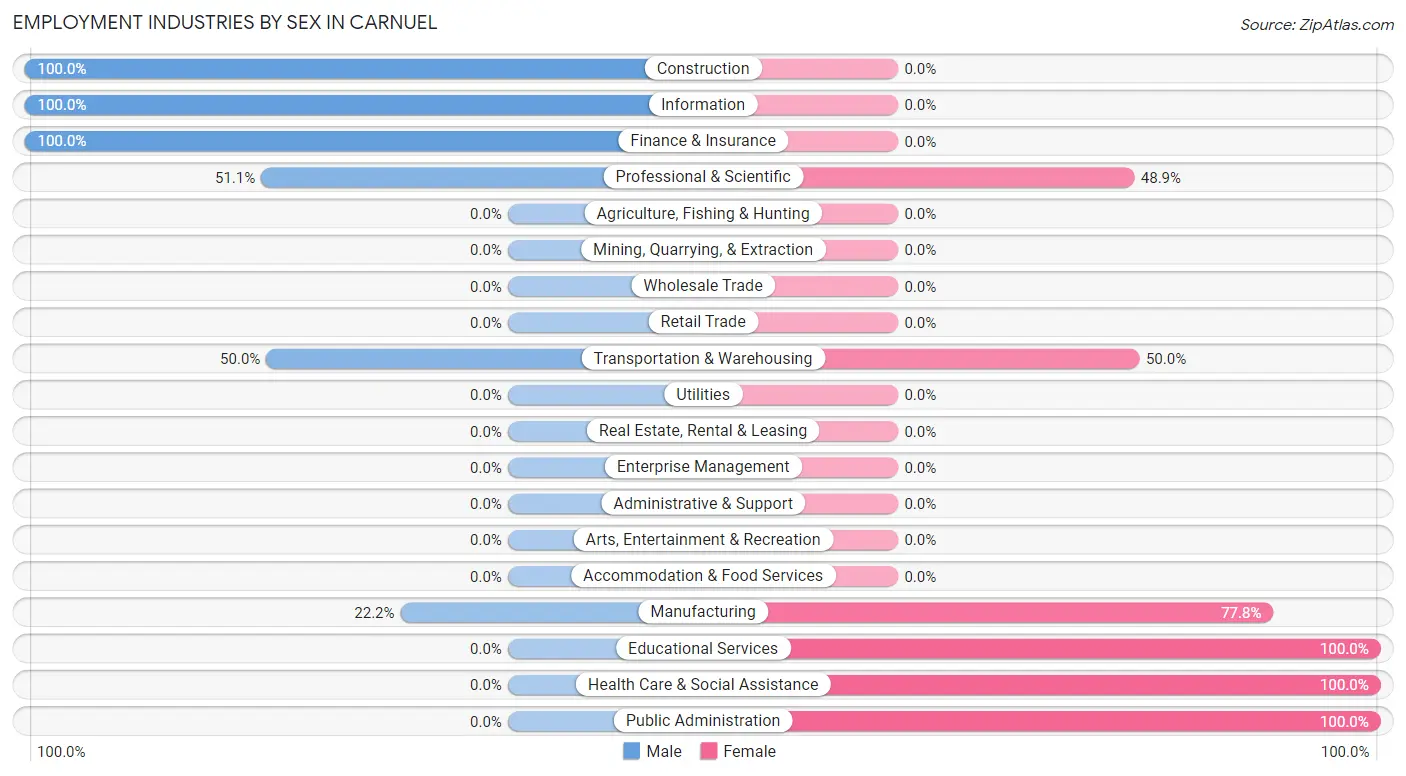
| Industry | Male | Female |
| Agriculture, Fishing & Hunting | 0 (0.0%) | 0 (0.0%) |
| Mining, Quarrying, & Extraction | 0 (0.0%) | 0 (0.0%) |
| Construction | 44 (100.0%) | 0 (0.0%) |
| Manufacturing | 8 (22.2%) | 28 (77.8%) |
| Wholesale Trade | 0 (0.0%) | 0 (0.0%) |
| Retail Trade | 0 (0.0%) | 0 (0.0%) |
| Transportation & Warehousing | 7 (50.0%) | 7 (50.0%) |
| Utilities | 0 (0.0%) | 0 (0.0%) |
| Information | 1 (100.0%) | 0 (0.0%) |
| Finance & Insurance | 10 (100.0%) | 0 (0.0%) |
| Real Estate, Rental & Leasing | 0 (0.0%) | 0 (0.0%) |
| Professional & Scientific | 24 (51.1%) | 23 (48.9%) |
| Enterprise Management | 0 (0.0%) | 0 (0.0%) |
| Administrative & Support | 0 (0.0%) | 0 (0.0%) |
| Educational Services | 0 (0.0%) | 3 (100.0%) |
| Health Care & Social Assistance | 0 (0.0%) | 17 (100.0%) |
| Arts, Entertainment & Recreation | 0 (0.0%) | 0 (0.0%) |
| Accommodation & Food Services | 0 (0.0%) | 0 (0.0%) |
| Public Administration | 0 (0.0%) | 46 (100.0%) |
| Total | 94 (41.0%) | 135 (59.0%) |
Education in Carnuel
School Enrollment in Carnuel
The most common levels of schooling among the 42 students in Carnuel are middle school (25 | 59.5%), kindergarten (14 | 33.3%), and graduate / professional (3 | 7.1%).
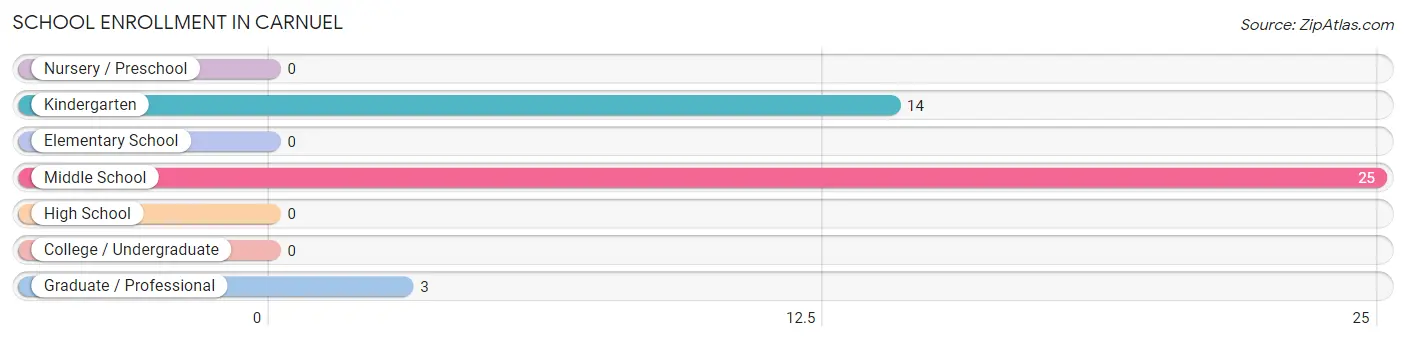
| School Level | # Students | % Students |
| Nursery / Preschool | 0 | 0.0% |
| Kindergarten | 14 | 33.3% |
| Elementary School | 0 | 0.0% |
| Middle School | 25 | 59.5% |
| High School | 0 | 0.0% |
| College / Undergraduate | 0 | 0.0% |
| Graduate / Professional | 3 | 7.1% |
| Total | 42 | 100.0% |
School Enrollment by Age by Funding Source in Carnuel
Out of a total of 42 students who are enrolled in schools in Carnuel, 21 (50.0%) attend a private institution, while the remaining 21 (50.0%) are enrolled in public schools. The age group of 5 to 9 year old has the highest likelihood of being enrolled in private schools, with 14 (100.0% in the age bracket) enrolled. Conversely, the age group of 35 years and over has the lowest likelihood of being enrolled in a private school, with 3 (100.0% in the age bracket) attending a public institution.
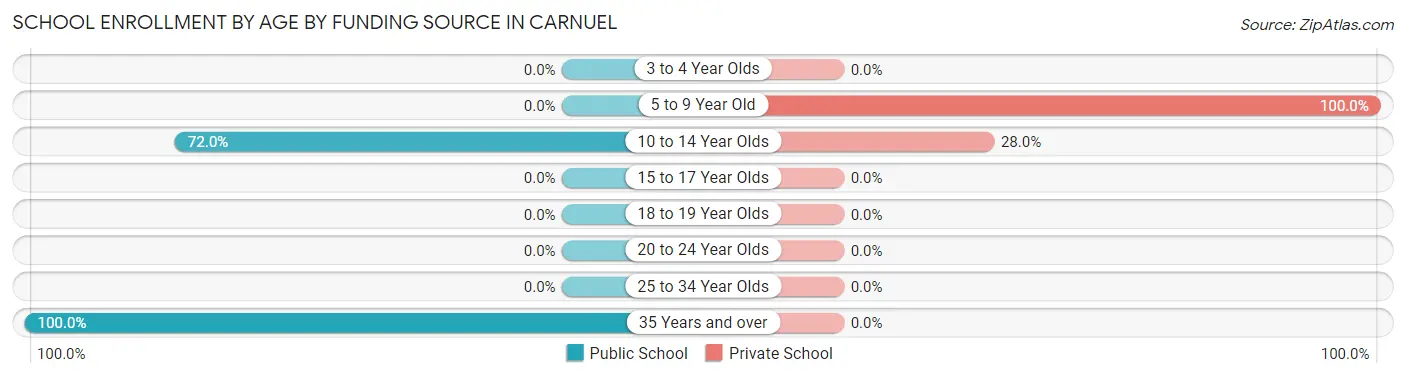
| Age Bracket | Public School | Private School |
| 3 to 4 Year Olds | 0 (0.0%) | 0 (0.0%) |
| 5 to 9 Year Old | 0 (0.0%) | 14 (100.0%) |
| 10 to 14 Year Olds | 18 (72.0%) | 7 (28.0%) |
| 15 to 17 Year Olds | 0 (0.0%) | 0 (0.0%) |
| 18 to 19 Year Olds | 0 (0.0%) | 0 (0.0%) |
| 20 to 24 Year Olds | 0 (0.0%) | 0 (0.0%) |
| 25 to 34 Year Olds | 0 (0.0%) | 0 (0.0%) |
| 35 Years and over | 3 (100.0%) | 0 (0.0%) |
| Total | 21 (50.0%) | 21 (50.0%) |
Educational Attainment by Field of Study in Carnuel
Engineering (36 | 26.3%), computers & mathematics (28 | 20.4%), business (18 | 13.1%), literature & languages (13 | 9.5%), and multidisciplinary studies (8 | 5.8%) are the most common fields of study among 137 individuals in Carnuel who have obtained a bachelor's degree or higher.
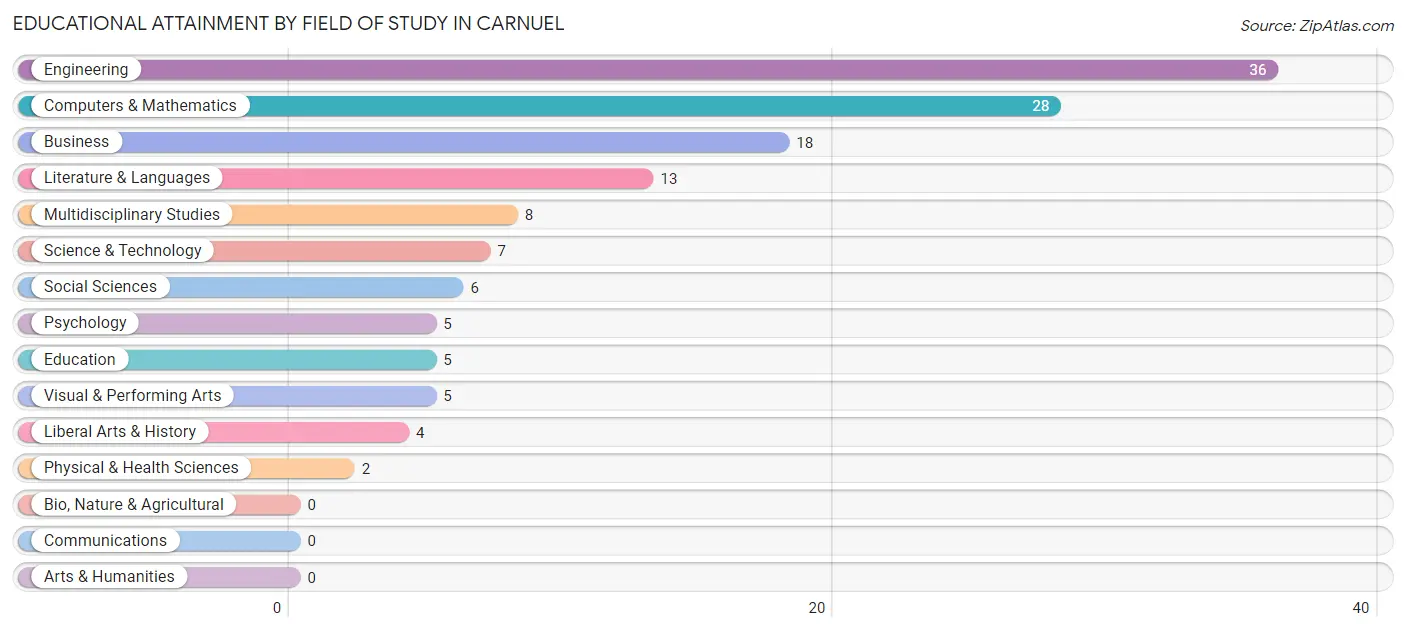
| Field of Study | # Graduates | % Graduates |
| Computers & Mathematics | 28 | 20.4% |
| Bio, Nature & Agricultural | 0 | 0.0% |
| Physical & Health Sciences | 2 | 1.5% |
| Psychology | 5 | 3.6% |
| Social Sciences | 6 | 4.4% |
| Engineering | 36 | 26.3% |
| Multidisciplinary Studies | 8 | 5.8% |
| Science & Technology | 7 | 5.1% |
| Business | 18 | 13.1% |
| Education | 5 | 3.6% |
| Literature & Languages | 13 | 9.5% |
| Liberal Arts & History | 4 | 2.9% |
| Visual & Performing Arts | 5 | 3.6% |
| Communications | 0 | 0.0% |
| Arts & Humanities | 0 | 0.0% |
| Total | 137 | 100.0% |
Transportation & Commute in Carnuel
Vehicle Availability by Sex in Carnuel
The most prevalent vehicle ownership categories in Carnuel are males with 4 vehicles (50, accounting for 53.8%) and females with 4 vehicles (45, making up 37.0%).
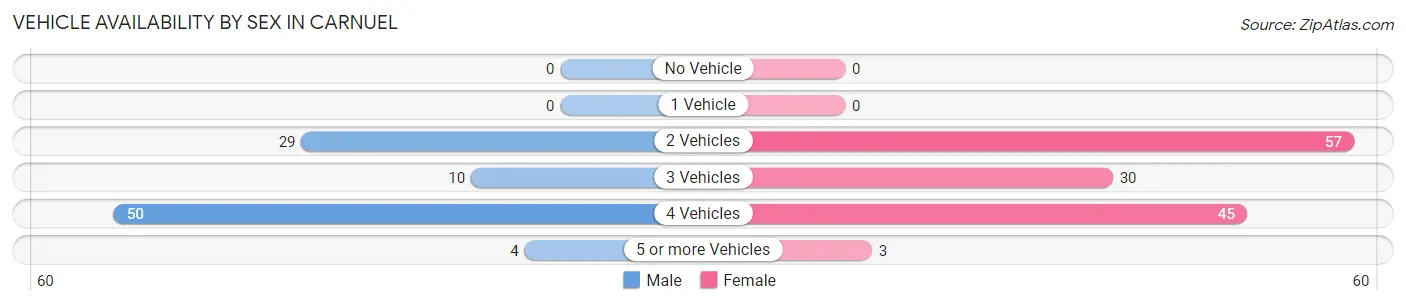
| Vehicles Available | Male | Female |
| No Vehicle | 0 (0.0%) | 0 (0.0%) |
| 1 Vehicle | 0 (0.0%) | 0 (0.0%) |
| 2 Vehicles | 29 (31.2%) | 57 (42.2%) |
| 3 Vehicles | 10 (10.7%) | 30 (22.2%) |
| 4 Vehicles | 50 (53.8%) | 45 (33.3%) |
| 5 or more Vehicles | 4 (4.3%) | 3 (2.2%) |
| Total | 93 (100.0%) | 135 (100.0%) |
Commute Time in Carnuel
The most frequently occuring commute durations in Carnuel are 20 to 24 minutes (58 commuters, 35.1%), 30 to 34 minutes (50 commuters, 30.3%), and 25 to 29 minutes (29 commuters, 17.6%).
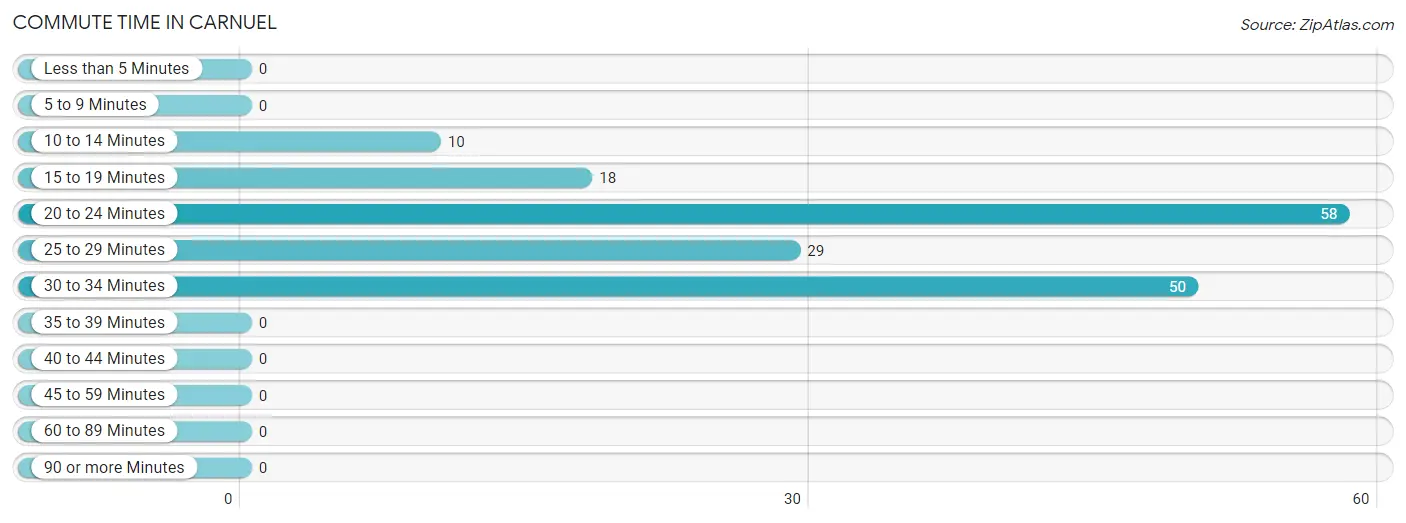
| Commute Time | # Commuters | % Commuters |
| Less than 5 Minutes | 0 | 0.0% |
| 5 to 9 Minutes | 0 | 0.0% |
| 10 to 14 Minutes | 10 | 6.1% |
| 15 to 19 Minutes | 18 | 10.9% |
| 20 to 24 Minutes | 58 | 35.1% |
| 25 to 29 Minutes | 29 | 17.6% |
| 30 to 34 Minutes | 50 | 30.3% |
| 35 to 39 Minutes | 0 | 0.0% |
| 40 to 44 Minutes | 0 | 0.0% |
| 45 to 59 Minutes | 0 | 0.0% |
| 60 to 89 Minutes | 0 | 0.0% |
| 90 or more Minutes | 0 | 0.0% |
Commute Time by Sex in Carnuel
The most common commute times in Carnuel are 30 to 34 minutes (40 commuters, 44.9%) for males and 20 to 24 minutes (58 commuters, 76.3%) for females.
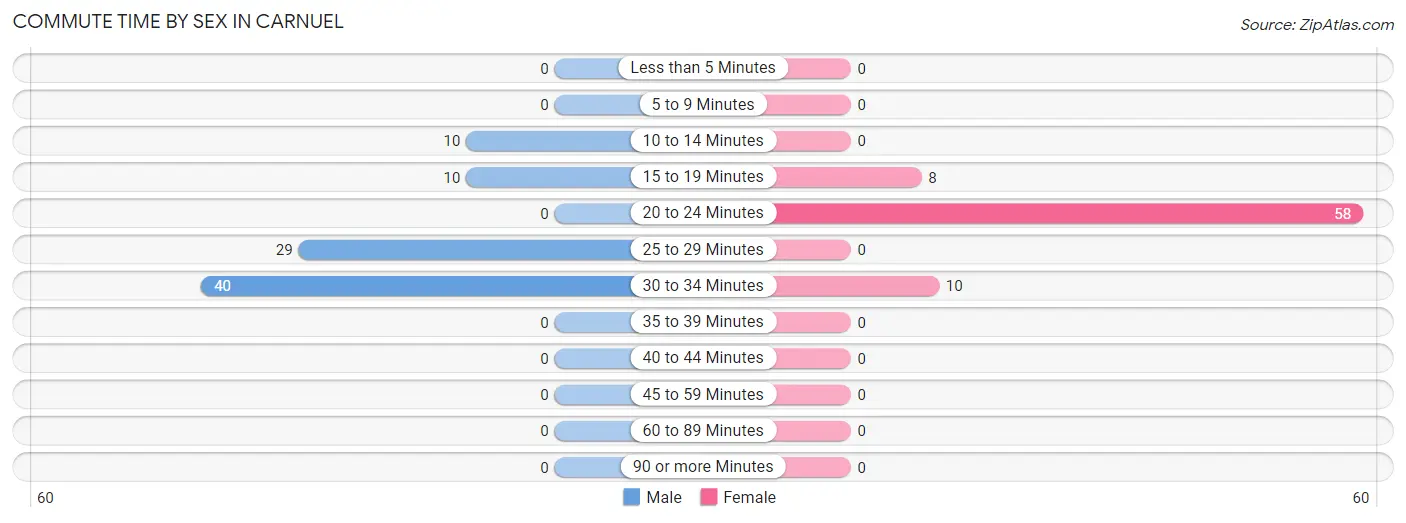
| Commute Time | Male | Female |
| Less than 5 Minutes | 0 (0.0%) | 0 (0.0%) |
| 5 to 9 Minutes | 0 (0.0%) | 0 (0.0%) |
| 10 to 14 Minutes | 10 (11.2%) | 0 (0.0%) |
| 15 to 19 Minutes | 10 (11.2%) | 8 (10.5%) |
| 20 to 24 Minutes | 0 (0.0%) | 58 (76.3%) |
| 25 to 29 Minutes | 29 (32.6%) | 0 (0.0%) |
| 30 to 34 Minutes | 40 (44.9%) | 10 (13.2%) |
| 35 to 39 Minutes | 0 (0.0%) | 0 (0.0%) |
| 40 to 44 Minutes | 0 (0.0%) | 0 (0.0%) |
| 45 to 59 Minutes | 0 (0.0%) | 0 (0.0%) |
| 60 to 89 Minutes | 0 (0.0%) | 0 (0.0%) |
| 90 or more Minutes | 0 (0.0%) | 0 (0.0%) |
Time of Departure to Work by Sex in Carnuel
The most frequent times of departure to work in Carnuel are 10:00 AM to 10:59 AM (44, 49.4%) for males and 4:00 PM to 11:59 PM (26, 34.2%) for females.
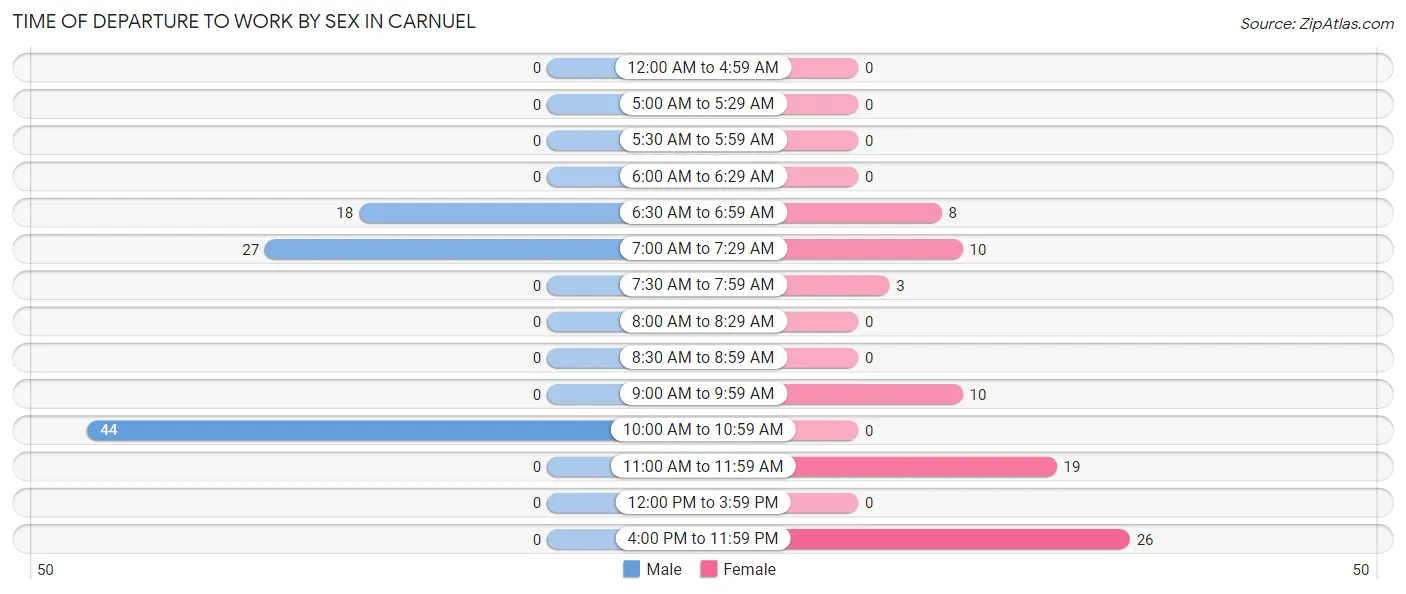
| Time of Departure | Male | Female |
| 12:00 AM to 4:59 AM | 0 (0.0%) | 0 (0.0%) |
| 5:00 AM to 5:29 AM | 0 (0.0%) | 0 (0.0%) |
| 5:30 AM to 5:59 AM | 0 (0.0%) | 0 (0.0%) |
| 6:00 AM to 6:29 AM | 0 (0.0%) | 0 (0.0%) |
| 6:30 AM to 6:59 AM | 18 (20.2%) | 8 (10.5%) |
| 7:00 AM to 7:29 AM | 27 (30.3%) | 10 (13.2%) |
| 7:30 AM to 7:59 AM | 0 (0.0%) | 3 (4.0%) |
| 8:00 AM to 8:29 AM | 0 (0.0%) | 0 (0.0%) |
| 8:30 AM to 8:59 AM | 0 (0.0%) | 0 (0.0%) |
| 9:00 AM to 9:59 AM | 0 (0.0%) | 10 (13.2%) |
| 10:00 AM to 10:59 AM | 44 (49.4%) | 0 (0.0%) |
| 11:00 AM to 11:59 AM | 0 (0.0%) | 19 (25.0%) |
| 12:00 PM to 3:59 PM | 0 (0.0%) | 0 (0.0%) |
| 4:00 PM to 11:59 PM | 0 (0.0%) | 26 (34.2%) |
| Total | 89 (100.0%) | 76 (100.0%) |
Housing Occupancy in Carnuel
Occupancy by Ownership in Carnuel
Of the total 293 dwellings in Carnuel, owner-occupied units account for 293 (100.0%), while renter-occupied units make up 0 (0.0%).
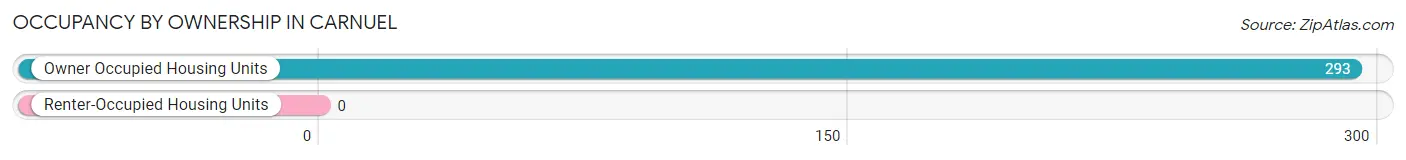
| Occupancy | # Housing Units | % Housing Units |
| Owner Occupied Housing Units | 293 | 100.0% |
| Renter-Occupied Housing Units | 0 | 0.0% |
| Total Occupied Housing Units | 293 | 100.0% |
Occupancy by Household Size in Carnuel
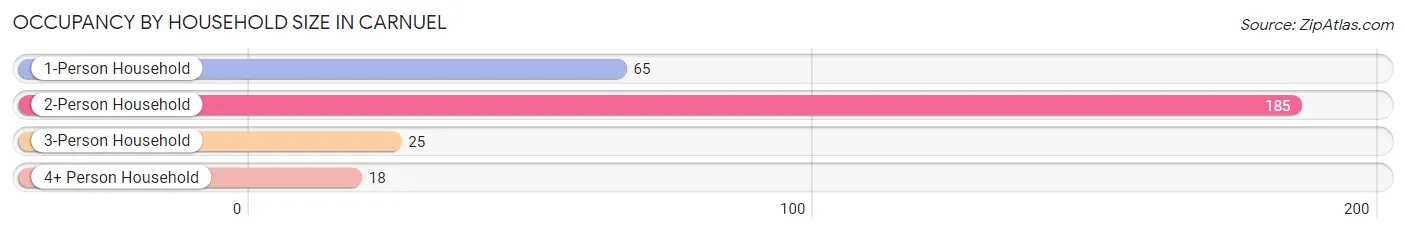
| Household Size | # Housing Units | % Housing Units |
| 1-Person Household | 65 | 22.2% |
| 2-Person Household | 185 | 63.1% |
| 3-Person Household | 25 | 8.5% |
| 4+ Person Household | 18 | 6.1% |
| Total Housing Units | 293 | 100.0% |
Occupancy by Ownership by Household Size in Carnuel
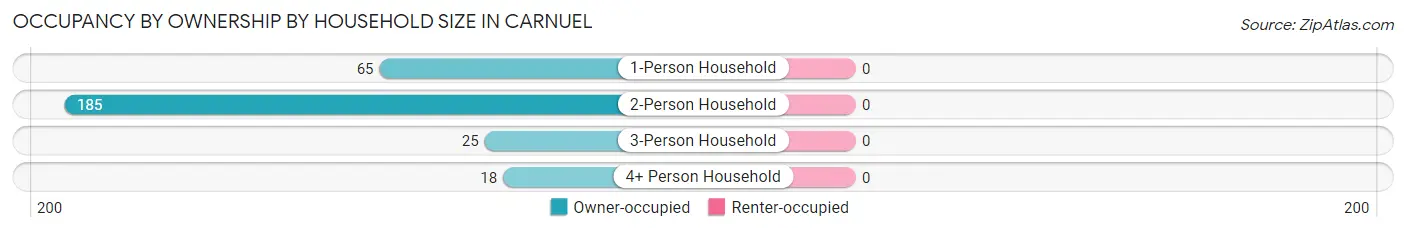
| Household Size | Owner-occupied | Renter-occupied |
| 1-Person Household | 65 (100.0%) | 0 (0.0%) |
| 2-Person Household | 185 (100.0%) | 0 (0.0%) |
| 3-Person Household | 25 (100.0%) | 0 (0.0%) |
| 4+ Person Household | 18 (100.0%) | 0 (0.0%) |
| Total Housing Units | 293 (100.0%) | 0 (0.0%) |
Occupancy by Educational Attainment in Carnuel
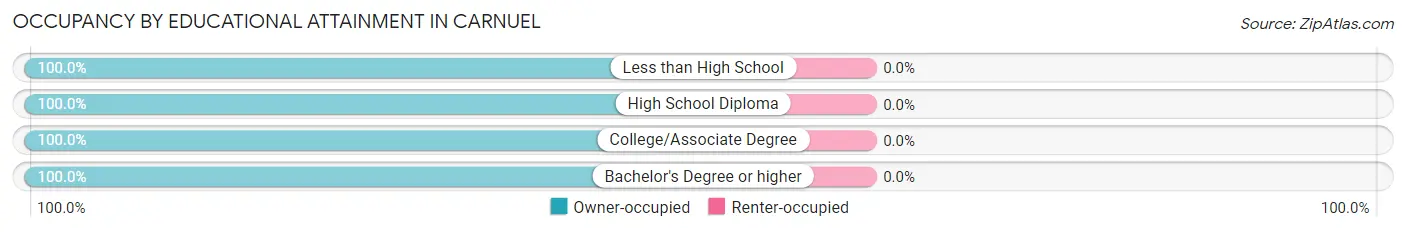
| Household Size | Owner-occupied | Renter-occupied |
| Less than High School | 69 (100.0%) | 0 (0.0%) |
| High School Diploma | 46 (100.0%) | 0 (0.0%) |
| College/Associate Degree | 133 (100.0%) | 0 (0.0%) |
| Bachelor's Degree or higher | 45 (100.0%) | 0 (0.0%) |
Occupancy by Age of Householder in Carnuel
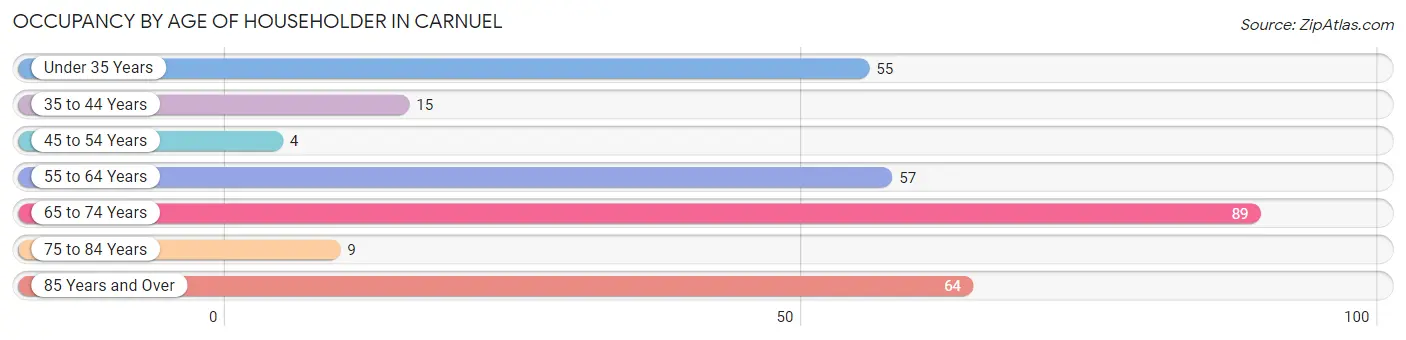
| Age Bracket | # Households | % Households |
| Under 35 Years | 55 | 18.8% |
| 35 to 44 Years | 15 | 5.1% |
| 45 to 54 Years | 4 | 1.4% |
| 55 to 64 Years | 57 | 19.5% |
| 65 to 74 Years | 89 | 30.4% |
| 75 to 84 Years | 9 | 3.1% |
| 85 Years and Over | 64 | 21.8% |
| Total | 293 | 100.0% |
Housing Finances in Carnuel
Median Income by Occupancy in Carnuel
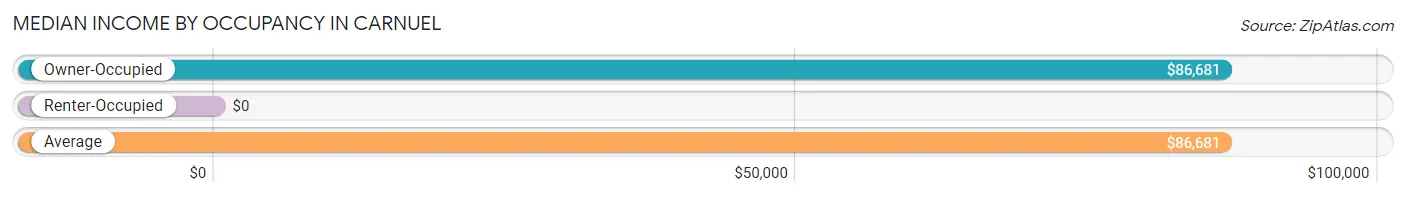
| Occupancy Type | # Households | Median Income |
| Owner-Occupied | 293 (100.0%) | $86,681 |
| Renter-Occupied | 0 (0.0%) | $0 |
| Average | 293 (100.0%) | $86,681 |
Occupancy by Householder Income Bracket in Carnuel
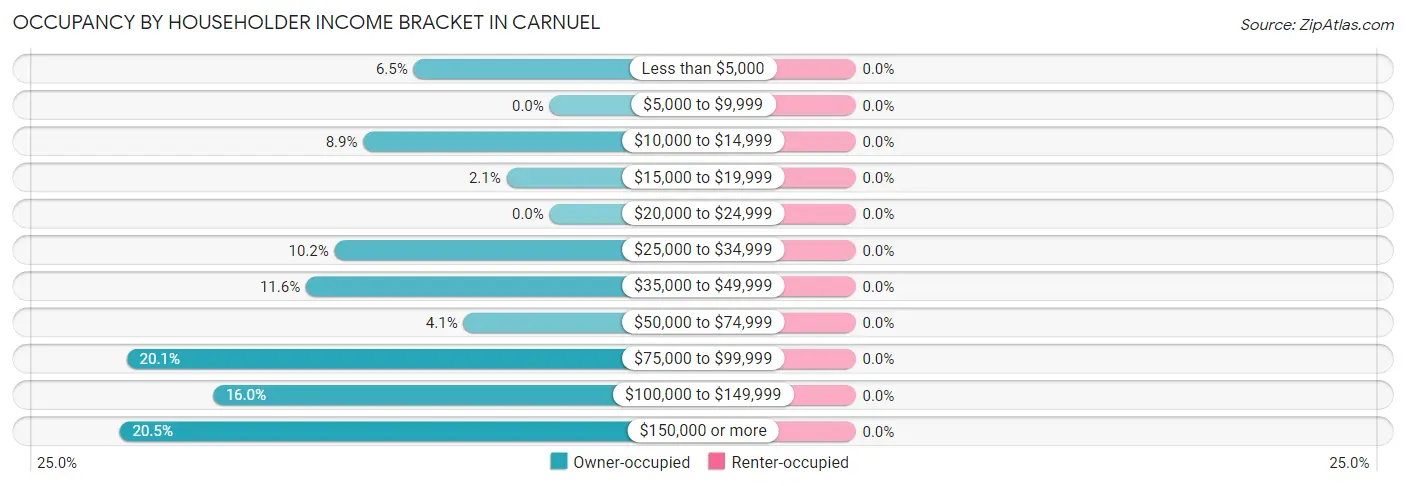
| Income Bracket | Owner-occupied | Renter-occupied |
| Less than $5,000 | 19 (6.5%) | 0 (0.0%) |
| $5,000 to $9,999 | 0 (0.0%) | 0 (0.0%) |
| $10,000 to $14,999 | 26 (8.9%) | 0 (0.0%) |
| $15,000 to $19,999 | 6 (2.1%) | 0 (0.0%) |
| $20,000 to $24,999 | 0 (0.0%) | 0 (0.0%) |
| $25,000 to $34,999 | 30 (10.2%) | 0 (0.0%) |
| $35,000 to $49,999 | 34 (11.6%) | 0 (0.0%) |
| $50,000 to $74,999 | 12 (4.1%) | 0 (0.0%) |
| $75,000 to $99,999 | 59 (20.1%) | 0 (0.0%) |
| $100,000 to $149,999 | 47 (16.0%) | 0 (0.0%) |
| $150,000 or more | 60 (20.5%) | 0 (0.0%) |
| Total | 293 (100.0%) | 0 (0.0%) |
Monthly Housing Cost Tiers in Carnuel
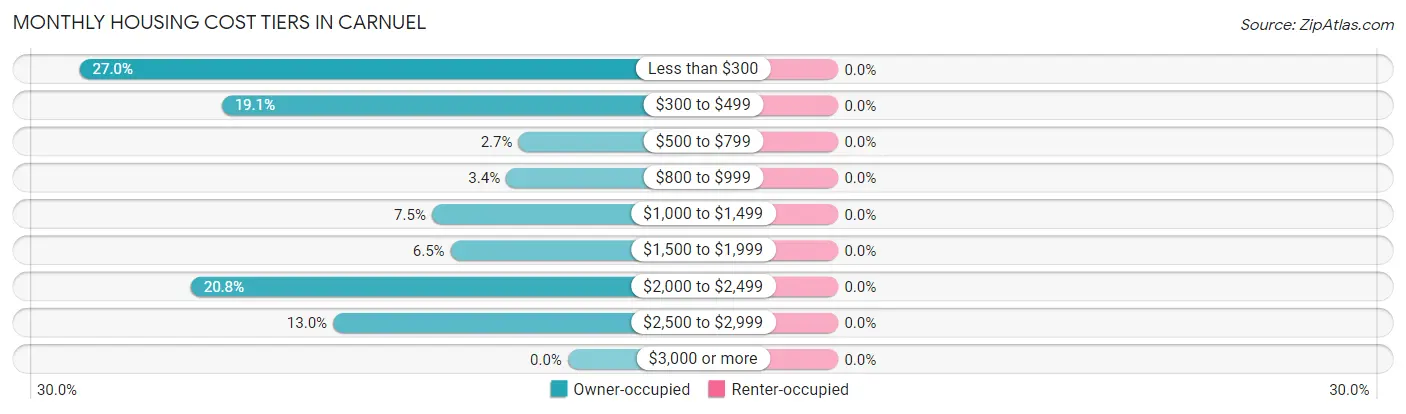
| Monthly Cost | Owner-occupied | Renter-occupied |
| Less than $300 | 79 (27.0%) | 0 (0.0%) |
| $300 to $499 | 56 (19.1%) | 0 (0.0%) |
| $500 to $799 | 8 (2.7%) | 0 (0.0%) |
| $800 to $999 | 10 (3.4%) | 0 (0.0%) |
| $1,000 to $1,499 | 22 (7.5%) | 0 (0.0%) |
| $1,500 to $1,999 | 19 (6.5%) | 0 (0.0%) |
| $2,000 to $2,499 | 61 (20.8%) | 0 (0.0%) |
| $2,500 to $2,999 | 38 (13.0%) | 0 (0.0%) |
| $3,000 or more | 0 (0.0%) | 0 (0.0%) |
| Total | 293 (100.0%) | 0 (0.0%) |
Physical Housing Characteristics in Carnuel
Housing Structures in Carnuel
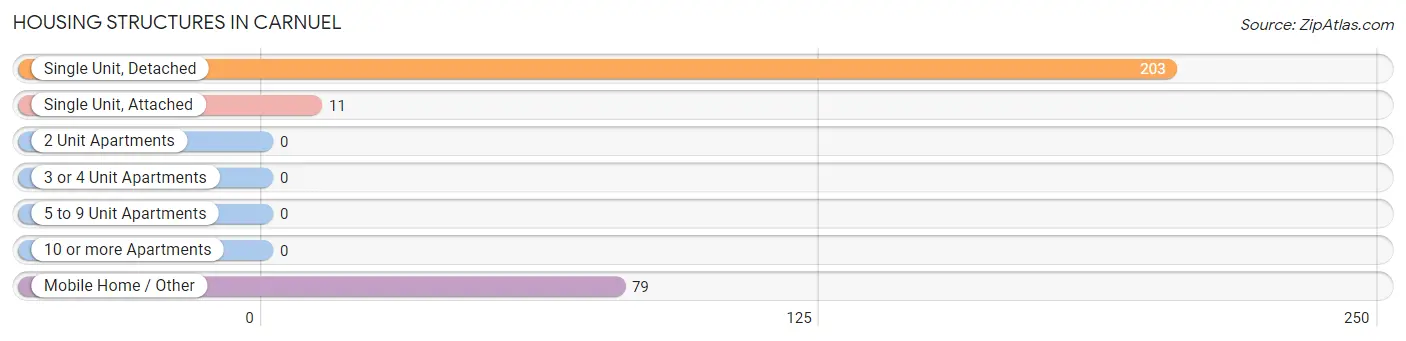
| Structure Type | # Housing Units | % Housing Units |
| Single Unit, Detached | 203 | 69.3% |
| Single Unit, Attached | 11 | 3.7% |
| 2 Unit Apartments | 0 | 0.0% |
| 3 or 4 Unit Apartments | 0 | 0.0% |
| 5 to 9 Unit Apartments | 0 | 0.0% |
| 10 or more Apartments | 0 | 0.0% |
| Mobile Home / Other | 79 | 27.0% |
| Total | 293 | 100.0% |
Housing Structures by Occupancy in Carnuel
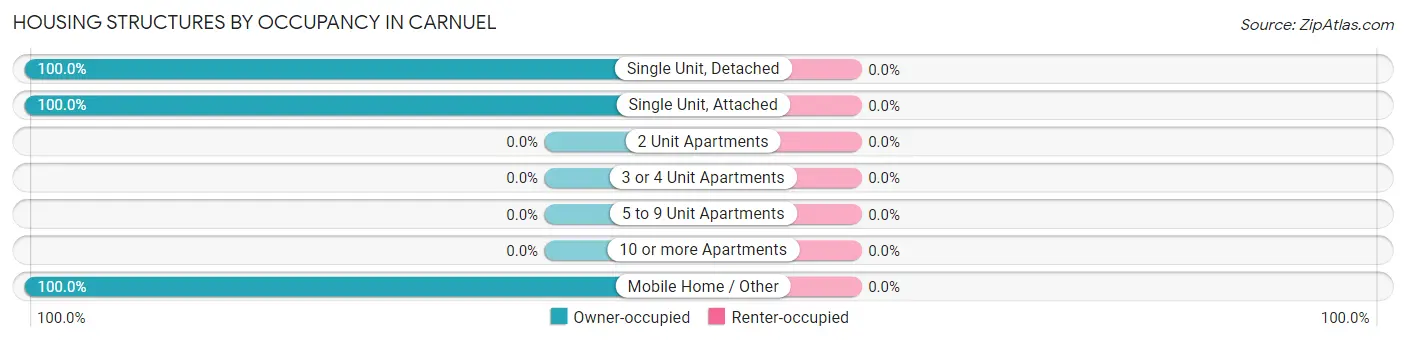
| Structure Type | Owner-occupied | Renter-occupied |
| Single Unit, Detached | 203 (100.0%) | 0 (0.0%) |
| Single Unit, Attached | 11 (100.0%) | 0 (0.0%) |
| 2 Unit Apartments | 0 (0.0%) | 0 (0.0%) |
| 3 or 4 Unit Apartments | 0 (0.0%) | 0 (0.0%) |
| 5 to 9 Unit Apartments | 0 (0.0%) | 0 (0.0%) |
| 10 or more Apartments | 0 (0.0%) | 0 (0.0%) |
| Mobile Home / Other | 79 (100.0%) | 0 (0.0%) |
| Total | 293 (100.0%) | 0 (0.0%) |
Housing Structures by Number of Rooms in Carnuel
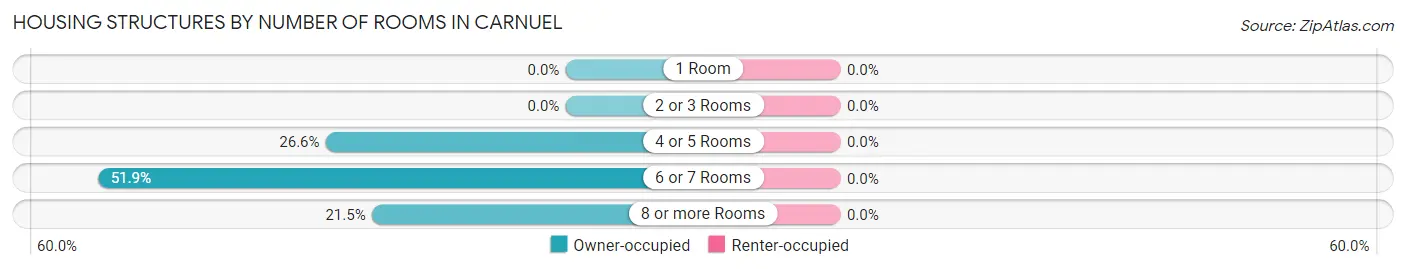
| Number of Rooms | Owner-occupied | Renter-occupied |
| 1 Room | 0 (0.0%) | 0 (0.0%) |
| 2 or 3 Rooms | 0 (0.0%) | 0 (0.0%) |
| 4 or 5 Rooms | 78 (26.6%) | 0 (0.0%) |
| 6 or 7 Rooms | 152 (51.9%) | 0 (0.0%) |
| 8 or more Rooms | 63 (21.5%) | 0 (0.0%) |
| Total | 293 (100.0%) | 0 (0.0%) |
Housing Structure by Heating Type in Carnuel
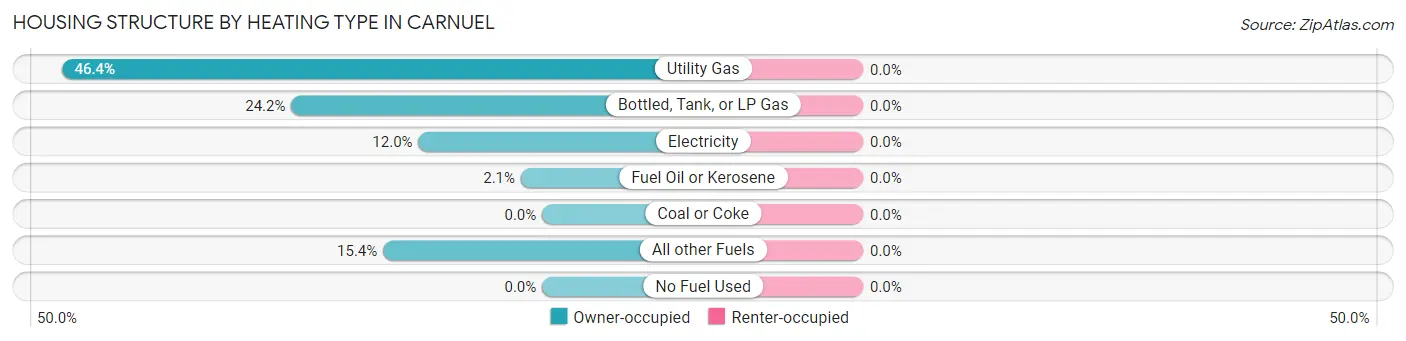
| Heating Type | Owner-occupied | Renter-occupied |
| Utility Gas | 136 (46.4%) | 0 (0.0%) |
| Bottled, Tank, or LP Gas | 71 (24.2%) | 0 (0.0%) |
| Electricity | 35 (11.9%) | 0 (0.0%) |
| Fuel Oil or Kerosene | 6 (2.1%) | 0 (0.0%) |
| Coal or Coke | 0 (0.0%) | 0 (0.0%) |
| All other Fuels | 45 (15.4%) | 0 (0.0%) |
| No Fuel Used | 0 (0.0%) | 0 (0.0%) |
| Total | 293 (100.0%) | 0 (0.0%) |
Household Vehicle Usage in Carnuel
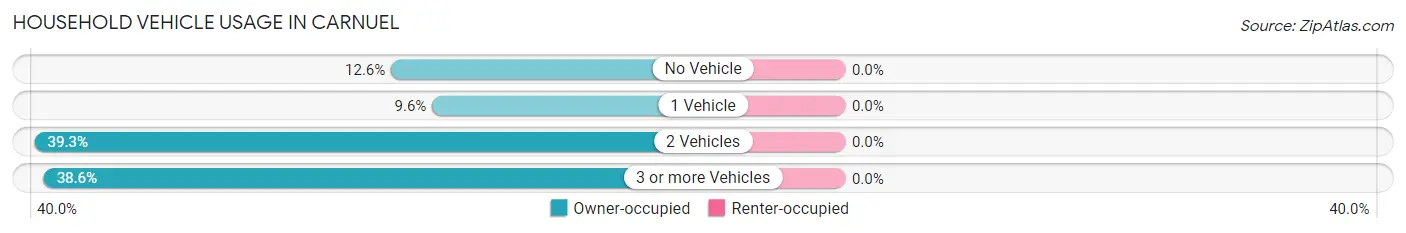
| Vehicles per Household | Owner-occupied | Renter-occupied |
| No Vehicle | 37 (12.6%) | 0 (0.0%) |
| 1 Vehicle | 28 (9.6%) | 0 (0.0%) |
| 2 Vehicles | 115 (39.3%) | 0 (0.0%) |
| 3 or more Vehicles | 113 (38.6%) | 0 (0.0%) |
| Total | 293 (100.0%) | 0 (0.0%) |
Real Estate & Mortgages in Carnuel
Real Estate and Mortgage Overview in Carnuel
| Characteristic | Without Mortgage | With Mortgage |
| Housing Units | 147 | 146 |
| Median Property Value | - | - |
| Median Household Income | $27,163 | $60 |
| Monthly Housing Costs | $291 | $0 |
| Real Estate Taxes | $1,071 | $0 |
Property Value by Mortgage Status in Carnuel
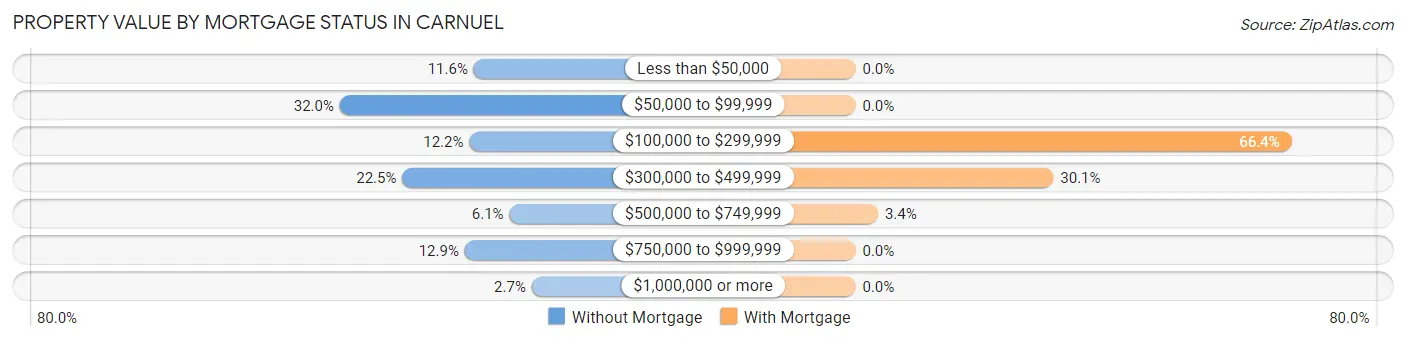
| Property Value | Without Mortgage | With Mortgage |
| Less than $50,000 | 17 (11.6%) | 0 (0.0%) |
| $50,000 to $99,999 | 47 (32.0%) | 0 (0.0%) |
| $100,000 to $299,999 | 18 (12.2%) | 97 (66.4%) |
| $300,000 to $499,999 | 33 (22.5%) | 44 (30.1%) |
| $500,000 to $749,999 | 9 (6.1%) | 5 (3.4%) |
| $750,000 to $999,999 | 19 (12.9%) | 0 (0.0%) |
| $1,000,000 or more | 4 (2.7%) | 0 (0.0%) |
| Total | 147 (100.0%) | 146 (100.0%) |
Household Income by Mortgage Status in Carnuel
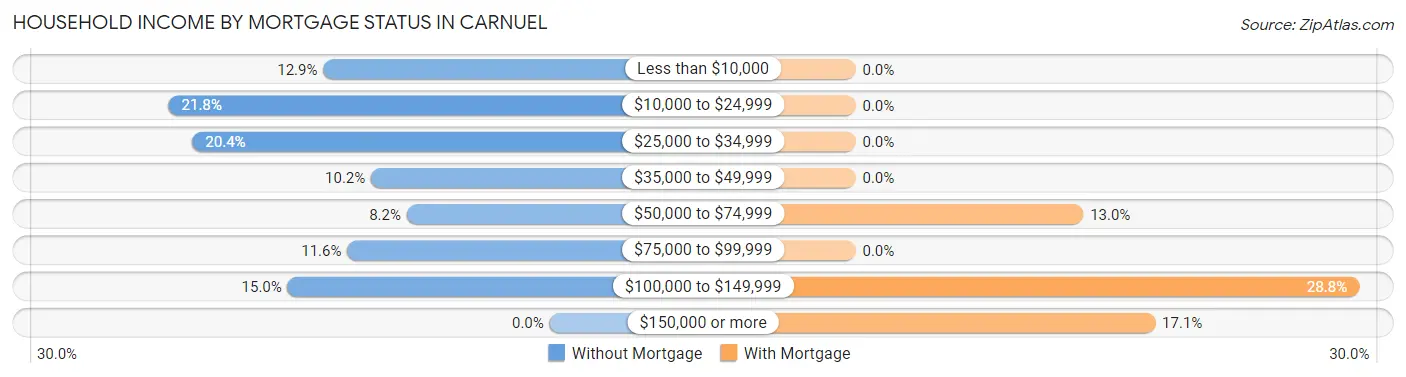
| Household Income | Without Mortgage | With Mortgage |
| Less than $10,000 | 19 (12.9%) | 0 (0.0%) |
| $10,000 to $24,999 | 32 (21.8%) | 0 (0.0%) |
| $25,000 to $34,999 | 30 (20.4%) | 0 (0.0%) |
| $35,000 to $49,999 | 15 (10.2%) | 0 (0.0%) |
| $50,000 to $74,999 | 12 (8.2%) | 19 (13.0%) |
| $75,000 to $99,999 | 17 (11.6%) | 0 (0.0%) |
| $100,000 to $149,999 | 22 (15.0%) | 42 (28.8%) |
| $150,000 or more | 0 (0.0%) | 25 (17.1%) |
| Total | 147 (100.0%) | 146 (100.0%) |
Property Value to Household Income Ratio in Carnuel
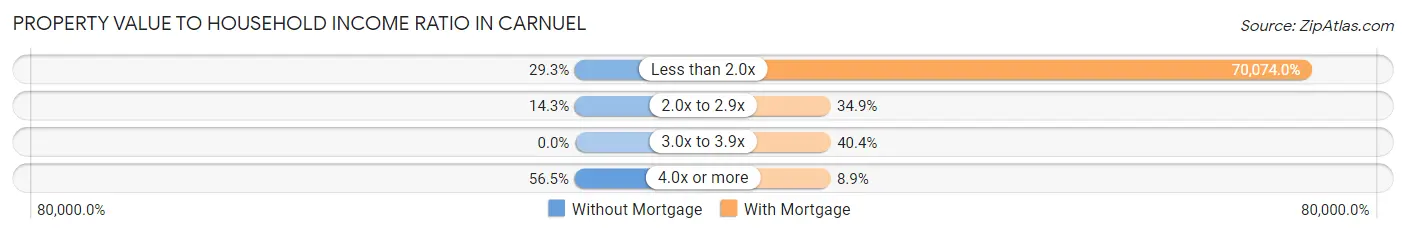
| Value-to-Income Ratio | Without Mortgage | With Mortgage |
| Less than 2.0x | 43 (29.2%) | 102,308 (70,074.0%) |
| 2.0x to 2.9x | 21 (14.3%) | 51 (34.9%) |
| 3.0x to 3.9x | 0 (0.0%) | 59 (40.4%) |
| 4.0x or more | 83 (56.5%) | 13 (8.9%) |
| Total | 147 (100.0%) | 146 (100.0%) |
Real Estate Taxes by Mortgage Status in Carnuel
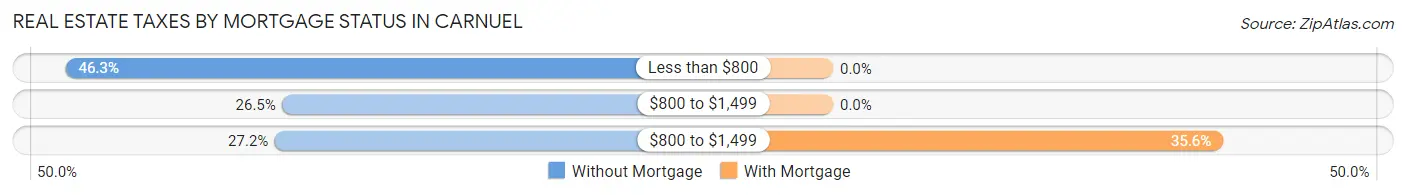
| Property Taxes | Without Mortgage | With Mortgage |
| Less than $800 | 68 (46.3%) | 0 (0.0%) |
| $800 to $1,499 | 39 (26.5%) | 0 (0.0%) |
| $800 to $1,499 | 40 (27.2%) | 52 (35.6%) |
| Total | 147 (100.0%) | 146 (100.0%) |
Health & Disability in Carnuel
Health Insurance Coverage by Age in Carnuel
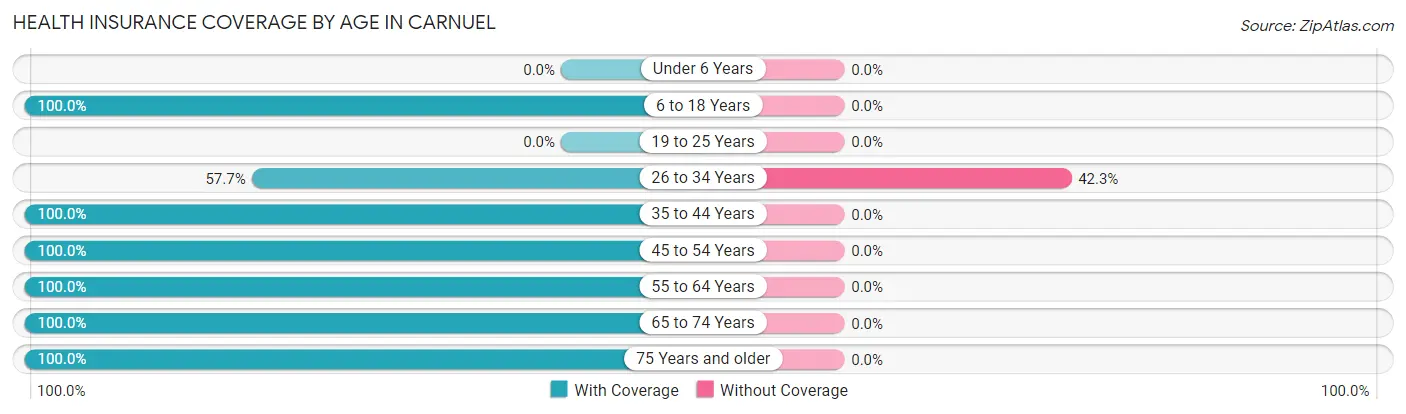
| Age Bracket | With Coverage | Without Coverage |
| Under 6 Years | 0 (0.0%) | 0 (0.0%) |
| 6 to 18 Years | 39 (100.0%) | 0 (0.0%) |
| 19 to 25 Years | 0 (0.0%) | 0 (0.0%) |
| 26 to 34 Years | 45 (57.7%) | 33 (42.3%) |
| 35 to 44 Years | 26 (100.0%) | 0 (0.0%) |
| 45 to 54 Years | 62 (100.0%) | 0 (0.0%) |
| 55 to 64 Years | 159 (100.0%) | 0 (0.0%) |
| 65 to 74 Years | 159 (100.0%) | 0 (0.0%) |
| 75 Years and older | 103 (100.0%) | 0 (0.0%) |
| Total | 593 (94.7%) | 33 (5.3%) |
Health Insurance Coverage by Citizenship Status in Carnuel
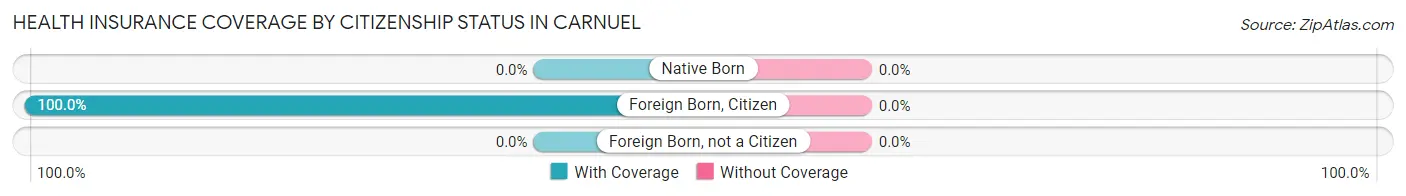
| Citizenship Status | With Coverage | Without Coverage |
| Native Born | 0 (0.0%) | 0 (0.0%) |
| Foreign Born, Citizen | 39 (100.0%) | 0 (0.0%) |
| Foreign Born, not a Citizen | 0 (0.0%) | 0 (0.0%) |
Health Insurance Coverage by Household Income in Carnuel
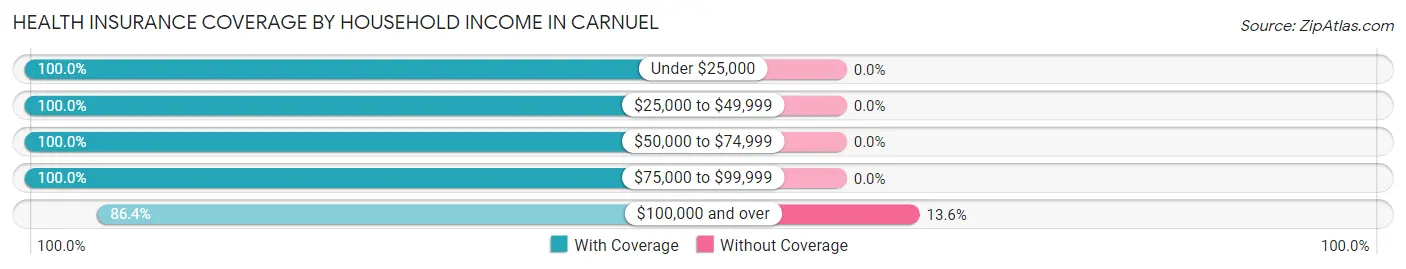
| Household Income | With Coverage | Without Coverage |
| Under $25,000 | 59 (100.0%) | 0 (0.0%) |
| $25,000 to $49,999 | 149 (100.0%) | 0 (0.0%) |
| $50,000 to $74,999 | 19 (100.0%) | 0 (0.0%) |
| $75,000 to $99,999 | 157 (100.0%) | 0 (0.0%) |
| $100,000 and over | 209 (86.4%) | 33 (13.6%) |
Public vs Private Health Insurance Coverage by Age in Carnuel
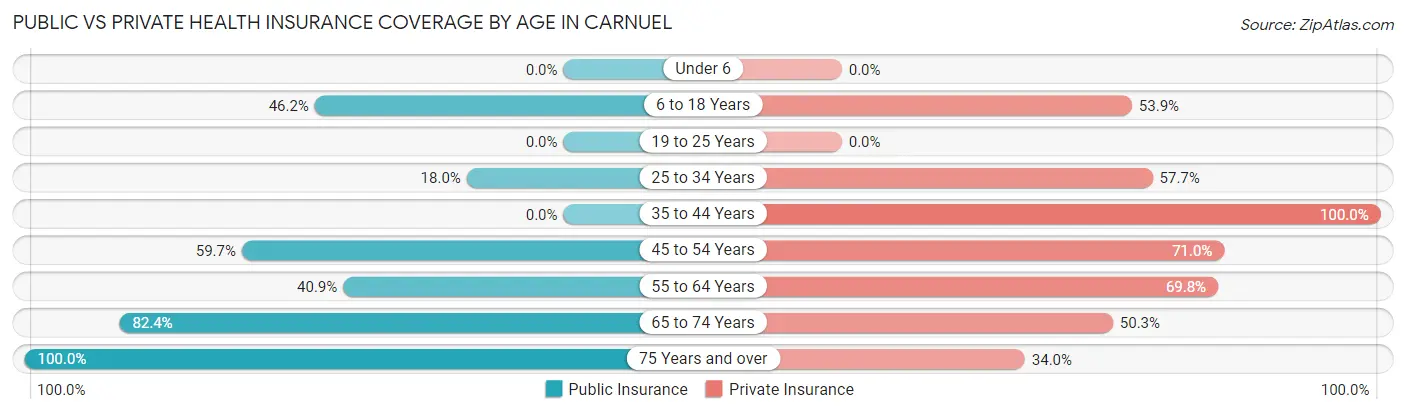
| Age Bracket | Public Insurance | Private Insurance |
| Under 6 | 0 (0.0%) | 0 (0.0%) |
| 6 to 18 Years | 18 (46.2%) | 21 (53.8%) |
| 19 to 25 Years | 0 (0.0%) | 0 (0.0%) |
| 25 to 34 Years | 14 (17.9%) | 45 (57.7%) |
| 35 to 44 Years | 0 (0.0%) | 26 (100.0%) |
| 45 to 54 Years | 37 (59.7%) | 44 (71.0%) |
| 55 to 64 Years | 65 (40.9%) | 111 (69.8%) |
| 65 to 74 Years | 131 (82.4%) | 80 (50.3%) |
| 75 Years and over | 103 (100.0%) | 35 (34.0%) |
| Total | 368 (58.8%) | 362 (57.8%) |
Disability Status by Sex by Age in Carnuel
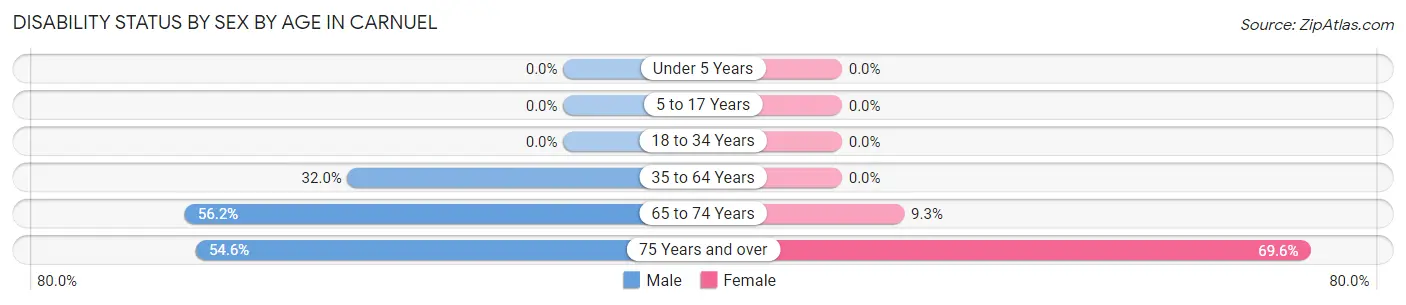
| Age Bracket | Male | Female |
| Under 5 Years | 0 (0.0%) | 0 (0.0%) |
| 5 to 17 Years | 0 (0.0%) | 0 (0.0%) |
| 18 to 34 Years | 0 (0.0%) | 0 (0.0%) |
| 35 to 64 Years | 41 (32.0%) | 0 (0.0%) |
| 65 to 74 Years | 59 (56.2%) | 5 (9.3%) |
| 75 Years and over | 6 (54.5%) | 64 (69.6%) |
Disability Class by Sex by Age in Carnuel
Disability Class: Hearing Difficulty
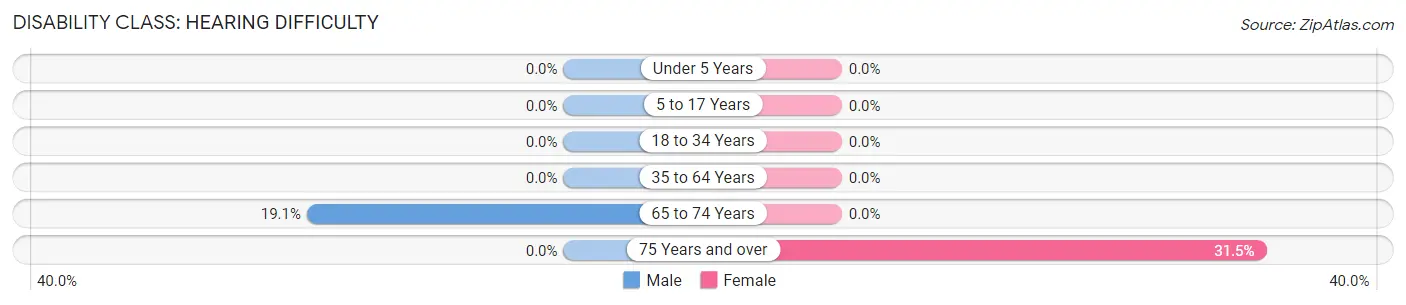
| Age Bracket | Male | Female |
| Under 5 Years | 0 (0.0%) | 0 (0.0%) |
| 5 to 17 Years | 0 (0.0%) | 0 (0.0%) |
| 18 to 34 Years | 0 (0.0%) | 0 (0.0%) |
| 35 to 64 Years | 0 (0.0%) | 0 (0.0%) |
| 65 to 74 Years | 20 (19.1%) | 0 (0.0%) |
| 75 Years and over | 0 (0.0%) | 29 (31.5%) |
Disability Class: Vision Difficulty
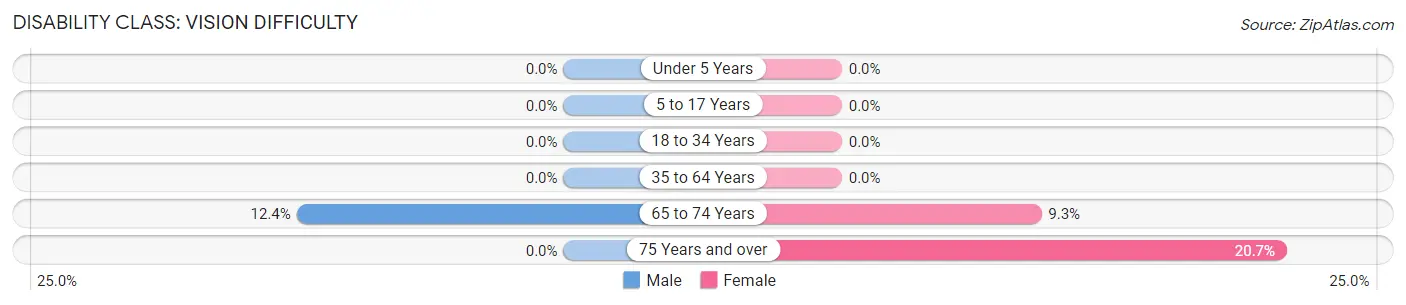
| Age Bracket | Male | Female |
| Under 5 Years | 0 (0.0%) | 0 (0.0%) |
| 5 to 17 Years | 0 (0.0%) | 0 (0.0%) |
| 18 to 34 Years | 0 (0.0%) | 0 (0.0%) |
| 35 to 64 Years | 0 (0.0%) | 0 (0.0%) |
| 65 to 74 Years | 13 (12.4%) | 5 (9.3%) |
| 75 Years and over | 0 (0.0%) | 19 (20.6%) |
Disability Class: Cognitive Difficulty
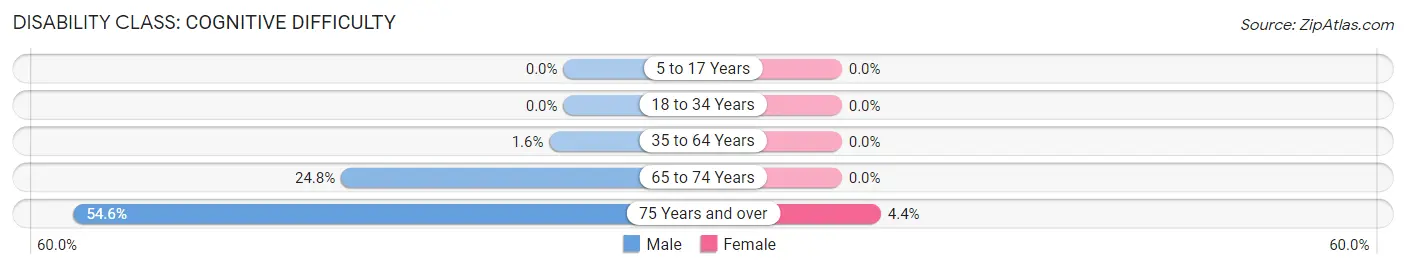
| Age Bracket | Male | Female |
| 5 to 17 Years | 0 (0.0%) | 0 (0.0%) |
| 18 to 34 Years | 0 (0.0%) | 0 (0.0%) |
| 35 to 64 Years | 2 (1.6%) | 0 (0.0%) |
| 65 to 74 Years | 26 (24.8%) | 0 (0.0%) |
| 75 Years and over | 6 (54.5%) | 4 (4.3%) |
Disability Class: Ambulatory Difficulty
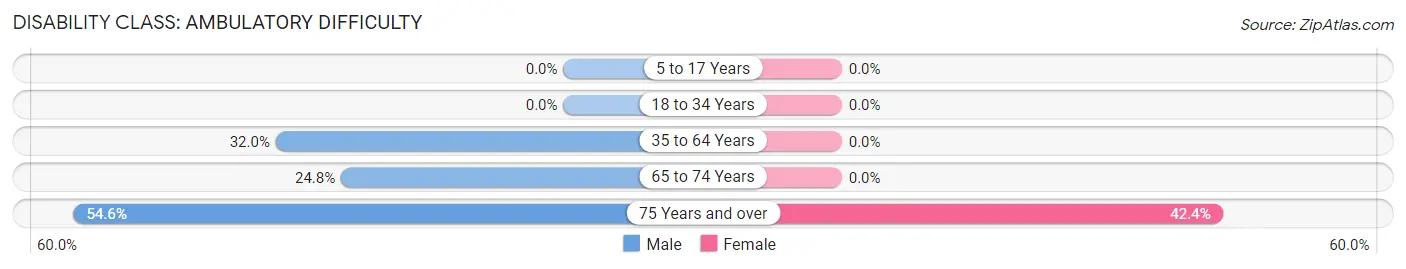
| Age Bracket | Male | Female |
| 5 to 17 Years | 0 (0.0%) | 0 (0.0%) |
| 18 to 34 Years | 0 (0.0%) | 0 (0.0%) |
| 35 to 64 Years | 41 (32.0%) | 0 (0.0%) |
| 65 to 74 Years | 26 (24.8%) | 0 (0.0%) |
| 75 Years and over | 6 (54.5%) | 39 (42.4%) |
Disability Class: Self-Care Difficulty
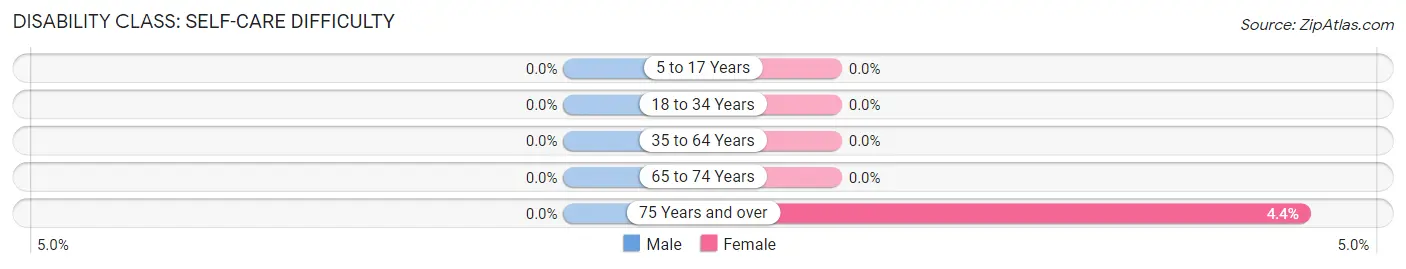
| Age Bracket | Male | Female |
| 5 to 17 Years | 0 (0.0%) | 0 (0.0%) |
| 18 to 34 Years | 0 (0.0%) | 0 (0.0%) |
| 35 to 64 Years | 0 (0.0%) | 0 (0.0%) |
| 65 to 74 Years | 0 (0.0%) | 0 (0.0%) |
| 75 Years and over | 0 (0.0%) | 4 (4.3%) |
Technology Access in Carnuel
Computing Device Access in Carnuel
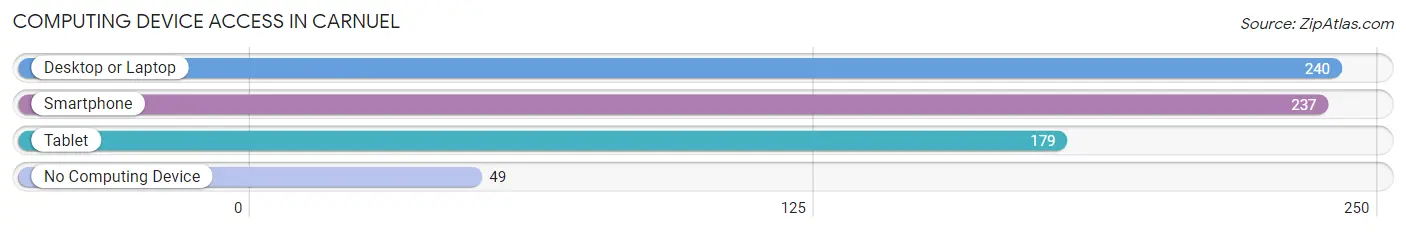
| Device Type | # Households | % Households |
| Desktop or Laptop | 240 | 81.9% |
| Smartphone | 237 | 80.9% |
| Tablet | 179 | 61.1% |
| No Computing Device | 49 | 16.7% |
| Total | 293 | 100.0% |
Internet Access in Carnuel
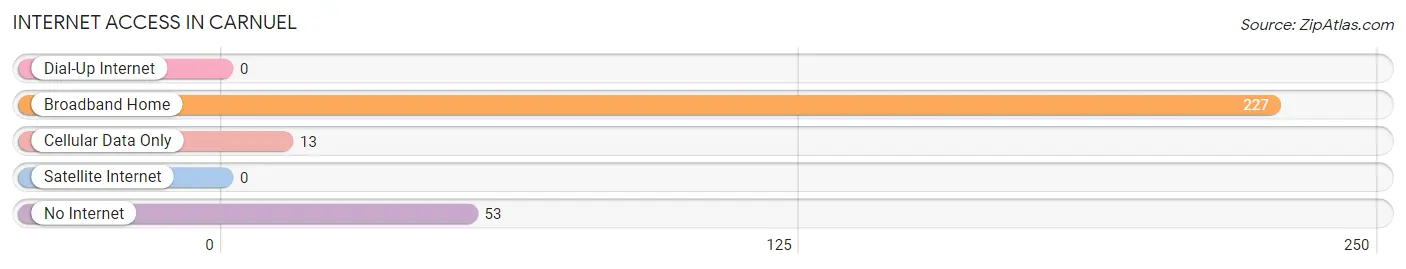
| Internet Type | # Households | % Households |
| Dial-Up Internet | 0 | 0.0% |
| Broadband Home | 227 | 77.5% |
| Cellular Data Only | 13 | 4.4% |
| Satellite Internet | 0 | 0.0% |
| No Internet | 53 | 18.1% |
| Total | 293 | 100.0% |
Carnuel Summary
Carnuel is a small unincorporated community located in Bernalillo County, New Mexico. It is situated in the foothills of the Sandia Mountains, just east of Albuquerque. The community is home to a diverse population of Native Americans, Hispanics, and Anglos.
History
Carnuel was originally inhabited by the Pueblo Indians, who lived in the area for centuries before the arrival of the Spanish in the 16th century. The Spanish established a mission in the area in 1680, and the community was known as San Antonio de Carnuel. The mission was abandoned in 1706, but the community remained.
In the late 19th century, the area was settled by Anglo-Americans, who established a small farming community. The community was named after a local rancher, John Carnuel. The town was incorporated in 1912, and the population grew steadily over the next few decades.
Geography
Carnuel is located in the foothills of the Sandia Mountains, just east of Albuquerque. The area is characterized by rolling hills and mesas, with elevations ranging from 5,000 to 6,000 feet. The climate is semi-arid, with hot summers and cold winters.
Economy
Carnuel’s economy is largely based on agriculture and ranching. The area is home to several small farms and ranches, which produce a variety of crops and livestock. The community also has a small manufacturing sector, which produces a variety of products, including furniture, clothing, and electronics.
Demographics
As of the 2010 census, the population of Carnuel was 1,845. The racial makeup of the community was 57.3% Hispanic, 33.2% Native American, and 9.5% Anglo. The median household income was $35,000, and the median home value was $150,000.
Carnuel is a small, diverse community with a rich history and culture. The area is home to a variety of cultures and backgrounds, and the economy is largely based on agriculture and ranching. The community is a great place to live and work, and offers a unique blend of rural and urban life.
Common Questions
What is Per Capita Income in Carnuel?
Per Capita income in Carnuel is $43,834.
What is the Median Family Income in Carnuel?
Median Family Income in Carnuel is $94,875.
What is the Median Household income in Carnuel?
Median Household Income in Carnuel is $86,681.
What is Inequality or Gini Index in Carnuel?
Inequality or Gini Index in Carnuel is 0.43.
What is the Total Population of Carnuel?
Total Population of Carnuel is 626.
What is the Total Male Population of Carnuel?
Total Male Population of Carnuel is 332.
What is the Total Female Population of Carnuel?
Total Female Population of Carnuel is 294.
What is the Ratio of Males per 100 Females in Carnuel?
There are 112.93 Males per 100 Females in Carnuel.
What is the Ratio of Females per 100 Males in Carnuel?
There are 88.55 Females per 100 Males in Carnuel.
What is the Median Population Age in Carnuel?
Median Population Age in Carnuel is 63.3 Years.
What is the Average Family Size in Carnuel
Average Family Size in Carnuel is 2.4 People.
What is the Average Household Size in Carnuel
Average Household Size in Carnuel is 2.1 People.
How Large is the Labor Force in Carnuel?
There are 229 People in the Labor Forcein in Carnuel.
What is the Percentage of People in the Labor Force in Carnuel?
39.0% of People are in the Labor Force in Carnuel.