Pena Blanca, NM Map & Demographics
Pena Blanca Overview
$28,415
PER CAPITA INCOME
$86,211
AVG FAMILY INCOME
$65,104
AVG HOUSEHOLD INCOME
42.6%
WAGE / INCOME GAP [ % ]
57.4¢/ $1
WAGE / INCOME GAP [ $ ]
0.40
INEQUALITY / GINI INDEX
688
TOTAL POPULATION
409
MALE POPULATION
279
FEMALE POPULATION
146.59
MALES / 100 FEMALES
68.22
FEMALES / 100 MALES
42.4
MEDIAN AGE
3.1
AVG FAMILY SIZE
2.4
AVG HOUSEHOLD SIZE
398
LABOR FORCE [ PEOPLE ]
71.1%
PERCENT IN LABOR FORCE
5.6%
UNEMPLOYMENT RATE
Pena Blanca Zip Codes
Pena Blanca Area Codes
Income in Pena Blanca
Income Overview in Pena Blanca
Per Capita Income in Pena Blanca is $28,415, while median incomes of families and households are $86,211 and $65,104 respectively.
| Characteristic | Number | Measure |
| Per Capita Income | 688 | $28,415 |
| Median Family Income | 175 | $86,211 |
| Mean Family Income | 175 | $87,605 |
| Median Household Income | 285 | $65,104 |
| Mean Household Income | 285 | $66,791 |
| Income Deficit | 175 | $0 |
| Wage / Income Gap (%) | 688 | 42.56% |
| Wage / Income Gap ($) | 688 | 57.44¢ per $1 |
| Gini / Inequality Index | 688 | 0.40 |
Earnings by Sex in Pena Blanca
Average Earnings in Pena Blanca are $40,000, $51,982 for men and $29,861 for women, a difference of 42.6%.
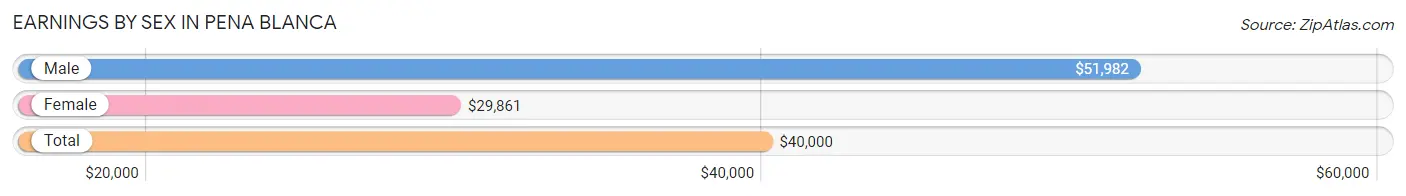
| Sex | Number | Average Earnings |
| Male | 217 (53.7%) | $51,982 |
| Female | 187 (46.3%) | $29,861 |
| Total | 404 (100.0%) | $40,000 |
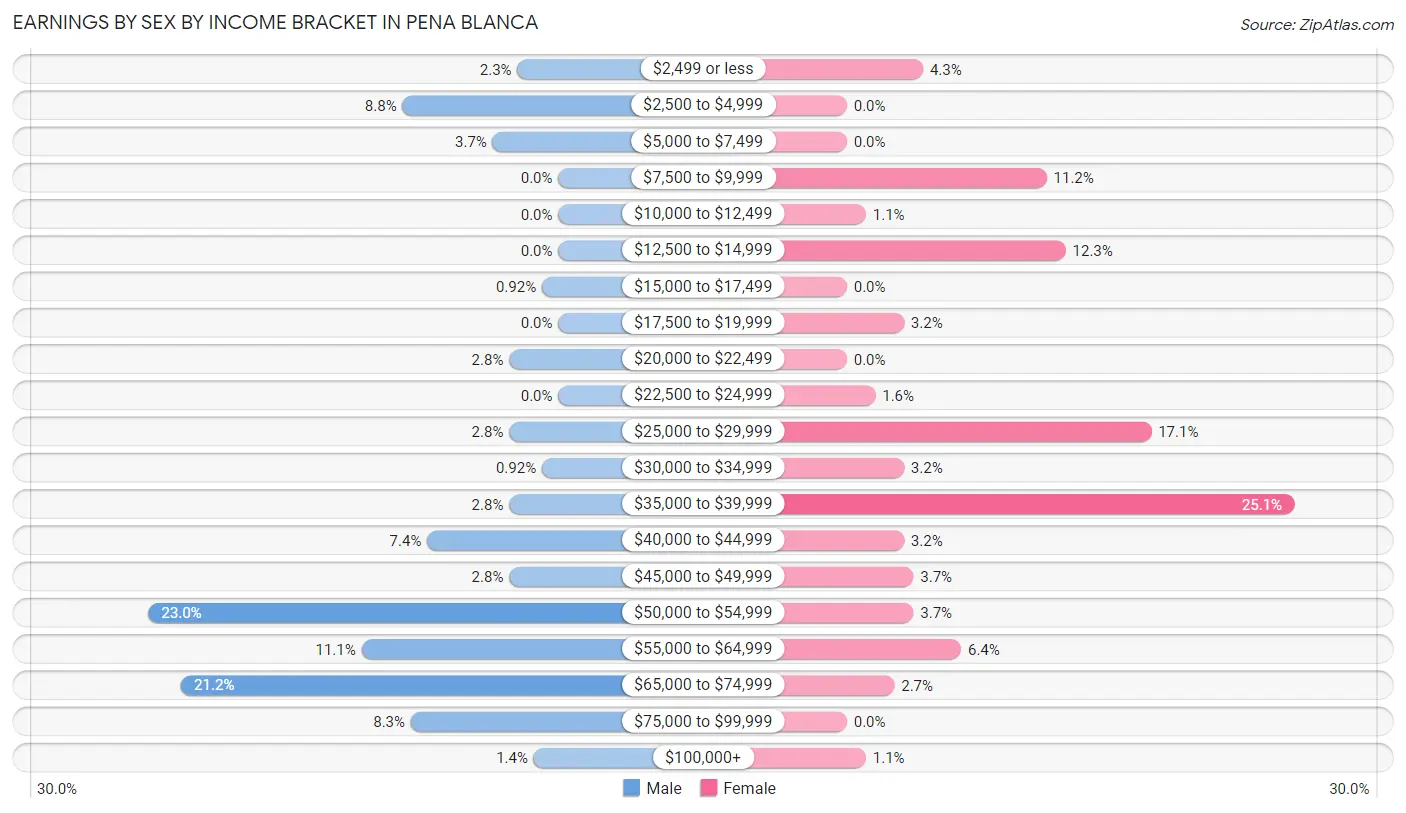
Earnings by Sex by Income Bracket in Pena Blanca
The most common earnings brackets in Pena Blanca are $50,000 to $54,999 for men (50 | 23.0%) and $35,000 to $39,999 for women (47 | 25.1%).
| Income | Male | Female |
| $2,499 or less | 5 (2.3%) | 8 (4.3%) |
| $2,500 to $4,999 | 19 (8.8%) | 0 (0.0%) |
| $5,000 to $7,499 | 8 (3.7%) | 0 (0.0%) |
| $7,500 to $9,999 | 0 (0.0%) | 21 (11.2%) |
| $10,000 to $12,499 | 0 (0.0%) | 2 (1.1%) |
| $12,500 to $14,999 | 0 (0.0%) | 23 (12.3%) |
| $15,000 to $17,499 | 2 (0.9%) | 0 (0.0%) |
| $17,500 to $19,999 | 0 (0.0%) | 6 (3.2%) |
| $20,000 to $22,499 | 6 (2.8%) | 0 (0.0%) |
| $22,500 to $24,999 | 0 (0.0%) | 3 (1.6%) |
| $25,000 to $29,999 | 6 (2.8%) | 32 (17.1%) |
| $30,000 to $34,999 | 2 (0.9%) | 6 (3.2%) |
| $35,000 to $39,999 | 6 (2.8%) | 47 (25.1%) |
| $40,000 to $44,999 | 16 (7.4%) | 6 (3.2%) |
| $45,000 to $49,999 | 6 (2.8%) | 7 (3.7%) |
| $50,000 to $54,999 | 50 (23.0%) | 7 (3.7%) |
| $55,000 to $64,999 | 24 (11.1%) | 12 (6.4%) |
| $65,000 to $74,999 | 46 (21.2%) | 5 (2.7%) |
| $75,000 to $99,999 | 18 (8.3%) | 0 (0.0%) |
| $100,000+ | 3 (1.4%) | 2 (1.1%) |
| Total | 217 (100.0%) | 187 (100.0%) |
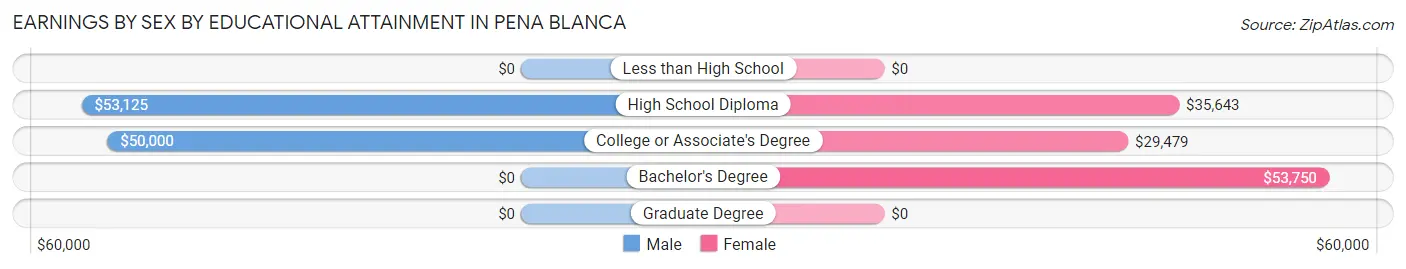
Earnings by Sex by Educational Attainment in Pena Blanca
Average earnings in Pena Blanca are $52,639 for men and $35,464 for women, a difference of 32.6%. Men with an educational attainment of high school diploma enjoy the highest average annual earnings of $53,125, while those with college or associate's degree education earn the least with $50,000. Women with an educational attainment of bachelor's degree earn the most with the average annual earnings of $53,750, while those with college or associate's degree education have the smallest earnings of $29,479.
| Educational Attainment | Male Income | Female Income |
| Less than High School | - | - |
| High School Diploma | $53,125 | $35,643 |
| College or Associate's Degree | $50,000 | $29,479 |
| Bachelor's Degree | - | - |
| Graduate Degree | - | - |
| Total | $52,639 | $35,464 |
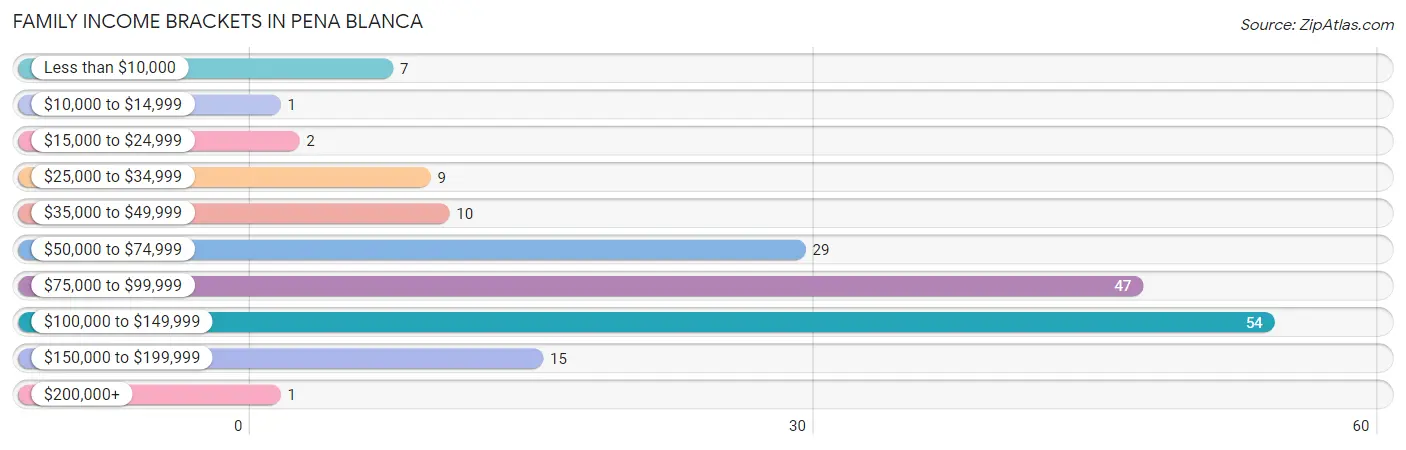
Family Income in Pena Blanca
Family Income Brackets in Pena Blanca
According to the Pena Blanca family income data, there are 54 families falling into the $100,000 to $149,999 income range, which is the most common income bracket and makes up 30.9% of all families. Conversely, the $10,000 to $14,999 income bracket is the least frequent group with only 1 families (0.6%) belonging to this category.
| Income Bracket | # Families | % Families |
| Less than $10,000 | 7 | 4.0% |
| $10,000 to $14,999 | 1 | 0.6% |
| $15,000 to $24,999 | 2 | 1.1% |
| $25,000 to $34,999 | 9 | 5.1% |
| $35,000 to $49,999 | 10 | 5.7% |
| $50,000 to $74,999 | 29 | 16.6% |
| $75,000 to $99,999 | 47 | 26.9% |
| $100,000 to $149,999 | 54 | 30.9% |
| $150,000 to $199,999 | 15 | 8.6% |
| $200,000+ | 1 | 0.6% |
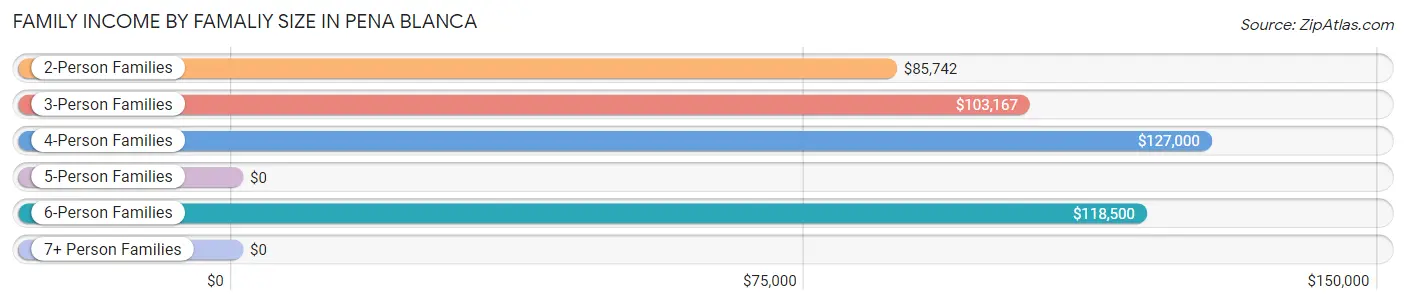
Family Income by Famaliy Size in Pena Blanca
4-person families (12 | 6.9%) account for the highest median family income in Pena Blanca with $127,000 per family, while 2-person families (67 | 38.3%) have the highest median income of $42,871 per family member.
| Income Bracket | # Families | Median Income |
| 2-Person Families | 67 (38.3%) | $85,742 |
| 3-Person Families | 62 (35.4%) | $103,167 |
| 4-Person Families | 12 (6.9%) | $127,000 |
| 5-Person Families | 18 (10.3%) | $0 |
| 6-Person Families | 16 (9.1%) | $118,500 |
| 7+ Person Families | 0 (0.0%) | $0 |
| Total | 175 (100.0%) | $86,211 |
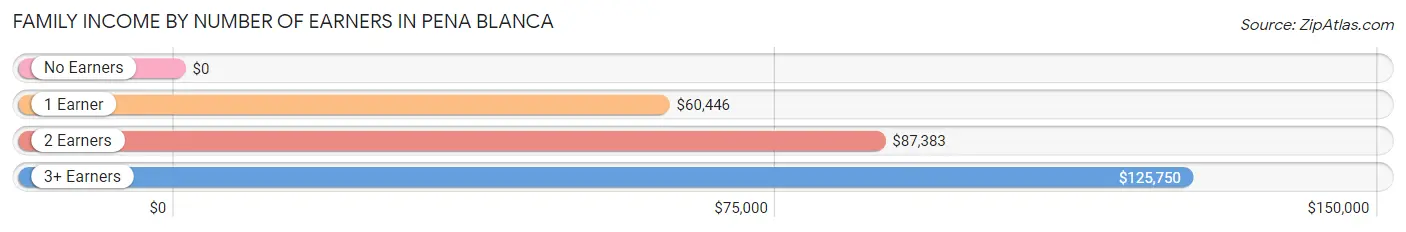
Family Income by Number of Earners in Pena Blanca
| Number of Earners | # Families | Median Income |
| No Earners | 10 (5.7%) | $0 |
| 1 Earner | 55 (31.4%) | $60,446 |
| 2 Earners | 83 (47.4%) | $87,383 |
| 3+ Earners | 27 (15.4%) | $125,750 |
| Total | 175 (100.0%) | $86,211 |
Household Income in Pena Blanca
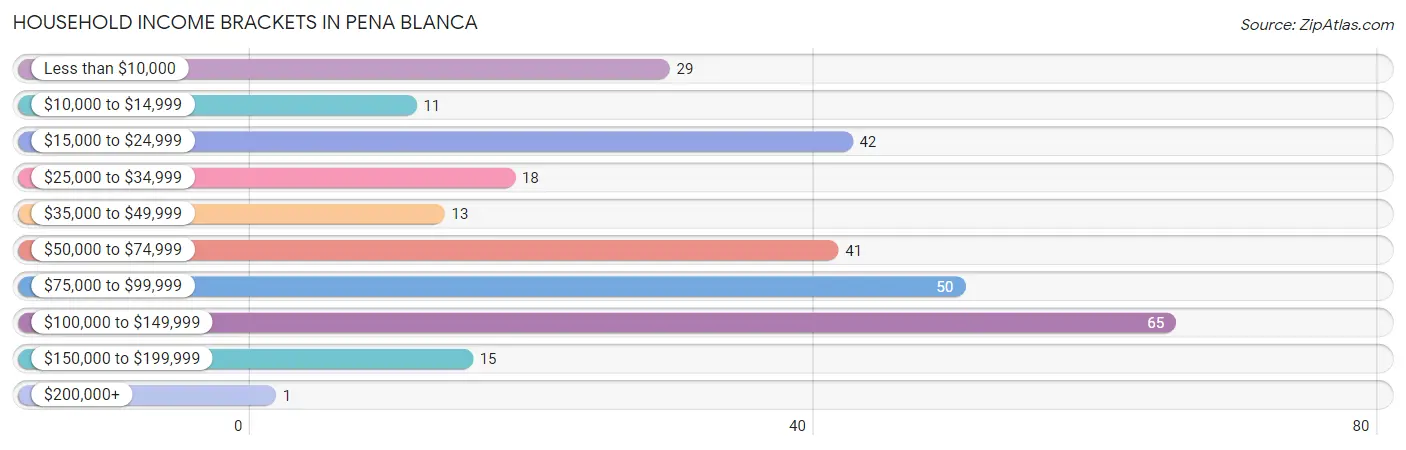
Household Income Brackets in Pena Blanca
With 65 households falling in the category, the $100,000 to $149,999 income range is the most frequent in Pena Blanca, accounting for 22.8% of all households. In contrast, only 1 households (0.4%) fall into the $200,000+ income bracket, making it the least populous group.
| Income Bracket | # Households | % Households |
| Less than $10,000 | 29 | 10.2% |
| $10,000 to $14,999 | 11 | 3.9% |
| $15,000 to $24,999 | 42 | 14.7% |
| $25,000 to $34,999 | 18 | 6.3% |
| $35,000 to $49,999 | 13 | 4.6% |
| $50,000 to $74,999 | 41 | 14.4% |
| $75,000 to $99,999 | 50 | 17.5% |
| $100,000 to $149,999 | 65 | 22.8% |
| $150,000 to $199,999 | 15 | 5.3% |
| $200,000+ | 1 | 0.4% |
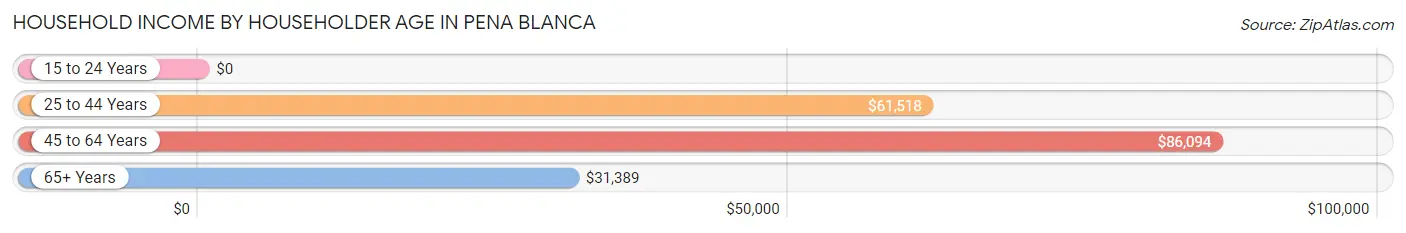
Household Income by Householder Age in Pena Blanca
The median household income in Pena Blanca is $65,104, with the highest median household income of $86,094 found in the 45 to 64 years age bracket for the primary householder. A total of 158 households (55.4%) fall into this category. Meanwhile, the 15 to 24 years age bracket for the primary householder has the lowest median household income of $0, with 18 households (6.3%) in this group.
| Income Bracket | # Households | Median Income |
| 15 to 24 Years | 18 (6.3%) | $0 |
| 25 to 44 Years | 53 (18.6%) | $61,518 |
| 45 to 64 Years | 158 (55.4%) | $86,094 |
| 65+ Years | 56 (19.7%) | $31,389 |
| Total | 285 (100.0%) | $65,104 |
Poverty in Pena Blanca
Income Below Poverty by Sex and Age in Pena Blanca
With 10.3% poverty level for males and 15.8% for females among the residents of Pena Blanca, under 5 year old males and 12 to 14 year old females are the most vulnerable to poverty, with 3 males (75.0%) and 5 females (71.4%) in their respective age groups living below the poverty level.
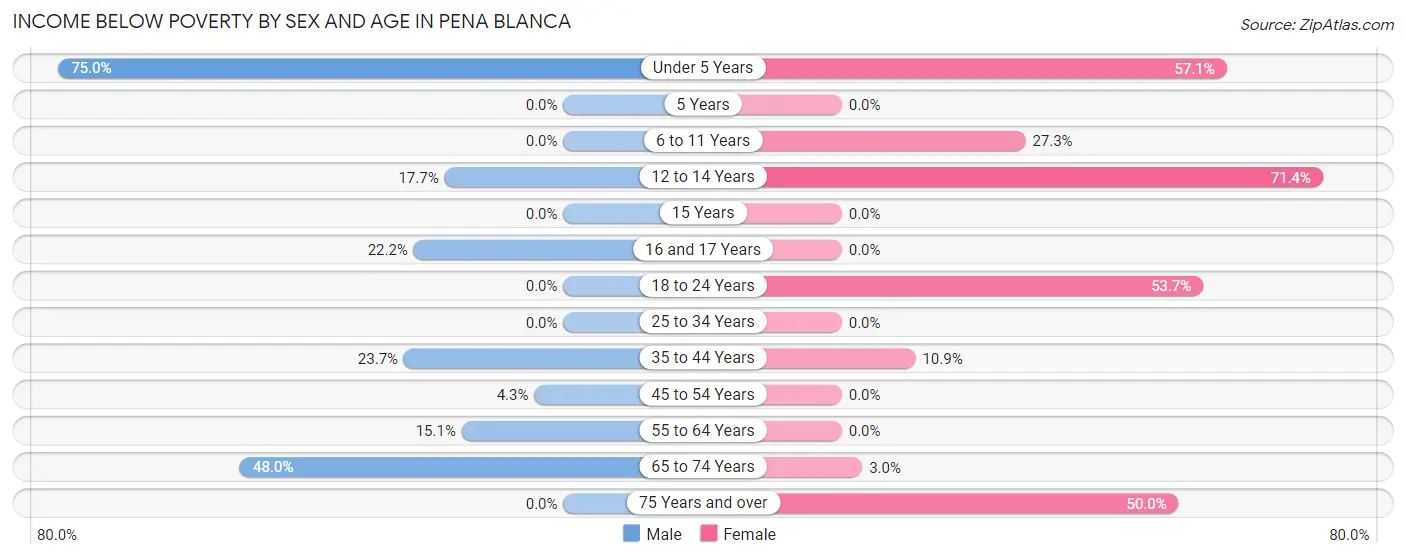
| Age Bracket | Male | Female |
| Under 5 Years | 3 (75.0%) | 4 (57.1%) |
| 5 Years | 0 (0.0%) | 0 (0.0%) |
| 6 to 11 Years | 0 (0.0%) | 3 (27.3%) |
| 12 to 14 Years | 3 (17.6%) | 5 (71.4%) |
| 15 Years | 0 (0.0%) | 0 (0.0%) |
| 16 and 17 Years | 2 (22.2%) | 0 (0.0%) |
| 18 to 24 Years | 0 (0.0%) | 22 (53.7%) |
| 25 to 34 Years | 0 (0.0%) | 0 (0.0%) |
| 35 to 44 Years | 9 (23.7%) | 7 (10.9%) |
| 45 to 54 Years | 5 (4.3%) | 0 (0.0%) |
| 55 to 64 Years | 8 (15.1%) | 0 (0.0%) |
| 65 to 74 Years | 12 (48.0%) | 1 (3.0%) |
| 75 Years and over | 0 (0.0%) | 2 (50.0%) |
| Total | 42 (10.3%) | 44 (15.8%) |
Income Above Poverty by Sex and Age in Pena Blanca
According to the poverty statistics in Pena Blanca, males aged 5 years and females aged 5 years are the age groups that are most secure financially, with 100.0% of males and 100.0% of females in these age groups living above the poverty line.
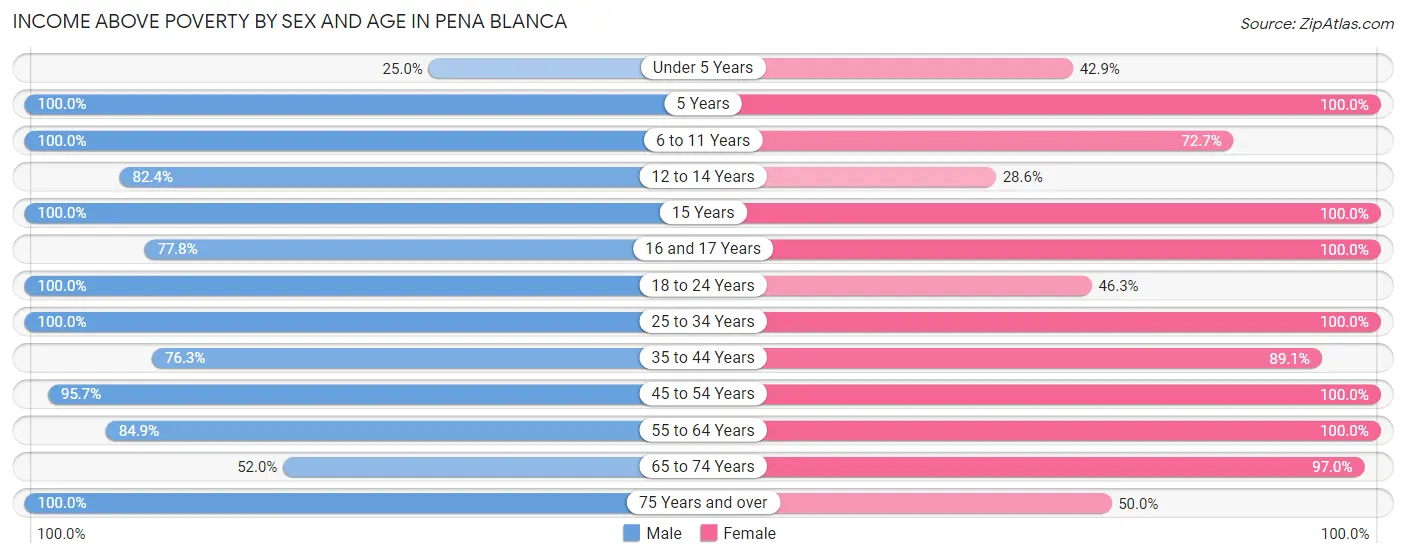
| Age Bracket | Male | Female |
| Under 5 Years | 1 (25.0%) | 3 (42.9%) |
| 5 Years | 6 (100.0%) | 3 (100.0%) |
| 6 to 11 Years | 33 (100.0%) | 8 (72.7%) |
| 12 to 14 Years | 14 (82.4%) | 2 (28.6%) |
| 15 Years | 29 (100.0%) | 11 (100.0%) |
| 16 and 17 Years | 7 (77.8%) | 4 (100.0%) |
| 18 to 24 Years | 32 (100.0%) | 19 (46.3%) |
| 25 to 34 Years | 30 (100.0%) | 16 (100.0%) |
| 35 to 44 Years | 29 (76.3%) | 57 (89.1%) |
| 45 to 54 Years | 111 (95.7%) | 35 (100.0%) |
| 55 to 64 Years | 45 (84.9%) | 43 (100.0%) |
| 65 to 74 Years | 13 (52.0%) | 32 (97.0%) |
| 75 Years and over | 17 (100.0%) | 2 (50.0%) |
| Total | 367 (89.7%) | 235 (84.2%) |
Income Below Poverty Among Married-Couple Families in Pena Blanca
The poverty statistics for married-couple families in Pena Blanca show that 2.1% or 3 of the total 140 families live below the poverty line. Families with 1 or 2 children have the highest poverty rate of 4.9%, comprising of 2 families. On the other hand, families with 3 or 4 children have the lowest poverty rate of 0.0%, which includes 0 families.
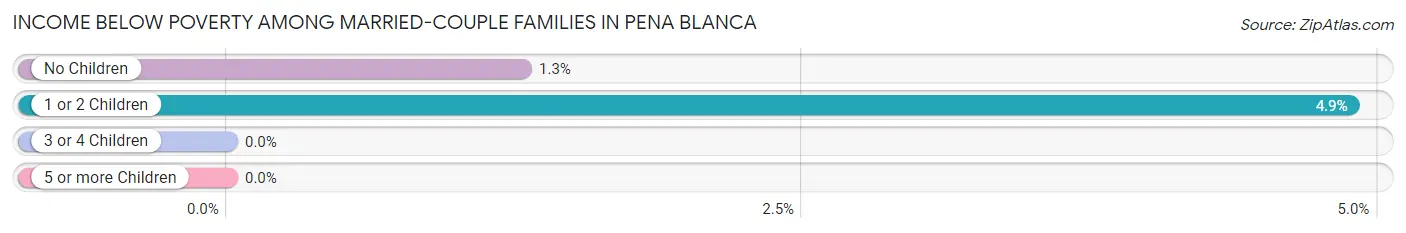
| Children | Above Poverty | Below Poverty |
| No Children | 77 (98.7%) | 1 (1.3%) |
| 1 or 2 Children | 39 (95.1%) | 2 (4.9%) |
| 3 or 4 Children | 21 (100.0%) | 0 (0.0%) |
| 5 or more Children | 0 (0.0%) | 0 (0.0%) |
| Total | 137 (97.9%) | 3 (2.1%) |
Income Below Poverty Among Single-Parent Households in Pena Blanca
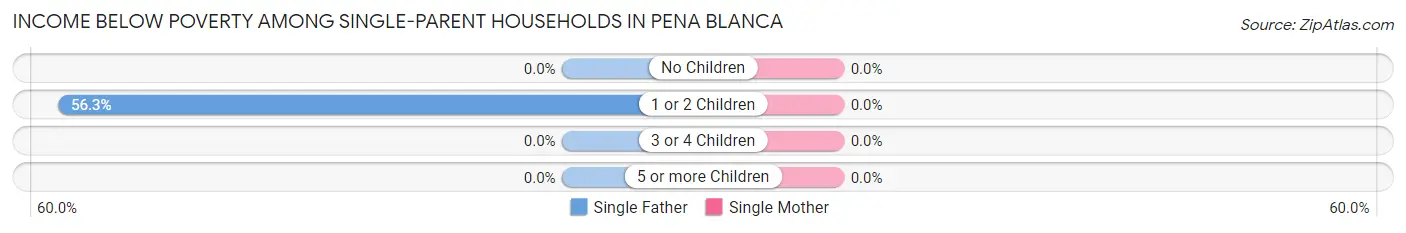
| Children | Single Father | Single Mother |
| No Children | 0 (0.0%) | 0 (0.0%) |
| 1 or 2 Children | 9 (56.2%) | 0 (0.0%) |
| 3 or 4 Children | 0 (0.0%) | 0 (0.0%) |
| 5 or more Children | 0 (0.0%) | 0 (0.0%) |
| Total | 9 (47.4%) | 0 (0.0%) |
Income Below Poverty Among Married-Couple vs Single-Parent Households in Pena Blanca
The poverty data for Pena Blanca shows that 3 of the married-couple family households (2.1%) and 9 of the single-parent households (25.7%) are living below the poverty level. Within the married-couple family households, those with 1 or 2 children have the highest poverty rate, with 2 households (4.9%) falling below the poverty line. Among the single-parent households, those with 1 or 2 children have the highest poverty rate, with 9 household (29.0%) living below poverty.
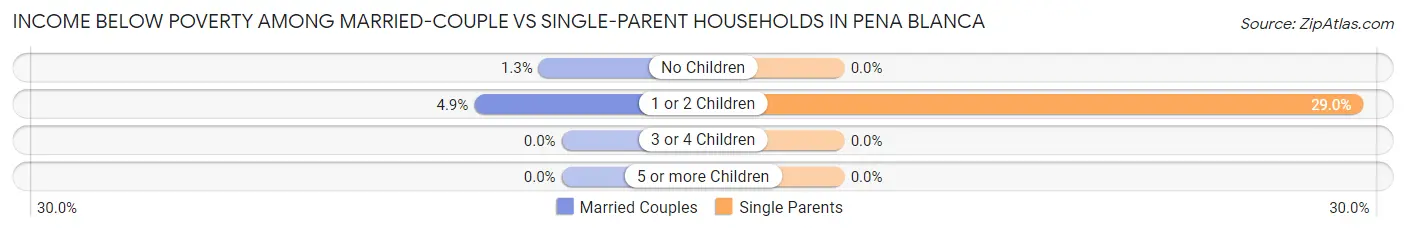
| Children | Married-Couple Families | Single-Parent Households |
| No Children | 1 (1.3%) | 0 (0.0%) |
| 1 or 2 Children | 2 (4.9%) | 9 (29.0%) |
| 3 or 4 Children | 0 (0.0%) | 0 (0.0%) |
| 5 or more Children | 0 (0.0%) | 0 (0.0%) |
| Total | 3 (2.1%) | 9 (25.7%) |
Race in Pena Blanca
The most populous races in Pena Blanca are Hispanic or Latino (585 | 85.0%), Two or more Races (338 | 49.1%), and White / Caucasian (244 | 35.5%).
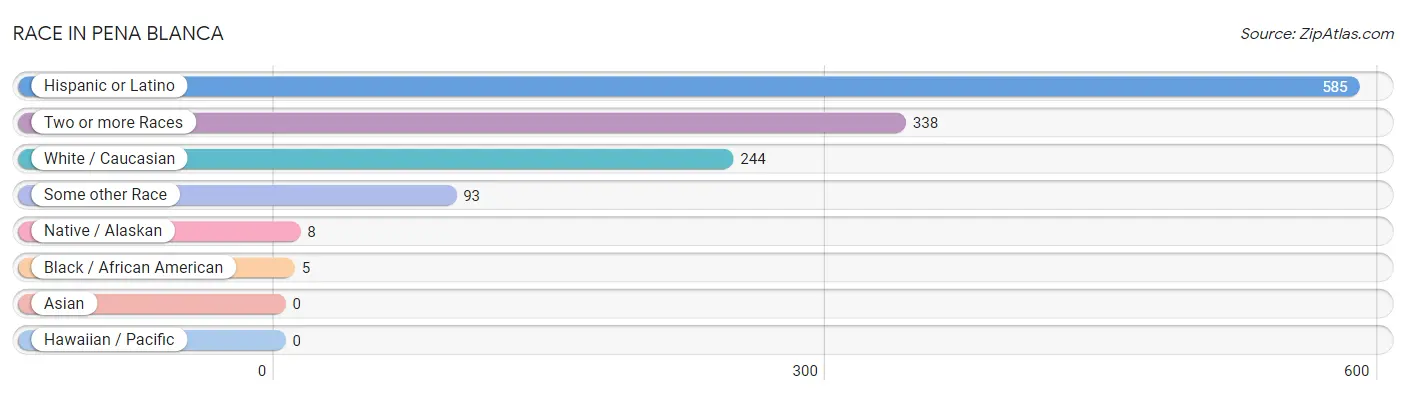
| Race | # Population | % Population |
| Asian | 0 | 0.0% |
| Black / African American | 5 | 0.7% |
| Hawaiian / Pacific | 0 | 0.0% |
| Hispanic or Latino | 585 | 85.0% |
| Native / Alaskan | 8 | 1.2% |
| White / Caucasian | 244 | 35.5% |
| Two or more Races | 338 | 49.1% |
| Some other Race | 93 | 13.5% |
| Total | 688 | 100.0% |
Ancestry in Pena Blanca
The most populous ancestries reported in Pena Blanca are Spanish (277 | 40.3%), Mexican (174 | 25.3%), German (61 | 8.9%), Irish (58 | 8.4%), and Italian (31 | 4.5%), together accounting for 87.4% of all Pena Blanca residents.
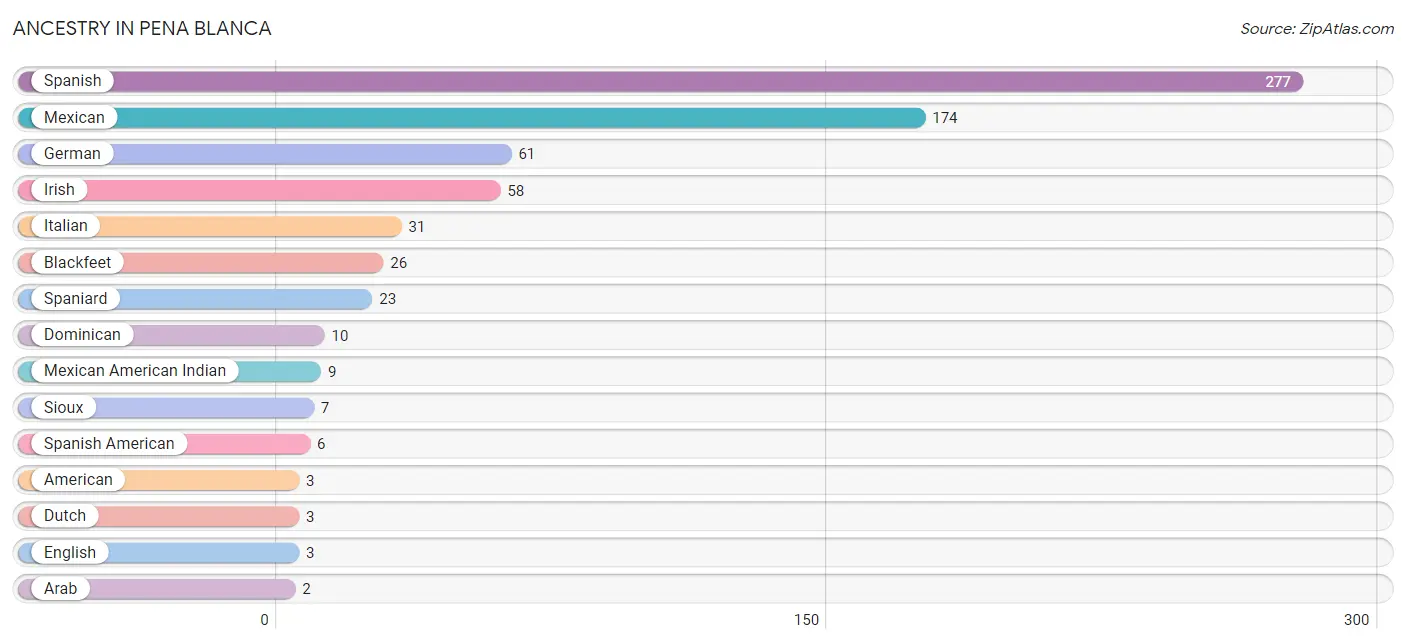
| Ancestry | # Population | % Population |
| American | 3 | 0.4% |
| Arab | 2 | 0.3% |
| Blackfeet | 26 | 3.8% |
| Cherokee | 1 | 0.2% |
| Dominican | 10 | 1.5% |
| Dutch | 3 | 0.4% |
| English | 3 | 0.4% |
| German | 61 | 8.9% |
| Irish | 58 | 8.4% |
| Italian | 31 | 4.5% |
| Lebanese | 2 | 0.3% |
| Mexican | 174 | 25.3% |
| Mexican American Indian | 9 | 1.3% |
| Navajo | 1 | 0.2% |
| Portuguese | 1 | 0.2% |
| Scotch-Irish | 2 | 0.3% |
| Sioux | 7 | 1.0% |
| Spaniard | 23 | 3.3% |
| Spanish | 277 | 40.3% |
| Spanish American | 6 | 0.9% | View All 20 Rows |
Immigrants in Pena Blanca
The most numerous immigrant groups reported in Pena Blanca came from Central America (39 | 5.7%), Latin America (39 | 5.7%), and Mexico (39 | 5.7%), together accounting for 17.0% of all Pena Blanca residents.
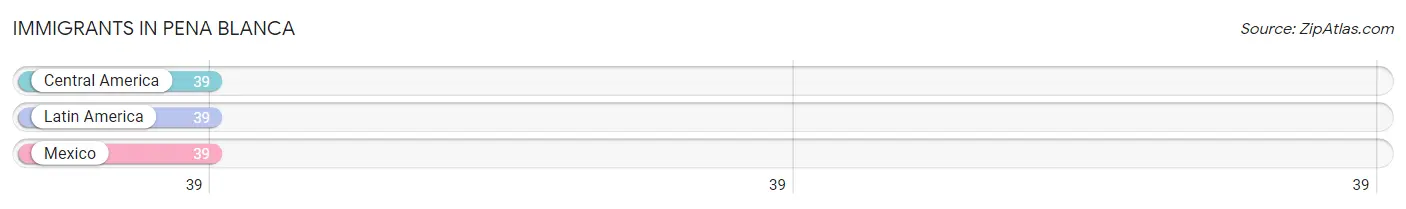
| Immigration Origin | # Population | % Population |
| Central America | 39 | 5.7% |
| Latin America | 39 | 5.7% |
| Mexico | 39 | 5.7% | View All 3 Rows |
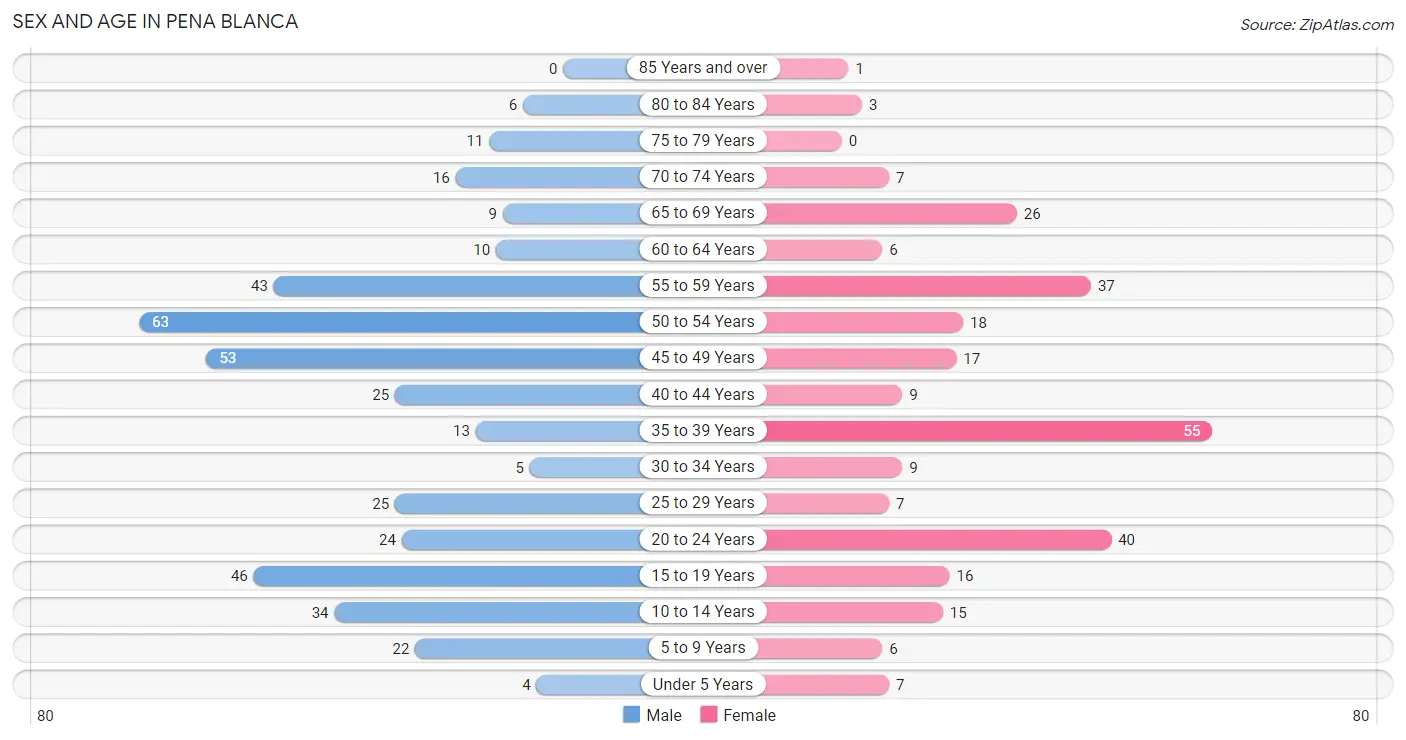
Sex and Age in Pena Blanca
Sex and Age in Pena Blanca
The most populous age groups in Pena Blanca are 50 to 54 Years (63 | 15.4%) for men and 35 to 39 Years (55 | 19.7%) for women.
| Age Bracket | Male | Female |
| Under 5 Years | 4 (1.0%) | 7 (2.5%) |
| 5 to 9 Years | 22 (5.4%) | 6 (2.1%) |
| 10 to 14 Years | 34 (8.3%) | 15 (5.4%) |
| 15 to 19 Years | 46 (11.3%) | 16 (5.7%) |
| 20 to 24 Years | 24 (5.9%) | 40 (14.3%) |
| 25 to 29 Years | 25 (6.1%) | 7 (2.5%) |
| 30 to 34 Years | 5 (1.2%) | 9 (3.2%) |
| 35 to 39 Years | 13 (3.2%) | 55 (19.7%) |
| 40 to 44 Years | 25 (6.1%) | 9 (3.2%) |
| 45 to 49 Years | 53 (13.0%) | 17 (6.1%) |
| 50 to 54 Years | 63 (15.4%) | 18 (6.5%) |
| 55 to 59 Years | 43 (10.5%) | 37 (13.3%) |
| 60 to 64 Years | 10 (2.4%) | 6 (2.1%) |
| 65 to 69 Years | 9 (2.2%) | 26 (9.3%) |
| 70 to 74 Years | 16 (3.9%) | 7 (2.5%) |
| 75 to 79 Years | 11 (2.7%) | 0 (0.0%) |
| 80 to 84 Years | 6 (1.5%) | 3 (1.1%) |
| 85 Years and over | 0 (0.0%) | 1 (0.4%) |
| Total | 409 (100.0%) | 279 (100.0%) |
Families and Households in Pena Blanca
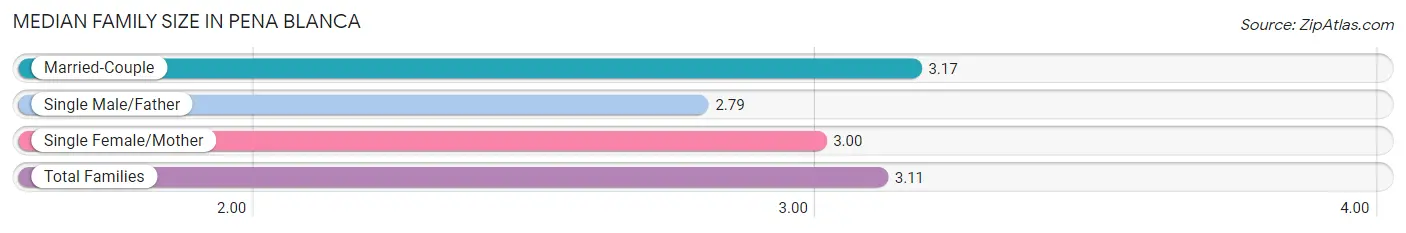
Median Family Size in Pena Blanca
The median family size in Pena Blanca is 3.11 persons per family, with married-couple families (140 | 80.0%) accounting for the largest median family size of 3.17 persons per family. On the other hand, single male/father families (19 | 10.9%) represent the smallest median family size with 2.79 persons per family.
| Family Type | # Families | Family Size |
| Married-Couple | 140 (80.0%) | 3.17 |
| Single Male/Father | 19 (10.9%) | 2.79 |
| Single Female/Mother | 16 (9.1%) | 3.00 |
| Total Families | 175 (100.0%) | 3.11 |
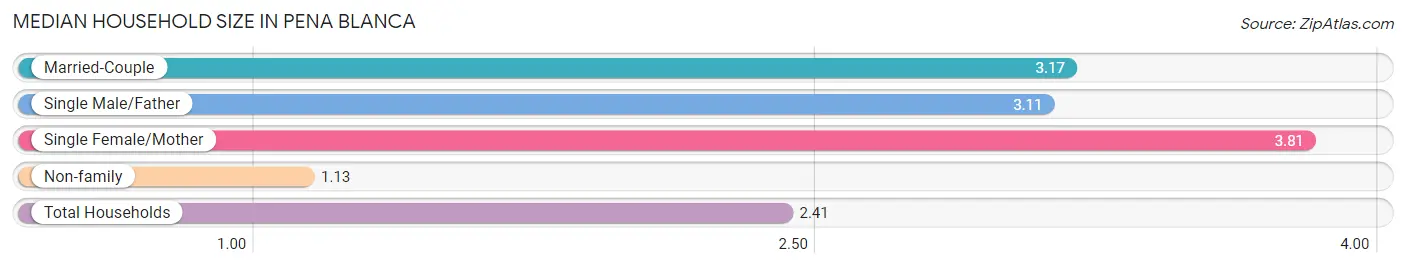
Median Household Size in Pena Blanca
The median household size in Pena Blanca is 2.41 persons per household, with single female/mother households (16 | 5.6%) accounting for the largest median household size of 3.81 persons per household. non-family households (110 | 38.6%) represent the smallest median household size with 1.13 persons per household.
| Household Type | # Households | Household Size |
| Married-Couple | 140 (49.1%) | 3.17 |
| Single Male/Father | 19 (6.7%) | 3.11 |
| Single Female/Mother | 16 (5.6%) | 3.81 |
| Non-family | 110 (38.6%) | 1.13 |
| Total Households | 285 (100.0%) | 2.41 |
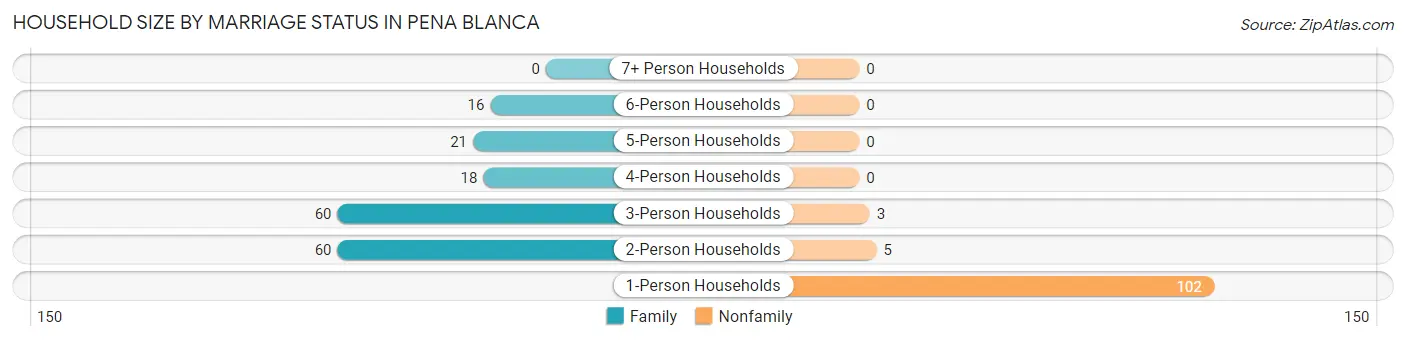
Household Size by Marriage Status in Pena Blanca
Out of a total of 285 households in Pena Blanca, 175 (61.4%) are family households, while 110 (38.6%) are nonfamily households. The most numerous type of family households are 2-person households, comprising 60, and the most common type of nonfamily households are 1-person households, comprising 102.
| Household Size | Family Households | Nonfamily Households |
| 1-Person Households | - | 102 (35.8%) |
| 2-Person Households | 60 (21.0%) | 5 (1.8%) |
| 3-Person Households | 60 (21.0%) | 3 (1.1%) |
| 4-Person Households | 18 (6.3%) | 0 (0.0%) |
| 5-Person Households | 21 (7.4%) | 0 (0.0%) |
| 6-Person Households | 16 (5.6%) | 0 (0.0%) |
| 7+ Person Households | 0 (0.0%) | 0 (0.0%) |
| Total | 175 (61.4%) | 110 (38.6%) |
Female Fertility in Pena Blanca
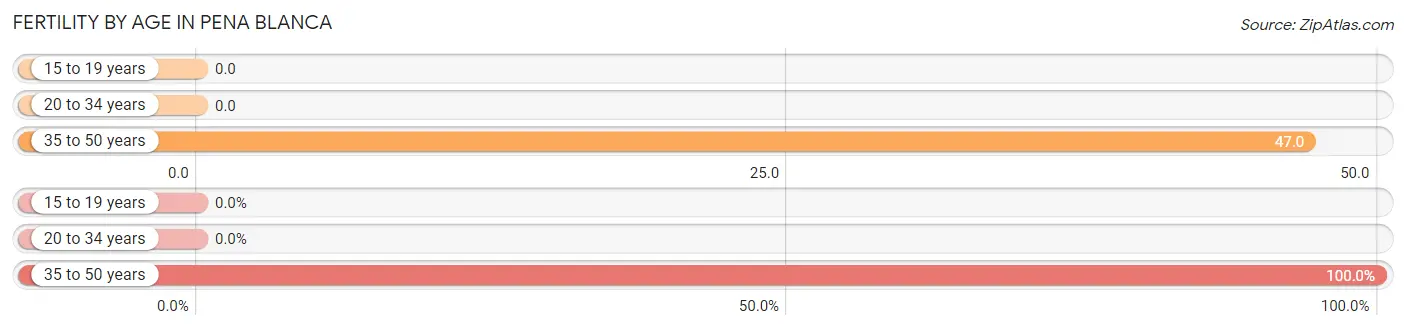
Fertility by Age in Pena Blanca
Average fertility rate in Pena Blanca is 25.0 births per 1,000 women. Women in the age bracket of 35 to 50 years have the highest fertility rate with 47.0 births per 1,000 women. Women in the age bracket of 35 to 50 years acount for 100.0% of all women with births.
| Age Bracket | Women with Births | Births / 1,000 Women |
| 15 to 19 years | 0 (0.0%) | 0.0 |
| 20 to 34 years | 0 (0.0%) | 0.0 |
| 35 to 50 years | 4 (100.0%) | 47.0 |
| Total | 4 (100.0%) | 25.0 |
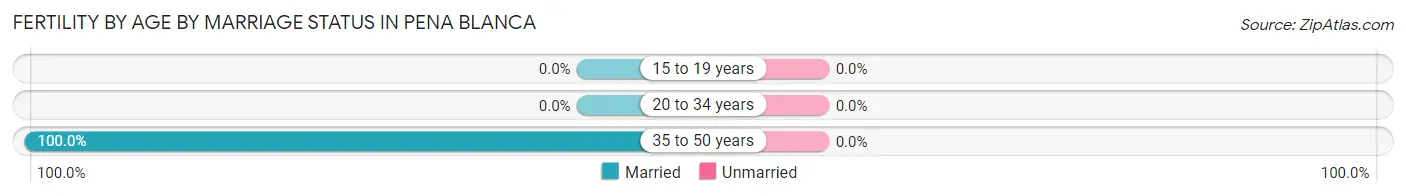
Fertility by Age by Marriage Status in Pena Blanca
| Age Bracket | Married | Unmarried |
| 15 to 19 years | 0 (0.0%) | 0 (0.0%) |
| 20 to 34 years | 0 (0.0%) | 0 (0.0%) |
| 35 to 50 years | 4 (100.0%) | 0 (0.0%) |
| Total | 4 (100.0%) | 0 (0.0%) |
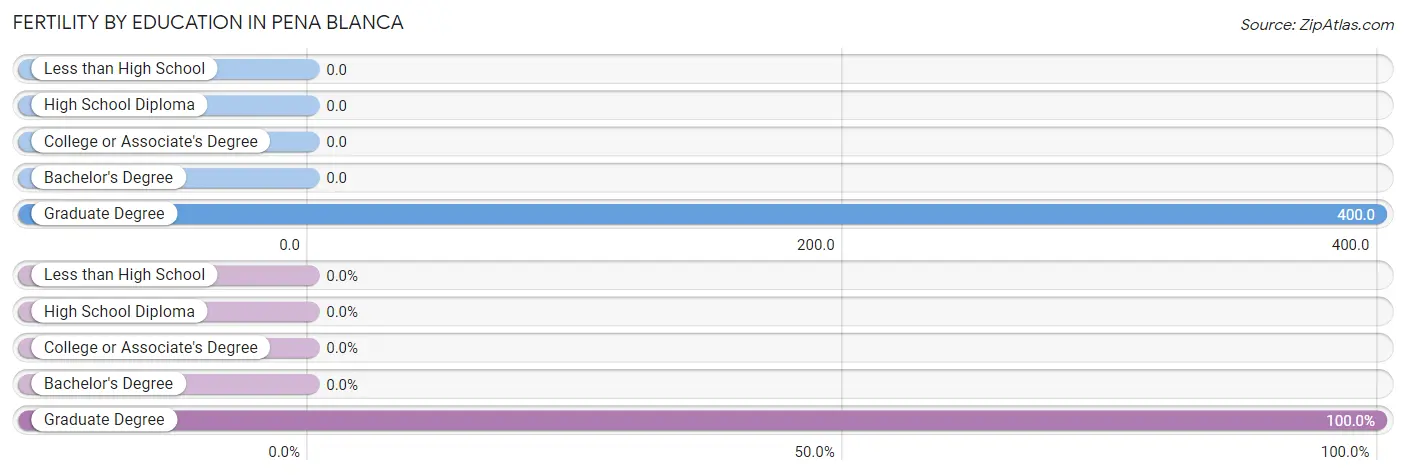
Fertility by Education in Pena Blanca
| Educational Attainment | Women with Births | Births / 1,000 Women |
| Less than High School | 0 (0.0%) | 0.0 |
| High School Diploma | 0 (0.0%) | 0.0 |
| College or Associate's Degree | 0 (0.0%) | 0.0 |
| Bachelor's Degree | 0 (0.0%) | 0.0 |
| Graduate Degree | 4 (100.0%) | 400.0 |
| Total | 4 (100.0%) | 25.0 |
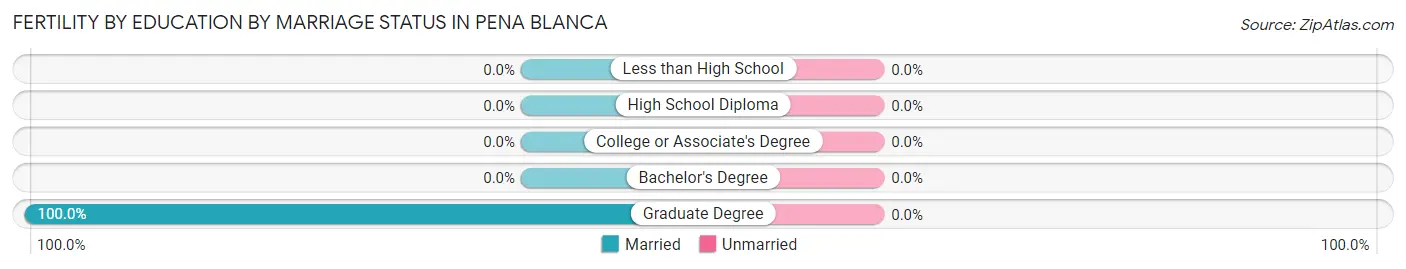
Fertility by Education by Marriage Status in Pena Blanca
| Educational Attainment | Married | Unmarried |
| Less than High School | 0 (0.0%) | 0 (0.0%) |
| High School Diploma | 0 (0.0%) | 0 (0.0%) |
| College or Associate's Degree | 0 (0.0%) | 0 (0.0%) |
| Bachelor's Degree | 0 (0.0%) | 0 (0.0%) |
| Graduate Degree | 4 (100.0%) | 0 (0.0%) |
| Total | 4 (100.0%) | 0 (0.0%) |
Employment Characteristics in Pena Blanca
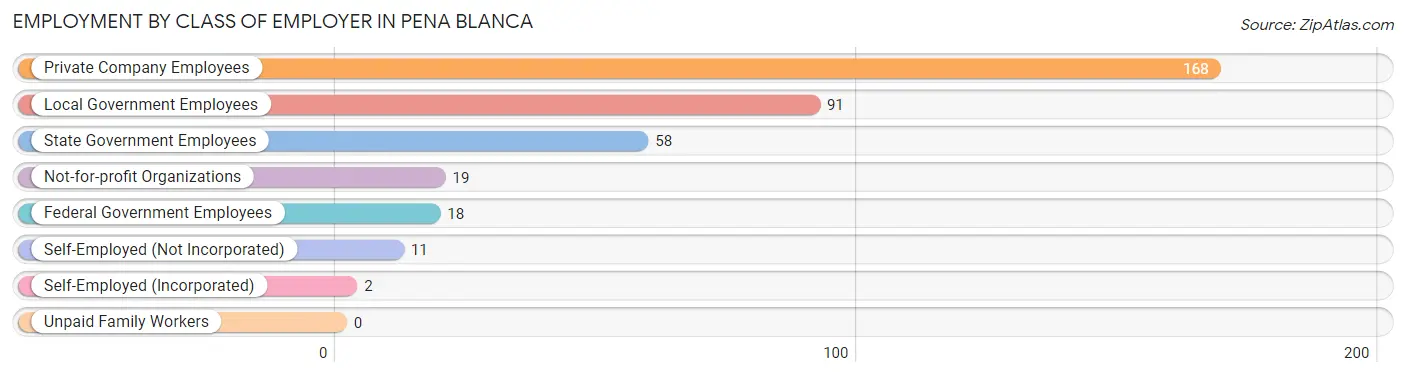
Employment by Class of Employer in Pena Blanca
Among the 367 employed individuals in Pena Blanca, private company employees (168 | 45.8%), local government employees (91 | 24.8%), and state government employees (58 | 15.8%) make up the most common classes of employment.
| Employer Class | # Employees | % Employees |
| Private Company Employees | 168 | 45.8% |
| Self-Employed (Incorporated) | 2 | 0.5% |
| Self-Employed (Not Incorporated) | 11 | 3.0% |
| Not-for-profit Organizations | 19 | 5.2% |
| Local Government Employees | 91 | 24.8% |
| State Government Employees | 58 | 15.8% |
| Federal Government Employees | 18 | 4.9% |
| Unpaid Family Workers | 0 | 0.0% |
| Total | 367 | 100.0% |
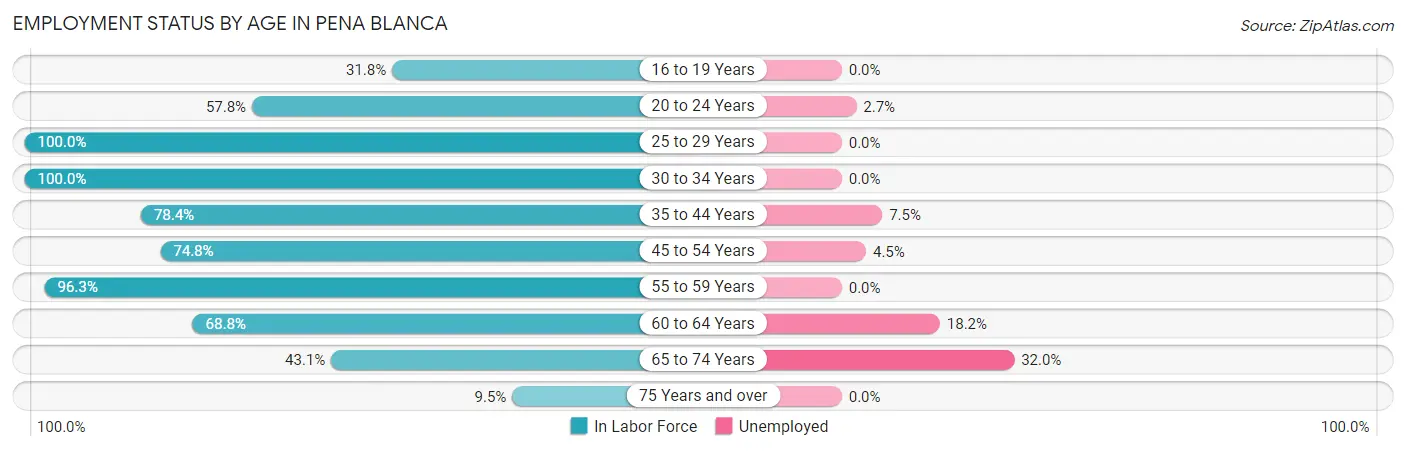
Employment Status by Age in Pena Blanca
According to the labor force statistics for Pena Blanca, out of the total population over 16 years of age (560), 71.1% or 398 individuals are in the labor force, with 5.6% or 22 of them unemployed. The age group with the highest labor force participation rate is 25 to 29 years, with 100.0% or 32 individuals in the labor force. Within the labor force, the 65 to 74 years age range has the highest percentage of unemployed individuals, with 32.0% or 8 of them being unemployed.
| Age Bracket | In Labor Force | Unemployed |
| 16 to 19 Years | 7 (31.8%) | 0 (0.0%) |
| 20 to 24 Years | 37 (57.8%) | 1 (2.7%) |
| 25 to 29 Years | 32 (100.0%) | 0 (0.0%) |
| 30 to 34 Years | 14 (100.0%) | 0 (0.0%) |
| 35 to 44 Years | 80 (78.4%) | 6 (7.5%) |
| 45 to 54 Years | 113 (74.8%) | 5 (4.5%) |
| 55 to 59 Years | 77 (96.3%) | 0 (0.0%) |
| 60 to 64 Years | 11 (68.8%) | 2 (18.2%) |
| 65 to 74 Years | 25 (43.1%) | 8 (32.0%) |
| 75 Years and over | 2 (9.5%) | 0 (0.0%) |
| Total | 398 (71.1%) | 22 (5.6%) |
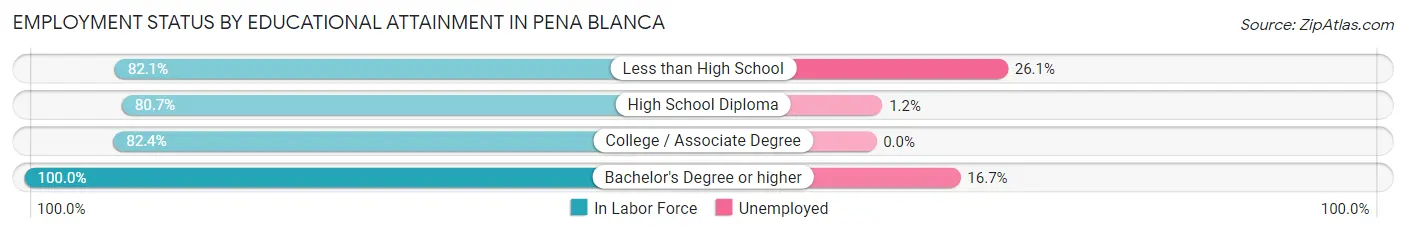
Employment Status by Educational Attainment in Pena Blanca
According to labor force statistics for Pena Blanca, 82.8% of individuals (327) out of the total population between 25 and 64 years of age (395) are in the labor force, with 4.0% or 13 of them being unemployed. The group with the highest labor force participation rate are those with the educational attainment of bachelor's degree or higher, with 100.0% or 30 individuals in the labor force. Within the labor force, individuals with less than high school education have the highest percentage of unemployment, with 26.1% or 6 of them being unemployed.
| Educational Attainment | In Labor Force | Unemployed |
| Less than High School | 23 (82.1%) | 7 (26.1%) |
| High School Diploma | 171 (80.7%) | 3 (1.2%) |
| College / Associate Degree | 103 (82.4%) | 0 (0.0%) |
| Bachelor's Degree or higher | 30 (100.0%) | 5 (16.7%) |
| Total | 327 (82.8%) | 16 (4.0%) |
Employment Occupations by Sex in Pena Blanca
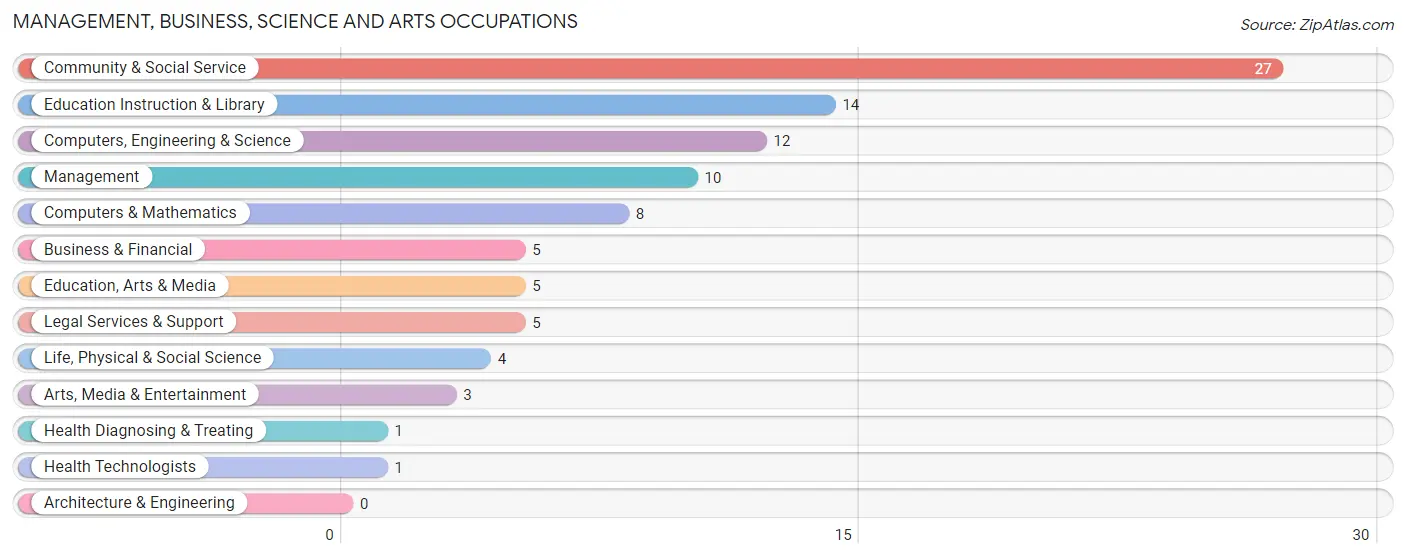
Management, Business, Science and Arts Occupations
The most common Management, Business, Science and Arts occupations in Pena Blanca are Community & Social Service (27 | 7.2%), Education Instruction & Library (14 | 3.7%), Computers, Engineering & Science (12 | 3.2%), Management (10 | 2.7%), and Computers & Mathematics (8 | 2.1%).
Management, Business, Science and Arts Occupations by Sex
Within the Management, Business, Science and Arts occupations in Pena Blanca, the most male-oriented occupations are Computers & Mathematics (100.0%), Arts, Media & Entertainment (100.0%), and Computers, Engineering & Science (66.7%), while the most female-oriented occupations are Business & Financial (100.0%), Life, Physical & Social Science (100.0%), and Education, Arts & Media (100.0%).
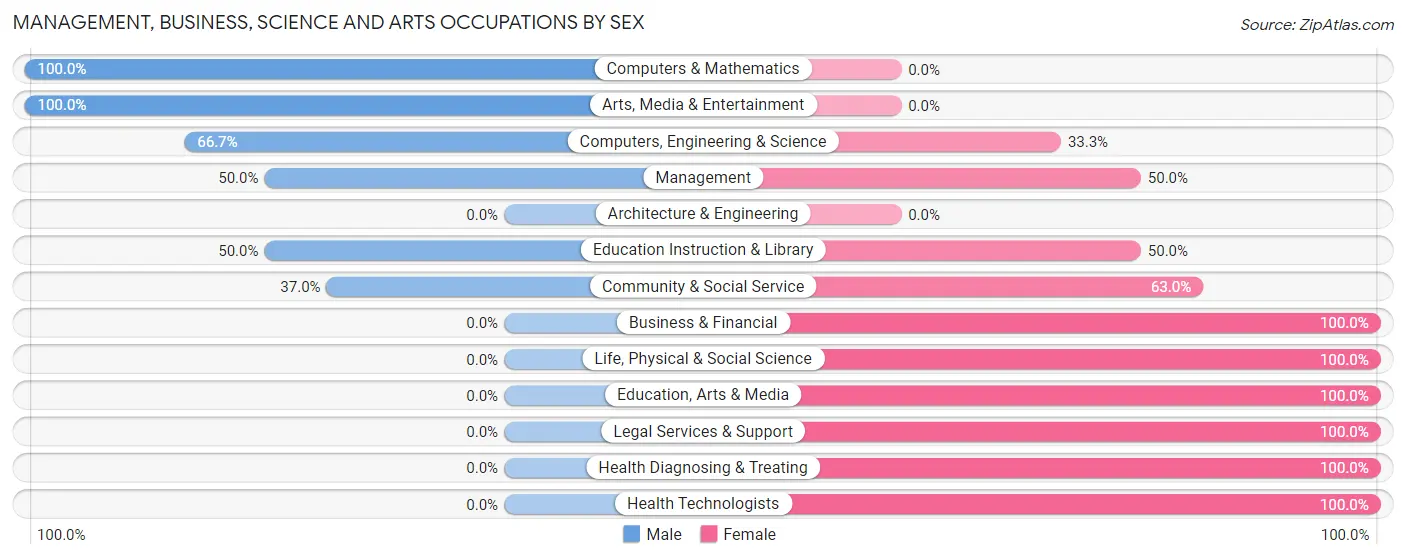
| Occupation | Male | Female |
| Management | 5 (50.0%) | 5 (50.0%) |
| Business & Financial | 0 (0.0%) | 5 (100.0%) |
| Computers, Engineering & Science | 8 (66.7%) | 4 (33.3%) |
| Computers & Mathematics | 8 (100.0%) | 0 (0.0%) |
| Architecture & Engineering | 0 (0.0%) | 0 (0.0%) |
| Life, Physical & Social Science | 0 (0.0%) | 4 (100.0%) |
| Community & Social Service | 10 (37.0%) | 17 (63.0%) |
| Education, Arts & Media | 0 (0.0%) | 5 (100.0%) |
| Legal Services & Support | 0 (0.0%) | 5 (100.0%) |
| Education Instruction & Library | 7 (50.0%) | 7 (50.0%) |
| Arts, Media & Entertainment | 3 (100.0%) | 0 (0.0%) |
| Health Diagnosing & Treating | 0 (0.0%) | 1 (100.0%) |
| Health Technologists | 0 (0.0%) | 1 (100.0%) |
| Total (Category) | 23 (41.8%) | 32 (58.2%) |
| Total (Overall) | 199 (53.3%) | 174 (46.7%) |
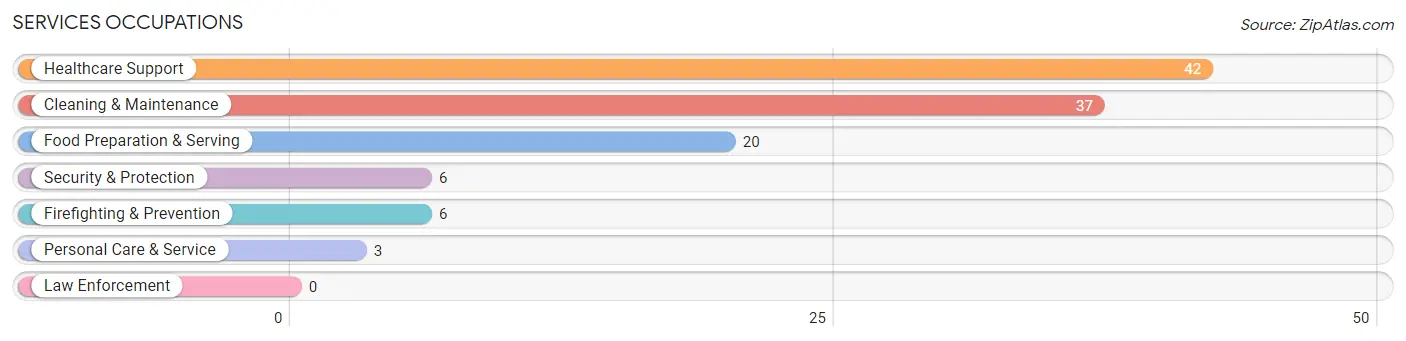
Services Occupations
The most common Services occupations in Pena Blanca are Healthcare Support (42 | 11.3%), Cleaning & Maintenance (37 | 9.9%), Food Preparation & Serving (20 | 5.4%), Security & Protection (6 | 1.6%), and Firefighting & Prevention (6 | 1.6%).
Services Occupations by Sex
Within the Services occupations in Pena Blanca, the most male-oriented occupations are Security & Protection (100.0%), Firefighting & Prevention (100.0%), and Personal Care & Service (100.0%), while the most female-oriented occupations are Healthcare Support (100.0%), Food Preparation & Serving (90.0%), and Cleaning & Maintenance (21.6%).
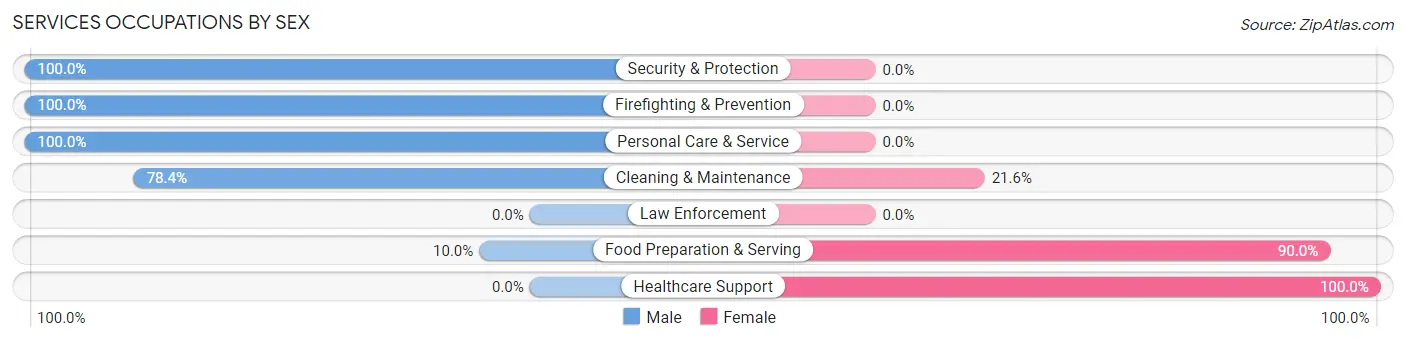
| Occupation | Male | Female |
| Healthcare Support | 0 (0.0%) | 42 (100.0%) |
| Security & Protection | 6 (100.0%) | 0 (0.0%) |
| Firefighting & Prevention | 6 (100.0%) | 0 (0.0%) |
| Law Enforcement | 0 (0.0%) | 0 (0.0%) |
| Food Preparation & Serving | 2 (10.0%) | 18 (90.0%) |
| Cleaning & Maintenance | 29 (78.4%) | 8 (21.6%) |
| Personal Care & Service | 3 (100.0%) | 0 (0.0%) |
| Total (Category) | 40 (37.0%) | 68 (63.0%) |
| Total (Overall) | 199 (53.3%) | 174 (46.7%) |
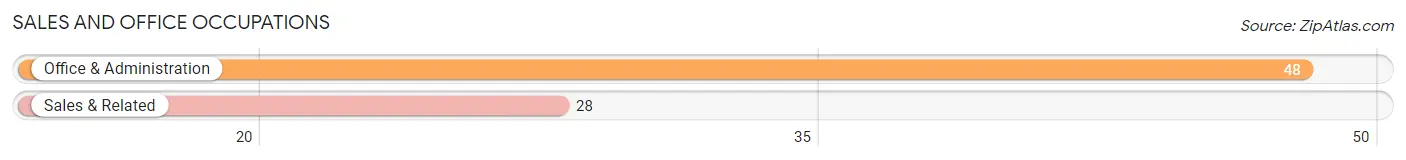
Sales and Office Occupations
The most common Sales and Office occupations in Pena Blanca are Office & Administration (48 | 12.9%), and Sales & Related (28 | 7.5%).
Sales and Office Occupations by Sex

| Occupation | Male | Female |
| Sales & Related | 3 (10.7%) | 25 (89.3%) |
| Office & Administration | 18 (37.5%) | 30 (62.5%) |
| Total (Category) | 21 (27.6%) | 55 (72.4%) |
| Total (Overall) | 199 (53.3%) | 174 (46.7%) |
Natural Resources, Construction and Maintenance Occupations
The most common Natural Resources, Construction and Maintenance occupations in Pena Blanca are Construction & Extraction (67 | 18.0%), and Installation, Maintenance & Repair (7 | 1.9%).
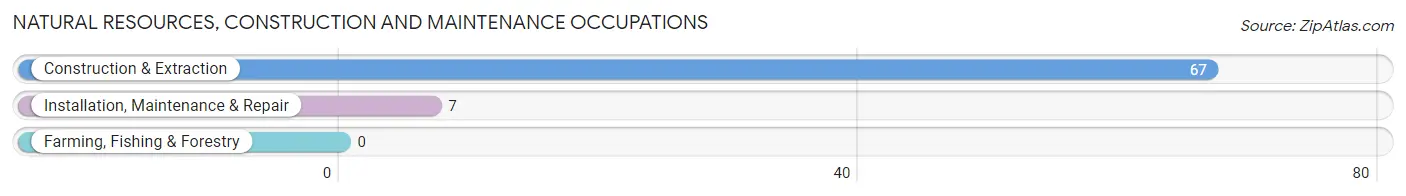
Natural Resources, Construction and Maintenance Occupations by Sex

| Occupation | Male | Female |
| Farming, Fishing & Forestry | 0 (0.0%) | 0 (0.0%) |
| Construction & Extraction | 67 (100.0%) | 0 (0.0%) |
| Installation, Maintenance & Repair | 7 (100.0%) | 0 (0.0%) |
| Total (Category) | 74 (100.0%) | 0 (0.0%) |
| Total (Overall) | 199 (53.3%) | 174 (46.7%) |
Production, Transportation and Moving Occupations
The most common Production, Transportation and Moving occupations in Pena Blanca are Production (33 | 8.8%), Transportation (16 | 4.3%), and Material Moving (11 | 2.9%).
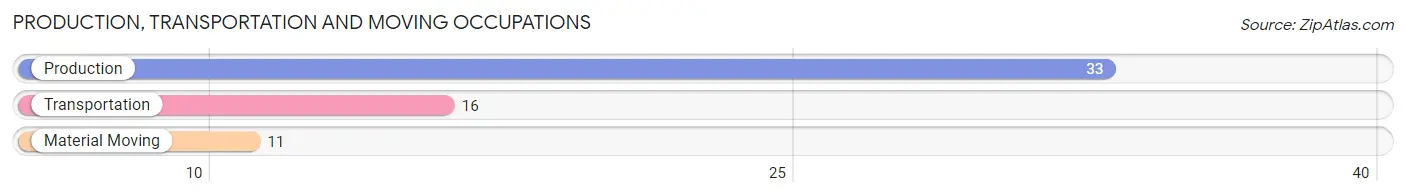
Production, Transportation and Moving Occupations by Sex
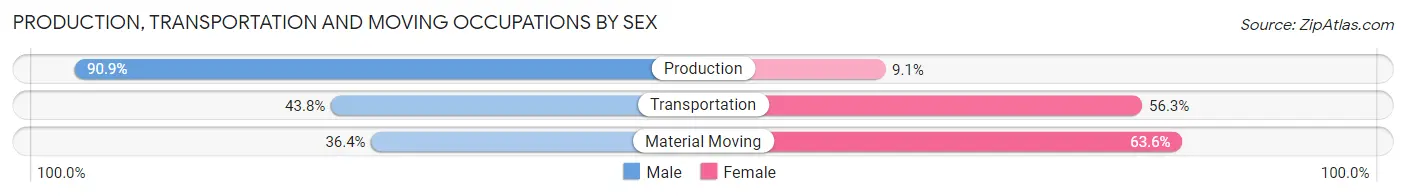
| Occupation | Male | Female |
| Production | 30 (90.9%) | 3 (9.1%) |
| Transportation | 7 (43.8%) | 9 (56.2%) |
| Material Moving | 4 (36.4%) | 7 (63.6%) |
| Total (Category) | 41 (68.3%) | 19 (31.7%) |
| Total (Overall) | 199 (53.3%) | 174 (46.7%) |
Employment Industries by Sex in Pena Blanca
Employment Industries in Pena Blanca
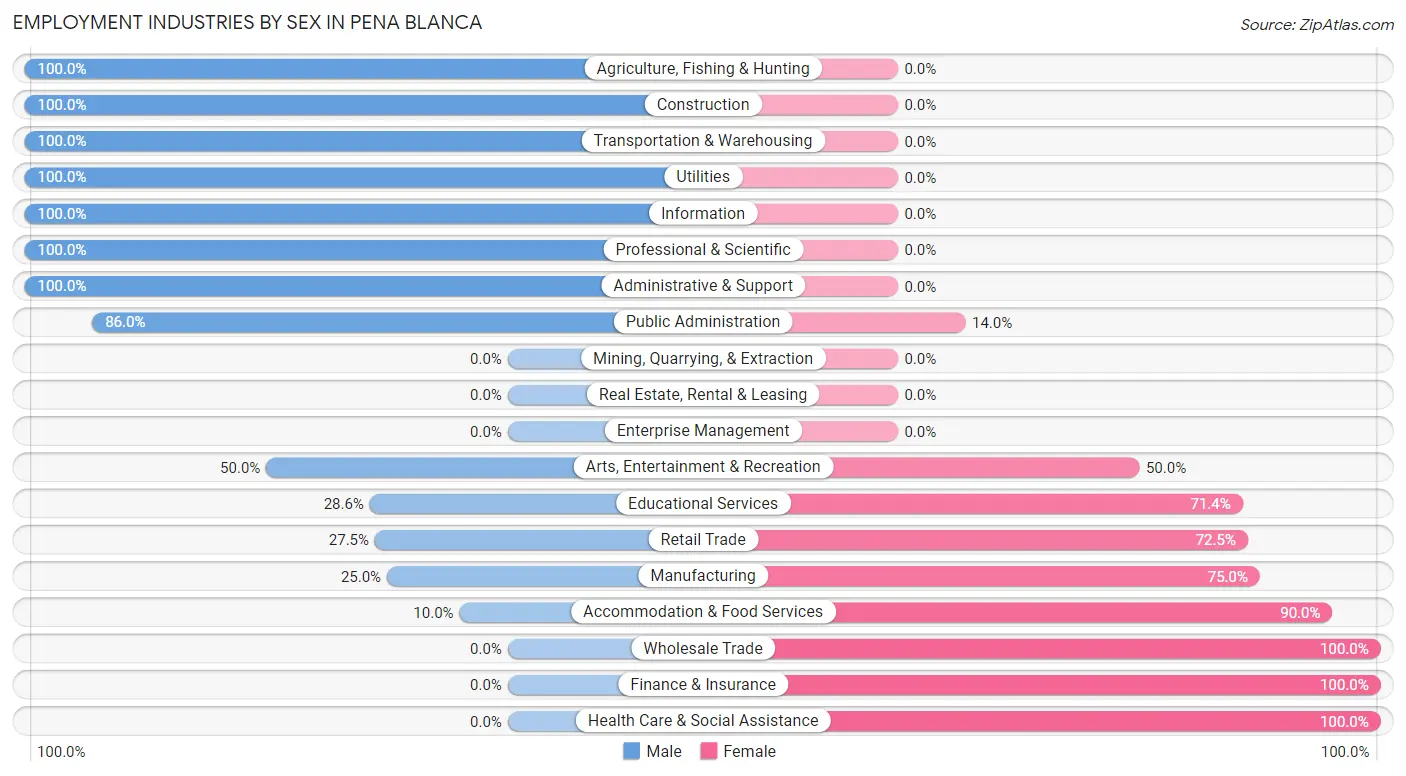
The major employment industries in Pena Blanca include Health Care & Social Assistance (63 | 16.9%), Construction (60 | 16.1%), Public Administration (50 | 13.4%), Retail Trade (40 | 10.7%), and Educational Services (28 | 7.5%).
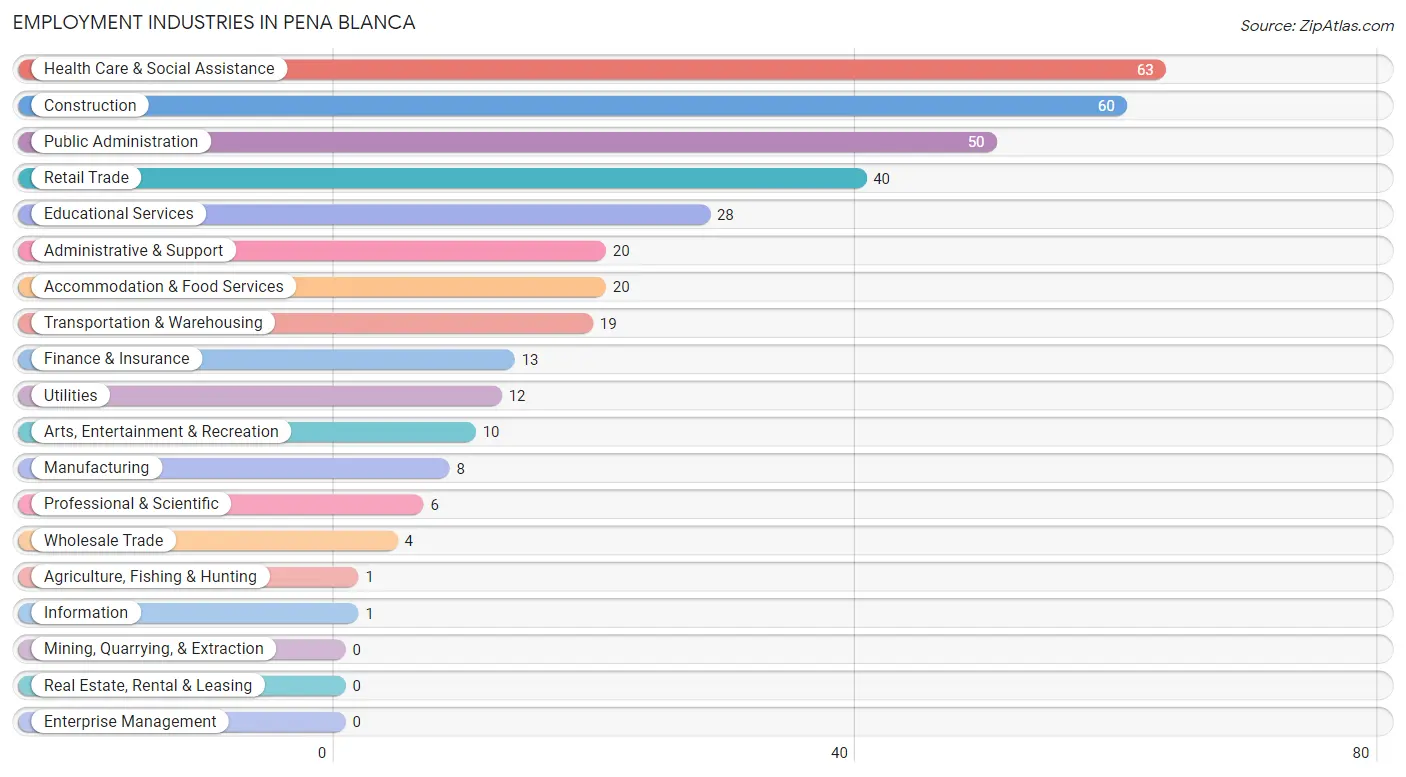
Employment Industries by Sex in Pena Blanca
The Pena Blanca industries that see more men than women are Agriculture, Fishing & Hunting (100.0%), Construction (100.0%), and Transportation & Warehousing (100.0%), whereas the industries that tend to have a higher number of women are Wholesale Trade (100.0%), Finance & Insurance (100.0%), and Health Care & Social Assistance (100.0%).
| Industry | Male | Female |
| Agriculture, Fishing & Hunting | 1 (100.0%) | 0 (0.0%) |
| Mining, Quarrying, & Extraction | 0 (0.0%) | 0 (0.0%) |
| Construction | 60 (100.0%) | 0 (0.0%) |
| Manufacturing | 2 (25.0%) | 6 (75.0%) |
| Wholesale Trade | 0 (0.0%) | 4 (100.0%) |
| Retail Trade | 11 (27.5%) | 29 (72.5%) |
| Transportation & Warehousing | 19 (100.0%) | 0 (0.0%) |
| Utilities | 12 (100.0%) | 0 (0.0%) |
| Information | 1 (100.0%) | 0 (0.0%) |
| Finance & Insurance | 0 (0.0%) | 13 (100.0%) |
| Real Estate, Rental & Leasing | 0 (0.0%) | 0 (0.0%) |
| Professional & Scientific | 6 (100.0%) | 0 (0.0%) |
| Enterprise Management | 0 (0.0%) | 0 (0.0%) |
| Administrative & Support | 20 (100.0%) | 0 (0.0%) |
| Educational Services | 8 (28.6%) | 20 (71.4%) |
| Health Care & Social Assistance | 0 (0.0%) | 63 (100.0%) |
| Arts, Entertainment & Recreation | 5 (50.0%) | 5 (50.0%) |
| Accommodation & Food Services | 2 (10.0%) | 18 (90.0%) |
| Public Administration | 43 (86.0%) | 7 (14.0%) |
| Total | 199 (53.3%) | 174 (46.7%) |
Education in Pena Blanca
School Enrollment in Pena Blanca
The most common levels of schooling among the 182 students in Pena Blanca are high school (59 | 32.4%), college / undergraduate (49 | 26.9%), and middle school (41 | 22.5%).
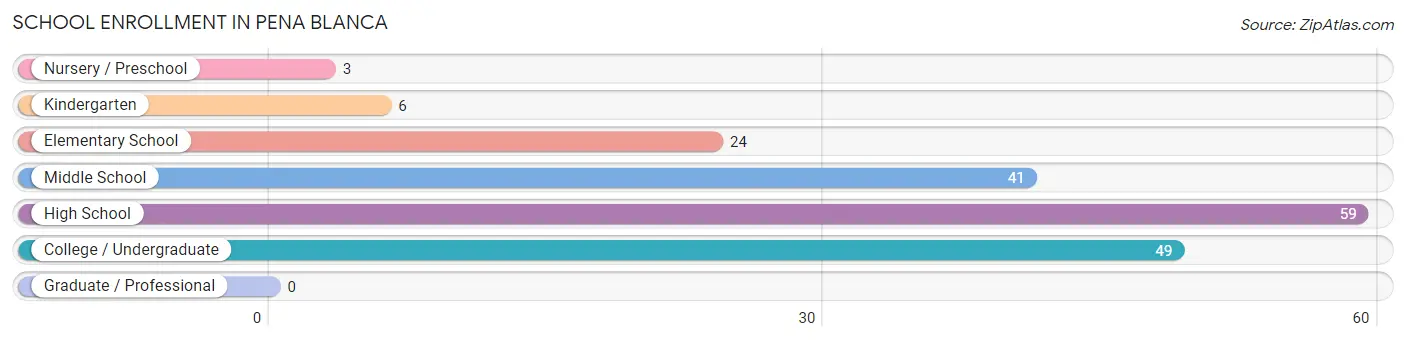
| School Level | # Students | % Students |
| Nursery / Preschool | 3 | 1.7% |
| Kindergarten | 6 | 3.3% |
| Elementary School | 24 | 13.2% |
| Middle School | 41 | 22.5% |
| High School | 59 | 32.4% |
| College / Undergraduate | 49 | 26.9% |
| Graduate / Professional | 0 | 0.0% |
| Total | 182 | 100.0% |
School Enrollment by Age by Funding Source in Pena Blanca
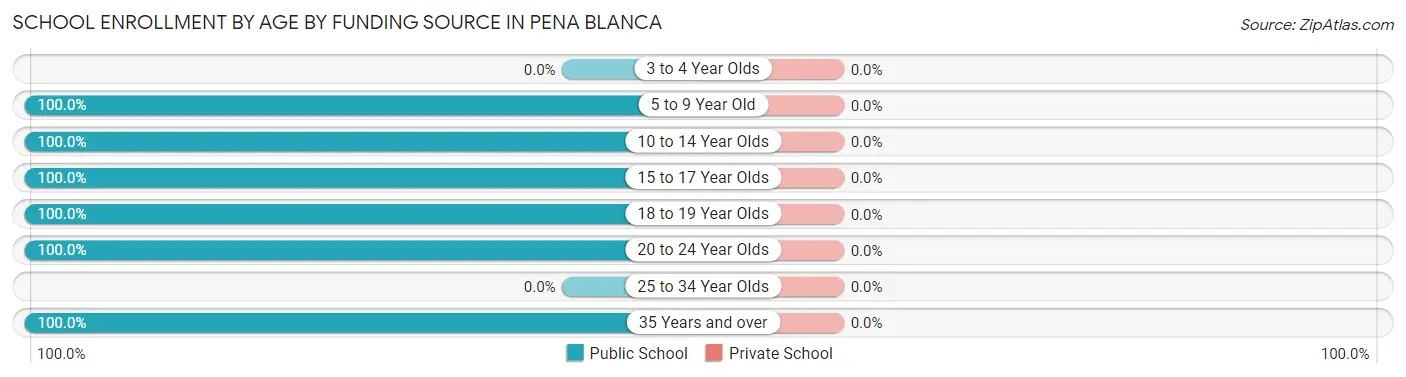
| Age Bracket | Public School | Private School |
| 3 to 4 Year Olds | 0 (0.0%) | 0 (0.0%) |
| 5 to 9 Year Old | 28 (100.0%) | 0 (0.0%) |
| 10 to 14 Year Olds | 49 (100.0%) | 0 (0.0%) |
| 15 to 17 Year Olds | 53 (100.0%) | 0 (0.0%) |
| 18 to 19 Year Olds | 4 (100.0%) | 0 (0.0%) |
| 20 to 24 Year Olds | 25 (100.0%) | 0 (0.0%) |
| 25 to 34 Year Olds | 0 (0.0%) | 0 (0.0%) |
| 35 Years and over | 23 (100.0%) | 0 (0.0%) |
| Total | 182 (100.0%) | 0 (0.0%) |
Educational Attainment by Field of Study in Pena Blanca
Social sciences (11 | 23.9%), education (11 | 23.9%), science & technology (8 | 17.4%), liberal arts & history (4 | 8.7%), and visual & performing arts (4 | 8.7%) are the most common fields of study among 46 individuals in Pena Blanca who have obtained a bachelor's degree or higher.
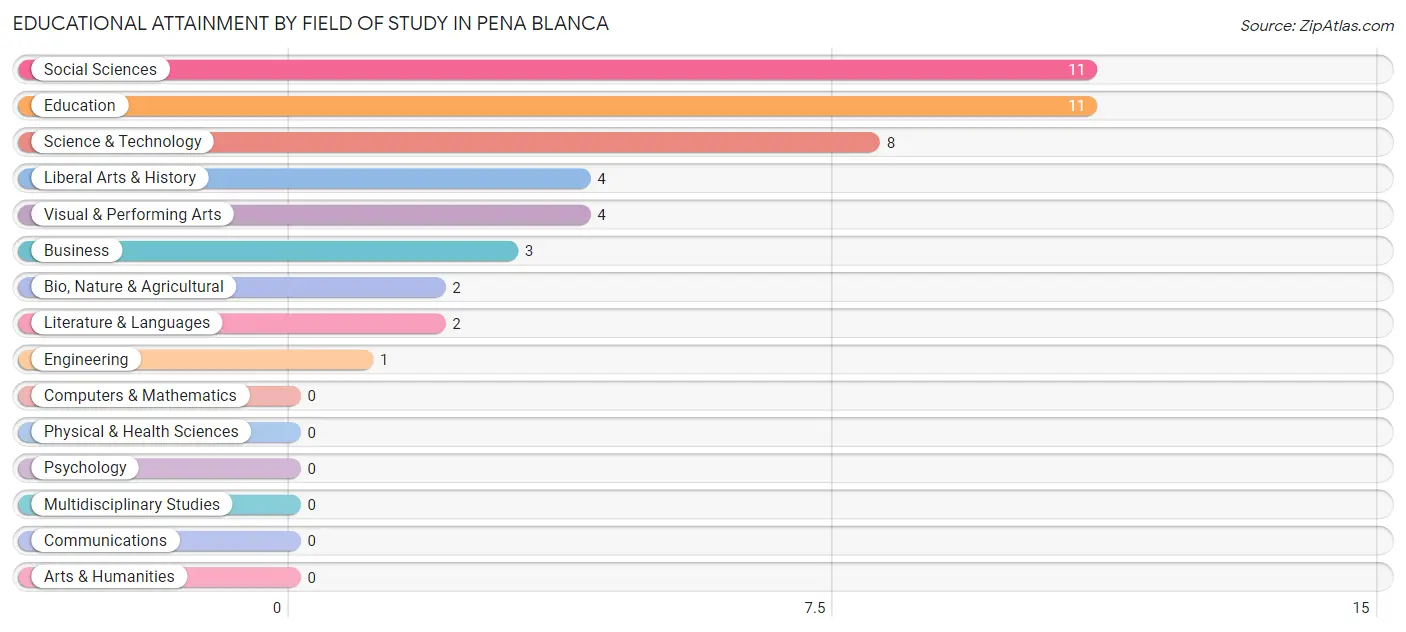
| Field of Study | # Graduates | % Graduates |
| Computers & Mathematics | 0 | 0.0% |
| Bio, Nature & Agricultural | 2 | 4.3% |
| Physical & Health Sciences | 0 | 0.0% |
| Psychology | 0 | 0.0% |
| Social Sciences | 11 | 23.9% |
| Engineering | 1 | 2.2% |
| Multidisciplinary Studies | 0 | 0.0% |
| Science & Technology | 8 | 17.4% |
| Business | 3 | 6.5% |
| Education | 11 | 23.9% |
| Literature & Languages | 2 | 4.3% |
| Liberal Arts & History | 4 | 8.7% |
| Visual & Performing Arts | 4 | 8.7% |
| Communications | 0 | 0.0% |
| Arts & Humanities | 0 | 0.0% |
| Total | 46 | 100.0% |
Transportation & Commute in Pena Blanca
Vehicle Availability by Sex in Pena Blanca
The most prevalent vehicle ownership categories in Pena Blanca are males with 3 vehicles (71, accounting for 36.8%) and females with 3 vehicles (42, making up 40.8%).
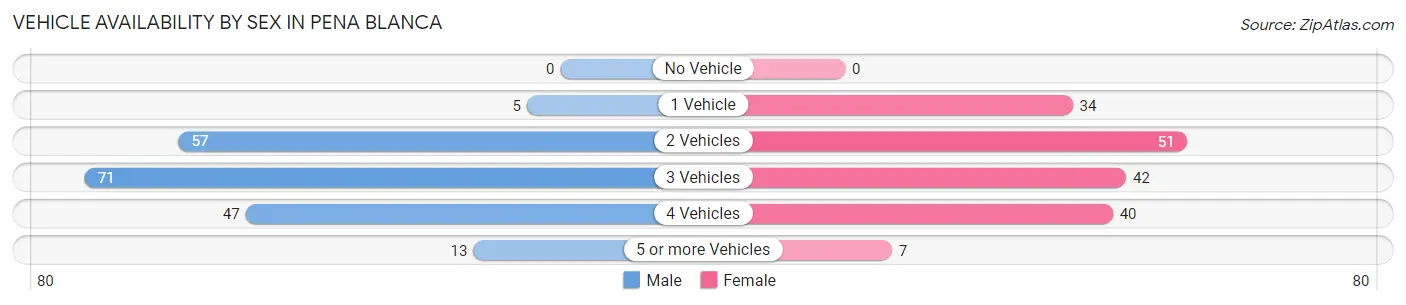
| Vehicles Available | Male | Female |
| No Vehicle | 0 (0.0%) | 0 (0.0%) |
| 1 Vehicle | 5 (2.6%) | 34 (19.5%) |
| 2 Vehicles | 57 (29.5%) | 51 (29.3%) |
| 3 Vehicles | 71 (36.8%) | 42 (24.1%) |
| 4 Vehicles | 47 (24.3%) | 40 (23.0%) |
| 5 or more Vehicles | 13 (6.7%) | 7 (4.0%) |
| Total | 193 (100.0%) | 174 (100.0%) |
Commute Time in Pena Blanca
The most frequently occuring commute durations in Pena Blanca are 30 to 34 minutes (95 commuters, 29.2%), 45 to 59 minutes (85 commuters, 26.2%), and 40 to 44 minutes (47 commuters, 14.5%).
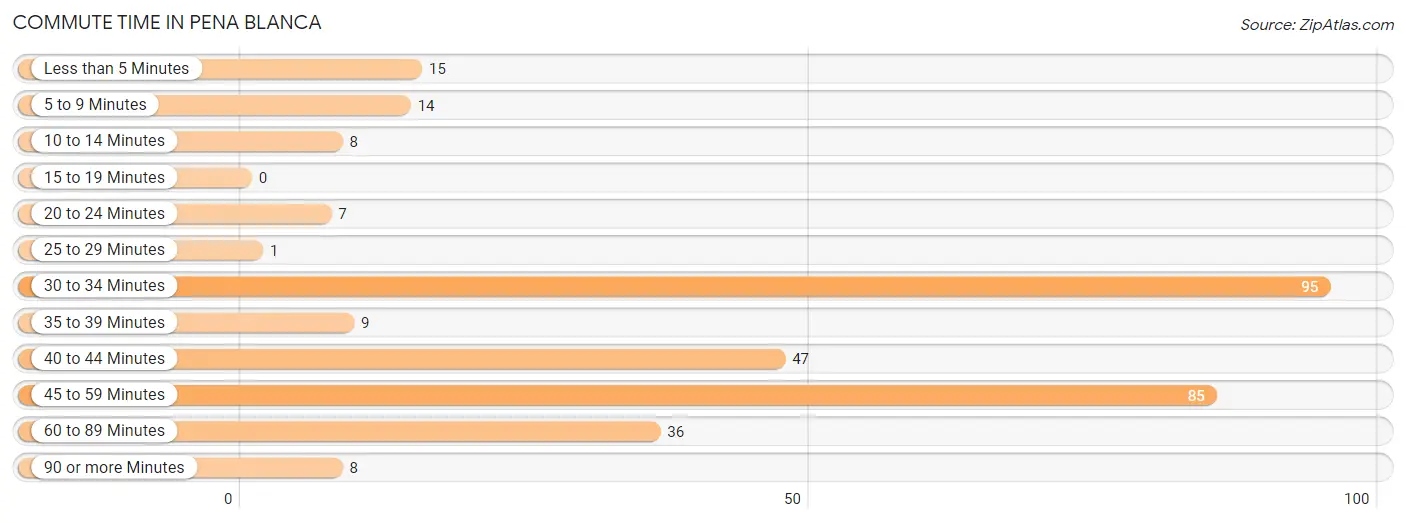
| Commute Time | # Commuters | % Commuters |
| Less than 5 Minutes | 15 | 4.6% |
| 5 to 9 Minutes | 14 | 4.3% |
| 10 to 14 Minutes | 8 | 2.5% |
| 15 to 19 Minutes | 0 | 0.0% |
| 20 to 24 Minutes | 7 | 2.1% |
| 25 to 29 Minutes | 1 | 0.3% |
| 30 to 34 Minutes | 95 | 29.2% |
| 35 to 39 Minutes | 9 | 2.8% |
| 40 to 44 Minutes | 47 | 14.5% |
| 45 to 59 Minutes | 85 | 26.2% |
| 60 to 89 Minutes | 36 | 11.1% |
| 90 or more Minutes | 8 | 2.5% |
Commute Time by Sex in Pena Blanca
The most common commute times in Pena Blanca are 30 to 34 minutes (72 commuters, 45.3%) for males and 45 to 59 minutes (55 commuters, 33.1%) for females.
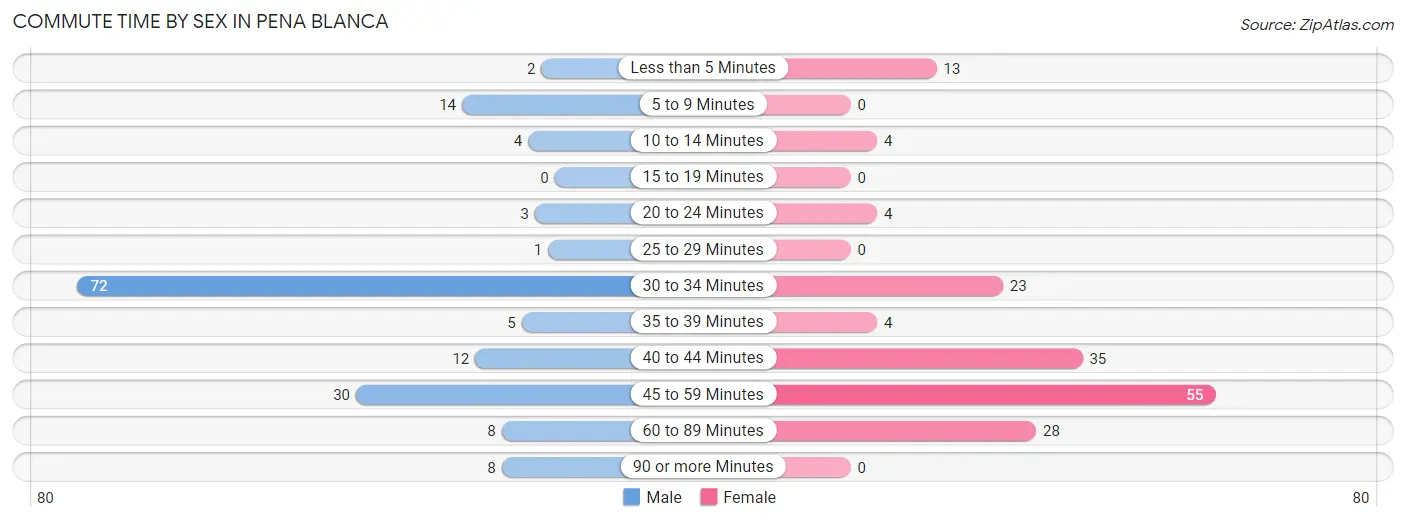
| Commute Time | Male | Female |
| Less than 5 Minutes | 2 (1.3%) | 13 (7.8%) |
| 5 to 9 Minutes | 14 (8.8%) | 0 (0.0%) |
| 10 to 14 Minutes | 4 (2.5%) | 4 (2.4%) |
| 15 to 19 Minutes | 0 (0.0%) | 0 (0.0%) |
| 20 to 24 Minutes | 3 (1.9%) | 4 (2.4%) |
| 25 to 29 Minutes | 1 (0.6%) | 0 (0.0%) |
| 30 to 34 Minutes | 72 (45.3%) | 23 (13.9%) |
| 35 to 39 Minutes | 5 (3.1%) | 4 (2.4%) |
| 40 to 44 Minutes | 12 (7.5%) | 35 (21.1%) |
| 45 to 59 Minutes | 30 (18.9%) | 55 (33.1%) |
| 60 to 89 Minutes | 8 (5.0%) | 28 (16.9%) |
| 90 or more Minutes | 8 (5.0%) | 0 (0.0%) |
Time of Departure to Work by Sex in Pena Blanca
The most frequent times of departure to work in Pena Blanca are 6:00 AM to 6:29 AM (59, 37.1%) for males and 8:00 AM to 8:29 AM (50, 30.1%) for females.
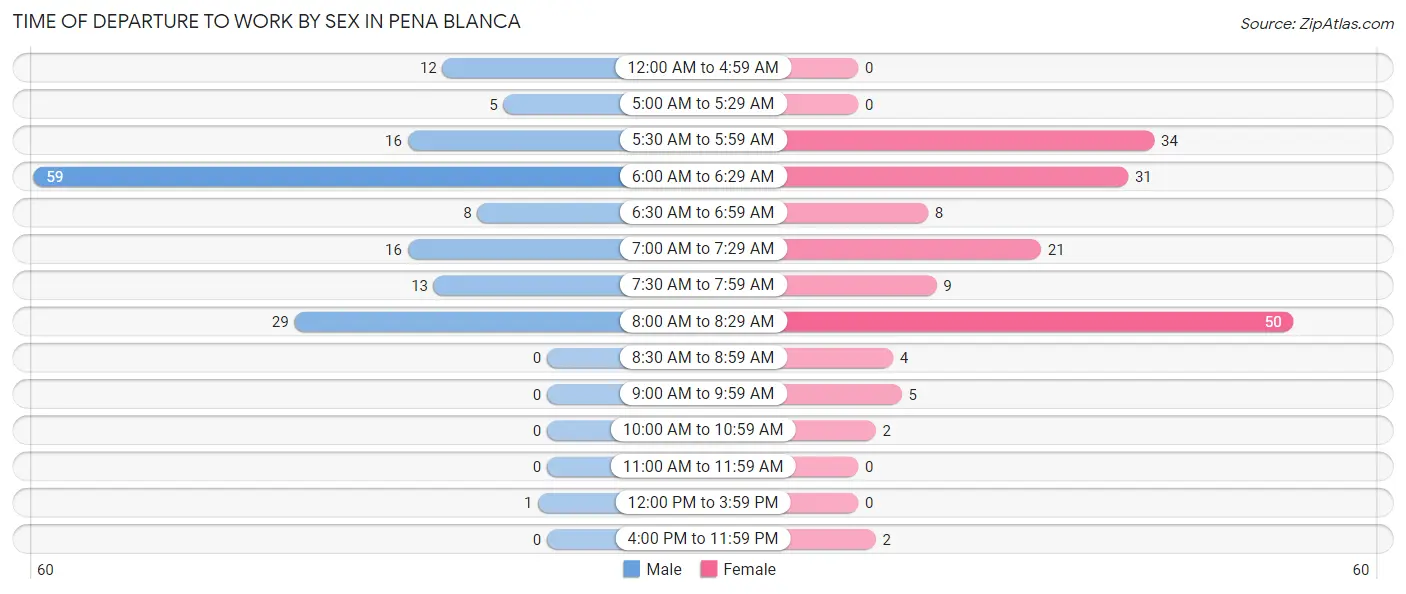
| Time of Departure | Male | Female |
| 12:00 AM to 4:59 AM | 12 (7.5%) | 0 (0.0%) |
| 5:00 AM to 5:29 AM | 5 (3.1%) | 0 (0.0%) |
| 5:30 AM to 5:59 AM | 16 (10.1%) | 34 (20.5%) |
| 6:00 AM to 6:29 AM | 59 (37.1%) | 31 (18.7%) |
| 6:30 AM to 6:59 AM | 8 (5.0%) | 8 (4.8%) |
| 7:00 AM to 7:29 AM | 16 (10.1%) | 21 (12.7%) |
| 7:30 AM to 7:59 AM | 13 (8.2%) | 9 (5.4%) |
| 8:00 AM to 8:29 AM | 29 (18.2%) | 50 (30.1%) |
| 8:30 AM to 8:59 AM | 0 (0.0%) | 4 (2.4%) |
| 9:00 AM to 9:59 AM | 0 (0.0%) | 5 (3.0%) |
| 10:00 AM to 10:59 AM | 0 (0.0%) | 2 (1.2%) |
| 11:00 AM to 11:59 AM | 0 (0.0%) | 0 (0.0%) |
| 12:00 PM to 3:59 PM | 1 (0.6%) | 0 (0.0%) |
| 4:00 PM to 11:59 PM | 0 (0.0%) | 2 (1.2%) |
| Total | 159 (100.0%) | 166 (100.0%) |
Housing Occupancy in Pena Blanca
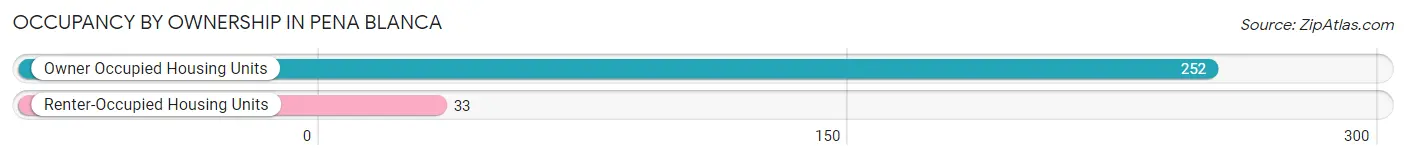
Occupancy by Ownership in Pena Blanca
Of the total 285 dwellings in Pena Blanca, owner-occupied units account for 252 (88.4%), while renter-occupied units make up 33 (11.6%).
| Occupancy | # Housing Units | % Housing Units |
| Owner Occupied Housing Units | 252 | 88.4% |
| Renter-Occupied Housing Units | 33 | 11.6% |
| Total Occupied Housing Units | 285 | 100.0% |
Occupancy by Household Size in Pena Blanca

| Household Size | # Housing Units | % Housing Units |
| 1-Person Household | 102 | 35.8% |
| 2-Person Household | 65 | 22.8% |
| 3-Person Household | 63 | 22.1% |
| 4+ Person Household | 55 | 19.3% |
| Total Housing Units | 285 | 100.0% |
Occupancy by Ownership by Household Size in Pena Blanca
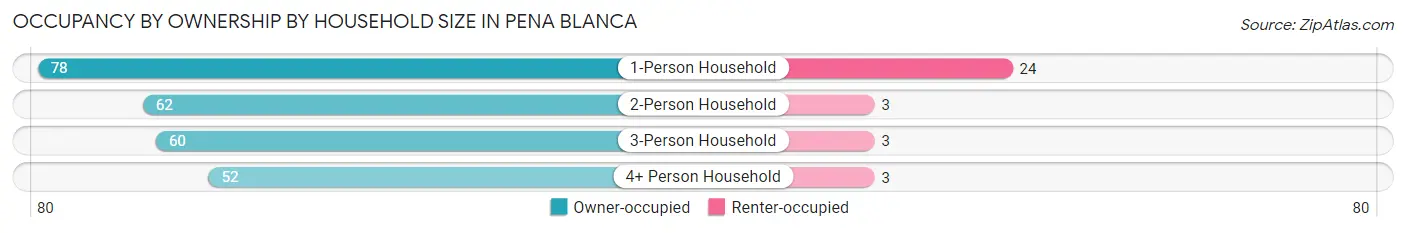
| Household Size | Owner-occupied | Renter-occupied |
| 1-Person Household | 78 (76.5%) | 24 (23.5%) |
| 2-Person Household | 62 (95.4%) | 3 (4.6%) |
| 3-Person Household | 60 (95.2%) | 3 (4.8%) |
| 4+ Person Household | 52 (94.6%) | 3 (5.4%) |
| Total Housing Units | 252 (88.4%) | 33 (11.6%) |
Occupancy by Educational Attainment in Pena Blanca
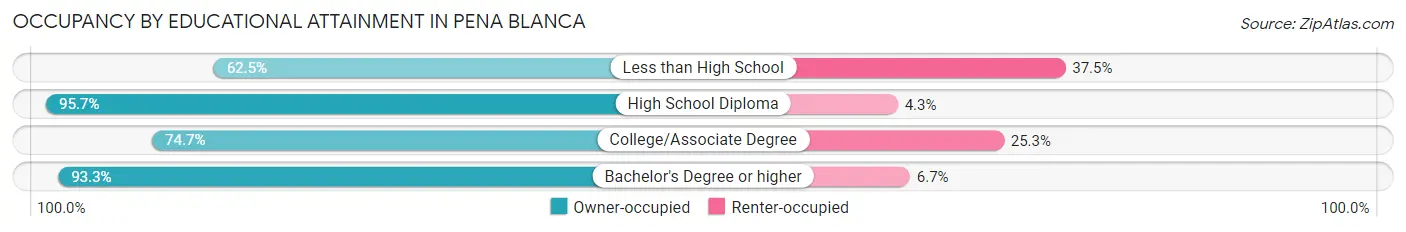
| Household Size | Owner-occupied | Renter-occupied |
| Less than High School | 5 (62.5%) | 3 (37.5%) |
| High School Diploma | 157 (95.7%) | 7 (4.3%) |
| College/Associate Degree | 62 (74.7%) | 21 (25.3%) |
| Bachelor's Degree or higher | 28 (93.3%) | 2 (6.7%) |
Occupancy by Age of Householder in Pena Blanca
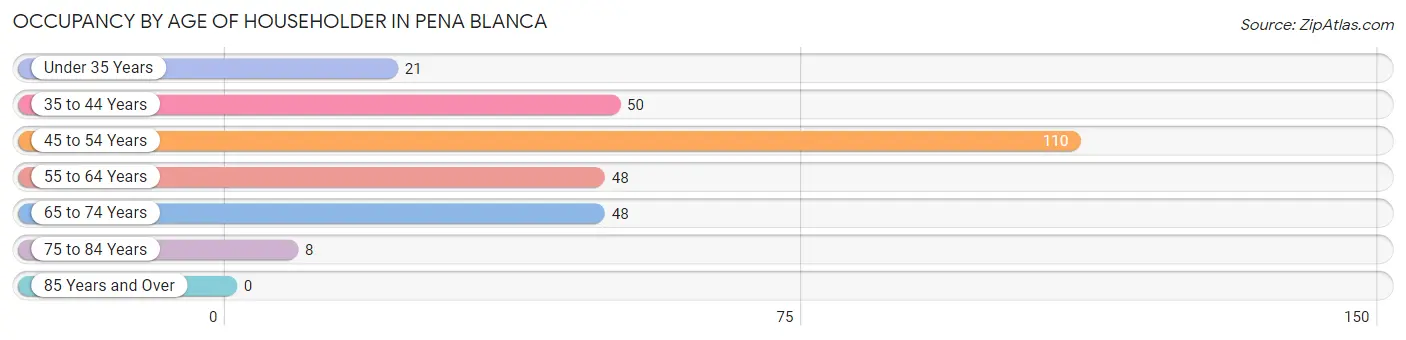
| Age Bracket | # Households | % Households |
| Under 35 Years | 21 | 7.4% |
| 35 to 44 Years | 50 | 17.5% |
| 45 to 54 Years | 110 | 38.6% |
| 55 to 64 Years | 48 | 16.8% |
| 65 to 74 Years | 48 | 16.8% |
| 75 to 84 Years | 8 | 2.8% |
| 85 Years and Over | 0 | 0.0% |
| Total | 285 | 100.0% |
Housing Finances in Pena Blanca
Median Income by Occupancy in Pena Blanca
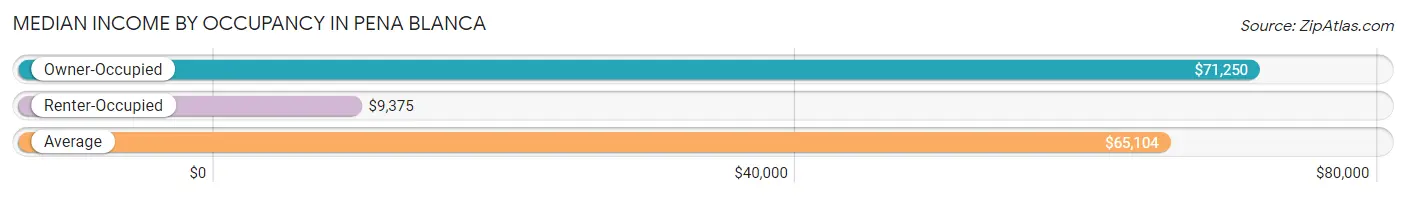
| Occupancy Type | # Households | Median Income |
| Owner-Occupied | 252 (88.4%) | $71,250 |
| Renter-Occupied | 33 (11.6%) | $9,375 |
| Average | 285 (100.0%) | $65,104 |
Occupancy by Householder Income Bracket in Pena Blanca
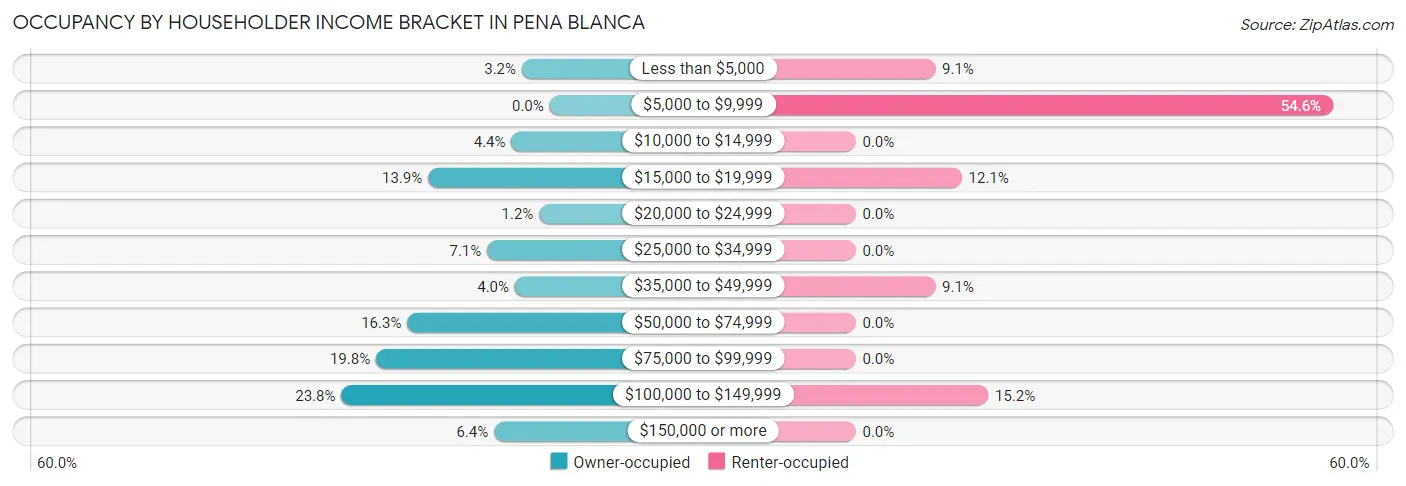
| Income Bracket | Owner-occupied | Renter-occupied |
| Less than $5,000 | 8 (3.2%) | 3 (9.1%) |
| $5,000 to $9,999 | 0 (0.0%) | 18 (54.5%) |
| $10,000 to $14,999 | 11 (4.4%) | 0 (0.0%) |
| $15,000 to $19,999 | 35 (13.9%) | 4 (12.1%) |
| $20,000 to $24,999 | 3 (1.2%) | 0 (0.0%) |
| $25,000 to $34,999 | 18 (7.1%) | 0 (0.0%) |
| $35,000 to $49,999 | 10 (4.0%) | 3 (9.1%) |
| $50,000 to $74,999 | 41 (16.3%) | 0 (0.0%) |
| $75,000 to $99,999 | 50 (19.8%) | 0 (0.0%) |
| $100,000 to $149,999 | 60 (23.8%) | 5 (15.1%) |
| $150,000 or more | 16 (6.4%) | 0 (0.0%) |
| Total | 252 (100.0%) | 33 (100.0%) |
Monthly Housing Cost Tiers in Pena Blanca
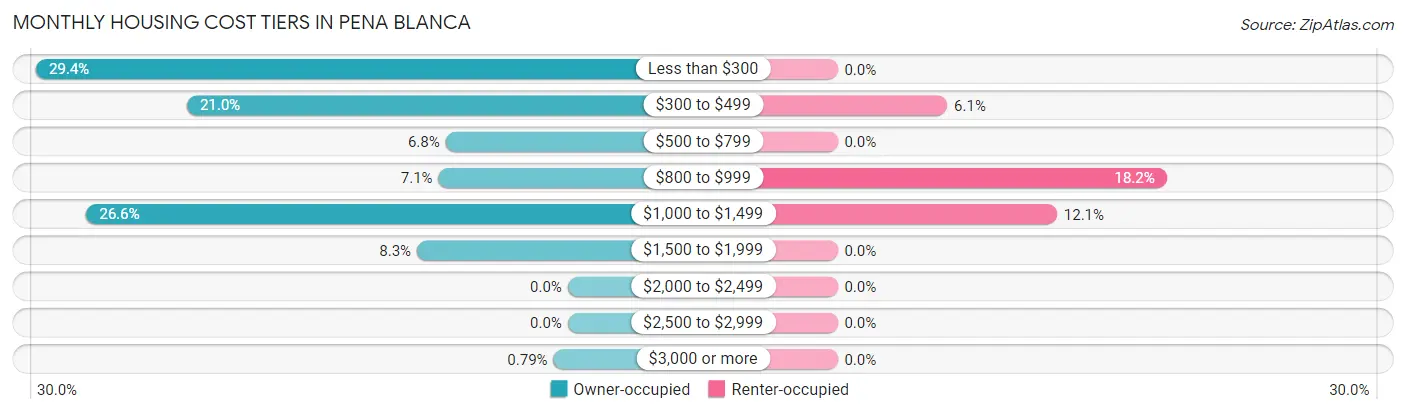
| Monthly Cost | Owner-occupied | Renter-occupied |
| Less than $300 | 74 (29.4%) | 0 (0.0%) |
| $300 to $499 | 53 (21.0%) | 2 (6.1%) |
| $500 to $799 | 17 (6.8%) | 0 (0.0%) |
| $800 to $999 | 18 (7.1%) | 6 (18.2%) |
| $1,000 to $1,499 | 67 (26.6%) | 4 (12.1%) |
| $1,500 to $1,999 | 21 (8.3%) | 0 (0.0%) |
| $2,000 to $2,499 | 0 (0.0%) | 0 (0.0%) |
| $2,500 to $2,999 | 0 (0.0%) | 0 (0.0%) |
| $3,000 or more | 2 (0.8%) | 0 (0.0%) |
| Total | 252 (100.0%) | 33 (100.0%) |
Physical Housing Characteristics in Pena Blanca
Housing Structures in Pena Blanca
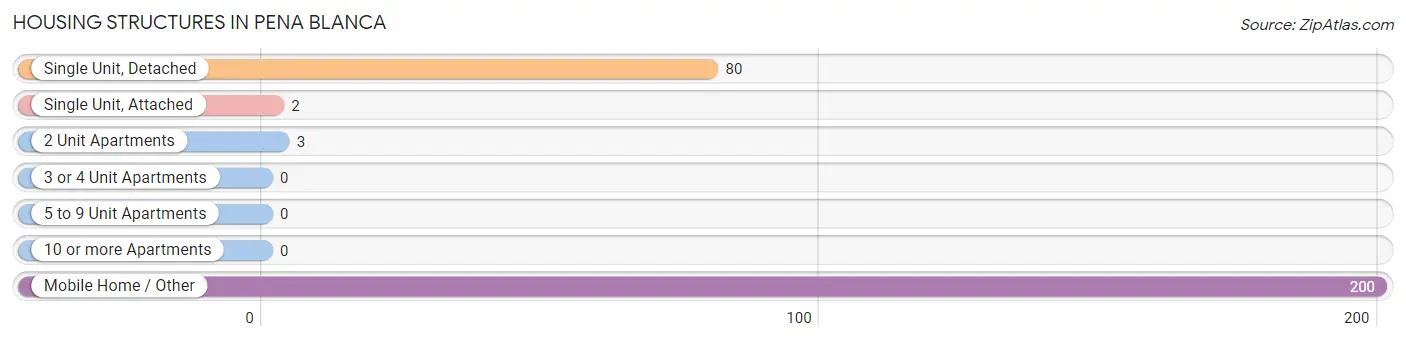
| Structure Type | # Housing Units | % Housing Units |
| Single Unit, Detached | 80 | 28.1% |
| Single Unit, Attached | 2 | 0.7% |
| 2 Unit Apartments | 3 | 1.1% |
| 3 or 4 Unit Apartments | 0 | 0.0% |
| 5 to 9 Unit Apartments | 0 | 0.0% |
| 10 or more Apartments | 0 | 0.0% |
| Mobile Home / Other | 200 | 70.2% |
| Total | 285 | 100.0% |
Housing Structures by Occupancy in Pena Blanca
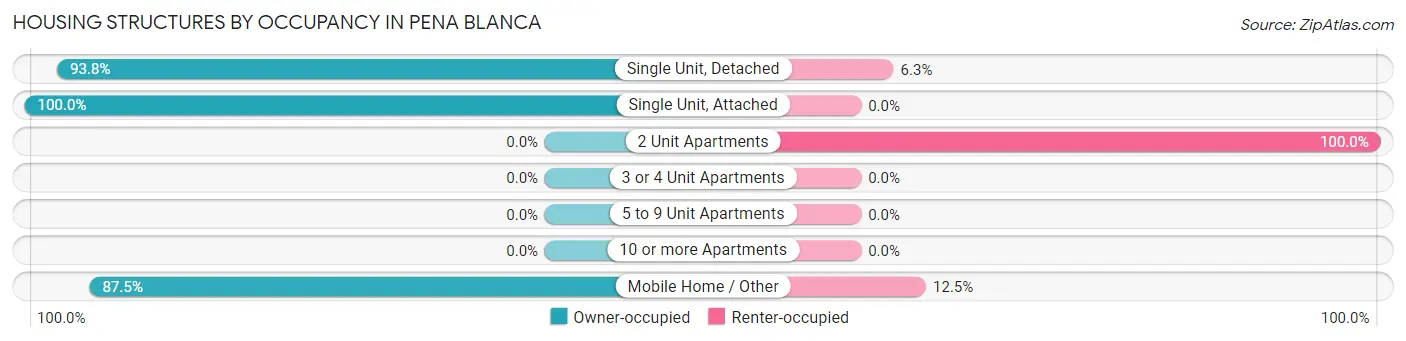
| Structure Type | Owner-occupied | Renter-occupied |
| Single Unit, Detached | 75 (93.8%) | 5 (6.2%) |
| Single Unit, Attached | 2 (100.0%) | 0 (0.0%) |
| 2 Unit Apartments | 0 (0.0%) | 3 (100.0%) |
| 3 or 4 Unit Apartments | 0 (0.0%) | 0 (0.0%) |
| 5 to 9 Unit Apartments | 0 (0.0%) | 0 (0.0%) |
| 10 or more Apartments | 0 (0.0%) | 0 (0.0%) |
| Mobile Home / Other | 175 (87.5%) | 25 (12.5%) |
| Total | 252 (88.4%) | 33 (11.6%) |
Housing Structures by Number of Rooms in Pena Blanca
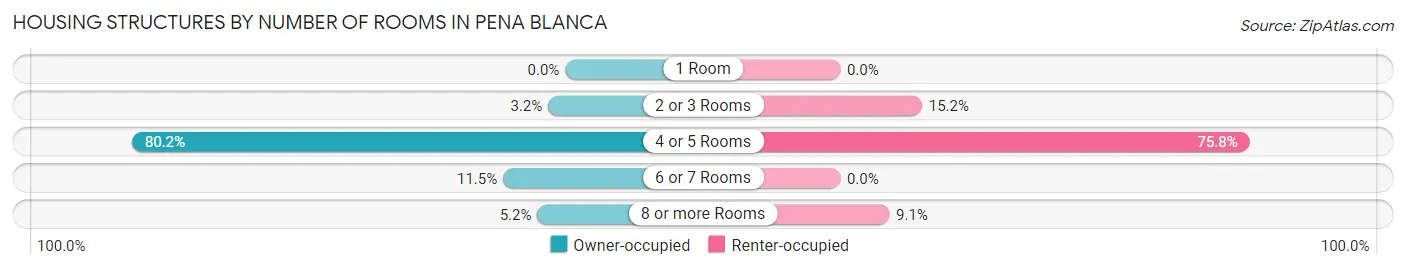
| Number of Rooms | Owner-occupied | Renter-occupied |
| 1 Room | 0 (0.0%) | 0 (0.0%) |
| 2 or 3 Rooms | 8 (3.2%) | 5 (15.1%) |
| 4 or 5 Rooms | 202 (80.2%) | 25 (75.8%) |
| 6 or 7 Rooms | 29 (11.5%) | 0 (0.0%) |
| 8 or more Rooms | 13 (5.2%) | 3 (9.1%) |
| Total | 252 (100.0%) | 33 (100.0%) |
Housing Structure by Heating Type in Pena Blanca
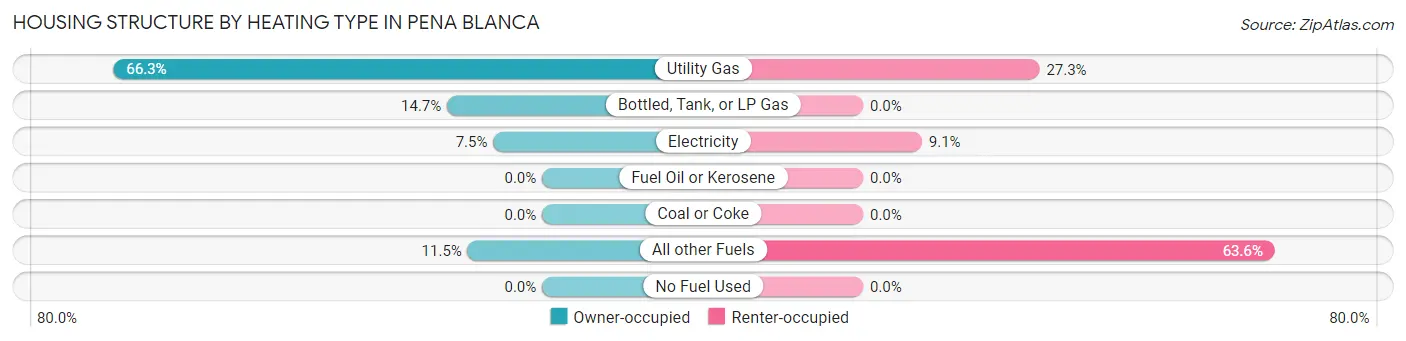
| Heating Type | Owner-occupied | Renter-occupied |
| Utility Gas | 167 (66.3%) | 9 (27.3%) |
| Bottled, Tank, or LP Gas | 37 (14.7%) | 0 (0.0%) |
| Electricity | 19 (7.5%) | 3 (9.1%) |
| Fuel Oil or Kerosene | 0 (0.0%) | 0 (0.0%) |
| Coal or Coke | 0 (0.0%) | 0 (0.0%) |
| All other Fuels | 29 (11.5%) | 21 (63.6%) |
| No Fuel Used | 0 (0.0%) | 0 (0.0%) |
| Total | 252 (100.0%) | 33 (100.0%) |
Household Vehicle Usage in Pena Blanca
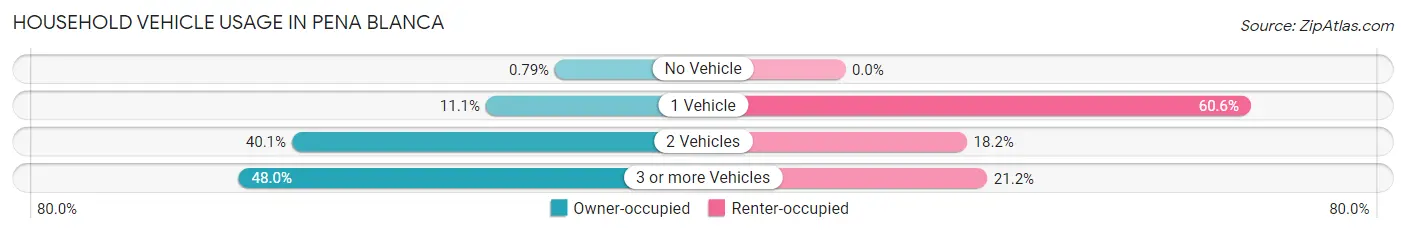
| Vehicles per Household | Owner-occupied | Renter-occupied |
| No Vehicle | 2 (0.8%) | 0 (0.0%) |
| 1 Vehicle | 28 (11.1%) | 20 (60.6%) |
| 2 Vehicles | 101 (40.1%) | 6 (18.2%) |
| 3 or more Vehicles | 121 (48.0%) | 7 (21.2%) |
| Total | 252 (100.0%) | 33 (100.0%) |
Real Estate & Mortgages in Pena Blanca
Real Estate and Mortgage Overview in Pena Blanca
| Characteristic | Without Mortgage | With Mortgage |
| Housing Units | 146 | 106 |
| Median Property Value | $201,800 | $159,600 |
| Median Household Income | $63,750 | $14 |
| Monthly Housing Costs | $297 | $2 |
| Real Estate Taxes | $287 | $11 |
Property Value by Mortgage Status in Pena Blanca
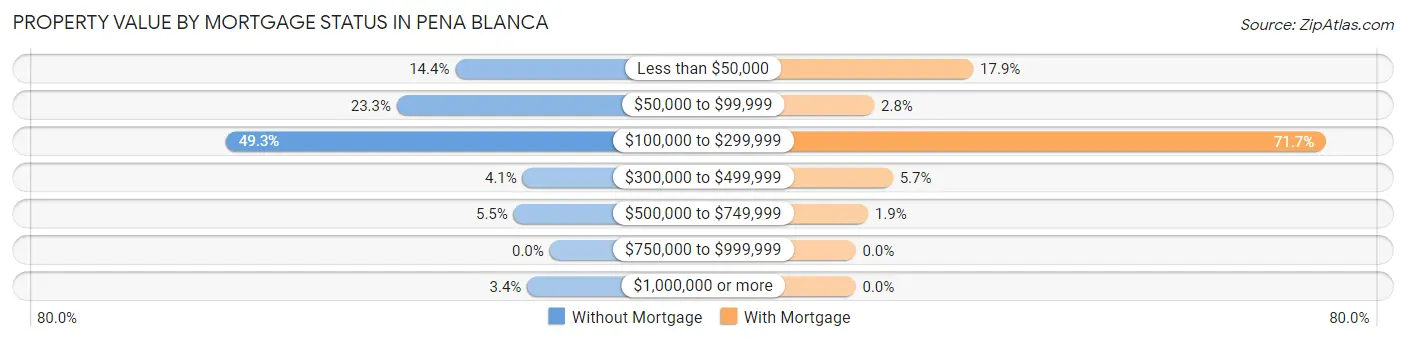
| Property Value | Without Mortgage | With Mortgage |
| Less than $50,000 | 21 (14.4%) | 19 (17.9%) |
| $50,000 to $99,999 | 34 (23.3%) | 3 (2.8%) |
| $100,000 to $299,999 | 72 (49.3%) | 76 (71.7%) |
| $300,000 to $499,999 | 6 (4.1%) | 6 (5.7%) |
| $500,000 to $749,999 | 8 (5.5%) | 2 (1.9%) |
| $750,000 to $999,999 | 0 (0.0%) | 0 (0.0%) |
| $1,000,000 or more | 5 (3.4%) | 0 (0.0%) |
| Total | 146 (100.0%) | 106 (100.0%) |
Household Income by Mortgage Status in Pena Blanca
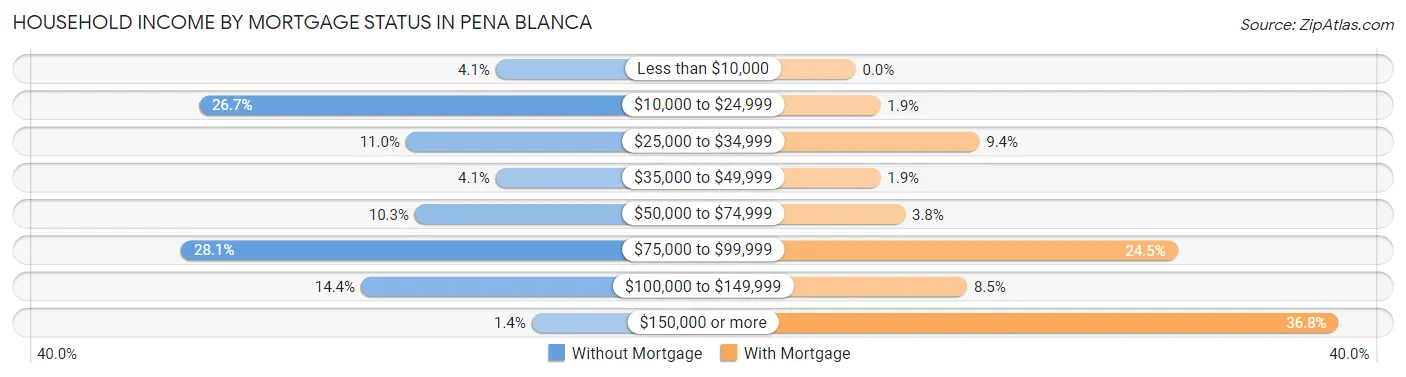
| Household Income | Without Mortgage | With Mortgage |
| Less than $10,000 | 6 (4.1%) | 0 (0.0%) |
| $10,000 to $24,999 | 39 (26.7%) | 2 (1.9%) |
| $25,000 to $34,999 | 16 (11.0%) | 10 (9.4%) |
| $35,000 to $49,999 | 6 (4.1%) | 2 (1.9%) |
| $50,000 to $74,999 | 15 (10.3%) | 4 (3.8%) |
| $75,000 to $99,999 | 41 (28.1%) | 26 (24.5%) |
| $100,000 to $149,999 | 21 (14.4%) | 9 (8.5%) |
| $150,000 or more | 2 (1.4%) | 39 (36.8%) |
| Total | 146 (100.0%) | 106 (100.0%) |
Property Value to Household Income Ratio in Pena Blanca
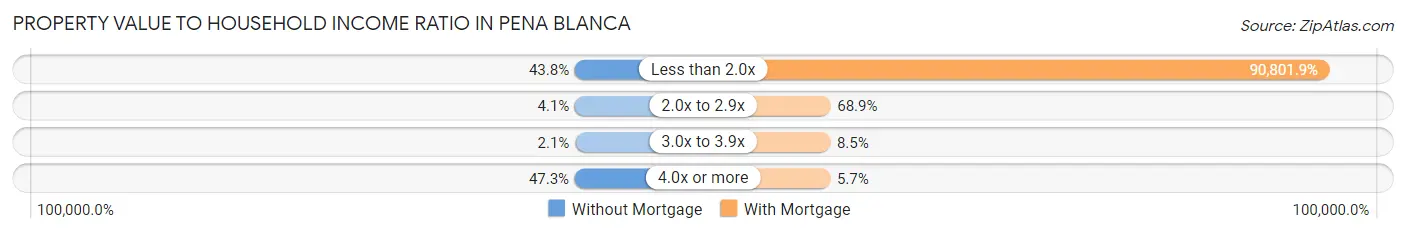
| Value-to-Income Ratio | Without Mortgage | With Mortgage |
| Less than 2.0x | 64 (43.8%) | 96,250 (90,801.9%) |
| 2.0x to 2.9x | 6 (4.1%) | 73 (68.9%) |
| 3.0x to 3.9x | 3 (2.1%) | 9 (8.5%) |
| 4.0x or more | 69 (47.3%) | 6 (5.7%) |
| Total | 146 (100.0%) | 106 (100.0%) |
Real Estate Taxes by Mortgage Status in Pena Blanca

| Property Taxes | Without Mortgage | With Mortgage |
| Less than $800 | 95 (65.1%) | 2 (1.9%) |
| $800 to $1,499 | 21 (14.4%) | 18 (17.0%) |
| $800 to $1,499 | 15 (10.3%) | 51 (48.1%) |
| Total | 146 (100.0%) | 106 (100.0%) |
Health & Disability in Pena Blanca
Health Insurance Coverage by Age in Pena Blanca
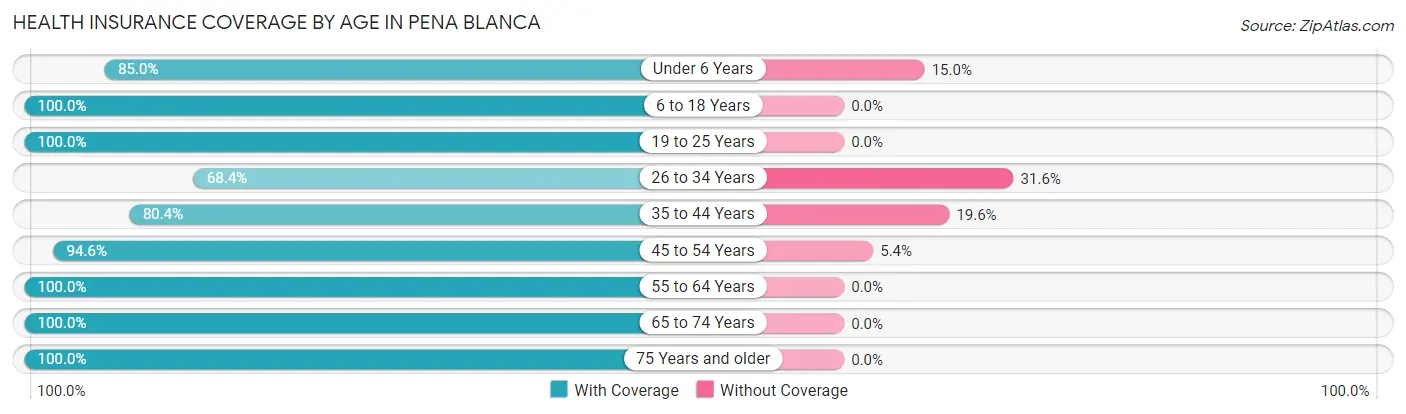
| Age Bracket | With Coverage | Without Coverage |
| Under 6 Years | 17 (85.0%) | 3 (15.0%) |
| 6 to 18 Years | 125 (100.0%) | 0 (0.0%) |
| 19 to 25 Years | 77 (100.0%) | 0 (0.0%) |
| 26 to 34 Years | 26 (68.4%) | 12 (31.6%) |
| 35 to 44 Years | 82 (80.4%) | 20 (19.6%) |
| 45 to 54 Years | 140 (94.6%) | 8 (5.4%) |
| 55 to 64 Years | 96 (100.0%) | 0 (0.0%) |
| 65 to 74 Years | 58 (100.0%) | 0 (0.0%) |
| 75 Years and older | 21 (100.0%) | 0 (0.0%) |
| Total | 642 (93.7%) | 43 (6.3%) |
Health Insurance Coverage by Citizenship Status in Pena Blanca
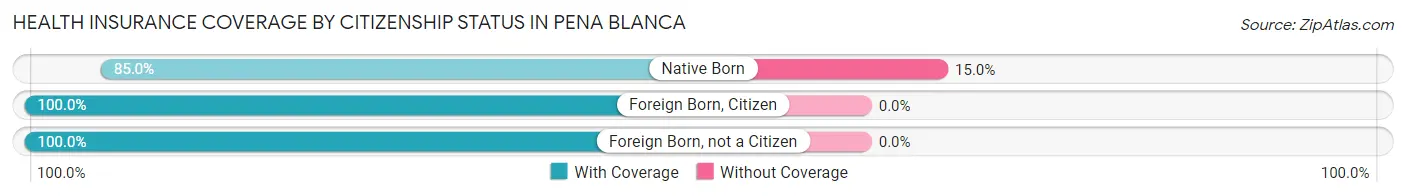
| Citizenship Status | With Coverage | Without Coverage |
| Native Born | 17 (85.0%) | 3 (15.0%) |
| Foreign Born, Citizen | 125 (100.0%) | 0 (0.0%) |
| Foreign Born, not a Citizen | 77 (100.0%) | 0 (0.0%) |
Health Insurance Coverage by Household Income in Pena Blanca
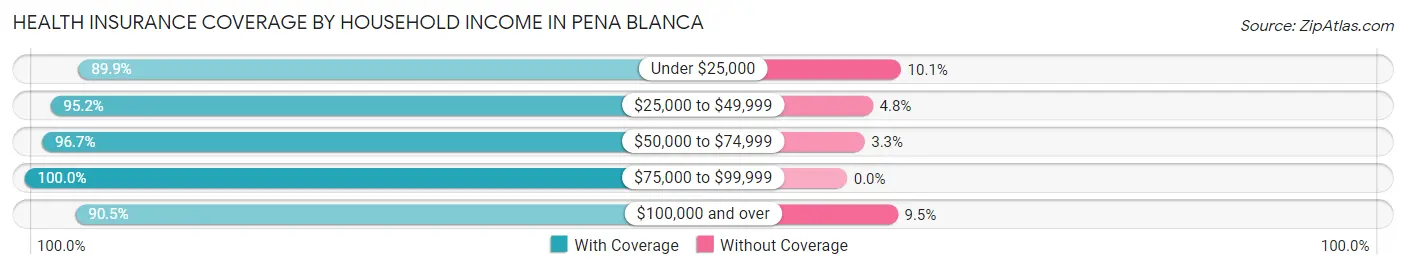
| Household Income | With Coverage | Without Coverage |
| Under $25,000 | 98 (89.9%) | 11 (10.1%) |
| $25,000 to $49,999 | 59 (95.2%) | 3 (4.8%) |
| $50,000 to $74,999 | 118 (96.7%) | 4 (3.3%) |
| $75,000 to $99,999 | 129 (100.0%) | 0 (0.0%) |
| $100,000 and over | 238 (90.5%) | 25 (9.5%) |
Public vs Private Health Insurance Coverage by Age in Pena Blanca
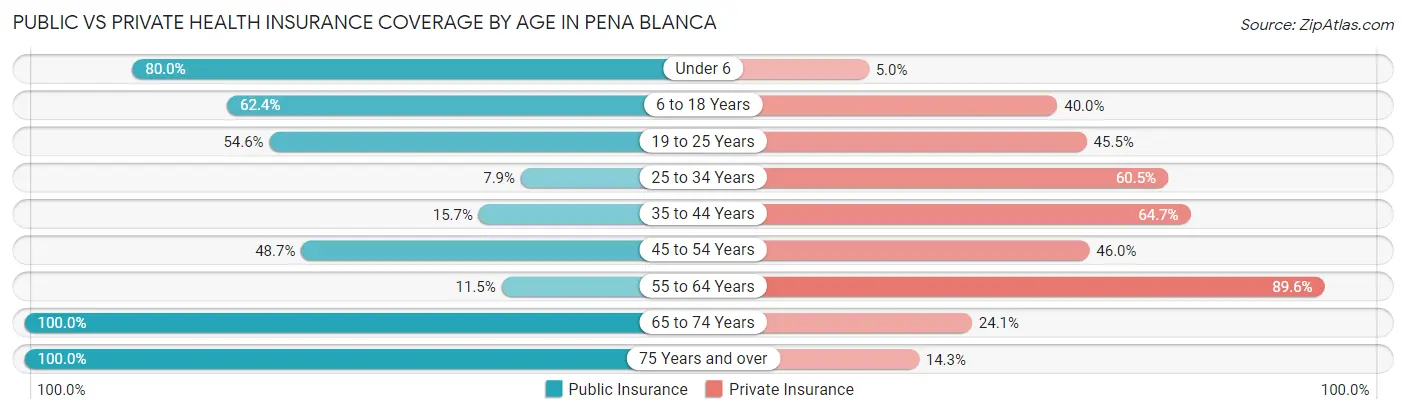
| Age Bracket | Public Insurance | Private Insurance |
| Under 6 | 16 (80.0%) | 1 (5.0%) |
| 6 to 18 Years | 78 (62.4%) | 50 (40.0%) |
| 19 to 25 Years | 42 (54.5%) | 35 (45.5%) |
| 25 to 34 Years | 3 (7.9%) | 23 (60.5%) |
| 35 to 44 Years | 16 (15.7%) | 66 (64.7%) |
| 45 to 54 Years | 72 (48.6%) | 68 (46.0%) |
| 55 to 64 Years | 11 (11.5%) | 86 (89.6%) |
| 65 to 74 Years | 58 (100.0%) | 14 (24.1%) |
| 75 Years and over | 21 (100.0%) | 3 (14.3%) |
| Total | 317 (46.3%) | 346 (50.5%) |
Disability Status by Sex by Age in Pena Blanca
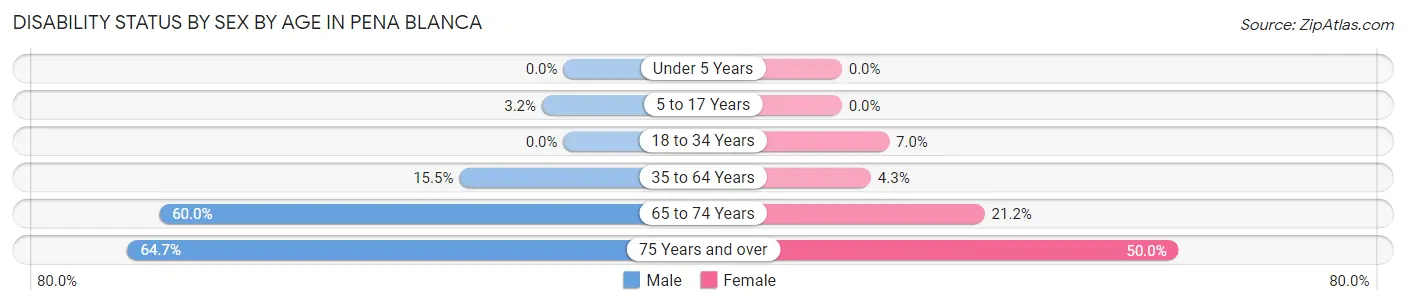
| Age Bracket | Male | Female |
| Under 5 Years | 0 (0.0%) | 0 (0.0%) |
| 5 to 17 Years | 3 (3.2%) | 0 (0.0%) |
| 18 to 34 Years | 0 (0.0%) | 4 (7.0%) |
| 35 to 64 Years | 32 (15.5%) | 6 (4.3%) |
| 65 to 74 Years | 15 (60.0%) | 7 (21.2%) |
| 75 Years and over | 11 (64.7%) | 2 (50.0%) |
Disability Class by Sex by Age in Pena Blanca
Disability Class: Hearing Difficulty
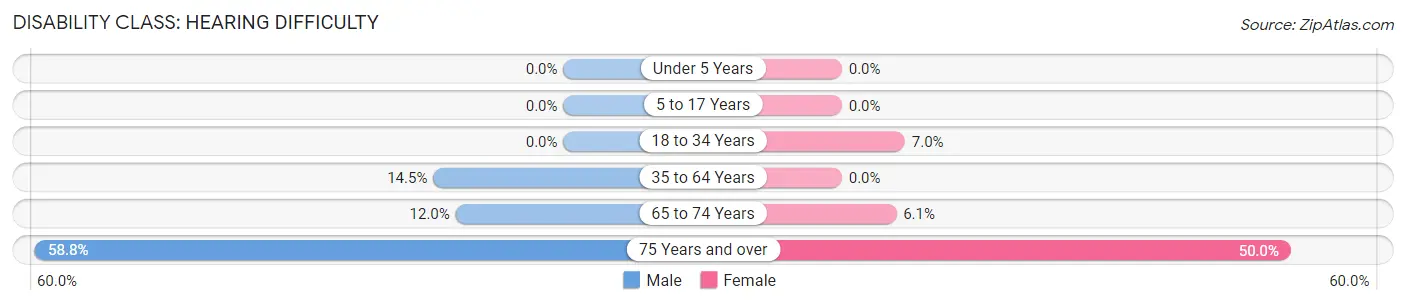
| Age Bracket | Male | Female |
| Under 5 Years | 0 (0.0%) | 0 (0.0%) |
| 5 to 17 Years | 0 (0.0%) | 0 (0.0%) |
| 18 to 34 Years | 0 (0.0%) | 4 (7.0%) |
| 35 to 64 Years | 30 (14.5%) | 0 (0.0%) |
| 65 to 74 Years | 3 (12.0%) | 2 (6.1%) |
| 75 Years and over | 10 (58.8%) | 2 (50.0%) |
Disability Class: Vision Difficulty
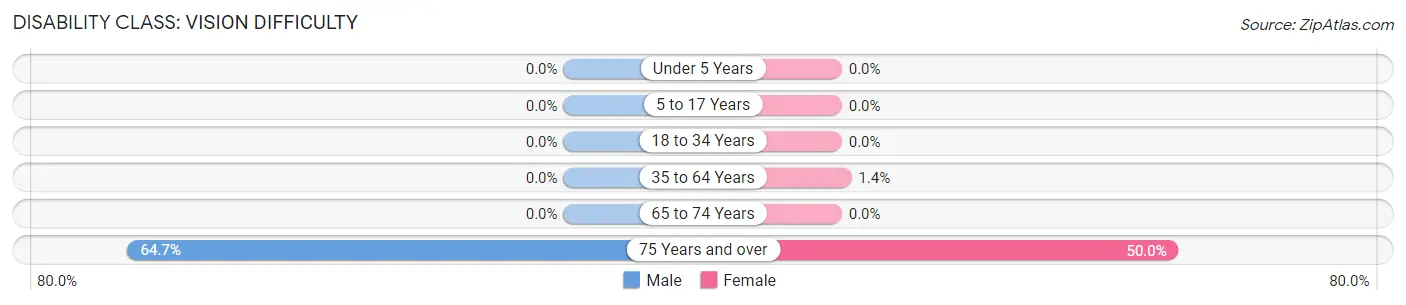
| Age Bracket | Male | Female |
| Under 5 Years | 0 (0.0%) | 0 (0.0%) |
| 5 to 17 Years | 0 (0.0%) | 0 (0.0%) |
| 18 to 34 Years | 0 (0.0%) | 0 (0.0%) |
| 35 to 64 Years | 0 (0.0%) | 2 (1.4%) |
| 65 to 74 Years | 0 (0.0%) | 0 (0.0%) |
| 75 Years and over | 11 (64.7%) | 2 (50.0%) |
Disability Class: Cognitive Difficulty
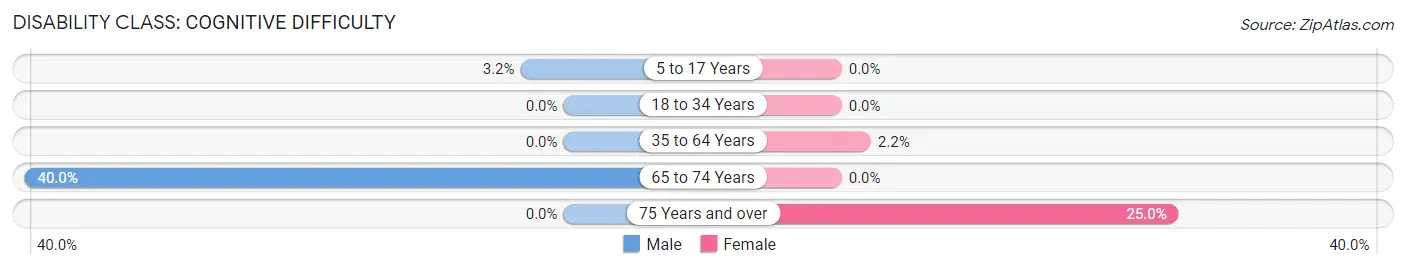
| Age Bracket | Male | Female |
| 5 to 17 Years | 3 (3.2%) | 0 (0.0%) |
| 18 to 34 Years | 0 (0.0%) | 0 (0.0%) |
| 35 to 64 Years | 0 (0.0%) | 3 (2.2%) |
| 65 to 74 Years | 10 (40.0%) | 0 (0.0%) |
| 75 Years and over | 0 (0.0%) | 1 (25.0%) |
Disability Class: Ambulatory Difficulty
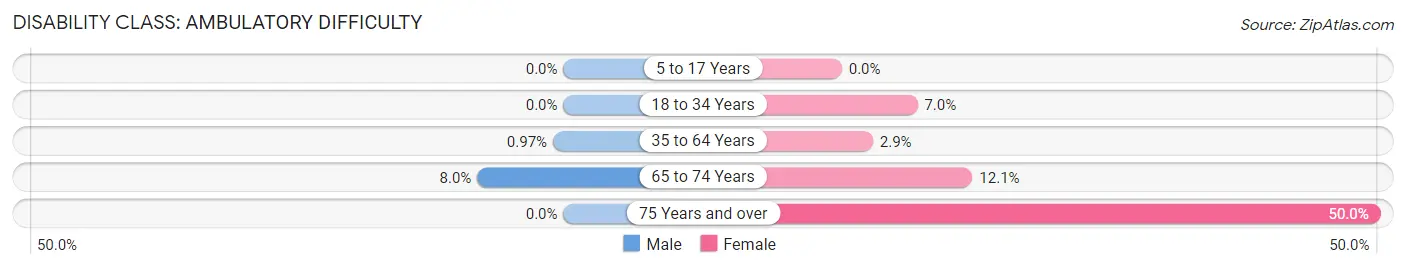
| Age Bracket | Male | Female |
| 5 to 17 Years | 0 (0.0%) | 0 (0.0%) |
| 18 to 34 Years | 0 (0.0%) | 4 (7.0%) |
| 35 to 64 Years | 2 (1.0%) | 4 (2.9%) |
| 65 to 74 Years | 2 (8.0%) | 4 (12.1%) |
| 75 Years and over | 0 (0.0%) | 2 (50.0%) |
Disability Class: Self-Care Difficulty
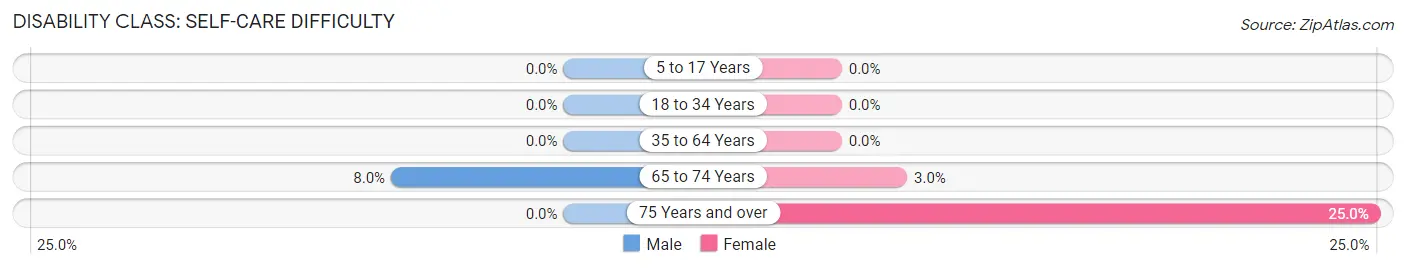
| Age Bracket | Male | Female |
| 5 to 17 Years | 0 (0.0%) | 0 (0.0%) |
| 18 to 34 Years | 0 (0.0%) | 0 (0.0%) |
| 35 to 64 Years | 0 (0.0%) | 0 (0.0%) |
| 65 to 74 Years | 2 (8.0%) | 1 (3.0%) |
| 75 Years and over | 0 (0.0%) | 1 (25.0%) |
Technology Access in Pena Blanca
Computing Device Access in Pena Blanca
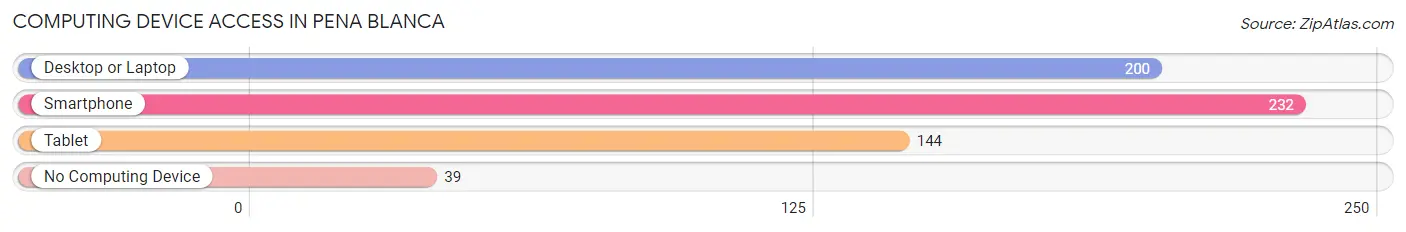
| Device Type | # Households | % Households |
| Desktop or Laptop | 200 | 70.2% |
| Smartphone | 232 | 81.4% |
| Tablet | 144 | 50.5% |
| No Computing Device | 39 | 13.7% |
| Total | 285 | 100.0% |
Internet Access in Pena Blanca
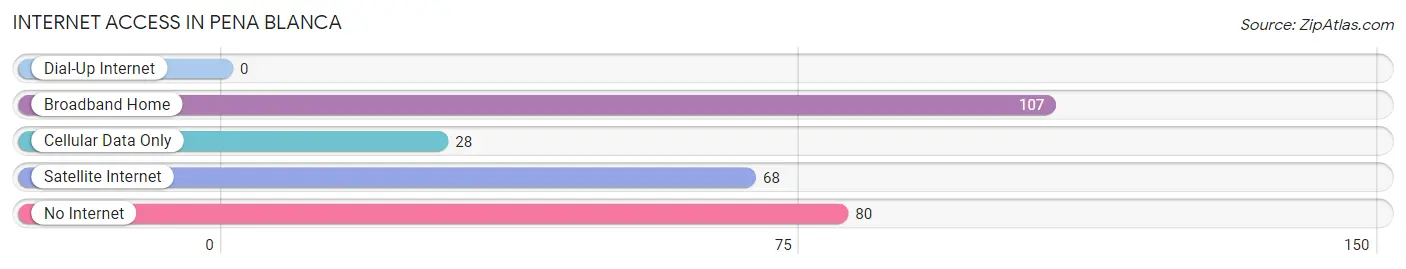
| Internet Type | # Households | % Households |
| Dial-Up Internet | 0 | 0.0% |
| Broadband Home | 107 | 37.5% |
| Cellular Data Only | 28 | 9.8% |
| Satellite Internet | 68 | 23.9% |
| No Internet | 80 | 28.1% |
| Total | 285 | 100.0% |
Pena Blanca Summary
Pena Blanca, New Mexico is a small unincorporated community located in Sandoval County, New Mexico. It is situated in the foothills of the Jemez Mountains, approximately 25 miles northwest of Albuquerque. The area is known for its scenic beauty, with the nearby Jemez Mountains providing a stunning backdrop.
History
Pena Blanca was originally inhabited by the Pueblo Indians, who lived in the area for centuries before the arrival of the Spanish in the late 1500s. The Spanish established a mission in the area in 1617, and the area was later settled by Mexican and American settlers in the late 1800s. The area was originally known as "La Pena Blanca," which translates to "White Rock," due to the large white rock formations in the area.
In the early 1900s, the area was home to a number of small farms and ranches. The area was also home to a number of small businesses, including a general store, a blacksmith shop, and a post office. The post office was established in 1910 and was in operation until the mid-1960s.
Geography
Pena Blanca is located in the foothills of the Jemez Mountains, approximately 25 miles northwest of Albuquerque. The area is characterized by rolling hills, mesas, and canyons. The area is also home to a number of small streams and rivers, including the Rio Grande. The climate in the area is semi-arid, with hot summers and mild winters.
Economy
The economy of Pena Blanca is largely based on agriculture and ranching. The area is home to a number of small farms and ranches, which produce a variety of crops, including alfalfa, hay, and corn. The area is also home to a number of small businesses, including a general store, a blacksmith shop, and a post office.
Demographics
As of the 2010 census, the population of Pena Blanca was 1,072. The population is largely Hispanic, with over 90% of the population identifying as Hispanic or Latino. The median household income in the area is $35,000, and the median home value is $125,000. The area is served by the Pena Blanca Independent School District.
Common Questions
What is Per Capita Income in Pena Blanca?
Per Capita income in Pena Blanca is $28,415.
What is the Median Family Income in Pena Blanca?
Median Family Income in Pena Blanca is $86,211.
What is the Median Household income in Pena Blanca?
Median Household Income in Pena Blanca is $65,104.
What is Income or Wage Gap in Pena Blanca?
Income or Wage Gap in Pena Blanca is 42.6%.
Women in Pena Blanca earn 57.4 cents for every dollar earned by a man.
What is Inequality or Gini Index in Pena Blanca?
Inequality or Gini Index in Pena Blanca is 0.40.
What is the Total Population of Pena Blanca?
Total Population of Pena Blanca is 688.
What is the Total Male Population of Pena Blanca?
Total Male Population of Pena Blanca is 409.
What is the Total Female Population of Pena Blanca?
Total Female Population of Pena Blanca is 279.
What is the Ratio of Males per 100 Females in Pena Blanca?
There are 146.59 Males per 100 Females in Pena Blanca.
What is the Ratio of Females per 100 Males in Pena Blanca?
There are 68.22 Females per 100 Males in Pena Blanca.
What is the Median Population Age in Pena Blanca?
Median Population Age in Pena Blanca is 42.4 Years.
What is the Average Family Size in Pena Blanca
Average Family Size in Pena Blanca is 3.1 People.
What is the Average Household Size in Pena Blanca
Average Household Size in Pena Blanca is 2.4 People.
How Large is the Labor Force in Pena Blanca?
There are 398 People in the Labor Forcein in Pena Blanca.
What is the Percentage of People in the Labor Force in Pena Blanca?
71.1% of People are in the Labor Force in Pena Blanca.
What is the Unemployment Rate in Pena Blanca?
Unemployment Rate in Pena Blanca is 5.6%.