Ventura, NM Map & Demographics
Ventura Map
Ventura Overview
$20,153
PER CAPITA INCOME
0.41
INEQUALITY / GINI INDEX
808
TOTAL POPULATION
324
MALE POPULATION
484
FEMALE POPULATION
66.94
MALES / 100 FEMALES
149.38
FEMALES / 100 MALES
41.5
MEDIAN AGE
3.2
AVG FAMILY SIZE
2.8
AVG HOUSEHOLD SIZE
143
LABOR FORCE [ PEOPLE ]
18.9%
PERCENT IN LABOR FORCE
Income in Ventura
Income Overview in Ventura
| Characteristic | Number | Measure |
| Per Capita Income | 808 | $20,153 |
| Median Family Income | 218 | $0 |
| Mean Family Income | 218 | $50,306 |
| Median Household Income | 294 | $0 |
| Mean Household Income | 294 | $50,878 |
| Income Deficit | 218 | $0 |
| Wage / Income Gap (%) | 808 | 0.00% |
| Wage / Income Gap ($) | 808 | 100.00¢ per $1 |
| Gini / Inequality Index | 808 | 0.41 |
Earnings by Sex in Ventura
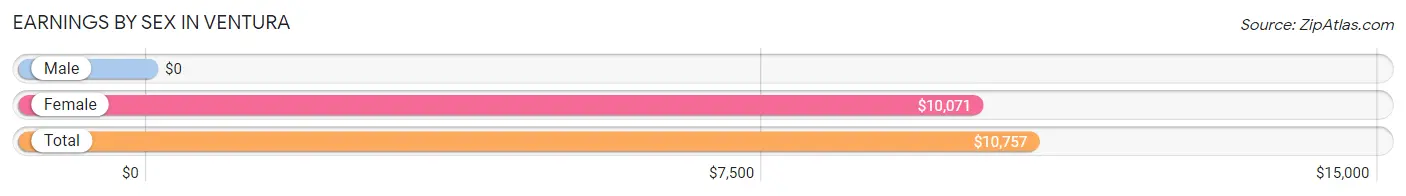
| Sex | Number | Average Earnings |
| Male | 59 (28.0%) | $0 |
| Female | 152 (72.0%) | $10,071 |
| Total | 211 (100.0%) | $10,757 |
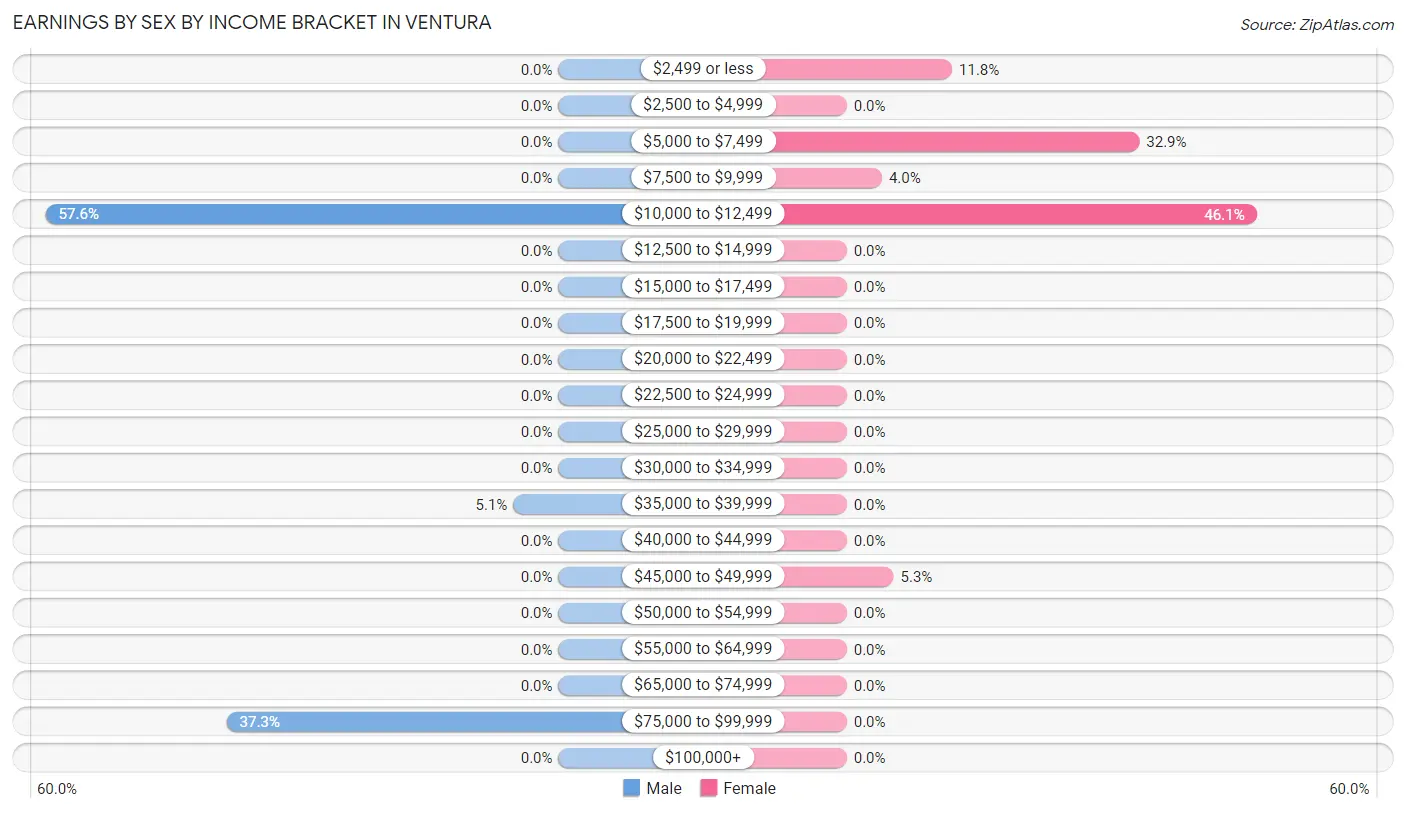
Earnings by Sex by Income Bracket in Ventura
The most common earnings brackets in Ventura are $10,000 to $12,499 for men (34 | 57.6%) and $10,000 to $12,499 for women (70 | 46.1%).
| Income | Male | Female |
| $2,499 or less | 0 (0.0%) | 18 (11.8%) |
| $2,500 to $4,999 | 0 (0.0%) | 0 (0.0%) |
| $5,000 to $7,499 | 0 (0.0%) | 50 (32.9%) |
| $7,500 to $9,999 | 0 (0.0%) | 6 (4.0%) |
| $10,000 to $12,499 | 34 (57.6%) | 70 (46.1%) |
| $12,500 to $14,999 | 0 (0.0%) | 0 (0.0%) |
| $15,000 to $17,499 | 0 (0.0%) | 0 (0.0%) |
| $17,500 to $19,999 | 0 (0.0%) | 0 (0.0%) |
| $20,000 to $22,499 | 0 (0.0%) | 0 (0.0%) |
| $22,500 to $24,999 | 0 (0.0%) | 0 (0.0%) |
| $25,000 to $29,999 | 0 (0.0%) | 0 (0.0%) |
| $30,000 to $34,999 | 0 (0.0%) | 0 (0.0%) |
| $35,000 to $39,999 | 3 (5.1%) | 0 (0.0%) |
| $40,000 to $44,999 | 0 (0.0%) | 0 (0.0%) |
| $45,000 to $49,999 | 0 (0.0%) | 8 (5.3%) |
| $50,000 to $54,999 | 0 (0.0%) | 0 (0.0%) |
| $55,000 to $64,999 | 0 (0.0%) | 0 (0.0%) |
| $65,000 to $74,999 | 0 (0.0%) | 0 (0.0%) |
| $75,000 to $99,999 | 22 (37.3%) | 0 (0.0%) |
| $100,000+ | 0 (0.0%) | 0 (0.0%) |
| Total | 59 (100.0%) | 152 (100.0%) |
Earnings by Sex by Educational Attainment in Ventura
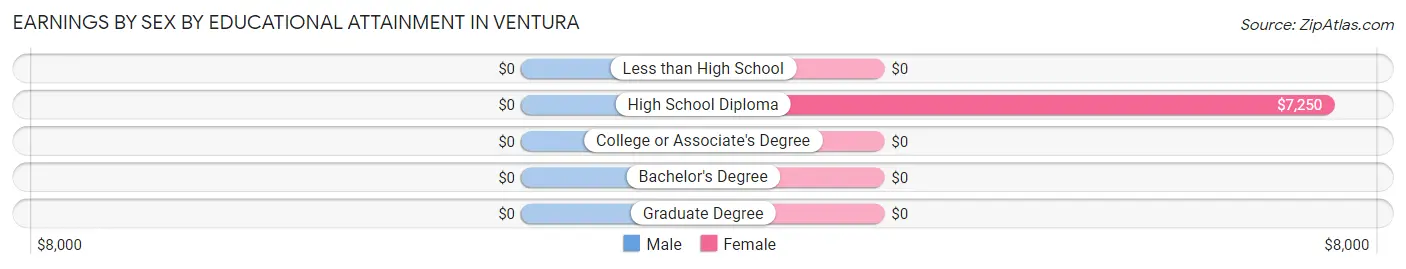
| Educational Attainment | Male Income | Female Income |
| Less than High School | - | - |
| High School Diploma | - | - |
| College or Associate's Degree | - | - |
| Bachelor's Degree | - | - |
| Graduate Degree | - | - |
| Total | - | - |
Family Income in Ventura
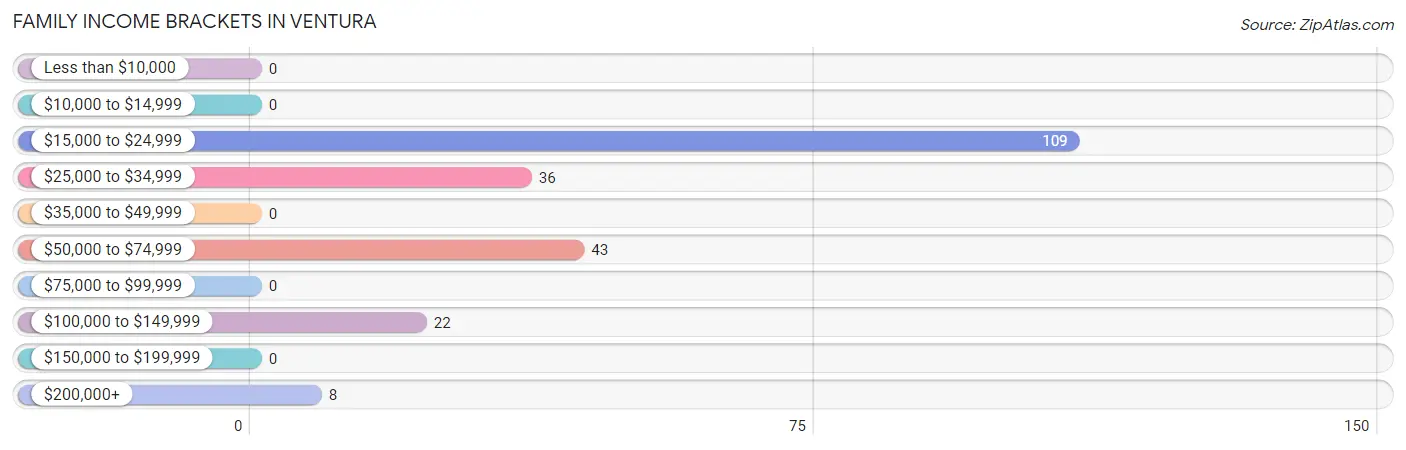
Family Income Brackets in Ventura
According to the Ventura family income data, there are 109 families falling into the $15,000 to $24,999 income range, which is the most common income bracket and makes up 50.0% of all families.
| Income Bracket | # Families | % Families |
| Less than $10,000 | 0 | 0.0% |
| $10,000 to $14,999 | 0 | 0.0% |
| $15,000 to $24,999 | 109 | 50.0% |
| $25,000 to $34,999 | 36 | 16.5% |
| $35,000 to $49,999 | 0 | 0.0% |
| $50,000 to $74,999 | 43 | 19.7% |
| $75,000 to $99,999 | 0 | 0.0% |
| $100,000 to $149,999 | 22 | 10.1% |
| $150,000 to $199,999 | 0 | 0.0% |
| $200,000+ | 8 | 3.7% |
Family Income by Famaliy Size in Ventura
| Income Bracket | # Families | Median Income |
| 2-Person Families | 99 (45.4%) | $0 |
| 3-Person Families | 83 (38.1%) | $0 |
| 4-Person Families | 36 (16.5%) | $0 |
| 5-Person Families | 0 (0.0%) | $0 |
| 6-Person Families | 0 (0.0%) | $0 |
| 7+ Person Families | 0 (0.0%) | $0 |
| Total | 218 (100.0%) | $0 |
Family Income by Number of Earners in Ventura
| Number of Earners | # Families | Median Income |
| No Earners | 43 (19.7%) | $0 |
| 1 Earner | 109 (50.0%) | $0 |
| 2 Earners | 66 (30.3%) | $0 |
| 3+ Earners | 0 (0.0%) | $0 |
| Total | 218 (100.0%) | $0 |
Household Income in Ventura
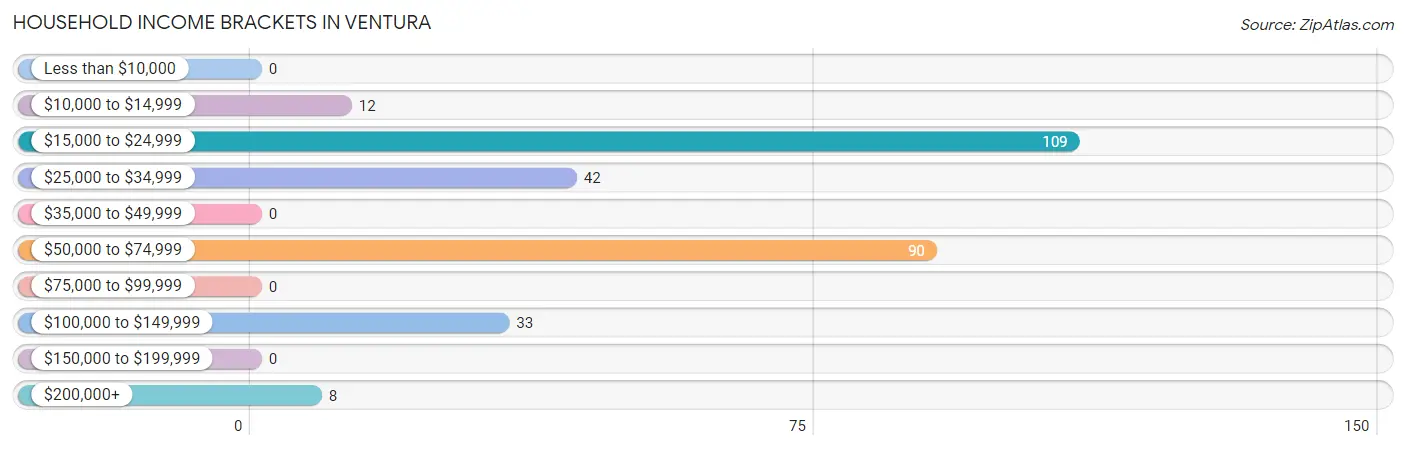
Household Income Brackets in Ventura
With 109 households falling in the category, the $15,000 to $24,999 income range is the most frequent in Ventura, accounting for 37.1% of all households.
| Income Bracket | # Households | % Households |
| Less than $10,000 | 0 | 0.0% |
| $10,000 to $14,999 | 12 | 4.1% |
| $15,000 to $24,999 | 109 | 37.1% |
| $25,000 to $34,999 | 42 | 14.3% |
| $35,000 to $49,999 | 0 | 0.0% |
| $50,000 to $74,999 | 90 | 30.6% |
| $75,000 to $99,999 | 0 | 0.0% |
| $100,000 to $149,999 | 33 | 11.2% |
| $150,000 to $199,999 | 0 | 0.0% |
| $200,000+ | 8 | 2.7% |
Household Income by Householder Age in Ventura
The median household income in Ventura is $0, with the highest median household income of $51,915 found in the 65+ years age bracket for the primary householder. A total of 108 households (36.7%) fall into this category.
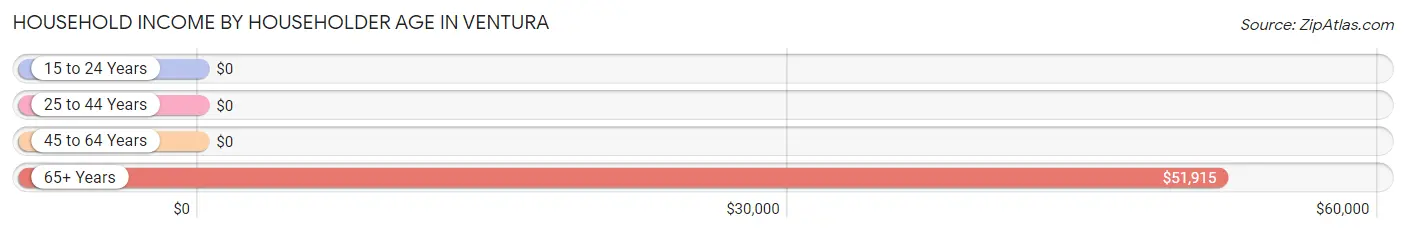
| Income Bracket | # Households | Median Income |
| 15 to 24 Years | 0 (0.0%) | $0 |
| 25 to 44 Years | 109 (37.1%) | $0 |
| 45 to 64 Years | 77 (26.2%) | $0 |
| 65+ Years | 108 (36.7%) | $51,915 |
| Total | 294 (100.0%) | $0 |
Poverty in Ventura
Income Below Poverty by Sex and Age in Ventura
With 41.4% poverty level for males and 66.9% for females among the residents of Ventura, 16 and 17 year old males and 6 to 11 year old females are the most vulnerable to poverty, with 25 males (100.0%) and 51 females (100.0%) in their respective age groups living below the poverty level.
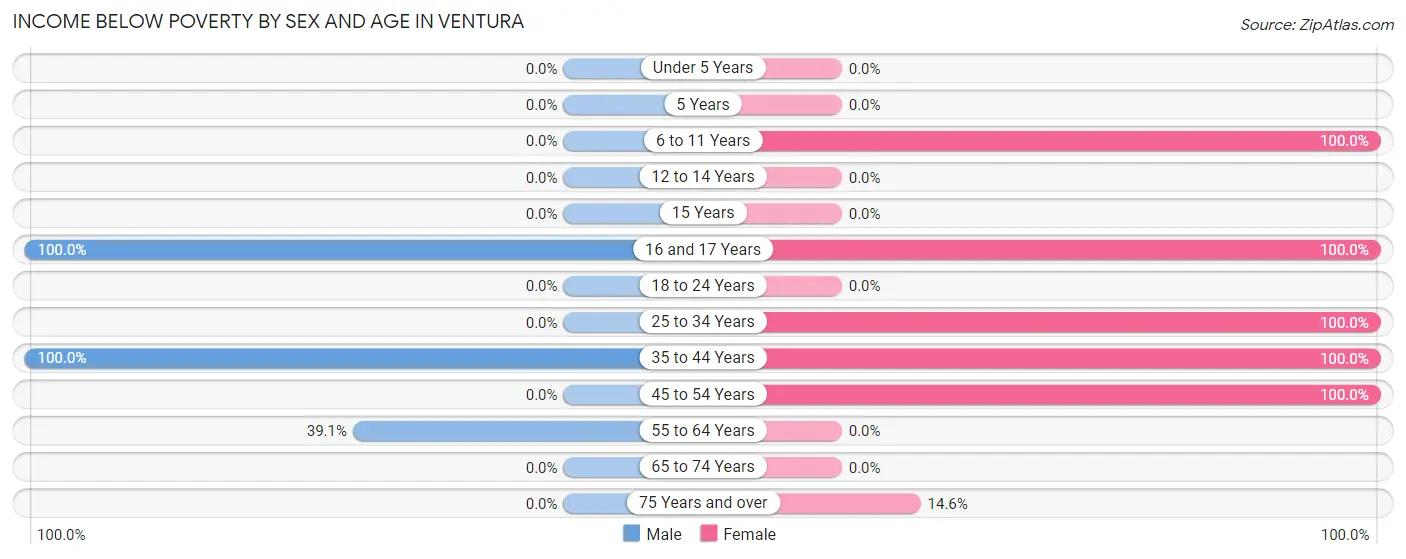
| Age Bracket | Male | Female |
| Under 5 Years | 0 (0.0%) | 0 (0.0%) |
| 5 Years | 0 (0.0%) | 0 (0.0%) |
| 6 to 11 Years | 0 (0.0%) | 51 (100.0%) |
| 12 to 14 Years | 0 (0.0%) | 0 (0.0%) |
| 15 Years | 0 (0.0%) | 0 (0.0%) |
| 16 and 17 Years | 25 (100.0%) | 141 (100.0%) |
| 18 to 24 Years | 0 (0.0%) | 0 (0.0%) |
| 25 to 34 Years | 0 (0.0%) | 34 (100.0%) |
| 35 to 44 Years | 75 (100.0%) | 50 (100.0%) |
| 45 to 54 Years | 0 (0.0%) | 36 (100.0%) |
| 55 to 64 Years | 34 (39.1%) | 0 (0.0%) |
| 65 to 74 Years | 0 (0.0%) | 0 (0.0%) |
| 75 Years and over | 0 (0.0%) | 12 (14.6%) |
| Total | 134 (41.4%) | 324 (66.9%) |
Income Above Poverty by Sex and Age in Ventura
According to the poverty statistics in Ventura, males aged 25 to 34 years and females aged 55 to 64 years are the age groups that are most secure financially, with 100.0% of males and 100.0% of females in these age groups living above the poverty line.
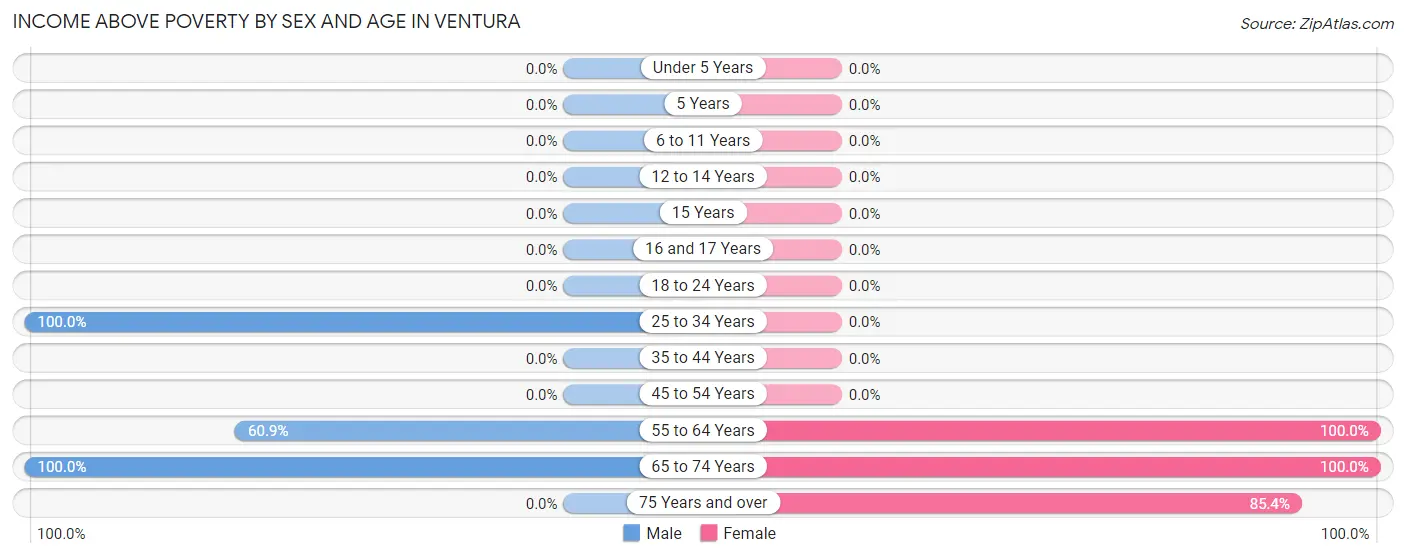
| Age Bracket | Male | Female |
| Under 5 Years | 0 (0.0%) | 0 (0.0%) |
| 5 Years | 0 (0.0%) | 0 (0.0%) |
| 6 to 11 Years | 0 (0.0%) | 0 (0.0%) |
| 12 to 14 Years | 0 (0.0%) | 0 (0.0%) |
| 15 Years | 0 (0.0%) | 0 (0.0%) |
| 16 and 17 Years | 0 (0.0%) | 0 (0.0%) |
| 18 to 24 Years | 0 (0.0%) | 0 (0.0%) |
| 25 to 34 Years | 94 (100.0%) | 0 (0.0%) |
| 35 to 44 Years | 0 (0.0%) | 0 (0.0%) |
| 45 to 54 Years | 0 (0.0%) | 0 (0.0%) |
| 55 to 64 Years | 53 (60.9%) | 37 (100.0%) |
| 65 to 74 Years | 43 (100.0%) | 53 (100.0%) |
| 75 Years and over | 0 (0.0%) | 70 (85.4%) |
| Total | 190 (58.6%) | 160 (33.1%) |
Income Below Poverty Among Married-Couple Families in Ventura
The poverty statistics for married-couple families in Ventura show that 60.3% or 111 of the total 184 families live below the poverty line. Families with 1 or 2 children have the highest poverty rate of 100.0%, comprising of 111 families. On the other hand, families with no children have the lowest poverty rate of 0.0%, which includes 0 families.
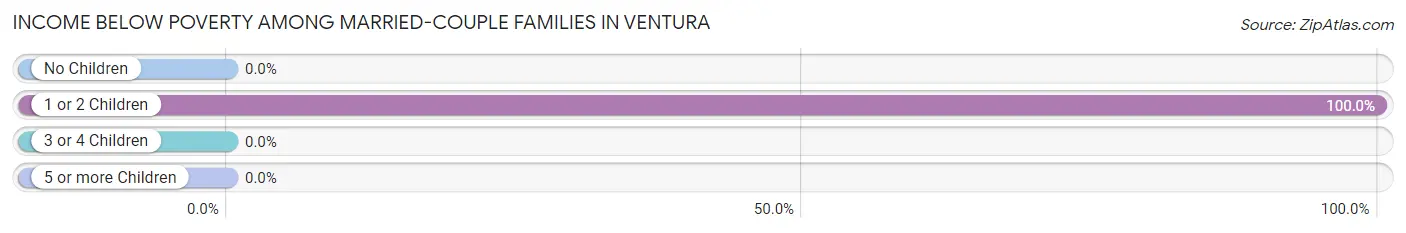
| Children | Above Poverty | Below Poverty |
| No Children | 73 (100.0%) | 0 (0.0%) |
| 1 or 2 Children | 0 (0.0%) | 111 (100.0%) |
| 3 or 4 Children | 0 (0.0%) | 0 (0.0%) |
| 5 or more Children | 0 (0.0%) | 0 (0.0%) |
| Total | 73 (39.7%) | 111 (60.3%) |
Income Below Poverty Among Single-Parent Households in Ventura
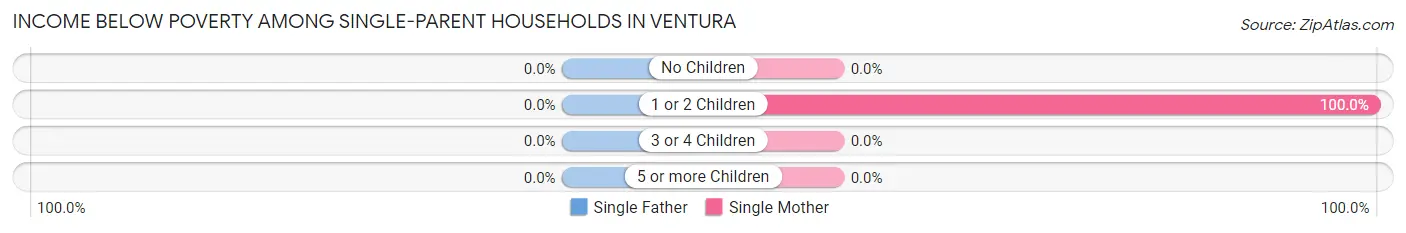
| Children | Single Father | Single Mother |
| No Children | 0 (0.0%) | 0 (0.0%) |
| 1 or 2 Children | 0 (0.0%) | 34 (100.0%) |
| 3 or 4 Children | 0 (0.0%) | 0 (0.0%) |
| 5 or more Children | 0 (0.0%) | 0 (0.0%) |
| Total | 0 (0.0%) | 34 (100.0%) |
Income Below Poverty Among Married-Couple vs Single-Parent Households in Ventura
The poverty data for Ventura shows that 111 of the married-couple family households (60.3%) and 34 of the single-parent households (100.0%) are living below the poverty level. Within the married-couple family households, those with 1 or 2 children have the highest poverty rate, with 111 households (100.0%) falling below the poverty line. Among the single-parent households, those with 1 or 2 children have the highest poverty rate, with 34 household (100.0%) living below poverty.
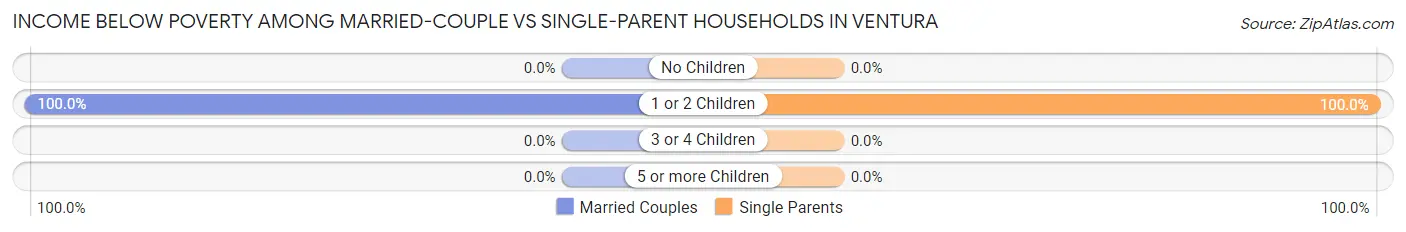
| Children | Married-Couple Families | Single-Parent Households |
| No Children | 0 (0.0%) | 0 (0.0%) |
| 1 or 2 Children | 111 (100.0%) | 34 (100.0%) |
| 3 or 4 Children | 0 (0.0%) | 0 (0.0%) |
| 5 or more Children | 0 (0.0%) | 0 (0.0%) |
| Total | 111 (60.3%) | 34 (100.0%) |
Race in Ventura
The most populous races in Ventura are White / Caucasian (649 | 80.3%), Hispanic or Latino (537 | 66.5%), and Some other Race (147 | 18.2%).
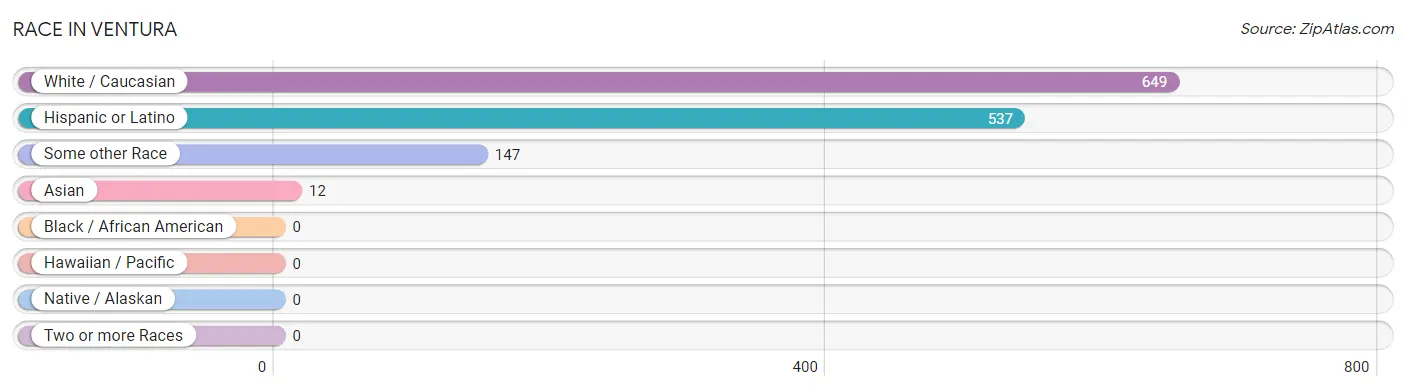
| Race | # Population | % Population |
| Asian | 12 | 1.5% |
| Black / African American | 0 | 0.0% |
| Hawaiian / Pacific | 0 | 0.0% |
| Hispanic or Latino | 537 | 66.5% |
| Native / Alaskan | 0 | 0.0% |
| White / Caucasian | 649 | 80.3% |
| Two or more Races | 0 | 0.0% |
| Some other Race | 147 | 18.2% |
| Total | 808 | 100.0% |
Ancestry in Ventura
The most populous ancestries reported in Ventura are Mexican (440 | 54.5%), Cuban (97 | 12.0%), American (76 | 9.4%), German (53 | 6.6%), and Dutch (47 | 5.8%), together accounting for 88.2% of all Ventura residents.
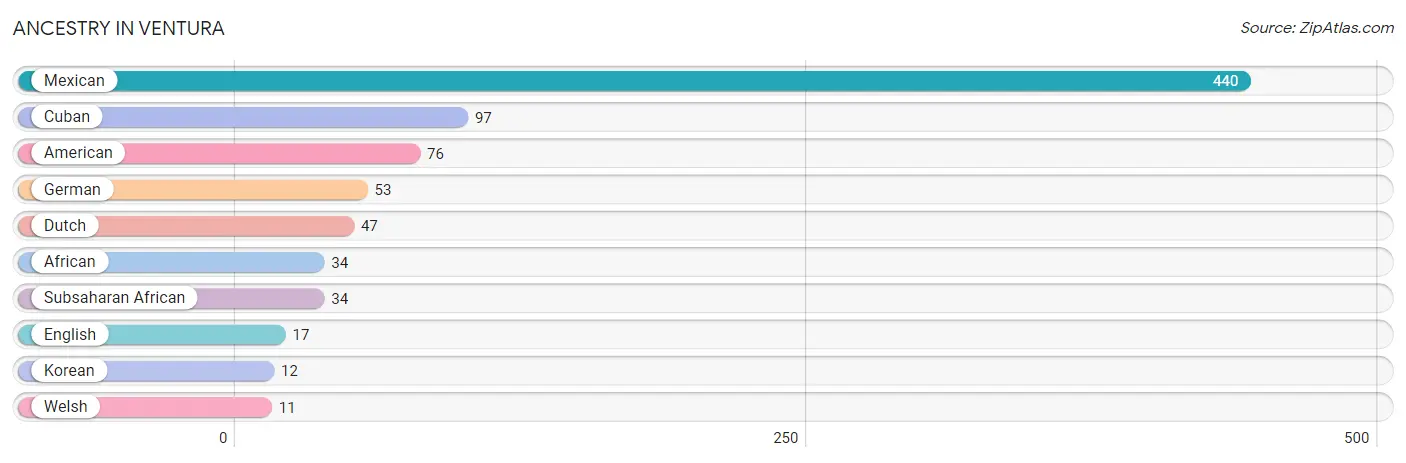
| Ancestry | # Population | % Population |
| African | 34 | 4.2% |
| American | 76 | 9.4% |
| Cuban | 97 | 12.0% |
| Dutch | 47 | 5.8% |
| English | 17 | 2.1% |
| German | 53 | 6.6% |
| Korean | 12 | 1.5% |
| Mexican | 440 | 54.5% |
| Subsaharan African | 34 | 4.2% |
| Welsh | 11 | 1.4% | View All 10 Rows |
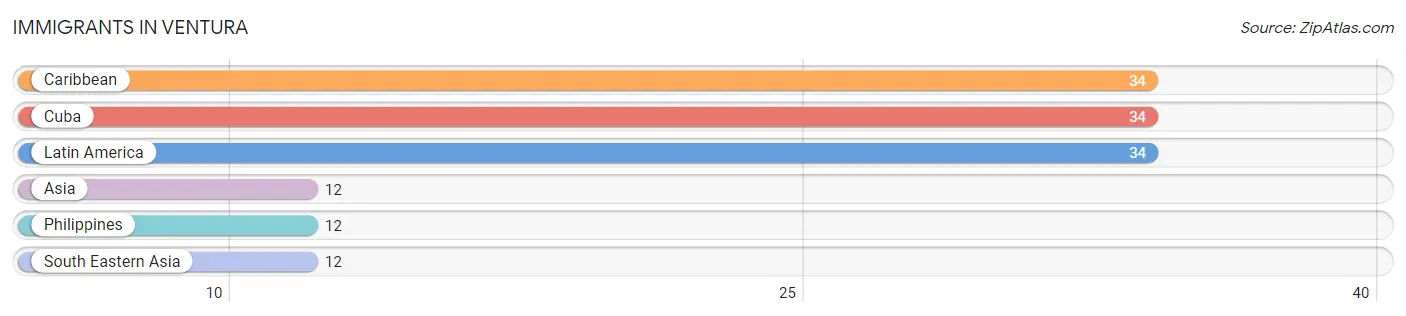
Immigrants in Ventura
The most numerous immigrant groups reported in Ventura came from Caribbean (34 | 4.2%), Cuba (34 | 4.2%), Latin America (34 | 4.2%), Asia (12 | 1.5%), and Philippines (12 | 1.5%), together accounting for 15.6% of all Ventura residents.
| Immigration Origin | # Population | % Population |
| Asia | 12 | 1.5% |
| Caribbean | 34 | 4.2% |
| Cuba | 34 | 4.2% |
| Latin America | 34 | 4.2% |
| Philippines | 12 | 1.5% |
| South Eastern Asia | 12 | 1.5% | View All 6 Rows |
Sex and Age in Ventura
Sex and Age in Ventura
The most populous age groups in Ventura are 30 to 34 Years (94 | 29.0%) for men and 15 to 19 Years (141 | 29.1%) for women.
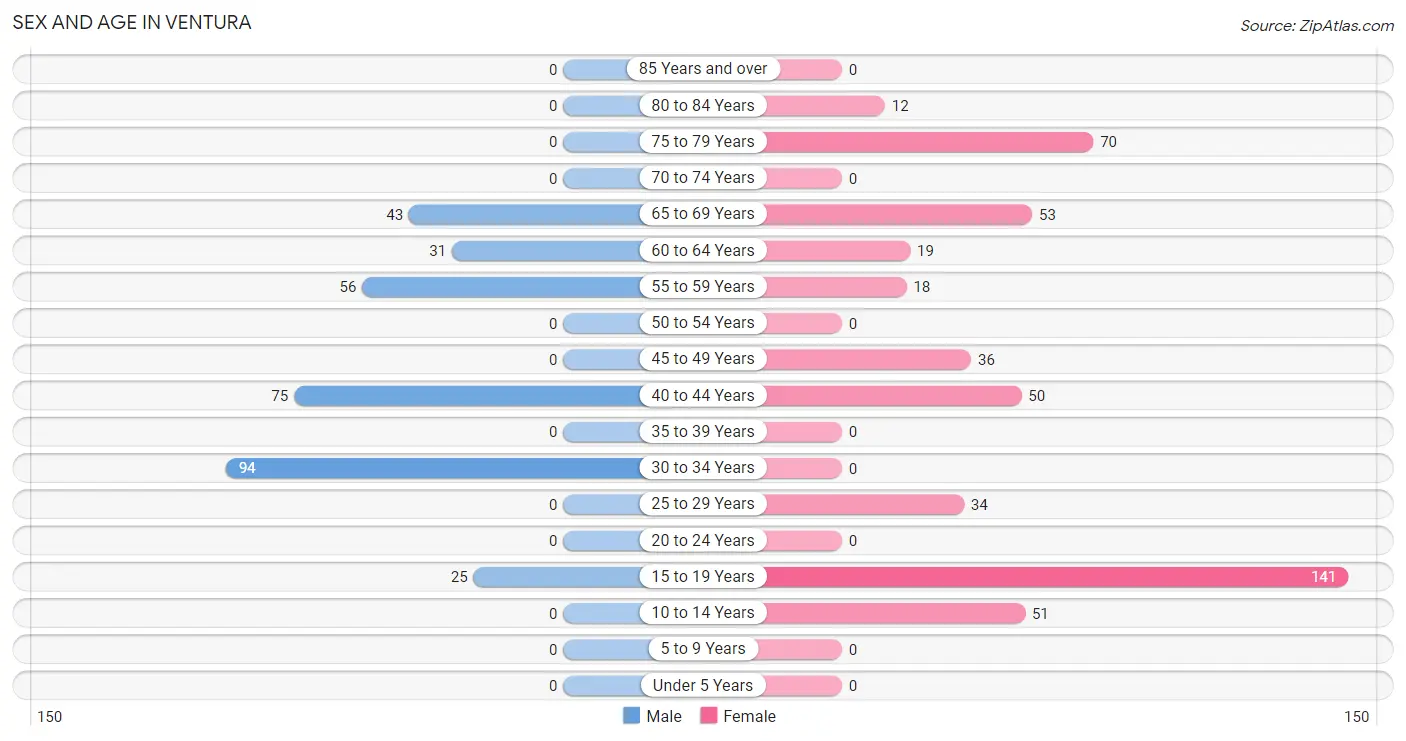
| Age Bracket | Male | Female |
| Under 5 Years | 0 (0.0%) | 0 (0.0%) |
| 5 to 9 Years | 0 (0.0%) | 0 (0.0%) |
| 10 to 14 Years | 0 (0.0%) | 51 (10.5%) |
| 15 to 19 Years | 25 (7.7%) | 141 (29.1%) |
| 20 to 24 Years | 0 (0.0%) | 0 (0.0%) |
| 25 to 29 Years | 0 (0.0%) | 34 (7.0%) |
| 30 to 34 Years | 94 (29.0%) | 0 (0.0%) |
| 35 to 39 Years | 0 (0.0%) | 0 (0.0%) |
| 40 to 44 Years | 75 (23.2%) | 50 (10.3%) |
| 45 to 49 Years | 0 (0.0%) | 36 (7.4%) |
| 50 to 54 Years | 0 (0.0%) | 0 (0.0%) |
| 55 to 59 Years | 56 (17.3%) | 18 (3.7%) |
| 60 to 64 Years | 31 (9.6%) | 19 (3.9%) |
| 65 to 69 Years | 43 (13.3%) | 53 (11.0%) |
| 70 to 74 Years | 0 (0.0%) | 0 (0.0%) |
| 75 to 79 Years | 0 (0.0%) | 70 (14.5%) |
| 80 to 84 Years | 0 (0.0%) | 12 (2.5%) |
| 85 Years and over | 0 (0.0%) | 0 (0.0%) |
| Total | 324 (100.0%) | 484 (100.0%) |
Families and Households in Ventura
Median Family Size in Ventura
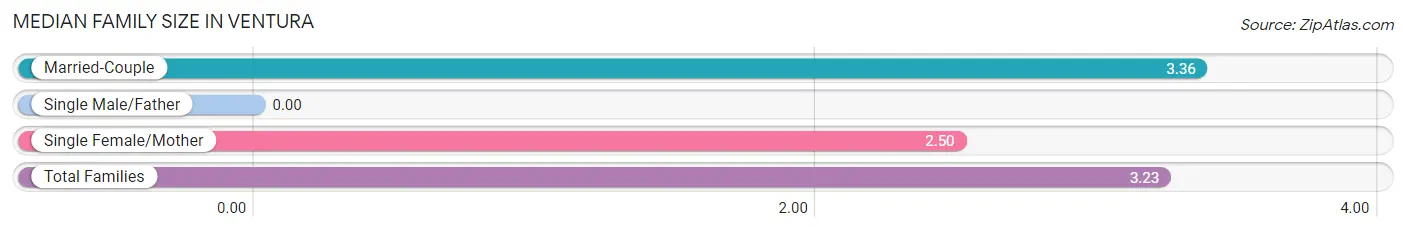
| Family Type | # Families | Family Size |
| Married-Couple | 184 (84.4%) | 3.36 |
| Single Male/Father | 0 (0.0%) | - |
| Single Female/Mother | 34 (15.6%) | 2.50 |
| Total Families | 218 (100.0%) | 3.23 |
Median Household Size in Ventura
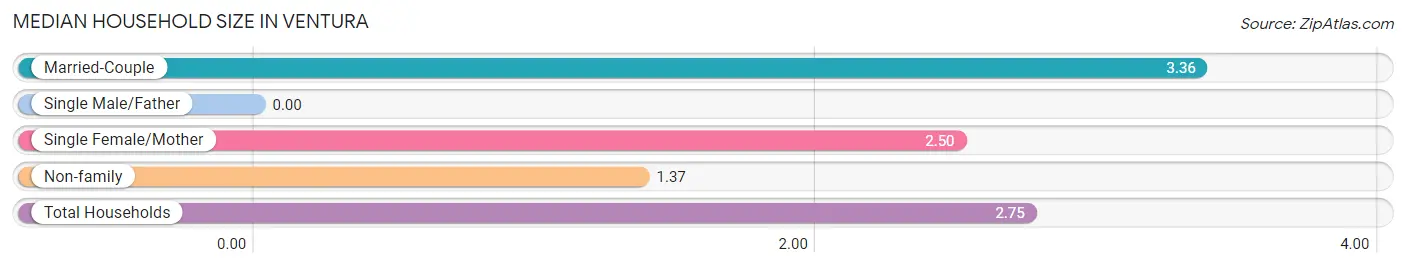
| Household Type | # Households | Household Size |
| Married-Couple | 184 (62.6%) | 3.36 |
| Single Male/Father | 0 (0.0%) | - |
| Single Female/Mother | 34 (11.6%) | 2.50 |
| Non-family | 76 (25.9%) | 1.37 |
| Total Households | 294 (100.0%) | 2.75 |
Household Size by Marriage Status in Ventura
Out of a total of 294 households in Ventura, 218 (74.2%) are family households, while 76 (25.9%) are nonfamily households. The most numerous type of family households are 2-person households, comprising 99, and the most common type of nonfamily households are 1-person households, comprising 65.
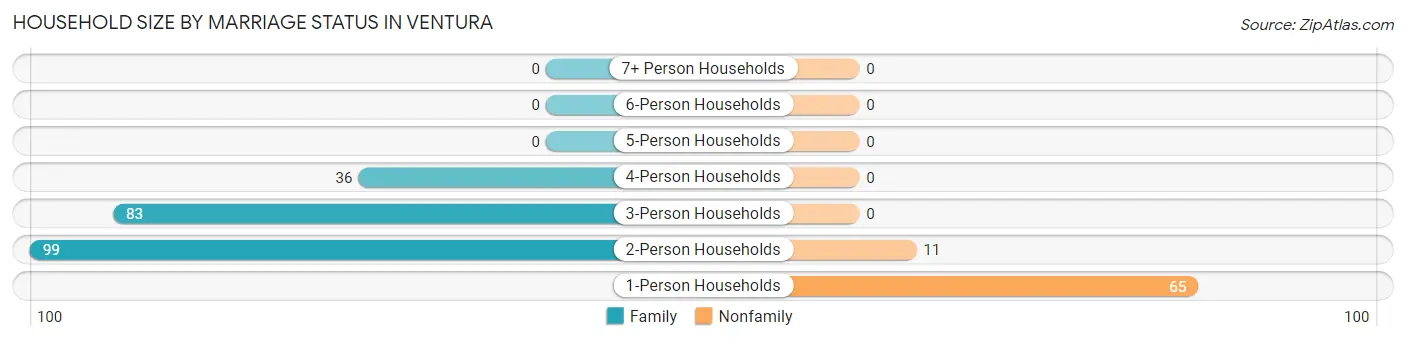
| Household Size | Family Households | Nonfamily Households |
| 1-Person Households | - | 65 (22.1%) |
| 2-Person Households | 99 (33.7%) | 11 (3.7%) |
| 3-Person Households | 83 (28.2%) | 0 (0.0%) |
| 4-Person Households | 36 (12.2%) | 0 (0.0%) |
| 5-Person Households | 0 (0.0%) | 0 (0.0%) |
| 6-Person Households | 0 (0.0%) | 0 (0.0%) |
| 7+ Person Households | 0 (0.0%) | 0 (0.0%) |
| Total | 218 (74.2%) | 76 (25.9%) |
Female Fertility in Ventura
Fertility by Age in Ventura
| Age Bracket | Women with Births | Births / 1,000 Women |
| 15 to 19 years | 0 (0.0%) | 0.0 |
| 20 to 34 years | 0 (0.0%) | 0.0 |
| 35 to 50 years | 0 (0.0%) | 0.0 |
| Total | 0 (0.0%) | 0.0 |
Fertility by Age by Marriage Status in Ventura
| Age Bracket | Married | Unmarried |
| 15 to 19 years | 0 (0.0%) | 0 (0.0%) |
| 20 to 34 years | 0 (0.0%) | 0 (0.0%) |
| 35 to 50 years | 0 (0.0%) | 0 (0.0%) |
| Total | 0 (0.0%) | 0 (0.0%) |
Fertility by Education in Ventura
| Educational Attainment | Women with Births | Births / 1,000 Women |
| Less than High School | 0 (0.0%) | 0.0 |
| High School Diploma | 0 (0.0%) | 0.0 |
| College or Associate's Degree | 0 (0.0%) | 0.0 |
| Bachelor's Degree | 0 (0.0%) | 0.0 |
| Graduate Degree | 0 (0.0%) | 0.0 |
| Total | 0 (0.0%) | 0.0 |
Fertility by Education by Marriage Status in Ventura
| Educational Attainment | Married | Unmarried |
| Less than High School | 0 (0.0%) | 0 (0.0%) |
| High School Diploma | 0 (0.0%) | 0 (0.0%) |
| College or Associate's Degree | 0 (0.0%) | 0 (0.0%) |
| Bachelor's Degree | 0 (0.0%) | 0 (0.0%) |
| Graduate Degree | 0 (0.0%) | 0 (0.0%) |
| Total | 0 (0.0%) | 0 (0.0%) |
Employment Characteristics in Ventura
Employment by Class of Employer in Ventura
Among the 143 employed individuals in Ventura, private company employees (126 | 88.1%), local government employees (14 | 9.8%), and not-for-profit organizations (3 | 2.1%) make up the most common classes of employment.
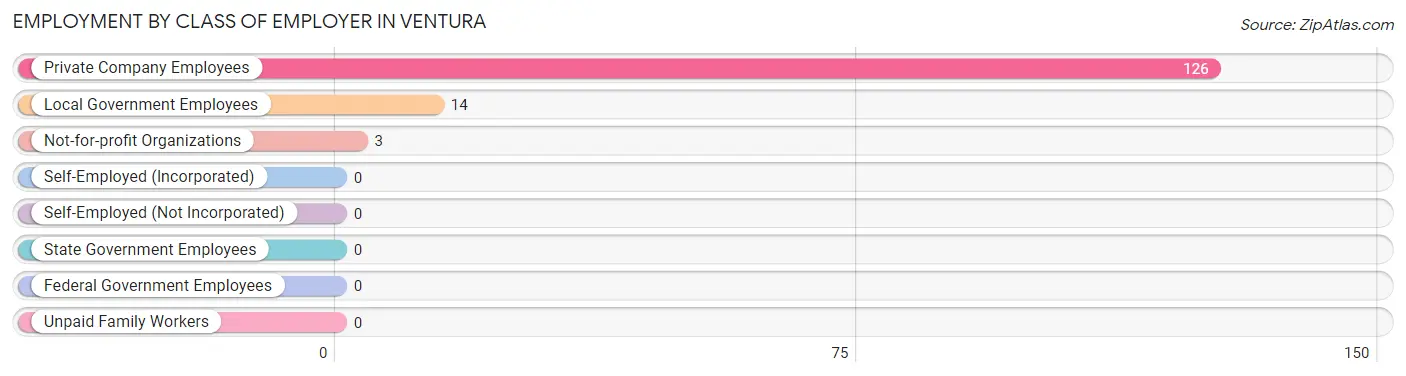
| Employer Class | # Employees | % Employees |
| Private Company Employees | 126 | 88.1% |
| Self-Employed (Incorporated) | 0 | 0.0% |
| Self-Employed (Not Incorporated) | 0 | 0.0% |
| Not-for-profit Organizations | 3 | 2.1% |
| Local Government Employees | 14 | 9.8% |
| State Government Employees | 0 | 0.0% |
| Federal Government Employees | 0 | 0.0% |
| Unpaid Family Workers | 0 | 0.0% |
| Total | 143 | 100.0% |
Employment Status by Age in Ventura
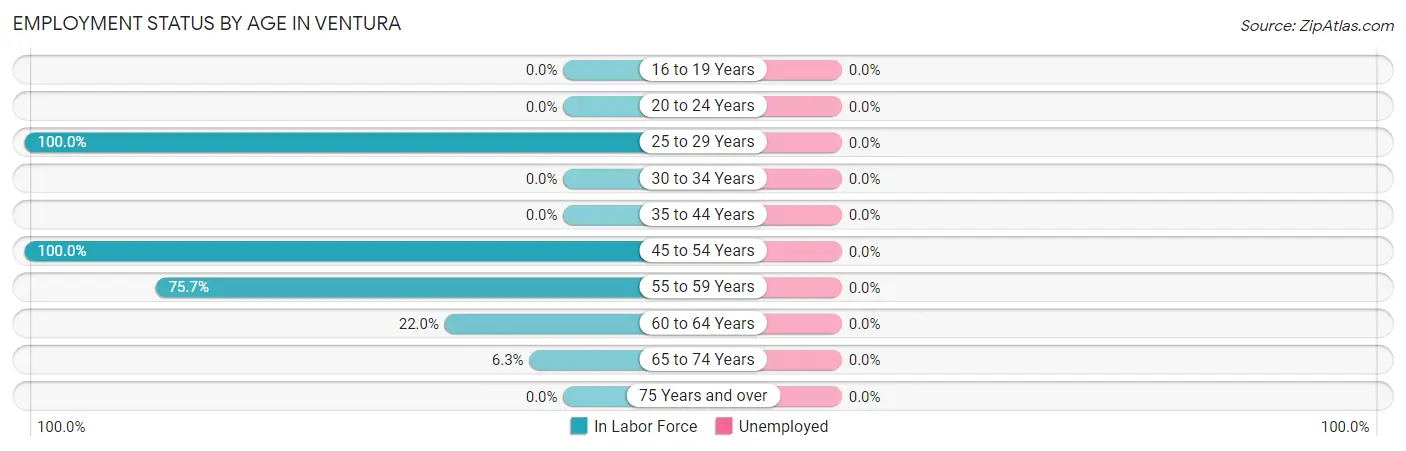
| Age Bracket | In Labor Force | Unemployed |
| 16 to 19 Years | 0 (0.0%) | 0 (0.0%) |
| 20 to 24 Years | 0 (0.0%) | 0 (0.0%) |
| 25 to 29 Years | 34 (100.0%) | 0 (0.0%) |
| 30 to 34 Years | 0 (0.0%) | 0 (0.0%) |
| 35 to 44 Years | 0 (0.0%) | 0 (0.0%) |
| 45 to 54 Years | 36 (100.0%) | 0 (0.0%) |
| 55 to 59 Years | 56 (75.7%) | 0 (0.0%) |
| 60 to 64 Years | 11 (22.0%) | 0 (0.0%) |
| 65 to 74 Years | 6 (6.3%) | 0 (0.0%) |
| 75 Years and over | 0 (0.0%) | 0 (0.0%) |
| Total | 143 (18.9%) | 0 (0.0%) |
Employment Status by Educational Attainment in Ventura
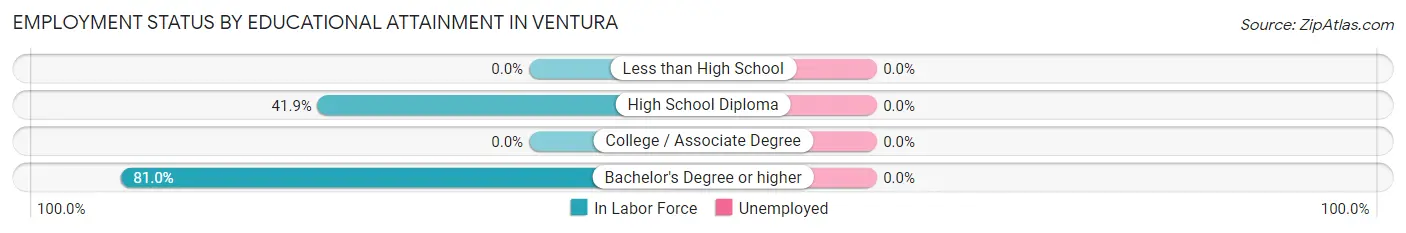
| Educational Attainment | In Labor Force | Unemployed |
| Less than High School | 0 (0.0%) | 0 (0.0%) |
| High School Diploma | 90 (41.9%) | 0 (0.0%) |
| College / Associate Degree | 0 (0.0%) | 0 (0.0%) |
| Bachelor's Degree or higher | 47 (81.0%) | 0 (0.0%) |
| Total | 137 (33.2%) | 0 (0.0%) |
Employment Occupations by Sex in Ventura
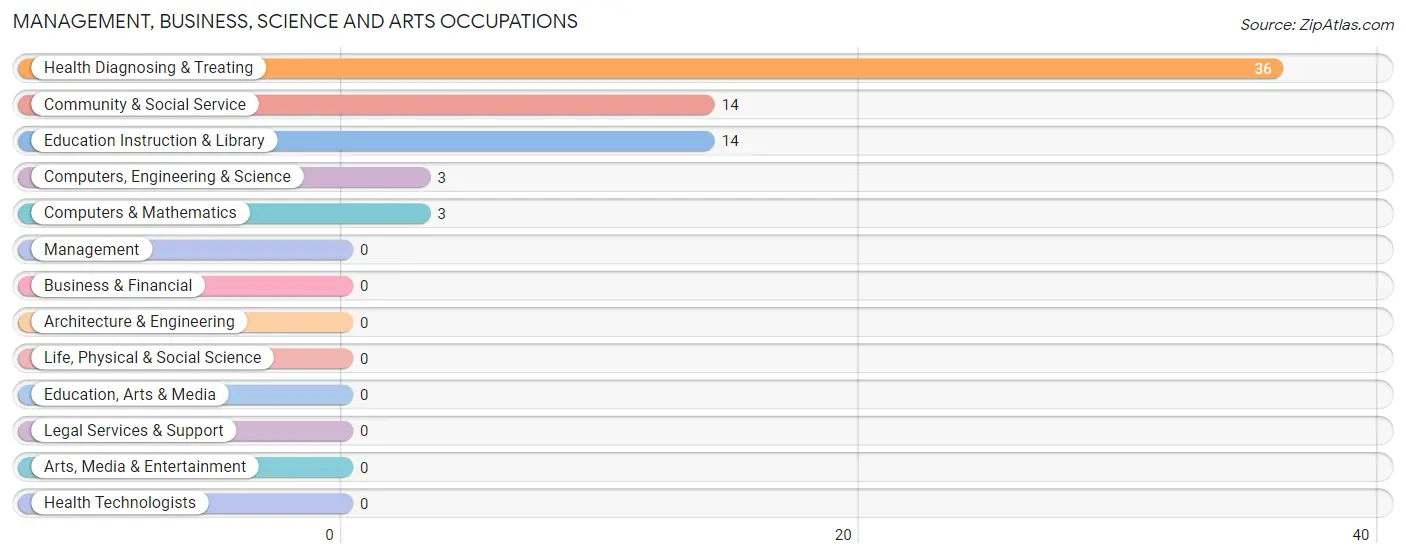
Management, Business, Science and Arts Occupations
The most common Management, Business, Science and Arts occupations in Ventura are Health Diagnosing & Treating (36 | 25.2%), Community & Social Service (14 | 9.8%), Education Instruction & Library (14 | 9.8%), Computers, Engineering & Science (3 | 2.1%), and Computers & Mathematics (3 | 2.1%).
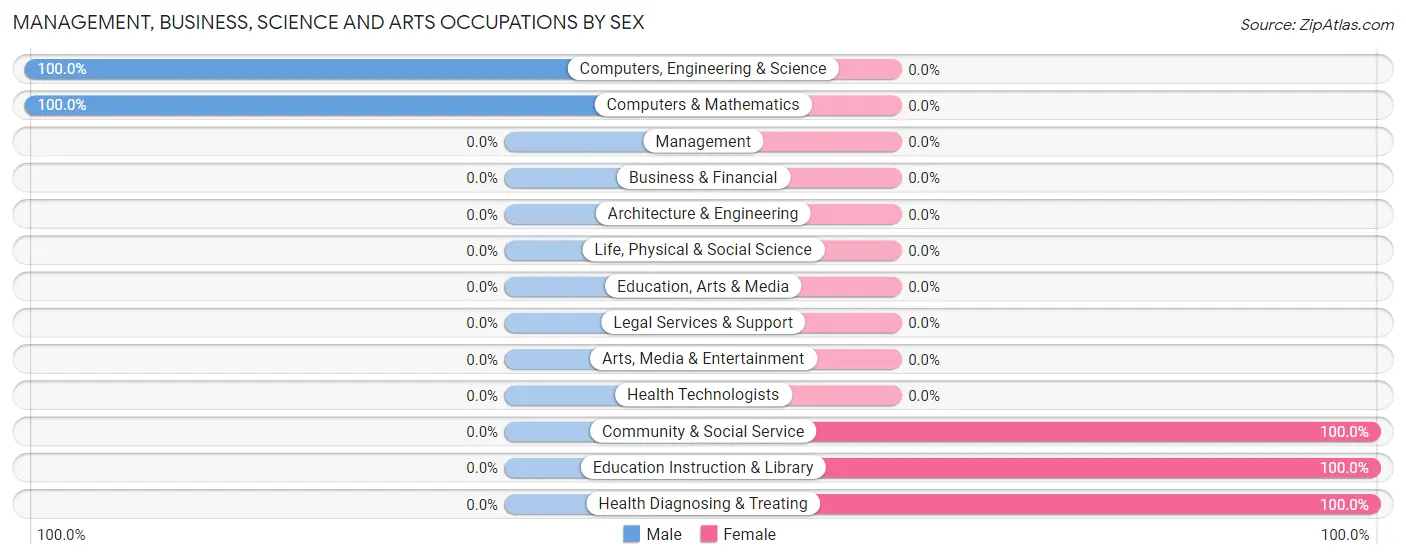
Management, Business, Science and Arts Occupations by Sex
Within the Management, Business, Science and Arts occupations in Ventura, the most male-oriented occupations are Computers, Engineering & Science (100.0%), and Computers & Mathematics (100.0%), while the most female-oriented occupations are Community & Social Service (100.0%), Education Instruction & Library (100.0%), and Health Diagnosing & Treating (100.0%).
| Occupation | Male | Female |
| Management | 0 (0.0%) | 0 (0.0%) |
| Business & Financial | 0 (0.0%) | 0 (0.0%) |
| Computers, Engineering & Science | 3 (100.0%) | 0 (0.0%) |
| Computers & Mathematics | 3 (100.0%) | 0 (0.0%) |
| Architecture & Engineering | 0 (0.0%) | 0 (0.0%) |
| Life, Physical & Social Science | 0 (0.0%) | 0 (0.0%) |
| Community & Social Service | 0 (0.0%) | 14 (100.0%) |
| Education, Arts & Media | 0 (0.0%) | 0 (0.0%) |
| Legal Services & Support | 0 (0.0%) | 0 (0.0%) |
| Education Instruction & Library | 0 (0.0%) | 14 (100.0%) |
| Arts, Media & Entertainment | 0 (0.0%) | 0 (0.0%) |
| Health Diagnosing & Treating | 0 (0.0%) | 36 (100.0%) |
| Health Technologists | 0 (0.0%) | 0 (0.0%) |
| Total (Category) | 3 (5.7%) | 50 (94.3%) |
| Total (Overall) | 59 (41.3%) | 84 (58.7%) |
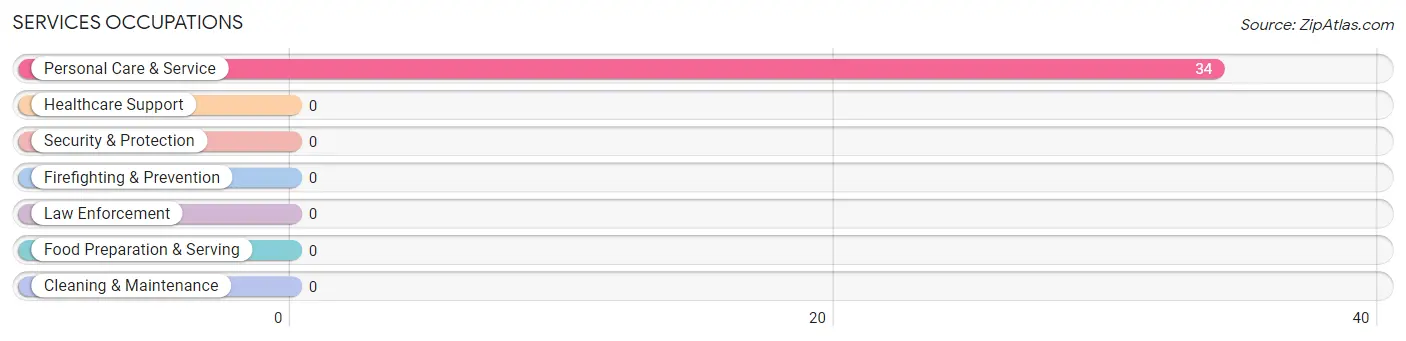
Services Occupations
The most common Services occupations in Ventura are , and Personal Care & Service (34 | 23.8%).
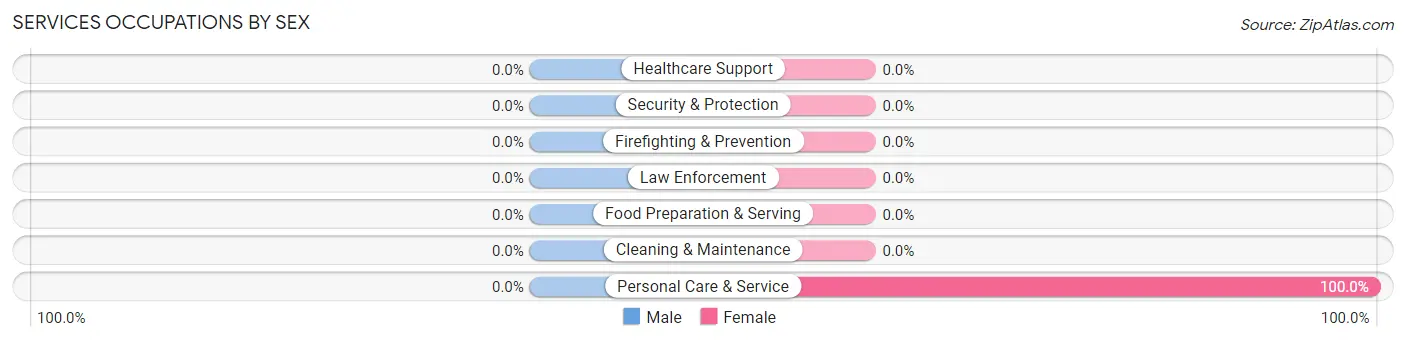
Services Occupations by Sex
| Occupation | Male | Female |
| Healthcare Support | 0 (0.0%) | 0 (0.0%) |
| Security & Protection | 0 (0.0%) | 0 (0.0%) |
| Firefighting & Prevention | 0 (0.0%) | 0 (0.0%) |
| Law Enforcement | 0 (0.0%) | 0 (0.0%) |
| Food Preparation & Serving | 0 (0.0%) | 0 (0.0%) |
| Cleaning & Maintenance | 0 (0.0%) | 0 (0.0%) |
| Personal Care & Service | 0 (0.0%) | 34 (100.0%) |
| Total (Category) | 0 (0.0%) | 34 (100.0%) |
| Total (Overall) | 59 (41.3%) | 84 (58.7%) |
Sales and Office Occupations
Sales and Office Occupations by Sex
| Occupation | Male | Female |
| Sales & Related | 0 (0.0%) | 0 (0.0%) |
| Office & Administration | 0 (0.0%) | 0 (0.0%) |
| Total (Category) | 0 (0.0%) | 0 (0.0%) |
| Total (Overall) | 59 (41.3%) | 84 (58.7%) |
Natural Resources, Construction and Maintenance Occupations
The most common Natural Resources, Construction and Maintenance occupations in Ventura are , and Construction & Extraction (22 | 15.4%).
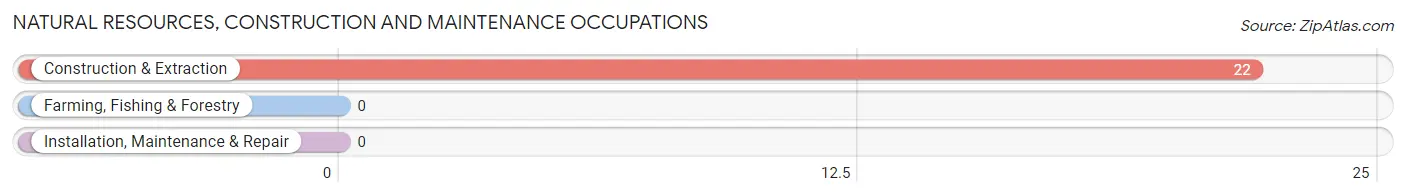
Natural Resources, Construction and Maintenance Occupations by Sex
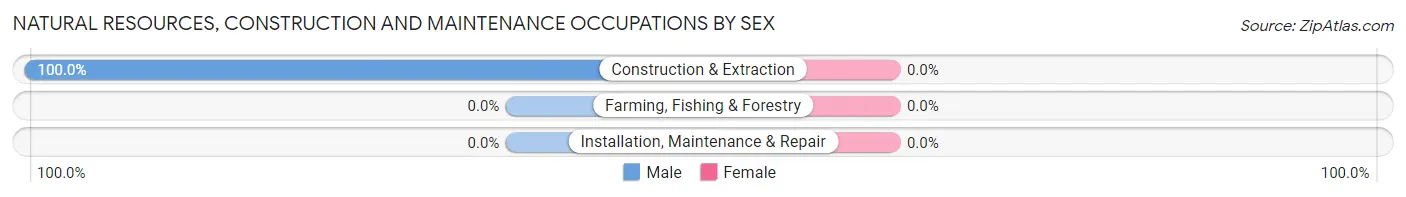
| Occupation | Male | Female |
| Farming, Fishing & Forestry | 0 (0.0%) | 0 (0.0%) |
| Construction & Extraction | 22 (100.0%) | 0 (0.0%) |
| Installation, Maintenance & Repair | 0 (0.0%) | 0 (0.0%) |
| Total (Category) | 22 (100.0%) | 0 (0.0%) |
| Total (Overall) | 59 (41.3%) | 84 (58.7%) |
Production, Transportation and Moving Occupations
The most common Production, Transportation and Moving occupations in Ventura are , and Transportation (34 | 23.8%).
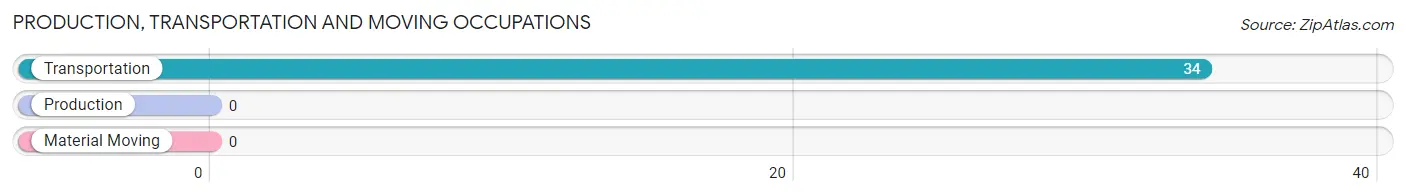
Production, Transportation and Moving Occupations by Sex
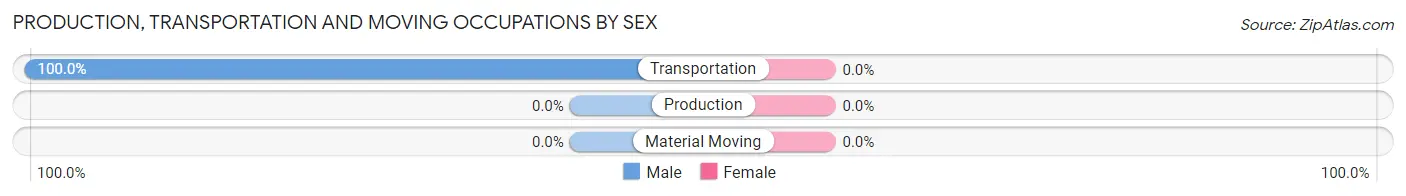
| Occupation | Male | Female |
| Production | 0 (0.0%) | 0 (0.0%) |
| Transportation | 34 (100.0%) | 0 (0.0%) |
| Material Moving | 0 (0.0%) | 0 (0.0%) |
| Total (Category) | 34 (100.0%) | 0 (0.0%) |
| Total (Overall) | 59 (41.3%) | 84 (58.7%) |
Employment Industries by Sex in Ventura
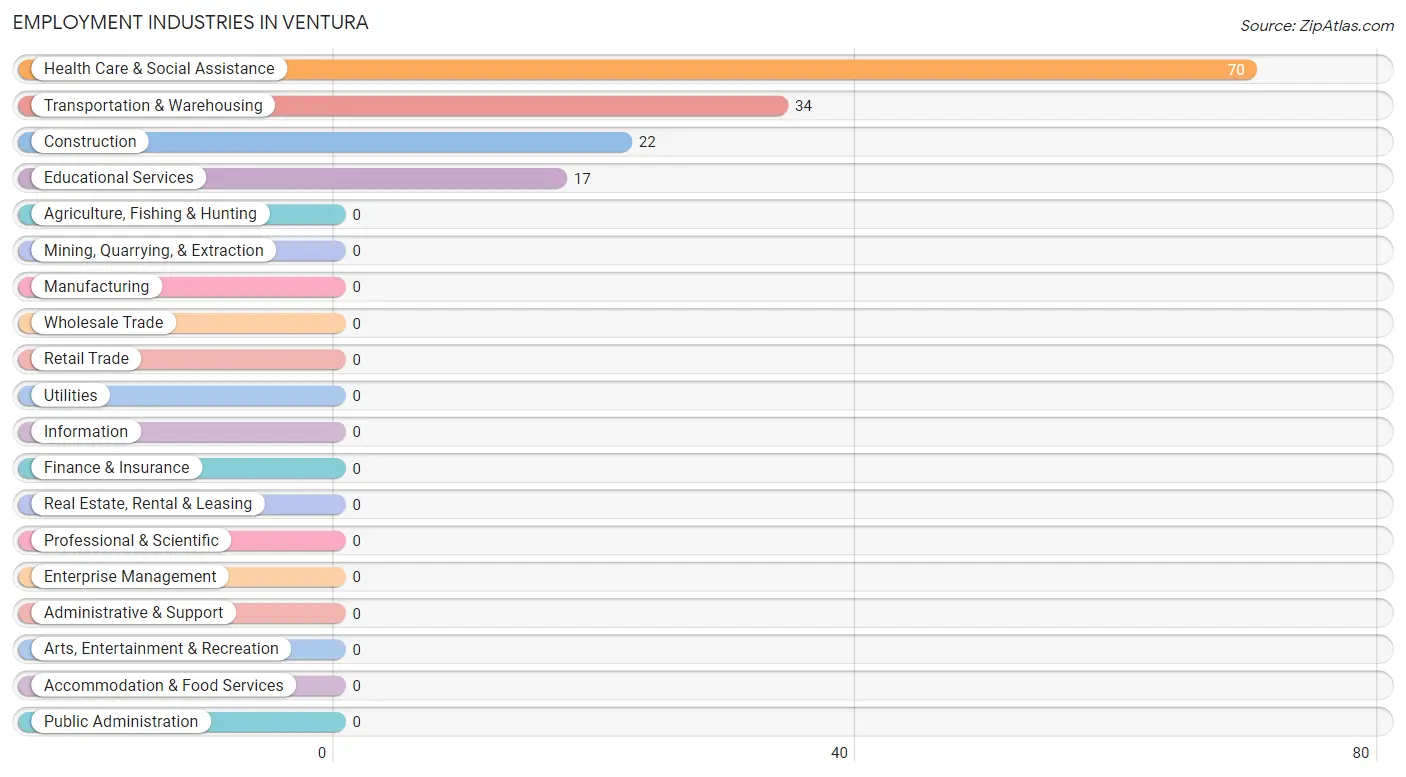
Employment Industries in Ventura
The major employment industries in Ventura include Health Care & Social Assistance (70 | 48.9%), Transportation & Warehousing (34 | 23.8%), Construction (22 | 15.4%), and Educational Services (17 | 11.9%).
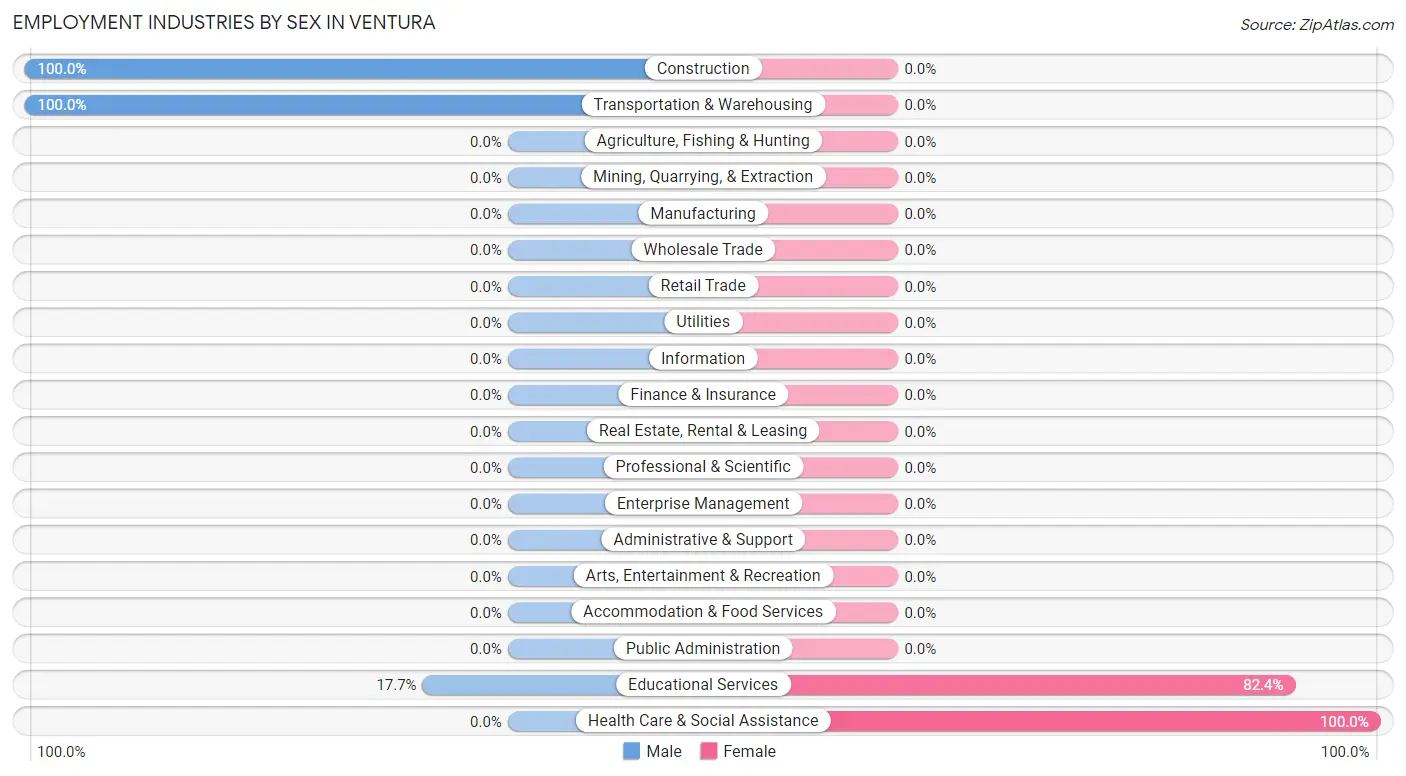
Employment Industries by Sex in Ventura
The Ventura industries that see more men than women are Construction (100.0%), Transportation & Warehousing (100.0%), and Educational Services (17.6%), whereas the industries that tend to have a higher number of women are Health Care & Social Assistance (100.0%), and Educational Services (82.4%).
| Industry | Male | Female |
| Agriculture, Fishing & Hunting | 0 (0.0%) | 0 (0.0%) |
| Mining, Quarrying, & Extraction | 0 (0.0%) | 0 (0.0%) |
| Construction | 22 (100.0%) | 0 (0.0%) |
| Manufacturing | 0 (0.0%) | 0 (0.0%) |
| Wholesale Trade | 0 (0.0%) | 0 (0.0%) |
| Retail Trade | 0 (0.0%) | 0 (0.0%) |
| Transportation & Warehousing | 34 (100.0%) | 0 (0.0%) |
| Utilities | 0 (0.0%) | 0 (0.0%) |
| Information | 0 (0.0%) | 0 (0.0%) |
| Finance & Insurance | 0 (0.0%) | 0 (0.0%) |
| Real Estate, Rental & Leasing | 0 (0.0%) | 0 (0.0%) |
| Professional & Scientific | 0 (0.0%) | 0 (0.0%) |
| Enterprise Management | 0 (0.0%) | 0 (0.0%) |
| Administrative & Support | 0 (0.0%) | 0 (0.0%) |
| Educational Services | 3 (17.6%) | 14 (82.4%) |
| Health Care & Social Assistance | 0 (0.0%) | 70 (100.0%) |
| Arts, Entertainment & Recreation | 0 (0.0%) | 0 (0.0%) |
| Accommodation & Food Services | 0 (0.0%) | 0 (0.0%) |
| Public Administration | 0 (0.0%) | 0 (0.0%) |
| Total | 59 (41.3%) | 84 (58.7%) |
Education in Ventura
School Enrollment in Ventura
The most common levels of schooling among the 253 students in Ventura are high school (166 | 65.6%), middle school (51 | 20.2%), and graduate / professional (36 | 14.2%).
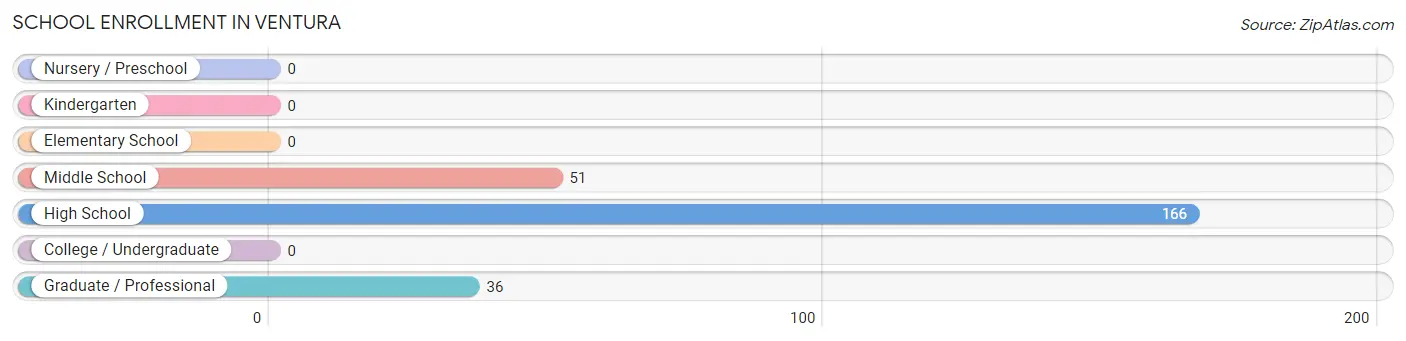
| School Level | # Students | % Students |
| Nursery / Preschool | 0 | 0.0% |
| Kindergarten | 0 | 0.0% |
| Elementary School | 0 | 0.0% |
| Middle School | 51 | 20.2% |
| High School | 166 | 65.6% |
| College / Undergraduate | 0 | 0.0% |
| Graduate / Professional | 36 | 14.2% |
| Total | 253 | 100.0% |
School Enrollment by Age by Funding Source in Ventura
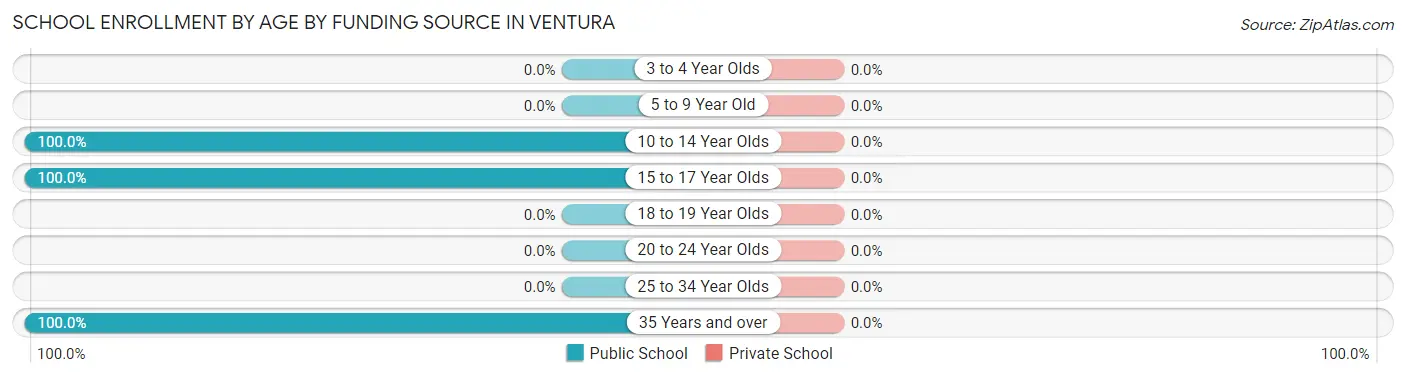
| Age Bracket | Public School | Private School |
| 3 to 4 Year Olds | 0 (0.0%) | 0 (0.0%) |
| 5 to 9 Year Old | 0 (0.0%) | 0 (0.0%) |
| 10 to 14 Year Olds | 51 (100.0%) | 0 (0.0%) |
| 15 to 17 Year Olds | 166 (100.0%) | 0 (0.0%) |
| 18 to 19 Year Olds | 0 (0.0%) | 0 (0.0%) |
| 20 to 24 Year Olds | 0 (0.0%) | 0 (0.0%) |
| 25 to 34 Year Olds | 0 (0.0%) | 0 (0.0%) |
| 35 Years and over | 36 (100.0%) | 0 (0.0%) |
| Total | 253 (100.0%) | 0 (0.0%) |
Educational Attainment by Field of Study in Ventura
Education (55 | 94.8%), and computers & mathematics (3 | 5.2%) are the most common fields of study among 58 individuals in Ventura who have obtained a bachelor's degree or higher.
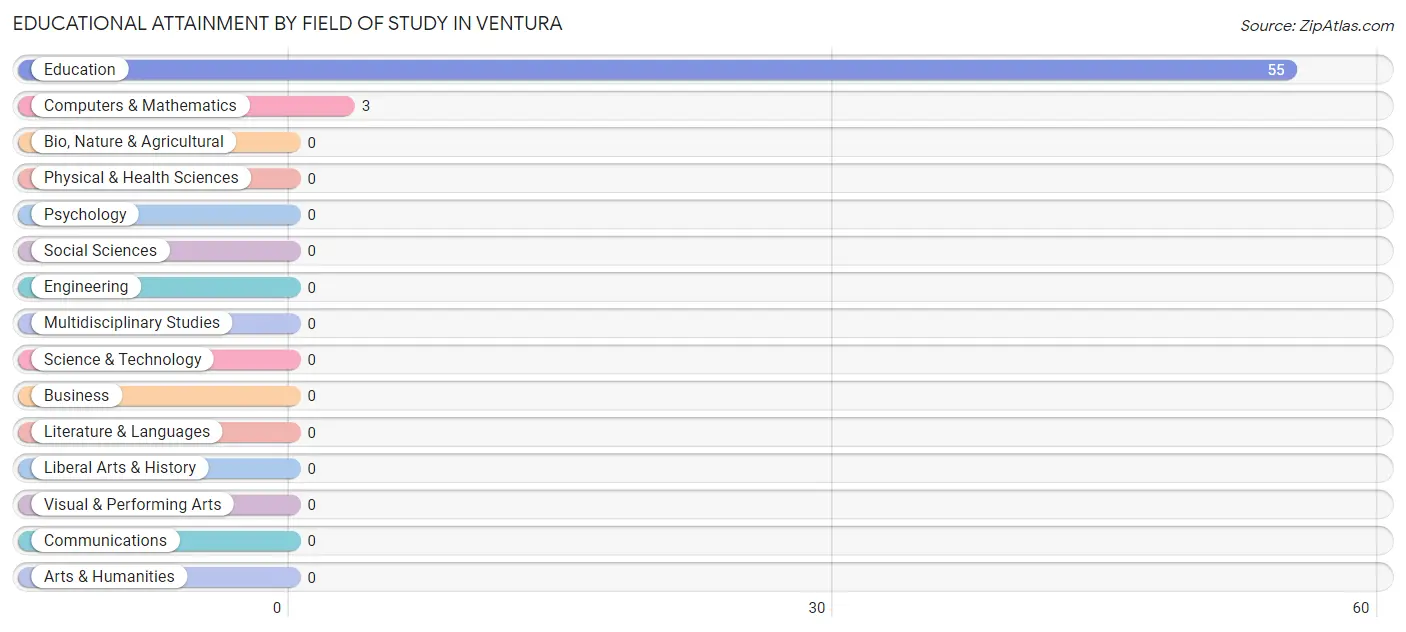
| Field of Study | # Graduates | % Graduates |
| Computers & Mathematics | 3 | 5.2% |
| Bio, Nature & Agricultural | 0 | 0.0% |
| Physical & Health Sciences | 0 | 0.0% |
| Psychology | 0 | 0.0% |
| Social Sciences | 0 | 0.0% |
| Engineering | 0 | 0.0% |
| Multidisciplinary Studies | 0 | 0.0% |
| Science & Technology | 0 | 0.0% |
| Business | 0 | 0.0% |
| Education | 55 | 94.8% |
| Literature & Languages | 0 | 0.0% |
| Liberal Arts & History | 0 | 0.0% |
| Visual & Performing Arts | 0 | 0.0% |
| Communications | 0 | 0.0% |
| Arts & Humanities | 0 | 0.0% |
| Total | 58 | 100.0% |
Transportation & Commute in Ventura
Vehicle Availability by Sex in Ventura
The most prevalent vehicle ownership categories in Ventura are males with 2 vehicles (34, accounting for 57.6%) and females with 2 vehicles (36, making up 40.5%).
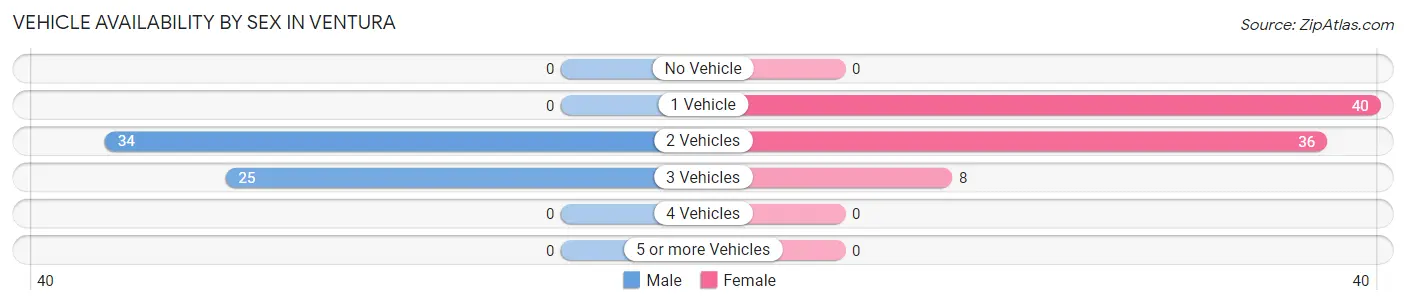
| Vehicles Available | Male | Female |
| No Vehicle | 0 (0.0%) | 0 (0.0%) |
| 1 Vehicle | 0 (0.0%) | 40 (47.6%) |
| 2 Vehicles | 34 (57.6%) | 36 (42.9%) |
| 3 Vehicles | 25 (42.4%) | 8 (9.5%) |
| 4 Vehicles | 0 (0.0%) | 0 (0.0%) |
| 5 or more Vehicles | 0 (0.0%) | 0 (0.0%) |
| Total | 59 (100.0%) | 84 (100.0%) |
Commute Time in Ventura
The most frequently occuring commute durations in Ventura are 45 to 59 minutes (70 commuters, 48.9%), 10 to 14 minutes (65 commuters, 45.5%), and 20 to 24 minutes (8 commuters, 5.6%).
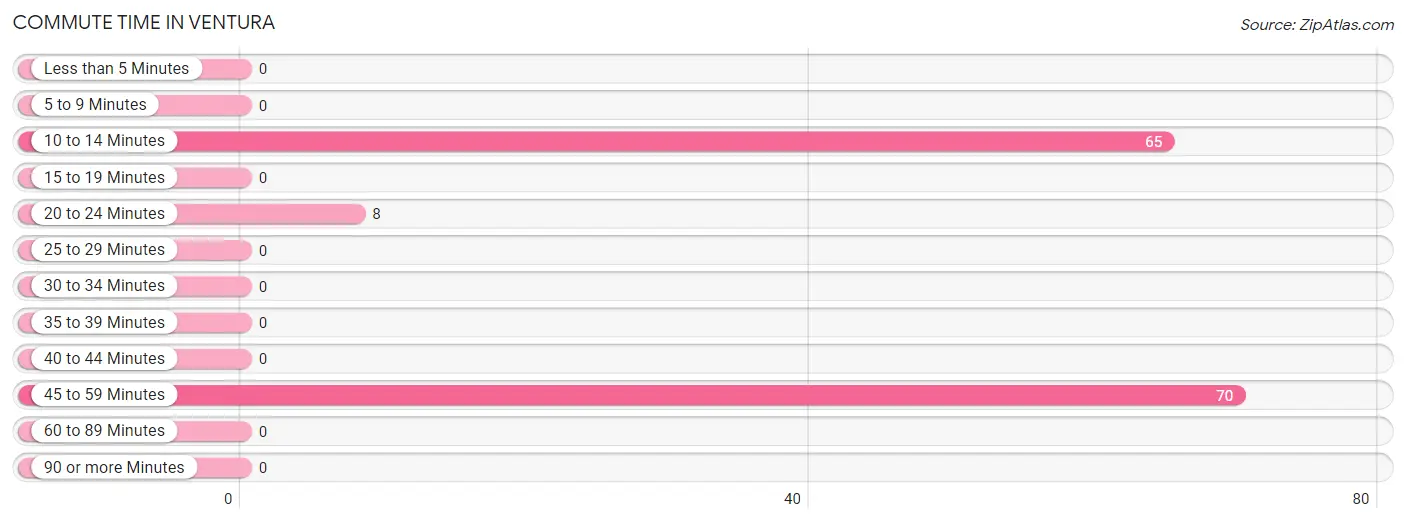
| Commute Time | # Commuters | % Commuters |
| Less than 5 Minutes | 0 | 0.0% |
| 5 to 9 Minutes | 0 | 0.0% |
| 10 to 14 Minutes | 65 | 45.5% |
| 15 to 19 Minutes | 0 | 0.0% |
| 20 to 24 Minutes | 8 | 5.6% |
| 25 to 29 Minutes | 0 | 0.0% |
| 30 to 34 Minutes | 0 | 0.0% |
| 35 to 39 Minutes | 0 | 0.0% |
| 40 to 44 Minutes | 0 | 0.0% |
| 45 to 59 Minutes | 70 | 48.9% |
| 60 to 89 Minutes | 0 | 0.0% |
| 90 or more Minutes | 0 | 0.0% |
Commute Time by Sex in Ventura
The most common commute times in Ventura are 45 to 59 minutes (34 commuters, 57.6%) for males and 10 to 14 minutes (40 commuters, 47.6%) for females.
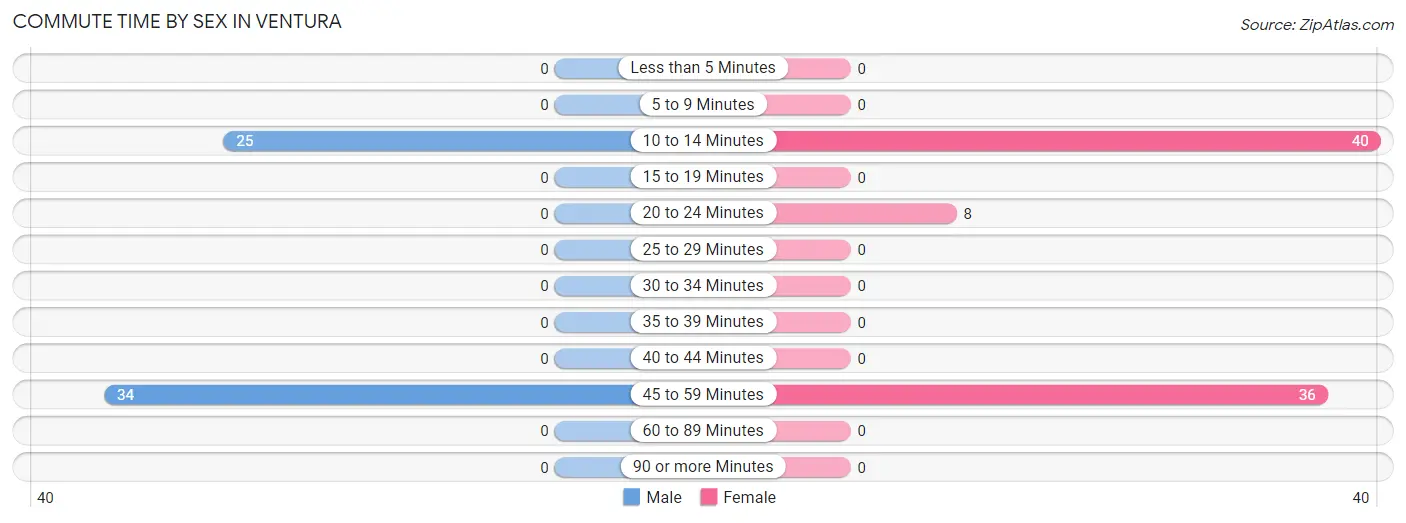
| Commute Time | Male | Female |
| Less than 5 Minutes | 0 (0.0%) | 0 (0.0%) |
| 5 to 9 Minutes | 0 (0.0%) | 0 (0.0%) |
| 10 to 14 Minutes | 25 (42.4%) | 40 (47.6%) |
| 15 to 19 Minutes | 0 (0.0%) | 0 (0.0%) |
| 20 to 24 Minutes | 0 (0.0%) | 8 (9.5%) |
| 25 to 29 Minutes | 0 (0.0%) | 0 (0.0%) |
| 30 to 34 Minutes | 0 (0.0%) | 0 (0.0%) |
| 35 to 39 Minutes | 0 (0.0%) | 0 (0.0%) |
| 40 to 44 Minutes | 0 (0.0%) | 0 (0.0%) |
| 45 to 59 Minutes | 34 (57.6%) | 36 (42.9%) |
| 60 to 89 Minutes | 0 (0.0%) | 0 (0.0%) |
| 90 or more Minutes | 0 (0.0%) | 0 (0.0%) |
Time of Departure to Work by Sex in Ventura
The most frequent times of departure to work in Ventura are 6:30 AM to 6:59 AM (34, 57.6%) for males and 7:30 AM to 7:59 AM (48, 57.1%) for females.
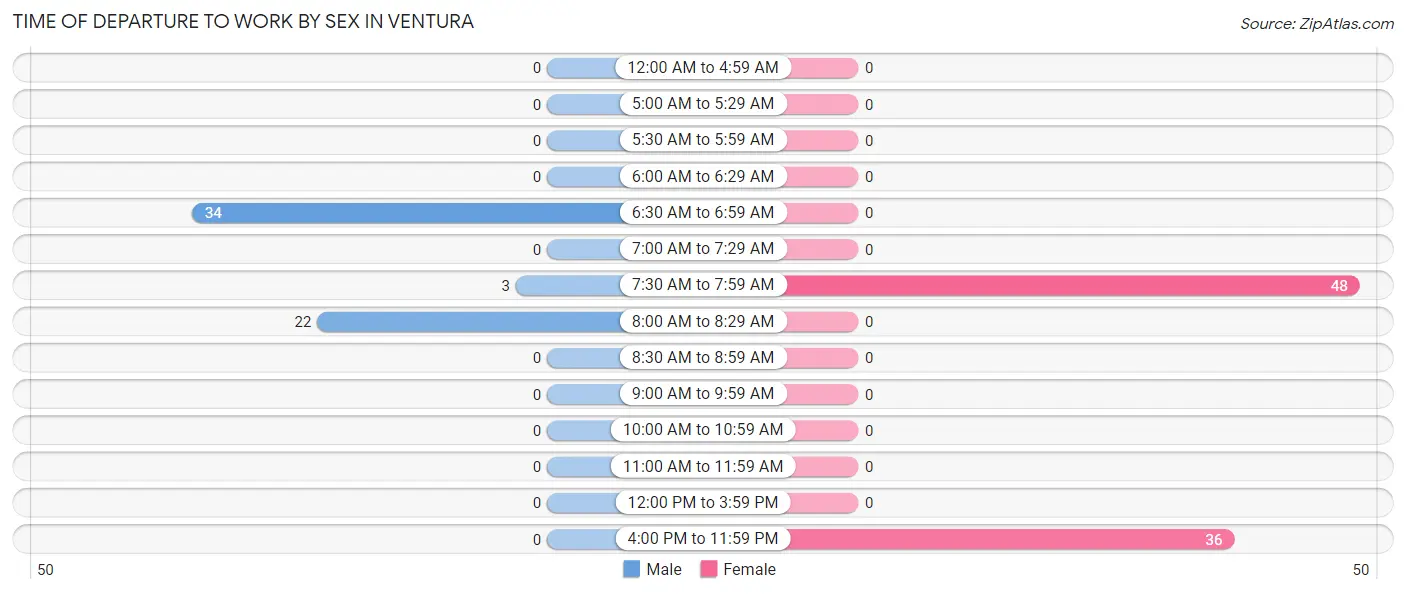
| Time of Departure | Male | Female |
| 12:00 AM to 4:59 AM | 0 (0.0%) | 0 (0.0%) |
| 5:00 AM to 5:29 AM | 0 (0.0%) | 0 (0.0%) |
| 5:30 AM to 5:59 AM | 0 (0.0%) | 0 (0.0%) |
| 6:00 AM to 6:29 AM | 0 (0.0%) | 0 (0.0%) |
| 6:30 AM to 6:59 AM | 34 (57.6%) | 0 (0.0%) |
| 7:00 AM to 7:29 AM | 0 (0.0%) | 0 (0.0%) |
| 7:30 AM to 7:59 AM | 3 (5.1%) | 48 (57.1%) |
| 8:00 AM to 8:29 AM | 22 (37.3%) | 0 (0.0%) |
| 8:30 AM to 8:59 AM | 0 (0.0%) | 0 (0.0%) |
| 9:00 AM to 9:59 AM | 0 (0.0%) | 0 (0.0%) |
| 10:00 AM to 10:59 AM | 0 (0.0%) | 0 (0.0%) |
| 11:00 AM to 11:59 AM | 0 (0.0%) | 0 (0.0%) |
| 12:00 PM to 3:59 PM | 0 (0.0%) | 0 (0.0%) |
| 4:00 PM to 11:59 PM | 0 (0.0%) | 36 (42.9%) |
| Total | 59 (100.0%) | 84 (100.0%) |
Housing Occupancy in Ventura
Occupancy by Ownership in Ventura
Of the total 294 dwellings in Ventura, owner-occupied units account for 249 (84.7%), while renter-occupied units make up 45 (15.3%).
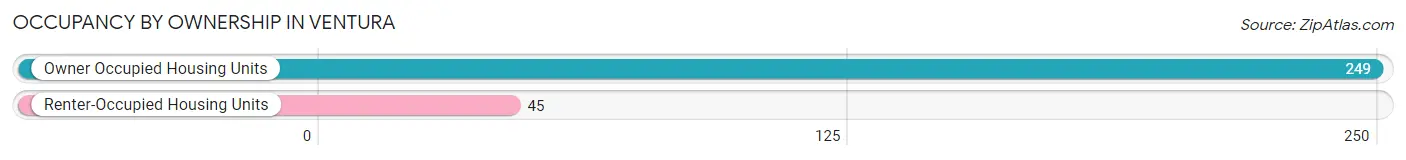
| Occupancy | # Housing Units | % Housing Units |
| Owner Occupied Housing Units | 249 | 84.7% |
| Renter-Occupied Housing Units | 45 | 15.3% |
| Total Occupied Housing Units | 294 | 100.0% |
Occupancy by Household Size in Ventura
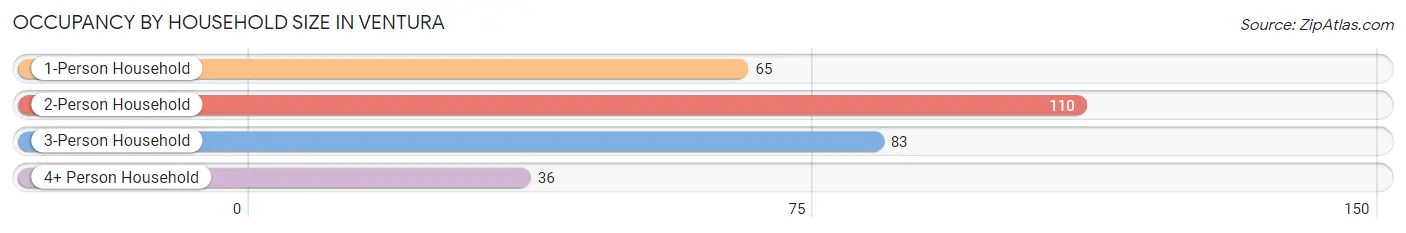
| Household Size | # Housing Units | % Housing Units |
| 1-Person Household | 65 | 22.1% |
| 2-Person Household | 110 | 37.4% |
| 3-Person Household | 83 | 28.2% |
| 4+ Person Household | 36 | 12.2% |
| Total Housing Units | 294 | 100.0% |
Occupancy by Ownership by Household Size in Ventura
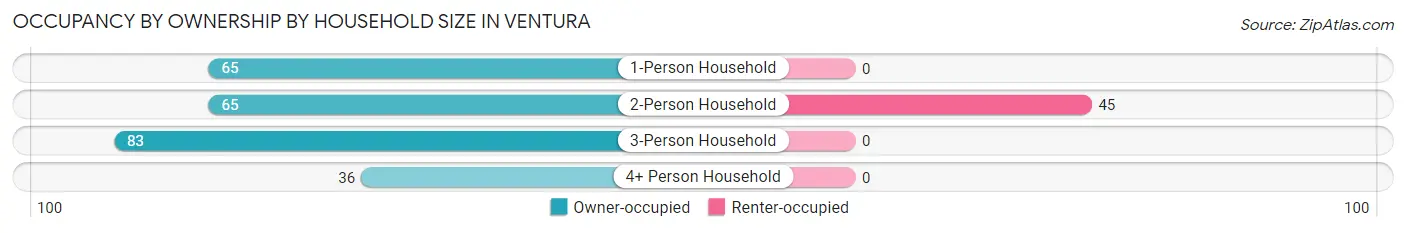
| Household Size | Owner-occupied | Renter-occupied |
| 1-Person Household | 65 (100.0%) | 0 (0.0%) |
| 2-Person Household | 65 (59.1%) | 45 (40.9%) |
| 3-Person Household | 83 (100.0%) | 0 (0.0%) |
| 4+ Person Household | 36 (100.0%) | 0 (0.0%) |
| Total Housing Units | 249 (84.7%) | 45 (15.3%) |
Occupancy by Educational Attainment in Ventura
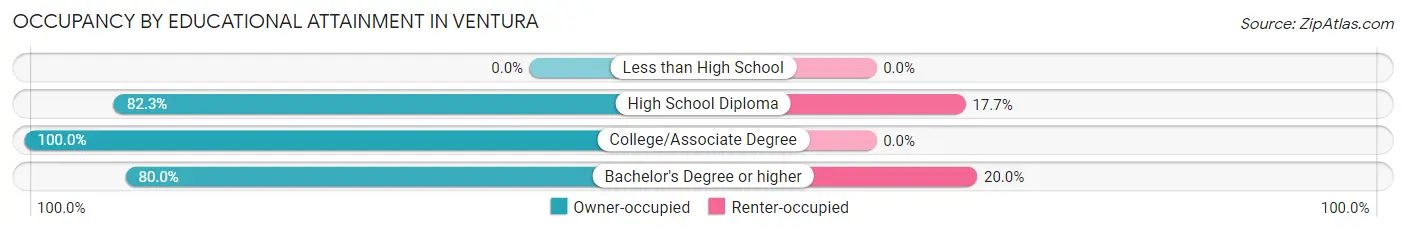
| Household Size | Owner-occupied | Renter-occupied |
| Less than High School | 0 (0.0%) | 0 (0.0%) |
| High School Diploma | 158 (82.3%) | 34 (17.7%) |
| College/Associate Degree | 47 (100.0%) | 0 (0.0%) |
| Bachelor's Degree or higher | 44 (80.0%) | 11 (20.0%) |
Occupancy by Age of Householder in Ventura
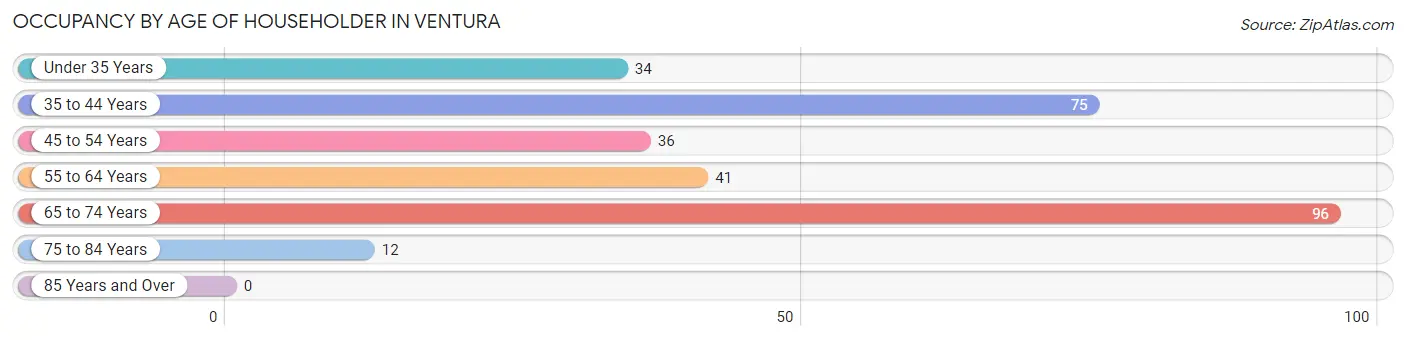
| Age Bracket | # Households | % Households |
| Under 35 Years | 34 | 11.6% |
| 35 to 44 Years | 75 | 25.5% |
| 45 to 54 Years | 36 | 12.2% |
| 55 to 64 Years | 41 | 14.0% |
| 65 to 74 Years | 96 | 32.7% |
| 75 to 84 Years | 12 | 4.1% |
| 85 Years and Over | 0 | 0.0% |
| Total | 294 | 100.0% |
Housing Finances in Ventura
Median Income by Occupancy in Ventura
| Occupancy Type | # Households | Median Income |
| Owner-Occupied | 249 (84.7%) | $0 |
| Renter-Occupied | 45 (15.3%) | $0 |
| Average | 294 (100.0%) | $0 |
Occupancy by Householder Income Bracket in Ventura
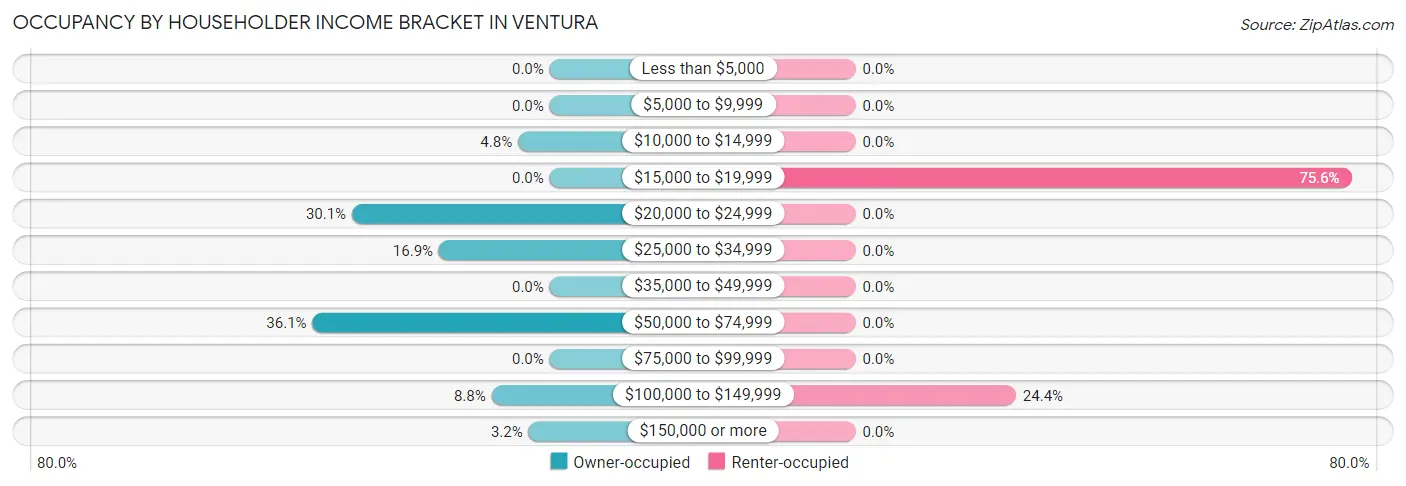
| Income Bracket | Owner-occupied | Renter-occupied |
| Less than $5,000 | 0 (0.0%) | 0 (0.0%) |
| $5,000 to $9,999 | 0 (0.0%) | 0 (0.0%) |
| $10,000 to $14,999 | 12 (4.8%) | 0 (0.0%) |
| $15,000 to $19,999 | 0 (0.0%) | 34 (75.6%) |
| $20,000 to $24,999 | 75 (30.1%) | 0 (0.0%) |
| $25,000 to $34,999 | 42 (16.9%) | 0 (0.0%) |
| $35,000 to $49,999 | 0 (0.0%) | 0 (0.0%) |
| $50,000 to $74,999 | 90 (36.1%) | 0 (0.0%) |
| $75,000 to $99,999 | 0 (0.0%) | 0 (0.0%) |
| $100,000 to $149,999 | 22 (8.8%) | 11 (24.4%) |
| $150,000 or more | 8 (3.2%) | 0 (0.0%) |
| Total | 249 (100.0%) | 45 (100.0%) |
Monthly Housing Cost Tiers in Ventura
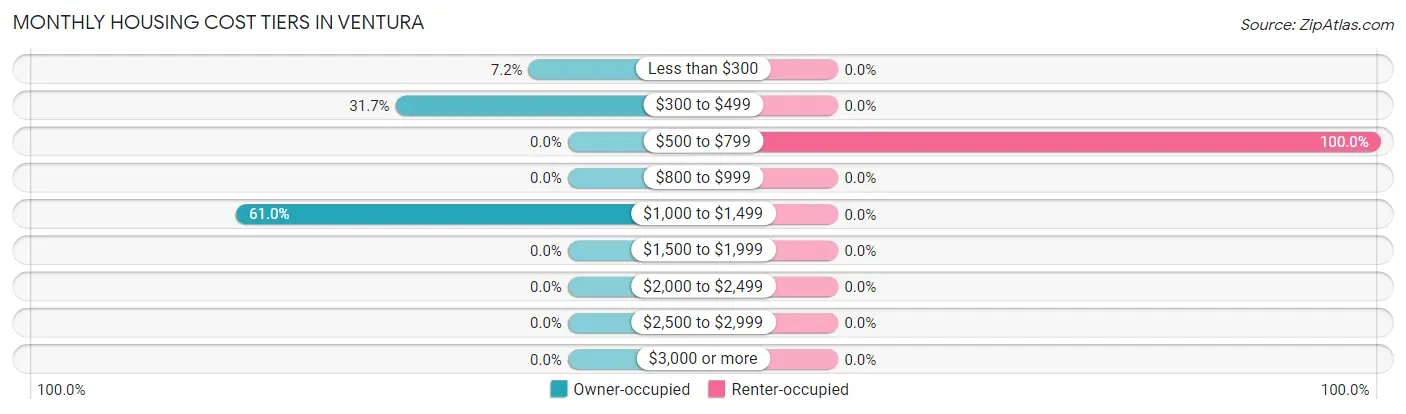
| Monthly Cost | Owner-occupied | Renter-occupied |
| Less than $300 | 18 (7.2%) | 0 (0.0%) |
| $300 to $499 | 79 (31.7%) | 0 (0.0%) |
| $500 to $799 | 0 (0.0%) | 45 (100.0%) |
| $800 to $999 | 0 (0.0%) | 0 (0.0%) |
| $1,000 to $1,499 | 152 (61.0%) | 0 (0.0%) |
| $1,500 to $1,999 | 0 (0.0%) | 0 (0.0%) |
| $2,000 to $2,499 | 0 (0.0%) | 0 (0.0%) |
| $2,500 to $2,999 | 0 (0.0%) | 0 (0.0%) |
| $3,000 or more | 0 (0.0%) | 0 (0.0%) |
| Total | 249 (100.0%) | 45 (100.0%) |
Physical Housing Characteristics in Ventura
Housing Structures in Ventura
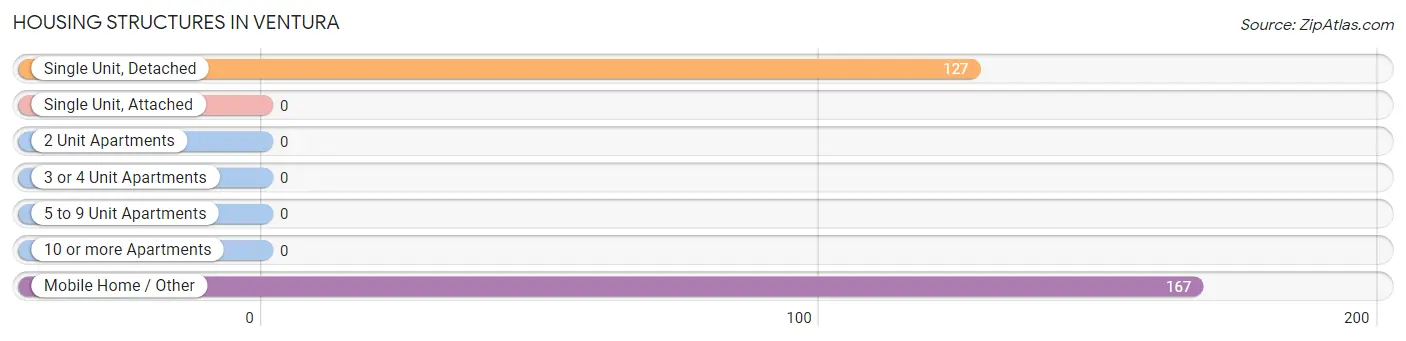
| Structure Type | # Housing Units | % Housing Units |
| Single Unit, Detached | 127 | 43.2% |
| Single Unit, Attached | 0 | 0.0% |
| 2 Unit Apartments | 0 | 0.0% |
| 3 or 4 Unit Apartments | 0 | 0.0% |
| 5 to 9 Unit Apartments | 0 | 0.0% |
| 10 or more Apartments | 0 | 0.0% |
| Mobile Home / Other | 167 | 56.8% |
| Total | 294 | 100.0% |
Housing Structures by Occupancy in Ventura
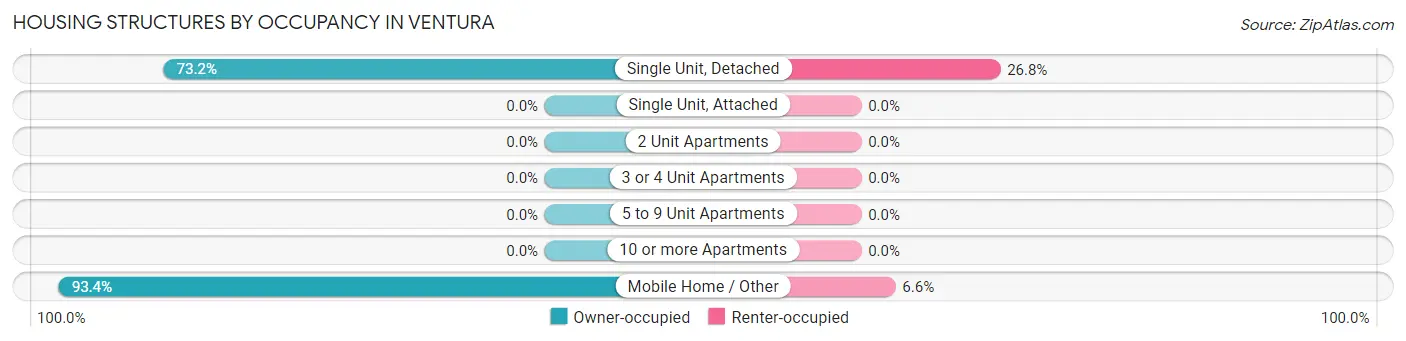
| Structure Type | Owner-occupied | Renter-occupied |
| Single Unit, Detached | 93 (73.2%) | 34 (26.8%) |
| Single Unit, Attached | 0 (0.0%) | 0 (0.0%) |
| 2 Unit Apartments | 0 (0.0%) | 0 (0.0%) |
| 3 or 4 Unit Apartments | 0 (0.0%) | 0 (0.0%) |
| 5 to 9 Unit Apartments | 0 (0.0%) | 0 (0.0%) |
| 10 or more Apartments | 0 (0.0%) | 0 (0.0%) |
| Mobile Home / Other | 156 (93.4%) | 11 (6.6%) |
| Total | 249 (84.7%) | 45 (15.3%) |
Housing Structures by Number of Rooms in Ventura
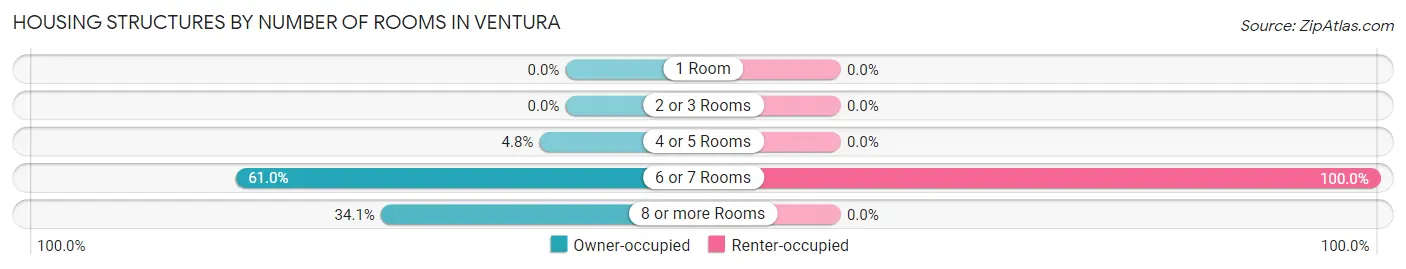
| Number of Rooms | Owner-occupied | Renter-occupied |
| 1 Room | 0 (0.0%) | 0 (0.0%) |
| 2 or 3 Rooms | 0 (0.0%) | 0 (0.0%) |
| 4 or 5 Rooms | 12 (4.8%) | 0 (0.0%) |
| 6 or 7 Rooms | 152 (61.0%) | 45 (100.0%) |
| 8 or more Rooms | 85 (34.1%) | 0 (0.0%) |
| Total | 249 (100.0%) | 45 (100.0%) |
Housing Structure by Heating Type in Ventura
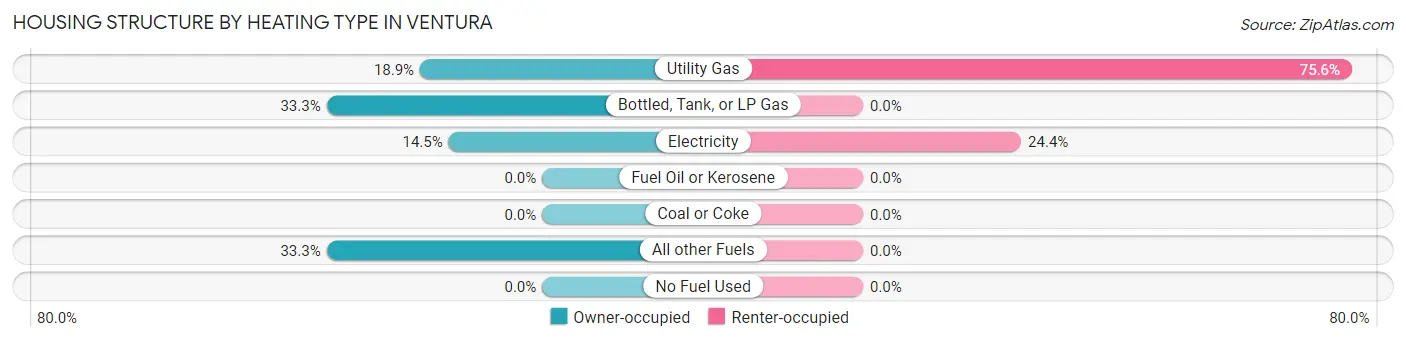
| Heating Type | Owner-occupied | Renter-occupied |
| Utility Gas | 47 (18.9%) | 34 (75.6%) |
| Bottled, Tank, or LP Gas | 83 (33.3%) | 0 (0.0%) |
| Electricity | 36 (14.5%) | 11 (24.4%) |
| Fuel Oil or Kerosene | 0 (0.0%) | 0 (0.0%) |
| Coal or Coke | 0 (0.0%) | 0 (0.0%) |
| All other Fuels | 83 (33.3%) | 0 (0.0%) |
| No Fuel Used | 0 (0.0%) | 0 (0.0%) |
| Total | 249 (100.0%) | 45 (100.0%) |
Household Vehicle Usage in Ventura
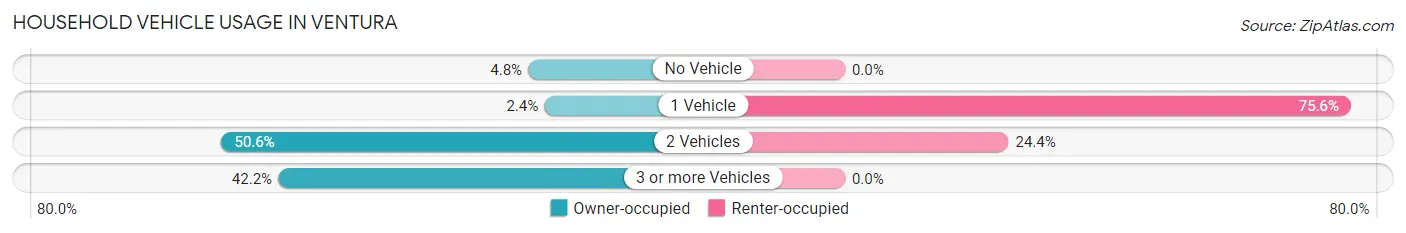
| Vehicles per Household | Owner-occupied | Renter-occupied |
| No Vehicle | 12 (4.8%) | 0 (0.0%) |
| 1 Vehicle | 6 (2.4%) | 34 (75.6%) |
| 2 Vehicles | 126 (50.6%) | 11 (24.4%) |
| 3 or more Vehicles | 105 (42.2%) | 0 (0.0%) |
| Total | 249 (100.0%) | 45 (100.0%) |
Real Estate & Mortgages in Ventura
Real Estate and Mortgage Overview in Ventura
| Characteristic | Without Mortgage | With Mortgage |
| Housing Units | 61 | 188 |
| Median Property Value | $109,400 | $68,500 |
| Median Household Income | $65,727 | $8 |
| Monthly Housing Costs | $429 | $0 |
| Real Estate Taxes | $658 | $0 |
Property Value by Mortgage Status in Ventura
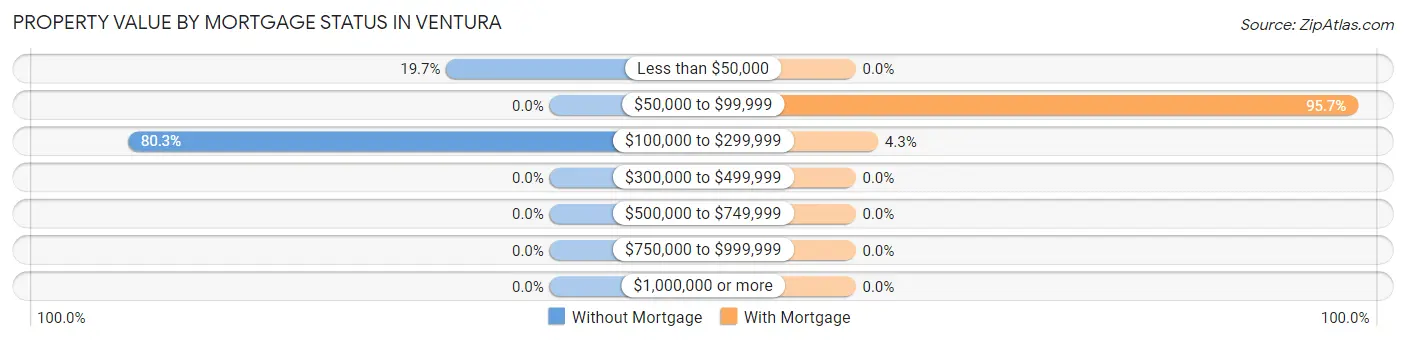
| Property Value | Without Mortgage | With Mortgage |
| Less than $50,000 | 12 (19.7%) | 0 (0.0%) |
| $50,000 to $99,999 | 0 (0.0%) | 180 (95.7%) |
| $100,000 to $299,999 | 49 (80.3%) | 8 (4.3%) |
| $300,000 to $499,999 | 0 (0.0%) | 0 (0.0%) |
| $500,000 to $749,999 | 0 (0.0%) | 0 (0.0%) |
| $750,000 to $999,999 | 0 (0.0%) | 0 (0.0%) |
| $1,000,000 or more | 0 (0.0%) | 0 (0.0%) |
| Total | 61 (100.0%) | 188 (100.0%) |
Household Income by Mortgage Status in Ventura
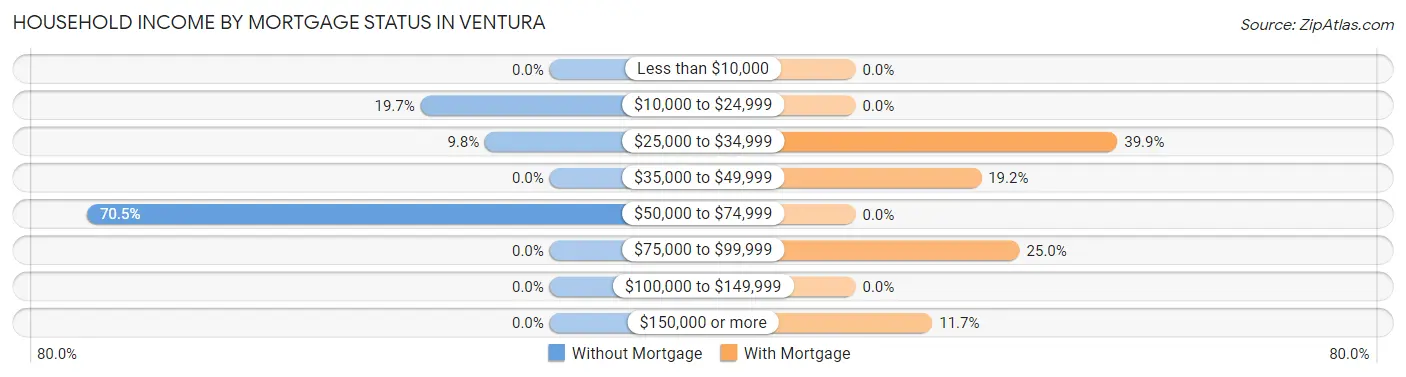
| Household Income | Without Mortgage | With Mortgage |
| Less than $10,000 | 0 (0.0%) | 0 (0.0%) |
| $10,000 to $24,999 | 12 (19.7%) | 0 (0.0%) |
| $25,000 to $34,999 | 6 (9.8%) | 75 (39.9%) |
| $35,000 to $49,999 | 0 (0.0%) | 36 (19.2%) |
| $50,000 to $74,999 | 43 (70.5%) | 0 (0.0%) |
| $75,000 to $99,999 | 0 (0.0%) | 47 (25.0%) |
| $100,000 to $149,999 | 0 (0.0%) | 0 (0.0%) |
| $150,000 or more | 0 (0.0%) | 22 (11.7%) |
| Total | 61 (100.0%) | 188 (100.0%) |
Property Value to Household Income Ratio in Ventura
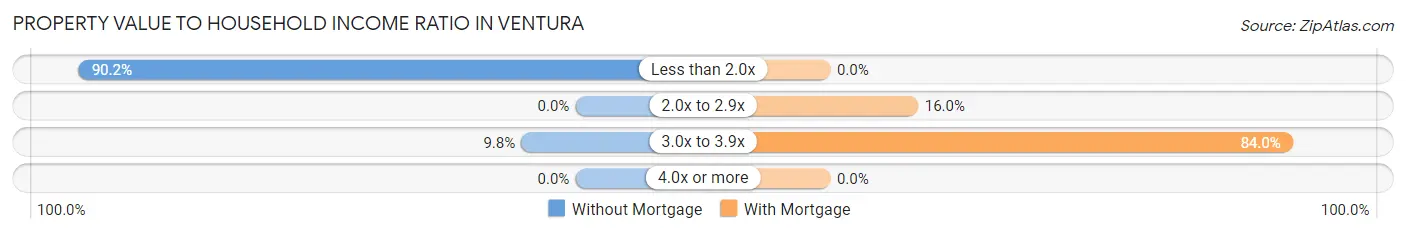
| Value-to-Income Ratio | Without Mortgage | With Mortgage |
| Less than 2.0x | 55 (90.2%) | 0 (0.0%) |
| 2.0x to 2.9x | 0 (0.0%) | 30 (16.0%) |
| 3.0x to 3.9x | 6 (9.8%) | 158 (84.0%) |
| 4.0x or more | 0 (0.0%) | 0 (0.0%) |
| Total | 61 (100.0%) | 188 (100.0%) |
Real Estate Taxes by Mortgage Status in Ventura
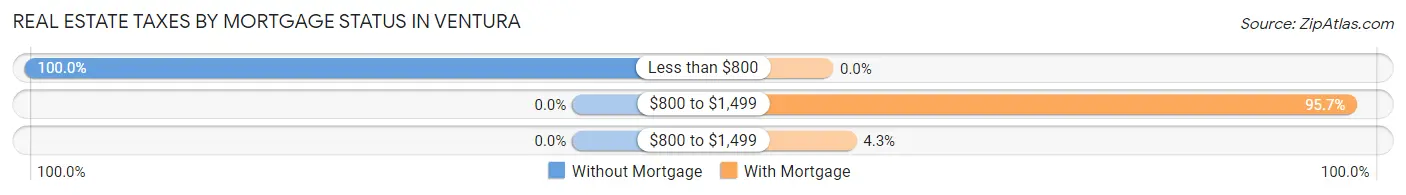
| Property Taxes | Without Mortgage | With Mortgage |
| Less than $800 | 61 (100.0%) | 0 (0.0%) |
| $800 to $1,499 | 0 (0.0%) | 180 (95.7%) |
| $800 to $1,499 | 0 (0.0%) | 8 (4.3%) |
| Total | 61 (100.0%) | 188 (100.0%) |
Health & Disability in Ventura
Health Insurance Coverage by Age in Ventura
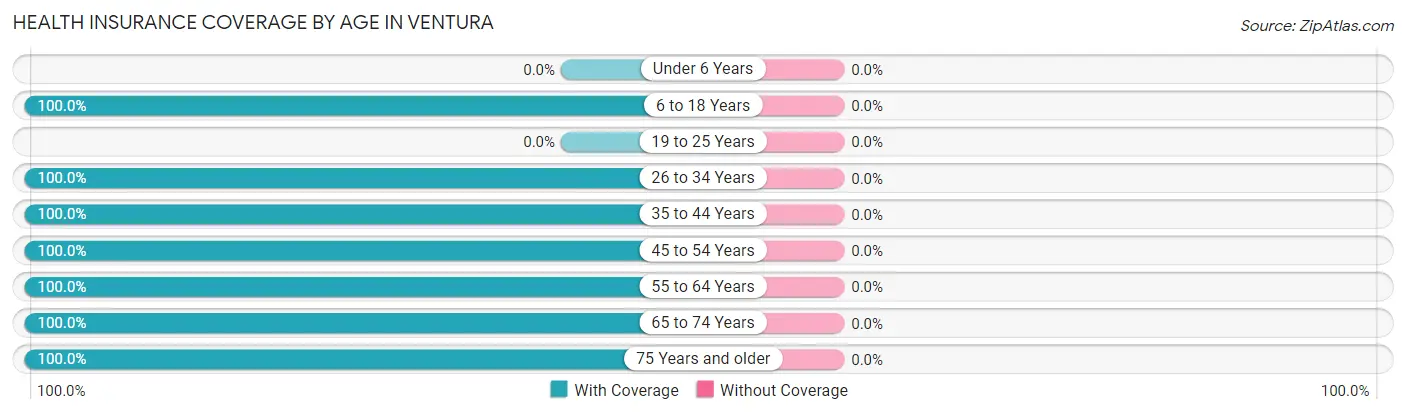
| Age Bracket | With Coverage | Without Coverage |
| Under 6 Years | 0 (0.0%) | 0 (0.0%) |
| 6 to 18 Years | 217 (100.0%) | 0 (0.0%) |
| 19 to 25 Years | 0 (0.0%) | 0 (0.0%) |
| 26 to 34 Years | 128 (100.0%) | 0 (0.0%) |
| 35 to 44 Years | 125 (100.0%) | 0 (0.0%) |
| 45 to 54 Years | 36 (100.0%) | 0 (0.0%) |
| 55 to 64 Years | 124 (100.0%) | 0 (0.0%) |
| 65 to 74 Years | 96 (100.0%) | 0 (0.0%) |
| 75 Years and older | 82 (100.0%) | 0 (0.0%) |
| Total | 808 (100.0%) | 0 (0.0%) |
Health Insurance Coverage by Citizenship Status in Ventura
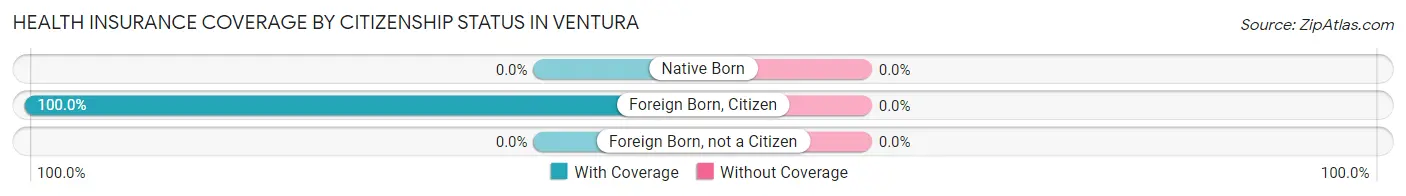
| Citizenship Status | With Coverage | Without Coverage |
| Native Born | 0 (0.0%) | 0 (0.0%) |
| Foreign Born, Citizen | 217 (100.0%) | 0 (0.0%) |
| Foreign Born, not a Citizen | 0 (0.0%) | 0 (0.0%) |
Health Insurance Coverage by Household Income in Ventura
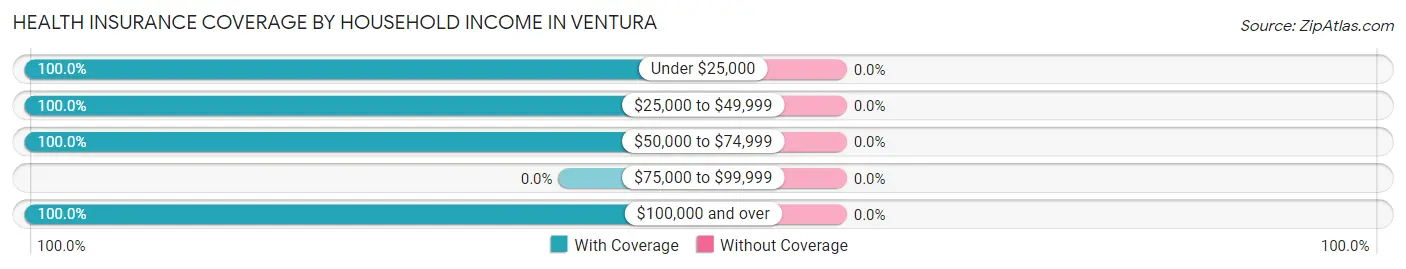
| Household Income | With Coverage | Without Coverage |
| Under $25,000 | 325 (100.0%) | 0 (0.0%) |
| $25,000 to $49,999 | 139 (100.0%) | 0 (0.0%) |
| $50,000 to $74,999 | 160 (100.0%) | 0 (0.0%) |
| $75,000 to $99,999 | 0 (0.0%) | 0 (0.0%) |
| $100,000 and over | 184 (100.0%) | 0 (0.0%) |
Public vs Private Health Insurance Coverage by Age in Ventura
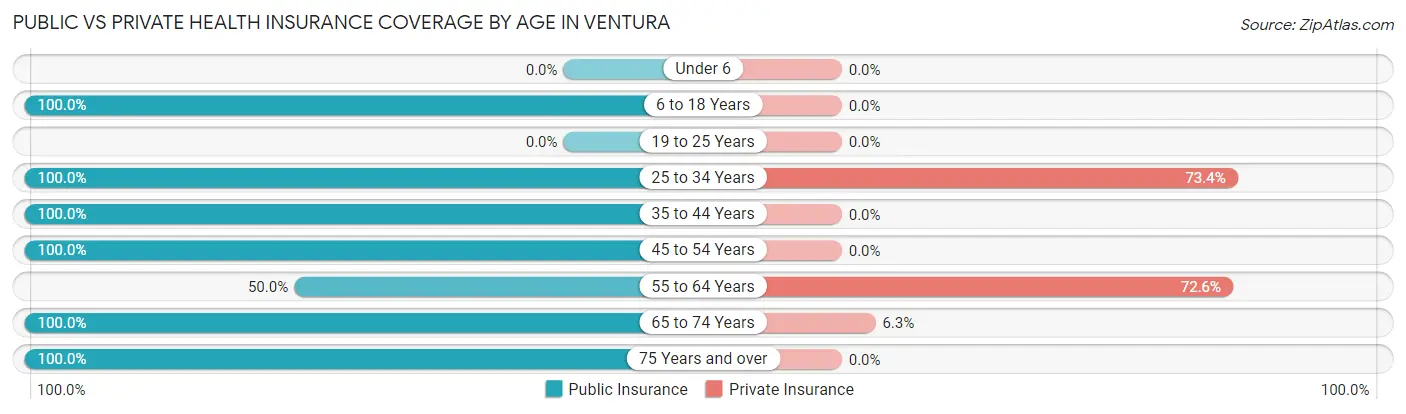
| Age Bracket | Public Insurance | Private Insurance |
| Under 6 | 0 (0.0%) | 0 (0.0%) |
| 6 to 18 Years | 217 (100.0%) | 0 (0.0%) |
| 19 to 25 Years | 0 (0.0%) | 0 (0.0%) |
| 25 to 34 Years | 128 (100.0%) | 94 (73.4%) |
| 35 to 44 Years | 125 (100.0%) | 0 (0.0%) |
| 45 to 54 Years | 36 (100.0%) | 0 (0.0%) |
| 55 to 64 Years | 62 (50.0%) | 90 (72.6%) |
| 65 to 74 Years | 96 (100.0%) | 6 (6.2%) |
| 75 Years and over | 82 (100.0%) | 0 (0.0%) |
| Total | 746 (92.3%) | 190 (23.5%) |
Disability Status by Sex by Age in Ventura
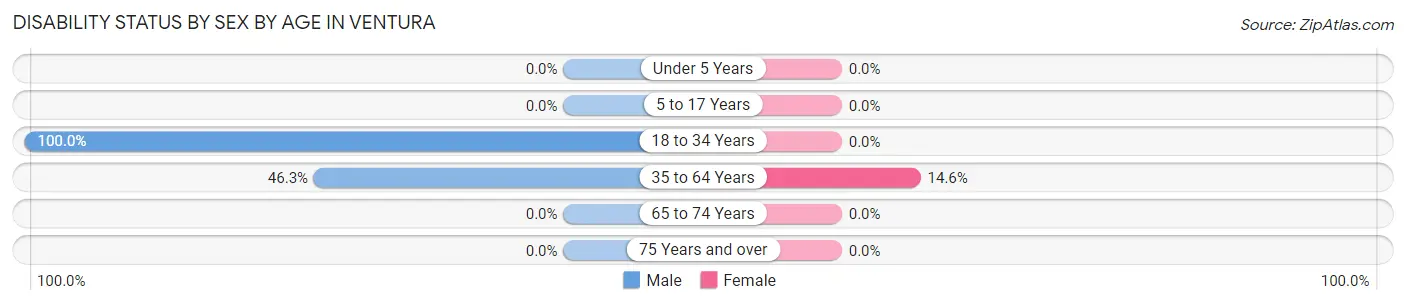
| Age Bracket | Male | Female |
| Under 5 Years | 0 (0.0%) | 0 (0.0%) |
| 5 to 17 Years | 0 (0.0%) | 0 (0.0%) |
| 18 to 34 Years | 94 (100.0%) | 0 (0.0%) |
| 35 to 64 Years | 75 (46.3%) | 18 (14.6%) |
| 65 to 74 Years | 0 (0.0%) | 0 (0.0%) |
| 75 Years and over | 0 (0.0%) | 0 (0.0%) |
Disability Class by Sex by Age in Ventura
Disability Class: Hearing Difficulty
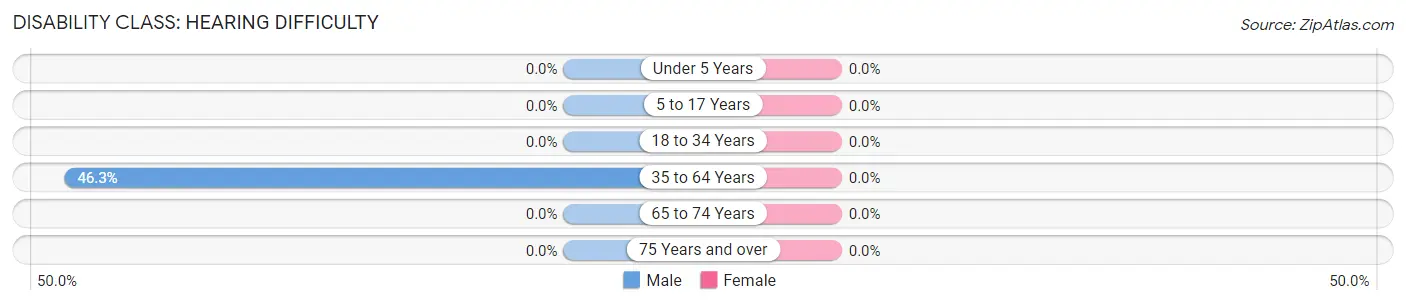
| Age Bracket | Male | Female |
| Under 5 Years | 0 (0.0%) | 0 (0.0%) |
| 5 to 17 Years | 0 (0.0%) | 0 (0.0%) |
| 18 to 34 Years | 0 (0.0%) | 0 (0.0%) |
| 35 to 64 Years | 75 (46.3%) | 0 (0.0%) |
| 65 to 74 Years | 0 (0.0%) | 0 (0.0%) |
| 75 Years and over | 0 (0.0%) | 0 (0.0%) |
Disability Class: Vision Difficulty
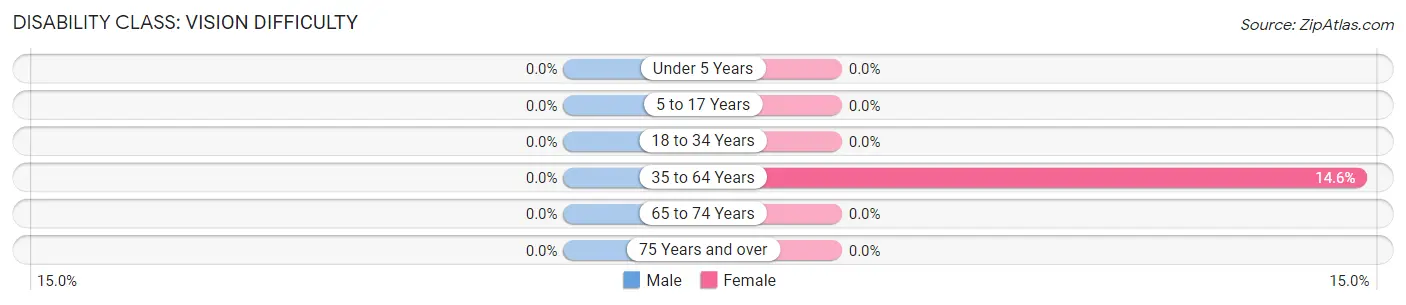
| Age Bracket | Male | Female |
| Under 5 Years | 0 (0.0%) | 0 (0.0%) |
| 5 to 17 Years | 0 (0.0%) | 0 (0.0%) |
| 18 to 34 Years | 0 (0.0%) | 0 (0.0%) |
| 35 to 64 Years | 0 (0.0%) | 18 (14.6%) |
| 65 to 74 Years | 0 (0.0%) | 0 (0.0%) |
| 75 Years and over | 0 (0.0%) | 0 (0.0%) |
Disability Class: Cognitive Difficulty
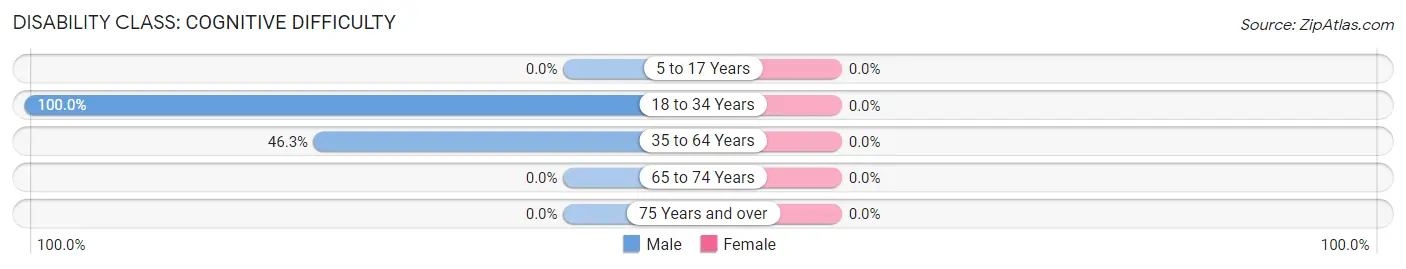
| Age Bracket | Male | Female |
| 5 to 17 Years | 0 (0.0%) | 0 (0.0%) |
| 18 to 34 Years | 94 (100.0%) | 0 (0.0%) |
| 35 to 64 Years | 75 (46.3%) | 0 (0.0%) |
| 65 to 74 Years | 0 (0.0%) | 0 (0.0%) |
| 75 Years and over | 0 (0.0%) | 0 (0.0%) |
Disability Class: Ambulatory Difficulty
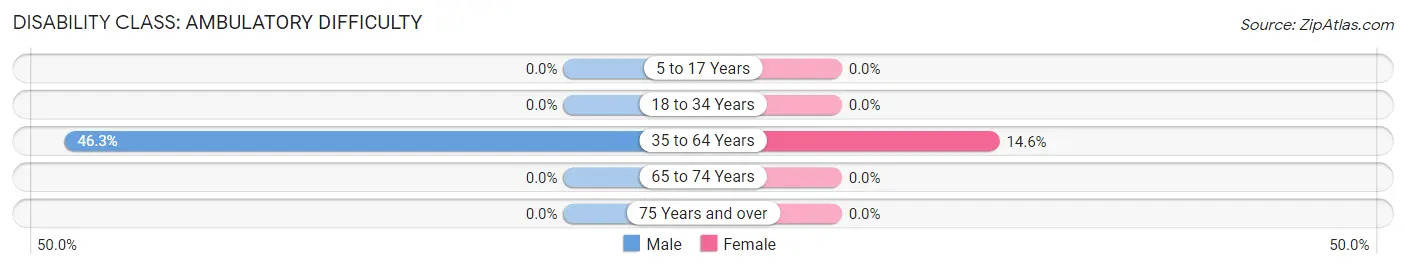
| Age Bracket | Male | Female |
| 5 to 17 Years | 0 (0.0%) | 0 (0.0%) |
| 18 to 34 Years | 0 (0.0%) | 0 (0.0%) |
| 35 to 64 Years | 75 (46.3%) | 18 (14.6%) |
| 65 to 74 Years | 0 (0.0%) | 0 (0.0%) |
| 75 Years and over | 0 (0.0%) | 0 (0.0%) |
Disability Class: Self-Care Difficulty
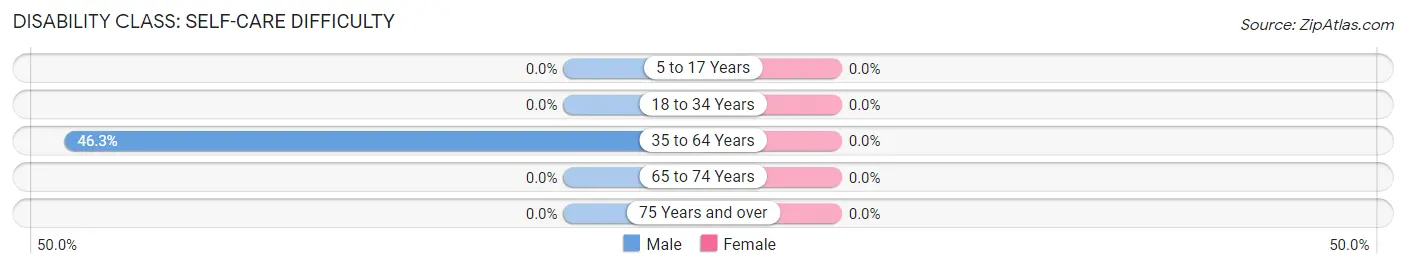
| Age Bracket | Male | Female |
| 5 to 17 Years | 0 (0.0%) | 0 (0.0%) |
| 18 to 34 Years | 0 (0.0%) | 0 (0.0%) |
| 35 to 64 Years | 75 (46.3%) | 0 (0.0%) |
| 65 to 74 Years | 0 (0.0%) | 0 (0.0%) |
| 75 Years and over | 0 (0.0%) | 0 (0.0%) |
Technology Access in Ventura
Computing Device Access in Ventura
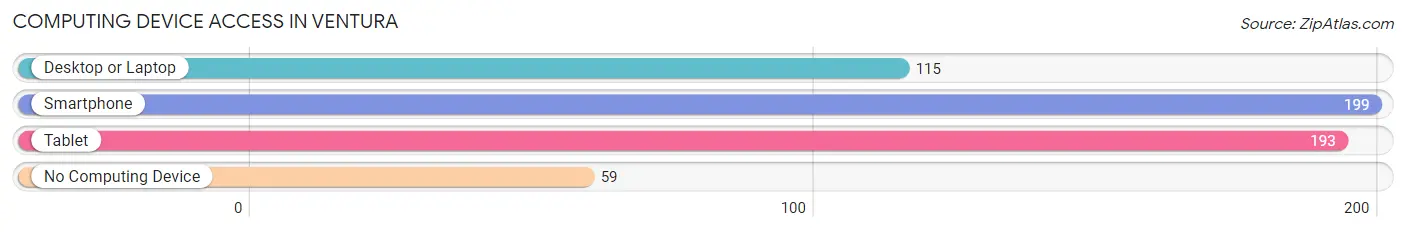
| Device Type | # Households | % Households |
| Desktop or Laptop | 115 | 39.1% |
| Smartphone | 199 | 67.7% |
| Tablet | 193 | 65.6% |
| No Computing Device | 59 | 20.1% |
| Total | 294 | 100.0% |
Internet Access in Ventura
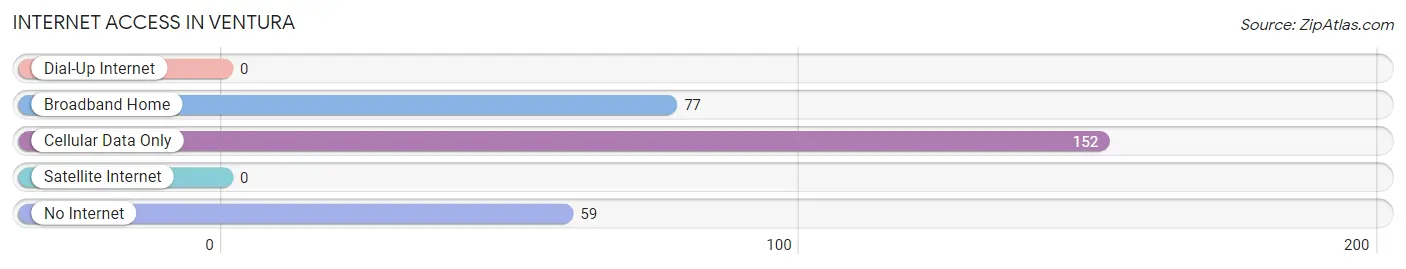
| Internet Type | # Households | % Households |
| Dial-Up Internet | 0 | 0.0% |
| Broadband Home | 77 | 26.2% |
| Cellular Data Only | 152 | 51.7% |
| Satellite Internet | 0 | 0.0% |
| No Internet | 59 | 20.1% |
| Total | 294 | 100.0% |
Ventura Summary
Ventura, New Mexico is a small town located in the northeastern corner of the state, near the Texas border. It is part of the San Miguel County and is the county seat. The town was founded in 1881 and has a population of approximately 1,000 people.
History
Ventura was founded in 1881 by a group of settlers from Texas. The town was named after the nearby Ventura River, which was named by Spanish explorers in the late 1700s. The town was originally a farming and ranching community, but it soon became a trading center for the surrounding area. In the early 1900s, the town was home to several businesses, including a hotel, a general store, a bank, and a post office.
In the 1920s, Ventura began to experience a period of growth. The town was connected to the rest of the state by a railroad line, and the population increased to over 1,000 people. During this time, the town was home to several businesses, including a movie theater, a drug store, and a grocery store.
In the 1950s, Ventura experienced a decline in population as many of its residents moved away to larger cities. However, the town was able to maintain its small-town charm and remains a popular destination for tourists.
Geography
Ventura is located in the northeastern corner of New Mexico, near the Texas border. The town is situated in the San Miguel Valley, which is surrounded by the San Miguel Mountains. The town is located at an elevation of 4,500 feet and has a semi-arid climate.
The town is located near several natural attractions, including the Carlsbad Caverns National Park, the Guadalupe Mountains National Park, and the White Sands National Monument.
Economy
Ventura’s economy is largely based on tourism. The town is home to several attractions, including the Carlsbad Caverns National Park, the Guadalupe Mountains National Park, and the White Sands National Monument. The town also has several restaurants, shops, and galleries.
In addition to tourism, Ventura’s economy is also supported by agriculture. The town is home to several farms, which produce a variety of crops, including alfalfa, corn, and wheat.
Demographics
As of the 2010 census, Ventura had a population of 1,000 people. The town is predominantly Hispanic, with over 90% of the population identifying as Hispanic or Latino. The median household income in Ventura is $30,000, and the median age is 33.
Conclusion
Ventura, New Mexico is a small town located in the northeastern corner of the state, near the Texas border. It is part of the San Miguel County and is the county seat. The town was founded in 1881 and has a population of approximately 1,000 people. Ventura’s economy is largely based on tourism, and the town is home to several attractions, including the Carlsbad Caverns National Park, the Guadalupe Mountains National Park, and the White Sands National Monument. The town is predominantly Hispanic, with over 90% of the population identifying as Hispanic or Latino.
Common Questions
What is Per Capita Income in Ventura?
Per Capita income in Ventura is $20,153.
What is Inequality or Gini Index in Ventura?
Inequality or Gini Index in Ventura is 0.41.
What is the Total Population of Ventura?
Total Population of Ventura is 808.
What is the Total Male Population of Ventura?
Total Male Population of Ventura is 324.
What is the Total Female Population of Ventura?
Total Female Population of Ventura is 484.
What is the Ratio of Males per 100 Females in Ventura?
There are 66.94 Males per 100 Females in Ventura.
What is the Ratio of Females per 100 Males in Ventura?
There are 149.38 Females per 100 Males in Ventura.
What is the Median Population Age in Ventura?
Median Population Age in Ventura is 41.5 Years.
What is the Average Family Size in Ventura
Average Family Size in Ventura is 3.2 People.
What is the Average Household Size in Ventura
Average Household Size in Ventura is 2.8 People.
How Large is the Labor Force in Ventura?
There are 143 People in the Labor Forcein in Ventura.
What is the Percentage of People in the Labor Force in Ventura?
18.9% of People are in the Labor Force in Ventura.