Cuyamungue, NM Map & Demographics
Cuyamungue Map
Cuyamungue Overview
$33,339
PER CAPITA INCOME
$80,938
AVG FAMILY INCOME
$64,500
AVG HOUSEHOLD INCOME
10.0%
WAGE / INCOME GAP [ % ]
90.0¢/ $1
WAGE / INCOME GAP [ $ ]
0.44
INEQUALITY / GINI INDEX
512
TOTAL POPULATION
232
MALE POPULATION
280
FEMALE POPULATION
82.86
MALES / 100 FEMALES
120.69
FEMALES / 100 MALES
42.7
MEDIAN AGE
3.4
AVG FAMILY SIZE
2.7
AVG HOUSEHOLD SIZE
218
LABOR FORCE [ PEOPLE ]
52.5%
PERCENT IN LABOR FORCE
3.7%
UNEMPLOYMENT RATE
Income in Cuyamungue
Income Overview in Cuyamungue
Per Capita Income in Cuyamungue is $33,339, while median incomes of families and households are $80,938 and $64,500 respectively.
| Characteristic | Number | Measure |
| Per Capita Income | 512 | $33,339 |
| Median Family Income | 123 | $80,938 |
| Mean Family Income | 123 | $97,587 |
| Median Household Income | 190 | $64,500 |
| Mean Household Income | 190 | $82,913 |
| Income Deficit | 123 | $0 |
| Wage / Income Gap (%) | 512 | 10.01% |
| Wage / Income Gap ($) | 512 | 89.99¢ per $1 |
| Gini / Inequality Index | 512 | 0.44 |
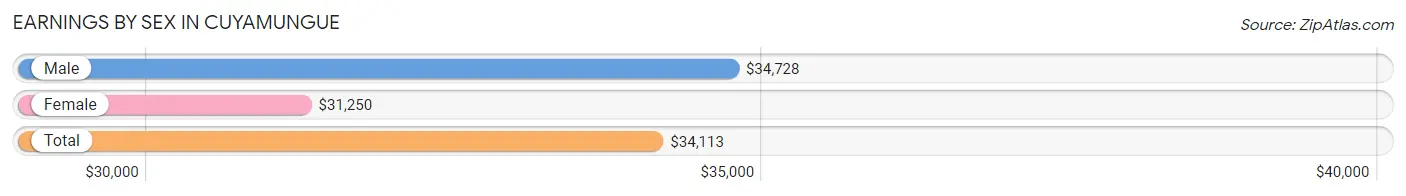
Earnings by Sex in Cuyamungue
Average Earnings in Cuyamungue are $34,113, $34,728 for men and $31,250 for women, a difference of 10.0%.
| Sex | Number | Average Earnings |
| Male | 107 (47.8%) | $34,728 |
| Female | 117 (52.2%) | $31,250 |
| Total | 224 (100.0%) | $34,113 |
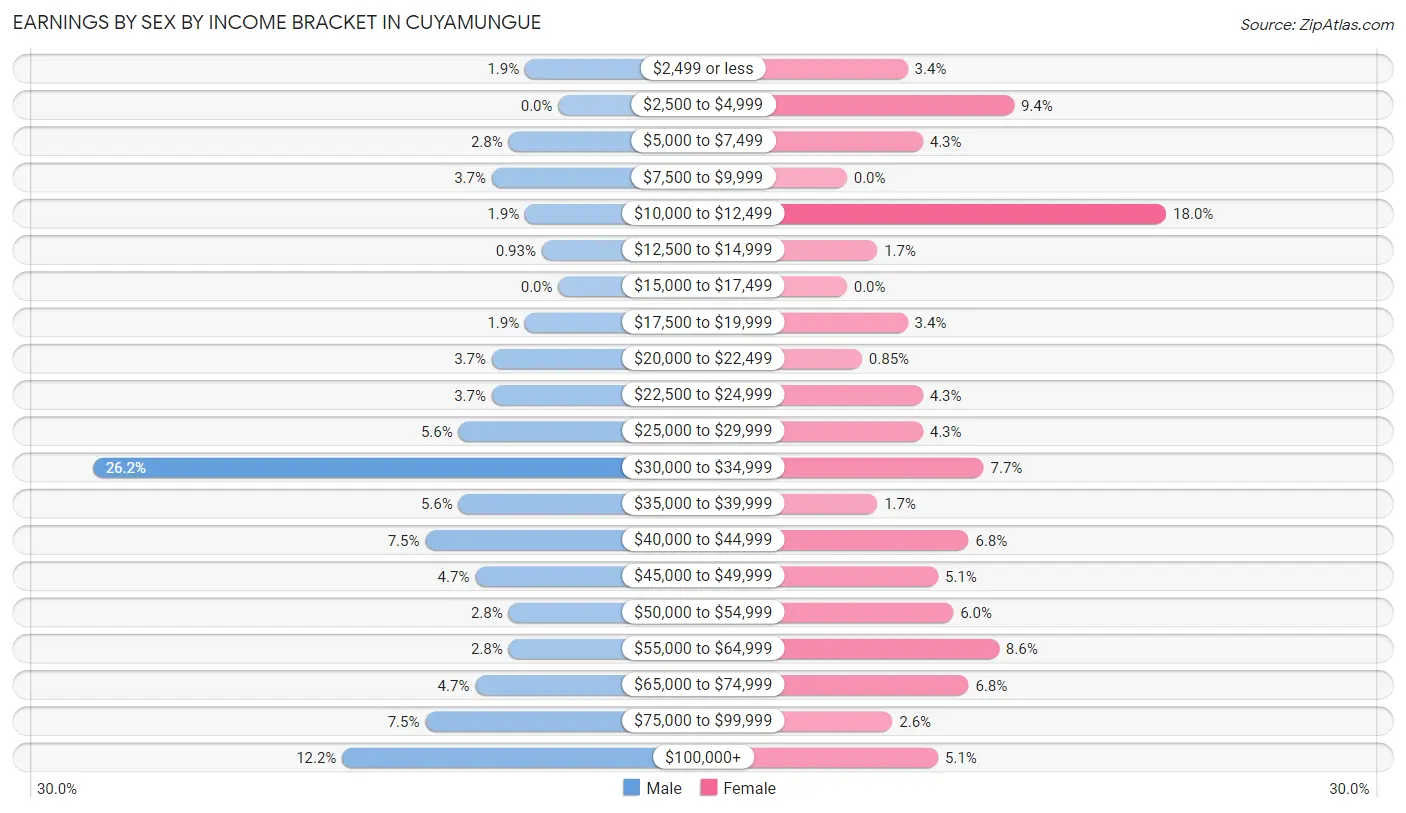
Earnings by Sex by Income Bracket in Cuyamungue
The most common earnings brackets in Cuyamungue are $30,000 to $34,999 for men (28 | 26.2%) and $10,000 to $12,499 for women (21 | 17.9%).
| Income | Male | Female |
| $2,499 or less | 2 (1.9%) | 4 (3.4%) |
| $2,500 to $4,999 | 0 (0.0%) | 11 (9.4%) |
| $5,000 to $7,499 | 3 (2.8%) | 5 (4.3%) |
| $7,500 to $9,999 | 4 (3.7%) | 0 (0.0%) |
| $10,000 to $12,499 | 2 (1.9%) | 21 (17.9%) |
| $12,500 to $14,999 | 1 (0.9%) | 2 (1.7%) |
| $15,000 to $17,499 | 0 (0.0%) | 0 (0.0%) |
| $17,500 to $19,999 | 2 (1.9%) | 4 (3.4%) |
| $20,000 to $22,499 | 4 (3.7%) | 1 (0.9%) |
| $22,500 to $24,999 | 4 (3.7%) | 5 (4.3%) |
| $25,000 to $29,999 | 6 (5.6%) | 5 (4.3%) |
| $30,000 to $34,999 | 28 (26.2%) | 9 (7.7%) |
| $35,000 to $39,999 | 6 (5.6%) | 2 (1.7%) |
| $40,000 to $44,999 | 8 (7.5%) | 8 (6.8%) |
| $45,000 to $49,999 | 5 (4.7%) | 6 (5.1%) |
| $50,000 to $54,999 | 3 (2.8%) | 7 (6.0%) |
| $55,000 to $64,999 | 3 (2.8%) | 10 (8.6%) |
| $65,000 to $74,999 | 5 (4.7%) | 8 (6.8%) |
| $75,000 to $99,999 | 8 (7.5%) | 3 (2.6%) |
| $100,000+ | 13 (12.1%) | 6 (5.1%) |
| Total | 107 (100.0%) | 117 (100.0%) |
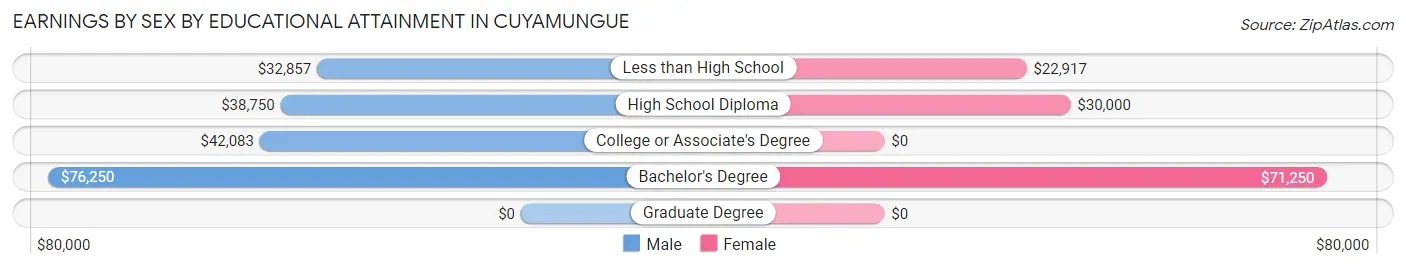
Earnings by Sex by Educational Attainment in Cuyamungue
Average earnings in Cuyamungue are $37,917 for men and $33,250 for women, a difference of 12.3%. Men with an educational attainment of bachelor's degree enjoy the highest average annual earnings of $76,250, while those with less than high school education earn the least with $32,857. Women with an educational attainment of bachelor's degree earn the most with the average annual earnings of $71,250, while those with less than high school education have the smallest earnings of $22,917.
| Educational Attainment | Male Income | Female Income |
| Less than High School | $32,857 | $22,917 |
| High School Diploma | $38,750 | $30,000 |
| College or Associate's Degree | $42,083 | $0 |
| Bachelor's Degree | $76,250 | $71,250 |
| Graduate Degree | - | - |
| Total | $37,917 | $33,250 |
Family Income in Cuyamungue
Family Income Brackets in Cuyamungue
According to the Cuyamungue family income data, there are 24 families falling into the $75,000 to $99,999 income range, which is the most common income bracket and makes up 19.5% of all families. Conversely, the $10,000 to $14,999 income bracket is the least frequent group with only 3 families (2.4%) belonging to this category.
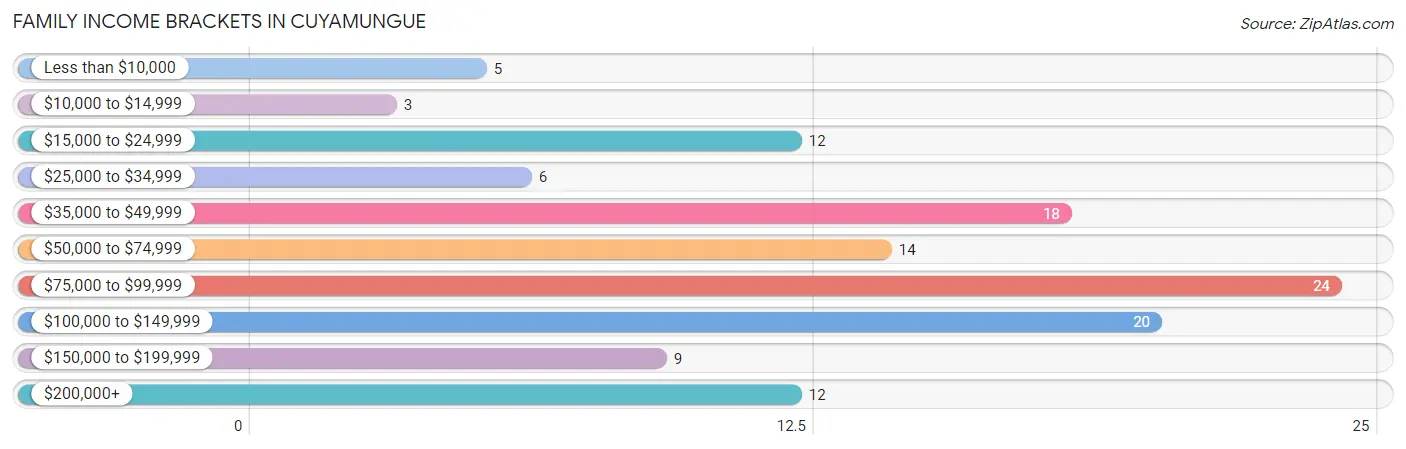
| Income Bracket | # Families | % Families |
| Less than $10,000 | 5 | 4.1% |
| $10,000 to $14,999 | 3 | 2.4% |
| $15,000 to $24,999 | 12 | 9.8% |
| $25,000 to $34,999 | 6 | 4.9% |
| $35,000 to $49,999 | 18 | 14.6% |
| $50,000 to $74,999 | 14 | 11.4% |
| $75,000 to $99,999 | 24 | 19.5% |
| $100,000 to $149,999 | 20 | 16.3% |
| $150,000 to $199,999 | 9 | 7.3% |
| $200,000+ | 12 | 9.8% |
Family Income by Famaliy Size in Cuyamungue
6-person families (9 | 7.3%) account for the highest median family income in Cuyamungue with $101,250 per family, while 2-person families (62 | 50.4%) have the highest median income of $38,125 per family member.
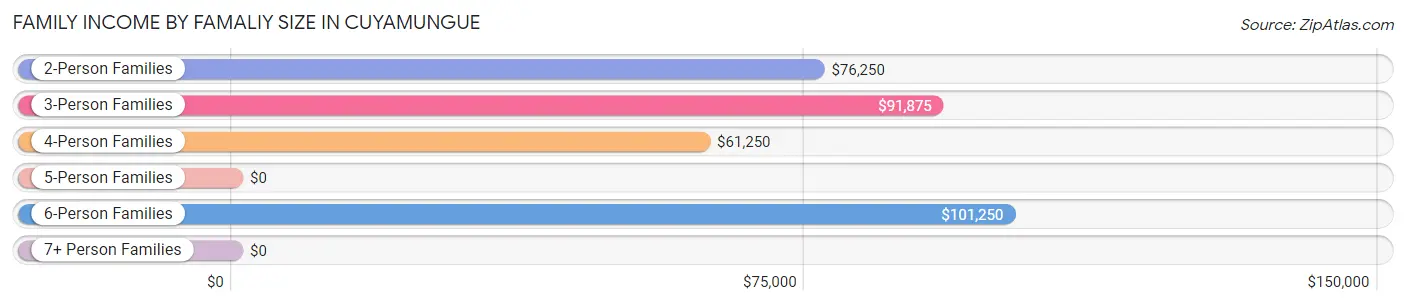
| Income Bracket | # Families | Median Income |
| 2-Person Families | 62 (50.4%) | $76,250 |
| 3-Person Families | 19 (15.4%) | $91,875 |
| 4-Person Families | 24 (19.5%) | $61,250 |
| 5-Person Families | 8 (6.5%) | $0 |
| 6-Person Families | 9 (7.3%) | $101,250 |
| 7+ Person Families | 1 (0.8%) | $0 |
| Total | 123 (100.0%) | $80,938 |
Family Income by Number of Earners in Cuyamungue
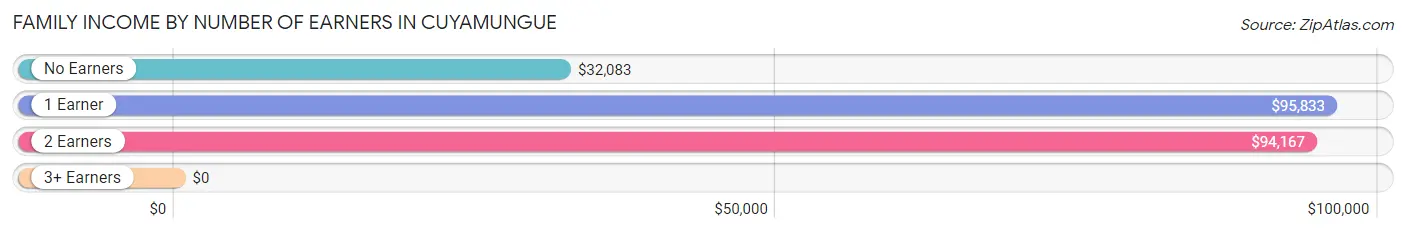
| Number of Earners | # Families | Median Income |
| No Earners | 33 (26.8%) | $32,083 |
| 1 Earner | 30 (24.4%) | $95,833 |
| 2 Earners | 46 (37.4%) | $94,167 |
| 3+ Earners | 14 (11.4%) | $0 |
| Total | 123 (100.0%) | $80,938 |
Household Income in Cuyamungue
Household Income Brackets in Cuyamungue
With 41 households falling in the category, the $75,000 to $99,999 income range is the most frequent in Cuyamungue, accounting for 21.6% of all households. In contrast, only 5 households (2.6%) fall into the $10,000 to $14,999 income bracket, making it the least populous group.
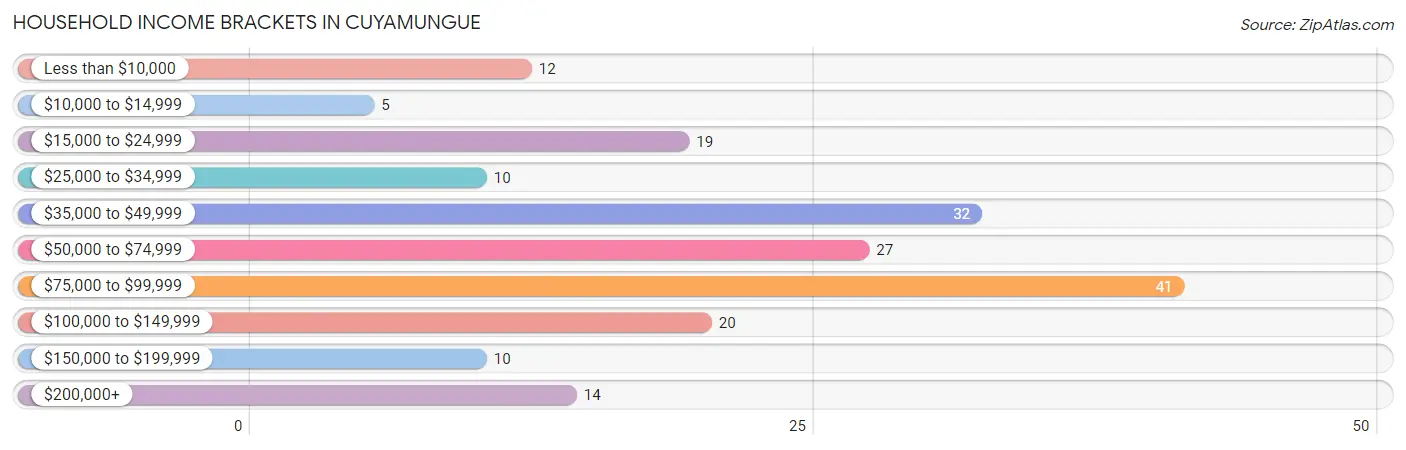
| Income Bracket | # Households | % Households |
| Less than $10,000 | 12 | 6.3% |
| $10,000 to $14,999 | 5 | 2.6% |
| $15,000 to $24,999 | 19 | 10.0% |
| $25,000 to $34,999 | 10 | 5.3% |
| $35,000 to $49,999 | 32 | 16.8% |
| $50,000 to $74,999 | 27 | 14.2% |
| $75,000 to $99,999 | 41 | 21.6% |
| $100,000 to $149,999 | 20 | 10.5% |
| $150,000 to $199,999 | 10 | 5.3% |
| $200,000+ | 14 | 7.4% |
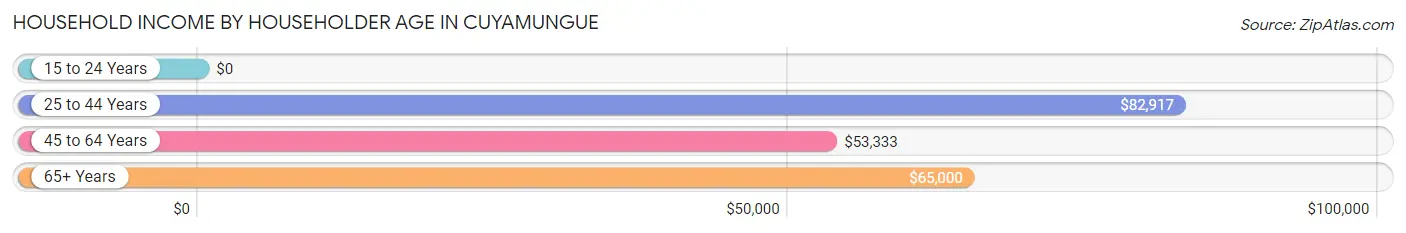
Household Income by Householder Age in Cuyamungue
The median household income in Cuyamungue is $64,500, with the highest median household income of $82,917 found in the 25 to 44 years age bracket for the primary householder. A total of 39 households (20.5%) fall into this category. Meanwhile, the 15 to 24 years age bracket for the primary householder has the lowest median household income of $0, with 3 households (1.6%) in this group.
| Income Bracket | # Households | Median Income |
| 15 to 24 Years | 3 (1.6%) | $0 |
| 25 to 44 Years | 39 (20.5%) | $82,917 |
| 45 to 64 Years | 80 (42.1%) | $53,333 |
| 65+ Years | 68 (35.8%) | $65,000 |
| Total | 190 (100.0%) | $64,500 |
Poverty in Cuyamungue
Income Below Poverty by Sex and Age in Cuyamungue
With 17.3% poverty level for males and 11.2% for females among the residents of Cuyamungue, under 5 year old males and 45 to 54 year old females are the most vulnerable to poverty, with 2 males (40.0%) and 4 females (21.0%) in their respective age groups living below the poverty level.
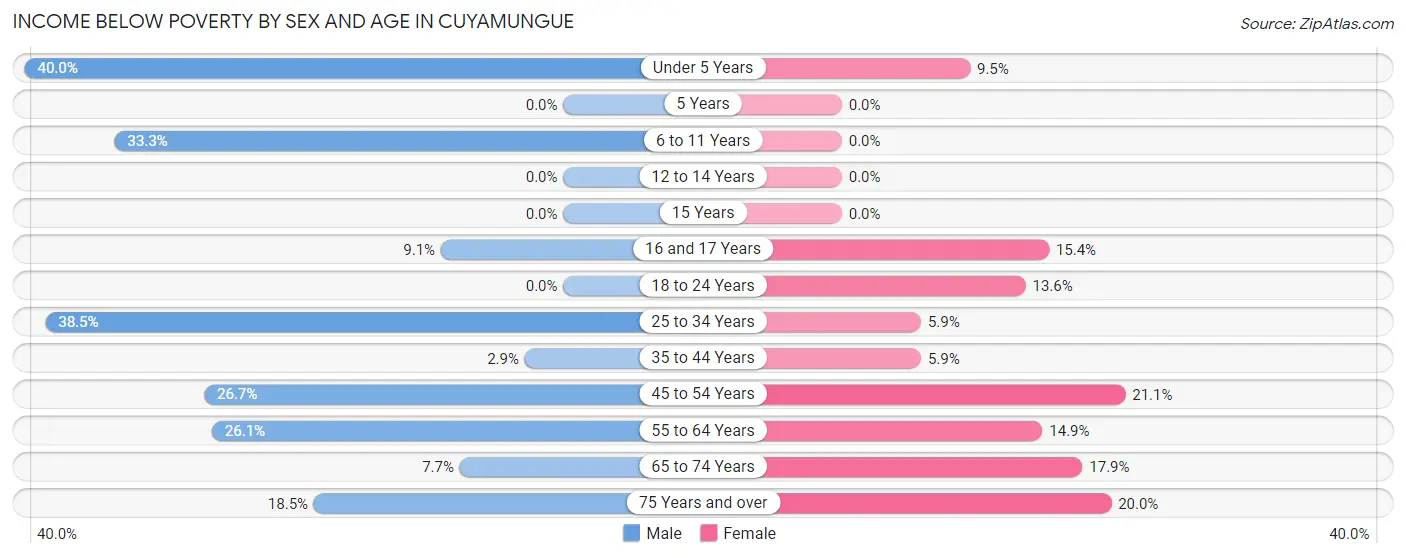
| Age Bracket | Male | Female |
| Under 5 Years | 2 (40.0%) | 2 (9.5%) |
| 5 Years | 0 (0.0%) | 0 (0.0%) |
| 6 to 11 Years | 4 (33.3%) | 0 (0.0%) |
| 12 to 14 Years | 0 (0.0%) | 0 (0.0%) |
| 15 Years | 0 (0.0%) | 0 (0.0%) |
| 16 and 17 Years | 1 (9.1%) | 2 (15.4%) |
| 18 to 24 Years | 0 (0.0%) | 3 (13.6%) |
| 25 to 34 Years | 5 (38.5%) | 2 (5.9%) |
| 35 to 44 Years | 1 (2.9%) | 2 (5.9%) |
| 45 to 54 Years | 8 (26.7%) | 4 (21.0%) |
| 55 to 64 Years | 12 (26.1%) | 7 (14.9%) |
| 65 to 74 Years | 2 (7.7%) | 5 (17.9%) |
| 75 Years and over | 5 (18.5%) | 4 (20.0%) |
| Total | 40 (17.3%) | 31 (11.2%) |
Income Above Poverty by Sex and Age in Cuyamungue
According to the poverty statistics in Cuyamungue, males aged 5 years and females aged 6 to 11 years are the age groups that are most secure financially, with 100.0% of males and 100.0% of females in these age groups living above the poverty line.
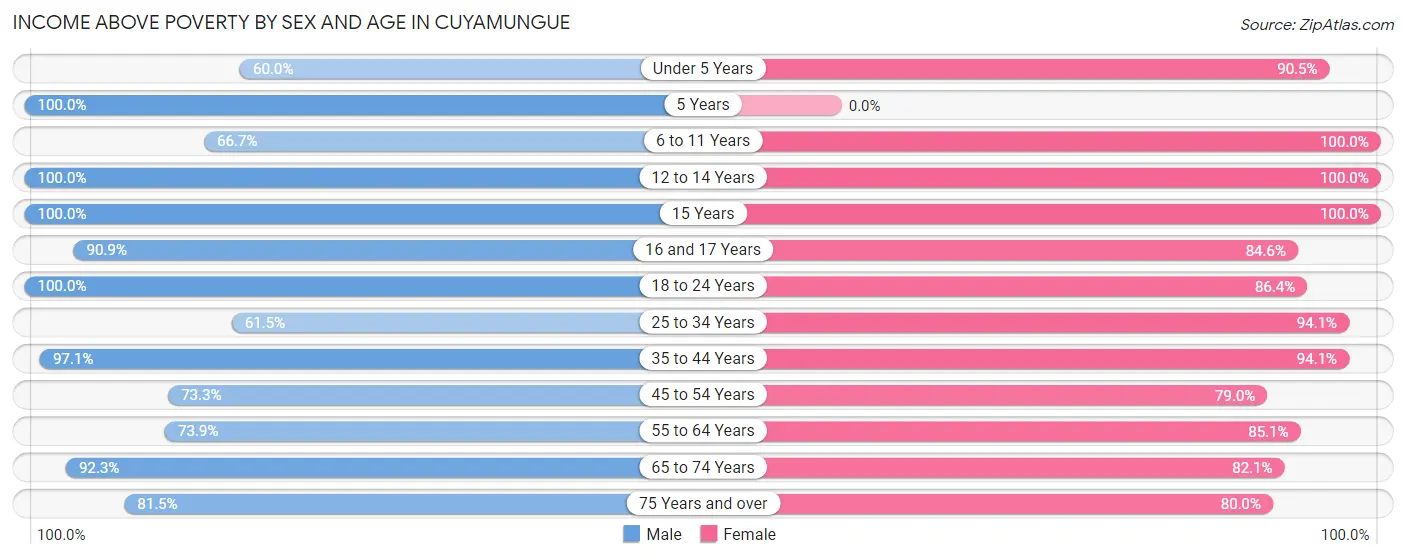
| Age Bracket | Male | Female |
| Under 5 Years | 3 (60.0%) | 19 (90.5%) |
| 5 Years | 2 (100.0%) | 0 (0.0%) |
| 6 to 11 Years | 8 (66.7%) | 23 (100.0%) |
| 12 to 14 Years | 7 (100.0%) | 13 (100.0%) |
| 15 Years | 7 (100.0%) | 4 (100.0%) |
| 16 and 17 Years | 10 (90.9%) | 11 (84.6%) |
| 18 to 24 Years | 10 (100.0%) | 19 (86.4%) |
| 25 to 34 Years | 8 (61.5%) | 32 (94.1%) |
| 35 to 44 Years | 34 (97.1%) | 32 (94.1%) |
| 45 to 54 Years | 22 (73.3%) | 15 (78.9%) |
| 55 to 64 Years | 34 (73.9%) | 40 (85.1%) |
| 65 to 74 Years | 24 (92.3%) | 23 (82.1%) |
| 75 Years and over | 22 (81.5%) | 16 (80.0%) |
| Total | 191 (82.7%) | 247 (88.8%) |
Income Below Poverty Among Married-Couple Families in Cuyamungue
The poverty statistics for married-couple families in Cuyamungue show that 10.7% or 10 of the total 93 families live below the poverty line. Families with 1 or 2 children have the highest poverty rate of 18.5%, comprising of 5 families. On the other hand, families with 3 or 4 children have the lowest poverty rate of 0.0%, which includes 0 families.
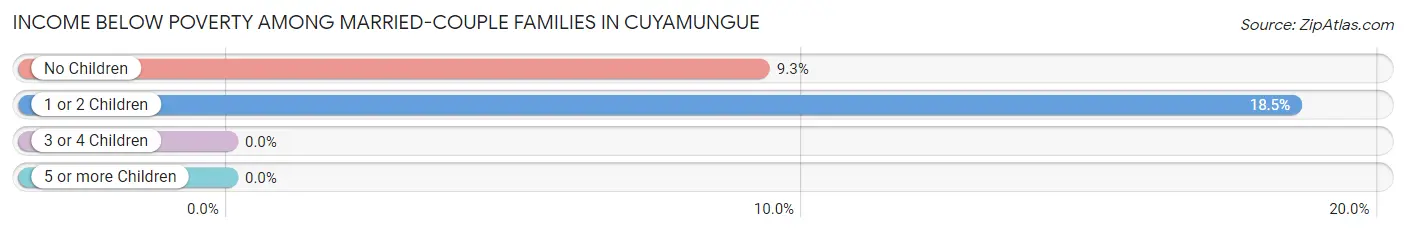
| Children | Above Poverty | Below Poverty |
| No Children | 49 (90.7%) | 5 (9.3%) |
| 1 or 2 Children | 22 (81.5%) | 5 (18.5%) |
| 3 or 4 Children | 12 (100.0%) | 0 (0.0%) |
| 5 or more Children | 0 (0.0%) | 0 (0.0%) |
| Total | 83 (89.2%) | 10 (10.7%) |
Income Below Poverty Among Single-Parent Households in Cuyamungue
According to the poverty data in Cuyamungue, 25.0% or 3 single-father households and 16.7% or 3 single-mother households are living below the poverty line. Among single-father households, those with 1 or 2 children have the highest poverty rate, with 3 households (60.0%) experiencing poverty. Likewise, among single-mother households, those with no children have the highest poverty rate, with 3 households (30.0%) falling below the poverty line.
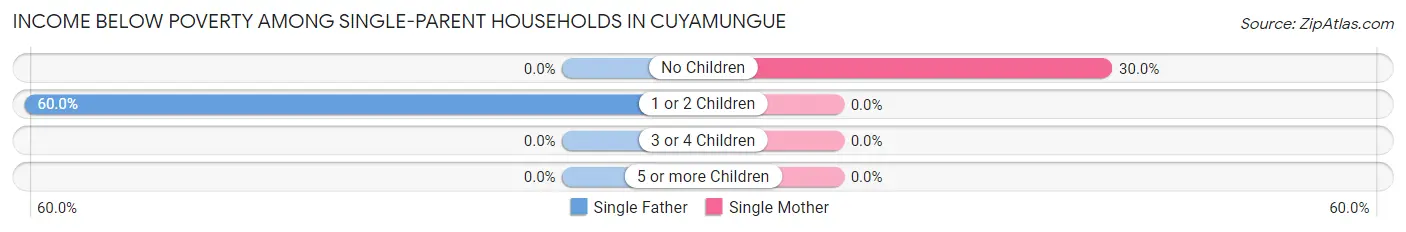
| Children | Single Father | Single Mother |
| No Children | 0 (0.0%) | 3 (30.0%) |
| 1 or 2 Children | 3 (60.0%) | 0 (0.0%) |
| 3 or 4 Children | 0 (0.0%) | 0 (0.0%) |
| 5 or more Children | 0 (0.0%) | 0 (0.0%) |
| Total | 3 (25.0%) | 3 (16.7%) |
Income Below Poverty Among Married-Couple vs Single-Parent Households in Cuyamungue
The poverty data for Cuyamungue shows that 10 of the married-couple family households (10.7%) and 6 of the single-parent households (20.0%) are living below the poverty level. Within the married-couple family households, those with 1 or 2 children have the highest poverty rate, with 5 households (18.5%) falling below the poverty line. Among the single-parent households, those with 1 or 2 children have the highest poverty rate, with 3 household (23.1%) living below poverty.
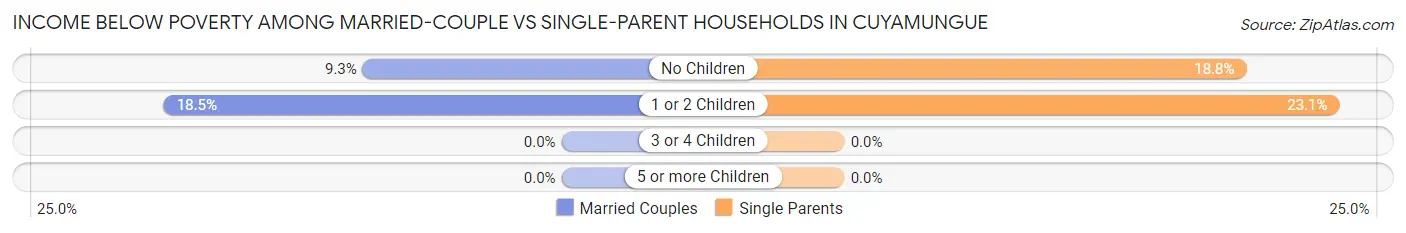
| Children | Married-Couple Families | Single-Parent Households |
| No Children | 5 (9.3%) | 3 (18.8%) |
| 1 or 2 Children | 5 (18.5%) | 3 (23.1%) |
| 3 or 4 Children | 0 (0.0%) | 0 (0.0%) |
| 5 or more Children | 0 (0.0%) | 0 (0.0%) |
| Total | 10 (10.7%) | 6 (20.0%) |
Race in Cuyamungue
The most populous races in Cuyamungue are Hispanic or Latino (420 | 82.0%), White / Caucasian (265 | 51.8%), and Two or more Races (132 | 25.8%).
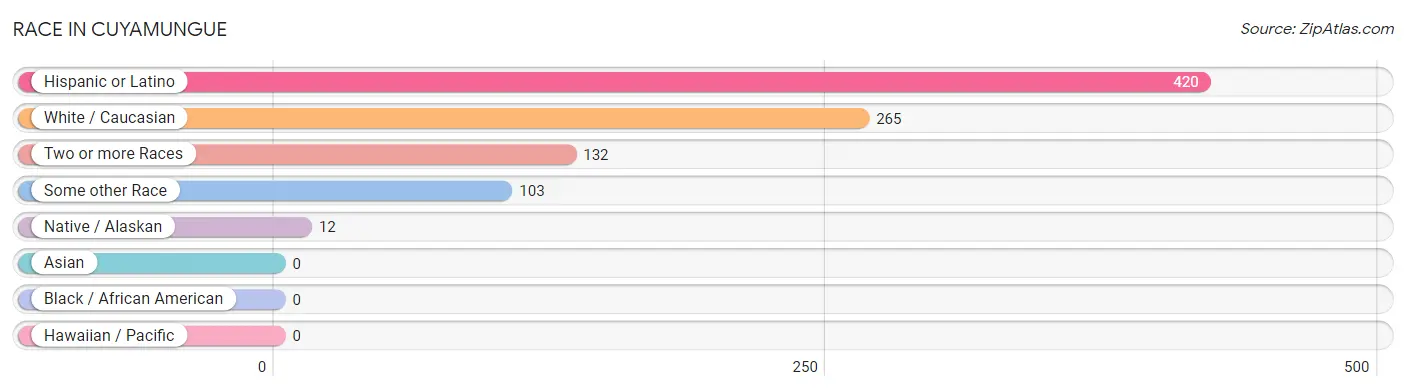
| Race | # Population | % Population |
| Asian | 0 | 0.0% |
| Black / African American | 0 | 0.0% |
| Hawaiian / Pacific | 0 | 0.0% |
| Hispanic or Latino | 420 | 82.0% |
| Native / Alaskan | 12 | 2.3% |
| White / Caucasian | 265 | 51.8% |
| Two or more Races | 132 | 25.8% |
| Some other Race | 103 | 20.1% |
| Total | 512 | 100.0% |
Ancestry in Cuyamungue
The most populous ancestries reported in Cuyamungue are Mexican (141 | 27.5%), Spanish (127 | 24.8%), Spaniard (81 | 15.8%), Pueblo (18 | 3.5%), and American (16 | 3.1%), together accounting for 74.8% of all Cuyamungue residents.
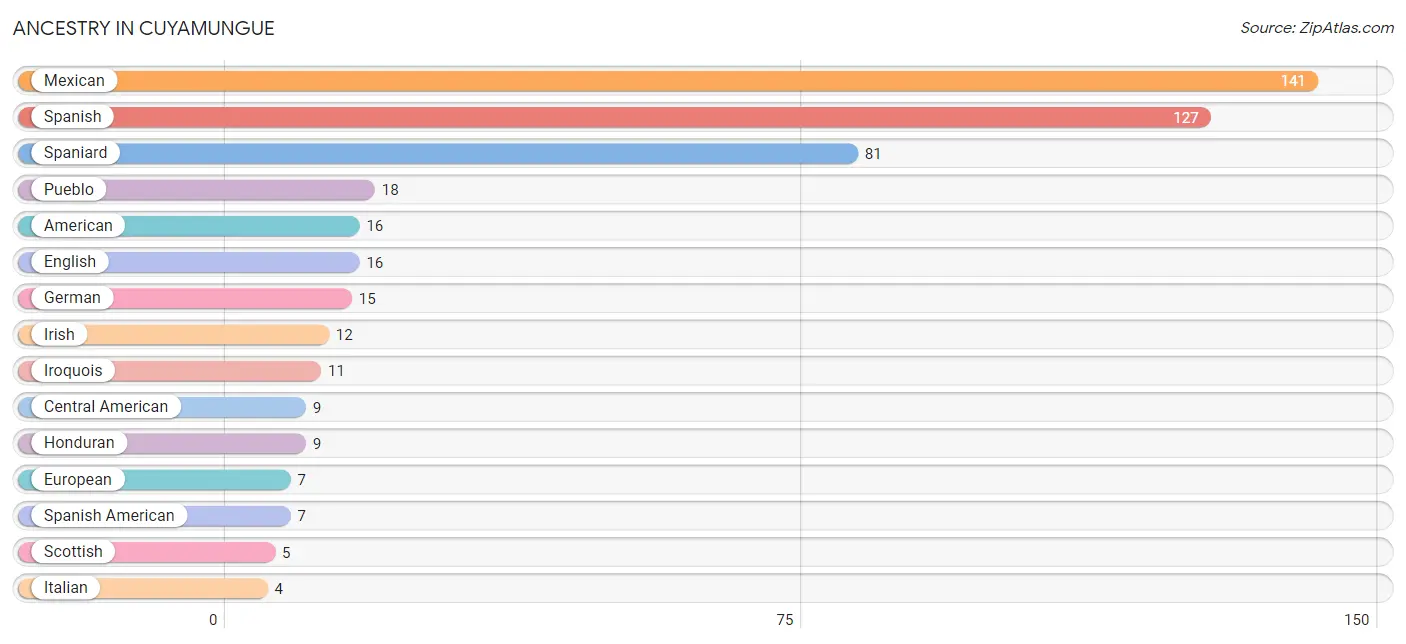
| Ancestry | # Population | % Population |
| American | 16 | 3.1% |
| Arab | 1 | 0.2% |
| Central American | 9 | 1.8% |
| Colombian | 2 | 0.4% |
| Czech | 1 | 0.2% |
| Czechoslovakian | 2 | 0.4% |
| English | 16 | 3.1% |
| European | 7 | 1.4% |
| Finnish | 1 | 0.2% |
| German | 15 | 2.9% |
| Honduran | 9 | 1.8% |
| Inupiat | 1 | 0.2% |
| Irish | 12 | 2.3% |
| Iroquois | 11 | 2.1% |
| Italian | 4 | 0.8% |
| Korean | 3 | 0.6% |
| Mexican | 141 | 27.5% |
| Northern European | 1 | 0.2% |
| Polish | 1 | 0.2% |
| Pueblo | 18 | 3.5% |
| Scottish | 5 | 1.0% |
| South American | 2 | 0.4% |
| Spaniard | 81 | 15.8% |
| Spanish | 127 | 24.8% |
| Spanish American | 7 | 1.4% |
| Welsh | 2 | 0.4% | View All 26 Rows |
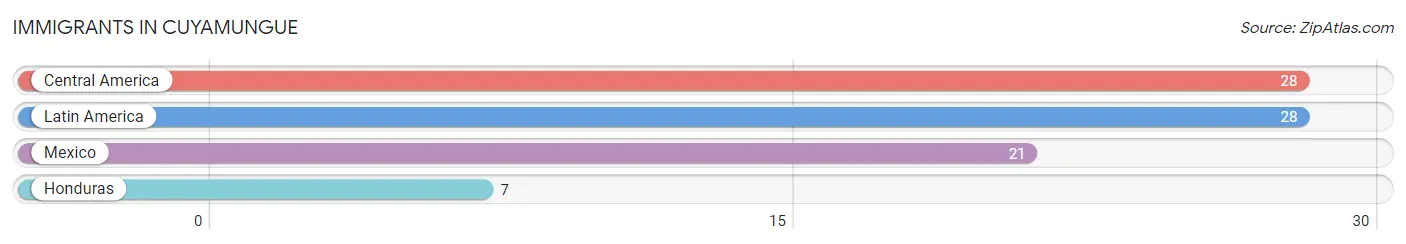
Immigrants in Cuyamungue
The most numerous immigrant groups reported in Cuyamungue came from Central America (28 | 5.5%), Latin America (28 | 5.5%), Mexico (21 | 4.1%), and Honduras (7 | 1.4%), together accounting for 16.4% of all Cuyamungue residents.
| Immigration Origin | # Population | % Population |
| Central America | 28 | 5.5% |
| Honduras | 7 | 1.4% |
| Latin America | 28 | 5.5% |
| Mexico | 21 | 4.1% | View All 4 Rows |
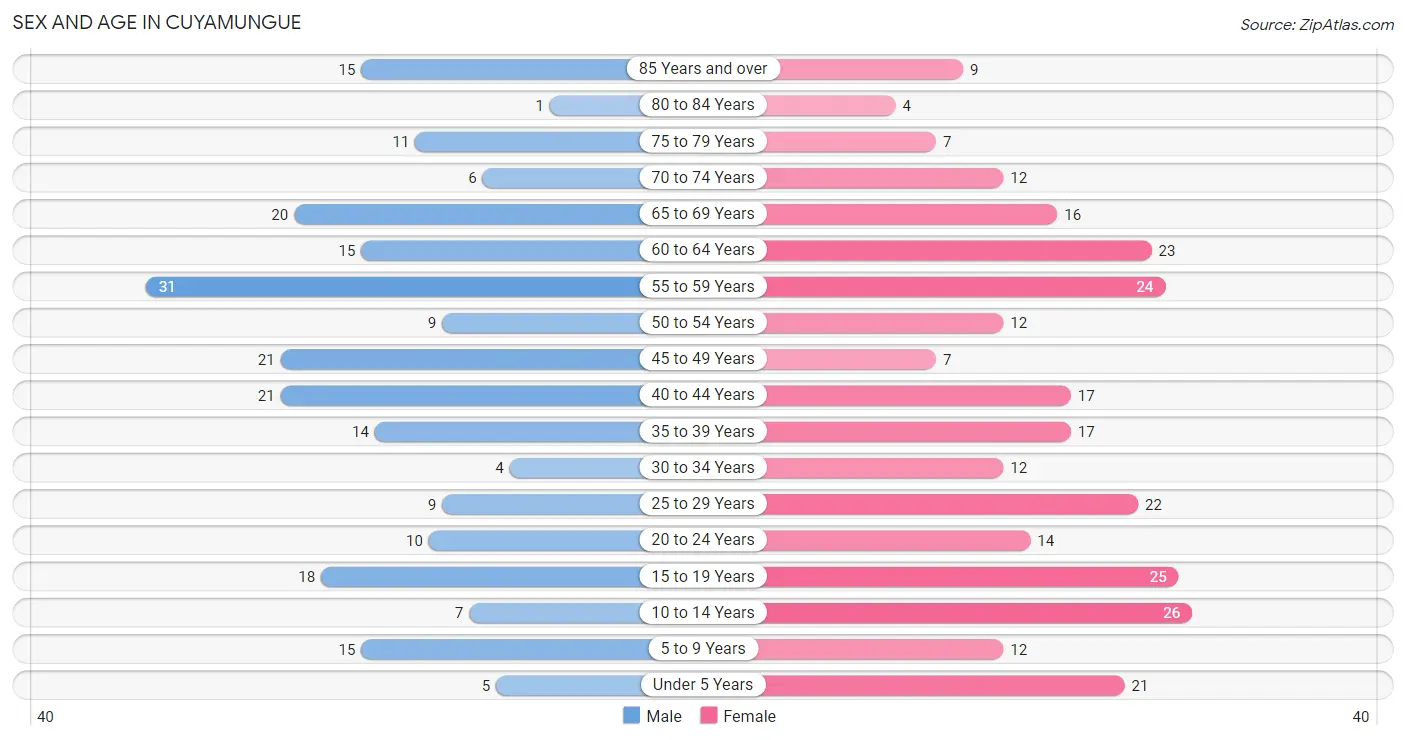
Sex and Age in Cuyamungue
Sex and Age in Cuyamungue
The most populous age groups in Cuyamungue are 55 to 59 Years (31 | 13.4%) for men and 10 to 14 Years (26 | 9.3%) for women.
| Age Bracket | Male | Female |
| Under 5 Years | 5 (2.2%) | 21 (7.5%) |
| 5 to 9 Years | 15 (6.5%) | 12 (4.3%) |
| 10 to 14 Years | 7 (3.0%) | 26 (9.3%) |
| 15 to 19 Years | 18 (7.8%) | 25 (8.9%) |
| 20 to 24 Years | 10 (4.3%) | 14 (5.0%) |
| 25 to 29 Years | 9 (3.9%) | 22 (7.9%) |
| 30 to 34 Years | 4 (1.7%) | 12 (4.3%) |
| 35 to 39 Years | 14 (6.0%) | 17 (6.1%) |
| 40 to 44 Years | 21 (9.0%) | 17 (6.1%) |
| 45 to 49 Years | 21 (9.0%) | 7 (2.5%) |
| 50 to 54 Years | 9 (3.9%) | 12 (4.3%) |
| 55 to 59 Years | 31 (13.4%) | 24 (8.6%) |
| 60 to 64 Years | 15 (6.5%) | 23 (8.2%) |
| 65 to 69 Years | 20 (8.6%) | 16 (5.7%) |
| 70 to 74 Years | 6 (2.6%) | 12 (4.3%) |
| 75 to 79 Years | 11 (4.7%) | 7 (2.5%) |
| 80 to 84 Years | 1 (0.4%) | 4 (1.4%) |
| 85 Years and over | 15 (6.5%) | 9 (3.2%) |
| Total | 232 (100.0%) | 280 (100.0%) |
Families and Households in Cuyamungue
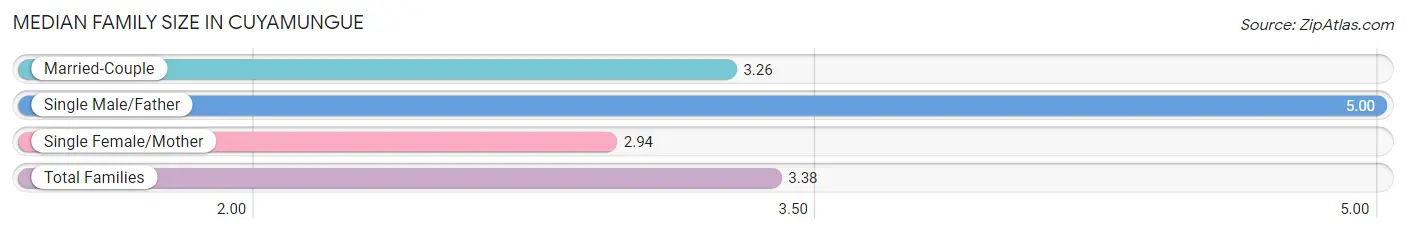
Median Family Size in Cuyamungue
The median family size in Cuyamungue is 3.38 persons per family, with single male/father families (12 | 9.8%) accounting for the largest median family size of 5 persons per family. On the other hand, single female/mother families (18 | 14.6%) represent the smallest median family size with 2.94 persons per family.
| Family Type | # Families | Family Size |
| Married-Couple | 93 (75.6%) | 3.26 |
| Single Male/Father | 12 (9.8%) | 5.00 |
| Single Female/Mother | 18 (14.6%) | 2.94 |
| Total Families | 123 (100.0%) | 3.38 |
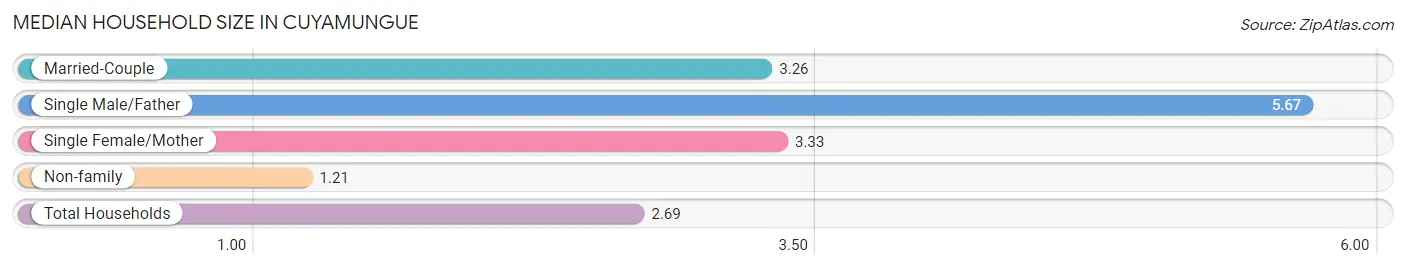
Median Household Size in Cuyamungue
The median household size in Cuyamungue is 2.69 persons per household, with single male/father households (12 | 6.3%) accounting for the largest median household size of 5.67 persons per household. non-family households (67 | 35.3%) represent the smallest median household size with 1.21 persons per household.
| Household Type | # Households | Household Size |
| Married-Couple | 93 (48.9%) | 3.26 |
| Single Male/Father | 12 (6.3%) | 5.67 |
| Single Female/Mother | 18 (9.5%) | 3.33 |
| Non-family | 67 (35.3%) | 1.21 |
| Total Households | 190 (100.0%) | 2.69 |
Household Size by Marriage Status in Cuyamungue
Out of a total of 190 households in Cuyamungue, 123 (64.7%) are family households, while 67 (35.3%) are nonfamily households. The most numerous type of family households are 2-person households, comprising 57, and the most common type of nonfamily households are 1-person households, comprising 58.
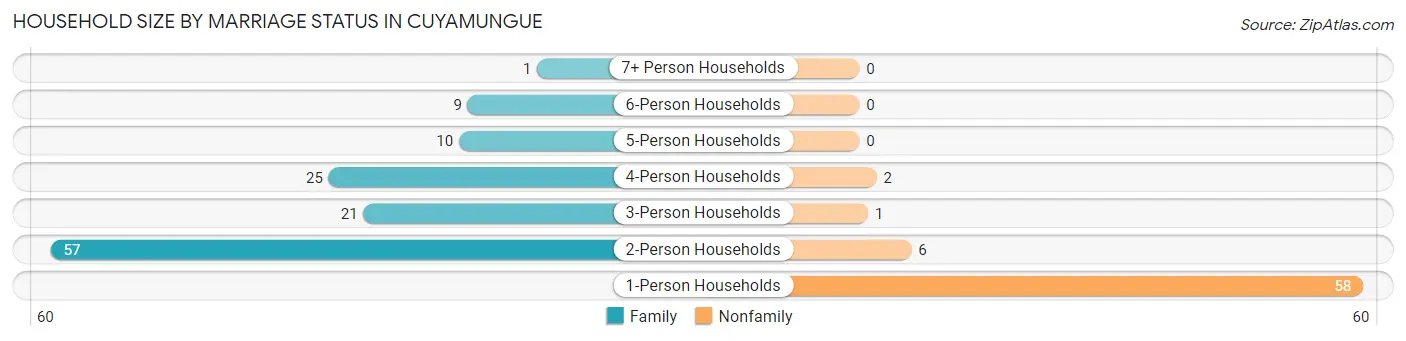
| Household Size | Family Households | Nonfamily Households |
| 1-Person Households | - | 58 (30.5%) |
| 2-Person Households | 57 (30.0%) | 6 (3.2%) |
| 3-Person Households | 21 (11.1%) | 1 (0.5%) |
| 4-Person Households | 25 (13.2%) | 2 (1.1%) |
| 5-Person Households | 10 (5.3%) | 0 (0.0%) |
| 6-Person Households | 9 (4.7%) | 0 (0.0%) |
| 7+ Person Households | 1 (0.5%) | 0 (0.0%) |
| Total | 123 (64.7%) | 67 (35.3%) |
Female Fertility in Cuyamungue
Fertility by Age in Cuyamungue
Average fertility rate in Cuyamungue is 26.0 births per 1,000 women. Women in the age bracket of 15 to 19 years have the highest fertility rate with 80.0 births per 1,000 women. Women in the age bracket of 15 to 19 years acount for 66.7% of all women with births.
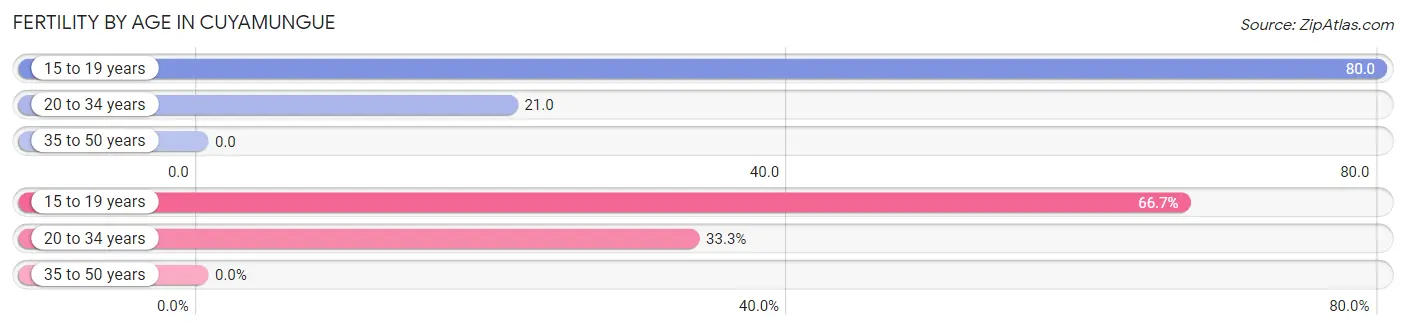
| Age Bracket | Women with Births | Births / 1,000 Women |
| 15 to 19 years | 2 (66.7%) | 80.0 |
| 20 to 34 years | 1 (33.3%) | 21.0 |
| 35 to 50 years | 0 (0.0%) | 0.0 |
| Total | 3 (100.0%) | 26.0 |
Fertility by Age by Marriage Status in Cuyamungue
33.3% of women with births (3) in Cuyamungue are married. The highest percentage of unmarried women with births falls into 15 to 19 years age bracket with 100.0% of them unmarried at the time of birth, while the lowest percentage of unmarried women with births belong to 20 to 34 years age bracket with 0.0% of them unmarried.
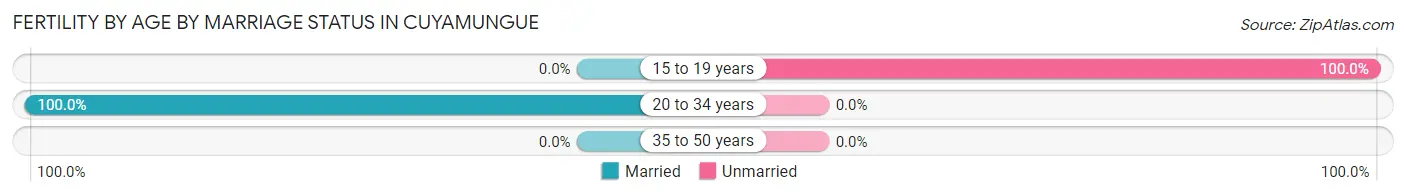
| Age Bracket | Married | Unmarried |
| 15 to 19 years | 0 (0.0%) | 2 (100.0%) |
| 20 to 34 years | 1 (100.0%) | 0 (0.0%) |
| 35 to 50 years | 0 (0.0%) | 0 (0.0%) |
| Total | 1 (33.3%) | 2 (66.7%) |
Fertility by Education in Cuyamungue
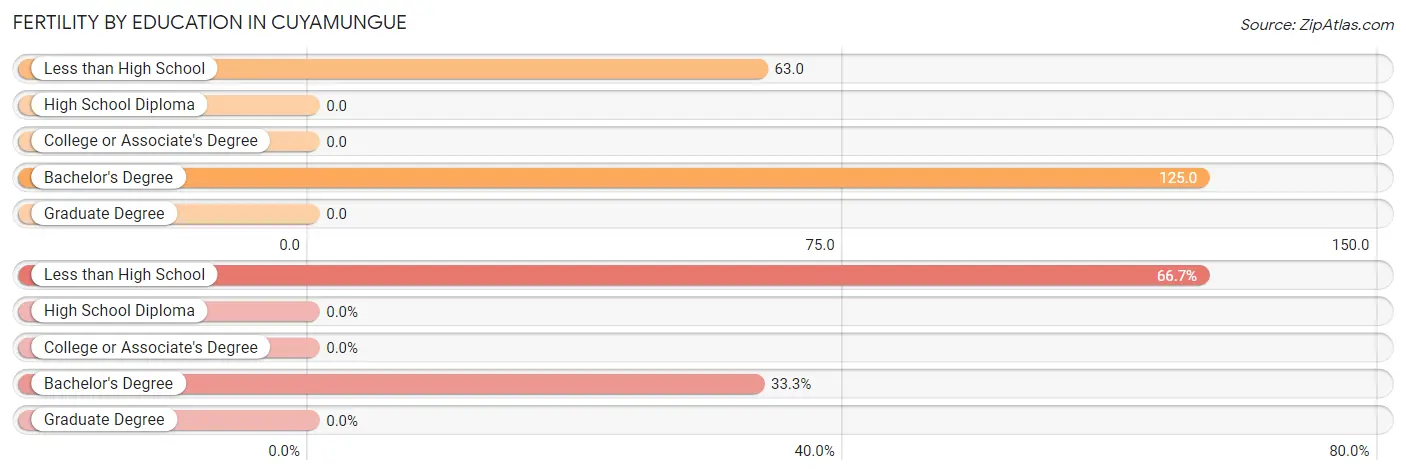
| Educational Attainment | Women with Births | Births / 1,000 Women |
| Less than High School | 2 (66.7%) | 63.0 |
| High School Diploma | 0 (0.0%) | 0.0 |
| College or Associate's Degree | 0 (0.0%) | 0.0 |
| Bachelor's Degree | 1 (33.3%) | 125.0 |
| Graduate Degree | 0 (0.0%) | 0.0 |
| Total | 3 (100.0%) | 26.0 |
Fertility by Education by Marriage Status in Cuyamungue
66.7% of women with births in Cuyamungue are unmarried. Women with the educational attainment of bachelor's degree are most likely to be married with 100.0% of them married at childbirth, while women with the educational attainment of less than high school are least likely to be married with 100.0% of them unmarried at childbirth.
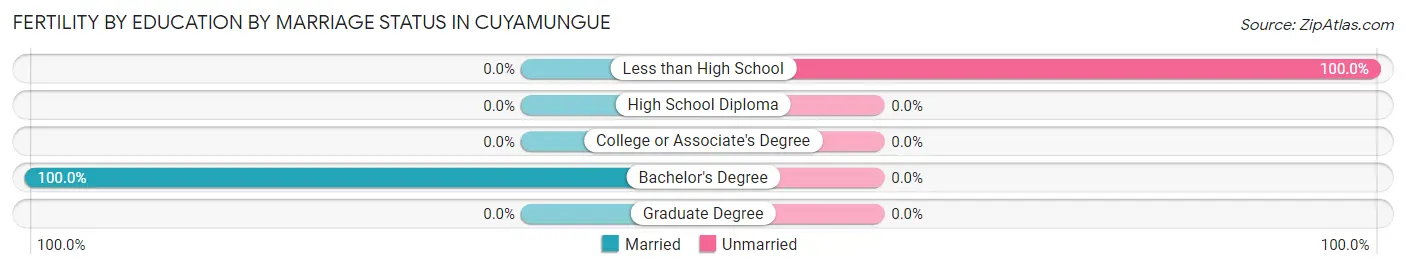
| Educational Attainment | Married | Unmarried |
| Less than High School | 0 (0.0%) | 2 (100.0%) |
| High School Diploma | 0 (0.0%) | 0 (0.0%) |
| College or Associate's Degree | 0 (0.0%) | 0 (0.0%) |
| Bachelor's Degree | 1 (100.0%) | 0 (0.0%) |
| Graduate Degree | 0 (0.0%) | 0 (0.0%) |
| Total | 1 (33.3%) | 2 (66.7%) |
Employment Characteristics in Cuyamungue
Employment by Class of Employer in Cuyamungue
Among the 208 employed individuals in Cuyamungue, private company employees (104 | 50.0%), state government employees (33 | 15.9%), and federal government employees (20 | 9.6%) make up the most common classes of employment.
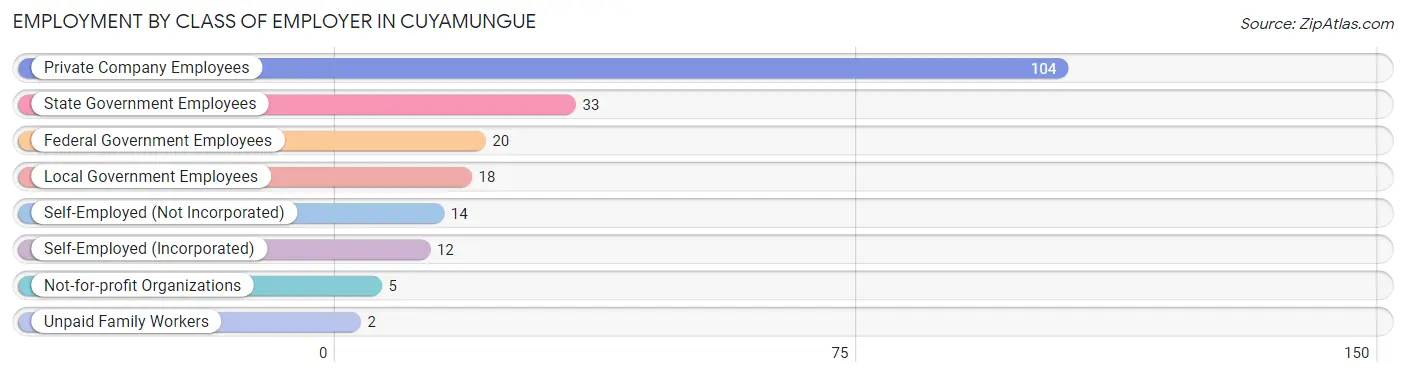
| Employer Class | # Employees | % Employees |
| Private Company Employees | 104 | 50.0% |
| Self-Employed (Incorporated) | 12 | 5.8% |
| Self-Employed (Not Incorporated) | 14 | 6.7% |
| Not-for-profit Organizations | 5 | 2.4% |
| Local Government Employees | 18 | 8.6% |
| State Government Employees | 33 | 15.9% |
| Federal Government Employees | 20 | 9.6% |
| Unpaid Family Workers | 2 | 1.0% |
| Total | 208 | 100.0% |
Employment Status by Age in Cuyamungue
According to the labor force statistics for Cuyamungue, out of the total population over 16 years of age (415), 52.5% or 218 individuals are in the labor force, with 3.7% or 8 of them unemployed. The age group with the highest labor force participation rate is 35 to 44 years, with 88.4% or 61 individuals in the labor force. Within the labor force, the 25 to 29 years age range has the highest percentage of unemployed individuals, with 20.0% or 3 of them being unemployed.
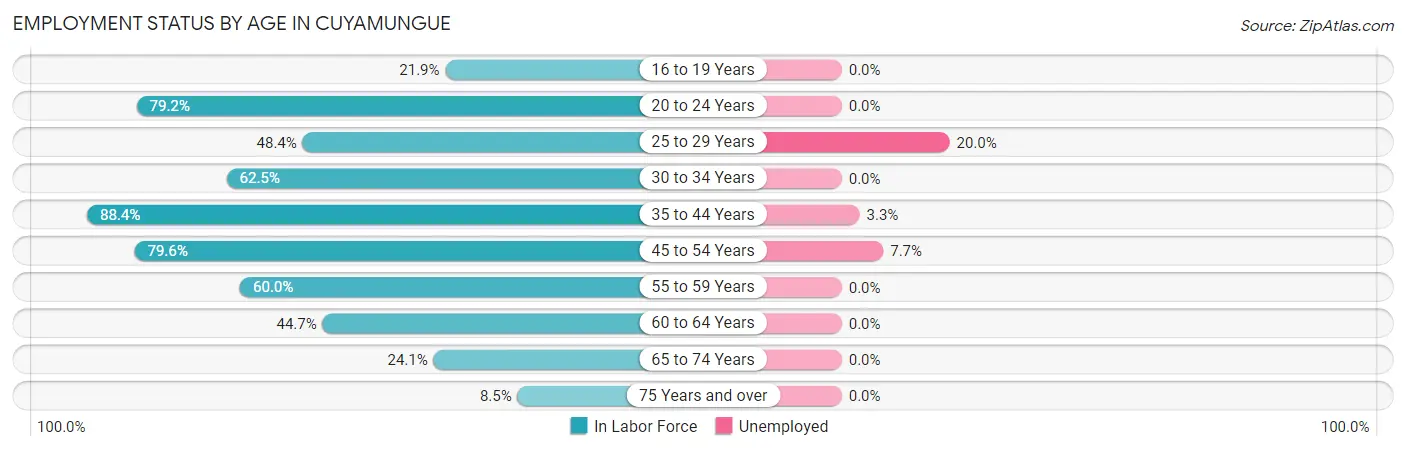
| Age Bracket | In Labor Force | Unemployed |
| 16 to 19 Years | 7 (21.9%) | 0 (0.0%) |
| 20 to 24 Years | 19 (79.2%) | 0 (0.0%) |
| 25 to 29 Years | 15 (48.4%) | 3 (20.0%) |
| 30 to 34 Years | 10 (62.5%) | 0 (0.0%) |
| 35 to 44 Years | 61 (88.4%) | 2 (3.3%) |
| 45 to 54 Years | 39 (79.6%) | 3 (7.7%) |
| 55 to 59 Years | 33 (60.0%) | 0 (0.0%) |
| 60 to 64 Years | 17 (44.7%) | 0 (0.0%) |
| 65 to 74 Years | 13 (24.1%) | 0 (0.0%) |
| 75 Years and over | 4 (8.5%) | 0 (0.0%) |
| Total | 218 (52.5%) | 8 (3.7%) |
Employment Status by Educational Attainment in Cuyamungue
According to labor force statistics for Cuyamungue, 67.8% of individuals (175) out of the total population between 25 and 64 years of age (258) are in the labor force, with 4.6% or 8 of them being unemployed. The group with the highest labor force participation rate are those with the educational attainment of bachelor's degree or higher, with 87.2% or 34 individuals in the labor force. Within the labor force, individuals with high school diploma education have the highest percentage of unemployment, with 8.1% or 3 of them being unemployed.
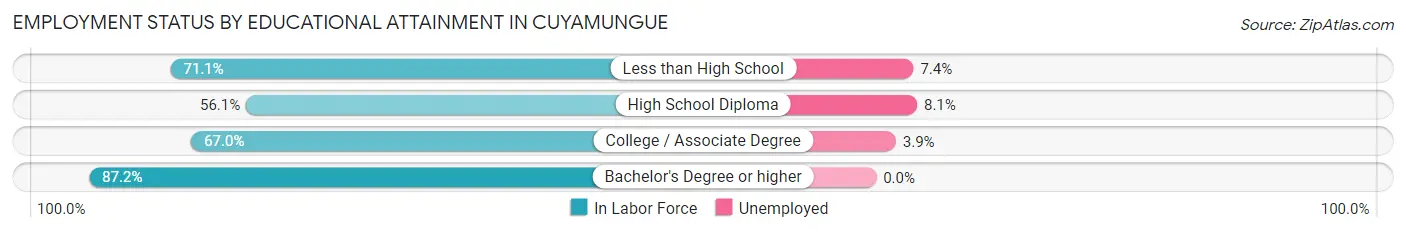
| Educational Attainment | In Labor Force | Unemployed |
| Less than High School | 27 (71.1%) | 3 (7.4%) |
| High School Diploma | 37 (56.1%) | 5 (8.1%) |
| College / Associate Degree | 77 (67.0%) | 4 (3.9%) |
| Bachelor's Degree or higher | 34 (87.2%) | 0 (0.0%) |
| Total | 175 (67.8%) | 12 (4.6%) |
Employment Occupations by Sex in Cuyamungue
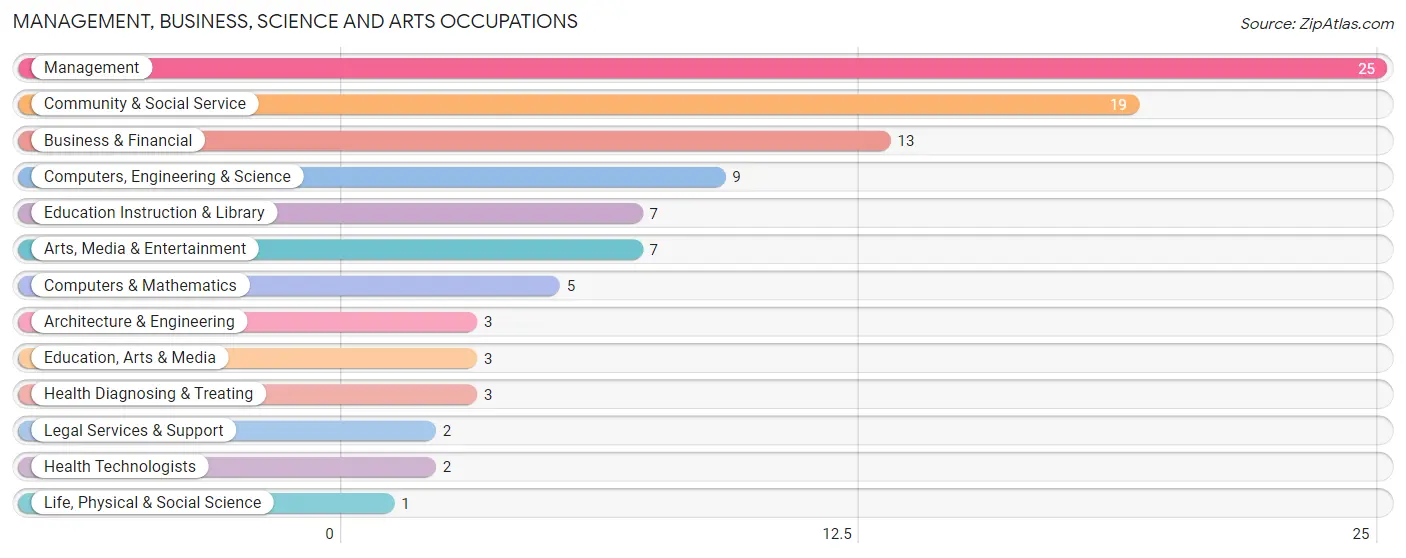
Management, Business, Science and Arts Occupations
The most common Management, Business, Science and Arts occupations in Cuyamungue are Management (25 | 11.9%), Community & Social Service (19 | 9.0%), Business & Financial (13 | 6.2%), Computers, Engineering & Science (9 | 4.3%), and Education Instruction & Library (7 | 3.3%).
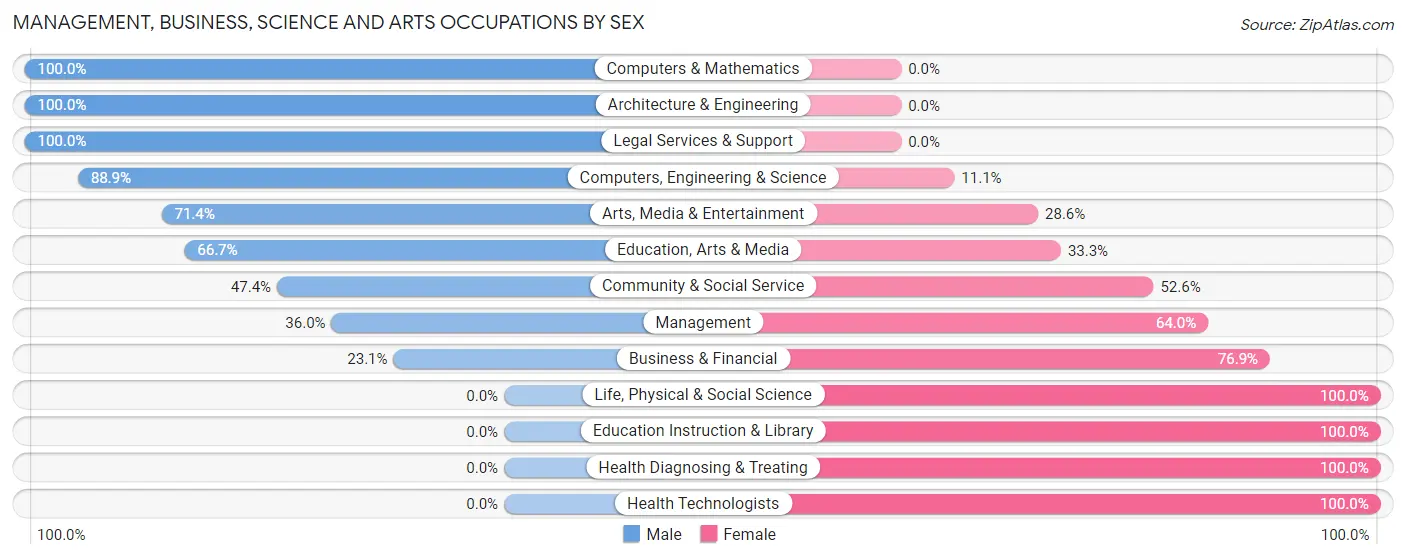
Management, Business, Science and Arts Occupations by Sex
Within the Management, Business, Science and Arts occupations in Cuyamungue, the most male-oriented occupations are Computers & Mathematics (100.0%), Architecture & Engineering (100.0%), and Legal Services & Support (100.0%), while the most female-oriented occupations are Life, Physical & Social Science (100.0%), Education Instruction & Library (100.0%), and Health Diagnosing & Treating (100.0%).
| Occupation | Male | Female |
| Management | 9 (36.0%) | 16 (64.0%) |
| Business & Financial | 3 (23.1%) | 10 (76.9%) |
| Computers, Engineering & Science | 8 (88.9%) | 1 (11.1%) |
| Computers & Mathematics | 5 (100.0%) | 0 (0.0%) |
| Architecture & Engineering | 3 (100.0%) | 0 (0.0%) |
| Life, Physical & Social Science | 0 (0.0%) | 1 (100.0%) |
| Community & Social Service | 9 (47.4%) | 10 (52.6%) |
| Education, Arts & Media | 2 (66.7%) | 1 (33.3%) |
| Legal Services & Support | 2 (100.0%) | 0 (0.0%) |
| Education Instruction & Library | 0 (0.0%) | 7 (100.0%) |
| Arts, Media & Entertainment | 5 (71.4%) | 2 (28.6%) |
| Health Diagnosing & Treating | 0 (0.0%) | 3 (100.0%) |
| Health Technologists | 0 (0.0%) | 2 (100.0%) |
| Total (Category) | 29 (42.0%) | 40 (58.0%) |
| Total (Overall) | 102 (48.6%) | 108 (51.4%) |
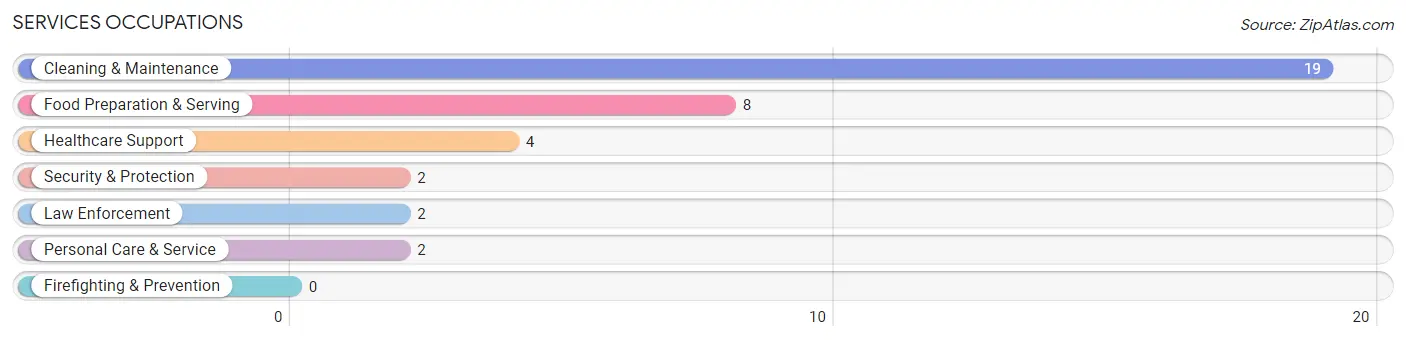
Services Occupations
The most common Services occupations in Cuyamungue are Cleaning & Maintenance (19 | 9.0%), Food Preparation & Serving (8 | 3.8%), Healthcare Support (4 | 1.9%), Security & Protection (2 | 0.9%), and Law Enforcement (2 | 0.9%).
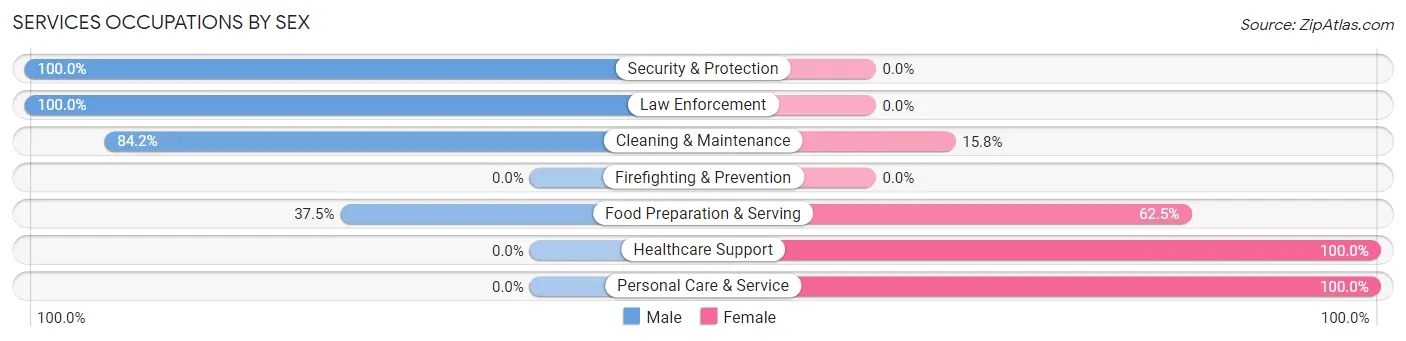
Services Occupations by Sex
Within the Services occupations in Cuyamungue, the most male-oriented occupations are Security & Protection (100.0%), Law Enforcement (100.0%), and Cleaning & Maintenance (84.2%), while the most female-oriented occupations are Healthcare Support (100.0%), Personal Care & Service (100.0%), and Food Preparation & Serving (62.5%).
| Occupation | Male | Female |
| Healthcare Support | 0 (0.0%) | 4 (100.0%) |
| Security & Protection | 2 (100.0%) | 0 (0.0%) |
| Firefighting & Prevention | 0 (0.0%) | 0 (0.0%) |
| Law Enforcement | 2 (100.0%) | 0 (0.0%) |
| Food Preparation & Serving | 3 (37.5%) | 5 (62.5%) |
| Cleaning & Maintenance | 16 (84.2%) | 3 (15.8%) |
| Personal Care & Service | 0 (0.0%) | 2 (100.0%) |
| Total (Category) | 21 (60.0%) | 14 (40.0%) |
| Total (Overall) | 102 (48.6%) | 108 (51.4%) |
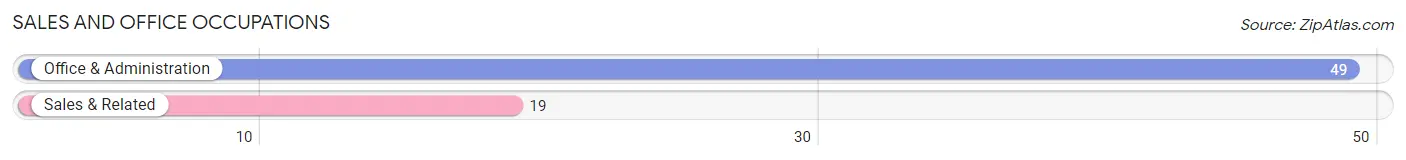
Sales and Office Occupations
The most common Sales and Office occupations in Cuyamungue are Office & Administration (49 | 23.3%), and Sales & Related (19 | 9.0%).
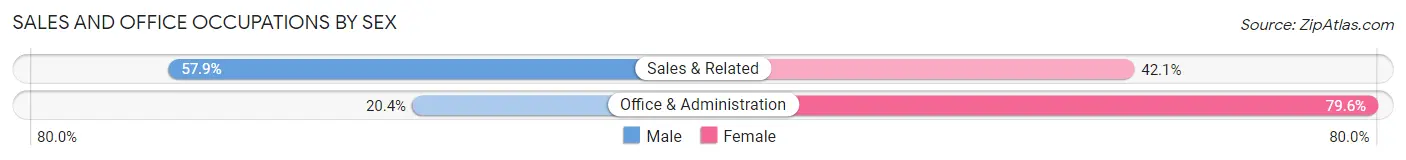
Sales and Office Occupations by Sex
| Occupation | Male | Female |
| Sales & Related | 11 (57.9%) | 8 (42.1%) |
| Office & Administration | 10 (20.4%) | 39 (79.6%) |
| Total (Category) | 21 (30.9%) | 47 (69.1%) |
| Total (Overall) | 102 (48.6%) | 108 (51.4%) |
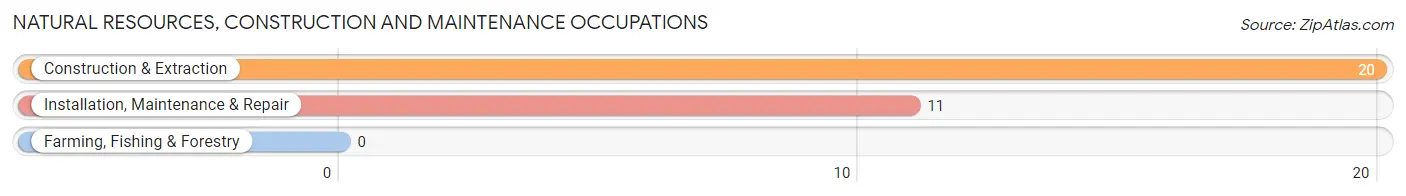
Natural Resources, Construction and Maintenance Occupations
The most common Natural Resources, Construction and Maintenance occupations in Cuyamungue are Construction & Extraction (20 | 9.5%), and Installation, Maintenance & Repair (11 | 5.2%).
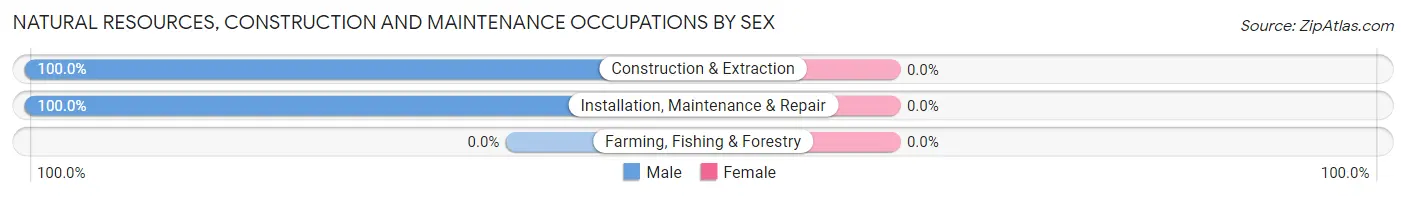
Natural Resources, Construction and Maintenance Occupations by Sex
| Occupation | Male | Female |
| Farming, Fishing & Forestry | 0 (0.0%) | 0 (0.0%) |
| Construction & Extraction | 20 (100.0%) | 0 (0.0%) |
| Installation, Maintenance & Repair | 11 (100.0%) | 0 (0.0%) |
| Total (Category) | 31 (100.0%) | 0 (0.0%) |
| Total (Overall) | 102 (48.6%) | 108 (51.4%) |
Production, Transportation and Moving Occupations
The most common Production, Transportation and Moving occupations in Cuyamungue are , and Material Moving (7 | 3.3%).
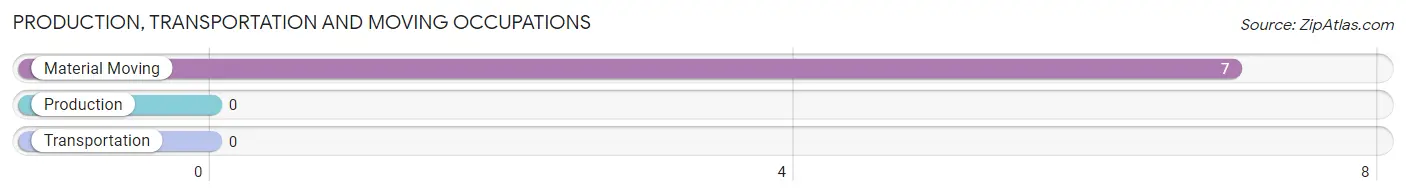
Production, Transportation and Moving Occupations by Sex
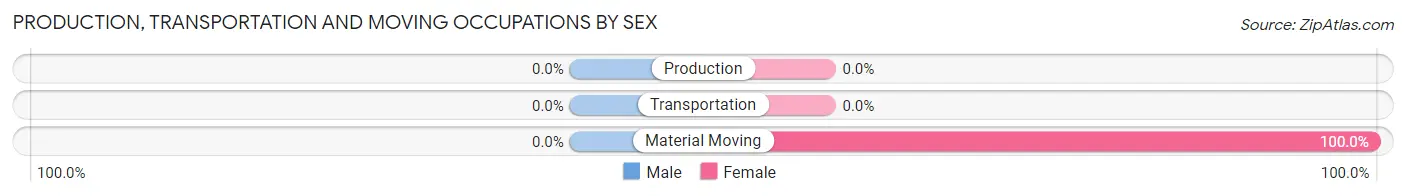
| Occupation | Male | Female |
| Production | 0 (0.0%) | 0 (0.0%) |
| Transportation | 0 (0.0%) | 0 (0.0%) |
| Material Moving | 0 (0.0%) | 7 (100.0%) |
| Total (Category) | 0 (0.0%) | 7 (100.0%) |
| Total (Overall) | 102 (48.6%) | 108 (51.4%) |
Employment Industries by Sex in Cuyamungue
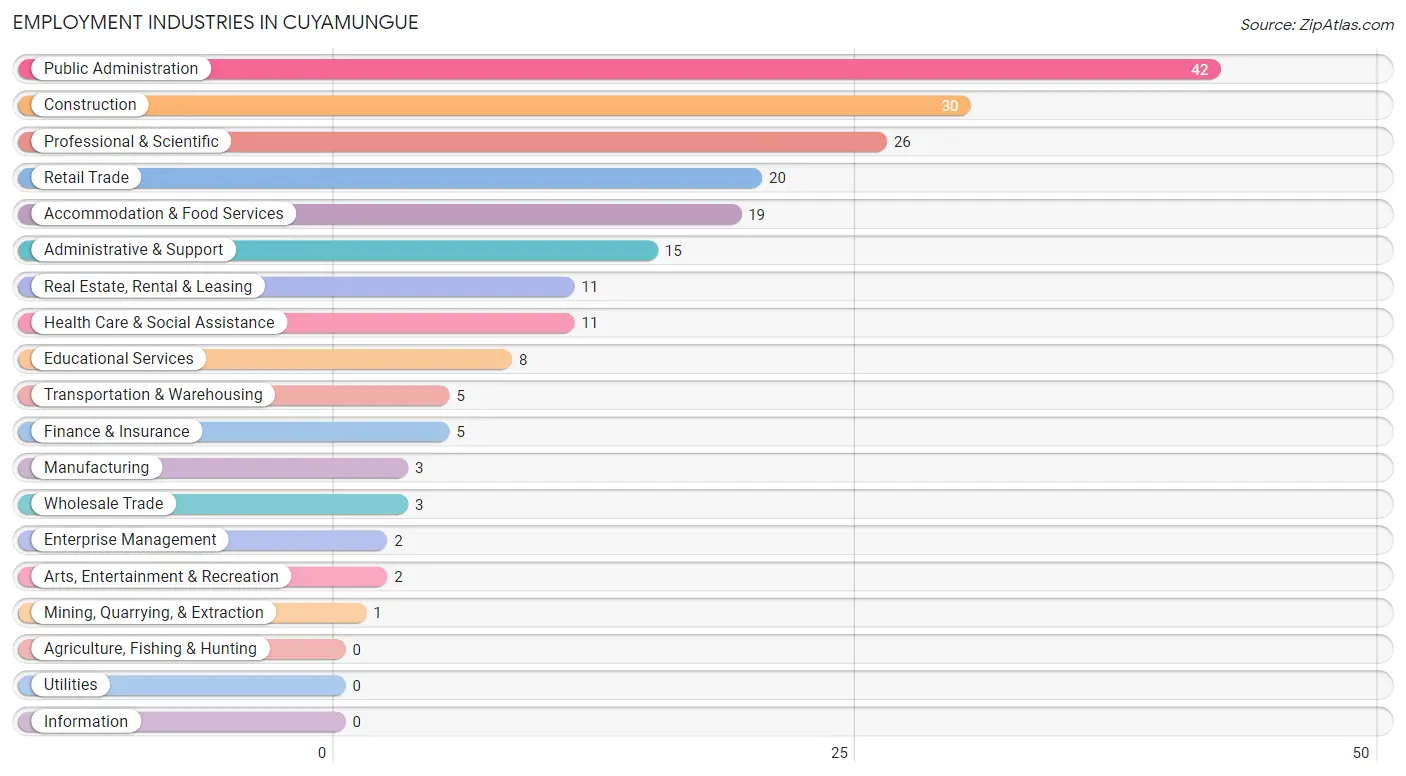
Employment Industries in Cuyamungue
The major employment industries in Cuyamungue include Public Administration (42 | 20.0%), Construction (30 | 14.3%), Professional & Scientific (26 | 12.4%), Retail Trade (20 | 9.5%), and Accommodation & Food Services (19 | 9.0%).
Employment Industries by Sex in Cuyamungue
The Cuyamungue industries that see more men than women are Mining, Quarrying, & Extraction (100.0%), Wholesale Trade (100.0%), and Transportation & Warehousing (100.0%), whereas the industries that tend to have a higher number of women are Manufacturing (100.0%), Finance & Insurance (100.0%), and Enterprise Management (100.0%).
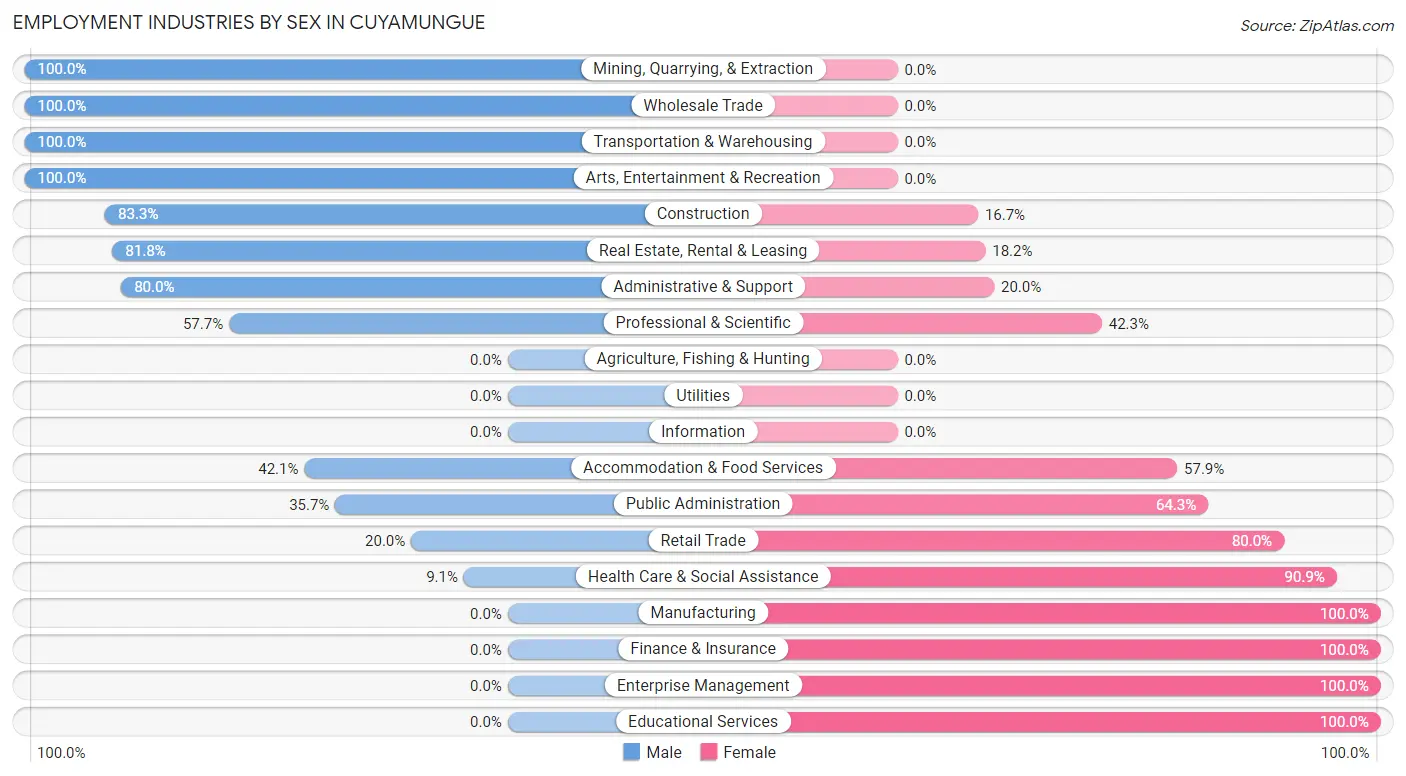
| Industry | Male | Female |
| Agriculture, Fishing & Hunting | 0 (0.0%) | 0 (0.0%) |
| Mining, Quarrying, & Extraction | 1 (100.0%) | 0 (0.0%) |
| Construction | 25 (83.3%) | 5 (16.7%) |
| Manufacturing | 0 (0.0%) | 3 (100.0%) |
| Wholesale Trade | 3 (100.0%) | 0 (0.0%) |
| Retail Trade | 4 (20.0%) | 16 (80.0%) |
| Transportation & Warehousing | 5 (100.0%) | 0 (0.0%) |
| Utilities | 0 (0.0%) | 0 (0.0%) |
| Information | 0 (0.0%) | 0 (0.0%) |
| Finance & Insurance | 0 (0.0%) | 5 (100.0%) |
| Real Estate, Rental & Leasing | 9 (81.8%) | 2 (18.2%) |
| Professional & Scientific | 15 (57.7%) | 11 (42.3%) |
| Enterprise Management | 0 (0.0%) | 2 (100.0%) |
| Administrative & Support | 12 (80.0%) | 3 (20.0%) |
| Educational Services | 0 (0.0%) | 8 (100.0%) |
| Health Care & Social Assistance | 1 (9.1%) | 10 (90.9%) |
| Arts, Entertainment & Recreation | 2 (100.0%) | 0 (0.0%) |
| Accommodation & Food Services | 8 (42.1%) | 11 (57.9%) |
| Public Administration | 15 (35.7%) | 27 (64.3%) |
| Total | 102 (48.6%) | 108 (51.4%) |
Education in Cuyamungue
School Enrollment in Cuyamungue
The most common levels of schooling among the 116 students in Cuyamungue are high school (34 | 29.3%), elementary school (28 | 24.1%), and middle school (28 | 24.1%).
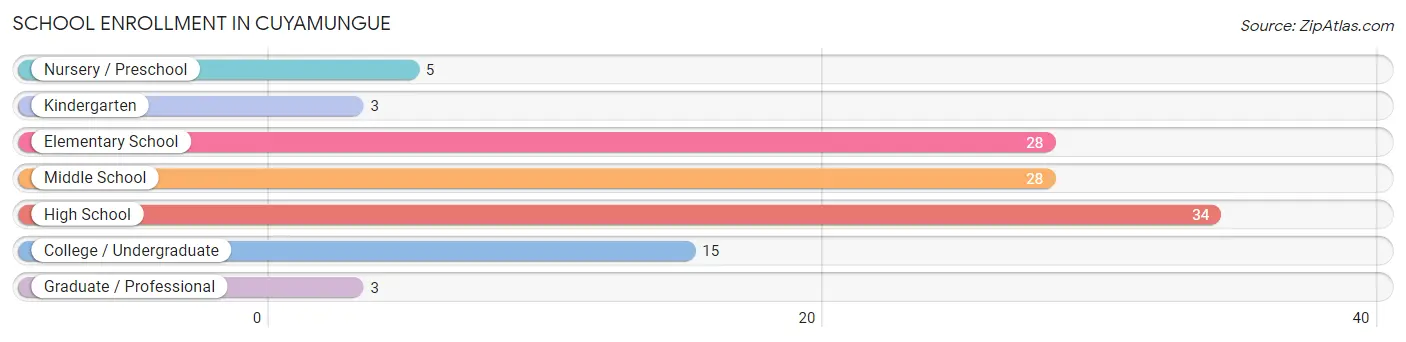
| School Level | # Students | % Students |
| Nursery / Preschool | 5 | 4.3% |
| Kindergarten | 3 | 2.6% |
| Elementary School | 28 | 24.1% |
| Middle School | 28 | 24.1% |
| High School | 34 | 29.3% |
| College / Undergraduate | 15 | 12.9% |
| Graduate / Professional | 3 | 2.6% |
| Total | 116 | 100.0% |
School Enrollment by Age by Funding Source in Cuyamungue
Out of a total of 116 students who are enrolled in schools in Cuyamungue, 11 (9.5%) attend a private institution, while the remaining 105 (90.5%) are enrolled in public schools. The age group of 10 to 14 year olds has the highest likelihood of being enrolled in private schools, with 5 (15.1% in the age bracket) enrolled. Conversely, the age group of 3 to 4 year olds has the lowest likelihood of being enrolled in a private school, with 2 (100.0% in the age bracket) attending a public institution.
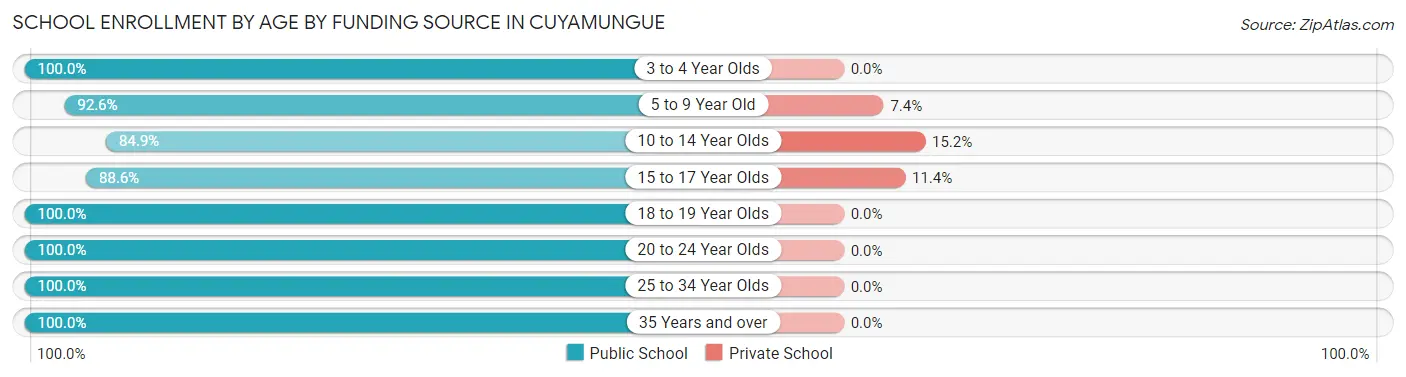
| Age Bracket | Public School | Private School |
| 3 to 4 Year Olds | 2 (100.0%) | 0 (0.0%) |
| 5 to 9 Year Old | 25 (92.6%) | 2 (7.4%) |
| 10 to 14 Year Olds | 28 (84.9%) | 5 (15.1%) |
| 15 to 17 Year Olds | 31 (88.6%) | 4 (11.4%) |
| 18 to 19 Year Olds | 8 (100.0%) | 0 (0.0%) |
| 20 to 24 Year Olds | 3 (100.0%) | 0 (0.0%) |
| 25 to 34 Year Olds | 2 (100.0%) | 0 (0.0%) |
| 35 Years and over | 6 (100.0%) | 0 (0.0%) |
| Total | 105 (90.5%) | 11 (9.5%) |
Educational Attainment by Field of Study in Cuyamungue
Business (12 | 16.9%), bio, nature & agricultural (11 | 15.5%), science & technology (8 | 11.3%), education (8 | 11.3%), and literature & languages (8 | 11.3%) are the most common fields of study among 71 individuals in Cuyamungue who have obtained a bachelor's degree or higher.
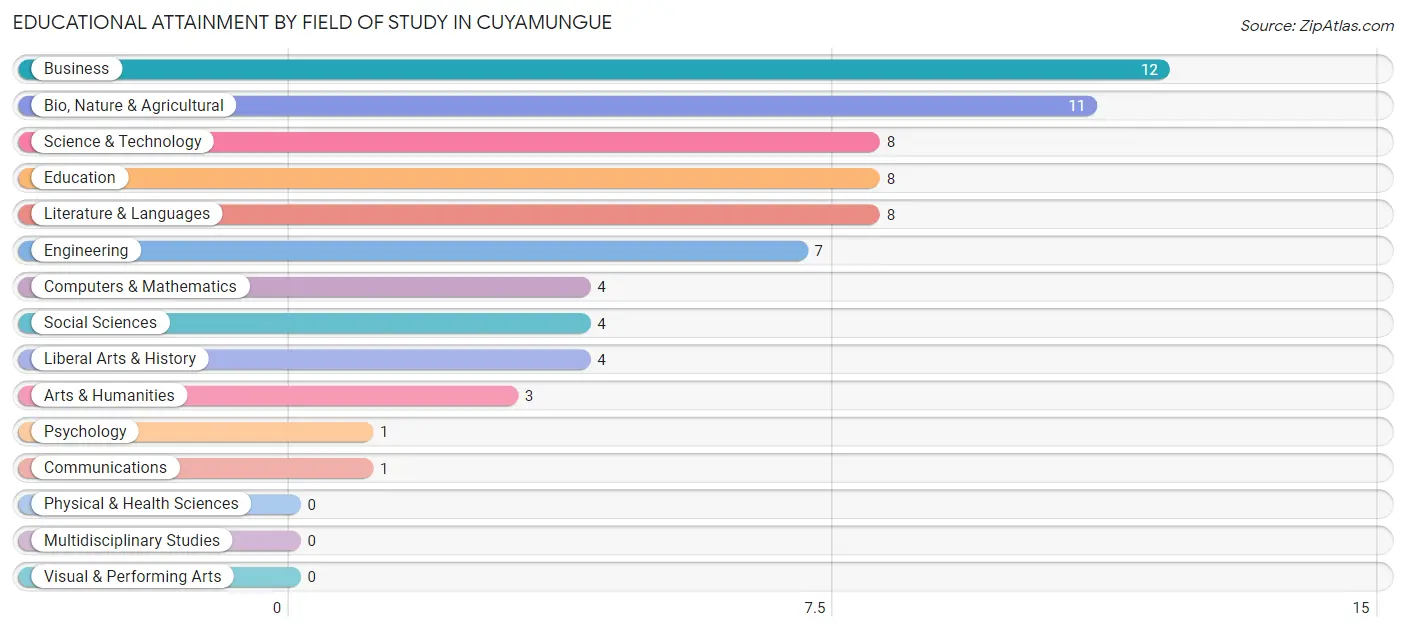
| Field of Study | # Graduates | % Graduates |
| Computers & Mathematics | 4 | 5.6% |
| Bio, Nature & Agricultural | 11 | 15.5% |
| Physical & Health Sciences | 0 | 0.0% |
| Psychology | 1 | 1.4% |
| Social Sciences | 4 | 5.6% |
| Engineering | 7 | 9.9% |
| Multidisciplinary Studies | 0 | 0.0% |
| Science & Technology | 8 | 11.3% |
| Business | 12 | 16.9% |
| Education | 8 | 11.3% |
| Literature & Languages | 8 | 11.3% |
| Liberal Arts & History | 4 | 5.6% |
| Visual & Performing Arts | 0 | 0.0% |
| Communications | 1 | 1.4% |
| Arts & Humanities | 3 | 4.2% |
| Total | 71 | 100.0% |
Transportation & Commute in Cuyamungue
Vehicle Availability by Sex in Cuyamungue
The most prevalent vehicle ownership categories in Cuyamungue are males with 3 vehicles (32, accounting for 31.4%) and females with 3 vehicles (45, making up 30.2%).
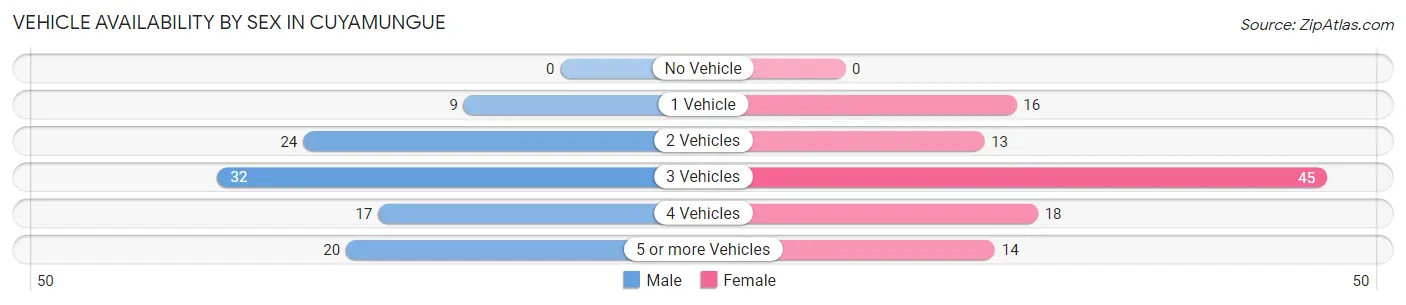
| Vehicles Available | Male | Female |
| No Vehicle | 0 (0.0%) | 0 (0.0%) |
| 1 Vehicle | 9 (8.8%) | 16 (15.1%) |
| 2 Vehicles | 24 (23.5%) | 13 (12.3%) |
| 3 Vehicles | 32 (31.4%) | 45 (42.4%) |
| 4 Vehicles | 17 (16.7%) | 18 (17.0%) |
| 5 or more Vehicles | 20 (19.6%) | 14 (13.2%) |
| Total | 102 (100.0%) | 106 (100.0%) |
Commute Time in Cuyamungue
The most frequently occuring commute durations in Cuyamungue are 30 to 34 minutes (56 commuters, 29.9%), 15 to 19 minutes (35 commuters, 18.7%), and 25 to 29 minutes (34 commuters, 18.2%).
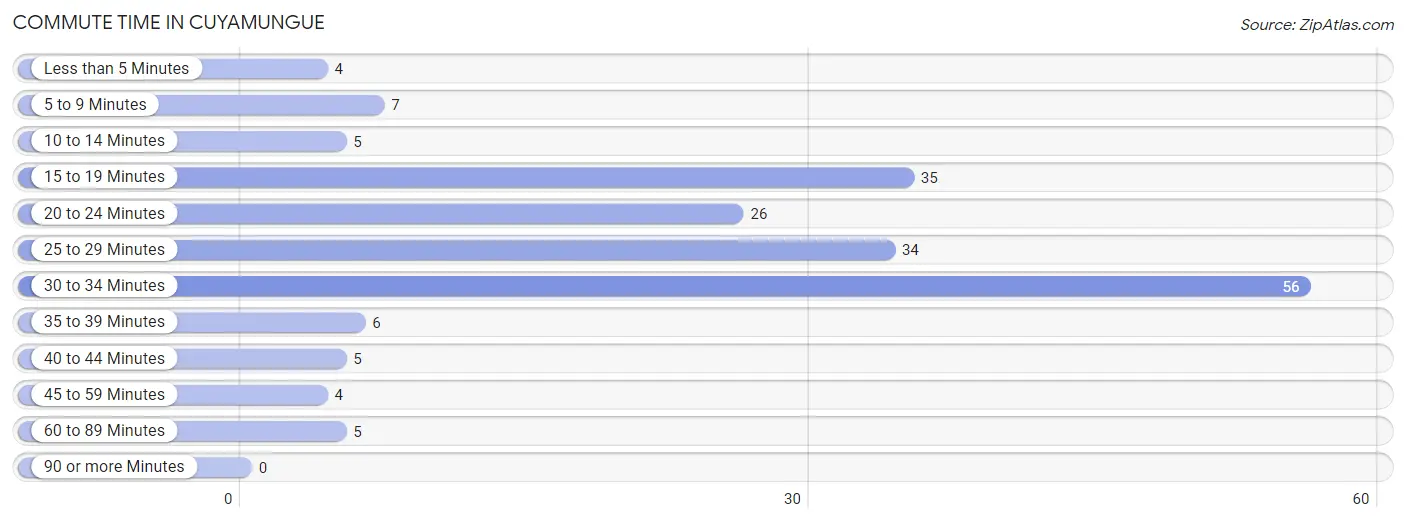
| Commute Time | # Commuters | % Commuters |
| Less than 5 Minutes | 4 | 2.1% |
| 5 to 9 Minutes | 7 | 3.7% |
| 10 to 14 Minutes | 5 | 2.7% |
| 15 to 19 Minutes | 35 | 18.7% |
| 20 to 24 Minutes | 26 | 13.9% |
| 25 to 29 Minutes | 34 | 18.2% |
| 30 to 34 Minutes | 56 | 29.9% |
| 35 to 39 Minutes | 6 | 3.2% |
| 40 to 44 Minutes | 5 | 2.7% |
| 45 to 59 Minutes | 4 | 2.1% |
| 60 to 89 Minutes | 5 | 2.7% |
| 90 or more Minutes | 0 | 0.0% |
Commute Time by Sex in Cuyamungue
The most common commute times in Cuyamungue are 30 to 34 minutes (33 commuters, 35.1%) for males and 15 to 19 minutes (23 commuters, 24.7%) for females.
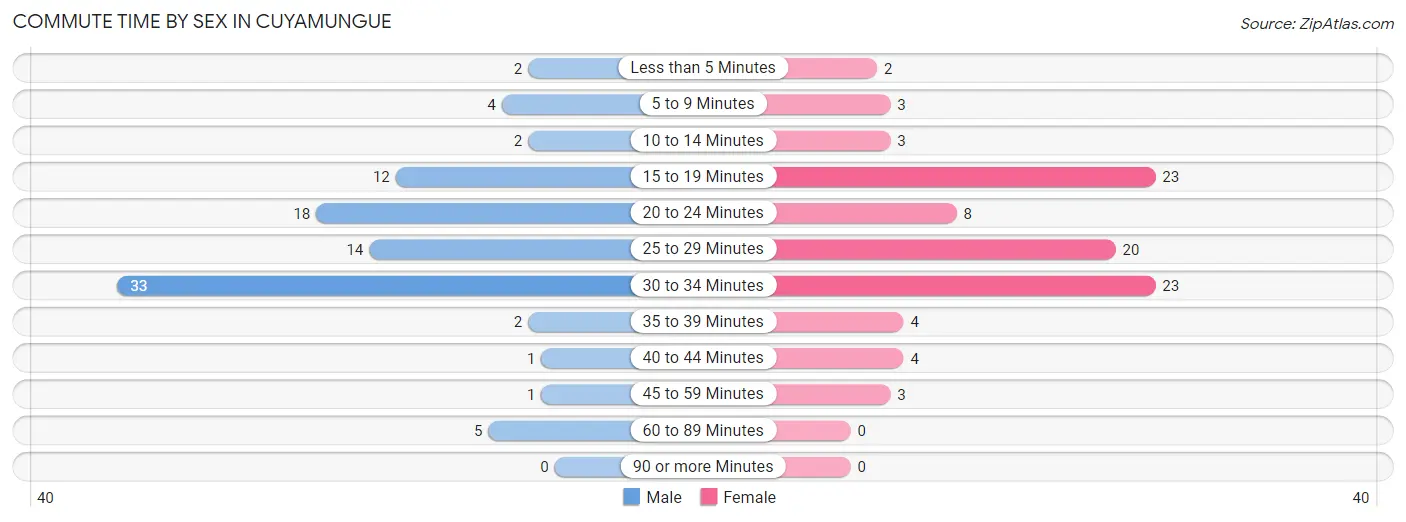
| Commute Time | Male | Female |
| Less than 5 Minutes | 2 (2.1%) | 2 (2.1%) |
| 5 to 9 Minutes | 4 (4.3%) | 3 (3.2%) |
| 10 to 14 Minutes | 2 (2.1%) | 3 (3.2%) |
| 15 to 19 Minutes | 12 (12.8%) | 23 (24.7%) |
| 20 to 24 Minutes | 18 (19.2%) | 8 (8.6%) |
| 25 to 29 Minutes | 14 (14.9%) | 20 (21.5%) |
| 30 to 34 Minutes | 33 (35.1%) | 23 (24.7%) |
| 35 to 39 Minutes | 2 (2.1%) | 4 (4.3%) |
| 40 to 44 Minutes | 1 (1.1%) | 4 (4.3%) |
| 45 to 59 Minutes | 1 (1.1%) | 3 (3.2%) |
| 60 to 89 Minutes | 5 (5.3%) | 0 (0.0%) |
| 90 or more Minutes | 0 (0.0%) | 0 (0.0%) |
Time of Departure to Work by Sex in Cuyamungue
The most frequent times of departure to work in Cuyamungue are 7:30 AM to 7:59 AM (20, 21.3%) for males and 7:00 AM to 7:29 AM (24, 25.8%) for females.
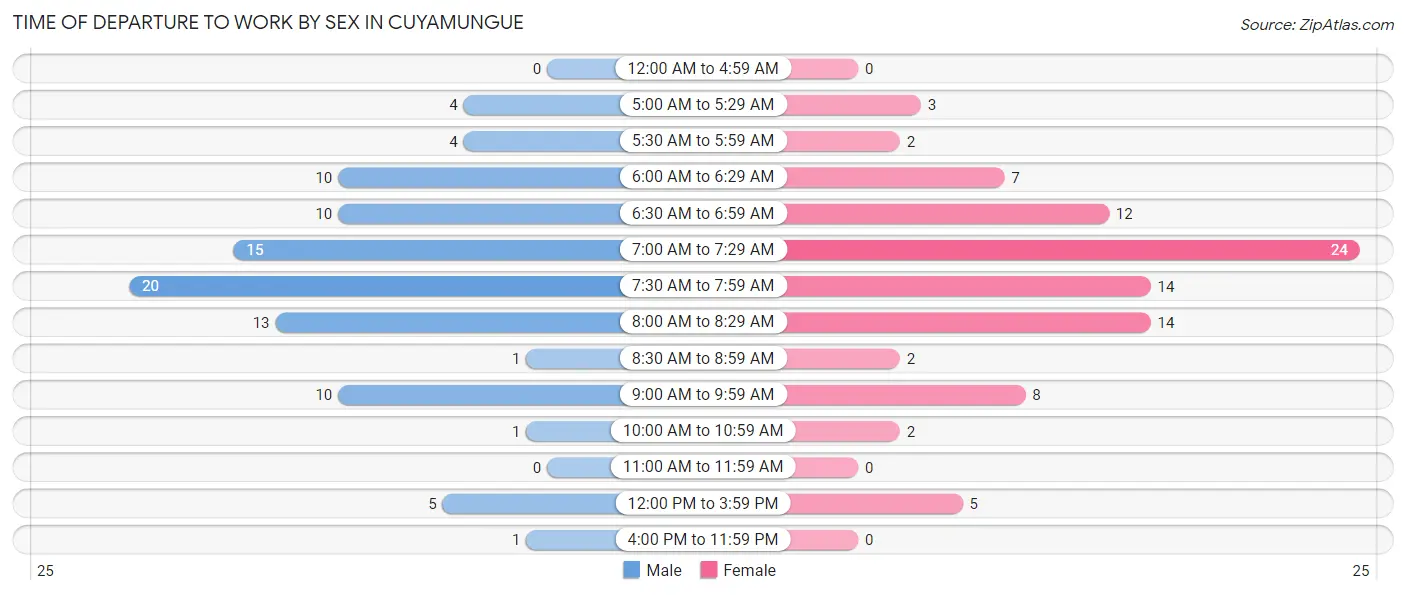
| Time of Departure | Male | Female |
| 12:00 AM to 4:59 AM | 0 (0.0%) | 0 (0.0%) |
| 5:00 AM to 5:29 AM | 4 (4.3%) | 3 (3.2%) |
| 5:30 AM to 5:59 AM | 4 (4.3%) | 2 (2.1%) |
| 6:00 AM to 6:29 AM | 10 (10.6%) | 7 (7.5%) |
| 6:30 AM to 6:59 AM | 10 (10.6%) | 12 (12.9%) |
| 7:00 AM to 7:29 AM | 15 (16.0%) | 24 (25.8%) |
| 7:30 AM to 7:59 AM | 20 (21.3%) | 14 (15.0%) |
| 8:00 AM to 8:29 AM | 13 (13.8%) | 14 (15.0%) |
| 8:30 AM to 8:59 AM | 1 (1.1%) | 2 (2.1%) |
| 9:00 AM to 9:59 AM | 10 (10.6%) | 8 (8.6%) |
| 10:00 AM to 10:59 AM | 1 (1.1%) | 2 (2.1%) |
| 11:00 AM to 11:59 AM | 0 (0.0%) | 0 (0.0%) |
| 12:00 PM to 3:59 PM | 5 (5.3%) | 5 (5.4%) |
| 4:00 PM to 11:59 PM | 1 (1.1%) | 0 (0.0%) |
| Total | 94 (100.0%) | 93 (100.0%) |
Housing Occupancy in Cuyamungue
Occupancy by Ownership in Cuyamungue
Of the total 190 dwellings in Cuyamungue, owner-occupied units account for 152 (80.0%), while renter-occupied units make up 38 (20.0%).
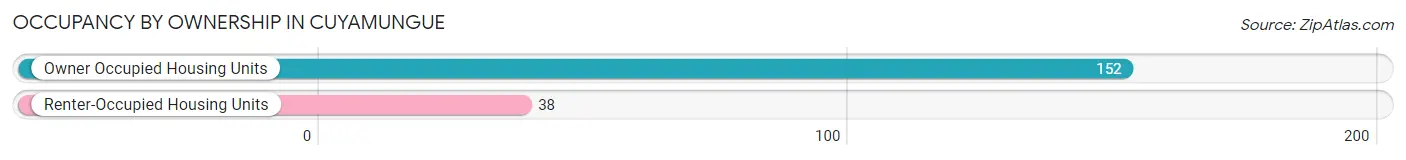
| Occupancy | # Housing Units | % Housing Units |
| Owner Occupied Housing Units | 152 | 80.0% |
| Renter-Occupied Housing Units | 38 | 20.0% |
| Total Occupied Housing Units | 190 | 100.0% |
Occupancy by Household Size in Cuyamungue
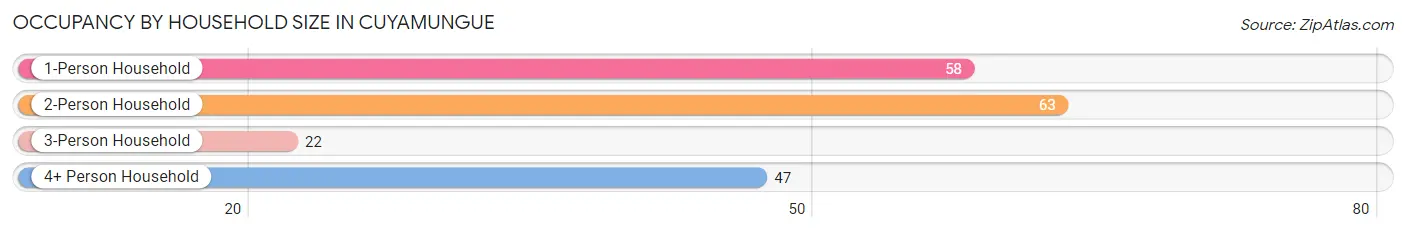
| Household Size | # Housing Units | % Housing Units |
| 1-Person Household | 58 | 30.5% |
| 2-Person Household | 63 | 33.2% |
| 3-Person Household | 22 | 11.6% |
| 4+ Person Household | 47 | 24.7% |
| Total Housing Units | 190 | 100.0% |
Occupancy by Ownership by Household Size in Cuyamungue
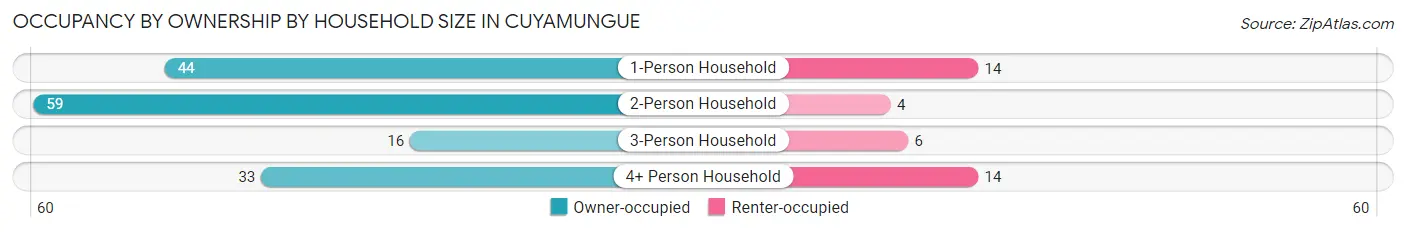
| Household Size | Owner-occupied | Renter-occupied |
| 1-Person Household | 44 (75.9%) | 14 (24.1%) |
| 2-Person Household | 59 (93.6%) | 4 (6.4%) |
| 3-Person Household | 16 (72.7%) | 6 (27.3%) |
| 4+ Person Household | 33 (70.2%) | 14 (29.8%) |
| Total Housing Units | 152 (80.0%) | 38 (20.0%) |
Occupancy by Educational Attainment in Cuyamungue
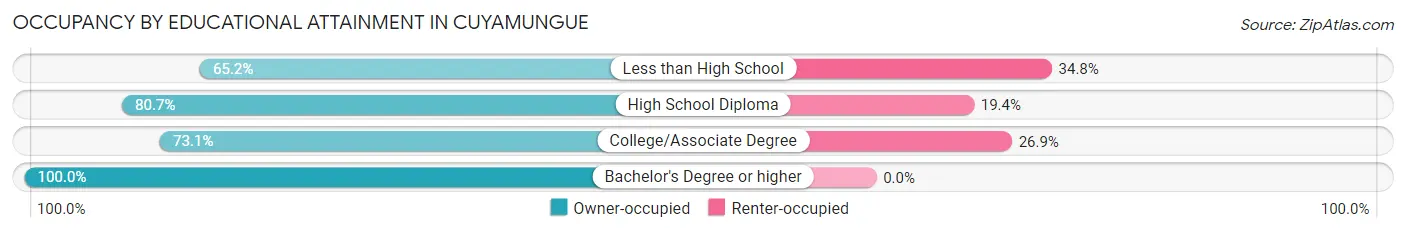
| Household Size | Owner-occupied | Renter-occupied |
| Less than High School | 15 (65.2%) | 8 (34.8%) |
| High School Diploma | 50 (80.6%) | 12 (19.4%) |
| College/Associate Degree | 49 (73.1%) | 18 (26.9%) |
| Bachelor's Degree or higher | 38 (100.0%) | 0 (0.0%) |
Occupancy by Age of Householder in Cuyamungue
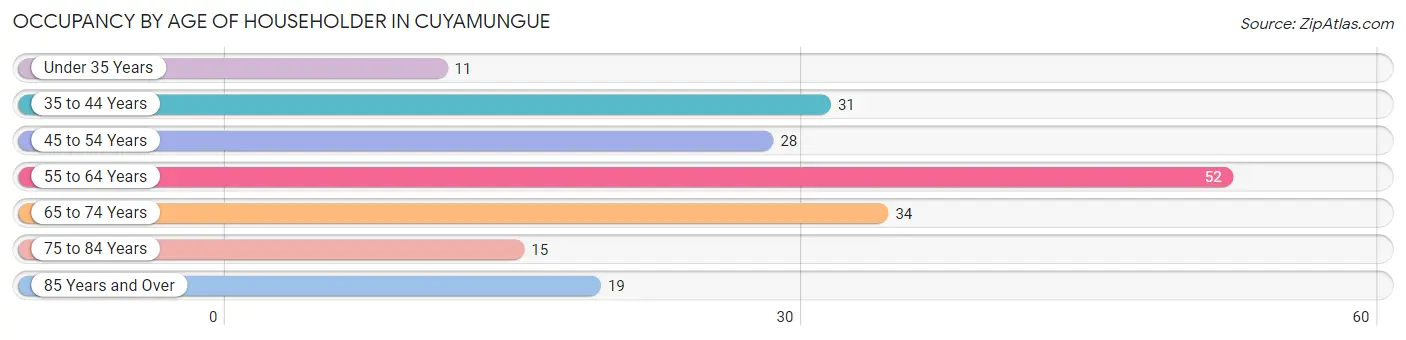
| Age Bracket | # Households | % Households |
| Under 35 Years | 11 | 5.8% |
| 35 to 44 Years | 31 | 16.3% |
| 45 to 54 Years | 28 | 14.7% |
| 55 to 64 Years | 52 | 27.4% |
| 65 to 74 Years | 34 | 17.9% |
| 75 to 84 Years | 15 | 7.9% |
| 85 Years and Over | 19 | 10.0% |
| Total | 190 | 100.0% |
Housing Finances in Cuyamungue
Median Income by Occupancy in Cuyamungue
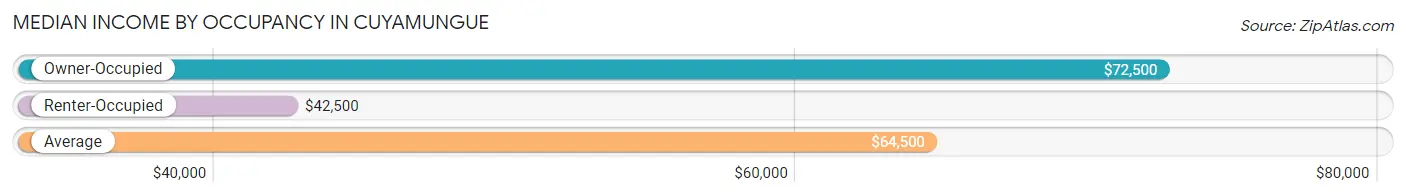
| Occupancy Type | # Households | Median Income |
| Owner-Occupied | 152 (80.0%) | $72,500 |
| Renter-Occupied | 38 (20.0%) | $42,500 |
| Average | 190 (100.0%) | $64,500 |
Occupancy by Householder Income Bracket in Cuyamungue
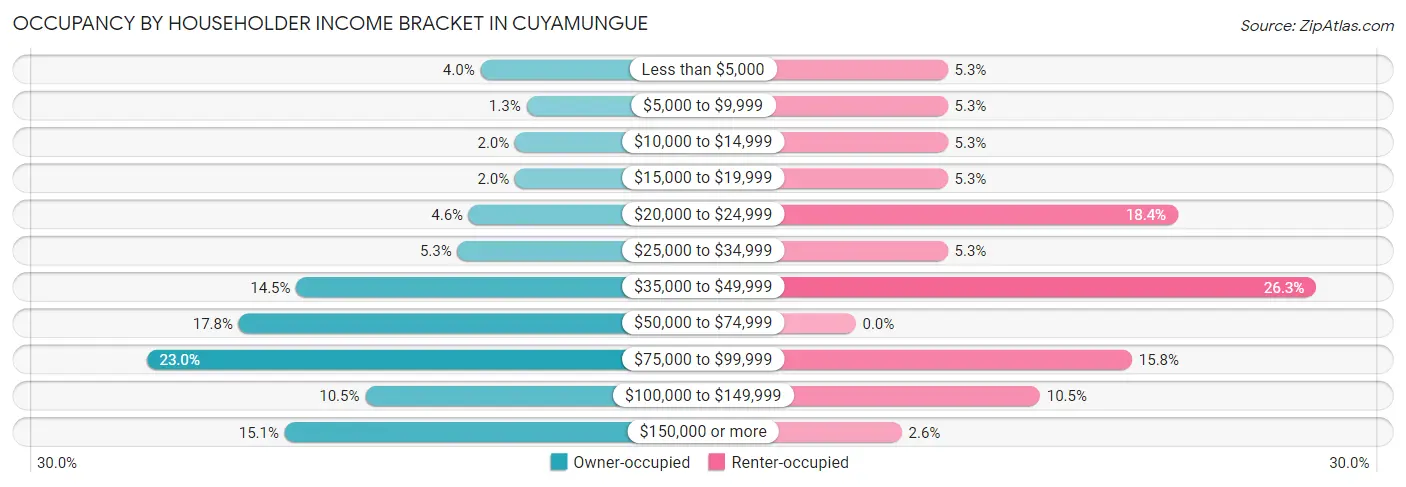
| Income Bracket | Owner-occupied | Renter-occupied |
| Less than $5,000 | 6 (4.0%) | 2 (5.3%) |
| $5,000 to $9,999 | 2 (1.3%) | 2 (5.3%) |
| $10,000 to $14,999 | 3 (2.0%) | 2 (5.3%) |
| $15,000 to $19,999 | 3 (2.0%) | 2 (5.3%) |
| $20,000 to $24,999 | 7 (4.6%) | 7 (18.4%) |
| $25,000 to $34,999 | 8 (5.3%) | 2 (5.3%) |
| $35,000 to $49,999 | 22 (14.5%) | 10 (26.3%) |
| $50,000 to $74,999 | 27 (17.8%) | 0 (0.0%) |
| $75,000 to $99,999 | 35 (23.0%) | 6 (15.8%) |
| $100,000 to $149,999 | 16 (10.5%) | 4 (10.5%) |
| $150,000 or more | 23 (15.1%) | 1 (2.6%) |
| Total | 152 (100.0%) | 38 (100.0%) |
Monthly Housing Cost Tiers in Cuyamungue
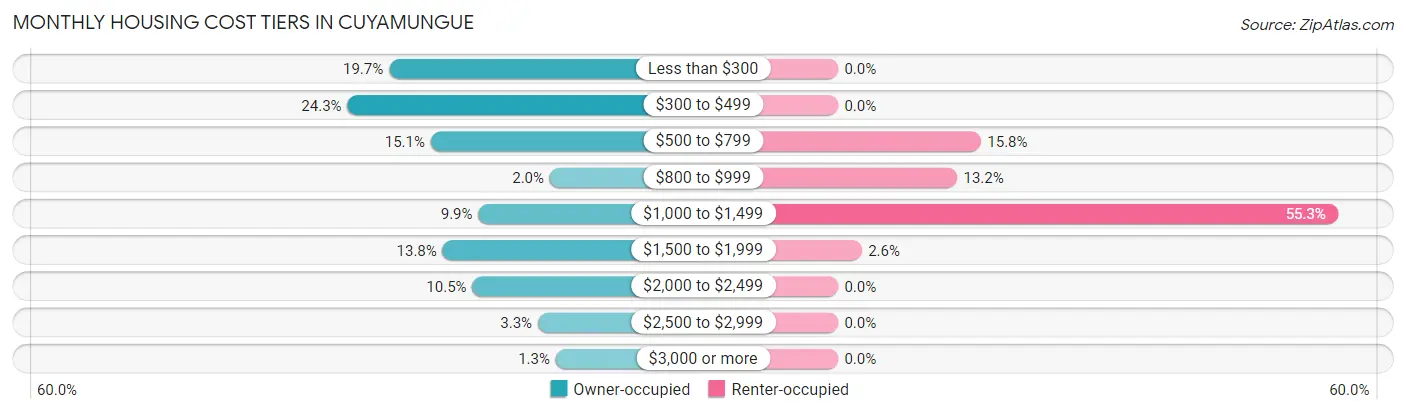
| Monthly Cost | Owner-occupied | Renter-occupied |
| Less than $300 | 30 (19.7%) | 0 (0.0%) |
| $300 to $499 | 37 (24.3%) | 0 (0.0%) |
| $500 to $799 | 23 (15.1%) | 6 (15.8%) |
| $800 to $999 | 3 (2.0%) | 5 (13.2%) |
| $1,000 to $1,499 | 15 (9.9%) | 21 (55.3%) |
| $1,500 to $1,999 | 21 (13.8%) | 1 (2.6%) |
| $2,000 to $2,499 | 16 (10.5%) | 0 (0.0%) |
| $2,500 to $2,999 | 5 (3.3%) | 0 (0.0%) |
| $3,000 or more | 2 (1.3%) | 0 (0.0%) |
| Total | 152 (100.0%) | 38 (100.0%) |
Physical Housing Characteristics in Cuyamungue
Housing Structures in Cuyamungue
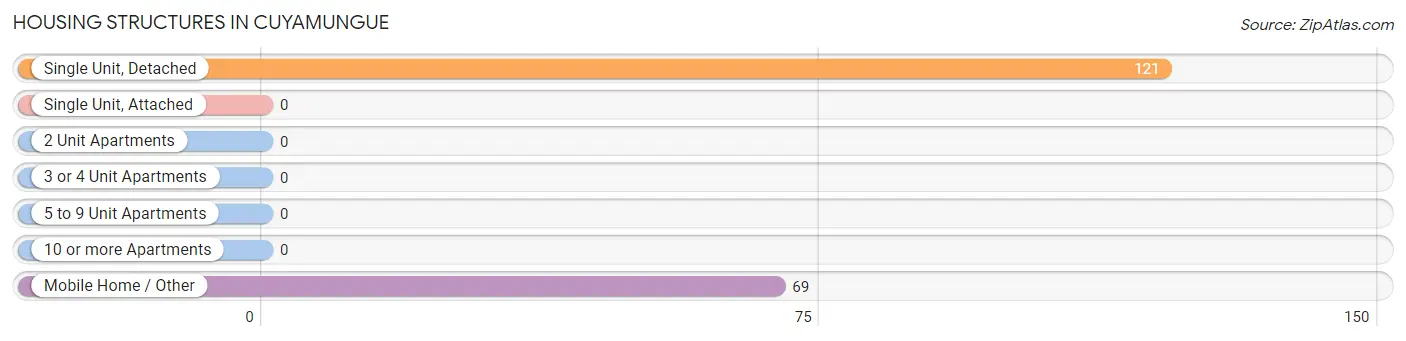
| Structure Type | # Housing Units | % Housing Units |
| Single Unit, Detached | 121 | 63.7% |
| Single Unit, Attached | 0 | 0.0% |
| 2 Unit Apartments | 0 | 0.0% |
| 3 or 4 Unit Apartments | 0 | 0.0% |
| 5 to 9 Unit Apartments | 0 | 0.0% |
| 10 or more Apartments | 0 | 0.0% |
| Mobile Home / Other | 69 | 36.3% |
| Total | 190 | 100.0% |
Housing Structures by Occupancy in Cuyamungue
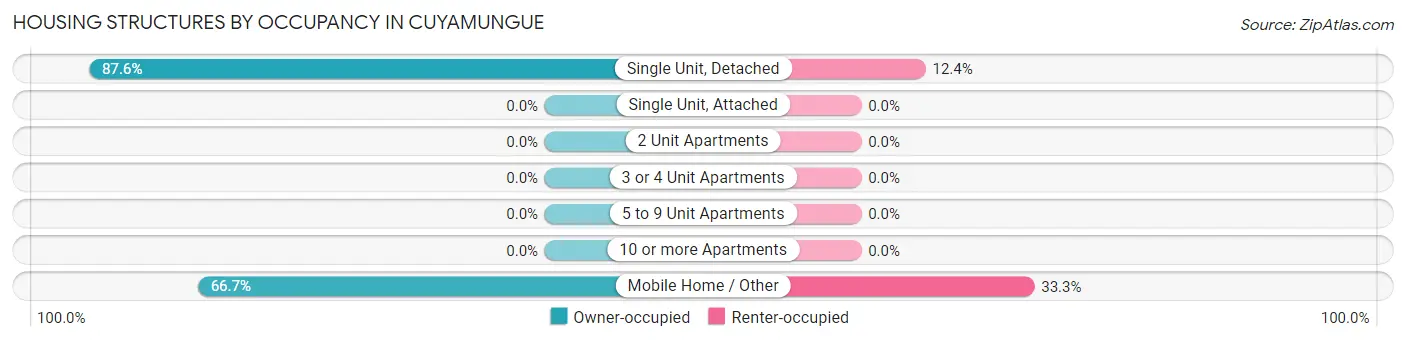
| Structure Type | Owner-occupied | Renter-occupied |
| Single Unit, Detached | 106 (87.6%) | 15 (12.4%) |
| Single Unit, Attached | 0 (0.0%) | 0 (0.0%) |
| 2 Unit Apartments | 0 (0.0%) | 0 (0.0%) |
| 3 or 4 Unit Apartments | 0 (0.0%) | 0 (0.0%) |
| 5 to 9 Unit Apartments | 0 (0.0%) | 0 (0.0%) |
| 10 or more Apartments | 0 (0.0%) | 0 (0.0%) |
| Mobile Home / Other | 46 (66.7%) | 23 (33.3%) |
| Total | 152 (80.0%) | 38 (20.0%) |
Housing Structures by Number of Rooms in Cuyamungue
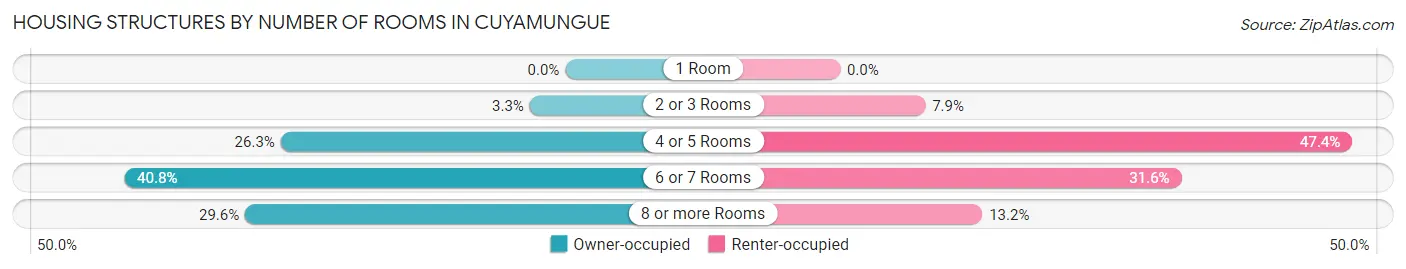
| Number of Rooms | Owner-occupied | Renter-occupied |
| 1 Room | 0 (0.0%) | 0 (0.0%) |
| 2 or 3 Rooms | 5 (3.3%) | 3 (7.9%) |
| 4 or 5 Rooms | 40 (26.3%) | 18 (47.4%) |
| 6 or 7 Rooms | 62 (40.8%) | 12 (31.6%) |
| 8 or more Rooms | 45 (29.6%) | 5 (13.2%) |
| Total | 152 (100.0%) | 38 (100.0%) |
Housing Structure by Heating Type in Cuyamungue
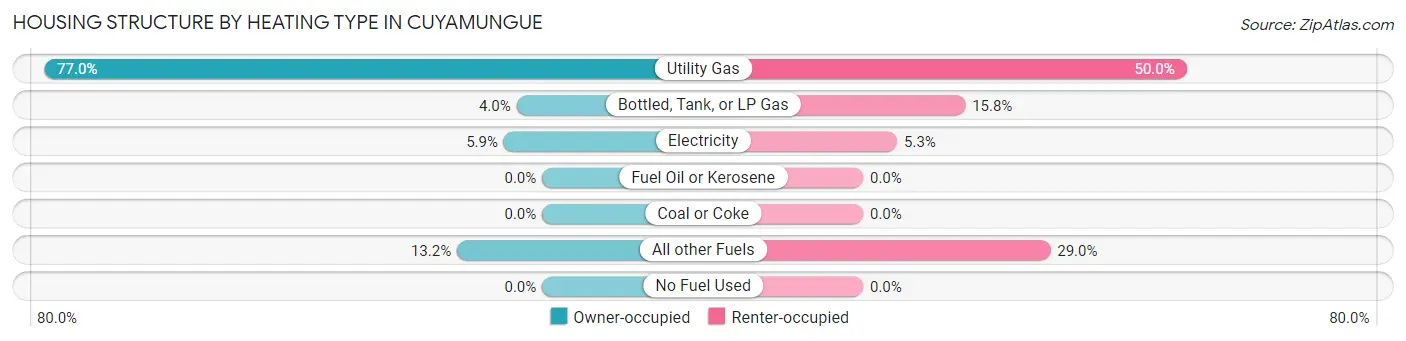
| Heating Type | Owner-occupied | Renter-occupied |
| Utility Gas | 117 (77.0%) | 19 (50.0%) |
| Bottled, Tank, or LP Gas | 6 (4.0%) | 6 (15.8%) |
| Electricity | 9 (5.9%) | 2 (5.3%) |
| Fuel Oil or Kerosene | 0 (0.0%) | 0 (0.0%) |
| Coal or Coke | 0 (0.0%) | 0 (0.0%) |
| All other Fuels | 20 (13.2%) | 11 (28.9%) |
| No Fuel Used | 0 (0.0%) | 0 (0.0%) |
| Total | 152 (100.0%) | 38 (100.0%) |
Household Vehicle Usage in Cuyamungue
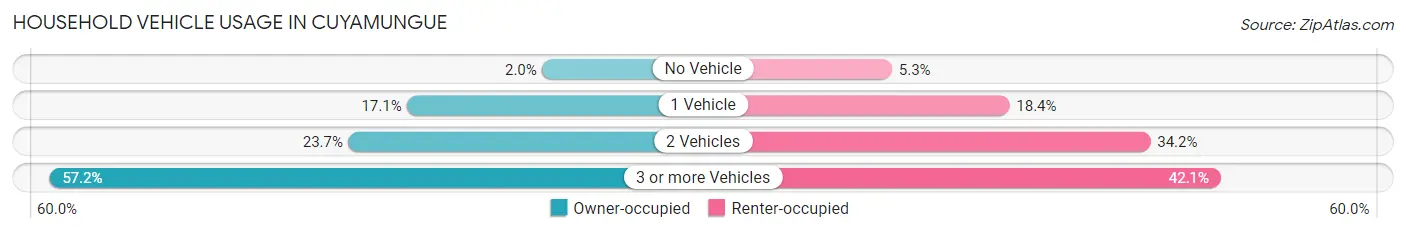
| Vehicles per Household | Owner-occupied | Renter-occupied |
| No Vehicle | 3 (2.0%) | 2 (5.3%) |
| 1 Vehicle | 26 (17.1%) | 7 (18.4%) |
| 2 Vehicles | 36 (23.7%) | 13 (34.2%) |
| 3 or more Vehicles | 87 (57.2%) | 16 (42.1%) |
| Total | 152 (100.0%) | 38 (100.0%) |
Real Estate & Mortgages in Cuyamungue
Real Estate and Mortgage Overview in Cuyamungue
| Characteristic | Without Mortgage | With Mortgage |
| Housing Units | 87 | 65 |
| Median Property Value | $278,100 | $334,400 |
| Median Household Income | $60,750 | $18 |
| Monthly Housing Costs | $417 | $0 |
| Real Estate Taxes | $1,280 | $3 |
Property Value by Mortgage Status in Cuyamungue
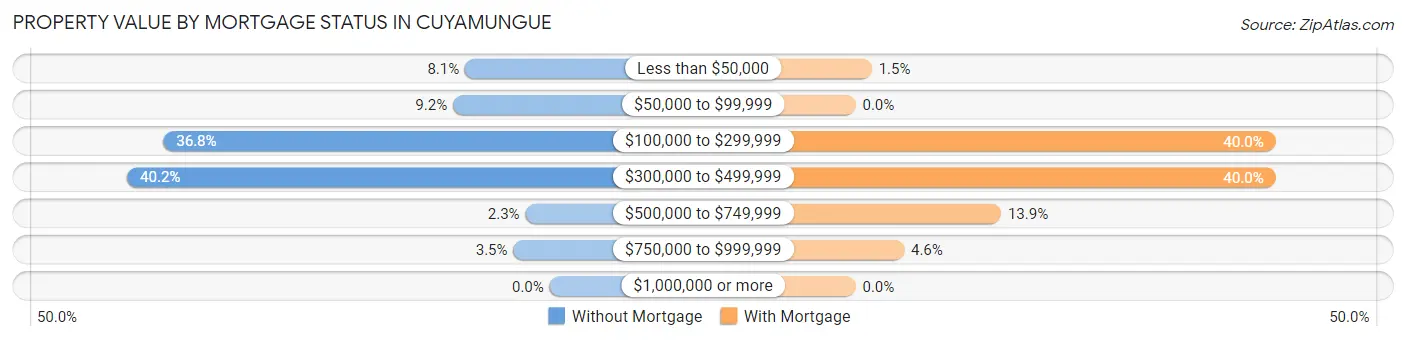
| Property Value | Without Mortgage | With Mortgage |
| Less than $50,000 | 7 (8.1%) | 1 (1.5%) |
| $50,000 to $99,999 | 8 (9.2%) | 0 (0.0%) |
| $100,000 to $299,999 | 32 (36.8%) | 26 (40.0%) |
| $300,000 to $499,999 | 35 (40.2%) | 26 (40.0%) |
| $500,000 to $749,999 | 2 (2.3%) | 9 (13.9%) |
| $750,000 to $999,999 | 3 (3.5%) | 3 (4.6%) |
| $1,000,000 or more | 0 (0.0%) | 0 (0.0%) |
| Total | 87 (100.0%) | 65 (100.0%) |
Household Income by Mortgage Status in Cuyamungue
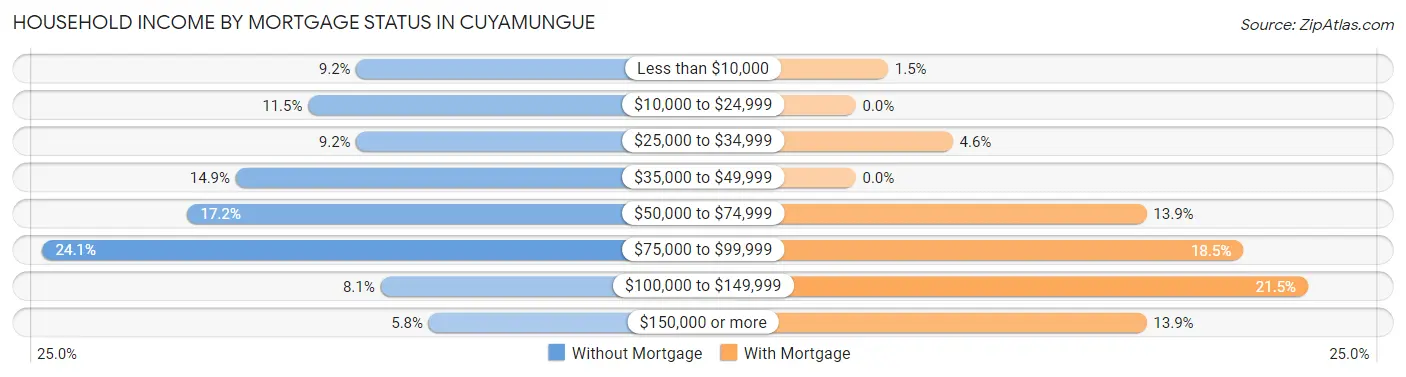
| Household Income | Without Mortgage | With Mortgage |
| Less than $10,000 | 8 (9.2%) | 1 (1.5%) |
| $10,000 to $24,999 | 10 (11.5%) | 0 (0.0%) |
| $25,000 to $34,999 | 8 (9.2%) | 3 (4.6%) |
| $35,000 to $49,999 | 13 (14.9%) | 0 (0.0%) |
| $50,000 to $74,999 | 15 (17.2%) | 9 (13.9%) |
| $75,000 to $99,999 | 21 (24.1%) | 12 (18.5%) |
| $100,000 to $149,999 | 7 (8.1%) | 14 (21.5%) |
| $150,000 or more | 5 (5.8%) | 9 (13.9%) |
| Total | 87 (100.0%) | 65 (100.0%) |
Property Value to Household Income Ratio in Cuyamungue
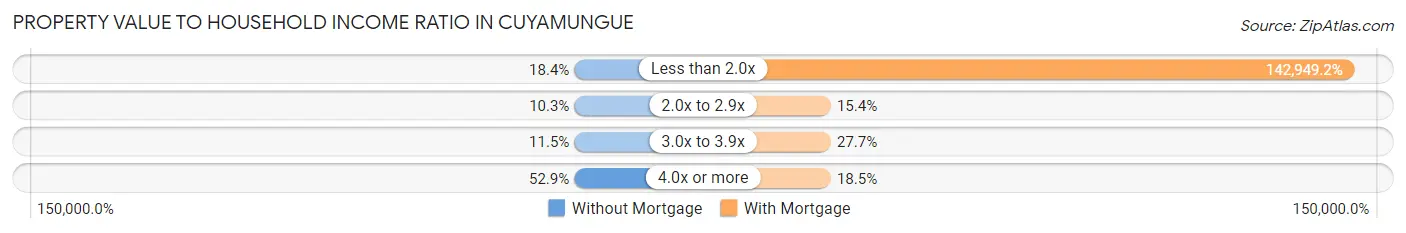
| Value-to-Income Ratio | Without Mortgage | With Mortgage |
| Less than 2.0x | 16 (18.4%) | 92,917 (142,949.2%) |
| 2.0x to 2.9x | 9 (10.3%) | 10 (15.4%) |
| 3.0x to 3.9x | 10 (11.5%) | 18 (27.7%) |
| 4.0x or more | 46 (52.9%) | 12 (18.5%) |
| Total | 87 (100.0%) | 65 (100.0%) |
Real Estate Taxes by Mortgage Status in Cuyamungue
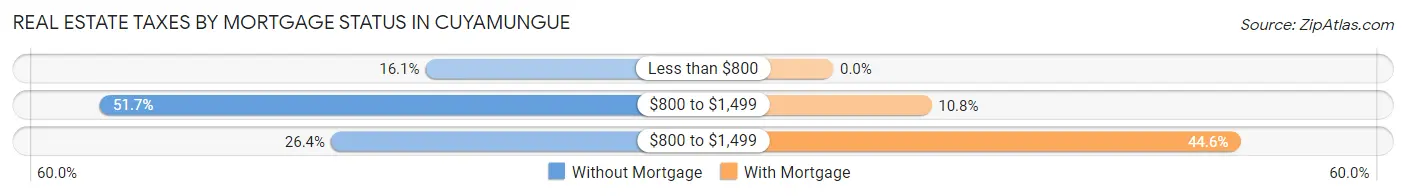
| Property Taxes | Without Mortgage | With Mortgage |
| Less than $800 | 14 (16.1%) | 0 (0.0%) |
| $800 to $1,499 | 45 (51.7%) | 7 (10.8%) |
| $800 to $1,499 | 23 (26.4%) | 29 (44.6%) |
| Total | 87 (100.0%) | 65 (100.0%) |
Health & Disability in Cuyamungue
Health Insurance Coverage by Age in Cuyamungue
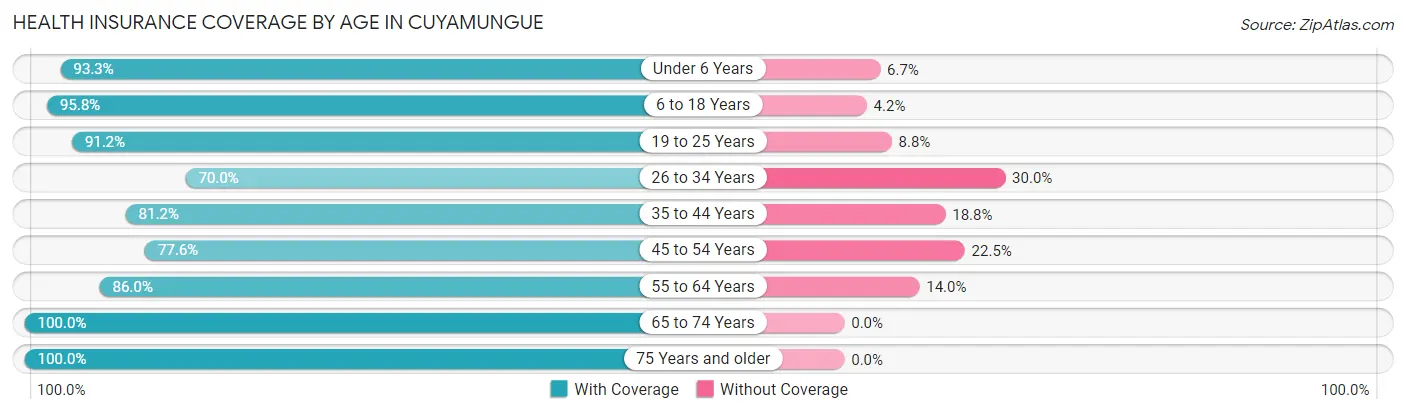
| Age Bracket | With Coverage | Without Coverage |
| Under 6 Years | 28 (93.3%) | 2 (6.7%) |
| 6 to 18 Years | 92 (95.8%) | 4 (4.2%) |
| 19 to 25 Years | 31 (91.2%) | 3 (8.8%) |
| 26 to 34 Years | 28 (70.0%) | 12 (30.0%) |
| 35 to 44 Years | 56 (81.2%) | 13 (18.8%) |
| 45 to 54 Years | 38 (77.5%) | 11 (22.5%) |
| 55 to 64 Years | 80 (86.0%) | 13 (14.0%) |
| 65 to 74 Years | 54 (100.0%) | 0 (0.0%) |
| 75 Years and older | 47 (100.0%) | 0 (0.0%) |
| Total | 454 (88.7%) | 58 (11.3%) |
Health Insurance Coverage by Citizenship Status in Cuyamungue
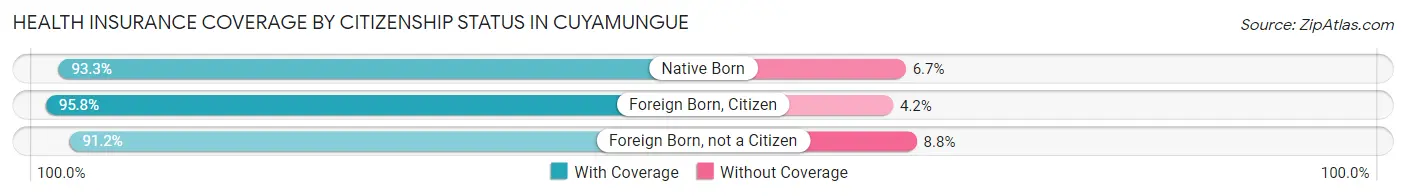
| Citizenship Status | With Coverage | Without Coverage |
| Native Born | 28 (93.3%) | 2 (6.7%) |
| Foreign Born, Citizen | 92 (95.8%) | 4 (4.2%) |
| Foreign Born, not a Citizen | 31 (91.2%) | 3 (8.8%) |
Health Insurance Coverage by Household Income in Cuyamungue
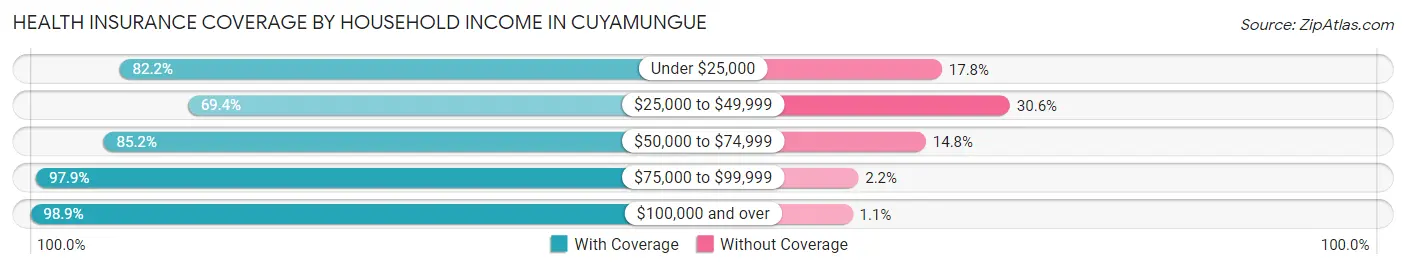
| Household Income | With Coverage | Without Coverage |
| Under $25,000 | 60 (82.2%) | 13 (17.8%) |
| $25,000 to $49,999 | 75 (69.4%) | 33 (30.6%) |
| $50,000 to $74,999 | 46 (85.2%) | 8 (14.8%) |
| $75,000 to $99,999 | 91 (97.9%) | 2 (2.1%) |
| $100,000 and over | 182 (98.9%) | 2 (1.1%) |
Public vs Private Health Insurance Coverage by Age in Cuyamungue
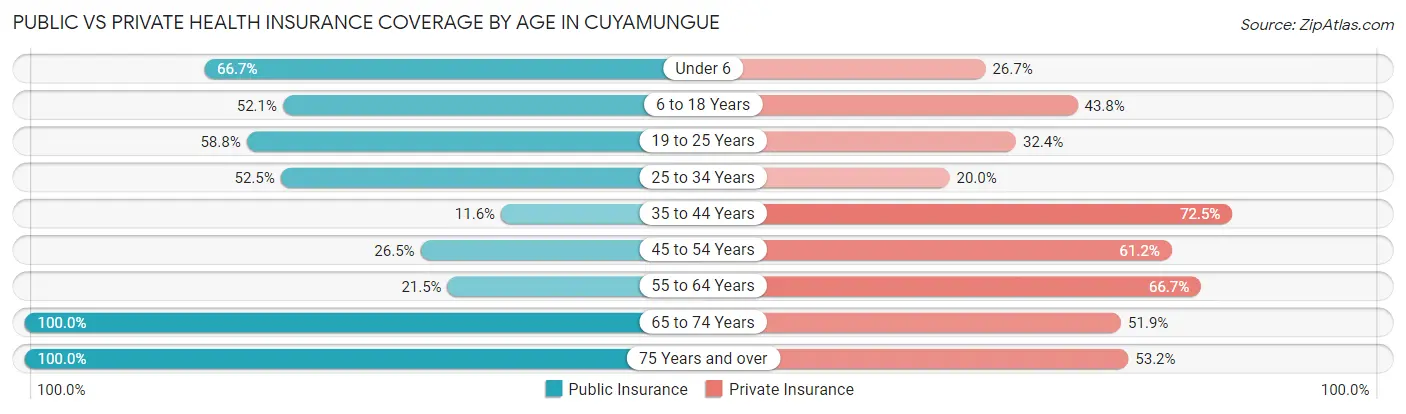
| Age Bracket | Public Insurance | Private Insurance |
| Under 6 | 20 (66.7%) | 8 (26.7%) |
| 6 to 18 Years | 50 (52.1%) | 42 (43.8%) |
| 19 to 25 Years | 20 (58.8%) | 11 (32.4%) |
| 25 to 34 Years | 21 (52.5%) | 8 (20.0%) |
| 35 to 44 Years | 8 (11.6%) | 50 (72.5%) |
| 45 to 54 Years | 13 (26.5%) | 30 (61.2%) |
| 55 to 64 Years | 20 (21.5%) | 62 (66.7%) |
| 65 to 74 Years | 54 (100.0%) | 28 (51.8%) |
| 75 Years and over | 47 (100.0%) | 25 (53.2%) |
| Total | 253 (49.4%) | 264 (51.6%) |
Disability Status by Sex by Age in Cuyamungue
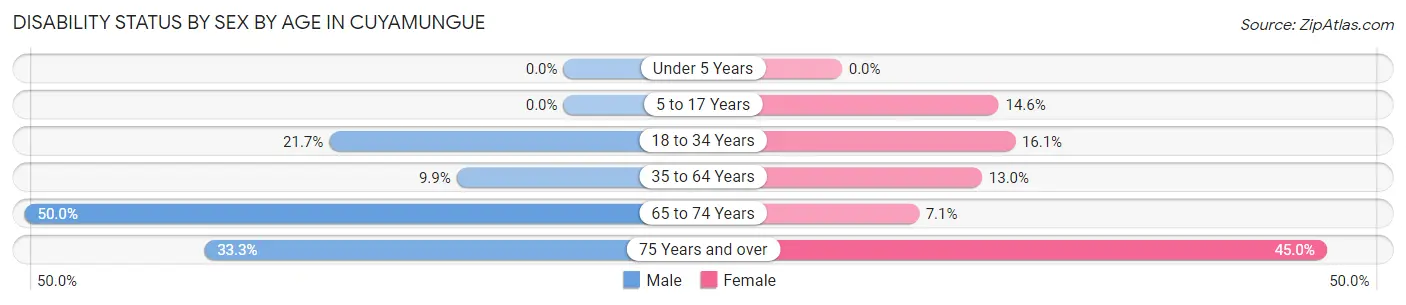
| Age Bracket | Male | Female |
| Under 5 Years | 0 (0.0%) | 0 (0.0%) |
| 5 to 17 Years | 0 (0.0%) | 8 (14.5%) |
| 18 to 34 Years | 5 (21.7%) | 9 (16.1%) |
| 35 to 64 Years | 11 (9.9%) | 13 (13.0%) |
| 65 to 74 Years | 13 (50.0%) | 2 (7.1%) |
| 75 Years and over | 9 (33.3%) | 9 (45.0%) |
Disability Class by Sex by Age in Cuyamungue
Disability Class: Hearing Difficulty
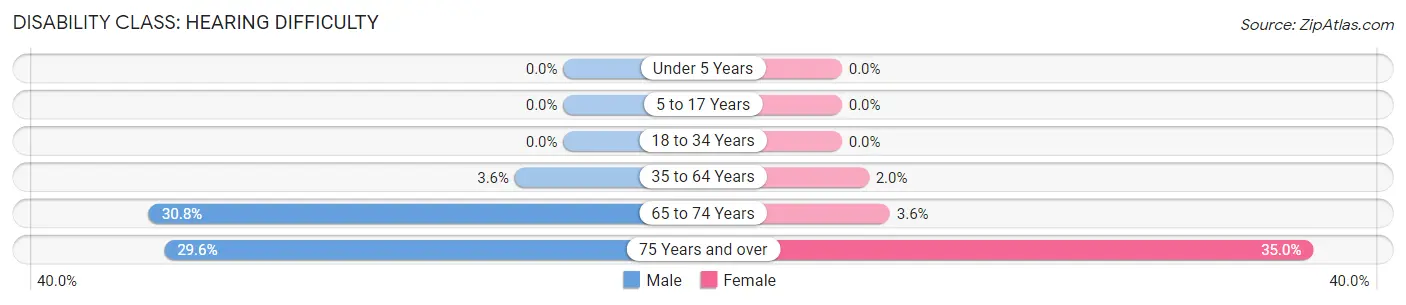
| Age Bracket | Male | Female |
| Under 5 Years | 0 (0.0%) | 0 (0.0%) |
| 5 to 17 Years | 0 (0.0%) | 0 (0.0%) |
| 18 to 34 Years | 0 (0.0%) | 0 (0.0%) |
| 35 to 64 Years | 4 (3.6%) | 2 (2.0%) |
| 65 to 74 Years | 8 (30.8%) | 1 (3.6%) |
| 75 Years and over | 8 (29.6%) | 7 (35.0%) |
Disability Class: Vision Difficulty
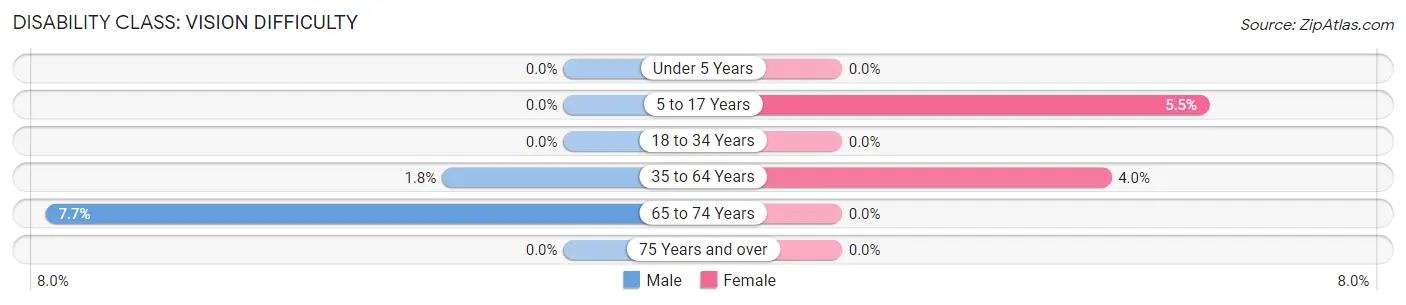
| Age Bracket | Male | Female |
| Under 5 Years | 0 (0.0%) | 0 (0.0%) |
| 5 to 17 Years | 0 (0.0%) | 3 (5.4%) |
| 18 to 34 Years | 0 (0.0%) | 0 (0.0%) |
| 35 to 64 Years | 2 (1.8%) | 4 (4.0%) |
| 65 to 74 Years | 2 (7.7%) | 0 (0.0%) |
| 75 Years and over | 0 (0.0%) | 0 (0.0%) |
Disability Class: Cognitive Difficulty
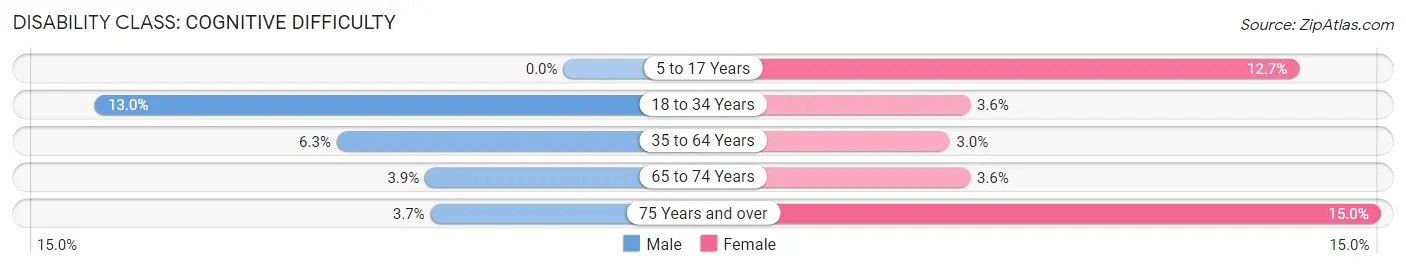
| Age Bracket | Male | Female |
| 5 to 17 Years | 0 (0.0%) | 7 (12.7%) |
| 18 to 34 Years | 3 (13.0%) | 2 (3.6%) |
| 35 to 64 Years | 7 (6.3%) | 3 (3.0%) |
| 65 to 74 Years | 1 (3.8%) | 1 (3.6%) |
| 75 Years and over | 1 (3.7%) | 3 (15.0%) |
Disability Class: Ambulatory Difficulty
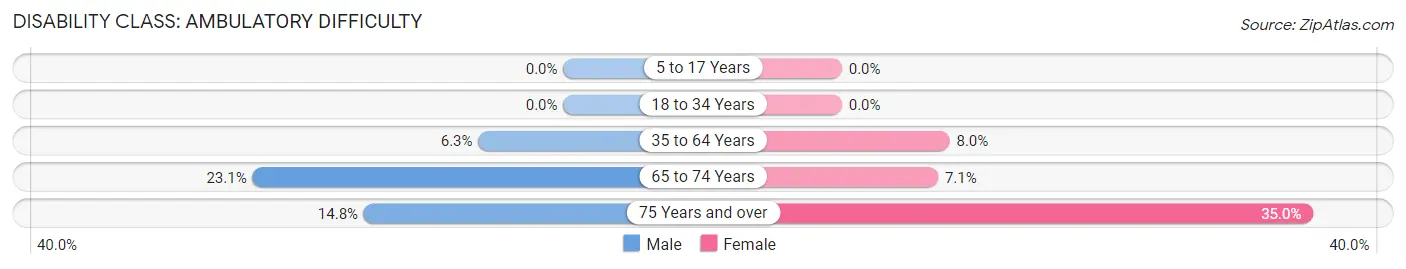
| Age Bracket | Male | Female |
| 5 to 17 Years | 0 (0.0%) | 0 (0.0%) |
| 18 to 34 Years | 0 (0.0%) | 0 (0.0%) |
| 35 to 64 Years | 7 (6.3%) | 8 (8.0%) |
| 65 to 74 Years | 6 (23.1%) | 2 (7.1%) |
| 75 Years and over | 4 (14.8%) | 7 (35.0%) |
Disability Class: Self-Care Difficulty
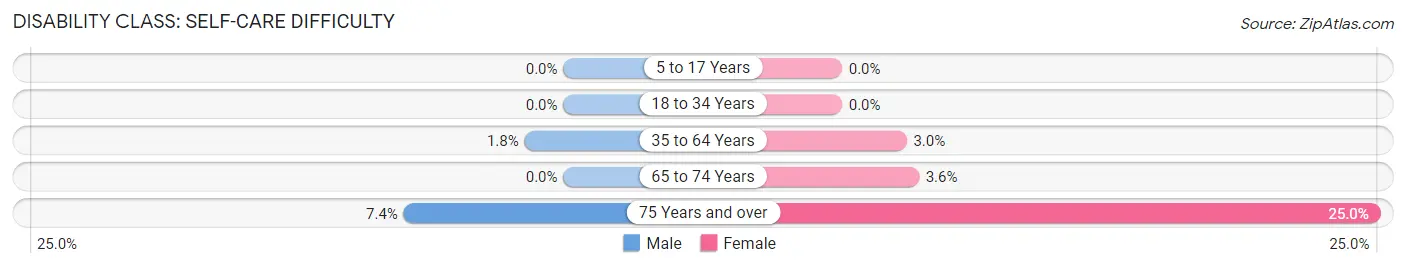
| Age Bracket | Male | Female |
| 5 to 17 Years | 0 (0.0%) | 0 (0.0%) |
| 18 to 34 Years | 0 (0.0%) | 0 (0.0%) |
| 35 to 64 Years | 2 (1.8%) | 3 (3.0%) |
| 65 to 74 Years | 0 (0.0%) | 1 (3.6%) |
| 75 Years and over | 2 (7.4%) | 5 (25.0%) |
Technology Access in Cuyamungue
Computing Device Access in Cuyamungue
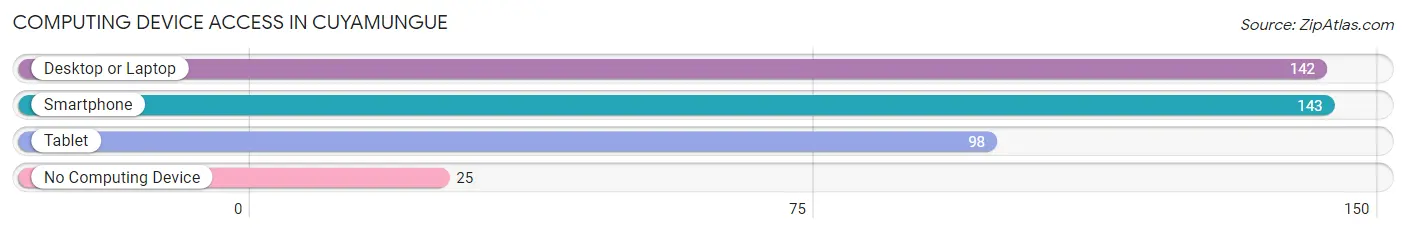
| Device Type | # Households | % Households |
| Desktop or Laptop | 142 | 74.7% |
| Smartphone | 143 | 75.3% |
| Tablet | 98 | 51.6% |
| No Computing Device | 25 | 13.2% |
| Total | 190 | 100.0% |
Internet Access in Cuyamungue
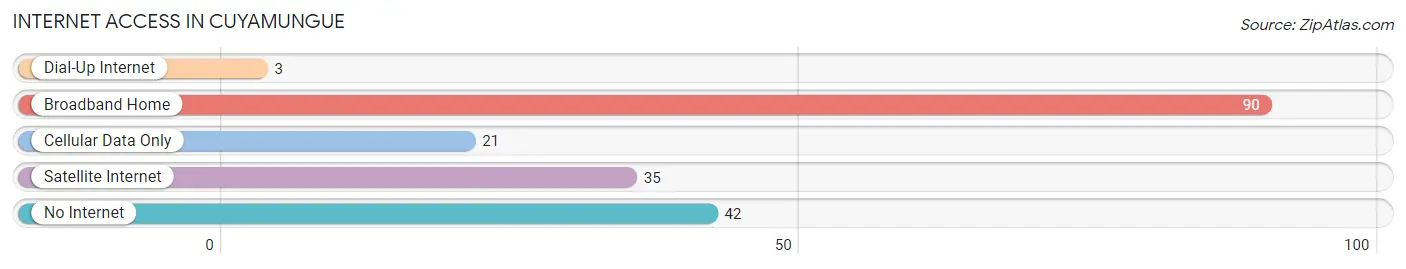
| Internet Type | # Households | % Households |
| Dial-Up Internet | 3 | 1.6% |
| Broadband Home | 90 | 47.4% |
| Cellular Data Only | 21 | 11.1% |
| Satellite Internet | 35 | 18.4% |
| No Internet | 42 | 22.1% |
| Total | 190 | 100.0% |
Cuyamungue Summary
Cuyamungue is a small unincorporated community located in Santa Fe County, New Mexico. It is situated in the foothills of the Sangre de Cristo Mountains, approximately 15 miles north of Santa Fe. The area is known for its scenic beauty, with rolling hills, lush vegetation, and stunning views of the surrounding mountains.
History
The area now known as Cuyamungue has been inhabited for thousands of years. The first known inhabitants were the Pueblo Indians, who lived in the area for centuries before the arrival of the Spanish in the 16th century. The Spanish established a mission in the area in 1610, and the area was later part of the Spanish land grant system.
In the late 19th century, the area was settled by Anglo-American settlers, who established a small farming community. The town was officially established in 1891, and was named after the nearby Cuyamungue River. The town grew slowly, and by the early 20th century, it had a population of around 200 people.
Geography
Cuyamungue is located in the foothills of the Sangre de Cristo Mountains, approximately 15 miles north of Santa Fe. The area is characterized by rolling hills, lush vegetation, and stunning views of the surrounding mountains. The town is situated at an elevation of 6,000 feet, and the climate is semi-arid, with hot summers and cold winters.
Economy
The economy of Cuyamungue is largely based on agriculture and tourism. The area is known for its scenic beauty, and it is a popular destination for hikers, campers, and other outdoor enthusiasts. The town also has a few small businesses, including a general store, a gas station, and a few restaurants.
Demographics
As of the 2010 census, the population of Cuyamungue was 545. The racial makeup of the town was 94.2% White, 0.7% African American, 0.4% Native American, 0.2% Asian, 0.1% Pacific Islander, and 4.4% from other races. The median household income was $37,500, and the median family income was $41,250. The per capita income was $17,845.
Conclusion
Cuyamungue is a small unincorporated community located in Santa Fe County, New Mexico. It is situated in the foothills of the Sangre de Cristo Mountains, approximately 15 miles north of Santa Fe. The area is known for its scenic beauty, with rolling hills, lush vegetation, and stunning views of the surrounding mountains. The economy of Cuyamungue is largely based on agriculture and tourism, and the town has a population of 545, as of the 2010 census. The area is a popular destination for outdoor enthusiasts, and it is also home to a few small businesses.
Common Questions
What is Per Capita Income in Cuyamungue?
Per Capita income in Cuyamungue is $33,339.
What is the Median Family Income in Cuyamungue?
Median Family Income in Cuyamungue is $80,938.
What is the Median Household income in Cuyamungue?
Median Household Income in Cuyamungue is $64,500.
What is Income or Wage Gap in Cuyamungue?
Income or Wage Gap in Cuyamungue is 10.0%.
Women in Cuyamungue earn 90.0 cents for every dollar earned by a man.
What is Inequality or Gini Index in Cuyamungue?
Inequality or Gini Index in Cuyamungue is 0.44.
What is the Total Population of Cuyamungue?
Total Population of Cuyamungue is 512.
What is the Total Male Population of Cuyamungue?
Total Male Population of Cuyamungue is 232.
What is the Total Female Population of Cuyamungue?
Total Female Population of Cuyamungue is 280.
What is the Ratio of Males per 100 Females in Cuyamungue?
There are 82.86 Males per 100 Females in Cuyamungue.
What is the Ratio of Females per 100 Males in Cuyamungue?
There are 120.69 Females per 100 Males in Cuyamungue.
What is the Median Population Age in Cuyamungue?
Median Population Age in Cuyamungue is 42.7 Years.
What is the Average Family Size in Cuyamungue
Average Family Size in Cuyamungue is 3.4 People.
What is the Average Household Size in Cuyamungue
Average Household Size in Cuyamungue is 2.7 People.
How Large is the Labor Force in Cuyamungue?
There are 218 People in the Labor Forcein in Cuyamungue.
What is the Percentage of People in the Labor Force in Cuyamungue?
52.5% of People are in the Labor Force in Cuyamungue.
What is the Unemployment Rate in Cuyamungue?
Unemployment Rate in Cuyamungue is 3.7%.