Mesilla, NM Map & Demographics
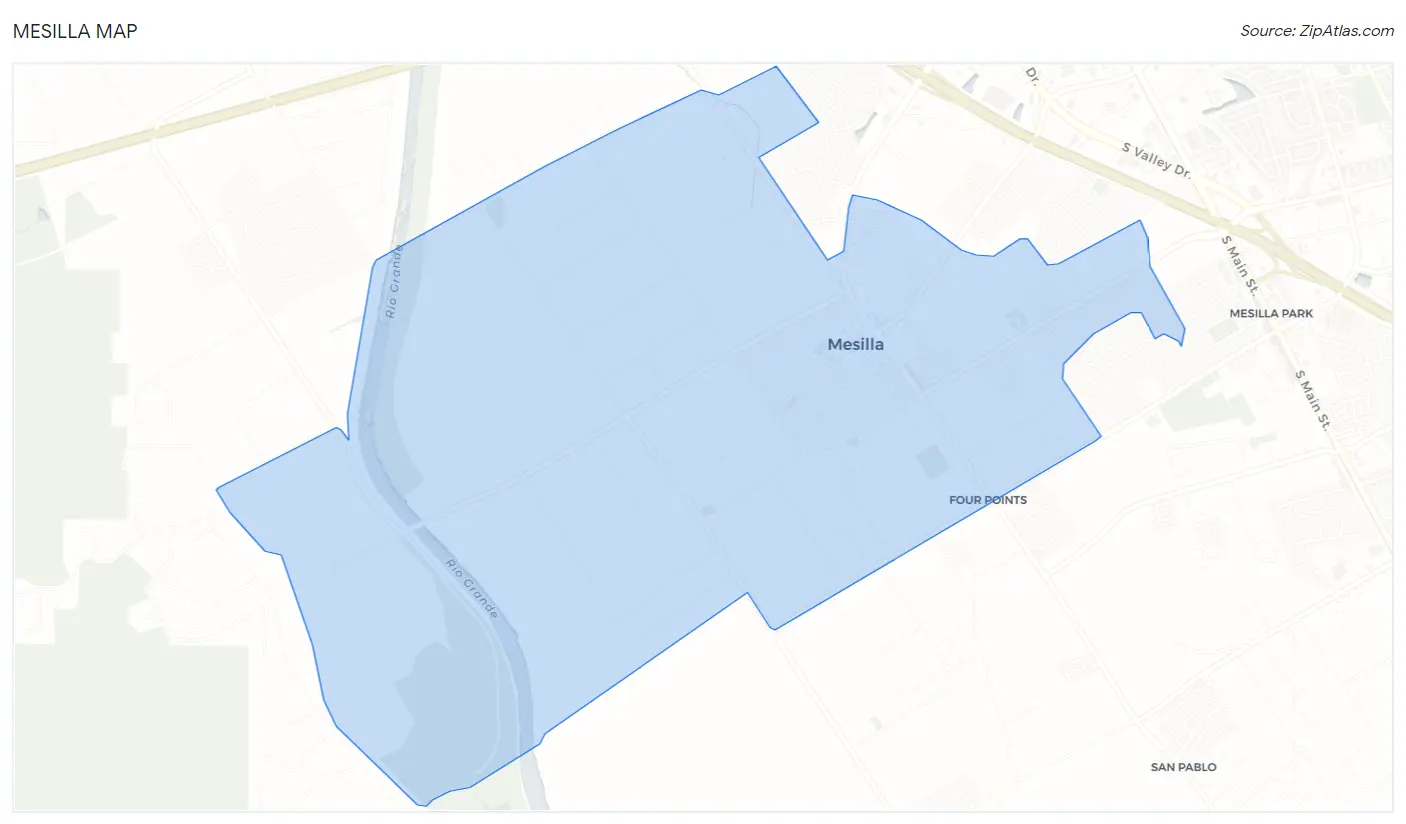
Mesilla Map
Mesilla Overview
$48,947
PER CAPITA INCOME
$102,813
AVG FAMILY INCOME
$65,809
AVG HOUSEHOLD INCOME
31.9%
WAGE / INCOME GAP [ % ]
68.1¢/ $1
WAGE / INCOME GAP [ $ ]
0.54
INEQUALITY / GINI INDEX
1,647
TOTAL POPULATION
674
MALE POPULATION
973
FEMALE POPULATION
69.27
MALES / 100 FEMALES
144.36
FEMALES / 100 MALES
51.0
MEDIAN AGE
3.4
AVG FAMILY SIZE
2.2
AVG HOUSEHOLD SIZE
777
LABOR FORCE [ PEOPLE ]
53.8%
PERCENT IN LABOR FORCE
1.3%
UNEMPLOYMENT RATE
Mesilla Zip Codes
Mesilla Area Codes
Income in Mesilla
Income Overview in Mesilla
Per Capita Income in Mesilla is $48,947, while median incomes of families and households are $102,813 and $65,809 respectively.
| Characteristic | Number | Measure |
| Per Capita Income | 1,647 | $48,947 |
| Median Family Income | 339 | $102,813 |
| Mean Family Income | 339 | $142,865 |
| Median Household Income | 755 | $65,809 |
| Mean Household Income | 755 | $100,721 |
| Income Deficit | 339 | $0 |
| Wage / Income Gap (%) | 1,647 | 31.85% |
| Wage / Income Gap ($) | 1,647 | 68.15¢ per $1 |
| Gini / Inequality Index | 1,647 | 0.54 |
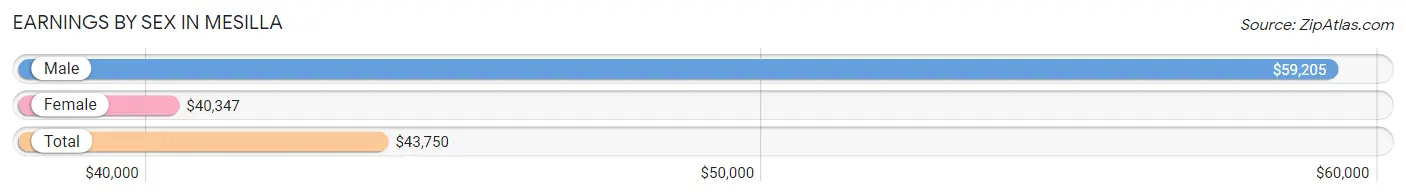
Earnings by Sex in Mesilla
Average Earnings in Mesilla are $43,750, $59,205 for men and $40,347 for women, a difference of 31.9%.
| Sex | Number | Average Earnings |
| Male | 461 (56.8%) | $59,205 |
| Female | 351 (43.2%) | $40,347 |
| Total | 812 (100.0%) | $43,750 |
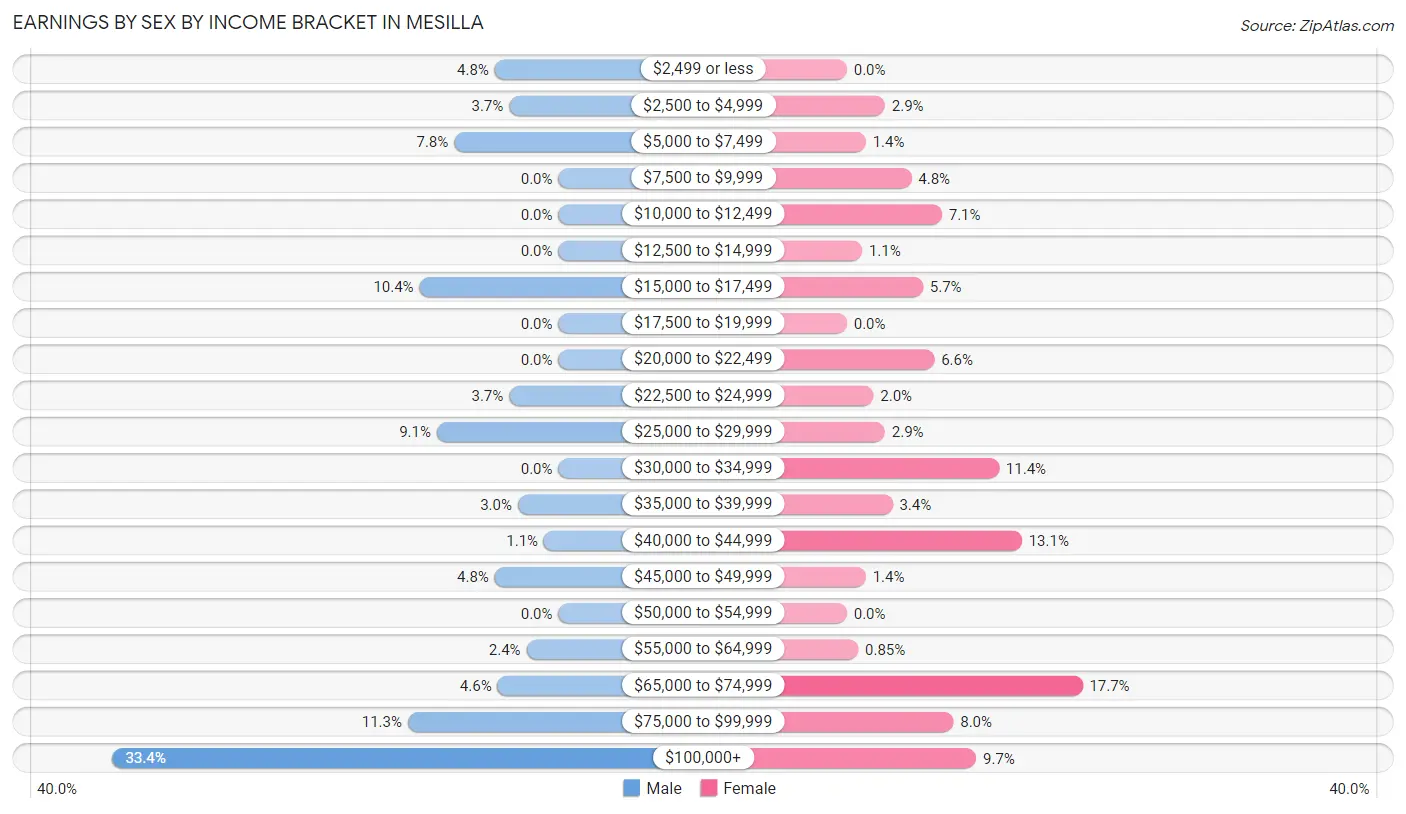
Earnings by Sex by Income Bracket in Mesilla
The most common earnings brackets in Mesilla are $100,000+ for men (154 | 33.4%) and $65,000 to $74,999 for women (62 | 17.7%).
| Income | Male | Female |
| $2,499 or less | 22 (4.8%) | 0 (0.0%) |
| $2,500 to $4,999 | 17 (3.7%) | 10 (2.9%) |
| $5,000 to $7,499 | 36 (7.8%) | 5 (1.4%) |
| $7,500 to $9,999 | 0 (0.0%) | 17 (4.8%) |
| $10,000 to $12,499 | 0 (0.0%) | 25 (7.1%) |
| $12,500 to $14,999 | 0 (0.0%) | 4 (1.1%) |
| $15,000 to $17,499 | 48 (10.4%) | 20 (5.7%) |
| $17,500 to $19,999 | 0 (0.0%) | 0 (0.0%) |
| $20,000 to $22,499 | 0 (0.0%) | 23 (6.6%) |
| $22,500 to $24,999 | 17 (3.7%) | 7 (2.0%) |
| $25,000 to $29,999 | 42 (9.1%) | 10 (2.9%) |
| $30,000 to $34,999 | 0 (0.0%) | 40 (11.4%) |
| $35,000 to $39,999 | 14 (3.0%) | 12 (3.4%) |
| $40,000 to $44,999 | 5 (1.1%) | 46 (13.1%) |
| $45,000 to $49,999 | 22 (4.8%) | 5 (1.4%) |
| $50,000 to $54,999 | 0 (0.0%) | 0 (0.0%) |
| $55,000 to $64,999 | 11 (2.4%) | 3 (0.9%) |
| $65,000 to $74,999 | 21 (4.6%) | 62 (17.7%) |
| $75,000 to $99,999 | 52 (11.3%) | 28 (8.0%) |
| $100,000+ | 154 (33.4%) | 34 (9.7%) |
| Total | 461 (100.0%) | 351 (100.0%) |
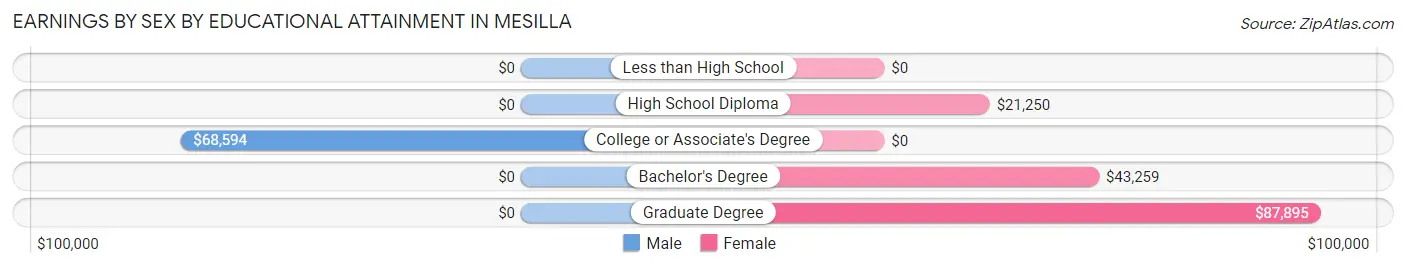
Earnings by Sex by Educational Attainment in Mesilla
Average earnings in Mesilla are $89,107 for men and $43,036 for women, a difference of 51.7%. Men with an educational attainment of college or associate's degree enjoy the highest average annual earnings of $68,594, while those with college or associate's degree education earn the least with $68,594. Women with an educational attainment of graduate degree earn the most with the average annual earnings of $87,895, while those with high school diploma education have the smallest earnings of $21,250.
| Educational Attainment | Male Income | Female Income |
| Less than High School | - | - |
| High School Diploma | - | - |
| College or Associate's Degree | $68,594 | $0 |
| Bachelor's Degree | - | - |
| Graduate Degree | - | - |
| Total | $89,107 | $43,036 |
Family Income in Mesilla
Family Income Brackets in Mesilla
According to the Mesilla family income data, there are 88 families falling into the $100,000 to $149,999 income range, which is the most common income bracket and makes up 26.0% of all families.
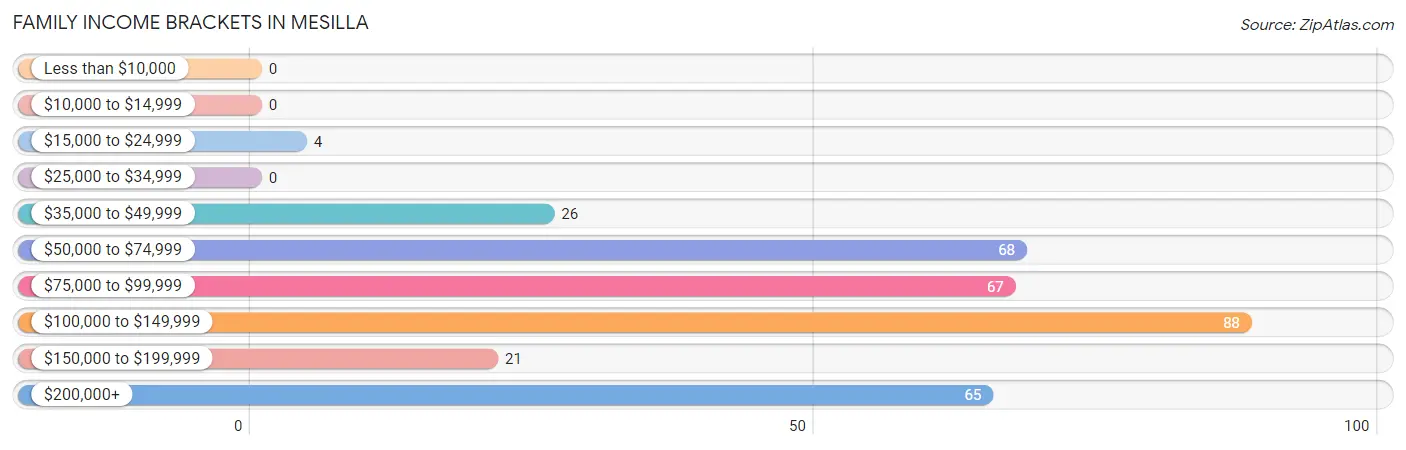
| Income Bracket | # Families | % Families |
| Less than $10,000 | 0 | 0.0% |
| $10,000 to $14,999 | 0 | 0.0% |
| $15,000 to $24,999 | 4 | 1.2% |
| $25,000 to $34,999 | 0 | 0.0% |
| $35,000 to $49,999 | 26 | 7.7% |
| $50,000 to $74,999 | 68 | 20.1% |
| $75,000 to $99,999 | 67 | 19.8% |
| $100,000 to $149,999 | 88 | 26.0% |
| $150,000 to $199,999 | 21 | 6.2% |
| $200,000+ | 65 | 19.2% |
Family Income by Famaliy Size in Mesilla
5-person families (43 | 12.7%) account for the highest median family income in Mesilla with $104,063 per family, while 2-person families (162 | 47.8%) have the highest median income of $41,786 per family member.
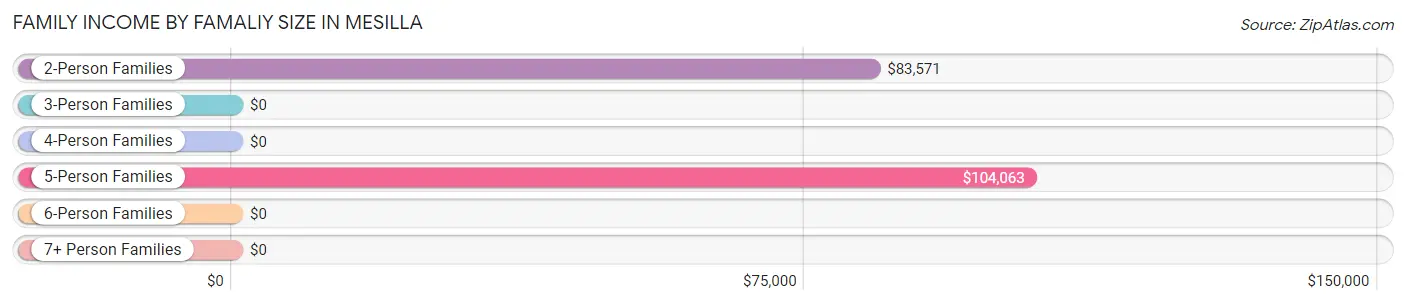
| Income Bracket | # Families | Median Income |
| 2-Person Families | 162 (47.8%) | $83,571 |
| 3-Person Families | 59 (17.4%) | $0 |
| 4-Person Families | 75 (22.1%) | $0 |
| 5-Person Families | 43 (12.7%) | $104,063 |
| 6-Person Families | 0 (0.0%) | $0 |
| 7+ Person Families | 0 (0.0%) | $0 |
| Total | 339 (100.0%) | $102,813 |
Family Income by Number of Earners in Mesilla
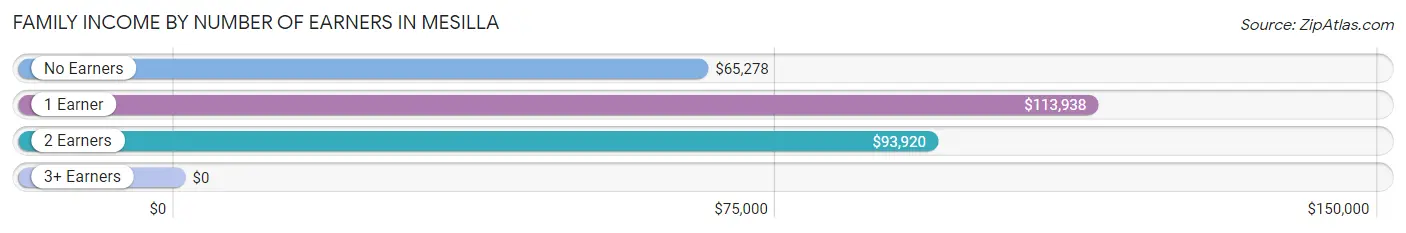
| Number of Earners | # Families | Median Income |
| No Earners | 38 (11.2%) | $65,278 |
| 1 Earner | 116 (34.2%) | $113,938 |
| 2 Earners | 177 (52.2%) | $93,920 |
| 3+ Earners | 8 (2.4%) | $0 |
| Total | 339 (100.0%) | $102,813 |
Household Income in Mesilla
Household Income Brackets in Mesilla
With 210 households falling in the category, the $15,000 to $24,999 income range is the most frequent in Mesilla, accounting for 27.8% of all households. In contrast, only 6 households (0.8%) fall into the $25,000 to $34,999 income bracket, making it the least populous group.
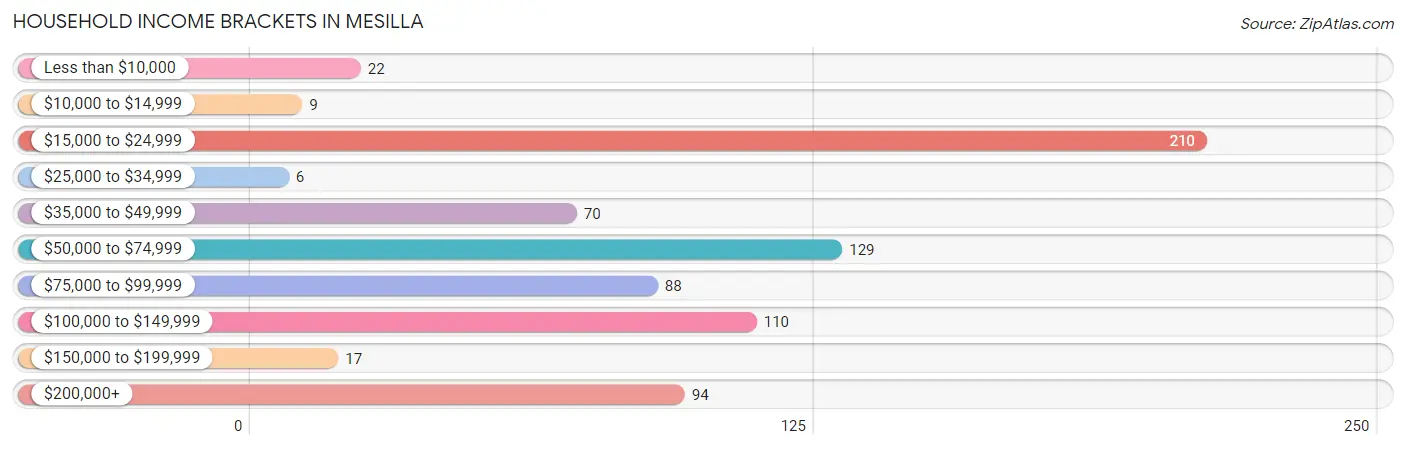
| Income Bracket | # Households | % Households |
| Less than $10,000 | 22 | 2.9% |
| $10,000 to $14,999 | 9 | 1.2% |
| $15,000 to $24,999 | 210 | 27.8% |
| $25,000 to $34,999 | 6 | 0.8% |
| $35,000 to $49,999 | 70 | 9.3% |
| $50,000 to $74,999 | 129 | 17.1% |
| $75,000 to $99,999 | 88 | 11.7% |
| $100,000 to $149,999 | 110 | 14.6% |
| $150,000 to $199,999 | 17 | 2.3% |
| $200,000+ | 94 | 12.5% |
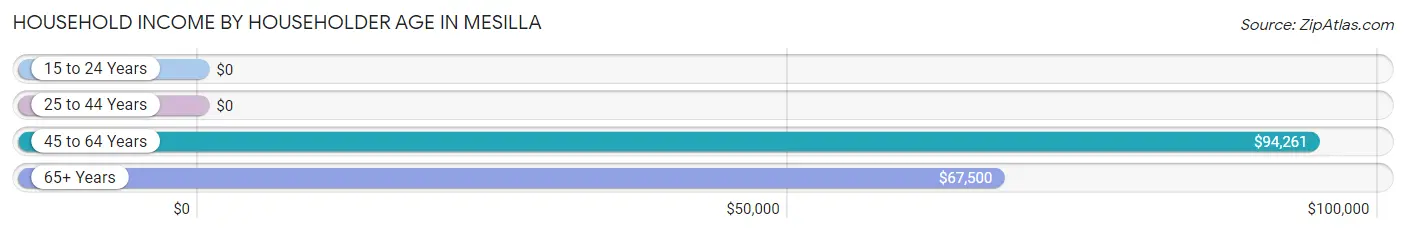
Household Income by Householder Age in Mesilla
The median household income in Mesilla is $65,809, with the highest median household income of $94,261 found in the 45 to 64 years age bracket for the primary householder. A total of 353 households (46.8%) fall into this category. Meanwhile, the 15 to 24 years age bracket for the primary householder has the lowest median household income of $0, with 51 households (6.8%) in this group.
| Income Bracket | # Households | Median Income |
| 15 to 24 Years | 51 (6.8%) | $0 |
| 25 to 44 Years | 137 (18.1%) | $0 |
| 45 to 64 Years | 353 (46.8%) | $94,261 |
| 65+ Years | 214 (28.3%) | $67,500 |
| Total | 755 (100.0%) | $65,809 |
Poverty in Mesilla
Income Below Poverty by Sex and Age in Mesilla
With 7.3% poverty level for males and 5.4% for females among the residents of Mesilla, 5 year old males and 75 year old and over females are the most vulnerable to poverty, with 4 males (100.0%) and 30 females (14.9%) in their respective age groups living below the poverty level.
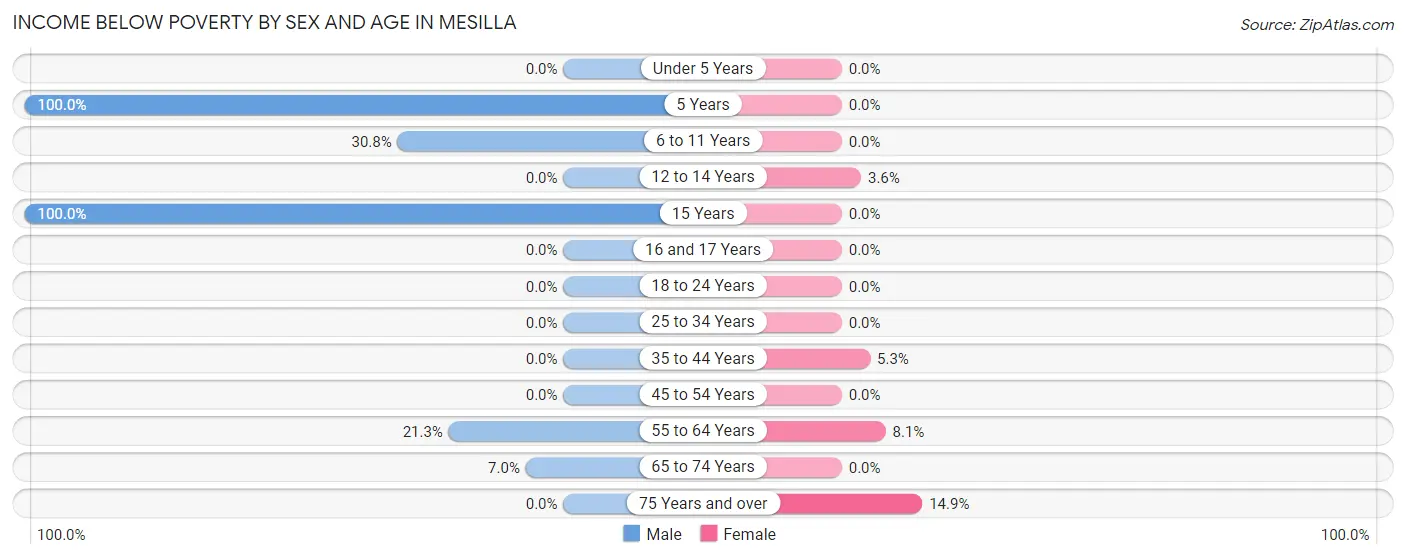
| Age Bracket | Male | Female |
| Under 5 Years | 0 (0.0%) | 0 (0.0%) |
| 5 Years | 4 (100.0%) | 0 (0.0%) |
| 6 to 11 Years | 4 (30.8%) | 0 (0.0%) |
| 12 to 14 Years | 0 (0.0%) | 2 (3.6%) |
| 15 Years | 5 (100.0%) | 0 (0.0%) |
| 16 and 17 Years | 0 (0.0%) | 0 (0.0%) |
| 18 to 24 Years | 0 (0.0%) | 0 (0.0%) |
| 25 to 34 Years | 0 (0.0%) | 0 (0.0%) |
| 35 to 44 Years | 0 (0.0%) | 4 (5.3%) |
| 45 to 54 Years | 0 (0.0%) | 0 (0.0%) |
| 55 to 64 Years | 30 (21.3%) | 17 (8.1%) |
| 65 to 74 Years | 6 (7.0%) | 0 (0.0%) |
| 75 Years and over | 0 (0.0%) | 30 (14.9%) |
| Total | 49 (7.3%) | 53 (5.4%) |
Income Above Poverty by Sex and Age in Mesilla
According to the poverty statistics in Mesilla, males aged under 5 years and females aged under 5 years are the age groups that are most secure financially, with 100.0% of males and 100.0% of females in these age groups living above the poverty line.
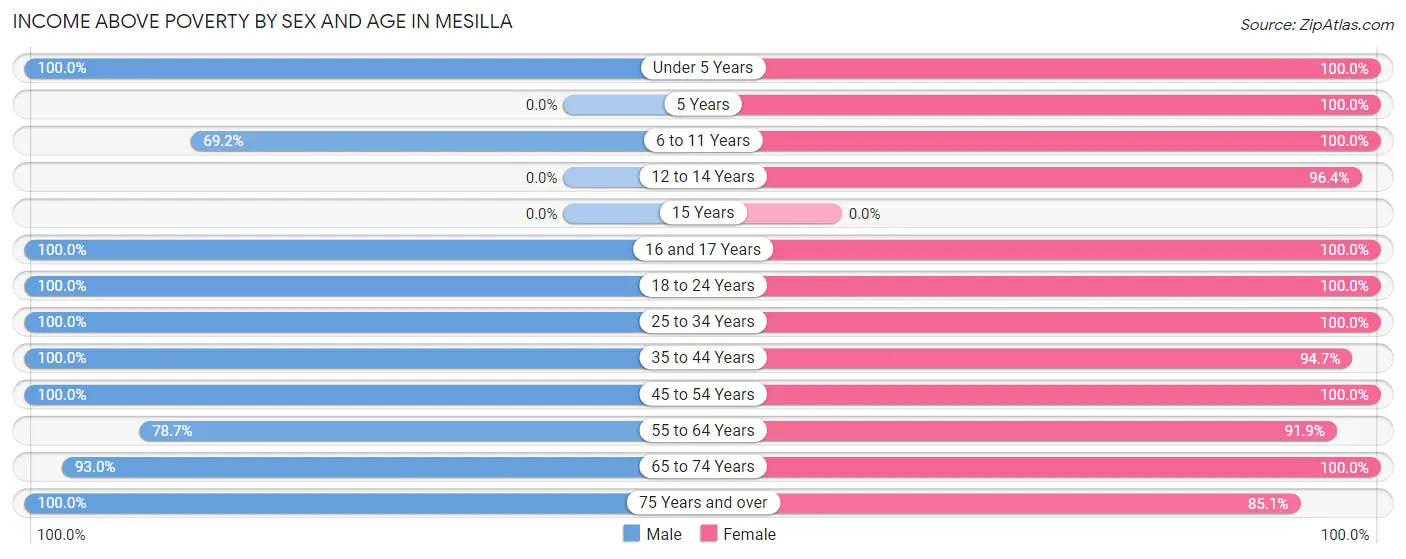
| Age Bracket | Male | Female |
| Under 5 Years | 6 (100.0%) | 14 (100.0%) |
| 5 Years | 0 (0.0%) | 16 (100.0%) |
| 6 to 11 Years | 9 (69.2%) | 88 (100.0%) |
| 12 to 14 Years | 0 (0.0%) | 54 (96.4%) |
| 15 Years | 0 (0.0%) | 0 (0.0%) |
| 16 and 17 Years | 15 (100.0%) | 24 (100.0%) |
| 18 to 24 Years | 121 (100.0%) | 90 (100.0%) |
| 25 to 34 Years | 87 (100.0%) | 19 (100.0%) |
| 35 to 44 Years | 29 (100.0%) | 72 (94.7%) |
| 45 to 54 Years | 127 (100.0%) | 103 (100.0%) |
| 55 to 64 Years | 111 (78.7%) | 192 (91.9%) |
| 65 to 74 Years | 80 (93.0%) | 77 (100.0%) |
| 75 Years and over | 40 (100.0%) | 171 (85.1%) |
| Total | 625 (92.7%) | 920 (94.6%) |
Income Below Poverty Among Married-Couple Families in Mesilla
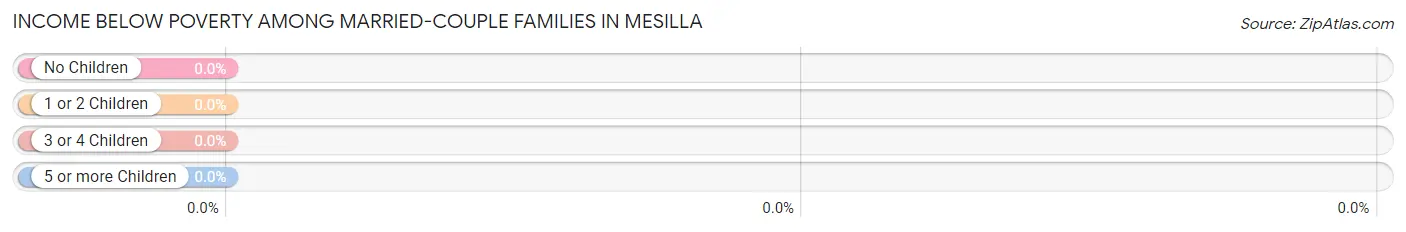
| Children | Above Poverty | Below Poverty |
| No Children | 167 (100.0%) | 0 (0.0%) |
| 1 or 2 Children | 74 (100.0%) | 0 (0.0%) |
| 3 or 4 Children | 32 (100.0%) | 0 (0.0%) |
| 5 or more Children | 0 (0.0%) | 0 (0.0%) |
| Total | 273 (100.0%) | 0 (0.0%) |
Income Below Poverty Among Single-Parent Households in Mesilla
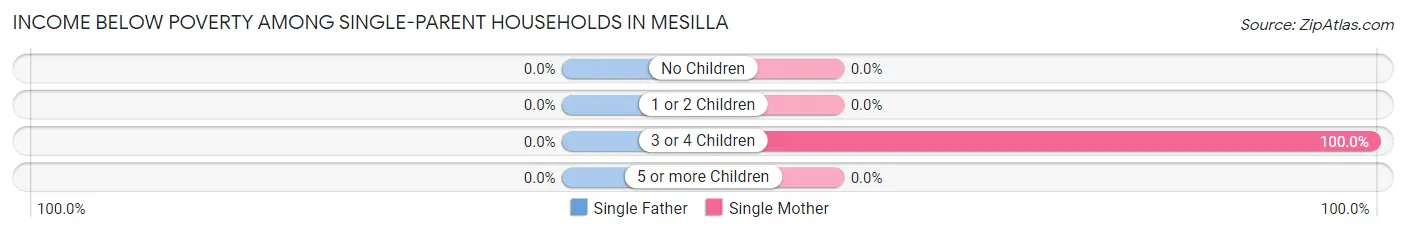
| Children | Single Father | Single Mother |
| No Children | 0 (0.0%) | 0 (0.0%) |
| 1 or 2 Children | 0 (0.0%) | 0 (0.0%) |
| 3 or 4 Children | 0 (0.0%) | 4 (100.0%) |
| 5 or more Children | 0 (0.0%) | 0 (0.0%) |
| Total | 0 (0.0%) | 4 (8.2%) |
Income Below Poverty Among Married-Couple vs Single-Parent Households in Mesilla
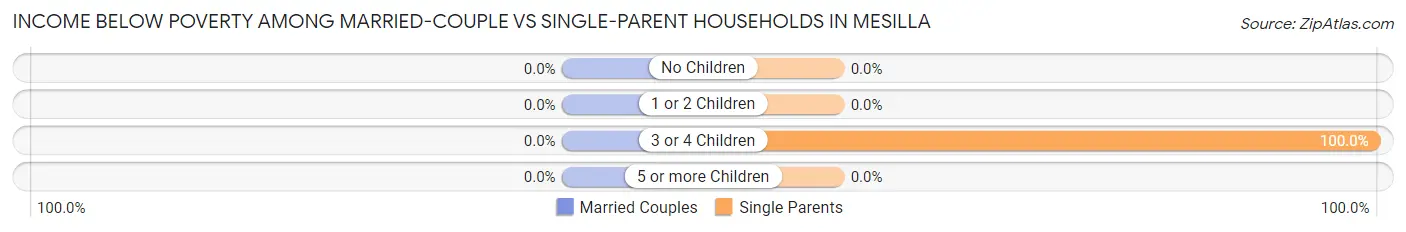
| Children | Married-Couple Families | Single-Parent Households |
| No Children | 0 (0.0%) | 0 (0.0%) |
| 1 or 2 Children | 0 (0.0%) | 0 (0.0%) |
| 3 or 4 Children | 0 (0.0%) | 4 (100.0%) |
| 5 or more Children | 0 (0.0%) | 0 (0.0%) |
| Total | 0 (0.0%) | 4 (6.1%) |
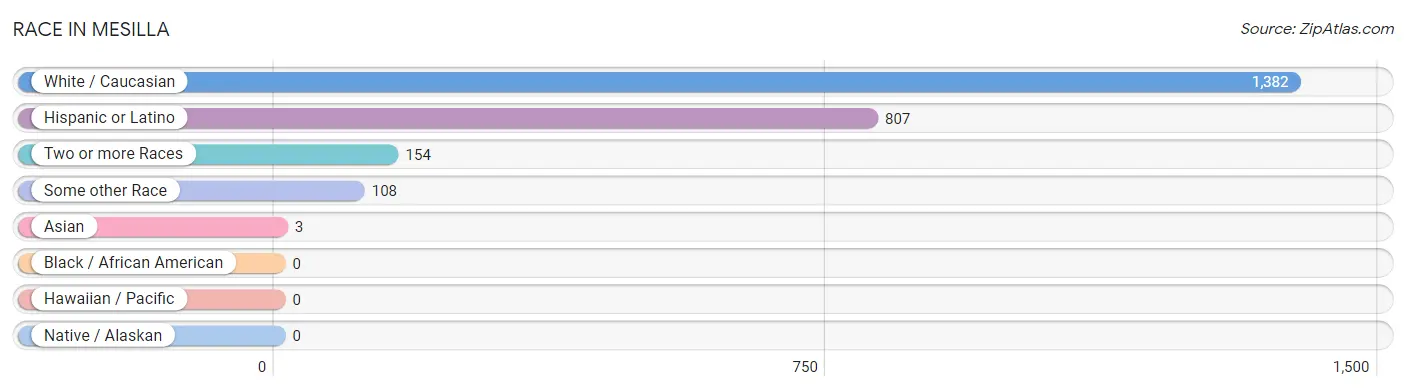
Race in Mesilla
The most populous races in Mesilla are White / Caucasian (1,382 | 83.9%), Hispanic or Latino (807 | 49.0%), and Two or more Races (154 | 9.3%).
| Race | # Population | % Population |
| Asian | 3 | 0.2% |
| Black / African American | 0 | 0.0% |
| Hawaiian / Pacific | 0 | 0.0% |
| Hispanic or Latino | 807 | 49.0% |
| Native / Alaskan | 0 | 0.0% |
| White / Caucasian | 1,382 | 83.9% |
| Two or more Races | 154 | 9.3% |
| Some other Race | 108 | 6.6% |
| Total | 1,647 | 100.0% |
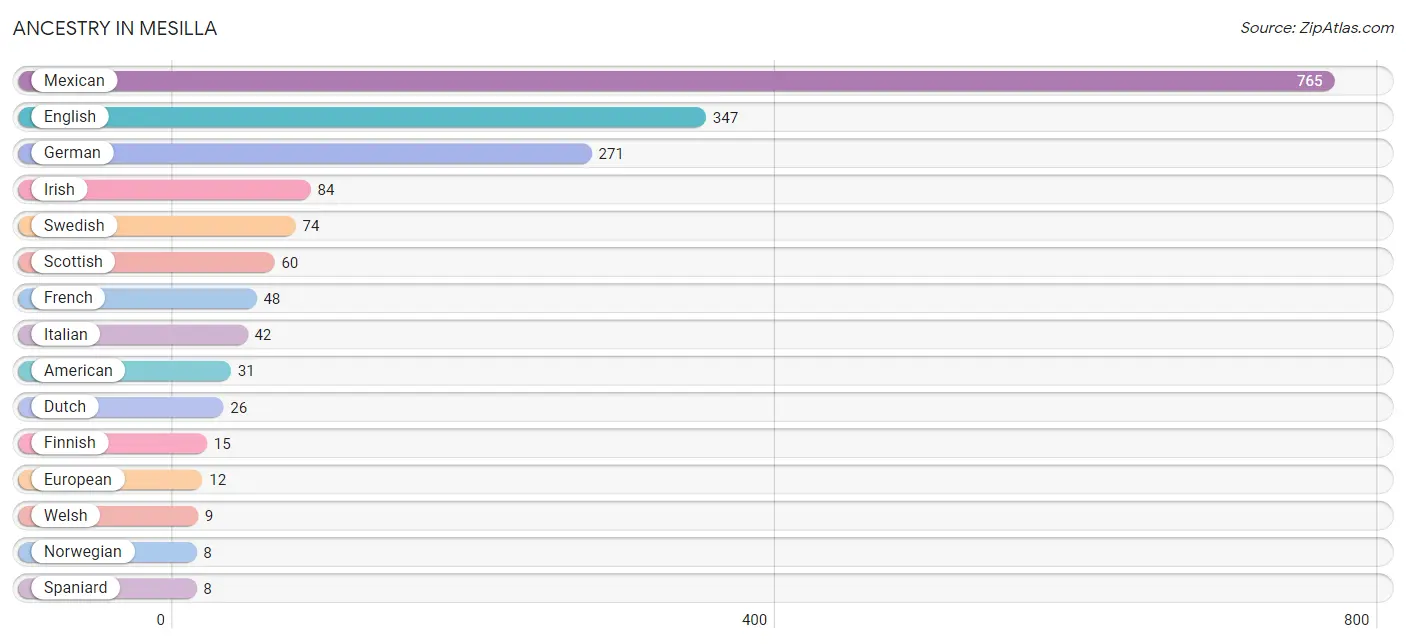
Ancestry in Mesilla
The most populous ancestries reported in Mesilla are Mexican (765 | 46.5%), English (347 | 21.1%), German (271 | 16.5%), Irish (84 | 5.1%), and Swedish (74 | 4.5%), together accounting for 93.6% of all Mesilla residents.
| Ancestry | # Population | % Population |
| American | 31 | 1.9% |
| Arab | 6 | 0.4% |
| Cherokee | 6 | 0.4% |
| Cuban | 7 | 0.4% |
| Czech | 5 | 0.3% |
| Dutch | 26 | 1.6% |
| English | 347 | 21.1% |
| European | 12 | 0.7% |
| Finnish | 15 | 0.9% |
| French | 48 | 2.9% |
| German | 271 | 16.5% |
| Irish | 84 | 5.1% |
| Italian | 42 | 2.5% |
| Jordanian | 6 | 0.4% |
| Korean | 3 | 0.2% |
| Mexican | 765 | 46.5% |
| Norwegian | 8 | 0.5% |
| Russian | 6 | 0.4% |
| Scottish | 60 | 3.6% |
| Spaniard | 8 | 0.5% |
| Swedish | 74 | 4.5% |
| Welsh | 9 | 0.5% | View All 22 Rows |
Immigrants in Mesilla
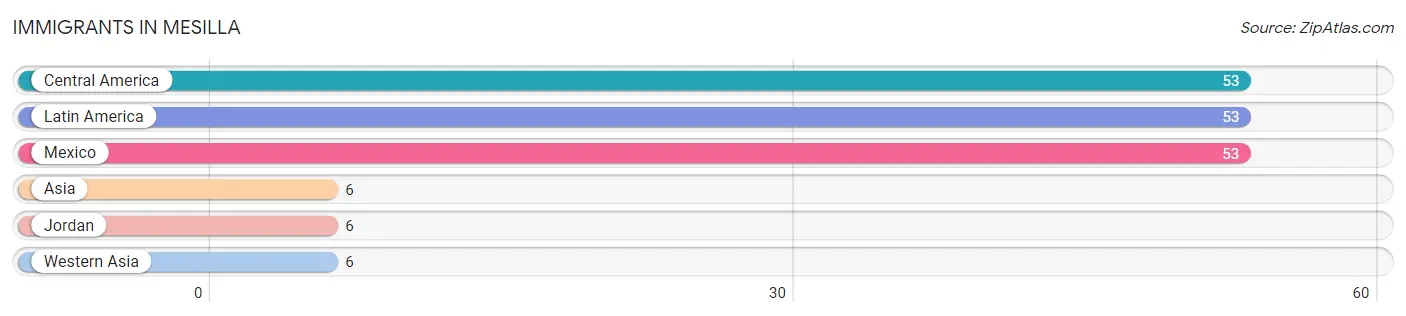
The most numerous immigrant groups reported in Mesilla came from Central America (53 | 3.2%), Latin America (53 | 3.2%), Mexico (53 | 3.2%), Asia (6 | 0.4%), and Jordan (6 | 0.4%), together accounting for 10.4% of all Mesilla residents.
| Immigration Origin | # Population | % Population |
| Asia | 6 | 0.4% |
| Central America | 53 | 3.2% |
| Jordan | 6 | 0.4% |
| Latin America | 53 | 3.2% |
| Mexico | 53 | 3.2% |
| Western Asia | 6 | 0.4% | View All 6 Rows |
Sex and Age in Mesilla
Sex and Age in Mesilla
The most populous age groups in Mesilla are 55 to 59 Years (115 | 17.1%) for men and 55 to 59 Years (112 | 11.5%) for women.
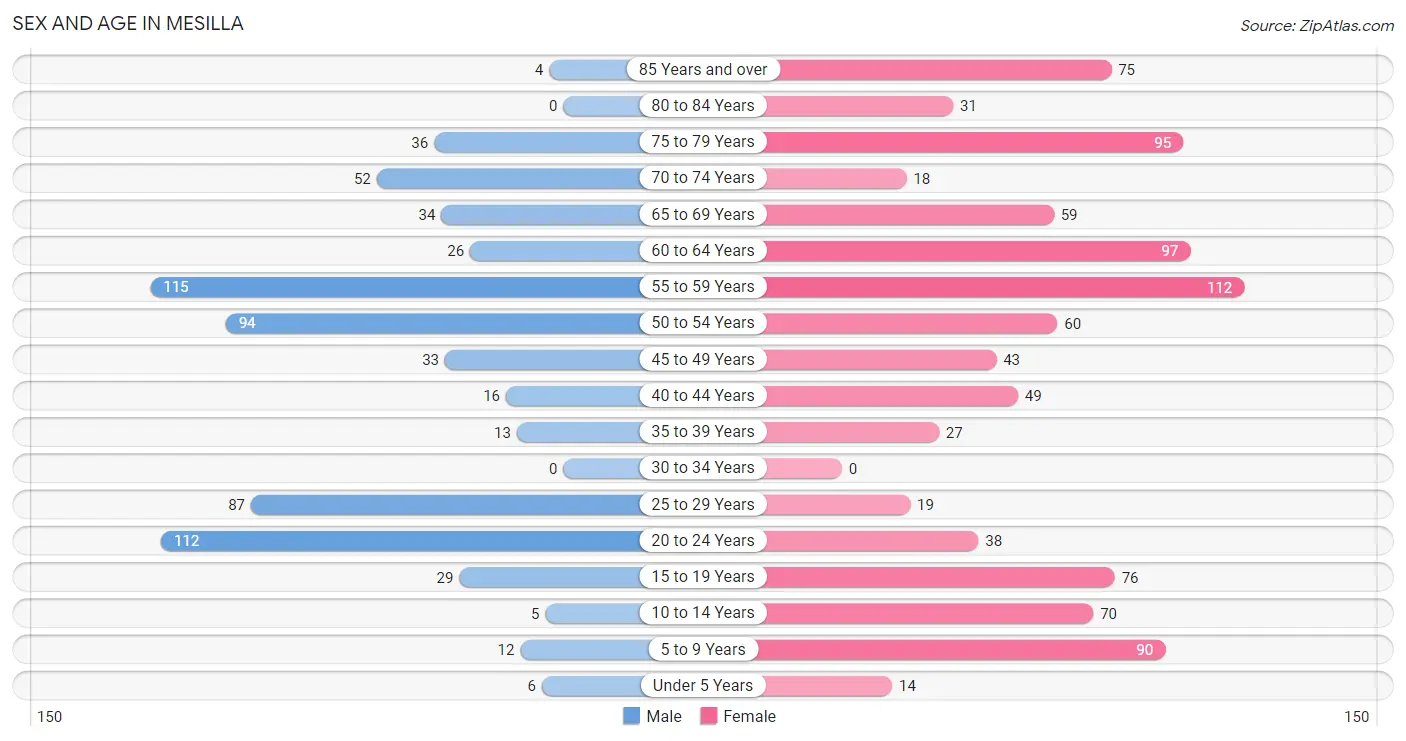
| Age Bracket | Male | Female |
| Under 5 Years | 6 (0.9%) | 14 (1.4%) |
| 5 to 9 Years | 12 (1.8%) | 90 (9.2%) |
| 10 to 14 Years | 5 (0.7%) | 70 (7.2%) |
| 15 to 19 Years | 29 (4.3%) | 76 (7.8%) |
| 20 to 24 Years | 112 (16.6%) | 38 (3.9%) |
| 25 to 29 Years | 87 (12.9%) | 19 (1.9%) |
| 30 to 34 Years | 0 (0.0%) | 0 (0.0%) |
| 35 to 39 Years | 13 (1.9%) | 27 (2.8%) |
| 40 to 44 Years | 16 (2.4%) | 49 (5.0%) |
| 45 to 49 Years | 33 (4.9%) | 43 (4.4%) |
| 50 to 54 Years | 94 (14.0%) | 60 (6.2%) |
| 55 to 59 Years | 115 (17.1%) | 112 (11.5%) |
| 60 to 64 Years | 26 (3.9%) | 97 (10.0%) |
| 65 to 69 Years | 34 (5.0%) | 59 (6.1%) |
| 70 to 74 Years | 52 (7.7%) | 18 (1.8%) |
| 75 to 79 Years | 36 (5.3%) | 95 (9.8%) |
| 80 to 84 Years | 0 (0.0%) | 31 (3.2%) |
| 85 Years and over | 4 (0.6%) | 75 (7.7%) |
| Total | 674 (100.0%) | 973 (100.0%) |
Families and Households in Mesilla
Median Family Size in Mesilla
The median family size in Mesilla is 3.40 persons per family, with married-couple families (273 | 80.5%) accounting for the largest median family size of 3.52 persons per family. On the other hand, single male/father families (17 | 5.0%) represent the smallest median family size with 2.47 persons per family.
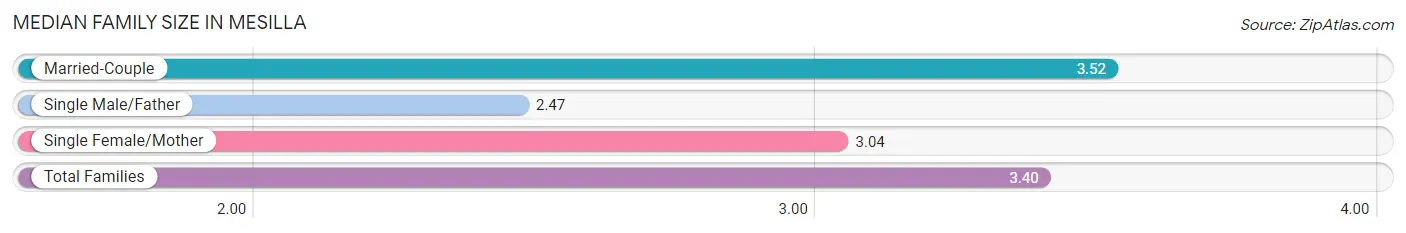
| Family Type | # Families | Family Size |
| Married-Couple | 273 (80.5%) | 3.52 |
| Single Male/Father | 17 (5.0%) | 2.47 |
| Single Female/Mother | 49 (14.4%) | 3.04 |
| Total Families | 339 (100.0%) | 3.40 |
Median Household Size in Mesilla
The median household size in Mesilla is 2.18 persons per household, with married-couple households (273 | 36.2%) accounting for the largest median household size of 3.52 persons per household. non-family households (416 | 55.1%) represent the smallest median household size with 1.13 persons per household.
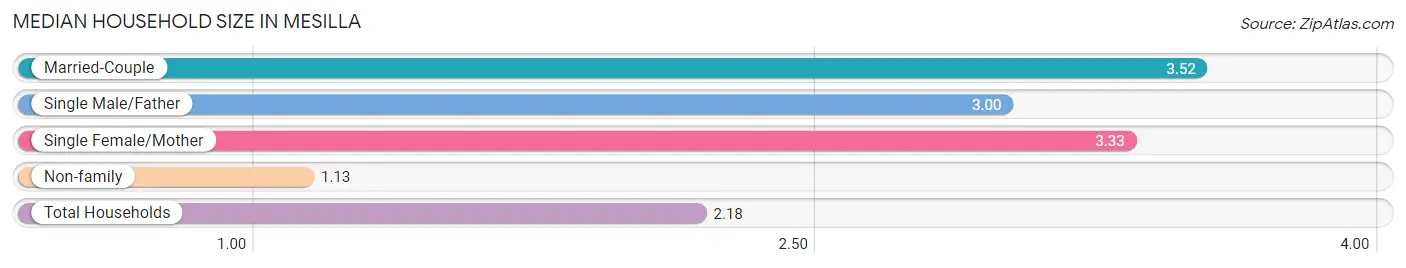
| Household Type | # Households | Household Size |
| Married-Couple | 273 (36.2%) | 3.52 |
| Single Male/Father | 17 (2.2%) | 3.00 |
| Single Female/Mother | 49 (6.5%) | 3.33 |
| Non-family | 416 (55.1%) | 1.13 |
| Total Households | 755 (100.0%) | 2.18 |
Household Size by Marriage Status in Mesilla
Out of a total of 755 households in Mesilla, 339 (44.9%) are family households, while 416 (55.1%) are nonfamily households. The most numerous type of family households are 2-person households, comprising 140, and the most common type of nonfamily households are 1-person households, comprising 372.
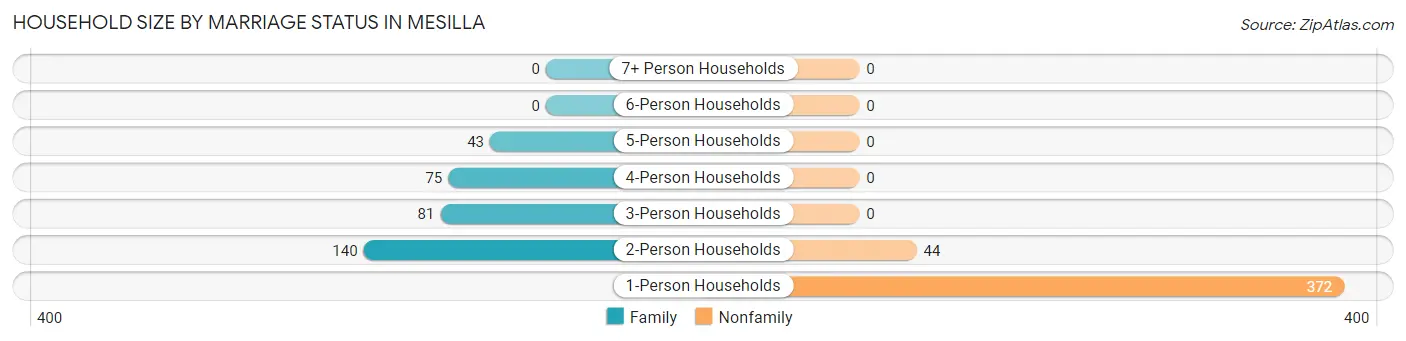
| Household Size | Family Households | Nonfamily Households |
| 1-Person Households | - | 372 (49.3%) |
| 2-Person Households | 140 (18.5%) | 44 (5.8%) |
| 3-Person Households | 81 (10.7%) | 0 (0.0%) |
| 4-Person Households | 75 (9.9%) | 0 (0.0%) |
| 5-Person Households | 43 (5.7%) | 0 (0.0%) |
| 6-Person Households | 0 (0.0%) | 0 (0.0%) |
| 7+ Person Households | 0 (0.0%) | 0 (0.0%) |
| Total | 339 (44.9%) | 416 (55.1%) |
Female Fertility in Mesilla
Fertility by Age in Mesilla
| Age Bracket | Women with Births | Births / 1,000 Women |
| 15 to 19 years | 0 (0.0%) | 0.0 |
| 20 to 34 years | 0 (0.0%) | 0.0 |
| 35 to 50 years | 0 (0.0%) | 0.0 |
| Total | 0 (0.0%) | 0.0 |
Fertility by Age by Marriage Status in Mesilla
| Age Bracket | Married | Unmarried |
| 15 to 19 years | 0 (0.0%) | 0 (0.0%) |
| 20 to 34 years | 0 (0.0%) | 0 (0.0%) |
| 35 to 50 years | 0 (0.0%) | 0 (0.0%) |
| Total | 0 (0.0%) | 0 (0.0%) |
Fertility by Education in Mesilla
| Educational Attainment | Women with Births | Births / 1,000 Women |
| Less than High School | 0 (0.0%) | 0.0 |
| High School Diploma | 0 (0.0%) | 0.0 |
| College or Associate's Degree | 0 (0.0%) | 0.0 |
| Bachelor's Degree | 0 (0.0%) | 0.0 |
| Graduate Degree | 0 (0.0%) | 0.0 |
| Total | 0 (0.0%) | 0.0 |
Fertility by Education by Marriage Status in Mesilla
| Educational Attainment | Married | Unmarried |
| Less than High School | 0 (0.0%) | 0 (0.0%) |
| High School Diploma | 0 (0.0%) | 0 (0.0%) |
| College or Associate's Degree | 0 (0.0%) | 0 (0.0%) |
| Bachelor's Degree | 0 (0.0%) | 0 (0.0%) |
| Graduate Degree | 0 (0.0%) | 0 (0.0%) |
| Total | 0 (0.0%) | 0 (0.0%) |
Employment Characteristics in Mesilla
Employment by Class of Employer in Mesilla
Among the 725 employed individuals in Mesilla, private company employees (367 | 50.6%), self-employed (incorporated) (83 | 11.5%), and local government employees (68 | 9.4%) make up the most common classes of employment.
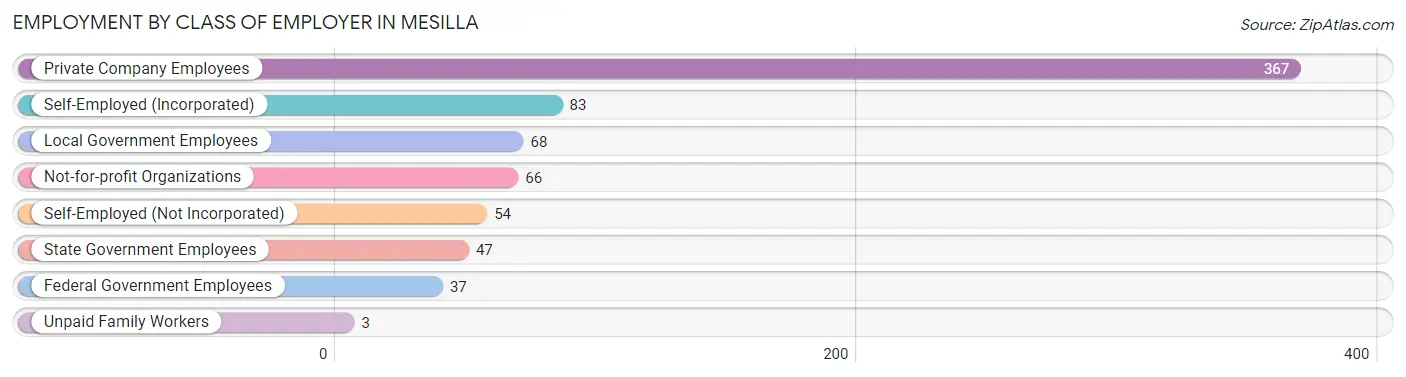
| Employer Class | # Employees | % Employees |
| Private Company Employees | 367 | 50.6% |
| Self-Employed (Incorporated) | 83 | 11.5% |
| Self-Employed (Not Incorporated) | 54 | 7.4% |
| Not-for-profit Organizations | 66 | 9.1% |
| Local Government Employees | 68 | 9.4% |
| State Government Employees | 47 | 6.5% |
| Federal Government Employees | 37 | 5.1% |
| Unpaid Family Workers | 3 | 0.4% |
| Total | 725 | 100.0% |
Employment Status by Age in Mesilla
According to the labor force statistics for Mesilla, out of the total population over 16 years of age (1,445), 53.8% or 777 individuals are in the labor force, with 1.3% or 10 of them unemployed. The age group with the highest labor force participation rate is 35 to 44 years, with 100.0% or 105 individuals in the labor force. Within the labor force, the 20 to 24 years age range has the highest percentage of unemployed individuals, with 10.1% or 10 of them being unemployed.
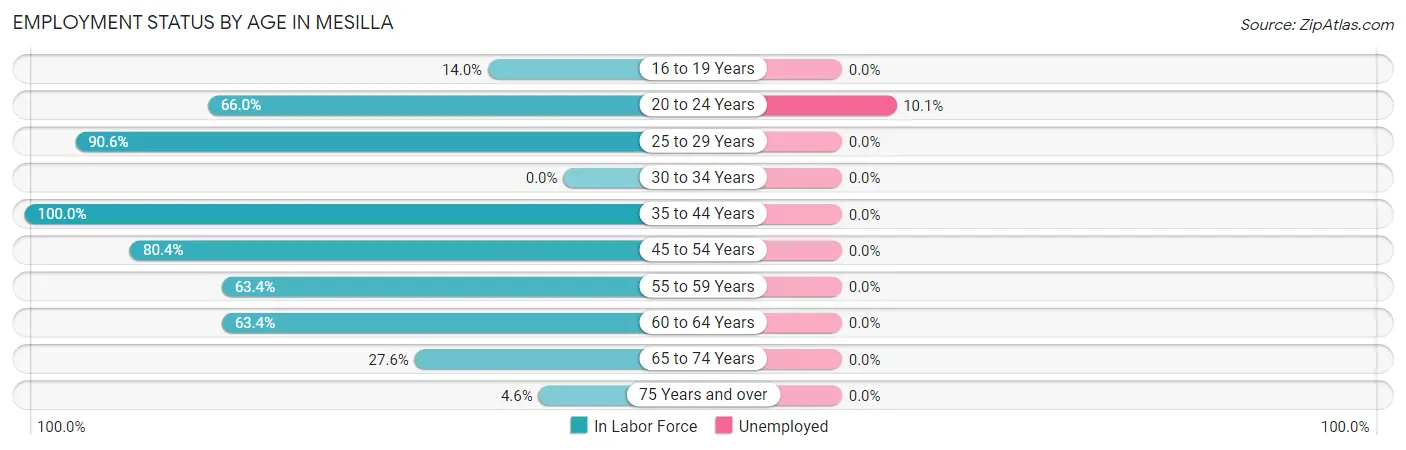
| Age Bracket | In Labor Force | Unemployed |
| 16 to 19 Years | 14 (14.0%) | 0 (0.0%) |
| 20 to 24 Years | 99 (66.0%) | 10 (10.1%) |
| 25 to 29 Years | 96 (90.6%) | 0 (0.0%) |
| 30 to 34 Years | 0 (0.0%) | 0 (0.0%) |
| 35 to 44 Years | 105 (100.0%) | 0 (0.0%) |
| 45 to 54 Years | 185 (80.4%) | 0 (0.0%) |
| 55 to 59 Years | 144 (63.4%) | 0 (0.0%) |
| 60 to 64 Years | 78 (63.4%) | 0 (0.0%) |
| 65 to 74 Years | 45 (27.6%) | 0 (0.0%) |
| 75 Years and over | 11 (4.6%) | 0 (0.0%) |
| Total | 777 (53.8%) | 10 (1.3%) |
Employment Status by Educational Attainment in Mesilla
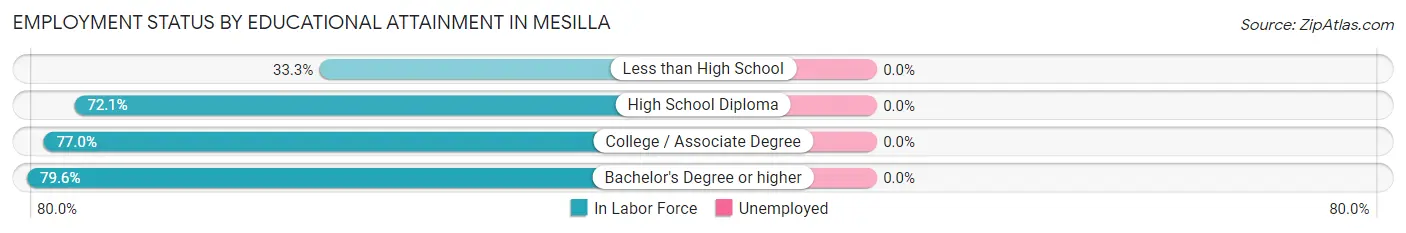
| Educational Attainment | In Labor Force | Unemployed |
| Less than High School | 4 (33.3%) | 0 (0.0%) |
| High School Diploma | 119 (72.1%) | 0 (0.0%) |
| College / Associate Degree | 114 (77.0%) | 0 (0.0%) |
| Bachelor's Degree or higher | 371 (79.6%) | 0 (0.0%) |
| Total | 608 (76.9%) | 0 (0.0%) |
Employment Occupations by Sex in Mesilla
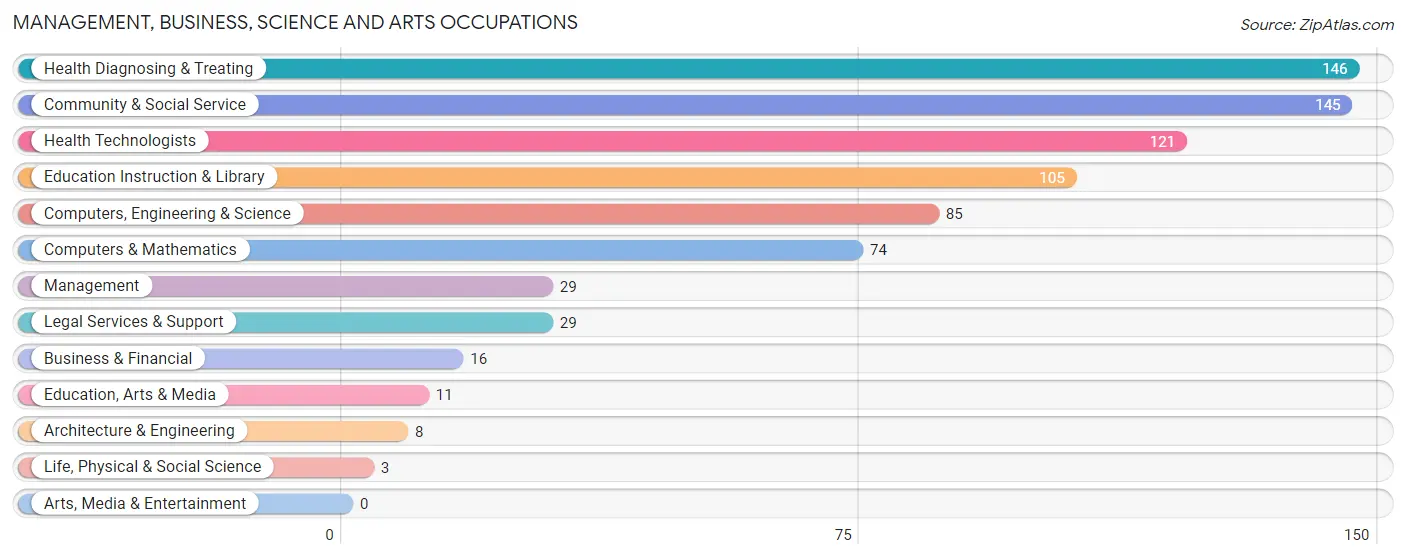
Management, Business, Science and Arts Occupations
The most common Management, Business, Science and Arts occupations in Mesilla are Health Diagnosing & Treating (146 | 19.0%), Community & Social Service (145 | 18.9%), Health Technologists (121 | 15.8%), Education Instruction & Library (105 | 13.7%), and Computers, Engineering & Science (85 | 11.1%).
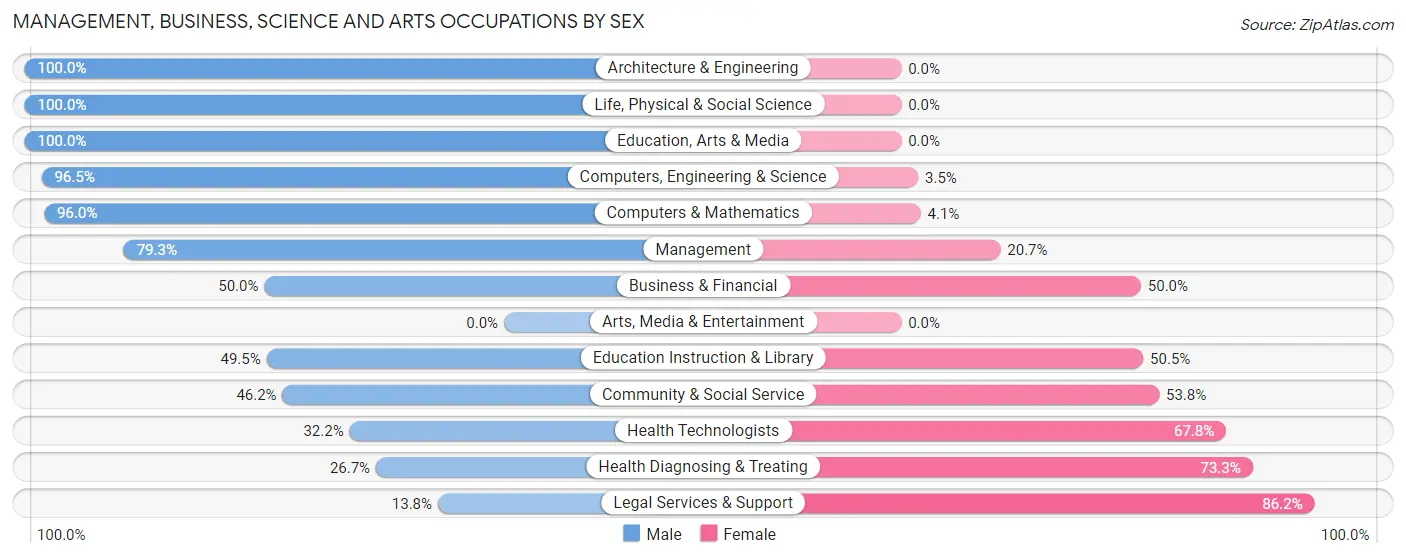
Management, Business, Science and Arts Occupations by Sex
Within the Management, Business, Science and Arts occupations in Mesilla, the most male-oriented occupations are Architecture & Engineering (100.0%), Life, Physical & Social Science (100.0%), and Education, Arts & Media (100.0%), while the most female-oriented occupations are Legal Services & Support (86.2%), Health Diagnosing & Treating (73.3%), and Health Technologists (67.8%).
| Occupation | Male | Female |
| Management | 23 (79.3%) | 6 (20.7%) |
| Business & Financial | 8 (50.0%) | 8 (50.0%) |
| Computers, Engineering & Science | 82 (96.5%) | 3 (3.5%) |
| Computers & Mathematics | 71 (96.0%) | 3 (4.1%) |
| Architecture & Engineering | 8 (100.0%) | 0 (0.0%) |
| Life, Physical & Social Science | 3 (100.0%) | 0 (0.0%) |
| Community & Social Service | 67 (46.2%) | 78 (53.8%) |
| Education, Arts & Media | 11 (100.0%) | 0 (0.0%) |
| Legal Services & Support | 4 (13.8%) | 25 (86.2%) |
| Education Instruction & Library | 52 (49.5%) | 53 (50.5%) |
| Arts, Media & Entertainment | 0 (0.0%) | 0 (0.0%) |
| Health Diagnosing & Treating | 39 (26.7%) | 107 (73.3%) |
| Health Technologists | 39 (32.2%) | 82 (67.8%) |
| Total (Category) | 219 (52.0%) | 202 (48.0%) |
| Total (Overall) | 426 (55.5%) | 341 (44.5%) |
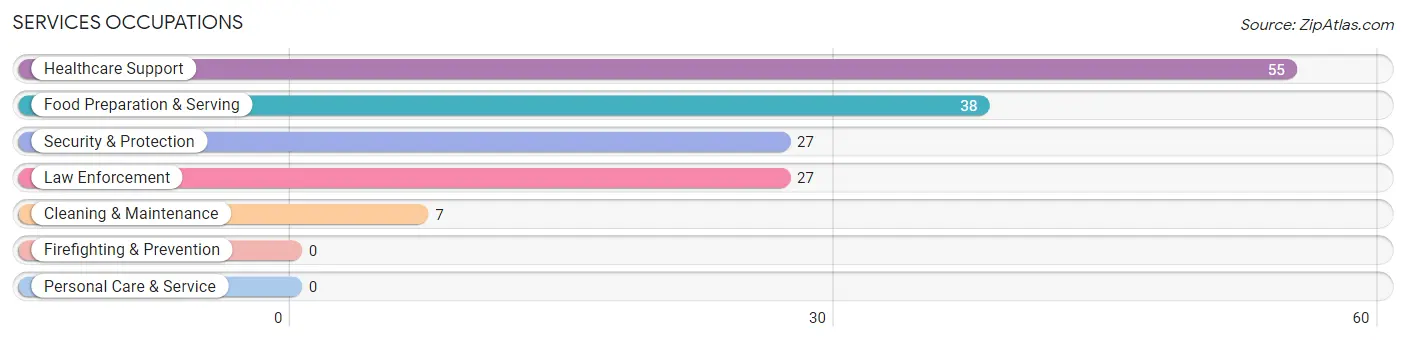
Services Occupations
The most common Services occupations in Mesilla are Healthcare Support (55 | 7.2%), Food Preparation & Serving (38 | 5.0%), Security & Protection (27 | 3.5%), Law Enforcement (27 | 3.5%), and Cleaning & Maintenance (7 | 0.9%).
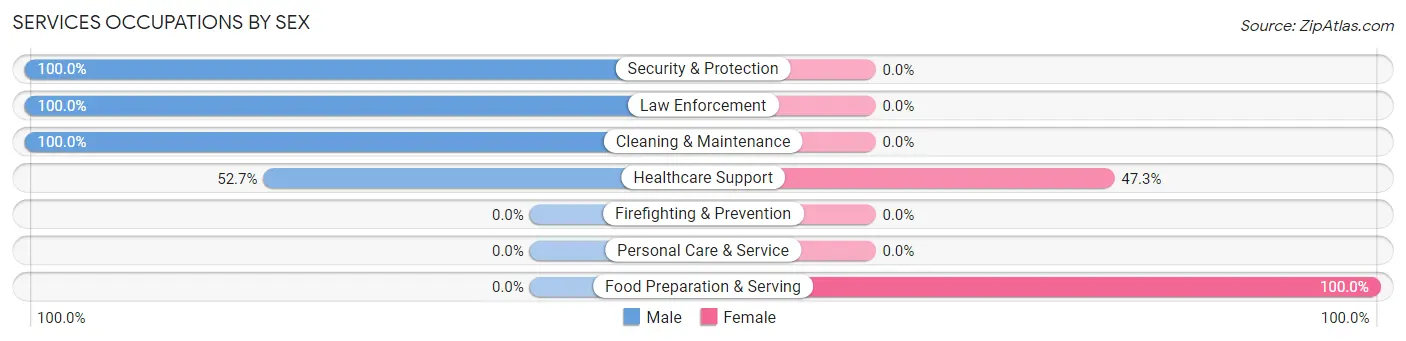
Services Occupations by Sex
Within the Services occupations in Mesilla, the most male-oriented occupations are Security & Protection (100.0%), Law Enforcement (100.0%), and Cleaning & Maintenance (100.0%), while the most female-oriented occupations are Food Preparation & Serving (100.0%), and Healthcare Support (47.3%).
| Occupation | Male | Female |
| Healthcare Support | 29 (52.7%) | 26 (47.3%) |
| Security & Protection | 27 (100.0%) | 0 (0.0%) |
| Firefighting & Prevention | 0 (0.0%) | 0 (0.0%) |
| Law Enforcement | 27 (100.0%) | 0 (0.0%) |
| Food Preparation & Serving | 0 (0.0%) | 38 (100.0%) |
| Cleaning & Maintenance | 7 (100.0%) | 0 (0.0%) |
| Personal Care & Service | 0 (0.0%) | 0 (0.0%) |
| Total (Category) | 63 (49.6%) | 64 (50.4%) |
| Total (Overall) | 426 (55.5%) | 341 (44.5%) |
Sales and Office Occupations
The most common Sales and Office occupations in Mesilla are Sales & Related (57 | 7.4%), and Office & Administration (57 | 7.4%).

Sales and Office Occupations by Sex

| Occupation | Male | Female |
| Sales & Related | 57 (100.0%) | 0 (0.0%) |
| Office & Administration | 0 (0.0%) | 57 (100.0%) |
| Total (Category) | 57 (50.0%) | 57 (50.0%) |
| Total (Overall) | 426 (55.5%) | 341 (44.5%) |
Natural Resources, Construction and Maintenance Occupations
The most common Natural Resources, Construction and Maintenance occupations in Mesilla are Installation, Maintenance & Repair (13 | 1.7%), and Construction & Extraction (8 | 1.0%).

Natural Resources, Construction and Maintenance Occupations by Sex

| Occupation | Male | Female |
| Farming, Fishing & Forestry | 0 (0.0%) | 0 (0.0%) |
| Construction & Extraction | 8 (100.0%) | 0 (0.0%) |
| Installation, Maintenance & Repair | 13 (100.0%) | 0 (0.0%) |
| Total (Category) | 21 (100.0%) | 0 (0.0%) |
| Total (Overall) | 426 (55.5%) | 341 (44.5%) |
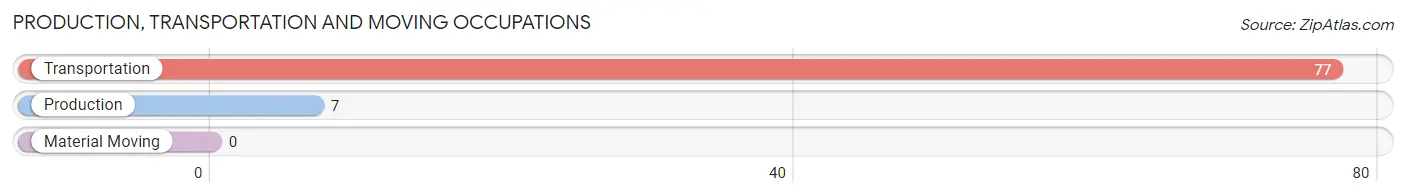
Production, Transportation and Moving Occupations
The most common Production, Transportation and Moving occupations in Mesilla are Transportation (77 | 10.0%), and Production (7 | 0.9%).
Production, Transportation and Moving Occupations by Sex
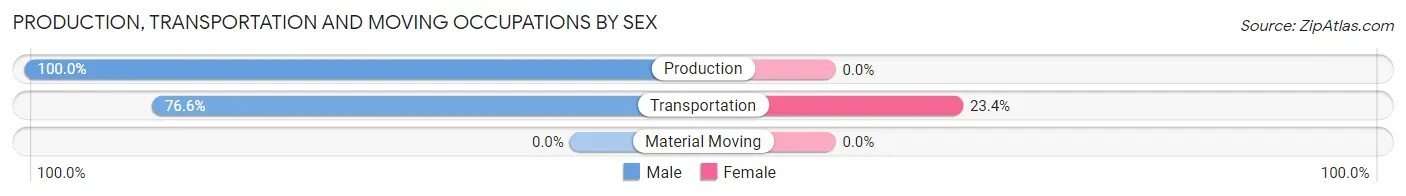
| Occupation | Male | Female |
| Production | 7 (100.0%) | 0 (0.0%) |
| Transportation | 59 (76.6%) | 18 (23.4%) |
| Material Moving | 0 (0.0%) | 0 (0.0%) |
| Total (Category) | 66 (78.6%) | 18 (21.4%) |
| Total (Overall) | 426 (55.5%) | 341 (44.5%) |
Employment Industries by Sex in Mesilla
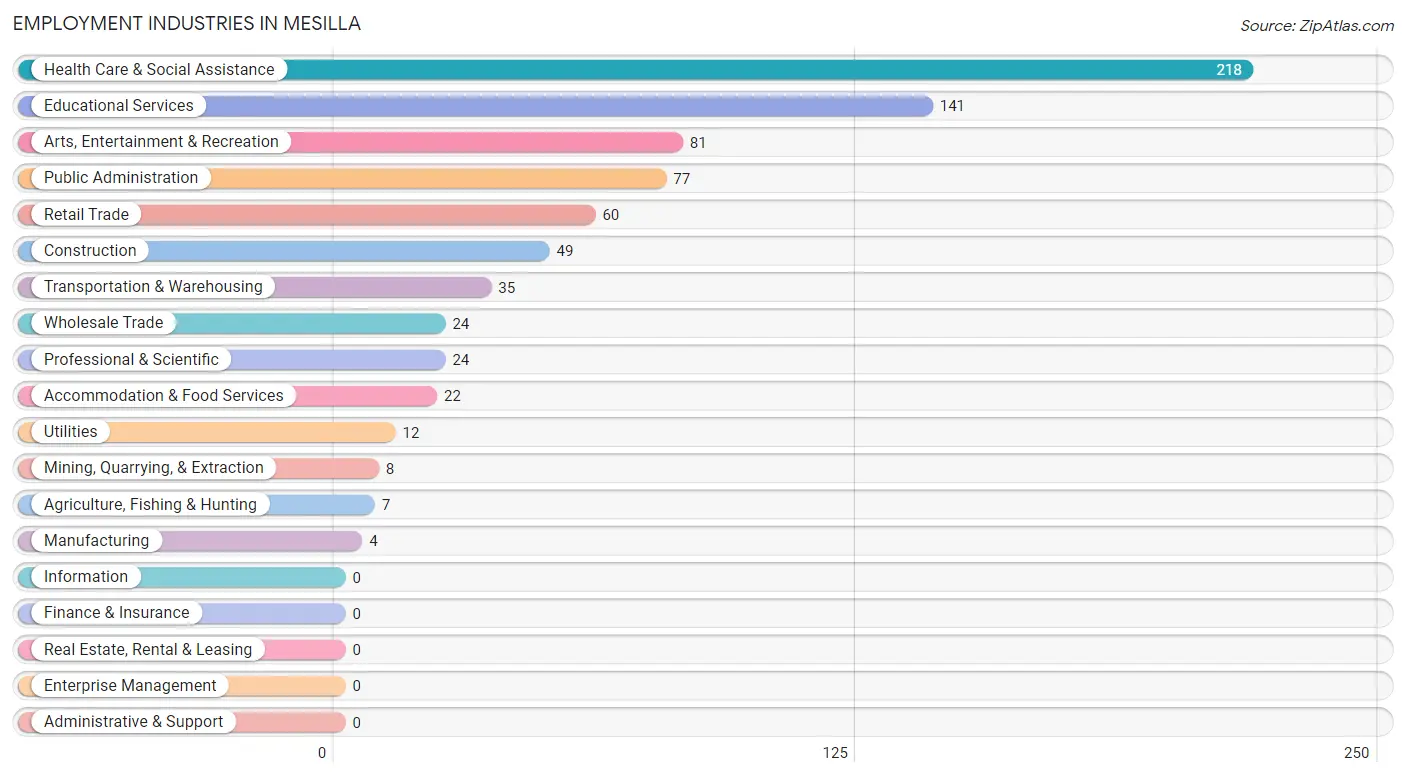
Employment Industries in Mesilla
The major employment industries in Mesilla include Health Care & Social Assistance (218 | 28.4%), Educational Services (141 | 18.4%), Arts, Entertainment & Recreation (81 | 10.6%), Public Administration (77 | 10.0%), and Retail Trade (60 | 7.8%).
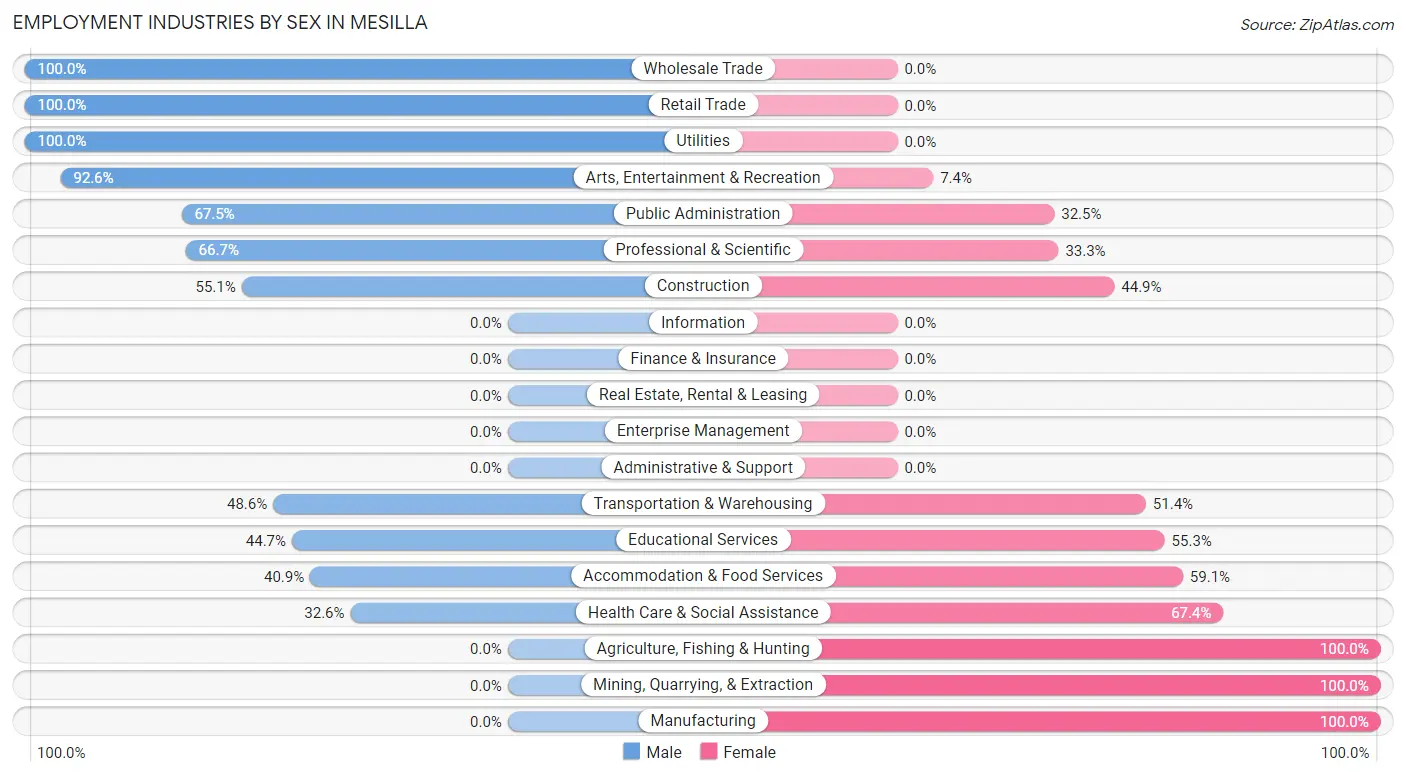
Employment Industries by Sex in Mesilla
The Mesilla industries that see more men than women are Wholesale Trade (100.0%), Retail Trade (100.0%), and Utilities (100.0%), whereas the industries that tend to have a higher number of women are Agriculture, Fishing & Hunting (100.0%), Mining, Quarrying, & Extraction (100.0%), and Manufacturing (100.0%).
| Industry | Male | Female |
| Agriculture, Fishing & Hunting | 0 (0.0%) | 7 (100.0%) |
| Mining, Quarrying, & Extraction | 0 (0.0%) | 8 (100.0%) |
| Construction | 27 (55.1%) | 22 (44.9%) |
| Manufacturing | 0 (0.0%) | 4 (100.0%) |
| Wholesale Trade | 24 (100.0%) | 0 (0.0%) |
| Retail Trade | 60 (100.0%) | 0 (0.0%) |
| Transportation & Warehousing | 17 (48.6%) | 18 (51.4%) |
| Utilities | 12 (100.0%) | 0 (0.0%) |
| Information | 0 (0.0%) | 0 (0.0%) |
| Finance & Insurance | 0 (0.0%) | 0 (0.0%) |
| Real Estate, Rental & Leasing | 0 (0.0%) | 0 (0.0%) |
| Professional & Scientific | 16 (66.7%) | 8 (33.3%) |
| Enterprise Management | 0 (0.0%) | 0 (0.0%) |
| Administrative & Support | 0 (0.0%) | 0 (0.0%) |
| Educational Services | 63 (44.7%) | 78 (55.3%) |
| Health Care & Social Assistance | 71 (32.6%) | 147 (67.4%) |
| Arts, Entertainment & Recreation | 75 (92.6%) | 6 (7.4%) |
| Accommodation & Food Services | 9 (40.9%) | 13 (59.1%) |
| Public Administration | 52 (67.5%) | 25 (32.5%) |
| Total | 426 (55.5%) | 341 (44.5%) |
Education in Mesilla
School Enrollment in Mesilla
The most common levels of schooling among the 413 students in Mesilla are high school (105 | 25.4%), elementary school (83 | 20.1%), and graduate / professional (74 | 17.9%).
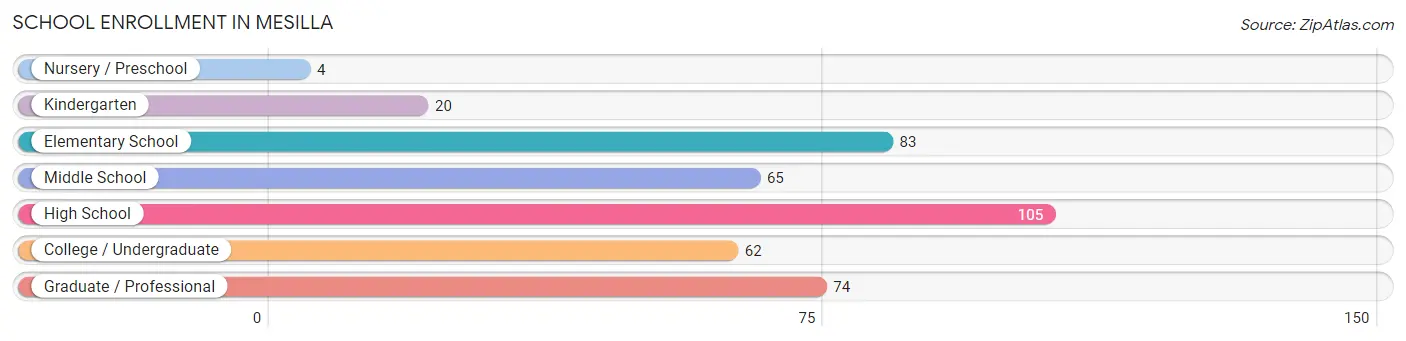
| School Level | # Students | % Students |
| Nursery / Preschool | 4 | 1.0% |
| Kindergarten | 20 | 4.8% |
| Elementary School | 83 | 20.1% |
| Middle School | 65 | 15.7% |
| High School | 105 | 25.4% |
| College / Undergraduate | 62 | 15.0% |
| Graduate / Professional | 74 | 17.9% |
| Total | 413 | 100.0% |
School Enrollment by Age by Funding Source in Mesilla
Out of a total of 413 students who are enrolled in schools in Mesilla, 127 (30.8%) attend a private institution, while the remaining 286 (69.2%) are enrolled in public schools. The age group of 5 to 9 year old has the highest likelihood of being enrolled in private schools, with 76 (74.5% in the age bracket) enrolled. Conversely, the age group of 15 to 17 year olds has the lowest likelihood of being enrolled in a private school, with 44 (100.0% in the age bracket) attending a public institution.
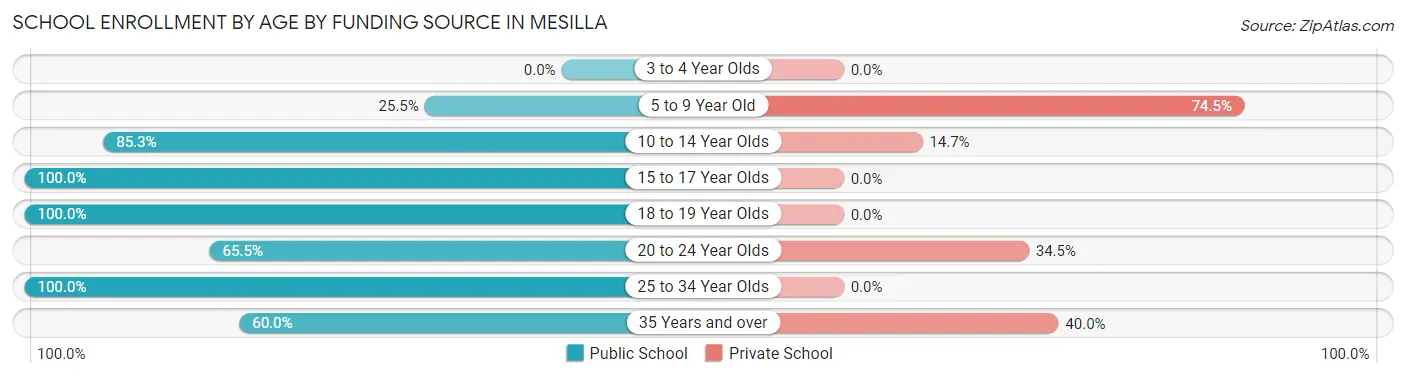
| Age Bracket | Public School | Private School |
| 3 to 4 Year Olds | 0 (0.0%) | 0 (0.0%) |
| 5 to 9 Year Old | 26 (25.5%) | 76 (74.5%) |
| 10 to 14 Year Olds | 64 (85.3%) | 11 (14.7%) |
| 15 to 17 Year Olds | 44 (100.0%) | 0 (0.0%) |
| 18 to 19 Year Olds | 56 (100.0%) | 0 (0.0%) |
| 20 to 24 Year Olds | 57 (65.5%) | 30 (34.5%) |
| 25 to 34 Year Olds | 24 (100.0%) | 0 (0.0%) |
| 35 Years and over | 15 (60.0%) | 10 (40.0%) |
| Total | 286 (69.2%) | 127 (30.8%) |
Educational Attainment by Field of Study in Mesilla
Science & technology (113 | 18.9%), computers & mathematics (90 | 15.1%), bio, nature & agricultural (71 | 11.9%), business (61 | 10.2%), and social sciences (59 | 9.9%) are the most common fields of study among 597 individuals in Mesilla who have obtained a bachelor's degree or higher.
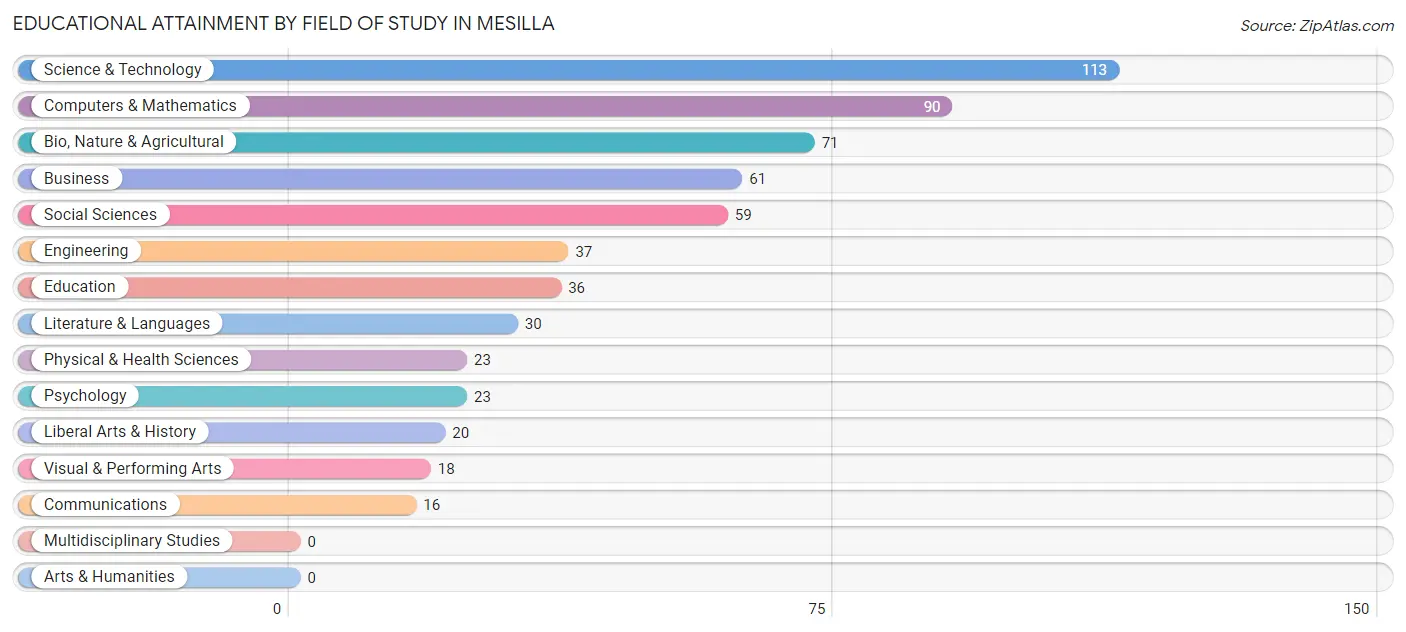
| Field of Study | # Graduates | % Graduates |
| Computers & Mathematics | 90 | 15.1% |
| Bio, Nature & Agricultural | 71 | 11.9% |
| Physical & Health Sciences | 23 | 3.8% |
| Psychology | 23 | 3.8% |
| Social Sciences | 59 | 9.9% |
| Engineering | 37 | 6.2% |
| Multidisciplinary Studies | 0 | 0.0% |
| Science & Technology | 113 | 18.9% |
| Business | 61 | 10.2% |
| Education | 36 | 6.0% |
| Literature & Languages | 30 | 5.0% |
| Liberal Arts & History | 20 | 3.4% |
| Visual & Performing Arts | 18 | 3.0% |
| Communications | 16 | 2.7% |
| Arts & Humanities | 0 | 0.0% |
| Total | 597 | 100.0% |
Transportation & Commute in Mesilla
Vehicle Availability by Sex in Mesilla
The most prevalent vehicle ownership categories in Mesilla are males with 2 vehicles (131, accounting for 34.1%) and females with 2 vehicles (89, making up 38.4%).
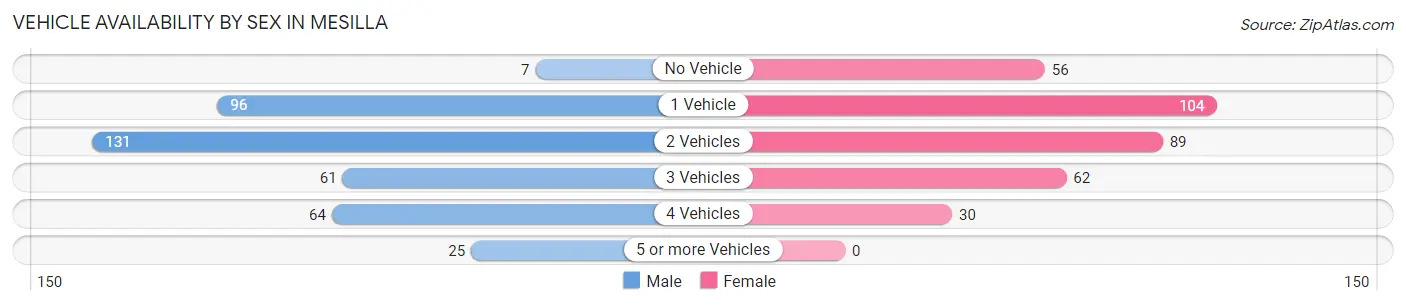
| Vehicles Available | Male | Female |
| No Vehicle | 7 (1.8%) | 56 (16.4%) |
| 1 Vehicle | 96 (25.0%) | 104 (30.5%) |
| 2 Vehicles | 131 (34.1%) | 89 (26.1%) |
| 3 Vehicles | 61 (15.9%) | 62 (18.2%) |
| 4 Vehicles | 64 (16.7%) | 30 (8.8%) |
| 5 or more Vehicles | 25 (6.5%) | 0 (0.0%) |
| Total | 384 (100.0%) | 341 (100.0%) |
Commute Time in Mesilla
The most frequently occuring commute durations in Mesilla are 10 to 14 minutes (162 commuters, 29.1%), 15 to 19 minutes (113 commuters, 20.3%), and 20 to 24 minutes (93 commuters, 16.7%).
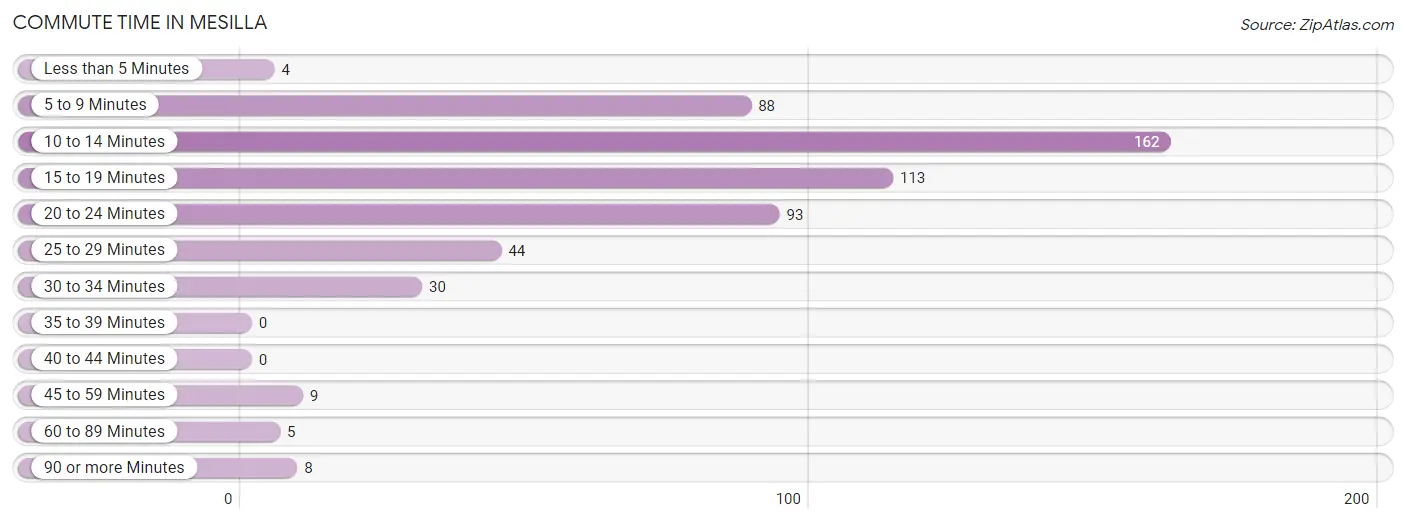
| Commute Time | # Commuters | % Commuters |
| Less than 5 Minutes | 4 | 0.7% |
| 5 to 9 Minutes | 88 | 15.8% |
| 10 to 14 Minutes | 162 | 29.1% |
| 15 to 19 Minutes | 113 | 20.3% |
| 20 to 24 Minutes | 93 | 16.7% |
| 25 to 29 Minutes | 44 | 7.9% |
| 30 to 34 Minutes | 30 | 5.4% |
| 35 to 39 Minutes | 0 | 0.0% |
| 40 to 44 Minutes | 0 | 0.0% |
| 45 to 59 Minutes | 9 | 1.6% |
| 60 to 89 Minutes | 5 | 0.9% |
| 90 or more Minutes | 8 | 1.4% |
Commute Time by Sex in Mesilla
The most common commute times in Mesilla are 15 to 19 minutes (86 commuters, 34.3%) for males and 10 to 14 minutes (96 commuters, 31.5%) for females.
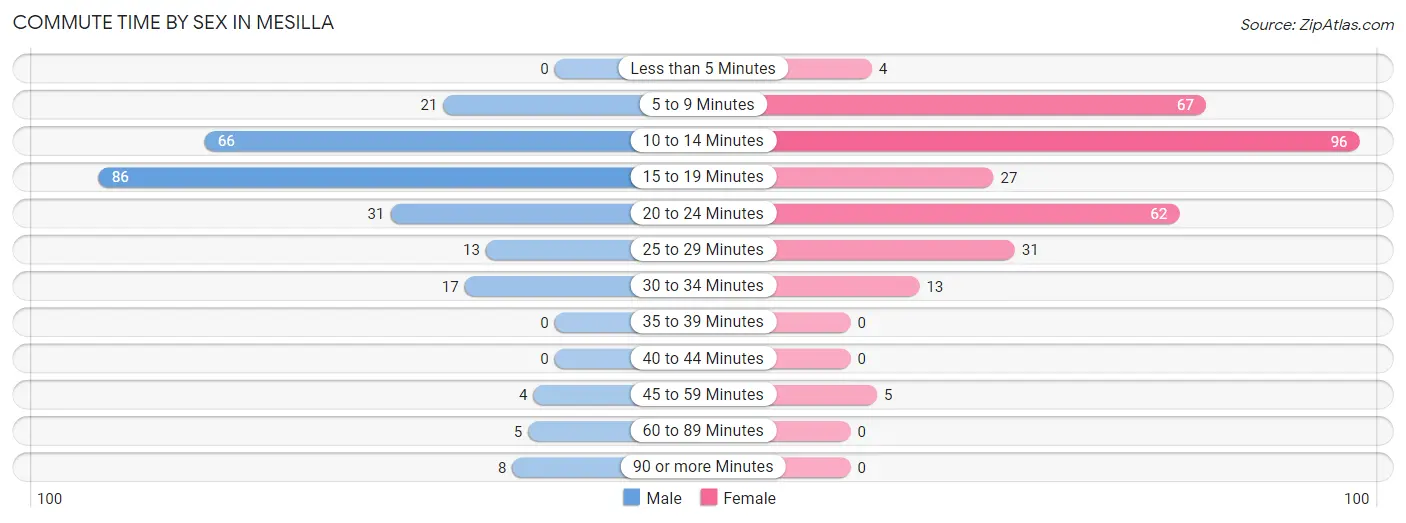
| Commute Time | Male | Female |
| Less than 5 Minutes | 0 (0.0%) | 4 (1.3%) |
| 5 to 9 Minutes | 21 (8.4%) | 67 (22.0%) |
| 10 to 14 Minutes | 66 (26.3%) | 96 (31.5%) |
| 15 to 19 Minutes | 86 (34.3%) | 27 (8.8%) |
| 20 to 24 Minutes | 31 (12.3%) | 62 (20.3%) |
| 25 to 29 Minutes | 13 (5.2%) | 31 (10.2%) |
| 30 to 34 Minutes | 17 (6.8%) | 13 (4.3%) |
| 35 to 39 Minutes | 0 (0.0%) | 0 (0.0%) |
| 40 to 44 Minutes | 0 (0.0%) | 0 (0.0%) |
| 45 to 59 Minutes | 4 (1.6%) | 5 (1.6%) |
| 60 to 89 Minutes | 5 (2.0%) | 0 (0.0%) |
| 90 or more Minutes | 8 (3.2%) | 0 (0.0%) |
Time of Departure to Work by Sex in Mesilla
The most frequent times of departure to work in Mesilla are 8:00 AM to 8:29 AM (56, 22.3%) for males and 7:30 AM to 7:59 AM (84, 27.5%) for females.
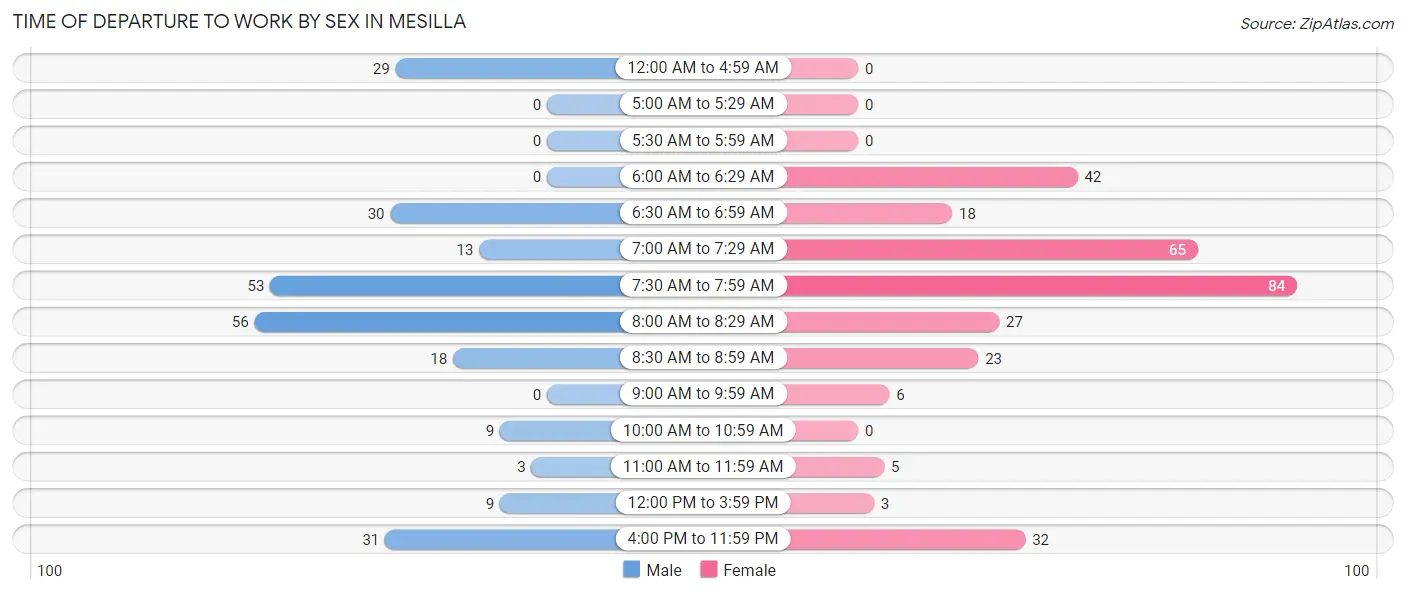
| Time of Departure | Male | Female |
| 12:00 AM to 4:59 AM | 29 (11.6%) | 0 (0.0%) |
| 5:00 AM to 5:29 AM | 0 (0.0%) | 0 (0.0%) |
| 5:30 AM to 5:59 AM | 0 (0.0%) | 0 (0.0%) |
| 6:00 AM to 6:29 AM | 0 (0.0%) | 42 (13.8%) |
| 6:30 AM to 6:59 AM | 30 (11.9%) | 18 (5.9%) |
| 7:00 AM to 7:29 AM | 13 (5.2%) | 65 (21.3%) |
| 7:30 AM to 7:59 AM | 53 (21.1%) | 84 (27.5%) |
| 8:00 AM to 8:29 AM | 56 (22.3%) | 27 (8.8%) |
| 8:30 AM to 8:59 AM | 18 (7.2%) | 23 (7.5%) |
| 9:00 AM to 9:59 AM | 0 (0.0%) | 6 (2.0%) |
| 10:00 AM to 10:59 AM | 9 (3.6%) | 0 (0.0%) |
| 11:00 AM to 11:59 AM | 3 (1.2%) | 5 (1.6%) |
| 12:00 PM to 3:59 PM | 9 (3.6%) | 3 (1.0%) |
| 4:00 PM to 11:59 PM | 31 (12.3%) | 32 (10.5%) |
| Total | 251 (100.0%) | 305 (100.0%) |
Housing Occupancy in Mesilla
Occupancy by Ownership in Mesilla
Of the total 755 dwellings in Mesilla, owner-occupied units account for 515 (68.2%), while renter-occupied units make up 240 (31.8%).
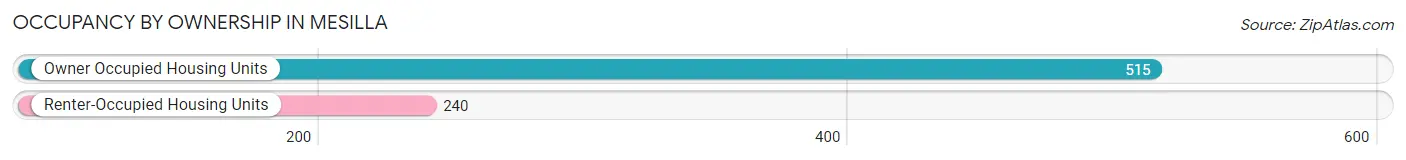
| Occupancy | # Housing Units | % Housing Units |
| Owner Occupied Housing Units | 515 | 68.2% |
| Renter-Occupied Housing Units | 240 | 31.8% |
| Total Occupied Housing Units | 755 | 100.0% |
Occupancy by Household Size in Mesilla
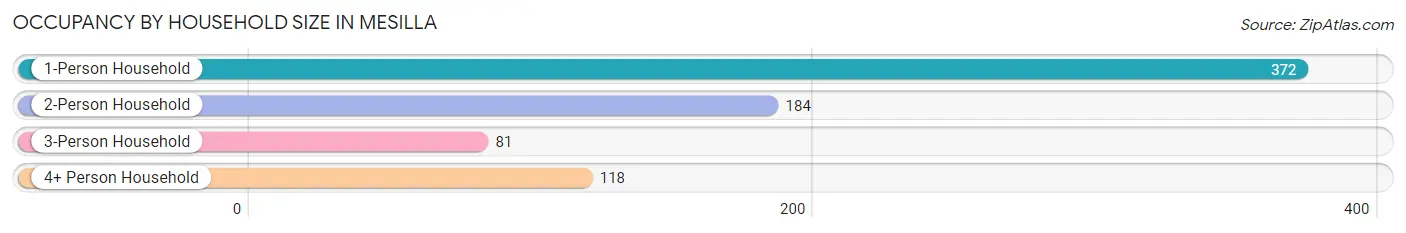
| Household Size | # Housing Units | % Housing Units |
| 1-Person Household | 372 | 49.3% |
| 2-Person Household | 184 | 24.4% |
| 3-Person Household | 81 | 10.7% |
| 4+ Person Household | 118 | 15.6% |
| Total Housing Units | 755 | 100.0% |
Occupancy by Ownership by Household Size in Mesilla
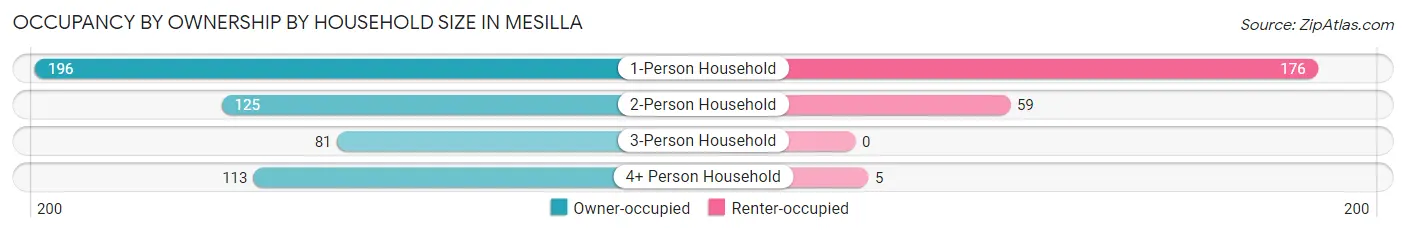
| Household Size | Owner-occupied | Renter-occupied |
| 1-Person Household | 196 (52.7%) | 176 (47.3%) |
| 2-Person Household | 125 (67.9%) | 59 (32.1%) |
| 3-Person Household | 81 (100.0%) | 0 (0.0%) |
| 4+ Person Household | 113 (95.8%) | 5 (4.2%) |
| Total Housing Units | 515 (68.2%) | 240 (31.8%) |
Occupancy by Educational Attainment in Mesilla
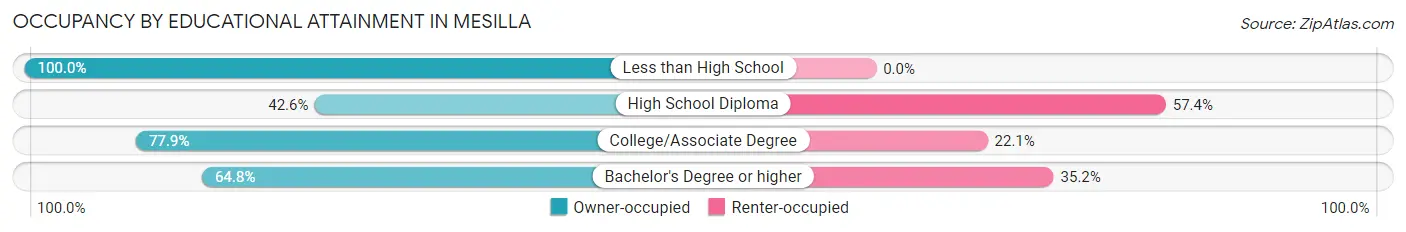
| Household Size | Owner-occupied | Renter-occupied |
| Less than High School | 76 (100.0%) | 0 (0.0%) |
| High School Diploma | 43 (42.6%) | 58 (57.4%) |
| College/Associate Degree | 127 (77.9%) | 36 (22.1%) |
| Bachelor's Degree or higher | 269 (64.8%) | 146 (35.2%) |
Occupancy by Age of Householder in Mesilla
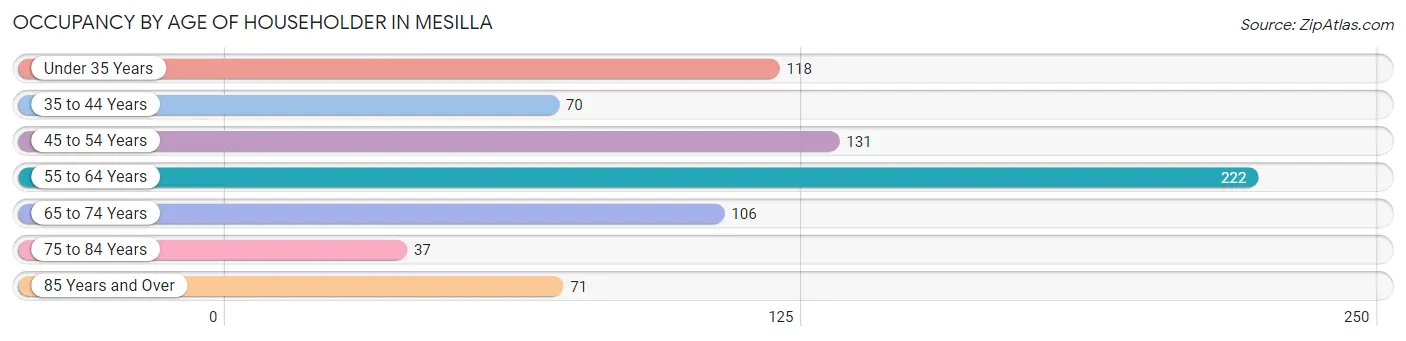
| Age Bracket | # Households | % Households |
| Under 35 Years | 118 | 15.6% |
| 35 to 44 Years | 70 | 9.3% |
| 45 to 54 Years | 131 | 17.3% |
| 55 to 64 Years | 222 | 29.4% |
| 65 to 74 Years | 106 | 14.0% |
| 75 to 84 Years | 37 | 4.9% |
| 85 Years and Over | 71 | 9.4% |
| Total | 755 | 100.0% |
Housing Finances in Mesilla
Median Income by Occupancy in Mesilla
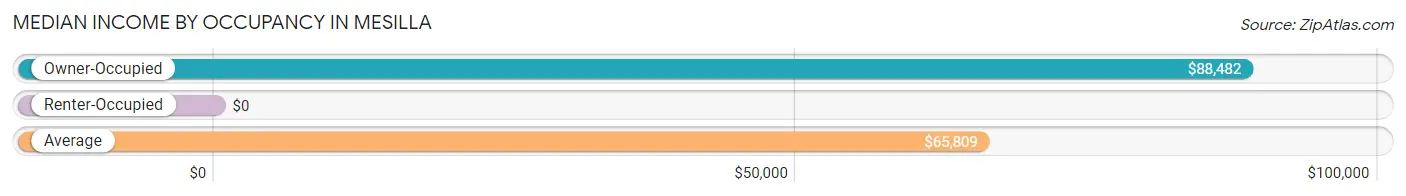
| Occupancy Type | # Households | Median Income |
| Owner-Occupied | 515 (68.2%) | $88,482 |
| Renter-Occupied | 240 (31.8%) | $0 |
| Average | 755 (100.0%) | $65,809 |
Occupancy by Householder Income Bracket in Mesilla
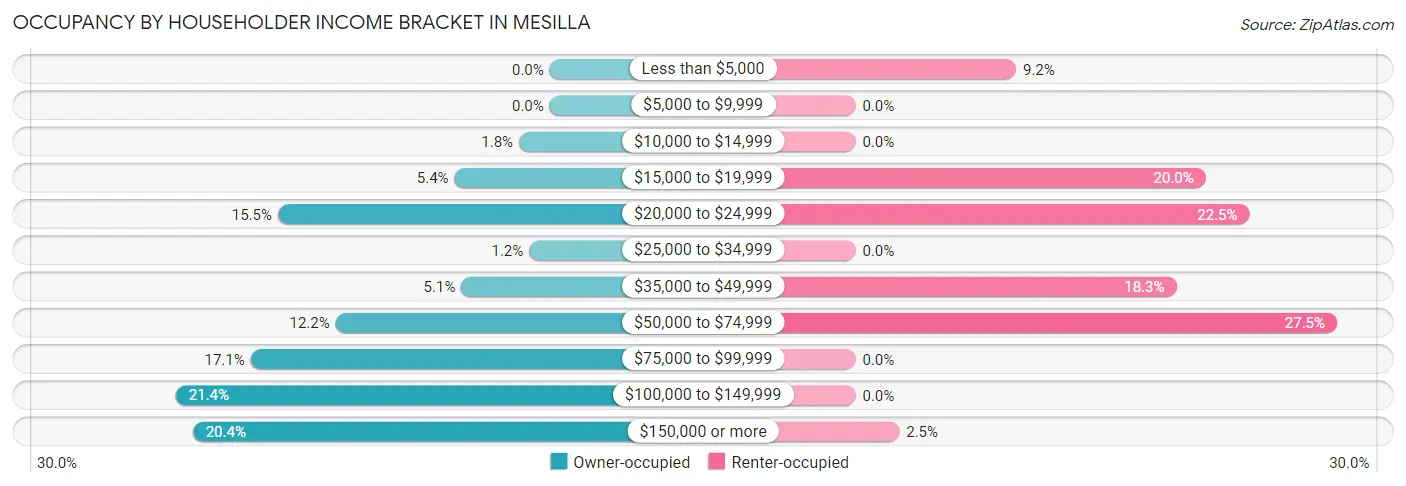
| Income Bracket | Owner-occupied | Renter-occupied |
| Less than $5,000 | 0 (0.0%) | 22 (9.2%) |
| $5,000 to $9,999 | 0 (0.0%) | 0 (0.0%) |
| $10,000 to $14,999 | 9 (1.8%) | 0 (0.0%) |
| $15,000 to $19,999 | 28 (5.4%) | 48 (20.0%) |
| $20,000 to $24,999 | 80 (15.5%) | 54 (22.5%) |
| $25,000 to $34,999 | 6 (1.2%) | 0 (0.0%) |
| $35,000 to $49,999 | 26 (5.1%) | 44 (18.3%) |
| $50,000 to $74,999 | 63 (12.2%) | 66 (27.5%) |
| $75,000 to $99,999 | 88 (17.1%) | 0 (0.0%) |
| $100,000 to $149,999 | 110 (21.4%) | 0 (0.0%) |
| $150,000 or more | 105 (20.4%) | 6 (2.5%) |
| Total | 515 (100.0%) | 240 (100.0%) |
Monthly Housing Cost Tiers in Mesilla
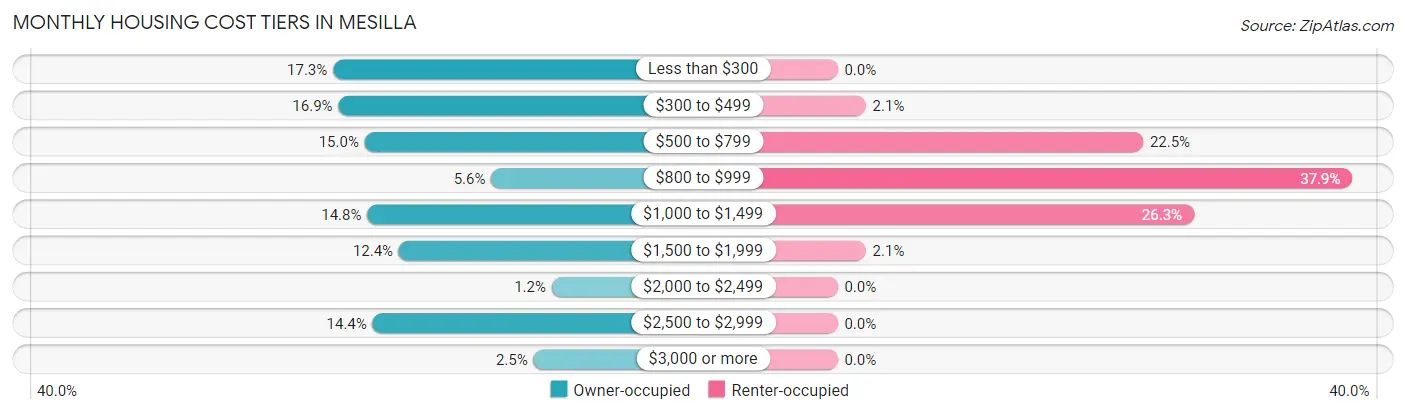
| Monthly Cost | Owner-occupied | Renter-occupied |
| Less than $300 | 89 (17.3%) | 0 (0.0%) |
| $300 to $499 | 87 (16.9%) | 5 (2.1%) |
| $500 to $799 | 77 (14.9%) | 54 (22.5%) |
| $800 to $999 | 29 (5.6%) | 91 (37.9%) |
| $1,000 to $1,499 | 76 (14.8%) | 63 (26.3%) |
| $1,500 to $1,999 | 64 (12.4%) | 5 (2.1%) |
| $2,000 to $2,499 | 6 (1.2%) | 0 (0.0%) |
| $2,500 to $2,999 | 74 (14.4%) | 0 (0.0%) |
| $3,000 or more | 13 (2.5%) | 0 (0.0%) |
| Total | 515 (100.0%) | 240 (100.0%) |
Physical Housing Characteristics in Mesilla
Housing Structures in Mesilla
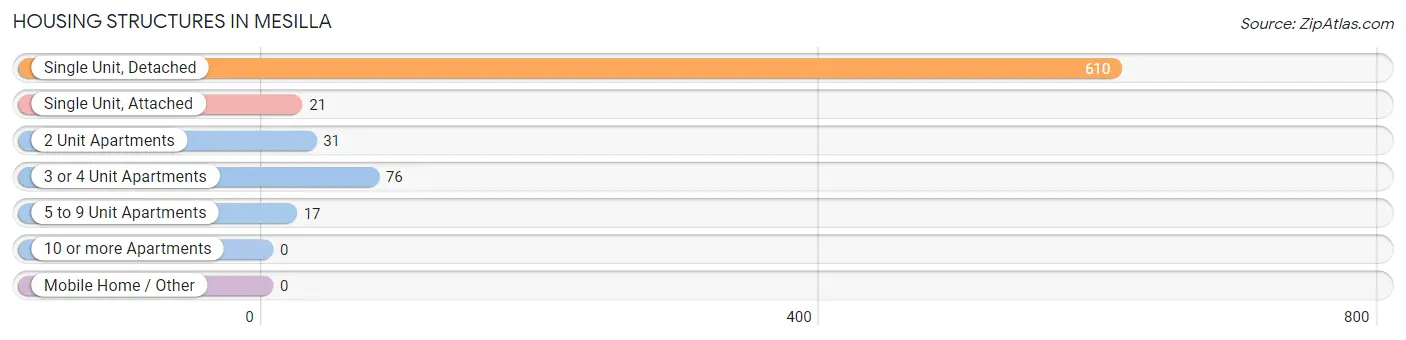
| Structure Type | # Housing Units | % Housing Units |
| Single Unit, Detached | 610 | 80.8% |
| Single Unit, Attached | 21 | 2.8% |
| 2 Unit Apartments | 31 | 4.1% |
| 3 or 4 Unit Apartments | 76 | 10.1% |
| 5 to 9 Unit Apartments | 17 | 2.2% |
| 10 or more Apartments | 0 | 0.0% |
| Mobile Home / Other | 0 | 0.0% |
| Total | 755 | 100.0% |
Housing Structures by Occupancy in Mesilla
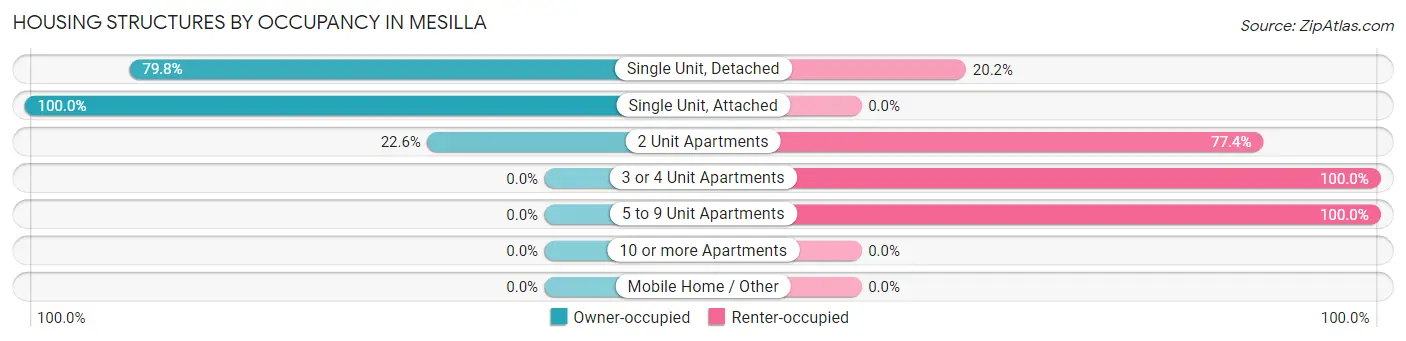
| Structure Type | Owner-occupied | Renter-occupied |
| Single Unit, Detached | 487 (79.8%) | 123 (20.2%) |
| Single Unit, Attached | 21 (100.0%) | 0 (0.0%) |
| 2 Unit Apartments | 7 (22.6%) | 24 (77.4%) |
| 3 or 4 Unit Apartments | 0 (0.0%) | 76 (100.0%) |
| 5 to 9 Unit Apartments | 0 (0.0%) | 17 (100.0%) |
| 10 or more Apartments | 0 (0.0%) | 0 (0.0%) |
| Mobile Home / Other | 0 (0.0%) | 0 (0.0%) |
| Total | 515 (68.2%) | 240 (31.8%) |
Housing Structures by Number of Rooms in Mesilla
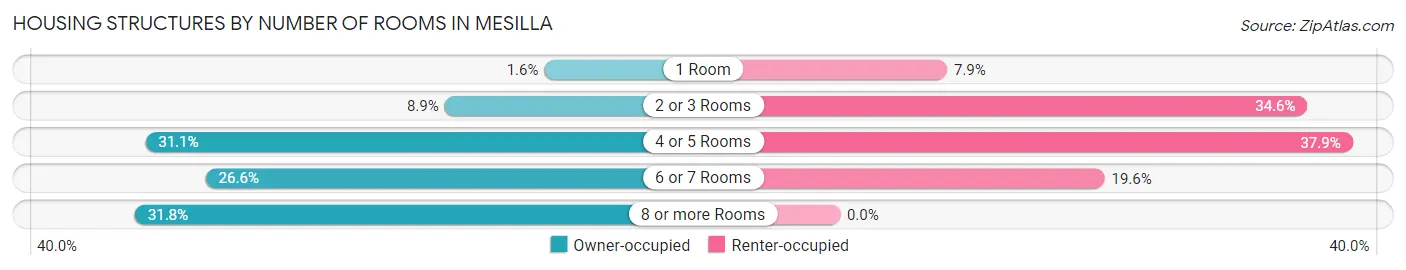
| Number of Rooms | Owner-occupied | Renter-occupied |
| 1 Room | 8 (1.5%) | 19 (7.9%) |
| 2 or 3 Rooms | 46 (8.9%) | 83 (34.6%) |
| 4 or 5 Rooms | 160 (31.1%) | 91 (37.9%) |
| 6 or 7 Rooms | 137 (26.6%) | 47 (19.6%) |
| 8 or more Rooms | 164 (31.8%) | 0 (0.0%) |
| Total | 515 (100.0%) | 240 (100.0%) |
Housing Structure by Heating Type in Mesilla
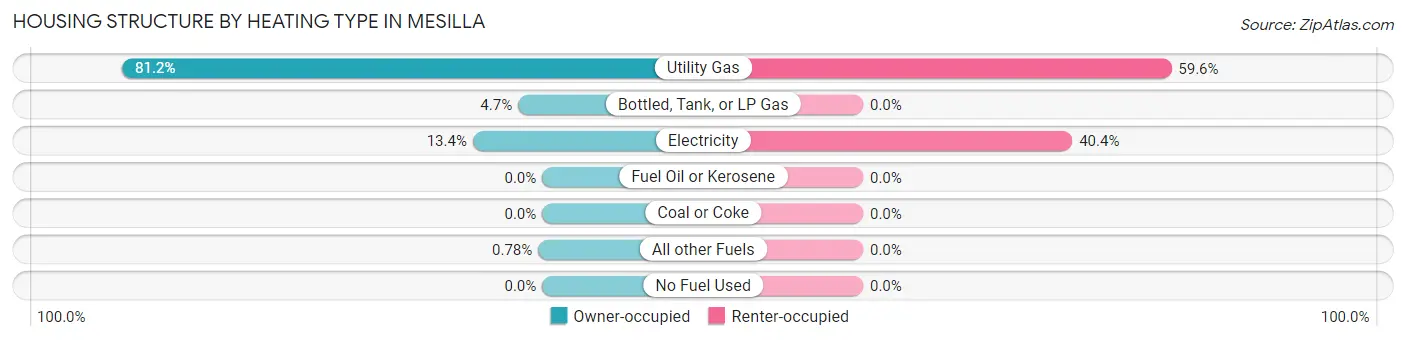
| Heating Type | Owner-occupied | Renter-occupied |
| Utility Gas | 418 (81.2%) | 143 (59.6%) |
| Bottled, Tank, or LP Gas | 24 (4.7%) | 0 (0.0%) |
| Electricity | 69 (13.4%) | 97 (40.4%) |
| Fuel Oil or Kerosene | 0 (0.0%) | 0 (0.0%) |
| Coal or Coke | 0 (0.0%) | 0 (0.0%) |
| All other Fuels | 4 (0.8%) | 0 (0.0%) |
| No Fuel Used | 0 (0.0%) | 0 (0.0%) |
| Total | 515 (100.0%) | 240 (100.0%) |
Household Vehicle Usage in Mesilla
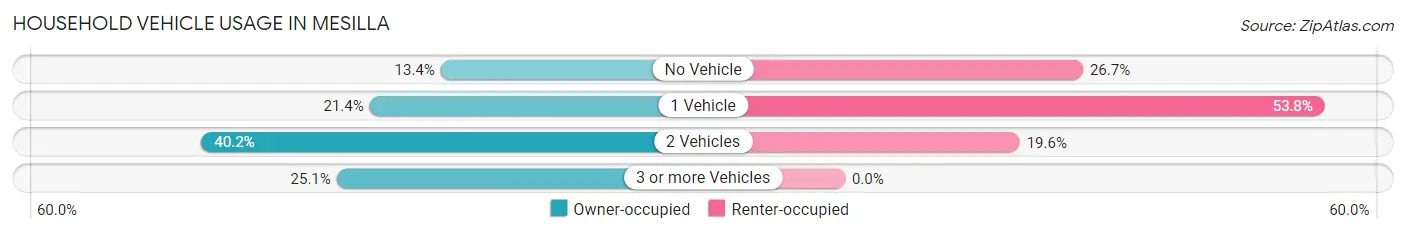
| Vehicles per Household | Owner-occupied | Renter-occupied |
| No Vehicle | 69 (13.4%) | 64 (26.7%) |
| 1 Vehicle | 110 (21.4%) | 129 (53.7%) |
| 2 Vehicles | 207 (40.2%) | 47 (19.6%) |
| 3 or more Vehicles | 129 (25.1%) | 0 (0.0%) |
| Total | 515 (100.0%) | 240 (100.0%) |
Real Estate & Mortgages in Mesilla
Real Estate and Mortgage Overview in Mesilla
| Characteristic | Without Mortgage | With Mortgage |
| Housing Units | 281 | 234 |
| Median Property Value | $198,500 | $358,100 |
| Median Household Income | $81,042 | $67 |
| Monthly Housing Costs | $419 | $4 |
| Real Estate Taxes | $1,265 | $0 |
Property Value by Mortgage Status in Mesilla
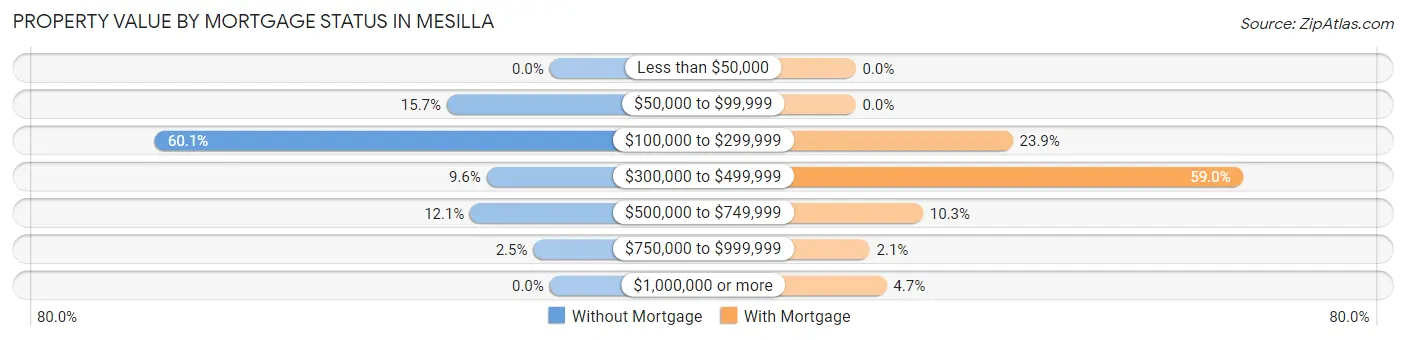
| Property Value | Without Mortgage | With Mortgage |
| Less than $50,000 | 0 (0.0%) | 0 (0.0%) |
| $50,000 to $99,999 | 44 (15.7%) | 0 (0.0%) |
| $100,000 to $299,999 | 169 (60.1%) | 56 (23.9%) |
| $300,000 to $499,999 | 27 (9.6%) | 138 (59.0%) |
| $500,000 to $749,999 | 34 (12.1%) | 24 (10.3%) |
| $750,000 to $999,999 | 7 (2.5%) | 5 (2.1%) |
| $1,000,000 or more | 0 (0.0%) | 11 (4.7%) |
| Total | 281 (100.0%) | 234 (100.0%) |
Household Income by Mortgage Status in Mesilla
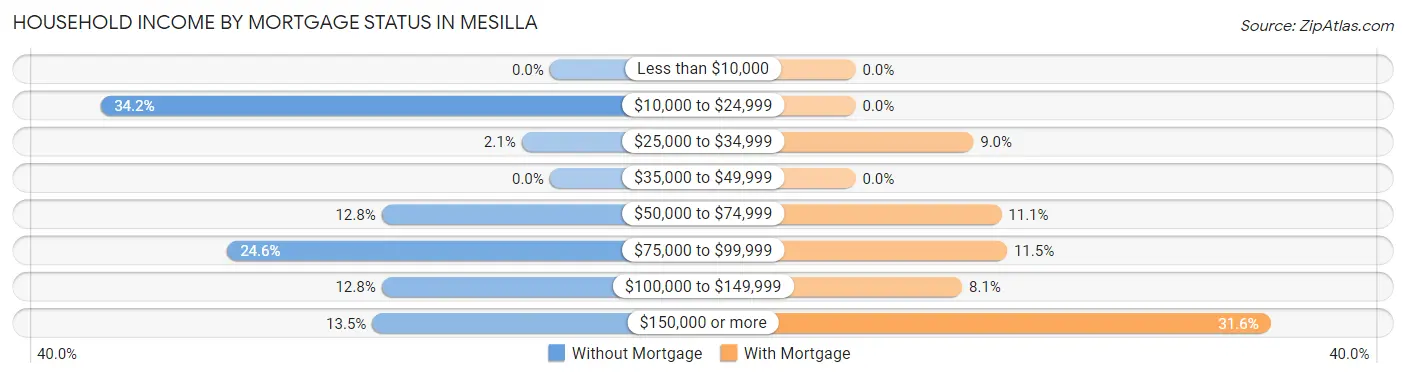
| Household Income | Without Mortgage | With Mortgage |
| Less than $10,000 | 0 (0.0%) | 0 (0.0%) |
| $10,000 to $24,999 | 96 (34.2%) | 0 (0.0%) |
| $25,000 to $34,999 | 6 (2.1%) | 21 (9.0%) |
| $35,000 to $49,999 | 0 (0.0%) | 0 (0.0%) |
| $50,000 to $74,999 | 36 (12.8%) | 26 (11.1%) |
| $75,000 to $99,999 | 69 (24.6%) | 27 (11.5%) |
| $100,000 to $149,999 | 36 (12.8%) | 19 (8.1%) |
| $150,000 or more | 38 (13.5%) | 74 (31.6%) |
| Total | 281 (100.0%) | 234 (100.0%) |
Property Value to Household Income Ratio in Mesilla
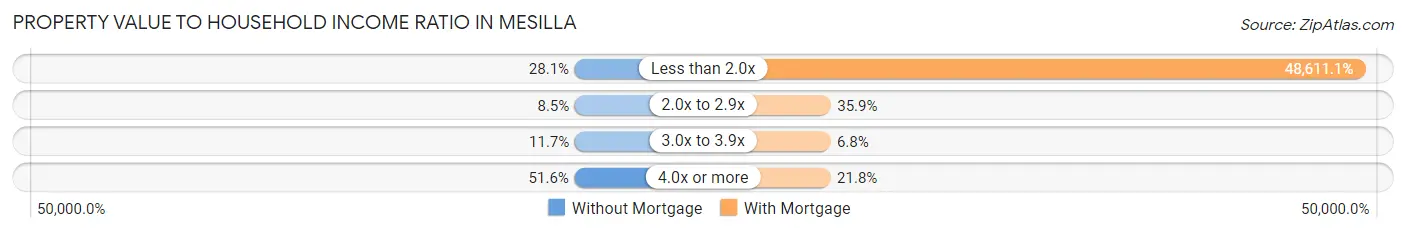
| Value-to-Income Ratio | Without Mortgage | With Mortgage |
| Less than 2.0x | 79 (28.1%) | 113,750 (48,611.1%) |
| 2.0x to 2.9x | 24 (8.5%) | 84 (35.9%) |
| 3.0x to 3.9x | 33 (11.7%) | 16 (6.8%) |
| 4.0x or more | 145 (51.6%) | 51 (21.8%) |
| Total | 281 (100.0%) | 234 (100.0%) |
Real Estate Taxes by Mortgage Status in Mesilla

| Property Taxes | Without Mortgage | With Mortgage |
| Less than $800 | 64 (22.8%) | 0 (0.0%) |
| $800 to $1,499 | 122 (43.4%) | 0 (0.0%) |
| $800 to $1,499 | 79 (28.1%) | 83 (35.5%) |
| Total | 281 (100.0%) | 234 (100.0%) |
Health & Disability in Mesilla
Health Insurance Coverage by Age in Mesilla
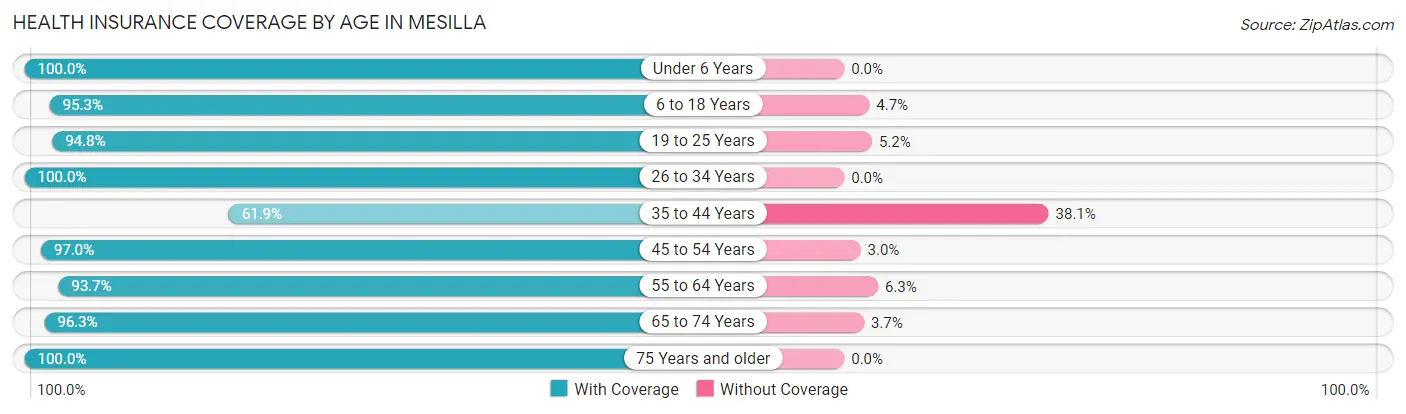
| Age Bracket | With Coverage | Without Coverage |
| Under 6 Years | 40 (100.0%) | 0 (0.0%) |
| 6 to 18 Years | 245 (95.3%) | 12 (4.7%) |
| 19 to 25 Years | 147 (94.8%) | 8 (5.2%) |
| 26 to 34 Years | 106 (100.0%) | 0 (0.0%) |
| 35 to 44 Years | 65 (61.9%) | 40 (38.1%) |
| 45 to 54 Years | 223 (97.0%) | 7 (3.0%) |
| 55 to 64 Years | 328 (93.7%) | 22 (6.3%) |
| 65 to 74 Years | 157 (96.3%) | 6 (3.7%) |
| 75 Years and older | 241 (100.0%) | 0 (0.0%) |
| Total | 1,552 (94.2%) | 95 (5.8%) |
Health Insurance Coverage by Citizenship Status in Mesilla

| Citizenship Status | With Coverage | Without Coverage |
| Native Born | 40 (100.0%) | 0 (0.0%) |
| Foreign Born, Citizen | 245 (95.3%) | 12 (4.7%) |
| Foreign Born, not a Citizen | 147 (94.8%) | 8 (5.2%) |
Health Insurance Coverage by Household Income in Mesilla
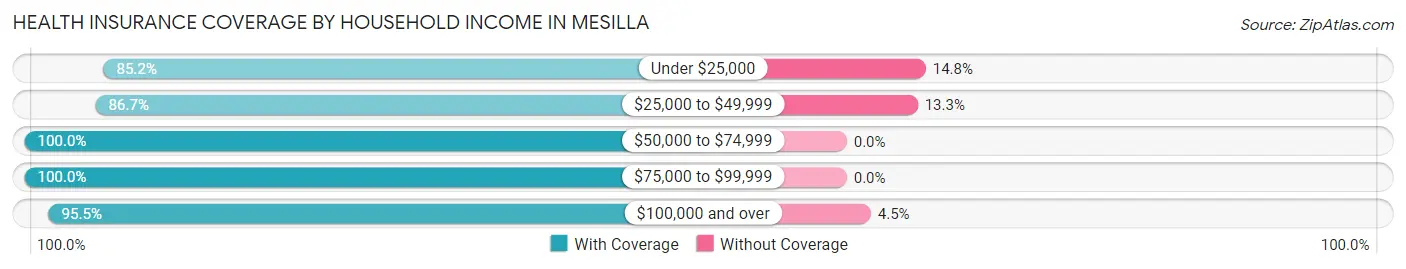
| Household Income | With Coverage | Without Coverage |
| Under $25,000 | 236 (85.2%) | 41 (14.8%) |
| $25,000 to $49,999 | 137 (86.7%) | 21 (13.3%) |
| $50,000 to $74,999 | 232 (100.0%) | 0 (0.0%) |
| $75,000 to $99,999 | 249 (100.0%) | 0 (0.0%) |
| $100,000 and over | 698 (95.5%) | 33 (4.5%) |
Public vs Private Health Insurance Coverage by Age in Mesilla
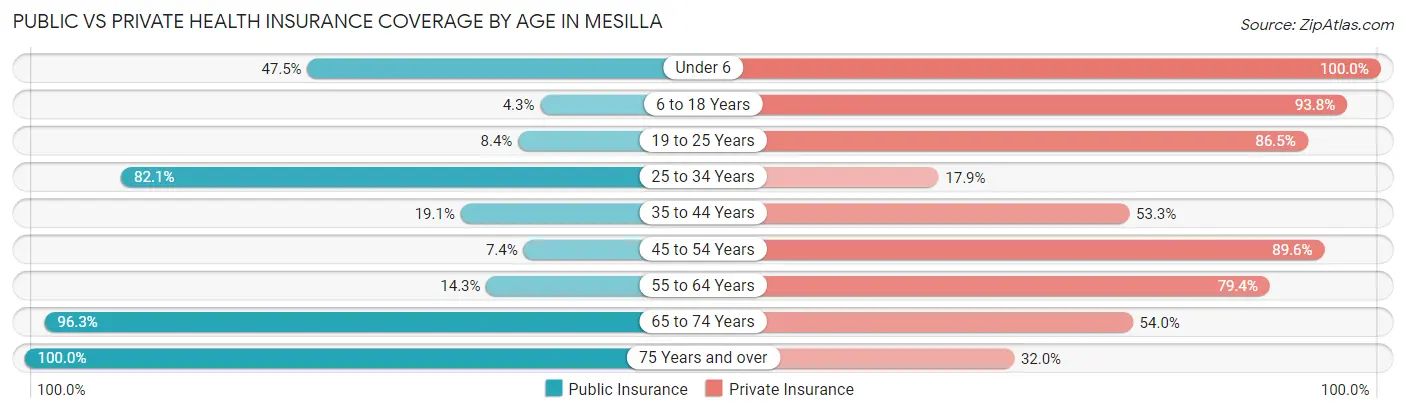
| Age Bracket | Public Insurance | Private Insurance |
| Under 6 | 19 (47.5%) | 40 (100.0%) |
| 6 to 18 Years | 11 (4.3%) | 241 (93.8%) |
| 19 to 25 Years | 13 (8.4%) | 134 (86.5%) |
| 25 to 34 Years | 87 (82.1%) | 19 (17.9%) |
| 35 to 44 Years | 20 (19.1%) | 56 (53.3%) |
| 45 to 54 Years | 17 (7.4%) | 206 (89.6%) |
| 55 to 64 Years | 50 (14.3%) | 278 (79.4%) |
| 65 to 74 Years | 157 (96.3%) | 88 (54.0%) |
| 75 Years and over | 241 (100.0%) | 77 (32.0%) |
| Total | 615 (37.3%) | 1,139 (69.2%) |
Disability Status by Sex by Age in Mesilla
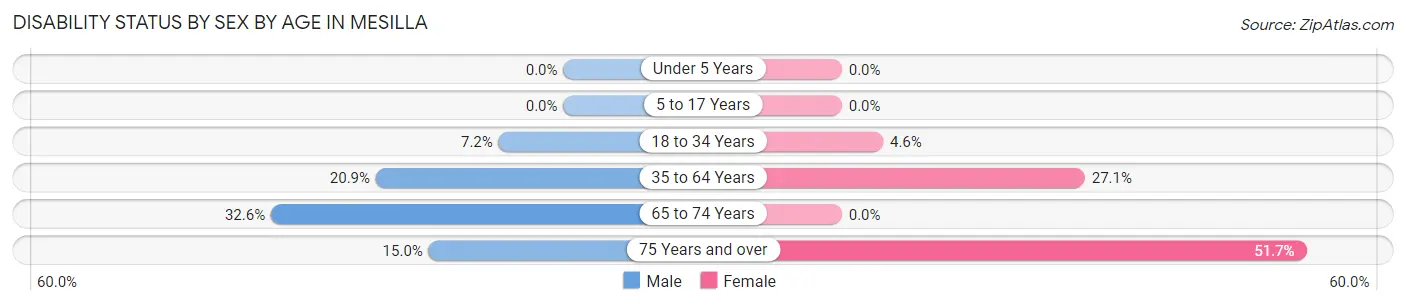
| Age Bracket | Male | Female |
| Under 5 Years | 0 (0.0%) | 0 (0.0%) |
| 5 to 17 Years | 0 (0.0%) | 0 (0.0%) |
| 18 to 34 Years | 15 (7.2%) | 5 (4.6%) |
| 35 to 64 Years | 62 (20.9%) | 105 (27.1%) |
| 65 to 74 Years | 28 (32.6%) | 0 (0.0%) |
| 75 Years and over | 6 (15.0%) | 104 (51.7%) |
Disability Class by Sex by Age in Mesilla
Disability Class: Hearing Difficulty
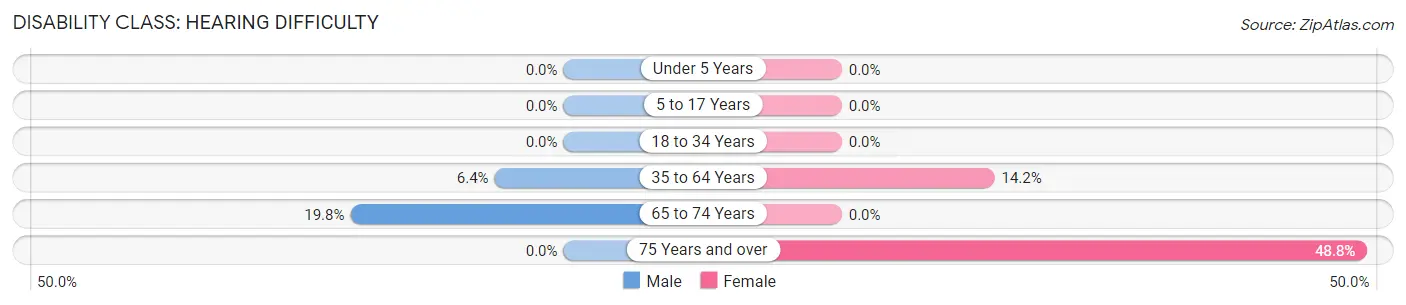
| Age Bracket | Male | Female |
| Under 5 Years | 0 (0.0%) | 0 (0.0%) |
| 5 to 17 Years | 0 (0.0%) | 0 (0.0%) |
| 18 to 34 Years | 0 (0.0%) | 0 (0.0%) |
| 35 to 64 Years | 19 (6.4%) | 55 (14.2%) |
| 65 to 74 Years | 17 (19.8%) | 0 (0.0%) |
| 75 Years and over | 0 (0.0%) | 98 (48.8%) |
Disability Class: Vision Difficulty
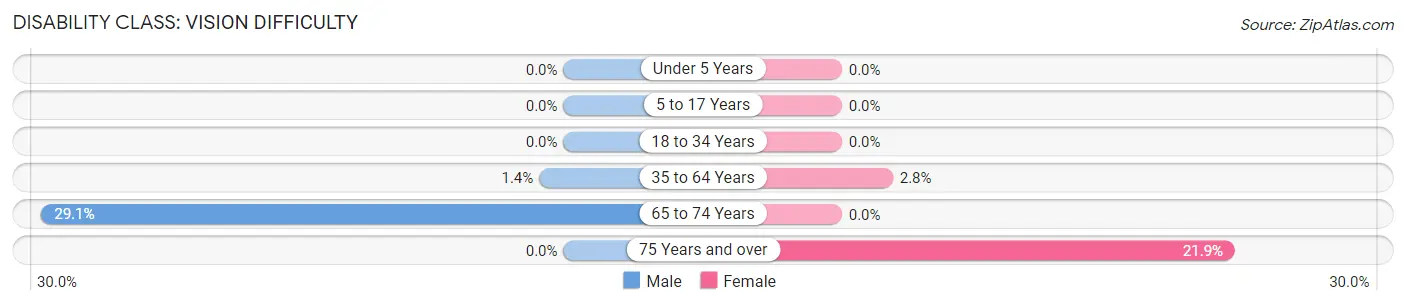
| Age Bracket | Male | Female |
| Under 5 Years | 0 (0.0%) | 0 (0.0%) |
| 5 to 17 Years | 0 (0.0%) | 0 (0.0%) |
| 18 to 34 Years | 0 (0.0%) | 0 (0.0%) |
| 35 to 64 Years | 4 (1.3%) | 11 (2.8%) |
| 65 to 74 Years | 25 (29.1%) | 0 (0.0%) |
| 75 Years and over | 0 (0.0%) | 44 (21.9%) |
Disability Class: Cognitive Difficulty
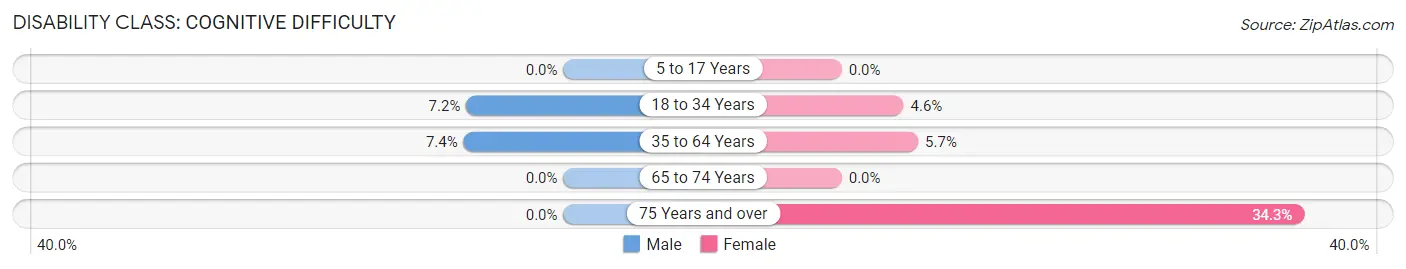
| Age Bracket | Male | Female |
| 5 to 17 Years | 0 (0.0%) | 0 (0.0%) |
| 18 to 34 Years | 15 (7.2%) | 5 (4.6%) |
| 35 to 64 Years | 22 (7.4%) | 22 (5.7%) |
| 65 to 74 Years | 0 (0.0%) | 0 (0.0%) |
| 75 Years and over | 0 (0.0%) | 69 (34.3%) |
Disability Class: Ambulatory Difficulty
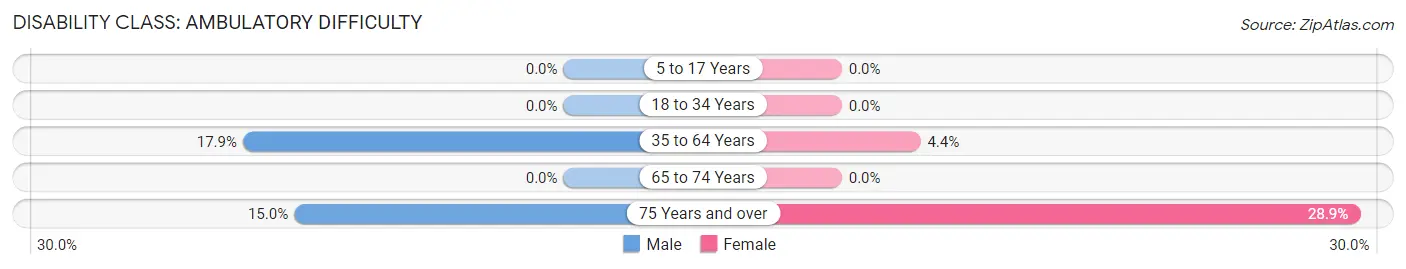
| Age Bracket | Male | Female |
| 5 to 17 Years | 0 (0.0%) | 0 (0.0%) |
| 18 to 34 Years | 0 (0.0%) | 0 (0.0%) |
| 35 to 64 Years | 53 (17.8%) | 17 (4.4%) |
| 65 to 74 Years | 0 (0.0%) | 0 (0.0%) |
| 75 Years and over | 6 (15.0%) | 58 (28.9%) |
Disability Class: Self-Care Difficulty

| Age Bracket | Male | Female |
| 5 to 17 Years | 0 (0.0%) | 0 (0.0%) |
| 18 to 34 Years | 0 (0.0%) | 0 (0.0%) |
| 35 to 64 Years | 0 (0.0%) | 0 (0.0%) |
| 65 to 74 Years | 0 (0.0%) | 0 (0.0%) |
| 75 Years and over | 0 (0.0%) | 44 (21.9%) |
Technology Access in Mesilla
Computing Device Access in Mesilla
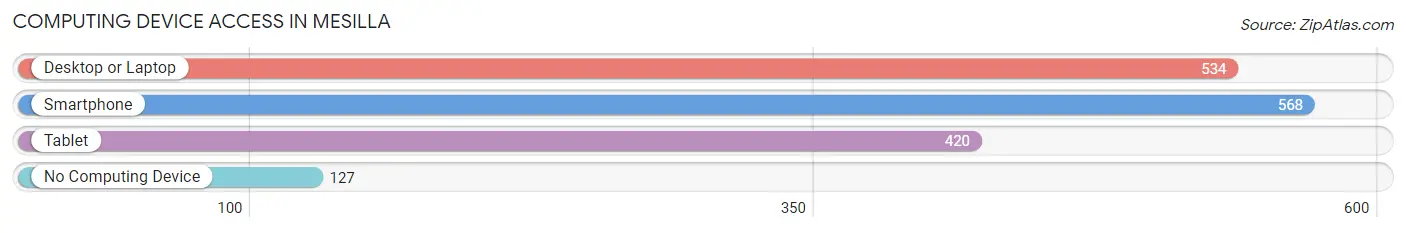
| Device Type | # Households | % Households |
| Desktop or Laptop | 534 | 70.7% |
| Smartphone | 568 | 75.2% |
| Tablet | 420 | 55.6% |
| No Computing Device | 127 | 16.8% |
| Total | 755 | 100.0% |
Internet Access in Mesilla
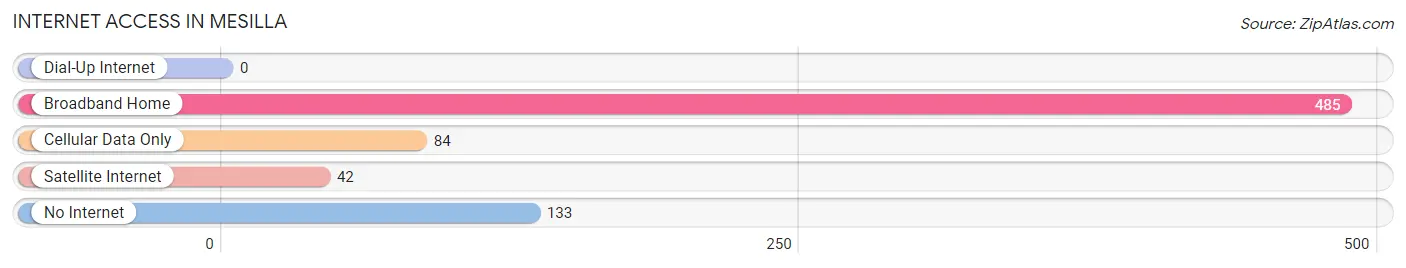
| Internet Type | # Households | % Households |
| Dial-Up Internet | 0 | 0.0% |
| Broadband Home | 485 | 64.2% |
| Cellular Data Only | 84 | 11.1% |
| Satellite Internet | 42 | 5.6% |
| No Internet | 133 | 17.6% |
| Total | 755 | 100.0% |
Mesilla Summary
Mesilla, New Mexico is a small town located in the southern part of the state, just outside of Las Cruces. It is a historic town with a rich history and culture, and is home to a diverse population.
Geography
Mesilla is located in the Mesilla Valley, which is part of the Rio Grande Valley. The town is situated on the banks of the Rio Grande, and is surrounded by the Organ Mountains to the east and the Franklin Mountains to the west. The town is located at an elevation of 3,912 feet above sea level. The climate in Mesilla is semi-arid, with hot summers and mild winters.
History
Mesilla was founded in 1848, when the Treaty of Guadalupe Hidalgo was signed, ending the Mexican-American War. The town was originally part of Mexico, but was ceded to the United States as part of the treaty. The town was then settled by American settlers, and it quickly became a center of commerce and trade. In 1854, Mesilla was designated as the county seat of Doña Ana County.
In 1861, Mesilla was briefly occupied by Confederate forces during the Civil War. The town was then occupied by Union forces in 1862, and it remained under Union control until the end of the war. After the war, Mesilla continued to grow and prosper, and it became an important stop on the Butterfield Overland Mail route.
In 1881, Mesilla was incorporated as a town, and it has remained an important part of the region ever since. The town has a rich history and culture, and it is home to many historic buildings and sites.
Economy
Mesilla’s economy is largely based on agriculture and tourism. The town is home to a number of farms and ranches, and it is also a popular tourist destination. The town is home to a number of historic sites, including the San Albino Church, the Mesilla Plaza, and the Old Mesilla Town Hall. The town also hosts a number of festivals and events throughout the year, including the Mesilla Valley Balloon Rally and the Mesilla Valley Chile Festival.
Demographics
As of the 2010 census, Mesilla had a population of 2,196. The town has a diverse population, with a mix of Hispanic, Native American, and Anglo residents. The median household income in Mesilla is $35,938, and the median home value is $127,400. The town has a high rate of poverty, with 28.3% of the population living below the poverty line.
Mesilla is a small town with a rich history and culture. It is home to a diverse population, and it has a strong economy based on agriculture and tourism. The town is an important part of the region, and it is a great place to visit and explore.
Common Questions
What is Per Capita Income in Mesilla?
Per Capita income in Mesilla is $48,947.
What is the Median Family Income in Mesilla?
Median Family Income in Mesilla is $102,813.
What is the Median Household income in Mesilla?
Median Household Income in Mesilla is $65,809.
What is Income or Wage Gap in Mesilla?
Income or Wage Gap in Mesilla is 31.9%.
Women in Mesilla earn 68.1 cents for every dollar earned by a man.
What is Inequality or Gini Index in Mesilla?
Inequality or Gini Index in Mesilla is 0.54.
What is the Total Population of Mesilla?
Total Population of Mesilla is 1,647.
What is the Total Male Population of Mesilla?
Total Male Population of Mesilla is 674.
What is the Total Female Population of Mesilla?
Total Female Population of Mesilla is 973.
What is the Ratio of Males per 100 Females in Mesilla?
There are 69.27 Males per 100 Females in Mesilla.
What is the Ratio of Females per 100 Males in Mesilla?
There are 144.36 Females per 100 Males in Mesilla.
What is the Median Population Age in Mesilla?
Median Population Age in Mesilla is 51.0 Years.
What is the Average Family Size in Mesilla
Average Family Size in Mesilla is 3.4 People.
What is the Average Household Size in Mesilla
Average Household Size in Mesilla is 2.2 People.
How Large is the Labor Force in Mesilla?
There are 777 People in the Labor Forcein in Mesilla.
What is the Percentage of People in the Labor Force in Mesilla?
53.8% of People are in the Labor Force in Mesilla.
What is the Unemployment Rate in Mesilla?
Unemployment Rate in Mesilla is 1.3%.