San Pablo, NM Map & Demographics
San Pablo Map
San Pablo Overview
$34,030
PER CAPITA INCOME
$91,172
AVG FAMILY INCOME
0.41
INEQUALITY / GINI INDEX
449
TOTAL POPULATION
212
MALE POPULATION
237
FEMALE POPULATION
89.45
MALES / 100 FEMALES
111.79
FEMALES / 100 MALES
48.6
MEDIAN AGE
2.8
AVG FAMILY SIZE
2.5
AVG HOUSEHOLD SIZE
224
LABOR FORCE [ PEOPLE ]
55.9%
PERCENT IN LABOR FORCE
2.2%
UNEMPLOYMENT RATE
Income in San Pablo
Income Overview in San Pablo
| Characteristic | Number | Measure |
| Per Capita Income | 449 | $34,030 |
| Median Family Income | 113 | $91,172 |
| Mean Family Income | 113 | $110,458 |
| Median Household Income | 176 | $0 |
| Mean Household Income | 176 | $87,195 |
| Income Deficit | 113 | $0 |
| Wage / Income Gap (%) | 449 | 0.00% |
| Wage / Income Gap ($) | 449 | 100.00¢ per $1 |
| Gini / Inequality Index | 449 | 0.41 |
Earnings by Sex in San Pablo
| Sex | Number | Average Earnings |
| Male | 136 (58.9%) | $0 |
| Female | 95 (41.1%) | $0 |
| Total | 231 (100.0%) | $0 |
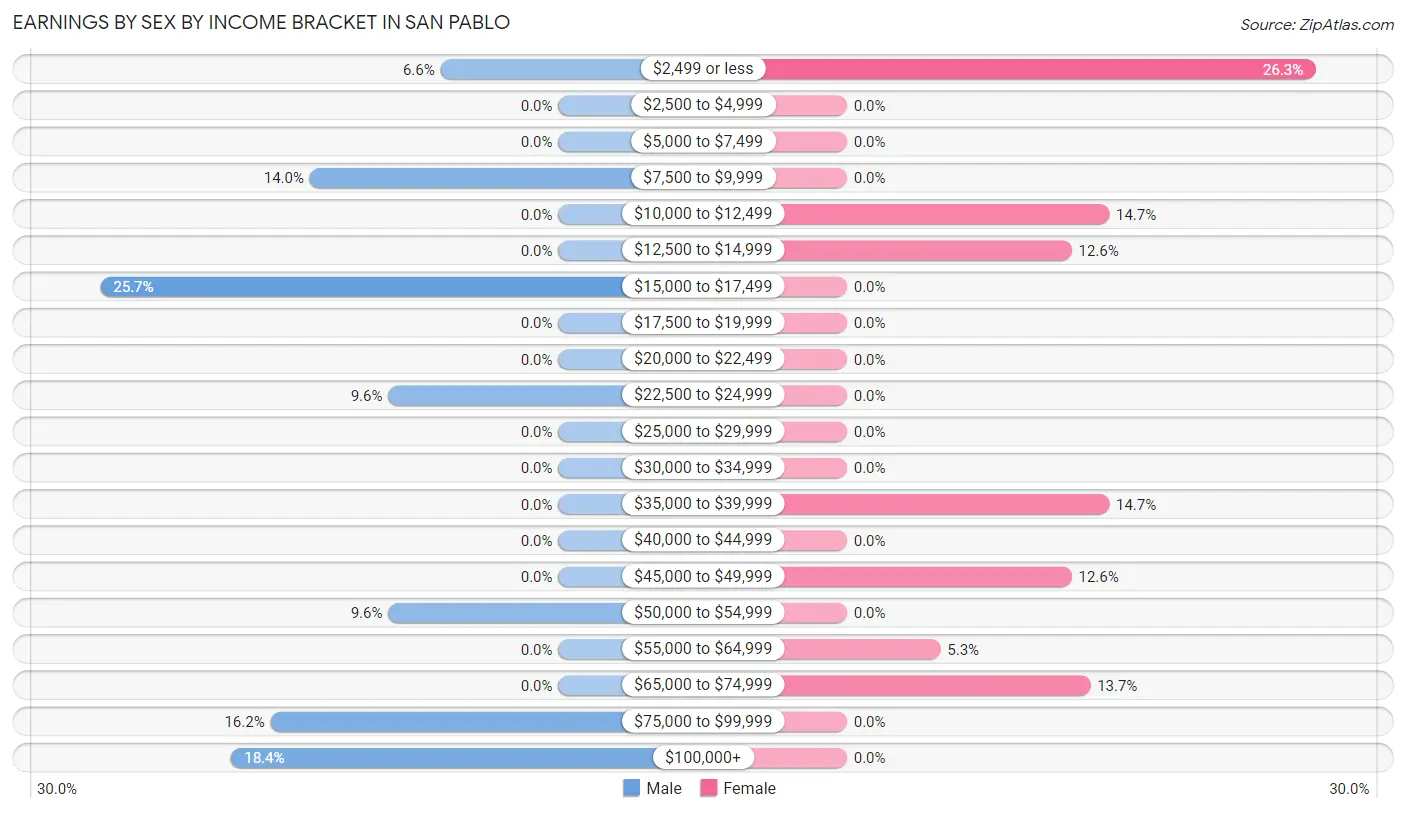
Earnings by Sex by Income Bracket in San Pablo
The most common earnings brackets in San Pablo are $15,000 to $17,499 for men (35 | 25.7%) and $2,499 or less for women (25 | 26.3%).
| Income | Male | Female |
| $2,499 or less | 9 (6.6%) | 25 (26.3%) |
| $2,500 to $4,999 | 0 (0.0%) | 0 (0.0%) |
| $5,000 to $7,499 | 0 (0.0%) | 0 (0.0%) |
| $7,500 to $9,999 | 19 (14.0%) | 0 (0.0%) |
| $10,000 to $12,499 | 0 (0.0%) | 14 (14.7%) |
| $12,500 to $14,999 | 0 (0.0%) | 12 (12.6%) |
| $15,000 to $17,499 | 35 (25.7%) | 0 (0.0%) |
| $17,500 to $19,999 | 0 (0.0%) | 0 (0.0%) |
| $20,000 to $22,499 | 0 (0.0%) | 0 (0.0%) |
| $22,500 to $24,999 | 13 (9.6%) | 0 (0.0%) |
| $25,000 to $29,999 | 0 (0.0%) | 0 (0.0%) |
| $30,000 to $34,999 | 0 (0.0%) | 0 (0.0%) |
| $35,000 to $39,999 | 0 (0.0%) | 14 (14.7%) |
| $40,000 to $44,999 | 0 (0.0%) | 0 (0.0%) |
| $45,000 to $49,999 | 0 (0.0%) | 12 (12.6%) |
| $50,000 to $54,999 | 13 (9.6%) | 0 (0.0%) |
| $55,000 to $64,999 | 0 (0.0%) | 5 (5.3%) |
| $65,000 to $74,999 | 0 (0.0%) | 13 (13.7%) |
| $75,000 to $99,999 | 22 (16.2%) | 0 (0.0%) |
| $100,000+ | 25 (18.4%) | 0 (0.0%) |
| Total | 136 (100.0%) | 95 (100.0%) |
Earnings by Sex by Educational Attainment in San Pablo
| Educational Attainment | Male Income | Female Income |
| Less than High School | - | - |
| High School Diploma | - | - |
| College or Associate's Degree | - | - |
| Bachelor's Degree | - | - |
| Graduate Degree | - | - |
| Total | - | - |
Family Income in San Pablo
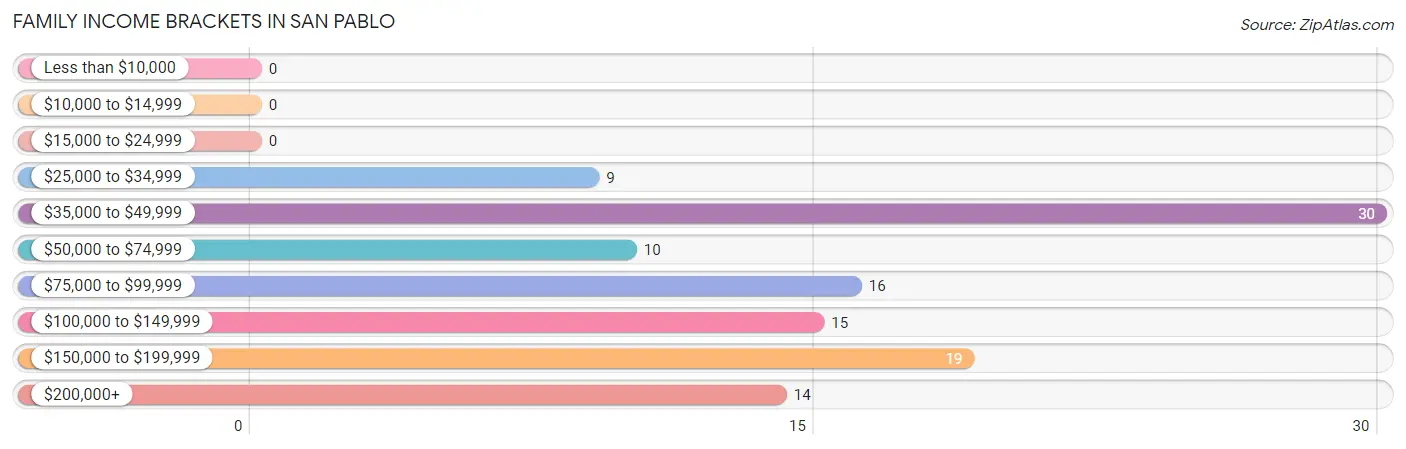
Family Income Brackets in San Pablo
According to the San Pablo family income data, there are 30 families falling into the $35,000 to $49,999 income range, which is the most common income bracket and makes up 26.6% of all families.
| Income Bracket | # Families | % Families |
| Less than $10,000 | 0 | 0.0% |
| $10,000 to $14,999 | 0 | 0.0% |
| $15,000 to $24,999 | 0 | 0.0% |
| $25,000 to $34,999 | 9 | 8.0% |
| $35,000 to $49,999 | 30 | 26.5% |
| $50,000 to $74,999 | 10 | 8.8% |
| $75,000 to $99,999 | 16 | 14.2% |
| $100,000 to $149,999 | 15 | 13.3% |
| $150,000 to $199,999 | 19 | 16.8% |
| $200,000+ | 14 | 12.4% |
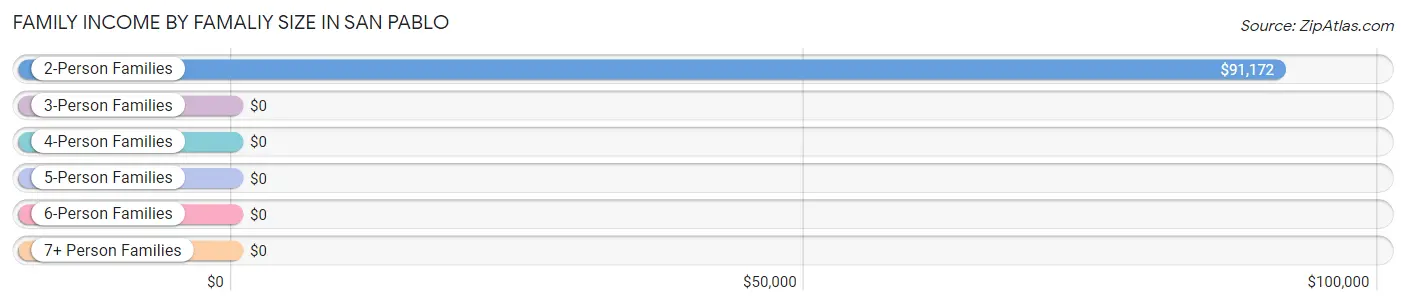
Family Income by Famaliy Size in San Pablo
2-person families (71 | 62.8%) account for the highest median family income in San Pablo with $91,172 per family, while 2-person families (71 | 62.8%) have the highest median income of $45,586 per family member.
| Income Bracket | # Families | Median Income |
| 2-Person Families | 71 (62.8%) | $91,172 |
| 3-Person Families | 23 (20.3%) | $0 |
| 4-Person Families | 9 (8.0%) | $0 |
| 5-Person Families | 0 (0.0%) | $0 |
| 6-Person Families | 10 (8.8%) | $0 |
| 7+ Person Families | 0 (0.0%) | $0 |
| Total | 113 (100.0%) | $91,172 |
Family Income by Number of Earners in San Pablo
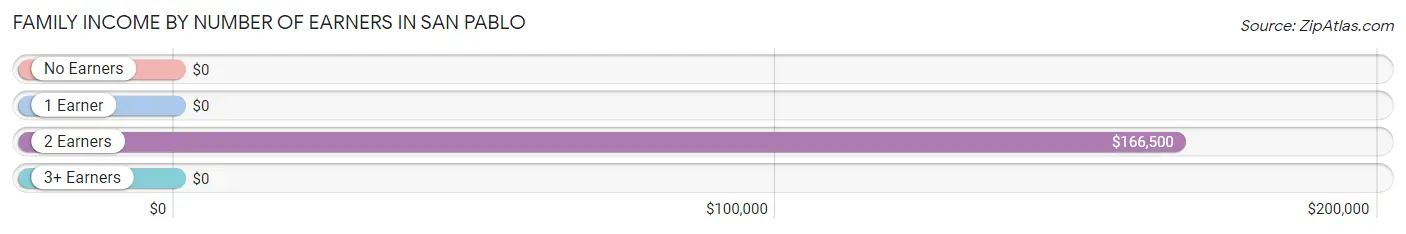
| Number of Earners | # Families | Median Income |
| No Earners | 10 (8.8%) | $0 |
| 1 Earner | 58 (51.3%) | $0 |
| 2 Earners | 20 (17.7%) | $166,500 |
| 3+ Earners | 25 (22.1%) | $0 |
| Total | 113 (100.0%) | $91,172 |
Household Income in San Pablo
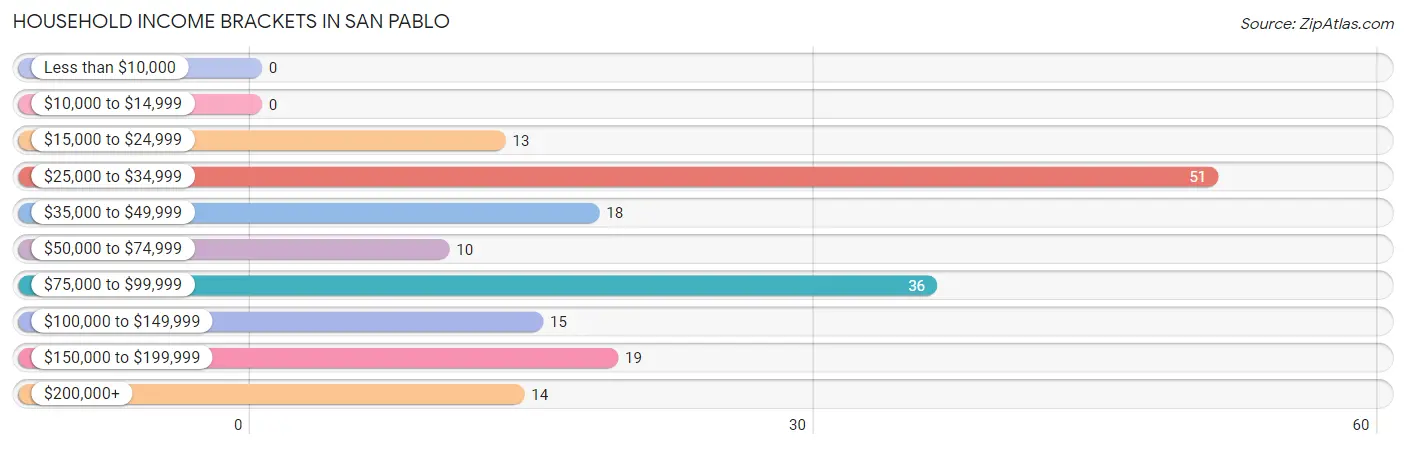
Household Income Brackets in San Pablo
With 51 households falling in the category, the $25,000 to $34,999 income range is the most frequent in San Pablo, accounting for 29.0% of all households.
| Income Bracket | # Households | % Households |
| Less than $10,000 | 0 | 0.0% |
| $10,000 to $14,999 | 0 | 0.0% |
| $15,000 to $24,999 | 13 | 7.4% |
| $25,000 to $34,999 | 51 | 29.0% |
| $35,000 to $49,999 | 18 | 10.2% |
| $50,000 to $74,999 | 10 | 5.7% |
| $75,000 to $99,999 | 36 | 20.5% |
| $100,000 to $149,999 | 15 | 8.5% |
| $150,000 to $199,999 | 19 | 10.8% |
| $200,000+ | 14 | 8.0% |
Household Income by Householder Age in San Pablo
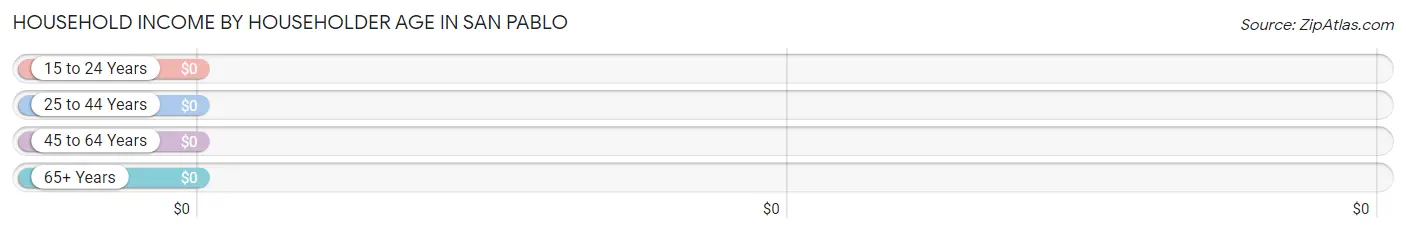
| Income Bracket | # Households | Median Income |
| 15 to 24 Years | 0 (0.0%) | $0 |
| 25 to 44 Years | 47 (26.7%) | $0 |
| 45 to 64 Years | 64 (36.4%) | $0 |
| 65+ Years | 65 (36.9%) | $0 |
| Total | 176 (100.0%) | $0 |
Poverty in San Pablo
Income Below Poverty by Sex and Age in San Pablo
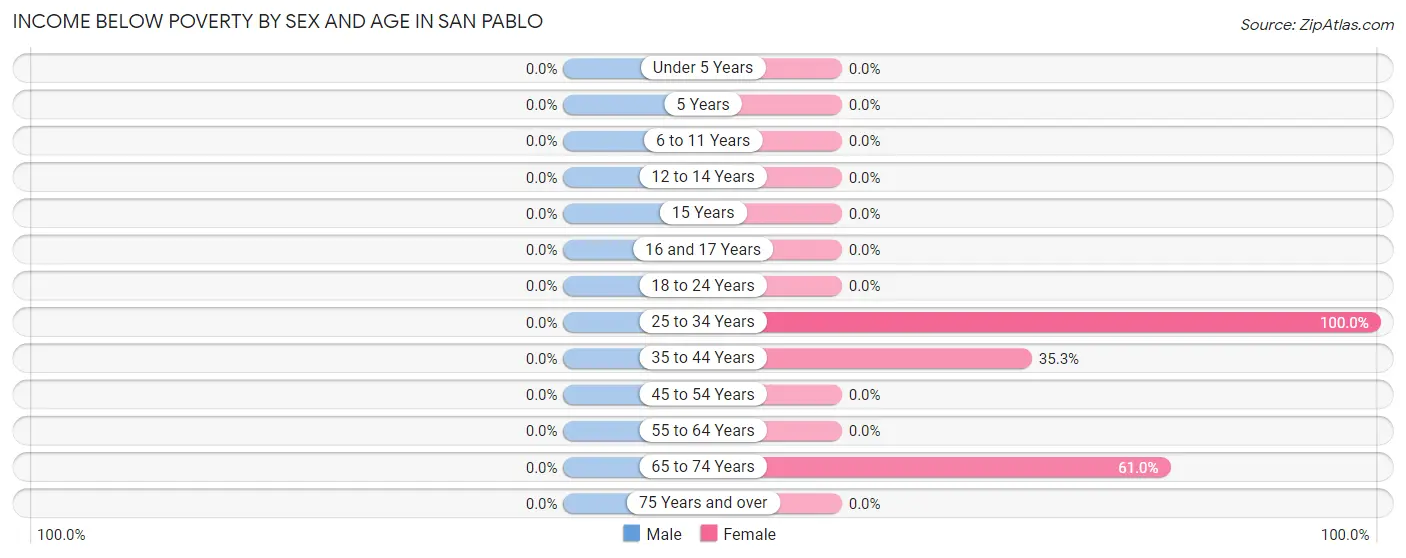
| Age Bracket | Male | Female |
| Under 5 Years | 0 (0.0%) | 0 (0.0%) |
| 5 Years | 0 (0.0%) | 0 (0.0%) |
| 6 to 11 Years | 0 (0.0%) | 0 (0.0%) |
| 12 to 14 Years | 0 (0.0%) | 0 (0.0%) |
| 15 Years | 0 (0.0%) | 0 (0.0%) |
| 16 and 17 Years | 0 (0.0%) | 0 (0.0%) |
| 18 to 24 Years | 0 (0.0%) | 0 (0.0%) |
| 25 to 34 Years | 0 (0.0%) | 19 (100.0%) |
| 35 to 44 Years | 0 (0.0%) | 12 (35.3%) |
| 45 to 54 Years | 0 (0.0%) | 0 (0.0%) |
| 55 to 64 Years | 0 (0.0%) | 0 (0.0%) |
| 65 to 74 Years | 0 (0.0%) | 25 (61.0%) |
| 75 Years and over | 0 (0.0%) | 0 (0.0%) |
| Total | 0 (0.0%) | 56 (23.6%) |
Income Above Poverty by Sex and Age in San Pablo
According to the poverty statistics in San Pablo, males aged 6 to 11 years and females aged 5 years are the age groups that are most secure financially, with 100.0% of males and 100.0% of females in these age groups living above the poverty line.
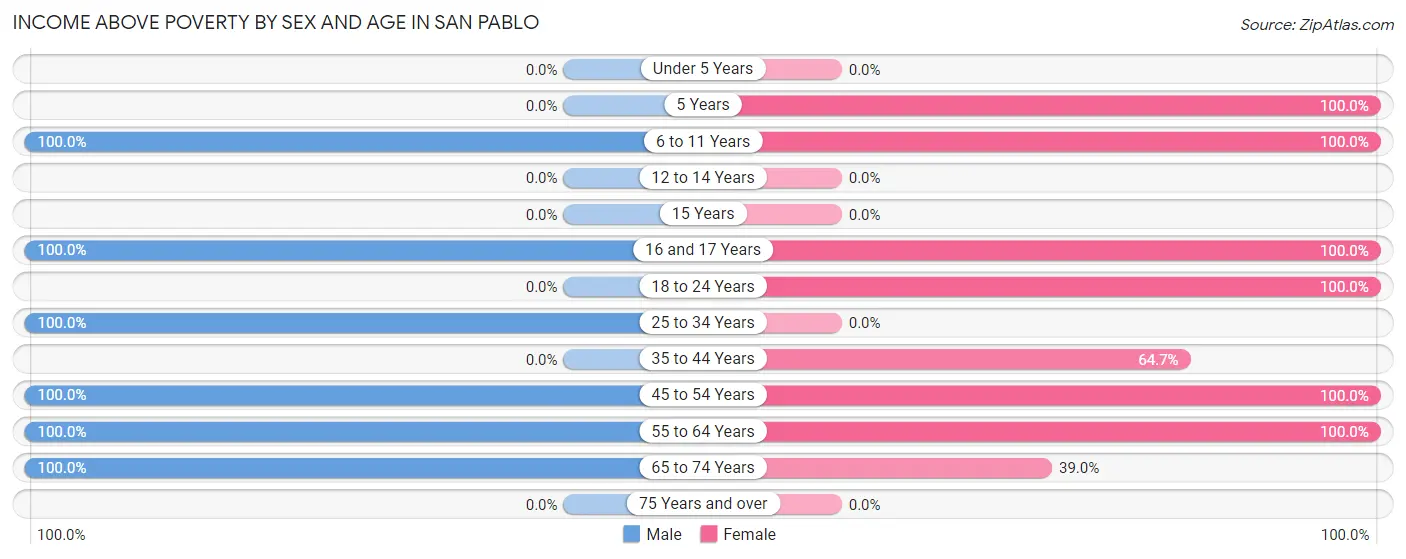
| Age Bracket | Male | Female |
| Under 5 Years | 0 (0.0%) | 0 (0.0%) |
| 5 Years | 0 (0.0%) | 15 (100.0%) |
| 6 to 11 Years | 13 (100.0%) | 20 (100.0%) |
| 12 to 14 Years | 0 (0.0%) | 0 (0.0%) |
| 15 Years | 0 (0.0%) | 0 (0.0%) |
| 16 and 17 Years | 15 (100.0%) | 5 (100.0%) |
| 18 to 24 Years | 0 (0.0%) | 36 (100.0%) |
| 25 to 34 Years | 37 (100.0%) | 0 (0.0%) |
| 35 to 44 Years | 0 (0.0%) | 22 (64.7%) |
| 45 to 54 Years | 37 (100.0%) | 4 (100.0%) |
| 55 to 64 Years | 53 (100.0%) | 63 (100.0%) |
| 65 to 74 Years | 57 (100.0%) | 16 (39.0%) |
| 75 Years and over | 0 (0.0%) | 0 (0.0%) |
| Total | 212 (100.0%) | 181 (76.4%) |
Income Below Poverty Among Married-Couple Families in San Pablo
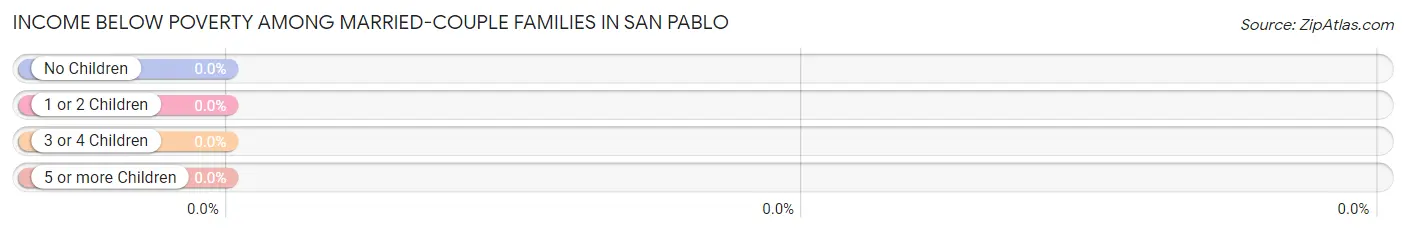
| Children | Above Poverty | Below Poverty |
| No Children | 64 (100.0%) | 0 (0.0%) |
| 1 or 2 Children | 11 (100.0%) | 0 (0.0%) |
| 3 or 4 Children | 10 (100.0%) | 0 (0.0%) |
| 5 or more Children | 0 (0.0%) | 0 (0.0%) |
| Total | 85 (100.0%) | 0 (0.0%) |
Income Below Poverty Among Single-Parent Households in San Pablo
| Children | Single Father | Single Mother |
| No Children | 0 (0.0%) | 0 (0.0%) |
| 1 or 2 Children | 0 (0.0%) | 0 (0.0%) |
| 3 or 4 Children | 0 (0.0%) | 0 (0.0%) |
| 5 or more Children | 0 (0.0%) | 0 (0.0%) |
| Total | 0 (0.0%) | 0 (0.0%) |
Income Below Poverty Among Married-Couple vs Single-Parent Households in San Pablo
| Children | Married-Couple Families | Single-Parent Households |
| No Children | 0 (0.0%) | 0 (0.0%) |
| 1 or 2 Children | 0 (0.0%) | 0 (0.0%) |
| 3 or 4 Children | 0 (0.0%) | 0 (0.0%) |
| 5 or more Children | 0 (0.0%) | 0 (0.0%) |
| Total | 0 (0.0%) | 0 (0.0%) |
Race in San Pablo
The most populous races in San Pablo are White / Caucasian (389 | 86.6%), Hispanic or Latino (226 | 50.3%), and Some other Race (46 | 10.2%).
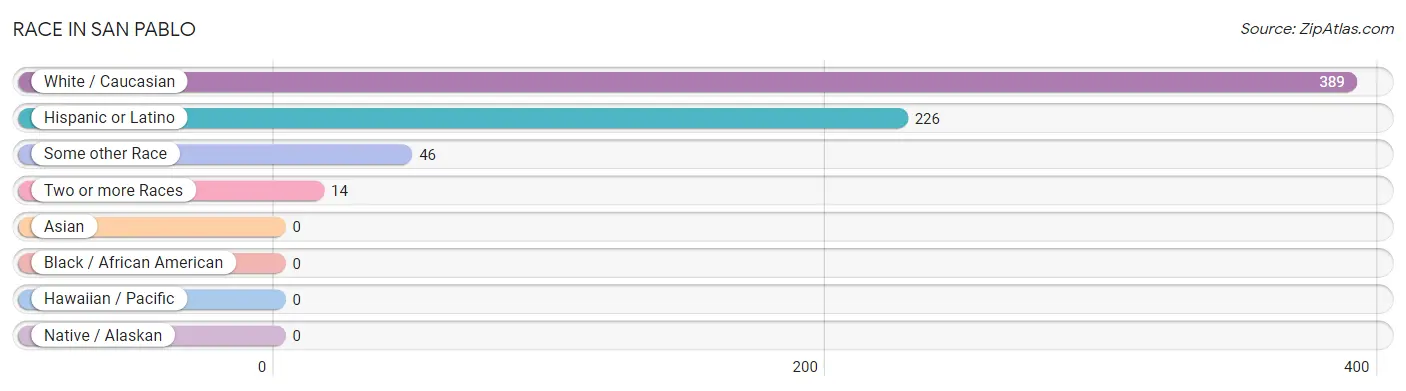
| Race | # Population | % Population |
| Asian | 0 | 0.0% |
| Black / African American | 0 | 0.0% |
| Hawaiian / Pacific | 0 | 0.0% |
| Hispanic or Latino | 226 | 50.3% |
| Native / Alaskan | 0 | 0.0% |
| White / Caucasian | 389 | 86.6% |
| Two or more Races | 14 | 3.1% |
| Some other Race | 46 | 10.2% |
| Total | 449 | 100.0% |
Ancestry in San Pablo
The most populous ancestries reported in San Pablo are Mexican (186 | 41.4%), English (73 | 16.3%), German (59 | 13.1%), Scotch-Irish (17 | 3.8%), and Swedish (11 | 2.5%), together accounting for 77.1% of all San Pablo residents.
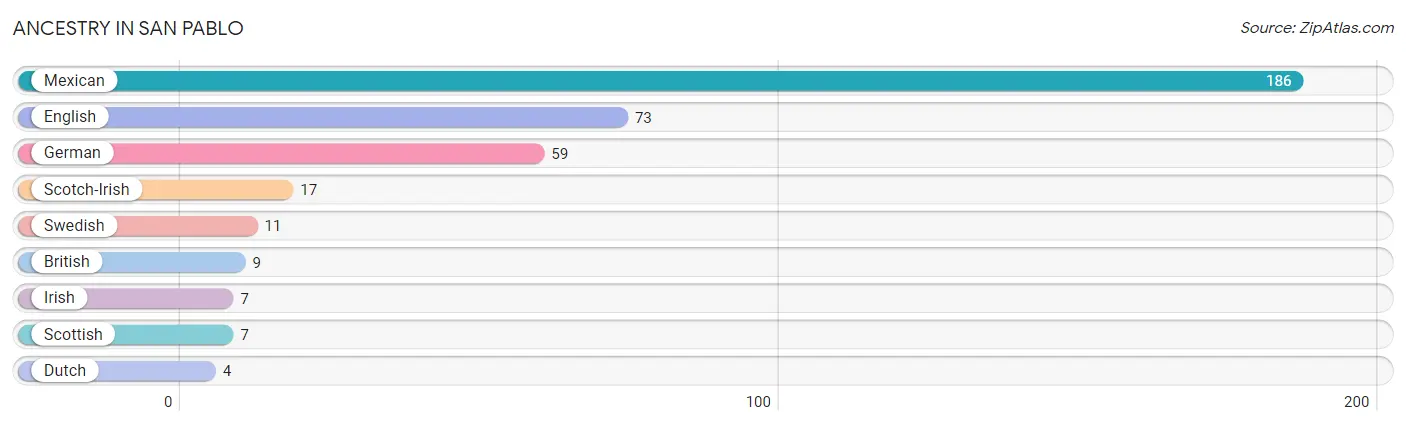
| Ancestry | # Population | % Population |
| British | 9 | 2.0% |
| Dutch | 4 | 0.9% |
| English | 73 | 16.3% |
| German | 59 | 13.1% |
| Irish | 7 | 1.6% |
| Mexican | 186 | 41.4% |
| Scotch-Irish | 17 | 3.8% |
| Scottish | 7 | 1.6% |
| Swedish | 11 | 2.5% | View All 9 Rows |
Immigrants in San Pablo
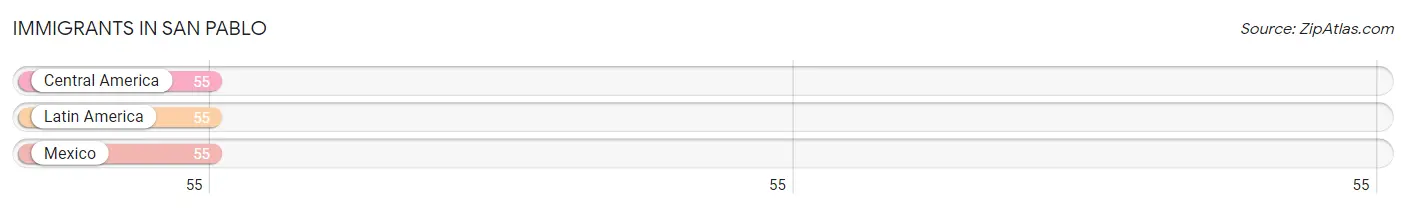
The most numerous immigrant groups reported in San Pablo came from Central America (55 | 12.2%), Latin America (55 | 12.2%), and Mexico (55 | 12.2%), together accounting for 36.7% of all San Pablo residents.
| Immigration Origin | # Population | % Population |
| Central America | 55 | 12.2% |
| Latin America | 55 | 12.2% |
| Mexico | 55 | 12.2% | View All 3 Rows |
Sex and Age in San Pablo
Sex and Age in San Pablo
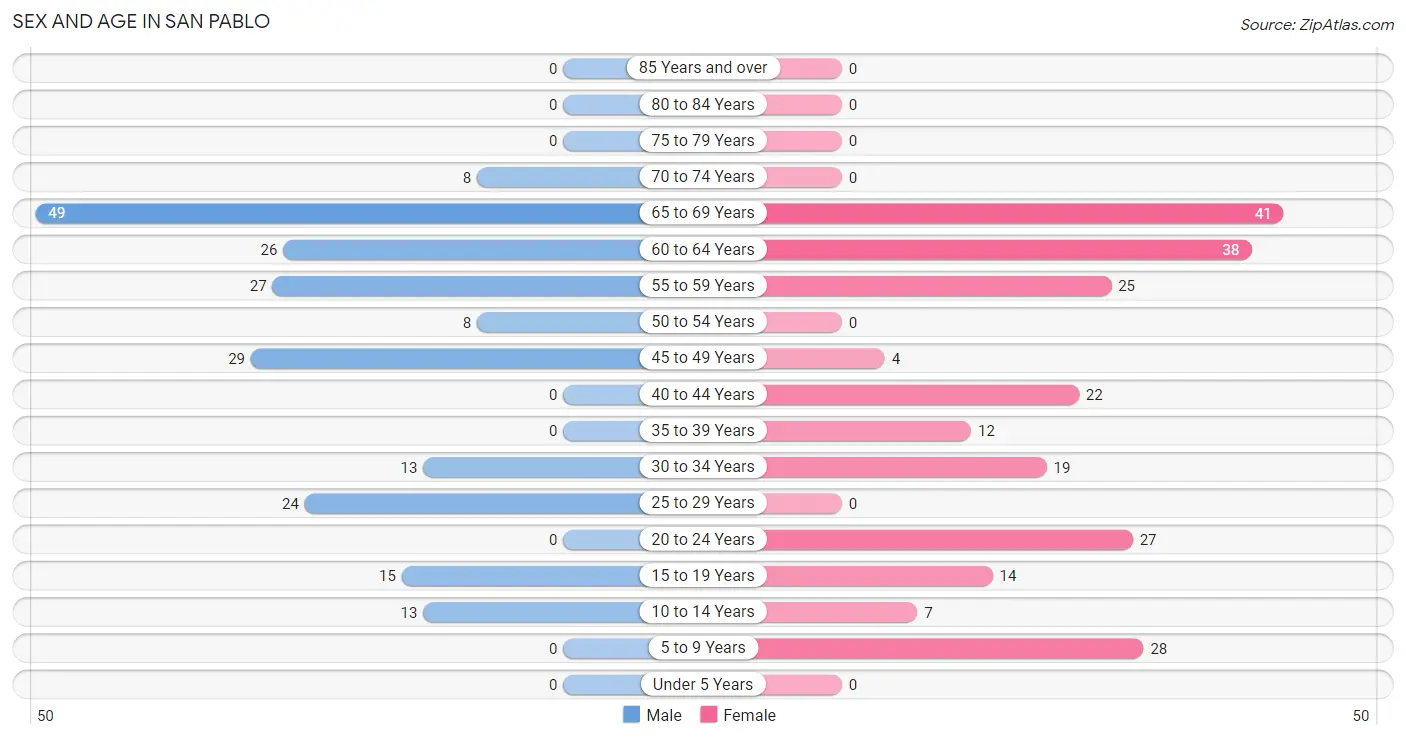
The most populous age groups in San Pablo are 65 to 69 Years (49 | 23.1%) for men and 65 to 69 Years (41 | 17.3%) for women.
| Age Bracket | Male | Female |
| Under 5 Years | 0 (0.0%) | 0 (0.0%) |
| 5 to 9 Years | 0 (0.0%) | 28 (11.8%) |
| 10 to 14 Years | 13 (6.1%) | 7 (2.9%) |
| 15 to 19 Years | 15 (7.1%) | 14 (5.9%) |
| 20 to 24 Years | 0 (0.0%) | 27 (11.4%) |
| 25 to 29 Years | 24 (11.3%) | 0 (0.0%) |
| 30 to 34 Years | 13 (6.1%) | 19 (8.0%) |
| 35 to 39 Years | 0 (0.0%) | 12 (5.1%) |
| 40 to 44 Years | 0 (0.0%) | 22 (9.3%) |
| 45 to 49 Years | 29 (13.7%) | 4 (1.7%) |
| 50 to 54 Years | 8 (3.8%) | 0 (0.0%) |
| 55 to 59 Years | 27 (12.7%) | 25 (10.5%) |
| 60 to 64 Years | 26 (12.3%) | 38 (16.0%) |
| 65 to 69 Years | 49 (23.1%) | 41 (17.3%) |
| 70 to 74 Years | 8 (3.8%) | 0 (0.0%) |
| 75 to 79 Years | 0 (0.0%) | 0 (0.0%) |
| 80 to 84 Years | 0 (0.0%) | 0 (0.0%) |
| 85 Years and over | 0 (0.0%) | 0 (0.0%) |
| Total | 212 (100.0%) | 237 (100.0%) |
Families and Households in San Pablo
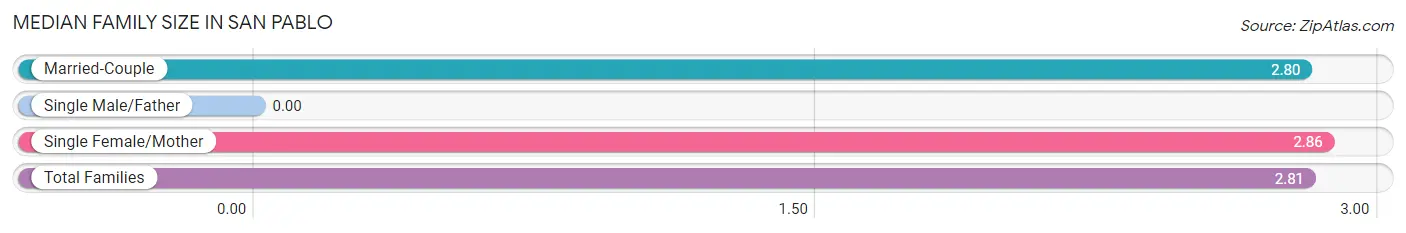
Median Family Size in San Pablo
| Family Type | # Families | Family Size |
| Married-Couple | 85 (75.2%) | 2.80 |
| Single Male/Father | 0 (0.0%) | - |
| Single Female/Mother | 28 (24.8%) | 2.86 |
| Total Families | 113 (100.0%) | 2.81 |
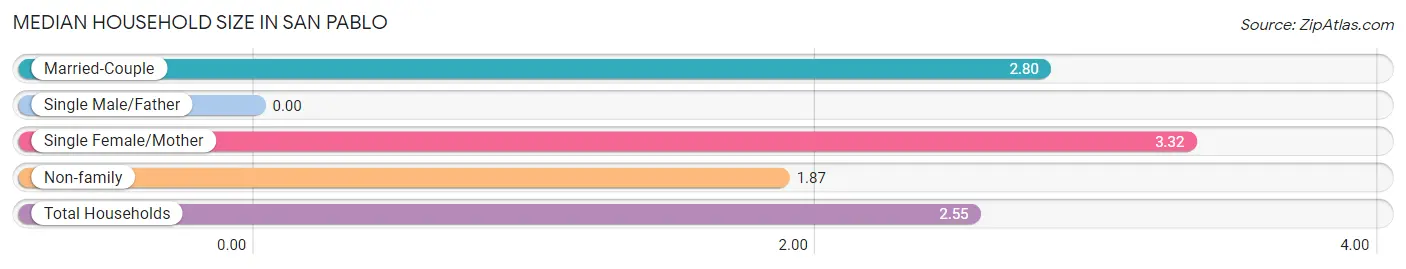
Median Household Size in San Pablo
| Household Type | # Households | Household Size |
| Married-Couple | 85 (48.3%) | 2.80 |
| Single Male/Father | 0 (0.0%) | - |
| Single Female/Mother | 28 (15.9%) | 3.32 |
| Non-family | 63 (35.8%) | 1.87 |
| Total Households | 176 (100.0%) | 2.55 |
Household Size by Marriage Status in San Pablo
Out of a total of 176 households in San Pablo, 113 (64.2%) are family households, while 63 (35.8%) are nonfamily households. The most numerous type of family households are 2-person households, comprising 71, and the most common type of nonfamily households are 2-person households, comprising 55.
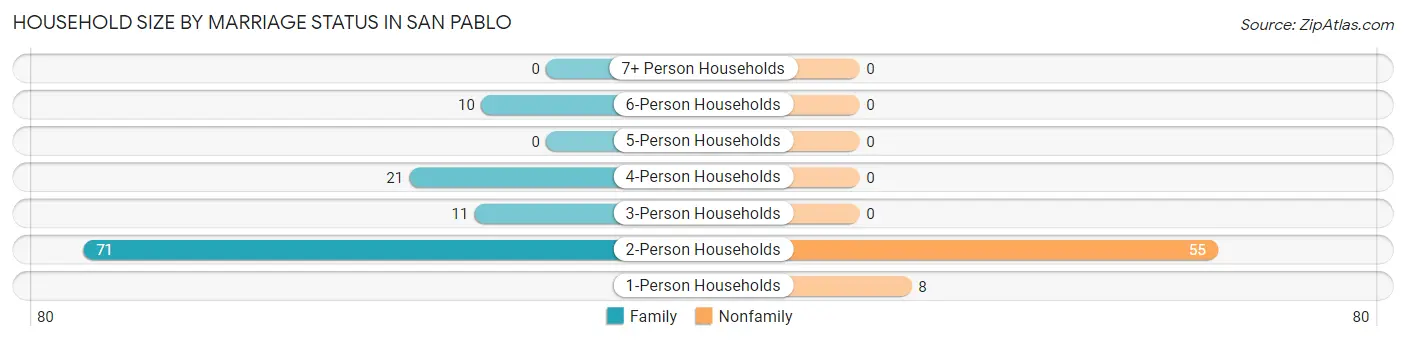
| Household Size | Family Households | Nonfamily Households |
| 1-Person Households | - | 8 (4.5%) |
| 2-Person Households | 71 (40.3%) | 55 (31.2%) |
| 3-Person Households | 11 (6.2%) | 0 (0.0%) |
| 4-Person Households | 21 (11.9%) | 0 (0.0%) |
| 5-Person Households | 0 (0.0%) | 0 (0.0%) |
| 6-Person Households | 10 (5.7%) | 0 (0.0%) |
| 7+ Person Households | 0 (0.0%) | 0 (0.0%) |
| Total | 113 (64.2%) | 63 (35.8%) |
Female Fertility in San Pablo
Fertility by Age in San Pablo
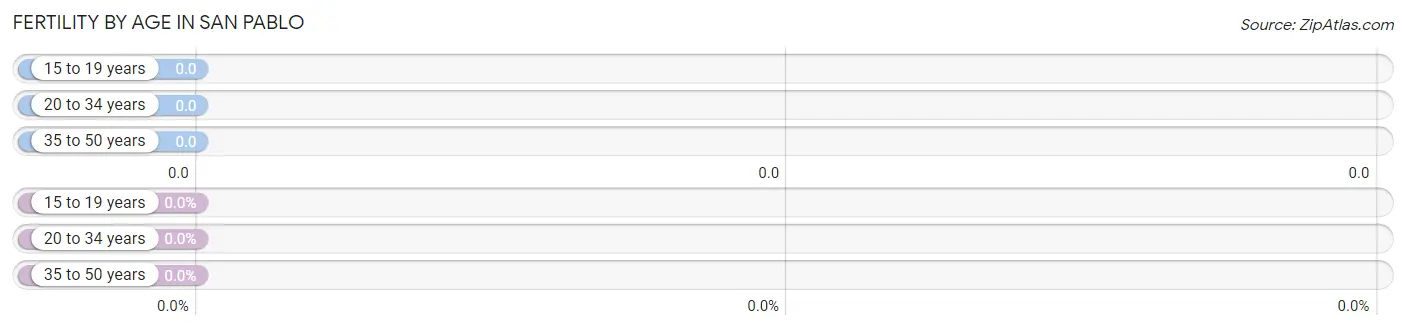
| Age Bracket | Women with Births | Births / 1,000 Women |
| 15 to 19 years | 0 (0.0%) | 0.0 |
| 20 to 34 years | 0 (0.0%) | 0.0 |
| 35 to 50 years | 0 (0.0%) | 0.0 |
| Total | 0 (0.0%) | 0.0 |
Fertility by Age by Marriage Status in San Pablo
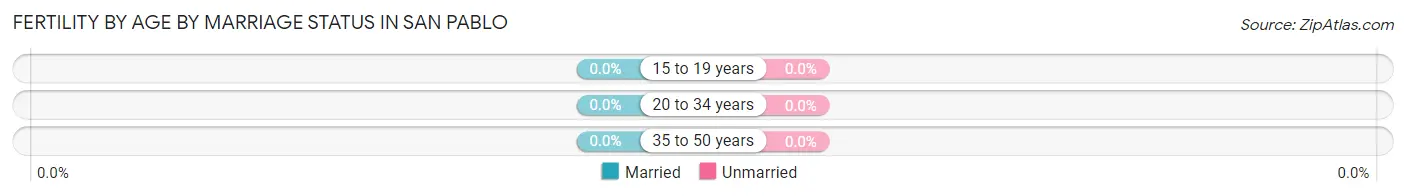
| Age Bracket | Married | Unmarried |
| 15 to 19 years | 0 (0.0%) | 0 (0.0%) |
| 20 to 34 years | 0 (0.0%) | 0 (0.0%) |
| 35 to 50 years | 0 (0.0%) | 0 (0.0%) |
| Total | 0 (0.0%) | 0 (0.0%) |
Fertility by Education in San Pablo
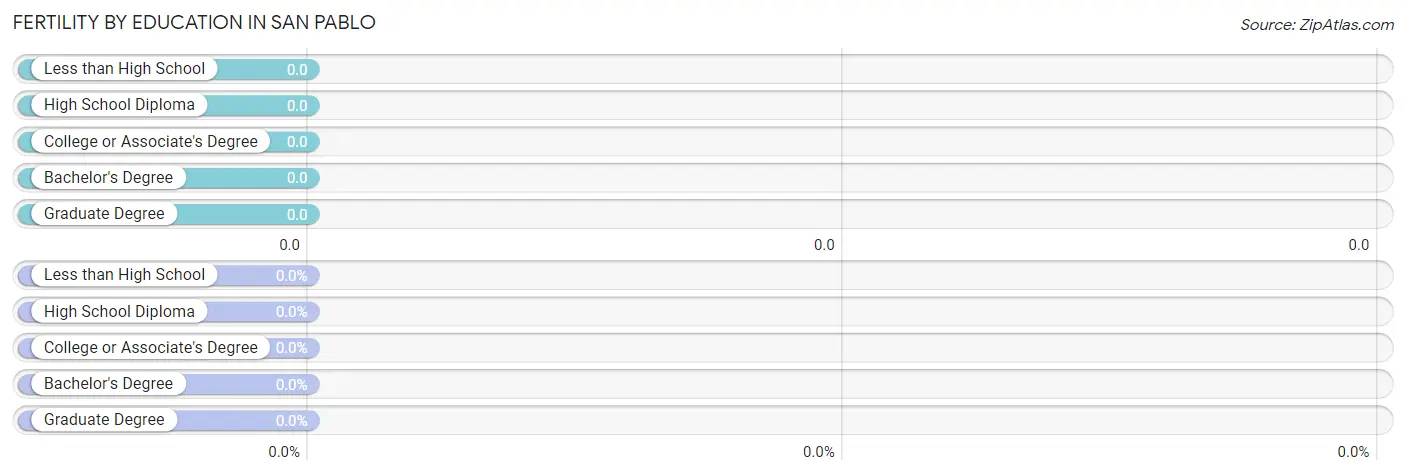
| Educational Attainment | Women with Births | Births / 1,000 Women |
| Less than High School | 0 (0.0%) | 0.0 |
| High School Diploma | 0 (0.0%) | 0.0 |
| College or Associate's Degree | 0 (0.0%) | 0.0 |
| Bachelor's Degree | 0 (0.0%) | 0.0 |
| Graduate Degree | 0 (0.0%) | 0.0 |
| Total | 0 (0.0%) | 0.0 |
Fertility by Education by Marriage Status in San Pablo
| Educational Attainment | Married | Unmarried |
| Less than High School | 0 (0.0%) | 0 (0.0%) |
| High School Diploma | 0 (0.0%) | 0 (0.0%) |
| College or Associate's Degree | 0 (0.0%) | 0 (0.0%) |
| Bachelor's Degree | 0 (0.0%) | 0 (0.0%) |
| Graduate Degree | 0 (0.0%) | 0 (0.0%) |
| Total | 0 (0.0%) | 0 (0.0%) |
Employment Characteristics in San Pablo
Employment by Class of Employer in San Pablo
Among the 219 employed individuals in San Pablo, private company employees (104 | 47.5%), local government employees (28 | 12.8%), and not-for-profit organizations (21 | 9.6%) make up the most common classes of employment.
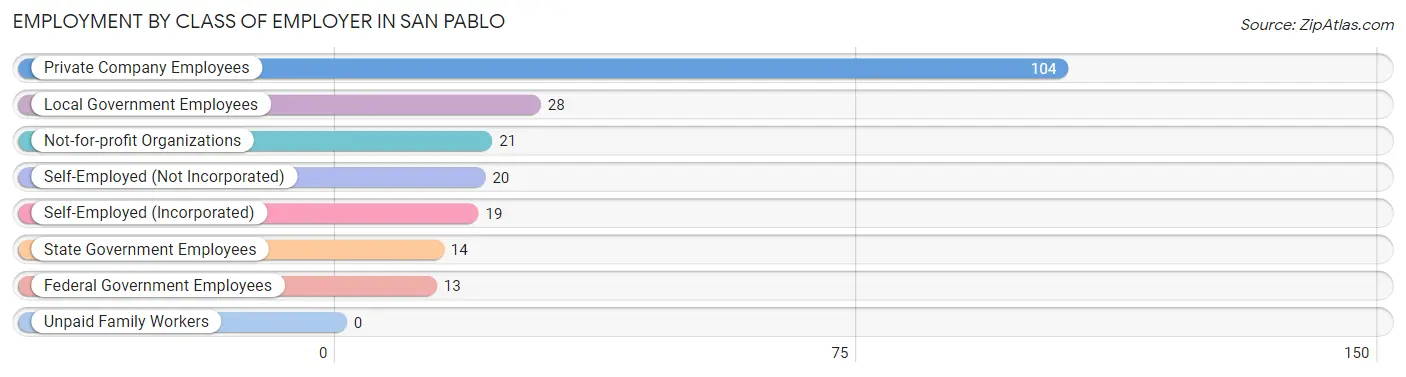
| Employer Class | # Employees | % Employees |
| Private Company Employees | 104 | 47.5% |
| Self-Employed (Incorporated) | 19 | 8.7% |
| Self-Employed (Not Incorporated) | 20 | 9.1% |
| Not-for-profit Organizations | 21 | 9.6% |
| Local Government Employees | 28 | 12.8% |
| State Government Employees | 14 | 6.4% |
| Federal Government Employees | 13 | 5.9% |
| Unpaid Family Workers | 0 | 0.0% |
| Total | 219 | 100.0% |
Employment Status by Age in San Pablo
According to the labor force statistics for San Pablo, out of the total population over 16 years of age (401), 55.9% or 224 individuals are in the labor force, with 2.2% or 5 of them unemployed. The age group with the highest labor force participation rate is 20 to 24 years, with 100.0% or 27 individuals in the labor force. Within the labor force, the 16 to 19 years age range has the highest percentage of unemployed individuals, with 100.0% or 5 of them being unemployed.
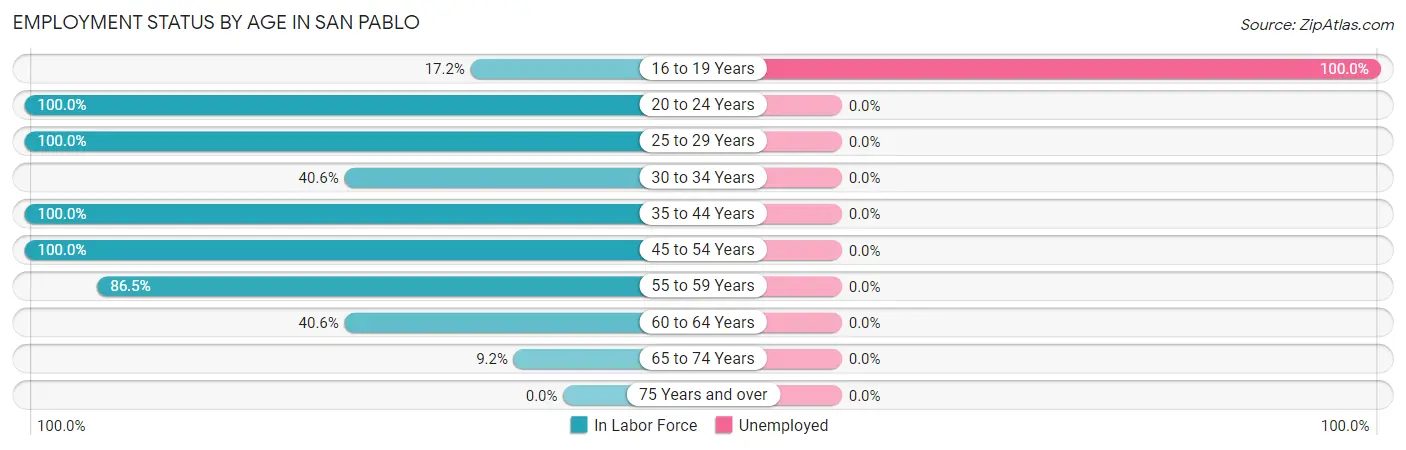
| Age Bracket | In Labor Force | Unemployed |
| 16 to 19 Years | 5 (17.2%) | 5 (100.0%) |
| 20 to 24 Years | 27 (100.0%) | 0 (0.0%) |
| 25 to 29 Years | 24 (100.0%) | 0 (0.0%) |
| 30 to 34 Years | 13 (40.6%) | 0 (0.0%) |
| 35 to 44 Years | 34 (100.0%) | 0 (0.0%) |
| 45 to 54 Years | 41 (100.0%) | 0 (0.0%) |
| 55 to 59 Years | 45 (86.5%) | 0 (0.0%) |
| 60 to 64 Years | 26 (40.6%) | 0 (0.0%) |
| 65 to 74 Years | 9 (9.2%) | 0 (0.0%) |
| 75 Years and over | 0 (0.0%) | 0 (0.0%) |
| Total | 224 (55.9%) | 5 (2.2%) |
Employment Status by Educational Attainment in San Pablo
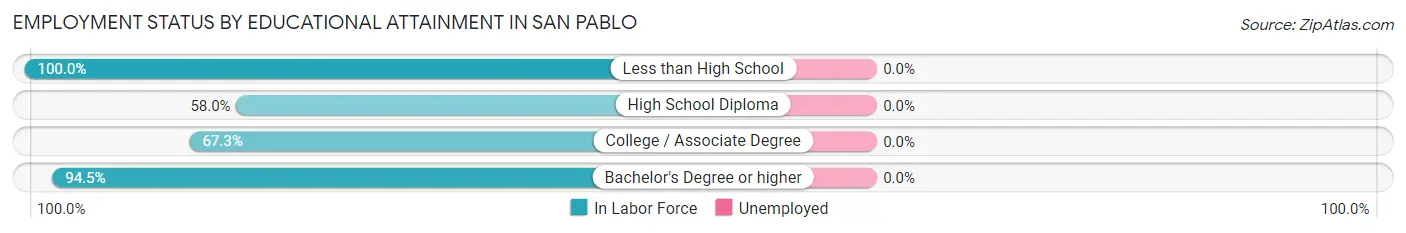
| Educational Attainment | In Labor Force | Unemployed |
| Less than High School | 19 (100.0%) | 0 (0.0%) |
| High School Diploma | 58 (58.0%) | 0 (0.0%) |
| College / Associate Degree | 37 (67.3%) | 0 (0.0%) |
| Bachelor's Degree or higher | 69 (94.5%) | 0 (0.0%) |
| Total | 183 (74.1%) | 0 (0.0%) |
Employment Occupations by Sex in San Pablo
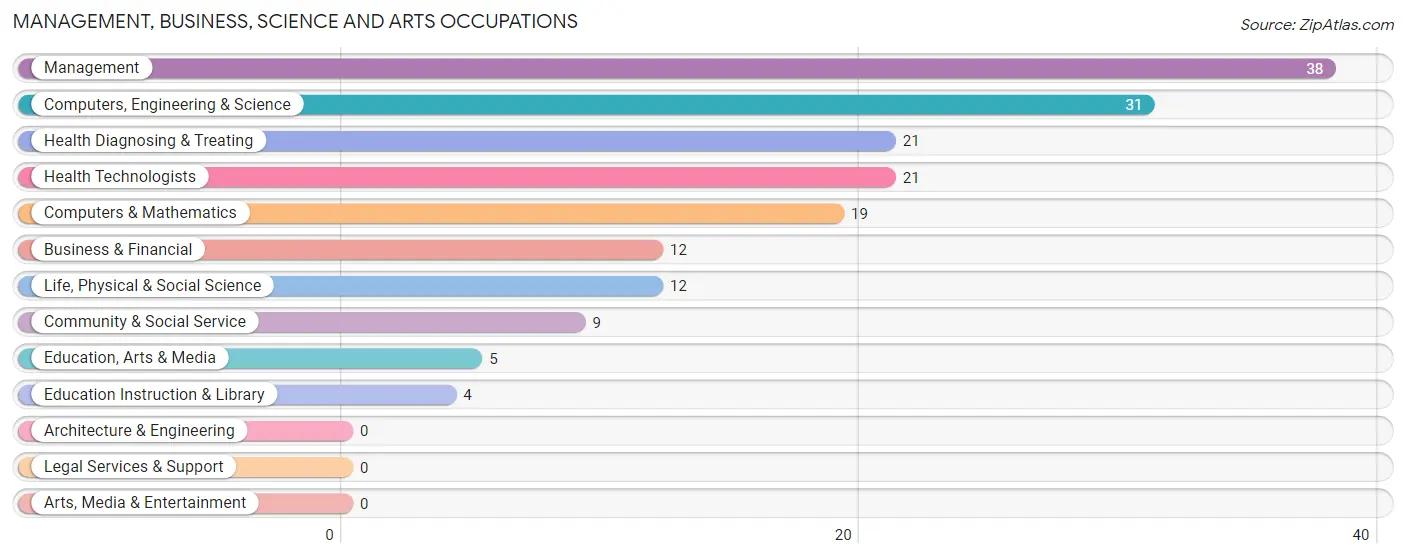
Management, Business, Science and Arts Occupations
The most common Management, Business, Science and Arts occupations in San Pablo are Management (38 | 17.3%), Computers, Engineering & Science (31 | 14.2%), Health Diagnosing & Treating (21 | 9.6%), Health Technologists (21 | 9.6%), and Computers & Mathematics (19 | 8.7%).
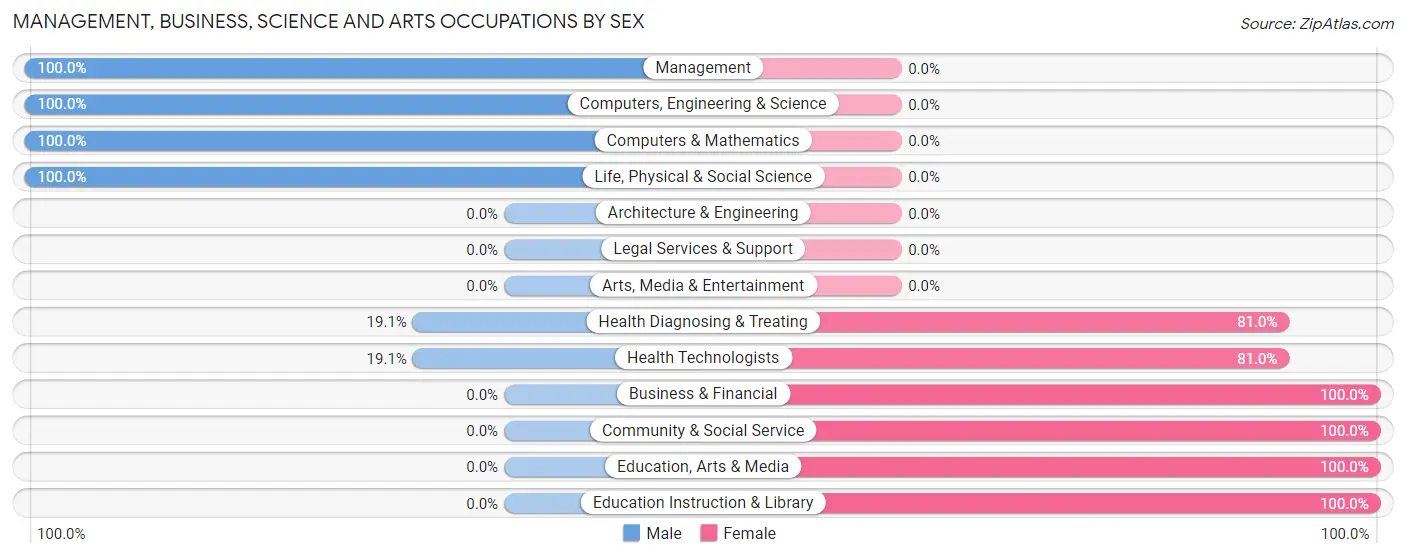
Management, Business, Science and Arts Occupations by Sex
Within the Management, Business, Science and Arts occupations in San Pablo, the most male-oriented occupations are Management (100.0%), Computers, Engineering & Science (100.0%), and Computers & Mathematics (100.0%), while the most female-oriented occupations are Business & Financial (100.0%), Community & Social Service (100.0%), and Education, Arts & Media (100.0%).
| Occupation | Male | Female |
| Management | 38 (100.0%) | 0 (0.0%) |
| Business & Financial | 0 (0.0%) | 12 (100.0%) |
| Computers, Engineering & Science | 31 (100.0%) | 0 (0.0%) |
| Computers & Mathematics | 19 (100.0%) | 0 (0.0%) |
| Architecture & Engineering | 0 (0.0%) | 0 (0.0%) |
| Life, Physical & Social Science | 12 (100.0%) | 0 (0.0%) |
| Community & Social Service | 0 (0.0%) | 9 (100.0%) |
| Education, Arts & Media | 0 (0.0%) | 5 (100.0%) |
| Legal Services & Support | 0 (0.0%) | 0 (0.0%) |
| Education Instruction & Library | 0 (0.0%) | 4 (100.0%) |
| Arts, Media & Entertainment | 0 (0.0%) | 0 (0.0%) |
| Health Diagnosing & Treating | 4 (19.1%) | 17 (80.9%) |
| Health Technologists | 4 (19.1%) | 17 (80.9%) |
| Total (Category) | 73 (65.8%) | 38 (34.2%) |
| Total (Overall) | 136 (62.1%) | 83 (37.9%) |
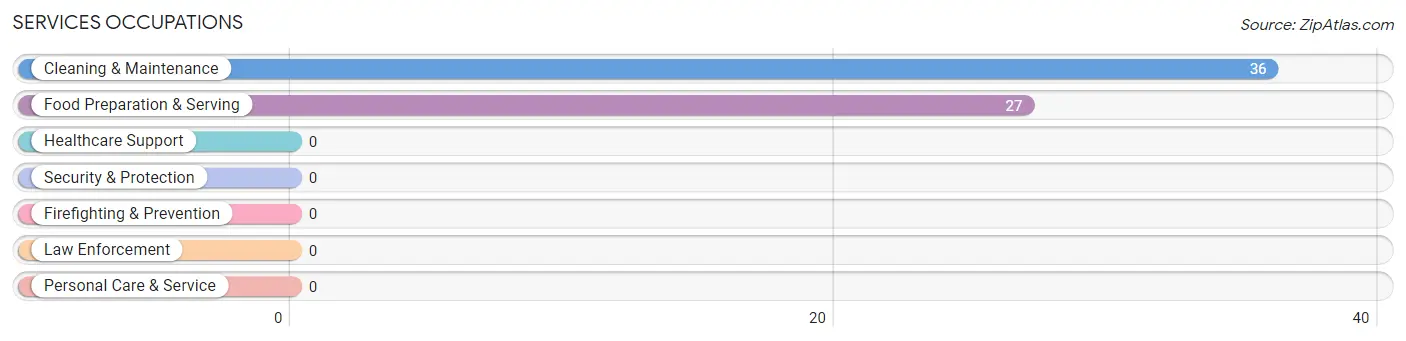
Services Occupations
The most common Services occupations in San Pablo are Cleaning & Maintenance (36 | 16.4%), and Food Preparation & Serving (27 | 12.3%).
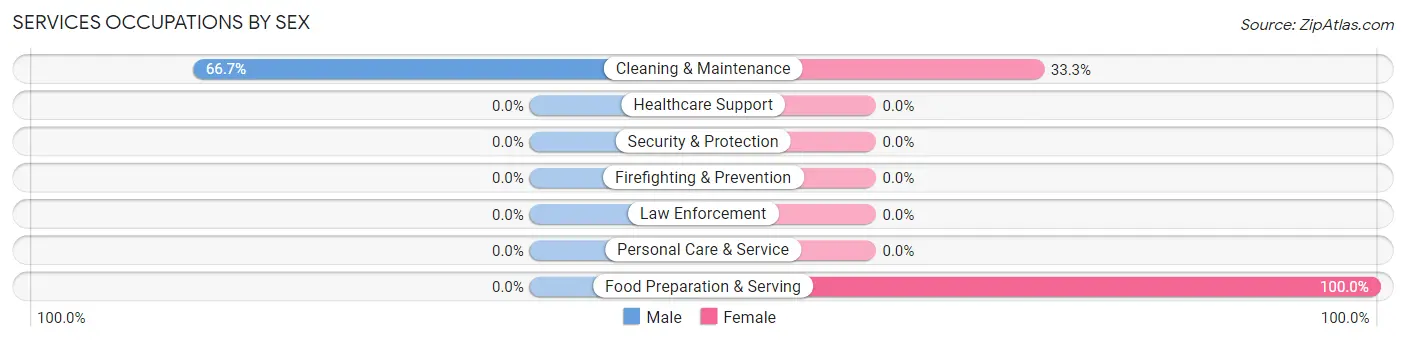
Services Occupations by Sex
| Occupation | Male | Female |
| Healthcare Support | 0 (0.0%) | 0 (0.0%) |
| Security & Protection | 0 (0.0%) | 0 (0.0%) |
| Firefighting & Prevention | 0 (0.0%) | 0 (0.0%) |
| Law Enforcement | 0 (0.0%) | 0 (0.0%) |
| Food Preparation & Serving | 0 (0.0%) | 27 (100.0%) |
| Cleaning & Maintenance | 24 (66.7%) | 12 (33.3%) |
| Personal Care & Service | 0 (0.0%) | 0 (0.0%) |
| Total (Category) | 24 (38.1%) | 39 (61.9%) |
| Total (Overall) | 136 (62.1%) | 83 (37.9%) |
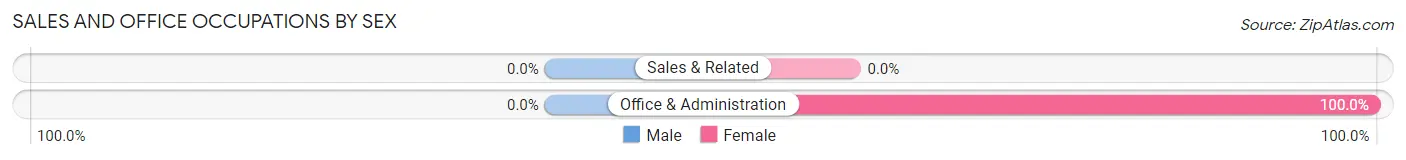
Sales and Office Occupations
The most common Sales and Office occupations in San Pablo are , and Office & Administration (6 | 2.7%).
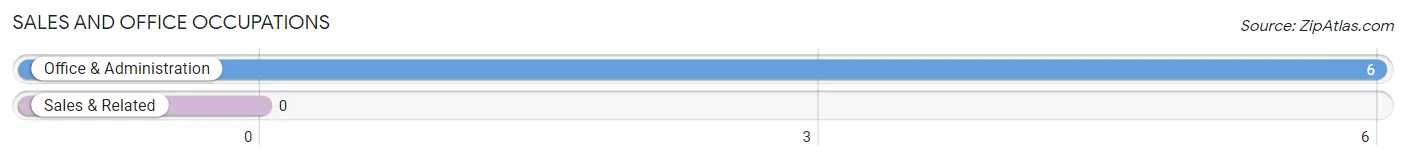
Sales and Office Occupations by Sex
| Occupation | Male | Female |
| Sales & Related | 0 (0.0%) | 0 (0.0%) |
| Office & Administration | 0 (0.0%) | 6 (100.0%) |
| Total (Category) | 0 (0.0%) | 6 (100.0%) |
| Total (Overall) | 136 (62.1%) | 83 (37.9%) |
Natural Resources, Construction and Maintenance Occupations
The most common Natural Resources, Construction and Maintenance occupations in San Pablo are , and Construction & Extraction (26 | 11.9%).
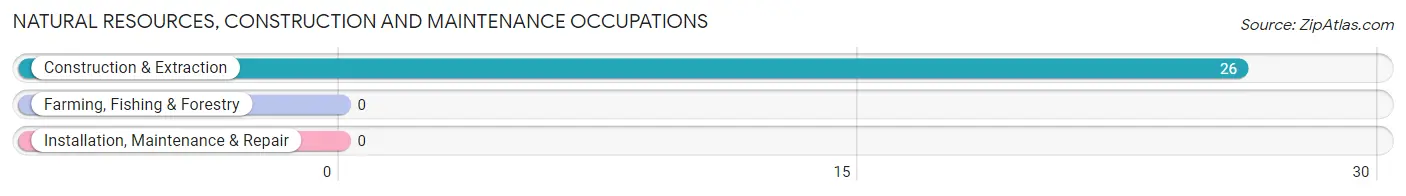
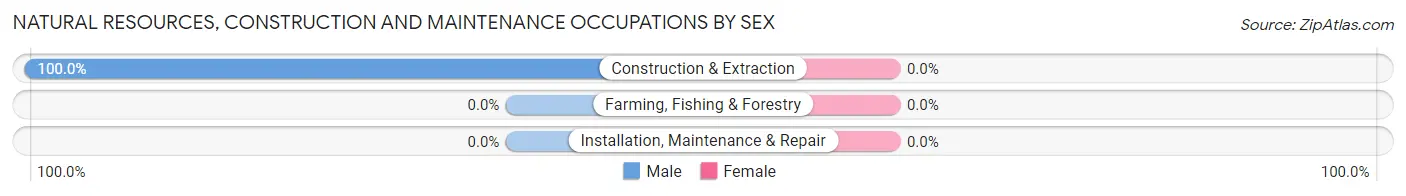
Natural Resources, Construction and Maintenance Occupations by Sex
| Occupation | Male | Female |
| Farming, Fishing & Forestry | 0 (0.0%) | 0 (0.0%) |
| Construction & Extraction | 26 (100.0%) | 0 (0.0%) |
| Installation, Maintenance & Repair | 0 (0.0%) | 0 (0.0%) |
| Total (Category) | 26 (100.0%) | 0 (0.0%) |
| Total (Overall) | 136 (62.1%) | 83 (37.9%) |
Production, Transportation and Moving Occupations
The most common Production, Transportation and Moving occupations in San Pablo are , and Production (13 | 5.9%).
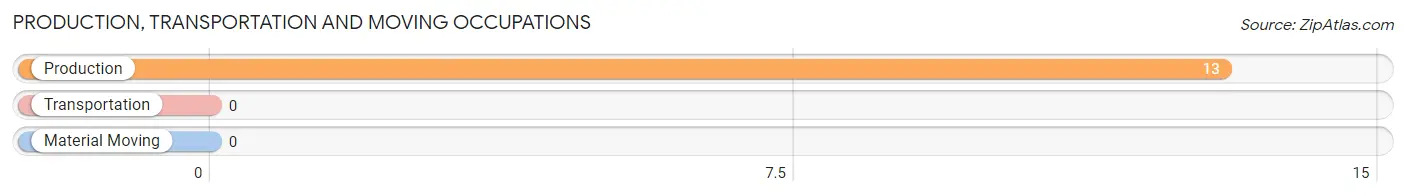
Production, Transportation and Moving Occupations by Sex
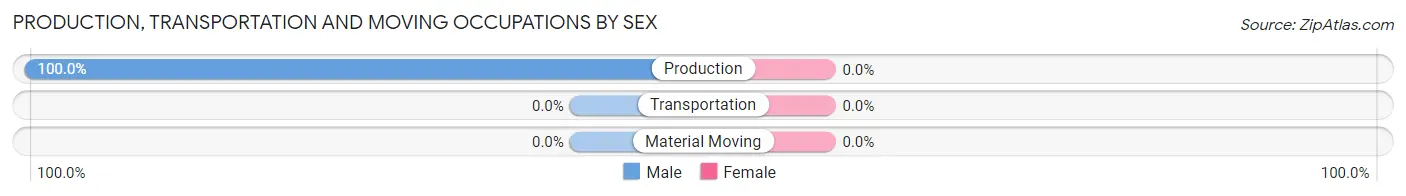
| Occupation | Male | Female |
| Production | 13 (100.0%) | 0 (0.0%) |
| Transportation | 0 (0.0%) | 0 (0.0%) |
| Material Moving | 0 (0.0%) | 0 (0.0%) |
| Total (Category) | 13 (100.0%) | 0 (0.0%) |
| Total (Overall) | 136 (62.1%) | 83 (37.9%) |
Employment Industries by Sex in San Pablo
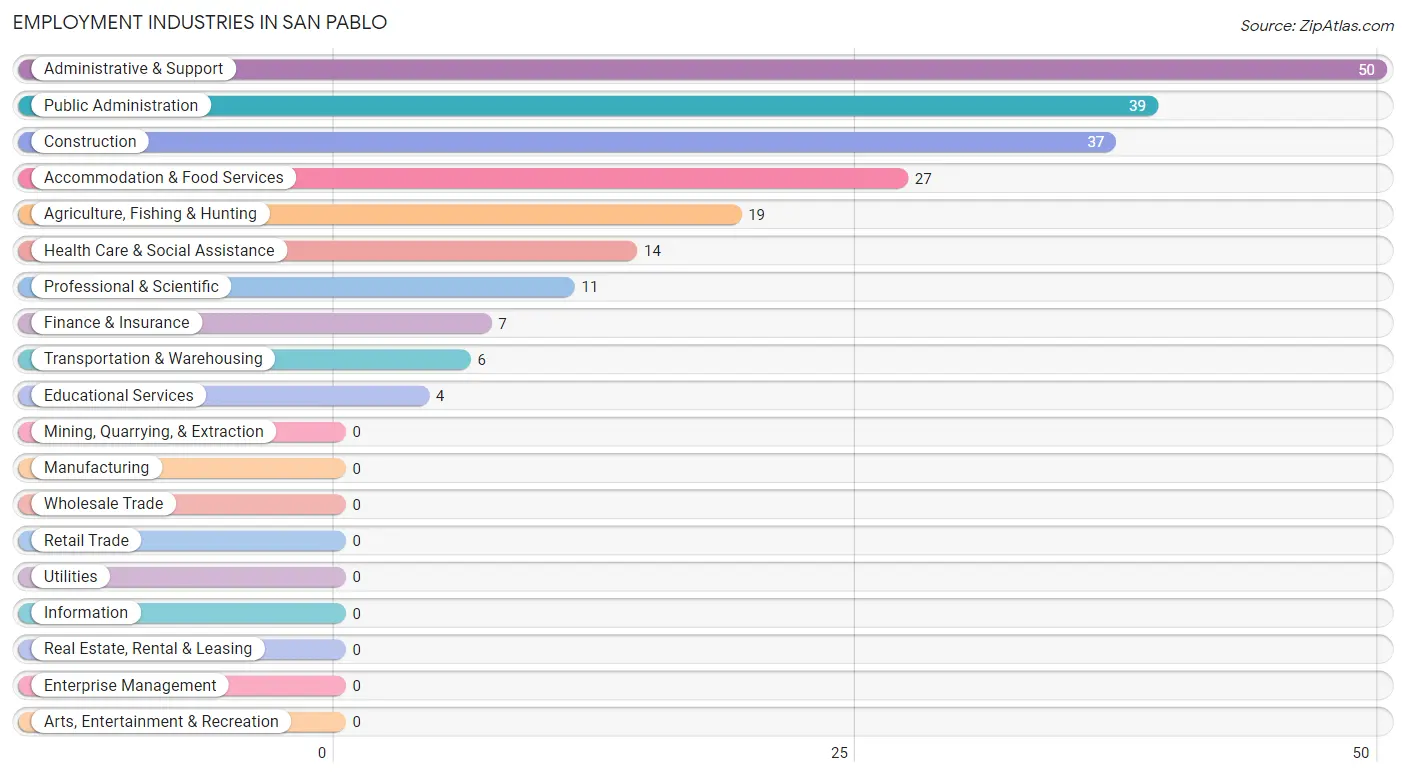
Employment Industries in San Pablo
The major employment industries in San Pablo include Administrative & Support (50 | 22.8%), Public Administration (39 | 17.8%), Construction (37 | 16.9%), Accommodation & Food Services (27 | 12.3%), and Agriculture, Fishing & Hunting (19 | 8.7%).
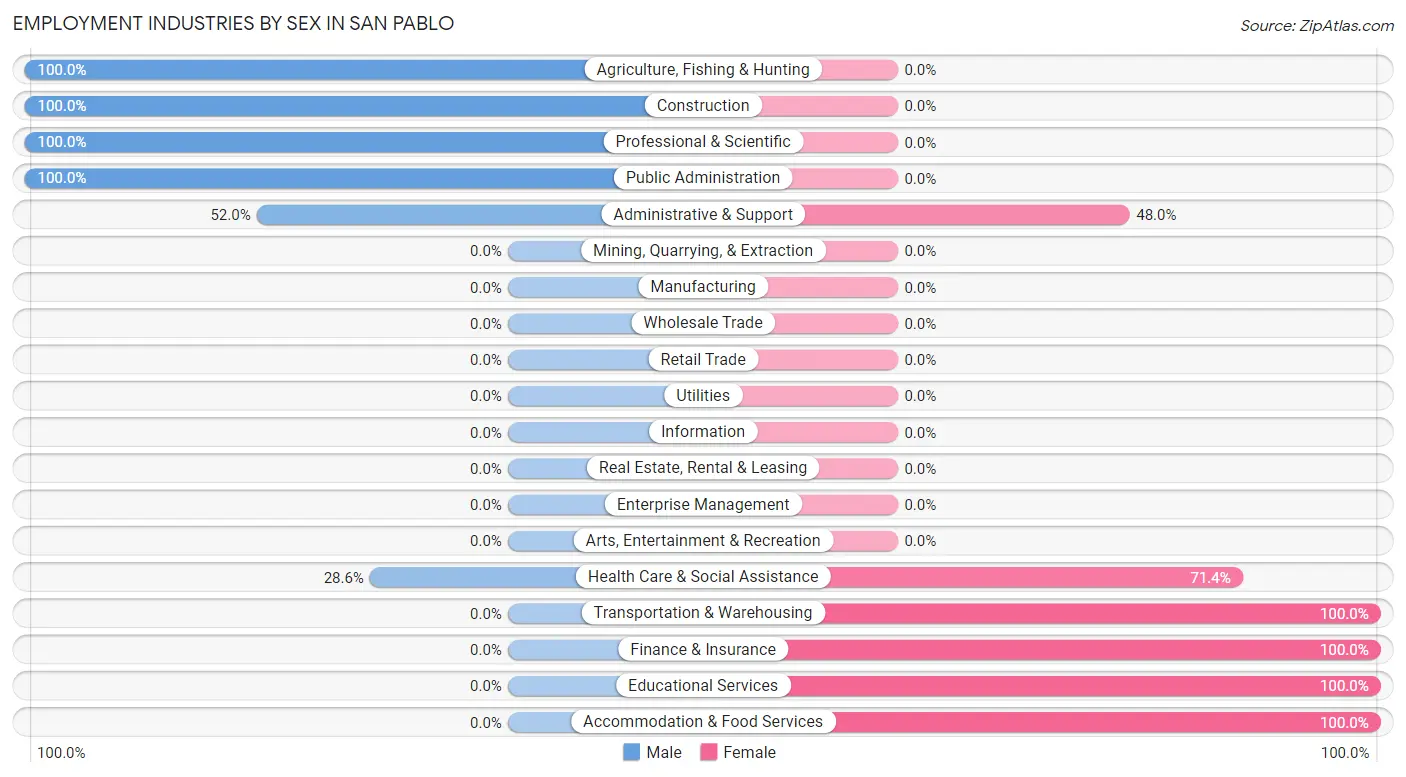
Employment Industries by Sex in San Pablo
The San Pablo industries that see more men than women are Agriculture, Fishing & Hunting (100.0%), Construction (100.0%), and Professional & Scientific (100.0%), whereas the industries that tend to have a higher number of women are Transportation & Warehousing (100.0%), Finance & Insurance (100.0%), and Educational Services (100.0%).
| Industry | Male | Female |
| Agriculture, Fishing & Hunting | 19 (100.0%) | 0 (0.0%) |
| Mining, Quarrying, & Extraction | 0 (0.0%) | 0 (0.0%) |
| Construction | 37 (100.0%) | 0 (0.0%) |
| Manufacturing | 0 (0.0%) | 0 (0.0%) |
| Wholesale Trade | 0 (0.0%) | 0 (0.0%) |
| Retail Trade | 0 (0.0%) | 0 (0.0%) |
| Transportation & Warehousing | 0 (0.0%) | 6 (100.0%) |
| Utilities | 0 (0.0%) | 0 (0.0%) |
| Information | 0 (0.0%) | 0 (0.0%) |
| Finance & Insurance | 0 (0.0%) | 7 (100.0%) |
| Real Estate, Rental & Leasing | 0 (0.0%) | 0 (0.0%) |
| Professional & Scientific | 11 (100.0%) | 0 (0.0%) |
| Enterprise Management | 0 (0.0%) | 0 (0.0%) |
| Administrative & Support | 26 (52.0%) | 24 (48.0%) |
| Educational Services | 0 (0.0%) | 4 (100.0%) |
| Health Care & Social Assistance | 4 (28.6%) | 10 (71.4%) |
| Arts, Entertainment & Recreation | 0 (0.0%) | 0 (0.0%) |
| Accommodation & Food Services | 0 (0.0%) | 27 (100.0%) |
| Public Administration | 39 (100.0%) | 0 (0.0%) |
| Total | 136 (62.1%) | 83 (37.9%) |
Education in San Pablo
School Enrollment in San Pablo
The most common levels of schooling among the 91 students in San Pablo are college / undergraduate (23 | 25.3%), kindergarten (21 | 23.1%), and middle school (20 | 22.0%).
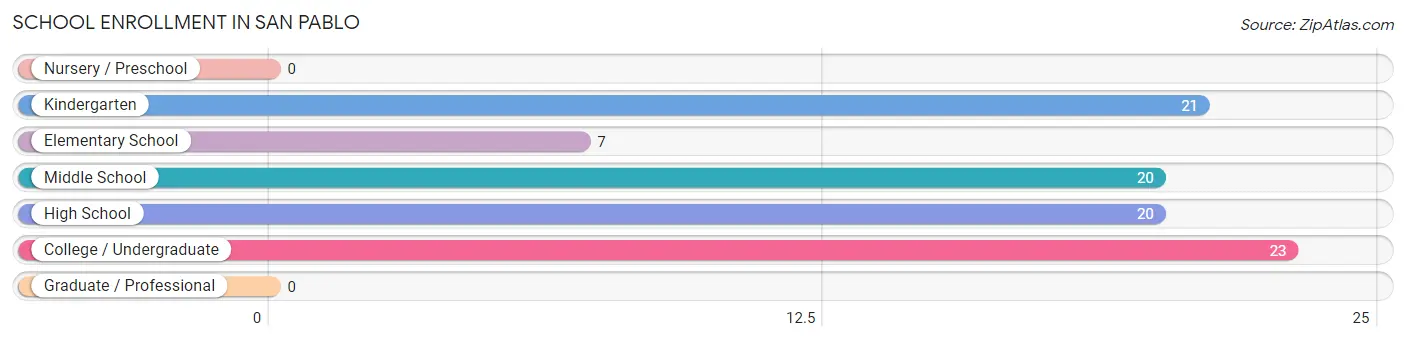
| School Level | # Students | % Students |
| Nursery / Preschool | 0 | 0.0% |
| Kindergarten | 21 | 23.1% |
| Elementary School | 7 | 7.7% |
| Middle School | 20 | 22.0% |
| High School | 20 | 22.0% |
| College / Undergraduate | 23 | 25.3% |
| Graduate / Professional | 0 | 0.0% |
| Total | 91 | 100.0% |
School Enrollment by Age by Funding Source in San Pablo
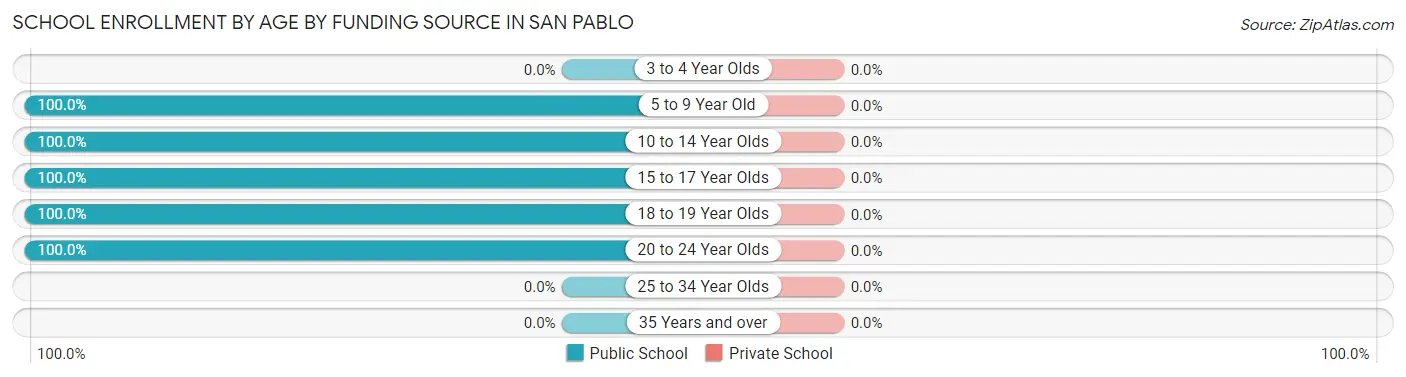
| Age Bracket | Public School | Private School |
| 3 to 4 Year Olds | 0 (0.0%) | 0 (0.0%) |
| 5 to 9 Year Old | 28 (100.0%) | 0 (0.0%) |
| 10 to 14 Year Olds | 20 (100.0%) | 0 (0.0%) |
| 15 to 17 Year Olds | 20 (100.0%) | 0 (0.0%) |
| 18 to 19 Year Olds | 9 (100.0%) | 0 (0.0%) |
| 20 to 24 Year Olds | 14 (100.0%) | 0 (0.0%) |
| 25 to 34 Year Olds | 0 (0.0%) | 0 (0.0%) |
| 35 Years and over | 0 (0.0%) | 0 (0.0%) |
| Total | 91 (100.0%) | 0 (0.0%) |
Educational Attainment by Field of Study in San Pablo
Liberal arts & history (34 | 25.2%), business (25 | 18.5%), science & technology (21 | 15.6%), communications (13 | 9.6%), and bio, nature & agricultural (12 | 8.9%) are the most common fields of study among 135 individuals in San Pablo who have obtained a bachelor's degree or higher.
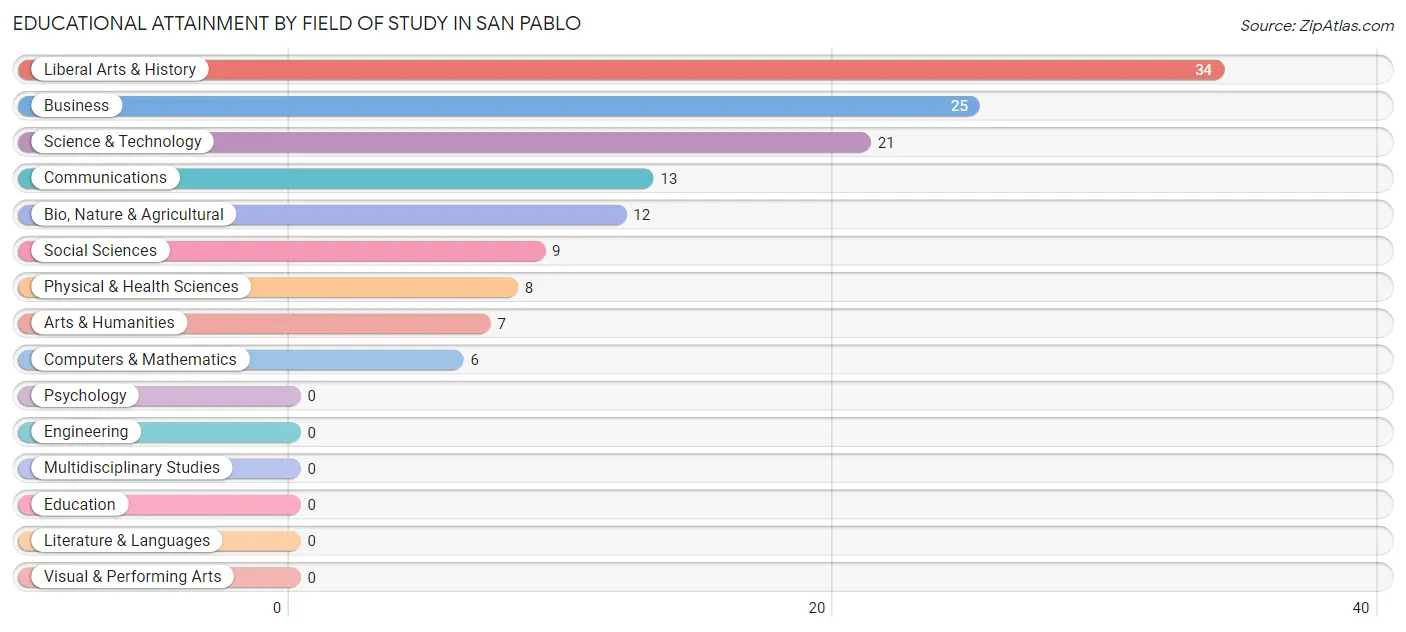
| Field of Study | # Graduates | % Graduates |
| Computers & Mathematics | 6 | 4.4% |
| Bio, Nature & Agricultural | 12 | 8.9% |
| Physical & Health Sciences | 8 | 5.9% |
| Psychology | 0 | 0.0% |
| Social Sciences | 9 | 6.7% |
| Engineering | 0 | 0.0% |
| Multidisciplinary Studies | 0 | 0.0% |
| Science & Technology | 21 | 15.6% |
| Business | 25 | 18.5% |
| Education | 0 | 0.0% |
| Literature & Languages | 0 | 0.0% |
| Liberal Arts & History | 34 | 25.2% |
| Visual & Performing Arts | 0 | 0.0% |
| Communications | 13 | 9.6% |
| Arts & Humanities | 7 | 5.2% |
| Total | 135 | 100.0% |
Transportation & Commute in San Pablo
Vehicle Availability by Sex in San Pablo
The most prevalent vehicle ownership categories in San Pablo are males with 2 vehicles (78, accounting for 57.4%) and females with 2 vehicles (31, making up 94.0%).
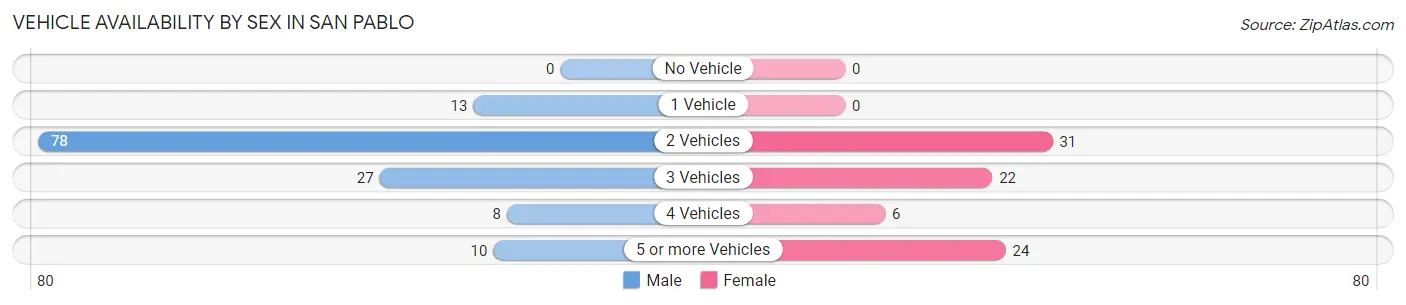
| Vehicles Available | Male | Female |
| No Vehicle | 0 (0.0%) | 0 (0.0%) |
| 1 Vehicle | 13 (9.6%) | 0 (0.0%) |
| 2 Vehicles | 78 (57.4%) | 31 (37.3%) |
| 3 Vehicles | 27 (19.9%) | 22 (26.5%) |
| 4 Vehicles | 8 (5.9%) | 6 (7.2%) |
| 5 or more Vehicles | 10 (7.3%) | 24 (28.9%) |
| Total | 136 (100.0%) | 83 (100.0%) |
Commute Time in San Pablo
The most frequently occuring commute durations in San Pablo are 10 to 14 minutes (64 commuters, 29.2%), 5 to 9 minutes (49 commuters, 22.4%), and 30 to 34 minutes (36 commuters, 16.4%).
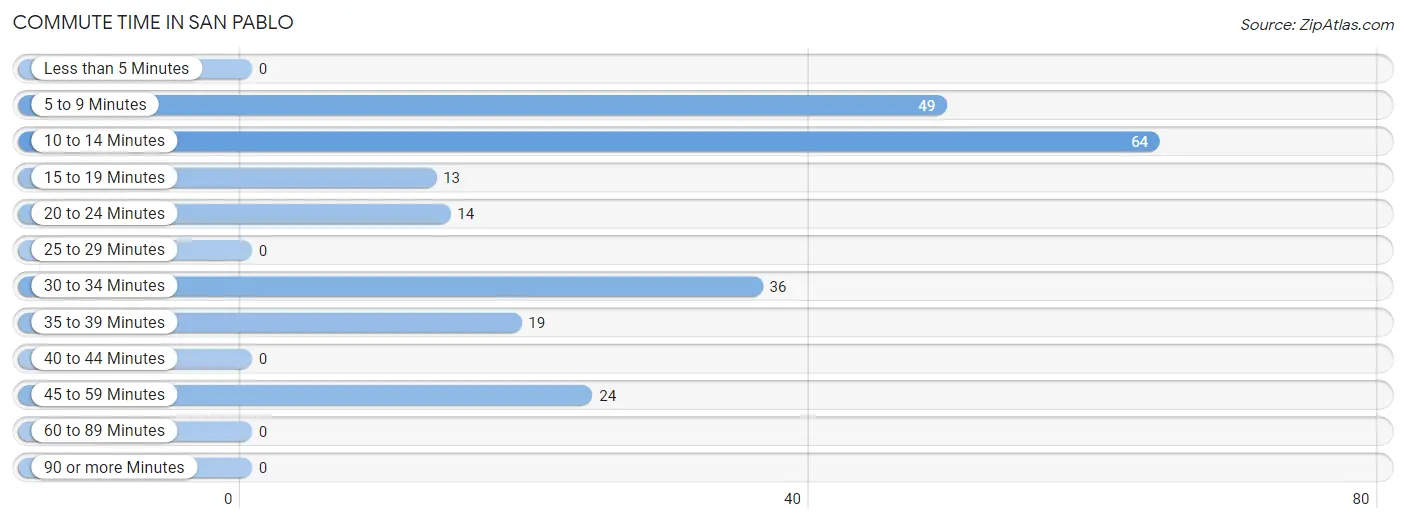
| Commute Time | # Commuters | % Commuters |
| Less than 5 Minutes | 0 | 0.0% |
| 5 to 9 Minutes | 49 | 22.4% |
| 10 to 14 Minutes | 64 | 29.2% |
| 15 to 19 Minutes | 13 | 5.9% |
| 20 to 24 Minutes | 14 | 6.4% |
| 25 to 29 Minutes | 0 | 0.0% |
| 30 to 34 Minutes | 36 | 16.4% |
| 35 to 39 Minutes | 19 | 8.7% |
| 40 to 44 Minutes | 0 | 0.0% |
| 45 to 59 Minutes | 24 | 11.0% |
| 60 to 89 Minutes | 0 | 0.0% |
| 90 or more Minutes | 0 | 0.0% |
Commute Time by Sex in San Pablo
The most common commute times in San Pablo are 10 to 14 minutes (55 commuters, 40.4%) for males and 5 to 9 minutes (49 commuters, 59.0%) for females.
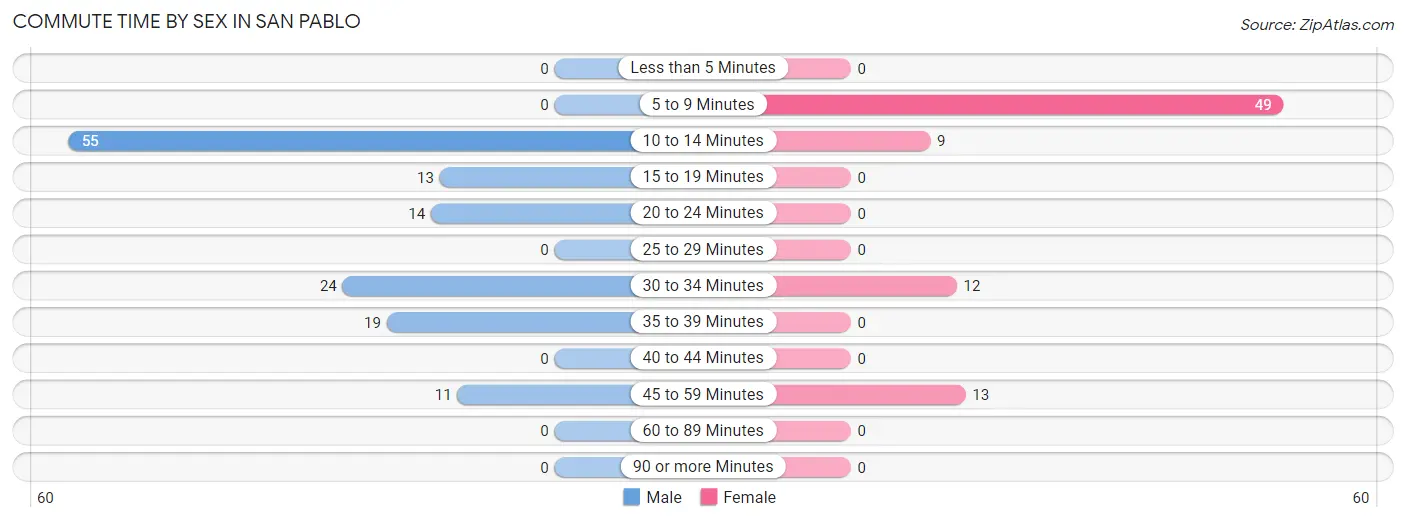
| Commute Time | Male | Female |
| Less than 5 Minutes | 0 (0.0%) | 0 (0.0%) |
| 5 to 9 Minutes | 0 (0.0%) | 49 (59.0%) |
| 10 to 14 Minutes | 55 (40.4%) | 9 (10.8%) |
| 15 to 19 Minutes | 13 (9.6%) | 0 (0.0%) |
| 20 to 24 Minutes | 14 (10.3%) | 0 (0.0%) |
| 25 to 29 Minutes | 0 (0.0%) | 0 (0.0%) |
| 30 to 34 Minutes | 24 (17.6%) | 12 (14.5%) |
| 35 to 39 Minutes | 19 (14.0%) | 0 (0.0%) |
| 40 to 44 Minutes | 0 (0.0%) | 0 (0.0%) |
| 45 to 59 Minutes | 11 (8.1%) | 13 (15.7%) |
| 60 to 89 Minutes | 0 (0.0%) | 0 (0.0%) |
| 90 or more Minutes | 0 (0.0%) | 0 (0.0%) |
Time of Departure to Work by Sex in San Pablo
The most frequent times of departure to work in San Pablo are 7:30 AM to 7:59 AM (47, 34.6%) for males and 9:00 AM to 9:59 AM (45, 54.2%) for females.
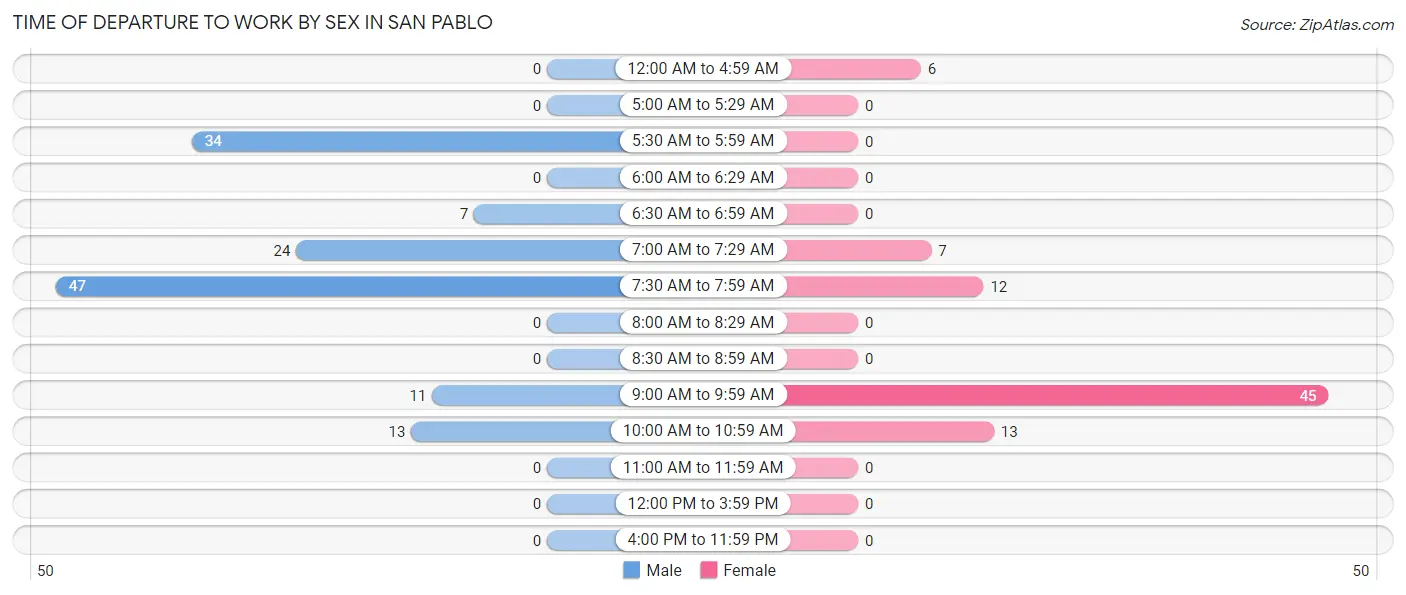
| Time of Departure | Male | Female |
| 12:00 AM to 4:59 AM | 0 (0.0%) | 6 (7.2%) |
| 5:00 AM to 5:29 AM | 0 (0.0%) | 0 (0.0%) |
| 5:30 AM to 5:59 AM | 34 (25.0%) | 0 (0.0%) |
| 6:00 AM to 6:29 AM | 0 (0.0%) | 0 (0.0%) |
| 6:30 AM to 6:59 AM | 7 (5.1%) | 0 (0.0%) |
| 7:00 AM to 7:29 AM | 24 (17.6%) | 7 (8.4%) |
| 7:30 AM to 7:59 AM | 47 (34.6%) | 12 (14.5%) |
| 8:00 AM to 8:29 AM | 0 (0.0%) | 0 (0.0%) |
| 8:30 AM to 8:59 AM | 0 (0.0%) | 0 (0.0%) |
| 9:00 AM to 9:59 AM | 11 (8.1%) | 45 (54.2%) |
| 10:00 AM to 10:59 AM | 13 (9.6%) | 13 (15.7%) |
| 11:00 AM to 11:59 AM | 0 (0.0%) | 0 (0.0%) |
| 12:00 PM to 3:59 PM | 0 (0.0%) | 0 (0.0%) |
| 4:00 PM to 11:59 PM | 0 (0.0%) | 0 (0.0%) |
| Total | 136 (100.0%) | 83 (100.0%) |
Housing Occupancy in San Pablo
Occupancy by Ownership in San Pablo
Of the total 176 dwellings in San Pablo, owner-occupied units account for 139 (79.0%), while renter-occupied units make up 37 (21.0%).
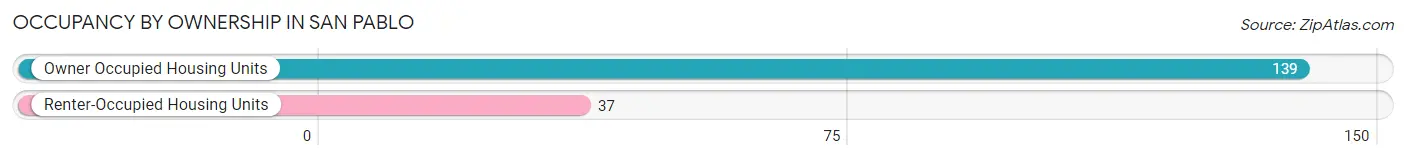
| Occupancy | # Housing Units | % Housing Units |
| Owner Occupied Housing Units | 139 | 79.0% |
| Renter-Occupied Housing Units | 37 | 21.0% |
| Total Occupied Housing Units | 176 | 100.0% |
Occupancy by Household Size in San Pablo
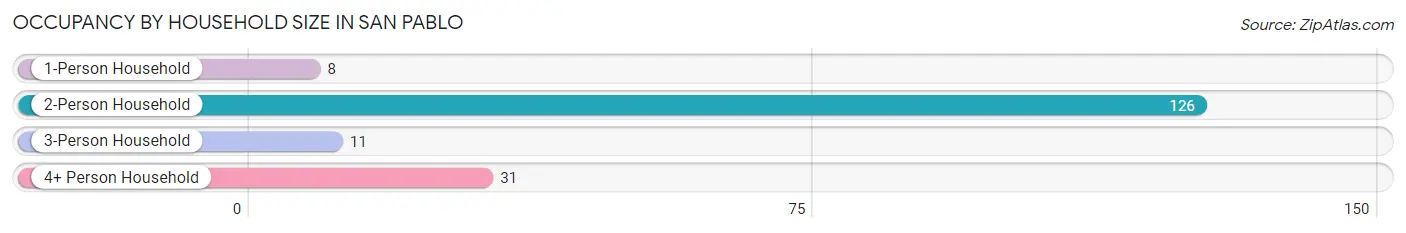
| Household Size | # Housing Units | % Housing Units |
| 1-Person Household | 8 | 4.5% |
| 2-Person Household | 126 | 71.6% |
| 3-Person Household | 11 | 6.2% |
| 4+ Person Household | 31 | 17.6% |
| Total Housing Units | 176 | 100.0% |
Occupancy by Ownership by Household Size in San Pablo
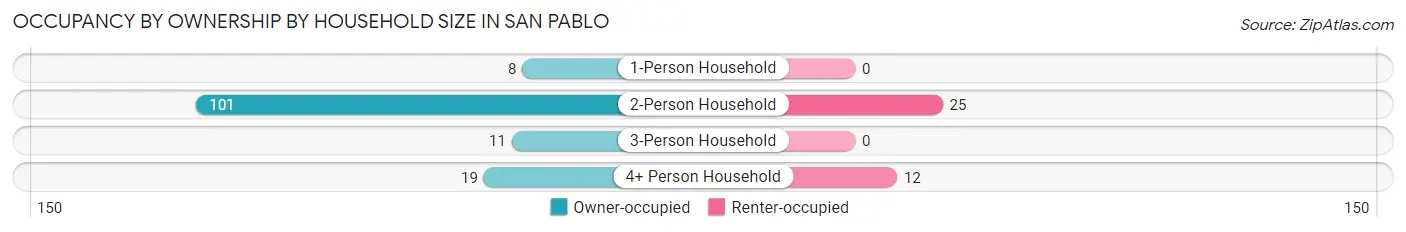
| Household Size | Owner-occupied | Renter-occupied |
| 1-Person Household | 8 (100.0%) | 0 (0.0%) |
| 2-Person Household | 101 (80.2%) | 25 (19.8%) |
| 3-Person Household | 11 (100.0%) | 0 (0.0%) |
| 4+ Person Household | 19 (61.3%) | 12 (38.7%) |
| Total Housing Units | 139 (79.0%) | 37 (21.0%) |
Occupancy by Educational Attainment in San Pablo
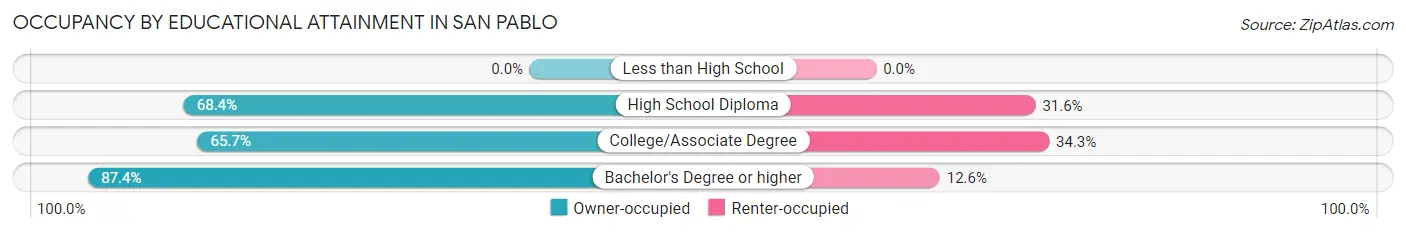
| Household Size | Owner-occupied | Renter-occupied |
| Less than High School | 0 (0.0%) | 0 (0.0%) |
| High School Diploma | 26 (68.4%) | 12 (31.6%) |
| College/Associate Degree | 23 (65.7%) | 12 (34.3%) |
| Bachelor's Degree or higher | 90 (87.4%) | 13 (12.6%) |
Occupancy by Age of Householder in San Pablo
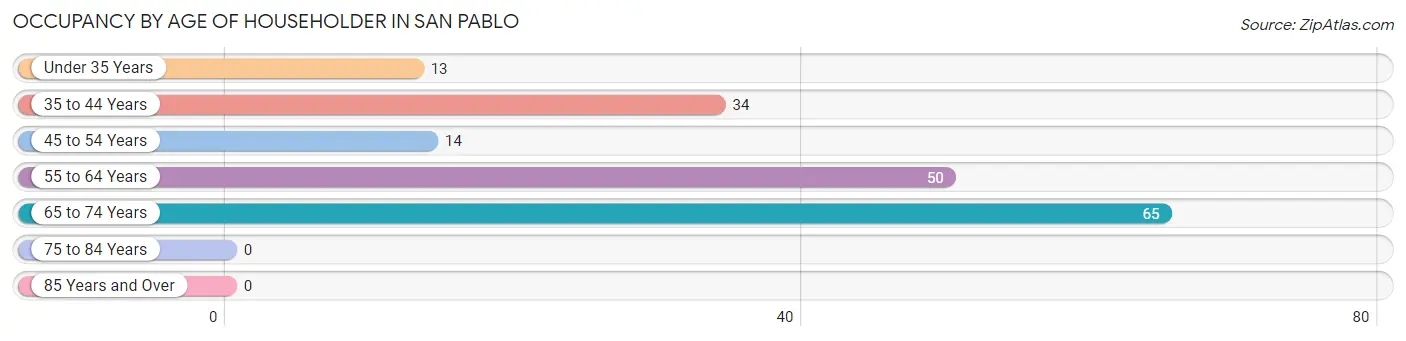
| Age Bracket | # Households | % Households |
| Under 35 Years | 13 | 7.4% |
| 35 to 44 Years | 34 | 19.3% |
| 45 to 54 Years | 14 | 8.0% |
| 55 to 64 Years | 50 | 28.4% |
| 65 to 74 Years | 65 | 36.9% |
| 75 to 84 Years | 0 | 0.0% |
| 85 Years and Over | 0 | 0.0% |
| Total | 176 | 100.0% |
Housing Finances in San Pablo
Median Income by Occupancy in San Pablo
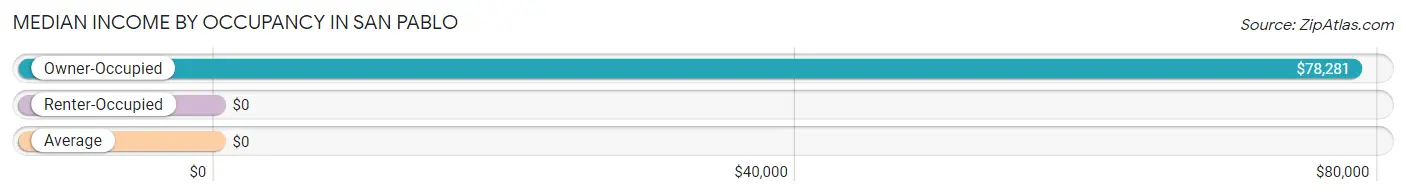
| Occupancy Type | # Households | Median Income |
| Owner-Occupied | 139 (79.0%) | $78,281 |
| Renter-Occupied | 37 (21.0%) | $0 |
| Average | 176 (100.0%) | $0 |
Occupancy by Householder Income Bracket in San Pablo
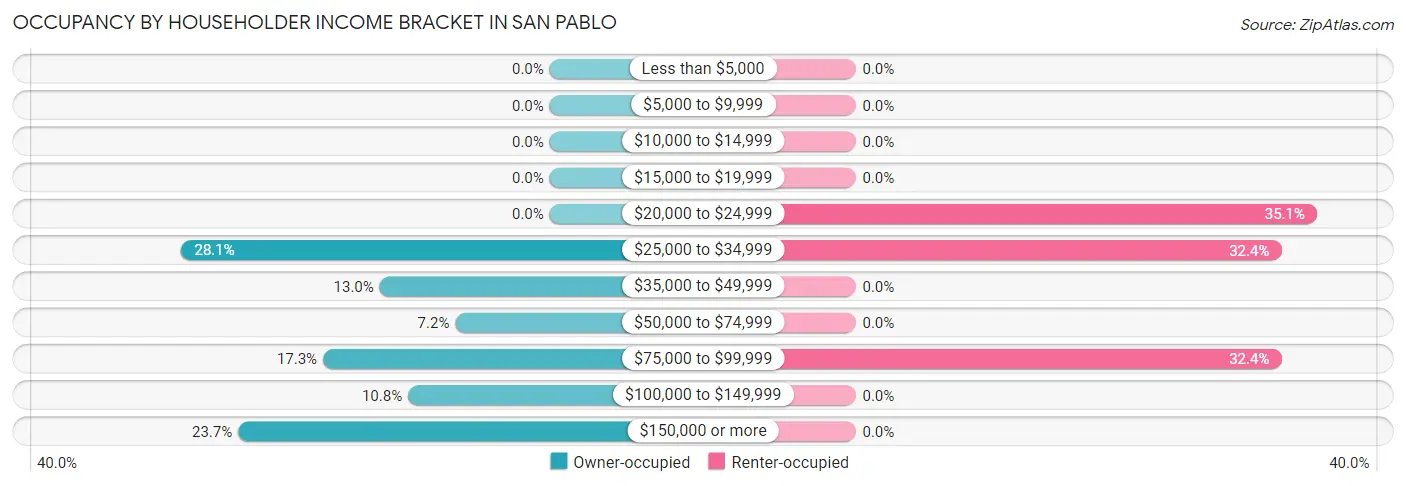
| Income Bracket | Owner-occupied | Renter-occupied |
| Less than $5,000 | 0 (0.0%) | 0 (0.0%) |
| $5,000 to $9,999 | 0 (0.0%) | 0 (0.0%) |
| $10,000 to $14,999 | 0 (0.0%) | 0 (0.0%) |
| $15,000 to $19,999 | 0 (0.0%) | 0 (0.0%) |
| $20,000 to $24,999 | 0 (0.0%) | 13 (35.1%) |
| $25,000 to $34,999 | 39 (28.1%) | 12 (32.4%) |
| $35,000 to $49,999 | 18 (13.0%) | 0 (0.0%) |
| $50,000 to $74,999 | 10 (7.2%) | 0 (0.0%) |
| $75,000 to $99,999 | 24 (17.3%) | 12 (32.4%) |
| $100,000 to $149,999 | 15 (10.8%) | 0 (0.0%) |
| $150,000 or more | 33 (23.7%) | 0 (0.0%) |
| Total | 139 (100.0%) | 37 (100.0%) |
Monthly Housing Cost Tiers in San Pablo
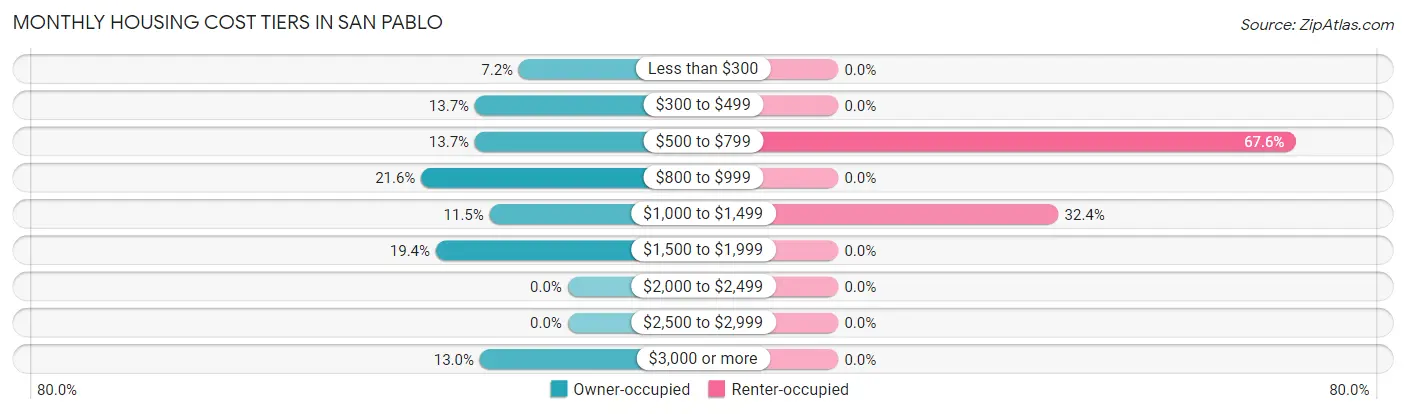
| Monthly Cost | Owner-occupied | Renter-occupied |
| Less than $300 | 10 (7.2%) | 0 (0.0%) |
| $300 to $499 | 19 (13.7%) | 0 (0.0%) |
| $500 to $799 | 19 (13.7%) | 25 (67.6%) |
| $800 to $999 | 30 (21.6%) | 0 (0.0%) |
| $1,000 to $1,499 | 16 (11.5%) | 12 (32.4%) |
| $1,500 to $1,999 | 27 (19.4%) | 0 (0.0%) |
| $2,000 to $2,499 | 0 (0.0%) | 0 (0.0%) |
| $2,500 to $2,999 | 0 (0.0%) | 0 (0.0%) |
| $3,000 or more | 18 (13.0%) | 0 (0.0%) |
| Total | 139 (100.0%) | 37 (100.0%) |
Physical Housing Characteristics in San Pablo
Housing Structures in San Pablo
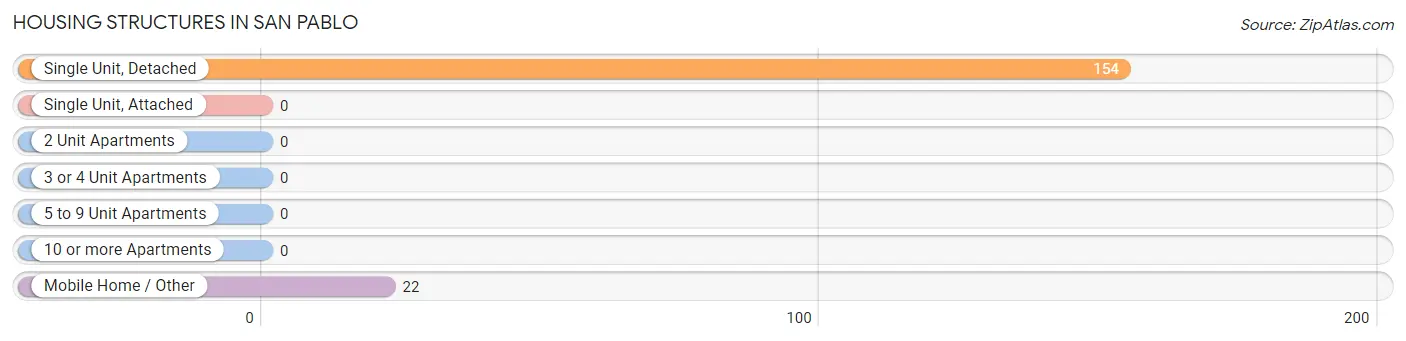
| Structure Type | # Housing Units | % Housing Units |
| Single Unit, Detached | 154 | 87.5% |
| Single Unit, Attached | 0 | 0.0% |
| 2 Unit Apartments | 0 | 0.0% |
| 3 or 4 Unit Apartments | 0 | 0.0% |
| 5 to 9 Unit Apartments | 0 | 0.0% |
| 10 or more Apartments | 0 | 0.0% |
| Mobile Home / Other | 22 | 12.5% |
| Total | 176 | 100.0% |
Housing Structures by Occupancy in San Pablo
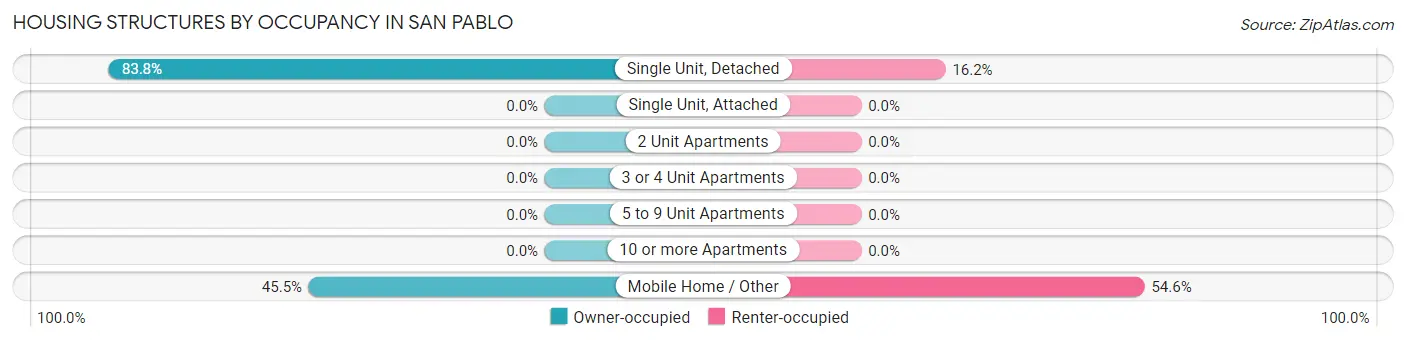
| Structure Type | Owner-occupied | Renter-occupied |
| Single Unit, Detached | 129 (83.8%) | 25 (16.2%) |
| Single Unit, Attached | 0 (0.0%) | 0 (0.0%) |
| 2 Unit Apartments | 0 (0.0%) | 0 (0.0%) |
| 3 or 4 Unit Apartments | 0 (0.0%) | 0 (0.0%) |
| 5 to 9 Unit Apartments | 0 (0.0%) | 0 (0.0%) |
| 10 or more Apartments | 0 (0.0%) | 0 (0.0%) |
| Mobile Home / Other | 10 (45.5%) | 12 (54.5%) |
| Total | 139 (79.0%) | 37 (21.0%) |
Housing Structures by Number of Rooms in San Pablo
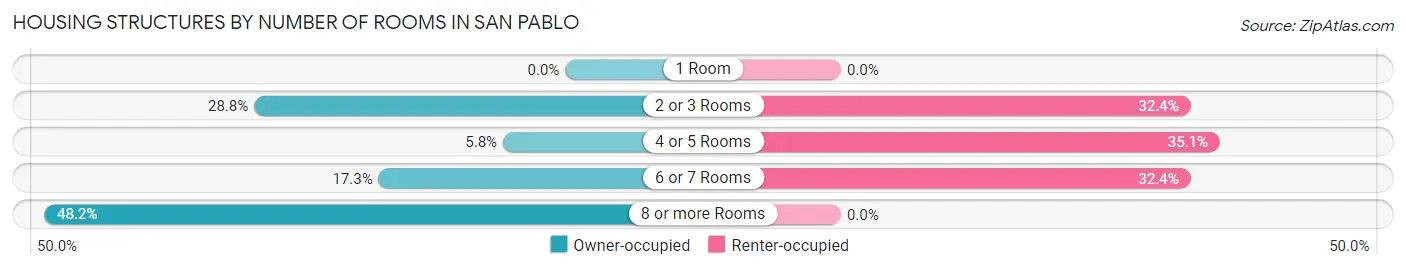
| Number of Rooms | Owner-occupied | Renter-occupied |
| 1 Room | 0 (0.0%) | 0 (0.0%) |
| 2 or 3 Rooms | 40 (28.8%) | 12 (32.4%) |
| 4 or 5 Rooms | 8 (5.8%) | 13 (35.1%) |
| 6 or 7 Rooms | 24 (17.3%) | 12 (32.4%) |
| 8 or more Rooms | 67 (48.2%) | 0 (0.0%) |
| Total | 139 (100.0%) | 37 (100.0%) |
Housing Structure by Heating Type in San Pablo
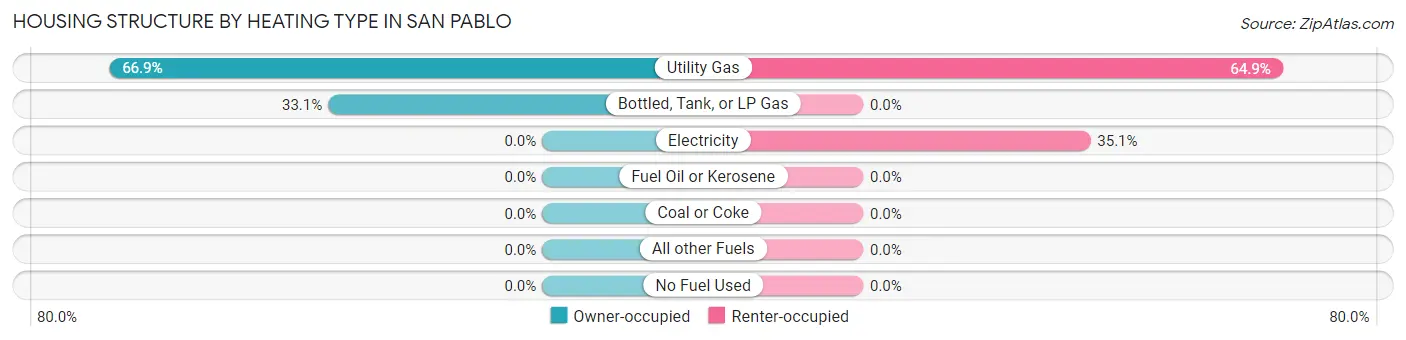
| Heating Type | Owner-occupied | Renter-occupied |
| Utility Gas | 93 (66.9%) | 24 (64.9%) |
| Bottled, Tank, or LP Gas | 46 (33.1%) | 0 (0.0%) |
| Electricity | 0 (0.0%) | 13 (35.1%) |
| Fuel Oil or Kerosene | 0 (0.0%) | 0 (0.0%) |
| Coal or Coke | 0 (0.0%) | 0 (0.0%) |
| All other Fuels | 0 (0.0%) | 0 (0.0%) |
| No Fuel Used | 0 (0.0%) | 0 (0.0%) |
| Total | 139 (100.0%) | 37 (100.0%) |
Household Vehicle Usage in San Pablo
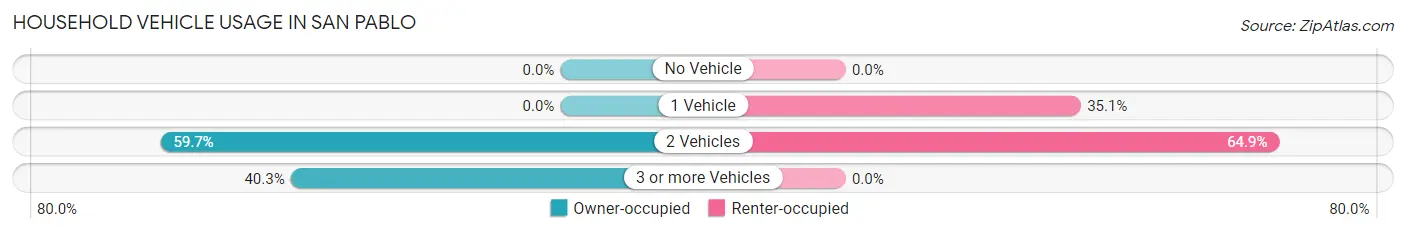
| Vehicles per Household | Owner-occupied | Renter-occupied |
| No Vehicle | 0 (0.0%) | 0 (0.0%) |
| 1 Vehicle | 0 (0.0%) | 13 (35.1%) |
| 2 Vehicles | 83 (59.7%) | 24 (64.9%) |
| 3 or more Vehicles | 56 (40.3%) | 0 (0.0%) |
| Total | 139 (100.0%) | 37 (100.0%) |
Real Estate & Mortgages in San Pablo
Real Estate and Mortgage Overview in San Pablo
| Characteristic | Without Mortgage | With Mortgage |
| Housing Units | 38 | 101 |
| Median Property Value | - | - |
| Median Household Income | $70,000 | $29 |
| Monthly Housing Costs | $447 | $18 |
| Real Estate Taxes | - | - |
Property Value by Mortgage Status in San Pablo
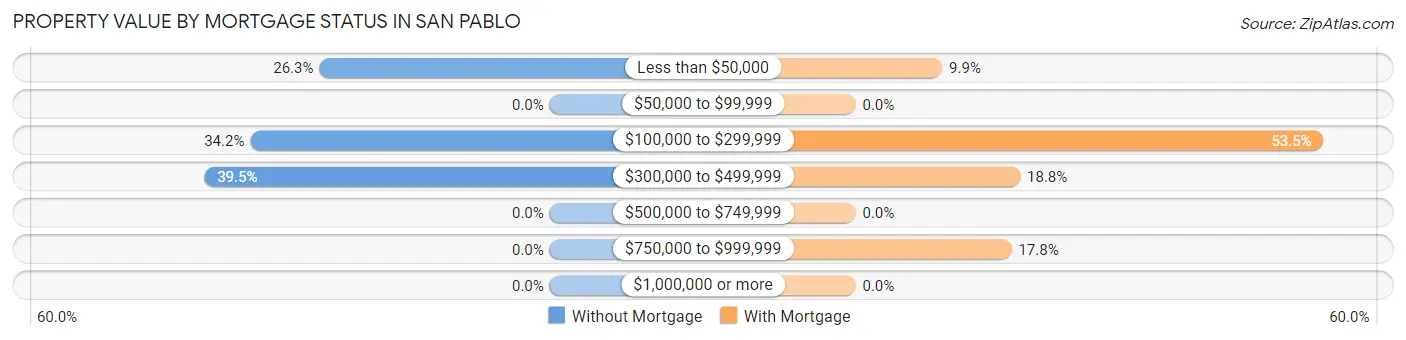
| Property Value | Without Mortgage | With Mortgage |
| Less than $50,000 | 10 (26.3%) | 10 (9.9%) |
| $50,000 to $99,999 | 0 (0.0%) | 0 (0.0%) |
| $100,000 to $299,999 | 13 (34.2%) | 54 (53.5%) |
| $300,000 to $499,999 | 15 (39.5%) | 19 (18.8%) |
| $500,000 to $749,999 | 0 (0.0%) | 0 (0.0%) |
| $750,000 to $999,999 | 0 (0.0%) | 18 (17.8%) |
| $1,000,000 or more | 0 (0.0%) | 0 (0.0%) |
| Total | 38 (100.0%) | 101 (100.0%) |
Household Income by Mortgage Status in San Pablo
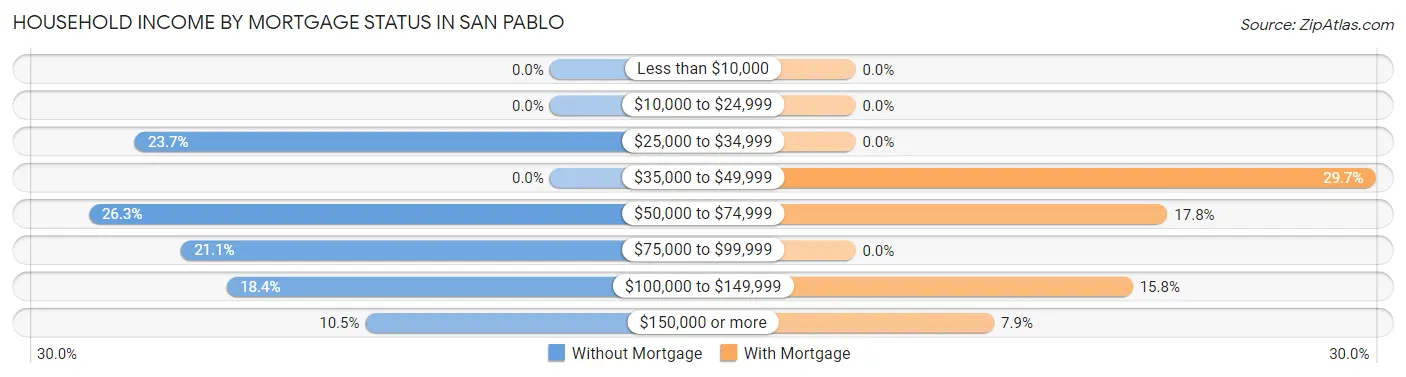
| Household Income | Without Mortgage | With Mortgage |
| Less than $10,000 | 0 (0.0%) | 0 (0.0%) |
| $10,000 to $24,999 | 0 (0.0%) | 0 (0.0%) |
| $25,000 to $34,999 | 9 (23.7%) | 0 (0.0%) |
| $35,000 to $49,999 | 0 (0.0%) | 30 (29.7%) |
| $50,000 to $74,999 | 10 (26.3%) | 18 (17.8%) |
| $75,000 to $99,999 | 8 (21.0%) | 0 (0.0%) |
| $100,000 to $149,999 | 7 (18.4%) | 16 (15.8%) |
| $150,000 or more | 4 (10.5%) | 8 (7.9%) |
| Total | 38 (100.0%) | 101 (100.0%) |
Property Value to Household Income Ratio in San Pablo
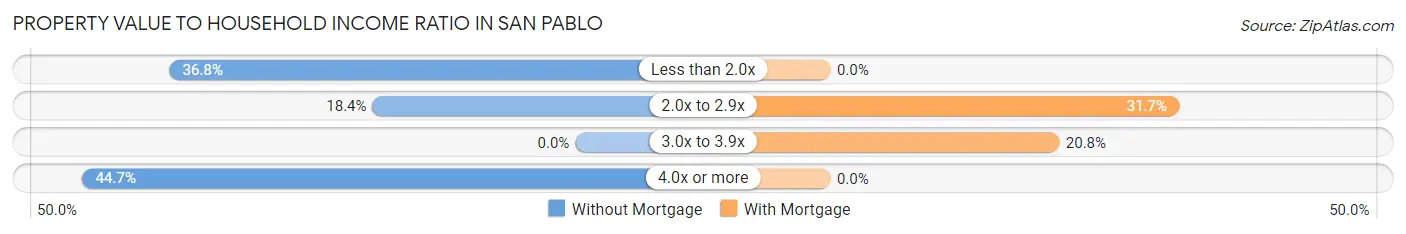
| Value-to-Income Ratio | Without Mortgage | With Mortgage |
| Less than 2.0x | 14 (36.8%) | 0 (0.0%) |
| 2.0x to 2.9x | 7 (18.4%) | 32 (31.7%) |
| 3.0x to 3.9x | 0 (0.0%) | 21 (20.8%) |
| 4.0x or more | 17 (44.7%) | 0 (0.0%) |
| Total | 38 (100.0%) | 101 (100.0%) |
Real Estate Taxes by Mortgage Status in San Pablo
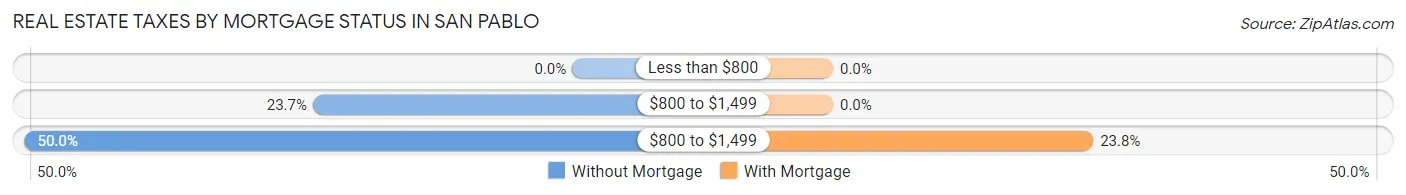
| Property Taxes | Without Mortgage | With Mortgage |
| Less than $800 | 0 (0.0%) | 0 (0.0%) |
| $800 to $1,499 | 9 (23.7%) | 0 (0.0%) |
| $800 to $1,499 | 19 (50.0%) | 24 (23.8%) |
| Total | 38 (100.0%) | 101 (100.0%) |
Health & Disability in San Pablo
Health Insurance Coverage by Age in San Pablo
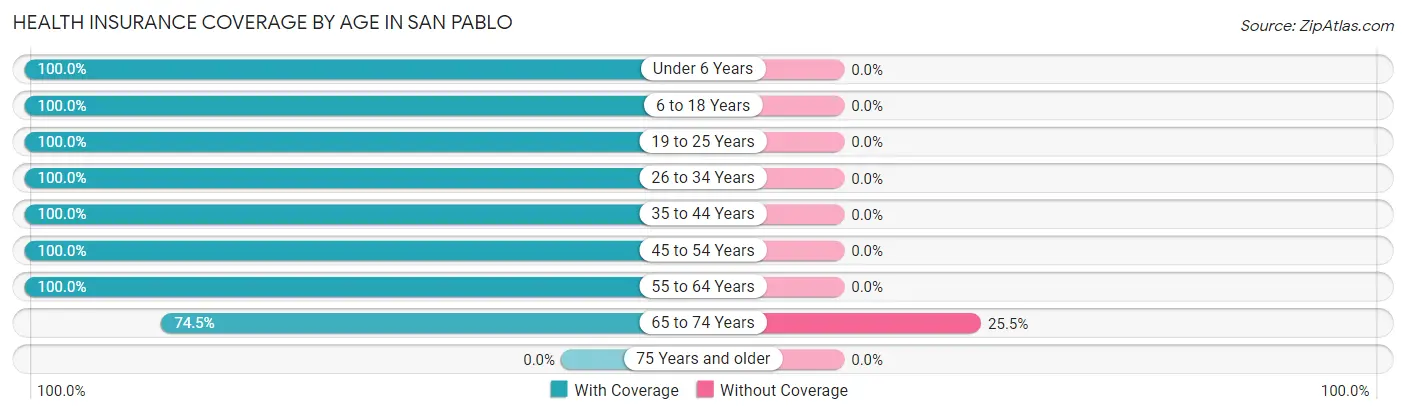
| Age Bracket | With Coverage | Without Coverage |
| Under 6 Years | 15 (100.0%) | 0 (0.0%) |
| 6 to 18 Years | 62 (100.0%) | 0 (0.0%) |
| 19 to 25 Years | 27 (100.0%) | 0 (0.0%) |
| 26 to 34 Years | 56 (100.0%) | 0 (0.0%) |
| 35 to 44 Years | 34 (100.0%) | 0 (0.0%) |
| 45 to 54 Years | 41 (100.0%) | 0 (0.0%) |
| 55 to 64 Years | 116 (100.0%) | 0 (0.0%) |
| 65 to 74 Years | 73 (74.5%) | 25 (25.5%) |
| 75 Years and older | 0 (0.0%) | 0 (0.0%) |
| Total | 424 (94.4%) | 25 (5.6%) |
Health Insurance Coverage by Citizenship Status in San Pablo
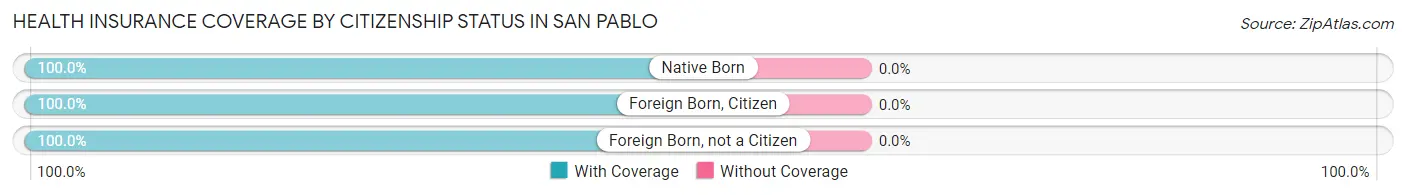
| Citizenship Status | With Coverage | Without Coverage |
| Native Born | 15 (100.0%) | 0 (0.0%) |
| Foreign Born, Citizen | 62 (100.0%) | 0 (0.0%) |
| Foreign Born, not a Citizen | 27 (100.0%) | 0 (0.0%) |
Health Insurance Coverage by Household Income in San Pablo
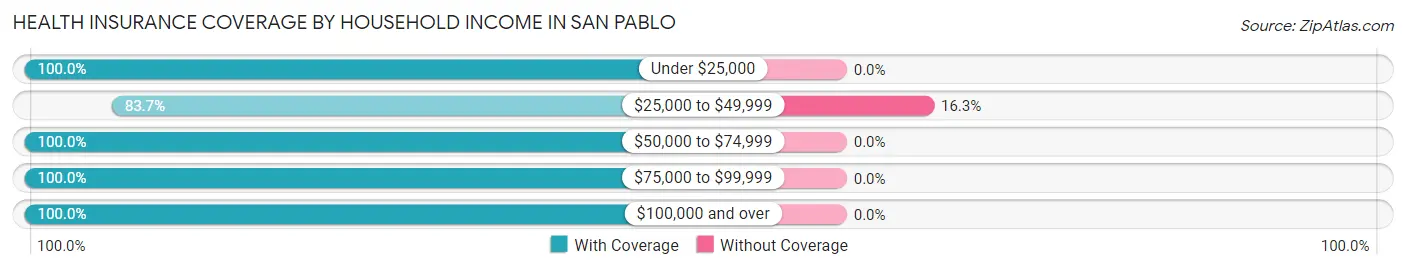
| Household Income | With Coverage | Without Coverage |
| Under $25,000 | 32 (100.0%) | 0 (0.0%) |
| $25,000 to $49,999 | 128 (83.7%) | 25 (16.3%) |
| $50,000 to $74,999 | 18 (100.0%) | 0 (0.0%) |
| $75,000 to $99,999 | 101 (100.0%) | 0 (0.0%) |
| $100,000 and over | 145 (100.0%) | 0 (0.0%) |
Public vs Private Health Insurance Coverage by Age in San Pablo
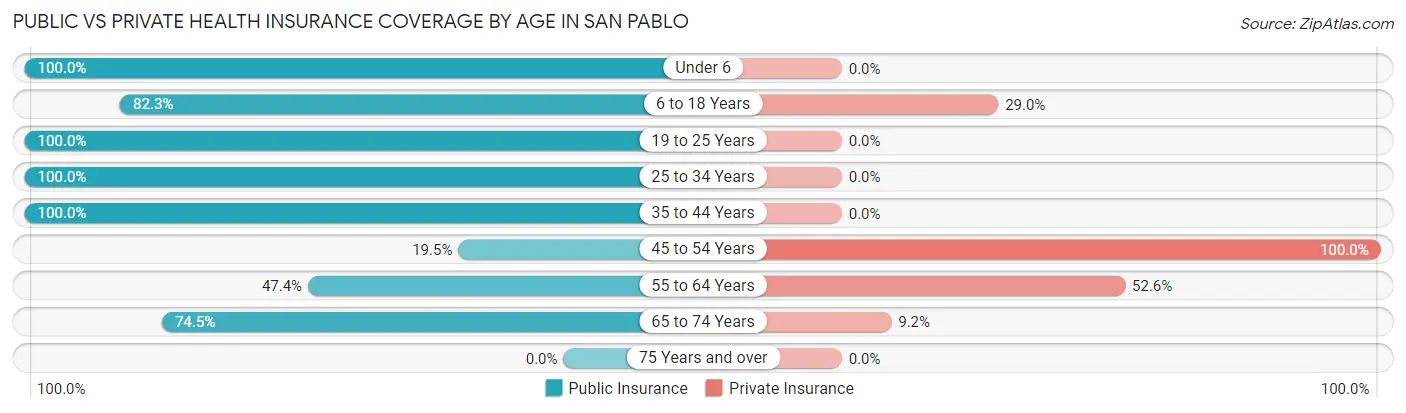
| Age Bracket | Public Insurance | Private Insurance |
| Under 6 | 15 (100.0%) | 0 (0.0%) |
| 6 to 18 Years | 51 (82.3%) | 18 (29.0%) |
| 19 to 25 Years | 27 (100.0%) | 0 (0.0%) |
| 25 to 34 Years | 56 (100.0%) | 0 (0.0%) |
| 35 to 44 Years | 34 (100.0%) | 0 (0.0%) |
| 45 to 54 Years | 8 (19.5%) | 41 (100.0%) |
| 55 to 64 Years | 55 (47.4%) | 61 (52.6%) |
| 65 to 74 Years | 73 (74.5%) | 9 (9.2%) |
| 75 Years and over | 0 (0.0%) | 0 (0.0%) |
| Total | 319 (71.1%) | 129 (28.7%) |
Disability Status by Sex by Age in San Pablo
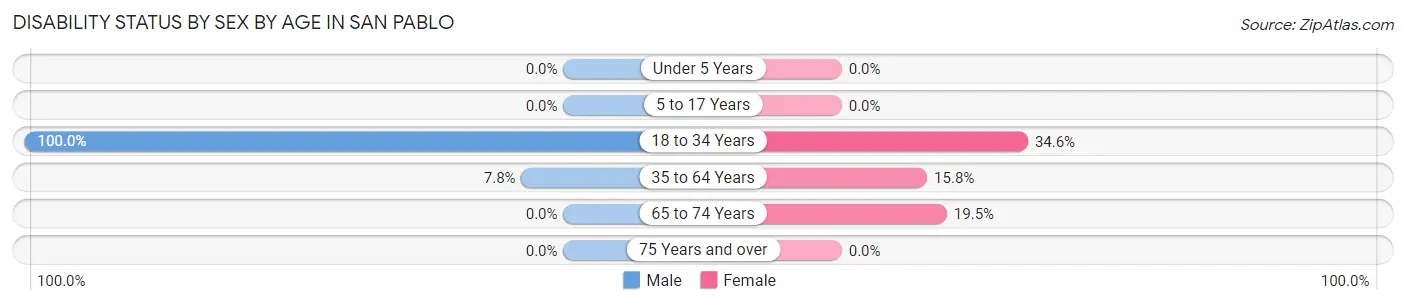
| Age Bracket | Male | Female |
| Under 5 Years | 0 (0.0%) | 0 (0.0%) |
| 5 to 17 Years | 0 (0.0%) | 0 (0.0%) |
| 18 to 34 Years | 37 (100.0%) | 19 (34.5%) |
| 35 to 64 Years | 7 (7.8%) | 16 (15.8%) |
| 65 to 74 Years | 0 (0.0%) | 8 (19.5%) |
| 75 Years and over | 0 (0.0%) | 0 (0.0%) |
Disability Class by Sex by Age in San Pablo
Disability Class: Hearing Difficulty
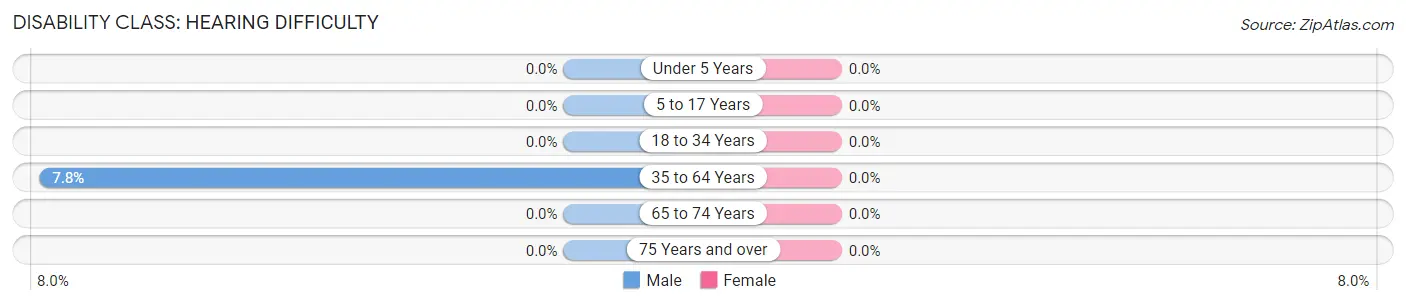
| Age Bracket | Male | Female |
| Under 5 Years | 0 (0.0%) | 0 (0.0%) |
| 5 to 17 Years | 0 (0.0%) | 0 (0.0%) |
| 18 to 34 Years | 0 (0.0%) | 0 (0.0%) |
| 35 to 64 Years | 7 (7.8%) | 0 (0.0%) |
| 65 to 74 Years | 0 (0.0%) | 0 (0.0%) |
| 75 Years and over | 0 (0.0%) | 0 (0.0%) |
Disability Class: Vision Difficulty
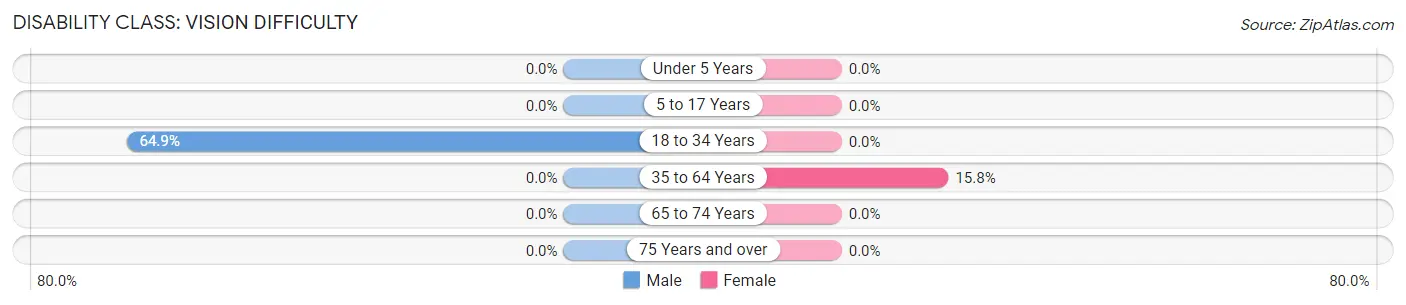
| Age Bracket | Male | Female |
| Under 5 Years | 0 (0.0%) | 0 (0.0%) |
| 5 to 17 Years | 0 (0.0%) | 0 (0.0%) |
| 18 to 34 Years | 24 (64.9%) | 0 (0.0%) |
| 35 to 64 Years | 0 (0.0%) | 16 (15.8%) |
| 65 to 74 Years | 0 (0.0%) | 0 (0.0%) |
| 75 Years and over | 0 (0.0%) | 0 (0.0%) |
Disability Class: Cognitive Difficulty
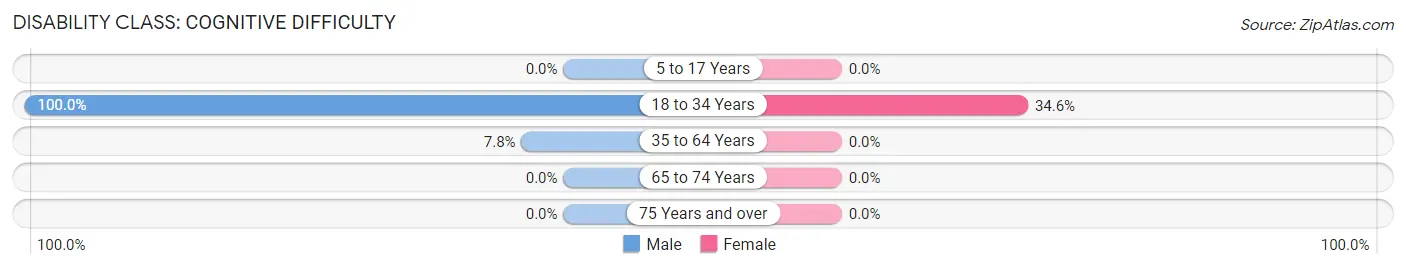
| Age Bracket | Male | Female |
| 5 to 17 Years | 0 (0.0%) | 0 (0.0%) |
| 18 to 34 Years | 37 (100.0%) | 19 (34.5%) |
| 35 to 64 Years | 7 (7.8%) | 0 (0.0%) |
| 65 to 74 Years | 0 (0.0%) | 0 (0.0%) |
| 75 Years and over | 0 (0.0%) | 0 (0.0%) |
Disability Class: Ambulatory Difficulty
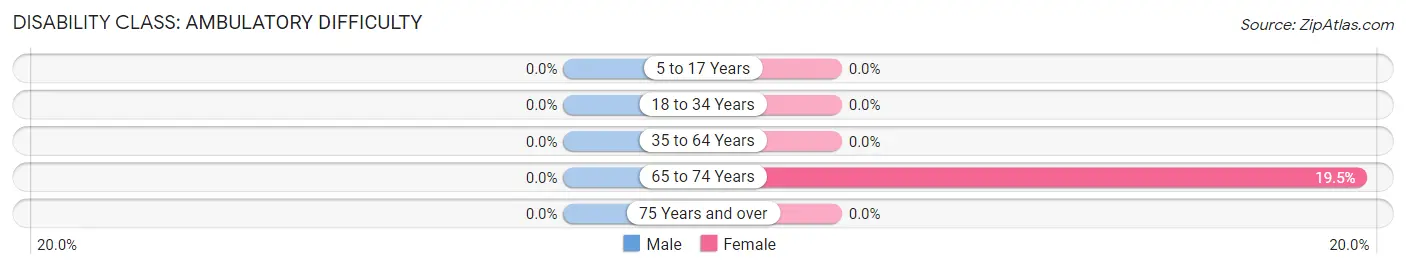
| Age Bracket | Male | Female |
| 5 to 17 Years | 0 (0.0%) | 0 (0.0%) |
| 18 to 34 Years | 0 (0.0%) | 0 (0.0%) |
| 35 to 64 Years | 0 (0.0%) | 0 (0.0%) |
| 65 to 74 Years | 0 (0.0%) | 8 (19.5%) |
| 75 Years and over | 0 (0.0%) | 0 (0.0%) |
Disability Class: Self-Care Difficulty
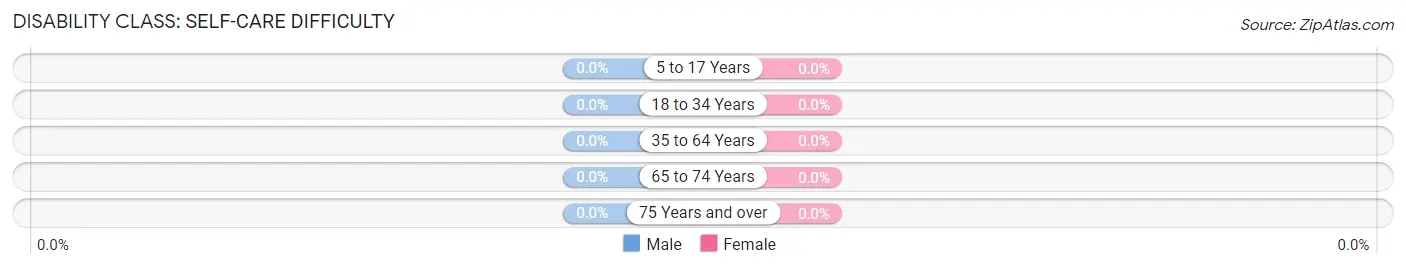
| Age Bracket | Male | Female |
| 5 to 17 Years | 0 (0.0%) | 0 (0.0%) |
| 18 to 34 Years | 0 (0.0%) | 0 (0.0%) |
| 35 to 64 Years | 0 (0.0%) | 0 (0.0%) |
| 65 to 74 Years | 0 (0.0%) | 0 (0.0%) |
| 75 Years and over | 0 (0.0%) | 0 (0.0%) |
Technology Access in San Pablo
Computing Device Access in San Pablo
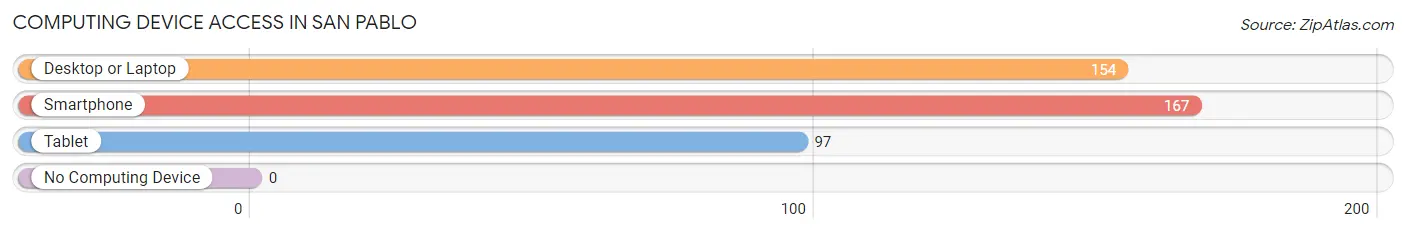
| Device Type | # Households | % Households |
| Desktop or Laptop | 154 | 87.5% |
| Smartphone | 167 | 94.9% |
| Tablet | 97 | 55.1% |
| No Computing Device | 0 | 0.0% |
| Total | 176 | 100.0% |
Internet Access in San Pablo
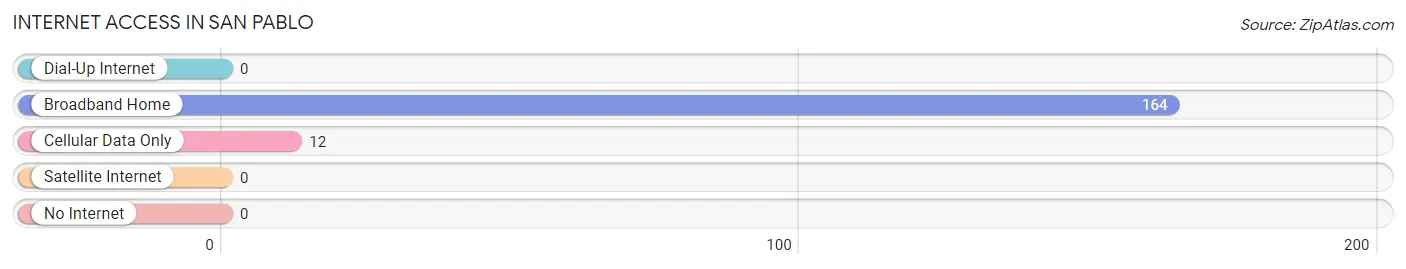
| Internet Type | # Households | % Households |
| Dial-Up Internet | 0 | 0.0% |
| Broadband Home | 164 | 93.2% |
| Cellular Data Only | 12 | 6.8% |
| Satellite Internet | 0 | 0.0% |
| No Internet | 0 | 0.0% |
| Total | 176 | 100.0% |
San Pablo Summary
Pablo, New Mexico is a small town located in the San Juan County of the state of New Mexico. It is situated in the northwest corner of the state, near the Four Corners region. The town is located on the San Juan River, which is a tributary of the Colorado River. The town is located at an elevation of 5,890 feet and has a population of approximately 1,000 people.
History
The area around San Pablo was first inhabited by the Anasazi people, who lived in the area from around 1000 BC to 1300 AD. The area was later inhabited by the Navajo people, who lived in the area until the late 19th century. The town of San Pablo was established in 1876 by the U.S. Army as a military outpost. The town was named after the nearby San Pablo Mission, which was established by the Spanish in 1776.
The town was originally a trading post for the Navajo people, and it served as a stopover for travelers on the Santa Fe Trail. The town was also a stop on the Denver and Rio Grande Western Railroad, which ran through the area from 1881 to 1937.
Geography
San Pablo is located in the northwest corner of New Mexico, near the Four Corners region. The town is situated on the San Juan River, which is a tributary of the Colorado River. The town is located at an elevation of 5,890 feet. The town is surrounded by the San Juan Mountains to the north and the Chuska Mountains to the south.
The climate in San Pablo is semi-arid, with hot summers and cold winters. The average annual temperature is around 50 degrees Fahrenheit. The average annual precipitation is around 10 inches.
Economy
The economy of San Pablo is largely based on agriculture and tourism. The town is home to several farms and ranches, which produce a variety of crops, including alfalfa, hay, corn, and wheat. The town is also home to several tourist attractions, including the San Juan River, the Chuska Mountains, and the Four Corners Monument.
Demographics
As of the 2010 census, the population of San Pablo was 1,000 people. The racial makeup of the town was 94.2% White, 0.7% African American, 0.7% Native American, 0.7% Asian, 0.7% from other races, and 2.7% from two or more races. The median household income was $30,000, and the median family income was $35,000. The per capita income was $14,000. The town had a poverty rate of 22.2%.
Common Questions
What is Per Capita Income in San Pablo?
Per Capita income in San Pablo is $34,030.
What is the Median Family Income in San Pablo?
Median Family Income in San Pablo is $91,172.
What is Inequality or Gini Index in San Pablo?
Inequality or Gini Index in San Pablo is 0.41.
What is the Total Population of San Pablo?
Total Population of San Pablo is 449.
What is the Total Male Population of San Pablo?
Total Male Population of San Pablo is 212.
What is the Total Female Population of San Pablo?
Total Female Population of San Pablo is 237.
What is the Ratio of Males per 100 Females in San Pablo?
There are 89.45 Males per 100 Females in San Pablo.
What is the Ratio of Females per 100 Males in San Pablo?
There are 111.79 Females per 100 Males in San Pablo.
What is the Median Population Age in San Pablo?
Median Population Age in San Pablo is 48.6 Years.
What is the Average Family Size in San Pablo
Average Family Size in San Pablo is 2.8 People.
What is the Average Household Size in San Pablo
Average Household Size in San Pablo is 2.5 People.
How Large is the Labor Force in San Pablo?
There are 224 People in the Labor Forcein in San Pablo.
What is the Percentage of People in the Labor Force in San Pablo?
55.9% of People are in the Labor Force in San Pablo.
What is the Unemployment Rate in San Pablo?
Unemployment Rate in San Pablo is 2.2%.