El Rancho, NM Map & Demographics
El Rancho Map
El Rancho Overview
$38,510
PER CAPITA INCOME
$93,750
AVG FAMILY INCOME
$66,250
AVG HOUSEHOLD INCOME
24.5%
WAGE / INCOME GAP [ % ]
75.5¢/ $1
WAGE / INCOME GAP [ $ ]
$5,159
FAMILY INCOME DEFICIT
0.41
INEQUALITY / GINI INDEX
1,513
TOTAL POPULATION
707
MALE POPULATION
806
FEMALE POPULATION
87.72
MALES / 100 FEMALES
114.00
FEMALES / 100 MALES
37.8
MEDIAN AGE
2.9
AVG FAMILY SIZE
2.4
AVG HOUSEHOLD SIZE
692
LABOR FORCE [ PEOPLE ]
57.5%
PERCENT IN LABOR FORCE
0.7%
UNEMPLOYMENT RATE
Income in El Rancho
Income Overview in El Rancho
Per Capita Income in El Rancho is $38,510, while median incomes of families and households are $93,750 and $66,250 respectively.
| Characteristic | Number | Measure |
| Per Capita Income | 1,513 | $38,510 |
| Median Family Income | 428 | $93,750 |
| Mean Family Income | 428 | $107,243 |
| Median Household Income | 620 | $66,250 |
| Mean Household Income | 620 | $94,413 |
| Income Deficit | 428 | $5,159 |
| Wage / Income Gap (%) | 1,513 | 24.54% |
| Wage / Income Gap ($) | 1,513 | 75.46¢ per $1 |
| Gini / Inequality Index | 1,513 | 0.41 |
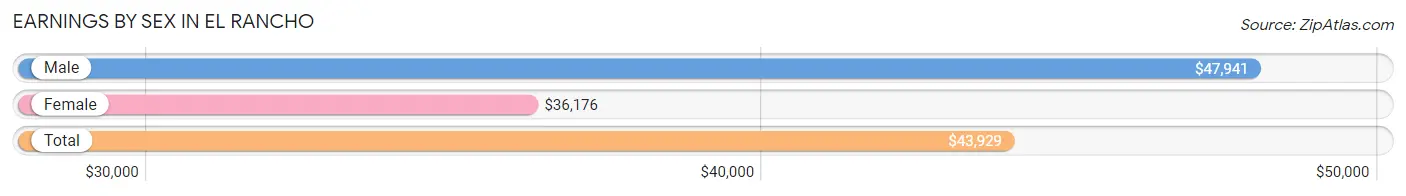
Earnings by Sex in El Rancho
Average Earnings in El Rancho are $43,929, $47,941 for men and $36,176 for women, a difference of 24.5%.
| Sex | Number | Average Earnings |
| Male | 402 (55.2%) | $47,941 |
| Female | 326 (44.8%) | $36,176 |
| Total | 728 (100.0%) | $43,929 |
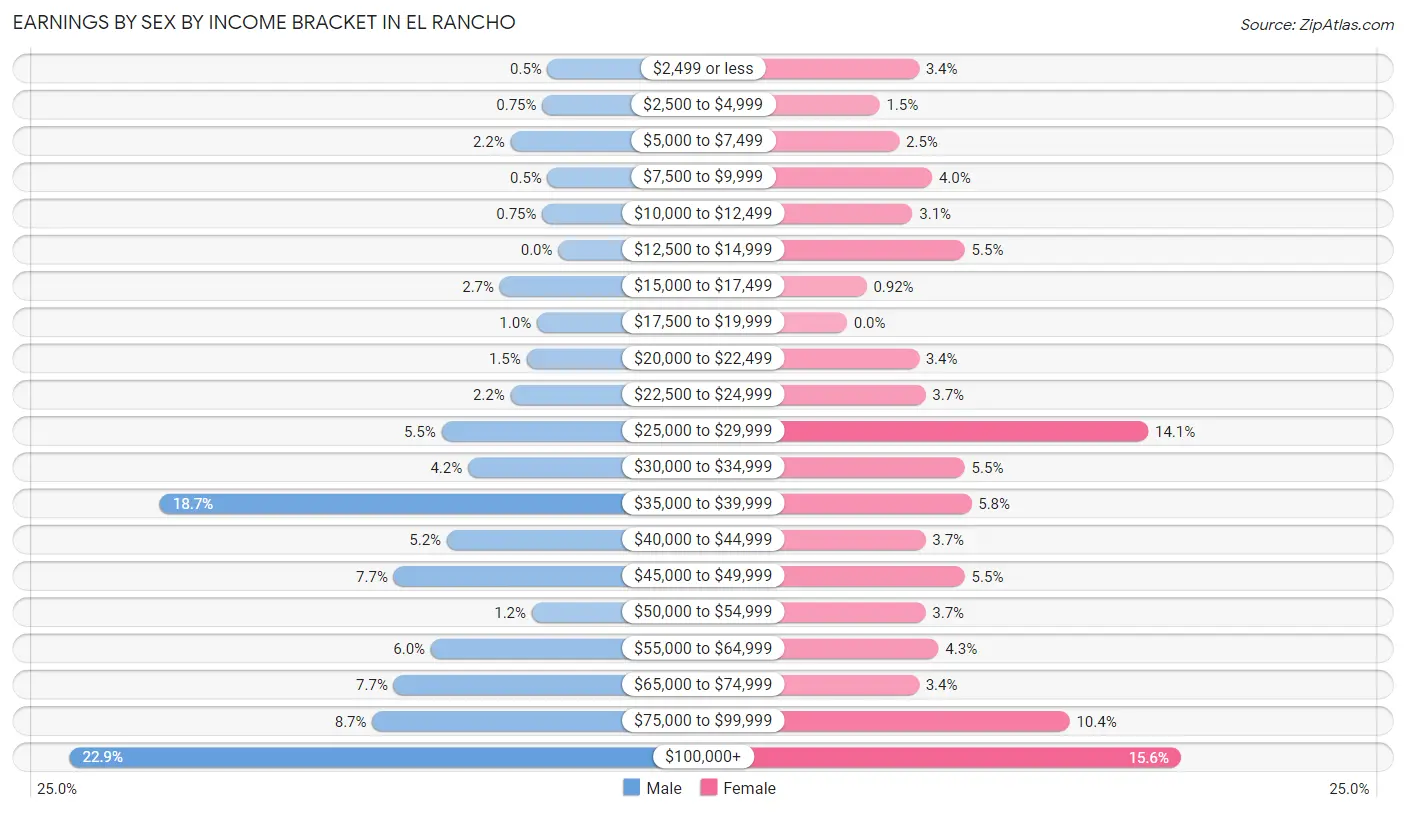
Earnings by Sex by Income Bracket in El Rancho
The most common earnings brackets in El Rancho are $100,000+ for men (92 | 22.9%) and $100,000+ for women (51 | 15.6%).
| Income | Male | Female |
| $2,499 or less | 2 (0.5%) | 11 (3.4%) |
| $2,500 to $4,999 | 3 (0.7%) | 5 (1.5%) |
| $5,000 to $7,499 | 9 (2.2%) | 8 (2.5%) |
| $7,500 to $9,999 | 2 (0.5%) | 13 (4.0%) |
| $10,000 to $12,499 | 3 (0.7%) | 10 (3.1%) |
| $12,500 to $14,999 | 0 (0.0%) | 18 (5.5%) |
| $15,000 to $17,499 | 11 (2.7%) | 3 (0.9%) |
| $17,500 to $19,999 | 4 (1.0%) | 0 (0.0%) |
| $20,000 to $22,499 | 6 (1.5%) | 11 (3.4%) |
| $22,500 to $24,999 | 9 (2.2%) | 12 (3.7%) |
| $25,000 to $29,999 | 22 (5.5%) | 46 (14.1%) |
| $30,000 to $34,999 | 17 (4.2%) | 18 (5.5%) |
| $35,000 to $39,999 | 75 (18.7%) | 19 (5.8%) |
| $40,000 to $44,999 | 21 (5.2%) | 12 (3.7%) |
| $45,000 to $49,999 | 31 (7.7%) | 18 (5.5%) |
| $50,000 to $54,999 | 5 (1.2%) | 12 (3.7%) |
| $55,000 to $64,999 | 24 (6.0%) | 14 (4.3%) |
| $65,000 to $74,999 | 31 (7.7%) | 11 (3.4%) |
| $75,000 to $99,999 | 35 (8.7%) | 34 (10.4%) |
| $100,000+ | 92 (22.9%) | 51 (15.6%) |
| Total | 402 (100.0%) | 326 (100.0%) |
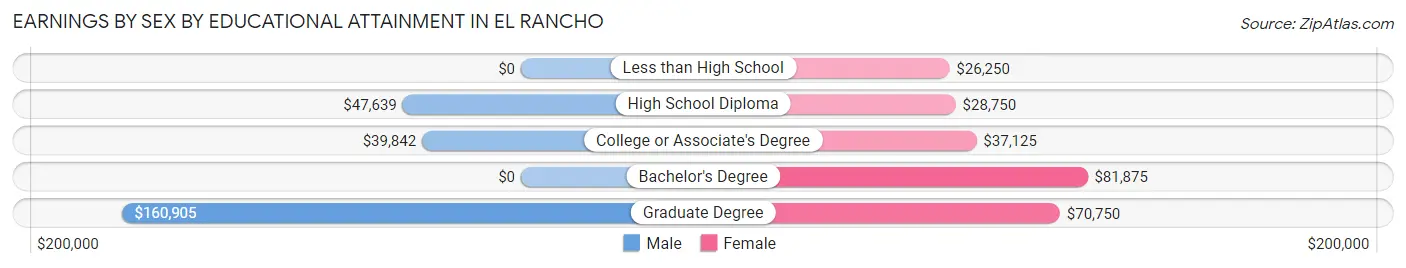
Earnings by Sex by Educational Attainment in El Rancho
Average earnings in El Rancho are $49,118 for men and $41,250 for women, a difference of 16.0%. Men with an educational attainment of graduate degree enjoy the highest average annual earnings of $160,905, while those with college or associate's degree education earn the least with $39,842. Women with an educational attainment of bachelor's degree earn the most with the average annual earnings of $81,875, while those with less than high school education have the smallest earnings of $26,250.
| Educational Attainment | Male Income | Female Income |
| Less than High School | - | - |
| High School Diploma | $47,639 | $28,750 |
| College or Associate's Degree | $39,842 | $37,125 |
| Bachelor's Degree | - | - |
| Graduate Degree | $160,905 | $70,750 |
| Total | $49,118 | $41,250 |
Family Income in El Rancho
Family Income Brackets in El Rancho
According to the El Rancho family income data, there are 102 families falling into the $35,000 to $49,999 income range, which is the most common income bracket and makes up 23.8% of all families.
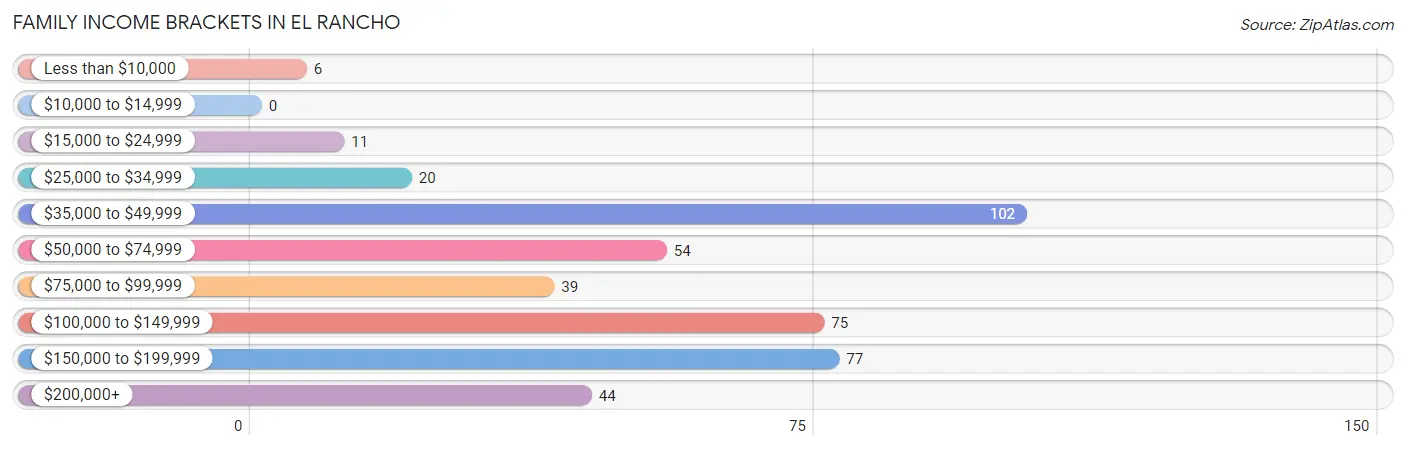
| Income Bracket | # Families | % Families |
| Less than $10,000 | 6 | 1.4% |
| $10,000 to $14,999 | 0 | 0.0% |
| $15,000 to $24,999 | 11 | 2.6% |
| $25,000 to $34,999 | 20 | 4.7% |
| $35,000 to $49,999 | 102 | 23.8% |
| $50,000 to $74,999 | 54 | 12.6% |
| $75,000 to $99,999 | 39 | 9.1% |
| $100,000 to $149,999 | 75 | 17.5% |
| $150,000 to $199,999 | 77 | 18.0% |
| $200,000+ | 44 | 10.3% |
Family Income by Famaliy Size in El Rancho
4-person families (79 | 18.5%) account for the highest median family income in El Rancho with $160,821 per family, while 2-person families (175 | 40.9%) have the highest median income of $53,646 per family member.
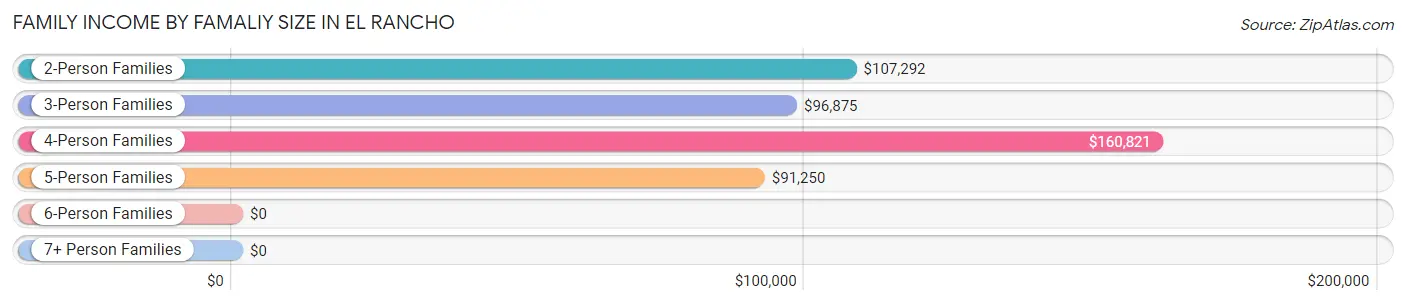
| Income Bracket | # Families | Median Income |
| 2-Person Families | 175 (40.9%) | $107,292 |
| 3-Person Families | 80 (18.7%) | $96,875 |
| 4-Person Families | 79 (18.5%) | $160,821 |
| 5-Person Families | 16 (3.7%) | $91,250 |
| 6-Person Families | 4 (0.9%) | $0 |
| 7+ Person Families | 74 (17.3%) | $0 |
| Total | 428 (100.0%) | $93,750 |
Family Income by Number of Earners in El Rancho
The median family income in El Rancho is $93,750, with families comprising 3+ earners (31) having the highest median family income of $161,875, while families with 1 earner (230) have the lowest median family income of $48,750, accounting for 7.2% and 53.7% of families, respectively.
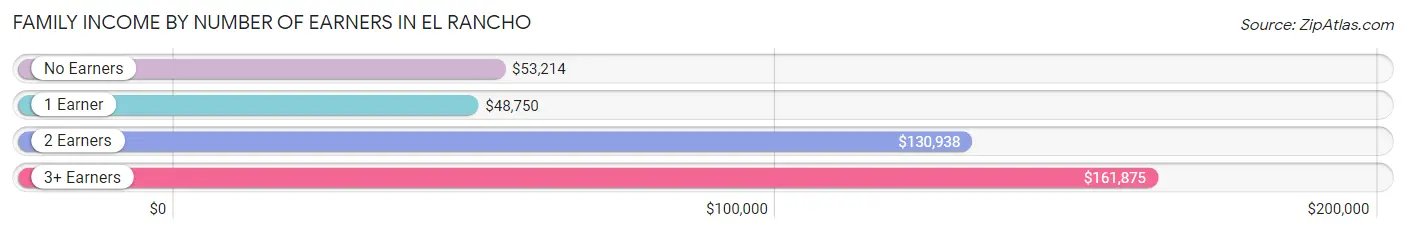
| Number of Earners | # Families | Median Income |
| No Earners | 44 (10.3%) | $53,214 |
| 1 Earner | 230 (53.7%) | $48,750 |
| 2 Earners | 123 (28.7%) | $130,938 |
| 3+ Earners | 31 (7.2%) | $161,875 |
| Total | 428 (100.0%) | $93,750 |
Household Income in El Rancho
Household Income Brackets in El Rancho
With 127 households falling in the category, the $35,000 to $49,999 income range is the most frequent in El Rancho, accounting for 20.5% of all households. In contrast, only 8 households (1.3%) fall into the $10,000 to $14,999 income bracket, making it the least populous group.
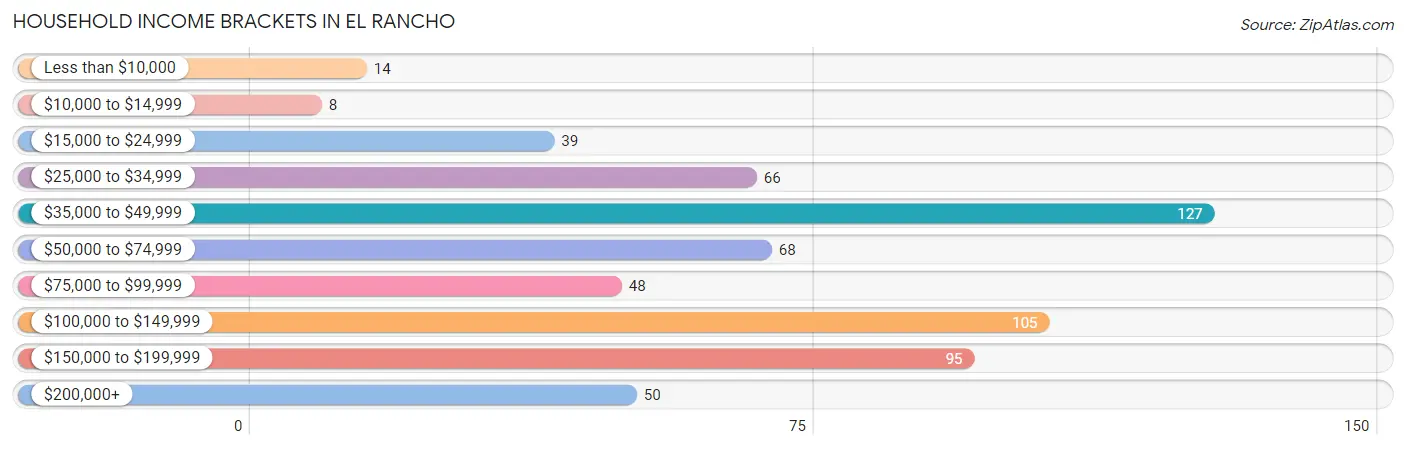
| Income Bracket | # Households | % Households |
| Less than $10,000 | 14 | 2.3% |
| $10,000 to $14,999 | 8 | 1.3% |
| $15,000 to $24,999 | 39 | 6.3% |
| $25,000 to $34,999 | 66 | 10.6% |
| $35,000 to $49,999 | 127 | 20.5% |
| $50,000 to $74,999 | 68 | 11.0% |
| $75,000 to $99,999 | 48 | 7.7% |
| $100,000 to $149,999 | 105 | 16.9% |
| $150,000 to $199,999 | 95 | 15.3% |
| $200,000+ | 50 | 8.1% |
Household Income by Householder Age in El Rancho
The median household income in El Rancho is $66,250, with the highest median household income of $95,000 found in the 45 to 64 years age bracket for the primary householder. A total of 212 households (34.2%) fall into this category. Meanwhile, the 15 to 24 years age bracket for the primary householder has the lowest median household income of $0, with 9 households (1.5%) in this group.
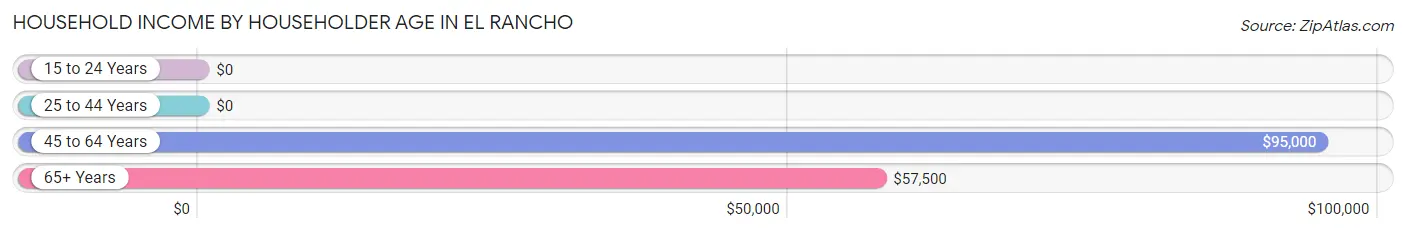
| Income Bracket | # Households | Median Income |
| 15 to 24 Years | 9 (1.5%) | $0 |
| 25 to 44 Years | 219 (35.3%) | $0 |
| 45 to 64 Years | 212 (34.2%) | $95,000 |
| 65+ Years | 180 (29.0%) | $57,500 |
| Total | 620 (100.0%) | $66,250 |
Poverty in El Rancho
Income Below Poverty by Sex and Age in El Rancho
With 26.3% poverty level for males and 10.2% for females among the residents of El Rancho, under 5 year old males and 12 to 14 year old females are the most vulnerable to poverty, with 62 males (72.1%) and 13 females (50.0%) in their respective age groups living below the poverty level.
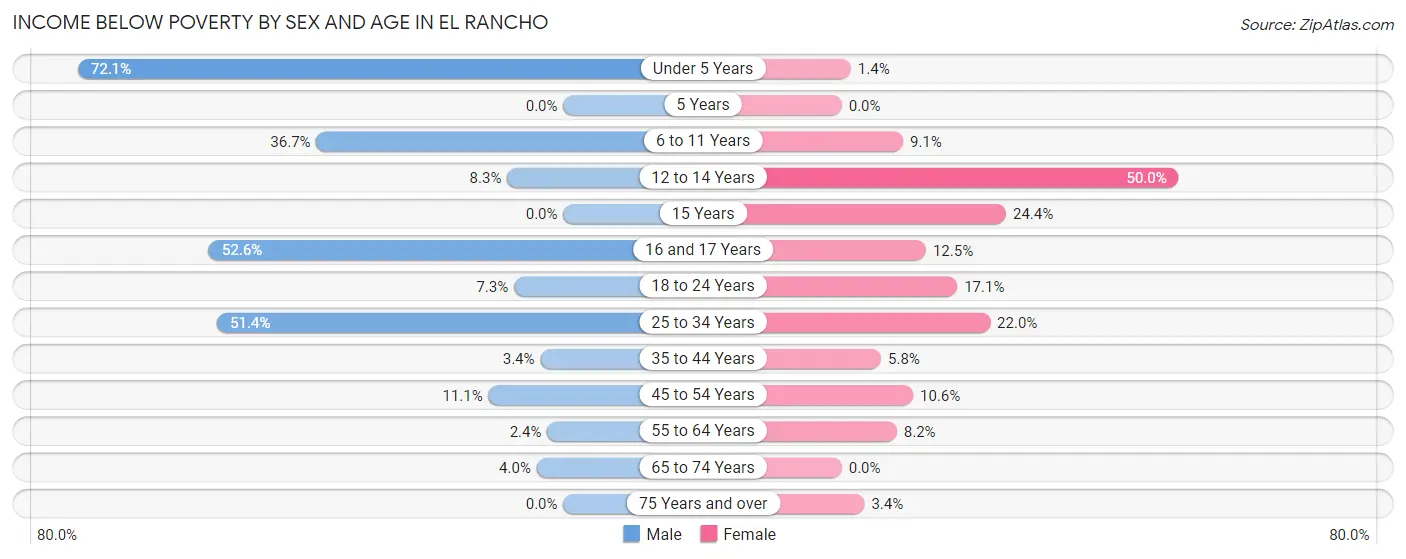
| Age Bracket | Male | Female |
| Under 5 Years | 62 (72.1%) | 1 (1.3%) |
| 5 Years | 0 (0.0%) | 0 (0.0%) |
| 6 to 11 Years | 11 (36.7%) | 3 (9.1%) |
| 12 to 14 Years | 1 (8.3%) | 13 (50.0%) |
| 15 Years | 0 (0.0%) | 10 (24.4%) |
| 16 and 17 Years | 20 (52.6%) | 3 (12.5%) |
| 18 to 24 Years | 3 (7.3%) | 12 (17.1%) |
| 25 to 34 Years | 73 (51.4%) | 13 (22.0%) |
| 35 to 44 Years | 3 (3.4%) | 6 (5.8%) |
| 45 to 54 Years | 8 (11.1%) | 9 (10.6%) |
| 55 to 64 Years | 2 (2.4%) | 9 (8.2%) |
| 65 to 74 Years | 3 (4.0%) | 0 (0.0%) |
| 75 Years and over | 0 (0.0%) | 3 (3.4%) |
| Total | 186 (26.3%) | 82 (10.2%) |
Income Above Poverty by Sex and Age in El Rancho
According to the poverty statistics in El Rancho, males aged 15 years and females aged 5 years are the age groups that are most secure financially, with 100.0% of males and 100.0% of females in these age groups living above the poverty line.
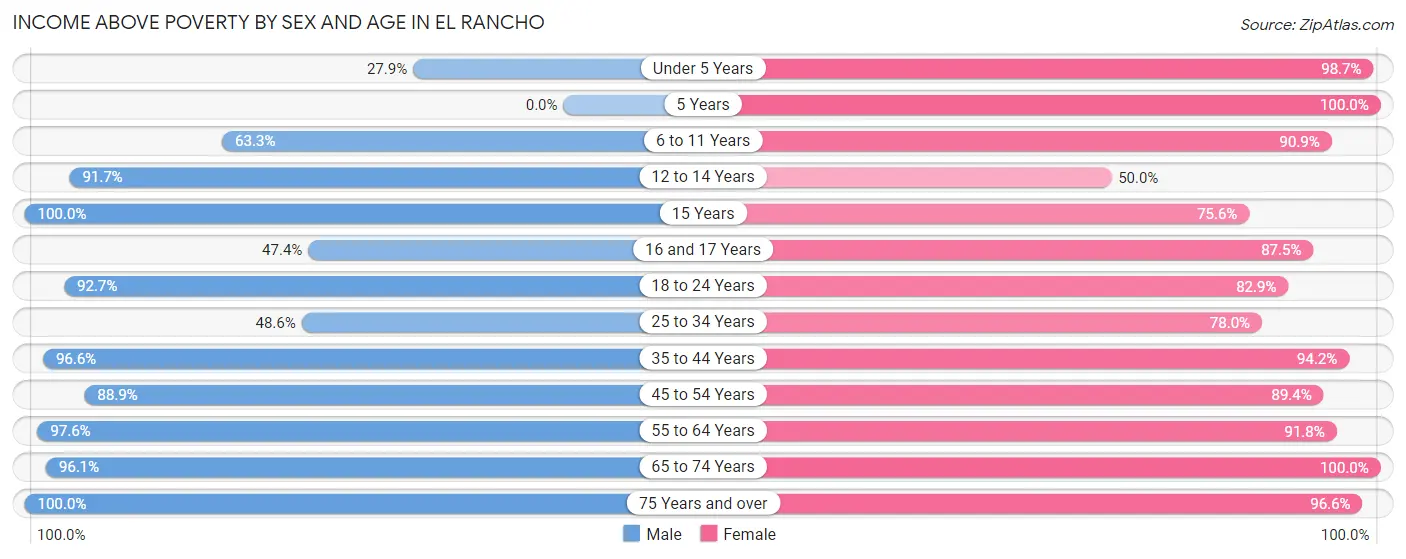
| Age Bracket | Male | Female |
| Under 5 Years | 24 (27.9%) | 73 (98.7%) |
| 5 Years | 0 (0.0%) | 4 (100.0%) |
| 6 to 11 Years | 19 (63.3%) | 30 (90.9%) |
| 12 to 14 Years | 11 (91.7%) | 13 (50.0%) |
| 15 Years | 3 (100.0%) | 31 (75.6%) |
| 16 and 17 Years | 18 (47.4%) | 21 (87.5%) |
| 18 to 24 Years | 38 (92.7%) | 58 (82.9%) |
| 25 to 34 Years | 69 (48.6%) | 46 (78.0%) |
| 35 to 44 Years | 85 (96.6%) | 97 (94.2%) |
| 45 to 54 Years | 64 (88.9%) | 76 (89.4%) |
| 55 to 64 Years | 82 (97.6%) | 101 (91.8%) |
| 65 to 74 Years | 73 (96.1%) | 88 (100.0%) |
| 75 Years and over | 35 (100.0%) | 86 (96.6%) |
| Total | 521 (73.7%) | 724 (89.8%) |
Income Below Poverty Among Married-Couple Families in El Rancho
The poverty statistics for married-couple families in El Rancho show that 24.0% or 76 of the total 317 families live below the poverty line. Families with 5 or more children have the highest poverty rate of 100.0%, comprising of 71 families. On the other hand, families with no children have the lowest poverty rate of 0.0%, which includes 0 families.
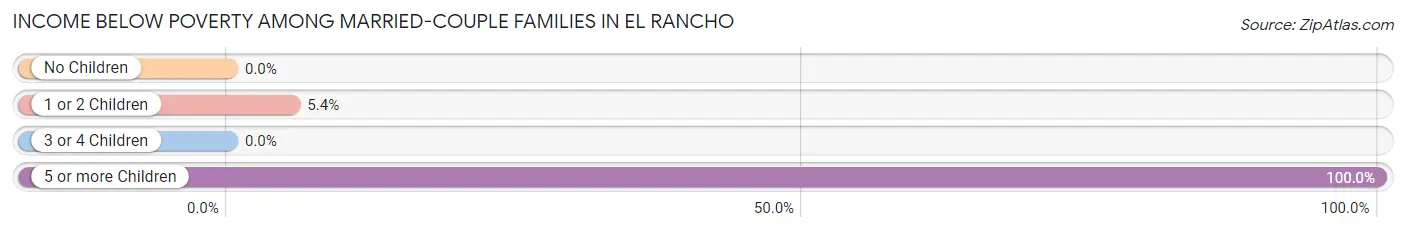
| Children | Above Poverty | Below Poverty |
| No Children | 147 (100.0%) | 0 (0.0%) |
| 1 or 2 Children | 87 (94.6%) | 5 (5.4%) |
| 3 or 4 Children | 7 (100.0%) | 0 (0.0%) |
| 5 or more Children | 0 (0.0%) | 71 (100.0%) |
| Total | 241 (76.0%) | 76 (24.0%) |
Income Below Poverty Among Single-Parent Households in El Rancho
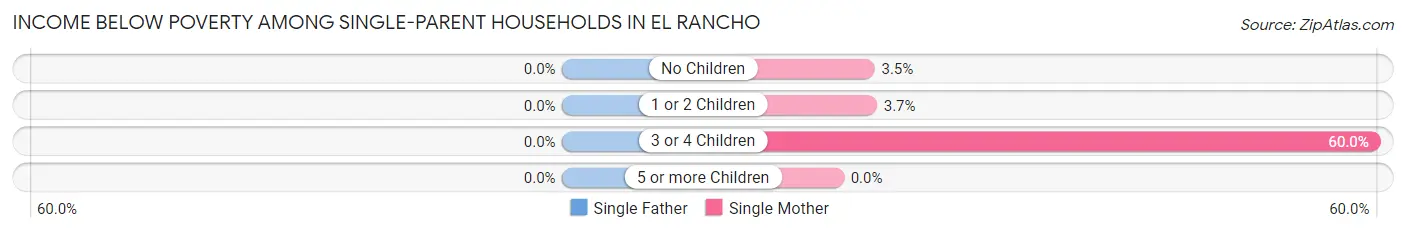
| Children | Single Father | Single Mother |
| No Children | 0 (0.0%) | 1 (3.5%) |
| 1 or 2 Children | 0 (0.0%) | 2 (3.7%) |
| 3 or 4 Children | 0 (0.0%) | 3 (60.0%) |
| 5 or more Children | 0 (0.0%) | 0 (0.0%) |
| Total | 0 (0.0%) | 6 (6.8%) |
Income Below Poverty Among Married-Couple vs Single-Parent Households in El Rancho
The poverty data for El Rancho shows that 76 of the married-couple family households (24.0%) and 6 of the single-parent households (5.4%) are living below the poverty level. Within the married-couple family households, those with 5 or more children have the highest poverty rate, with 71 households (100.0%) falling below the poverty line. Among the single-parent households, those with 3 or 4 children have the highest poverty rate, with 3 household (60.0%) living below poverty.
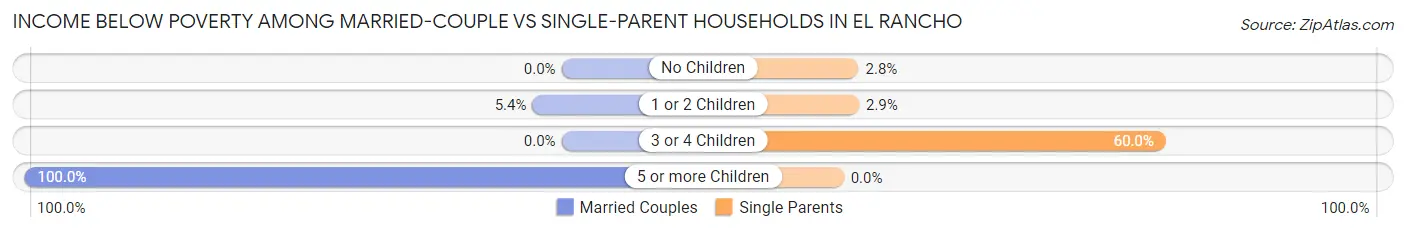
| Children | Married-Couple Families | Single-Parent Households |
| No Children | 0 (0.0%) | 1 (2.8%) |
| 1 or 2 Children | 5 (5.4%) | 2 (2.9%) |
| 3 or 4 Children | 0 (0.0%) | 3 (60.0%) |
| 5 or more Children | 71 (100.0%) | 0 (0.0%) |
| Total | 76 (24.0%) | 6 (5.4%) |
Race in El Rancho
The most populous races in El Rancho are Hispanic or Latino (1,144 | 75.6%), White / Caucasian (812 | 53.7%), and Two or more Races (506 | 33.4%).
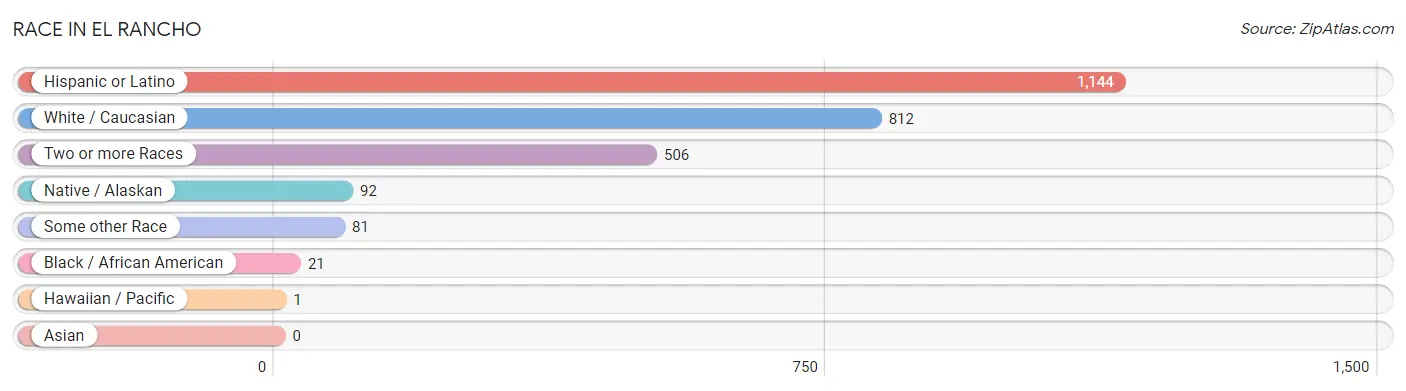
| Race | # Population | % Population |
| Asian | 0 | 0.0% |
| Black / African American | 21 | 1.4% |
| Hawaiian / Pacific | 1 | 0.1% |
| Hispanic or Latino | 1,144 | 75.6% |
| Native / Alaskan | 92 | 6.1% |
| White / Caucasian | 812 | 53.7% |
| Two or more Races | 506 | 33.4% |
| Some other Race | 81 | 5.3% |
| Total | 1,513 | 100.0% |
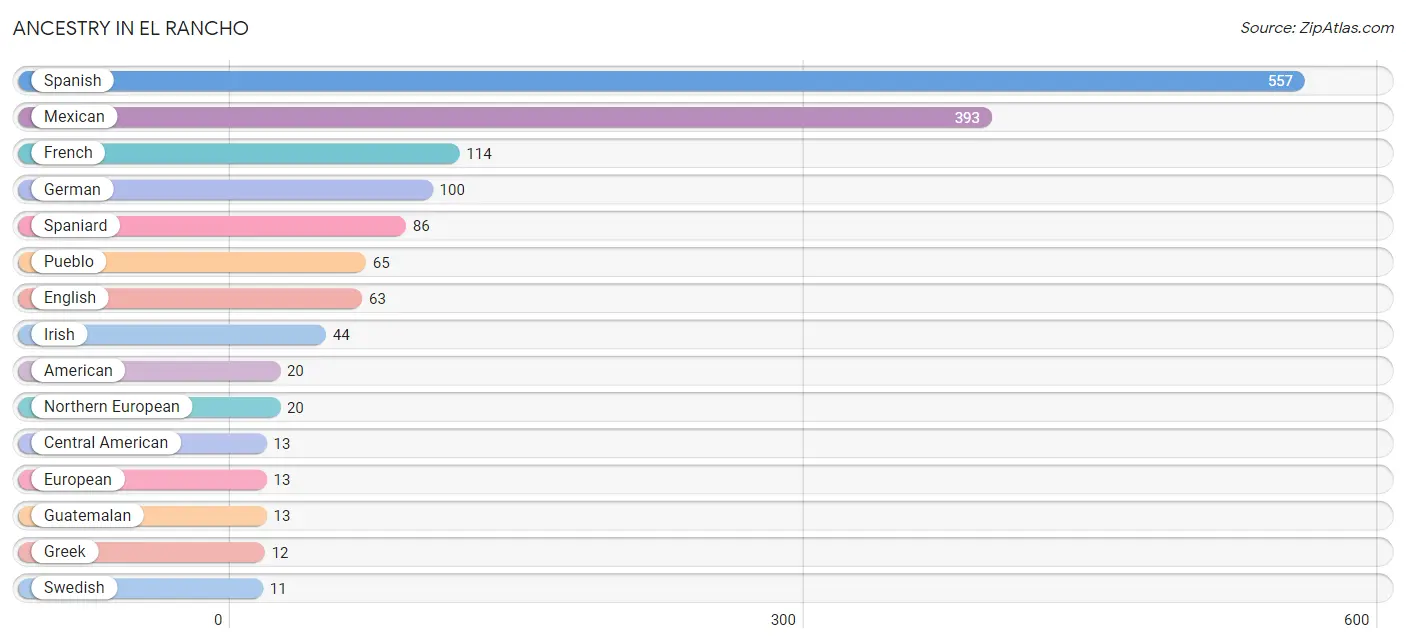
Ancestry in El Rancho
The most populous ancestries reported in El Rancho are Spanish (557 | 36.8%), Mexican (393 | 26.0%), French (114 | 7.5%), German (100 | 6.6%), and Spaniard (86 | 5.7%), together accounting for 82.6% of all El Rancho residents.
| Ancestry | # Population | % Population |
| American | 20 | 1.3% |
| Apache | 3 | 0.2% |
| Austrian | 3 | 0.2% |
| Basque | 3 | 0.2% |
| Belgian | 1 | 0.1% |
| British | 1 | 0.1% |
| Canadian | 8 | 0.5% |
| Central American | 13 | 0.9% |
| Cherokee | 3 | 0.2% |
| Danish | 4 | 0.3% |
| Dutch | 4 | 0.3% |
| Eastern European | 4 | 0.3% |
| English | 63 | 4.2% |
| European | 13 | 0.9% |
| French | 114 | 7.5% |
| German | 100 | 6.6% |
| Greek | 12 | 0.8% |
| Guatemalan | 13 | 0.9% |
| Indian (Asian) | 4 | 0.3% |
| Iranian | 2 | 0.1% |
| Irish | 44 | 2.9% |
| Italian | 10 | 0.7% |
| Jamaican | 4 | 0.3% |
| Lithuanian | 4 | 0.3% |
| Macedonian | 5 | 0.3% |
| Mexican | 393 | 26.0% |
| Northern European | 20 | 1.3% |
| Norwegian | 6 | 0.4% |
| Polish | 3 | 0.2% |
| Portuguese | 5 | 0.3% |
| Pueblo | 65 | 4.3% |
| Russian | 2 | 0.1% |
| Scandinavian | 10 | 0.7% |
| Scotch-Irish | 8 | 0.5% |
| Scottish | 6 | 0.4% |
| Slovak | 3 | 0.2% |
| Slovene | 2 | 0.1% |
| Spaniard | 86 | 5.7% |
| Spanish | 557 | 36.8% |
| Spanish American | 10 | 0.7% |
| Swedish | 11 | 0.7% |
| Swiss | 3 | 0.2% |
| Welsh | 1 | 0.1% |
| Yugoslavian | 4 | 0.3% | View All 44 Rows |
Immigrants in El Rancho
The most numerous immigrant groups reported in El Rancho came from Central America (98 | 6.5%), Latin America (98 | 6.5%), Mexico (95 | 6.3%), Europe (11 | 0.7%), and Africa (6 | 0.4%), together accounting for 20.4% of all El Rancho residents.
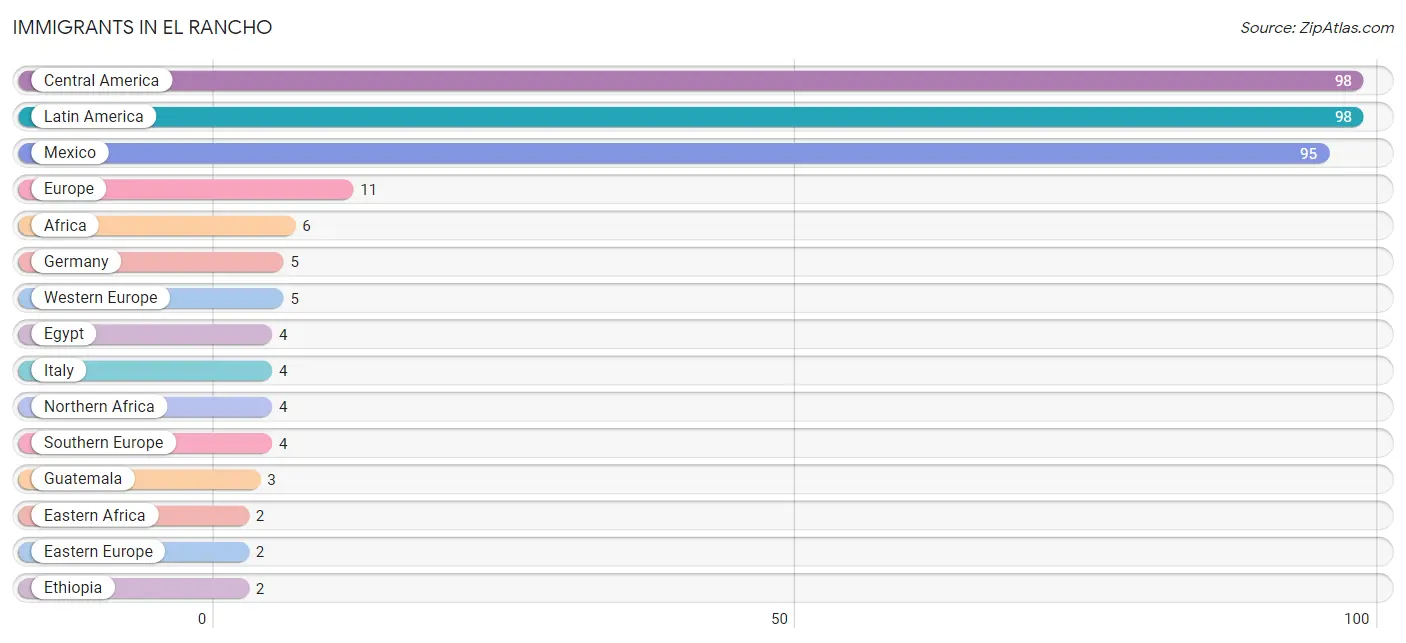
| Immigration Origin | # Population | % Population |
| Africa | 6 | 0.4% |
| Central America | 98 | 6.5% |
| Eastern Africa | 2 | 0.1% |
| Eastern Europe | 2 | 0.1% |
| Egypt | 4 | 0.3% |
| Ethiopia | 2 | 0.1% |
| Europe | 11 | 0.7% |
| Germany | 5 | 0.3% |
| Guatemala | 3 | 0.2% |
| Italy | 4 | 0.3% |
| Latin America | 98 | 6.5% |
| Mexico | 95 | 6.3% |
| Northern Africa | 4 | 0.3% |
| Russia | 2 | 0.1% |
| Southern Europe | 4 | 0.3% |
| Western Europe | 5 | 0.3% | View All 16 Rows |
Sex and Age in El Rancho
Sex and Age in El Rancho
The most populous age groups in El Rancho are 30 to 34 Years (111 | 15.7%) for men and 15 to 19 Years (82 | 10.2%) for women.
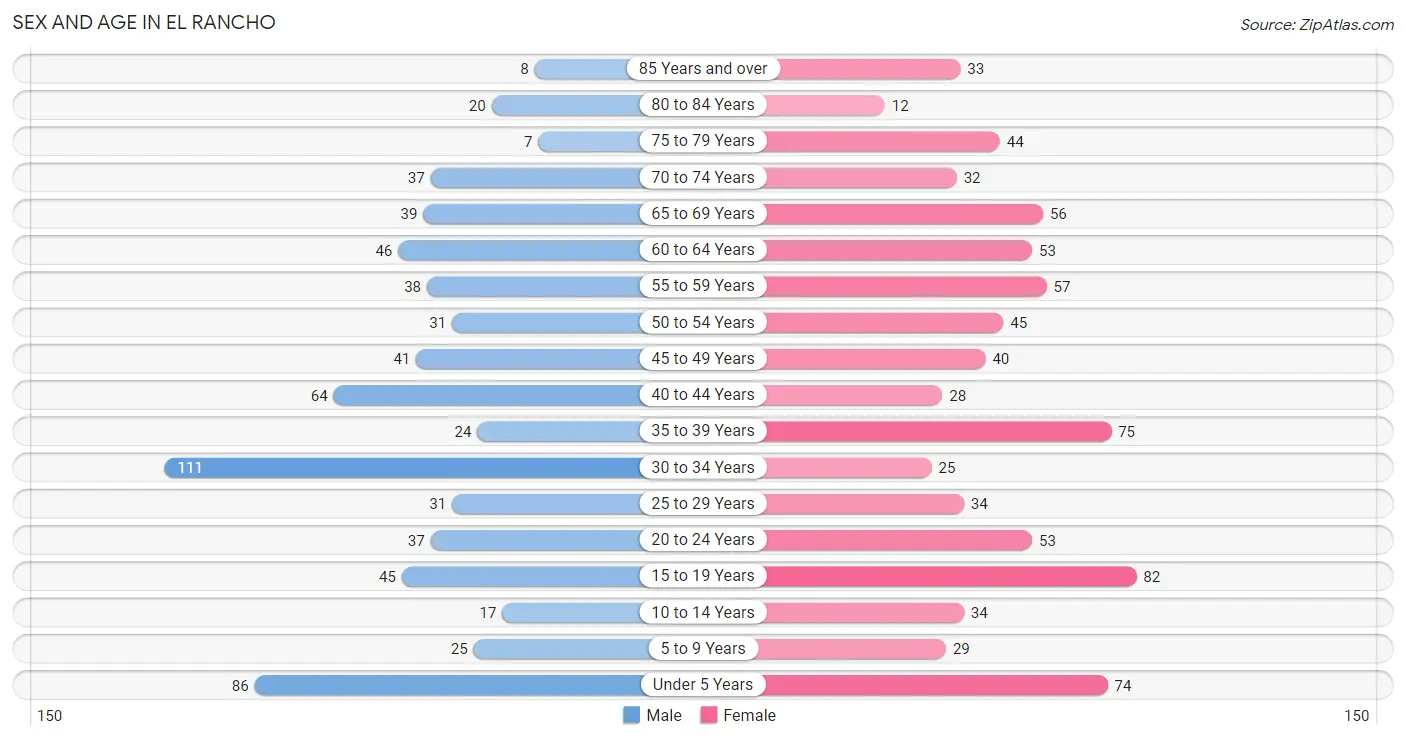
| Age Bracket | Male | Female |
| Under 5 Years | 86 (12.2%) | 74 (9.2%) |
| 5 to 9 Years | 25 (3.5%) | 29 (3.6%) |
| 10 to 14 Years | 17 (2.4%) | 34 (4.2%) |
| 15 to 19 Years | 45 (6.4%) | 82 (10.2%) |
| 20 to 24 Years | 37 (5.2%) | 53 (6.6%) |
| 25 to 29 Years | 31 (4.4%) | 34 (4.2%) |
| 30 to 34 Years | 111 (15.7%) | 25 (3.1%) |
| 35 to 39 Years | 24 (3.4%) | 75 (9.3%) |
| 40 to 44 Years | 64 (9.0%) | 28 (3.5%) |
| 45 to 49 Years | 41 (5.8%) | 40 (5.0%) |
| 50 to 54 Years | 31 (4.4%) | 45 (5.6%) |
| 55 to 59 Years | 38 (5.4%) | 57 (7.1%) |
| 60 to 64 Years | 46 (6.5%) | 53 (6.6%) |
| 65 to 69 Years | 39 (5.5%) | 56 (7.0%) |
| 70 to 74 Years | 37 (5.2%) | 32 (4.0%) |
| 75 to 79 Years | 7 (1.0%) | 44 (5.5%) |
| 80 to 84 Years | 20 (2.8%) | 12 (1.5%) |
| 85 Years and over | 8 (1.1%) | 33 (4.1%) |
| Total | 707 (100.0%) | 806 (100.0%) |
Families and Households in El Rancho
Median Family Size in El Rancho
The median family size in El Rancho is 2.86 persons per family, with single female/mother families (88 | 20.6%) accounting for the largest median family size of 3.08 persons per family. On the other hand, single male/father families (23 | 5.4%) represent the smallest median family size with 2.39 persons per family.
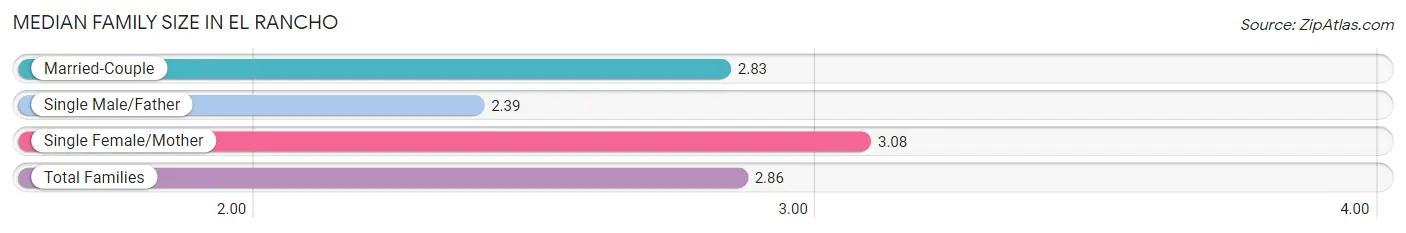
| Family Type | # Families | Family Size |
| Married-Couple | 317 (74.1%) | 2.83 |
| Single Male/Father | 23 (5.4%) | 2.39 |
| Single Female/Mother | 88 (20.6%) | 3.08 |
| Total Families | 428 (100.0%) | 2.86 |
Median Household Size in El Rancho
The median household size in El Rancho is 2.44 persons per household, with single female/mother households (88 | 14.2%) accounting for the largest median household size of 3.23 persons per household. non-family households (192 | 31.0%) represent the smallest median household size with 1.22 persons per household.
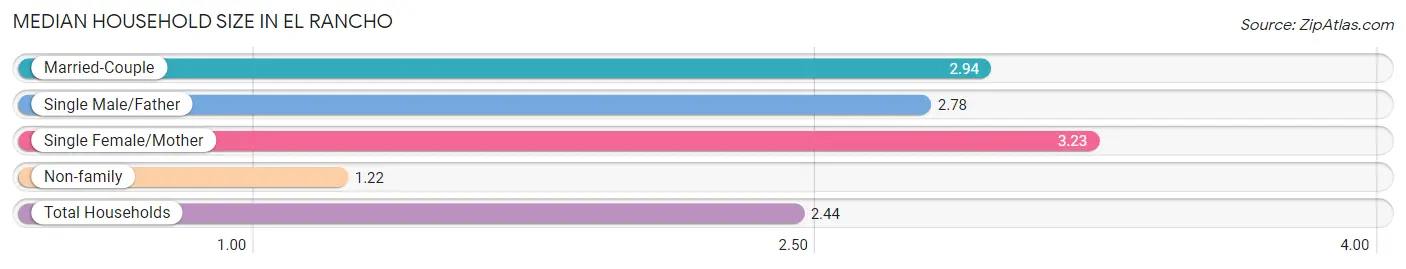
| Household Type | # Households | Household Size |
| Married-Couple | 317 (51.1%) | 2.94 |
| Single Male/Father | 23 (3.7%) | 2.78 |
| Single Female/Mother | 88 (14.2%) | 3.23 |
| Non-family | 192 (31.0%) | 1.22 |
| Total Households | 620 (100.0%) | 2.44 |
Household Size by Marriage Status in El Rancho
Out of a total of 620 households in El Rancho, 428 (69.0%) are family households, while 192 (31.0%) are nonfamily households. The most numerous type of family households are 2-person households, comprising 153, and the most common type of nonfamily households are 1-person households, comprising 158.
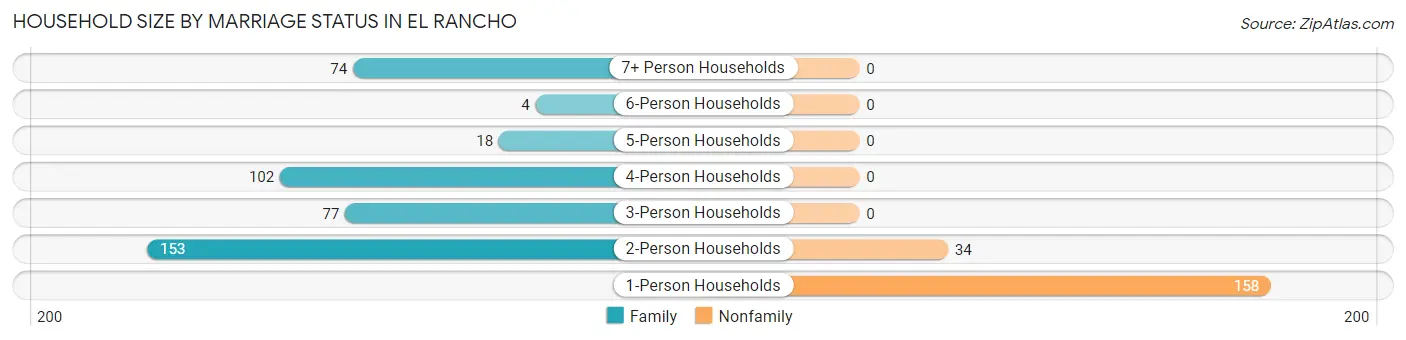
| Household Size | Family Households | Nonfamily Households |
| 1-Person Households | - | 158 (25.5%) |
| 2-Person Households | 153 (24.7%) | 34 (5.5%) |
| 3-Person Households | 77 (12.4%) | 0 (0.0%) |
| 4-Person Households | 102 (16.5%) | 0 (0.0%) |
| 5-Person Households | 18 (2.9%) | 0 (0.0%) |
| 6-Person Households | 4 (0.6%) | 0 (0.0%) |
| 7+ Person Households | 74 (11.9%) | 0 (0.0%) |
| Total | 428 (69.0%) | 192 (31.0%) |
Female Fertility in El Rancho
Fertility by Age in El Rancho
Average fertility rate in El Rancho is 28.0 births per 1,000 women. Women in the age bracket of 20 to 34 years have the highest fertility rate with 63.0 births per 1,000 women. Women in the age bracket of 20 to 34 years acount for 70.0% of all women with births.
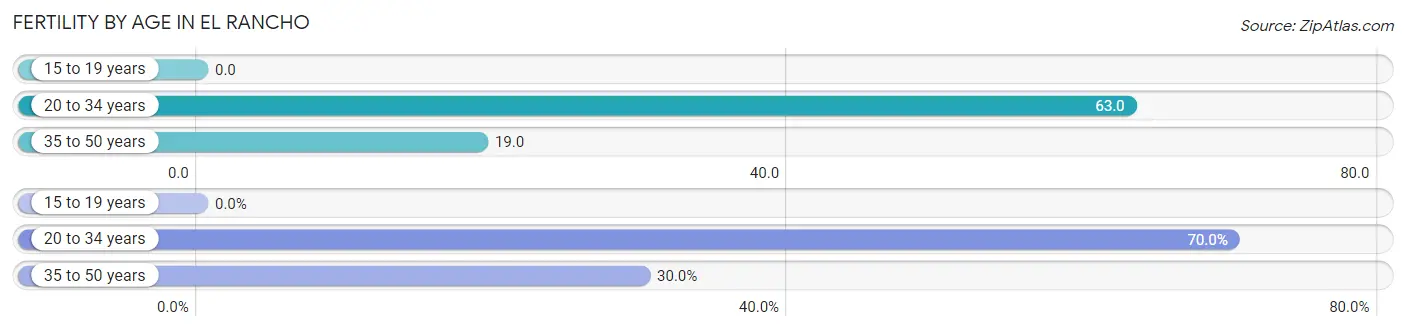
| Age Bracket | Women with Births | Births / 1,000 Women |
| 15 to 19 years | 0 (0.0%) | 0.0 |
| 20 to 34 years | 7 (70.0%) | 63.0 |
| 35 to 50 years | 3 (30.0%) | 19.0 |
| Total | 10 (100.0%) | 28.0 |
Fertility by Age by Marriage Status in El Rancho
30.0% of women with births (10) in El Rancho are married. The highest percentage of unmarried women with births falls into 20 to 34 years age bracket with 100.0% of them unmarried at the time of birth, while the lowest percentage of unmarried women with births belong to 35 to 50 years age bracket with 0.0% of them unmarried.
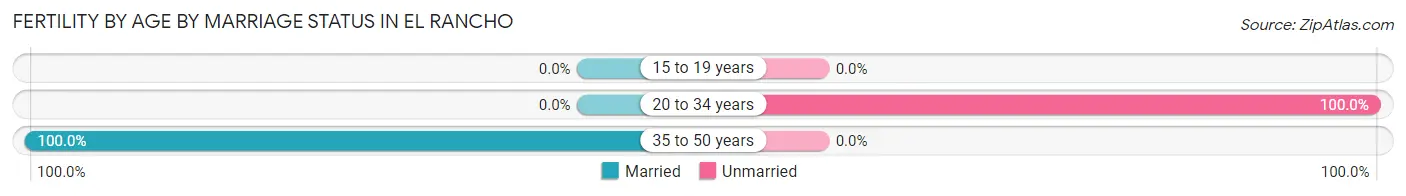
| Age Bracket | Married | Unmarried |
| 15 to 19 years | 0 (0.0%) | 0 (0.0%) |
| 20 to 34 years | 0 (0.0%) | 7 (100.0%) |
| 35 to 50 years | 3 (100.0%) | 0 (0.0%) |
| Total | 3 (30.0%) | 7 (70.0%) |
Fertility by Education in El Rancho
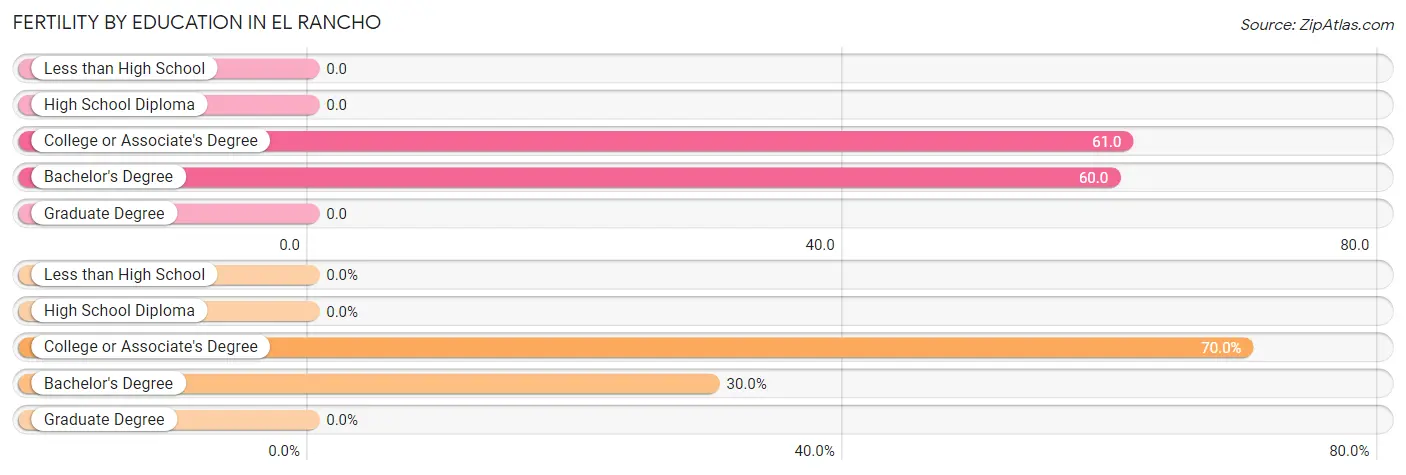
| Educational Attainment | Women with Births | Births / 1,000 Women |
| Less than High School | 0 (0.0%) | 0.0 |
| High School Diploma | 0 (0.0%) | 0.0 |
| College or Associate's Degree | 7 (70.0%) | 61.0 |
| Bachelor's Degree | 3 (30.0%) | 60.0 |
| Graduate Degree | 0 (0.0%) | 0.0 |
| Total | 10 (100.0%) | 28.0 |
Fertility by Education by Marriage Status in El Rancho
70.0% of women with births in El Rancho are unmarried. Women with the educational attainment of bachelor's degree are most likely to be married with 100.0% of them married at childbirth, while women with the educational attainment of college or associate's degree are least likely to be married with 100.0% of them unmarried at childbirth.
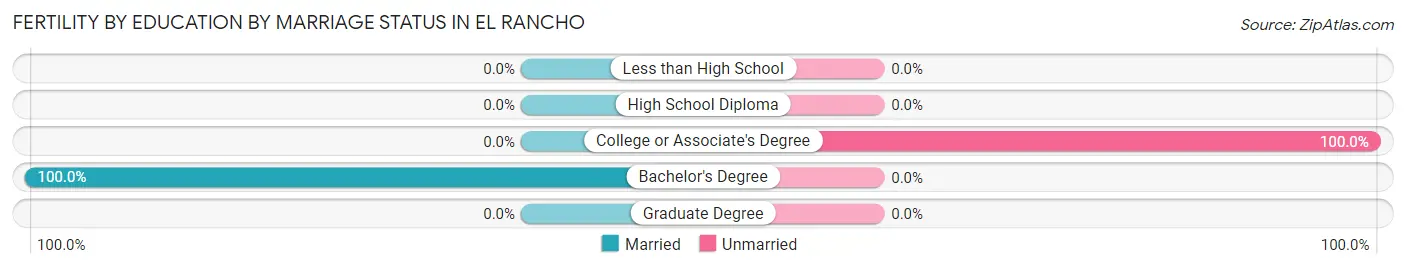
| Educational Attainment | Married | Unmarried |
| Less than High School | 0 (0.0%) | 0 (0.0%) |
| High School Diploma | 0 (0.0%) | 0 (0.0%) |
| College or Associate's Degree | 0 (0.0%) | 7 (100.0%) |
| Bachelor's Degree | 3 (100.0%) | 0 (0.0%) |
| Graduate Degree | 0 (0.0%) | 0 (0.0%) |
| Total | 3 (30.0%) | 7 (70.0%) |
Employment Characteristics in El Rancho
Employment by Class of Employer in El Rancho
Among the 677 employed individuals in El Rancho, private company employees (340 | 50.2%), self-employed (not incorporated) (126 | 18.6%), and state government employees (62 | 9.2%) make up the most common classes of employment.
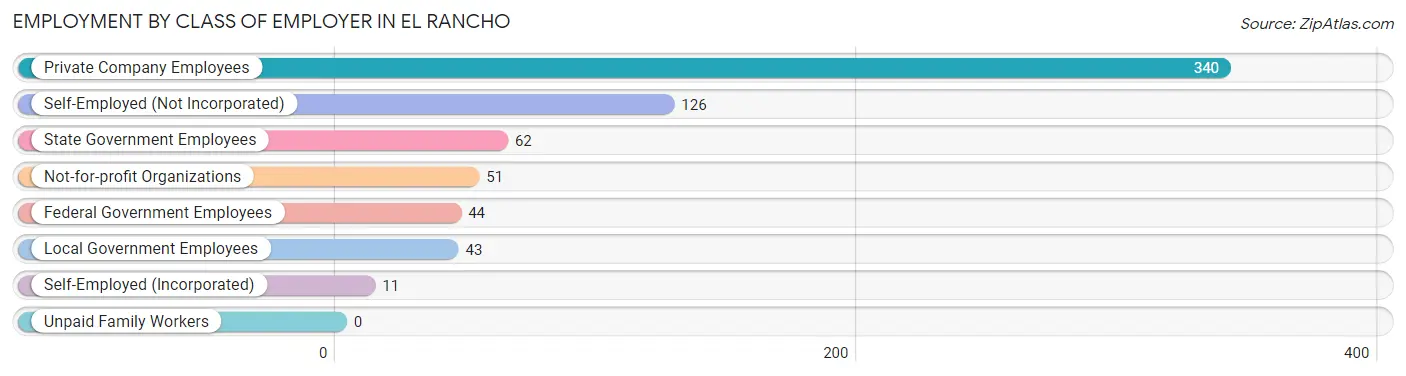
| Employer Class | # Employees | % Employees |
| Private Company Employees | 340 | 50.2% |
| Self-Employed (Incorporated) | 11 | 1.6% |
| Self-Employed (Not Incorporated) | 126 | 18.6% |
| Not-for-profit Organizations | 51 | 7.5% |
| Local Government Employees | 43 | 6.4% |
| State Government Employees | 62 | 9.2% |
| Federal Government Employees | 44 | 6.5% |
| Unpaid Family Workers | 0 | 0.0% |
| Total | 677 | 100.0% |
Employment Status by Age in El Rancho
According to the labor force statistics for El Rancho, out of the total population over 16 years of age (1,204), 57.5% or 692 individuals are in the labor force, with 0.7% or 5 of them unemployed. The age group with the highest labor force participation rate is 30 to 34 years, with 87.5% or 119 individuals in the labor force. Within the labor force, the 25 to 29 years age range has the highest percentage of unemployed individuals, with 8.9% or 5 of them being unemployed.
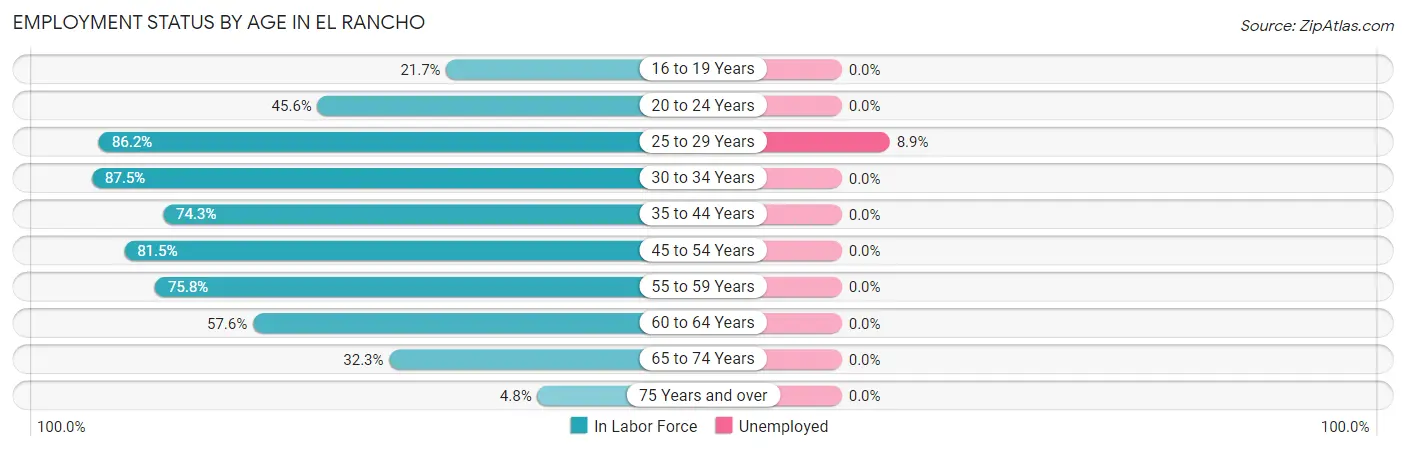
| Age Bracket | In Labor Force | Unemployed |
| 16 to 19 Years | 18 (21.7%) | 0 (0.0%) |
| 20 to 24 Years | 41 (45.6%) | 0 (0.0%) |
| 25 to 29 Years | 56 (86.2%) | 5 (8.9%) |
| 30 to 34 Years | 119 (87.5%) | 0 (0.0%) |
| 35 to 44 Years | 142 (74.3%) | 0 (0.0%) |
| 45 to 54 Years | 128 (81.5%) | 0 (0.0%) |
| 55 to 59 Years | 72 (75.8%) | 0 (0.0%) |
| 60 to 64 Years | 57 (57.6%) | 0 (0.0%) |
| 65 to 74 Years | 53 (32.3%) | 0 (0.0%) |
| 75 Years and over | 6 (4.8%) | 0 (0.0%) |
| Total | 692 (57.5%) | 5 (0.7%) |
Employment Status by Educational Attainment in El Rancho
According to labor force statistics for El Rancho, 77.3% of individuals (574) out of the total population between 25 and 64 years of age (743) are in the labor force, with 0.9% or 5 of them being unemployed. The group with the highest labor force participation rate are those with the educational attainment of college / associate degree, with 86.0% or 257 individuals in the labor force. Within the labor force, individuals with high school diploma education have the highest percentage of unemployment, with 3.3% or 5 of them being unemployed.
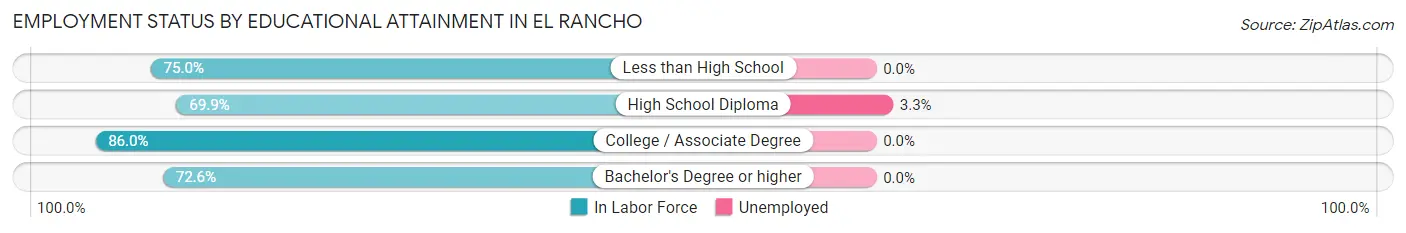
| Educational Attainment | In Labor Force | Unemployed |
| Less than High School | 15 (75.0%) | 0 (0.0%) |
| High School Diploma | 151 (69.9%) | 7 (3.3%) |
| College / Associate Degree | 257 (86.0%) | 0 (0.0%) |
| Bachelor's Degree or higher | 151 (72.6%) | 0 (0.0%) |
| Total | 574 (77.3%) | 7 (0.9%) |
Employment Occupations by Sex in El Rancho
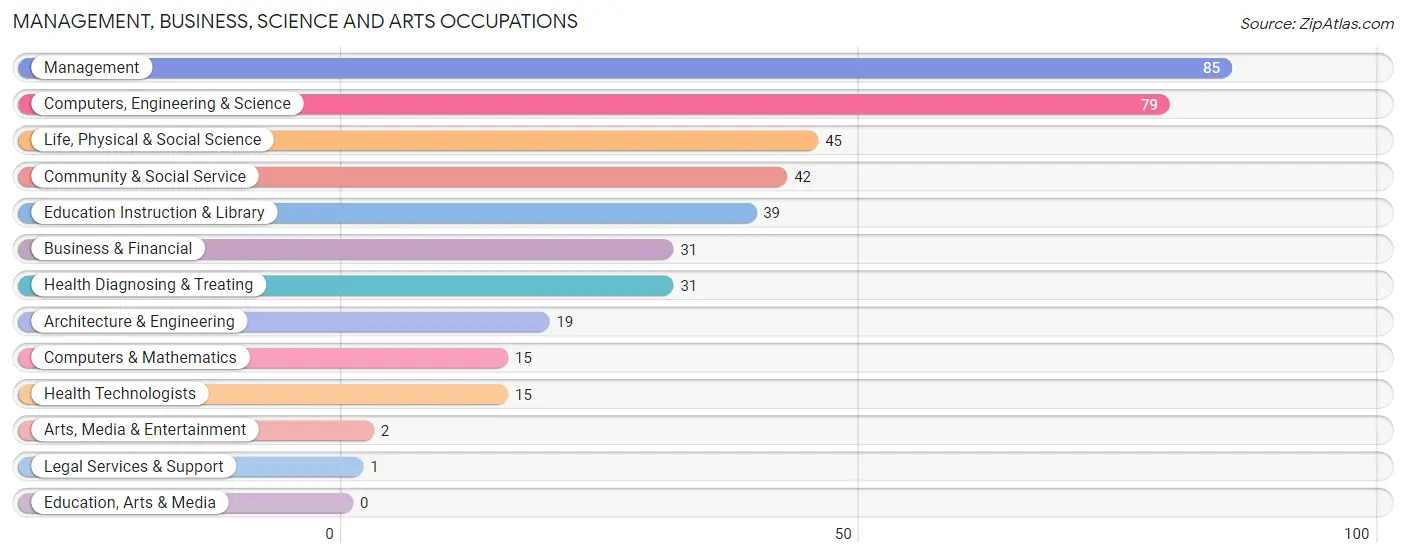
Management, Business, Science and Arts Occupations
The most common Management, Business, Science and Arts occupations in El Rancho are Management (85 | 12.4%), Computers, Engineering & Science (79 | 11.5%), Life, Physical & Social Science (45 | 6.6%), Community & Social Service (42 | 6.1%), and Education Instruction & Library (39 | 5.7%).
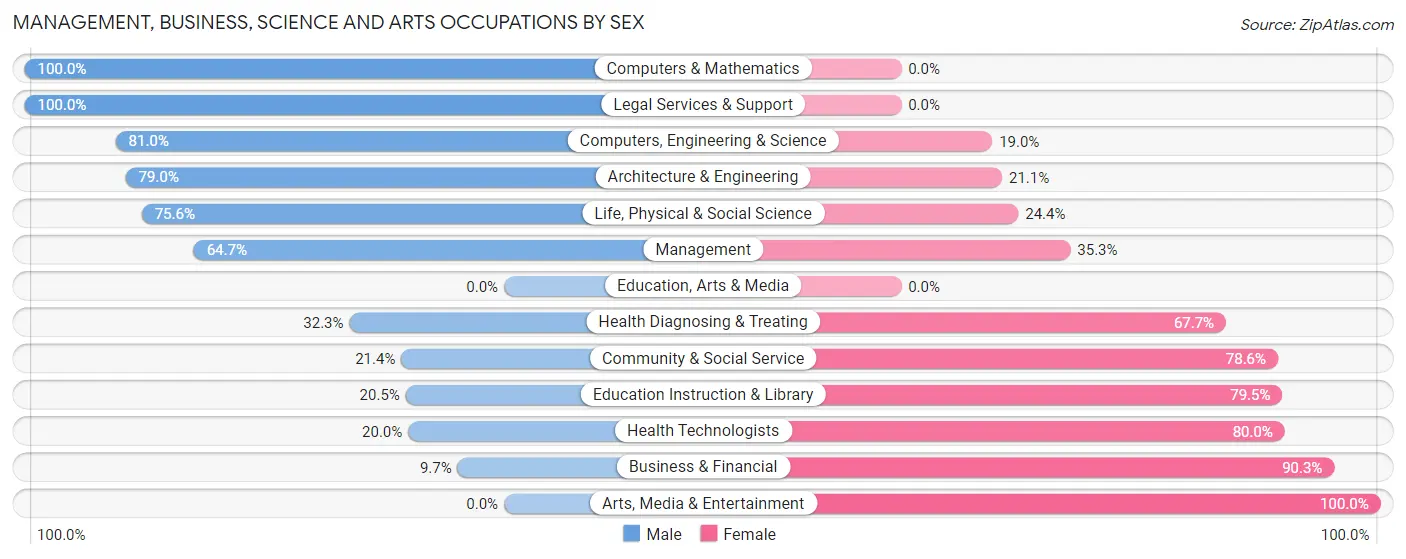
Management, Business, Science and Arts Occupations by Sex
Within the Management, Business, Science and Arts occupations in El Rancho, the most male-oriented occupations are Computers & Mathematics (100.0%), Legal Services & Support (100.0%), and Computers, Engineering & Science (81.0%), while the most female-oriented occupations are Arts, Media & Entertainment (100.0%), Business & Financial (90.3%), and Health Technologists (80.0%).
| Occupation | Male | Female |
| Management | 55 (64.7%) | 30 (35.3%) |
| Business & Financial | 3 (9.7%) | 28 (90.3%) |
| Computers, Engineering & Science | 64 (81.0%) | 15 (19.0%) |
| Computers & Mathematics | 15 (100.0%) | 0 (0.0%) |
| Architecture & Engineering | 15 (78.9%) | 4 (21.0%) |
| Life, Physical & Social Science | 34 (75.6%) | 11 (24.4%) |
| Community & Social Service | 9 (21.4%) | 33 (78.6%) |
| Education, Arts & Media | 0 (0.0%) | 0 (0.0%) |
| Legal Services & Support | 1 (100.0%) | 0 (0.0%) |
| Education Instruction & Library | 8 (20.5%) | 31 (79.5%) |
| Arts, Media & Entertainment | 0 (0.0%) | 2 (100.0%) |
| Health Diagnosing & Treating | 10 (32.3%) | 21 (67.7%) |
| Health Technologists | 3 (20.0%) | 12 (80.0%) |
| Total (Category) | 141 (52.6%) | 127 (47.4%) |
| Total (Overall) | 377 (54.9%) | 310 (45.1%) |
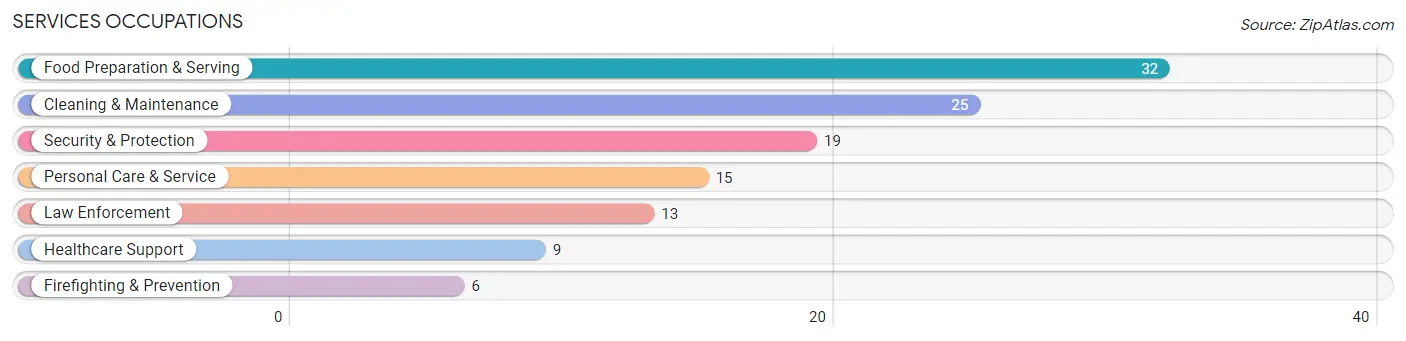
Services Occupations
The most common Services occupations in El Rancho are Food Preparation & Serving (32 | 4.7%), Cleaning & Maintenance (25 | 3.6%), Security & Protection (19 | 2.8%), Personal Care & Service (15 | 2.2%), and Law Enforcement (13 | 1.9%).
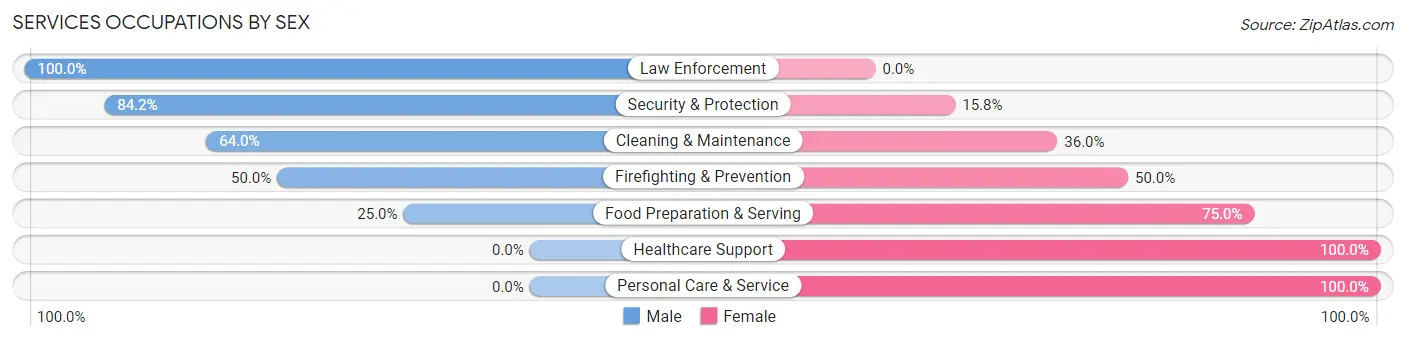
Services Occupations by Sex
Within the Services occupations in El Rancho, the most male-oriented occupations are Law Enforcement (100.0%), Security & Protection (84.2%), and Cleaning & Maintenance (64.0%), while the most female-oriented occupations are Healthcare Support (100.0%), Personal Care & Service (100.0%), and Food Preparation & Serving (75.0%).
| Occupation | Male | Female |
| Healthcare Support | 0 (0.0%) | 9 (100.0%) |
| Security & Protection | 16 (84.2%) | 3 (15.8%) |
| Firefighting & Prevention | 3 (50.0%) | 3 (50.0%) |
| Law Enforcement | 13 (100.0%) | 0 (0.0%) |
| Food Preparation & Serving | 8 (25.0%) | 24 (75.0%) |
| Cleaning & Maintenance | 16 (64.0%) | 9 (36.0%) |
| Personal Care & Service | 0 (0.0%) | 15 (100.0%) |
| Total (Category) | 40 (40.0%) | 60 (60.0%) |
| Total (Overall) | 377 (54.9%) | 310 (45.1%) |
Sales and Office Occupations
The most common Sales and Office occupations in El Rancho are Office & Administration (91 | 13.3%), and Sales & Related (51 | 7.4%).

Sales and Office Occupations by Sex

| Occupation | Male | Female |
| Sales & Related | 14 (27.5%) | 37 (72.6%) |
| Office & Administration | 14 (15.4%) | 77 (84.6%) |
| Total (Category) | 28 (19.7%) | 114 (80.3%) |
| Total (Overall) | 377 (54.9%) | 310 (45.1%) |
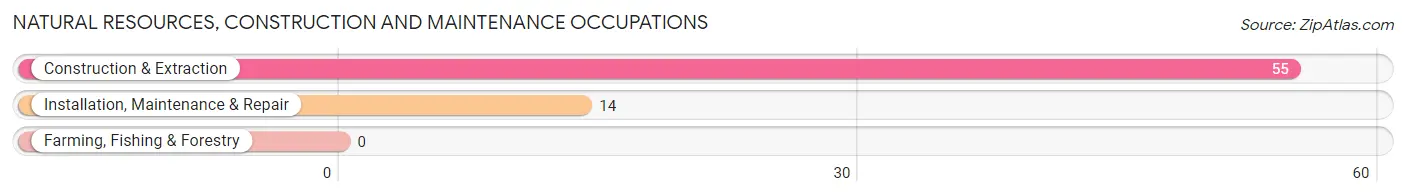
Natural Resources, Construction and Maintenance Occupations
The most common Natural Resources, Construction and Maintenance occupations in El Rancho are Construction & Extraction (55 | 8.0%), and Installation, Maintenance & Repair (14 | 2.0%).
Natural Resources, Construction and Maintenance Occupations by Sex
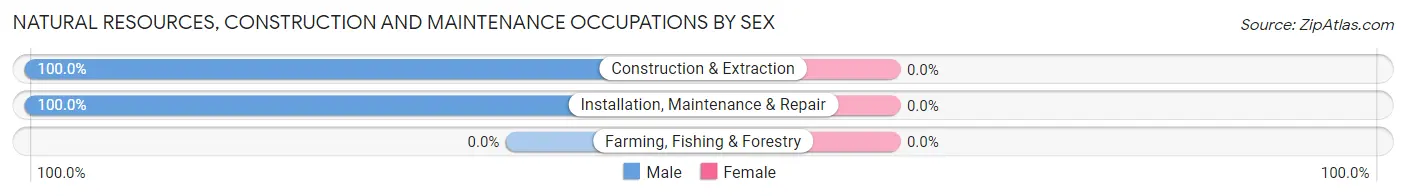
| Occupation | Male | Female |
| Farming, Fishing & Forestry | 0 (0.0%) | 0 (0.0%) |
| Construction & Extraction | 55 (100.0%) | 0 (0.0%) |
| Installation, Maintenance & Repair | 14 (100.0%) | 0 (0.0%) |
| Total (Category) | 69 (100.0%) | 0 (0.0%) |
| Total (Overall) | 377 (54.9%) | 310 (45.1%) |
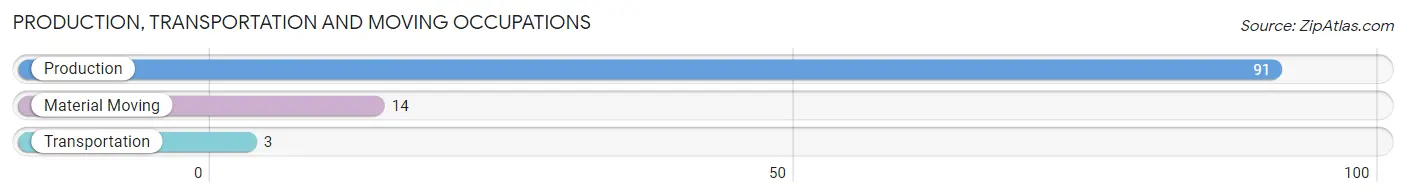
Production, Transportation and Moving Occupations
The most common Production, Transportation and Moving occupations in El Rancho are Production (91 | 13.3%), Material Moving (14 | 2.0%), and Transportation (3 | 0.4%).
Production, Transportation and Moving Occupations by Sex
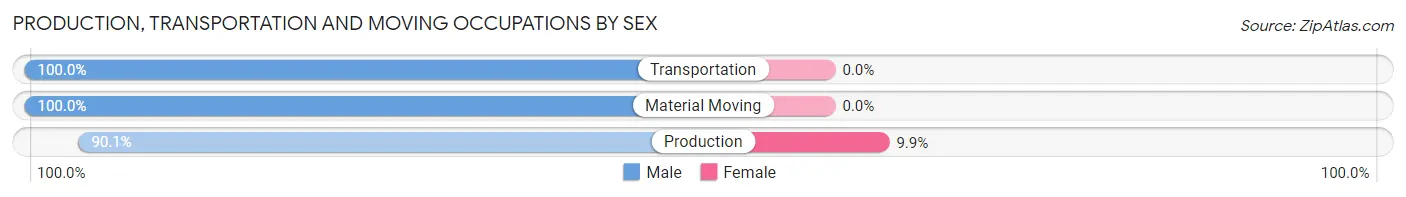
| Occupation | Male | Female |
| Production | 82 (90.1%) | 9 (9.9%) |
| Transportation | 3 (100.0%) | 0 (0.0%) |
| Material Moving | 14 (100.0%) | 0 (0.0%) |
| Total (Category) | 99 (91.7%) | 9 (8.3%) |
| Total (Overall) | 377 (54.9%) | 310 (45.1%) |
Employment Industries by Sex in El Rancho
Employment Industries in El Rancho
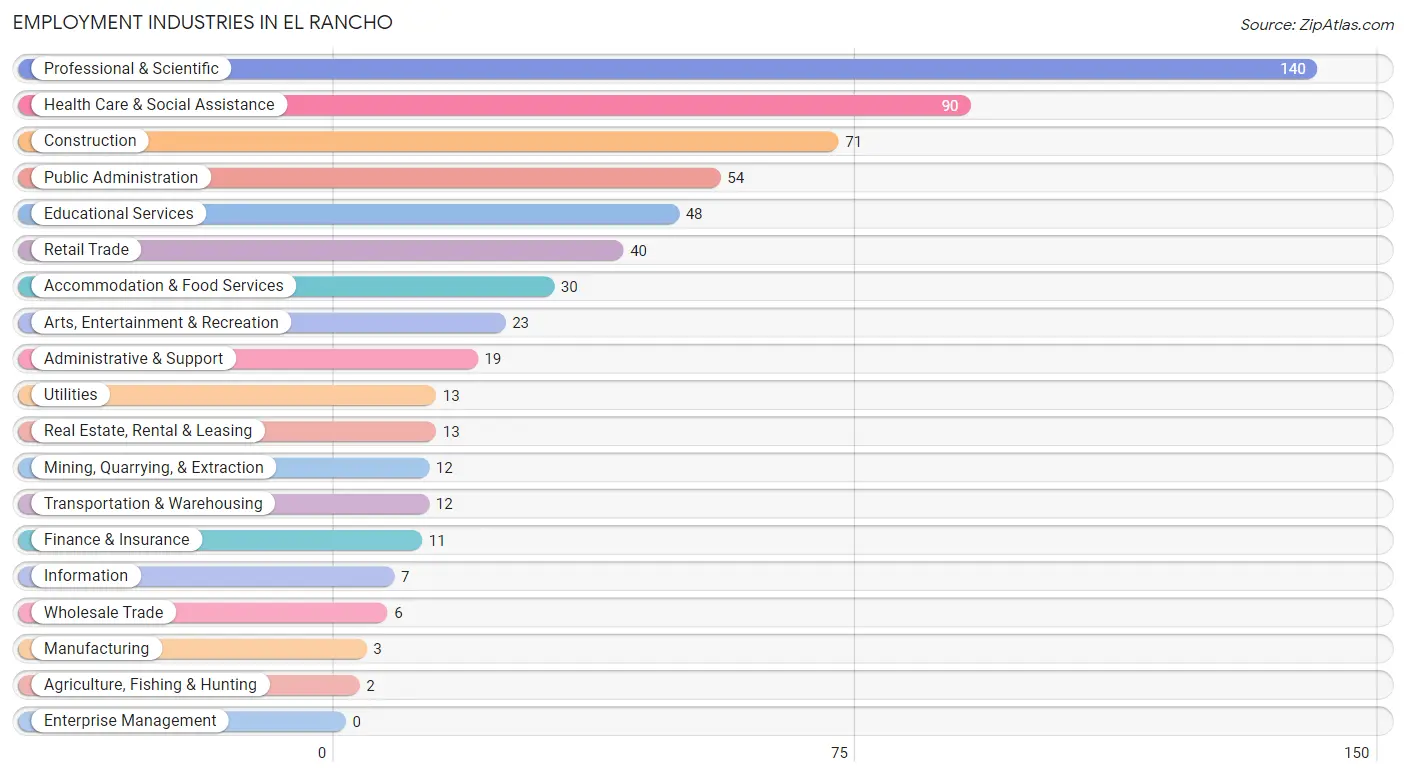
The major employment industries in El Rancho include Professional & Scientific (140 | 20.4%), Health Care & Social Assistance (90 | 13.1%), Construction (71 | 10.3%), Public Administration (54 | 7.9%), and Educational Services (48 | 7.0%).
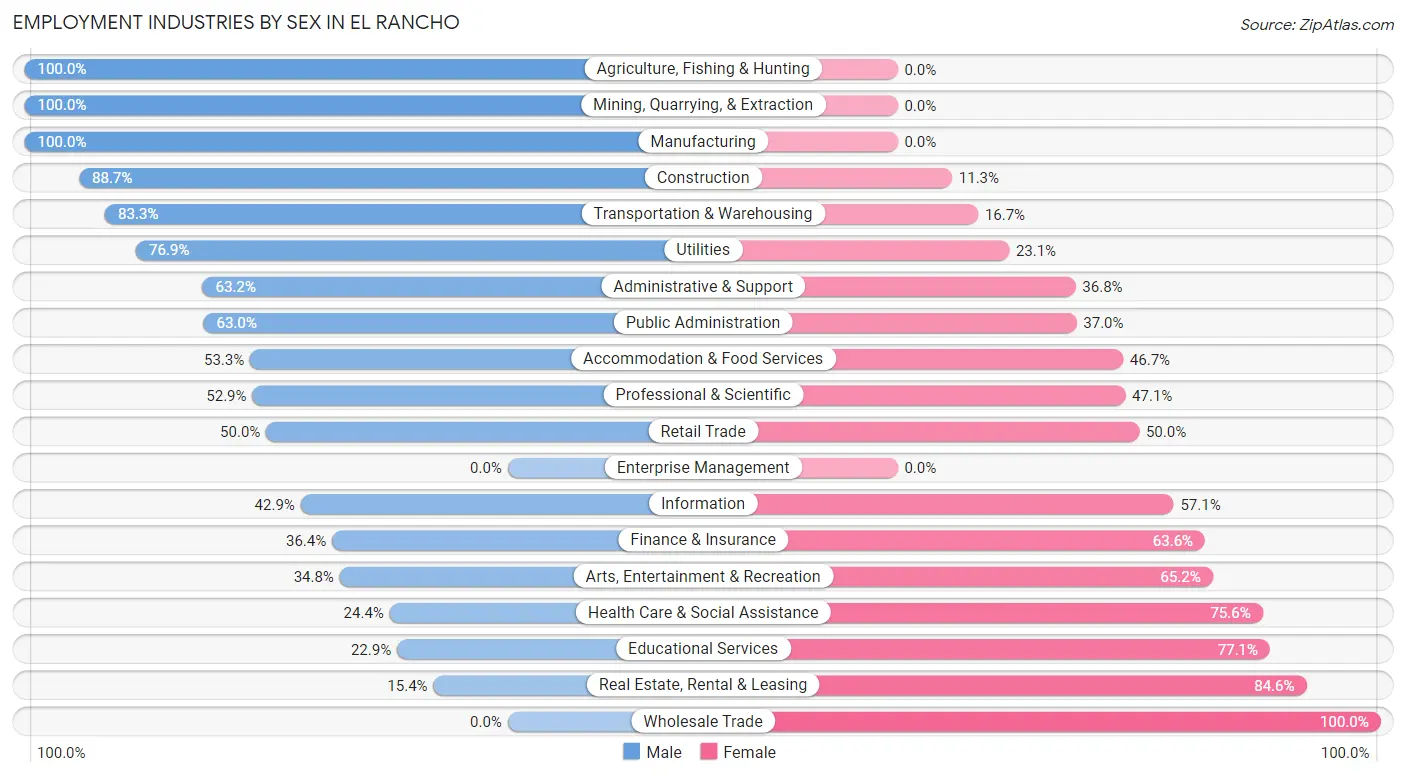
Employment Industries by Sex in El Rancho
The El Rancho industries that see more men than women are Agriculture, Fishing & Hunting (100.0%), Mining, Quarrying, & Extraction (100.0%), and Manufacturing (100.0%), whereas the industries that tend to have a higher number of women are Wholesale Trade (100.0%), Real Estate, Rental & Leasing (84.6%), and Educational Services (77.1%).
| Industry | Male | Female |
| Agriculture, Fishing & Hunting | 2 (100.0%) | 0 (0.0%) |
| Mining, Quarrying, & Extraction | 12 (100.0%) | 0 (0.0%) |
| Construction | 63 (88.7%) | 8 (11.3%) |
| Manufacturing | 3 (100.0%) | 0 (0.0%) |
| Wholesale Trade | 0 (0.0%) | 6 (100.0%) |
| Retail Trade | 20 (50.0%) | 20 (50.0%) |
| Transportation & Warehousing | 10 (83.3%) | 2 (16.7%) |
| Utilities | 10 (76.9%) | 3 (23.1%) |
| Information | 3 (42.9%) | 4 (57.1%) |
| Finance & Insurance | 4 (36.4%) | 7 (63.6%) |
| Real Estate, Rental & Leasing | 2 (15.4%) | 11 (84.6%) |
| Professional & Scientific | 74 (52.9%) | 66 (47.1%) |
| Enterprise Management | 0 (0.0%) | 0 (0.0%) |
| Administrative & Support | 12 (63.2%) | 7 (36.8%) |
| Educational Services | 11 (22.9%) | 37 (77.1%) |
| Health Care & Social Assistance | 22 (24.4%) | 68 (75.6%) |
| Arts, Entertainment & Recreation | 8 (34.8%) | 15 (65.2%) |
| Accommodation & Food Services | 16 (53.3%) | 14 (46.7%) |
| Public Administration | 34 (63.0%) | 20 (37.0%) |
| Total | 377 (54.9%) | 310 (45.1%) |
Education in El Rancho
School Enrollment in El Rancho
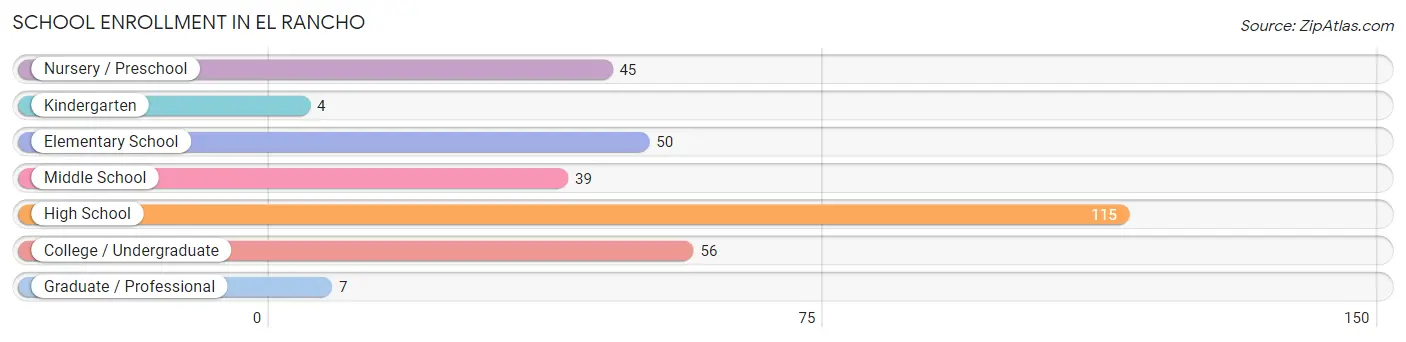
The most common levels of schooling among the 316 students in El Rancho are high school (115 | 36.4%), college / undergraduate (56 | 17.7%), and elementary school (50 | 15.8%).
| School Level | # Students | % Students |
| Nursery / Preschool | 45 | 14.2% |
| Kindergarten | 4 | 1.3% |
| Elementary School | 50 | 15.8% |
| Middle School | 39 | 12.3% |
| High School | 115 | 36.4% |
| College / Undergraduate | 56 | 17.7% |
| Graduate / Professional | 7 | 2.2% |
| Total | 316 | 100.0% |
School Enrollment by Age by Funding Source in El Rancho
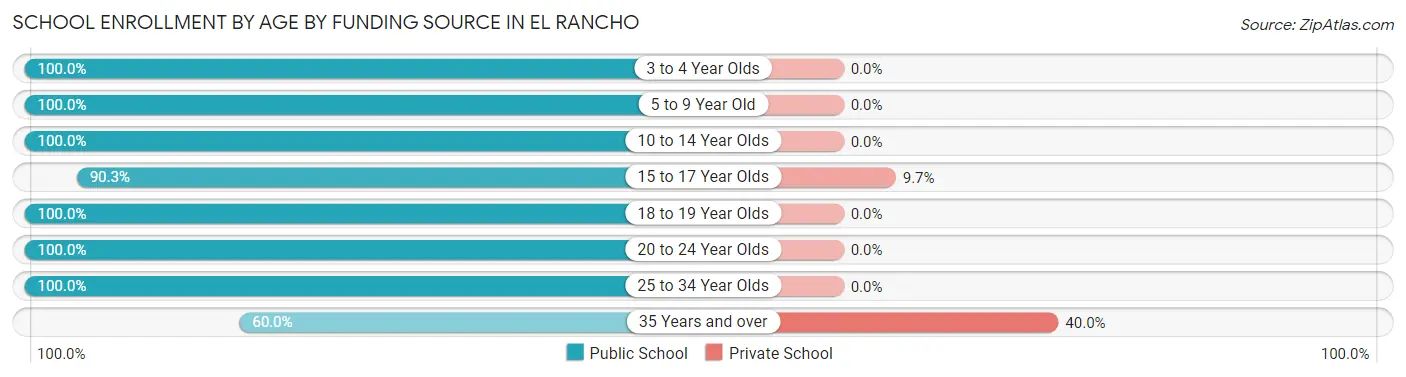
Out of a total of 316 students who are enrolled in schools in El Rancho, 14 (4.4%) attend a private institution, while the remaining 302 (95.6%) are enrolled in public schools. The age group of 35 years and over has the highest likelihood of being enrolled in private schools, with 4 (40.0% in the age bracket) enrolled. Conversely, the age group of 3 to 4 year olds has the lowest likelihood of being enrolled in a private school, with 41 (100.0% in the age bracket) attending a public institution.
| Age Bracket | Public School | Private School |
| 3 to 4 Year Olds | 41 (100.0%) | 0 (0.0%) |
| 5 to 9 Year Old | 49 (100.0%) | 0 (0.0%) |
| 10 to 14 Year Olds | 51 (100.0%) | 0 (0.0%) |
| 15 to 17 Year Olds | 93 (90.3%) | 10 (9.7%) |
| 18 to 19 Year Olds | 21 (100.0%) | 0 (0.0%) |
| 20 to 24 Year Olds | 32 (100.0%) | 0 (0.0%) |
| 25 to 34 Year Olds | 9 (100.0%) | 0 (0.0%) |
| 35 Years and over | 6 (60.0%) | 4 (40.0%) |
| Total | 302 (95.6%) | 14 (4.4%) |
Educational Attainment by Field of Study in El Rancho
Physical & health sciences (82 | 24.6%), business (49 | 14.7%), bio, nature & agricultural (44 | 13.2%), literature & languages (33 | 9.9%), and education (25 | 7.5%) are the most common fields of study among 333 individuals in El Rancho who have obtained a bachelor's degree or higher.
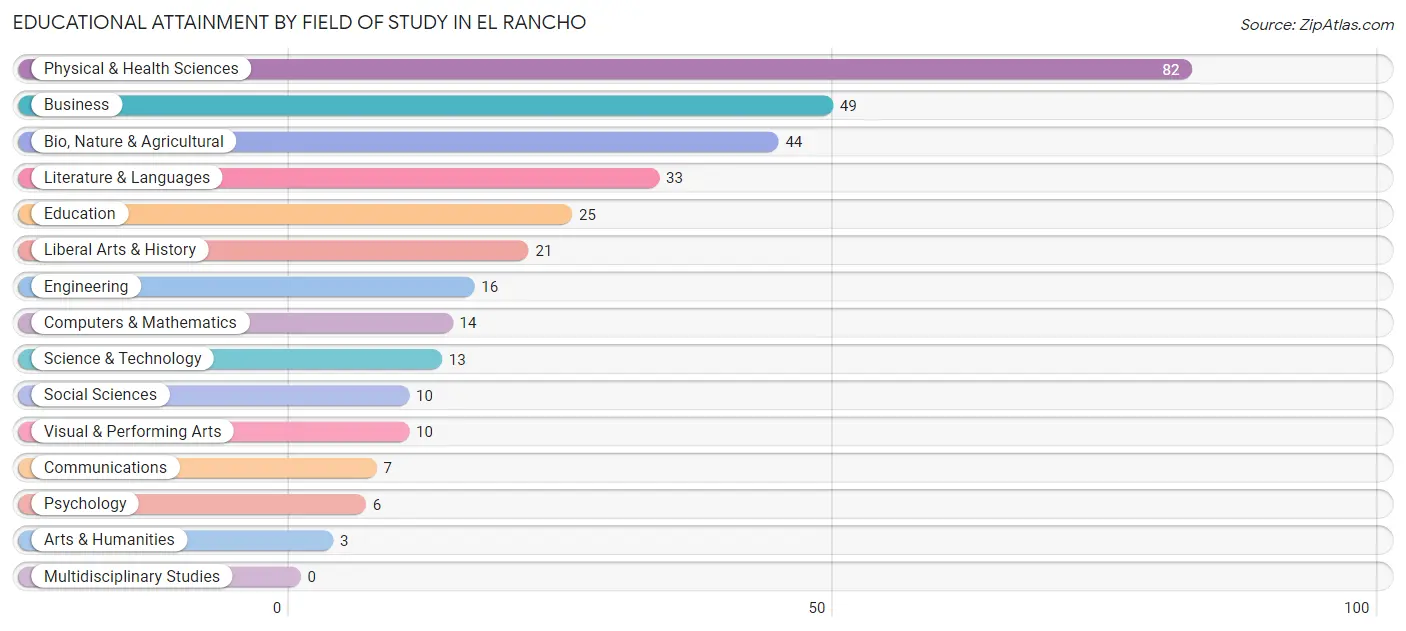
| Field of Study | # Graduates | % Graduates |
| Computers & Mathematics | 14 | 4.2% |
| Bio, Nature & Agricultural | 44 | 13.2% |
| Physical & Health Sciences | 82 | 24.6% |
| Psychology | 6 | 1.8% |
| Social Sciences | 10 | 3.0% |
| Engineering | 16 | 4.8% |
| Multidisciplinary Studies | 0 | 0.0% |
| Science & Technology | 13 | 3.9% |
| Business | 49 | 14.7% |
| Education | 25 | 7.5% |
| Literature & Languages | 33 | 9.9% |
| Liberal Arts & History | 21 | 6.3% |
| Visual & Performing Arts | 10 | 3.0% |
| Communications | 7 | 2.1% |
| Arts & Humanities | 3 | 0.9% |
| Total | 333 | 100.0% |
Transportation & Commute in El Rancho
Vehicle Availability by Sex in El Rancho
The most prevalent vehicle ownership categories in El Rancho are males with 3 vehicles (168, accounting for 44.7%) and females with 3 vehicles (73, making up 55.8%).
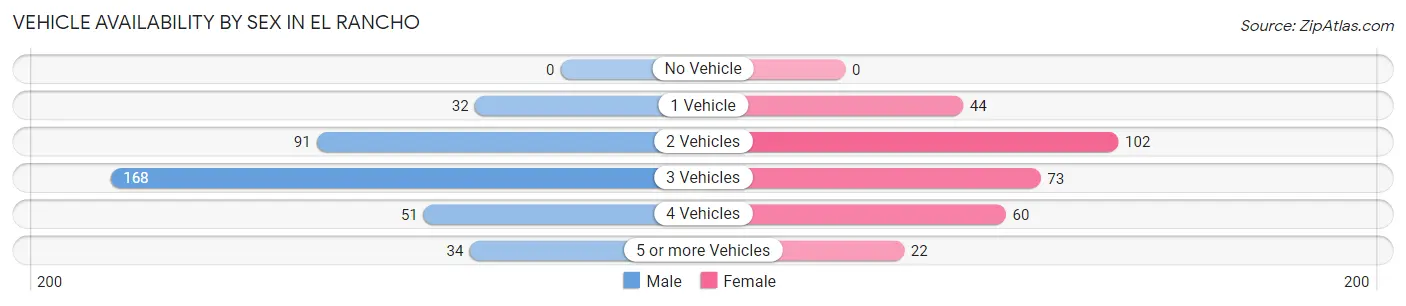
| Vehicles Available | Male | Female |
| No Vehicle | 0 (0.0%) | 0 (0.0%) |
| 1 Vehicle | 32 (8.5%) | 44 (14.6%) |
| 2 Vehicles | 91 (24.2%) | 102 (33.9%) |
| 3 Vehicles | 168 (44.7%) | 73 (24.2%) |
| 4 Vehicles | 51 (13.6%) | 60 (19.9%) |
| 5 or more Vehicles | 34 (9.0%) | 22 (7.3%) |
| Total | 376 (100.0%) | 301 (100.0%) |
Commute Time in El Rancho
The most frequently occuring commute durations in El Rancho are 30 to 34 minutes (229 commuters, 34.6%), 20 to 24 minutes (139 commuters, 21.0%), and 25 to 29 minutes (100 commuters, 15.1%).
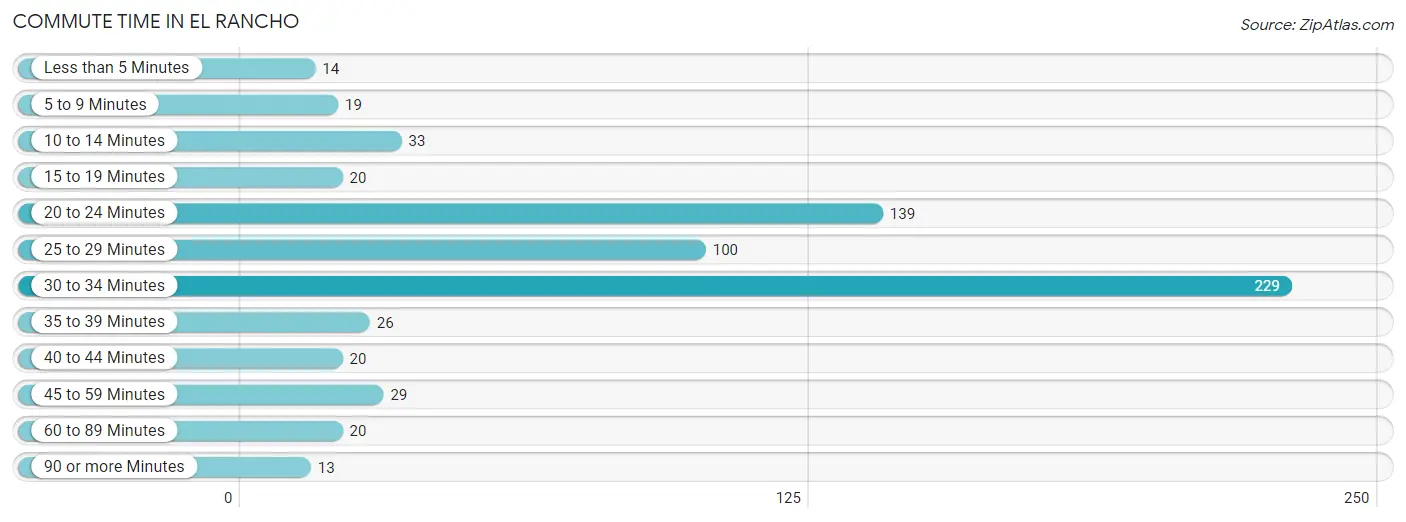
| Commute Time | # Commuters | % Commuters |
| Less than 5 Minutes | 14 | 2.1% |
| 5 to 9 Minutes | 19 | 2.9% |
| 10 to 14 Minutes | 33 | 5.0% |
| 15 to 19 Minutes | 20 | 3.0% |
| 20 to 24 Minutes | 139 | 21.0% |
| 25 to 29 Minutes | 100 | 15.1% |
| 30 to 34 Minutes | 229 | 34.6% |
| 35 to 39 Minutes | 26 | 3.9% |
| 40 to 44 Minutes | 20 | 3.0% |
| 45 to 59 Minutes | 29 | 4.4% |
| 60 to 89 Minutes | 20 | 3.0% |
| 90 or more Minutes | 13 | 2.0% |
Commute Time by Sex in El Rancho
The most common commute times in El Rancho are 30 to 34 minutes (153 commuters, 40.7%) for males and 30 to 34 minutes (76 commuters, 26.6%) for females.
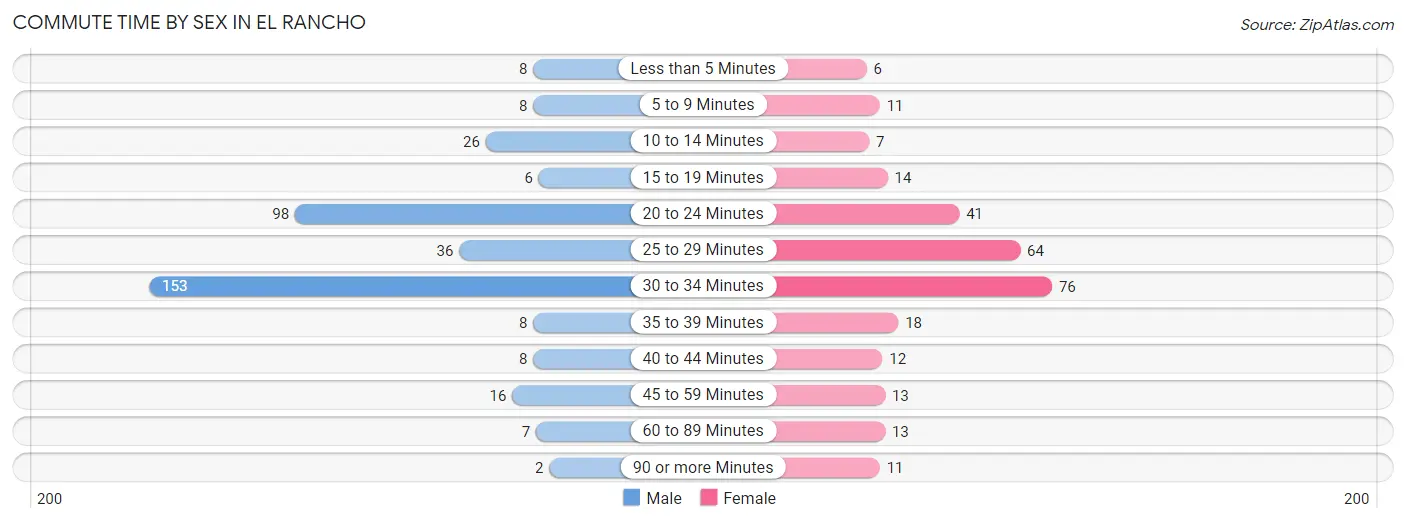
| Commute Time | Male | Female |
| Less than 5 Minutes | 8 (2.1%) | 6 (2.1%) |
| 5 to 9 Minutes | 8 (2.1%) | 11 (3.8%) |
| 10 to 14 Minutes | 26 (6.9%) | 7 (2.5%) |
| 15 to 19 Minutes | 6 (1.6%) | 14 (4.9%) |
| 20 to 24 Minutes | 98 (26.1%) | 41 (14.3%) |
| 25 to 29 Minutes | 36 (9.6%) | 64 (22.4%) |
| 30 to 34 Minutes | 153 (40.7%) | 76 (26.6%) |
| 35 to 39 Minutes | 8 (2.1%) | 18 (6.3%) |
| 40 to 44 Minutes | 8 (2.1%) | 12 (4.2%) |
| 45 to 59 Minutes | 16 (4.3%) | 13 (4.5%) |
| 60 to 89 Minutes | 7 (1.9%) | 13 (4.5%) |
| 90 or more Minutes | 2 (0.5%) | 11 (3.8%) |
Time of Departure to Work by Sex in El Rancho
The most frequent times of departure to work in El Rancho are 9:00 AM to 9:59 AM (77, 20.5%) for males and 7:30 AM to 7:59 AM (68, 23.8%) for females.
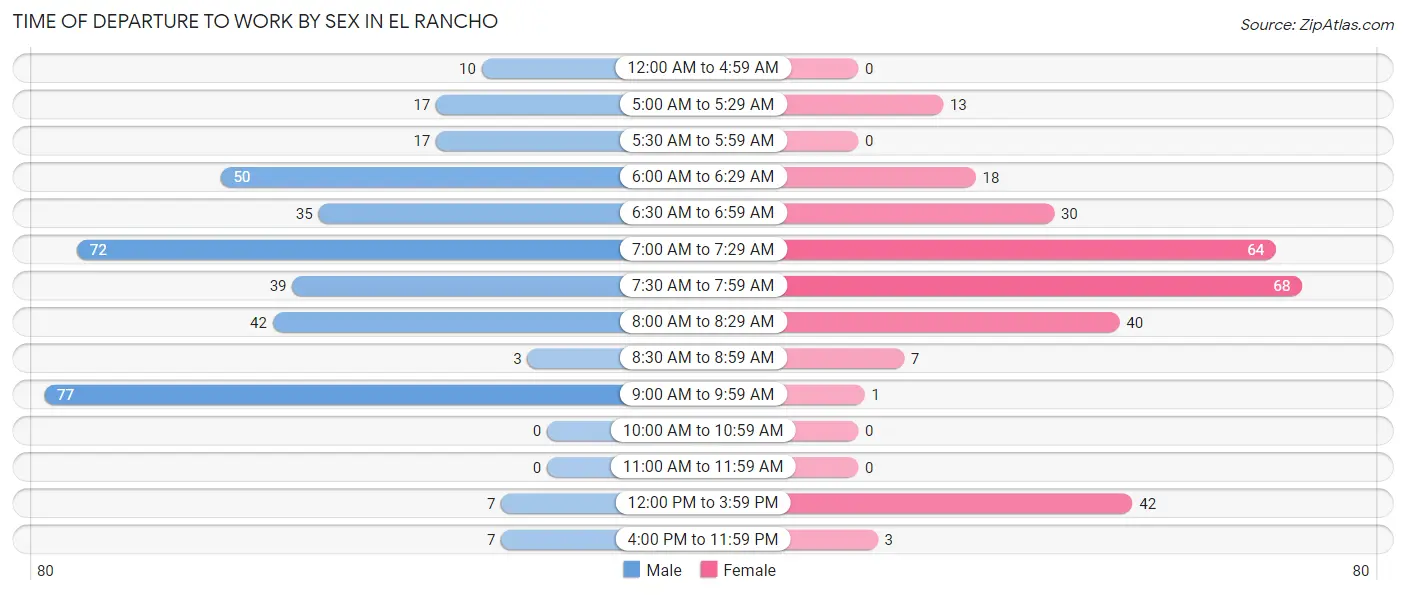
| Time of Departure | Male | Female |
| 12:00 AM to 4:59 AM | 10 (2.7%) | 0 (0.0%) |
| 5:00 AM to 5:29 AM | 17 (4.5%) | 13 (4.5%) |
| 5:30 AM to 5:59 AM | 17 (4.5%) | 0 (0.0%) |
| 6:00 AM to 6:29 AM | 50 (13.3%) | 18 (6.3%) |
| 6:30 AM to 6:59 AM | 35 (9.3%) | 30 (10.5%) |
| 7:00 AM to 7:29 AM | 72 (19.2%) | 64 (22.4%) |
| 7:30 AM to 7:59 AM | 39 (10.4%) | 68 (23.8%) |
| 8:00 AM to 8:29 AM | 42 (11.2%) | 40 (14.0%) |
| 8:30 AM to 8:59 AM | 3 (0.8%) | 7 (2.5%) |
| 9:00 AM to 9:59 AM | 77 (20.5%) | 1 (0.4%) |
| 10:00 AM to 10:59 AM | 0 (0.0%) | 0 (0.0%) |
| 11:00 AM to 11:59 AM | 0 (0.0%) | 0 (0.0%) |
| 12:00 PM to 3:59 PM | 7 (1.9%) | 42 (14.7%) |
| 4:00 PM to 11:59 PM | 7 (1.9%) | 3 (1.1%) |
| Total | 376 (100.0%) | 286 (100.0%) |
Housing Occupancy in El Rancho
Occupancy by Ownership in El Rancho
Of the total 620 dwellings in El Rancho, owner-occupied units account for 496 (80.0%), while renter-occupied units make up 124 (20.0%).
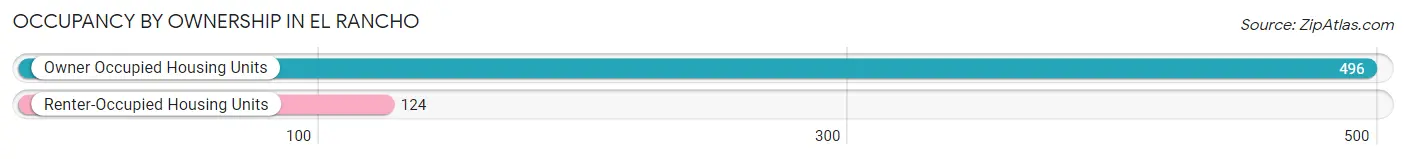
| Occupancy | # Housing Units | % Housing Units |
| Owner Occupied Housing Units | 496 | 80.0% |
| Renter-Occupied Housing Units | 124 | 20.0% |
| Total Occupied Housing Units | 620 | 100.0% |
Occupancy by Household Size in El Rancho
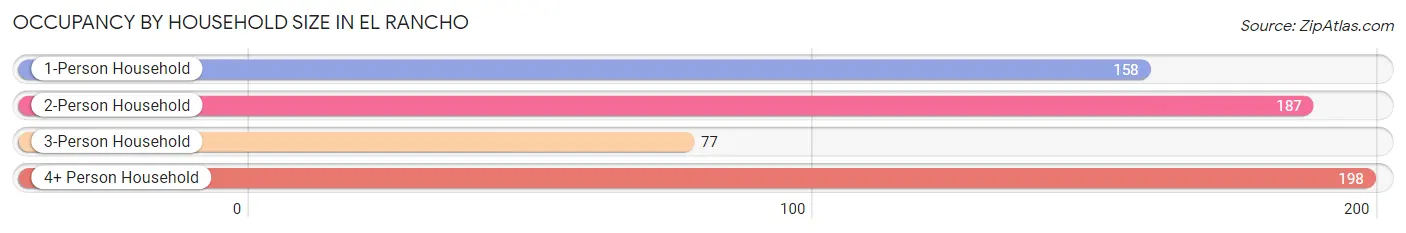
| Household Size | # Housing Units | % Housing Units |
| 1-Person Household | 158 | 25.5% |
| 2-Person Household | 187 | 30.2% |
| 3-Person Household | 77 | 12.4% |
| 4+ Person Household | 198 | 31.9% |
| Total Housing Units | 620 | 100.0% |
Occupancy by Ownership by Household Size in El Rancho
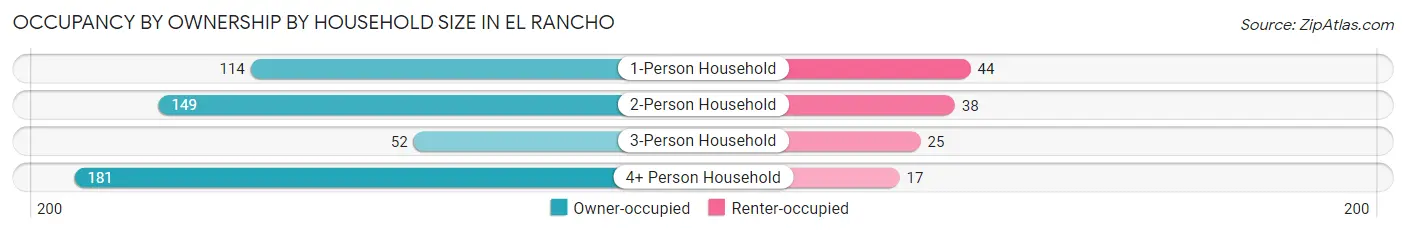
| Household Size | Owner-occupied | Renter-occupied |
| 1-Person Household | 114 (72.2%) | 44 (27.9%) |
| 2-Person Household | 149 (79.7%) | 38 (20.3%) |
| 3-Person Household | 52 (67.5%) | 25 (32.5%) |
| 4+ Person Household | 181 (91.4%) | 17 (8.6%) |
| Total Housing Units | 496 (80.0%) | 124 (20.0%) |
Occupancy by Educational Attainment in El Rancho
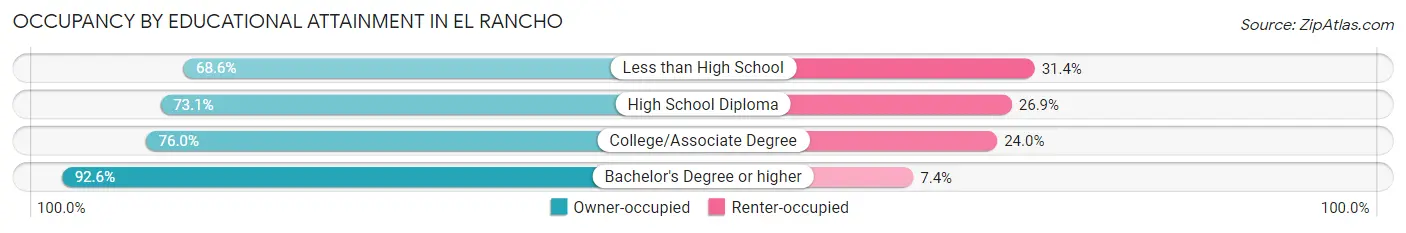
| Household Size | Owner-occupied | Renter-occupied |
| Less than High School | 24 (68.6%) | 11 (31.4%) |
| High School Diploma | 106 (73.1%) | 39 (26.9%) |
| College/Associate Degree | 190 (76.0%) | 60 (24.0%) |
| Bachelor's Degree or higher | 176 (92.6%) | 14 (7.4%) |
Occupancy by Age of Householder in El Rancho
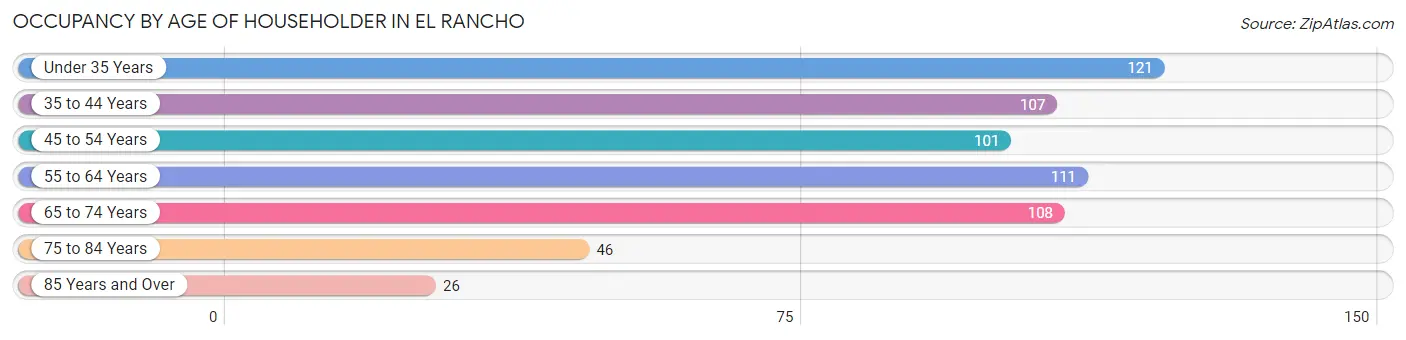
| Age Bracket | # Households | % Households |
| Under 35 Years | 121 | 19.5% |
| 35 to 44 Years | 107 | 17.3% |
| 45 to 54 Years | 101 | 16.3% |
| 55 to 64 Years | 111 | 17.9% |
| 65 to 74 Years | 108 | 17.4% |
| 75 to 84 Years | 46 | 7.4% |
| 85 Years and Over | 26 | 4.2% |
| Total | 620 | 100.0% |
Housing Finances in El Rancho
Median Income by Occupancy in El Rancho
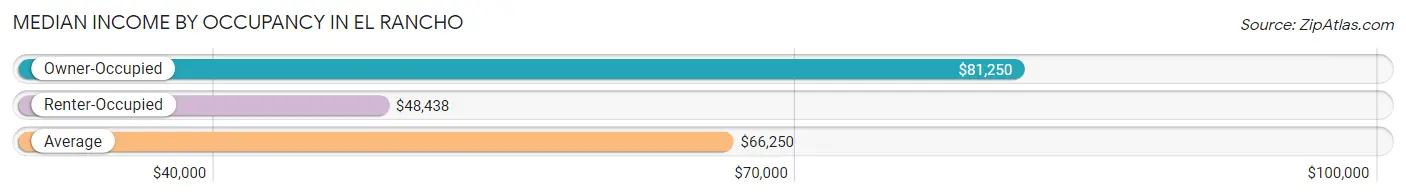
| Occupancy Type | # Households | Median Income |
| Owner-Occupied | 496 (80.0%) | $81,250 |
| Renter-Occupied | 124 (20.0%) | $48,438 |
| Average | 620 (100.0%) | $66,250 |
Occupancy by Householder Income Bracket in El Rancho
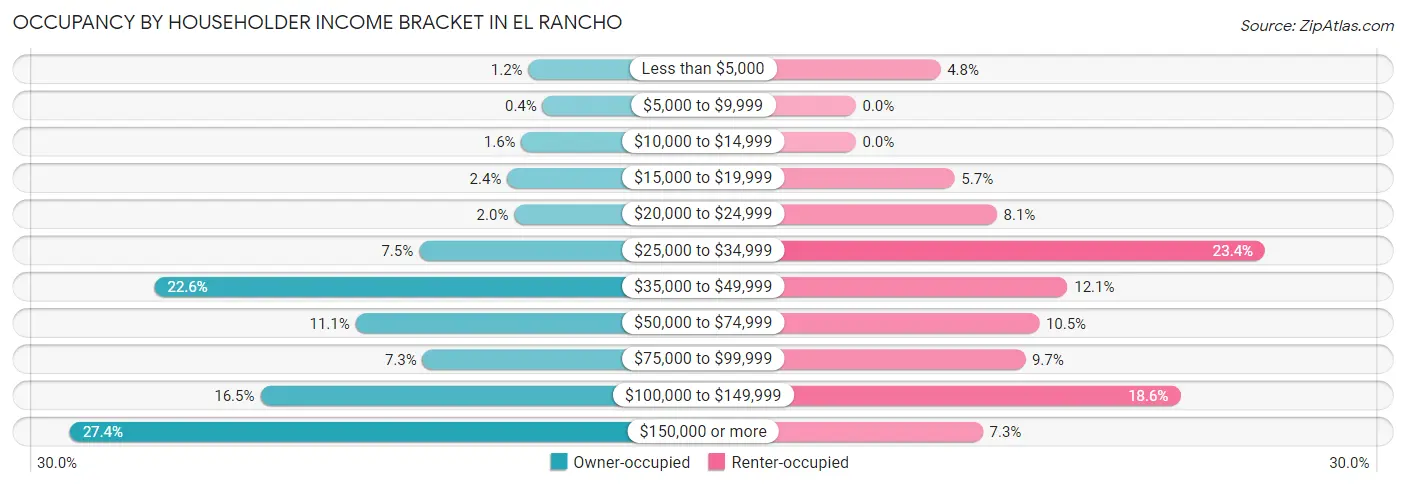
| Income Bracket | Owner-occupied | Renter-occupied |
| Less than $5,000 | 6 (1.2%) | 6 (4.8%) |
| $5,000 to $9,999 | 2 (0.4%) | 0 (0.0%) |
| $10,000 to $14,999 | 8 (1.6%) | 0 (0.0%) |
| $15,000 to $19,999 | 12 (2.4%) | 7 (5.7%) |
| $20,000 to $24,999 | 10 (2.0%) | 10 (8.1%) |
| $25,000 to $34,999 | 37 (7.5%) | 29 (23.4%) |
| $35,000 to $49,999 | 112 (22.6%) | 15 (12.1%) |
| $50,000 to $74,999 | 55 (11.1%) | 13 (10.5%) |
| $75,000 to $99,999 | 36 (7.3%) | 12 (9.7%) |
| $100,000 to $149,999 | 82 (16.5%) | 23 (18.5%) |
| $150,000 or more | 136 (27.4%) | 9 (7.3%) |
| Total | 496 (100.0%) | 124 (100.0%) |
Monthly Housing Cost Tiers in El Rancho
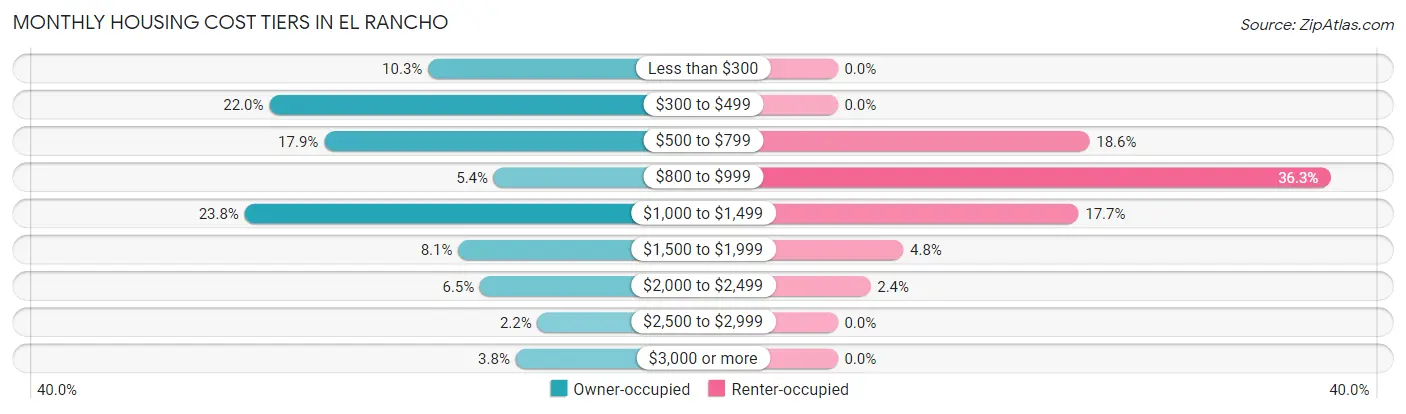
| Monthly Cost | Owner-occupied | Renter-occupied |
| Less than $300 | 51 (10.3%) | 0 (0.0%) |
| $300 to $499 | 109 (22.0%) | 0 (0.0%) |
| $500 to $799 | 89 (17.9%) | 23 (18.5%) |
| $800 to $999 | 27 (5.4%) | 45 (36.3%) |
| $1,000 to $1,499 | 118 (23.8%) | 22 (17.7%) |
| $1,500 to $1,999 | 40 (8.1%) | 6 (4.8%) |
| $2,000 to $2,499 | 32 (6.5%) | 3 (2.4%) |
| $2,500 to $2,999 | 11 (2.2%) | 0 (0.0%) |
| $3,000 or more | 19 (3.8%) | 0 (0.0%) |
| Total | 496 (100.0%) | 124 (100.0%) |
Physical Housing Characteristics in El Rancho
Housing Structures in El Rancho
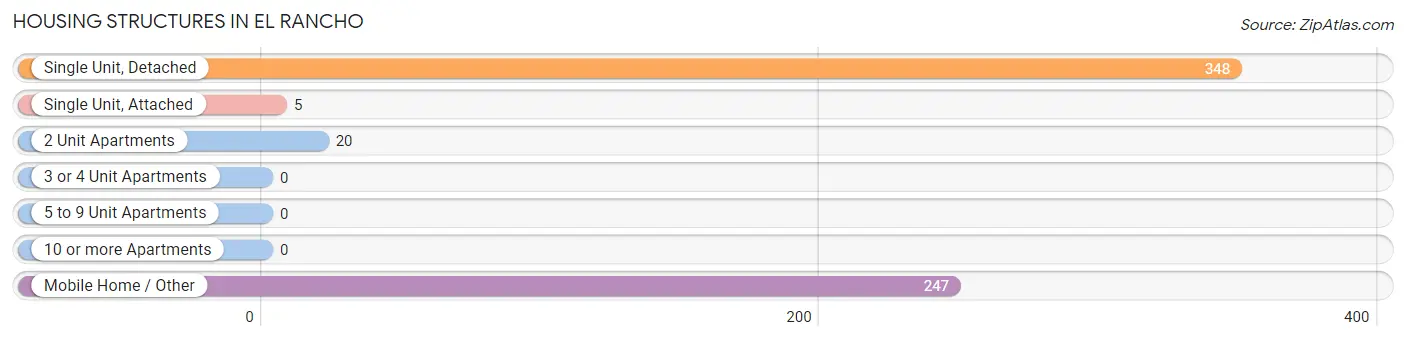
| Structure Type | # Housing Units | % Housing Units |
| Single Unit, Detached | 348 | 56.1% |
| Single Unit, Attached | 5 | 0.8% |
| 2 Unit Apartments | 20 | 3.2% |
| 3 or 4 Unit Apartments | 0 | 0.0% |
| 5 to 9 Unit Apartments | 0 | 0.0% |
| 10 or more Apartments | 0 | 0.0% |
| Mobile Home / Other | 247 | 39.8% |
| Total | 620 | 100.0% |
Housing Structures by Occupancy in El Rancho
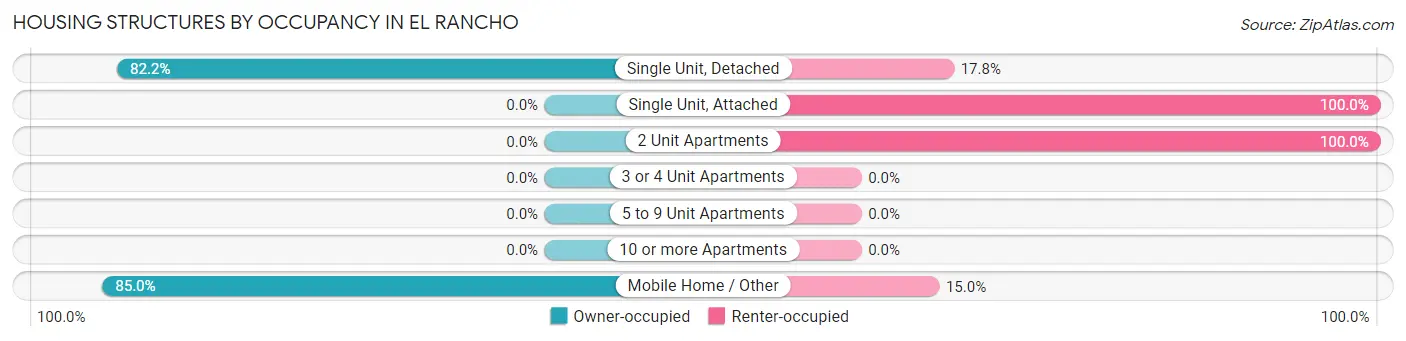
| Structure Type | Owner-occupied | Renter-occupied |
| Single Unit, Detached | 286 (82.2%) | 62 (17.8%) |
| Single Unit, Attached | 0 (0.0%) | 5 (100.0%) |
| 2 Unit Apartments | 0 (0.0%) | 20 (100.0%) |
| 3 or 4 Unit Apartments | 0 (0.0%) | 0 (0.0%) |
| 5 to 9 Unit Apartments | 0 (0.0%) | 0 (0.0%) |
| 10 or more Apartments | 0 (0.0%) | 0 (0.0%) |
| Mobile Home / Other | 210 (85.0%) | 37 (15.0%) |
| Total | 496 (80.0%) | 124 (20.0%) |
Housing Structures by Number of Rooms in El Rancho
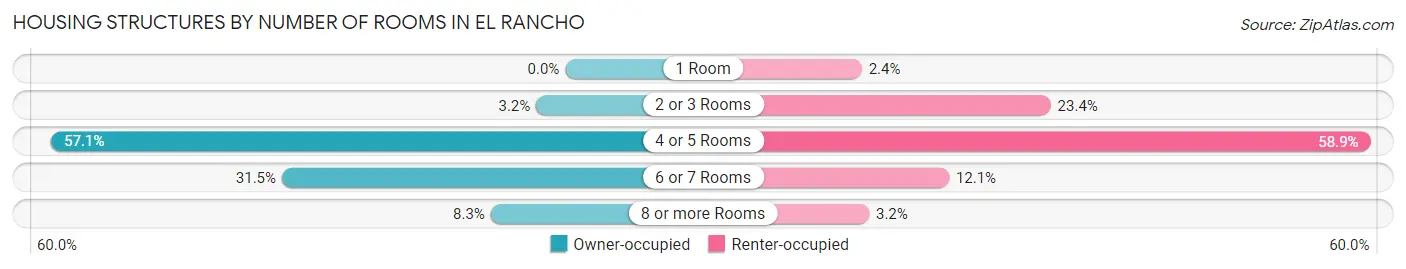
| Number of Rooms | Owner-occupied | Renter-occupied |
| 1 Room | 0 (0.0%) | 3 (2.4%) |
| 2 or 3 Rooms | 16 (3.2%) | 29 (23.4%) |
| 4 or 5 Rooms | 283 (57.1%) | 73 (58.9%) |
| 6 or 7 Rooms | 156 (31.5%) | 15 (12.1%) |
| 8 or more Rooms | 41 (8.3%) | 4 (3.2%) |
| Total | 496 (100.0%) | 124 (100.0%) |
Housing Structure by Heating Type in El Rancho
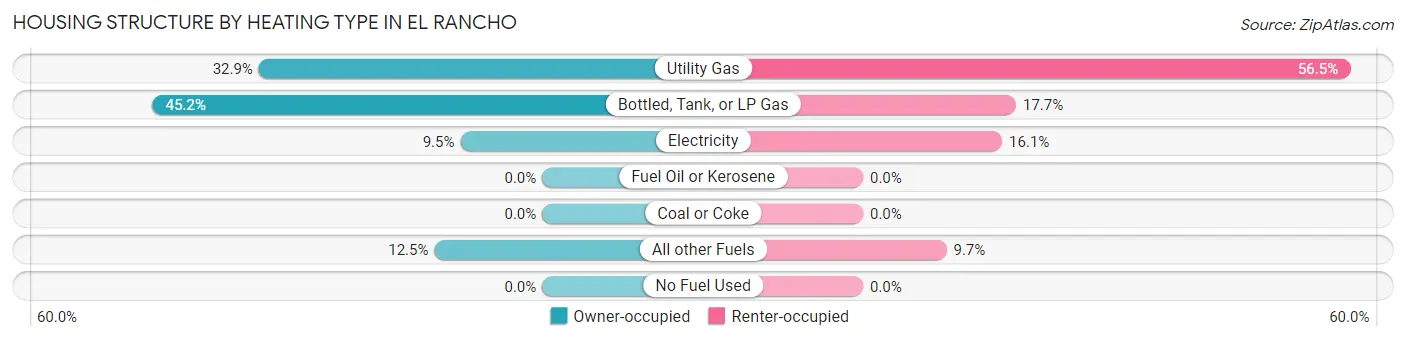
| Heating Type | Owner-occupied | Renter-occupied |
| Utility Gas | 163 (32.9%) | 70 (56.5%) |
| Bottled, Tank, or LP Gas | 224 (45.2%) | 22 (17.7%) |
| Electricity | 47 (9.5%) | 20 (16.1%) |
| Fuel Oil or Kerosene | 0 (0.0%) | 0 (0.0%) |
| Coal or Coke | 0 (0.0%) | 0 (0.0%) |
| All other Fuels | 62 (12.5%) | 12 (9.7%) |
| No Fuel Used | 0 (0.0%) | 0 (0.0%) |
| Total | 496 (100.0%) | 124 (100.0%) |
Household Vehicle Usage in El Rancho
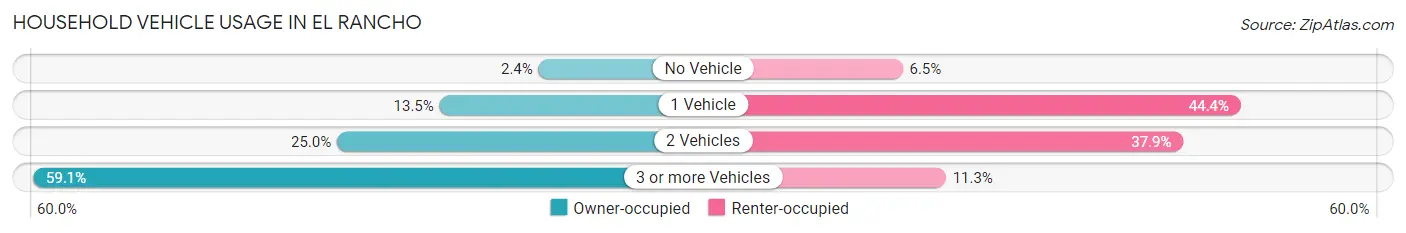
| Vehicles per Household | Owner-occupied | Renter-occupied |
| No Vehicle | 12 (2.4%) | 8 (6.5%) |
| 1 Vehicle | 67 (13.5%) | 55 (44.4%) |
| 2 Vehicles | 124 (25.0%) | 47 (37.9%) |
| 3 or more Vehicles | 293 (59.1%) | 14 (11.3%) |
| Total | 496 (100.0%) | 124 (100.0%) |
Real Estate & Mortgages in El Rancho
Real Estate and Mortgage Overview in El Rancho
| Characteristic | Without Mortgage | With Mortgage |
| Housing Units | 272 | 224 |
| Median Property Value | $270,300 | $251,600 |
| Median Household Income | $63,571 | $61 |
| Monthly Housing Costs | $458 | $17 |
| Real Estate Taxes | $1,490 | $72 |
Property Value by Mortgage Status in El Rancho
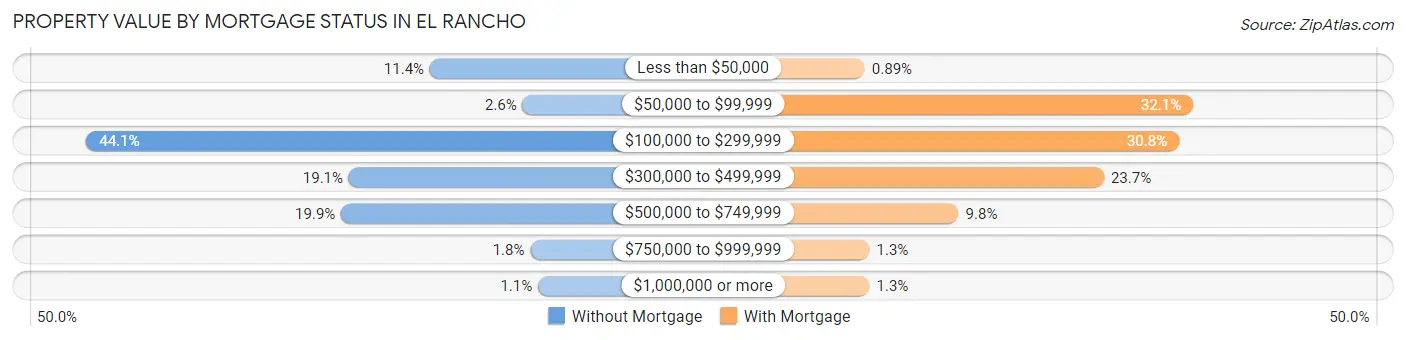
| Property Value | Without Mortgage | With Mortgage |
| Less than $50,000 | 31 (11.4%) | 2 (0.9%) |
| $50,000 to $99,999 | 7 (2.6%) | 72 (32.1%) |
| $100,000 to $299,999 | 120 (44.1%) | 69 (30.8%) |
| $300,000 to $499,999 | 52 (19.1%) | 53 (23.7%) |
| $500,000 to $749,999 | 54 (19.9%) | 22 (9.8%) |
| $750,000 to $999,999 | 5 (1.8%) | 3 (1.3%) |
| $1,000,000 or more | 3 (1.1%) | 3 (1.3%) |
| Total | 272 (100.0%) | 224 (100.0%) |
Household Income by Mortgage Status in El Rancho
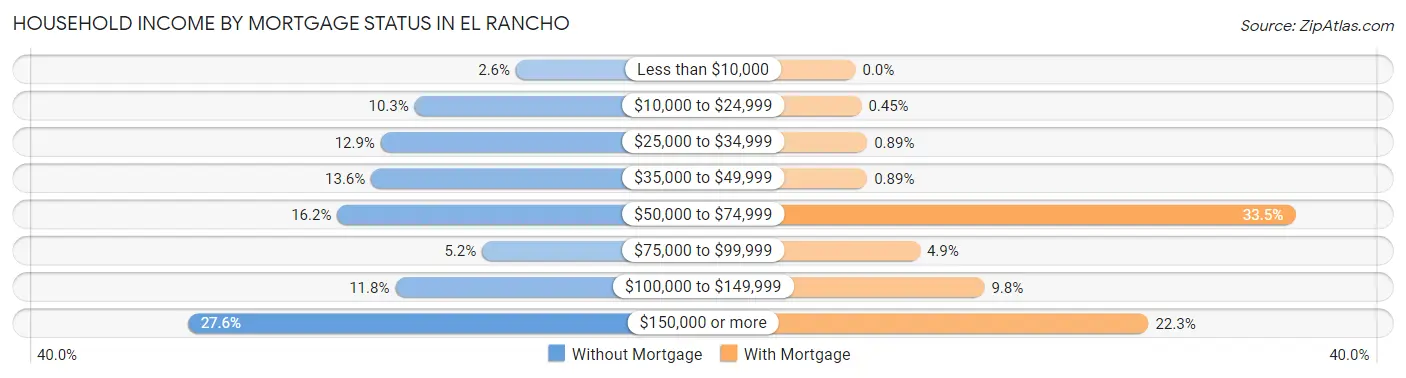
| Household Income | Without Mortgage | With Mortgage |
| Less than $10,000 | 7 (2.6%) | 0 (0.0%) |
| $10,000 to $24,999 | 28 (10.3%) | 1 (0.4%) |
| $25,000 to $34,999 | 35 (12.9%) | 2 (0.9%) |
| $35,000 to $49,999 | 37 (13.6%) | 2 (0.9%) |
| $50,000 to $74,999 | 44 (16.2%) | 75 (33.5%) |
| $75,000 to $99,999 | 14 (5.1%) | 11 (4.9%) |
| $100,000 to $149,999 | 32 (11.8%) | 22 (9.8%) |
| $150,000 or more | 75 (27.6%) | 50 (22.3%) |
| Total | 272 (100.0%) | 224 (100.0%) |
Property Value to Household Income Ratio in El Rancho
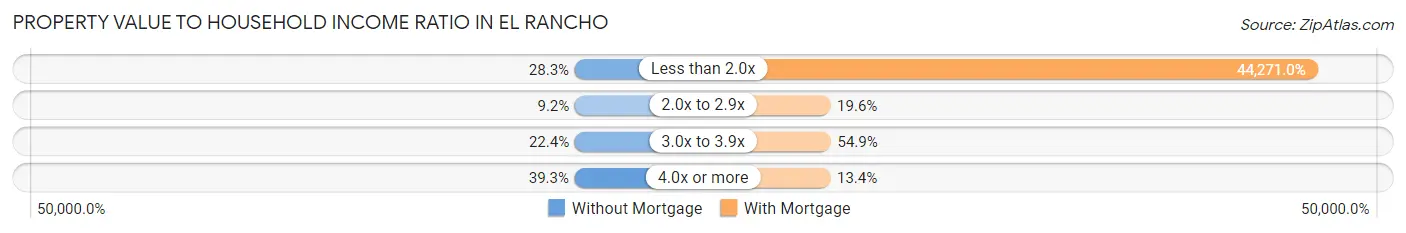
| Value-to-Income Ratio | Without Mortgage | With Mortgage |
| Less than 2.0x | 77 (28.3%) | 99,167 (44,271.0%) |
| 2.0x to 2.9x | 25 (9.2%) | 44 (19.6%) |
| 3.0x to 3.9x | 61 (22.4%) | 123 (54.9%) |
| 4.0x or more | 107 (39.3%) | 30 (13.4%) |
| Total | 272 (100.0%) | 224 (100.0%) |
Real Estate Taxes by Mortgage Status in El Rancho
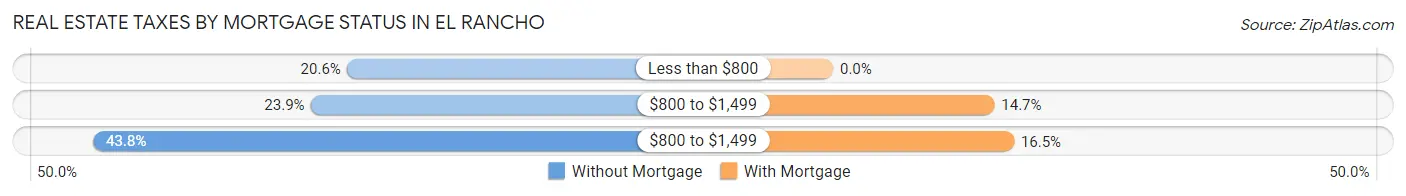
| Property Taxes | Without Mortgage | With Mortgage |
| Less than $800 | 56 (20.6%) | 0 (0.0%) |
| $800 to $1,499 | 65 (23.9%) | 33 (14.7%) |
| $800 to $1,499 | 119 (43.8%) | 37 (16.5%) |
| Total | 272 (100.0%) | 224 (100.0%) |
Health & Disability in El Rancho
Health Insurance Coverage by Age in El Rancho
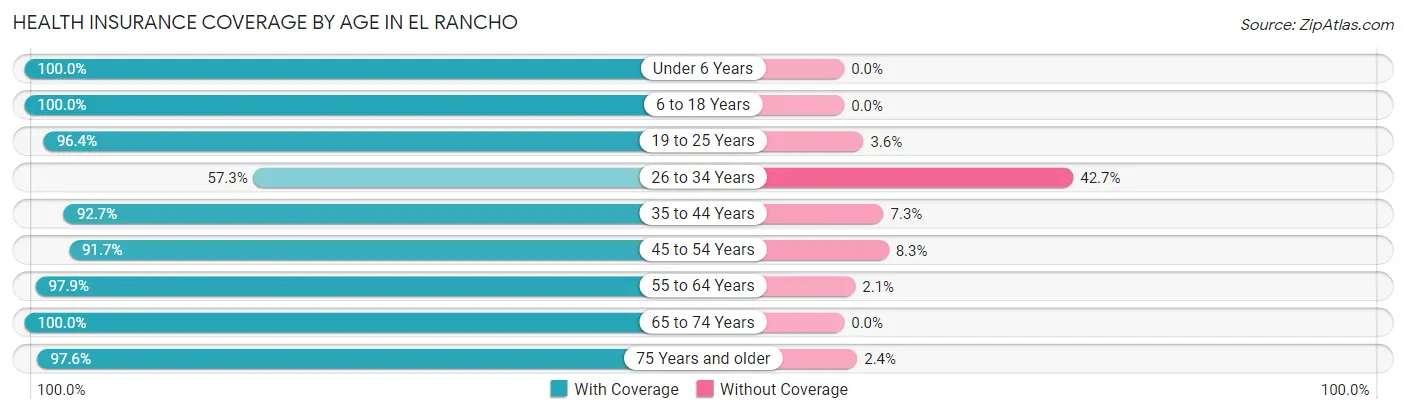
| Age Bracket | With Coverage | Without Coverage |
| Under 6 Years | 164 (100.0%) | 0 (0.0%) |
| 6 to 18 Years | 222 (100.0%) | 0 (0.0%) |
| 19 to 25 Years | 108 (96.4%) | 4 (3.6%) |
| 26 to 34 Years | 106 (57.3%) | 79 (42.7%) |
| 35 to 44 Years | 177 (92.7%) | 14 (7.3%) |
| 45 to 54 Years | 144 (91.7%) | 13 (8.3%) |
| 55 to 64 Years | 190 (97.9%) | 4 (2.1%) |
| 65 to 74 Years | 164 (100.0%) | 0 (0.0%) |
| 75 Years and older | 121 (97.6%) | 3 (2.4%) |
| Total | 1,396 (92.3%) | 117 (7.7%) |
Health Insurance Coverage by Citizenship Status in El Rancho
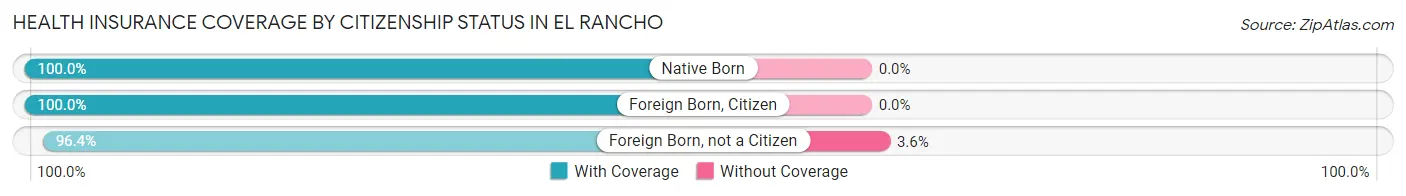
| Citizenship Status | With Coverage | Without Coverage |
| Native Born | 164 (100.0%) | 0 (0.0%) |
| Foreign Born, Citizen | 222 (100.0%) | 0 (0.0%) |
| Foreign Born, not a Citizen | 108 (96.4%) | 4 (3.6%) |
Health Insurance Coverage by Household Income in El Rancho
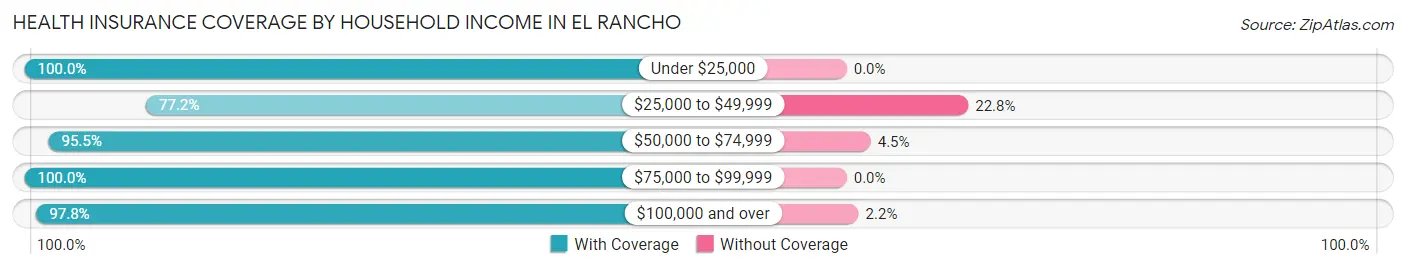
| Household Income | With Coverage | Without Coverage |
| Under $25,000 | 91 (100.0%) | 0 (0.0%) |
| $25,000 to $49,999 | 319 (77.2%) | 94 (22.8%) |
| $50,000 to $74,999 | 149 (95.5%) | 7 (4.5%) |
| $75,000 to $99,999 | 133 (100.0%) | 0 (0.0%) |
| $100,000 and over | 704 (97.8%) | 16 (2.2%) |
Public vs Private Health Insurance Coverage by Age in El Rancho
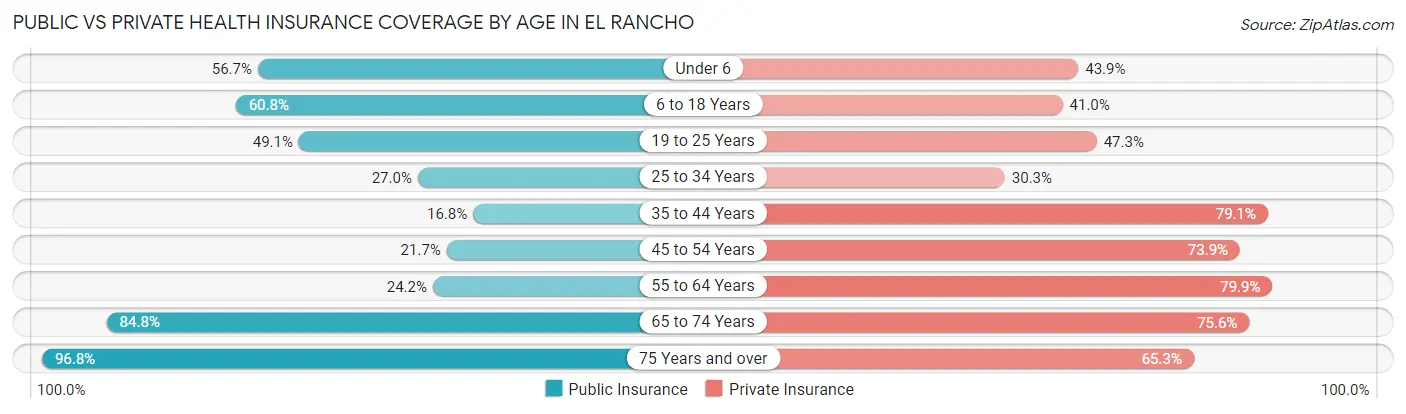
| Age Bracket | Public Insurance | Private Insurance |
| Under 6 | 93 (56.7%) | 72 (43.9%) |
| 6 to 18 Years | 135 (60.8%) | 91 (41.0%) |
| 19 to 25 Years | 55 (49.1%) | 53 (47.3%) |
| 25 to 34 Years | 50 (27.0%) | 56 (30.3%) |
| 35 to 44 Years | 32 (16.8%) | 151 (79.1%) |
| 45 to 54 Years | 34 (21.7%) | 116 (73.9%) |
| 55 to 64 Years | 47 (24.2%) | 155 (79.9%) |
| 65 to 74 Years | 139 (84.8%) | 124 (75.6%) |
| 75 Years and over | 120 (96.8%) | 81 (65.3%) |
| Total | 705 (46.6%) | 899 (59.4%) |
Disability Status by Sex by Age in El Rancho
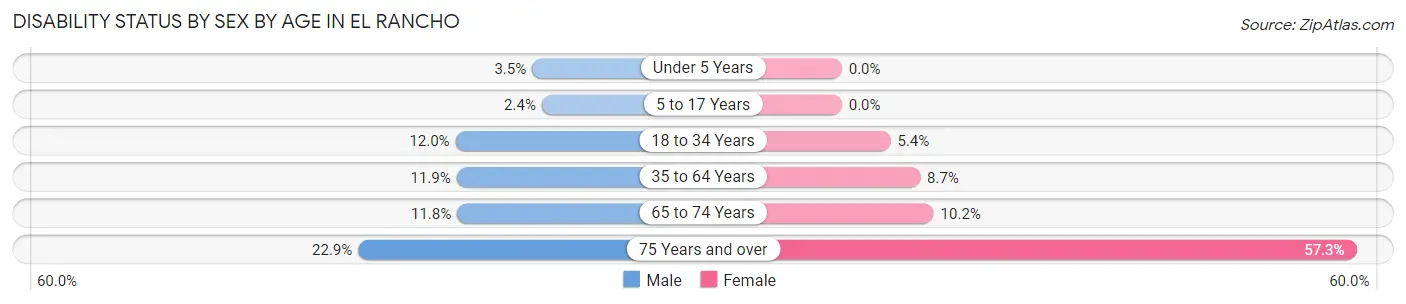
| Age Bracket | Male | Female |
| Under 5 Years | 3 (3.5%) | 0 (0.0%) |
| 5 to 17 Years | 2 (2.4%) | 0 (0.0%) |
| 18 to 34 Years | 22 (12.0%) | 7 (5.4%) |
| 35 to 64 Years | 29 (11.9%) | 26 (8.7%) |
| 65 to 74 Years | 9 (11.8%) | 9 (10.2%) |
| 75 Years and over | 8 (22.9%) | 51 (57.3%) |
Disability Class by Sex by Age in El Rancho
Disability Class: Hearing Difficulty
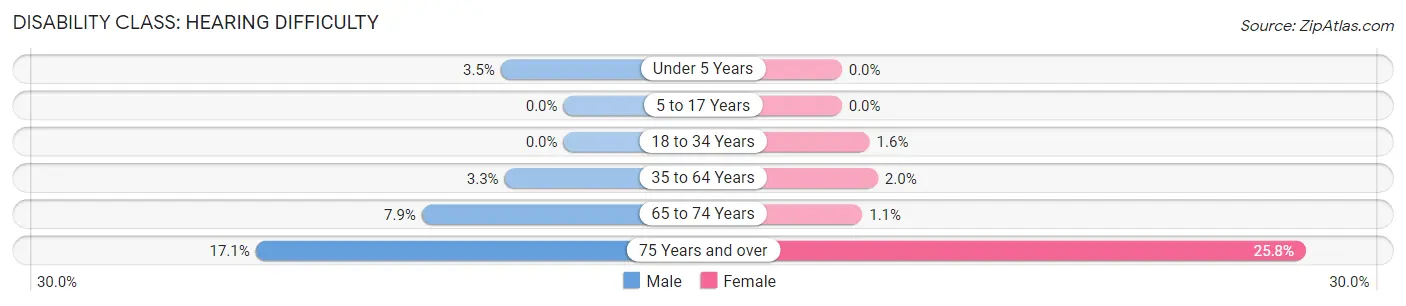
| Age Bracket | Male | Female |
| Under 5 Years | 3 (3.5%) | 0 (0.0%) |
| 5 to 17 Years | 0 (0.0%) | 0 (0.0%) |
| 18 to 34 Years | 0 (0.0%) | 2 (1.5%) |
| 35 to 64 Years | 8 (3.3%) | 6 (2.0%) |
| 65 to 74 Years | 6 (7.9%) | 1 (1.1%) |
| 75 Years and over | 6 (17.1%) | 23 (25.8%) |
Disability Class: Vision Difficulty
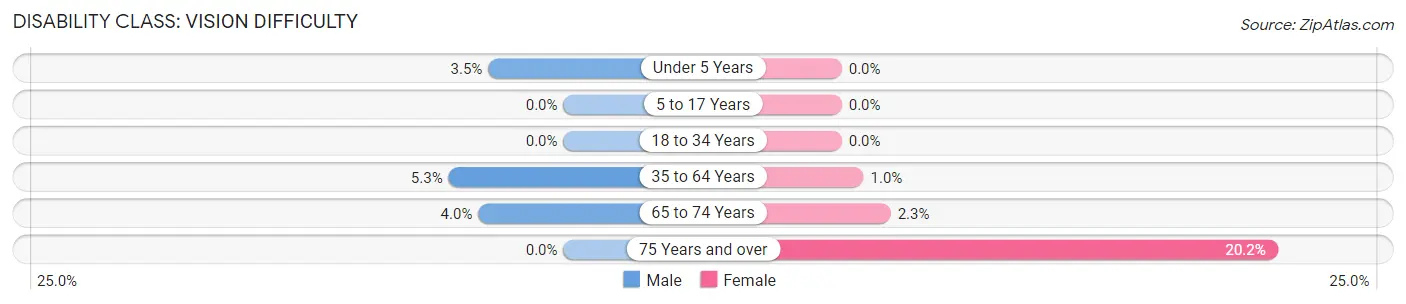
| Age Bracket | Male | Female |
| Under 5 Years | 3 (3.5%) | 0 (0.0%) |
| 5 to 17 Years | 0 (0.0%) | 0 (0.0%) |
| 18 to 34 Years | 0 (0.0%) | 0 (0.0%) |
| 35 to 64 Years | 13 (5.3%) | 3 (1.0%) |
| 65 to 74 Years | 3 (4.0%) | 2 (2.3%) |
| 75 Years and over | 0 (0.0%) | 18 (20.2%) |
Disability Class: Cognitive Difficulty
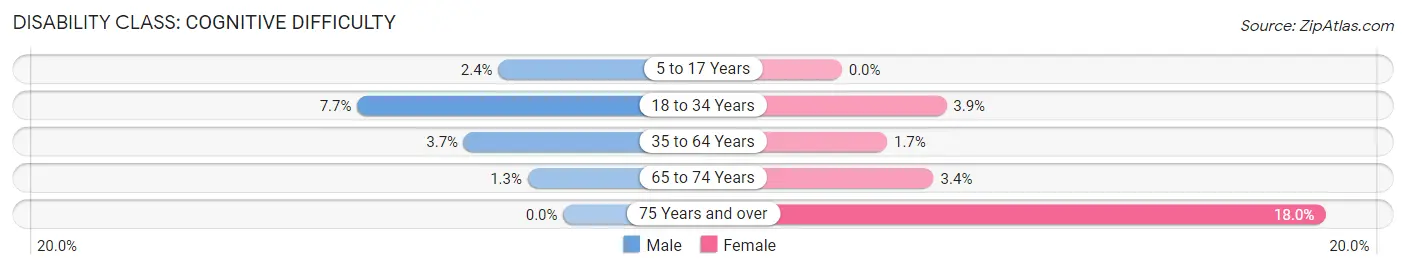
| Age Bracket | Male | Female |
| 5 to 17 Years | 2 (2.4%) | 0 (0.0%) |
| 18 to 34 Years | 14 (7.6%) | 5 (3.9%) |
| 35 to 64 Years | 9 (3.7%) | 5 (1.7%) |
| 65 to 74 Years | 1 (1.3%) | 3 (3.4%) |
| 75 Years and over | 0 (0.0%) | 16 (18.0%) |
Disability Class: Ambulatory Difficulty
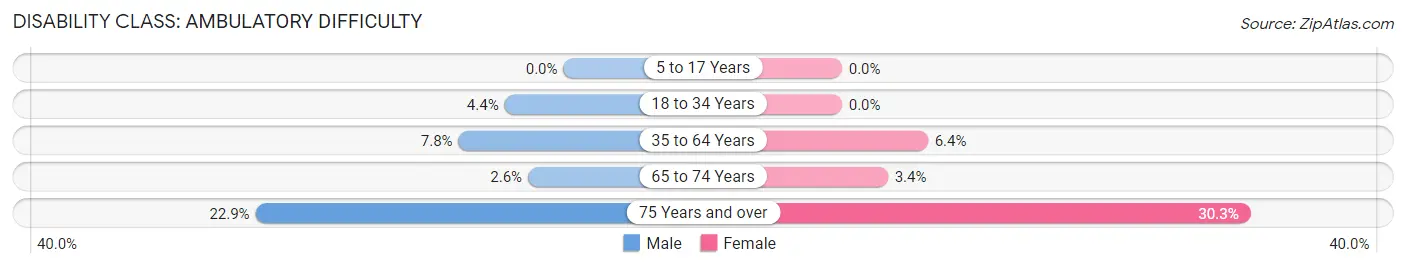
| Age Bracket | Male | Female |
| 5 to 17 Years | 0 (0.0%) | 0 (0.0%) |
| 18 to 34 Years | 8 (4.4%) | 0 (0.0%) |
| 35 to 64 Years | 19 (7.8%) | 19 (6.4%) |
| 65 to 74 Years | 2 (2.6%) | 3 (3.4%) |
| 75 Years and over | 8 (22.9%) | 27 (30.3%) |
Disability Class: Self-Care Difficulty
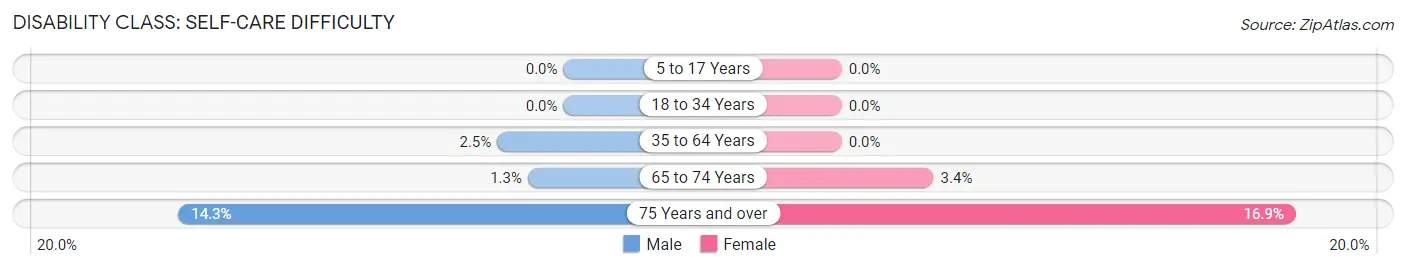
| Age Bracket | Male | Female |
| 5 to 17 Years | 0 (0.0%) | 0 (0.0%) |
| 18 to 34 Years | 0 (0.0%) | 0 (0.0%) |
| 35 to 64 Years | 6 (2.5%) | 0 (0.0%) |
| 65 to 74 Years | 1 (1.3%) | 3 (3.4%) |
| 75 Years and over | 5 (14.3%) | 15 (16.9%) |
Technology Access in El Rancho
Computing Device Access in El Rancho
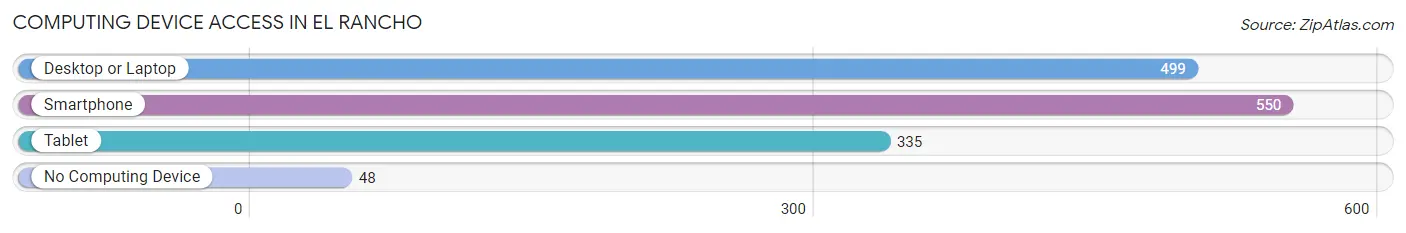
| Device Type | # Households | % Households |
| Desktop or Laptop | 499 | 80.5% |
| Smartphone | 550 | 88.7% |
| Tablet | 335 | 54.0% |
| No Computing Device | 48 | 7.7% |
| Total | 620 | 100.0% |
Internet Access in El Rancho
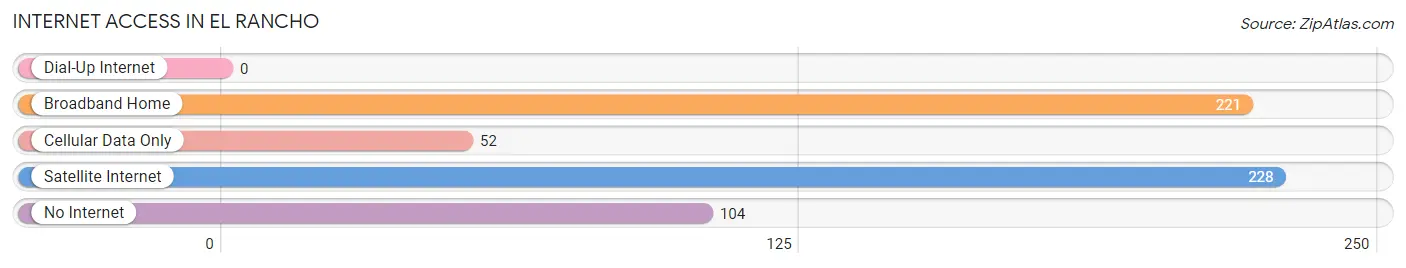
| Internet Type | # Households | % Households |
| Dial-Up Internet | 0 | 0.0% |
| Broadband Home | 221 | 35.6% |
| Cellular Data Only | 52 | 8.4% |
| Satellite Internet | 228 | 36.8% |
| No Internet | 104 | 16.8% |
| Total | 620 | 100.0% |
El Rancho Summary
Rancho, New Mexico is a small unincorporated community located in the northern part of the state. It is situated in the foothills of the Sangre de Cristo Mountains, approximately 25 miles north of Santa Fe. The area is known for its scenic beauty, with rolling hills, lush vegetation, and stunning views of the surrounding mountains.
History
Rancho, New Mexico was first settled in the late 1800s by Spanish settlers. The area was originally part of the Spanish land grant known as the Rancho de las Animas. The settlers were attracted to the area due to its fertile soil and abundant water sources. The area was also known for its abundant wildlife, including deer, elk, and antelope.
In the early 1900s, the area was home to a number of small ranches and farms. The area was also home to a number of small businesses, including a general store, a blacksmith, and a post office. The area was also home to a number of churches, including the Catholic Church of the Immaculate Conception.
In the mid-1900s, the area began to experience a population boom as more people moved to the area. This was due in part to the construction of the nearby Santa Fe National Forest, which provided jobs and recreational opportunities. The area also experienced an influx of tourists, who were drawn to the area’s scenic beauty and outdoor activities.
Geography
Rancho, New Mexico is located in the northern part of the state, in the foothills of the Sangre de Cristo Mountains. The area is known for its rolling hills, lush vegetation, and stunning views of the surrounding mountains. The area is also home to a number of small lakes and streams, which provide a variety of recreational opportunities.
The climate in Rancho is generally mild, with warm summers and cool winters. The average annual temperature is around 60 degrees Fahrenheit. The area receives an average of 16 inches of precipitation per year, with most of it falling in the form of snow during the winter months.
Economy
Rancho, New Mexico is a small, rural community with a limited economy. The area is home to a number of small businesses, including a general store, a blacksmith, and a post office. The area is also home to a number of small farms and ranches, which provide employment for many of the area’s residents.
Tourism is also an important part of the local economy. The area is known for its scenic beauty and outdoor activities, which attract visitors from all over the world. The area is also home to a number of small resorts and lodges, which provide accommodations for visitors.
Demographics
As of the 2010 census, the population of Rancho, New Mexico was 1,845. The population is primarily Hispanic, with a small percentage of Native American and White residents. The median age of the population is 37.5 years, and the median household income is $37,000.
Rancho, New Mexico is a small, rural community with a limited economy. The area is known for its scenic beauty and outdoor activities, which attract visitors from all over the world. The area is also home to a number of small businesses, farms, and ranches, which provide employment for many of the area’s residents. The population is primarily Hispanic, with a small percentage of Native American and White residents.
Common Questions
What is Per Capita Income in El Rancho?
Per Capita income in El Rancho is $38,510.
What is the Median Family Income in El Rancho?
Median Family Income in El Rancho is $93,750.
What is the Median Household income in El Rancho?
Median Household Income in El Rancho is $66,250.
What is Income or Wage Gap in El Rancho?
Income or Wage Gap in El Rancho is 24.5%.
Women in El Rancho earn 75.5 cents for every dollar earned by a man.
What is Family Income Deficit in El Rancho?
Family Income Deficit in El Rancho is $5,159.
Families that are below poverty line in El Rancho earn $5,159 less on average than the poverty threshold level.
What is Inequality or Gini Index in El Rancho?
Inequality or Gini Index in El Rancho is 0.41.
What is the Total Population of El Rancho?
Total Population of El Rancho is 1,513.
What is the Total Male Population of El Rancho?
Total Male Population of El Rancho is 707.
What is the Total Female Population of El Rancho?
Total Female Population of El Rancho is 806.
What is the Ratio of Males per 100 Females in El Rancho?
There are 87.72 Males per 100 Females in El Rancho.
What is the Ratio of Females per 100 Males in El Rancho?
There are 114.00 Females per 100 Males in El Rancho.
What is the Median Population Age in El Rancho?
Median Population Age in El Rancho is 37.8 Years.
What is the Average Family Size in El Rancho
Average Family Size in El Rancho is 2.9 People.
What is the Average Household Size in El Rancho
Average Household Size in El Rancho is 2.4 People.
How Large is the Labor Force in El Rancho?
There are 692 People in the Labor Forcein in El Rancho.
What is the Percentage of People in the Labor Force in El Rancho?
57.5% of People are in the Labor Force in El Rancho.
What is the Unemployment Rate in El Rancho?
Unemployment Rate in El Rancho is 0.7%.