Tesuque, NM Map & Demographics
Tesuque Map
Tesuque Overview
$63,445
PER CAPITA INCOME
$96,250
AVG FAMILY INCOME
$56,250
AVG HOUSEHOLD INCOME
4.7%
WAGE / INCOME GAP [ % ]
95.3¢/ $1
WAGE / INCOME GAP [ $ ]
0.60
INEQUALITY / GINI INDEX
1,123
TOTAL POPULATION
564
MALE POPULATION
559
FEMALE POPULATION
100.89
MALES / 100 FEMALES
99.11
FEMALES / 100 MALES
66.3
MEDIAN AGE
2.2
AVG FAMILY SIZE
1.6
AVG HOUSEHOLD SIZE
355
LABOR FORCE [ PEOPLE ]
32.2%
PERCENT IN LABOR FORCE
8.2%
UNEMPLOYMENT RATE
Tesuque Area Codes
Income in Tesuque
Income Overview in Tesuque
Per Capita Income in Tesuque is $63,445, while median incomes of families and households are $96,250 and $56,250 respectively.
| Characteristic | Number | Measure |
| Per Capita Income | 1,123 | $63,445 |
| Median Family Income | 225 | $96,250 |
| Mean Family Income | 225 | $186,983 |
| Median Household Income | 697 | $56,250 |
| Mean Household Income | 697 | $103,327 |
| Income Deficit | 225 | $0 |
| Wage / Income Gap (%) | 1,123 | 4.73% |
| Wage / Income Gap ($) | 1,123 | 95.27¢ per $1 |
| Gini / Inequality Index | 1,123 | 0.60 |
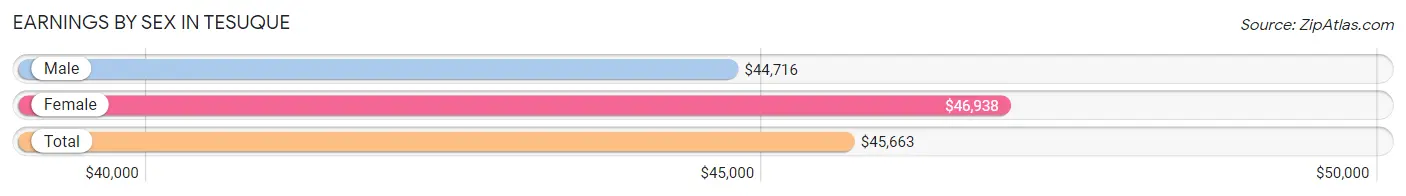
Earnings by Sex in Tesuque
Average Earnings in Tesuque are $45,663, $44,716 for men and $46,938 for women, a difference of 4.7%.
| Sex | Number | Average Earnings |
| Male | 245 (59.2%) | $44,716 |
| Female | 169 (40.8%) | $46,938 |
| Total | 414 (100.0%) | $45,663 |
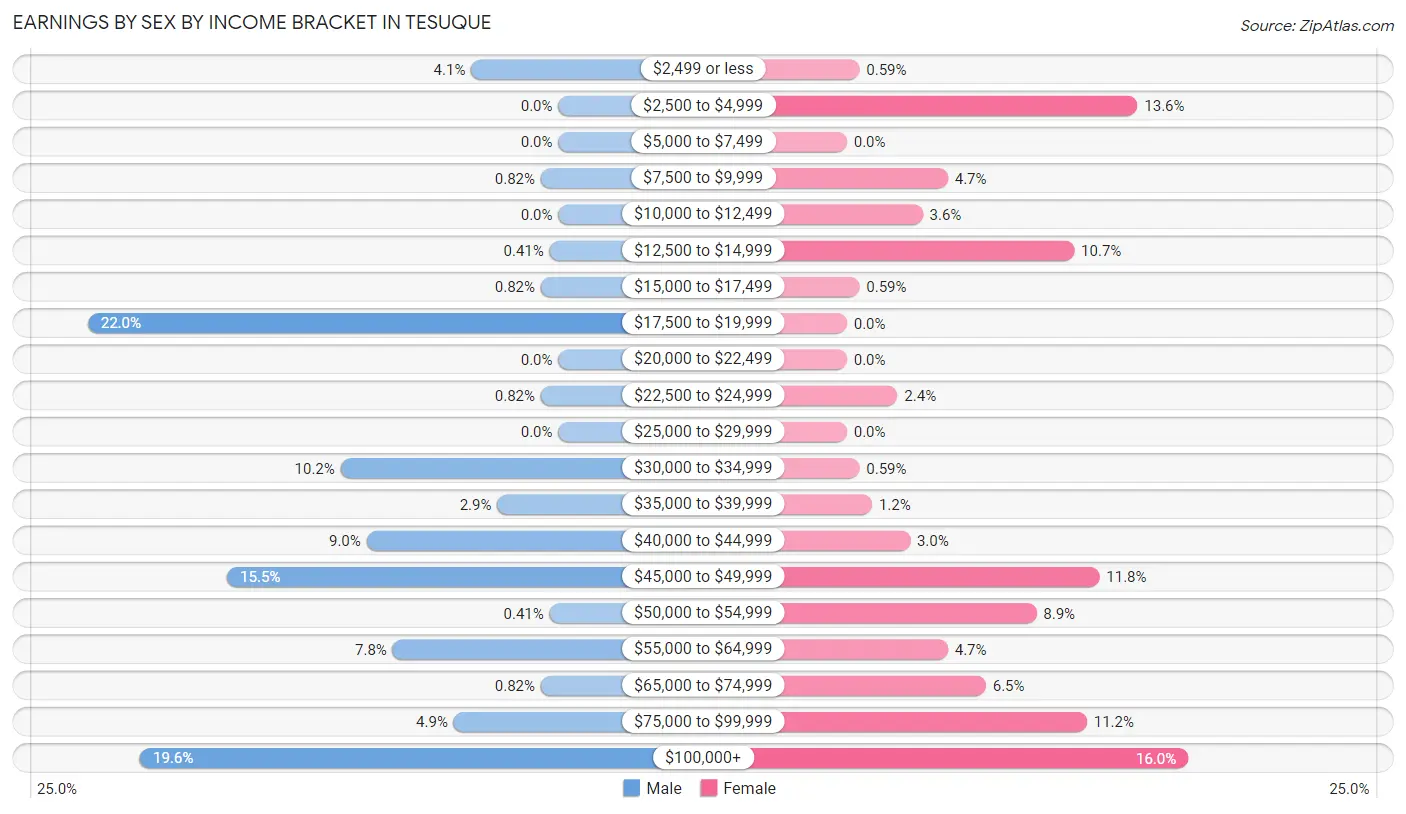
Earnings by Sex by Income Bracket in Tesuque
The most common earnings brackets in Tesuque are $17,500 to $19,999 for men (54 | 22.0%) and $100,000+ for women (27 | 16.0%).
| Income | Male | Female |
| $2,499 or less | 10 (4.1%) | 1 (0.6%) |
| $2,500 to $4,999 | 0 (0.0%) | 23 (13.6%) |
| $5,000 to $7,499 | 0 (0.0%) | 0 (0.0%) |
| $7,500 to $9,999 | 2 (0.8%) | 8 (4.7%) |
| $10,000 to $12,499 | 0 (0.0%) | 6 (3.5%) |
| $12,500 to $14,999 | 1 (0.4%) | 18 (10.6%) |
| $15,000 to $17,499 | 2 (0.8%) | 1 (0.6%) |
| $17,500 to $19,999 | 54 (22.0%) | 0 (0.0%) |
| $20,000 to $22,499 | 0 (0.0%) | 0 (0.0%) |
| $22,500 to $24,999 | 2 (0.8%) | 4 (2.4%) |
| $25,000 to $29,999 | 0 (0.0%) | 0 (0.0%) |
| $30,000 to $34,999 | 25 (10.2%) | 1 (0.6%) |
| $35,000 to $39,999 | 7 (2.9%) | 2 (1.2%) |
| $40,000 to $44,999 | 22 (9.0%) | 5 (3.0%) |
| $45,000 to $49,999 | 38 (15.5%) | 20 (11.8%) |
| $50,000 to $54,999 | 1 (0.4%) | 15 (8.9%) |
| $55,000 to $64,999 | 19 (7.8%) | 8 (4.7%) |
| $65,000 to $74,999 | 2 (0.8%) | 11 (6.5%) |
| $75,000 to $99,999 | 12 (4.9%) | 19 (11.2%) |
| $100,000+ | 48 (19.6%) | 27 (16.0%) |
| Total | 245 (100.0%) | 169 (100.0%) |
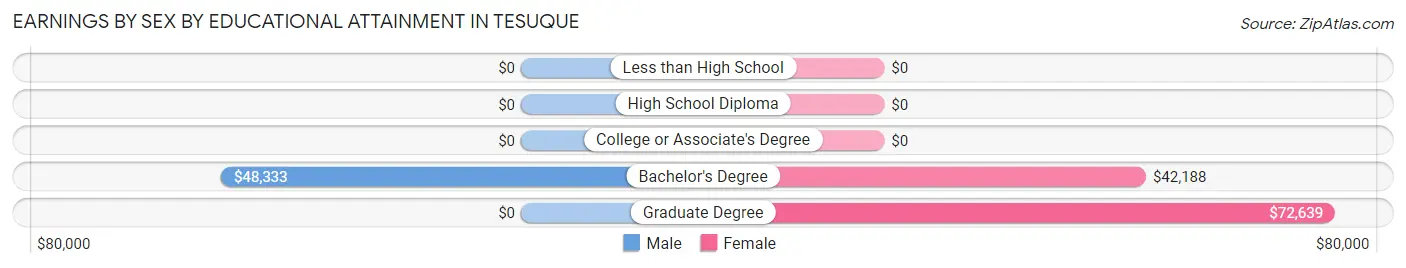
Earnings by Sex by Educational Attainment in Tesuque
Average earnings in Tesuque are $45,000 for men and $47,083 for women, a difference of 4.4%. Men with an educational attainment of bachelor's degree enjoy the highest average annual earnings of $48,333, while those with bachelor's degree education earn the least with $48,333. Women with an educational attainment of graduate degree earn the most with the average annual earnings of $72,639, while those with bachelor's degree education have the smallest earnings of $42,188.
| Educational Attainment | Male Income | Female Income |
| Less than High School | - | - |
| High School Diploma | - | - |
| College or Associate's Degree | - | - |
| Bachelor's Degree | $48,333 | $42,188 |
| Graduate Degree | - | - |
| Total | $45,000 | $47,083 |
Family Income in Tesuque
Family Income Brackets in Tesuque
According to the Tesuque family income data, there are 61 families falling into the $200,000+ income range, which is the most common income bracket and makes up 27.1% of all families.
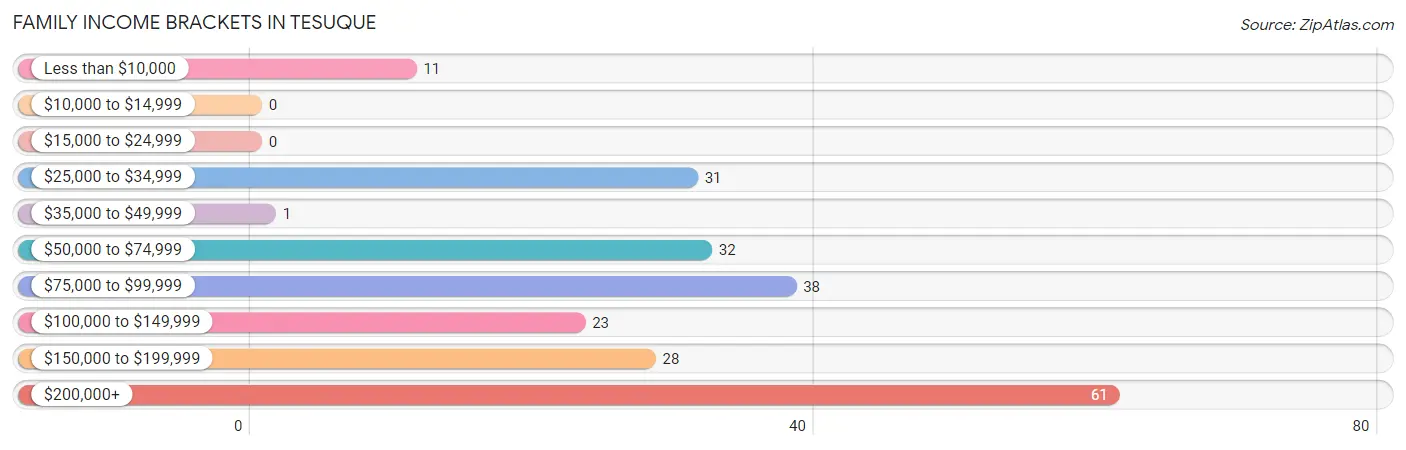
| Income Bracket | # Families | % Families |
| Less than $10,000 | 11 | 4.9% |
| $10,000 to $14,999 | 0 | 0.0% |
| $15,000 to $24,999 | 0 | 0.0% |
| $25,000 to $34,999 | 31 | 13.8% |
| $35,000 to $49,999 | 1 | 0.4% |
| $50,000 to $74,999 | 32 | 14.2% |
| $75,000 to $99,999 | 38 | 16.9% |
| $100,000 to $149,999 | 23 | 10.2% |
| $150,000 to $199,999 | 28 | 12.4% |
| $200,000+ | 61 | 27.1% |
Family Income by Famaliy Size in Tesuque
2-person families (177 | 78.7%) account for the highest median family income in Tesuque with $86,761 per family, while 2-person families (177 | 78.7%) have the highest median income of $43,380 per family member.
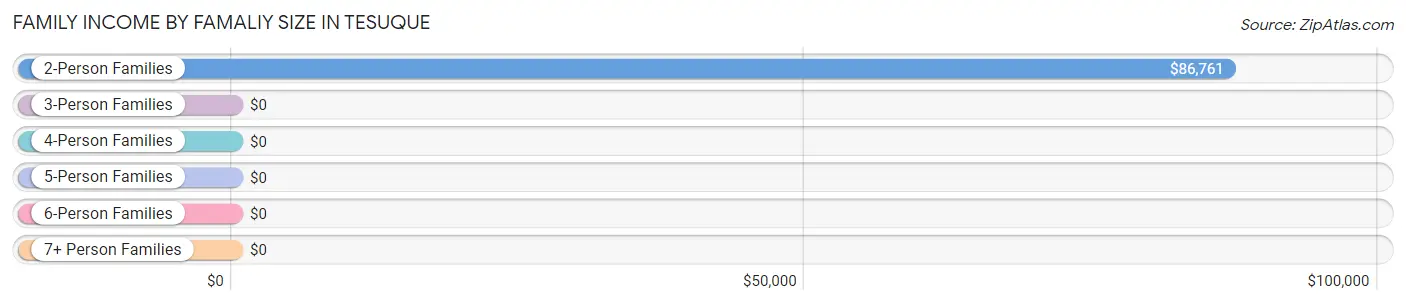
| Income Bracket | # Families | Median Income |
| 2-Person Families | 177 (78.7%) | $86,761 |
| 3-Person Families | 40 (17.8%) | $0 |
| 4-Person Families | 8 (3.6%) | $0 |
| 5-Person Families | 0 (0.0%) | $0 |
| 6-Person Families | 0 (0.0%) | $0 |
| 7+ Person Families | 0 (0.0%) | $0 |
| Total | 225 (100.0%) | $96,250 |
Family Income by Number of Earners in Tesuque
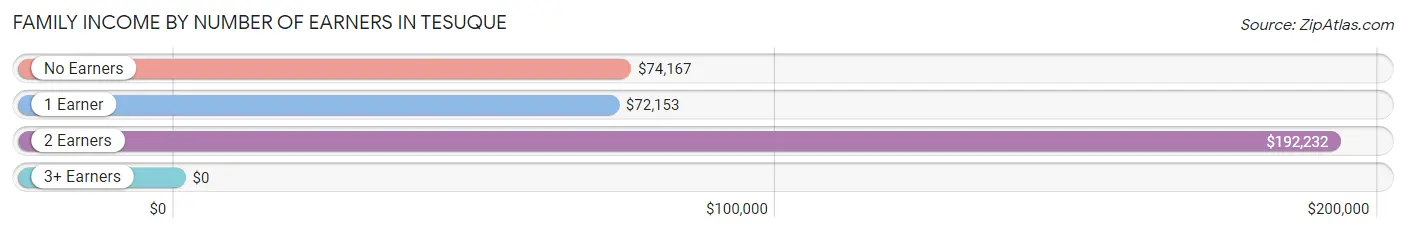
| Number of Earners | # Families | Median Income |
| No Earners | 106 (47.1%) | $74,167 |
| 1 Earner | 33 (14.7%) | $72,153 |
| 2 Earners | 85 (37.8%) | $192,232 |
| 3+ Earners | 1 (0.4%) | $0 |
| Total | 225 (100.0%) | $96,250 |
Household Income in Tesuque
Household Income Brackets in Tesuque
With 152 households falling in the category, the $35,000 to $49,999 income range is the most frequent in Tesuque, accounting for 21.8% of all households. In contrast, only 21 households (3.0%) fall into the $15,000 to $24,999 income bracket, making it the least populous group.
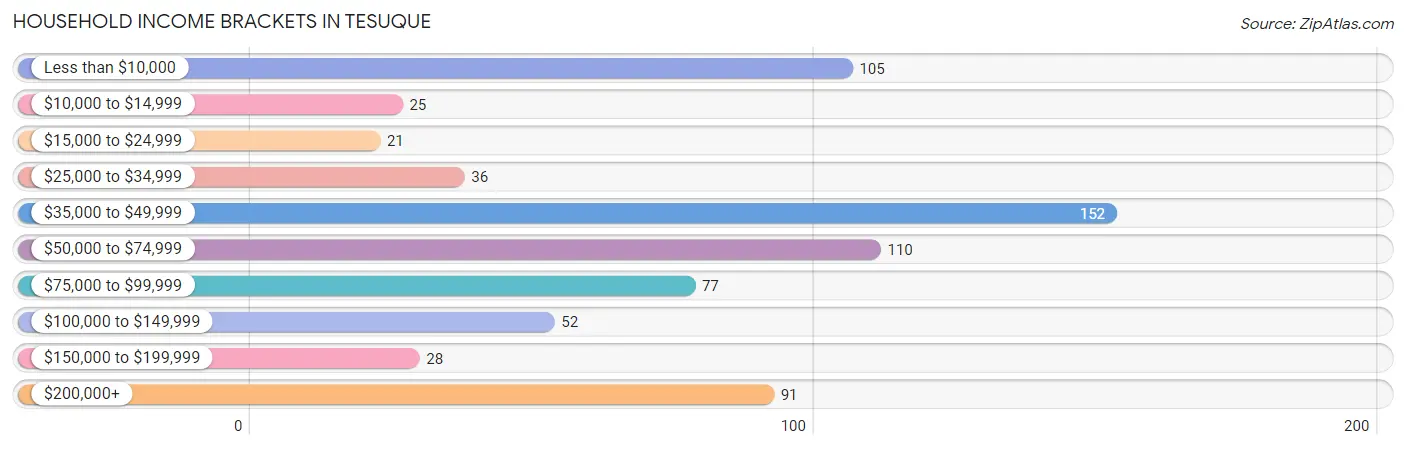
| Income Bracket | # Households | % Households |
| Less than $10,000 | 105 | 15.1% |
| $10,000 to $14,999 | 25 | 3.6% |
| $15,000 to $24,999 | 21 | 3.0% |
| $25,000 to $34,999 | 36 | 5.2% |
| $35,000 to $49,999 | 152 | 21.8% |
| $50,000 to $74,999 | 110 | 15.8% |
| $75,000 to $99,999 | 77 | 11.0% |
| $100,000 to $149,999 | 52 | 7.5% |
| $150,000 to $199,999 | 28 | 4.0% |
| $200,000+ | 91 | 13.1% |
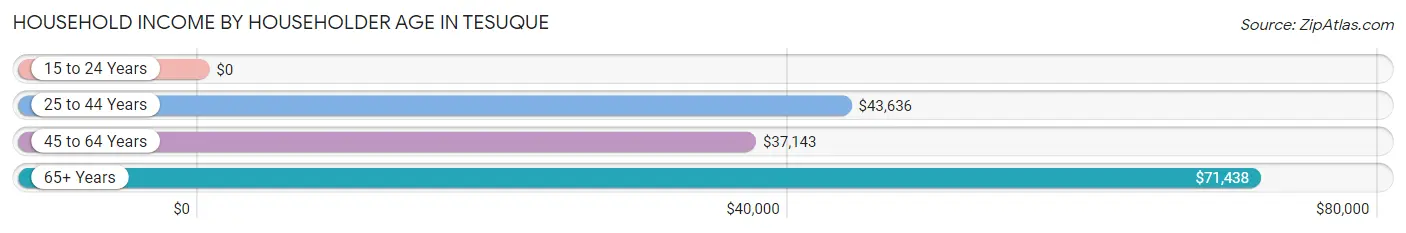
Household Income by Householder Age in Tesuque
The median household income in Tesuque is $56,250, with the highest median household income of $71,438 found in the 65+ years age bracket for the primary householder. A total of 389 households (55.8%) fall into this category. Meanwhile, the 15 to 24 years age bracket for the primary householder has the lowest median household income of $0, with 2 households (0.3%) in this group.
| Income Bracket | # Households | Median Income |
| 15 to 24 Years | 2 (0.3%) | $0 |
| 25 to 44 Years | 80 (11.5%) | $43,636 |
| 45 to 64 Years | 226 (32.4%) | $37,143 |
| 65+ Years | 389 (55.8%) | $71,438 |
| Total | 697 (100.0%) | $56,250 |
Poverty in Tesuque
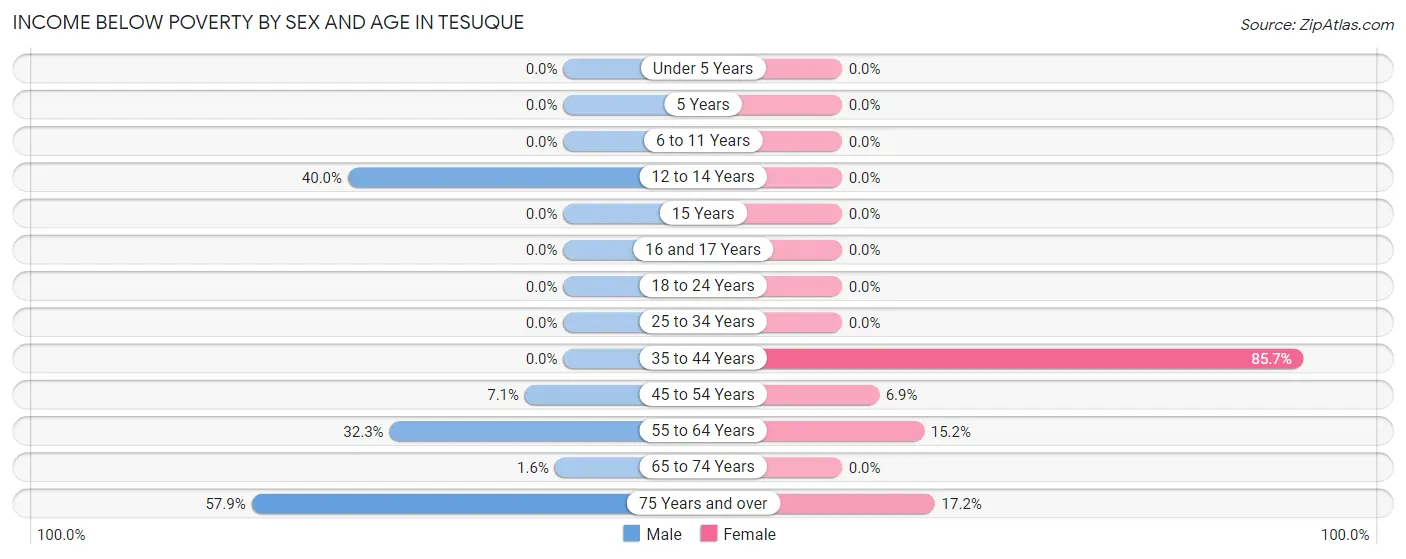
Income Below Poverty by Sex and Age in Tesuque
With 24.6% poverty level for males and 11.1% for females among the residents of Tesuque, 75 year old and over males and 35 to 44 year old females are the most vulnerable to poverty, with 66 males (57.9%) and 30 females (85.7%) in their respective age groups living below the poverty level.
| Age Bracket | Male | Female |
| Under 5 Years | 0 (0.0%) | 0 (0.0%) |
| 5 Years | 0 (0.0%) | 0 (0.0%) |
| 6 to 11 Years | 0 (0.0%) | 0 (0.0%) |
| 12 to 14 Years | 4 (40.0%) | 0 (0.0%) |
| 15 Years | 0 (0.0%) | 0 (0.0%) |
| 16 and 17 Years | 0 (0.0%) | 0 (0.0%) |
| 18 to 24 Years | 0 (0.0%) | 0 (0.0%) |
| 25 to 34 Years | 0 (0.0%) | 0 (0.0%) |
| 35 to 44 Years | 0 (0.0%) | 30 (85.7%) |
| 45 to 54 Years | 5 (7.1%) | 5 (6.9%) |
| 55 to 64 Years | 62 (32.3%) | 7 (15.2%) |
| 65 to 74 Years | 2 (1.6%) | 0 (0.0%) |
| 75 Years and over | 66 (57.9%) | 20 (17.2%) |
| Total | 139 (24.6%) | 62 (11.1%) |
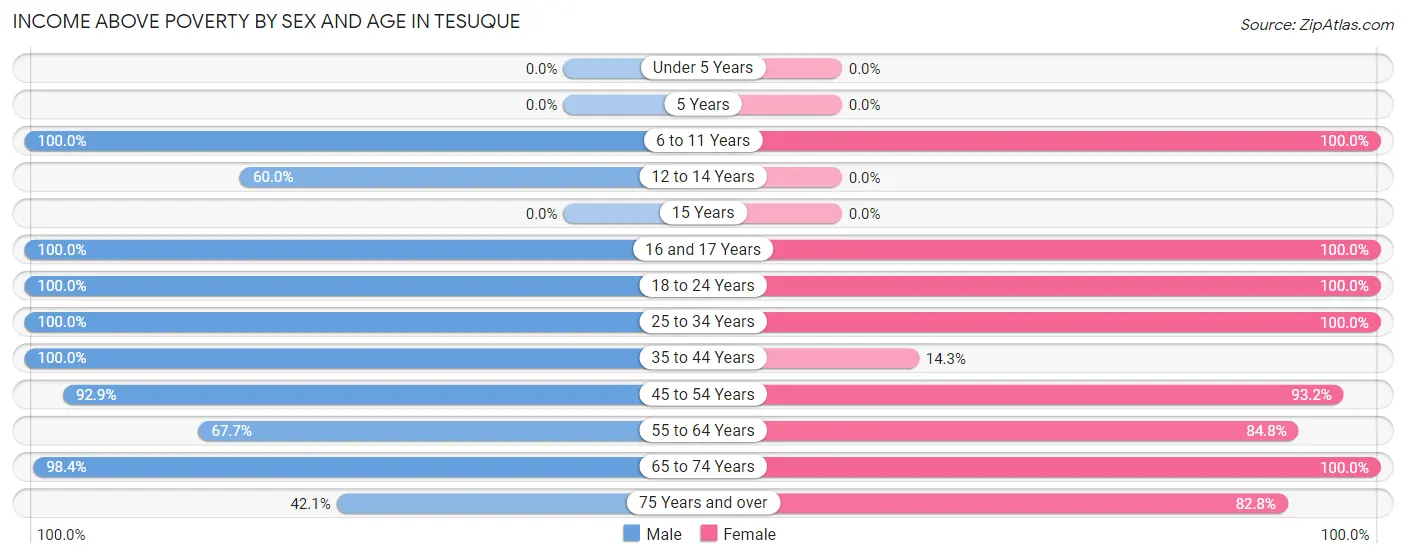
Income Above Poverty by Sex and Age in Tesuque
According to the poverty statistics in Tesuque, males aged 6 to 11 years and females aged 6 to 11 years are the age groups that are most secure financially, with 100.0% of males and 100.0% of females in these age groups living above the poverty line.
| Age Bracket | Male | Female |
| Under 5 Years | 0 (0.0%) | 0 (0.0%) |
| 5 Years | 0 (0.0%) | 0 (0.0%) |
| 6 to 11 Years | 3 (100.0%) | 7 (100.0%) |
| 12 to 14 Years | 6 (60.0%) | 0 (0.0%) |
| 15 Years | 0 (0.0%) | 0 (0.0%) |
| 16 and 17 Years | 7 (100.0%) | 22 (100.0%) |
| 18 to 24 Years | 5 (100.0%) | 2 (100.0%) |
| 25 to 34 Years | 32 (100.0%) | 22 (100.0%) |
| 35 to 44 Years | 6 (100.0%) | 5 (14.3%) |
| 45 to 54 Years | 65 (92.9%) | 68 (93.1%) |
| 55 to 64 Years | 130 (67.7%) | 39 (84.8%) |
| 65 to 74 Years | 123 (98.4%) | 236 (100.0%) |
| 75 Years and over | 48 (42.1%) | 96 (82.8%) |
| Total | 425 (75.3%) | 497 (88.9%) |
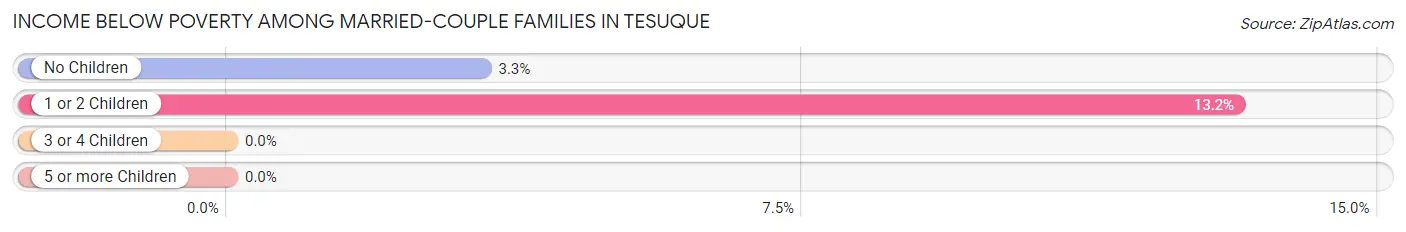
Income Below Poverty Among Married-Couple Families in Tesuque
The poverty statistics for married-couple families in Tesuque show that 5.0% or 11 of the total 219 families live below the poverty line. Families with 1 or 2 children have the highest poverty rate of 13.2%, comprising of 5 families. On the other hand, families with no children have the lowest poverty rate of 3.3%, which includes 6 families.
| Children | Above Poverty | Below Poverty |
| No Children | 175 (96.7%) | 6 (3.3%) |
| 1 or 2 Children | 33 (86.8%) | 5 (13.2%) |
| 3 or 4 Children | 0 (0.0%) | 0 (0.0%) |
| 5 or more Children | 0 (0.0%) | 0 (0.0%) |
| Total | 208 (95.0%) | 11 (5.0%) |
Income Below Poverty Among Single-Parent Households in Tesuque
| Children | Single Father | Single Mother |
| No Children | 0 (0.0%) | 0 (0.0%) |
| 1 or 2 Children | 0 (0.0%) | 0 (0.0%) |
| 3 or 4 Children | 0 (0.0%) | 0 (0.0%) |
| 5 or more Children | 0 (0.0%) | 0 (0.0%) |
| Total | 0 (0.0%) | 0 (0.0%) |
Income Below Poverty Among Married-Couple vs Single-Parent Households in Tesuque
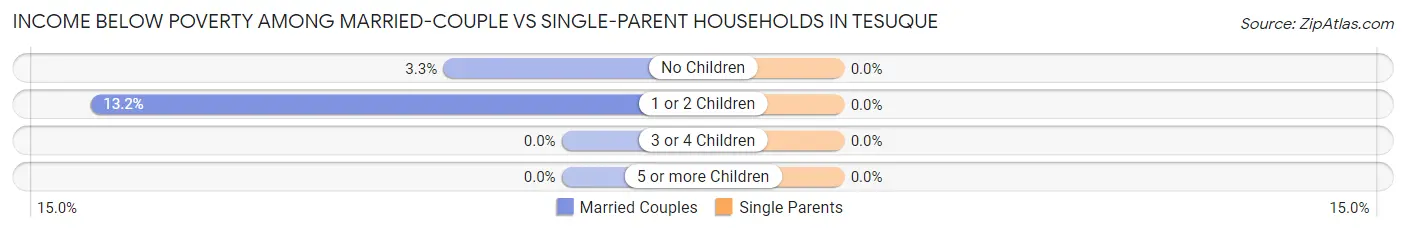
| Children | Married-Couple Families | Single-Parent Households |
| No Children | 6 (3.3%) | 0 (0.0%) |
| 1 or 2 Children | 5 (13.2%) | 0 (0.0%) |
| 3 or 4 Children | 0 (0.0%) | 0 (0.0%) |
| 5 or more Children | 0 (0.0%) | 0 (0.0%) |
| Total | 11 (5.0%) | 0 (0.0%) |
Race in Tesuque
The most populous races in Tesuque are White / Caucasian (1,010 | 89.9%), Hispanic or Latino (247 | 22.0%), and Two or more Races (69 | 6.1%).
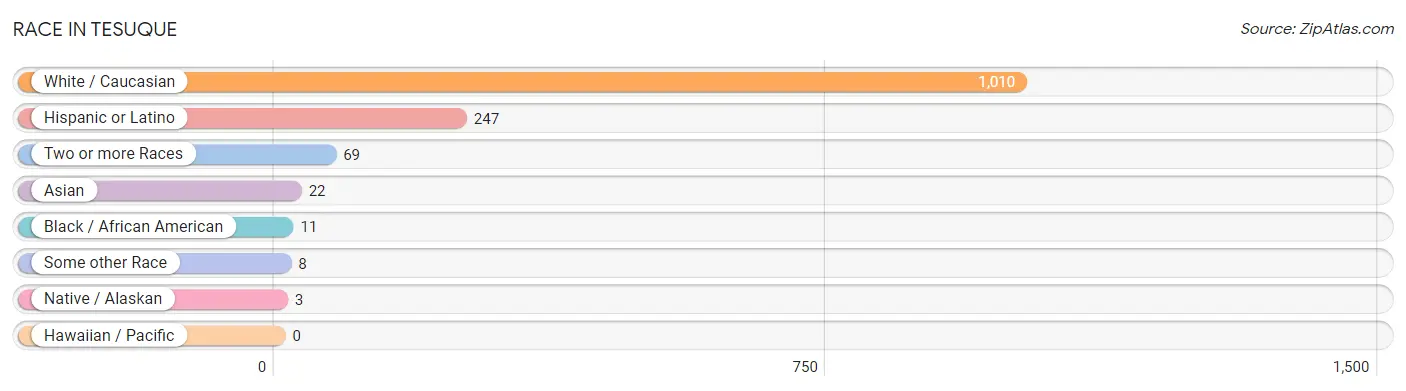
| Race | # Population | % Population |
| Asian | 22 | 2.0% |
| Black / African American | 11 | 1.0% |
| Hawaiian / Pacific | 0 | 0.0% |
| Hispanic or Latino | 247 | 22.0% |
| Native / Alaskan | 3 | 0.3% |
| White / Caucasian | 1,010 | 89.9% |
| Two or more Races | 69 | 6.1% |
| Some other Race | 8 | 0.7% |
| Total | 1,123 | 100.0% |
Ancestry in Tesuque
The most populous ancestries reported in Tesuque are English (252 | 22.4%), German (195 | 17.4%), Irish (164 | 14.6%), Mexican (93 | 8.3%), and Italian (90 | 8.0%), together accounting for 70.7% of all Tesuque residents.
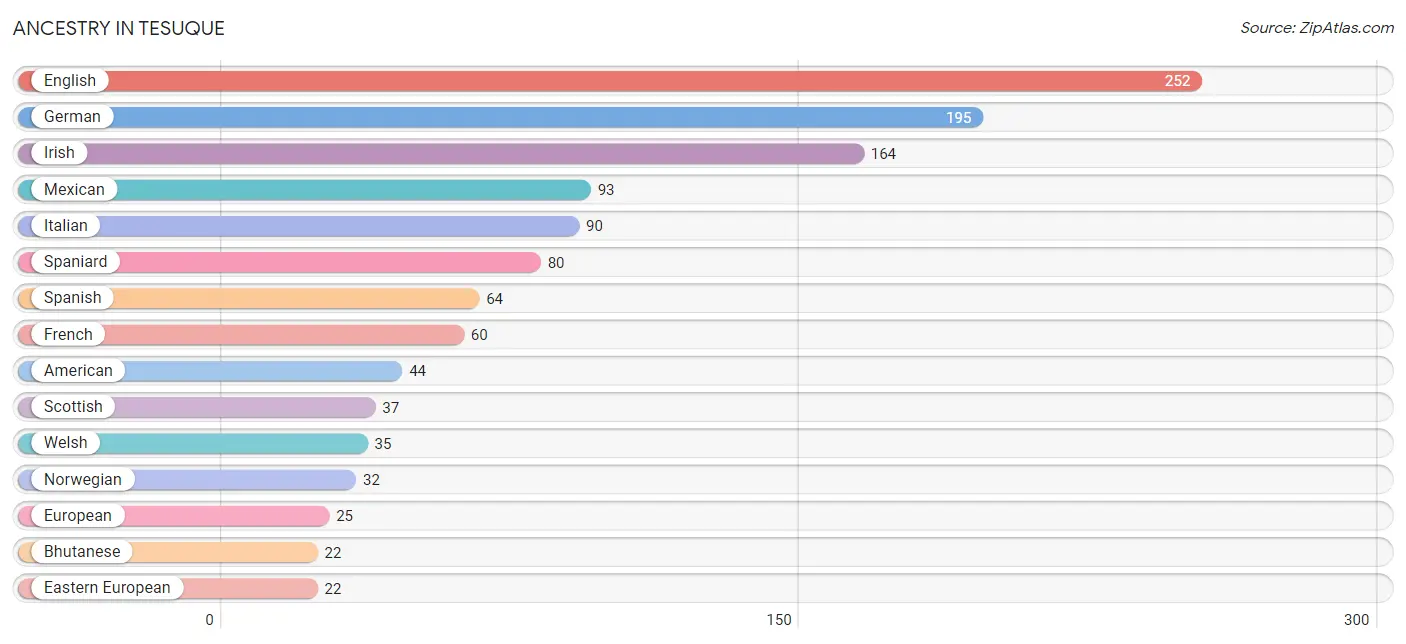
| Ancestry | # Population | % Population |
| American | 44 | 3.9% |
| Belgian | 4 | 0.4% |
| Bhutanese | 22 | 2.0% |
| British | 20 | 1.8% |
| Danish | 10 | 0.9% |
| Dutch | 9 | 0.8% |
| Eastern European | 22 | 2.0% |
| English | 252 | 22.4% |
| European | 25 | 2.2% |
| French | 60 | 5.3% |
| German | 195 | 17.4% |
| Greek | 1 | 0.1% |
| Hungarian | 1 | 0.1% |
| Irish | 164 | 14.6% |
| Italian | 90 | 8.0% |
| Korean | 9 | 0.8% |
| Lithuanian | 3 | 0.3% |
| Mexican | 93 | 8.3% |
| Northern European | 7 | 0.6% |
| Norwegian | 32 | 2.9% |
| Polish | 11 | 1.0% |
| Pueblo | 3 | 0.3% |
| Puerto Rican | 2 | 0.2% |
| Romanian | 1 | 0.1% |
| Russian | 8 | 0.7% |
| Scandinavian | 1 | 0.1% |
| Scotch-Irish | 2 | 0.2% |
| Scottish | 37 | 3.3% |
| Seminole | 6 | 0.5% |
| South American | 2 | 0.2% |
| Spaniard | 80 | 7.1% |
| Spanish | 64 | 5.7% |
| Swedish | 5 | 0.4% |
| Swiss | 2 | 0.2% |
| Ukrainian | 1 | 0.1% |
| Uruguayan | 2 | 0.2% |
| Welsh | 35 | 3.1% | View All 37 Rows |
Immigrants in Tesuque
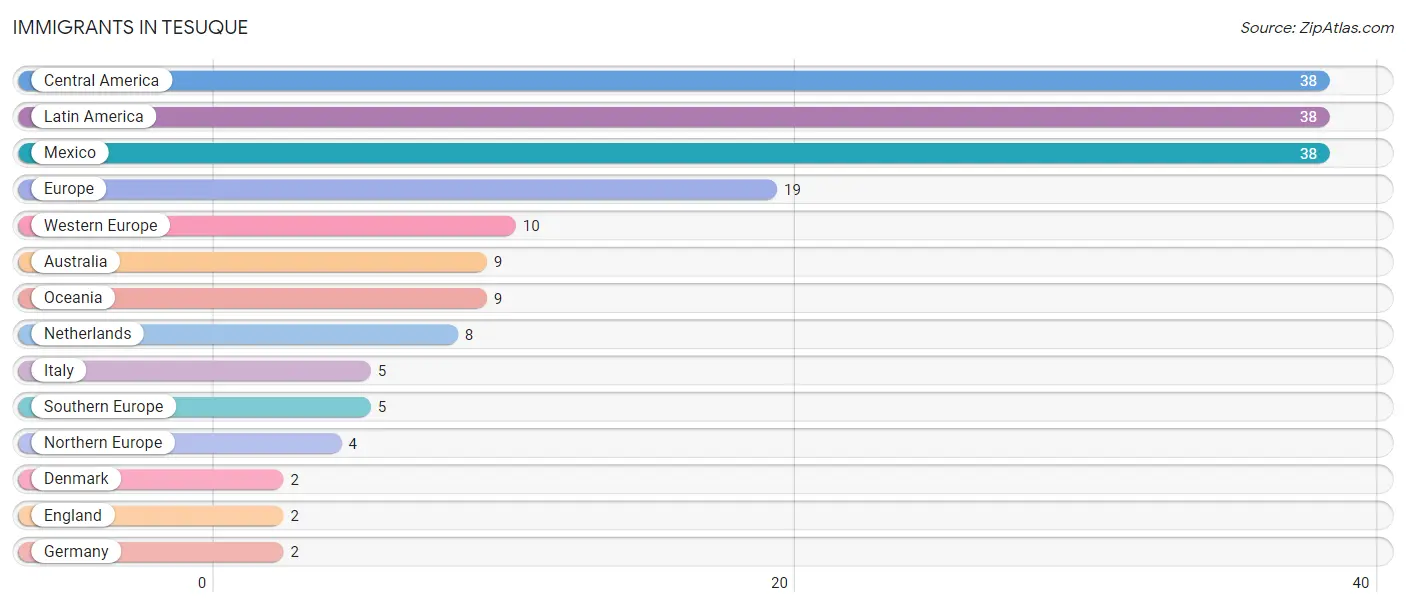
The most numerous immigrant groups reported in Tesuque came from Central America (38 | 3.4%), Latin America (38 | 3.4%), Mexico (38 | 3.4%), Europe (19 | 1.7%), and Western Europe (10 | 0.9%), together accounting for 12.7% of all Tesuque residents.
| Immigration Origin | # Population | % Population |
| Australia | 9 | 0.8% |
| Central America | 38 | 3.4% |
| Denmark | 2 | 0.2% |
| England | 2 | 0.2% |
| Europe | 19 | 1.7% |
| Germany | 2 | 0.2% |
| Italy | 5 | 0.4% |
| Latin America | 38 | 3.4% |
| Mexico | 38 | 3.4% |
| Netherlands | 8 | 0.7% |
| Northern Europe | 4 | 0.4% |
| Oceania | 9 | 0.8% |
| Southern Europe | 5 | 0.4% |
| Western Europe | 10 | 0.9% | View All 14 Rows |
Sex and Age in Tesuque
Sex and Age in Tesuque
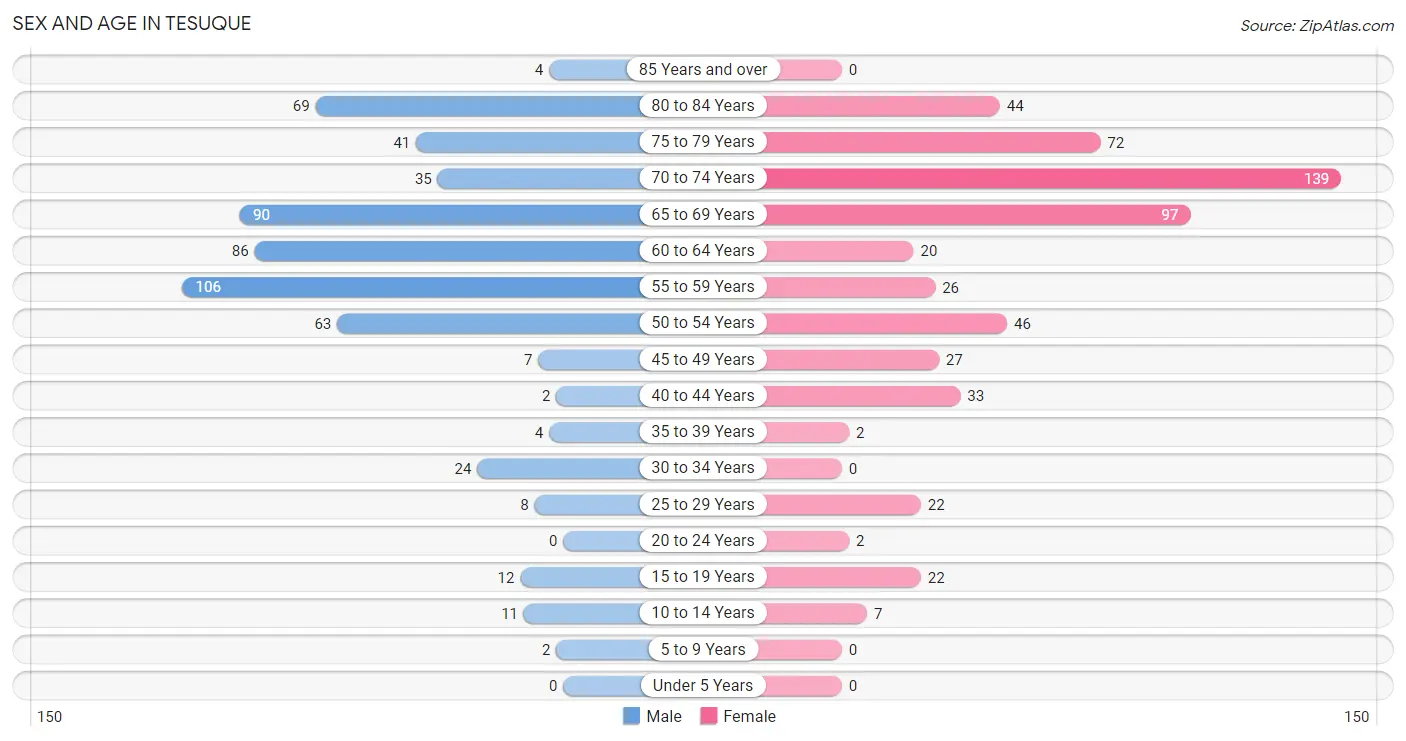
The most populous age groups in Tesuque are 55 to 59 Years (106 | 18.8%) for men and 70 to 74 Years (139 | 24.9%) for women.
| Age Bracket | Male | Female |
| Under 5 Years | 0 (0.0%) | 0 (0.0%) |
| 5 to 9 Years | 2 (0.4%) | 0 (0.0%) |
| 10 to 14 Years | 11 (1.9%) | 7 (1.3%) |
| 15 to 19 Years | 12 (2.1%) | 22 (3.9%) |
| 20 to 24 Years | 0 (0.0%) | 2 (0.4%) |
| 25 to 29 Years | 8 (1.4%) | 22 (3.9%) |
| 30 to 34 Years | 24 (4.3%) | 0 (0.0%) |
| 35 to 39 Years | 4 (0.7%) | 2 (0.4%) |
| 40 to 44 Years | 2 (0.4%) | 33 (5.9%) |
| 45 to 49 Years | 7 (1.2%) | 27 (4.8%) |
| 50 to 54 Years | 63 (11.2%) | 46 (8.2%) |
| 55 to 59 Years | 106 (18.8%) | 26 (4.6%) |
| 60 to 64 Years | 86 (15.2%) | 20 (3.6%) |
| 65 to 69 Years | 90 (16.0%) | 97 (17.3%) |
| 70 to 74 Years | 35 (6.2%) | 139 (24.9%) |
| 75 to 79 Years | 41 (7.3%) | 72 (12.9%) |
| 80 to 84 Years | 69 (12.2%) | 44 (7.9%) |
| 85 Years and over | 4 (0.7%) | 0 (0.0%) |
| Total | 564 (100.0%) | 559 (100.0%) |
Families and Households in Tesuque
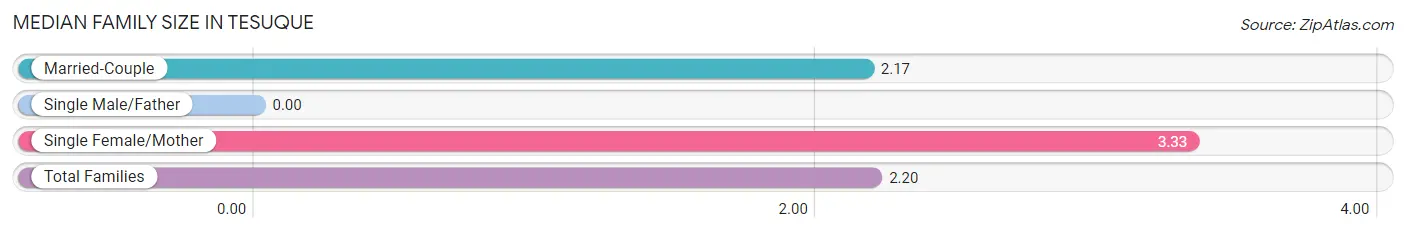
Median Family Size in Tesuque
| Family Type | # Families | Family Size |
| Married-Couple | 219 (97.3%) | 2.17 |
| Single Male/Father | 0 (0.0%) | - |
| Single Female/Mother | 6 (2.7%) | 3.33 |
| Total Families | 225 (100.0%) | 2.20 |
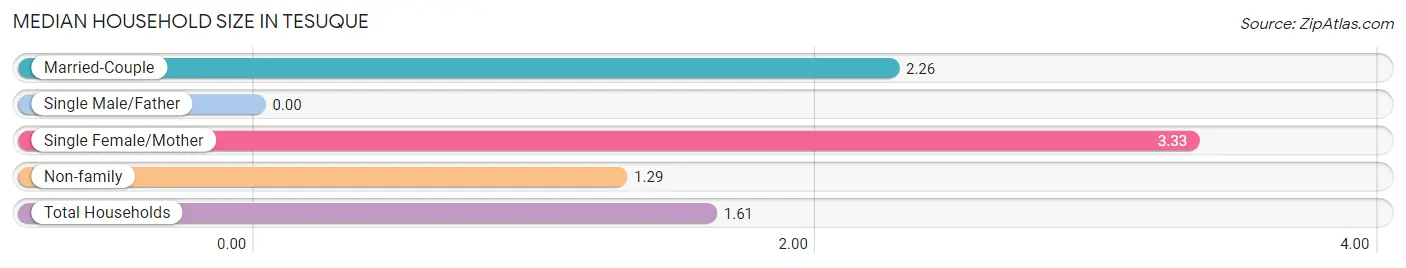
Median Household Size in Tesuque
| Household Type | # Households | Household Size |
| Married-Couple | 219 (31.4%) | 2.26 |
| Single Male/Father | 0 (0.0%) | - |
| Single Female/Mother | 6 (0.9%) | 3.33 |
| Non-family | 472 (67.7%) | 1.29 |
| Total Households | 697 (100.0%) | 1.61 |
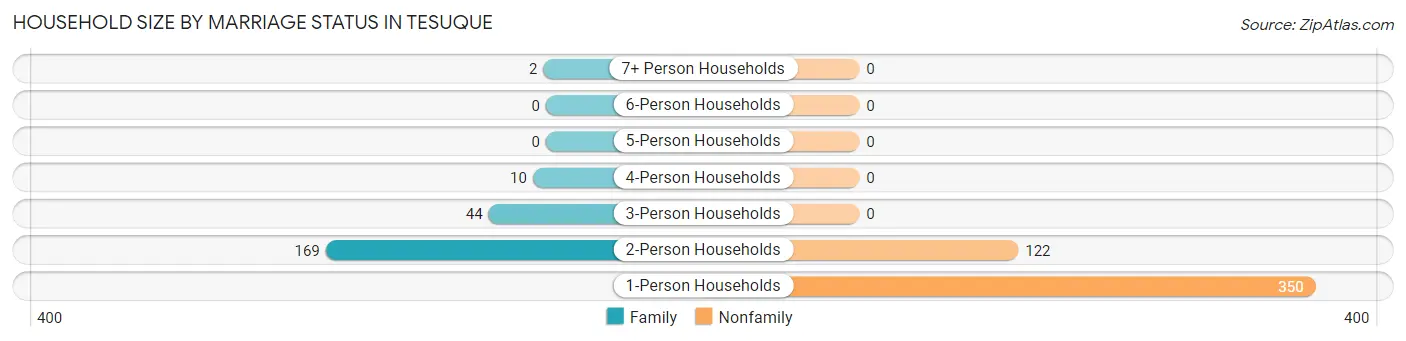
Household Size by Marriage Status in Tesuque
Out of a total of 697 households in Tesuque, 225 (32.3%) are family households, while 472 (67.7%) are nonfamily households. The most numerous type of family households are 2-person households, comprising 169, and the most common type of nonfamily households are 1-person households, comprising 350.
| Household Size | Family Households | Nonfamily Households |
| 1-Person Households | - | 350 (50.2%) |
| 2-Person Households | 169 (24.2%) | 122 (17.5%) |
| 3-Person Households | 44 (6.3%) | 0 (0.0%) |
| 4-Person Households | 10 (1.4%) | 0 (0.0%) |
| 5-Person Households | 0 (0.0%) | 0 (0.0%) |
| 6-Person Households | 0 (0.0%) | 0 (0.0%) |
| 7+ Person Households | 2 (0.3%) | 0 (0.0%) |
| Total | 225 (32.3%) | 472 (67.7%) |
Female Fertility in Tesuque
Fertility by Age in Tesuque
| Age Bracket | Women with Births | Births / 1,000 Women |
| 15 to 19 years | 0 (0.0%) | 0.0 |
| 20 to 34 years | 0 (0.0%) | 0.0 |
| 35 to 50 years | 0 (0.0%) | 0.0 |
| Total | 0 (0.0%) | 0.0 |
Fertility by Age by Marriage Status in Tesuque
| Age Bracket | Married | Unmarried |
| 15 to 19 years | 0 (0.0%) | 0 (0.0%) |
| 20 to 34 years | 0 (0.0%) | 0 (0.0%) |
| 35 to 50 years | 0 (0.0%) | 0 (0.0%) |
| Total | 0 (0.0%) | 0 (0.0%) |
Fertility by Education in Tesuque
| Educational Attainment | Women with Births | Births / 1,000 Women |
| Less than High School | 0 (0.0%) | 0.0 |
| High School Diploma | 0 (0.0%) | 0.0 |
| College or Associate's Degree | 0 (0.0%) | 0.0 |
| Bachelor's Degree | 0 (0.0%) | 0.0 |
| Graduate Degree | 0 (0.0%) | 0.0 |
| Total | 0 (0.0%) | 0.0 |
Fertility by Education by Marriage Status in Tesuque
| Educational Attainment | Married | Unmarried |
| Less than High School | 0 (0.0%) | 0 (0.0%) |
| High School Diploma | 0 (0.0%) | 0 (0.0%) |
| College or Associate's Degree | 0 (0.0%) | 0 (0.0%) |
| Bachelor's Degree | 0 (0.0%) | 0 (0.0%) |
| Graduate Degree | 0 (0.0%) | 0 (0.0%) |
| Total | 0 (0.0%) | 0 (0.0%) |
Employment Characteristics in Tesuque
Employment by Class of Employer in Tesuque
Among the 324 employed individuals in Tesuque, private company employees (107 | 33.0%), not-for-profit organizations (92 | 28.4%), and self-employed (not incorporated) (42 | 13.0%) make up the most common classes of employment.
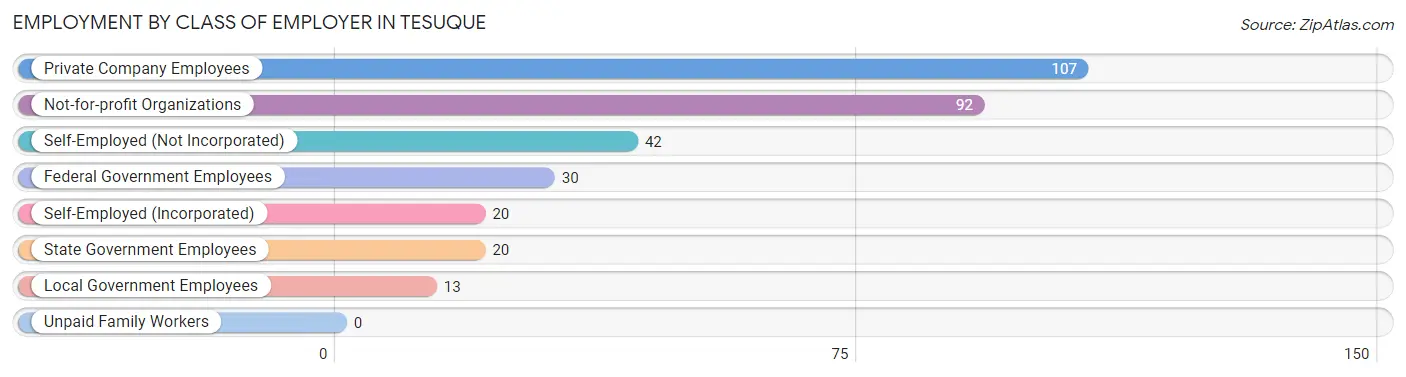
| Employer Class | # Employees | % Employees |
| Private Company Employees | 107 | 33.0% |
| Self-Employed (Incorporated) | 20 | 6.2% |
| Self-Employed (Not Incorporated) | 42 | 13.0% |
| Not-for-profit Organizations | 92 | 28.4% |
| Local Government Employees | 13 | 4.0% |
| State Government Employees | 20 | 6.2% |
| Federal Government Employees | 30 | 9.3% |
| Unpaid Family Workers | 0 | 0.0% |
| Total | 324 | 100.0% |
Employment Status by Age in Tesuque
According to the labor force statistics for Tesuque, out of the total population over 16 years of age (1,103), 32.2% or 355 individuals are in the labor force, with 8.2% or 29 of them unemployed. The age group with the highest labor force participation rate is 20 to 24 years, with 100.0% or 2 individuals in the labor force. Within the labor force, the 45 to 54 years age range has the highest percentage of unemployed individuals, with 25.0% or 27 of them being unemployed.
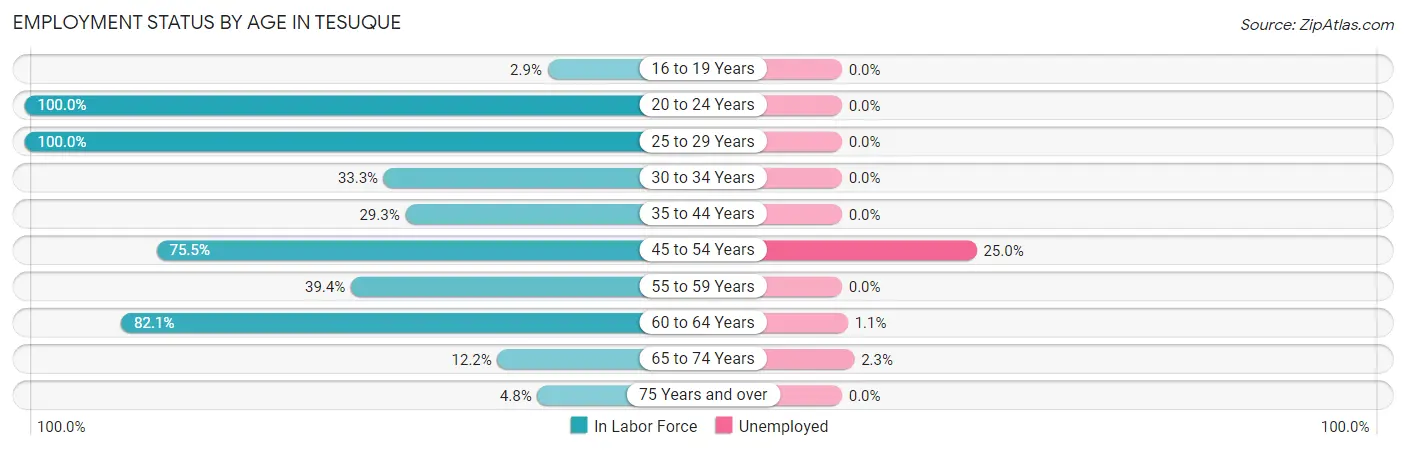
| Age Bracket | In Labor Force | Unemployed |
| 16 to 19 Years | 1 (2.9%) | 0 (0.0%) |
| 20 to 24 Years | 2 (100.0%) | 0 (0.0%) |
| 25 to 29 Years | 30 (100.0%) | 0 (0.0%) |
| 30 to 34 Years | 8 (33.3%) | 0 (0.0%) |
| 35 to 44 Years | 12 (29.3%) | 0 (0.0%) |
| 45 to 54 Years | 108 (75.5%) | 27 (25.0%) |
| 55 to 59 Years | 52 (39.4%) | 0 (0.0%) |
| 60 to 64 Years | 87 (82.1%) | 1 (1.1%) |
| 65 to 74 Years | 44 (12.2%) | 1 (2.3%) |
| 75 Years and over | 11 (4.8%) | 0 (0.0%) |
| Total | 355 (32.2%) | 29 (8.2%) |
Employment Status by Educational Attainment in Tesuque
According to labor force statistics for Tesuque, 62.4% of individuals (297) out of the total population between 25 and 64 years of age (476) are in the labor force, with 9.4% or 28 of them being unemployed. The group with the highest labor force participation rate are those with the educational attainment of less than high school, with 100.0% or 1 individuals in the labor force. Within the labor force, individuals with bachelor's degree or higher education have the highest percentage of unemployment, with 13.9% or 28 of them being unemployed.
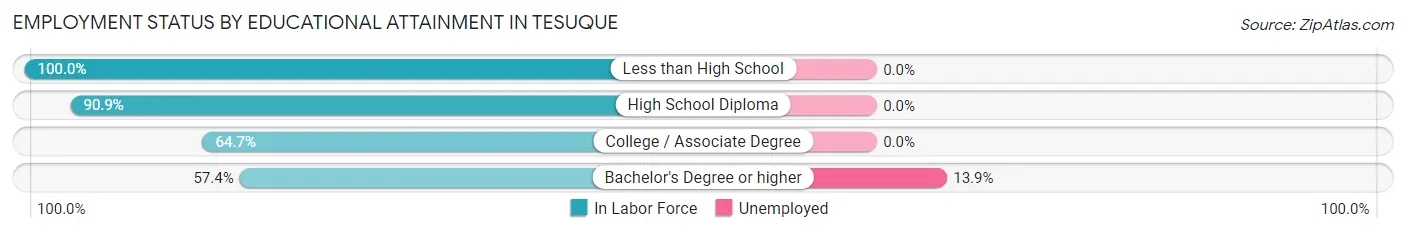
| Educational Attainment | In Labor Force | Unemployed |
| Less than High School | 1 (100.0%) | 0 (0.0%) |
| High School Diploma | 50 (90.9%) | 0 (0.0%) |
| College / Associate Degree | 44 (64.7%) | 0 (0.0%) |
| Bachelor's Degree or higher | 202 (57.4%) | 49 (13.9%) |
| Total | 297 (62.4%) | 45 (9.4%) |
Employment Occupations by Sex in Tesuque
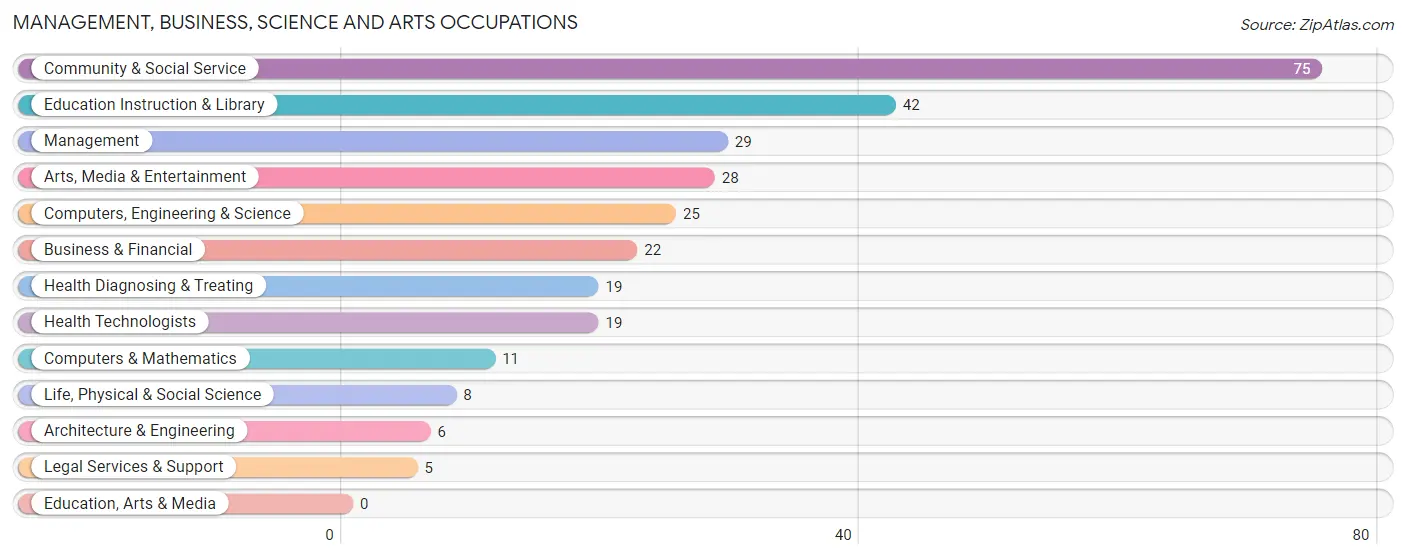
Management, Business, Science and Arts Occupations
The most common Management, Business, Science and Arts occupations in Tesuque are Community & Social Service (75 | 23.0%), Education Instruction & Library (42 | 12.9%), Management (29 | 8.9%), Arts, Media & Entertainment (28 | 8.6%), and Computers, Engineering & Science (25 | 7.7%).
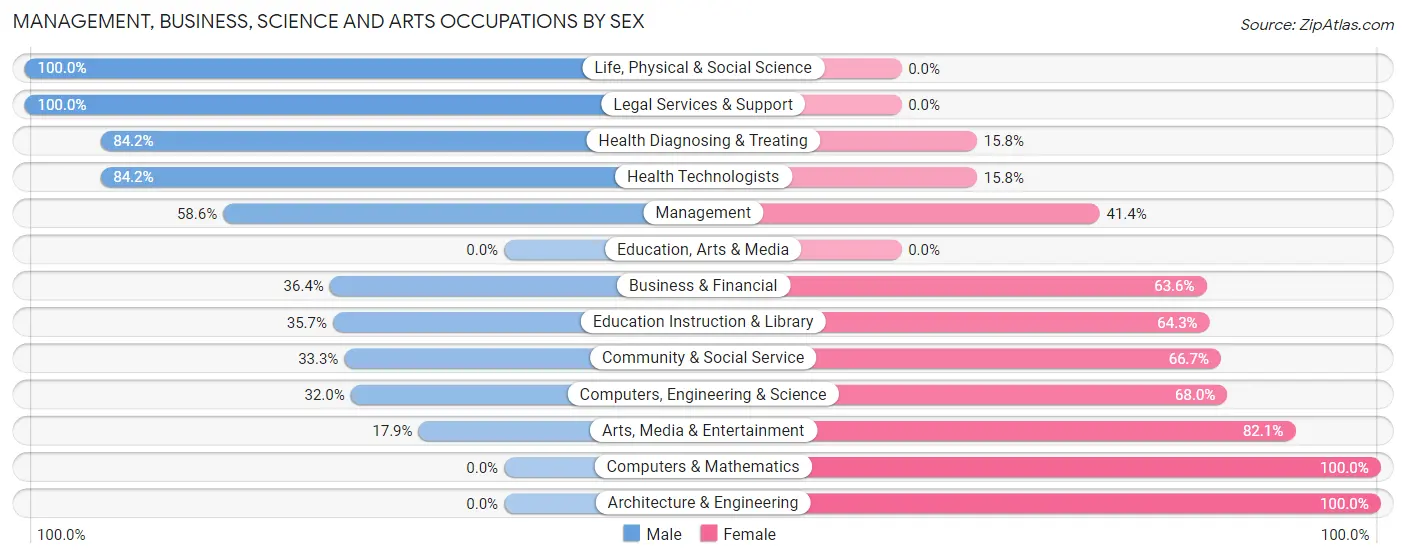
Management, Business, Science and Arts Occupations by Sex
Within the Management, Business, Science and Arts occupations in Tesuque, the most male-oriented occupations are Life, Physical & Social Science (100.0%), Legal Services & Support (100.0%), and Health Diagnosing & Treating (84.2%), while the most female-oriented occupations are Computers & Mathematics (100.0%), Architecture & Engineering (100.0%), and Arts, Media & Entertainment (82.1%).
| Occupation | Male | Female |
| Management | 17 (58.6%) | 12 (41.4%) |
| Business & Financial | 8 (36.4%) | 14 (63.6%) |
| Computers, Engineering & Science | 8 (32.0%) | 17 (68.0%) |
| Computers & Mathematics | 0 (0.0%) | 11 (100.0%) |
| Architecture & Engineering | 0 (0.0%) | 6 (100.0%) |
| Life, Physical & Social Science | 8 (100.0%) | 0 (0.0%) |
| Community & Social Service | 25 (33.3%) | 50 (66.7%) |
| Education, Arts & Media | 0 (0.0%) | 0 (0.0%) |
| Legal Services & Support | 5 (100.0%) | 0 (0.0%) |
| Education Instruction & Library | 15 (35.7%) | 27 (64.3%) |
| Arts, Media & Entertainment | 5 (17.9%) | 23 (82.1%) |
| Health Diagnosing & Treating | 16 (84.2%) | 3 (15.8%) |
| Health Technologists | 16 (84.2%) | 3 (15.8%) |
| Total (Category) | 74 (43.5%) | 96 (56.5%) |
| Total (Overall) | 194 (59.5%) | 132 (40.5%) |
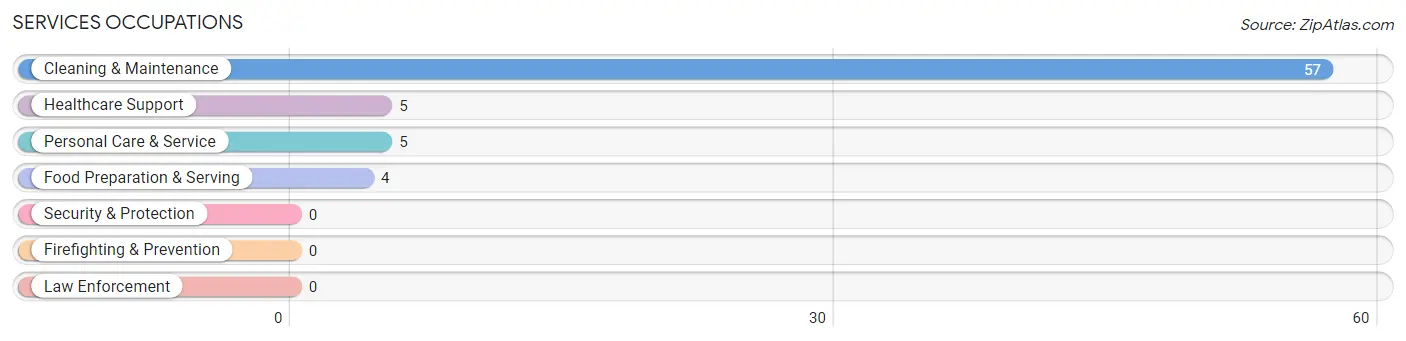
Services Occupations
The most common Services occupations in Tesuque are Cleaning & Maintenance (57 | 17.5%), Healthcare Support (5 | 1.5%), Personal Care & Service (5 | 1.5%), and Food Preparation & Serving (4 | 1.2%).
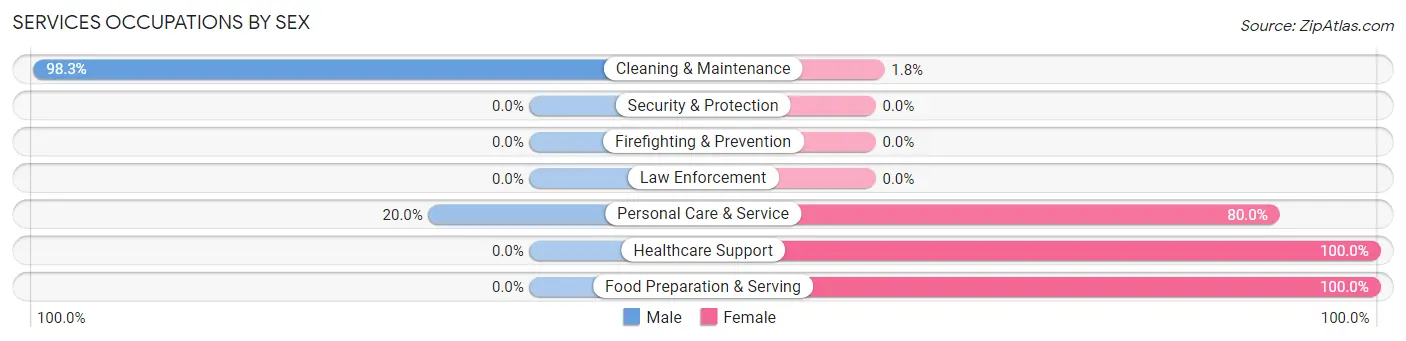
Services Occupations by Sex
Within the Services occupations in Tesuque, the most male-oriented occupations are Cleaning & Maintenance (98.3%), and Personal Care & Service (20.0%), while the most female-oriented occupations are Healthcare Support (100.0%), Food Preparation & Serving (100.0%), and Personal Care & Service (80.0%).
| Occupation | Male | Female |
| Healthcare Support | 0 (0.0%) | 5 (100.0%) |
| Security & Protection | 0 (0.0%) | 0 (0.0%) |
| Firefighting & Prevention | 0 (0.0%) | 0 (0.0%) |
| Law Enforcement | 0 (0.0%) | 0 (0.0%) |
| Food Preparation & Serving | 0 (0.0%) | 4 (100.0%) |
| Cleaning & Maintenance | 56 (98.3%) | 1 (1.8%) |
| Personal Care & Service | 1 (20.0%) | 4 (80.0%) |
| Total (Category) | 57 (80.3%) | 14 (19.7%) |
| Total (Overall) | 194 (59.5%) | 132 (40.5%) |
Sales and Office Occupations
The most common Sales and Office occupations in Tesuque are Office & Administration (31 | 9.5%), and Sales & Related (8 | 2.5%).

Sales and Office Occupations by Sex

| Occupation | Male | Female |
| Sales & Related | 6 (75.0%) | 2 (25.0%) |
| Office & Administration | 13 (41.9%) | 18 (58.1%) |
| Total (Category) | 19 (48.7%) | 20 (51.3%) |
| Total (Overall) | 194 (59.5%) | 132 (40.5%) |
Natural Resources, Construction and Maintenance Occupations

Natural Resources, Construction and Maintenance Occupations by Sex
| Occupation | Male | Female |
| Farming, Fishing & Forestry | 0 (0.0%) | 0 (0.0%) |
| Construction & Extraction | 0 (0.0%) | 0 (0.0%) |
| Installation, Maintenance & Repair | 0 (0.0%) | 0 (0.0%) |
| Total (Category) | 0 (0.0%) | 0 (0.0%) |
| Total (Overall) | 194 (59.5%) | 132 (40.5%) |
Production, Transportation and Moving Occupations
The most common Production, Transportation and Moving occupations in Tesuque are Production (24 | 7.4%), Transportation (21 | 6.4%), and Material Moving (1 | 0.3%).
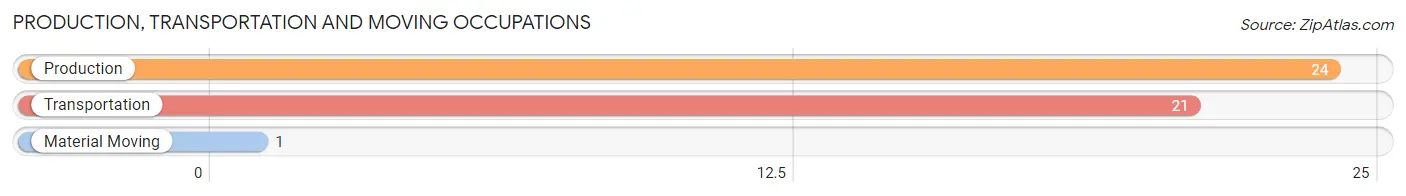
Production, Transportation and Moving Occupations by Sex
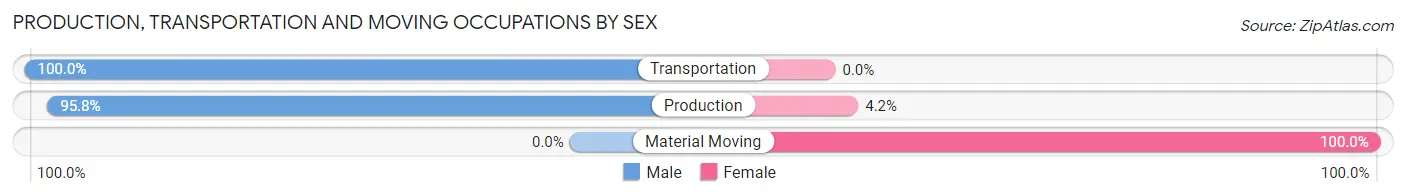
| Occupation | Male | Female |
| Production | 23 (95.8%) | 1 (4.2%) |
| Transportation | 21 (100.0%) | 0 (0.0%) |
| Material Moving | 0 (0.0%) | 1 (100.0%) |
| Total (Category) | 44 (95.7%) | 2 (4.3%) |
| Total (Overall) | 194 (59.5%) | 132 (40.5%) |
Employment Industries by Sex in Tesuque
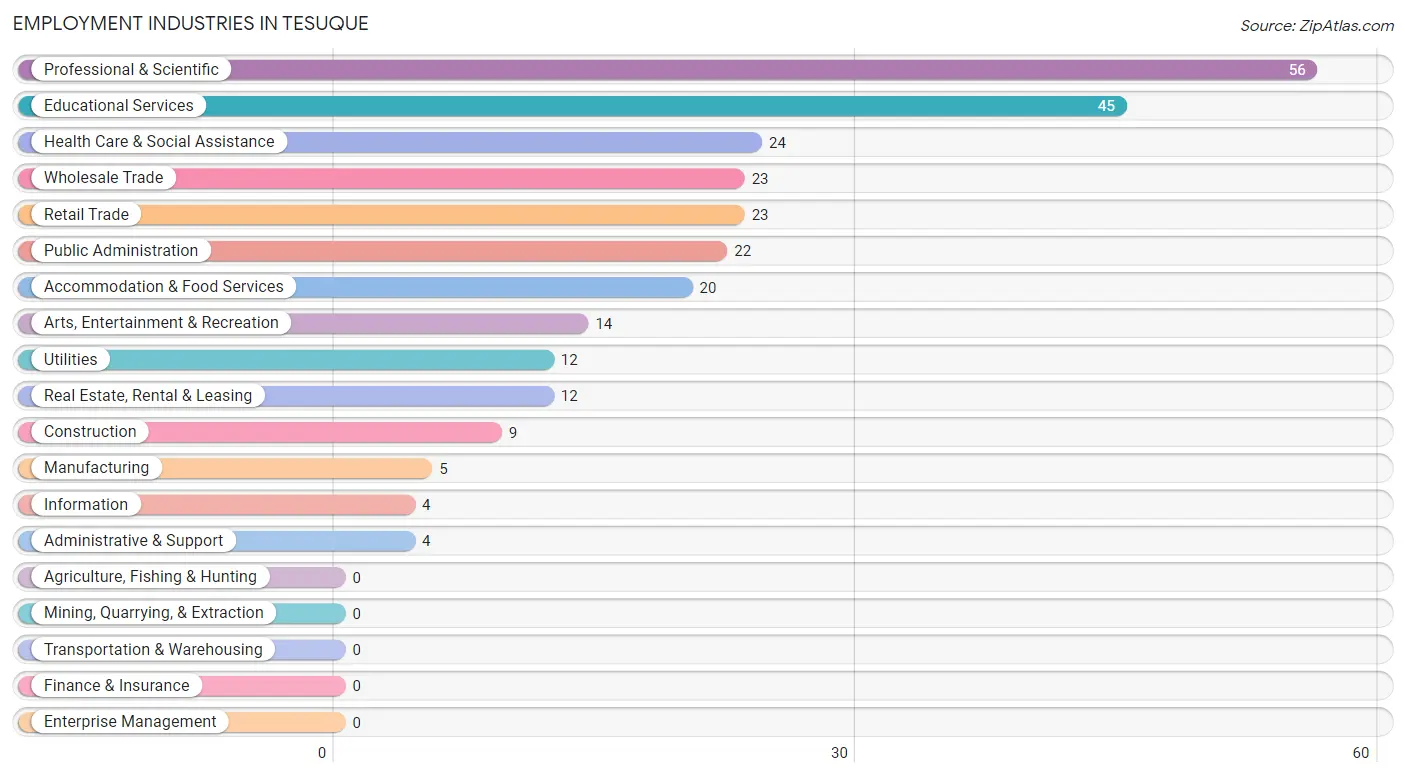
Employment Industries in Tesuque
The major employment industries in Tesuque include Professional & Scientific (56 | 17.2%), Educational Services (45 | 13.8%), Health Care & Social Assistance (24 | 7.4%), Wholesale Trade (23 | 7.1%), and Retail Trade (23 | 7.1%).
Employment Industries by Sex in Tesuque
The Tesuque industries that see more men than women are Wholesale Trade (100.0%), Administrative & Support (100.0%), and Manufacturing (80.0%), whereas the industries that tend to have a higher number of women are Construction (100.0%), Utilities (100.0%), and Arts, Entertainment & Recreation (85.7%).
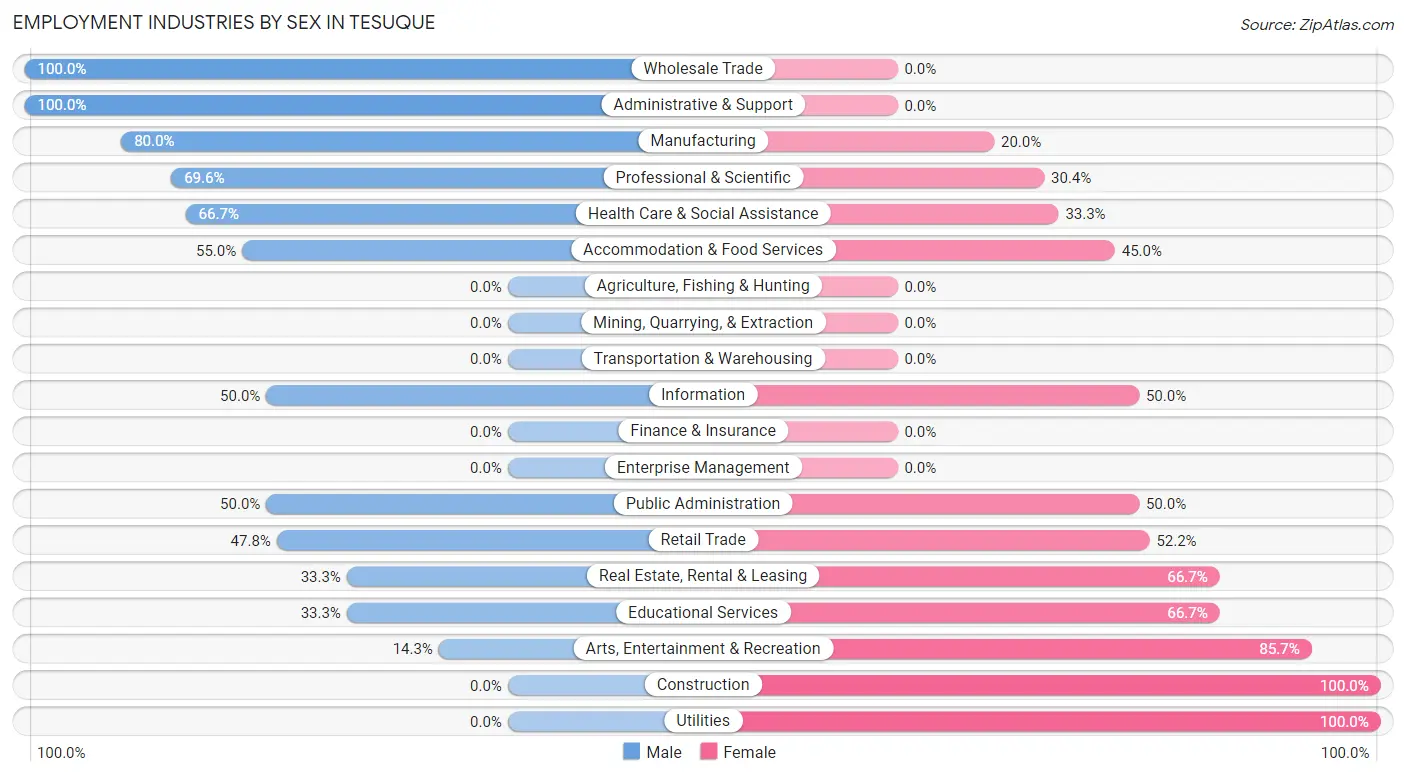
| Industry | Male | Female |
| Agriculture, Fishing & Hunting | 0 (0.0%) | 0 (0.0%) |
| Mining, Quarrying, & Extraction | 0 (0.0%) | 0 (0.0%) |
| Construction | 0 (0.0%) | 9 (100.0%) |
| Manufacturing | 4 (80.0%) | 1 (20.0%) |
| Wholesale Trade | 23 (100.0%) | 0 (0.0%) |
| Retail Trade | 11 (47.8%) | 12 (52.2%) |
| Transportation & Warehousing | 0 (0.0%) | 0 (0.0%) |
| Utilities | 0 (0.0%) | 12 (100.0%) |
| Information | 2 (50.0%) | 2 (50.0%) |
| Finance & Insurance | 0 (0.0%) | 0 (0.0%) |
| Real Estate, Rental & Leasing | 4 (33.3%) | 8 (66.7%) |
| Professional & Scientific | 39 (69.6%) | 17 (30.4%) |
| Enterprise Management | 0 (0.0%) | 0 (0.0%) |
| Administrative & Support | 4 (100.0%) | 0 (0.0%) |
| Educational Services | 15 (33.3%) | 30 (66.7%) |
| Health Care & Social Assistance | 16 (66.7%) | 8 (33.3%) |
| Arts, Entertainment & Recreation | 2 (14.3%) | 12 (85.7%) |
| Accommodation & Food Services | 11 (55.0%) | 9 (45.0%) |
| Public Administration | 11 (50.0%) | 11 (50.0%) |
| Total | 194 (59.5%) | 132 (40.5%) |
Education in Tesuque
School Enrollment in Tesuque
The most common levels of schooling among the 84 students in Tesuque are high school (33 | 39.3%), graduate / professional (19 | 22.6%), and college / undergraduate (16 | 19.1%).
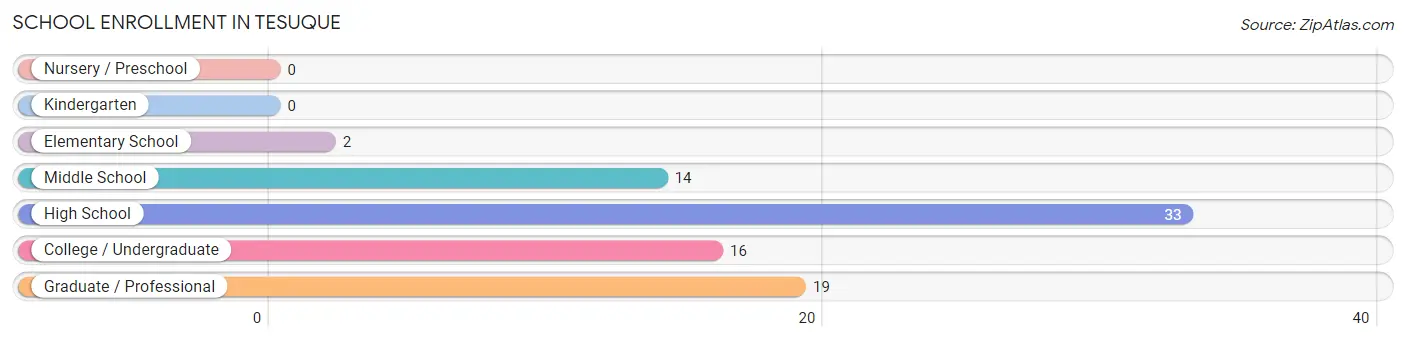
| School Level | # Students | % Students |
| Nursery / Preschool | 0 | 0.0% |
| Kindergarten | 0 | 0.0% |
| Elementary School | 2 | 2.4% |
| Middle School | 14 | 16.7% |
| High School | 33 | 39.3% |
| College / Undergraduate | 16 | 19.1% |
| Graduate / Professional | 19 | 22.6% |
| Total | 84 | 100.0% |
School Enrollment by Age by Funding Source in Tesuque
Out of a total of 84 students who are enrolled in schools in Tesuque, 37 (44.0%) attend a private institution, while the remaining 47 (56.0%) are enrolled in public schools. The age group of 5 to 9 year old has the highest likelihood of being enrolled in private schools, with 2 (100.0% in the age bracket) enrolled. Conversely, the age group of 20 to 24 year olds has the lowest likelihood of being enrolled in a private school, with 2 (100.0% in the age bracket) attending a public institution.
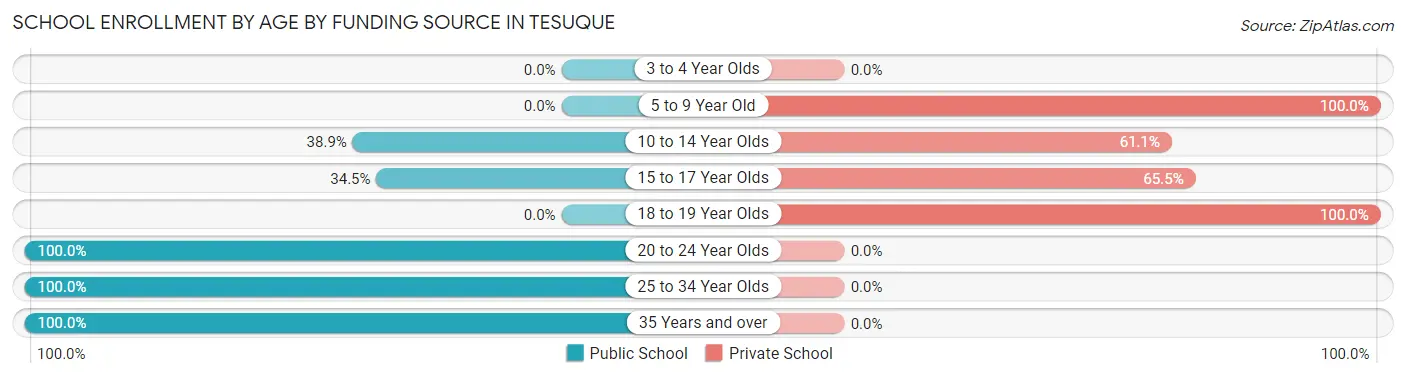
| Age Bracket | Public School | Private School |
| 3 to 4 Year Olds | 0 (0.0%) | 0 (0.0%) |
| 5 to 9 Year Old | 0 (0.0%) | 2 (100.0%) |
| 10 to 14 Year Olds | 7 (38.9%) | 11 (61.1%) |
| 15 to 17 Year Olds | 10 (34.5%) | 19 (65.5%) |
| 18 to 19 Year Olds | 0 (0.0%) | 5 (100.0%) |
| 20 to 24 Year Olds | 2 (100.0%) | 0 (0.0%) |
| 25 to 34 Year Olds | 11 (100.0%) | 0 (0.0%) |
| 35 Years and over | 17 (100.0%) | 0 (0.0%) |
| Total | 47 (56.0%) | 37 (44.0%) |
Educational Attainment by Field of Study in Tesuque
Liberal arts & history (127 | 15.9%), business (112 | 14.0%), social sciences (107 | 13.4%), visual & performing arts (97 | 12.1%), and bio, nature & agricultural (74 | 9.2%) are the most common fields of study among 800 individuals in Tesuque who have obtained a bachelor's degree or higher.
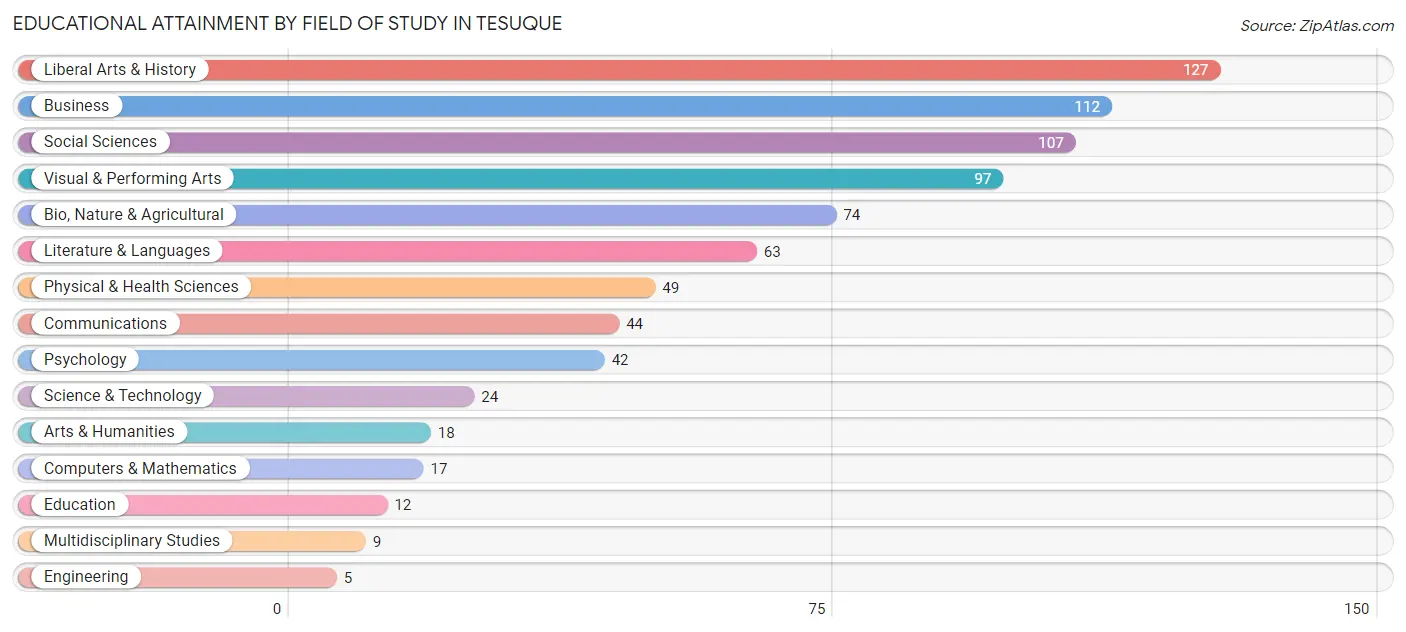
| Field of Study | # Graduates | % Graduates |
| Computers & Mathematics | 17 | 2.1% |
| Bio, Nature & Agricultural | 74 | 9.2% |
| Physical & Health Sciences | 49 | 6.1% |
| Psychology | 42 | 5.2% |
| Social Sciences | 107 | 13.4% |
| Engineering | 5 | 0.6% |
| Multidisciplinary Studies | 9 | 1.1% |
| Science & Technology | 24 | 3.0% |
| Business | 112 | 14.0% |
| Education | 12 | 1.5% |
| Literature & Languages | 63 | 7.9% |
| Liberal Arts & History | 127 | 15.9% |
| Visual & Performing Arts | 97 | 12.1% |
| Communications | 44 | 5.5% |
| Arts & Humanities | 18 | 2.2% |
| Total | 800 | 100.0% |
Transportation & Commute in Tesuque
Vehicle Availability by Sex in Tesuque
The most prevalent vehicle ownership categories in Tesuque are males with 1 vehicle (82, accounting for 42.7%) and females with 1 vehicle (35, making up 62.1%).
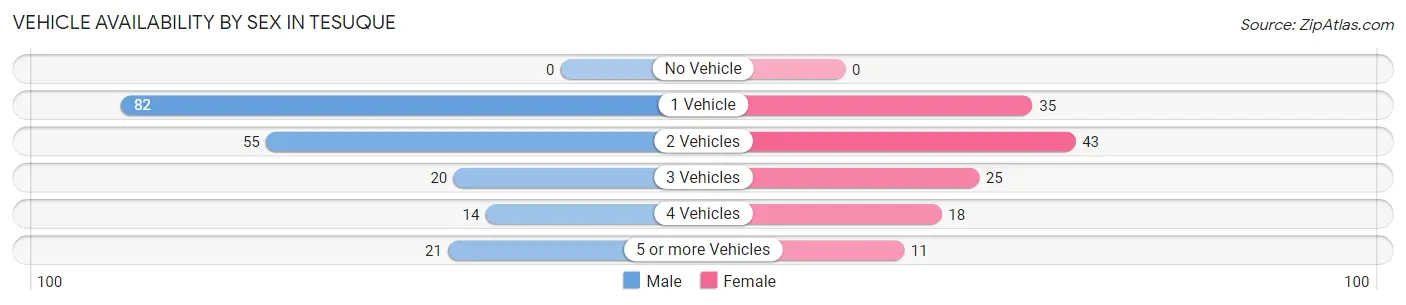
| Vehicles Available | Male | Female |
| No Vehicle | 0 (0.0%) | 0 (0.0%) |
| 1 Vehicle | 82 (42.7%) | 35 (26.5%) |
| 2 Vehicles | 55 (28.6%) | 43 (32.6%) |
| 3 Vehicles | 20 (10.4%) | 25 (18.9%) |
| 4 Vehicles | 14 (7.3%) | 18 (13.6%) |
| 5 or more Vehicles | 21 (10.9%) | 11 (8.3%) |
| Total | 192 (100.0%) | 132 (100.0%) |
Commute Time in Tesuque
The most frequently occuring commute durations in Tesuque are 15 to 19 minutes (71 commuters, 33.2%), 10 to 14 minutes (38 commuters, 17.8%), and 60 to 89 minutes (37 commuters, 17.3%).
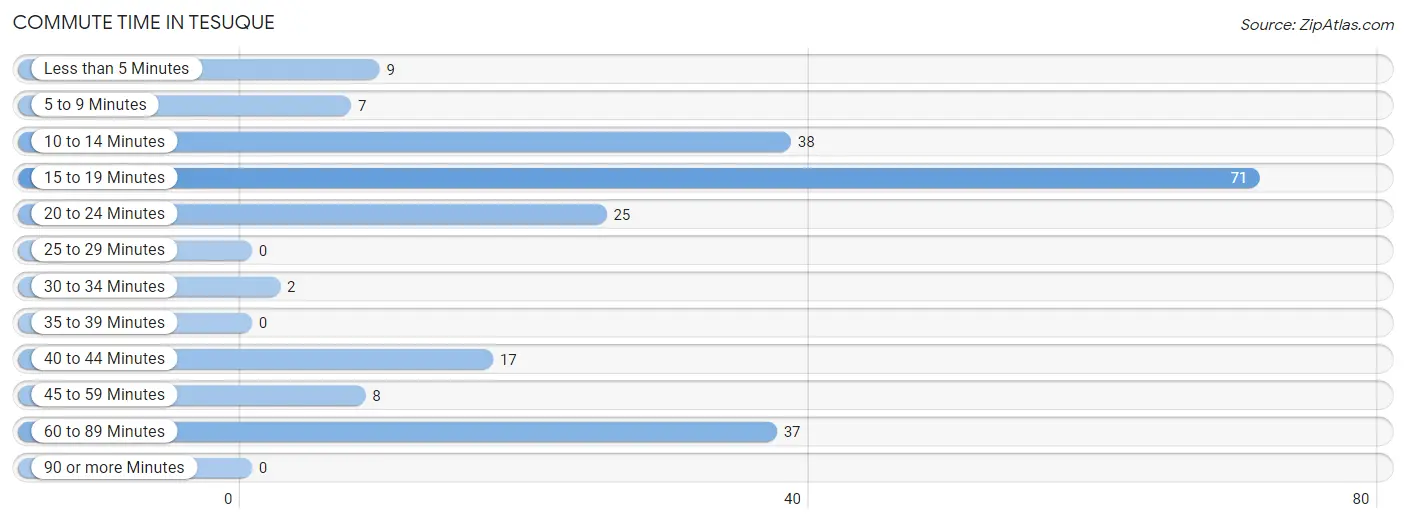
| Commute Time | # Commuters | % Commuters |
| Less than 5 Minutes | 9 | 4.2% |
| 5 to 9 Minutes | 7 | 3.3% |
| 10 to 14 Minutes | 38 | 17.8% |
| 15 to 19 Minutes | 71 | 33.2% |
| 20 to 24 Minutes | 25 | 11.7% |
| 25 to 29 Minutes | 0 | 0.0% |
| 30 to 34 Minutes | 2 | 0.9% |
| 35 to 39 Minutes | 0 | 0.0% |
| 40 to 44 Minutes | 17 | 7.9% |
| 45 to 59 Minutes | 8 | 3.7% |
| 60 to 89 Minutes | 37 | 17.3% |
| 90 or more Minutes | 0 | 0.0% |
Commute Time by Sex in Tesuque
The most common commute times in Tesuque are 10 to 14 minutes (32 commuters, 26.7%) for males and 15 to 19 minutes (45 commuters, 47.9%) for females.
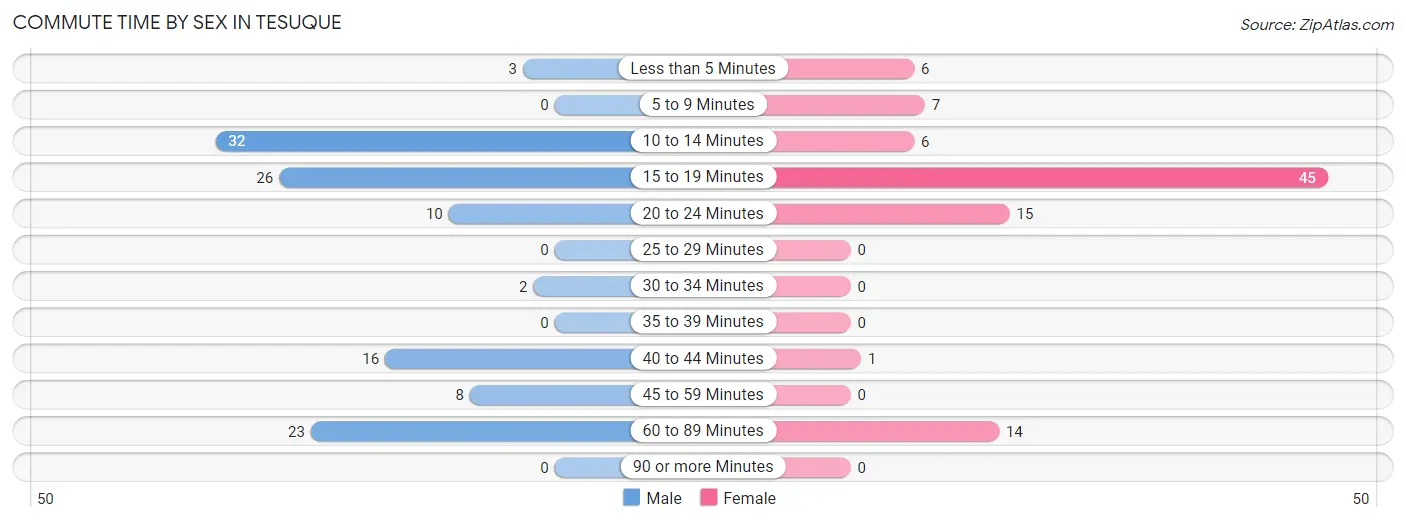
| Commute Time | Male | Female |
| Less than 5 Minutes | 3 (2.5%) | 6 (6.4%) |
| 5 to 9 Minutes | 0 (0.0%) | 7 (7.4%) |
| 10 to 14 Minutes | 32 (26.7%) | 6 (6.4%) |
| 15 to 19 Minutes | 26 (21.7%) | 45 (47.9%) |
| 20 to 24 Minutes | 10 (8.3%) | 15 (16.0%) |
| 25 to 29 Minutes | 0 (0.0%) | 0 (0.0%) |
| 30 to 34 Minutes | 2 (1.7%) | 0 (0.0%) |
| 35 to 39 Minutes | 0 (0.0%) | 0 (0.0%) |
| 40 to 44 Minutes | 16 (13.3%) | 1 (1.1%) |
| 45 to 59 Minutes | 8 (6.7%) | 0 (0.0%) |
| 60 to 89 Minutes | 23 (19.2%) | 14 (14.9%) |
| 90 or more Minutes | 0 (0.0%) | 0 (0.0%) |
Time of Departure to Work by Sex in Tesuque
The most frequent times of departure to work in Tesuque are 6:30 AM to 6:59 AM (24, 20.0%) for males and 7:00 AM to 7:29 AM (36, 38.3%) for females.
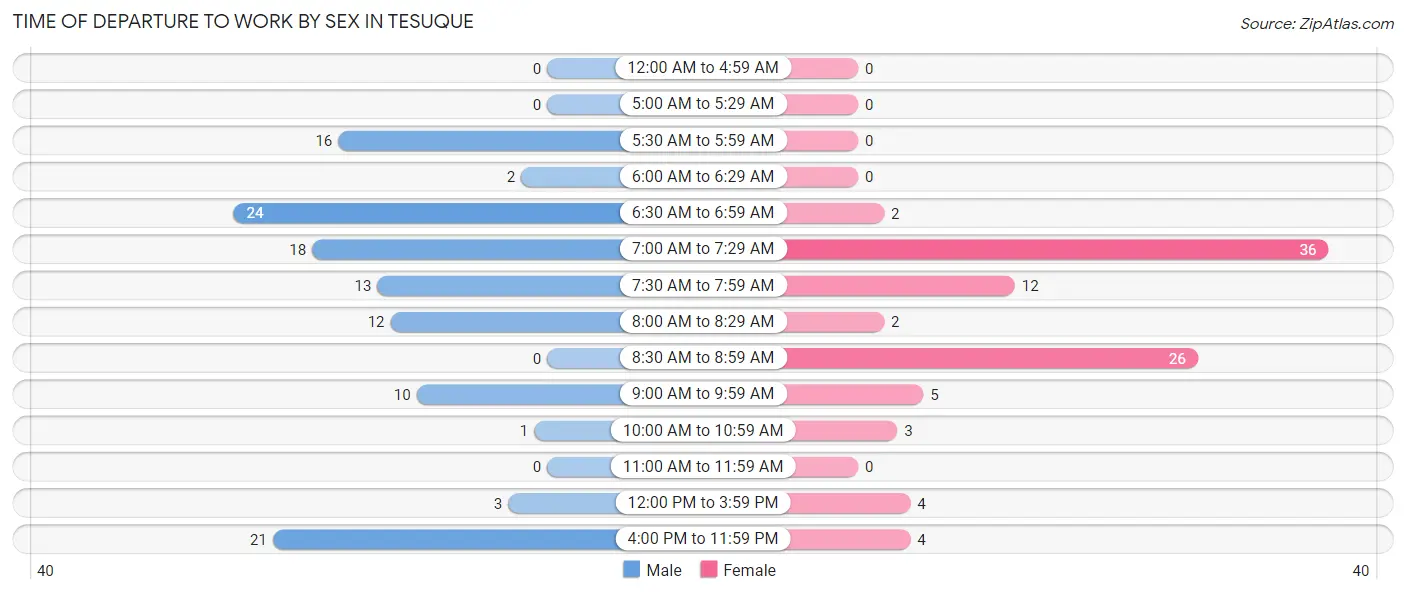
| Time of Departure | Male | Female |
| 12:00 AM to 4:59 AM | 0 (0.0%) | 0 (0.0%) |
| 5:00 AM to 5:29 AM | 0 (0.0%) | 0 (0.0%) |
| 5:30 AM to 5:59 AM | 16 (13.3%) | 0 (0.0%) |
| 6:00 AM to 6:29 AM | 2 (1.7%) | 0 (0.0%) |
| 6:30 AM to 6:59 AM | 24 (20.0%) | 2 (2.1%) |
| 7:00 AM to 7:29 AM | 18 (15.0%) | 36 (38.3%) |
| 7:30 AM to 7:59 AM | 13 (10.8%) | 12 (12.8%) |
| 8:00 AM to 8:29 AM | 12 (10.0%) | 2 (2.1%) |
| 8:30 AM to 8:59 AM | 0 (0.0%) | 26 (27.7%) |
| 9:00 AM to 9:59 AM | 10 (8.3%) | 5 (5.3%) |
| 10:00 AM to 10:59 AM | 1 (0.8%) | 3 (3.2%) |
| 11:00 AM to 11:59 AM | 0 (0.0%) | 0 (0.0%) |
| 12:00 PM to 3:59 PM | 3 (2.5%) | 4 (4.3%) |
| 4:00 PM to 11:59 PM | 21 (17.5%) | 4 (4.3%) |
| Total | 120 (100.0%) | 94 (100.0%) |
Housing Occupancy in Tesuque
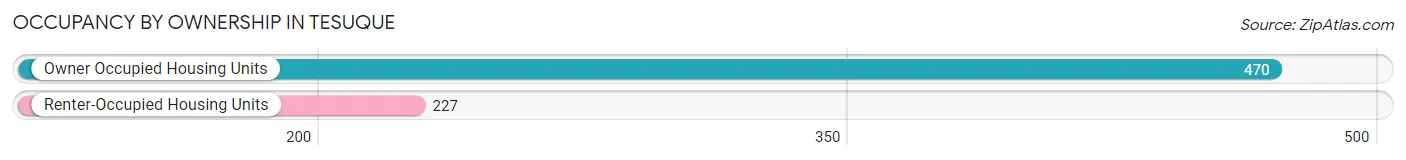
Occupancy by Ownership in Tesuque
Of the total 697 dwellings in Tesuque, owner-occupied units account for 470 (67.4%), while renter-occupied units make up 227 (32.6%).
| Occupancy | # Housing Units | % Housing Units |
| Owner Occupied Housing Units | 470 | 67.4% |
| Renter-Occupied Housing Units | 227 | 32.6% |
| Total Occupied Housing Units | 697 | 100.0% |
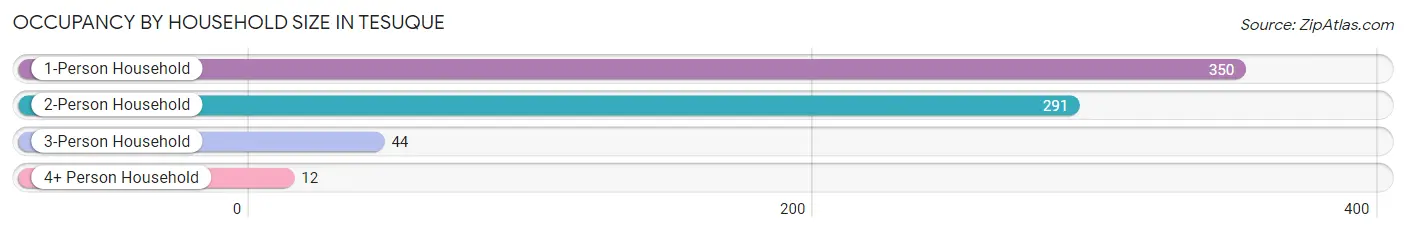
Occupancy by Household Size in Tesuque
| Household Size | # Housing Units | % Housing Units |
| 1-Person Household | 350 | 50.2% |
| 2-Person Household | 291 | 41.7% |
| 3-Person Household | 44 | 6.3% |
| 4+ Person Household | 12 | 1.7% |
| Total Housing Units | 697 | 100.0% |
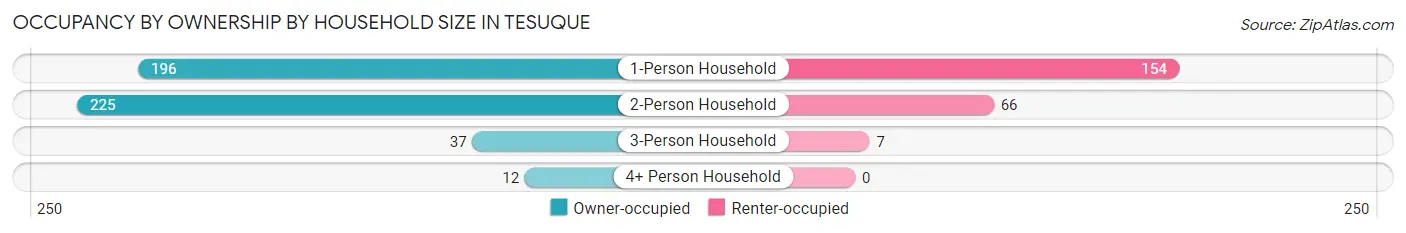
Occupancy by Ownership by Household Size in Tesuque
| Household Size | Owner-occupied | Renter-occupied |
| 1-Person Household | 196 (56.0%) | 154 (44.0%) |
| 2-Person Household | 225 (77.3%) | 66 (22.7%) |
| 3-Person Household | 37 (84.1%) | 7 (15.9%) |
| 4+ Person Household | 12 (100.0%) | 0 (0.0%) |
| Total Housing Units | 470 (67.4%) | 227 (32.6%) |
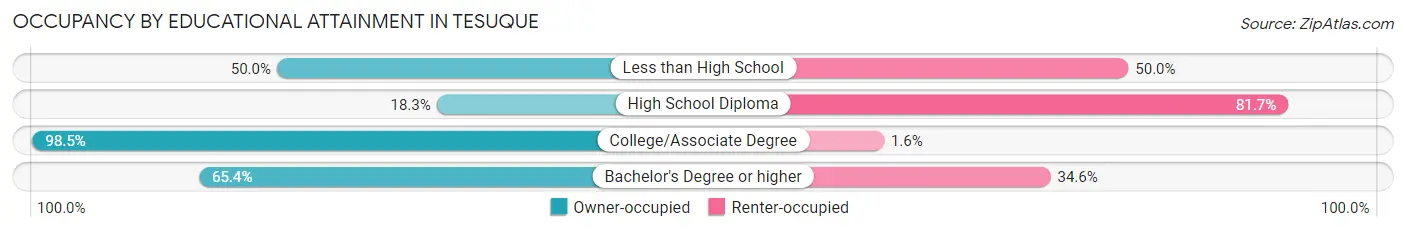
Occupancy by Educational Attainment in Tesuque
| Household Size | Owner-occupied | Renter-occupied |
| Less than High School | 1 (50.0%) | 1 (50.0%) |
| High School Diploma | 11 (18.3%) | 49 (81.7%) |
| College/Associate Degree | 127 (98.5%) | 2 (1.5%) |
| Bachelor's Degree or higher | 331 (65.4%) | 175 (34.6%) |
Occupancy by Age of Householder in Tesuque
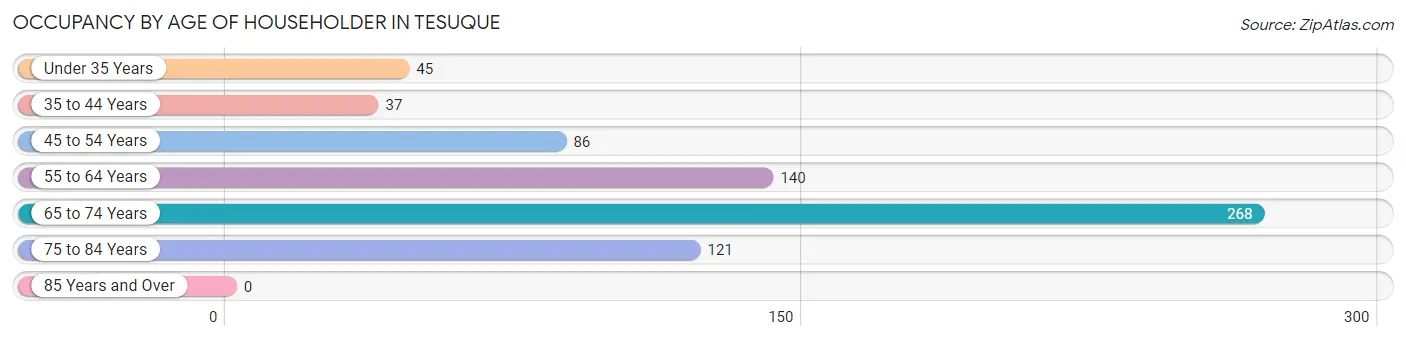
| Age Bracket | # Households | % Households |
| Under 35 Years | 45 | 6.5% |
| 35 to 44 Years | 37 | 5.3% |
| 45 to 54 Years | 86 | 12.3% |
| 55 to 64 Years | 140 | 20.1% |
| 65 to 74 Years | 268 | 38.5% |
| 75 to 84 Years | 121 | 17.4% |
| 85 Years and Over | 0 | 0.0% |
| Total | 697 | 100.0% |
Housing Finances in Tesuque
Median Income by Occupancy in Tesuque
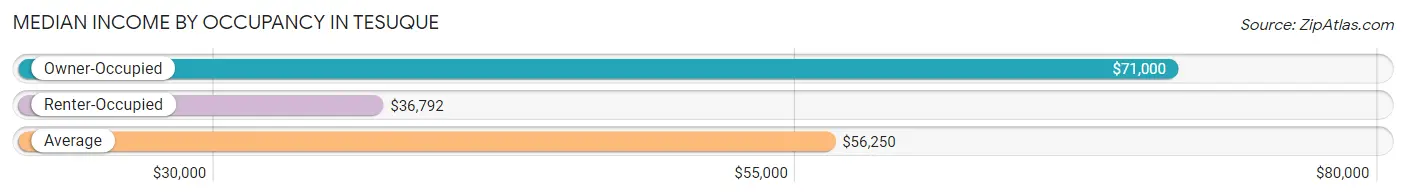
| Occupancy Type | # Households | Median Income |
| Owner-Occupied | 470 (67.4%) | $71,000 |
| Renter-Occupied | 227 (32.6%) | $36,792 |
| Average | 697 (100.0%) | $56,250 |
Occupancy by Householder Income Bracket in Tesuque
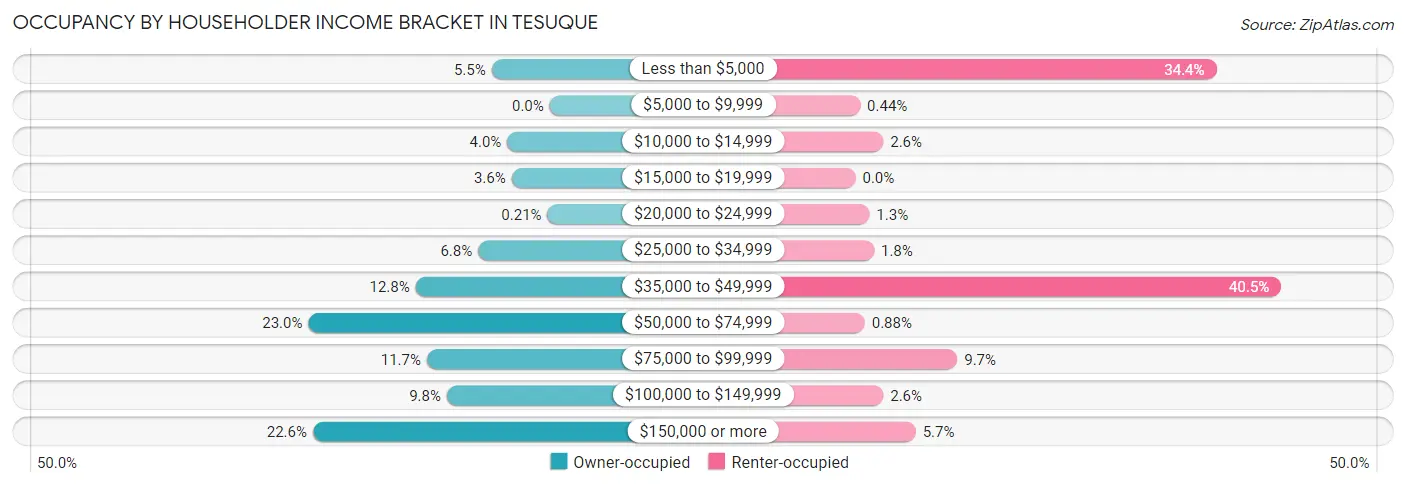
| Income Bracket | Owner-occupied | Renter-occupied |
| Less than $5,000 | 26 (5.5%) | 78 (34.4%) |
| $5,000 to $9,999 | 0 (0.0%) | 1 (0.4%) |
| $10,000 to $14,999 | 19 (4.0%) | 6 (2.6%) |
| $15,000 to $19,999 | 17 (3.6%) | 0 (0.0%) |
| $20,000 to $24,999 | 1 (0.2%) | 3 (1.3%) |
| $25,000 to $34,999 | 32 (6.8%) | 4 (1.8%) |
| $35,000 to $49,999 | 60 (12.8%) | 92 (40.5%) |
| $50,000 to $74,999 | 108 (23.0%) | 2 (0.9%) |
| $75,000 to $99,999 | 55 (11.7%) | 22 (9.7%) |
| $100,000 to $149,999 | 46 (9.8%) | 6 (2.6%) |
| $150,000 or more | 106 (22.6%) | 13 (5.7%) |
| Total | 470 (100.0%) | 227 (100.0%) |
Monthly Housing Cost Tiers in Tesuque
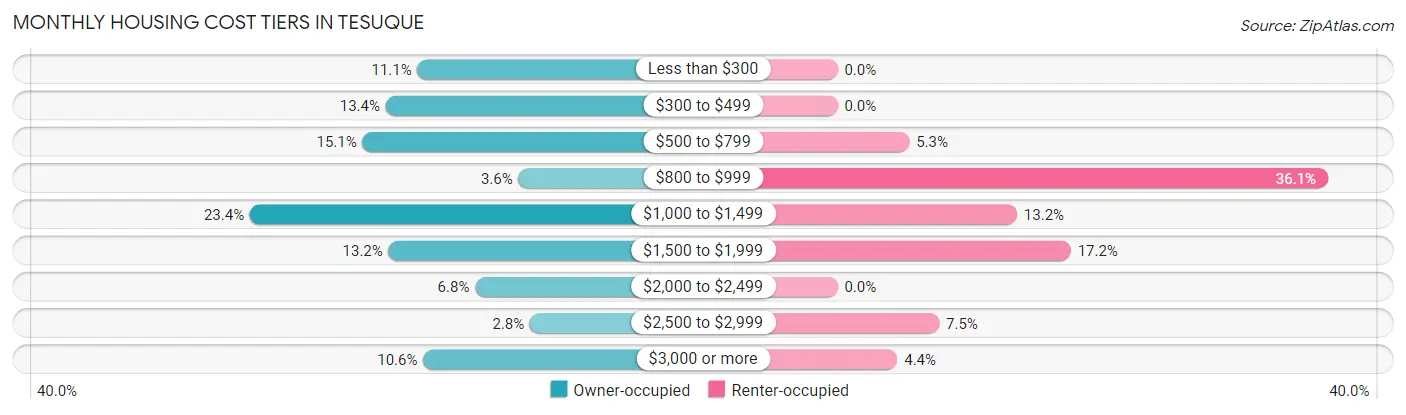
| Monthly Cost | Owner-occupied | Renter-occupied |
| Less than $300 | 52 (11.1%) | 0 (0.0%) |
| $300 to $499 | 63 (13.4%) | 0 (0.0%) |
| $500 to $799 | 71 (15.1%) | 12 (5.3%) |
| $800 to $999 | 17 (3.6%) | 82 (36.1%) |
| $1,000 to $1,499 | 110 (23.4%) | 30 (13.2%) |
| $1,500 to $1,999 | 62 (13.2%) | 39 (17.2%) |
| $2,000 to $2,499 | 32 (6.8%) | 0 (0.0%) |
| $2,500 to $2,999 | 13 (2.8%) | 17 (7.5%) |
| $3,000 or more | 50 (10.6%) | 10 (4.4%) |
| Total | 470 (100.0%) | 227 (100.0%) |
Physical Housing Characteristics in Tesuque
Housing Structures in Tesuque
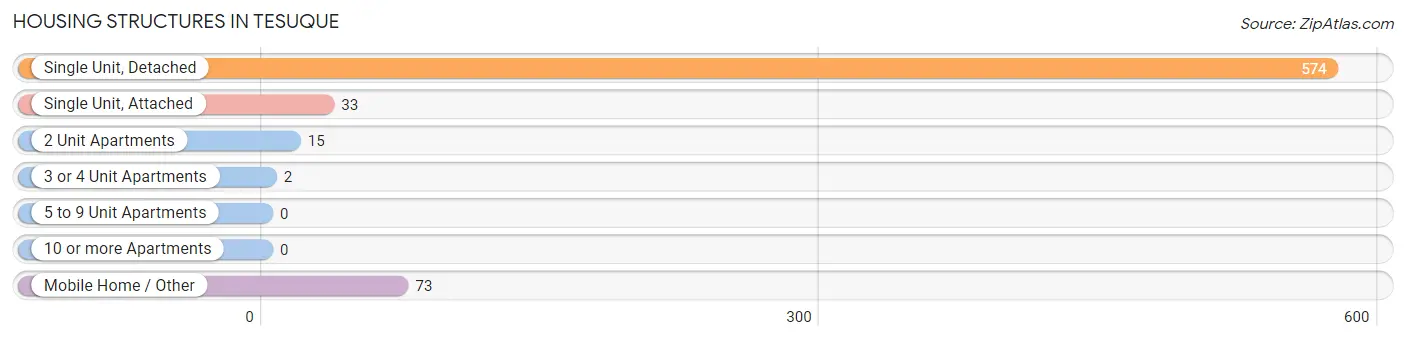
| Structure Type | # Housing Units | % Housing Units |
| Single Unit, Detached | 574 | 82.4% |
| Single Unit, Attached | 33 | 4.7% |
| 2 Unit Apartments | 15 | 2.1% |
| 3 or 4 Unit Apartments | 2 | 0.3% |
| 5 to 9 Unit Apartments | 0 | 0.0% |
| 10 or more Apartments | 0 | 0.0% |
| Mobile Home / Other | 73 | 10.5% |
| Total | 697 | 100.0% |
Housing Structures by Occupancy in Tesuque
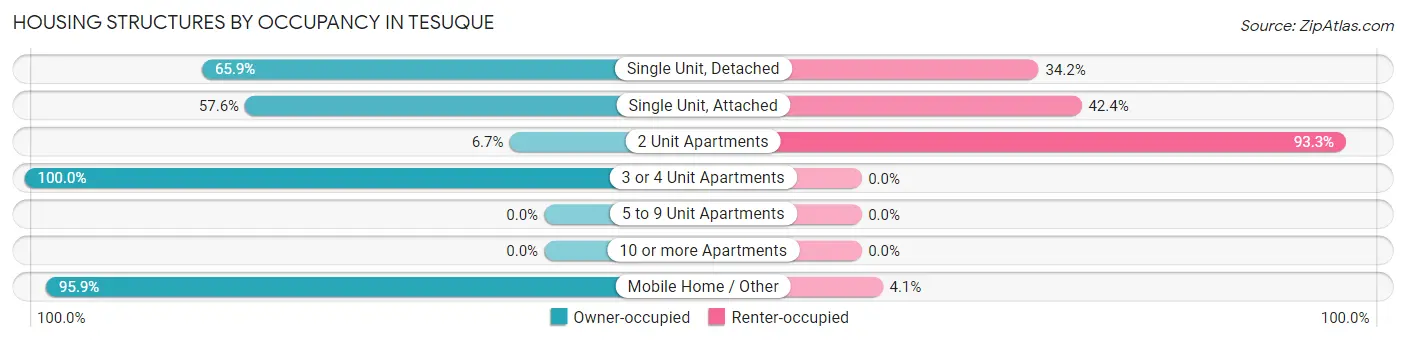
| Structure Type | Owner-occupied | Renter-occupied |
| Single Unit, Detached | 378 (65.8%) | 196 (34.2%) |
| Single Unit, Attached | 19 (57.6%) | 14 (42.4%) |
| 2 Unit Apartments | 1 (6.7%) | 14 (93.3%) |
| 3 or 4 Unit Apartments | 2 (100.0%) | 0 (0.0%) |
| 5 to 9 Unit Apartments | 0 (0.0%) | 0 (0.0%) |
| 10 or more Apartments | 0 (0.0%) | 0 (0.0%) |
| Mobile Home / Other | 70 (95.9%) | 3 (4.1%) |
| Total | 470 (67.4%) | 227 (32.6%) |
Housing Structures by Number of Rooms in Tesuque
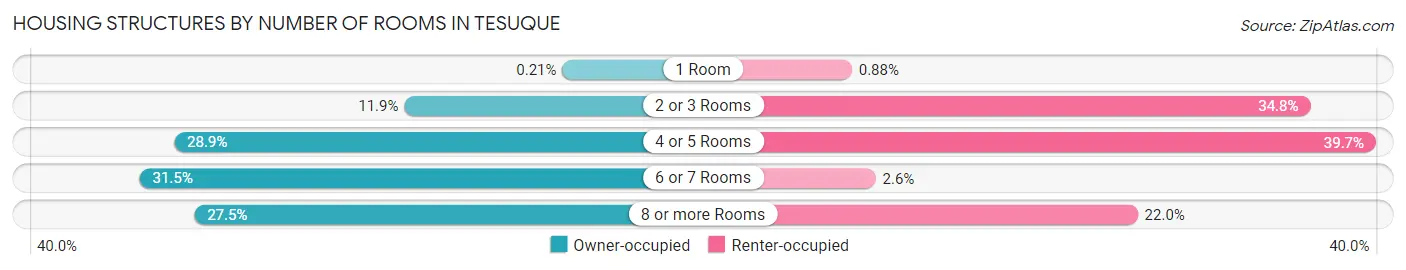
| Number of Rooms | Owner-occupied | Renter-occupied |
| 1 Room | 1 (0.2%) | 2 (0.9%) |
| 2 or 3 Rooms | 56 (11.9%) | 79 (34.8%) |
| 4 or 5 Rooms | 136 (28.9%) | 90 (39.7%) |
| 6 or 7 Rooms | 148 (31.5%) | 6 (2.6%) |
| 8 or more Rooms | 129 (27.5%) | 50 (22.0%) |
| Total | 470 (100.0%) | 227 (100.0%) |
Housing Structure by Heating Type in Tesuque
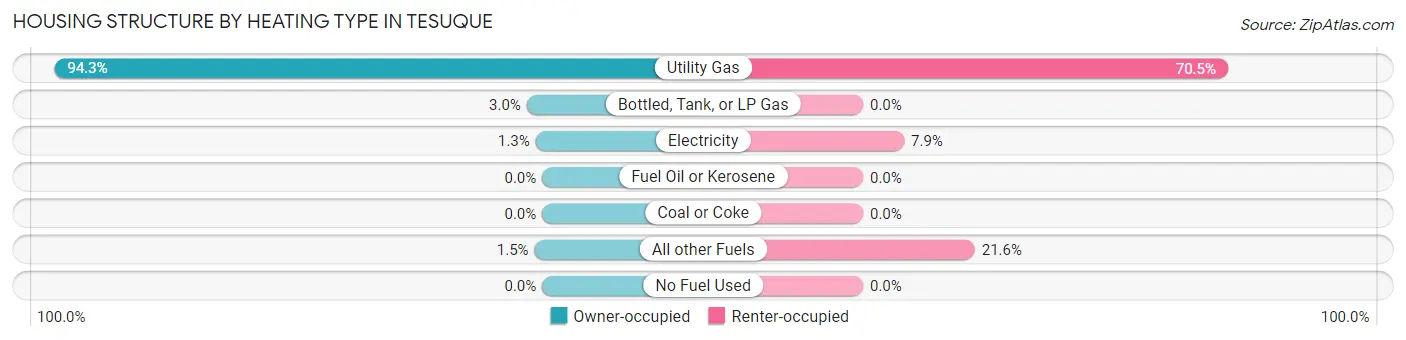
| Heating Type | Owner-occupied | Renter-occupied |
| Utility Gas | 443 (94.3%) | 160 (70.5%) |
| Bottled, Tank, or LP Gas | 14 (3.0%) | 0 (0.0%) |
| Electricity | 6 (1.3%) | 18 (7.9%) |
| Fuel Oil or Kerosene | 0 (0.0%) | 0 (0.0%) |
| Coal or Coke | 0 (0.0%) | 0 (0.0%) |
| All other Fuels | 7 (1.5%) | 49 (21.6%) |
| No Fuel Used | 0 (0.0%) | 0 (0.0%) |
| Total | 470 (100.0%) | 227 (100.0%) |
Household Vehicle Usage in Tesuque
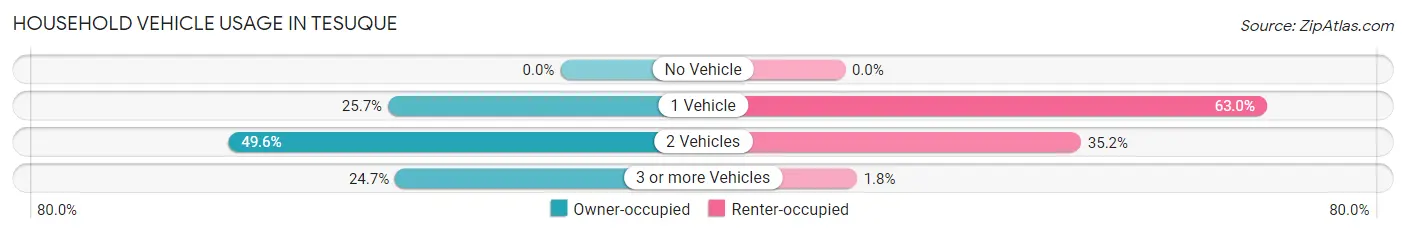
| Vehicles per Household | Owner-occupied | Renter-occupied |
| No Vehicle | 0 (0.0%) | 0 (0.0%) |
| 1 Vehicle | 121 (25.7%) | 143 (63.0%) |
| 2 Vehicles | 233 (49.6%) | 80 (35.2%) |
| 3 or more Vehicles | 116 (24.7%) | 4 (1.8%) |
| Total | 470 (100.0%) | 227 (100.0%) |
Real Estate & Mortgages in Tesuque
Real Estate and Mortgage Overview in Tesuque
| Characteristic | Without Mortgage | With Mortgage |
| Housing Units | 354 | 116 |
| Median Property Value | $812,500 | $906,300 |
| Median Household Income | $63,750 | $46 |
| Monthly Housing Costs | $779 | $50 |
| Real Estate Taxes | $3,469 | $0 |
Property Value by Mortgage Status in Tesuque
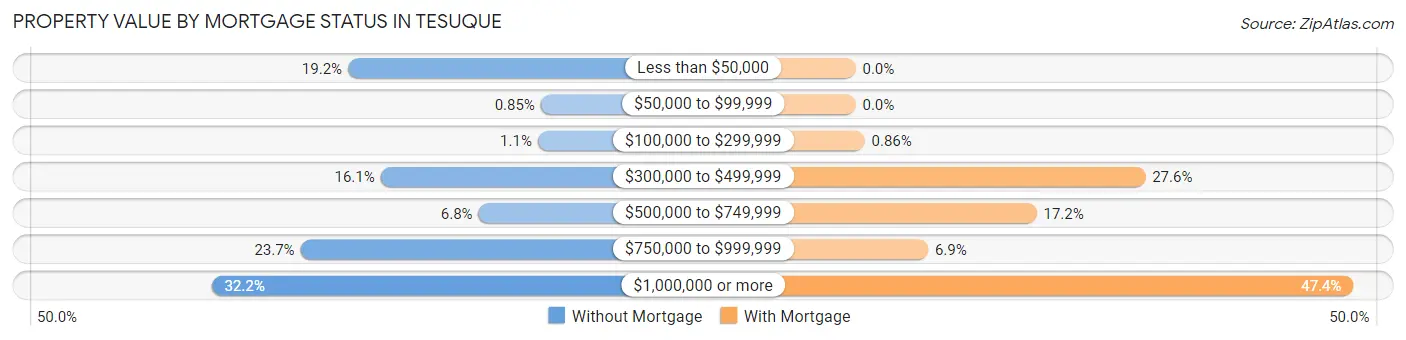
| Property Value | Without Mortgage | With Mortgage |
| Less than $50,000 | 68 (19.2%) | 0 (0.0%) |
| $50,000 to $99,999 | 3 (0.9%) | 0 (0.0%) |
| $100,000 to $299,999 | 4 (1.1%) | 1 (0.9%) |
| $300,000 to $499,999 | 57 (16.1%) | 32 (27.6%) |
| $500,000 to $749,999 | 24 (6.8%) | 20 (17.2%) |
| $750,000 to $999,999 | 84 (23.7%) | 8 (6.9%) |
| $1,000,000 or more | 114 (32.2%) | 55 (47.4%) |
| Total | 354 (100.0%) | 116 (100.0%) |
Household Income by Mortgage Status in Tesuque
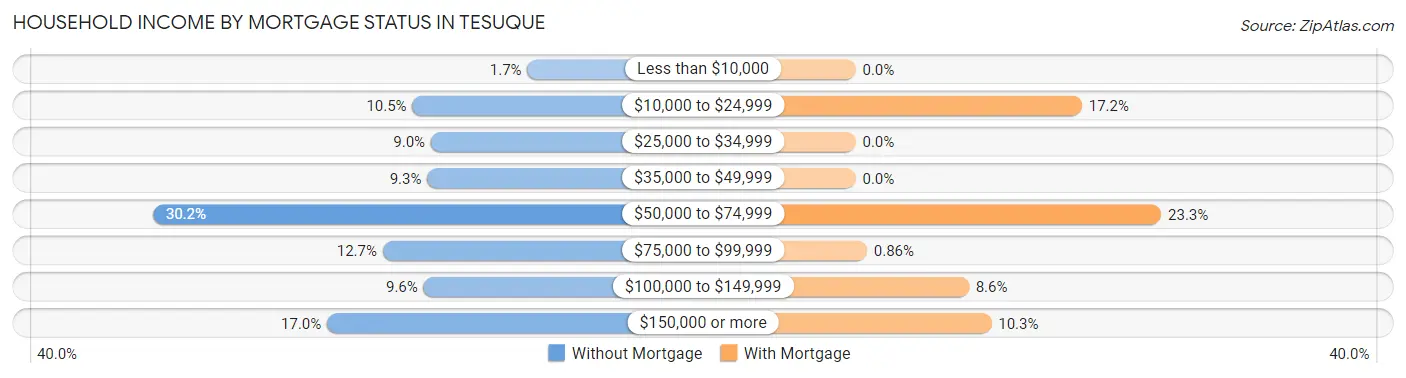
| Household Income | Without Mortgage | With Mortgage |
| Less than $10,000 | 6 (1.7%) | 0 (0.0%) |
| $10,000 to $24,999 | 37 (10.4%) | 20 (17.2%) |
| $25,000 to $34,999 | 32 (9.0%) | 0 (0.0%) |
| $35,000 to $49,999 | 33 (9.3%) | 0 (0.0%) |
| $50,000 to $74,999 | 107 (30.2%) | 27 (23.3%) |
| $75,000 to $99,999 | 45 (12.7%) | 1 (0.9%) |
| $100,000 to $149,999 | 34 (9.6%) | 10 (8.6%) |
| $150,000 or more | 60 (17.0%) | 12 (10.3%) |
| Total | 354 (100.0%) | 116 (100.0%) |
Property Value to Household Income Ratio in Tesuque
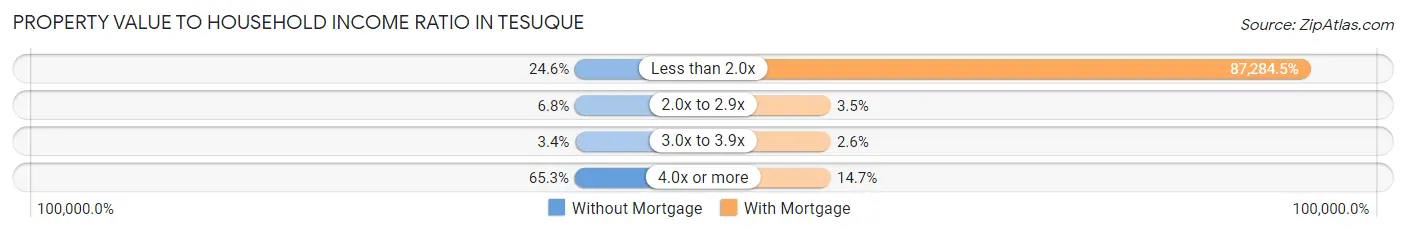
| Value-to-Income Ratio | Without Mortgage | With Mortgage |
| Less than 2.0x | 87 (24.6%) | 101,250 (87,284.5%) |
| 2.0x to 2.9x | 24 (6.8%) | 4 (3.5%) |
| 3.0x to 3.9x | 12 (3.4%) | 3 (2.6%) |
| 4.0x or more | 231 (65.2%) | 17 (14.7%) |
| Total | 354 (100.0%) | 116 (100.0%) |
Real Estate Taxes by Mortgage Status in Tesuque
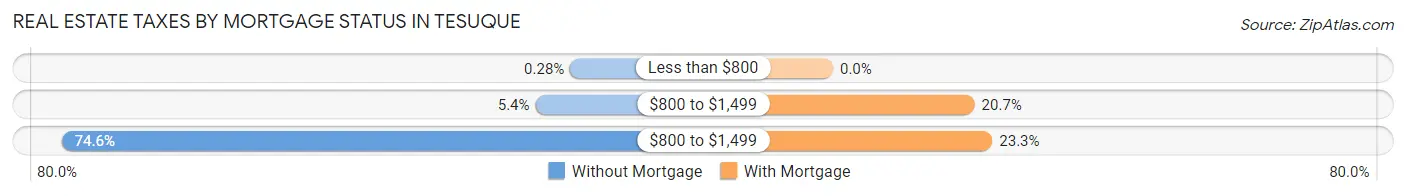
| Property Taxes | Without Mortgage | With Mortgage |
| Less than $800 | 1 (0.3%) | 0 (0.0%) |
| $800 to $1,499 | 19 (5.4%) | 24 (20.7%) |
| $800 to $1,499 | 264 (74.6%) | 27 (23.3%) |
| Total | 354 (100.0%) | 116 (100.0%) |
Health & Disability in Tesuque
Health Insurance Coverage by Age in Tesuque
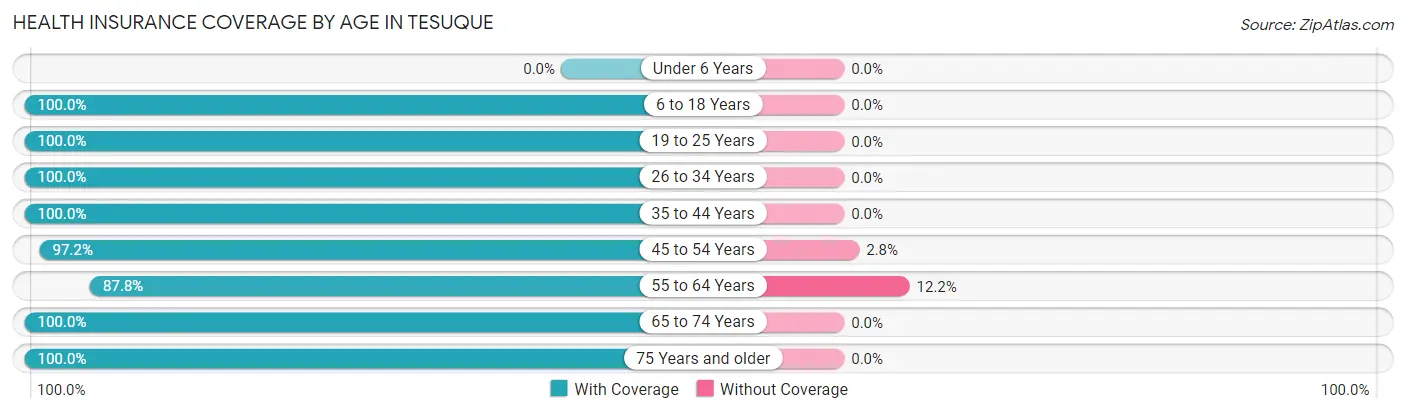
| Age Bracket | With Coverage | Without Coverage |
| Under 6 Years | 0 (0.0%) | 0 (0.0%) |
| 6 to 18 Years | 54 (100.0%) | 0 (0.0%) |
| 19 to 25 Years | 2 (100.0%) | 0 (0.0%) |
| 26 to 34 Years | 54 (100.0%) | 0 (0.0%) |
| 35 to 44 Years | 41 (100.0%) | 0 (0.0%) |
| 45 to 54 Years | 139 (97.2%) | 4 (2.8%) |
| 55 to 64 Years | 209 (87.8%) | 29 (12.2%) |
| 65 to 74 Years | 361 (100.0%) | 0 (0.0%) |
| 75 Years and older | 230 (100.0%) | 0 (0.0%) |
| Total | 1,090 (97.1%) | 33 (2.9%) |
Health Insurance Coverage by Citizenship Status in Tesuque

| Citizenship Status | With Coverage | Without Coverage |
| Native Born | 0 (0.0%) | 0 (0.0%) |
| Foreign Born, Citizen | 54 (100.0%) | 0 (0.0%) |
| Foreign Born, not a Citizen | 2 (100.0%) | 0 (0.0%) |
Health Insurance Coverage by Household Income in Tesuque
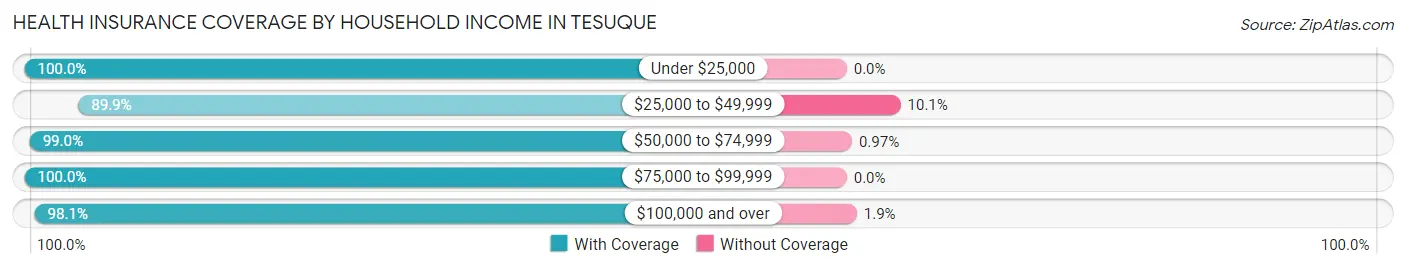
| Household Income | With Coverage | Without Coverage |
| Under $25,000 | 165 (100.0%) | 0 (0.0%) |
| $25,000 to $49,999 | 214 (89.9%) | 24 (10.1%) |
| $50,000 to $74,999 | 205 (99.0%) | 2 (1.0%) |
| $75,000 to $99,999 | 142 (100.0%) | 0 (0.0%) |
| $100,000 and over | 364 (98.1%) | 7 (1.9%) |
Public vs Private Health Insurance Coverage by Age in Tesuque
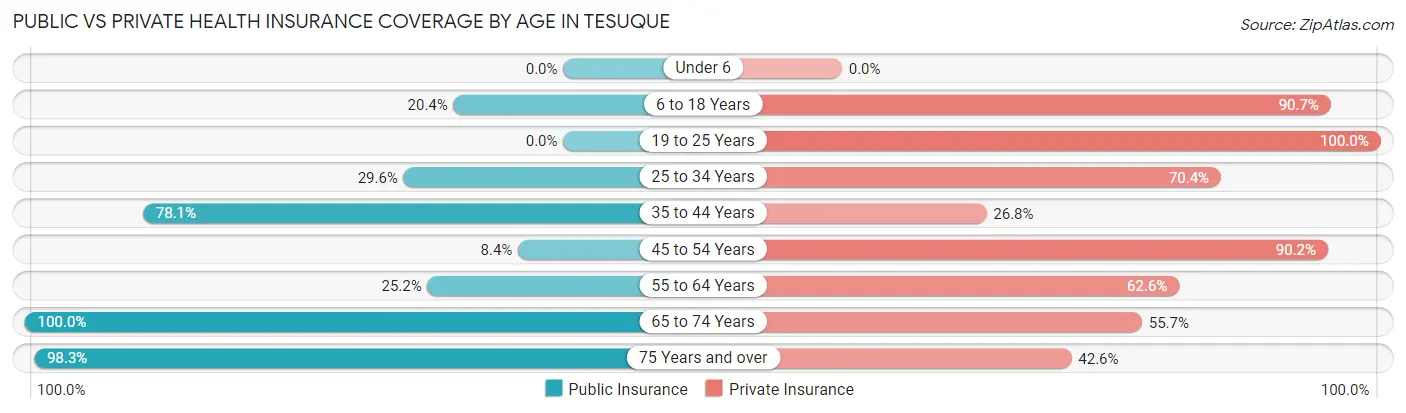
| Age Bracket | Public Insurance | Private Insurance |
| Under 6 | 0 (0.0%) | 0 (0.0%) |
| 6 to 18 Years | 11 (20.4%) | 49 (90.7%) |
| 19 to 25 Years | 0 (0.0%) | 2 (100.0%) |
| 25 to 34 Years | 16 (29.6%) | 38 (70.4%) |
| 35 to 44 Years | 32 (78.0%) | 11 (26.8%) |
| 45 to 54 Years | 12 (8.4%) | 129 (90.2%) |
| 55 to 64 Years | 60 (25.2%) | 149 (62.6%) |
| 65 to 74 Years | 361 (100.0%) | 201 (55.7%) |
| 75 Years and over | 226 (98.3%) | 98 (42.6%) |
| Total | 718 (63.9%) | 677 (60.3%) |
Disability Status by Sex by Age in Tesuque
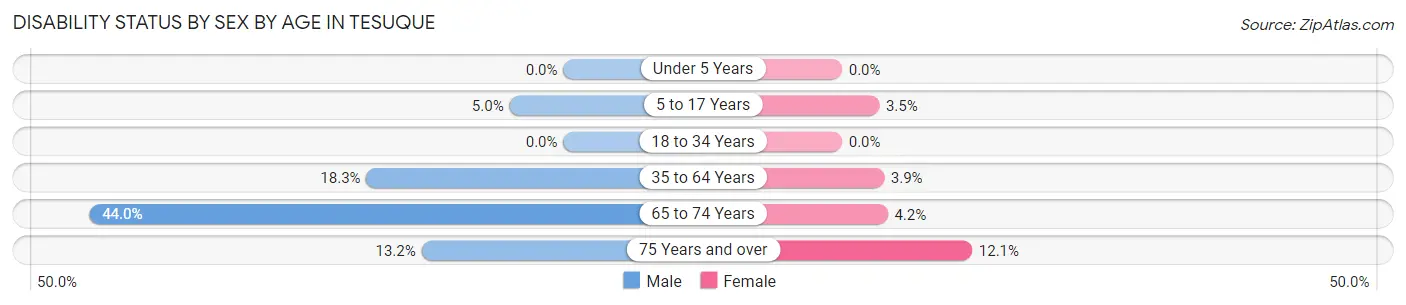
| Age Bracket | Male | Female |
| Under 5 Years | 0 (0.0%) | 0 (0.0%) |
| 5 to 17 Years | 1 (5.0%) | 1 (3.5%) |
| 18 to 34 Years | 0 (0.0%) | 0 (0.0%) |
| 35 to 64 Years | 49 (18.3%) | 6 (3.9%) |
| 65 to 74 Years | 55 (44.0%) | 10 (4.2%) |
| 75 Years and over | 15 (13.2%) | 14 (12.1%) |
Disability Class by Sex by Age in Tesuque
Disability Class: Hearing Difficulty
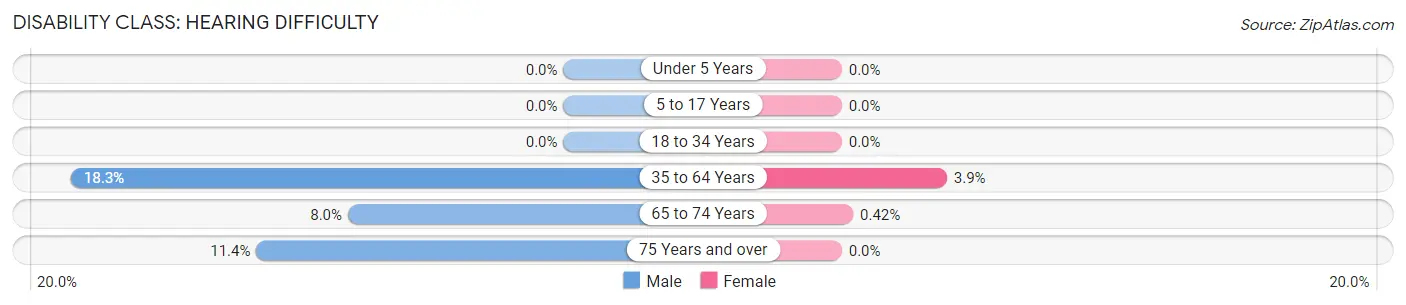
| Age Bracket | Male | Female |
| Under 5 Years | 0 (0.0%) | 0 (0.0%) |
| 5 to 17 Years | 0 (0.0%) | 0 (0.0%) |
| 18 to 34 Years | 0 (0.0%) | 0 (0.0%) |
| 35 to 64 Years | 49 (18.3%) | 6 (3.9%) |
| 65 to 74 Years | 10 (8.0%) | 1 (0.4%) |
| 75 Years and over | 13 (11.4%) | 0 (0.0%) |
Disability Class: Vision Difficulty
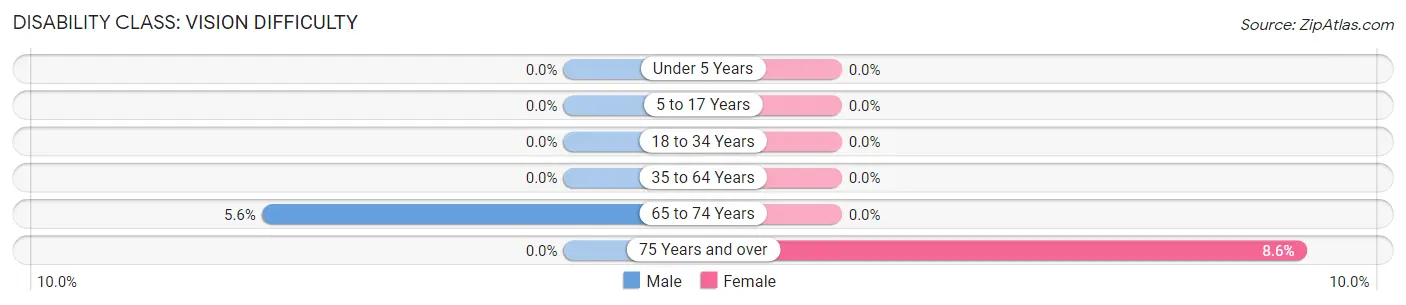
| Age Bracket | Male | Female |
| Under 5 Years | 0 (0.0%) | 0 (0.0%) |
| 5 to 17 Years | 0 (0.0%) | 0 (0.0%) |
| 18 to 34 Years | 0 (0.0%) | 0 (0.0%) |
| 35 to 64 Years | 0 (0.0%) | 0 (0.0%) |
| 65 to 74 Years | 7 (5.6%) | 0 (0.0%) |
| 75 Years and over | 0 (0.0%) | 10 (8.6%) |
Disability Class: Cognitive Difficulty
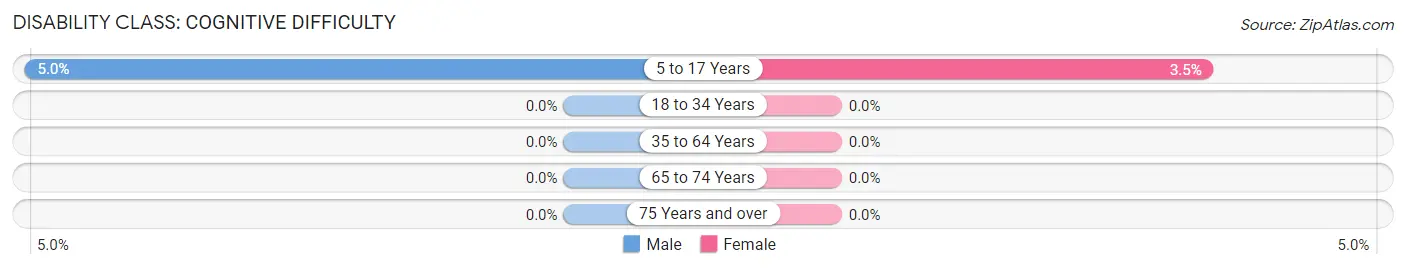
| Age Bracket | Male | Female |
| 5 to 17 Years | 1 (5.0%) | 1 (3.5%) |
| 18 to 34 Years | 0 (0.0%) | 0 (0.0%) |
| 35 to 64 Years | 0 (0.0%) | 0 (0.0%) |
| 65 to 74 Years | 0 (0.0%) | 0 (0.0%) |
| 75 Years and over | 0 (0.0%) | 0 (0.0%) |
Disability Class: Ambulatory Difficulty
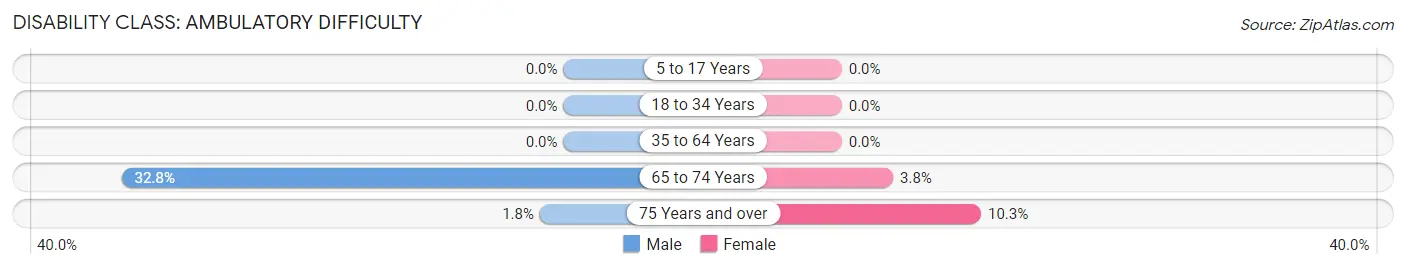
| Age Bracket | Male | Female |
| 5 to 17 Years | 0 (0.0%) | 0 (0.0%) |
| 18 to 34 Years | 0 (0.0%) | 0 (0.0%) |
| 35 to 64 Years | 0 (0.0%) | 0 (0.0%) |
| 65 to 74 Years | 41 (32.8%) | 9 (3.8%) |
| 75 Years and over | 2 (1.8%) | 12 (10.3%) |
Disability Class: Self-Care Difficulty

| Age Bracket | Male | Female |
| 5 to 17 Years | 0 (0.0%) | 0 (0.0%) |
| 18 to 34 Years | 0 (0.0%) | 0 (0.0%) |
| 35 to 64 Years | 0 (0.0%) | 0 (0.0%) |
| 65 to 74 Years | 0 (0.0%) | 0 (0.0%) |
| 75 Years and over | 0 (0.0%) | 0 (0.0%) |
Technology Access in Tesuque
Computing Device Access in Tesuque
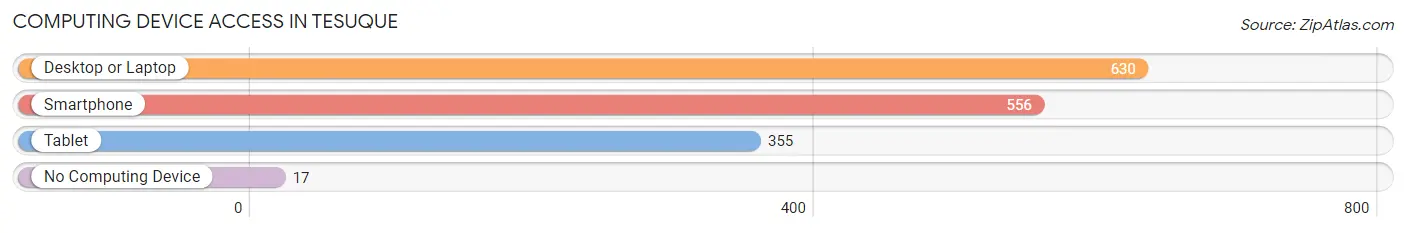
| Device Type | # Households | % Households |
| Desktop or Laptop | 630 | 90.4% |
| Smartphone | 556 | 79.8% |
| Tablet | 355 | 50.9% |
| No Computing Device | 17 | 2.4% |
| Total | 697 | 100.0% |
Internet Access in Tesuque
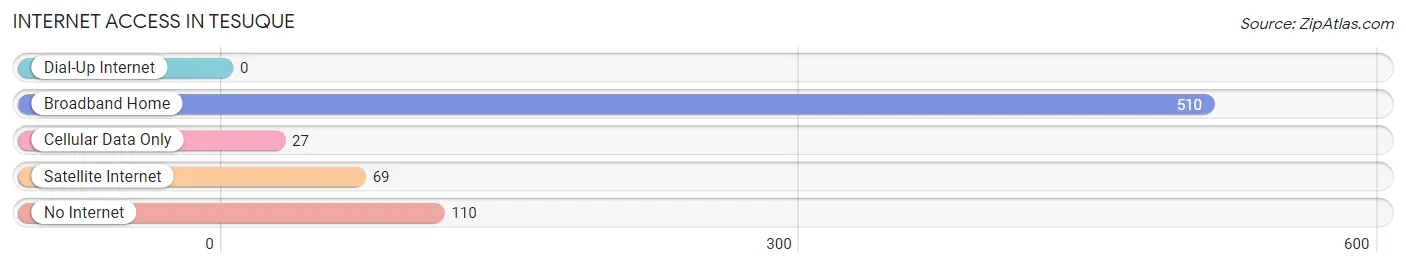
| Internet Type | # Households | % Households |
| Dial-Up Internet | 0 | 0.0% |
| Broadband Home | 510 | 73.2% |
| Cellular Data Only | 27 | 3.9% |
| Satellite Internet | 69 | 9.9% |
| No Internet | 110 | 15.8% |
| Total | 697 | 100.0% |
Tesuque Summary
Tesuque, New Mexico is a small unincorporated community located in Santa Fe County, New Mexico. It is situated in the foothills of the Sangre de Cristo Mountains, approximately 8 miles north of Santa Fe. The population of Tesuque was estimated to be around 1,000 in 2020.
History
Tesuque has a long and rich history that dates back to the Pueblo Indians who inhabited the area for centuries. The Pueblo Indians were the first to settle in the area, and they established a village in the Tesuque Valley. The Pueblo Indians were known for their farming and trading skills, and they were also known for their pottery and jewelry making.
The first Europeans to arrive in the area were Spanish explorers in the late 1500s. The Spanish established a mission in the area, and they also built a fort. The fort was used to protect the Spanish settlers from the Pueblo Indians.
In the late 1800s, the area was settled by Anglo-Americans. The Anglo-Americans established a trading post and a post office in the area. The trading post was used to trade goods with the Pueblo Indians, and the post office was used to send mail to and from the area.
In the early 1900s, the area was settled by Mexican immigrants. The Mexican immigrants established a small village in the area, and they also established a school. The school was used to teach the Mexican children about the Spanish language and culture.
Geography
Tesuque is located in the foothills of the Sangre de Cristo Mountains, approximately 8 miles north of Santa Fe. The area is known for its beautiful scenery, with rolling hills, lush forests, and stunning views of the mountains. The area is also known for its mild climate, with temperatures ranging from the mid-50s in the winter to the mid-80s in the summer.
The area is home to several parks and recreational areas, including the Tesuque Pueblo Nature Preserve, the Tesuque Wildlife Refuge, and the Tesuque River. The area is also home to several historic sites, including the Tesuque Pueblo, the Tesuque Mission, and the Tesuque Trading Post.
Economy
The economy of Tesuque is largely based on tourism and agriculture. The area is home to several tourist attractions, including the Tesuque Pueblo Nature Preserve, the Tesuque Wildlife Refuge, and the Tesuque River. The area is also home to several wineries, and the area is known for its production of high-quality wines.
Agriculture is also an important part of the economy of Tesuque. The area is home to several farms, and the area is known for its production of apples, peaches, and other fruits and vegetables. The area is also known for its production of wool, and the area is home to several sheep farms.
Demographics
The population of Tesuque was estimated to be around 1,000 in 2020. The majority of the population is of Hispanic or Latino descent, and the majority of the population speaks Spanish as their primary language. The area is also home to a small Native American population, and the area is home to several Pueblo Indian tribes.
The median household income in Tesuque is around $50,000, and the median home value is around $200,000. The area is known for its low cost of living, and the area is home to several affordable housing options. The area is also known for its low crime rate, and the area is considered to be a safe place to live.
Common Questions
What is Per Capita Income in Tesuque?
Per Capita income in Tesuque is $63,445.
What is the Median Family Income in Tesuque?
Median Family Income in Tesuque is $96,250.
What is the Median Household income in Tesuque?
Median Household Income in Tesuque is $56,250.
What is Income or Wage Gap in Tesuque?
Income or Wage Gap in Tesuque is 4.7%.
Women in Tesuque earn 95.3 cents for every dollar earned by a man.
What is Inequality or Gini Index in Tesuque?
Inequality or Gini Index in Tesuque is 0.60.
What is the Total Population of Tesuque?
Total Population of Tesuque is 1,123.
What is the Total Male Population of Tesuque?
Total Male Population of Tesuque is 564.
What is the Total Female Population of Tesuque?
Total Female Population of Tesuque is 559.
What is the Ratio of Males per 100 Females in Tesuque?
There are 100.89 Males per 100 Females in Tesuque.
What is the Ratio of Females per 100 Males in Tesuque?
There are 99.11 Females per 100 Males in Tesuque.
What is the Median Population Age in Tesuque?
Median Population Age in Tesuque is 66.3 Years.
What is the Average Family Size in Tesuque
Average Family Size in Tesuque is 2.2 People.
What is the Average Household Size in Tesuque
Average Household Size in Tesuque is 1.6 People.
How Large is the Labor Force in Tesuque?
There are 355 People in the Labor Forcein in Tesuque.
What is the Percentage of People in the Labor Force in Tesuque?
32.2% of People are in the Labor Force in Tesuque.
What is the Unemployment Rate in Tesuque?
Unemployment Rate in Tesuque is 8.2%.