Rio Lucio, NM Map & Demographics
Rio Lucio Map
Rio Lucio Overview
$25,009
PER CAPITA INCOME
$50,000
AVG FAMILY INCOME
$43,750
AVG HOUSEHOLD INCOME
4.6%
WAGE / INCOME GAP [ % ]
95.4¢/ $1
WAGE / INCOME GAP [ $ ]
0.44
INEQUALITY / GINI INDEX
621
TOTAL POPULATION
388
MALE POPULATION
233
FEMALE POPULATION
166.52
MALES / 100 FEMALES
60.05
FEMALES / 100 MALES
38.6
MEDIAN AGE
5.0
AVG FAMILY SIZE
3.2
AVG HOUSEHOLD SIZE
229
LABOR FORCE [ PEOPLE ]
46.9%
PERCENT IN LABOR FORCE
7.4%
UNEMPLOYMENT RATE
Income in Rio Lucio
Income Overview in Rio Lucio
Per Capita Income in Rio Lucio is $25,009, while median incomes of families and households are $50,000 and $43,750 respectively.
| Characteristic | Number | Measure |
| Per Capita Income | 621 | $25,009 |
| Median Family Income | 104 | $50,000 |
| Mean Family Income | 104 | $72,033 |
| Median Household Income | 195 | $43,750 |
| Mean Household Income | 195 | $62,052 |
| Income Deficit | 104 | $0 |
| Wage / Income Gap (%) | 621 | 4.61% |
| Wage / Income Gap ($) | 621 | 95.39¢ per $1 |
| Gini / Inequality Index | 621 | 0.44 |
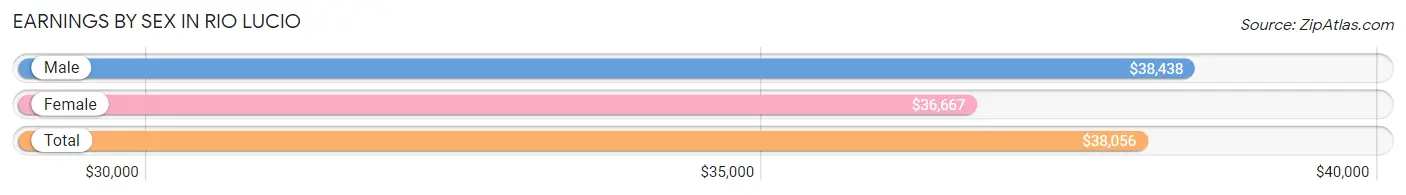
Earnings by Sex in Rio Lucio
Average Earnings in Rio Lucio are $38,056, $38,438 for men and $36,667 for women, a difference of 4.6%.
| Sex | Number | Average Earnings |
| Male | 132 (57.4%) | $38,438 |
| Female | 98 (42.6%) | $36,667 |
| Total | 230 (100.0%) | $38,056 |
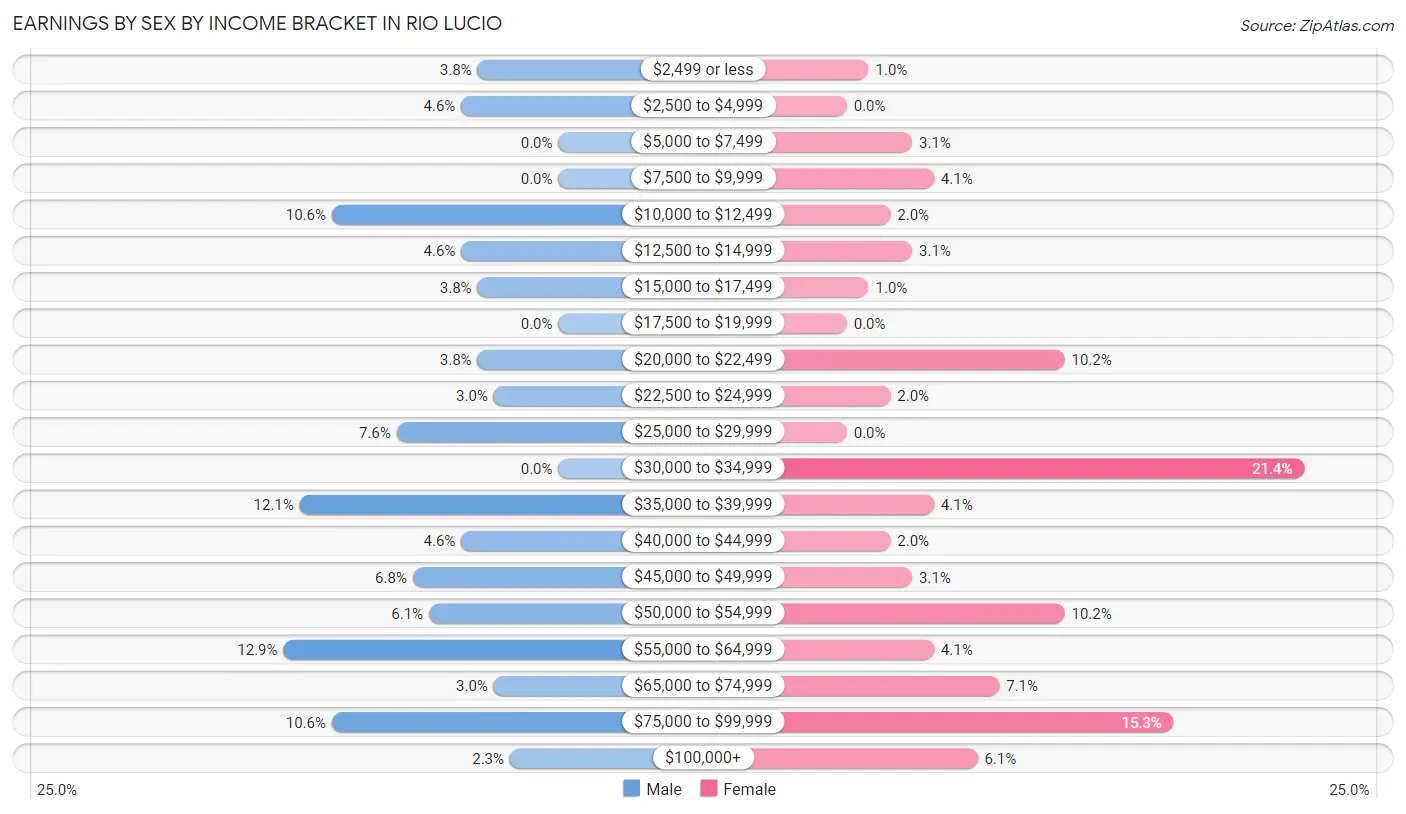
Earnings by Sex by Income Bracket in Rio Lucio
The most common earnings brackets in Rio Lucio are $55,000 to $64,999 for men (17 | 12.9%) and $30,000 to $34,999 for women (21 | 21.4%).
| Income | Male | Female |
| $2,499 or less | 5 (3.8%) | 1 (1.0%) |
| $2,500 to $4,999 | 6 (4.5%) | 0 (0.0%) |
| $5,000 to $7,499 | 0 (0.0%) | 3 (3.1%) |
| $7,500 to $9,999 | 0 (0.0%) | 4 (4.1%) |
| $10,000 to $12,499 | 14 (10.6%) | 2 (2.0%) |
| $12,500 to $14,999 | 6 (4.5%) | 3 (3.1%) |
| $15,000 to $17,499 | 5 (3.8%) | 1 (1.0%) |
| $17,500 to $19,999 | 0 (0.0%) | 0 (0.0%) |
| $20,000 to $22,499 | 5 (3.8%) | 10 (10.2%) |
| $22,500 to $24,999 | 4 (3.0%) | 2 (2.0%) |
| $25,000 to $29,999 | 10 (7.6%) | 0 (0.0%) |
| $30,000 to $34,999 | 0 (0.0%) | 21 (21.4%) |
| $35,000 to $39,999 | 16 (12.1%) | 4 (4.1%) |
| $40,000 to $44,999 | 6 (4.5%) | 2 (2.0%) |
| $45,000 to $49,999 | 9 (6.8%) | 3 (3.1%) |
| $50,000 to $54,999 | 8 (6.1%) | 10 (10.2%) |
| $55,000 to $64,999 | 17 (12.9%) | 4 (4.1%) |
| $65,000 to $74,999 | 4 (3.0%) | 7 (7.1%) |
| $75,000 to $99,999 | 14 (10.6%) | 15 (15.3%) |
| $100,000+ | 3 (2.3%) | 6 (6.1%) |
| Total | 132 (100.0%) | 98 (100.0%) |
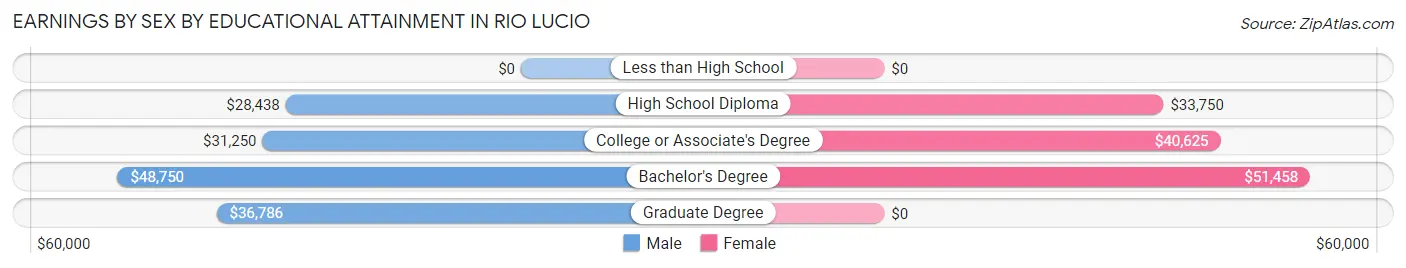
Earnings by Sex by Educational Attainment in Rio Lucio
Average earnings in Rio Lucio are $36,250 for men and $45,000 for women, a difference of 19.4%. Men with an educational attainment of bachelor's degree enjoy the highest average annual earnings of $48,750, while those with high school diploma education earn the least with $28,438. Women with an educational attainment of bachelor's degree earn the most with the average annual earnings of $51,458, while those with high school diploma education have the smallest earnings of $33,750.
| Educational Attainment | Male Income | Female Income |
| Less than High School | - | - |
| High School Diploma | $28,438 | $33,750 |
| College or Associate's Degree | $31,250 | $40,625 |
| Bachelor's Degree | $48,750 | $51,458 |
| Graduate Degree | $36,786 | $0 |
| Total | $36,250 | $45,000 |
Family Income in Rio Lucio
Family Income Brackets in Rio Lucio
According to the Rio Lucio family income data, there are 32 families falling into the $35,000 to $49,999 income range, which is the most common income bracket and makes up 30.8% of all families.
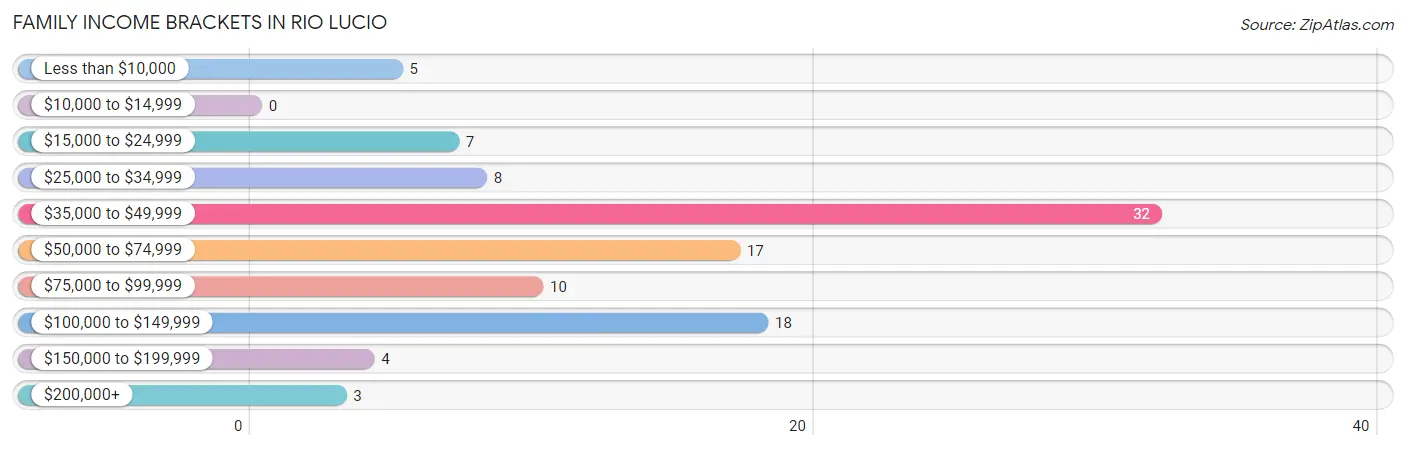
| Income Bracket | # Families | % Families |
| Less than $10,000 | 5 | 4.8% |
| $10,000 to $14,999 | 0 | 0.0% |
| $15,000 to $24,999 | 7 | 6.7% |
| $25,000 to $34,999 | 8 | 7.7% |
| $35,000 to $49,999 | 32 | 30.8% |
| $50,000 to $74,999 | 17 | 16.3% |
| $75,000 to $99,999 | 10 | 9.6% |
| $100,000 to $149,999 | 18 | 17.3% |
| $150,000 to $199,999 | 4 | 3.8% |
| $200,000+ | 3 | 2.9% |
Family Income by Famaliy Size in Rio Lucio
4-person families (16 | 15.4%) account for the highest median family income in Rio Lucio with $80,000 per family, while 2-person families (47 | 45.2%) have the highest median income of $25,375 per family member.
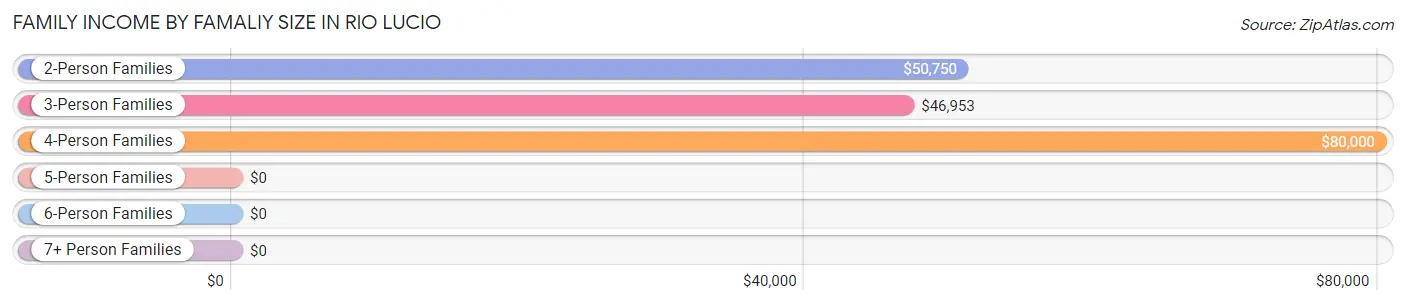
| Income Bracket | # Families | Median Income |
| 2-Person Families | 47 (45.2%) | $50,750 |
| 3-Person Families | 37 (35.6%) | $46,953 |
| 4-Person Families | 16 (15.4%) | $80,000 |
| 5-Person Families | 1 (1.0%) | $0 |
| 6-Person Families | 0 (0.0%) | $0 |
| 7+ Person Families | 3 (2.9%) | $0 |
| Total | 104 (100.0%) | $50,000 |
Family Income by Number of Earners in Rio Lucio
The median family income in Rio Lucio is $50,000, with families comprising 3+ earners (7) having the highest median family income of $180,625, while families with no earners (24) have the lowest median family income of $31,250, accounting for 6.7% and 23.1% of families, respectively.
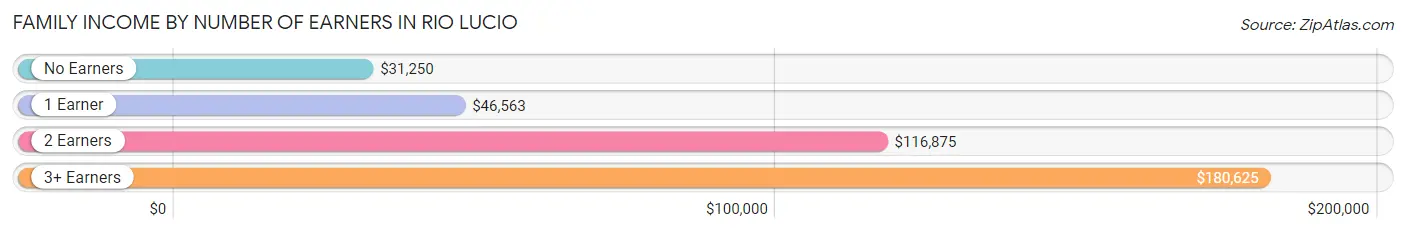
| Number of Earners | # Families | Median Income |
| No Earners | 24 (23.1%) | $31,250 |
| 1 Earner | 46 (44.2%) | $46,563 |
| 2 Earners | 27 (26.0%) | $116,875 |
| 3+ Earners | 7 (6.7%) | $180,625 |
| Total | 104 (100.0%) | $50,000 |
Household Income in Rio Lucio
Household Income Brackets in Rio Lucio
With 57 households falling in the category, the $25,000 to $34,999 income range is the most frequent in Rio Lucio, accounting for 29.2% of all households. In contrast, only 4 households (2.1%) fall into the $150,000 to $199,999 income bracket, making it the least populous group.
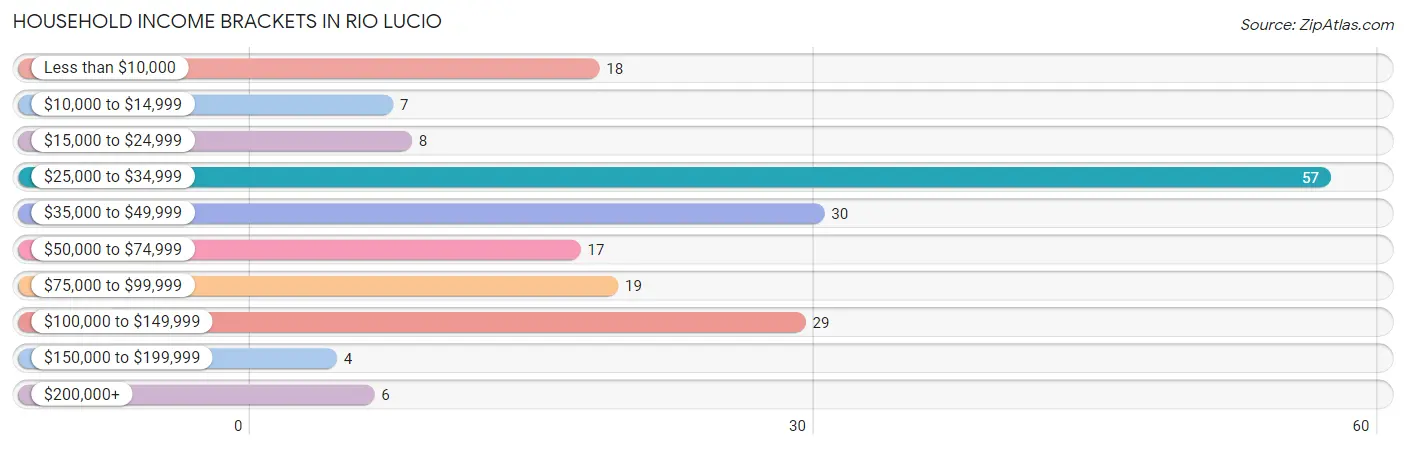
| Income Bracket | # Households | % Households |
| Less than $10,000 | 18 | 9.2% |
| $10,000 to $14,999 | 7 | 3.6% |
| $15,000 to $24,999 | 8 | 4.1% |
| $25,000 to $34,999 | 57 | 29.2% |
| $35,000 to $49,999 | 30 | 15.4% |
| $50,000 to $74,999 | 17 | 8.7% |
| $75,000 to $99,999 | 19 | 9.7% |
| $100,000 to $149,999 | 29 | 14.9% |
| $150,000 to $199,999 | 4 | 2.1% |
| $200,000+ | 6 | 3.1% |
Household Income by Householder Age in Rio Lucio
The median household income in Rio Lucio is $43,750, with the highest median household income of $123,125 found in the 45 to 64 years age bracket for the primary householder. A total of 37 households (19.0%) fall into this category. Meanwhile, the 15 to 24 years age bracket for the primary householder has the lowest median household income of $0, with 2 households (1.0%) in this group.
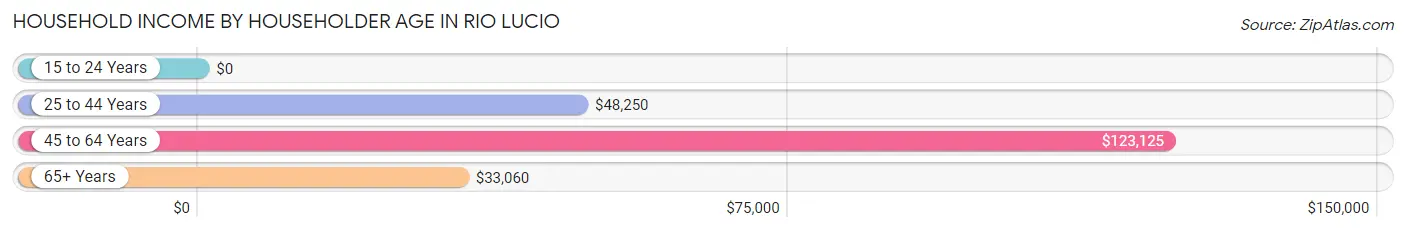
| Income Bracket | # Households | Median Income |
| 15 to 24 Years | 2 (1.0%) | $0 |
| 25 to 44 Years | 51 (26.2%) | $48,250 |
| 45 to 64 Years | 37 (19.0%) | $123,125 |
| 65+ Years | 105 (53.8%) | $33,060 |
| Total | 195 (100.0%) | $43,750 |
Poverty in Rio Lucio
Income Below Poverty by Sex and Age in Rio Lucio
With 13.7% poverty level for males and 10.3% for females among the residents of Rio Lucio, 5 year old males and 75 year old and over females are the most vulnerable to poverty, with 4 males (57.1%) and 16 females (32.7%) in their respective age groups living below the poverty level.
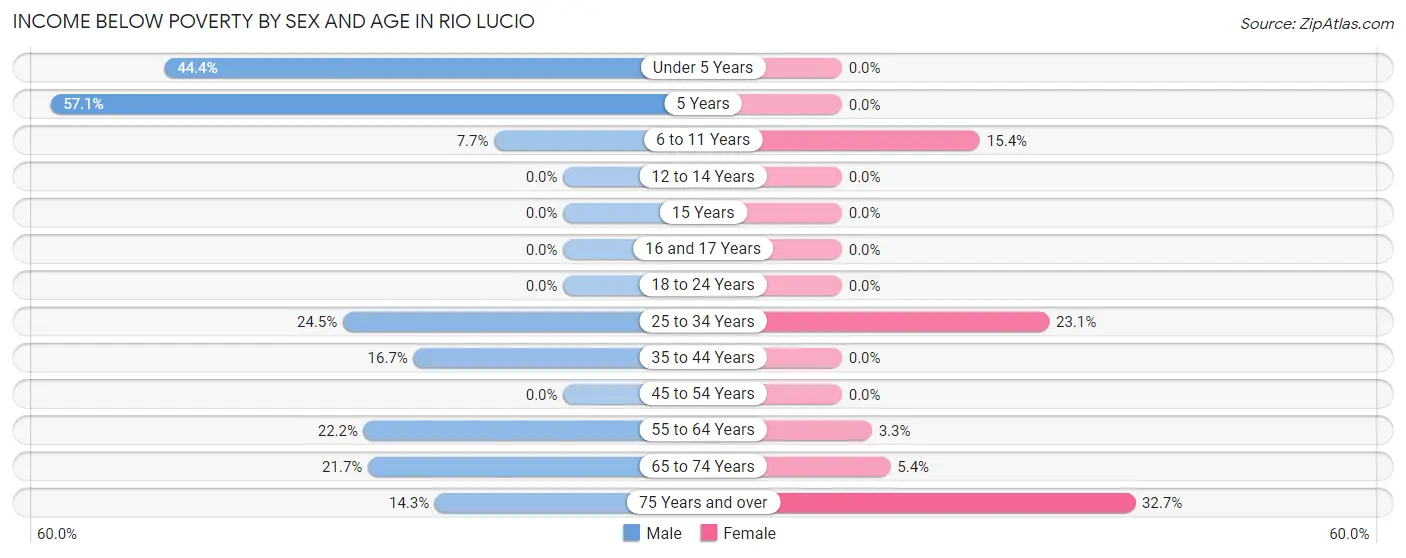
| Age Bracket | Male | Female |
| Under 5 Years | 4 (44.4%) | 0 (0.0%) |
| 5 Years | 4 (57.1%) | 0 (0.0%) |
| 6 to 11 Years | 7 (7.7%) | 2 (15.4%) |
| 12 to 14 Years | 0 (0.0%) | 0 (0.0%) |
| 15 Years | 0 (0.0%) | 0 (0.0%) |
| 16 and 17 Years | 0 (0.0%) | 0 (0.0%) |
| 18 to 24 Years | 0 (0.0%) | 0 (0.0%) |
| 25 to 34 Years | 13 (24.5%) | 3 (23.1%) |
| 35 to 44 Years | 9 (16.7%) | 0 (0.0%) |
| 45 to 54 Years | 0 (0.0%) | 0 (0.0%) |
| 55 to 64 Years | 8 (22.2%) | 1 (3.3%) |
| 65 to 74 Years | 5 (21.7%) | 2 (5.4%) |
| 75 Years and over | 3 (14.3%) | 16 (32.7%) |
| Total | 53 (13.7%) | 24 (10.3%) |
Income Above Poverty by Sex and Age in Rio Lucio
According to the poverty statistics in Rio Lucio, males aged 12 to 14 years and females aged 5 years are the age groups that are most secure financially, with 100.0% of males and 100.0% of females in these age groups living above the poverty line.
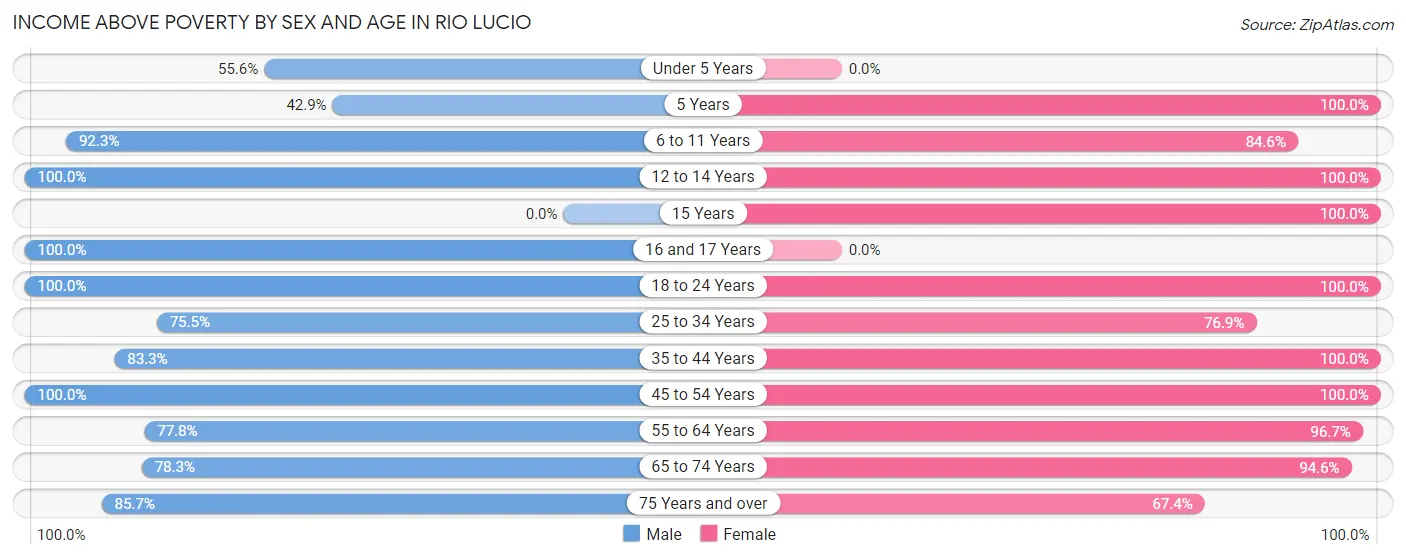
| Age Bracket | Male | Female |
| Under 5 Years | 5 (55.6%) | 0 (0.0%) |
| 5 Years | 3 (42.9%) | 2 (100.0%) |
| 6 to 11 Years | 84 (92.3%) | 11 (84.6%) |
| 12 to 14 Years | 7 (100.0%) | 3 (100.0%) |
| 15 Years | 0 (0.0%) | 1 (100.0%) |
| 16 and 17 Years | 14 (100.0%) | 0 (0.0%) |
| 18 to 24 Years | 63 (100.0%) | 15 (100.0%) |
| 25 to 34 Years | 40 (75.5%) | 10 (76.9%) |
| 35 to 44 Years | 45 (83.3%) | 36 (100.0%) |
| 45 to 54 Years | 10 (100.0%) | 34 (100.0%) |
| 55 to 64 Years | 28 (77.8%) | 29 (96.7%) |
| 65 to 74 Years | 18 (78.3%) | 35 (94.6%) |
| 75 Years and over | 18 (85.7%) | 33 (67.3%) |
| Total | 335 (86.3%) | 209 (89.7%) |
Income Below Poverty Among Married-Couple Families in Rio Lucio
The poverty statistics for married-couple families in Rio Lucio show that 6.5% or 3 of the total 46 families live below the poverty line. Families with no children have the highest poverty rate of 9.4%, comprising of 3 families. On the other hand, families with 1 or 2 children have the lowest poverty rate of 0.0%, which includes 0 families.
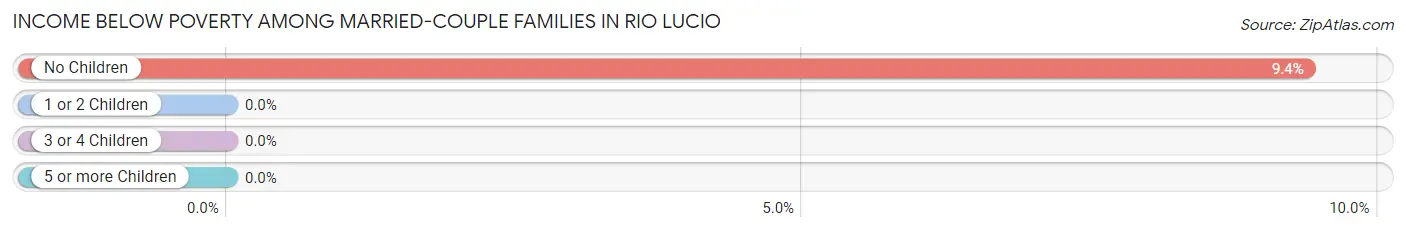
| Children | Above Poverty | Below Poverty |
| No Children | 29 (90.6%) | 3 (9.4%) |
| 1 or 2 Children | 14 (100.0%) | 0 (0.0%) |
| 3 or 4 Children | 0 (0.0%) | 0 (0.0%) |
| 5 or more Children | 0 (0.0%) | 0 (0.0%) |
| Total | 43 (93.5%) | 3 (6.5%) |
Income Below Poverty Among Single-Parent Households in Rio Lucio
According to the poverty data in Rio Lucio, 18.8% or 3 single-father households and 7.1% or 3 single-mother households are living below the poverty line. Among single-father households, those with 1 or 2 children have the highest poverty rate, with 2 households (50.0%) experiencing poverty. Likewise, among single-mother households, those with no children have the highest poverty rate, with 2 households (15.4%) falling below the poverty line.
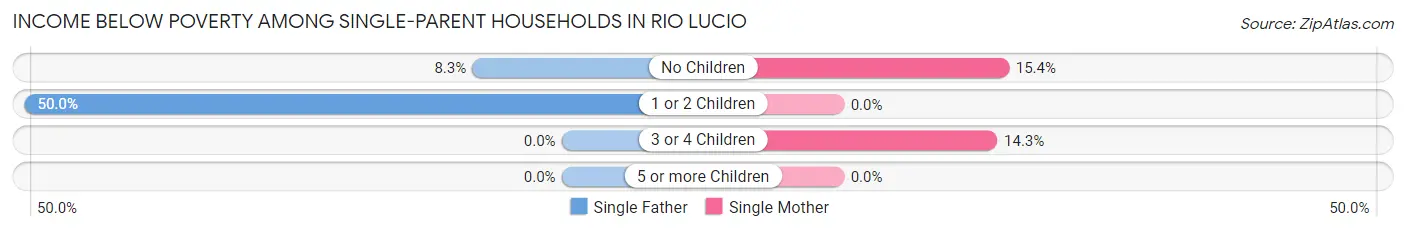
| Children | Single Father | Single Mother |
| No Children | 1 (8.3%) | 2 (15.4%) |
| 1 or 2 Children | 2 (50.0%) | 0 (0.0%) |
| 3 or 4 Children | 0 (0.0%) | 1 (14.3%) |
| 5 or more Children | 0 (0.0%) | 0 (0.0%) |
| Total | 3 (18.8%) | 3 (7.1%) |
Income Below Poverty Among Married-Couple vs Single-Parent Households in Rio Lucio
The poverty data for Rio Lucio shows that 3 of the married-couple family households (6.5%) and 6 of the single-parent households (10.3%) are living below the poverty level. Within the married-couple family households, those with no children have the highest poverty rate, with 3 households (9.4%) falling below the poverty line. Among the single-parent households, those with 3 or 4 children have the highest poverty rate, with 1 household (14.3%) living below poverty.
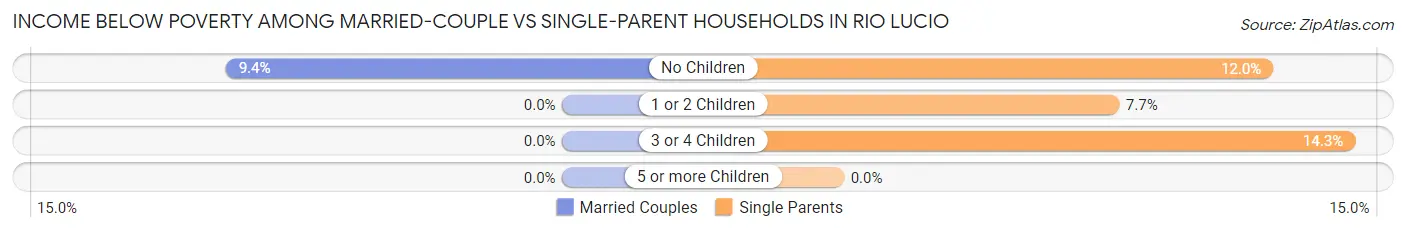
| Children | Married-Couple Families | Single-Parent Households |
| No Children | 3 (9.4%) | 3 (12.0%) |
| 1 or 2 Children | 0 (0.0%) | 2 (7.7%) |
| 3 or 4 Children | 0 (0.0%) | 1 (14.3%) |
| 5 or more Children | 0 (0.0%) | 0 (0.0%) |
| Total | 3 (6.5%) | 6 (10.3%) |
Race in Rio Lucio
The most populous races in Rio Lucio are Hispanic or Latino (589 | 94.9%), Two or more Races (342 | 55.1%), and White / Caucasian (204 | 32.9%).
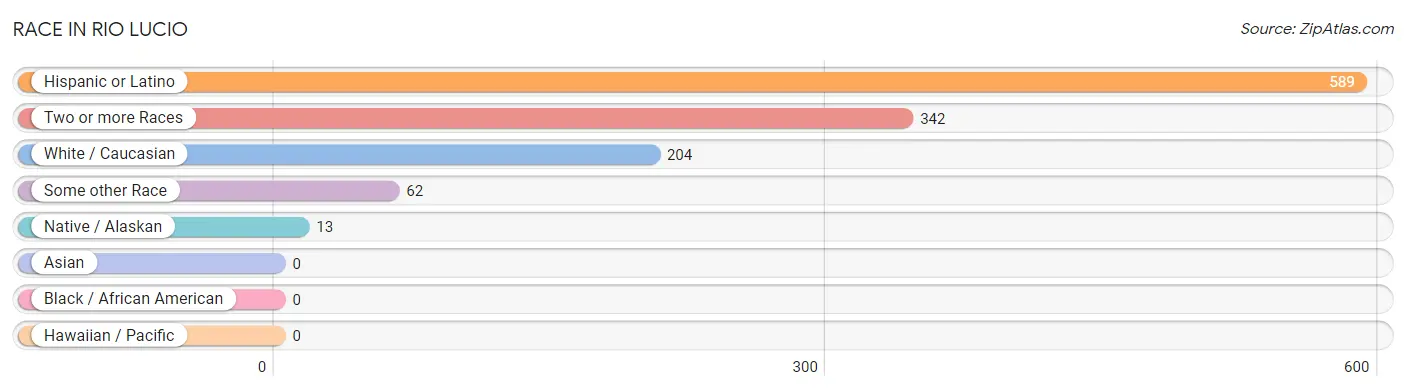
| Race | # Population | % Population |
| Asian | 0 | 0.0% |
| Black / African American | 0 | 0.0% |
| Hawaiian / Pacific | 0 | 0.0% |
| Hispanic or Latino | 589 | 94.9% |
| Native / Alaskan | 13 | 2.1% |
| White / Caucasian | 204 | 32.9% |
| Two or more Races | 342 | 55.1% |
| Some other Race | 62 | 10.0% |
| Total | 621 | 100.0% |
Ancestry in Rio Lucio
The most populous ancestries reported in Rio Lucio are Spanish (320 | 51.5%), Mexican (47 | 7.6%), Spanish American (33 | 5.3%), Pueblo (30 | 4.8%), and European (11 | 1.8%), together accounting for 71.0% of all Rio Lucio residents.
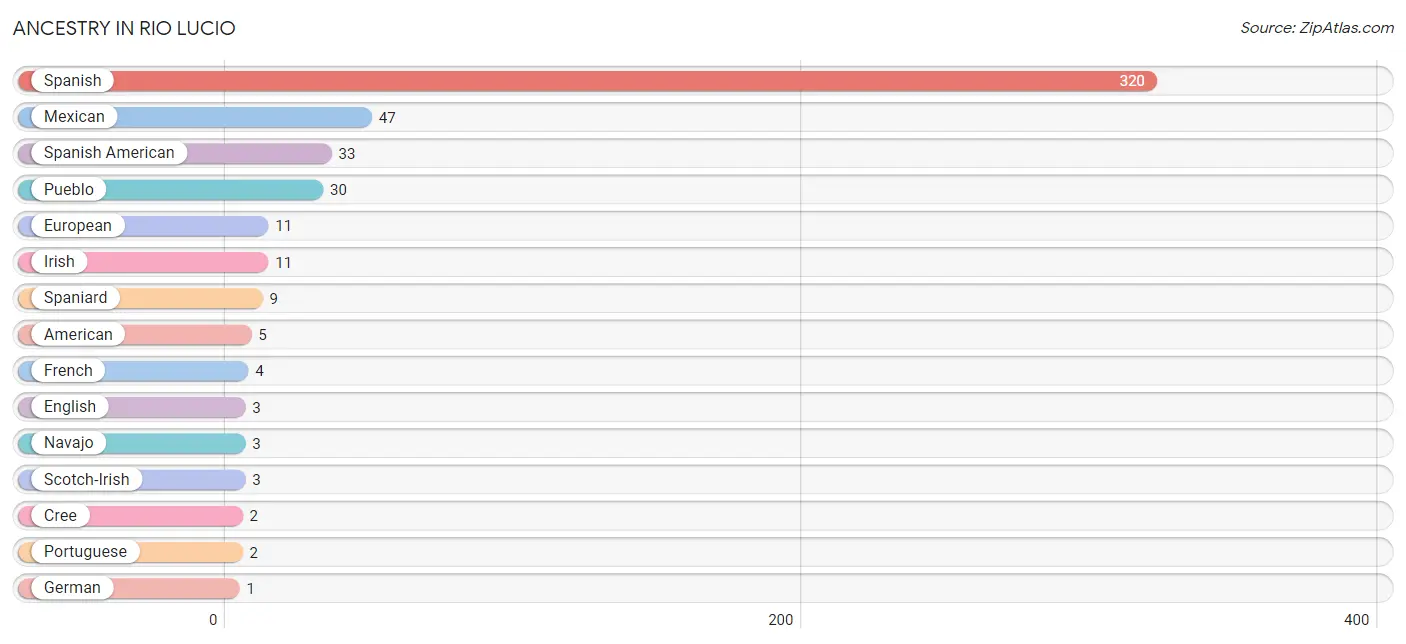
| Ancestry | # Population | % Population |
| American | 5 | 0.8% |
| Cree | 2 | 0.3% |
| English | 3 | 0.5% |
| European | 11 | 1.8% |
| French | 4 | 0.6% |
| German | 1 | 0.2% |
| Irish | 11 | 1.8% |
| Mexican | 47 | 7.6% |
| Navajo | 3 | 0.5% |
| Portuguese | 2 | 0.3% |
| Pueblo | 30 | 4.8% |
| Scotch-Irish | 3 | 0.5% |
| Spaniard | 9 | 1.5% |
| Spanish | 320 | 51.5% |
| Spanish American | 33 | 5.3% | View All 15 Rows |
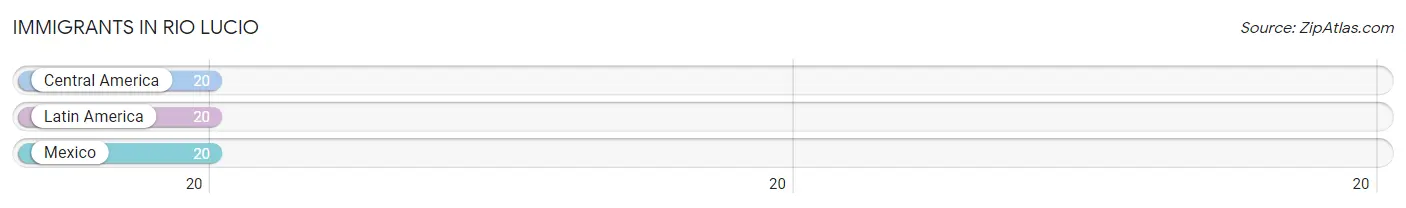
Immigrants in Rio Lucio
The most numerous immigrant groups reported in Rio Lucio came from Central America (20 | 3.2%), Latin America (20 | 3.2%), and Mexico (20 | 3.2%), together accounting for 9.7% of all Rio Lucio residents.
| Immigration Origin | # Population | % Population |
| Central America | 20 | 3.2% |
| Latin America | 20 | 3.2% |
| Mexico | 20 | 3.2% | View All 3 Rows |
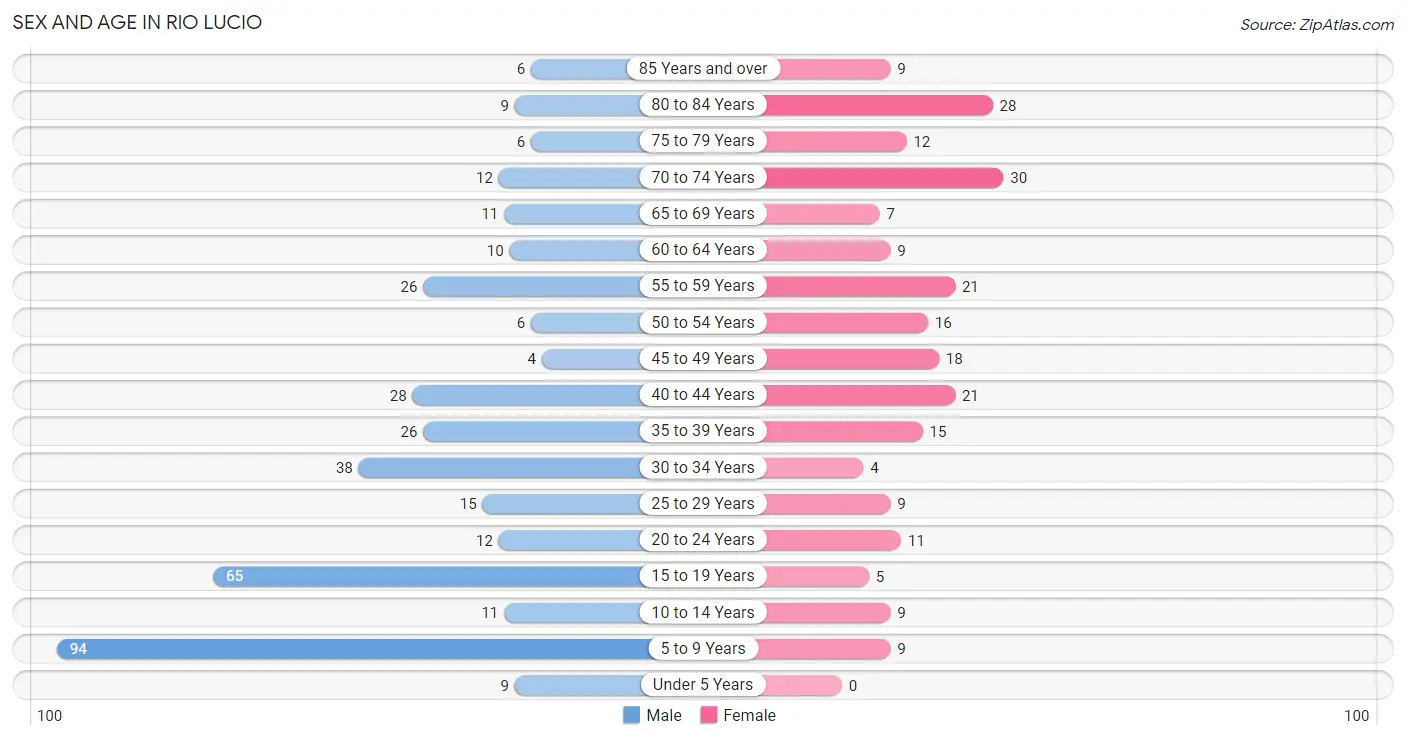
Sex and Age in Rio Lucio
Sex and Age in Rio Lucio
The most populous age groups in Rio Lucio are 5 to 9 Years (94 | 24.2%) for men and 70 to 74 Years (30 | 12.9%) for women.
| Age Bracket | Male | Female |
| Under 5 Years | 9 (2.3%) | 0 (0.0%) |
| 5 to 9 Years | 94 (24.2%) | 9 (3.9%) |
| 10 to 14 Years | 11 (2.8%) | 9 (3.9%) |
| 15 to 19 Years | 65 (16.8%) | 5 (2.1%) |
| 20 to 24 Years | 12 (3.1%) | 11 (4.7%) |
| 25 to 29 Years | 15 (3.9%) | 9 (3.9%) |
| 30 to 34 Years | 38 (9.8%) | 4 (1.7%) |
| 35 to 39 Years | 26 (6.7%) | 15 (6.4%) |
| 40 to 44 Years | 28 (7.2%) | 21 (9.0%) |
| 45 to 49 Years | 4 (1.0%) | 18 (7.7%) |
| 50 to 54 Years | 6 (1.5%) | 16 (6.9%) |
| 55 to 59 Years | 26 (6.7%) | 21 (9.0%) |
| 60 to 64 Years | 10 (2.6%) | 9 (3.9%) |
| 65 to 69 Years | 11 (2.8%) | 7 (3.0%) |
| 70 to 74 Years | 12 (3.1%) | 30 (12.9%) |
| 75 to 79 Years | 6 (1.5%) | 12 (5.1%) |
| 80 to 84 Years | 9 (2.3%) | 28 (12.0%) |
| 85 Years and over | 6 (1.5%) | 9 (3.9%) |
| Total | 388 (100.0%) | 233 (100.0%) |
Families and Households in Rio Lucio
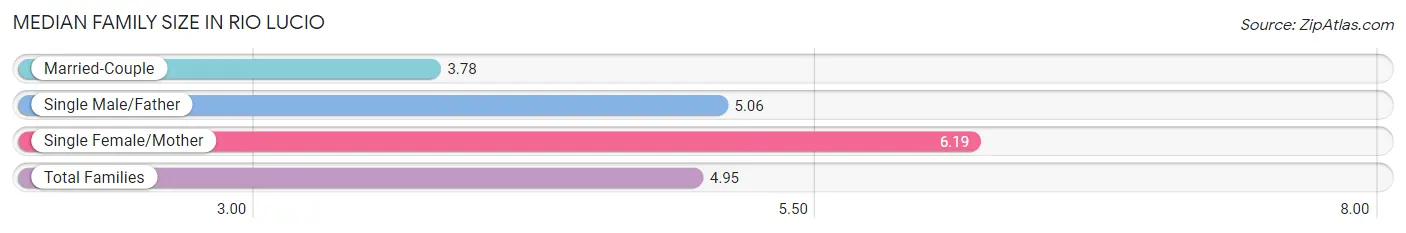
Median Family Size in Rio Lucio
The median family size in Rio Lucio is 4.95 persons per family, with single female/mother families (42 | 40.4%) accounting for the largest median family size of 6.19 persons per family. On the other hand, married-couple families (46 | 44.2%) represent the smallest median family size with 3.78 persons per family.
| Family Type | # Families | Family Size |
| Married-Couple | 46 (44.2%) | 3.78 |
| Single Male/Father | 16 (15.4%) | 5.06 |
| Single Female/Mother | 42 (40.4%) | 6.19 |
| Total Families | 104 (100.0%) | 4.95 |
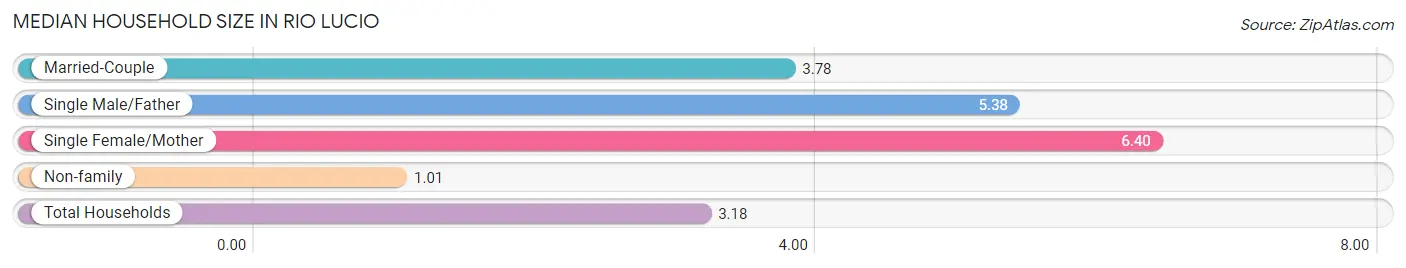
Median Household Size in Rio Lucio
The median household size in Rio Lucio is 3.18 persons per household, with single female/mother households (42 | 21.5%) accounting for the largest median household size of 6.4 persons per household. non-family households (91 | 46.7%) represent the smallest median household size with 1.01 persons per household.
| Household Type | # Households | Household Size |
| Married-Couple | 46 (23.6%) | 3.78 |
| Single Male/Father | 16 (8.2%) | 5.38 |
| Single Female/Mother | 42 (21.5%) | 6.40 |
| Non-family | 91 (46.7%) | 1.01 |
| Total Households | 195 (100.0%) | 3.18 |
Household Size by Marriage Status in Rio Lucio
Out of a total of 195 households in Rio Lucio, 104 (53.3%) are family households, while 91 (46.7%) are nonfamily households. The most numerous type of family households are 2-person households, comprising 45, and the most common type of nonfamily households are 1-person households, comprising 88.
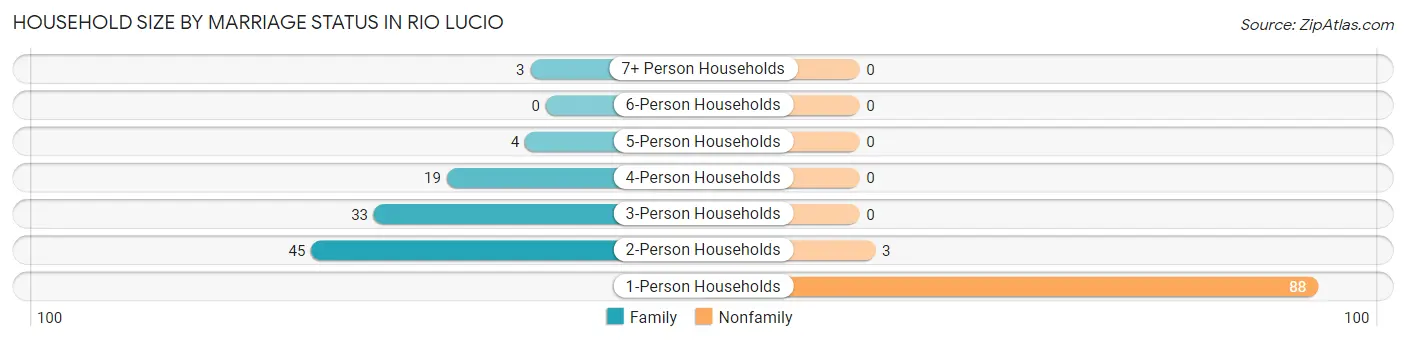
| Household Size | Family Households | Nonfamily Households |
| 1-Person Households | - | 88 (45.1%) |
| 2-Person Households | 45 (23.1%) | 3 (1.5%) |
| 3-Person Households | 33 (16.9%) | 0 (0.0%) |
| 4-Person Households | 19 (9.7%) | 0 (0.0%) |
| 5-Person Households | 4 (2.1%) | 0 (0.0%) |
| 6-Person Households | 0 (0.0%) | 0 (0.0%) |
| 7+ Person Households | 3 (1.5%) | 0 (0.0%) |
| Total | 104 (53.3%) | 91 (46.7%) |
Female Fertility in Rio Lucio
Fertility by Age in Rio Lucio
| Age Bracket | Women with Births | Births / 1,000 Women |
| 15 to 19 years | 0 (0.0%) | 0.0 |
| 20 to 34 years | 0 (0.0%) | 0.0 |
| 35 to 50 years | 0 (0.0%) | 0.0 |
| Total | 0 (0.0%) | 0.0 |
Fertility by Age by Marriage Status in Rio Lucio
| Age Bracket | Married | Unmarried |
| 15 to 19 years | 0 (0.0%) | 0 (0.0%) |
| 20 to 34 years | 0 (0.0%) | 0 (0.0%) |
| 35 to 50 years | 0 (0.0%) | 0 (0.0%) |
| Total | 0 (0.0%) | 0 (0.0%) |
Fertility by Education in Rio Lucio
| Educational Attainment | Women with Births | Births / 1,000 Women |
| Less than High School | 0 (0.0%) | 0.0 |
| High School Diploma | 0 (0.0%) | 0.0 |
| College or Associate's Degree | 0 (0.0%) | 0.0 |
| Bachelor's Degree | 0 (0.0%) | 0.0 |
| Graduate Degree | 0 (0.0%) | 0.0 |
| Total | 0 (0.0%) | 0.0 |
Fertility by Education by Marriage Status in Rio Lucio
| Educational Attainment | Married | Unmarried |
| Less than High School | 0 (0.0%) | 0 (0.0%) |
| High School Diploma | 0 (0.0%) | 0 (0.0%) |
| College or Associate's Degree | 0 (0.0%) | 0 (0.0%) |
| Bachelor's Degree | 0 (0.0%) | 0 (0.0%) |
| Graduate Degree | 0 (0.0%) | 0 (0.0%) |
| Total | 0 (0.0%) | 0 (0.0%) |
Employment Characteristics in Rio Lucio
Employment by Class of Employer in Rio Lucio
Among the 212 employed individuals in Rio Lucio, private company employees (109 | 51.4%), state government employees (35 | 16.5%), and local government employees (27 | 12.7%) make up the most common classes of employment.
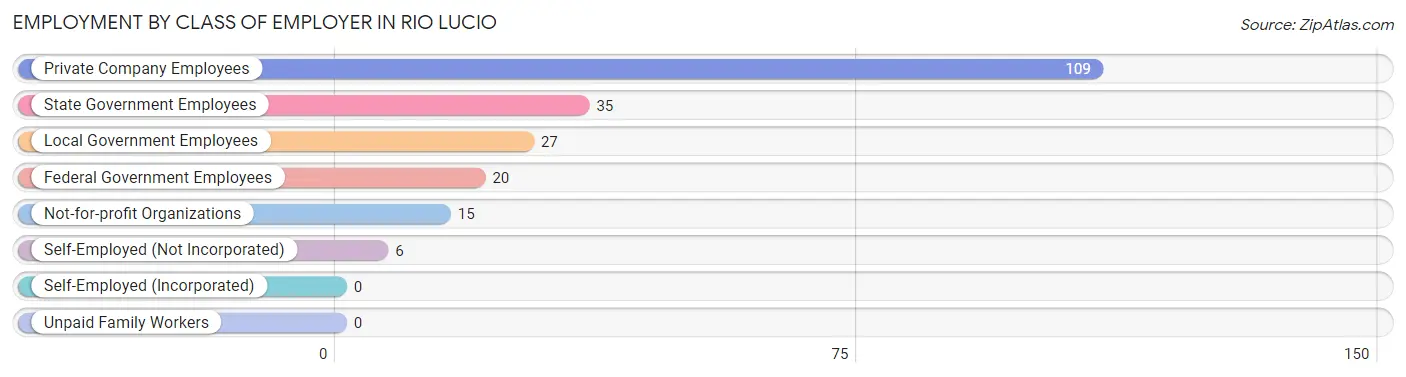
| Employer Class | # Employees | % Employees |
| Private Company Employees | 109 | 51.4% |
| Self-Employed (Incorporated) | 0 | 0.0% |
| Self-Employed (Not Incorporated) | 6 | 2.8% |
| Not-for-profit Organizations | 15 | 7.1% |
| Local Government Employees | 27 | 12.7% |
| State Government Employees | 35 | 16.5% |
| Federal Government Employees | 20 | 9.4% |
| Unpaid Family Workers | 0 | 0.0% |
| Total | 212 | 100.0% |
Employment Status by Age in Rio Lucio
According to the labor force statistics for Rio Lucio, out of the total population over 16 years of age (488), 46.9% or 229 individuals are in the labor force, with 7.4% or 17 of them unemployed. The age group with the highest labor force participation rate is 25 to 29 years, with 100.0% or 24 individuals in the labor force. Within the labor force, the 20 to 24 years age range has the highest percentage of unemployed individuals, with 22.2% or 4 of them being unemployed.
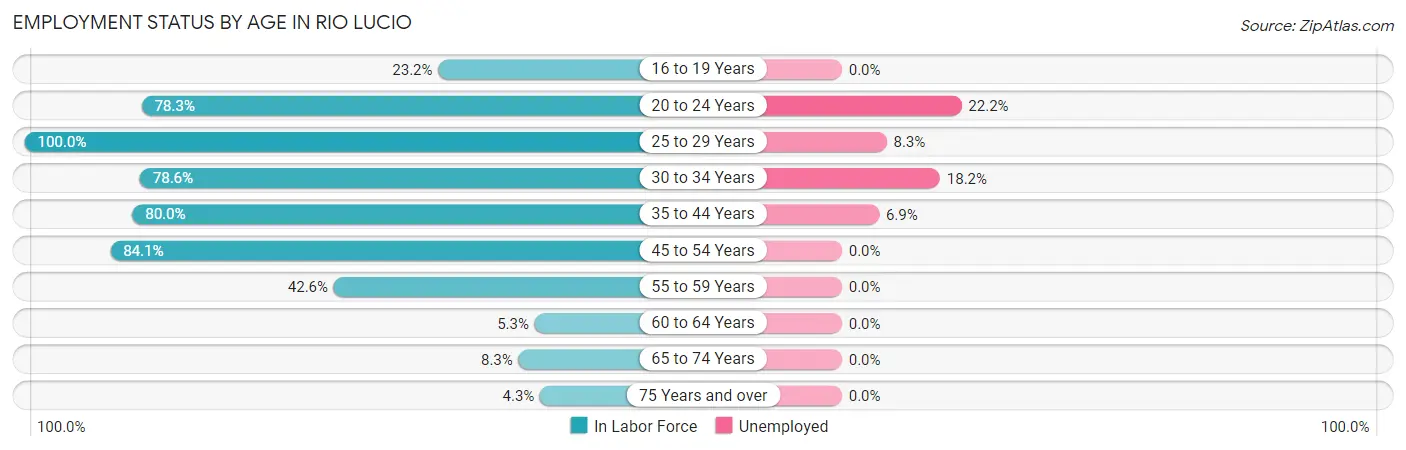
| Age Bracket | In Labor Force | Unemployed |
| 16 to 19 Years | 16 (23.2%) | 0 (0.0%) |
| 20 to 24 Years | 18 (78.3%) | 4 (22.2%) |
| 25 to 29 Years | 24 (100.0%) | 2 (8.3%) |
| 30 to 34 Years | 33 (78.6%) | 6 (18.2%) |
| 35 to 44 Years | 72 (80.0%) | 5 (6.9%) |
| 45 to 54 Years | 37 (84.1%) | 0 (0.0%) |
| 55 to 59 Years | 20 (42.6%) | 0 (0.0%) |
| 60 to 64 Years | 1 (5.3%) | 0 (0.0%) |
| 65 to 74 Years | 5 (8.3%) | 0 (0.0%) |
| 75 Years and over | 3 (4.3%) | 0 (0.0%) |
| Total | 229 (46.9%) | 17 (7.4%) |
Employment Status by Educational Attainment in Rio Lucio
According to labor force statistics for Rio Lucio, 70.3% of individuals (187) out of the total population between 25 and 64 years of age (266) are in the labor force, with 7.0% or 13 of them being unemployed. The group with the highest labor force participation rate are those with the educational attainment of college / associate degree, with 92.3% or 96 individuals in the labor force. Within the labor force, individuals with less than high school education have the highest percentage of unemployment, with 37.5% or 6 of them being unemployed.
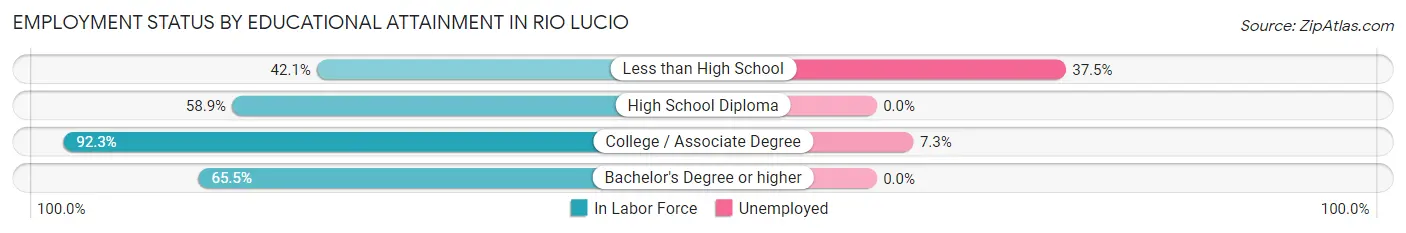
| Educational Attainment | In Labor Force | Unemployed |
| Less than High School | 16 (42.1%) | 14 (37.5%) |
| High School Diploma | 56 (58.9%) | 0 (0.0%) |
| College / Associate Degree | 96 (92.3%) | 8 (7.3%) |
| Bachelor's Degree or higher | 19 (65.5%) | 0 (0.0%) |
| Total | 187 (70.3%) | 19 (7.0%) |
Employment Occupations by Sex in Rio Lucio
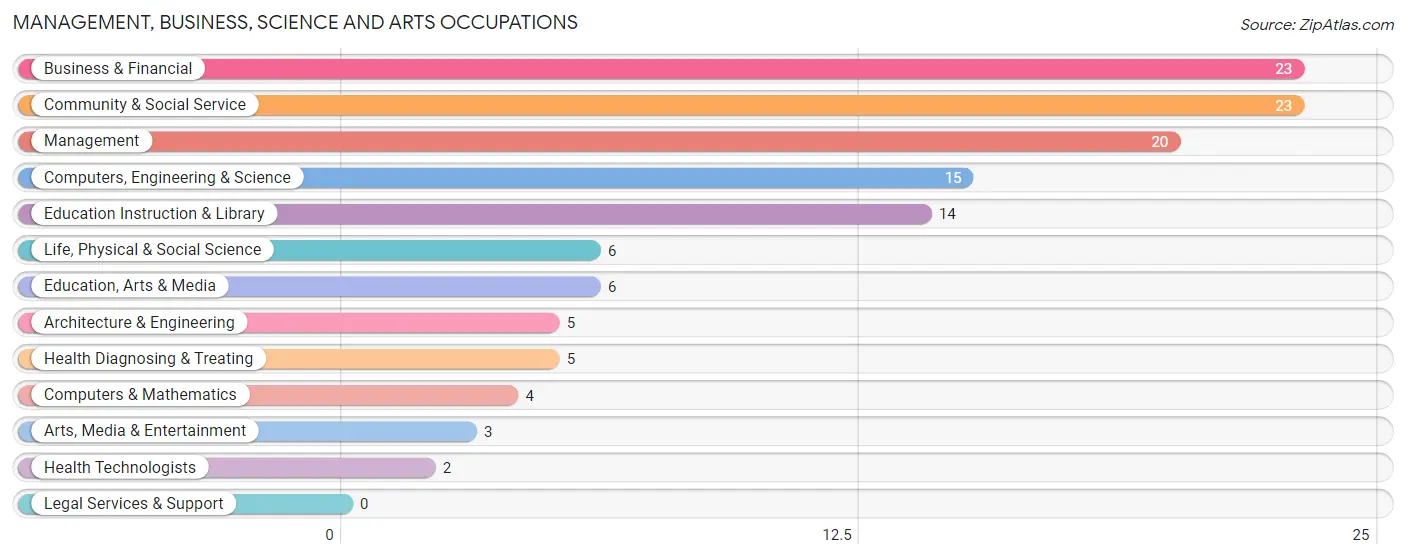
Management, Business, Science and Arts Occupations
The most common Management, Business, Science and Arts occupations in Rio Lucio are Business & Financial (23 | 10.8%), Community & Social Service (23 | 10.8%), Management (20 | 9.4%), Computers, Engineering & Science (15 | 7.1%), and Education Instruction & Library (14 | 6.6%).
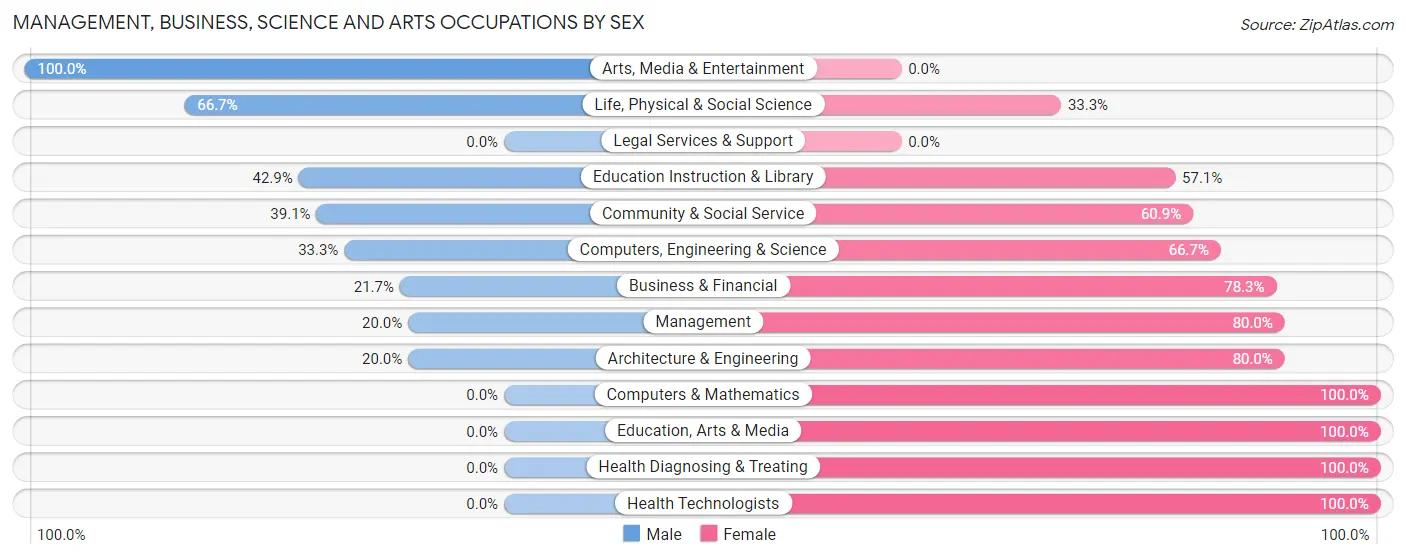
Management, Business, Science and Arts Occupations by Sex
Within the Management, Business, Science and Arts occupations in Rio Lucio, the most male-oriented occupations are Arts, Media & Entertainment (100.0%), Life, Physical & Social Science (66.7%), and Education Instruction & Library (42.9%), while the most female-oriented occupations are Computers & Mathematics (100.0%), Education, Arts & Media (100.0%), and Health Diagnosing & Treating (100.0%).
| Occupation | Male | Female |
| Management | 4 (20.0%) | 16 (80.0%) |
| Business & Financial | 5 (21.7%) | 18 (78.3%) |
| Computers, Engineering & Science | 5 (33.3%) | 10 (66.7%) |
| Computers & Mathematics | 0 (0.0%) | 4 (100.0%) |
| Architecture & Engineering | 1 (20.0%) | 4 (80.0%) |
| Life, Physical & Social Science | 4 (66.7%) | 2 (33.3%) |
| Community & Social Service | 9 (39.1%) | 14 (60.9%) |
| Education, Arts & Media | 0 (0.0%) | 6 (100.0%) |
| Legal Services & Support | 0 (0.0%) | 0 (0.0%) |
| Education Instruction & Library | 6 (42.9%) | 8 (57.1%) |
| Arts, Media & Entertainment | 3 (100.0%) | 0 (0.0%) |
| Health Diagnosing & Treating | 0 (0.0%) | 5 (100.0%) |
| Health Technologists | 0 (0.0%) | 2 (100.0%) |
| Total (Category) | 23 (26.7%) | 63 (73.3%) |
| Total (Overall) | 115 (54.2%) | 97 (45.8%) |
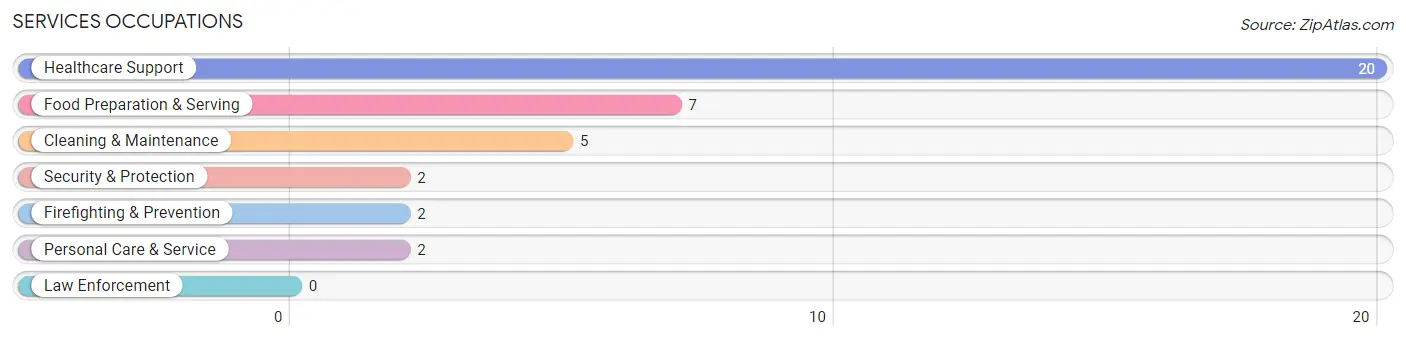
Services Occupations
The most common Services occupations in Rio Lucio are Healthcare Support (20 | 9.4%), Food Preparation & Serving (7 | 3.3%), Cleaning & Maintenance (5 | 2.4%), Security & Protection (2 | 0.9%), and Firefighting & Prevention (2 | 0.9%).
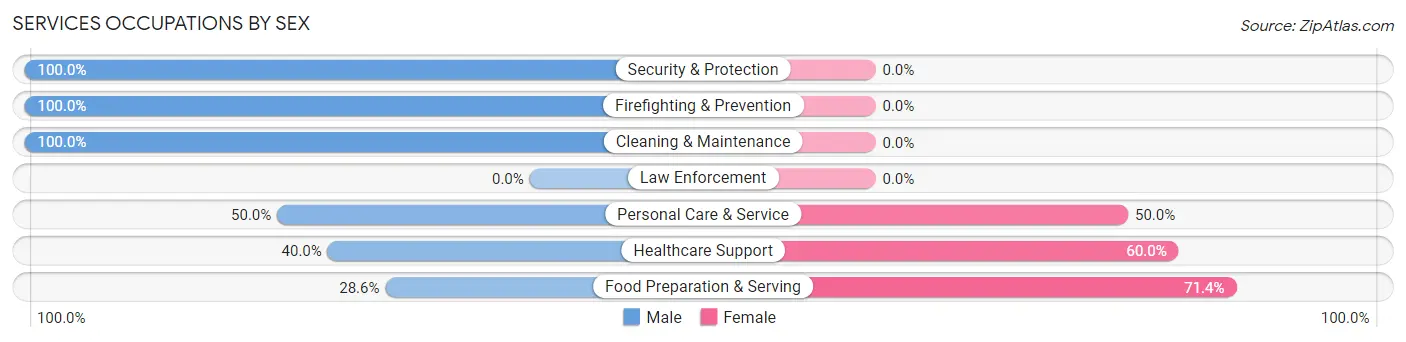
Services Occupations by Sex
Within the Services occupations in Rio Lucio, the most male-oriented occupations are Security & Protection (100.0%), Firefighting & Prevention (100.0%), and Cleaning & Maintenance (100.0%), while the most female-oriented occupations are Food Preparation & Serving (71.4%), Healthcare Support (60.0%), and Personal Care & Service (50.0%).
| Occupation | Male | Female |
| Healthcare Support | 8 (40.0%) | 12 (60.0%) |
| Security & Protection | 2 (100.0%) | 0 (0.0%) |
| Firefighting & Prevention | 2 (100.0%) | 0 (0.0%) |
| Law Enforcement | 0 (0.0%) | 0 (0.0%) |
| Food Preparation & Serving | 2 (28.6%) | 5 (71.4%) |
| Cleaning & Maintenance | 5 (100.0%) | 0 (0.0%) |
| Personal Care & Service | 1 (50.0%) | 1 (50.0%) |
| Total (Category) | 18 (50.0%) | 18 (50.0%) |
| Total (Overall) | 115 (54.2%) | 97 (45.8%) |
Sales and Office Occupations
The most common Sales and Office occupations in Rio Lucio are Office & Administration (8 | 3.8%), and Sales & Related (5 | 2.4%).

Sales and Office Occupations by Sex

| Occupation | Male | Female |
| Sales & Related | 3 (60.0%) | 2 (40.0%) |
| Office & Administration | 0 (0.0%) | 8 (100.0%) |
| Total (Category) | 3 (23.1%) | 10 (76.9%) |
| Total (Overall) | 115 (54.2%) | 97 (45.8%) |
Natural Resources, Construction and Maintenance Occupations
The most common Natural Resources, Construction and Maintenance occupations in Rio Lucio are Construction & Extraction (38 | 17.9%), and Installation, Maintenance & Repair (1 | 0.5%).

Natural Resources, Construction and Maintenance Occupations by Sex

| Occupation | Male | Female |
| Farming, Fishing & Forestry | 0 (0.0%) | 0 (0.0%) |
| Construction & Extraction | 38 (100.0%) | 0 (0.0%) |
| Installation, Maintenance & Repair | 1 (100.0%) | 0 (0.0%) |
| Total (Category) | 39 (100.0%) | 0 (0.0%) |
| Total (Overall) | 115 (54.2%) | 97 (45.8%) |
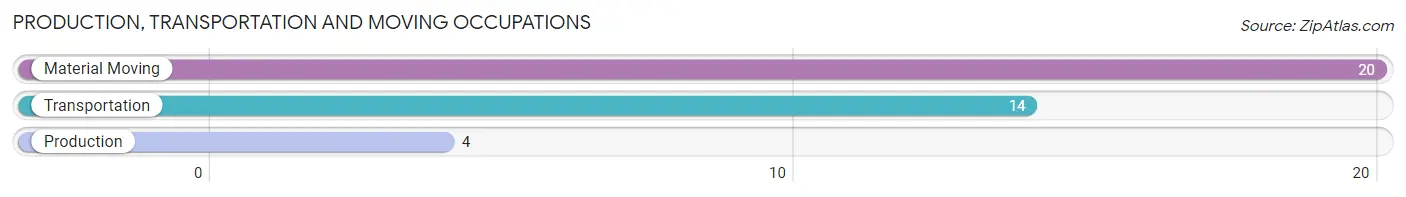
Production, Transportation and Moving Occupations
The most common Production, Transportation and Moving occupations in Rio Lucio are Material Moving (20 | 9.4%), Transportation (14 | 6.6%), and Production (4 | 1.9%).
Production, Transportation and Moving Occupations by Sex
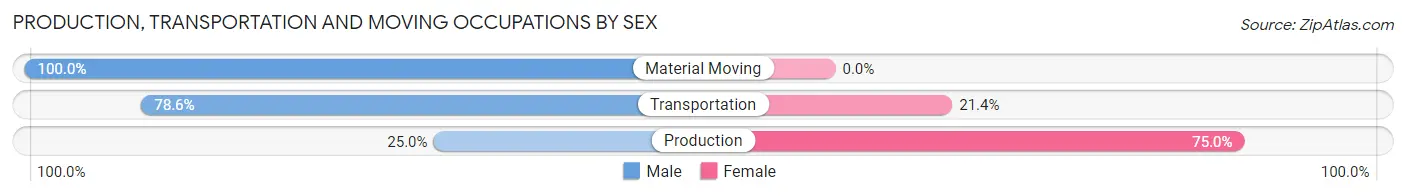
| Occupation | Male | Female |
| Production | 1 (25.0%) | 3 (75.0%) |
| Transportation | 11 (78.6%) | 3 (21.4%) |
| Material Moving | 20 (100.0%) | 0 (0.0%) |
| Total (Category) | 32 (84.2%) | 6 (15.8%) |
| Total (Overall) | 115 (54.2%) | 97 (45.8%) |
Employment Industries by Sex in Rio Lucio
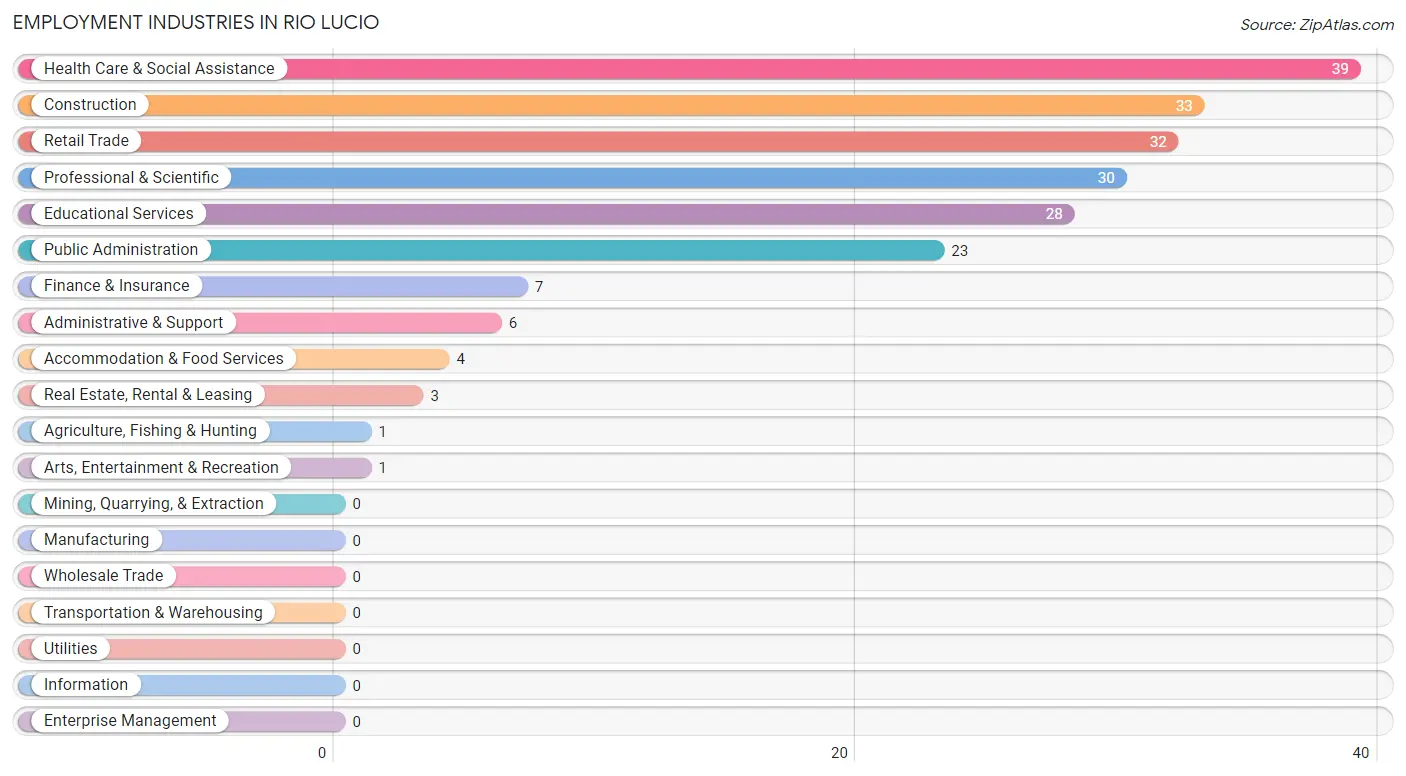
Employment Industries in Rio Lucio
The major employment industries in Rio Lucio include Health Care & Social Assistance (39 | 18.4%), Construction (33 | 15.6%), Retail Trade (32 | 15.1%), Professional & Scientific (30 | 14.1%), and Educational Services (28 | 13.2%).
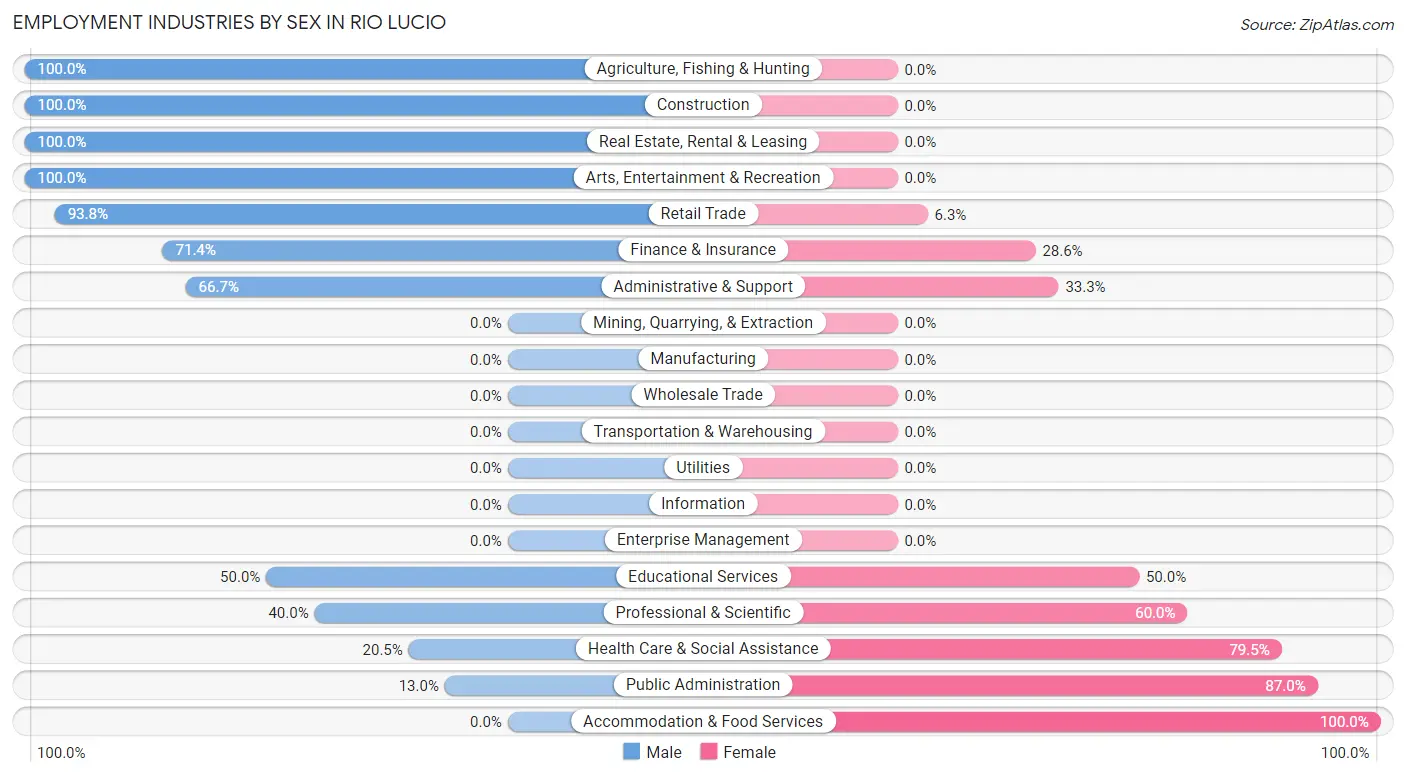
Employment Industries by Sex in Rio Lucio
The Rio Lucio industries that see more men than women are Agriculture, Fishing & Hunting (100.0%), Construction (100.0%), and Real Estate, Rental & Leasing (100.0%), whereas the industries that tend to have a higher number of women are Accommodation & Food Services (100.0%), Public Administration (87.0%), and Health Care & Social Assistance (79.5%).
| Industry | Male | Female |
| Agriculture, Fishing & Hunting | 1 (100.0%) | 0 (0.0%) |
| Mining, Quarrying, & Extraction | 0 (0.0%) | 0 (0.0%) |
| Construction | 33 (100.0%) | 0 (0.0%) |
| Manufacturing | 0 (0.0%) | 0 (0.0%) |
| Wholesale Trade | 0 (0.0%) | 0 (0.0%) |
| Retail Trade | 30 (93.8%) | 2 (6.2%) |
| Transportation & Warehousing | 0 (0.0%) | 0 (0.0%) |
| Utilities | 0 (0.0%) | 0 (0.0%) |
| Information | 0 (0.0%) | 0 (0.0%) |
| Finance & Insurance | 5 (71.4%) | 2 (28.6%) |
| Real Estate, Rental & Leasing | 3 (100.0%) | 0 (0.0%) |
| Professional & Scientific | 12 (40.0%) | 18 (60.0%) |
| Enterprise Management | 0 (0.0%) | 0 (0.0%) |
| Administrative & Support | 4 (66.7%) | 2 (33.3%) |
| Educational Services | 14 (50.0%) | 14 (50.0%) |
| Health Care & Social Assistance | 8 (20.5%) | 31 (79.5%) |
| Arts, Entertainment & Recreation | 1 (100.0%) | 0 (0.0%) |
| Accommodation & Food Services | 0 (0.0%) | 4 (100.0%) |
| Public Administration | 3 (13.0%) | 20 (87.0%) |
| Total | 115 (54.2%) | 97 (45.8%) |
Education in Rio Lucio
School Enrollment in Rio Lucio
The most common levels of schooling among the 216 students in Rio Lucio are elementary school (92 | 42.6%), high school (72 | 33.3%), and middle school (19 | 8.8%).
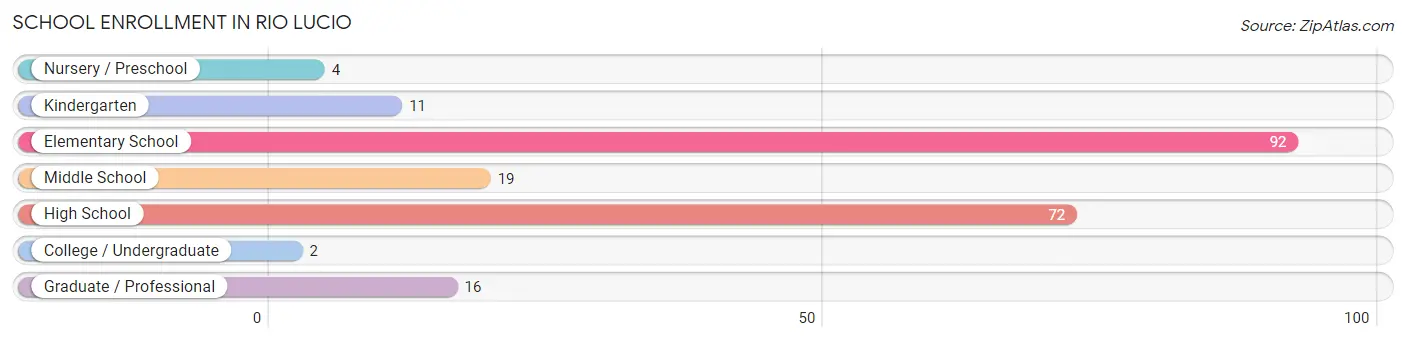
| School Level | # Students | % Students |
| Nursery / Preschool | 4 | 1.8% |
| Kindergarten | 11 | 5.1% |
| Elementary School | 92 | 42.6% |
| Middle School | 19 | 8.8% |
| High School | 72 | 33.3% |
| College / Undergraduate | 2 | 0.9% |
| Graduate / Professional | 16 | 7.4% |
| Total | 216 | 100.0% |
School Enrollment by Age by Funding Source in Rio Lucio
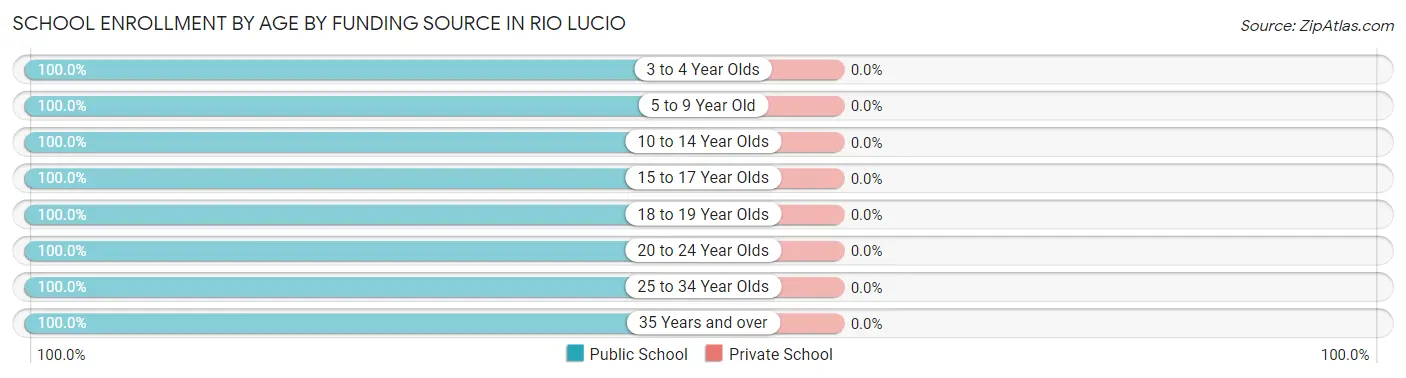
| Age Bracket | Public School | Private School |
| 3 to 4 Year Olds | 4 (100.0%) | 0 (0.0%) |
| 5 to 9 Year Old | 103 (100.0%) | 0 (0.0%) |
| 10 to 14 Year Olds | 20 (100.0%) | 0 (0.0%) |
| 15 to 17 Year Olds | 15 (100.0%) | 0 (0.0%) |
| 18 to 19 Year Olds | 41 (100.0%) | 0 (0.0%) |
| 20 to 24 Year Olds | 9 (100.0%) | 0 (0.0%) |
| 25 to 34 Year Olds | 11 (100.0%) | 0 (0.0%) |
| 35 Years and over | 13 (100.0%) | 0 (0.0%) |
| Total | 216 (100.0%) | 0 (0.0%) |
Educational Attainment by Field of Study in Rio Lucio
Education (19 | 37.2%), computers & mathematics (8 | 15.7%), business (6 | 11.8%), science & technology (4 | 7.8%), and literature & languages (4 | 7.8%) are the most common fields of study among 51 individuals in Rio Lucio who have obtained a bachelor's degree or higher.
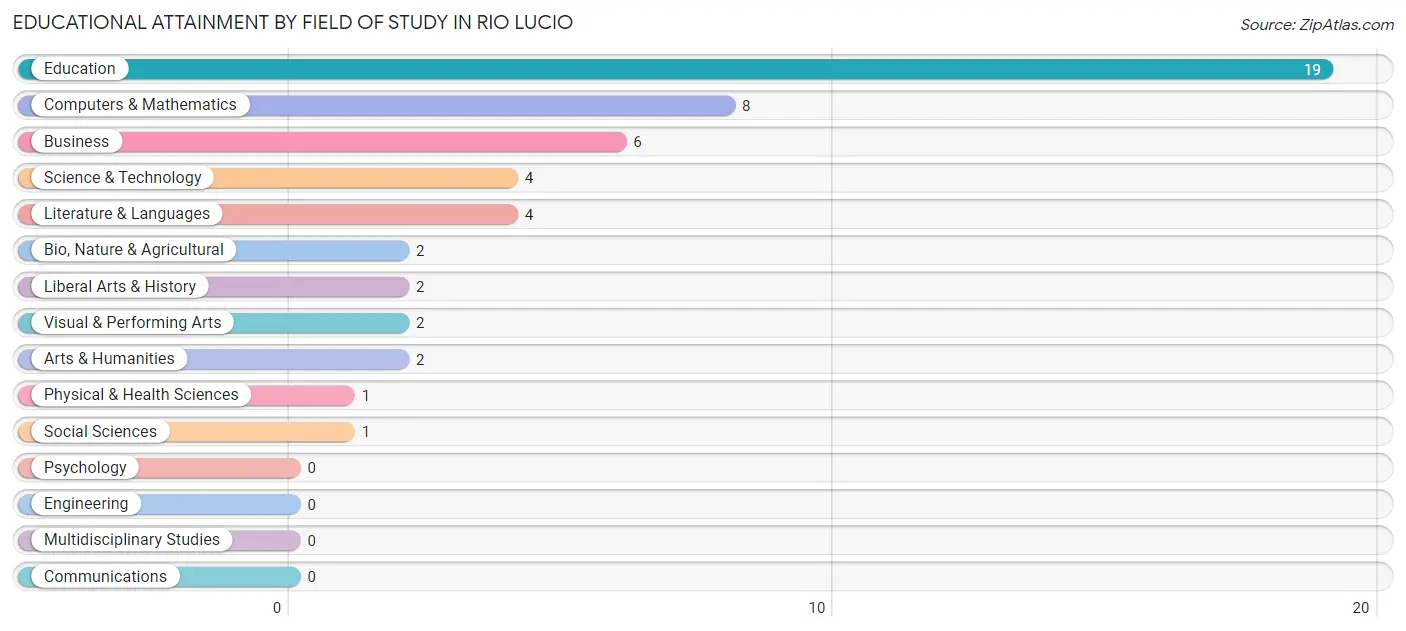
| Field of Study | # Graduates | % Graduates |
| Computers & Mathematics | 8 | 15.7% |
| Bio, Nature & Agricultural | 2 | 3.9% |
| Physical & Health Sciences | 1 | 2.0% |
| Psychology | 0 | 0.0% |
| Social Sciences | 1 | 2.0% |
| Engineering | 0 | 0.0% |
| Multidisciplinary Studies | 0 | 0.0% |
| Science & Technology | 4 | 7.8% |
| Business | 6 | 11.8% |
| Education | 19 | 37.2% |
| Literature & Languages | 4 | 7.8% |
| Liberal Arts & History | 2 | 3.9% |
| Visual & Performing Arts | 2 | 3.9% |
| Communications | 0 | 0.0% |
| Arts & Humanities | 2 | 3.9% |
| Total | 51 | 100.0% |
Transportation & Commute in Rio Lucio
Vehicle Availability by Sex in Rio Lucio
The most prevalent vehicle ownership categories in Rio Lucio are males with 2 vehicles (56, accounting for 48.7%) and females with 2 vehicles (50, making up 57.7%).
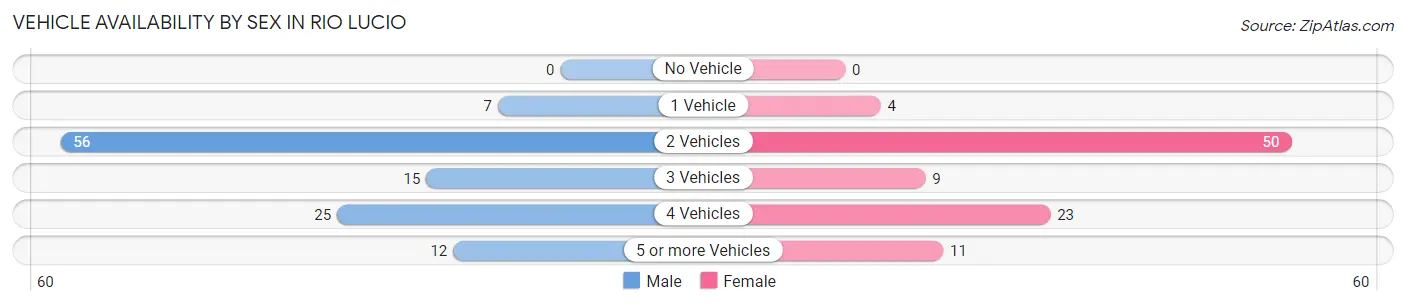
| Vehicles Available | Male | Female |
| No Vehicle | 0 (0.0%) | 0 (0.0%) |
| 1 Vehicle | 7 (6.1%) | 4 (4.1%) |
| 2 Vehicles | 56 (48.7%) | 50 (51.5%) |
| 3 Vehicles | 15 (13.0%) | 9 (9.3%) |
| 4 Vehicles | 25 (21.7%) | 23 (23.7%) |
| 5 or more Vehicles | 12 (10.4%) | 11 (11.3%) |
| Total | 115 (100.0%) | 97 (100.0%) |
Commute Time in Rio Lucio
The most frequently occuring commute durations in Rio Lucio are 60 to 89 minutes (71 commuters, 38.4%), 5 to 9 minutes (37 commuters, 20.0%), and 10 to 14 minutes (17 commuters, 9.2%).
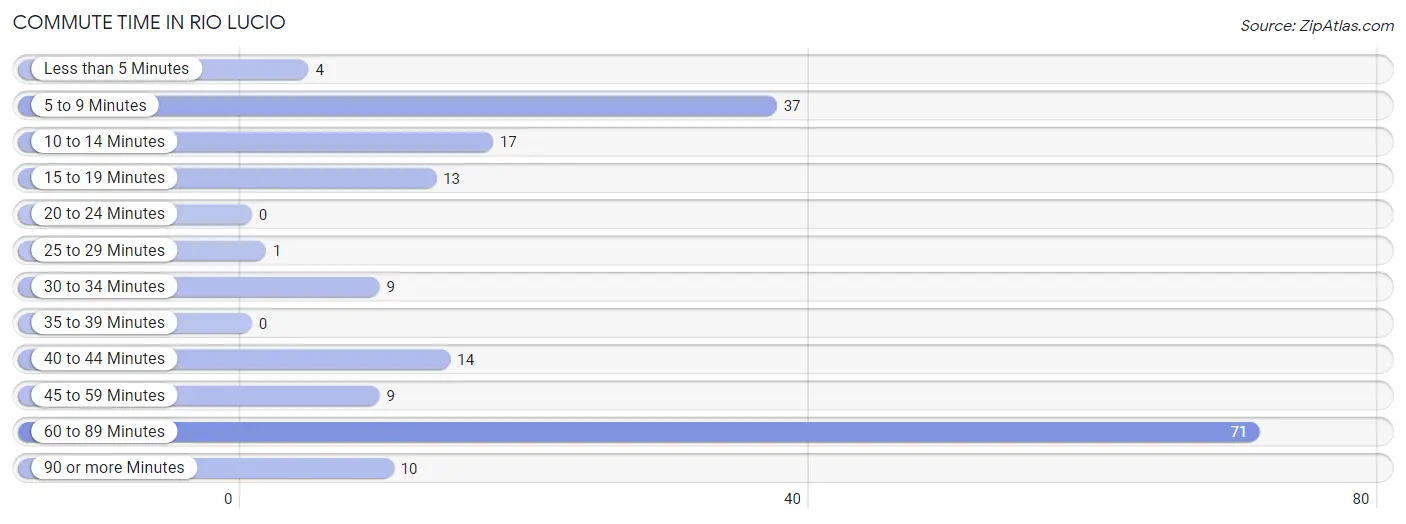
| Commute Time | # Commuters | % Commuters |
| Less than 5 Minutes | 4 | 2.2% |
| 5 to 9 Minutes | 37 | 20.0% |
| 10 to 14 Minutes | 17 | 9.2% |
| 15 to 19 Minutes | 13 | 7.0% |
| 20 to 24 Minutes | 0 | 0.0% |
| 25 to 29 Minutes | 1 | 0.5% |
| 30 to 34 Minutes | 9 | 4.9% |
| 35 to 39 Minutes | 0 | 0.0% |
| 40 to 44 Minutes | 14 | 7.6% |
| 45 to 59 Minutes | 9 | 4.9% |
| 60 to 89 Minutes | 71 | 38.4% |
| 90 or more Minutes | 10 | 5.4% |
Commute Time by Sex in Rio Lucio
The most common commute times in Rio Lucio are 60 to 89 minutes (53 commuters, 49.5%) for males and 5 to 9 minutes (32 commuters, 41.0%) for females.
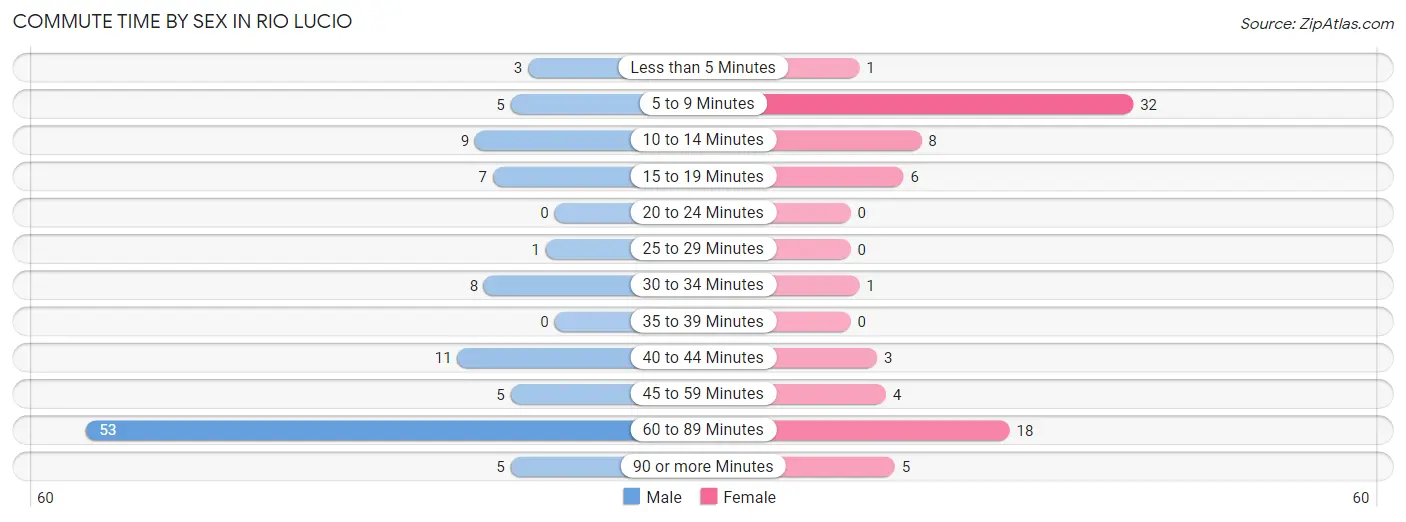
| Commute Time | Male | Female |
| Less than 5 Minutes | 3 (2.8%) | 1 (1.3%) |
| 5 to 9 Minutes | 5 (4.7%) | 32 (41.0%) |
| 10 to 14 Minutes | 9 (8.4%) | 8 (10.3%) |
| 15 to 19 Minutes | 7 (6.5%) | 6 (7.7%) |
| 20 to 24 Minutes | 0 (0.0%) | 0 (0.0%) |
| 25 to 29 Minutes | 1 (0.9%) | 0 (0.0%) |
| 30 to 34 Minutes | 8 (7.5%) | 1 (1.3%) |
| 35 to 39 Minutes | 0 (0.0%) | 0 (0.0%) |
| 40 to 44 Minutes | 11 (10.3%) | 3 (3.8%) |
| 45 to 59 Minutes | 5 (4.7%) | 4 (5.1%) |
| 60 to 89 Minutes | 53 (49.5%) | 18 (23.1%) |
| 90 or more Minutes | 5 (4.7%) | 5 (6.4%) |
Time of Departure to Work by Sex in Rio Lucio
The most frequent times of departure to work in Rio Lucio are 7:00 AM to 7:29 AM (30, 28.0%) for males and 6:30 AM to 6:59 AM (19, 24.4%) for females.
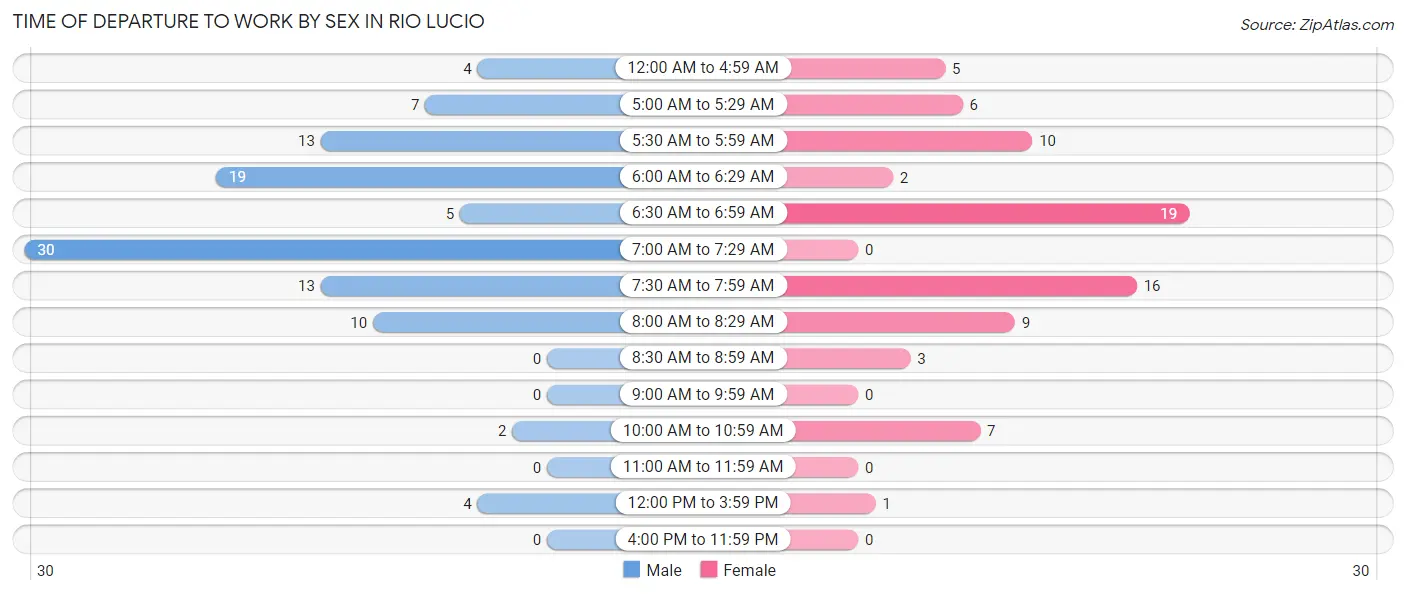
| Time of Departure | Male | Female |
| 12:00 AM to 4:59 AM | 4 (3.7%) | 5 (6.4%) |
| 5:00 AM to 5:29 AM | 7 (6.5%) | 6 (7.7%) |
| 5:30 AM to 5:59 AM | 13 (12.1%) | 10 (12.8%) |
| 6:00 AM to 6:29 AM | 19 (17.8%) | 2 (2.6%) |
| 6:30 AM to 6:59 AM | 5 (4.7%) | 19 (24.4%) |
| 7:00 AM to 7:29 AM | 30 (28.0%) | 0 (0.0%) |
| 7:30 AM to 7:59 AM | 13 (12.1%) | 16 (20.5%) |
| 8:00 AM to 8:29 AM | 10 (9.3%) | 9 (11.5%) |
| 8:30 AM to 8:59 AM | 0 (0.0%) | 3 (3.8%) |
| 9:00 AM to 9:59 AM | 0 (0.0%) | 0 (0.0%) |
| 10:00 AM to 10:59 AM | 2 (1.9%) | 7 (9.0%) |
| 11:00 AM to 11:59 AM | 0 (0.0%) | 0 (0.0%) |
| 12:00 PM to 3:59 PM | 4 (3.7%) | 1 (1.3%) |
| 4:00 PM to 11:59 PM | 0 (0.0%) | 0 (0.0%) |
| Total | 107 (100.0%) | 78 (100.0%) |
Housing Occupancy in Rio Lucio
Occupancy by Ownership in Rio Lucio
Of the total 195 dwellings in Rio Lucio, owner-occupied units account for 173 (88.7%), while renter-occupied units make up 22 (11.3%).
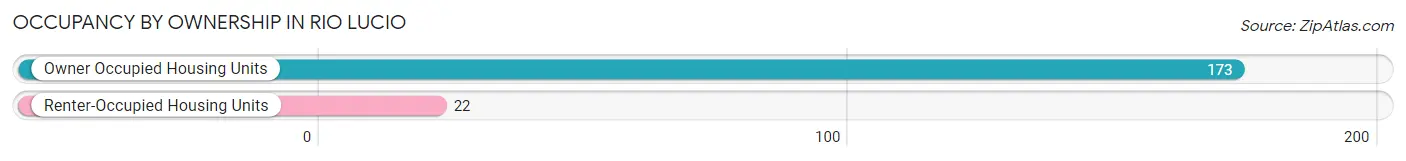
| Occupancy | # Housing Units | % Housing Units |
| Owner Occupied Housing Units | 173 | 88.7% |
| Renter-Occupied Housing Units | 22 | 11.3% |
| Total Occupied Housing Units | 195 | 100.0% |
Occupancy by Household Size in Rio Lucio
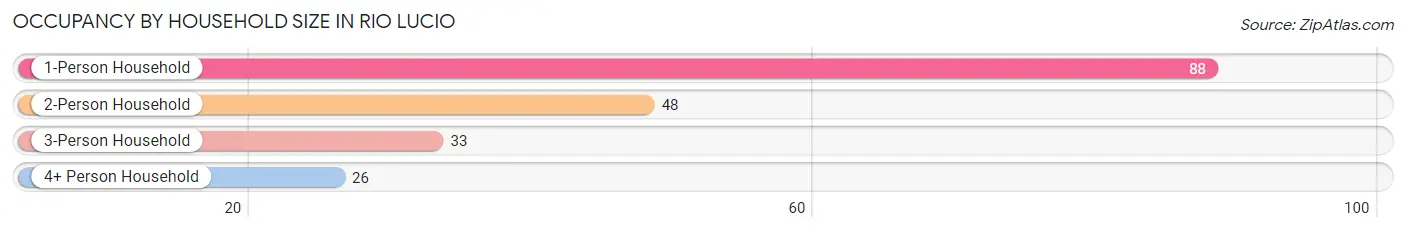
| Household Size | # Housing Units | % Housing Units |
| 1-Person Household | 88 | 45.1% |
| 2-Person Household | 48 | 24.6% |
| 3-Person Household | 33 | 16.9% |
| 4+ Person Household | 26 | 13.3% |
| Total Housing Units | 195 | 100.0% |
Occupancy by Ownership by Household Size in Rio Lucio
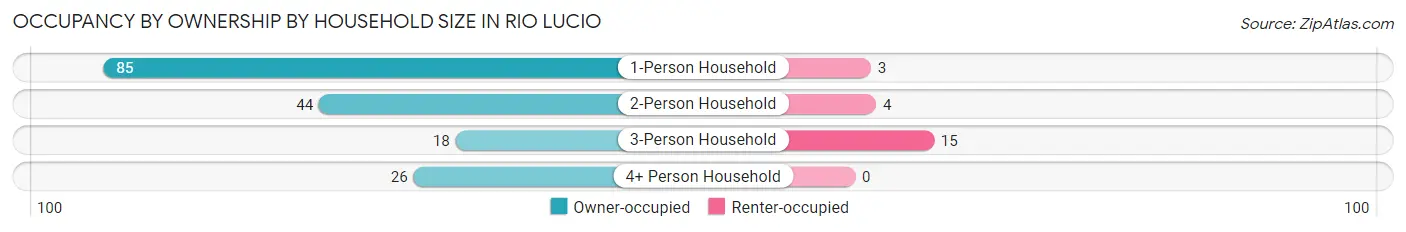
| Household Size | Owner-occupied | Renter-occupied |
| 1-Person Household | 85 (96.6%) | 3 (3.4%) |
| 2-Person Household | 44 (91.7%) | 4 (8.3%) |
| 3-Person Household | 18 (54.5%) | 15 (45.5%) |
| 4+ Person Household | 26 (100.0%) | 0 (0.0%) |
| Total Housing Units | 173 (88.7%) | 22 (11.3%) |
Occupancy by Educational Attainment in Rio Lucio
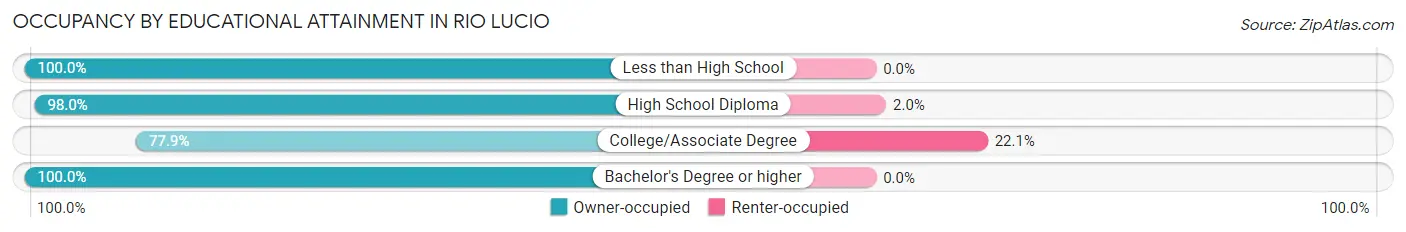
| Household Size | Owner-occupied | Renter-occupied |
| Less than High School | 31 (100.0%) | 0 (0.0%) |
| High School Diploma | 50 (98.0%) | 1 (2.0%) |
| College/Associate Degree | 74 (77.9%) | 21 (22.1%) |
| Bachelor's Degree or higher | 18 (100.0%) | 0 (0.0%) |
Occupancy by Age of Householder in Rio Lucio
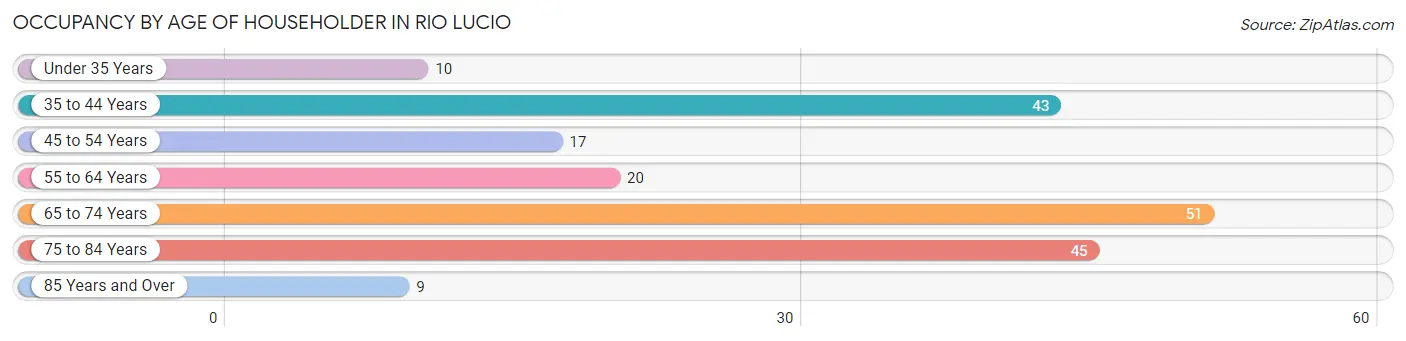
| Age Bracket | # Households | % Households |
| Under 35 Years | 10 | 5.1% |
| 35 to 44 Years | 43 | 22.1% |
| 45 to 54 Years | 17 | 8.7% |
| 55 to 64 Years | 20 | 10.3% |
| 65 to 74 Years | 51 | 26.2% |
| 75 to 84 Years | 45 | 23.1% |
| 85 Years and Over | 9 | 4.6% |
| Total | 195 | 100.0% |
Housing Finances in Rio Lucio
Median Income by Occupancy in Rio Lucio
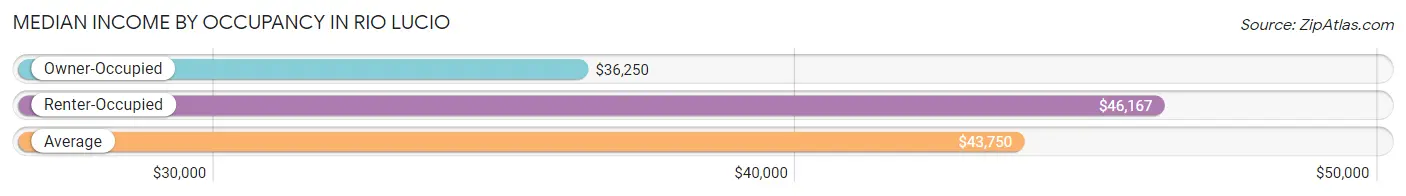
| Occupancy Type | # Households | Median Income |
| Owner-Occupied | 173 (88.7%) | $36,250 |
| Renter-Occupied | 22 (11.3%) | $46,167 |
| Average | 195 (100.0%) | $43,750 |
Occupancy by Householder Income Bracket in Rio Lucio
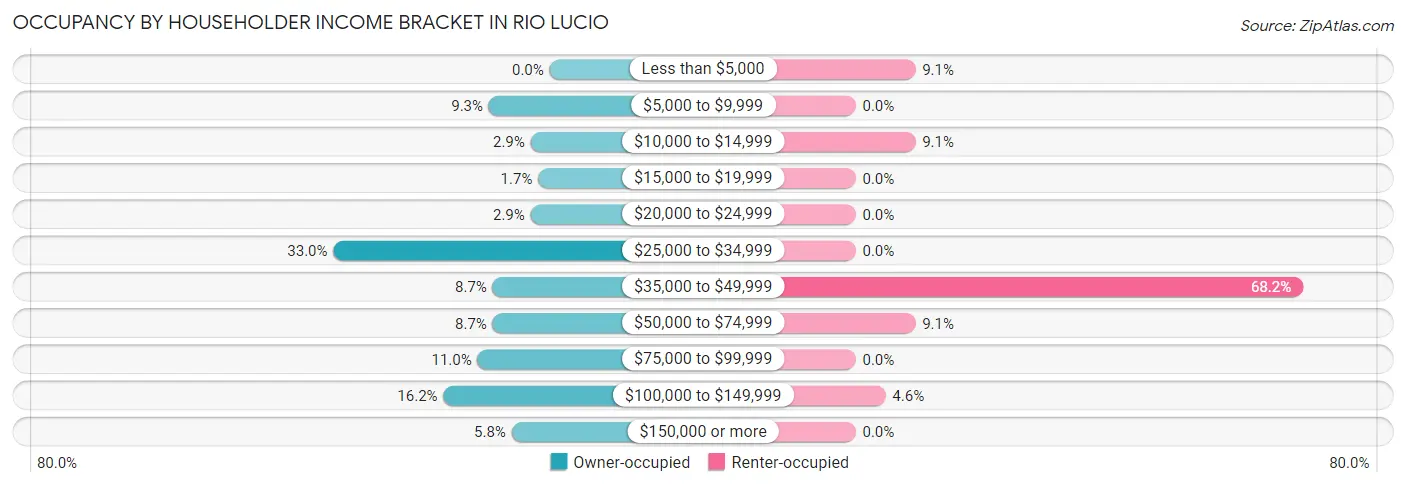
| Income Bracket | Owner-occupied | Renter-occupied |
| Less than $5,000 | 0 (0.0%) | 2 (9.1%) |
| $5,000 to $9,999 | 16 (9.2%) | 0 (0.0%) |
| $10,000 to $14,999 | 5 (2.9%) | 2 (9.1%) |
| $15,000 to $19,999 | 3 (1.7%) | 0 (0.0%) |
| $20,000 to $24,999 | 5 (2.9%) | 0 (0.0%) |
| $25,000 to $34,999 | 57 (33.0%) | 0 (0.0%) |
| $35,000 to $49,999 | 15 (8.7%) | 15 (68.2%) |
| $50,000 to $74,999 | 15 (8.7%) | 2 (9.1%) |
| $75,000 to $99,999 | 19 (11.0%) | 0 (0.0%) |
| $100,000 to $149,999 | 28 (16.2%) | 1 (4.5%) |
| $150,000 or more | 10 (5.8%) | 0 (0.0%) |
| Total | 173 (100.0%) | 22 (100.0%) |
Monthly Housing Cost Tiers in Rio Lucio
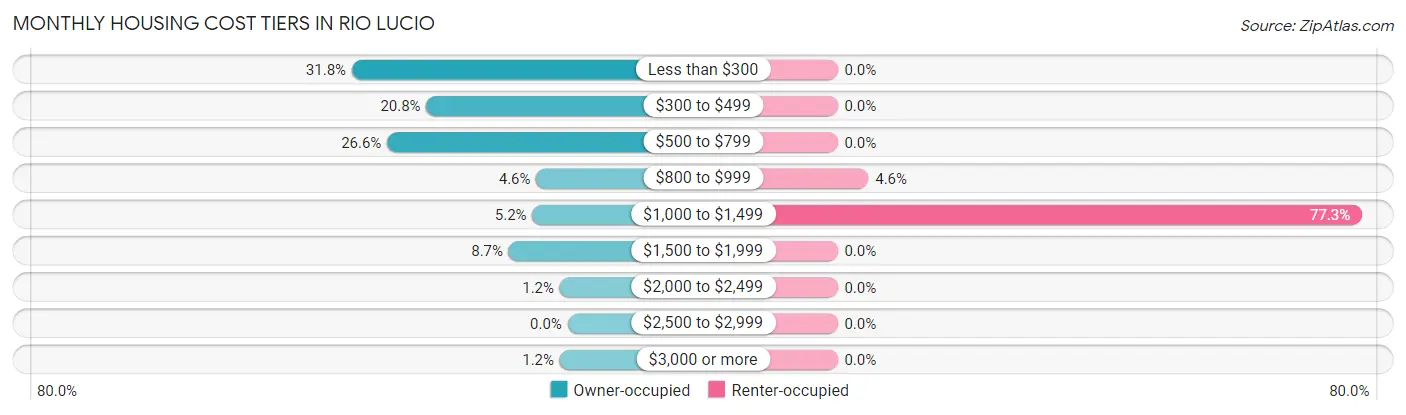
| Monthly Cost | Owner-occupied | Renter-occupied |
| Less than $300 | 55 (31.8%) | 0 (0.0%) |
| $300 to $499 | 36 (20.8%) | 0 (0.0%) |
| $500 to $799 | 46 (26.6%) | 0 (0.0%) |
| $800 to $999 | 8 (4.6%) | 1 (4.5%) |
| $1,000 to $1,499 | 9 (5.2%) | 17 (77.3%) |
| $1,500 to $1,999 | 15 (8.7%) | 0 (0.0%) |
| $2,000 to $2,499 | 2 (1.2%) | 0 (0.0%) |
| $2,500 to $2,999 | 0 (0.0%) | 0 (0.0%) |
| $3,000 or more | 2 (1.2%) | 0 (0.0%) |
| Total | 173 (100.0%) | 22 (100.0%) |
Physical Housing Characteristics in Rio Lucio
Housing Structures in Rio Lucio
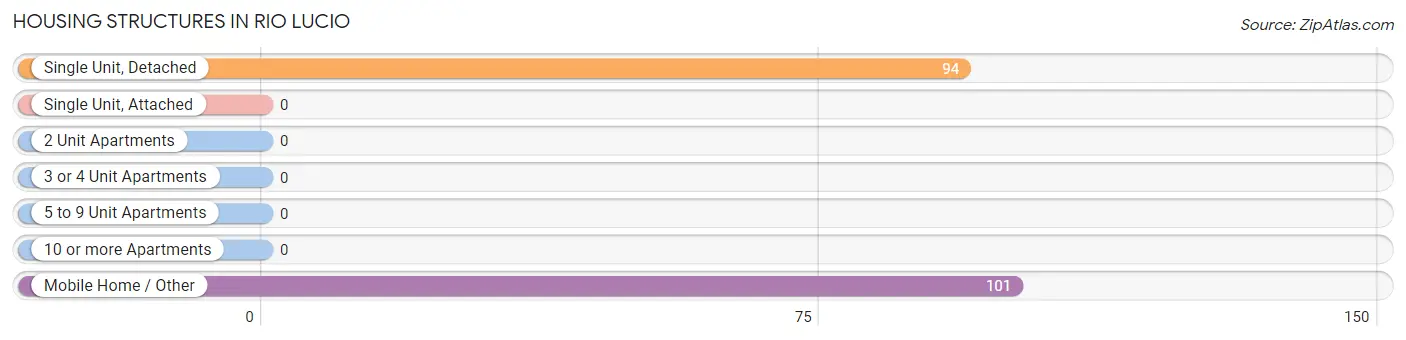
| Structure Type | # Housing Units | % Housing Units |
| Single Unit, Detached | 94 | 48.2% |
| Single Unit, Attached | 0 | 0.0% |
| 2 Unit Apartments | 0 | 0.0% |
| 3 or 4 Unit Apartments | 0 | 0.0% |
| 5 to 9 Unit Apartments | 0 | 0.0% |
| 10 or more Apartments | 0 | 0.0% |
| Mobile Home / Other | 101 | 51.8% |
| Total | 195 | 100.0% |
Housing Structures by Occupancy in Rio Lucio
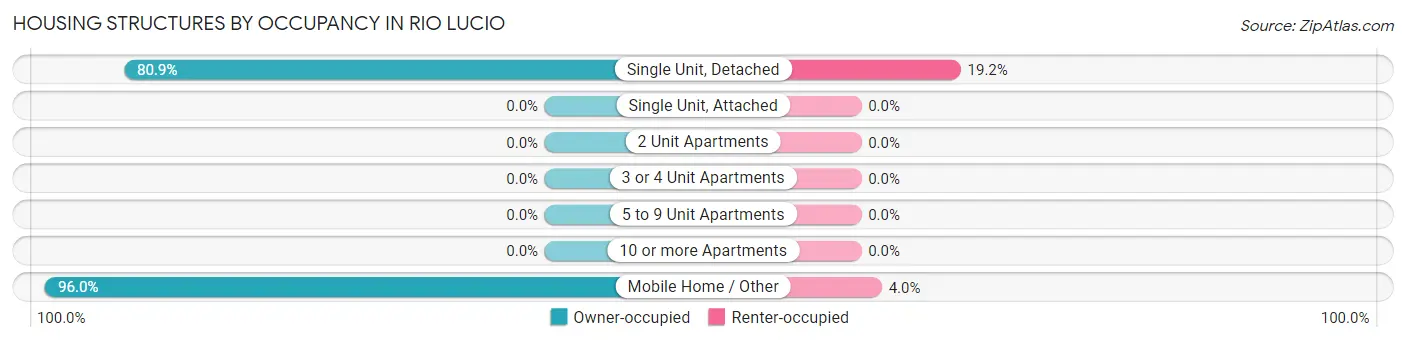
| Structure Type | Owner-occupied | Renter-occupied |
| Single Unit, Detached | 76 (80.8%) | 18 (19.2%) |
| Single Unit, Attached | 0 (0.0%) | 0 (0.0%) |
| 2 Unit Apartments | 0 (0.0%) | 0 (0.0%) |
| 3 or 4 Unit Apartments | 0 (0.0%) | 0 (0.0%) |
| 5 to 9 Unit Apartments | 0 (0.0%) | 0 (0.0%) |
| 10 or more Apartments | 0 (0.0%) | 0 (0.0%) |
| Mobile Home / Other | 97 (96.0%) | 4 (4.0%) |
| Total | 173 (88.7%) | 22 (11.3%) |
Housing Structures by Number of Rooms in Rio Lucio
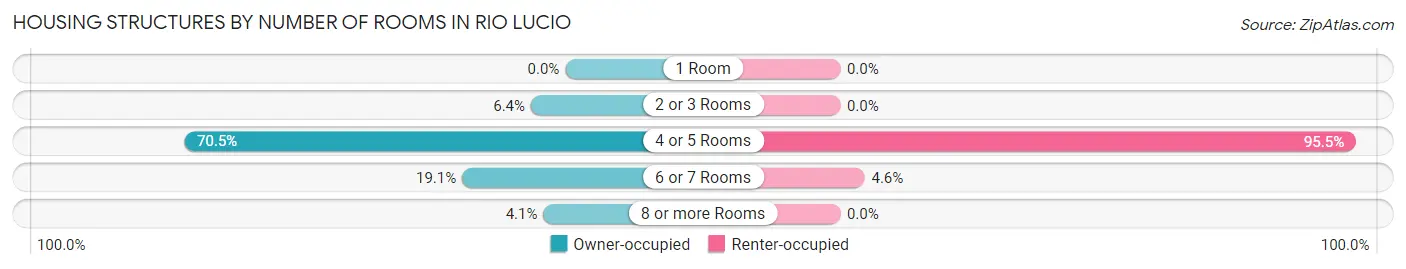
| Number of Rooms | Owner-occupied | Renter-occupied |
| 1 Room | 0 (0.0%) | 0 (0.0%) |
| 2 or 3 Rooms | 11 (6.4%) | 0 (0.0%) |
| 4 or 5 Rooms | 122 (70.5%) | 21 (95.5%) |
| 6 or 7 Rooms | 33 (19.1%) | 1 (4.5%) |
| 8 or more Rooms | 7 (4.1%) | 0 (0.0%) |
| Total | 173 (100.0%) | 22 (100.0%) |
Housing Structure by Heating Type in Rio Lucio
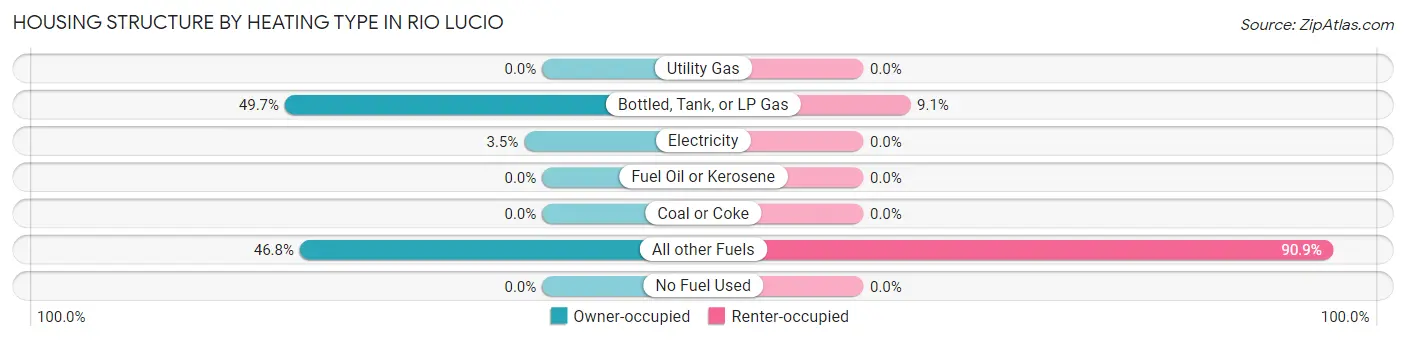
| Heating Type | Owner-occupied | Renter-occupied |
| Utility Gas | 0 (0.0%) | 0 (0.0%) |
| Bottled, Tank, or LP Gas | 86 (49.7%) | 2 (9.1%) |
| Electricity | 6 (3.5%) | 0 (0.0%) |
| Fuel Oil or Kerosene | 0 (0.0%) | 0 (0.0%) |
| Coal or Coke | 0 (0.0%) | 0 (0.0%) |
| All other Fuels | 81 (46.8%) | 20 (90.9%) |
| No Fuel Used | 0 (0.0%) | 0 (0.0%) |
| Total | 173 (100.0%) | 22 (100.0%) |
Household Vehicle Usage in Rio Lucio
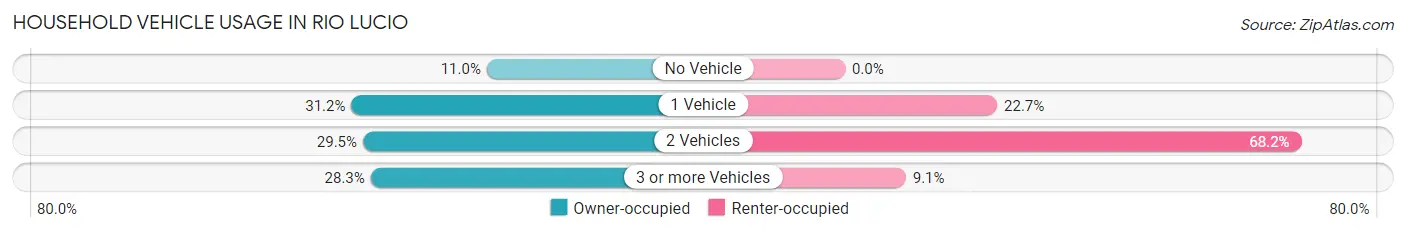
| Vehicles per Household | Owner-occupied | Renter-occupied |
| No Vehicle | 19 (11.0%) | 0 (0.0%) |
| 1 Vehicle | 54 (31.2%) | 5 (22.7%) |
| 2 Vehicles | 51 (29.5%) | 15 (68.2%) |
| 3 or more Vehicles | 49 (28.3%) | 2 (9.1%) |
| Total | 173 (100.0%) | 22 (100.0%) |
Real Estate & Mortgages in Rio Lucio
Real Estate and Mortgage Overview in Rio Lucio
| Characteristic | Without Mortgage | With Mortgage |
| Housing Units | 139 | 34 |
| Median Property Value | $177,900 | $150,000 |
| Median Household Income | $34,353 | $4 |
| Monthly Housing Costs | $388 | $2 |
| Real Estate Taxes | $461 | $1 |
Property Value by Mortgage Status in Rio Lucio
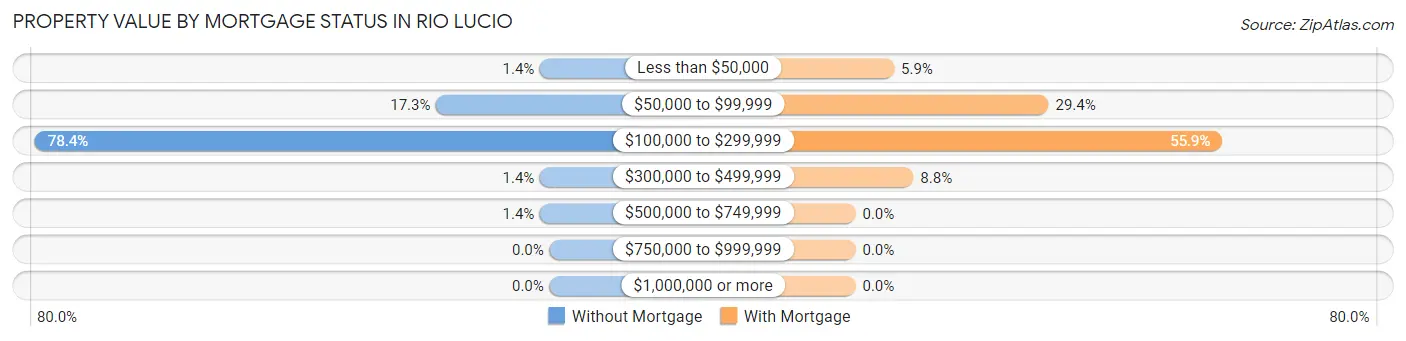
| Property Value | Without Mortgage | With Mortgage |
| Less than $50,000 | 2 (1.4%) | 2 (5.9%) |
| $50,000 to $99,999 | 24 (17.3%) | 10 (29.4%) |
| $100,000 to $299,999 | 109 (78.4%) | 19 (55.9%) |
| $300,000 to $499,999 | 2 (1.4%) | 3 (8.8%) |
| $500,000 to $749,999 | 2 (1.4%) | 0 (0.0%) |
| $750,000 to $999,999 | 0 (0.0%) | 0 (0.0%) |
| $1,000,000 or more | 0 (0.0%) | 0 (0.0%) |
| Total | 139 (100.0%) | 34 (100.0%) |
Household Income by Mortgage Status in Rio Lucio
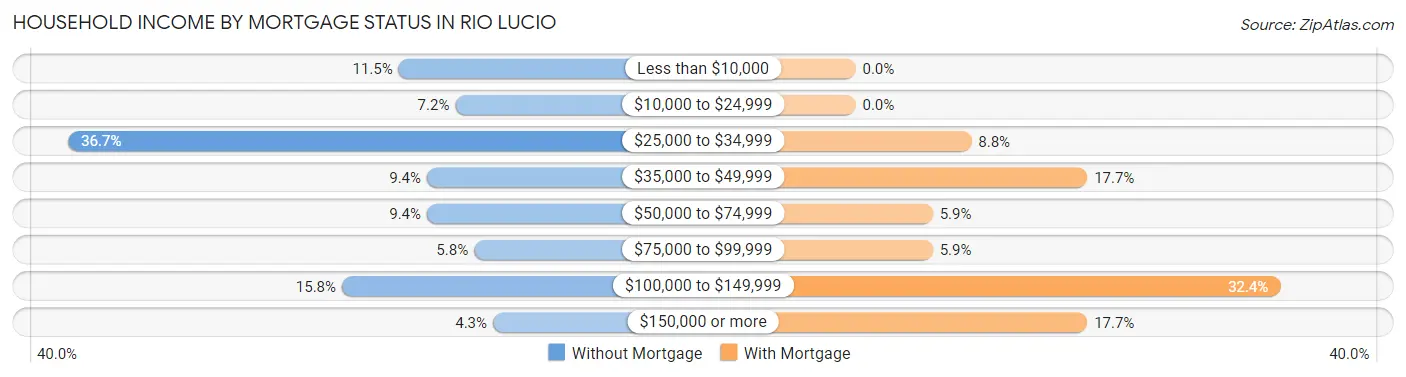
| Household Income | Without Mortgage | With Mortgage |
| Less than $10,000 | 16 (11.5%) | 0 (0.0%) |
| $10,000 to $24,999 | 10 (7.2%) | 0 (0.0%) |
| $25,000 to $34,999 | 51 (36.7%) | 3 (8.8%) |
| $35,000 to $49,999 | 13 (9.3%) | 6 (17.6%) |
| $50,000 to $74,999 | 13 (9.3%) | 2 (5.9%) |
| $75,000 to $99,999 | 8 (5.8%) | 2 (5.9%) |
| $100,000 to $149,999 | 22 (15.8%) | 11 (32.4%) |
| $150,000 or more | 6 (4.3%) | 6 (17.6%) |
| Total | 139 (100.0%) | 34 (100.0%) |
Property Value to Household Income Ratio in Rio Lucio
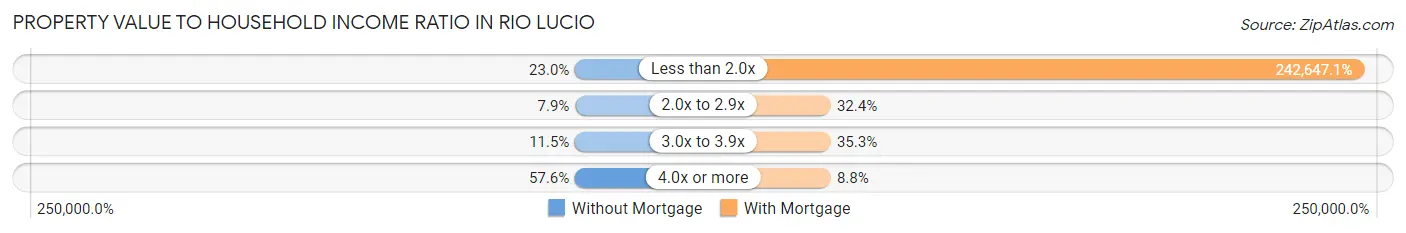
| Value-to-Income Ratio | Without Mortgage | With Mortgage |
| Less than 2.0x | 32 (23.0%) | 82,500 (242,647.1%) |
| 2.0x to 2.9x | 11 (7.9%) | 11 (32.4%) |
| 3.0x to 3.9x | 16 (11.5%) | 12 (35.3%) |
| 4.0x or more | 80 (57.6%) | 3 (8.8%) |
| Total | 139 (100.0%) | 34 (100.0%) |
Real Estate Taxes by Mortgage Status in Rio Lucio
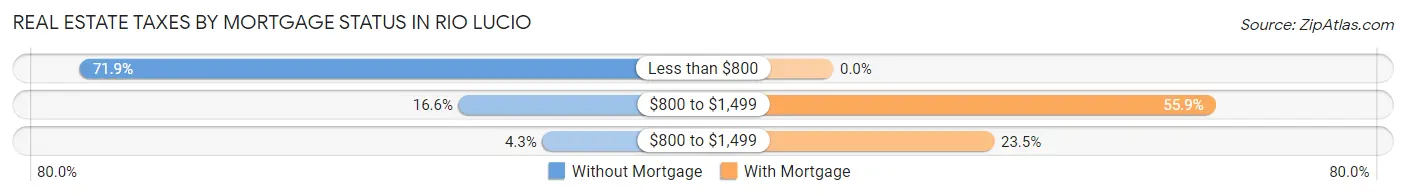
| Property Taxes | Without Mortgage | With Mortgage |
| Less than $800 | 100 (71.9%) | 0 (0.0%) |
| $800 to $1,499 | 23 (16.6%) | 19 (55.9%) |
| $800 to $1,499 | 6 (4.3%) | 8 (23.5%) |
| Total | 139 (100.0%) | 34 (100.0%) |
Health & Disability in Rio Lucio
Health Insurance Coverage by Age in Rio Lucio
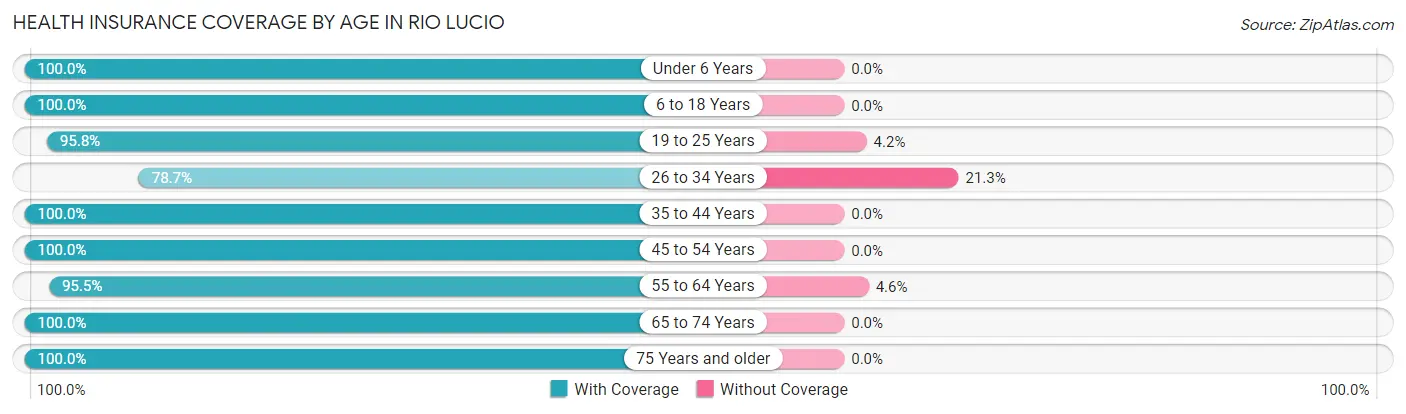
| Age Bracket | With Coverage | Without Coverage |
| Under 6 Years | 18 (100.0%) | 0 (0.0%) |
| 6 to 18 Years | 164 (100.0%) | 0 (0.0%) |
| 19 to 25 Years | 46 (95.8%) | 2 (4.2%) |
| 26 to 34 Years | 48 (78.7%) | 13 (21.3%) |
| 35 to 44 Years | 90 (100.0%) | 0 (0.0%) |
| 45 to 54 Years | 44 (100.0%) | 0 (0.0%) |
| 55 to 64 Years | 63 (95.5%) | 3 (4.5%) |
| 65 to 74 Years | 60 (100.0%) | 0 (0.0%) |
| 75 Years and older | 70 (100.0%) | 0 (0.0%) |
| Total | 603 (97.1%) | 18 (2.9%) |
Health Insurance Coverage by Citizenship Status in Rio Lucio

| Citizenship Status | With Coverage | Without Coverage |
| Native Born | 18 (100.0%) | 0 (0.0%) |
| Foreign Born, Citizen | 164 (100.0%) | 0 (0.0%) |
| Foreign Born, not a Citizen | 46 (95.8%) | 2 (4.2%) |
Health Insurance Coverage by Household Income in Rio Lucio
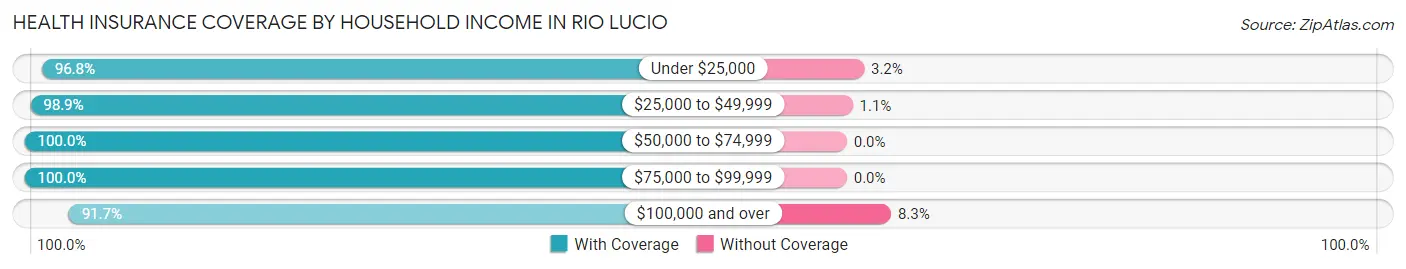
| Household Income | With Coverage | Without Coverage |
| Under $25,000 | 60 (96.8%) | 2 (3.2%) |
| $25,000 to $49,999 | 271 (98.9%) | 3 (1.1%) |
| $50,000 to $74,999 | 66 (100.0%) | 0 (0.0%) |
| $75,000 to $99,999 | 62 (100.0%) | 0 (0.0%) |
| $100,000 and over | 144 (91.7%) | 13 (8.3%) |
Public vs Private Health Insurance Coverage by Age in Rio Lucio
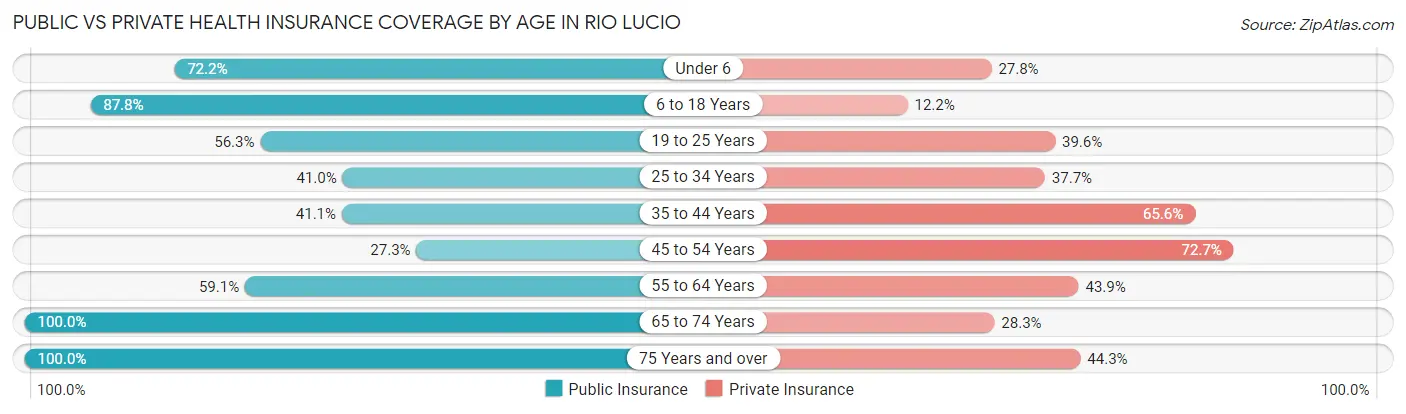
| Age Bracket | Public Insurance | Private Insurance |
| Under 6 | 13 (72.2%) | 5 (27.8%) |
| 6 to 18 Years | 144 (87.8%) | 20 (12.2%) |
| 19 to 25 Years | 27 (56.2%) | 19 (39.6%) |
| 25 to 34 Years | 25 (41.0%) | 23 (37.7%) |
| 35 to 44 Years | 37 (41.1%) | 59 (65.6%) |
| 45 to 54 Years | 12 (27.3%) | 32 (72.7%) |
| 55 to 64 Years | 39 (59.1%) | 29 (43.9%) |
| 65 to 74 Years | 60 (100.0%) | 17 (28.3%) |
| 75 Years and over | 70 (100.0%) | 31 (44.3%) |
| Total | 427 (68.8%) | 235 (37.8%) |
Disability Status by Sex by Age in Rio Lucio
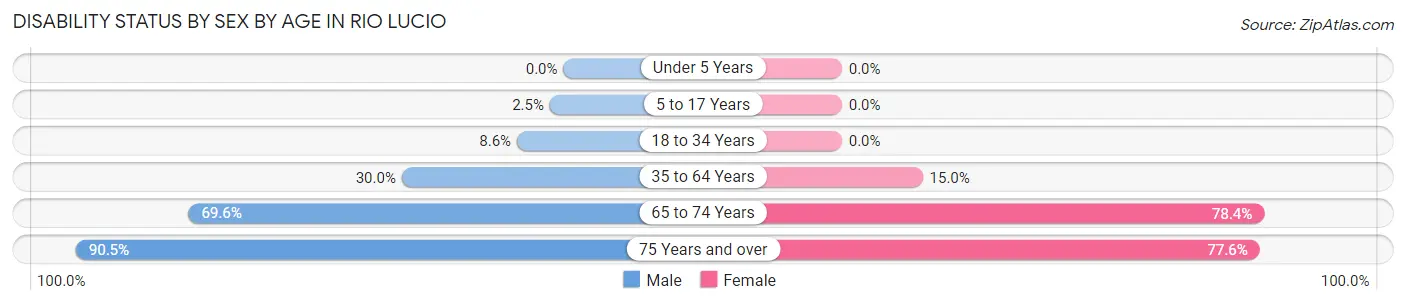
| Age Bracket | Male | Female |
| Under 5 Years | 0 (0.0%) | 0 (0.0%) |
| 5 to 17 Years | 3 (2.5%) | 0 (0.0%) |
| 18 to 34 Years | 10 (8.6%) | 0 (0.0%) |
| 35 to 64 Years | 30 (30.0%) | 15 (15.0%) |
| 65 to 74 Years | 16 (69.6%) | 29 (78.4%) |
| 75 Years and over | 19 (90.5%) | 38 (77.5%) |
Disability Class by Sex by Age in Rio Lucio
Disability Class: Hearing Difficulty
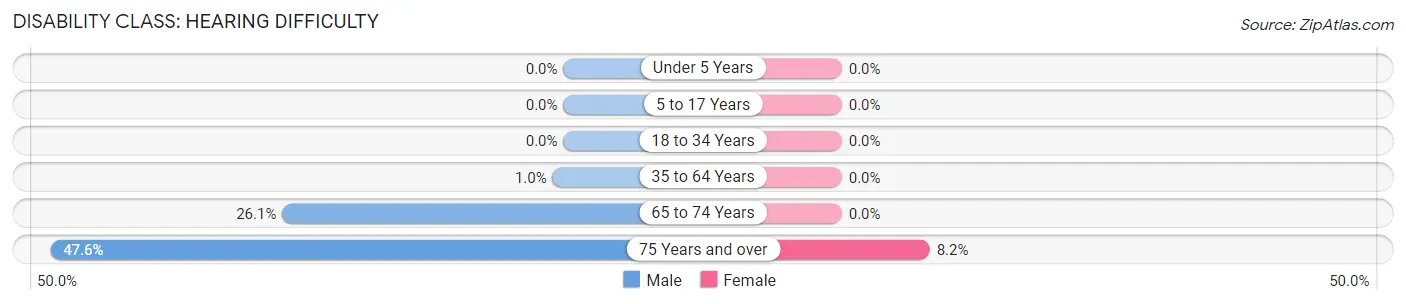
| Age Bracket | Male | Female |
| Under 5 Years | 0 (0.0%) | 0 (0.0%) |
| 5 to 17 Years | 0 (0.0%) | 0 (0.0%) |
| 18 to 34 Years | 0 (0.0%) | 0 (0.0%) |
| 35 to 64 Years | 1 (1.0%) | 0 (0.0%) |
| 65 to 74 Years | 6 (26.1%) | 0 (0.0%) |
| 75 Years and over | 10 (47.6%) | 4 (8.2%) |
Disability Class: Vision Difficulty
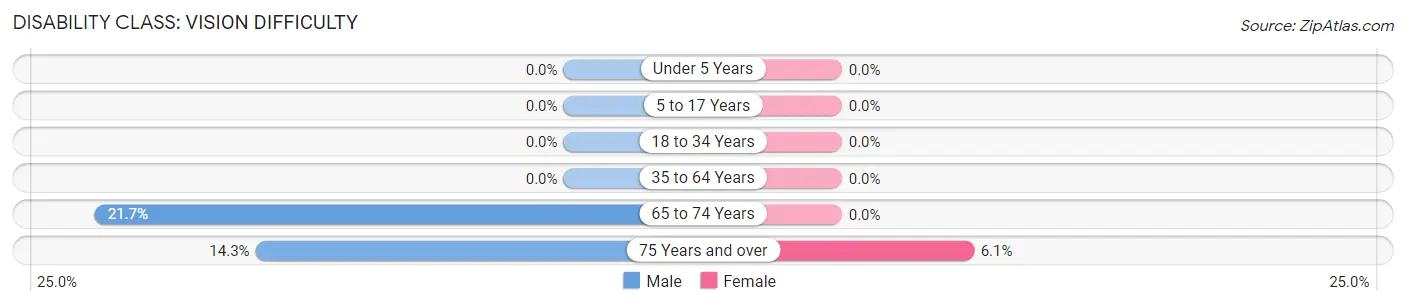
| Age Bracket | Male | Female |
| Under 5 Years | 0 (0.0%) | 0 (0.0%) |
| 5 to 17 Years | 0 (0.0%) | 0 (0.0%) |
| 18 to 34 Years | 0 (0.0%) | 0 (0.0%) |
| 35 to 64 Years | 0 (0.0%) | 0 (0.0%) |
| 65 to 74 Years | 5 (21.7%) | 0 (0.0%) |
| 75 Years and over | 3 (14.3%) | 3 (6.1%) |
Disability Class: Cognitive Difficulty
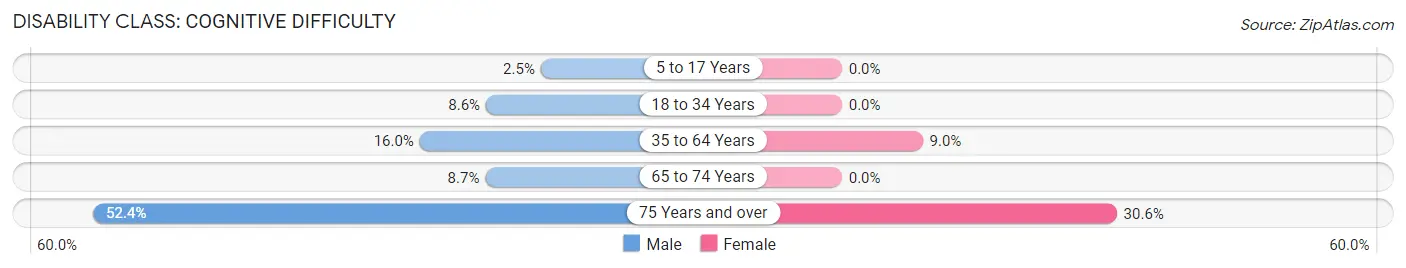
| Age Bracket | Male | Female |
| 5 to 17 Years | 3 (2.5%) | 0 (0.0%) |
| 18 to 34 Years | 10 (8.6%) | 0 (0.0%) |
| 35 to 64 Years | 16 (16.0%) | 9 (9.0%) |
| 65 to 74 Years | 2 (8.7%) | 0 (0.0%) |
| 75 Years and over | 11 (52.4%) | 15 (30.6%) |
Disability Class: Ambulatory Difficulty
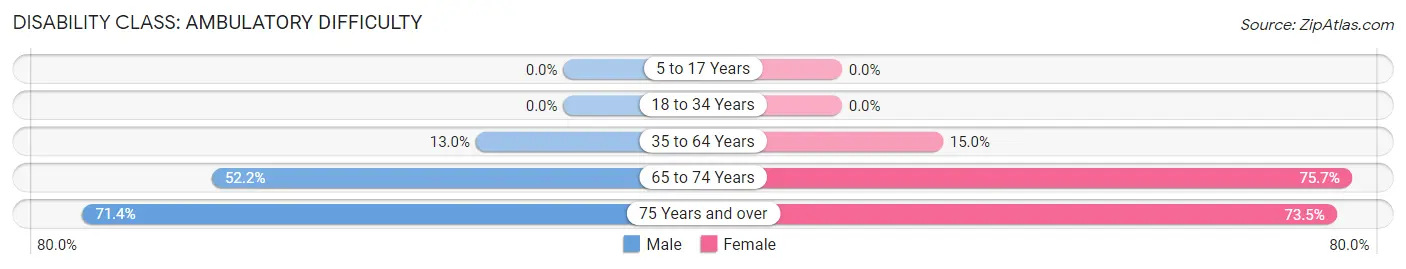
| Age Bracket | Male | Female |
| 5 to 17 Years | 0 (0.0%) | 0 (0.0%) |
| 18 to 34 Years | 0 (0.0%) | 0 (0.0%) |
| 35 to 64 Years | 13 (13.0%) | 15 (15.0%) |
| 65 to 74 Years | 12 (52.2%) | 28 (75.7%) |
| 75 Years and over | 15 (71.4%) | 36 (73.5%) |
Disability Class: Self-Care Difficulty
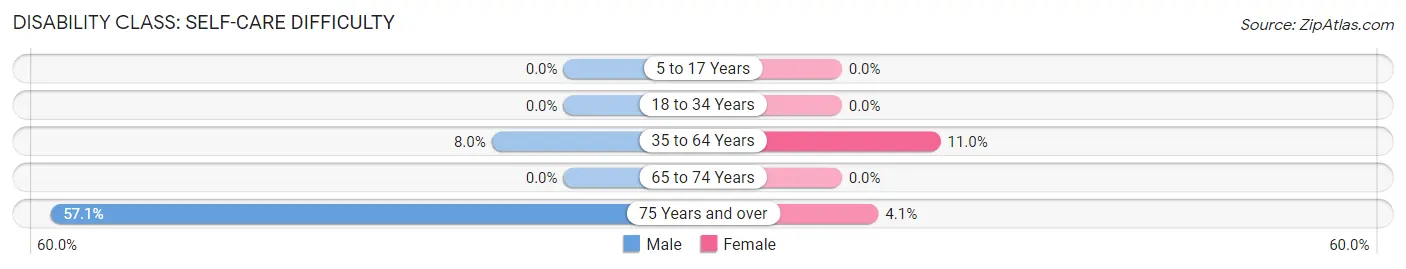
| Age Bracket | Male | Female |
| 5 to 17 Years | 0 (0.0%) | 0 (0.0%) |
| 18 to 34 Years | 0 (0.0%) | 0 (0.0%) |
| 35 to 64 Years | 8 (8.0%) | 11 (11.0%) |
| 65 to 74 Years | 0 (0.0%) | 0 (0.0%) |
| 75 Years and over | 12 (57.1%) | 2 (4.1%) |
Technology Access in Rio Lucio
Computing Device Access in Rio Lucio
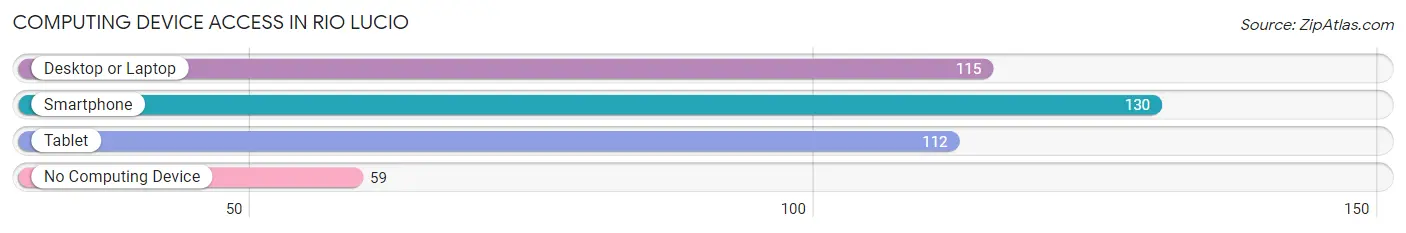
| Device Type | # Households | % Households |
| Desktop or Laptop | 115 | 59.0% |
| Smartphone | 130 | 66.7% |
| Tablet | 112 | 57.4% |
| No Computing Device | 59 | 30.3% |
| Total | 195 | 100.0% |
Internet Access in Rio Lucio
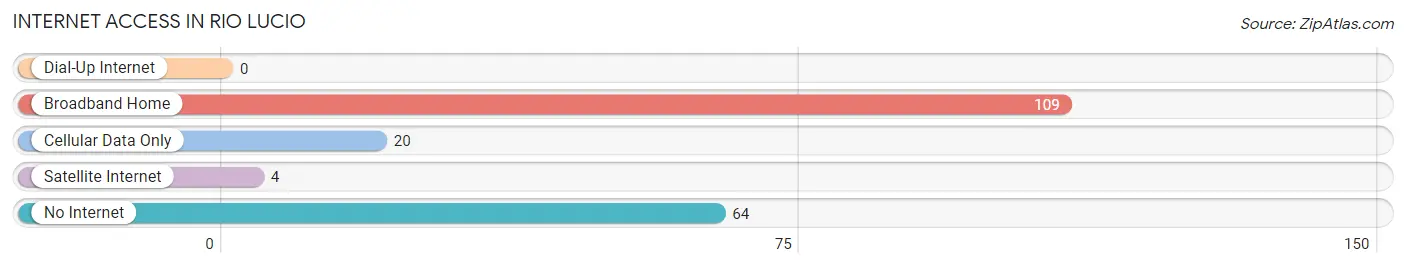
| Internet Type | # Households | % Households |
| Dial-Up Internet | 0 | 0.0% |
| Broadband Home | 109 | 55.9% |
| Cellular Data Only | 20 | 10.3% |
| Satellite Internet | 4 | 2.1% |
| No Internet | 64 | 32.8% |
| Total | 195 | 100.0% |
Rio Lucio Summary
Rio Lucio, New Mexico is a small unincorporated community located in the northern part of the state. It is situated in the San Juan Basin, which is part of the larger Colorado Plateau. The area is known for its rich cultural heritage, diverse geography, and unique economy.
Geography
Rio Lucio is located in the San Juan Basin, which is part of the larger Colorado Plateau. The area is characterized by its high elevation, with the highest point in the area being the summit of the San Juan Mountains at an elevation of 8,749 feet. The area is also known for its rugged terrain, with steep canyons, mesas, and buttes. The climate in the area is semi-arid, with hot summers and cold winters.
The area is home to a variety of wildlife, including mule deer, elk, bighorn sheep, and mountain lions. The area is also home to a variety of birds, including bald eagles, hawks, and owls.
History
Rio Lucio was first settled in the late 1800s by Spanish settlers. The area was originally known as San Juan de los Luceros, which translates to “Saint John of the Lights.” The area was later renamed Rio Lucio, which translates to “River of Light.”
The area was originally used for ranching and farming, but in the early 1900s, the area began to be used for mining. The area was home to several mines, including the Rio Lucio Mine, which was one of the largest in the area. The mine was in operation until the 1950s, when it was closed due to declining ore reserves.
Economy
The economy of Rio Lucio is largely based on agriculture and tourism. The area is home to several farms, which produce a variety of crops, including alfalfa, hay, and wheat. The area is also home to several ranches, which raise cattle and sheep.
The area is also home to several tourist attractions, including the Rio Lucio Museum, which showcases the area’s history and culture. The area is also home to several outdoor recreation areas, including the Rio Lucio National Wildlife Refuge, which is home to a variety of wildlife.
Demographics
As of the 2010 census, the population of Rio Lucio was 1,093. The population is largely Hispanic, with the majority of the population being of Mexican descent. The median household income in the area is $31,250, and the median age is 37.
Conclusion
Rio Lucio, New Mexico is a small unincorporated community located in the northern part of the state. It is situated in the San Juan Basin, which is part of the larger Colorado Plateau. The area is known for its rich cultural heritage, diverse geography, and unique economy. The area is home to a variety of wildlife, and is largely based on agriculture and tourism. The population of Rio Lucio is largely Hispanic, with the majority of the population being of Mexican descent. The median household income in the area is $31,250, and the median age is 37.
Common Questions
What is Per Capita Income in Rio Lucio?
Per Capita income in Rio Lucio is $25,009.
What is the Median Family Income in Rio Lucio?
Median Family Income in Rio Lucio is $50,000.
What is the Median Household income in Rio Lucio?
Median Household Income in Rio Lucio is $43,750.
What is Income or Wage Gap in Rio Lucio?
Income or Wage Gap in Rio Lucio is 4.6%.
Women in Rio Lucio earn 95.4 cents for every dollar earned by a man.
What is Inequality or Gini Index in Rio Lucio?
Inequality or Gini Index in Rio Lucio is 0.44.
What is the Total Population of Rio Lucio?
Total Population of Rio Lucio is 621.
What is the Total Male Population of Rio Lucio?
Total Male Population of Rio Lucio is 388.
What is the Total Female Population of Rio Lucio?
Total Female Population of Rio Lucio is 233.
What is the Ratio of Males per 100 Females in Rio Lucio?
There are 166.52 Males per 100 Females in Rio Lucio.
What is the Ratio of Females per 100 Males in Rio Lucio?
There are 60.05 Females per 100 Males in Rio Lucio.
What is the Median Population Age in Rio Lucio?
Median Population Age in Rio Lucio is 38.6 Years.
What is the Average Family Size in Rio Lucio
Average Family Size in Rio Lucio is 5.0 People.
What is the Average Household Size in Rio Lucio
Average Household Size in Rio Lucio is 3.2 People.
How Large is the Labor Force in Rio Lucio?
There are 229 People in the Labor Forcein in Rio Lucio.
What is the Percentage of People in the Labor Force in Rio Lucio?
46.9% of People are in the Labor Force in Rio Lucio.
What is the Unemployment Rate in Rio Lucio?
Unemployment Rate in Rio Lucio is 7.4%.