Oak Ridge, NC Map & Demographics
Oak Ridge Map
Oak Ridge Overview
$60,198
PER CAPITA INCOME
$157,465
AVG FAMILY INCOME
$146,131
AVG HOUSEHOLD INCOME
66.7%
WAGE / INCOME GAP [ % ]
33.3¢/ $1
WAGE / INCOME GAP [ $ ]
0.42
INEQUALITY / GINI INDEX
7,637
TOTAL POPULATION
3,967
MALE POPULATION
3,670
FEMALE POPULATION
108.09
MALES / 100 FEMALES
92.51
FEMALES / 100 MALES
46.8
MEDIAN AGE
3.2
AVG FAMILY SIZE
2.9
AVG HOUSEHOLD SIZE
3,798
LABOR FORCE [ PEOPLE ]
64.1%
PERCENT IN LABOR FORCE
3.8%
UNEMPLOYMENT RATE
Oak Ridge Zip Codes
Oak Ridge Area Codes
Income in Oak Ridge
Income Overview in Oak Ridge
Per Capita Income in Oak Ridge is $60,198, while median incomes of families and households are $157,465 and $146,131 respectively.
| Characteristic | Number | Measure |
| Per Capita Income | 7,637 | $60,198 |
| Median Family Income | 2,273 | $157,465 |
| Mean Family Income | 2,273 | $191,100 |
| Median Household Income | 2,617 | $146,131 |
| Mean Household Income | 2,617 | $173,654 |
| Income Deficit | 2,273 | $0 |
| Wage / Income Gap (%) | 7,637 | 66.71% |
| Wage / Income Gap ($) | 7,637 | 33.29¢ per $1 |
| Gini / Inequality Index | 7,637 | 0.42 |
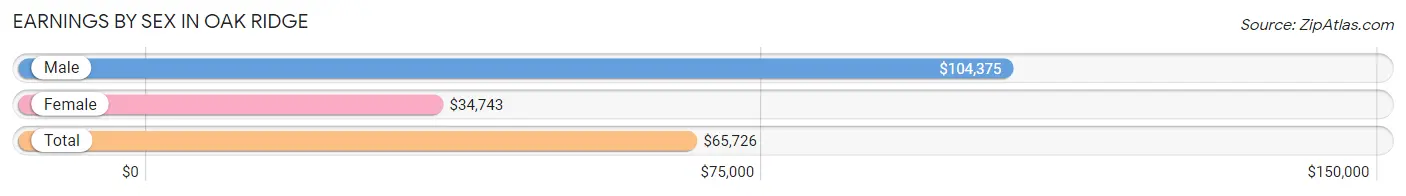
Earnings by Sex in Oak Ridge
Average Earnings in Oak Ridge are $65,726, $104,375 for men and $34,743 for women, a difference of 66.7%.
| Sex | Number | Average Earnings |
| Male | 2,296 (59.2%) | $104,375 |
| Female | 1,583 (40.8%) | $34,743 |
| Total | 3,879 (100.0%) | $65,726 |
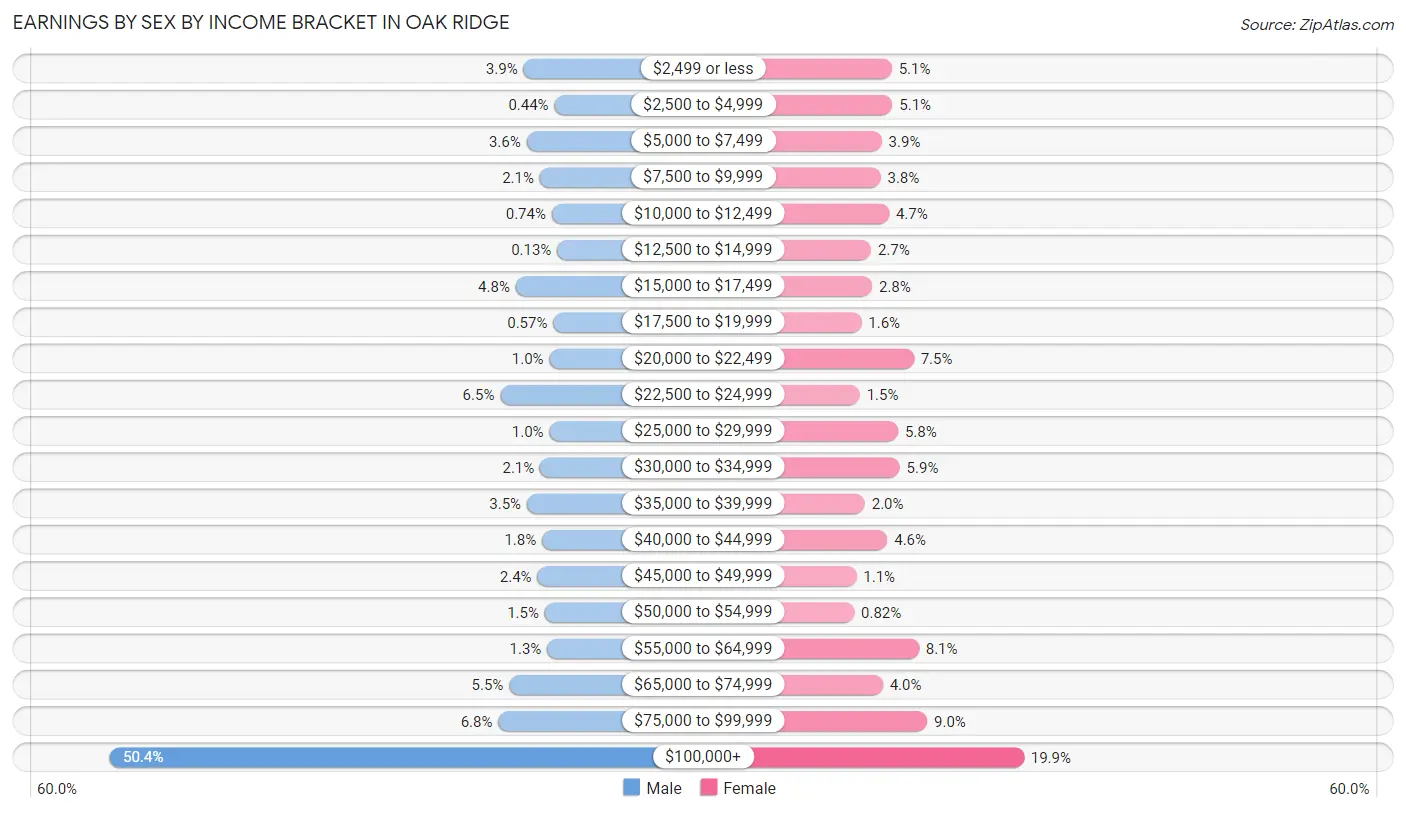
Earnings by Sex by Income Bracket in Oak Ridge
The most common earnings brackets in Oak Ridge are $100,000+ for men (1,157 | 50.4%) and $100,000+ for women (315 | 19.9%).
| Income | Male | Female |
| $2,499 or less | 90 (3.9%) | 80 (5.1%) |
| $2,500 to $4,999 | 10 (0.4%) | 81 (5.1%) |
| $5,000 to $7,499 | 82 (3.6%) | 62 (3.9%) |
| $7,500 to $9,999 | 48 (2.1%) | 60 (3.8%) |
| $10,000 to $12,499 | 17 (0.7%) | 75 (4.7%) |
| $12,500 to $14,999 | 3 (0.1%) | 43 (2.7%) |
| $15,000 to $17,499 | 110 (4.8%) | 45 (2.8%) |
| $17,500 to $19,999 | 13 (0.6%) | 26 (1.6%) |
| $20,000 to $22,499 | 23 (1.0%) | 119 (7.5%) |
| $22,500 to $24,999 | 150 (6.5%) | 23 (1.5%) |
| $25,000 to $29,999 | 23 (1.0%) | 91 (5.8%) |
| $30,000 to $34,999 | 47 (2.1%) | 94 (5.9%) |
| $35,000 to $39,999 | 81 (3.5%) | 32 (2.0%) |
| $40,000 to $44,999 | 42 (1.8%) | 72 (4.5%) |
| $45,000 to $49,999 | 54 (2.4%) | 17 (1.1%) |
| $50,000 to $54,999 | 35 (1.5%) | 13 (0.8%) |
| $55,000 to $64,999 | 29 (1.3%) | 128 (8.1%) |
| $65,000 to $74,999 | 127 (5.5%) | 64 (4.0%) |
| $75,000 to $99,999 | 155 (6.8%) | 143 (9.0%) |
| $100,000+ | 1,157 (50.4%) | 315 (19.9%) |
| Total | 2,296 (100.0%) | 1,583 (100.0%) |
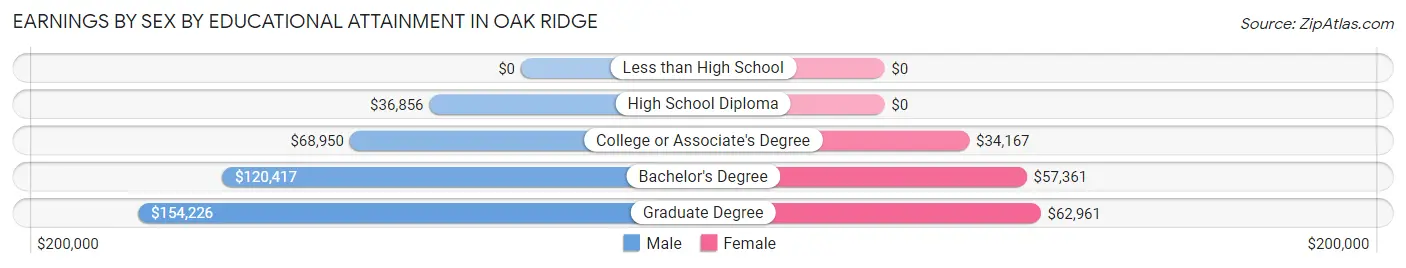
Earnings by Sex by Educational Attainment in Oak Ridge
Average earnings in Oak Ridge are $112,991 for men and $41,830 for women, a difference of 63.0%. Men with an educational attainment of graduate degree enjoy the highest average annual earnings of $154,226, while those with high school diploma education earn the least with $36,856. Women with an educational attainment of graduate degree earn the most with the average annual earnings of $62,961, while those with college or associate's degree education have the smallest earnings of $34,167.
| Educational Attainment | Male Income | Female Income |
| Less than High School | - | - |
| High School Diploma | $36,856 | $0 |
| College or Associate's Degree | $68,950 | $34,167 |
| Bachelor's Degree | $120,417 | $57,361 |
| Graduate Degree | $154,226 | $62,961 |
| Total | $112,991 | $41,830 |
Family Income in Oak Ridge
Family Income Brackets in Oak Ridge
According to the Oak Ridge family income data, there are 768 families falling into the $200,000+ income range, which is the most common income bracket and makes up 33.8% of all families. Conversely, the less than $10,000 income bracket is the least frequent group with only 9 families (0.4%) belonging to this category.
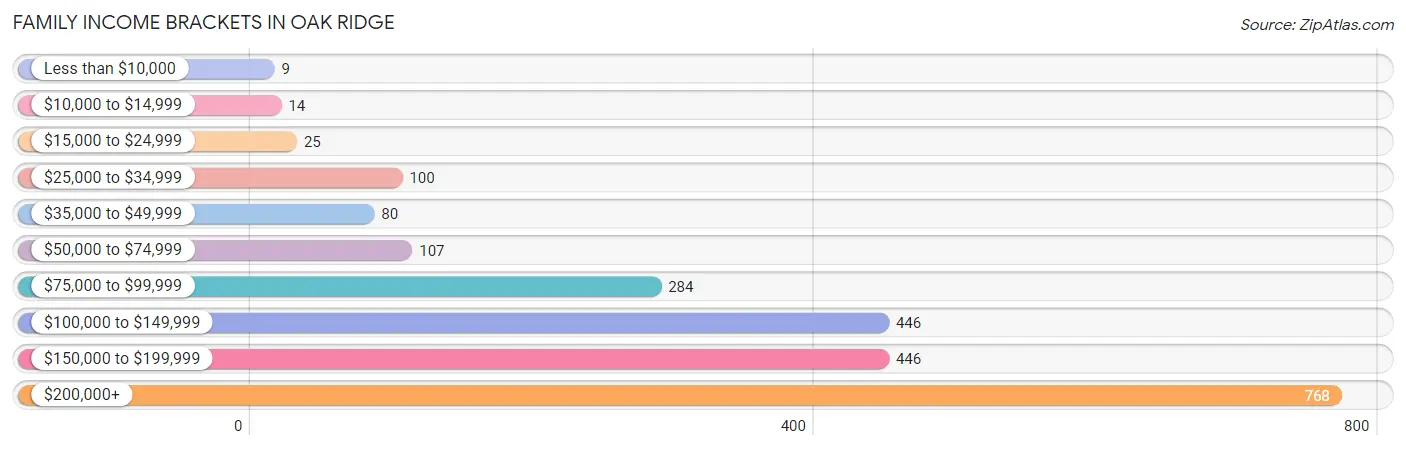
| Income Bracket | # Families | % Families |
| Less than $10,000 | 9 | 0.4% |
| $10,000 to $14,999 | 14 | 0.6% |
| $15,000 to $24,999 | 25 | 1.1% |
| $25,000 to $34,999 | 100 | 4.4% |
| $35,000 to $49,999 | 80 | 3.5% |
| $50,000 to $74,999 | 107 | 4.7% |
| $75,000 to $99,999 | 284 | 12.5% |
| $100,000 to $149,999 | 446 | 19.6% |
| $150,000 to $199,999 | 446 | 19.6% |
| $200,000+ | 768 | 33.8% |
Family Income by Famaliy Size in Oak Ridge
5-person families (223 | 9.8%) account for the highest median family income in Oak Ridge with $187,393 per family, while 2-person families (933 | 41.0%) have the highest median income of $63,314 per family member.
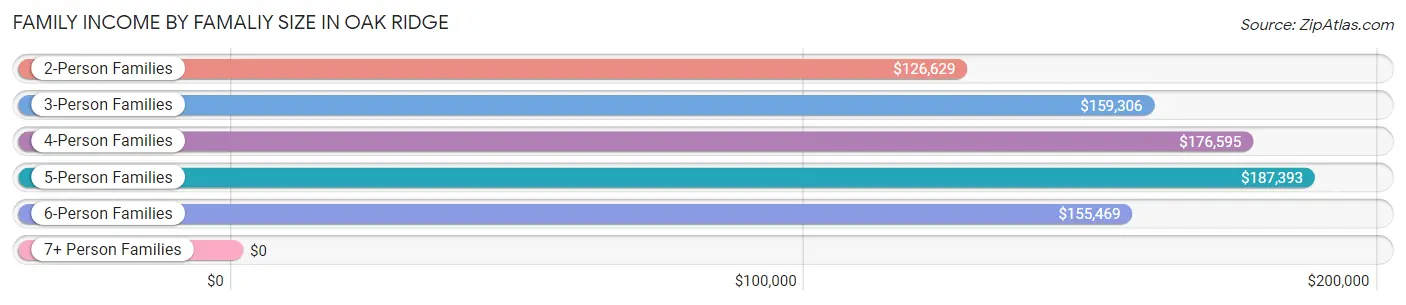
| Income Bracket | # Families | Median Income |
| 2-Person Families | 933 (41.0%) | $126,629 |
| 3-Person Families | 618 (27.2%) | $159,306 |
| 4-Person Families | 409 (18.0%) | $176,595 |
| 5-Person Families | 223 (9.8%) | $187,393 |
| 6-Person Families | 62 (2.7%) | $155,469 |
| 7+ Person Families | 28 (1.2%) | $0 |
| Total | 2,273 (100.0%) | $157,465 |
Family Income by Number of Earners in Oak Ridge
The median family income in Oak Ridge is $157,465, with families comprising 2 earners (998) having the highest median family income of $194,758, while families with no earners (252) have the lowest median family income of $49,762, accounting for 43.9% and 11.1% of families, respectively.
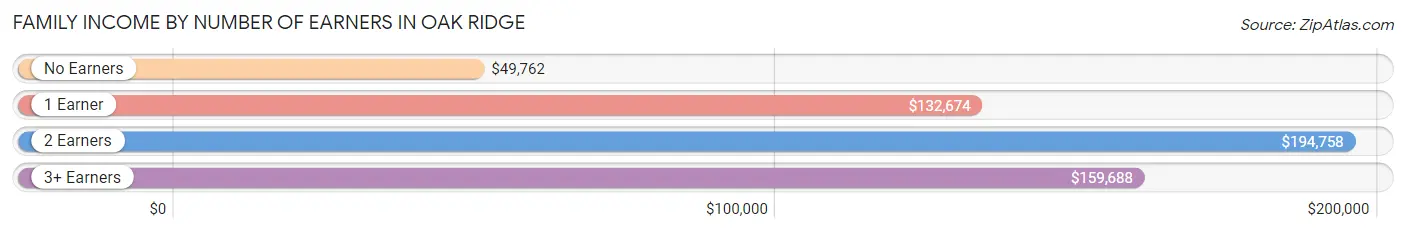
| Number of Earners | # Families | Median Income |
| No Earners | 252 (11.1%) | $49,762 |
| 1 Earner | 721 (31.7%) | $132,674 |
| 2 Earners | 998 (43.9%) | $194,758 |
| 3+ Earners | 302 (13.3%) | $159,688 |
| Total | 2,273 (100.0%) | $157,465 |
Household Income in Oak Ridge
Household Income Brackets in Oak Ridge
With 780 households falling in the category, the $200,000+ income range is the most frequent in Oak Ridge, accounting for 29.8% of all households. In contrast, only 21 households (0.8%) fall into the $10,000 to $14,999 income bracket, making it the least populous group.
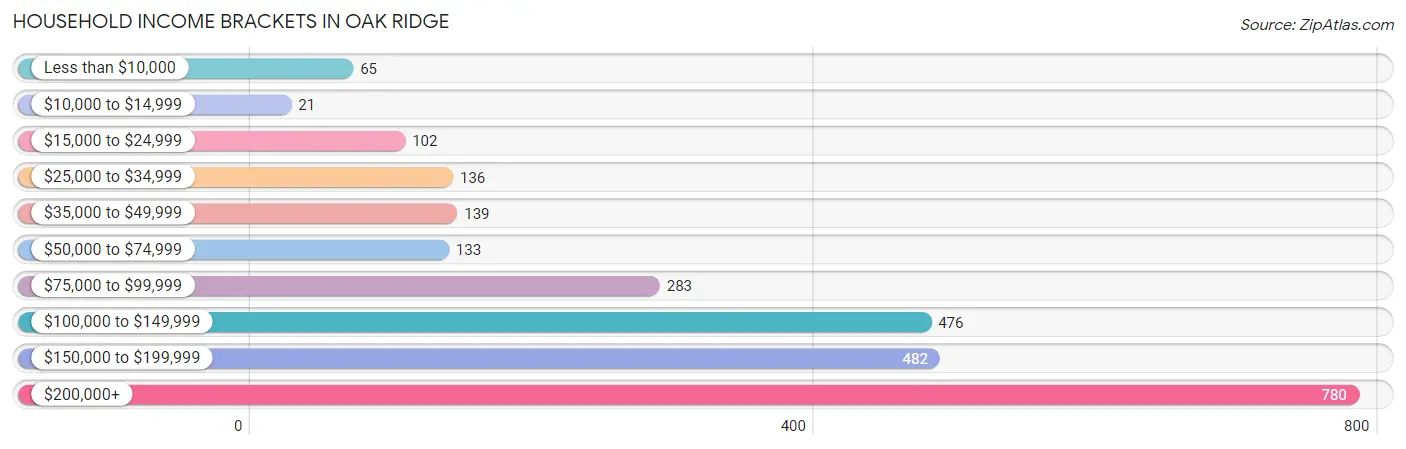
| Income Bracket | # Households | % Households |
| Less than $10,000 | 65 | 2.5% |
| $10,000 to $14,999 | 21 | 0.8% |
| $15,000 to $24,999 | 102 | 3.9% |
| $25,000 to $34,999 | 136 | 5.2% |
| $35,000 to $49,999 | 139 | 5.3% |
| $50,000 to $74,999 | 133 | 5.1% |
| $75,000 to $99,999 | 283 | 10.8% |
| $100,000 to $149,999 | 476 | 18.2% |
| $150,000 to $199,999 | 482 | 18.4% |
| $200,000+ | 780 | 29.8% |
Household Income by Householder Age in Oak Ridge
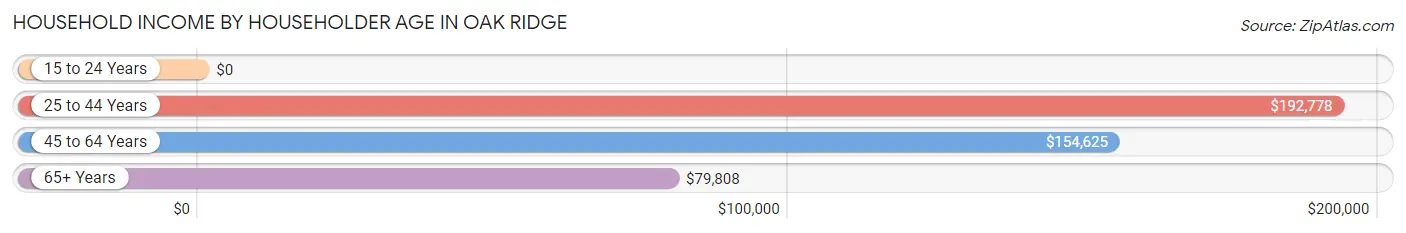
The median household income in Oak Ridge is $146,131, with the highest median household income of $192,778 found in the 25 to 44 years age bracket for the primary householder. A total of 562 households (21.5%) fall into this category.
| Income Bracket | # Households | Median Income |
| 15 to 24 Years | 0 (0.0%) | $0 |
| 25 to 44 Years | 562 (21.5%) | $192,778 |
| 45 to 64 Years | 1,427 (54.5%) | $154,625 |
| 65+ Years | 628 (24.0%) | $79,808 |
| Total | 2,617 (100.0%) | $146,131 |
Poverty in Oak Ridge
Income Below Poverty by Sex and Age in Oak Ridge
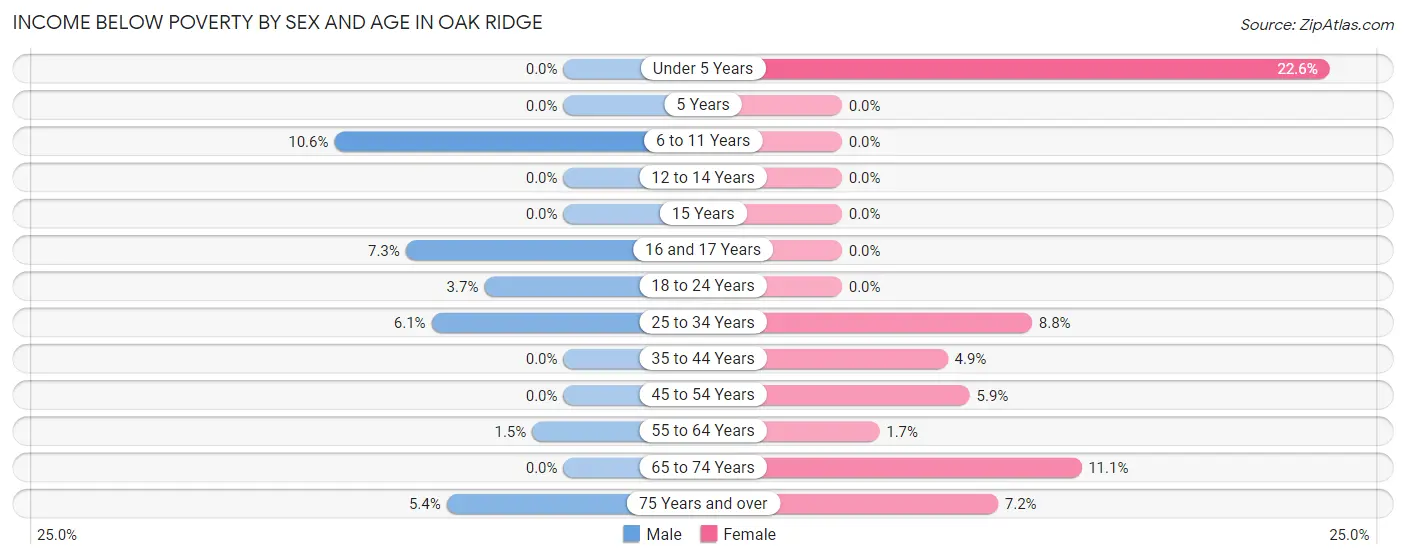
With 2.5% poverty level for males and 4.8% for females among the residents of Oak Ridge, 6 to 11 year old males and under 5 year old females are the most vulnerable to poverty, with 37 males (10.6%) and 31 females (22.6%) in their respective age groups living below the poverty level.
| Age Bracket | Male | Female |
| Under 5 Years | 0 (0.0%) | 31 (22.6%) |
| 5 Years | 0 (0.0%) | 0 (0.0%) |
| 6 to 11 Years | 37 (10.6%) | 0 (0.0%) |
| 12 to 14 Years | 0 (0.0%) | 0 (0.0%) |
| 15 Years | 0 (0.0%) | 0 (0.0%) |
| 16 and 17 Years | 9 (7.3%) | 0 (0.0%) |
| 18 to 24 Years | 9 (3.7%) | 0 (0.0%) |
| 25 to 34 Years | 20 (6.1%) | 9 (8.8%) |
| 35 to 44 Years | 0 (0.0%) | 26 (4.9%) |
| 45 to 54 Years | 0 (0.0%) | 36 (5.9%) |
| 55 to 64 Years | 13 (1.5%) | 12 (1.7%) |
| 65 to 74 Years | 0 (0.0%) | 46 (11.1%) |
| 75 Years and over | 11 (5.4%) | 16 (7.2%) |
| Total | 99 (2.5%) | 176 (4.8%) |
Income Above Poverty by Sex and Age in Oak Ridge
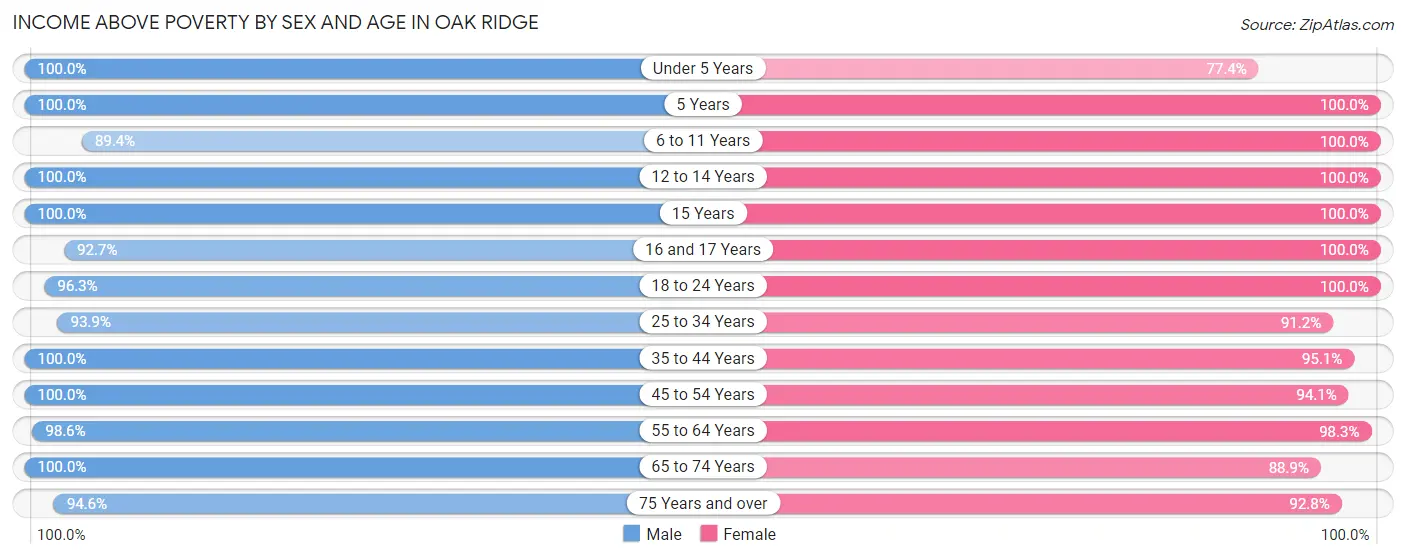
According to the poverty statistics in Oak Ridge, males aged under 5 years and females aged 5 years are the age groups that are most secure financially, with 100.0% of males and 100.0% of females in these age groups living above the poverty line.
| Age Bracket | Male | Female |
| Under 5 Years | 184 (100.0%) | 106 (77.4%) |
| 5 Years | 84 (100.0%) | 16 (100.0%) |
| 6 to 11 Years | 311 (89.4%) | 324 (100.0%) |
| 12 to 14 Years | 108 (100.0%) | 291 (100.0%) |
| 15 Years | 112 (100.0%) | 108 (100.0%) |
| 16 and 17 Years | 114 (92.7%) | 160 (100.0%) |
| 18 to 24 Years | 236 (96.3%) | 71 (100.0%) |
| 25 to 34 Years | 307 (93.9%) | 93 (91.2%) |
| 35 to 44 Years | 385 (100.0%) | 503 (95.1%) |
| 45 to 54 Years | 661 (100.0%) | 571 (94.1%) |
| 55 to 64 Years | 883 (98.6%) | 678 (98.3%) |
| 65 to 74 Years | 291 (100.0%) | 368 (88.9%) |
| 75 Years and over | 192 (94.6%) | 205 (92.8%) |
| Total | 3,868 (97.5%) | 3,494 (95.2%) |
Income Below Poverty Among Married-Couple Families in Oak Ridge
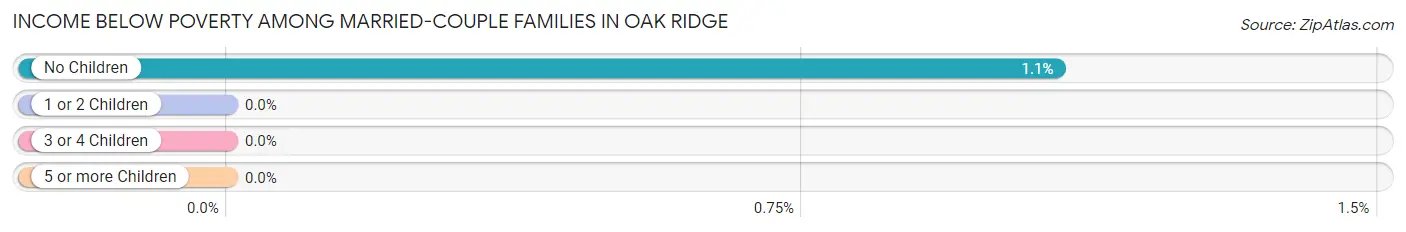
The poverty statistics for married-couple families in Oak Ridge show that 0.6% or 13 of the total 2,107 families live below the poverty line. Families with no children have the highest poverty rate of 1.1%, comprising of 13 families. On the other hand, families with 1 or 2 children have the lowest poverty rate of 0.0%, which includes 0 families.
| Children | Above Poverty | Below Poverty |
| No Children | 1,190 (98.9%) | 13 (1.1%) |
| 1 or 2 Children | 666 (100.0%) | 0 (0.0%) |
| 3 or 4 Children | 238 (100.0%) | 0 (0.0%) |
| 5 or more Children | 0 (0.0%) | 0 (0.0%) |
| Total | 2,094 (99.4%) | 13 (0.6%) |
Income Below Poverty Among Single-Parent Households in Oak Ridge
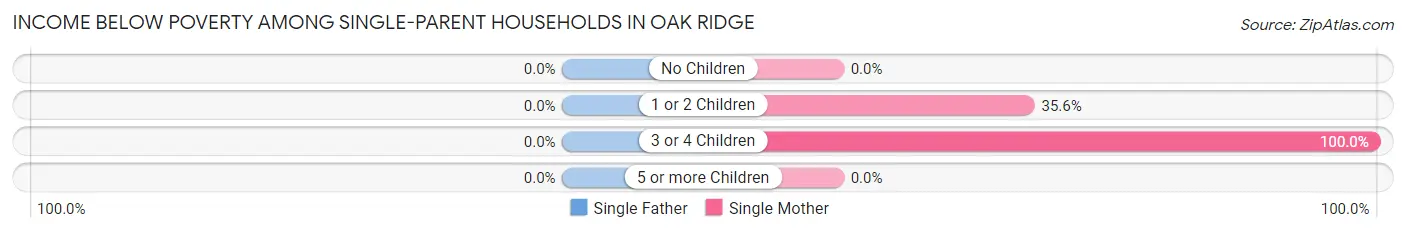
| Children | Single Father | Single Mother |
| No Children | 0 (0.0%) | 0 (0.0%) |
| 1 or 2 Children | 0 (0.0%) | 16 (35.6%) |
| 3 or 4 Children | 0 (0.0%) | 16 (100.0%) |
| 5 or more Children | 0 (0.0%) | 0 (0.0%) |
| Total | 0 (0.0%) | 32 (28.1%) |
Income Below Poverty Among Married-Couple vs Single-Parent Households in Oak Ridge
The poverty data for Oak Ridge shows that 13 of the married-couple family households (0.6%) and 32 of the single-parent households (19.3%) are living below the poverty level. Within the married-couple family households, those with no children have the highest poverty rate, with 13 households (1.1%) falling below the poverty line. Among the single-parent households, those with 3 or 4 children have the highest poverty rate, with 16 household (100.0%) living below poverty.
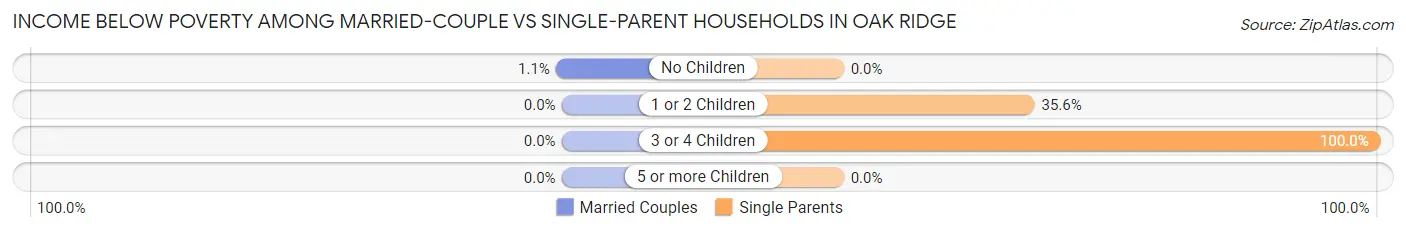
| Children | Married-Couple Families | Single-Parent Households |
| No Children | 13 (1.1%) | 0 (0.0%) |
| 1 or 2 Children | 0 (0.0%) | 16 (35.6%) |
| 3 or 4 Children | 0 (0.0%) | 16 (100.0%) |
| 5 or more Children | 0 (0.0%) | 0 (0.0%) |
| Total | 13 (0.6%) | 32 (19.3%) |
Race in Oak Ridge
The most populous races in Oak Ridge are White / Caucasian (5,814 | 76.1%), Asian (938 | 12.3%), and Some other Race (356 | 4.7%).
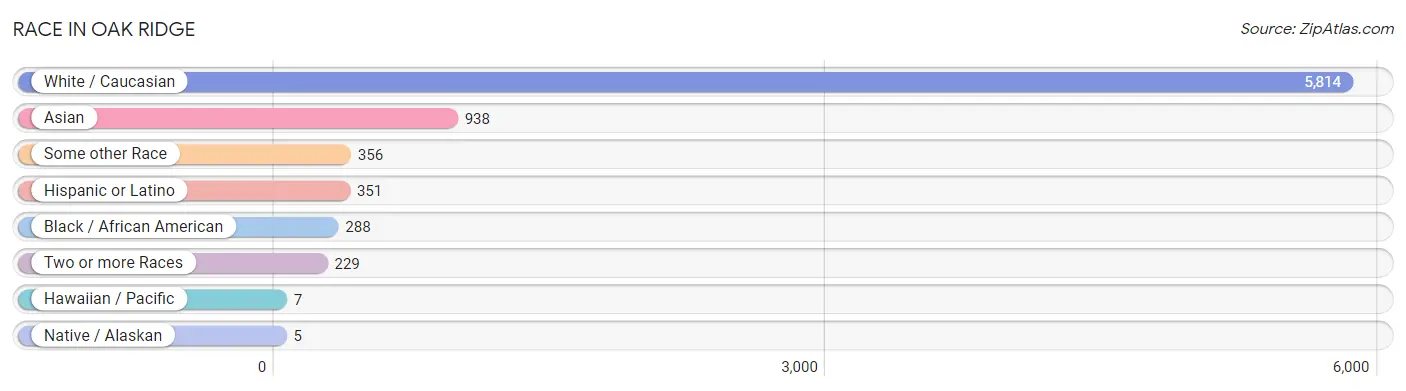
| Race | # Population | % Population |
| Asian | 938 | 12.3% |
| Black / African American | 288 | 3.8% |
| Hawaiian / Pacific | 7 | 0.1% |
| Hispanic or Latino | 351 | 4.6% |
| Native / Alaskan | 5 | 0.1% |
| White / Caucasian | 5,814 | 76.1% |
| Two or more Races | 229 | 3.0% |
| Some other Race | 356 | 4.7% |
| Total | 7,637 | 100.0% |
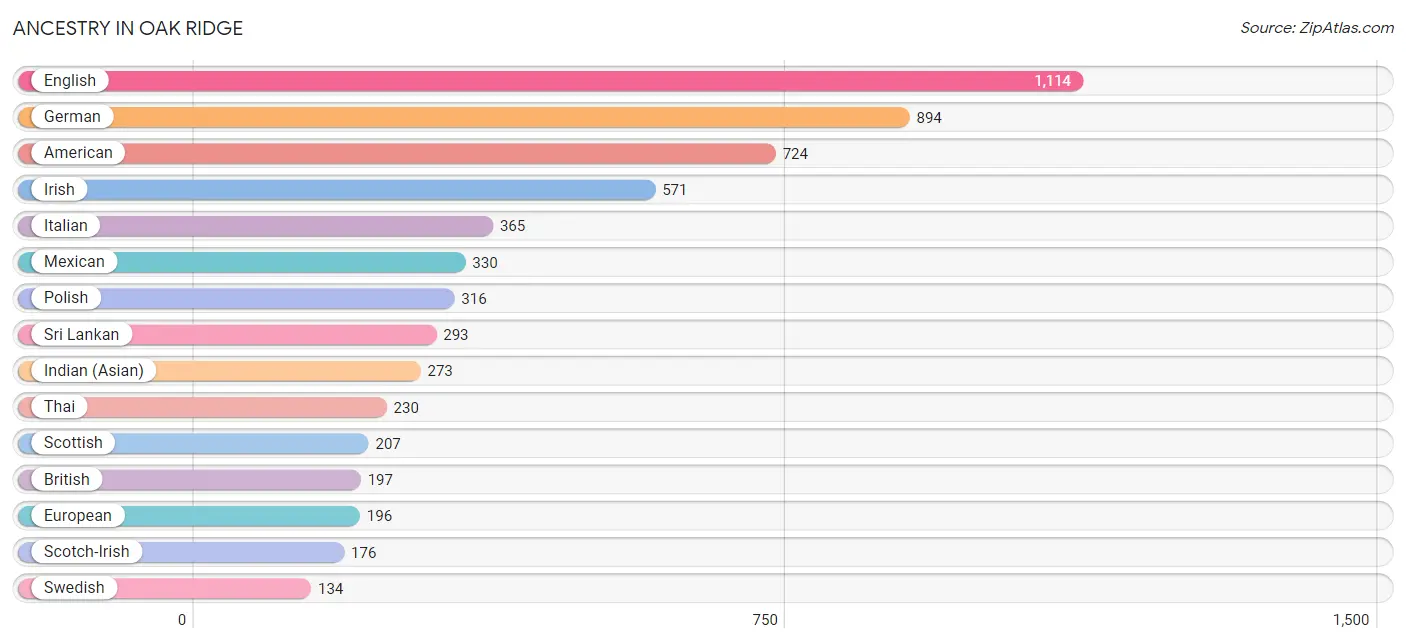
Ancestry in Oak Ridge
The most populous ancestries reported in Oak Ridge are English (1,114 | 14.6%), German (894 | 11.7%), American (724 | 9.5%), Irish (571 | 7.5%), and Italian (365 | 4.8%), together accounting for 48.0% of all Oak Ridge residents.
| Ancestry | # Population | % Population |
| African | 63 | 0.8% |
| American | 724 | 9.5% |
| Arab | 36 | 0.5% |
| Austrian | 12 | 0.2% |
| Bhutanese | 19 | 0.3% |
| Brazilian | 62 | 0.8% |
| British | 197 | 2.6% |
| Canadian | 12 | 0.2% |
| Cherokee | 12 | 0.2% |
| Czech | 45 | 0.6% |
| Czechoslovakian | 98 | 1.3% |
| Danish | 11 | 0.1% |
| Dutch | 84 | 1.1% |
| Eastern European | 41 | 0.5% |
| English | 1,114 | 14.6% |
| European | 196 | 2.6% |
| French | 62 | 0.8% |
| French Canadian | 51 | 0.7% |
| German | 894 | 11.7% |
| Greek | 10 | 0.1% |
| Hungarian | 23 | 0.3% |
| Icelander | 7 | 0.1% |
| Indian (Asian) | 273 | 3.6% |
| Iranian | 10 | 0.1% |
| Irish | 571 | 7.5% |
| Italian | 365 | 4.8% |
| Korean | 77 | 1.0% |
| Mexican | 330 | 4.3% |
| Norwegian | 18 | 0.2% |
| Polish | 316 | 4.1% |
| Portuguese | 13 | 0.2% |
| Puerto Rican | 21 | 0.3% |
| Russian | 48 | 0.6% |
| Scandinavian | 29 | 0.4% |
| Scotch-Irish | 176 | 2.3% |
| Scottish | 207 | 2.7% |
| Sri Lankan | 293 | 3.8% |
| Subsaharan African | 63 | 0.8% |
| Swedish | 134 | 1.8% |
| Swiss | 47 | 0.6% |
| Syrian | 36 | 0.5% |
| Thai | 230 | 3.0% |
| Ukrainian | 24 | 0.3% |
| Welsh | 13 | 0.2% | View All 44 Rows |
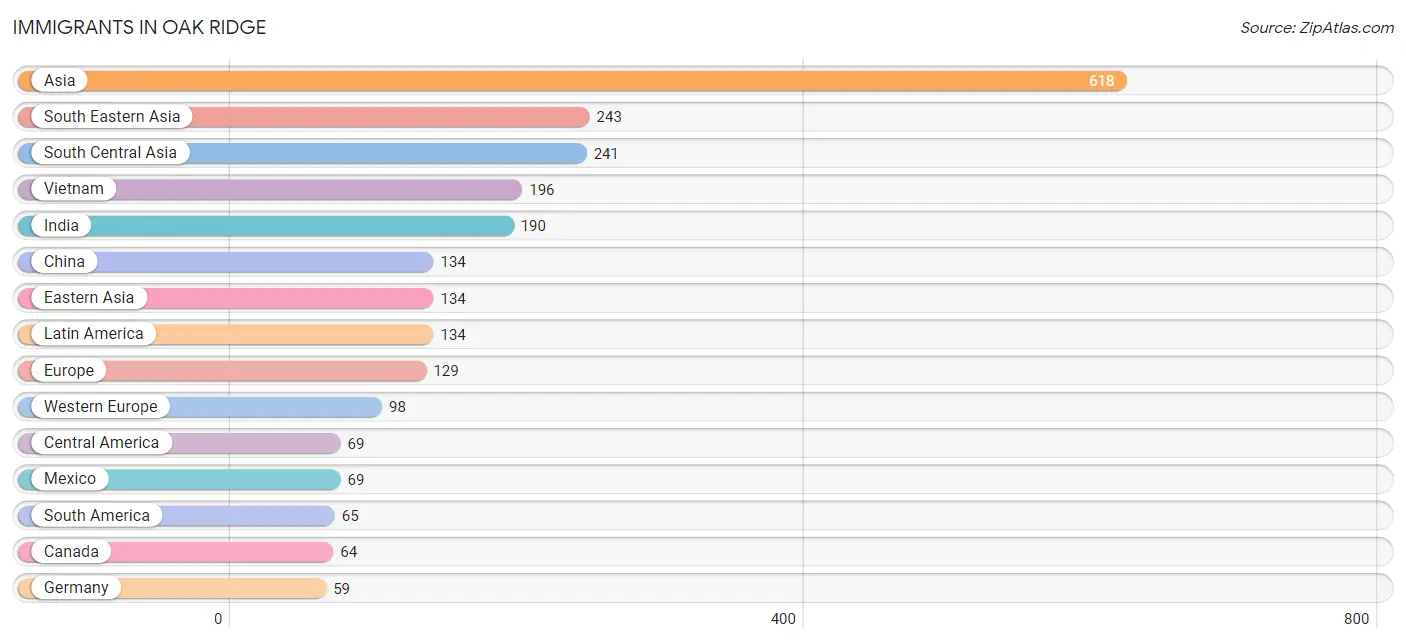
Immigrants in Oak Ridge
The most numerous immigrant groups reported in Oak Ridge came from Asia (618 | 8.1%), South Eastern Asia (243 | 3.2%), South Central Asia (241 | 3.2%), Vietnam (196 | 2.6%), and India (190 | 2.5%), together accounting for 19.5% of all Oak Ridge residents.
| Immigration Origin | # Population | % Population |
| Africa | 16 | 0.2% |
| Asia | 618 | 8.1% |
| Austria | 39 | 0.5% |
| Brazil | 24 | 0.3% |
| Canada | 64 | 0.8% |
| Central America | 69 | 0.9% |
| Chile | 41 | 0.5% |
| China | 134 | 1.8% |
| Eastern Asia | 134 | 1.8% |
| Eastern Europe | 23 | 0.3% |
| England | 8 | 0.1% |
| Europe | 129 | 1.7% |
| Germany | 59 | 0.8% |
| Ghana | 16 | 0.2% |
| India | 190 | 2.5% |
| Latin America | 134 | 1.8% |
| Latvia | 13 | 0.2% |
| Mexico | 69 | 0.9% |
| Northern Europe | 8 | 0.1% |
| Philippines | 47 | 0.6% |
| Poland | 10 | 0.1% |
| South America | 65 | 0.9% |
| South Central Asia | 241 | 3.2% |
| South Eastern Asia | 243 | 3.2% |
| Sri Lanka | 51 | 0.7% |
| Vietnam | 196 | 2.6% |
| Western Africa | 16 | 0.2% |
| Western Europe | 98 | 1.3% | View All 28 Rows |
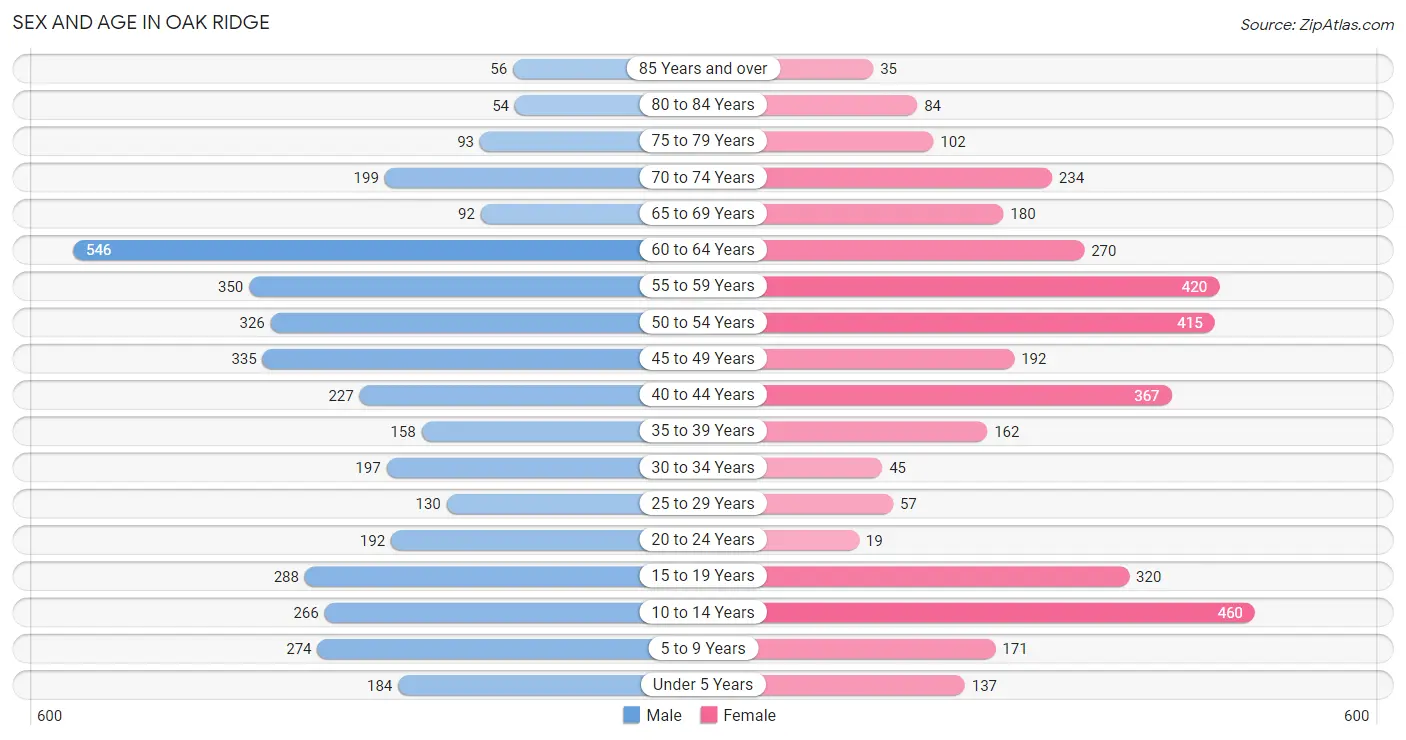
Sex and Age in Oak Ridge
Sex and Age in Oak Ridge
The most populous age groups in Oak Ridge are 60 to 64 Years (546 | 13.8%) for men and 10 to 14 Years (460 | 12.5%) for women.
| Age Bracket | Male | Female |
| Under 5 Years | 184 (4.6%) | 137 (3.7%) |
| 5 to 9 Years | 274 (6.9%) | 171 (4.7%) |
| 10 to 14 Years | 266 (6.7%) | 460 (12.5%) |
| 15 to 19 Years | 288 (7.3%) | 320 (8.7%) |
| 20 to 24 Years | 192 (4.8%) | 19 (0.5%) |
| 25 to 29 Years | 130 (3.3%) | 57 (1.5%) |
| 30 to 34 Years | 197 (5.0%) | 45 (1.2%) |
| 35 to 39 Years | 158 (4.0%) | 162 (4.4%) |
| 40 to 44 Years | 227 (5.7%) | 367 (10.0%) |
| 45 to 49 Years | 335 (8.4%) | 192 (5.2%) |
| 50 to 54 Years | 326 (8.2%) | 415 (11.3%) |
| 55 to 59 Years | 350 (8.8%) | 420 (11.4%) |
| 60 to 64 Years | 546 (13.8%) | 270 (7.4%) |
| 65 to 69 Years | 92 (2.3%) | 180 (4.9%) |
| 70 to 74 Years | 199 (5.0%) | 234 (6.4%) |
| 75 to 79 Years | 93 (2.3%) | 102 (2.8%) |
| 80 to 84 Years | 54 (1.4%) | 84 (2.3%) |
| 85 Years and over | 56 (1.4%) | 35 (0.9%) |
| Total | 3,967 (100.0%) | 3,670 (100.0%) |
Families and Households in Oak Ridge
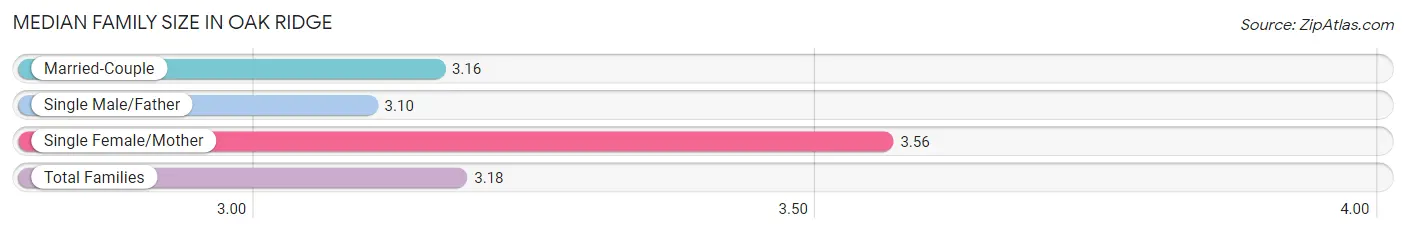
Median Family Size in Oak Ridge
The median family size in Oak Ridge is 3.18 persons per family, with single female/mother families (114 | 5.0%) accounting for the largest median family size of 3.56 persons per family. On the other hand, single male/father families (52 | 2.3%) represent the smallest median family size with 3.10 persons per family.
| Family Type | # Families | Family Size |
| Married-Couple | 2,107 (92.7%) | 3.16 |
| Single Male/Father | 52 (2.3%) | 3.10 |
| Single Female/Mother | 114 (5.0%) | 3.56 |
| Total Families | 2,273 (100.0%) | 3.18 |
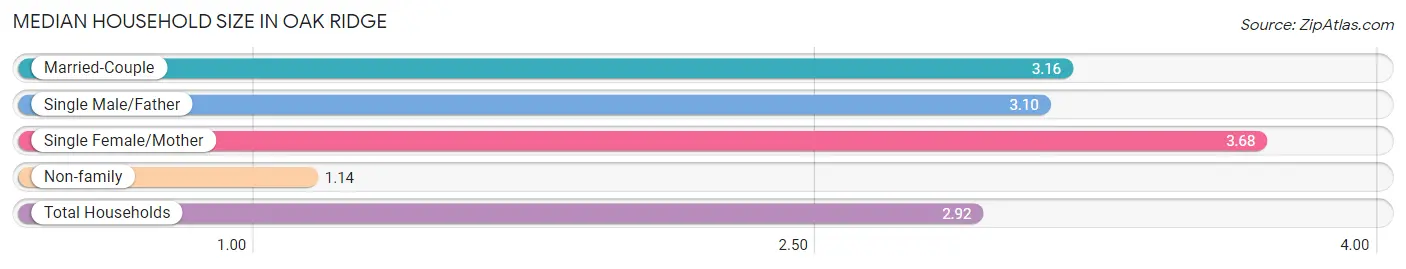
Median Household Size in Oak Ridge
The median household size in Oak Ridge is 2.92 persons per household, with single female/mother households (114 | 4.4%) accounting for the largest median household size of 3.68 persons per household. non-family households (344 | 13.1%) represent the smallest median household size with 1.14 persons per household.
| Household Type | # Households | Household Size |
| Married-Couple | 2,107 (80.5%) | 3.16 |
| Single Male/Father | 52 (2.0%) | 3.10 |
| Single Female/Mother | 114 (4.4%) | 3.68 |
| Non-family | 344 (13.1%) | 1.14 |
| Total Households | 2,617 (100.0%) | 2.92 |
Household Size by Marriage Status in Oak Ridge
Out of a total of 2,617 households in Oak Ridge, 2,273 (86.9%) are family households, while 344 (13.1%) are nonfamily households. The most numerous type of family households are 2-person households, comprising 933, and the most common type of nonfamily households are 1-person households, comprising 305.
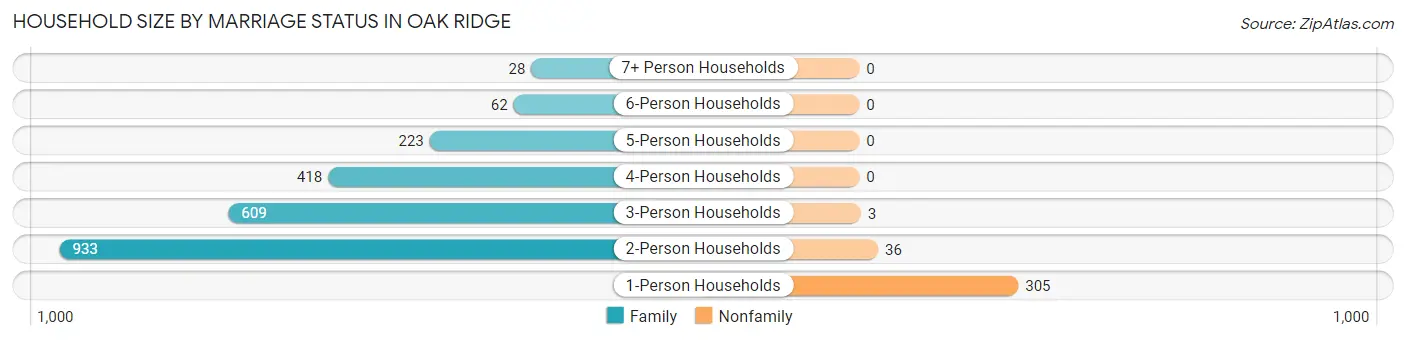
| Household Size | Family Households | Nonfamily Households |
| 1-Person Households | - | 305 (11.7%) |
| 2-Person Households | 933 (35.6%) | 36 (1.4%) |
| 3-Person Households | 609 (23.3%) | 3 (0.1%) |
| 4-Person Households | 418 (16.0%) | 0 (0.0%) |
| 5-Person Households | 223 (8.5%) | 0 (0.0%) |
| 6-Person Households | 62 (2.4%) | 0 (0.0%) |
| 7+ Person Households | 28 (1.1%) | 0 (0.0%) |
| Total | 2,273 (86.9%) | 344 (13.1%) |
Female Fertility in Oak Ridge
Fertility by Age in Oak Ridge
Average fertility rate in Oak Ridge is 26.0 births per 1,000 women. Women in the age bracket of 20 to 34 years have the highest fertility rate with 132.0 births per 1,000 women. Women in the age bracket of 20 to 34 years acount for 50.0% of all women with births.
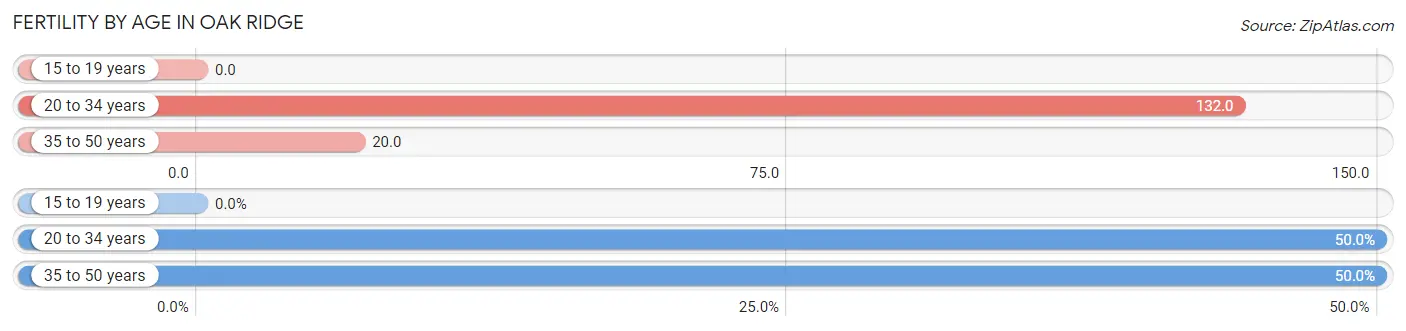
| Age Bracket | Women with Births | Births / 1,000 Women |
| 15 to 19 years | 0 (0.0%) | 0.0 |
| 20 to 34 years | 16 (50.0%) | 132.0 |
| 35 to 50 years | 16 (50.0%) | 20.0 |
| Total | 32 (100.0%) | 26.0 |
Fertility by Age by Marriage Status in Oak Ridge
50.0% of women with births (32) in Oak Ridge are married. The highest percentage of unmarried women with births falls into 35 to 50 years age bracket with 100.0% of them unmarried at the time of birth, while the lowest percentage of unmarried women with births belong to 20 to 34 years age bracket with 0.0% of them unmarried.
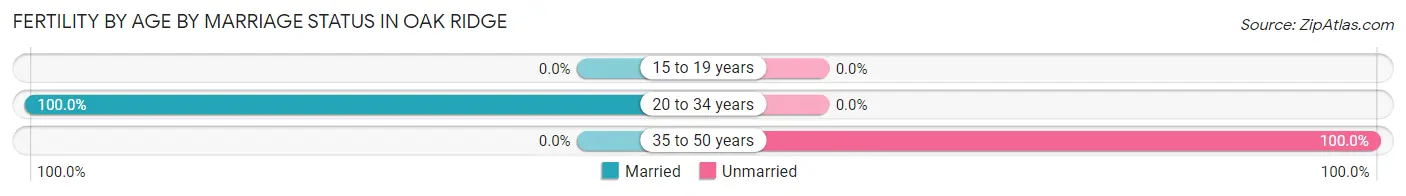
| Age Bracket | Married | Unmarried |
| 15 to 19 years | 0 (0.0%) | 0 (0.0%) |
| 20 to 34 years | 16 (100.0%) | 0 (0.0%) |
| 35 to 50 years | 0 (0.0%) | 16 (100.0%) |
| Total | 16 (50.0%) | 16 (50.0%) |
Fertility by Education in Oak Ridge
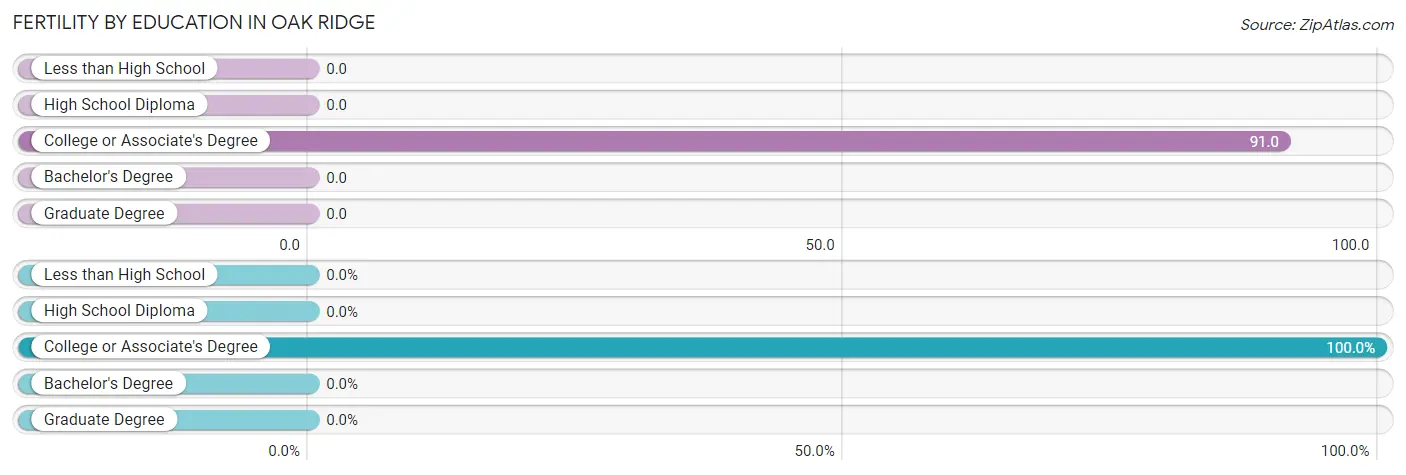
| Educational Attainment | Women with Births | Births / 1,000 Women |
| Less than High School | 0 (0.0%) | 0.0 |
| High School Diploma | 0 (0.0%) | 0.0 |
| College or Associate's Degree | 32 (100.0%) | 91.0 |
| Bachelor's Degree | 0 (0.0%) | 0.0 |
| Graduate Degree | 0 (0.0%) | 0.0 |
| Total | 32 (100.0%) | 26.0 |
Fertility by Education by Marriage Status in Oak Ridge
50.0% of women with births in Oak Ridge are unmarried. Women with the educational attainment of college or associate's degree are most likely to be married with 50.0% of them married at childbirth, while women with the educational attainment of college or associate's degree are least likely to be married with 50.0% of them unmarried at childbirth.
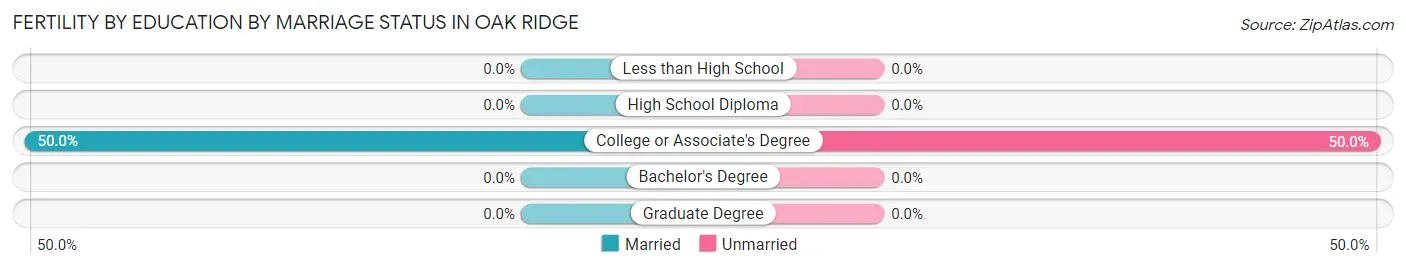
| Educational Attainment | Married | Unmarried |
| Less than High School | 0 (0.0%) | 0 (0.0%) |
| High School Diploma | 0 (0.0%) | 0 (0.0%) |
| College or Associate's Degree | 16 (50.0%) | 16 (50.0%) |
| Bachelor's Degree | 0 (0.0%) | 0 (0.0%) |
| Graduate Degree | 0 (0.0%) | 0 (0.0%) |
| Total | 16 (50.0%) | 16 (50.0%) |
Employment Characteristics in Oak Ridge
Employment by Class of Employer in Oak Ridge
Among the 3,648 employed individuals in Oak Ridge, private company employees (2,354 | 64.5%), self-employed (not incorporated) (470 | 12.9%), and self-employed (incorporated) (289 | 7.9%) make up the most common classes of employment.
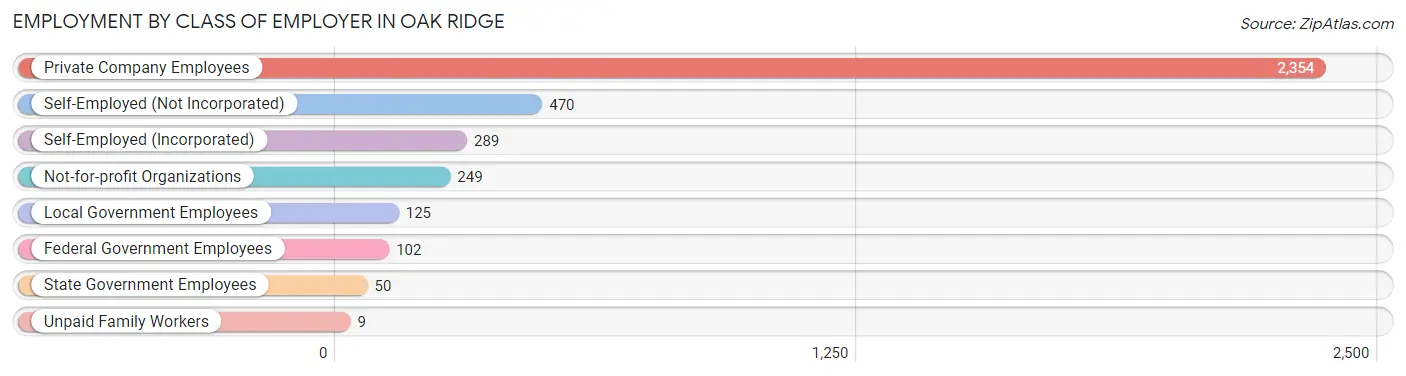
| Employer Class | # Employees | % Employees |
| Private Company Employees | 2,354 | 64.5% |
| Self-Employed (Incorporated) | 289 | 7.9% |
| Self-Employed (Not Incorporated) | 470 | 12.9% |
| Not-for-profit Organizations | 249 | 6.8% |
| Local Government Employees | 125 | 3.4% |
| State Government Employees | 50 | 1.4% |
| Federal Government Employees | 102 | 2.8% |
| Unpaid Family Workers | 9 | 0.3% |
| Total | 3,648 | 100.0% |
Employment Status by Age in Oak Ridge
According to the labor force statistics for Oak Ridge, out of the total population over 16 years of age (5,925), 64.1% or 3,798 individuals are in the labor force, with 3.8% or 144 of them unemployed. The age group with the highest labor force participation rate is 30 to 34 years, with 100.0% or 242 individuals in the labor force. Within the labor force, the 16 to 19 years age range has the highest percentage of unemployed individuals, with 22.8% or 46 of them being unemployed.
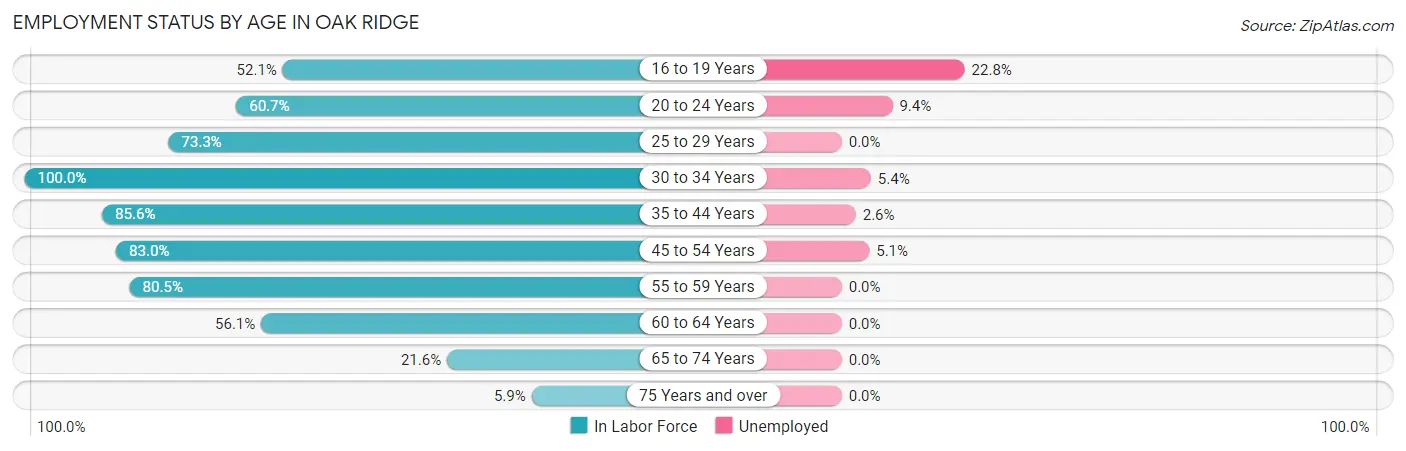
| Age Bracket | In Labor Force | Unemployed |
| 16 to 19 Years | 202 (52.1%) | 46 (22.8%) |
| 20 to 24 Years | 128 (60.7%) | 12 (9.4%) |
| 25 to 29 Years | 137 (73.3%) | 0 (0.0%) |
| 30 to 34 Years | 242 (100.0%) | 13 (5.4%) |
| 35 to 44 Years | 782 (85.6%) | 20 (2.6%) |
| 45 to 54 Years | 1,052 (83.0%) | 54 (5.1%) |
| 55 to 59 Years | 620 (80.5%) | 0 (0.0%) |
| 60 to 64 Years | 458 (56.1%) | 0 (0.0%) |
| 65 to 74 Years | 152 (21.6%) | 0 (0.0%) |
| 75 Years and over | 25 (5.9%) | 0 (0.0%) |
| Total | 3,798 (64.1%) | 144 (3.8%) |
Employment Status by Educational Attainment in Oak Ridge
According to labor force statistics for Oak Ridge, 78.4% of individuals (3,290) out of the total population between 25 and 64 years of age (4,197) are in the labor force, with 2.6% or 86 of them being unemployed. The group with the highest labor force participation rate are those with the educational attainment of less than high school, with 85.5% or 189 individuals in the labor force. Within the labor force, individuals with college / associate degree education have the highest percentage of unemployment, with 6.6% or 54 of them being unemployed.
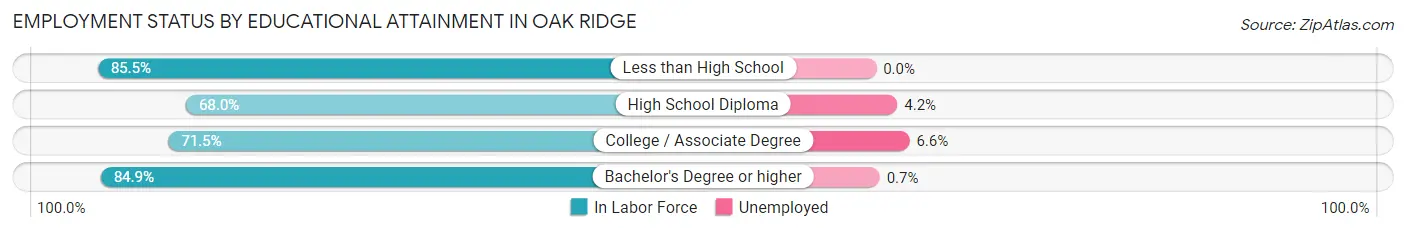
| Educational Attainment | In Labor Force | Unemployed |
| Less than High School | 189 (85.5%) | 0 (0.0%) |
| High School Diploma | 474 (68.0%) | 29 (4.2%) |
| College / Associate Degree | 822 (71.5%) | 76 (6.6%) |
| Bachelor's Degree or higher | 1,808 (84.9%) | 15 (0.7%) |
| Total | 3,290 (78.4%) | 109 (2.6%) |
Employment Occupations by Sex in Oak Ridge
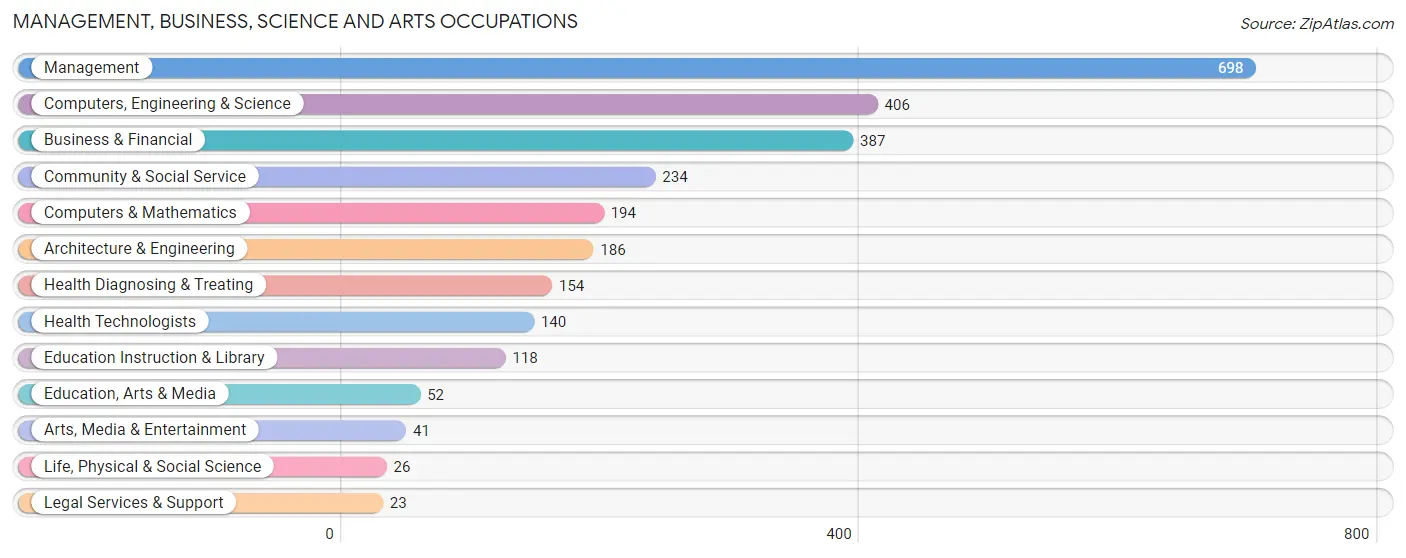
Management, Business, Science and Arts Occupations
The most common Management, Business, Science and Arts occupations in Oak Ridge are Management (698 | 19.1%), Computers, Engineering & Science (406 | 11.1%), Business & Financial (387 | 10.6%), Community & Social Service (234 | 6.4%), and Computers & Mathematics (194 | 5.3%).
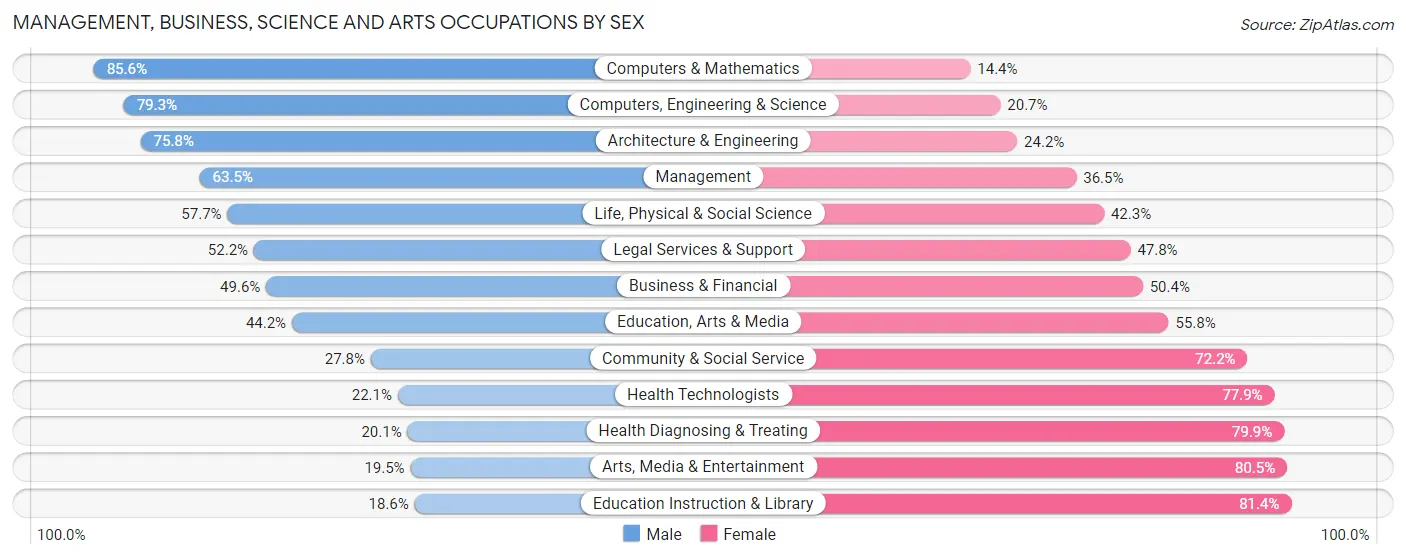
Management, Business, Science and Arts Occupations by Sex
Within the Management, Business, Science and Arts occupations in Oak Ridge, the most male-oriented occupations are Computers & Mathematics (85.6%), Computers, Engineering & Science (79.3%), and Architecture & Engineering (75.8%), while the most female-oriented occupations are Education Instruction & Library (81.4%), Arts, Media & Entertainment (80.5%), and Health Diagnosing & Treating (79.9%).
| Occupation | Male | Female |
| Management | 443 (63.5%) | 255 (36.5%) |
| Business & Financial | 192 (49.6%) | 195 (50.4%) |
| Computers, Engineering & Science | 322 (79.3%) | 84 (20.7%) |
| Computers & Mathematics | 166 (85.6%) | 28 (14.4%) |
| Architecture & Engineering | 141 (75.8%) | 45 (24.2%) |
| Life, Physical & Social Science | 15 (57.7%) | 11 (42.3%) |
| Community & Social Service | 65 (27.8%) | 169 (72.2%) |
| Education, Arts & Media | 23 (44.2%) | 29 (55.8%) |
| Legal Services & Support | 12 (52.2%) | 11 (47.8%) |
| Education Instruction & Library | 22 (18.6%) | 96 (81.4%) |
| Arts, Media & Entertainment | 8 (19.5%) | 33 (80.5%) |
| Health Diagnosing & Treating | 31 (20.1%) | 123 (79.9%) |
| Health Technologists | 31 (22.1%) | 109 (77.9%) |
| Total (Category) | 1,053 (56.0%) | 826 (44.0%) |
| Total (Overall) | 2,177 (59.6%) | 1,477 (40.4%) |
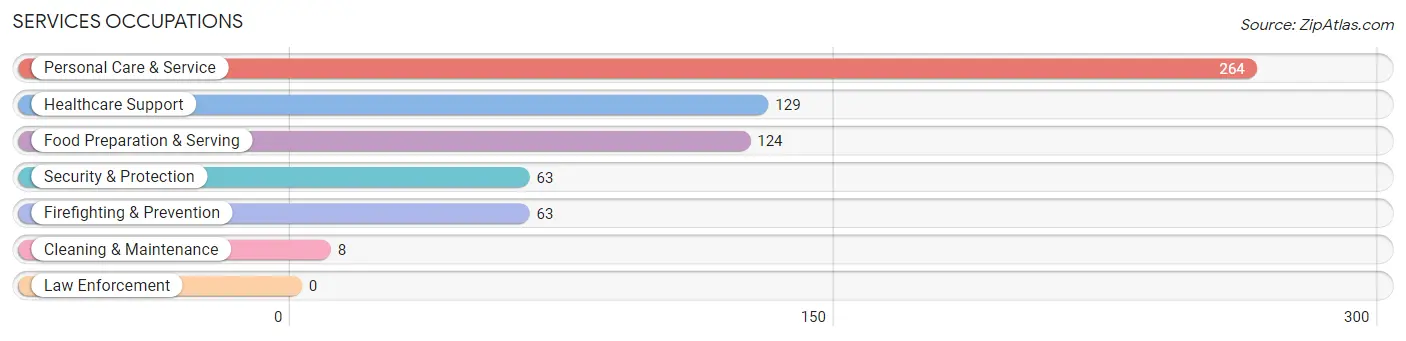
Services Occupations
The most common Services occupations in Oak Ridge are Personal Care & Service (264 | 7.2%), Healthcare Support (129 | 3.5%), Food Preparation & Serving (124 | 3.4%), Security & Protection (63 | 1.7%), and Firefighting & Prevention (63 | 1.7%).
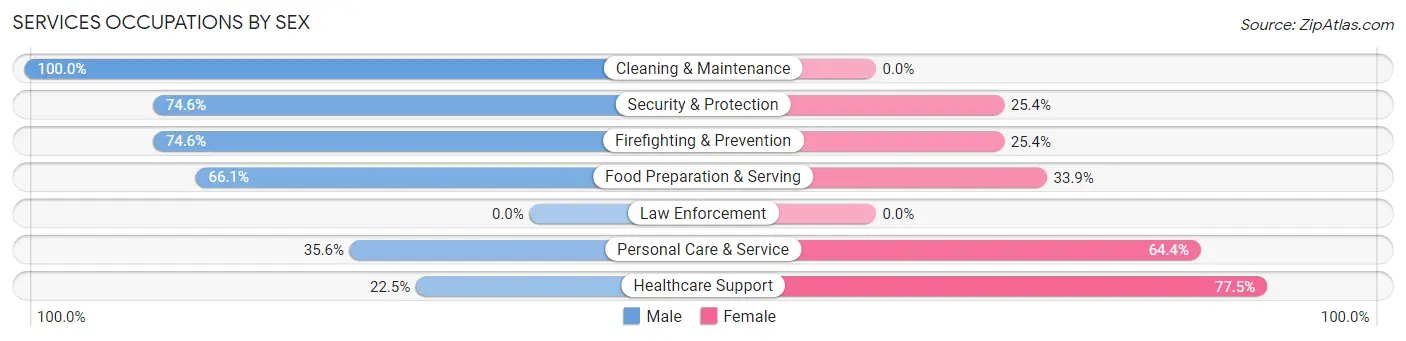
Services Occupations by Sex
Within the Services occupations in Oak Ridge, the most male-oriented occupations are Cleaning & Maintenance (100.0%), Security & Protection (74.6%), and Firefighting & Prevention (74.6%), while the most female-oriented occupations are Healthcare Support (77.5%), Personal Care & Service (64.4%), and Food Preparation & Serving (33.9%).
| Occupation | Male | Female |
| Healthcare Support | 29 (22.5%) | 100 (77.5%) |
| Security & Protection | 47 (74.6%) | 16 (25.4%) |
| Firefighting & Prevention | 47 (74.6%) | 16 (25.4%) |
| Law Enforcement | 0 (0.0%) | 0 (0.0%) |
| Food Preparation & Serving | 82 (66.1%) | 42 (33.9%) |
| Cleaning & Maintenance | 8 (100.0%) | 0 (0.0%) |
| Personal Care & Service | 94 (35.6%) | 170 (64.4%) |
| Total (Category) | 260 (44.2%) | 328 (55.8%) |
| Total (Overall) | 2,177 (59.6%) | 1,477 (40.4%) |
Sales and Office Occupations
The most common Sales and Office occupations in Oak Ridge are Sales & Related (341 | 9.3%), and Office & Administration (288 | 7.9%).

Sales and Office Occupations by Sex

| Occupation | Male | Female |
| Sales & Related | 223 (65.4%) | 118 (34.6%) |
| Office & Administration | 120 (41.7%) | 168 (58.3%) |
| Total (Category) | 343 (54.5%) | 286 (45.5%) |
| Total (Overall) | 2,177 (59.6%) | 1,477 (40.4%) |
Natural Resources, Construction and Maintenance Occupations
The most common Natural Resources, Construction and Maintenance occupations in Oak Ridge are Installation, Maintenance & Repair (167 | 4.6%), and Construction & Extraction (72 | 2.0%).
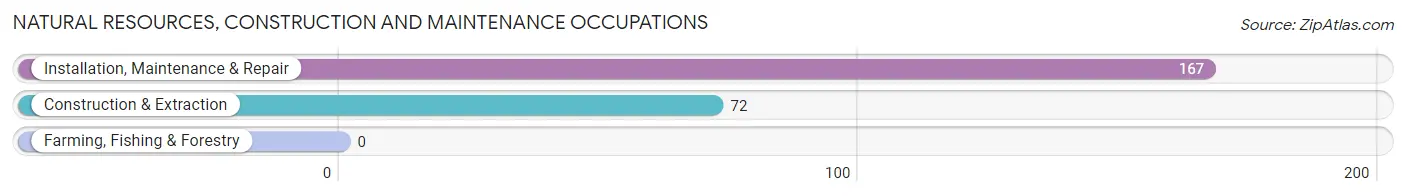
Natural Resources, Construction and Maintenance Occupations by Sex

| Occupation | Male | Female |
| Farming, Fishing & Forestry | 0 (0.0%) | 0 (0.0%) |
| Construction & Extraction | 72 (100.0%) | 0 (0.0%) |
| Installation, Maintenance & Repair | 167 (100.0%) | 0 (0.0%) |
| Total (Category) | 239 (100.0%) | 0 (0.0%) |
| Total (Overall) | 2,177 (59.6%) | 1,477 (40.4%) |
Production, Transportation and Moving Occupations
The most common Production, Transportation and Moving occupations in Oak Ridge are Production (153 | 4.2%), Transportation (83 | 2.3%), and Material Moving (83 | 2.3%).
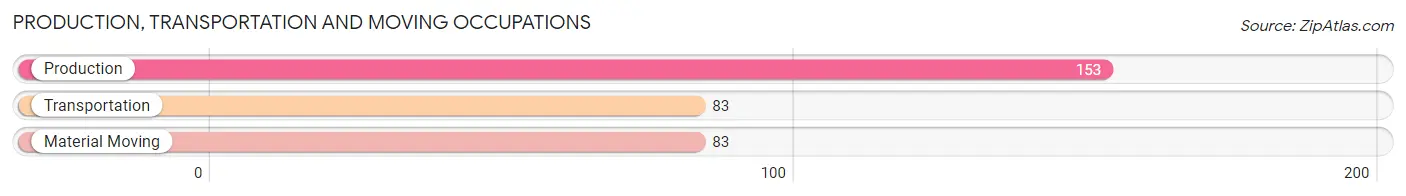
Production, Transportation and Moving Occupations by Sex
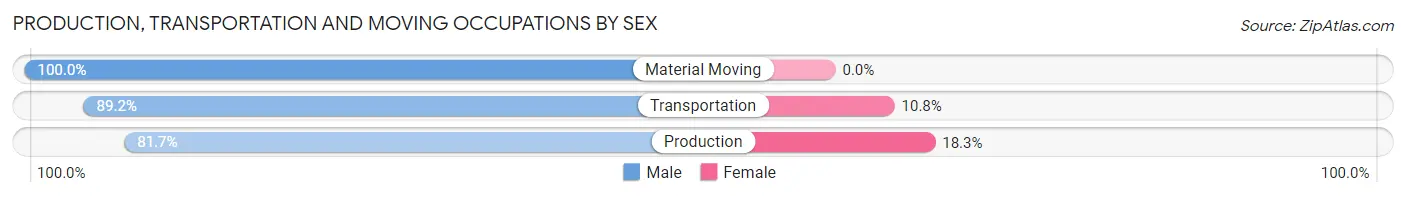
| Occupation | Male | Female |
| Production | 125 (81.7%) | 28 (18.3%) |
| Transportation | 74 (89.2%) | 9 (10.8%) |
| Material Moving | 83 (100.0%) | 0 (0.0%) |
| Total (Category) | 282 (88.4%) | 37 (11.6%) |
| Total (Overall) | 2,177 (59.6%) | 1,477 (40.4%) |
Employment Industries by Sex in Oak Ridge
Employment Industries in Oak Ridge
The major employment industries in Oak Ridge include Manufacturing (525 | 14.4%), Retail Trade (516 | 14.1%), Professional & Scientific (492 | 13.5%), Health Care & Social Assistance (358 | 9.8%), and Finance & Insurance (291 | 8.0%).
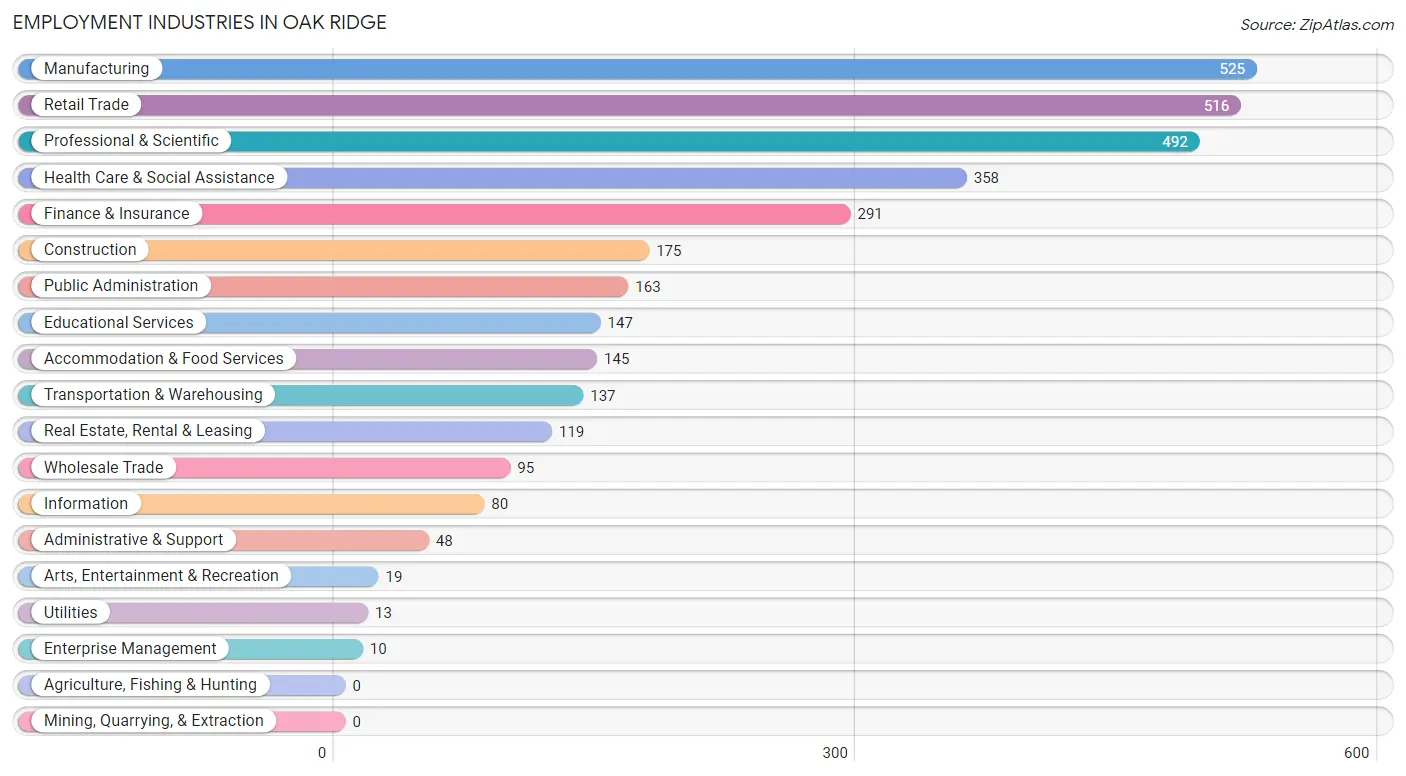
Employment Industries by Sex in Oak Ridge
The Oak Ridge industries that see more men than women are Wholesale Trade (100.0%), Utilities (100.0%), and Enterprise Management (100.0%), whereas the industries that tend to have a higher number of women are Arts, Entertainment & Recreation (84.2%), Administrative & Support (83.3%), and Health Care & Social Assistance (81.8%).
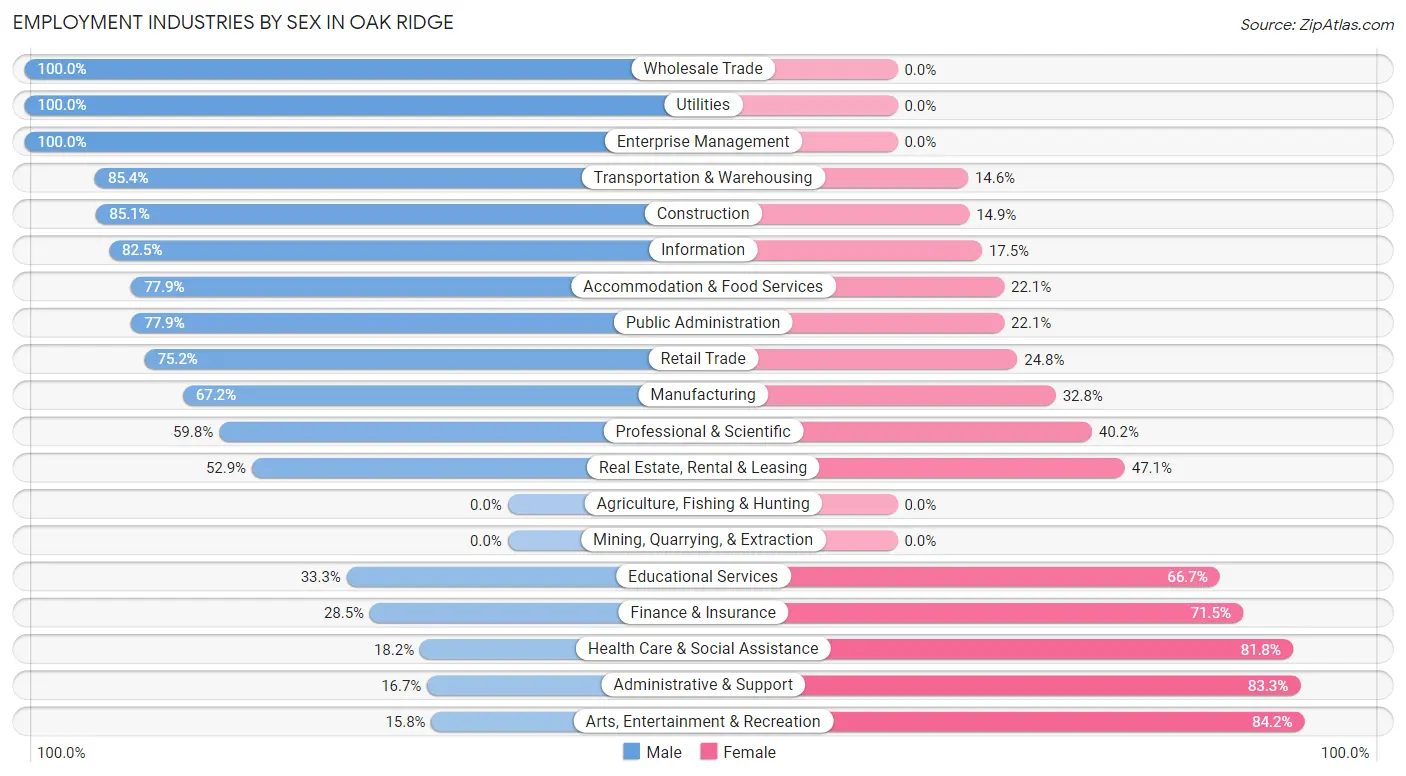
| Industry | Male | Female |
| Agriculture, Fishing & Hunting | 0 (0.0%) | 0 (0.0%) |
| Mining, Quarrying, & Extraction | 0 (0.0%) | 0 (0.0%) |
| Construction | 149 (85.1%) | 26 (14.9%) |
| Manufacturing | 353 (67.2%) | 172 (32.8%) |
| Wholesale Trade | 95 (100.0%) | 0 (0.0%) |
| Retail Trade | 388 (75.2%) | 128 (24.8%) |
| Transportation & Warehousing | 117 (85.4%) | 20 (14.6%) |
| Utilities | 13 (100.0%) | 0 (0.0%) |
| Information | 66 (82.5%) | 14 (17.5%) |
| Finance & Insurance | 83 (28.5%) | 208 (71.5%) |
| Real Estate, Rental & Leasing | 63 (52.9%) | 56 (47.1%) |
| Professional & Scientific | 294 (59.8%) | 198 (40.2%) |
| Enterprise Management | 10 (100.0%) | 0 (0.0%) |
| Administrative & Support | 8 (16.7%) | 40 (83.3%) |
| Educational Services | 49 (33.3%) | 98 (66.7%) |
| Health Care & Social Assistance | 65 (18.2%) | 293 (81.8%) |
| Arts, Entertainment & Recreation | 3 (15.8%) | 16 (84.2%) |
| Accommodation & Food Services | 113 (77.9%) | 32 (22.1%) |
| Public Administration | 127 (77.9%) | 36 (22.1%) |
| Total | 2,177 (59.6%) | 1,477 (40.4%) |
Education in Oak Ridge
School Enrollment in Oak Ridge
The most common levels of schooling among the 2,094 students in Oak Ridge are high school (647 | 30.9%), middle school (477 | 22.8%), and elementary school (427 | 20.4%).
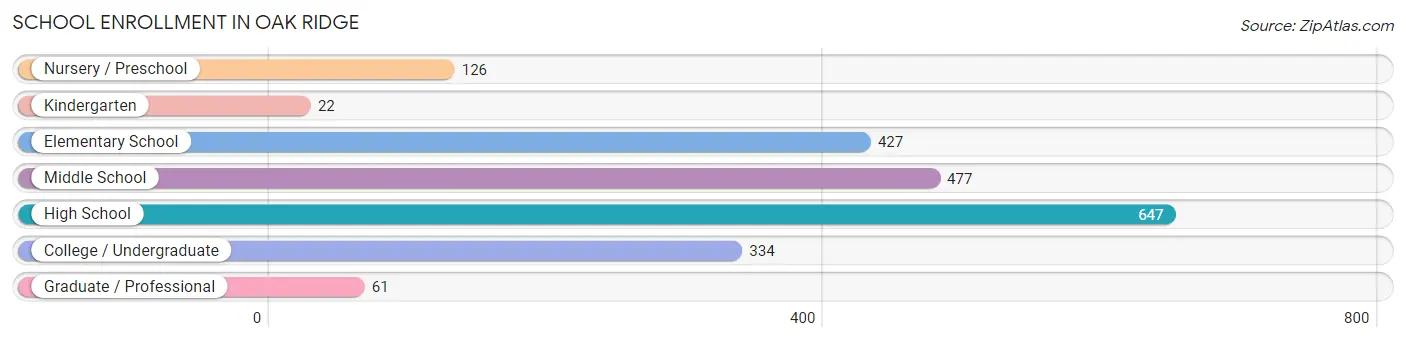
| School Level | # Students | % Students |
| Nursery / Preschool | 126 | 6.0% |
| Kindergarten | 22 | 1.1% |
| Elementary School | 427 | 20.4% |
| Middle School | 477 | 22.8% |
| High School | 647 | 30.9% |
| College / Undergraduate | 334 | 16.0% |
| Graduate / Professional | 61 | 2.9% |
| Total | 2,094 | 100.0% |
School Enrollment by Age by Funding Source in Oak Ridge
Out of a total of 2,094 students who are enrolled in schools in Oak Ridge, 337 (16.1%) attend a private institution, while the remaining 1,757 (83.9%) are enrolled in public schools. The age group of 20 to 24 year olds has the highest likelihood of being enrolled in private schools, with 36 (61.0% in the age bracket) enrolled. Conversely, the age group of 18 to 19 year olds has the lowest likelihood of being enrolled in a private school, with 105 (100.0% in the age bracket) attending a public institution.
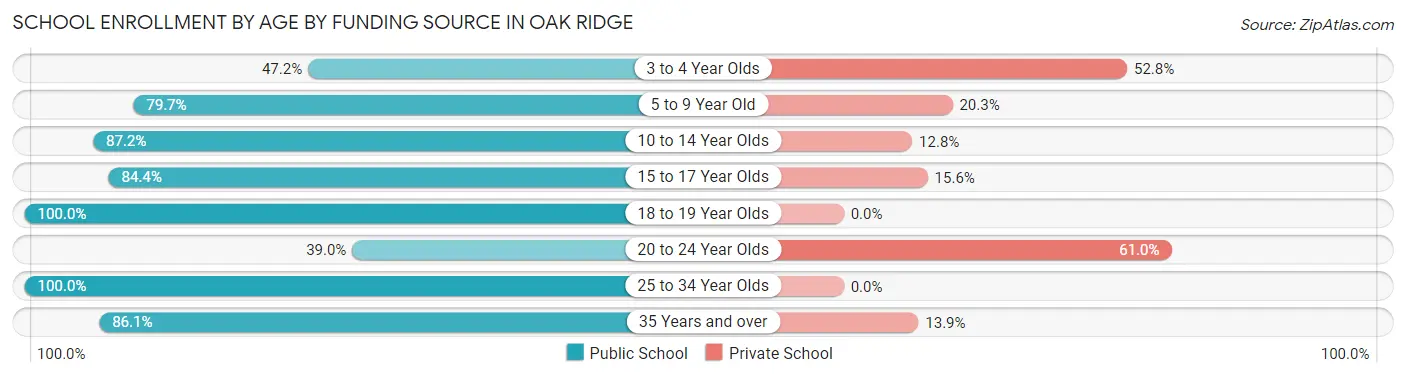
| Age Bracket | Public School | Private School |
| 3 to 4 Year Olds | 34 (47.2%) | 38 (52.8%) |
| 5 to 9 Year Old | 299 (79.7%) | 76 (20.3%) |
| 10 to 14 Year Olds | 622 (87.2%) | 91 (12.8%) |
| 15 to 17 Year Olds | 410 (84.4%) | 76 (15.6%) |
| 18 to 19 Year Olds | 105 (100.0%) | 0 (0.0%) |
| 20 to 24 Year Olds | 23 (39.0%) | 36 (61.0%) |
| 25 to 34 Year Olds | 133 (100.0%) | 0 (0.0%) |
| 35 Years and over | 130 (86.1%) | 21 (13.9%) |
| Total | 1,757 (83.9%) | 337 (16.1%) |
Educational Attainment by Field of Study in Oak Ridge
Business (714 | 26.8%), education (326 | 12.2%), engineering (283 | 10.6%), social sciences (257 | 9.7%), and computers & mathematics (235 | 8.8%) are the most common fields of study among 2,663 individuals in Oak Ridge who have obtained a bachelor's degree or higher.
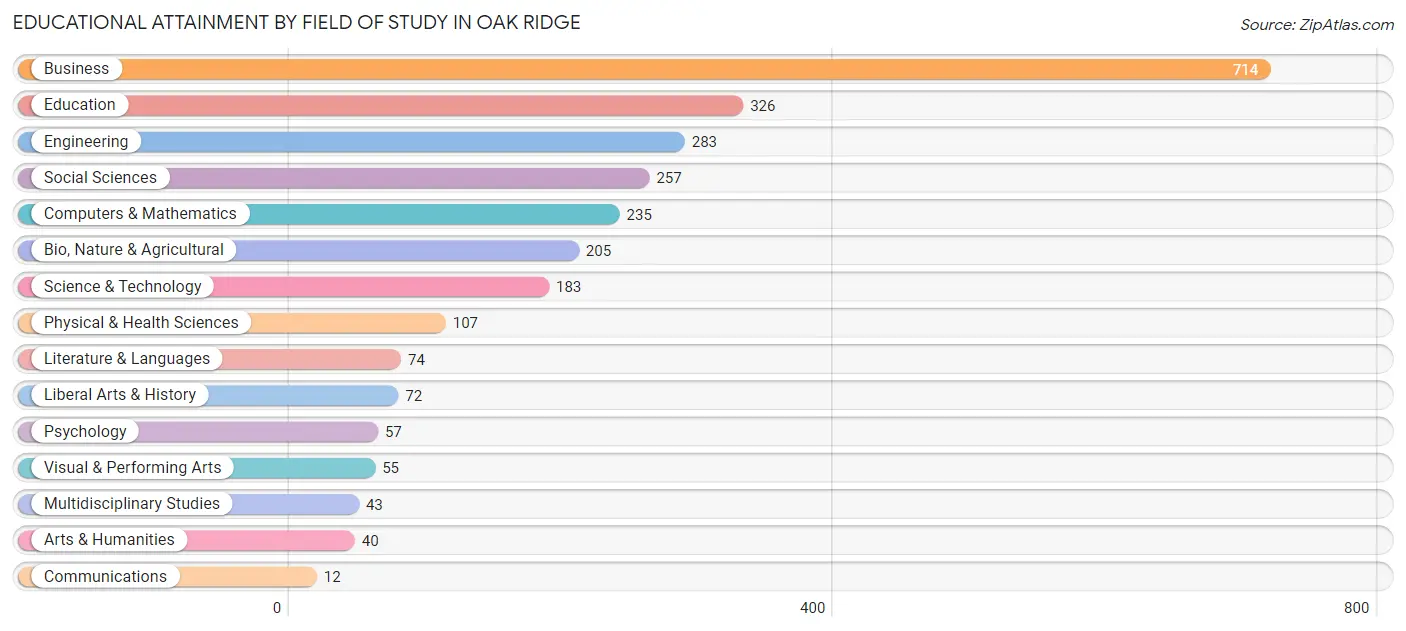
| Field of Study | # Graduates | % Graduates |
| Computers & Mathematics | 235 | 8.8% |
| Bio, Nature & Agricultural | 205 | 7.7% |
| Physical & Health Sciences | 107 | 4.0% |
| Psychology | 57 | 2.1% |
| Social Sciences | 257 | 9.7% |
| Engineering | 283 | 10.6% |
| Multidisciplinary Studies | 43 | 1.6% |
| Science & Technology | 183 | 6.9% |
| Business | 714 | 26.8% |
| Education | 326 | 12.2% |
| Literature & Languages | 74 | 2.8% |
| Liberal Arts & History | 72 | 2.7% |
| Visual & Performing Arts | 55 | 2.1% |
| Communications | 12 | 0.4% |
| Arts & Humanities | 40 | 1.5% |
| Total | 2,663 | 100.0% |
Transportation & Commute in Oak Ridge
Vehicle Availability by Sex in Oak Ridge
The most prevalent vehicle ownership categories in Oak Ridge are males with 2 vehicles (826, accounting for 38.1%) and females with 2 vehicles (692, making up 55.9%).
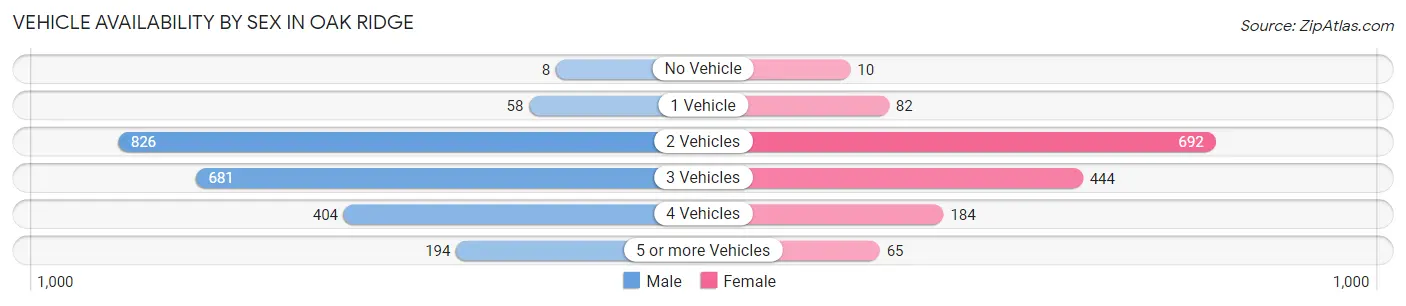
| Vehicles Available | Male | Female |
| No Vehicle | 8 (0.4%) | 10 (0.7%) |
| 1 Vehicle | 58 (2.7%) | 82 (5.6%) |
| 2 Vehicles | 826 (38.1%) | 692 (46.9%) |
| 3 Vehicles | 681 (31.4%) | 444 (30.1%) |
| 4 Vehicles | 404 (18.6%) | 184 (12.5%) |
| 5 or more Vehicles | 194 (8.9%) | 65 (4.4%) |
| Total | 2,171 (100.0%) | 1,477 (100.0%) |
Commute Time in Oak Ridge
The most frequently occuring commute durations in Oak Ridge are 30 to 34 minutes (707 commuters, 25.5%), 15 to 19 minutes (671 commuters, 24.2%), and 20 to 24 minutes (580 commuters, 20.9%).
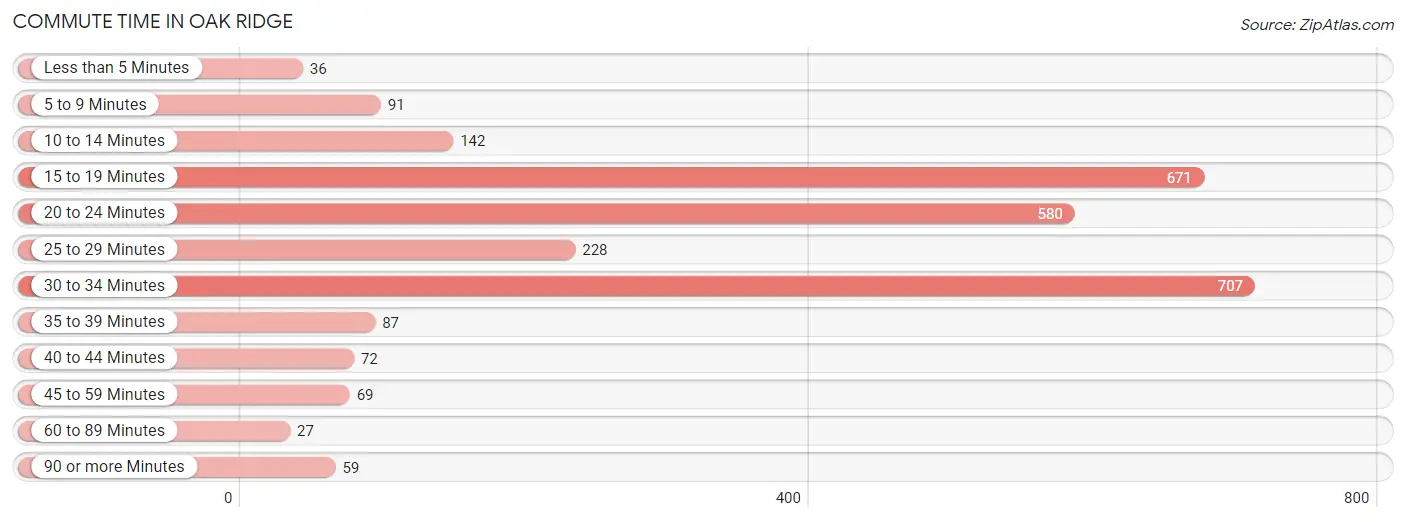
| Commute Time | # Commuters | % Commuters |
| Less than 5 Minutes | 36 | 1.3% |
| 5 to 9 Minutes | 91 | 3.3% |
| 10 to 14 Minutes | 142 | 5.1% |
| 15 to 19 Minutes | 671 | 24.2% |
| 20 to 24 Minutes | 580 | 20.9% |
| 25 to 29 Minutes | 228 | 8.2% |
| 30 to 34 Minutes | 707 | 25.5% |
| 35 to 39 Minutes | 87 | 3.1% |
| 40 to 44 Minutes | 72 | 2.6% |
| 45 to 59 Minutes | 69 | 2.5% |
| 60 to 89 Minutes | 27 | 1.0% |
| 90 or more Minutes | 59 | 2.1% |
Commute Time by Sex in Oak Ridge
The most common commute times in Oak Ridge are 15 to 19 minutes (483 commuters, 28.1%) for males and 30 to 34 minutes (346 commuters, 33.0%) for females.
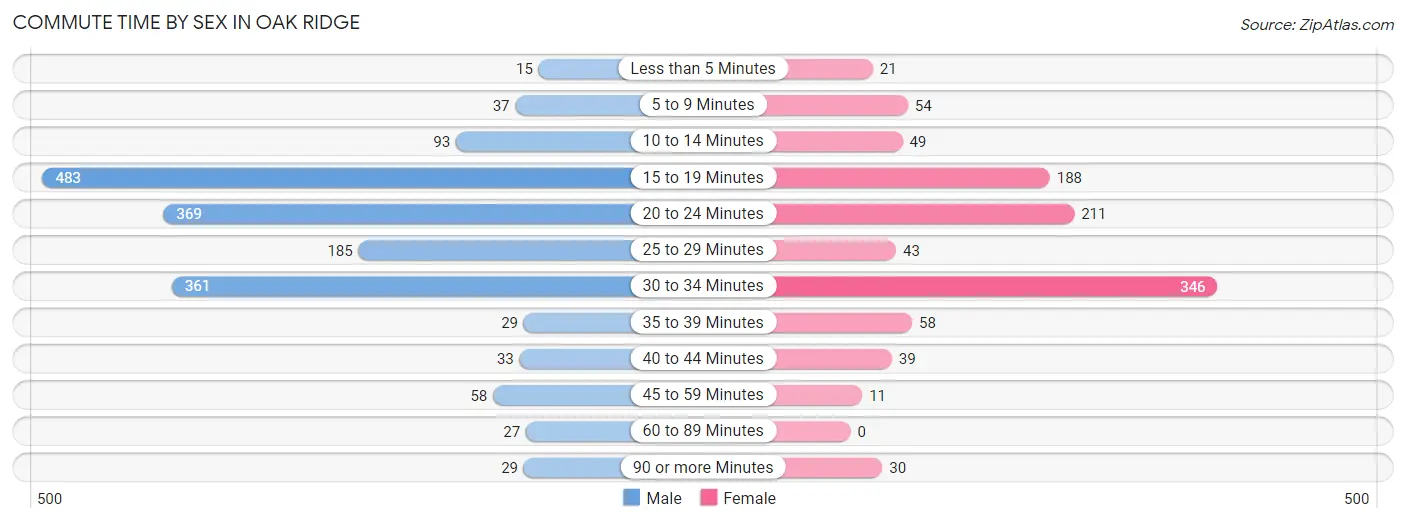
| Commute Time | Male | Female |
| Less than 5 Minutes | 15 (0.9%) | 21 (2.0%) |
| 5 to 9 Minutes | 37 (2.1%) | 54 (5.1%) |
| 10 to 14 Minutes | 93 (5.4%) | 49 (4.7%) |
| 15 to 19 Minutes | 483 (28.1%) | 188 (17.9%) |
| 20 to 24 Minutes | 369 (21.5%) | 211 (20.1%) |
| 25 to 29 Minutes | 185 (10.8%) | 43 (4.1%) |
| 30 to 34 Minutes | 361 (21.0%) | 346 (33.0%) |
| 35 to 39 Minutes | 29 (1.7%) | 58 (5.5%) |
| 40 to 44 Minutes | 33 (1.9%) | 39 (3.7%) |
| 45 to 59 Minutes | 58 (3.4%) | 11 (1.1%) |
| 60 to 89 Minutes | 27 (1.6%) | 0 (0.0%) |
| 90 or more Minutes | 29 (1.7%) | 30 (2.9%) |
Time of Departure to Work by Sex in Oak Ridge
The most frequent times of departure to work in Oak Ridge are 7:00 AM to 7:29 AM (376, 21.9%) for males and 7:00 AM to 7:29 AM (265, 25.2%) for females.
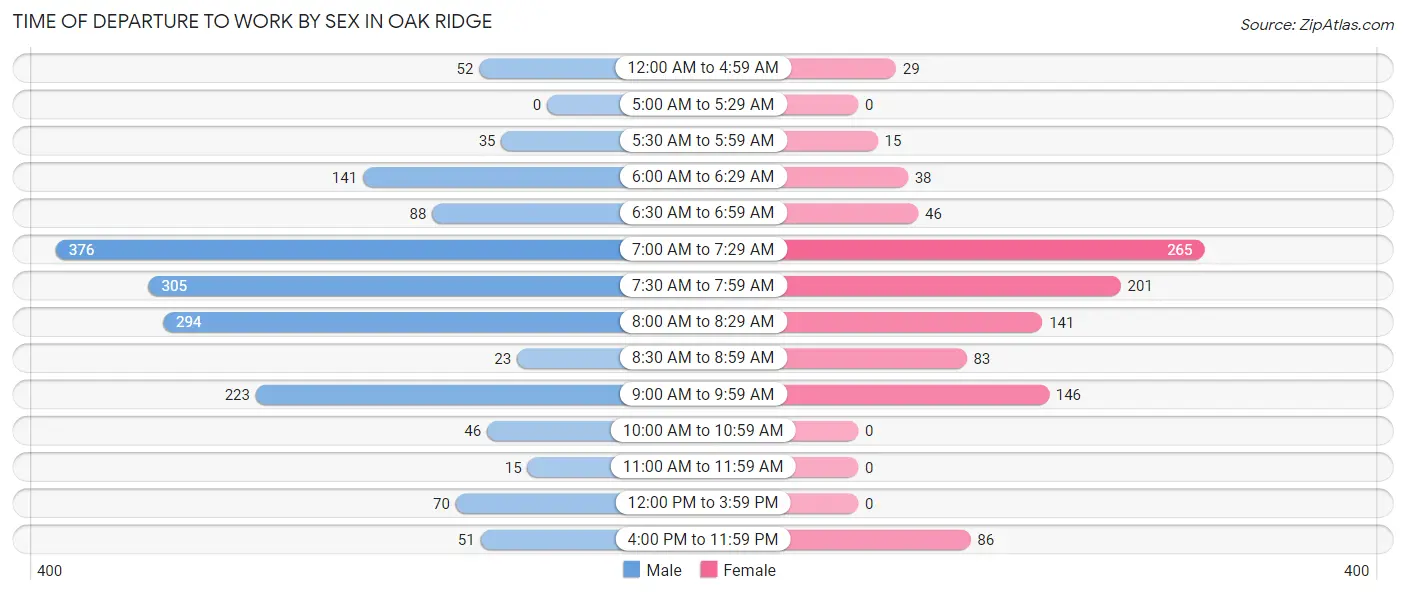
| Time of Departure | Male | Female |
| 12:00 AM to 4:59 AM | 52 (3.0%) | 29 (2.8%) |
| 5:00 AM to 5:29 AM | 0 (0.0%) | 0 (0.0%) |
| 5:30 AM to 5:59 AM | 35 (2.0%) | 15 (1.4%) |
| 6:00 AM to 6:29 AM | 141 (8.2%) | 38 (3.6%) |
| 6:30 AM to 6:59 AM | 88 (5.1%) | 46 (4.4%) |
| 7:00 AM to 7:29 AM | 376 (21.9%) | 265 (25.2%) |
| 7:30 AM to 7:59 AM | 305 (17.7%) | 201 (19.1%) |
| 8:00 AM to 8:29 AM | 294 (17.1%) | 141 (13.4%) |
| 8:30 AM to 8:59 AM | 23 (1.3%) | 83 (7.9%) |
| 9:00 AM to 9:59 AM | 223 (13.0%) | 146 (13.9%) |
| 10:00 AM to 10:59 AM | 46 (2.7%) | 0 (0.0%) |
| 11:00 AM to 11:59 AM | 15 (0.9%) | 0 (0.0%) |
| 12:00 PM to 3:59 PM | 70 (4.1%) | 0 (0.0%) |
| 4:00 PM to 11:59 PM | 51 (3.0%) | 86 (8.2%) |
| Total | 1,719 (100.0%) | 1,050 (100.0%) |
Housing Occupancy in Oak Ridge
Occupancy by Ownership in Oak Ridge
Of the total 2,617 dwellings in Oak Ridge, owner-occupied units account for 2,455 (93.8%), while renter-occupied units make up 162 (6.2%).
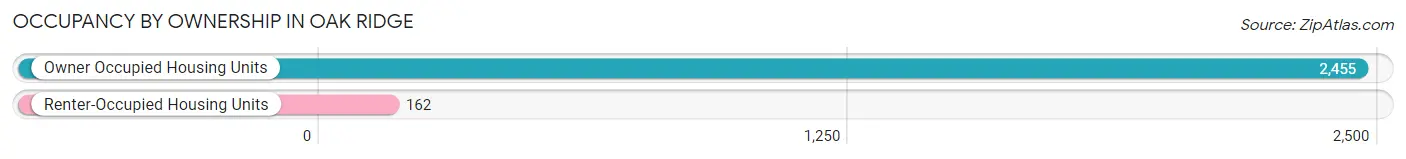
| Occupancy | # Housing Units | % Housing Units |
| Owner Occupied Housing Units | 2,455 | 93.8% |
| Renter-Occupied Housing Units | 162 | 6.2% |
| Total Occupied Housing Units | 2,617 | 100.0% |
Occupancy by Household Size in Oak Ridge
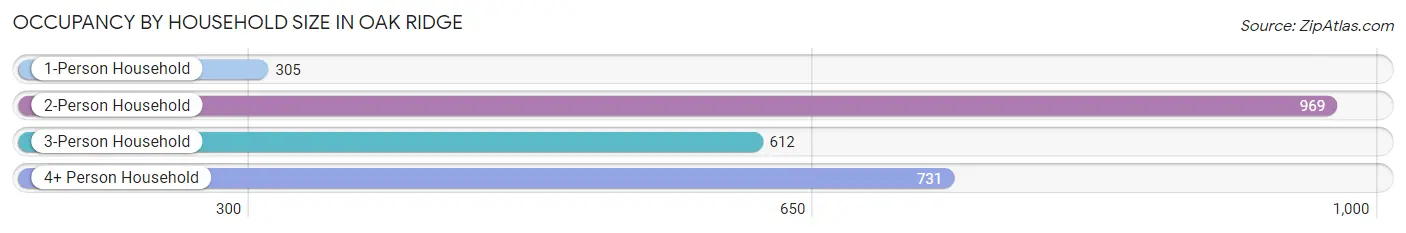
| Household Size | # Housing Units | % Housing Units |
| 1-Person Household | 305 | 11.7% |
| 2-Person Household | 969 | 37.0% |
| 3-Person Household | 612 | 23.4% |
| 4+ Person Household | 731 | 27.9% |
| Total Housing Units | 2,617 | 100.0% |
Occupancy by Ownership by Household Size in Oak Ridge
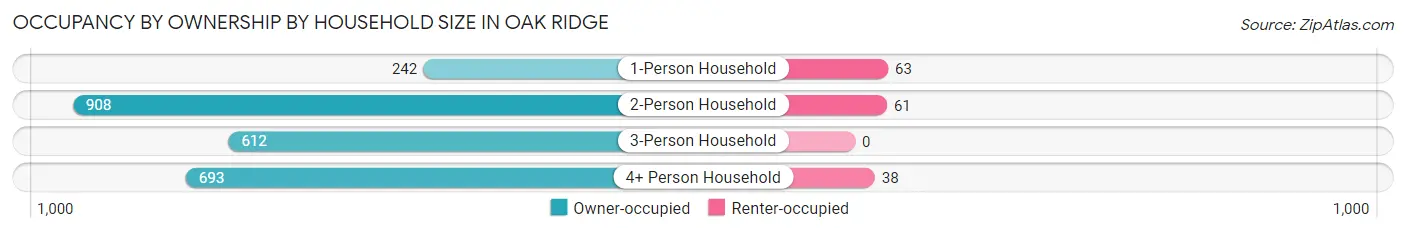
| Household Size | Owner-occupied | Renter-occupied |
| 1-Person Household | 242 (79.3%) | 63 (20.7%) |
| 2-Person Household | 908 (93.7%) | 61 (6.3%) |
| 3-Person Household | 612 (100.0%) | 0 (0.0%) |
| 4+ Person Household | 693 (94.8%) | 38 (5.2%) |
| Total Housing Units | 2,455 (93.8%) | 162 (6.2%) |
Occupancy by Educational Attainment in Oak Ridge
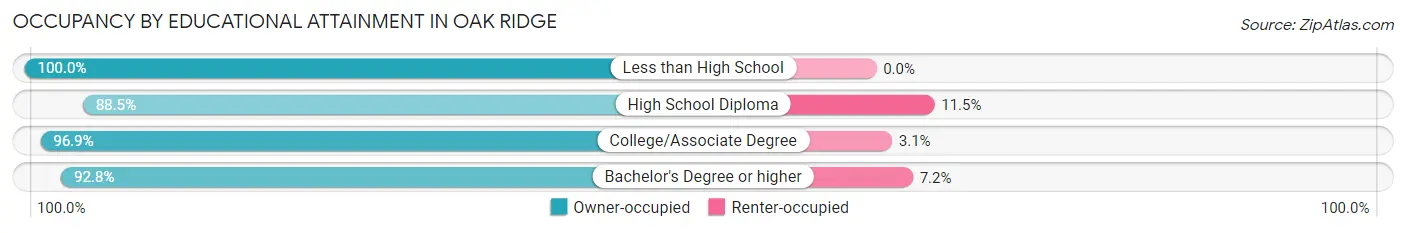
| Household Size | Owner-occupied | Renter-occupied |
| Less than High School | 131 (100.0%) | 0 (0.0%) |
| High School Diploma | 261 (88.5%) | 34 (11.5%) |
| College/Associate Degree | 717 (96.9%) | 23 (3.1%) |
| Bachelor's Degree or higher | 1,346 (92.8%) | 105 (7.2%) |
Occupancy by Age of Householder in Oak Ridge
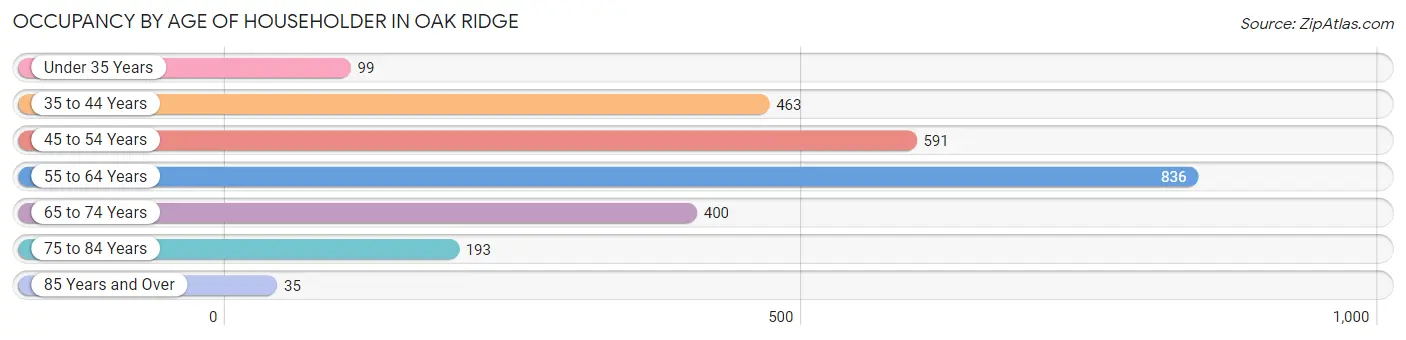
| Age Bracket | # Households | % Households |
| Under 35 Years | 99 | 3.8% |
| 35 to 44 Years | 463 | 17.7% |
| 45 to 54 Years | 591 | 22.6% |
| 55 to 64 Years | 836 | 31.9% |
| 65 to 74 Years | 400 | 15.3% |
| 75 to 84 Years | 193 | 7.4% |
| 85 Years and Over | 35 | 1.3% |
| Total | 2,617 | 100.0% |
Housing Finances in Oak Ridge
Median Income by Occupancy in Oak Ridge
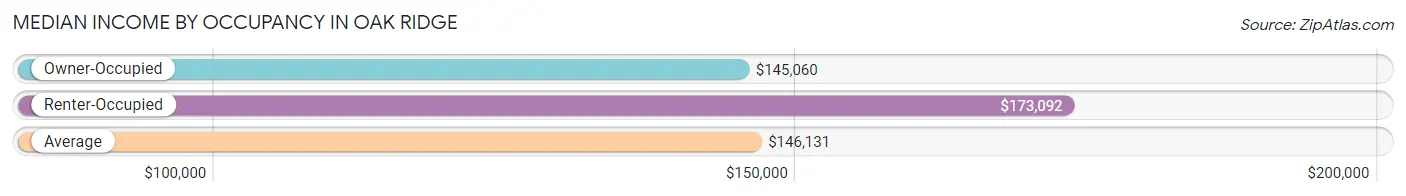
| Occupancy Type | # Households | Median Income |
| Owner-Occupied | 2,455 (93.8%) | $145,060 |
| Renter-Occupied | 162 (6.2%) | $173,092 |
| Average | 2,617 (100.0%) | $146,131 |
Occupancy by Householder Income Bracket in Oak Ridge
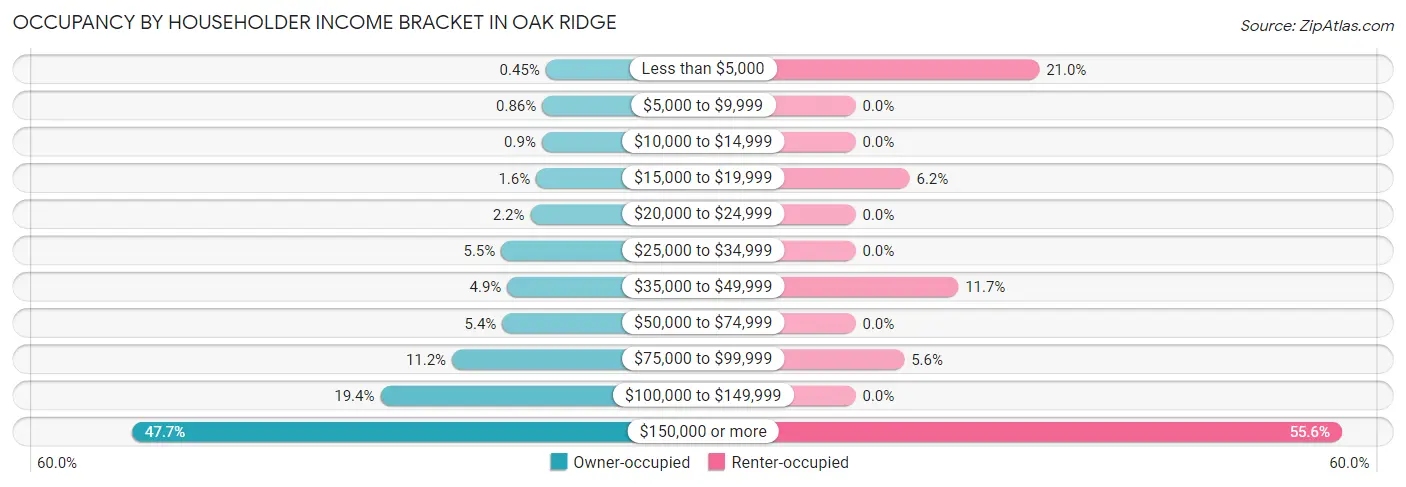
| Income Bracket | Owner-occupied | Renter-occupied |
| Less than $5,000 | 11 (0.4%) | 34 (21.0%) |
| $5,000 to $9,999 | 21 (0.9%) | 0 (0.0%) |
| $10,000 to $14,999 | 22 (0.9%) | 0 (0.0%) |
| $15,000 to $19,999 | 38 (1.5%) | 10 (6.2%) |
| $20,000 to $24,999 | 54 (2.2%) | 0 (0.0%) |
| $25,000 to $34,999 | 136 (5.5%) | 0 (0.0%) |
| $35,000 to $49,999 | 119 (4.9%) | 19 (11.7%) |
| $50,000 to $74,999 | 133 (5.4%) | 0 (0.0%) |
| $75,000 to $99,999 | 274 (11.2%) | 9 (5.6%) |
| $100,000 to $149,999 | 475 (19.4%) | 0 (0.0%) |
| $150,000 or more | 1,172 (47.7%) | 90 (55.6%) |
| Total | 2,455 (100.0%) | 162 (100.0%) |
Monthly Housing Cost Tiers in Oak Ridge
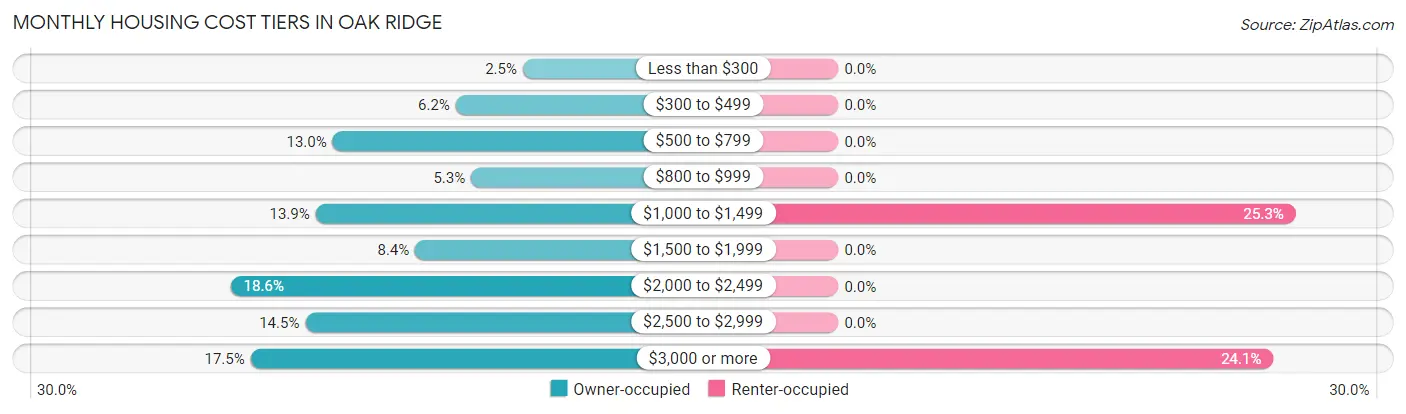
| Monthly Cost | Owner-occupied | Renter-occupied |
| Less than $300 | 61 (2.5%) | 0 (0.0%) |
| $300 to $499 | 152 (6.2%) | 0 (0.0%) |
| $500 to $799 | 319 (13.0%) | 0 (0.0%) |
| $800 to $999 | 131 (5.3%) | 0 (0.0%) |
| $1,000 to $1,499 | 342 (13.9%) | 41 (25.3%) |
| $1,500 to $1,999 | 207 (8.4%) | 0 (0.0%) |
| $2,000 to $2,499 | 457 (18.6%) | 0 (0.0%) |
| $2,500 to $2,999 | 356 (14.5%) | 0 (0.0%) |
| $3,000 or more | 430 (17.5%) | 39 (24.1%) |
| Total | 2,455 (100.0%) | 162 (100.0%) |
Physical Housing Characteristics in Oak Ridge
Housing Structures in Oak Ridge
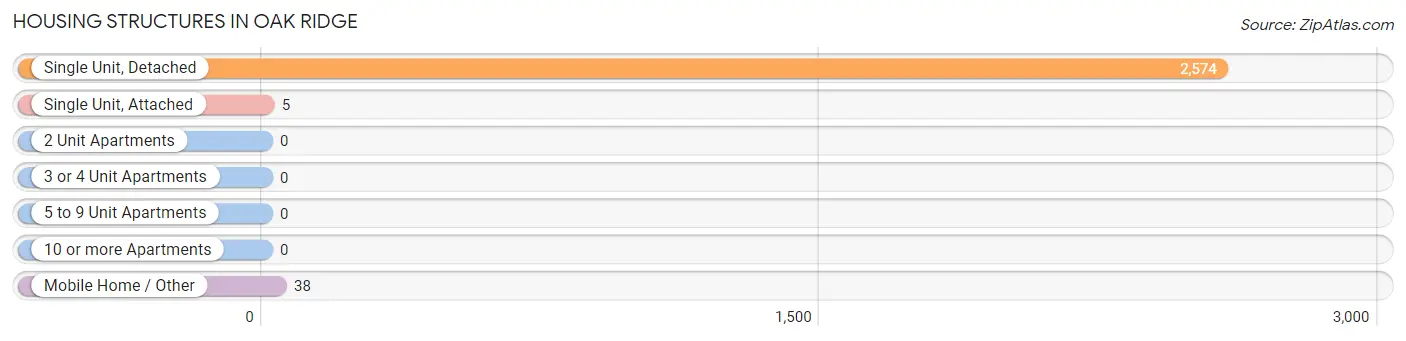
| Structure Type | # Housing Units | % Housing Units |
| Single Unit, Detached | 2,574 | 98.4% |
| Single Unit, Attached | 5 | 0.2% |
| 2 Unit Apartments | 0 | 0.0% |
| 3 or 4 Unit Apartments | 0 | 0.0% |
| 5 to 9 Unit Apartments | 0 | 0.0% |
| 10 or more Apartments | 0 | 0.0% |
| Mobile Home / Other | 38 | 1.5% |
| Total | 2,617 | 100.0% |
Housing Structures by Occupancy in Oak Ridge
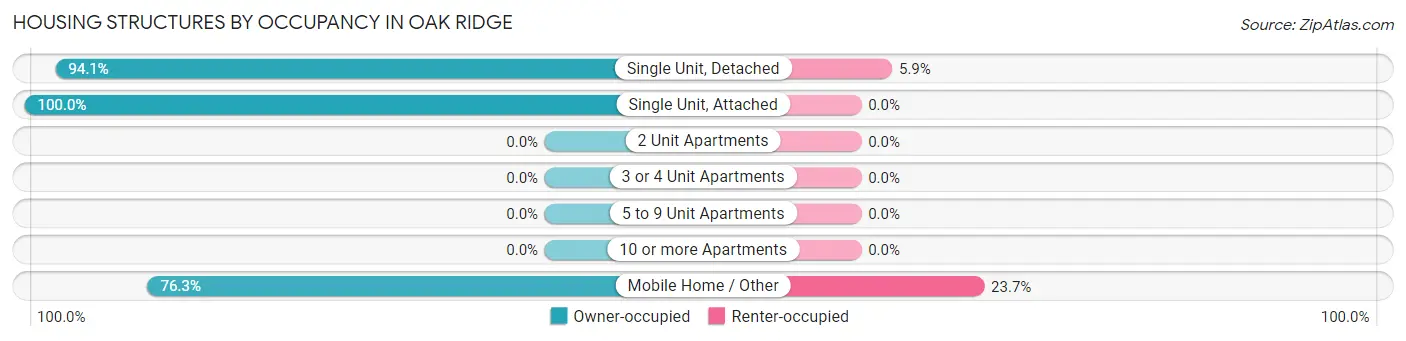
| Structure Type | Owner-occupied | Renter-occupied |
| Single Unit, Detached | 2,421 (94.1%) | 153 (5.9%) |
| Single Unit, Attached | 5 (100.0%) | 0 (0.0%) |
| 2 Unit Apartments | 0 (0.0%) | 0 (0.0%) |
| 3 or 4 Unit Apartments | 0 (0.0%) | 0 (0.0%) |
| 5 to 9 Unit Apartments | 0 (0.0%) | 0 (0.0%) |
| 10 or more Apartments | 0 (0.0%) | 0 (0.0%) |
| Mobile Home / Other | 29 (76.3%) | 9 (23.7%) |
| Total | 2,455 (93.8%) | 162 (6.2%) |
Housing Structures by Number of Rooms in Oak Ridge
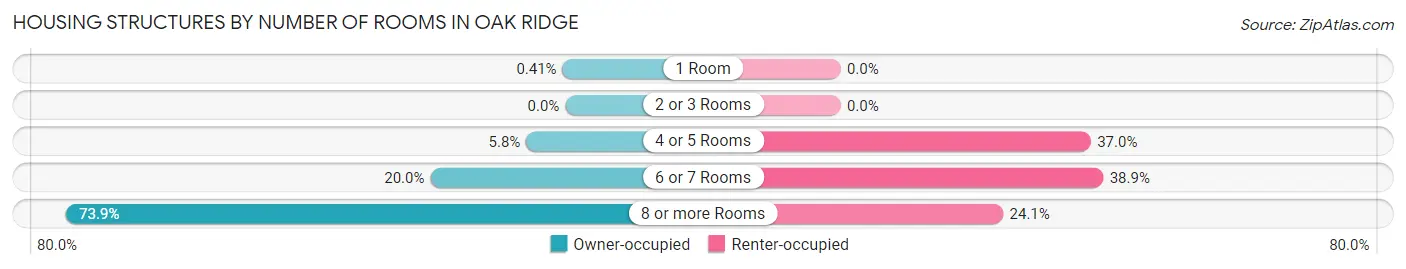
| Number of Rooms | Owner-occupied | Renter-occupied |
| 1 Room | 10 (0.4%) | 0 (0.0%) |
| 2 or 3 Rooms | 0 (0.0%) | 0 (0.0%) |
| 4 or 5 Rooms | 142 (5.8%) | 60 (37.0%) |
| 6 or 7 Rooms | 490 (20.0%) | 63 (38.9%) |
| 8 or more Rooms | 1,813 (73.9%) | 39 (24.1%) |
| Total | 2,455 (100.0%) | 162 (100.0%) |
Housing Structure by Heating Type in Oak Ridge
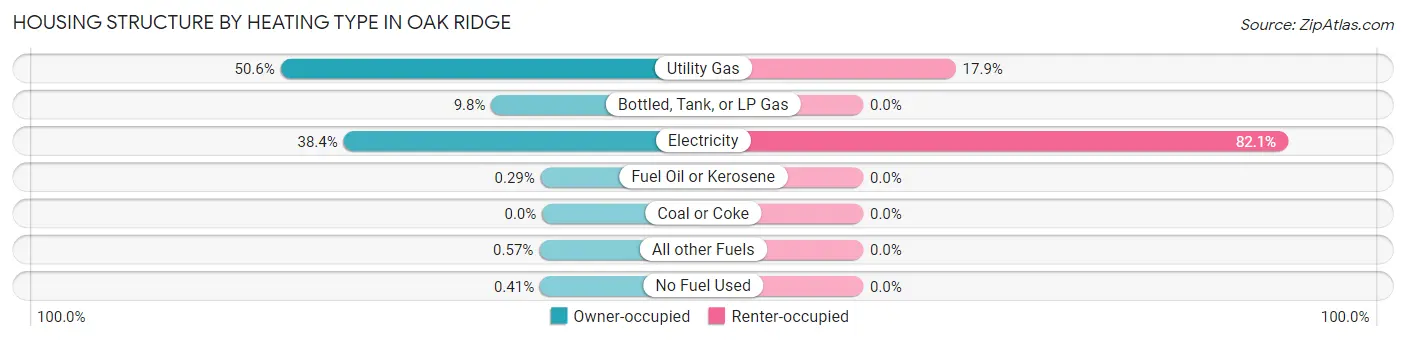
| Heating Type | Owner-occupied | Renter-occupied |
| Utility Gas | 1,241 (50.5%) | 29 (17.9%) |
| Bottled, Tank, or LP Gas | 241 (9.8%) | 0 (0.0%) |
| Electricity | 942 (38.4%) | 133 (82.1%) |
| Fuel Oil or Kerosene | 7 (0.3%) | 0 (0.0%) |
| Coal or Coke | 0 (0.0%) | 0 (0.0%) |
| All other Fuels | 14 (0.6%) | 0 (0.0%) |
| No Fuel Used | 10 (0.4%) | 0 (0.0%) |
| Total | 2,455 (100.0%) | 162 (100.0%) |
Household Vehicle Usage in Oak Ridge
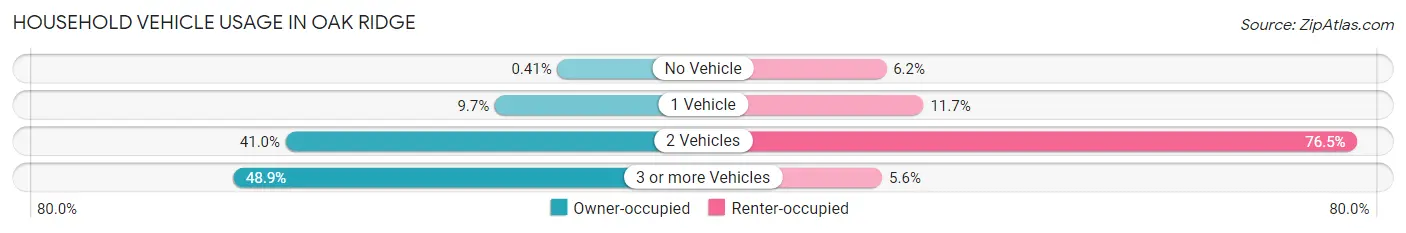
| Vehicles per Household | Owner-occupied | Renter-occupied |
| No Vehicle | 10 (0.4%) | 10 (6.2%) |
| 1 Vehicle | 239 (9.7%) | 19 (11.7%) |
| 2 Vehicles | 1,006 (41.0%) | 124 (76.5%) |
| 3 or more Vehicles | 1,200 (48.9%) | 9 (5.6%) |
| Total | 2,455 (100.0%) | 162 (100.0%) |
Real Estate & Mortgages in Oak Ridge
Real Estate and Mortgage Overview in Oak Ridge
| Characteristic | Without Mortgage | With Mortgage |
| Housing Units | 615 | 1,840 |
| Median Property Value | $445,800 | $497,400 |
| Median Household Income | $96,023 | $994 |
| Monthly Housing Costs | $584 | $430 |
| Real Estate Taxes | $3,216 | $5 |
Property Value by Mortgage Status in Oak Ridge
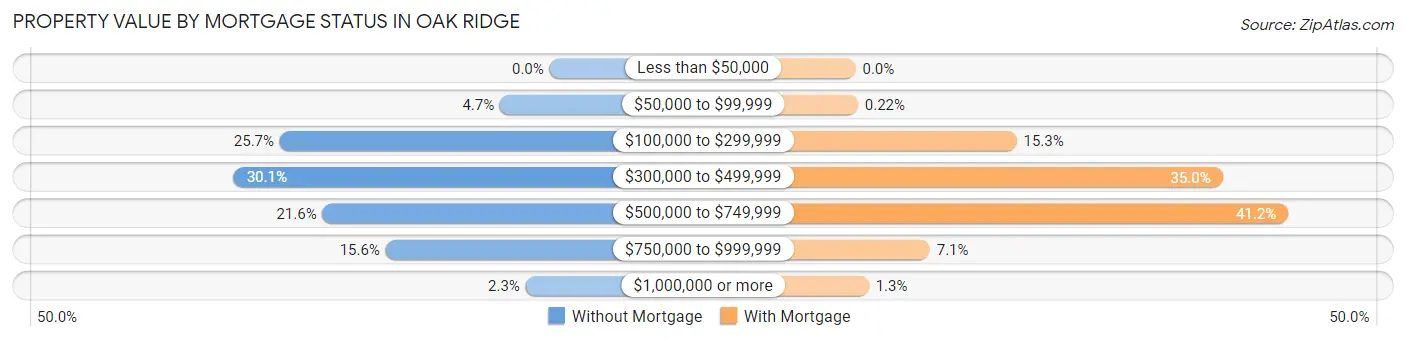
| Property Value | Without Mortgage | With Mortgage |
| Less than $50,000 | 0 (0.0%) | 0 (0.0%) |
| $50,000 to $99,999 | 29 (4.7%) | 4 (0.2%) |
| $100,000 to $299,999 | 158 (25.7%) | 282 (15.3%) |
| $300,000 to $499,999 | 185 (30.1%) | 643 (34.9%) |
| $500,000 to $749,999 | 133 (21.6%) | 758 (41.2%) |
| $750,000 to $999,999 | 96 (15.6%) | 130 (7.1%) |
| $1,000,000 or more | 14 (2.3%) | 23 (1.3%) |
| Total | 615 (100.0%) | 1,840 (100.0%) |
Household Income by Mortgage Status in Oak Ridge
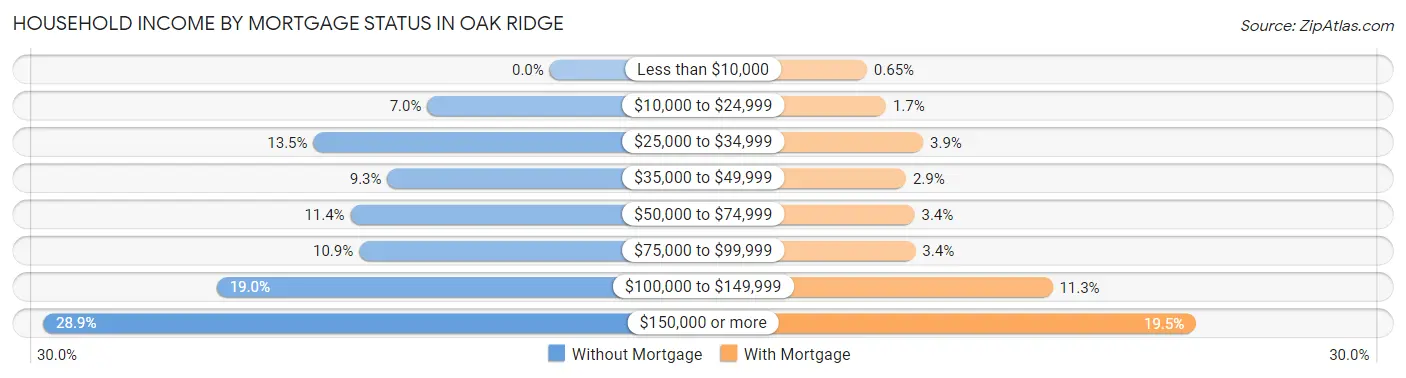
| Household Income | Without Mortgage | With Mortgage |
| Less than $10,000 | 0 (0.0%) | 12 (0.6%) |
| $10,000 to $24,999 | 43 (7.0%) | 32 (1.7%) |
| $25,000 to $34,999 | 83 (13.5%) | 71 (3.9%) |
| $35,000 to $49,999 | 57 (9.3%) | 53 (2.9%) |
| $50,000 to $74,999 | 70 (11.4%) | 62 (3.4%) |
| $75,000 to $99,999 | 67 (10.9%) | 63 (3.4%) |
| $100,000 to $149,999 | 117 (19.0%) | 207 (11.3%) |
| $150,000 or more | 178 (28.9%) | 358 (19.5%) |
| Total | 615 (100.0%) | 1,840 (100.0%) |
Property Value to Household Income Ratio in Oak Ridge
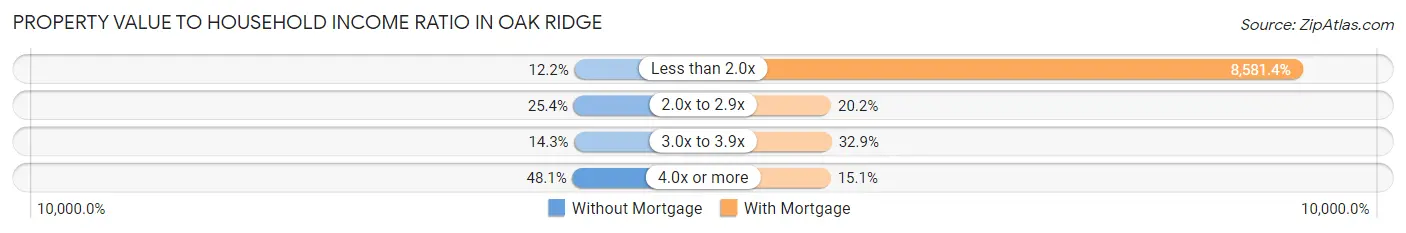
| Value-to-Income Ratio | Without Mortgage | With Mortgage |
| Less than 2.0x | 75 (12.2%) | 157,898 (8,581.4%) |
| 2.0x to 2.9x | 156 (25.4%) | 372 (20.2%) |
| 3.0x to 3.9x | 88 (14.3%) | 605 (32.9%) |
| 4.0x or more | 296 (48.1%) | 278 (15.1%) |
| Total | 615 (100.0%) | 1,840 (100.0%) |
Real Estate Taxes by Mortgage Status in Oak Ridge
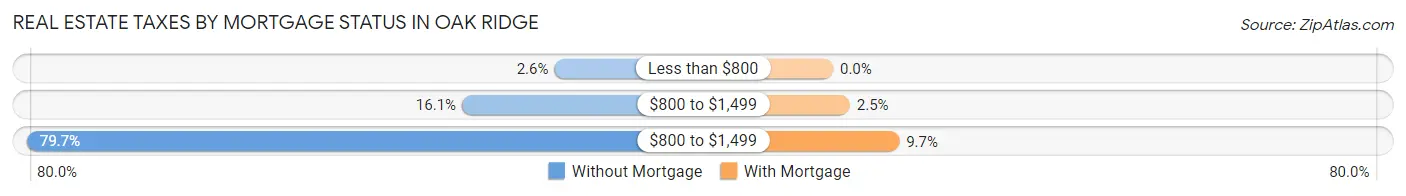
| Property Taxes | Without Mortgage | With Mortgage |
| Less than $800 | 16 (2.6%) | 0 (0.0%) |
| $800 to $1,499 | 99 (16.1%) | 45 (2.5%) |
| $800 to $1,499 | 490 (79.7%) | 178 (9.7%) |
| Total | 615 (100.0%) | 1,840 (100.0%) |
Health & Disability in Oak Ridge
Health Insurance Coverage by Age in Oak Ridge
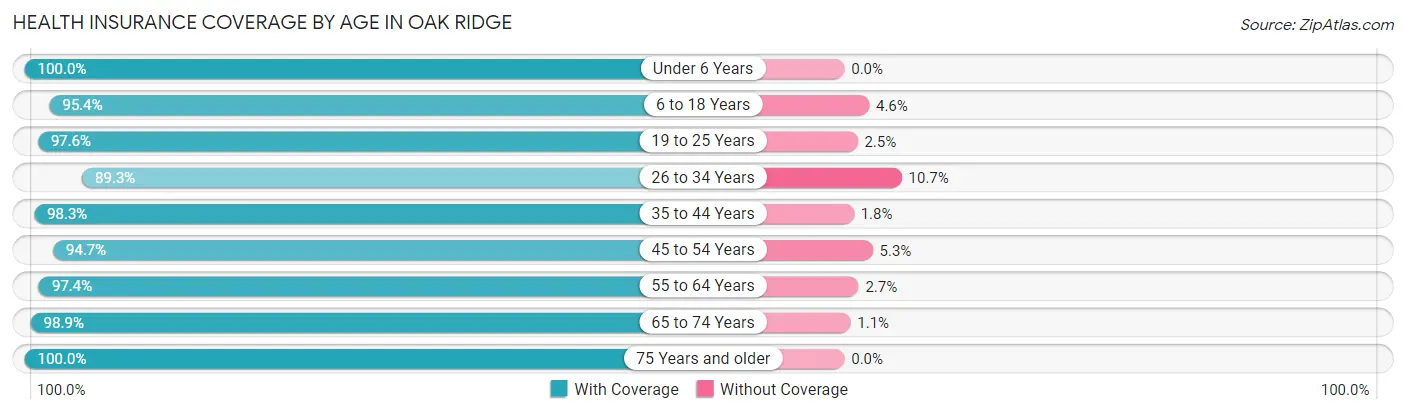
| Age Bracket | With Coverage | Without Coverage |
| Under 6 Years | 421 (100.0%) | 0 (0.0%) |
| 6 to 18 Years | 1,531 (95.4%) | 74 (4.6%) |
| 19 to 25 Years | 359 (97.6%) | 9 (2.5%) |
| 26 to 34 Years | 309 (89.3%) | 37 (10.7%) |
| 35 to 44 Years | 898 (98.3%) | 16 (1.8%) |
| 45 to 54 Years | 1,201 (94.7%) | 67 (5.3%) |
| 55 to 64 Years | 1,544 (97.4%) | 42 (2.6%) |
| 65 to 74 Years | 697 (98.9%) | 8 (1.1%) |
| 75 Years and older | 424 (100.0%) | 0 (0.0%) |
| Total | 7,384 (96.7%) | 253 (3.3%) |
Health Insurance Coverage by Citizenship Status in Oak Ridge
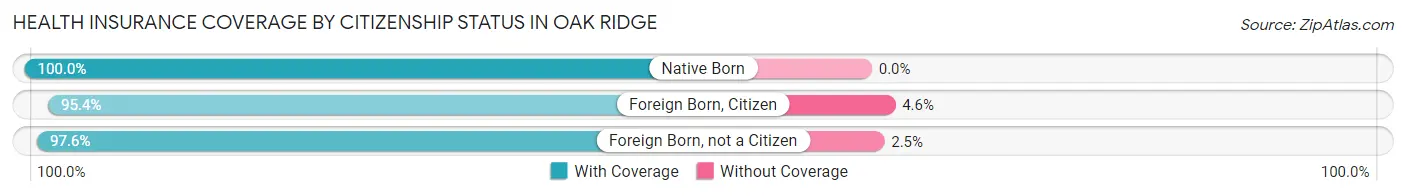
| Citizenship Status | With Coverage | Without Coverage |
| Native Born | 421 (100.0%) | 0 (0.0%) |
| Foreign Born, Citizen | 1,531 (95.4%) | 74 (4.6%) |
| Foreign Born, not a Citizen | 359 (97.6%) | 9 (2.5%) |
Health Insurance Coverage by Household Income in Oak Ridge
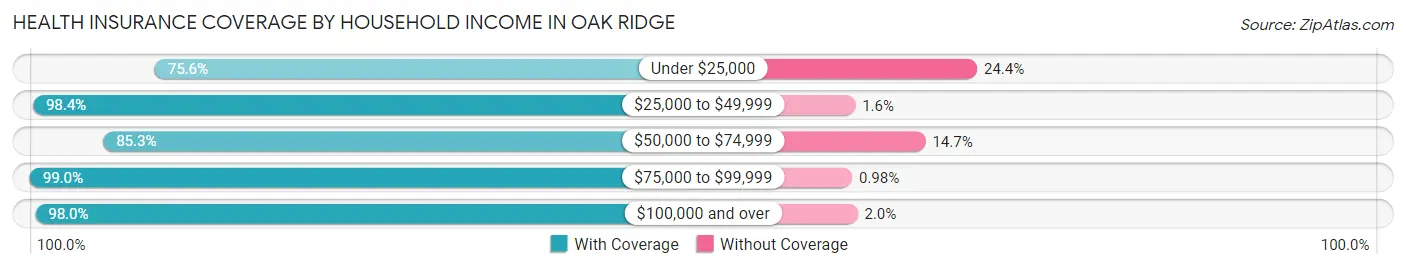
| Household Income | With Coverage | Without Coverage |
| Under $25,000 | 220 (75.6%) | 71 (24.4%) |
| $25,000 to $49,999 | 566 (98.4%) | 9 (1.6%) |
| $50,000 to $74,999 | 295 (85.3%) | 51 (14.7%) |
| $75,000 to $99,999 | 704 (99.0%) | 7 (1.0%) |
| $100,000 and over | 5,599 (98.0%) | 115 (2.0%) |
Public vs Private Health Insurance Coverage by Age in Oak Ridge
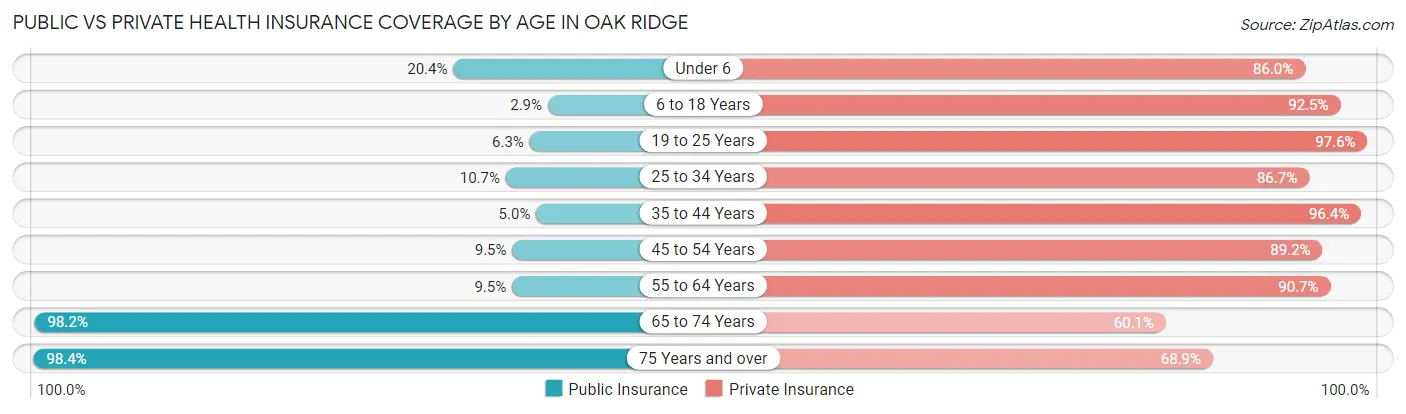
| Age Bracket | Public Insurance | Private Insurance |
| Under 6 | 86 (20.4%) | 362 (86.0%) |
| 6 to 18 Years | 46 (2.9%) | 1,485 (92.5%) |
| 19 to 25 Years | 23 (6.2%) | 359 (97.6%) |
| 25 to 34 Years | 37 (10.7%) | 300 (86.7%) |
| 35 to 44 Years | 46 (5.0%) | 881 (96.4%) |
| 45 to 54 Years | 120 (9.5%) | 1,131 (89.2%) |
| 55 to 64 Years | 151 (9.5%) | 1,438 (90.7%) |
| 65 to 74 Years | 692 (98.2%) | 424 (60.1%) |
| 75 Years and over | 417 (98.4%) | 292 (68.9%) |
| Total | 1,618 (21.2%) | 6,672 (87.4%) |
Disability Status by Sex by Age in Oak Ridge
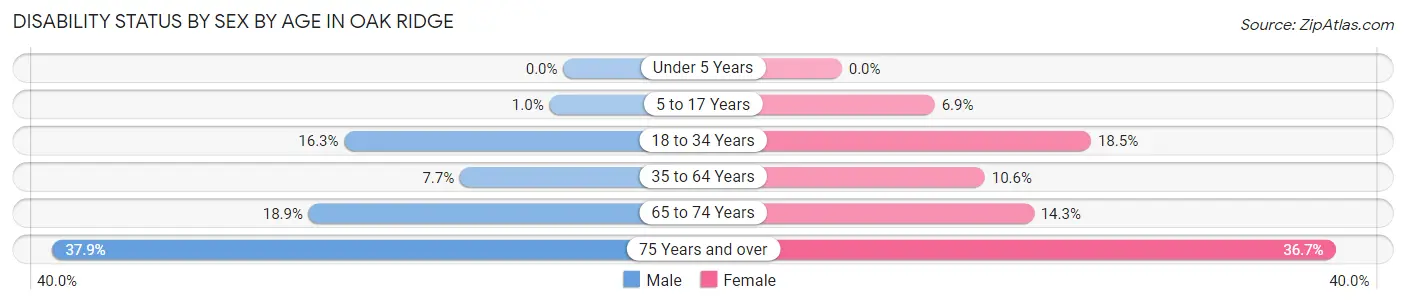
| Age Bracket | Male | Female |
| Under 5 Years | 0 (0.0%) | 0 (0.0%) |
| 5 to 17 Years | 8 (1.0%) | 62 (6.9%) |
| 18 to 34 Years | 93 (16.3%) | 32 (18.5%) |
| 35 to 64 Years | 149 (7.7%) | 194 (10.6%) |
| 65 to 74 Years | 55 (18.9%) | 59 (14.2%) |
| 75 Years and over | 77 (37.9%) | 81 (36.6%) |
Disability Class by Sex by Age in Oak Ridge
Disability Class: Hearing Difficulty
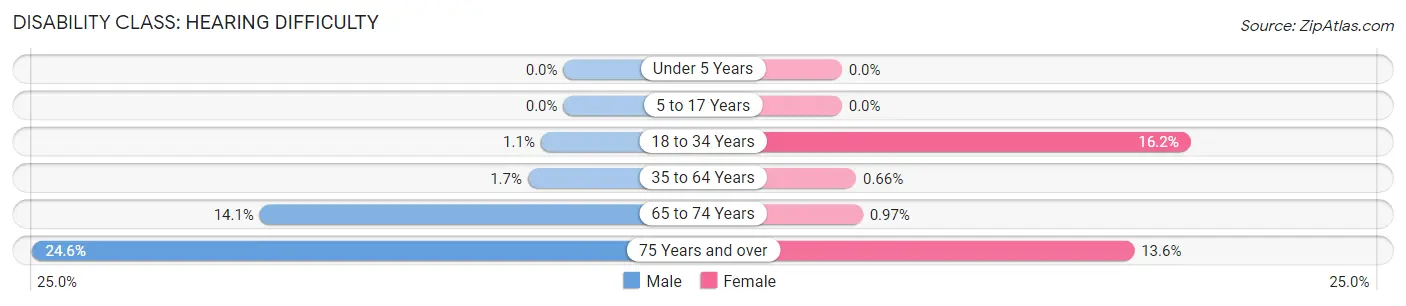
| Age Bracket | Male | Female |
| Under 5 Years | 0 (0.0%) | 0 (0.0%) |
| 5 to 17 Years | 0 (0.0%) | 0 (0.0%) |
| 18 to 34 Years | 6 (1.1%) | 28 (16.2%) |
| 35 to 64 Years | 32 (1.7%) | 12 (0.7%) |
| 65 to 74 Years | 41 (14.1%) | 4 (1.0%) |
| 75 Years and over | 50 (24.6%) | 30 (13.6%) |
Disability Class: Vision Difficulty
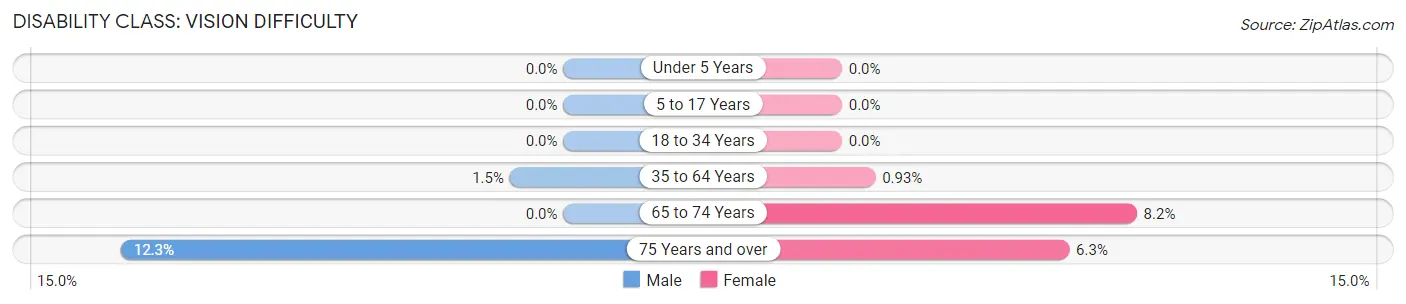
| Age Bracket | Male | Female |
| Under 5 Years | 0 (0.0%) | 0 (0.0%) |
| 5 to 17 Years | 0 (0.0%) | 0 (0.0%) |
| 18 to 34 Years | 0 (0.0%) | 0 (0.0%) |
| 35 to 64 Years | 29 (1.5%) | 17 (0.9%) |
| 65 to 74 Years | 0 (0.0%) | 34 (8.2%) |
| 75 Years and over | 25 (12.3%) | 14 (6.3%) |
Disability Class: Cognitive Difficulty
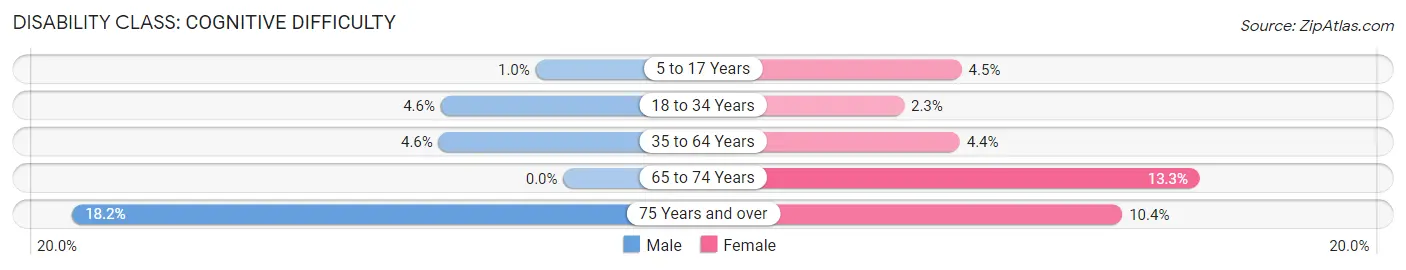
| Age Bracket | Male | Female |
| 5 to 17 Years | 8 (1.0%) | 40 (4.4%) |
| 18 to 34 Years | 26 (4.5%) | 4 (2.3%) |
| 35 to 64 Years | 90 (4.6%) | 80 (4.4%) |
| 65 to 74 Years | 0 (0.0%) | 55 (13.3%) |
| 75 Years and over | 37 (18.2%) | 23 (10.4%) |
Disability Class: Ambulatory Difficulty
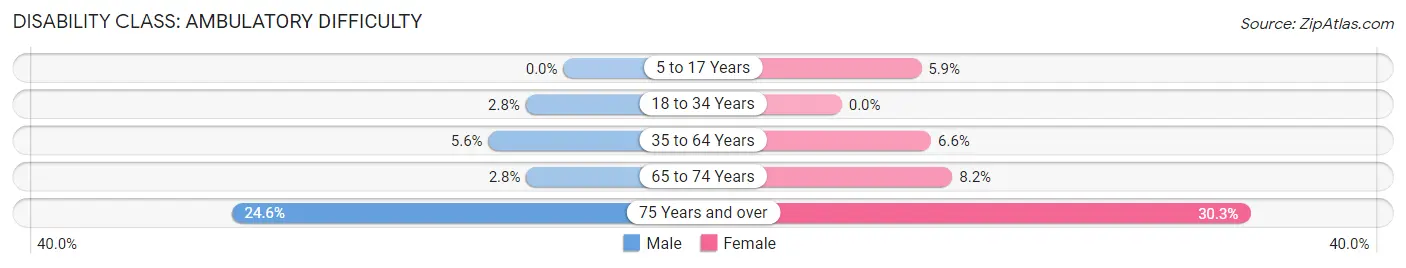
| Age Bracket | Male | Female |
| 5 to 17 Years | 0 (0.0%) | 53 (5.9%) |
| 18 to 34 Years | 16 (2.8%) | 0 (0.0%) |
| 35 to 64 Years | 108 (5.6%) | 121 (6.6%) |
| 65 to 74 Years | 8 (2.8%) | 34 (8.2%) |
| 75 Years and over | 50 (24.6%) | 67 (30.3%) |
Disability Class: Self-Care Difficulty
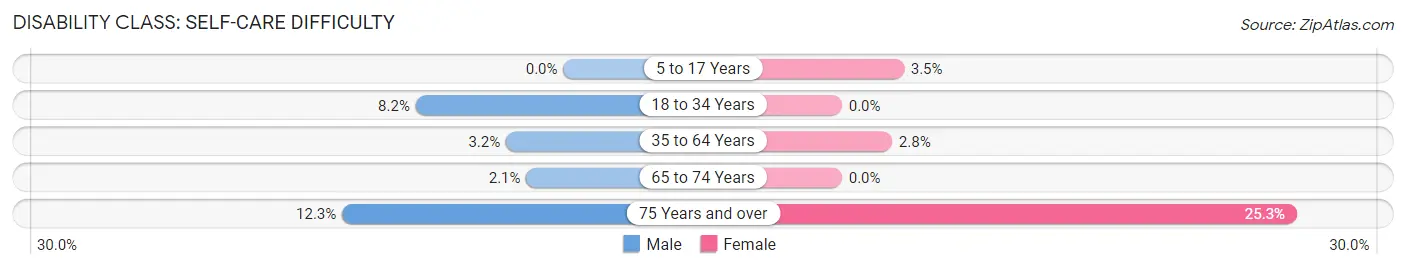
| Age Bracket | Male | Female |
| 5 to 17 Years | 0 (0.0%) | 31 (3.5%) |
| 18 to 34 Years | 47 (8.2%) | 0 (0.0%) |
| 35 to 64 Years | 62 (3.2%) | 51 (2.8%) |
| 65 to 74 Years | 6 (2.1%) | 0 (0.0%) |
| 75 Years and over | 25 (12.3%) | 56 (25.3%) |
Technology Access in Oak Ridge
Computing Device Access in Oak Ridge
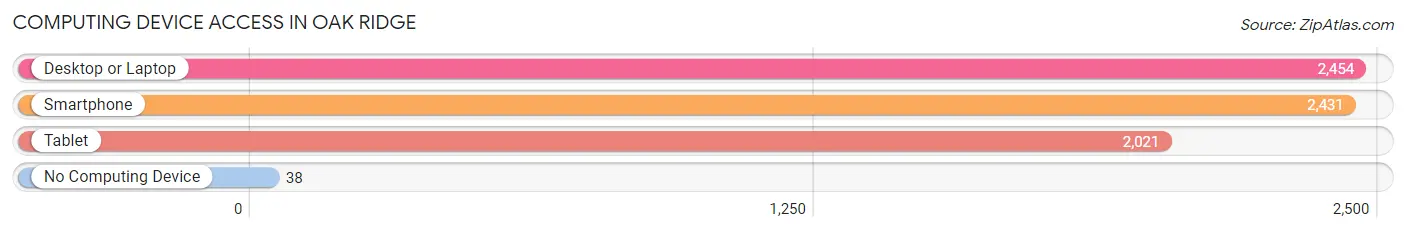
| Device Type | # Households | % Households |
| Desktop or Laptop | 2,454 | 93.8% |
| Smartphone | 2,431 | 92.9% |
| Tablet | 2,021 | 77.2% |
| No Computing Device | 38 | 1.5% |
| Total | 2,617 | 100.0% |
Internet Access in Oak Ridge
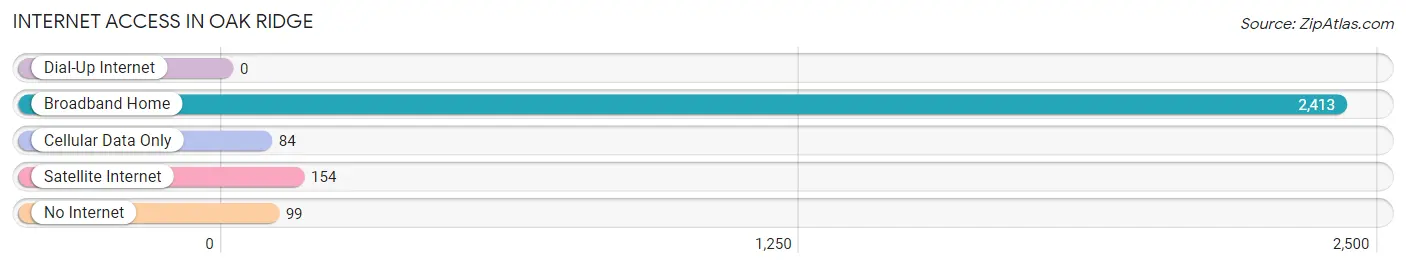
| Internet Type | # Households | % Households |
| Dial-Up Internet | 0 | 0.0% |
| Broadband Home | 2,413 | 92.2% |
| Cellular Data Only | 84 | 3.2% |
| Satellite Internet | 154 | 5.9% |
| No Internet | 99 | 3.8% |
| Total | 2,617 | 100.0% |
Oak Ridge Summary
Oak Ridge, North Carolina is a small town located in the foothills of the Blue Ridge Mountains in Guilford County. It is situated about 20 miles northeast of Greensboro and is part of the Piedmont Triad metropolitan area. The town was founded in 1836 and has a population of approximately 2,000 people.
Geography
Oak Ridge is located in the Piedmont region of North Carolina, which is characterized by rolling hills and valleys. The town is situated in the foothills of the Blue Ridge Mountains, which are part of the Appalachian Mountains. The town is located on the banks of the Haw River, which is a tributary of the Cape Fear River. The town is also located near the Uwharrie National Forest, which is a popular destination for outdoor recreation.
The town has a total area of 1.3 square miles, all of which is land. The town is located at an elevation of 890 feet above sea level. The climate in Oak Ridge is humid subtropical, with hot, humid summers and mild winters.
History
Oak Ridge was founded in 1836 by a group of settlers from the nearby town of Greensboro. The town was named after the oak trees that grew in the area. The town was originally a farming community, but it soon became a center for the production of textiles. The town was also home to several mills, which produced cotton, wool, and other fabrics.
In the late 19th century, Oak Ridge became a popular tourist destination. The town was home to several resorts, which attracted visitors from all over the country. The town also became a popular destination for outdoor recreation, such as fishing, hunting, and camping.
In the early 20th century, Oak Ridge became a center for the production of furniture. The town was home to several furniture factories, which produced furniture for the entire country. The town also became a center for the production of textiles, and several textile mills were established in the area.
Economy
Oak Ridge is a small town with a population of approximately 2,000 people. The town is home to several small businesses, including restaurants, retail stores, and service providers. The town is also home to several manufacturing companies, which produce furniture, textiles, and other products.
The town is also home to several educational institutions, including Oak Ridge High School and Oak Ridge Elementary School. The town is also home to several churches, including the Oak Ridge United Methodist Church and the Oak Ridge Baptist Church.
Demographics
As of the 2010 census, the population of Oak Ridge was 2,000 people. The racial makeup of the town was 94.2% White, 2.2% African American, 0.2% Native American, 0.6% Asian, 0.1% Pacific Islander, 1.2% from other races, and 1.7% from two or more races. Hispanic or Latino of any race were 3.2% of the population.
The median income for a household in Oak Ridge was $41,250, and the median income for a family was $50,000. The per capita income for the town was $20,945. About 11.2% of families and 14.2% of the population were below the poverty line, including 18.2% of those under age 18 and 8.3% of those age 65 or over.
Conclusion
Oak Ridge, North Carolina is a small town located in the foothills of the Blue Ridge Mountains in Guilford County. The town was founded in 1836 and has a population of approximately 2,000 people. The town is home to several small businesses, manufacturing companies, and educational institutions. The town has a humid subtropical climate and is a popular destination for outdoor recreation. The median income for a household in Oak Ridge was $41,250, and the median income for a family was $50,000. The racial makeup of the town was 94.2% White, 2.2% African American, 0.2% Native American, 0.6% Asian, 0.1% Pacific Islander, 1.2% from other races, and 1.7% from two or more races.
Common Questions
What is Per Capita Income in Oak Ridge?
Per Capita income in Oak Ridge is $60,198.
What is the Median Family Income in Oak Ridge?
Median Family Income in Oak Ridge is $157,465.
What is the Median Household income in Oak Ridge?
Median Household Income in Oak Ridge is $146,131.
What is Income or Wage Gap in Oak Ridge?
Income or Wage Gap in Oak Ridge is 66.7%.
Women in Oak Ridge earn 33.3 cents for every dollar earned by a man.
What is Inequality or Gini Index in Oak Ridge?
Inequality or Gini Index in Oak Ridge is 0.42.
What is the Total Population of Oak Ridge?
Total Population of Oak Ridge is 7,637.
What is the Total Male Population of Oak Ridge?
Total Male Population of Oak Ridge is 3,967.
What is the Total Female Population of Oak Ridge?
Total Female Population of Oak Ridge is 3,670.
What is the Ratio of Males per 100 Females in Oak Ridge?
There are 108.09 Males per 100 Females in Oak Ridge.
What is the Ratio of Females per 100 Males in Oak Ridge?
There are 92.51 Females per 100 Males in Oak Ridge.
What is the Median Population Age in Oak Ridge?
Median Population Age in Oak Ridge is 46.8 Years.
What is the Average Family Size in Oak Ridge
Average Family Size in Oak Ridge is 3.2 People.
What is the Average Household Size in Oak Ridge
Average Household Size in Oak Ridge is 2.9 People.
How Large is the Labor Force in Oak Ridge?
There are 3,798 People in the Labor Forcein in Oak Ridge.
What is the Percentage of People in the Labor Force in Oak Ridge?
64.1% of People are in the Labor Force in Oak Ridge.
What is the Unemployment Rate in Oak Ridge?
Unemployment Rate in Oak Ridge is 3.8%.