Hilliard, OH Map & Demographics
Hilliard Map
Hilliard Overview
$52,895
PER CAPITA INCOME
$136,106
AVG FAMILY INCOME
$116,287
AVG HOUSEHOLD INCOME
25.5%
WAGE / INCOME GAP [ % ]
74.5¢/ $1
WAGE / INCOME GAP [ $ ]
$14,345
FAMILY INCOME DEFICIT
0.39
INEQUALITY / GINI INDEX
36,103
TOTAL POPULATION
17,637
MALE POPULATION
18,466
FEMALE POPULATION
95.51
MALES / 100 FEMALES
104.70
FEMALES / 100 MALES
36.2
MEDIAN AGE
3.1
AVG FAMILY SIZE
2.6
AVG HOUSEHOLD SIZE
20,853
LABOR FORCE [ PEOPLE ]
74.4%
PERCENT IN LABOR FORCE
2.4%
UNEMPLOYMENT RATE
Hilliard Zip Codes
Hilliard Area Codes
Income in Hilliard
Income Overview in Hilliard
Per Capita Income in Hilliard is $52,895, while median incomes of families and households are $136,106 and $116,287 respectively.
| Characteristic | Number | Measure |
| Per Capita Income | 36,103 | $52,895 |
| Median Family Income | 10,019 | $136,106 |
| Mean Family Income | 10,019 | $156,784 |
| Median Household Income | 13,887 | $116,287 |
| Mean Household Income | 13,887 | $137,632 |
| Income Deficit | 10,019 | $14,345 |
| Wage / Income Gap (%) | 36,103 | 25.45% |
| Wage / Income Gap ($) | 36,103 | 74.55¢ per $1 |
| Gini / Inequality Index | 36,103 | 0.39 |
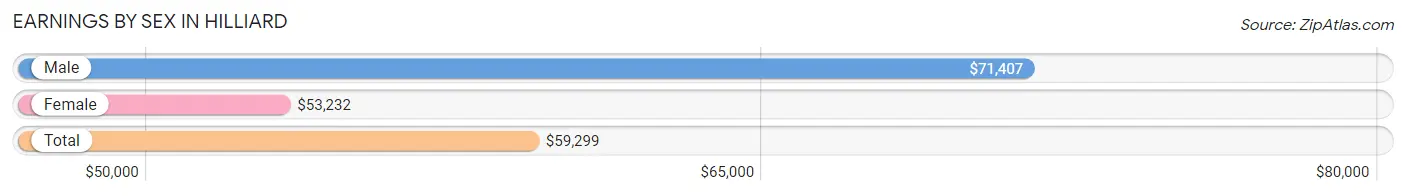
Earnings by Sex in Hilliard
Average Earnings in Hilliard are $59,299, $71,407 for men and $53,232 for women, a difference of 25.5%.
| Sex | Number | Average Earnings |
| Male | 11,421 (52.6%) | $71,407 |
| Female | 10,278 (47.4%) | $53,232 |
| Total | 21,699 (100.0%) | $59,299 |
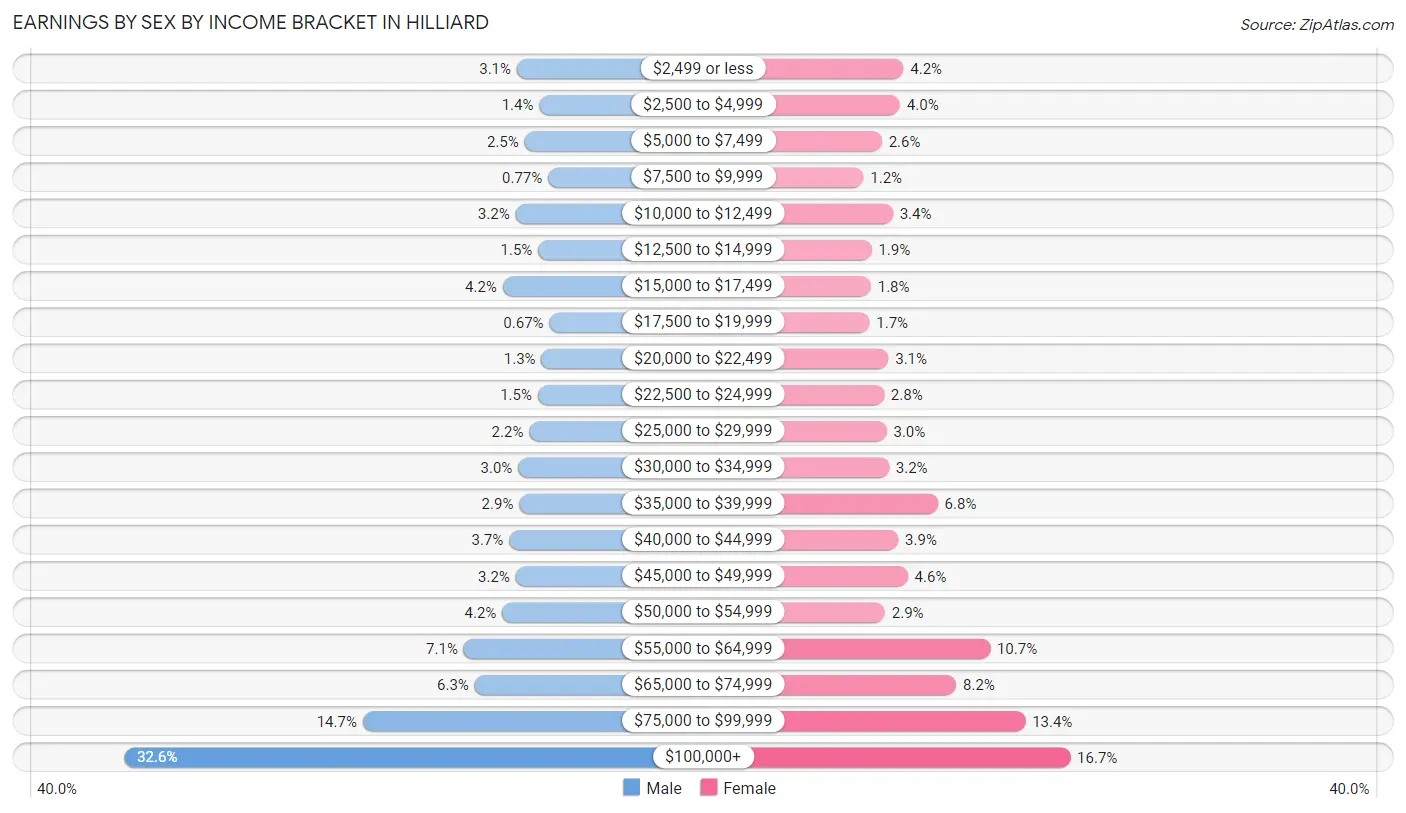
Earnings by Sex by Income Bracket in Hilliard
The most common earnings brackets in Hilliard are $100,000+ for men (3,717 | 32.6%) and $100,000+ for women (1,721 | 16.7%).
| Income | Male | Female |
| $2,499 or less | 355 (3.1%) | 436 (4.2%) |
| $2,500 to $4,999 | 163 (1.4%) | 409 (4.0%) |
| $5,000 to $7,499 | 289 (2.5%) | 269 (2.6%) |
| $7,500 to $9,999 | 88 (0.8%) | 127 (1.2%) |
| $10,000 to $12,499 | 367 (3.2%) | 354 (3.4%) |
| $12,500 to $14,999 | 173 (1.5%) | 190 (1.8%) |
| $15,000 to $17,499 | 476 (4.2%) | 185 (1.8%) |
| $17,500 to $19,999 | 76 (0.7%) | 174 (1.7%) |
| $20,000 to $22,499 | 145 (1.3%) | 320 (3.1%) |
| $22,500 to $24,999 | 176 (1.5%) | 286 (2.8%) |
| $25,000 to $29,999 | 249 (2.2%) | 306 (3.0%) |
| $30,000 to $34,999 | 344 (3.0%) | 324 (3.2%) |
| $35,000 to $39,999 | 335 (2.9%) | 700 (6.8%) |
| $40,000 to $44,999 | 422 (3.7%) | 396 (3.8%) |
| $45,000 to $49,999 | 365 (3.2%) | 469 (4.6%) |
| $50,000 to $54,999 | 481 (4.2%) | 293 (2.9%) |
| $55,000 to $64,999 | 810 (7.1%) | 1,103 (10.7%) |
| $65,000 to $74,999 | 716 (6.3%) | 842 (8.2%) |
| $75,000 to $99,999 | 1,674 (14.7%) | 1,374 (13.4%) |
| $100,000+ | 3,717 (32.6%) | 1,721 (16.7%) |
| Total | 11,421 (100.0%) | 10,278 (100.0%) |
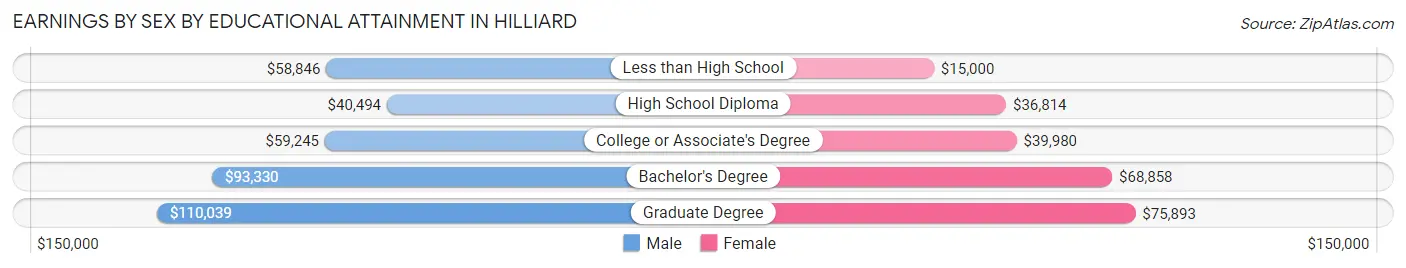
Earnings by Sex by Educational Attainment in Hilliard
Average earnings in Hilliard are $81,788 for men and $59,221 for women, a difference of 27.6%. Men with an educational attainment of graduate degree enjoy the highest average annual earnings of $110,039, while those with high school diploma education earn the least with $40,494. Women with an educational attainment of graduate degree earn the most with the average annual earnings of $75,893, while those with less than high school education have the smallest earnings of $15,000.
| Educational Attainment | Male Income | Female Income |
| Less than High School | $58,846 | $15,000 |
| High School Diploma | $40,494 | $36,814 |
| College or Associate's Degree | $59,245 | $39,980 |
| Bachelor's Degree | $93,330 | $68,858 |
| Graduate Degree | $110,039 | $75,893 |
| Total | $81,788 | $59,221 |
Family Income in Hilliard
Family Income Brackets in Hilliard
According to the Hilliard family income data, there are 2,705 families falling into the $100,000 to $149,999 income range, which is the most common income bracket and makes up 27.0% of all families. Conversely, the less than $10,000 income bracket is the least frequent group with only 10 families (0.1%) belonging to this category.
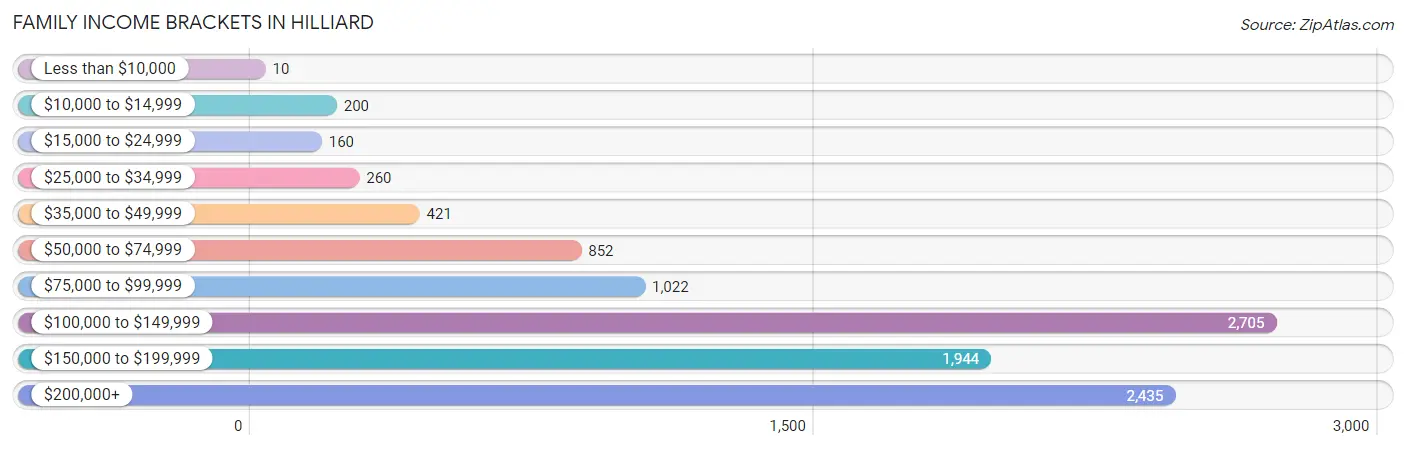
| Income Bracket | # Families | % Families |
| Less than $10,000 | 10 | 0.1% |
| $10,000 to $14,999 | 200 | 2.0% |
| $15,000 to $24,999 | 160 | 1.6% |
| $25,000 to $34,999 | 260 | 2.6% |
| $35,000 to $49,999 | 421 | 4.2% |
| $50,000 to $74,999 | 852 | 8.5% |
| $75,000 to $99,999 | 1,022 | 10.2% |
| $100,000 to $149,999 | 2,705 | 27.0% |
| $150,000 to $199,999 | 1,944 | 19.4% |
| $200,000+ | 2,435 | 24.3% |
Family Income by Famaliy Size in Hilliard
4-person families (2,144 | 21.4%) account for the highest median family income in Hilliard with $168,833 per family, while 2-person families (4,287 | 42.8%) have the highest median income of $62,716 per family member.
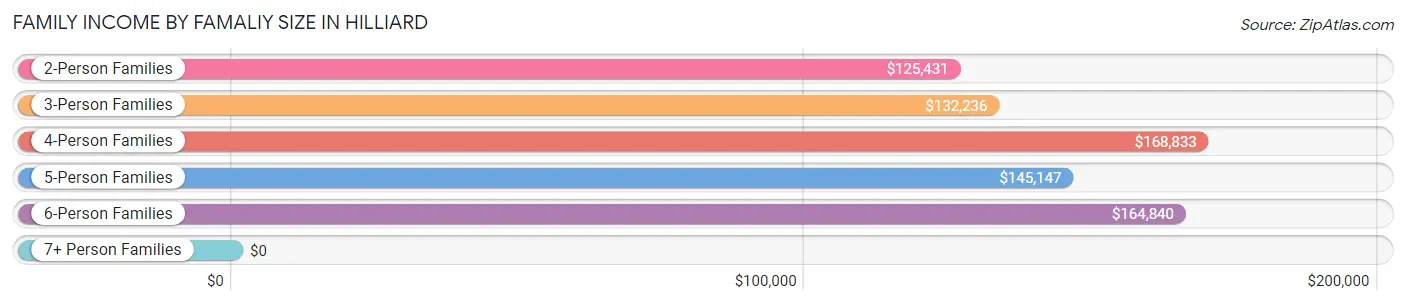
| Income Bracket | # Families | Median Income |
| 2-Person Families | 4,287 (42.8%) | $125,431 |
| 3-Person Families | 2,261 (22.6%) | $132,236 |
| 4-Person Families | 2,144 (21.4%) | $168,833 |
| 5-Person Families | 968 (9.7%) | $145,147 |
| 6-Person Families | 205 (2.1%) | $164,840 |
| 7+ Person Families | 154 (1.5%) | $0 |
| Total | 10,019 (100.0%) | $136,106 |
Family Income by Number of Earners in Hilliard
The median family income in Hilliard is $136,106, with families comprising 3+ earners (1,592) having the highest median family income of $178,333, while families with no earners (784) have the lowest median family income of $70,603, accounting for 15.9% and 7.8% of families, respectively.
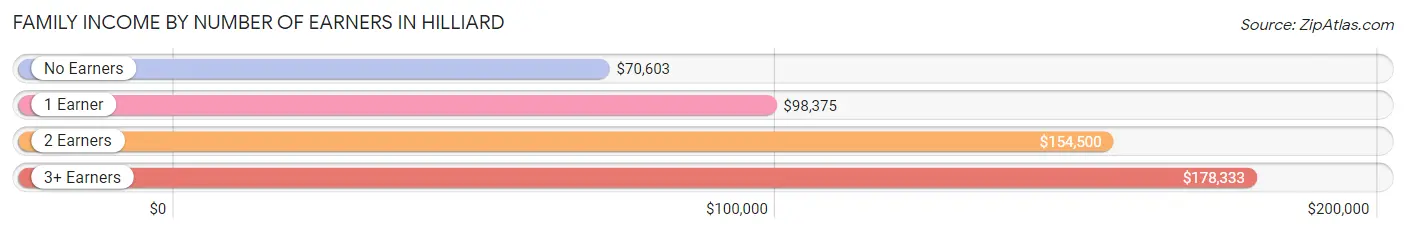
| Number of Earners | # Families | Median Income |
| No Earners | 784 (7.8%) | $70,603 |
| 1 Earner | 2,689 (26.8%) | $98,375 |
| 2 Earners | 4,954 (49.4%) | $154,500 |
| 3+ Earners | 1,592 (15.9%) | $178,333 |
| Total | 10,019 (100.0%) | $136,106 |
Household Income in Hilliard
Household Income Brackets in Hilliard
With 3,416 households falling in the category, the $100,000 to $149,999 income range is the most frequent in Hilliard, accounting for 24.6% of all households. In contrast, only 83 households (0.6%) fall into the less than $10,000 income bracket, making it the least populous group.
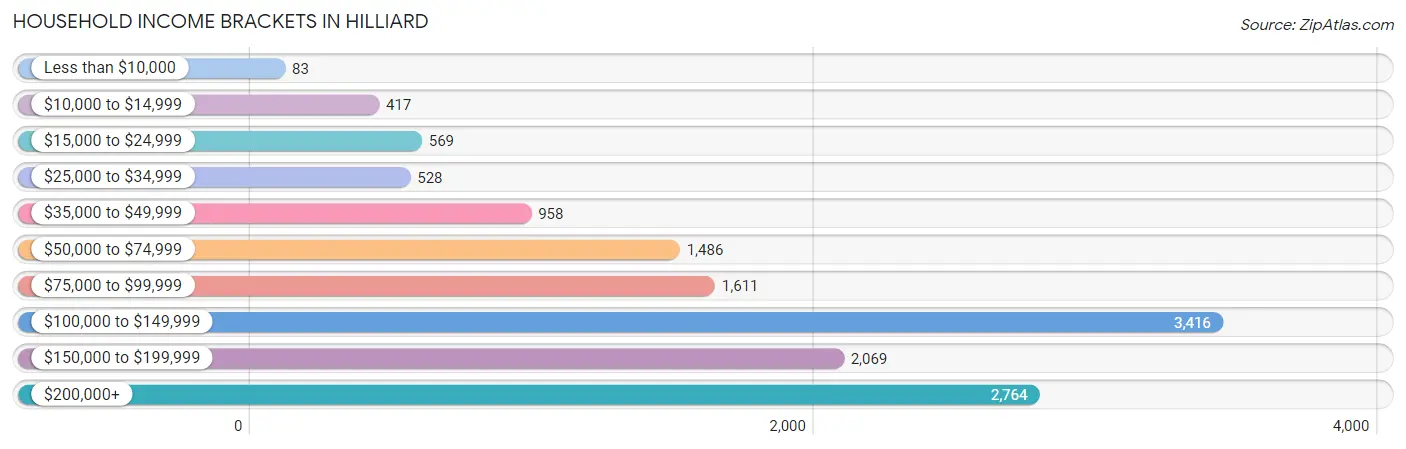
| Income Bracket | # Households | % Households |
| Less than $10,000 | 83 | 0.6% |
| $10,000 to $14,999 | 417 | 3.0% |
| $15,000 to $24,999 | 569 | 4.1% |
| $25,000 to $34,999 | 528 | 3.8% |
| $35,000 to $49,999 | 958 | 6.9% |
| $50,000 to $74,999 | 1,486 | 10.7% |
| $75,000 to $99,999 | 1,611 | 11.6% |
| $100,000 to $149,999 | 3,416 | 24.6% |
| $150,000 to $199,999 | 2,069 | 14.9% |
| $200,000+ | 2,764 | 19.9% |
Household Income by Householder Age in Hilliard
The median household income in Hilliard is $116,287, with the highest median household income of $150,650 found in the 45 to 64 years age bracket for the primary householder. A total of 5,389 households (38.8%) fall into this category. Meanwhile, the 15 to 24 years age bracket for the primary householder has the lowest median household income of $48,063, with 363 households (2.6%) in this group.
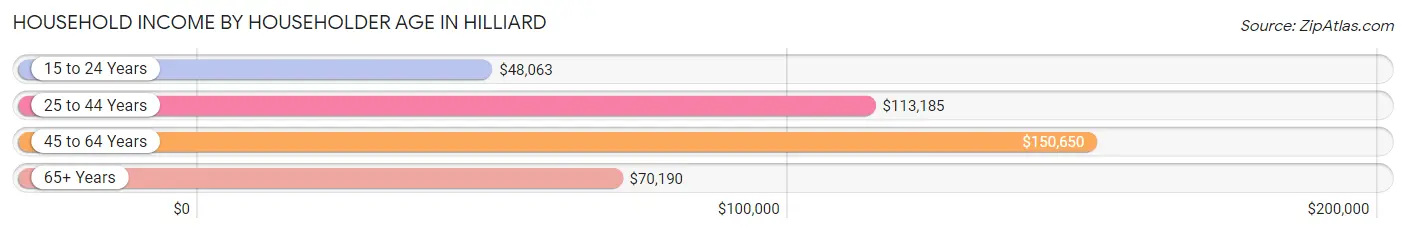
| Income Bracket | # Households | Median Income |
| 15 to 24 Years | 363 (2.6%) | $48,063 |
| 25 to 44 Years | 5,460 (39.3%) | $113,185 |
| 45 to 64 Years | 5,389 (38.8%) | $150,650 |
| 65+ Years | 2,675 (19.3%) | $70,190 |
| Total | 13,887 (100.0%) | $116,287 |
Poverty in Hilliard
Income Below Poverty by Sex and Age in Hilliard
With 3.4% poverty level for males and 7.1% for females among the residents of Hilliard, 75 year old and over males and 6 to 11 year old females are the most vulnerable to poverty, with 48 males (7.3%) and 447 females (27.3%) in their respective age groups living below the poverty level.
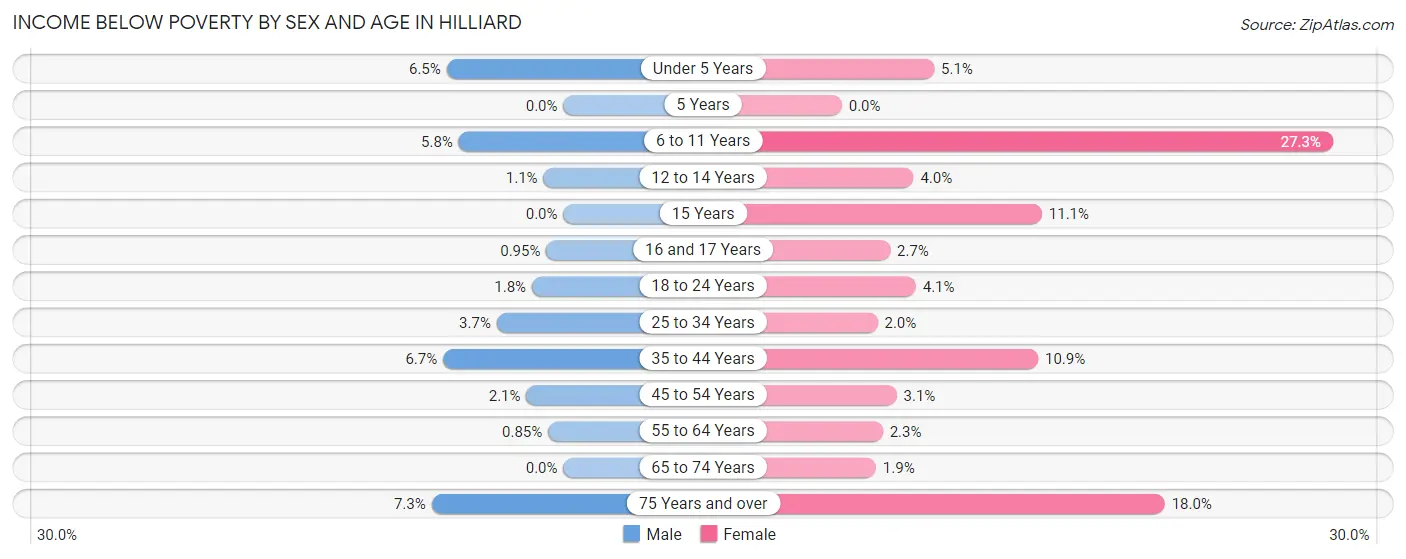
| Age Bracket | Male | Female |
| Under 5 Years | 67 (6.5%) | 58 (5.1%) |
| 5 Years | 0 (0.0%) | 0 (0.0%) |
| 6 to 11 Years | 105 (5.8%) | 447 (27.3%) |
| 12 to 14 Years | 7 (1.1%) | 36 (4.0%) |
| 15 Years | 0 (0.0%) | 46 (11.1%) |
| 16 and 17 Years | 7 (0.9%) | 13 (2.7%) |
| 18 to 24 Years | 20 (1.8%) | 46 (4.1%) |
| 25 to 34 Years | 106 (3.7%) | 61 (2.0%) |
| 35 to 44 Years | 168 (6.7%) | 279 (10.9%) |
| 45 to 54 Years | 47 (2.1%) | 72 (3.0%) |
| 55 to 64 Years | 20 (0.9%) | 51 (2.3%) |
| 65 to 74 Years | 0 (0.0%) | 24 (1.9%) |
| 75 Years and over | 48 (7.3%) | 160 (18.0%) |
| Total | 595 (3.4%) | 1,293 (7.1%) |
Income Above Poverty by Sex and Age in Hilliard
According to the poverty statistics in Hilliard, males aged 5 years and females aged 5 years are the age groups that are most secure financially, with 100.0% of males and 100.0% of females in these age groups living above the poverty line.
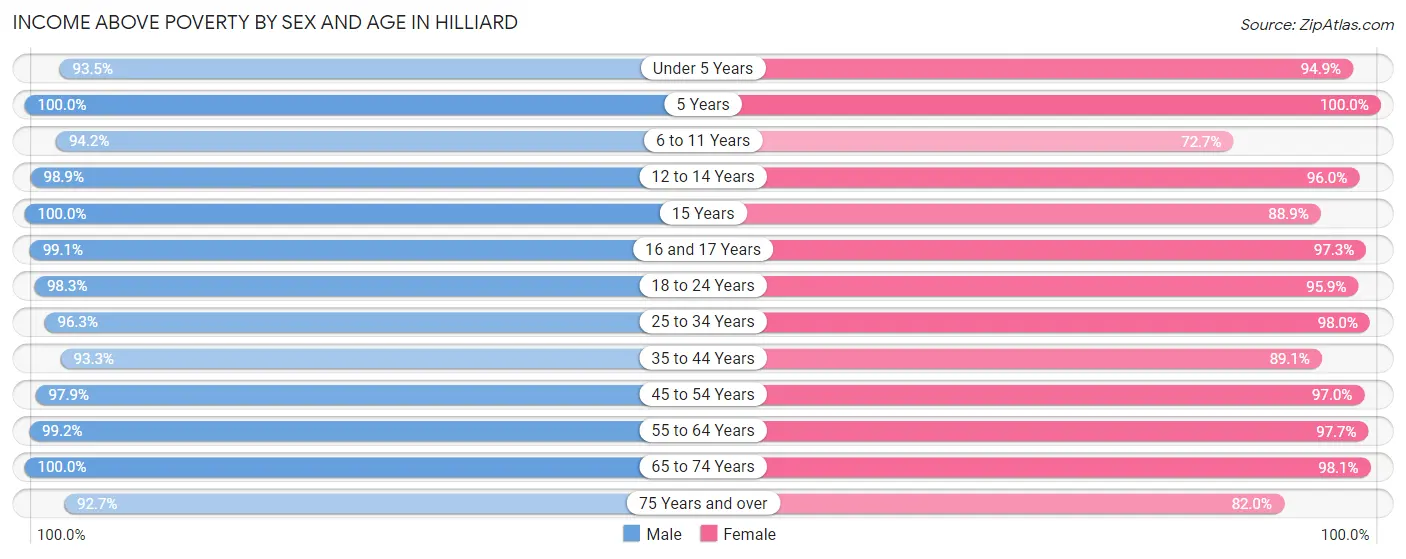
| Age Bracket | Male | Female |
| Under 5 Years | 964 (93.5%) | 1,071 (94.9%) |
| 5 Years | 154 (100.0%) | 246 (100.0%) |
| 6 to 11 Years | 1,697 (94.2%) | 1,188 (72.7%) |
| 12 to 14 Years | 621 (98.9%) | 866 (96.0%) |
| 15 Years | 112 (100.0%) | 367 (88.9%) |
| 16 and 17 Years | 729 (99.1%) | 471 (97.3%) |
| 18 to 24 Years | 1,123 (98.3%) | 1,070 (95.9%) |
| 25 to 34 Years | 2,753 (96.3%) | 3,012 (98.0%) |
| 35 to 44 Years | 2,339 (93.3%) | 2,273 (89.1%) |
| 45 to 54 Years | 2,235 (97.9%) | 2,287 (97.0%) |
| 55 to 64 Years | 2,336 (99.2%) | 2,183 (97.7%) |
| 65 to 74 Years | 1,326 (100.0%) | 1,237 (98.1%) |
| 75 Years and over | 606 (92.7%) | 730 (82.0%) |
| Total | 16,995 (96.6%) | 17,001 (92.9%) |
Income Below Poverty Among Married-Couple Families in Hilliard
The poverty statistics for married-couple families in Hilliard show that 3.0% or 254 of the total 8,405 families live below the poverty line. Families with 3 or 4 children have the highest poverty rate of 22.1%, comprising of 199 families. On the other hand, families with 5 or more children have the lowest poverty rate of 0.0%, which includes 0 families.
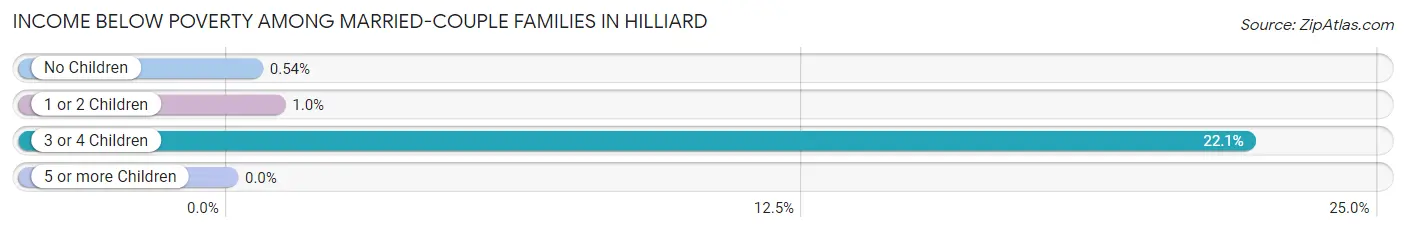
| Children | Above Poverty | Below Poverty |
| No Children | 4,405 (99.5%) | 24 (0.5%) |
| 1 or 2 Children | 2,975 (99.0%) | 31 (1.0%) |
| 3 or 4 Children | 700 (77.9%) | 199 (22.1%) |
| 5 or more Children | 71 (100.0%) | 0 (0.0%) |
| Total | 8,151 (97.0%) | 254 (3.0%) |
Income Below Poverty Among Single-Parent Households in Hilliard
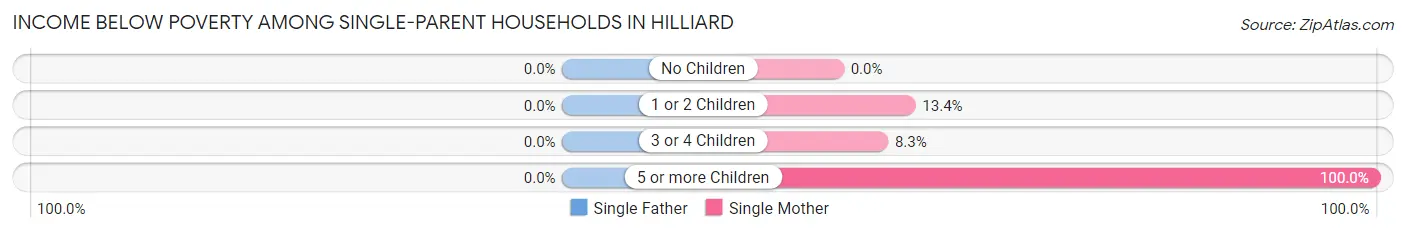
| Children | Single Father | Single Mother |
| No Children | 0 (0.0%) | 0 (0.0%) |
| 1 or 2 Children | 0 (0.0%) | 80 (13.4%) |
| 3 or 4 Children | 0 (0.0%) | 8 (8.3%) |
| 5 or more Children | 0 (0.0%) | 15 (100.0%) |
| Total | 0 (0.0%) | 103 (9.0%) |
Income Below Poverty Among Married-Couple vs Single-Parent Households in Hilliard
The poverty data for Hilliard shows that 254 of the married-couple family households (3.0%) and 103 of the single-parent households (6.4%) are living below the poverty level. Within the married-couple family households, those with 3 or 4 children have the highest poverty rate, with 199 households (22.1%) falling below the poverty line. Among the single-parent households, those with 5 or more children have the highest poverty rate, with 15 household (100.0%) living below poverty.
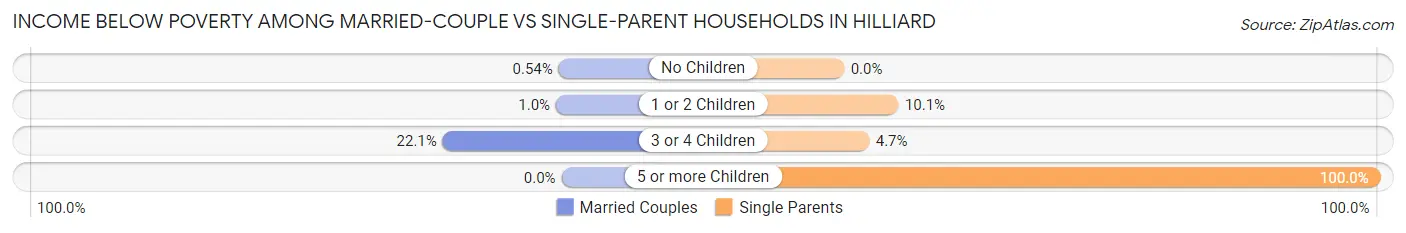
| Children | Married-Couple Families | Single-Parent Households |
| No Children | 24 (0.5%) | 0 (0.0%) |
| 1 or 2 Children | 31 (1.0%) | 80 (10.1%) |
| 3 or 4 Children | 199 (22.1%) | 8 (4.7%) |
| 5 or more Children | 0 (0.0%) | 15 (100.0%) |
| Total | 254 (3.0%) | 103 (6.4%) |
Race in Hilliard
The most populous races in Hilliard are White / Caucasian (29,092 | 80.6%), Asian (2,680 | 7.4%), and Two or more Races (2,404 | 6.7%).
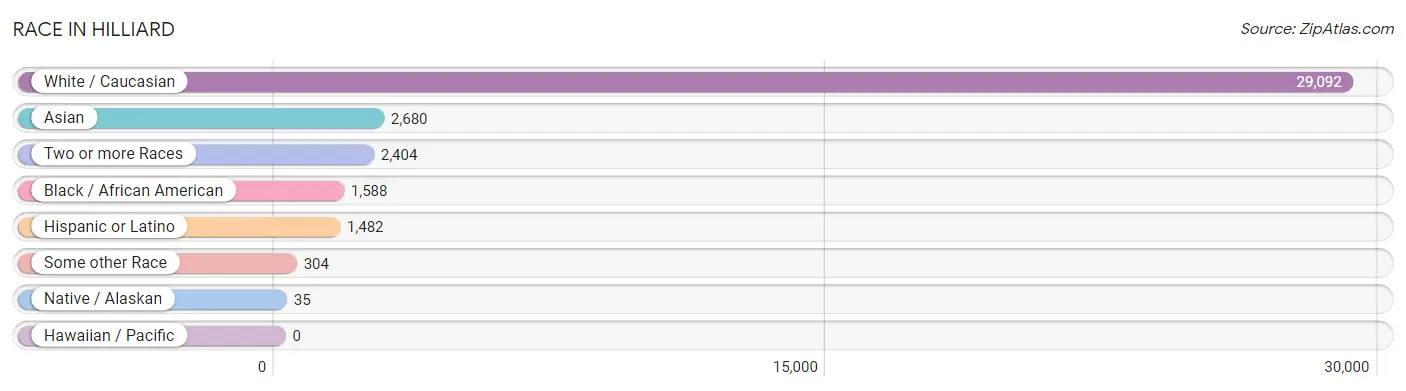
| Race | # Population | % Population |
| Asian | 2,680 | 7.4% |
| Black / African American | 1,588 | 4.4% |
| Hawaiian / Pacific | 0 | 0.0% |
| Hispanic or Latino | 1,482 | 4.1% |
| Native / Alaskan | 35 | 0.1% |
| White / Caucasian | 29,092 | 80.6% |
| Two or more Races | 2,404 | 6.7% |
| Some other Race | 304 | 0.8% |
| Total | 36,103 | 100.0% |
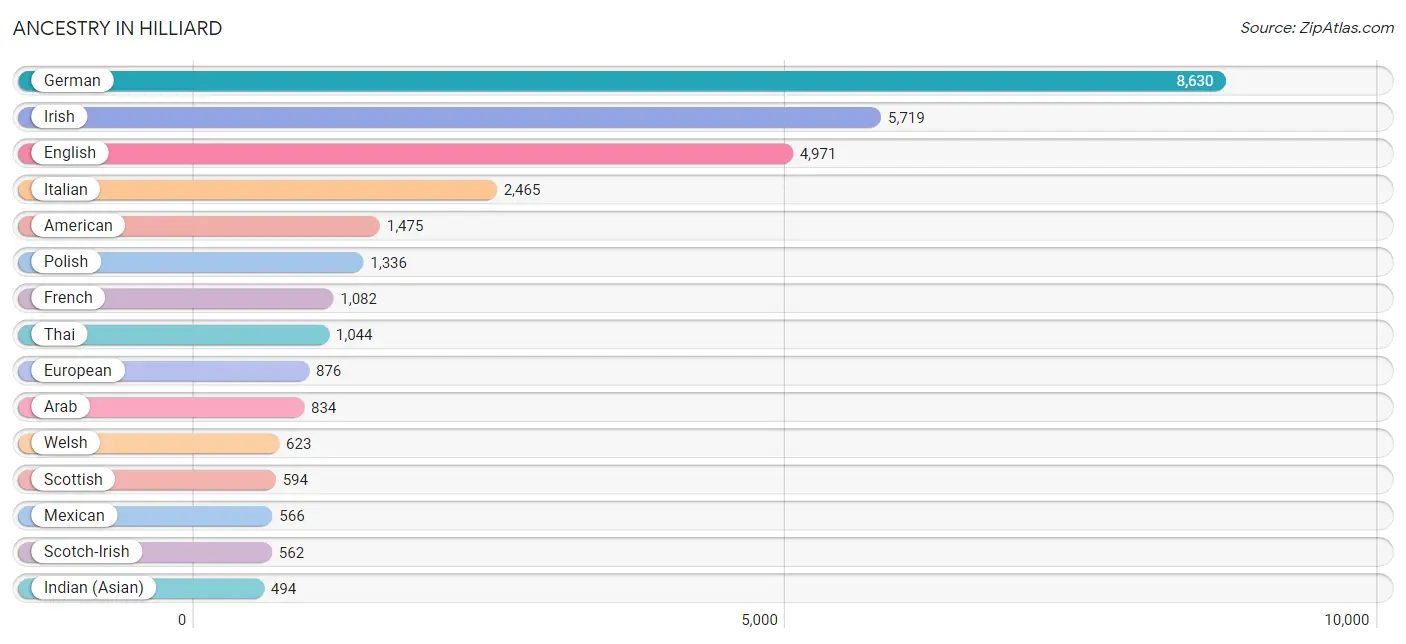
Ancestry in Hilliard
The most populous ancestries reported in Hilliard are German (8,630 | 23.9%), Irish (5,719 | 15.8%), English (4,971 | 13.8%), Italian (2,465 | 6.8%), and American (1,475 | 4.1%), together accounting for 64.4% of all Hilliard residents.
| Ancestry | # Population | % Population |
| African | 55 | 0.2% |
| American | 1,475 | 4.1% |
| Arab | 834 | 2.3% |
| Armenian | 6 | 0.0% |
| Austrian | 89 | 0.3% |
| Belgian | 36 | 0.1% |
| Bhutanese | 63 | 0.2% |
| Blackfeet | 14 | 0.0% |
| Bolivian | 33 | 0.1% |
| Brazilian | 64 | 0.2% |
| British | 241 | 0.7% |
| Bulgarian | 15 | 0.0% |
| Burmese | 145 | 0.4% |
| Canadian | 27 | 0.1% |
| Central American | 86 | 0.2% |
| Central American Indian | 22 | 0.1% |
| Cherokee | 79 | 0.2% |
| Chilean | 106 | 0.3% |
| Chippewa | 5 | 0.0% |
| Costa Rican | 21 | 0.1% |
| Croatian | 71 | 0.2% |
| Cuban | 17 | 0.1% |
| Czech | 189 | 0.5% |
| Czechoslovakian | 108 | 0.3% |
| Danish | 69 | 0.2% |
| Dutch | 250 | 0.7% |
| Eastern European | 107 | 0.3% |
| Ecuadorian | 52 | 0.1% |
| Egyptian | 166 | 0.5% |
| English | 4,971 | 13.8% |
| European | 876 | 2.4% |
| Filipino | 18 | 0.1% |
| Finnish | 49 | 0.1% |
| French | 1,082 | 3.0% |
| French American Indian | 2 | 0.0% |
| French Canadian | 115 | 0.3% |
| German | 8,630 | 23.9% |
| Greek | 127 | 0.4% |
| Guyanese | 21 | 0.1% |
| Honduran | 24 | 0.1% |
| Hungarian | 352 | 1.0% |
| Icelander | 49 | 0.1% |
| Indian (Asian) | 494 | 1.4% |
| Iranian | 39 | 0.1% |
| Iraqi | 57 | 0.2% |
| Irish | 5,719 | 15.8% |
| Iroquois | 62 | 0.2% |
| Italian | 2,465 | 6.8% |
| Japanese | 153 | 0.4% |
| Jordanian | 16 | 0.0% |
| Kenyan | 20 | 0.1% |
| Korean | 101 | 0.3% |
| Laotian | 173 | 0.5% |
| Latvian | 18 | 0.1% |
| Lebanese | 248 | 0.7% |
| Lithuanian | 63 | 0.2% |
| Lumbee | 6 | 0.0% |
| Luxembourger | 6 | 0.0% |
| Malaysian | 97 | 0.3% |
| Mexican | 566 | 1.6% |
| Mongolian | 44 | 0.1% |
| Nicaraguan | 22 | 0.1% |
| Northern European | 43 | 0.1% |
| Norwegian | 218 | 0.6% |
| Palestinian | 191 | 0.5% |
| Panamanian | 19 | 0.1% |
| Pennsylvania German | 136 | 0.4% |
| Peruvian | 60 | 0.2% |
| Polish | 1,336 | 3.7% |
| Portuguese | 51 | 0.1% |
| Puerto Rican | 189 | 0.5% |
| Romanian | 56 | 0.2% |
| Russian | 121 | 0.3% |
| Scandinavian | 15 | 0.0% |
| Scotch-Irish | 562 | 1.6% |
| Scottish | 594 | 1.7% |
| Slavic | 36 | 0.1% |
| Slovak | 348 | 1.0% |
| Slovene | 64 | 0.2% |
| Somali | 38 | 0.1% |
| South American | 483 | 1.3% |
| Spaniard | 50 | 0.1% |
| Sri Lankan | 126 | 0.4% |
| Subsaharan African | 131 | 0.4% |
| Swedish | 443 | 1.2% |
| Swiss | 116 | 0.3% |
| Syrian | 87 | 0.2% |
| Thai | 1,044 | 2.9% |
| Turkish | 58 | 0.2% |
| Ukrainian | 88 | 0.2% |
| Venezuelan | 232 | 0.6% |
| Vietnamese | 38 | 0.1% |
| Welsh | 623 | 1.7% |
| West Indian | 23 | 0.1% |
| Yugoslavian | 82 | 0.2% | View All 95 Rows |
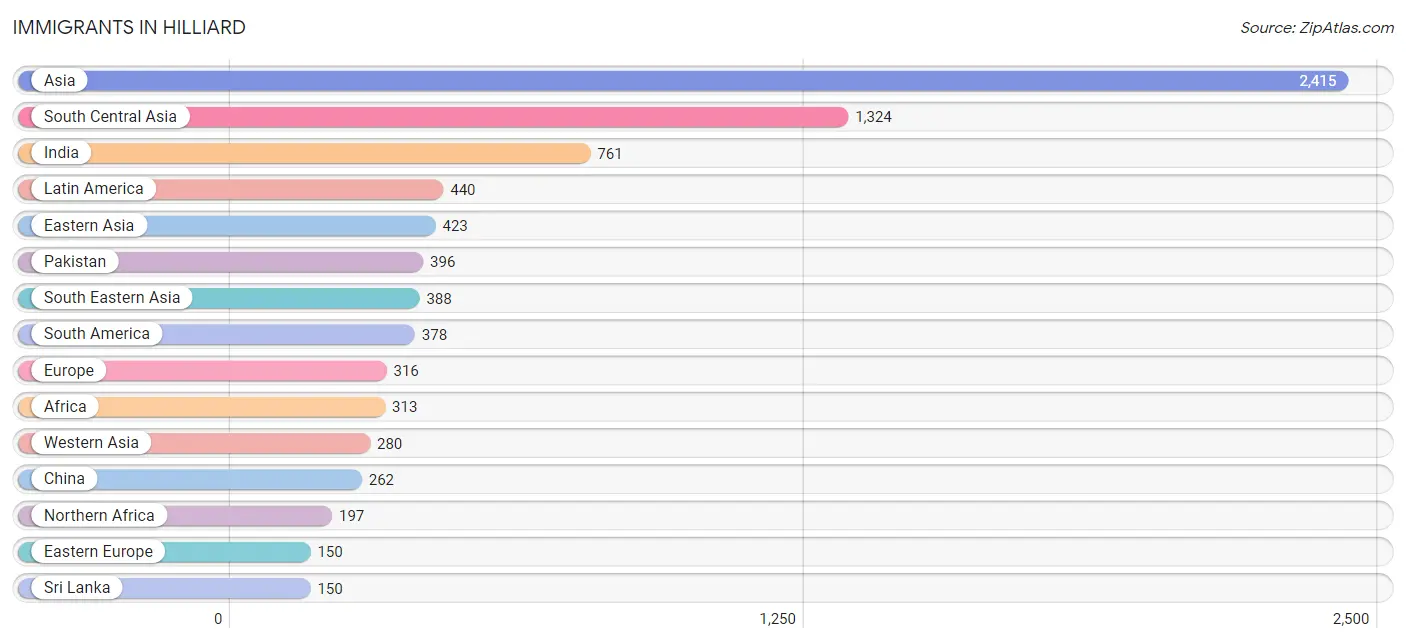
Immigrants in Hilliard
The most numerous immigrant groups reported in Hilliard came from Asia (2,415 | 6.7%), South Central Asia (1,324 | 3.7%), India (761 | 2.1%), Latin America (440 | 1.2%), and Eastern Asia (423 | 1.2%), together accounting for 14.9% of all Hilliard residents.
| Immigration Origin | # Population | % Population |
| Africa | 313 | 0.9% |
| Armenia | 6 | 0.0% |
| Asia | 2,415 | 6.7% |
| Bangladesh | 17 | 0.1% |
| Barbados | 38 | 0.1% |
| Belarus | 17 | 0.1% |
| Bolivia | 33 | 0.1% |
| Brazil | 79 | 0.2% |
| Bulgaria | 15 | 0.0% |
| Cambodia | 25 | 0.1% |
| Cameroon | 39 | 0.1% |
| Canada | 17 | 0.1% |
| Caribbean | 38 | 0.1% |
| Central America | 24 | 0.1% |
| Chile | 12 | 0.0% |
| China | 262 | 0.7% |
| Eastern Africa | 56 | 0.2% |
| Eastern Asia | 423 | 1.2% |
| Eastern Europe | 150 | 0.4% |
| Ecuador | 52 | 0.1% |
| Egypt | 68 | 0.2% |
| Ethiopia | 20 | 0.1% |
| Europe | 316 | 0.9% |
| Germany | 122 | 0.3% |
| Guyana | 22 | 0.1% |
| Honduras | 24 | 0.1% |
| Hong Kong | 11 | 0.0% |
| Hungary | 10 | 0.0% |
| India | 761 | 2.1% |
| Indonesia | 56 | 0.2% |
| Iraq | 57 | 0.2% |
| Italy | 38 | 0.1% |
| Japan | 62 | 0.2% |
| Jordan | 44 | 0.1% |
| Korea | 99 | 0.3% |
| Laos | 53 | 0.2% |
| Latin America | 440 | 1.2% |
| Lebanon | 34 | 0.1% |
| Malaysia | 65 | 0.2% |
| Middle Africa | 39 | 0.1% |
| Northern Africa | 197 | 0.5% |
| Pakistan | 396 | 1.1% |
| Peru | 39 | 0.1% |
| Philippines | 40 | 0.1% |
| Poland | 5 | 0.0% |
| Russia | 36 | 0.1% |
| Saudi Arabia | 28 | 0.1% |
| Sierra Leone | 11 | 0.0% |
| Singapore | 18 | 0.1% |
| Somalia | 36 | 0.1% |
| South America | 378 | 1.1% |
| South Central Asia | 1,324 | 3.7% |
| South Eastern Asia | 388 | 1.1% |
| Southern Europe | 38 | 0.1% |
| Sri Lanka | 150 | 0.4% |
| Syria | 34 | 0.1% |
| Taiwan | 34 | 0.1% |
| Thailand | 22 | 0.1% |
| Turkey | 60 | 0.2% |
| Ukraine | 67 | 0.2% |
| Venezuela | 141 | 0.4% |
| Vietnam | 109 | 0.3% |
| Western Africa | 11 | 0.0% |
| Western Asia | 280 | 0.8% |
| Western Europe | 128 | 0.4% | View All 65 Rows |
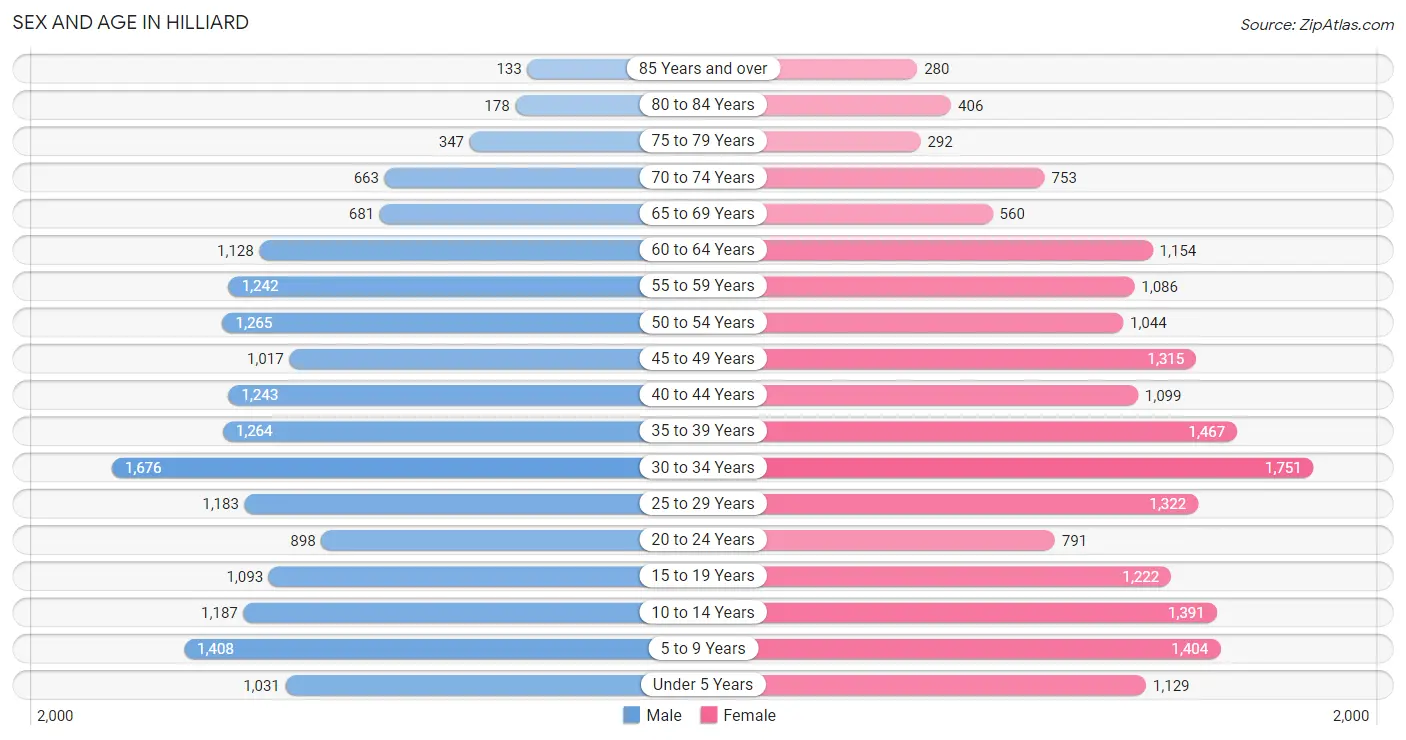
Sex and Age in Hilliard
Sex and Age in Hilliard
The most populous age groups in Hilliard are 30 to 34 Years (1,676 | 9.5%) for men and 30 to 34 Years (1,751 | 9.5%) for women.
| Age Bracket | Male | Female |
| Under 5 Years | 1,031 (5.9%) | 1,129 (6.1%) |
| 5 to 9 Years | 1,408 (8.0%) | 1,404 (7.6%) |
| 10 to 14 Years | 1,187 (6.7%) | 1,391 (7.5%) |
| 15 to 19 Years | 1,093 (6.2%) | 1,222 (6.6%) |
| 20 to 24 Years | 898 (5.1%) | 791 (4.3%) |
| 25 to 29 Years | 1,183 (6.7%) | 1,322 (7.2%) |
| 30 to 34 Years | 1,676 (9.5%) | 1,751 (9.5%) |
| 35 to 39 Years | 1,264 (7.2%) | 1,467 (7.9%) |
| 40 to 44 Years | 1,243 (7.0%) | 1,099 (5.9%) |
| 45 to 49 Years | 1,017 (5.8%) | 1,315 (7.1%) |
| 50 to 54 Years | 1,265 (7.2%) | 1,044 (5.7%) |
| 55 to 59 Years | 1,242 (7.0%) | 1,086 (5.9%) |
| 60 to 64 Years | 1,128 (6.4%) | 1,154 (6.2%) |
| 65 to 69 Years | 681 (3.9%) | 560 (3.0%) |
| 70 to 74 Years | 663 (3.8%) | 753 (4.1%) |
| 75 to 79 Years | 347 (2.0%) | 292 (1.6%) |
| 80 to 84 Years | 178 (1.0%) | 406 (2.2%) |
| 85 Years and over | 133 (0.7%) | 280 (1.5%) |
| Total | 17,637 (100.0%) | 18,466 (100.0%) |
Families and Households in Hilliard
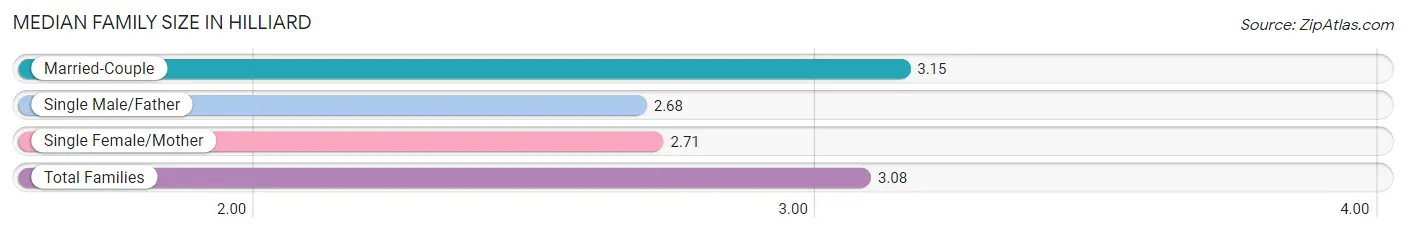
Median Family Size in Hilliard
The median family size in Hilliard is 3.08 persons per family, with married-couple families (8,405 | 83.9%) accounting for the largest median family size of 3.15 persons per family. On the other hand, single male/father families (471 | 4.7%) represent the smallest median family size with 2.68 persons per family.
| Family Type | # Families | Family Size |
| Married-Couple | 8,405 (83.9%) | 3.15 |
| Single Male/Father | 471 (4.7%) | 2.68 |
| Single Female/Mother | 1,143 (11.4%) | 2.71 |
| Total Families | 10,019 (100.0%) | 3.08 |
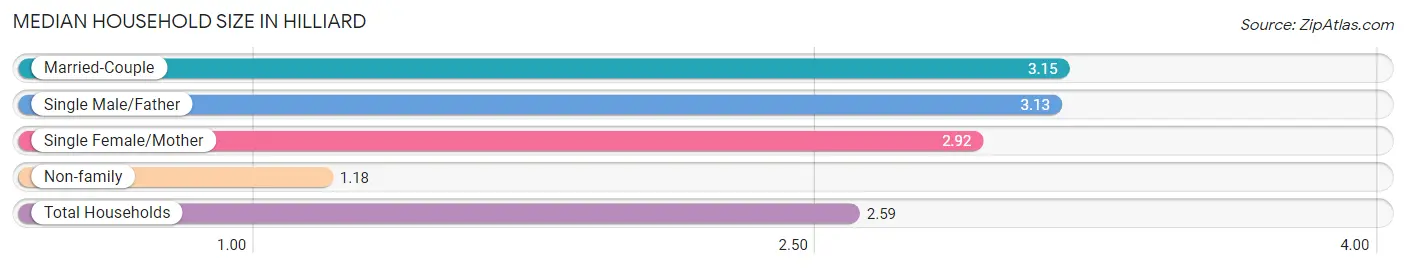
Median Household Size in Hilliard
The median household size in Hilliard is 2.59 persons per household, with married-couple households (8,405 | 60.5%) accounting for the largest median household size of 3.15 persons per household. non-family households (3,868 | 27.9%) represent the smallest median household size with 1.18 persons per household.
| Household Type | # Households | Household Size |
| Married-Couple | 8,405 (60.5%) | 3.15 |
| Single Male/Father | 471 (3.4%) | 3.13 |
| Single Female/Mother | 1,143 (8.2%) | 2.92 |
| Non-family | 3,868 (27.9%) | 1.18 |
| Total Households | 13,887 (100.0%) | 2.59 |
Household Size by Marriage Status in Hilliard
Out of a total of 13,887 households in Hilliard, 10,019 (72.2%) are family households, while 3,868 (27.9%) are nonfamily households. The most numerous type of family households are 2-person households, comprising 4,092, and the most common type of nonfamily households are 1-person households, comprising 3,207.
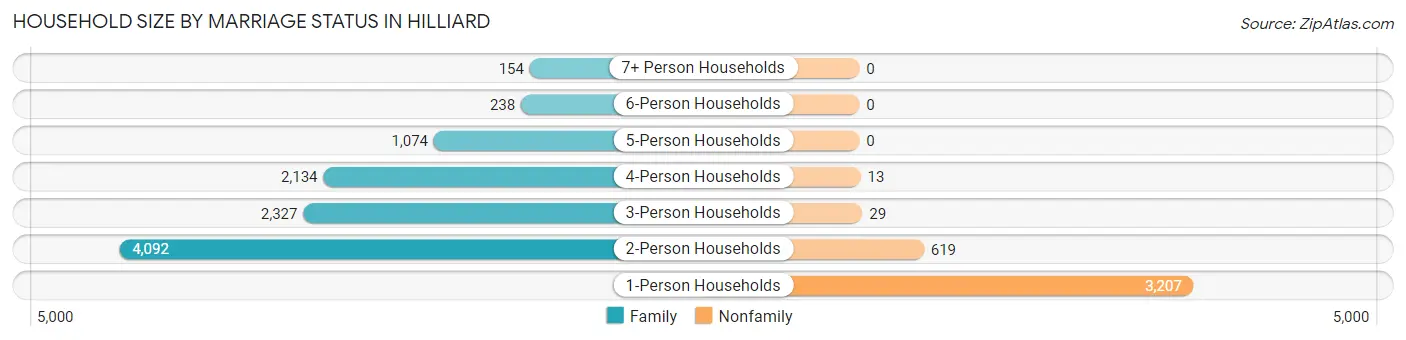
| Household Size | Family Households | Nonfamily Households |
| 1-Person Households | - | 3,207 (23.1%) |
| 2-Person Households | 4,092 (29.5%) | 619 (4.5%) |
| 3-Person Households | 2,327 (16.8%) | 29 (0.2%) |
| 4-Person Households | 2,134 (15.4%) | 13 (0.1%) |
| 5-Person Households | 1,074 (7.7%) | 0 (0.0%) |
| 6-Person Households | 238 (1.7%) | 0 (0.0%) |
| 7+ Person Households | 154 (1.1%) | 0 (0.0%) |
| Total | 10,019 (72.2%) | 3,868 (27.9%) |
Female Fertility in Hilliard
Fertility by Age in Hilliard
Average fertility rate in Hilliard is 49.0 births per 1,000 women. Women in the age bracket of 20 to 34 years have the highest fertility rate with 82.0 births per 1,000 women. Women in the age bracket of 20 to 34 years acount for 71.1% of all women with births.
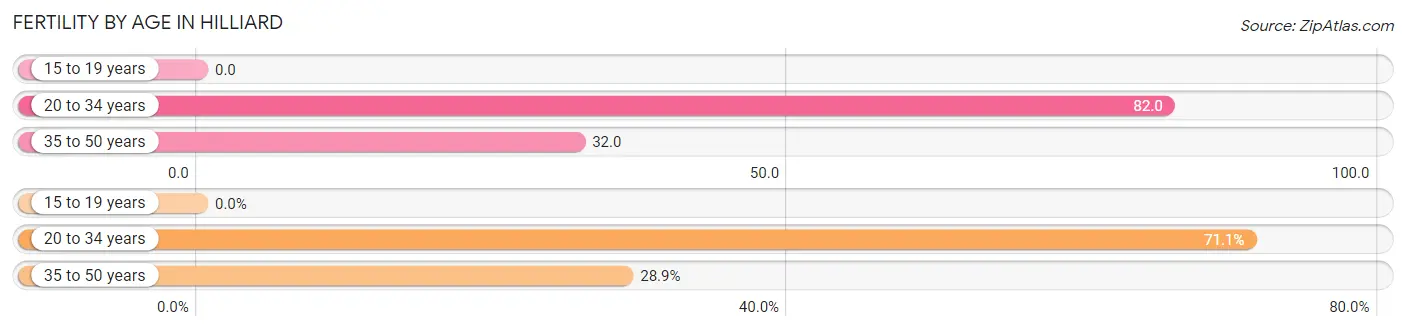
| Age Bracket | Women with Births | Births / 1,000 Women |
| 15 to 19 years | 0 (0.0%) | 0.0 |
| 20 to 34 years | 318 (71.1%) | 82.0 |
| 35 to 50 years | 129 (28.9%) | 32.0 |
| Total | 447 (100.0%) | 49.0 |
Fertility by Age by Marriage Status in Hilliard
97.8% of women with births (447) in Hilliard are married. The highest percentage of unmarried women with births falls into 20 to 34 years age bracket with 3.1% of them unmarried at the time of birth, while the lowest percentage of unmarried women with births belong to 35 to 50 years age bracket with 0.0% of them unmarried.
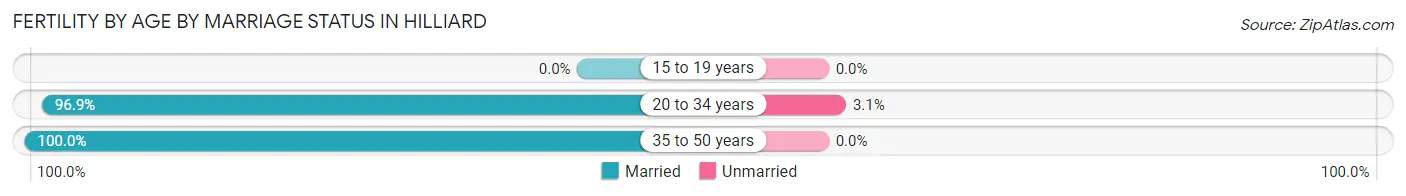
| Age Bracket | Married | Unmarried |
| 15 to 19 years | 0 (0.0%) | 0 (0.0%) |
| 20 to 34 years | 308 (96.9%) | 10 (3.1%) |
| 35 to 50 years | 129 (100.0%) | 0 (0.0%) |
| Total | 437 (97.8%) | 10 (2.2%) |
Fertility by Education in Hilliard
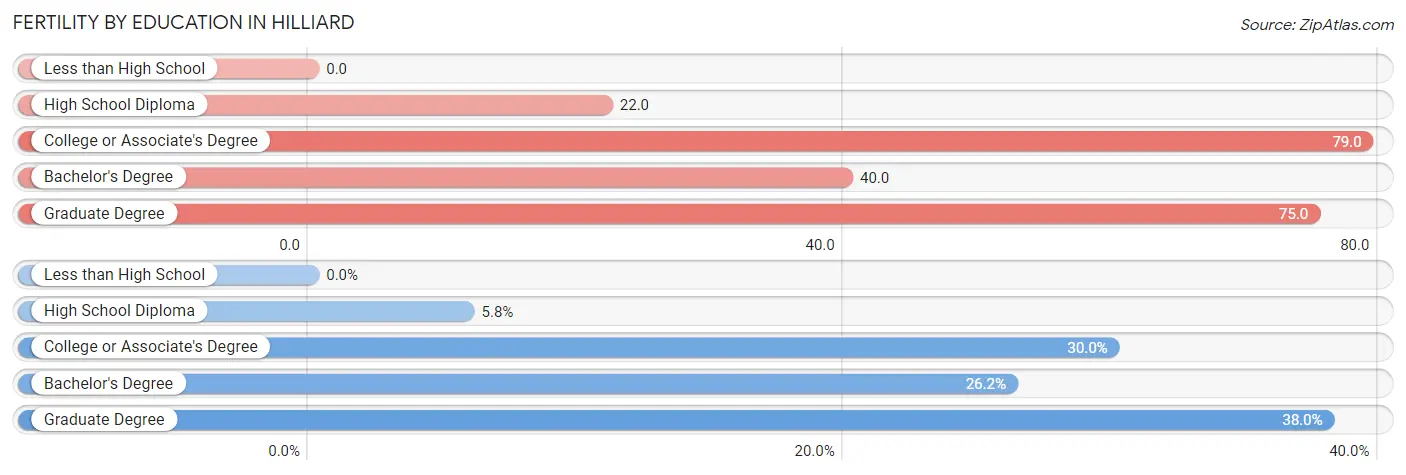
| Educational Attainment | Women with Births | Births / 1,000 Women |
| Less than High School | 0 (0.0%) | 0.0 |
| High School Diploma | 26 (5.8%) | 22.0 |
| College or Associate's Degree | 134 (30.0%) | 79.0 |
| Bachelor's Degree | 117 (26.2%) | 40.0 |
| Graduate Degree | 170 (38.0%) | 75.0 |
| Total | 447 (100.0%) | 49.0 |
Fertility by Education by Marriage Status in Hilliard
2.2% of women with births in Hilliard are unmarried. Women with the educational attainment of college or associate's degree are most likely to be married with 100.0% of them married at childbirth, while women with the educational attainment of high school diploma are least likely to be married with 38.5% of them unmarried at childbirth.
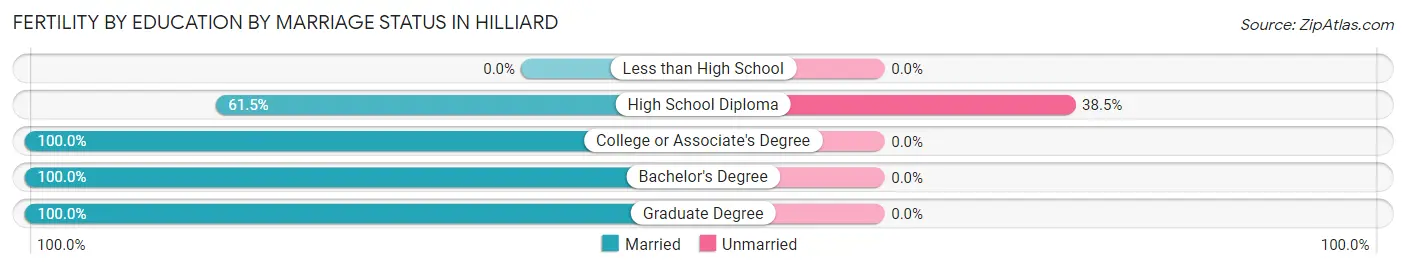
| Educational Attainment | Married | Unmarried |
| Less than High School | 0 (0.0%) | 0 (0.0%) |
| High School Diploma | 16 (61.5%) | 10 (38.5%) |
| College or Associate's Degree | 134 (100.0%) | 0 (0.0%) |
| Bachelor's Degree | 117 (100.0%) | 0 (0.0%) |
| Graduate Degree | 170 (100.0%) | 0 (0.0%) |
| Total | 437 (97.8%) | 10 (2.2%) |
Employment Characteristics in Hilliard
Employment by Class of Employer in Hilliard
Among the 20,132 employed individuals in Hilliard, private company employees (13,156 | 65.3%), not-for-profit organizations (2,245 | 11.2%), and local government employees (1,862 | 9.2%) make up the most common classes of employment.
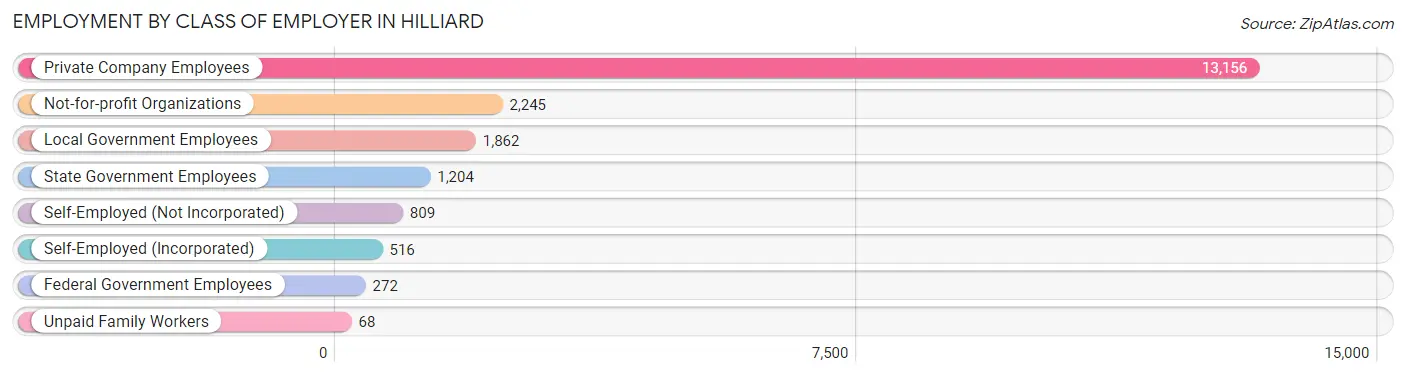
| Employer Class | # Employees | % Employees |
| Private Company Employees | 13,156 | 65.3% |
| Self-Employed (Incorporated) | 516 | 2.6% |
| Self-Employed (Not Incorporated) | 809 | 4.0% |
| Not-for-profit Organizations | 2,245 | 11.2% |
| Local Government Employees | 1,862 | 9.2% |
| State Government Employees | 1,204 | 6.0% |
| Federal Government Employees | 272 | 1.3% |
| Unpaid Family Workers | 68 | 0.3% |
| Total | 20,132 | 100.0% |
Employment Status by Age in Hilliard
According to the labor force statistics for Hilliard, out of the total population over 16 years of age (28,028), 74.4% or 20,853 individuals are in the labor force, with 2.4% or 500 of them unemployed. The age group with the highest labor force participation rate is 30 to 34 years, with 93.3% or 3,197 individuals in the labor force. Within the labor force, the 25 to 29 years age range has the highest percentage of unemployed individuals, with 8.7% or 197 of them being unemployed.
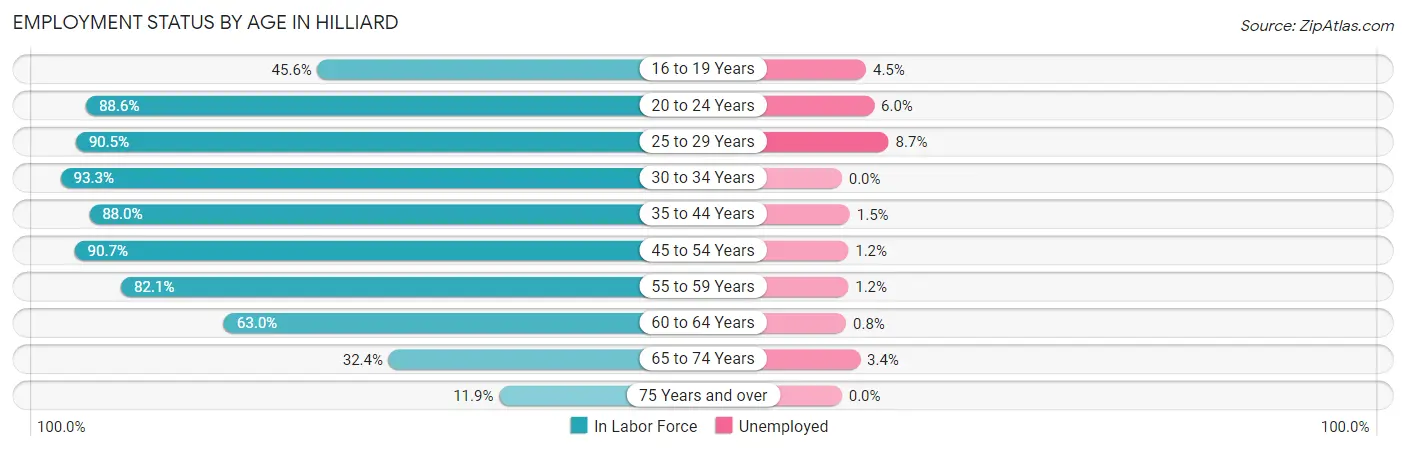
| Age Bracket | In Labor Force | Unemployed |
| 16 to 19 Years | 816 (45.6%) | 37 (4.5%) |
| 20 to 24 Years | 1,496 (88.6%) | 90 (6.0%) |
| 25 to 29 Years | 2,267 (90.5%) | 197 (8.7%) |
| 30 to 34 Years | 3,197 (93.3%) | 0 (0.0%) |
| 35 to 44 Years | 4,464 (88.0%) | 67 (1.5%) |
| 45 to 54 Years | 4,209 (90.7%) | 51 (1.2%) |
| 55 to 59 Years | 1,911 (82.1%) | 23 (1.2%) |
| 60 to 64 Years | 1,438 (63.0%) | 12 (0.8%) |
| 65 to 74 Years | 861 (32.4%) | 29 (3.4%) |
| 75 Years and over | 195 (11.9%) | 0 (0.0%) |
| Total | 20,853 (74.4%) | 500 (2.4%) |
Employment Status by Educational Attainment in Hilliard
According to labor force statistics for Hilliard, 86.3% of individuals (17,481) out of the total population between 25 and 64 years of age (20,256) are in the labor force, with 2.0% or 350 of them being unemployed. The group with the highest labor force participation rate are those with the educational attainment of bachelor's degree or higher, with 88.9% or 10,876 individuals in the labor force. Within the labor force, individuals with high school diploma education have the highest percentage of unemployment, with 11.2% or 230 of them being unemployed.
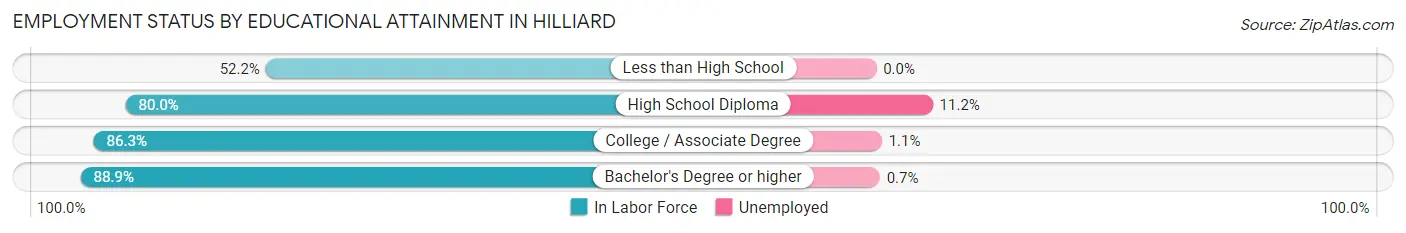
| Educational Attainment | In Labor Force | Unemployed |
| Less than High School | 227 (52.2%) | 0 (0.0%) |
| High School Diploma | 2,056 (80.0%) | 288 (11.2%) |
| College / Associate Degree | 4,330 (86.3%) | 55 (1.1%) |
| Bachelor's Degree or higher | 10,876 (88.9%) | 86 (0.7%) |
| Total | 17,481 (86.3%) | 405 (2.0%) |
Employment Occupations by Sex in Hilliard
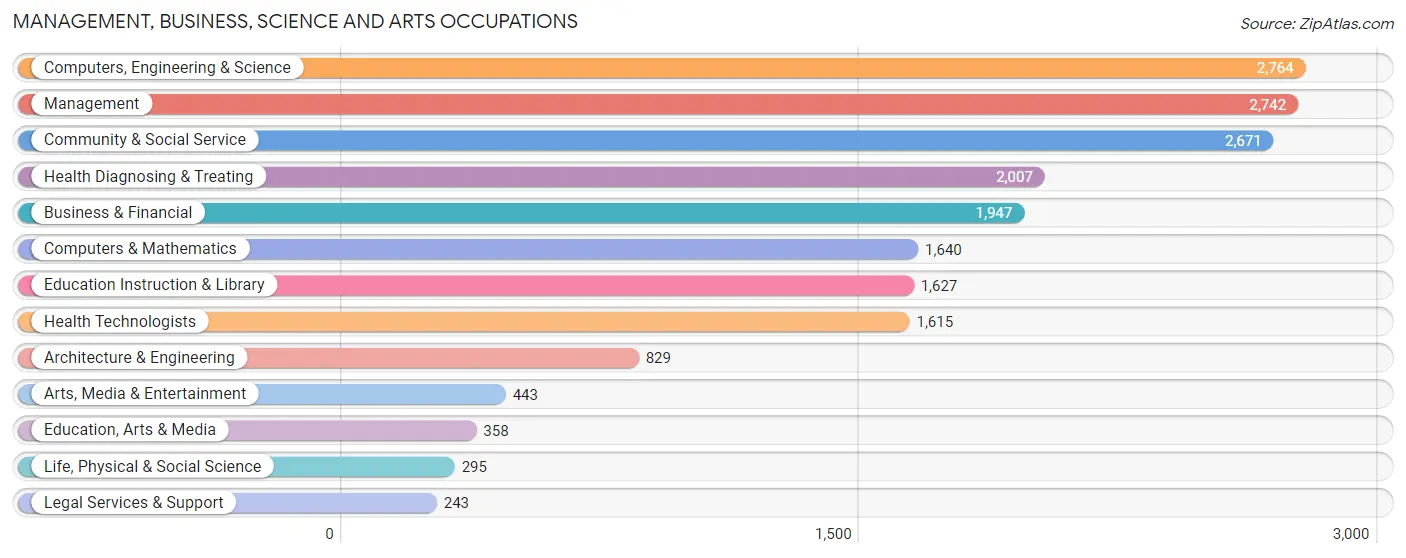
Management, Business, Science and Arts Occupations
The most common Management, Business, Science and Arts occupations in Hilliard are Computers, Engineering & Science (2,764 | 13.6%), Management (2,742 | 13.5%), Community & Social Service (2,671 | 13.2%), Health Diagnosing & Treating (2,007 | 9.9%), and Business & Financial (1,947 | 9.6%).
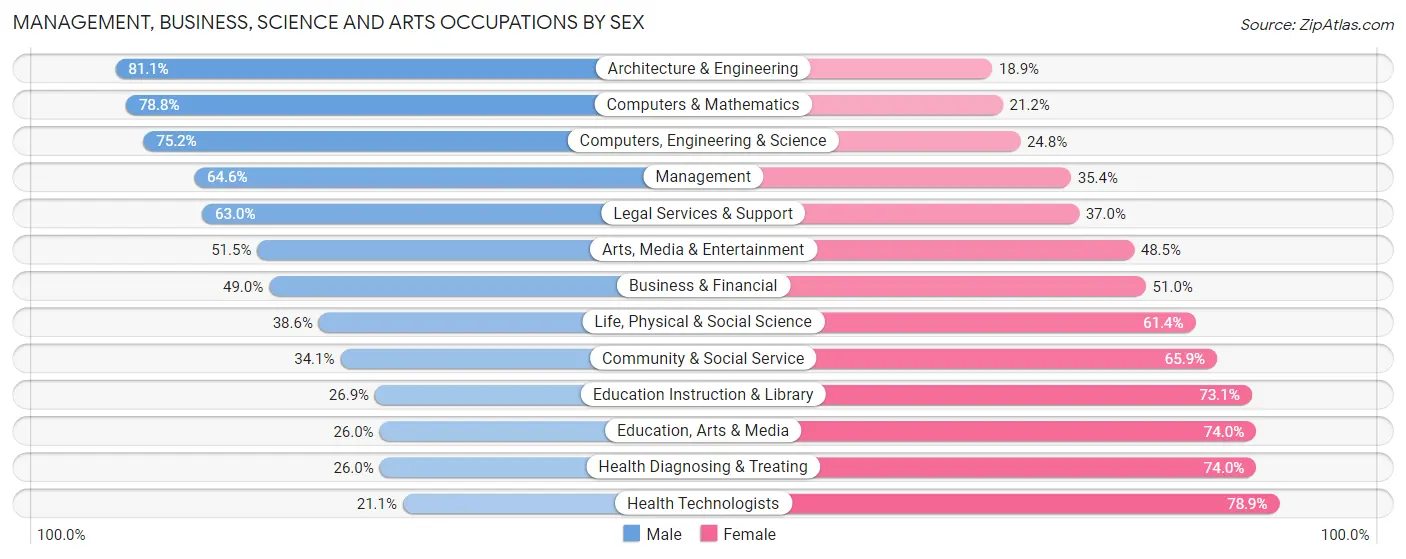
Management, Business, Science and Arts Occupations by Sex
Within the Management, Business, Science and Arts occupations in Hilliard, the most male-oriented occupations are Architecture & Engineering (81.1%), Computers & Mathematics (78.8%), and Computers, Engineering & Science (75.2%), while the most female-oriented occupations are Health Technologists (78.9%), Health Diagnosing & Treating (74.0%), and Education, Arts & Media (74.0%).
| Occupation | Male | Female |
| Management | 1,772 (64.6%) | 970 (35.4%) |
| Business & Financial | 954 (49.0%) | 993 (51.0%) |
| Computers, Engineering & Science | 2,079 (75.2%) | 685 (24.8%) |
| Computers & Mathematics | 1,293 (78.8%) | 347 (21.2%) |
| Architecture & Engineering | 672 (81.1%) | 157 (18.9%) |
| Life, Physical & Social Science | 114 (38.6%) | 181 (61.4%) |
| Community & Social Service | 912 (34.1%) | 1,759 (65.9%) |
| Education, Arts & Media | 93 (26.0%) | 265 (74.0%) |
| Legal Services & Support | 153 (63.0%) | 90 (37.0%) |
| Education Instruction & Library | 438 (26.9%) | 1,189 (73.1%) |
| Arts, Media & Entertainment | 228 (51.5%) | 215 (48.5%) |
| Health Diagnosing & Treating | 521 (26.0%) | 1,486 (74.0%) |
| Health Technologists | 341 (21.1%) | 1,274 (78.9%) |
| Total (Category) | 6,238 (51.4%) | 5,893 (48.6%) |
| Total (Overall) | 10,730 (52.9%) | 9,559 (47.1%) |
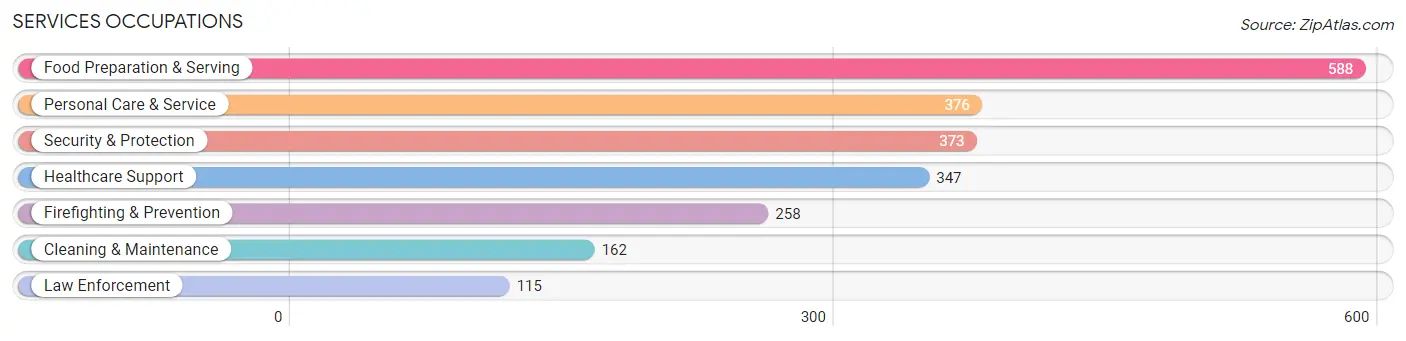
Services Occupations
The most common Services occupations in Hilliard are Food Preparation & Serving (588 | 2.9%), Personal Care & Service (376 | 1.8%), Security & Protection (373 | 1.8%), Healthcare Support (347 | 1.7%), and Firefighting & Prevention (258 | 1.3%).
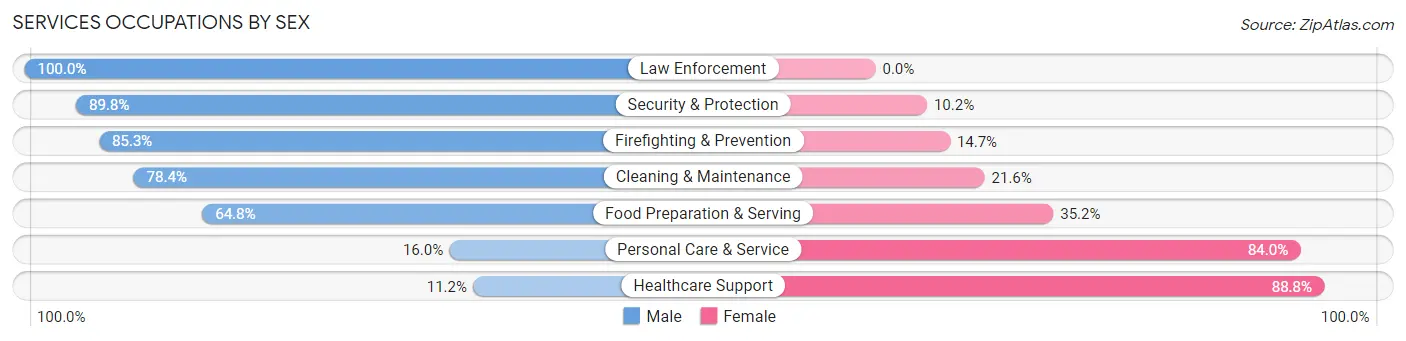
Services Occupations by Sex
Within the Services occupations in Hilliard, the most male-oriented occupations are Law Enforcement (100.0%), Security & Protection (89.8%), and Firefighting & Prevention (85.3%), while the most female-oriented occupations are Healthcare Support (88.8%), Personal Care & Service (84.0%), and Food Preparation & Serving (35.2%).
| Occupation | Male | Female |
| Healthcare Support | 39 (11.2%) | 308 (88.8%) |
| Security & Protection | 335 (89.8%) | 38 (10.2%) |
| Firefighting & Prevention | 220 (85.3%) | 38 (14.7%) |
| Law Enforcement | 115 (100.0%) | 0 (0.0%) |
| Food Preparation & Serving | 381 (64.8%) | 207 (35.2%) |
| Cleaning & Maintenance | 127 (78.4%) | 35 (21.6%) |
| Personal Care & Service | 60 (16.0%) | 316 (84.0%) |
| Total (Category) | 942 (51.0%) | 904 (49.0%) |
| Total (Overall) | 10,730 (52.9%) | 9,559 (47.1%) |
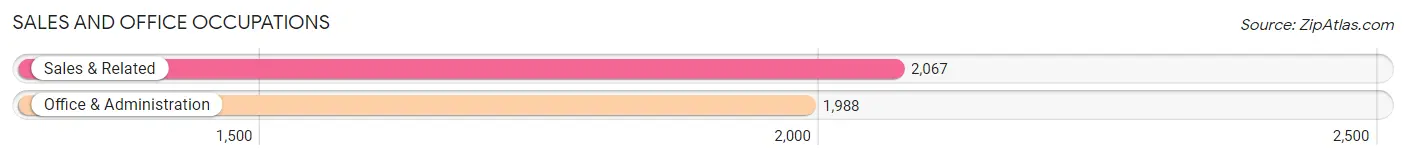
Sales and Office Occupations
The most common Sales and Office occupations in Hilliard are Sales & Related (2,067 | 10.2%), and Office & Administration (1,988 | 9.8%).
Sales and Office Occupations by Sex
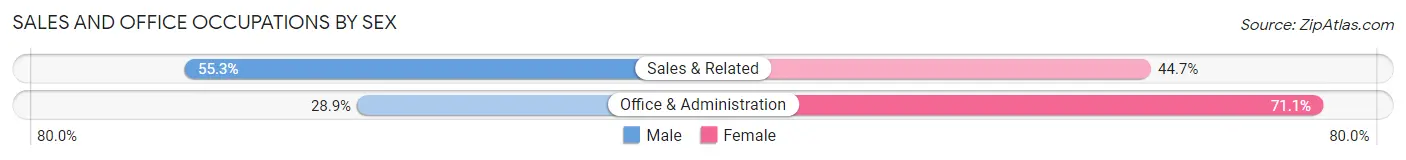
| Occupation | Male | Female |
| Sales & Related | 1,143 (55.3%) | 924 (44.7%) |
| Office & Administration | 574 (28.9%) | 1,414 (71.1%) |
| Total (Category) | 1,717 (42.3%) | 2,338 (57.7%) |
| Total (Overall) | 10,730 (52.9%) | 9,559 (47.1%) |
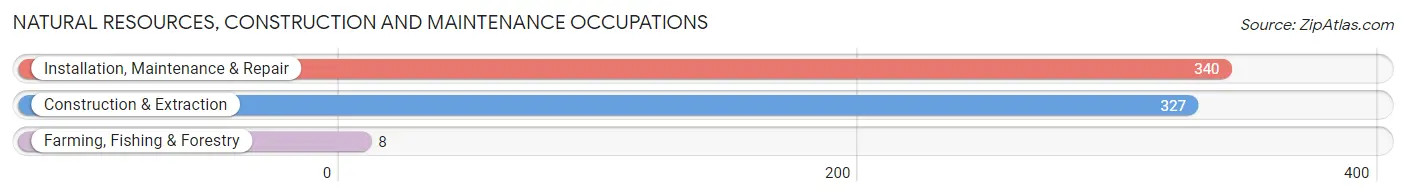
Natural Resources, Construction and Maintenance Occupations
The most common Natural Resources, Construction and Maintenance occupations in Hilliard are Installation, Maintenance & Repair (340 | 1.7%), Construction & Extraction (327 | 1.6%), and Farming, Fishing & Forestry (8 | 0.0%).
Natural Resources, Construction and Maintenance Occupations by Sex
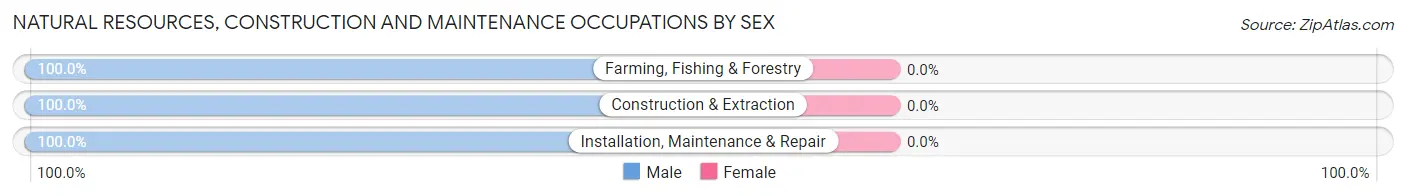
| Occupation | Male | Female |
| Farming, Fishing & Forestry | 8 (100.0%) | 0 (0.0%) |
| Construction & Extraction | 327 (100.0%) | 0 (0.0%) |
| Installation, Maintenance & Repair | 340 (100.0%) | 0 (0.0%) |
| Total (Category) | 675 (100.0%) | 0 (0.0%) |
| Total (Overall) | 10,730 (52.9%) | 9,559 (47.1%) |
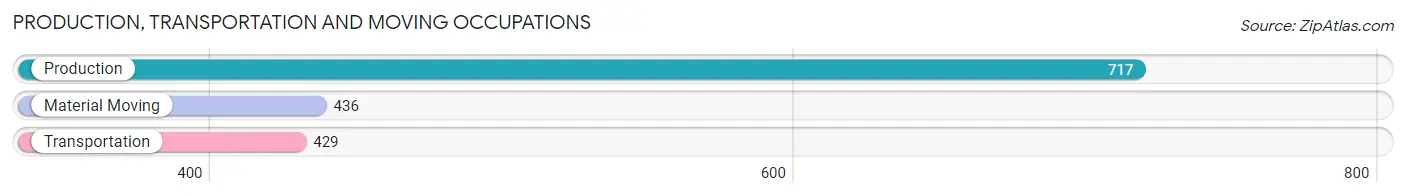
Production, Transportation and Moving Occupations
The most common Production, Transportation and Moving occupations in Hilliard are Production (717 | 3.5%), Material Moving (436 | 2.1%), and Transportation (429 | 2.1%).
Production, Transportation and Moving Occupations by Sex
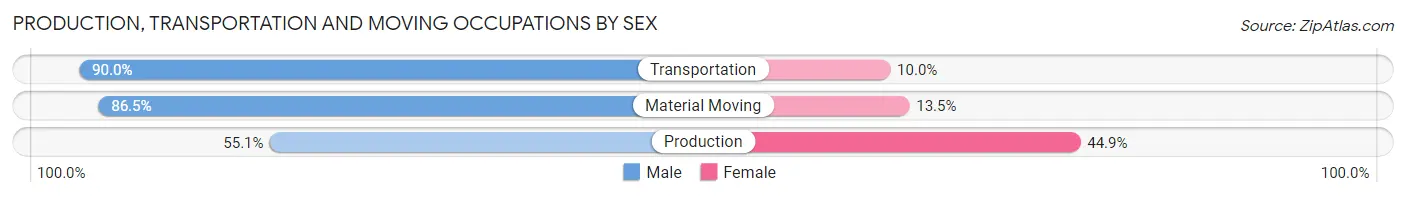
| Occupation | Male | Female |
| Production | 395 (55.1%) | 322 (44.9%) |
| Transportation | 386 (90.0%) | 43 (10.0%) |
| Material Moving | 377 (86.5%) | 59 (13.5%) |
| Total (Category) | 1,158 (73.2%) | 424 (26.8%) |
| Total (Overall) | 10,730 (52.9%) | 9,559 (47.1%) |
Employment Industries by Sex in Hilliard
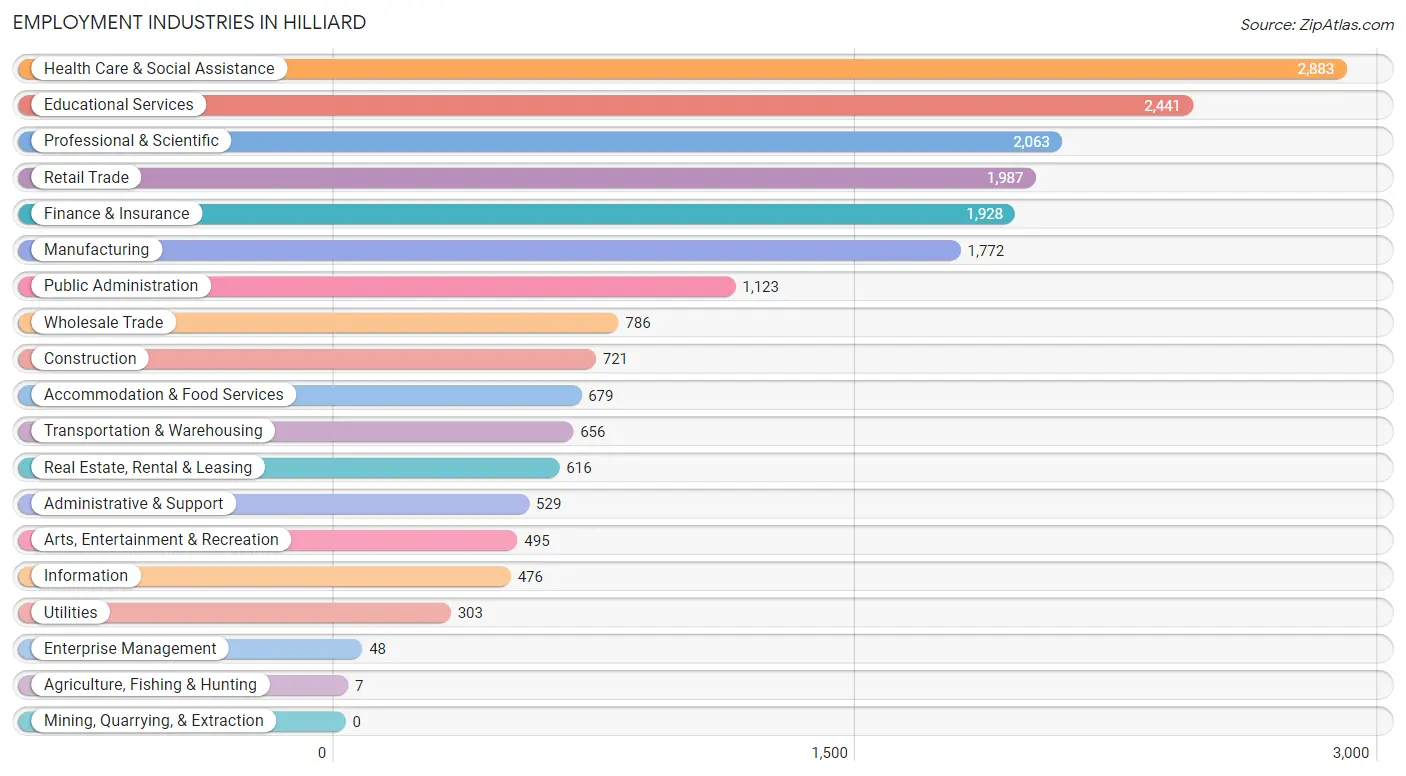
Employment Industries in Hilliard
The major employment industries in Hilliard include Health Care & Social Assistance (2,883 | 14.2%), Educational Services (2,441 | 12.0%), Professional & Scientific (2,063 | 10.2%), Retail Trade (1,987 | 9.8%), and Finance & Insurance (1,928 | 9.5%).
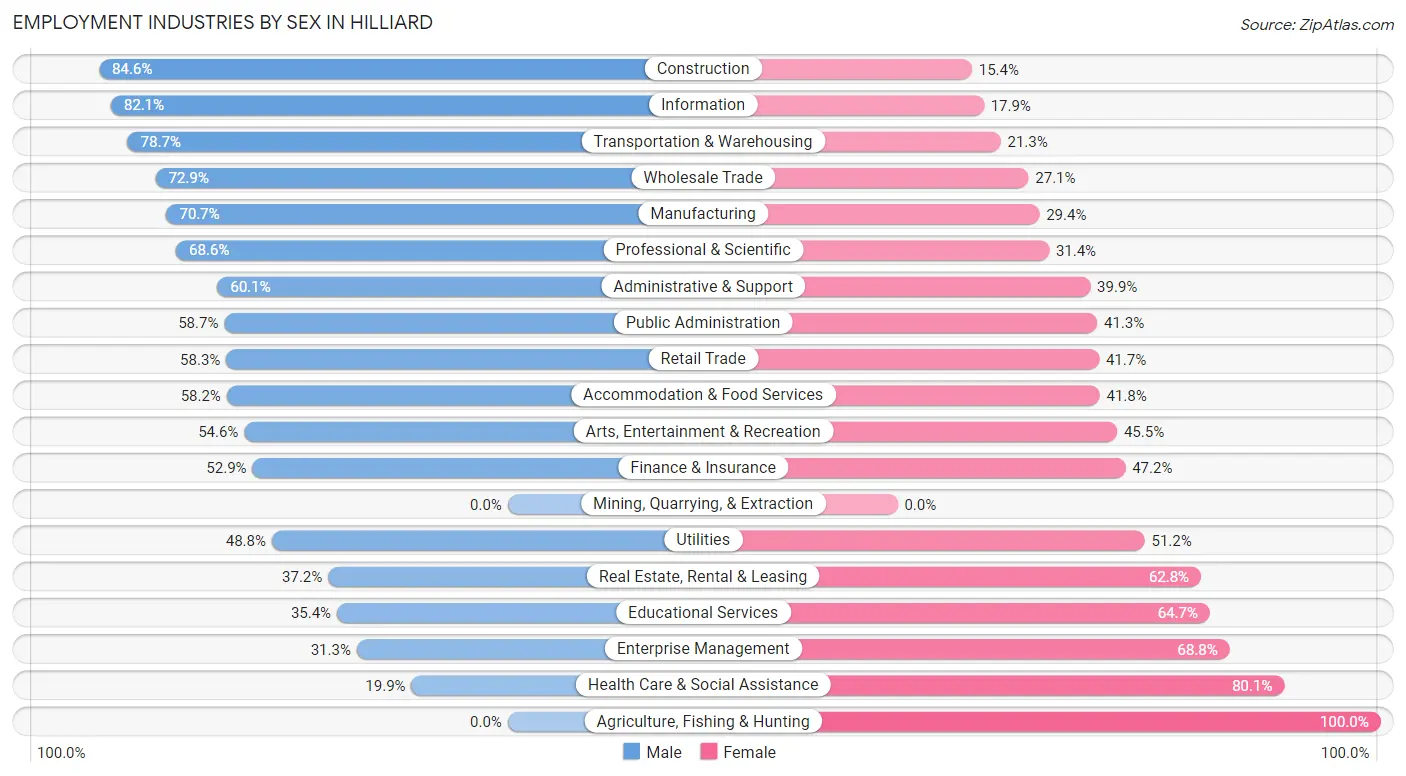
Employment Industries by Sex in Hilliard
The Hilliard industries that see more men than women are Construction (84.6%), Information (82.1%), and Transportation & Warehousing (78.7%), whereas the industries that tend to have a higher number of women are Agriculture, Fishing & Hunting (100.0%), Health Care & Social Assistance (80.1%), and Enterprise Management (68.8%).
| Industry | Male | Female |
| Agriculture, Fishing & Hunting | 0 (0.0%) | 7 (100.0%) |
| Mining, Quarrying, & Extraction | 0 (0.0%) | 0 (0.0%) |
| Construction | 610 (84.6%) | 111 (15.4%) |
| Manufacturing | 1,252 (70.7%) | 520 (29.3%) |
| Wholesale Trade | 573 (72.9%) | 213 (27.1%) |
| Retail Trade | 1,158 (58.3%) | 829 (41.7%) |
| Transportation & Warehousing | 516 (78.7%) | 140 (21.3%) |
| Utilities | 148 (48.8%) | 155 (51.2%) |
| Information | 391 (82.1%) | 85 (17.9%) |
| Finance & Insurance | 1,019 (52.8%) | 909 (47.1%) |
| Real Estate, Rental & Leasing | 229 (37.2%) | 387 (62.8%) |
| Professional & Scientific | 1,416 (68.6%) | 647 (31.4%) |
| Enterprise Management | 15 (31.2%) | 33 (68.8%) |
| Administrative & Support | 318 (60.1%) | 211 (39.9%) |
| Educational Services | 863 (35.3%) | 1,578 (64.6%) |
| Health Care & Social Assistance | 575 (19.9%) | 2,308 (80.1%) |
| Arts, Entertainment & Recreation | 270 (54.5%) | 225 (45.5%) |
| Accommodation & Food Services | 395 (58.2%) | 284 (41.8%) |
| Public Administration | 659 (58.7%) | 464 (41.3%) |
| Total | 10,730 (52.9%) | 9,559 (47.1%) |
Education in Hilliard
School Enrollment in Hilliard
The most common levels of schooling among the 9,464 students in Hilliard are high school (2,214 | 23.4%), elementary school (2,177 | 23.0%), and middle school (2,122 | 22.4%).
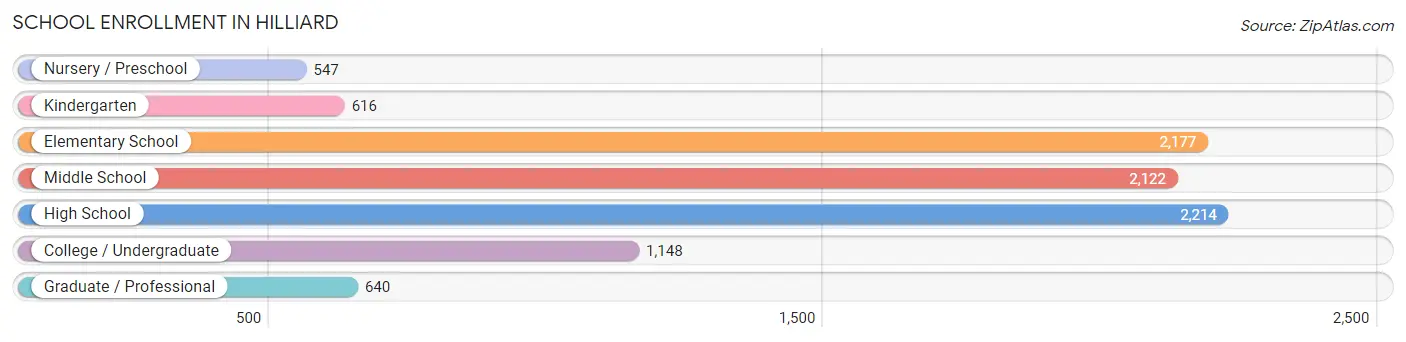
| School Level | # Students | % Students |
| Nursery / Preschool | 547 | 5.8% |
| Kindergarten | 616 | 6.5% |
| Elementary School | 2,177 | 23.0% |
| Middle School | 2,122 | 22.4% |
| High School | 2,214 | 23.4% |
| College / Undergraduate | 1,148 | 12.1% |
| Graduate / Professional | 640 | 6.8% |
| Total | 9,464 | 100.0% |
School Enrollment by Age by Funding Source in Hilliard
Out of a total of 9,464 students who are enrolled in schools in Hilliard, 1,448 (15.3%) attend a private institution, while the remaining 8,016 (84.7%) are enrolled in public schools. The age group of 3 to 4 year olds has the highest likelihood of being enrolled in private schools, with 170 (42.8% in the age bracket) enrolled. Conversely, the age group of 18 to 19 year olds has the lowest likelihood of being enrolled in a private school, with 472 (95.4% in the age bracket) attending a public institution.
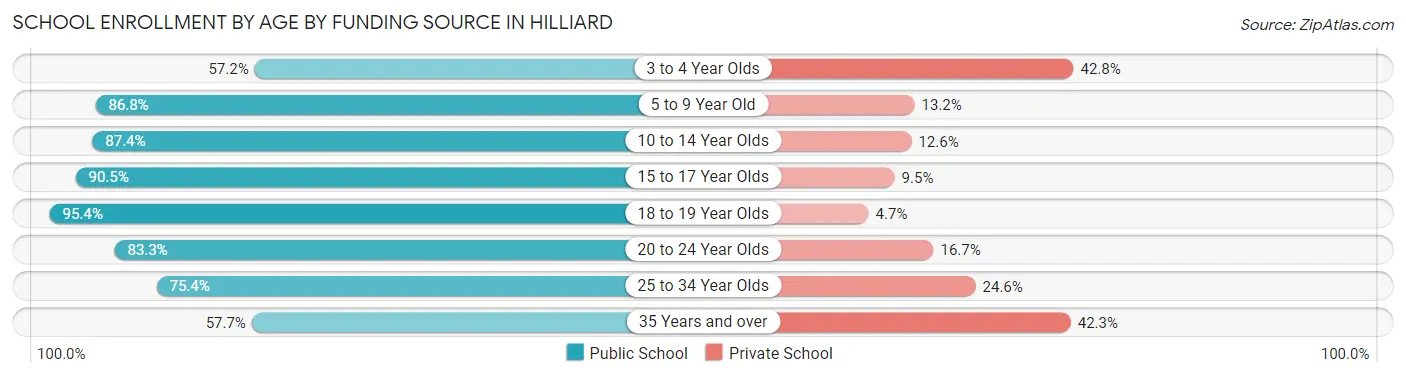
| Age Bracket | Public School | Private School |
| 3 to 4 Year Olds | 227 (57.2%) | 170 (42.8%) |
| 5 to 9 Year Old | 2,355 (86.8%) | 358 (13.2%) |
| 10 to 14 Year Olds | 2,172 (87.4%) | 314 (12.6%) |
| 15 to 17 Year Olds | 1,571 (90.5%) | 165 (9.5%) |
| 18 to 19 Year Olds | 472 (95.4%) | 23 (4.6%) |
| 20 to 24 Year Olds | 597 (83.3%) | 120 (16.7%) |
| 25 to 34 Year Olds | 405 (75.4%) | 132 (24.6%) |
| 35 Years and over | 221 (57.7%) | 162 (42.3%) |
| Total | 8,016 (84.7%) | 1,448 (15.3%) |
Educational Attainment by Field of Study in Hilliard
Business (3,395 | 22.5%), science & technology (1,792 | 11.9%), education (1,583 | 10.5%), engineering (1,314 | 8.7%), and computers & mathematics (1,079 | 7.1%) are the most common fields of study among 15,089 individuals in Hilliard who have obtained a bachelor's degree or higher.
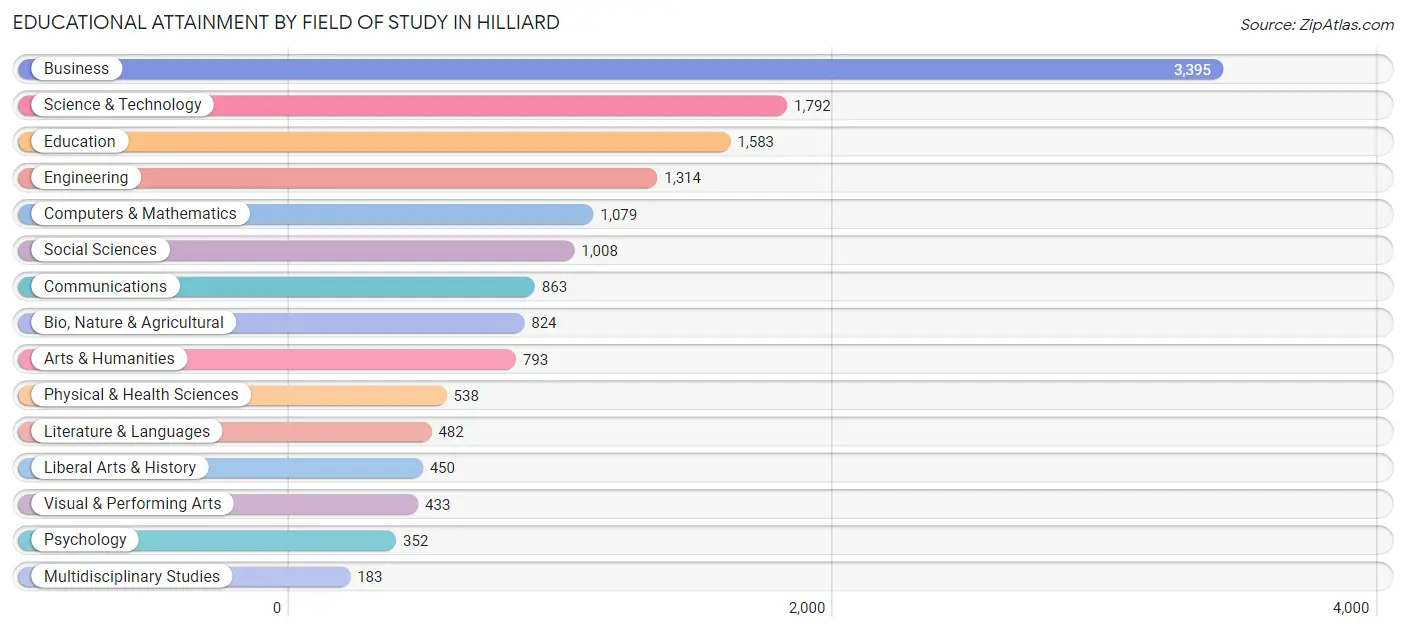
| Field of Study | # Graduates | % Graduates |
| Computers & Mathematics | 1,079 | 7.1% |
| Bio, Nature & Agricultural | 824 | 5.5% |
| Physical & Health Sciences | 538 | 3.6% |
| Psychology | 352 | 2.3% |
| Social Sciences | 1,008 | 6.7% |
| Engineering | 1,314 | 8.7% |
| Multidisciplinary Studies | 183 | 1.2% |
| Science & Technology | 1,792 | 11.9% |
| Business | 3,395 | 22.5% |
| Education | 1,583 | 10.5% |
| Literature & Languages | 482 | 3.2% |
| Liberal Arts & History | 450 | 3.0% |
| Visual & Performing Arts | 433 | 2.9% |
| Communications | 863 | 5.7% |
| Arts & Humanities | 793 | 5.3% |
| Total | 15,089 | 100.0% |
Transportation & Commute in Hilliard
Vehicle Availability by Sex in Hilliard
The most prevalent vehicle ownership categories in Hilliard are males with 2 vehicles (5,940, accounting for 55.5%) and females with 2 vehicles (5,063, making up 63.0%).
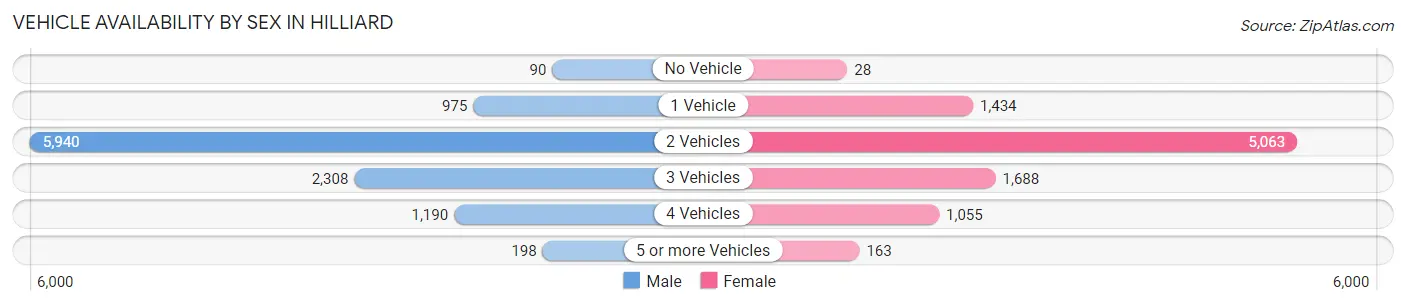
| Vehicles Available | Male | Female |
| No Vehicle | 90 (0.8%) | 28 (0.3%) |
| 1 Vehicle | 975 (9.1%) | 1,434 (15.2%) |
| 2 Vehicles | 5,940 (55.5%) | 5,063 (53.7%) |
| 3 Vehicles | 2,308 (21.6%) | 1,688 (17.9%) |
| 4 Vehicles | 1,190 (11.1%) | 1,055 (11.2%) |
| 5 or more Vehicles | 198 (1.8%) | 163 (1.7%) |
| Total | 10,701 (100.0%) | 9,431 (100.0%) |
Commute Time in Hilliard
The most frequently occuring commute durations in Hilliard are 20 to 24 minutes (3,290 commuters, 19.6%), 30 to 34 minutes (2,676 commuters, 16.0%), and 15 to 19 minutes (2,368 commuters, 14.1%).
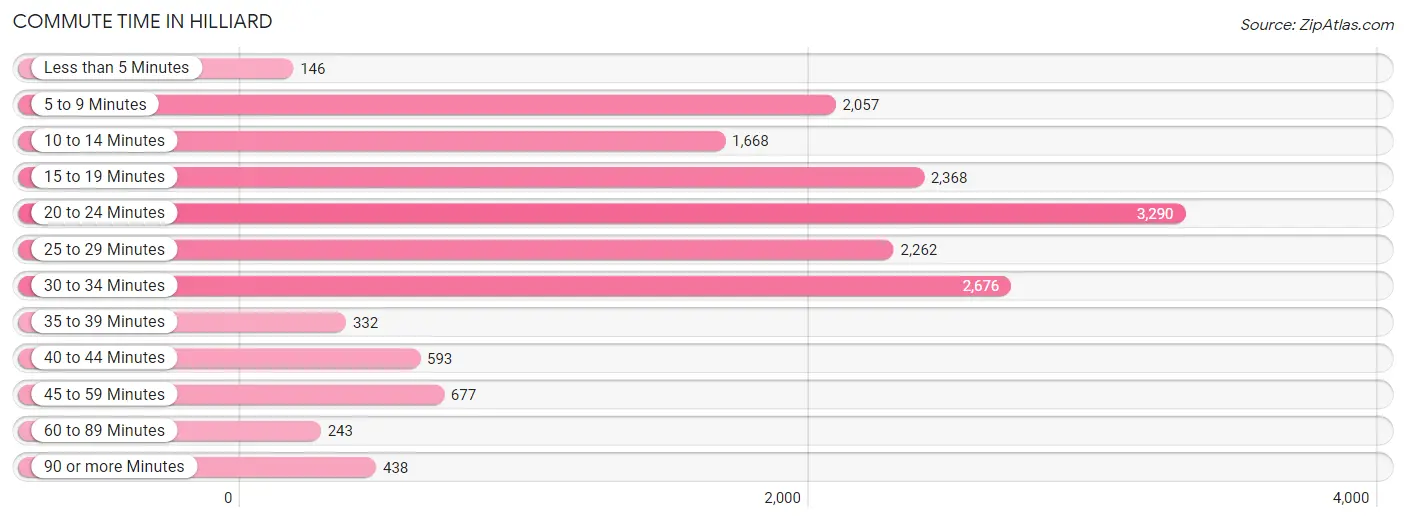
| Commute Time | # Commuters | % Commuters |
| Less than 5 Minutes | 146 | 0.9% |
| 5 to 9 Minutes | 2,057 | 12.3% |
| 10 to 14 Minutes | 1,668 | 10.0% |
| 15 to 19 Minutes | 2,368 | 14.1% |
| 20 to 24 Minutes | 3,290 | 19.6% |
| 25 to 29 Minutes | 2,262 | 13.5% |
| 30 to 34 Minutes | 2,676 | 16.0% |
| 35 to 39 Minutes | 332 | 2.0% |
| 40 to 44 Minutes | 593 | 3.5% |
| 45 to 59 Minutes | 677 | 4.0% |
| 60 to 89 Minutes | 243 | 1.5% |
| 90 or more Minutes | 438 | 2.6% |
Commute Time by Sex in Hilliard
The most common commute times in Hilliard are 20 to 24 minutes (1,747 commuters, 19.9%) for males and 20 to 24 minutes (1,543 commuters, 19.4%) for females.
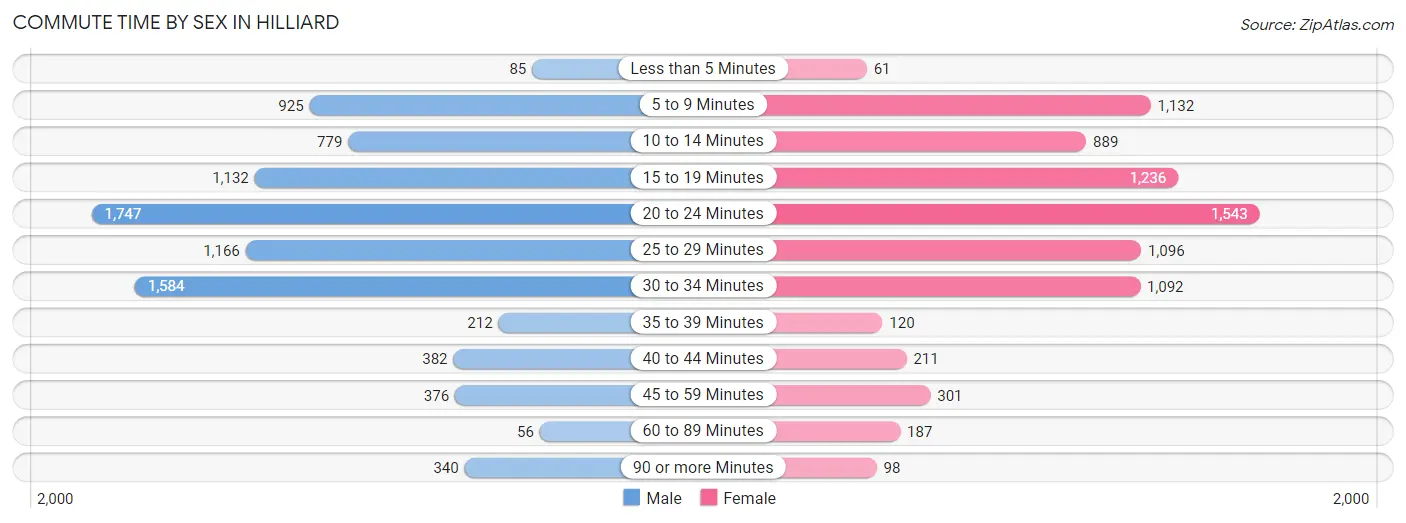
| Commute Time | Male | Female |
| Less than 5 Minutes | 85 (1.0%) | 61 (0.8%) |
| 5 to 9 Minutes | 925 (10.5%) | 1,132 (14.2%) |
| 10 to 14 Minutes | 779 (8.9%) | 889 (11.2%) |
| 15 to 19 Minutes | 1,132 (12.9%) | 1,236 (15.5%) |
| 20 to 24 Minutes | 1,747 (19.9%) | 1,543 (19.4%) |
| 25 to 29 Minutes | 1,166 (13.3%) | 1,096 (13.8%) |
| 30 to 34 Minutes | 1,584 (18.0%) | 1,092 (13.7%) |
| 35 to 39 Minutes | 212 (2.4%) | 120 (1.5%) |
| 40 to 44 Minutes | 382 (4.3%) | 211 (2.6%) |
| 45 to 59 Minutes | 376 (4.3%) | 301 (3.8%) |
| 60 to 89 Minutes | 56 (0.6%) | 187 (2.4%) |
| 90 or more Minutes | 340 (3.9%) | 98 (1.2%) |
Time of Departure to Work by Sex in Hilliard
The most frequent times of departure to work in Hilliard are 7:00 AM to 7:29 AM (1,890, 21.5%) for males and 7:00 AM to 7:29 AM (1,900, 23.8%) for females.
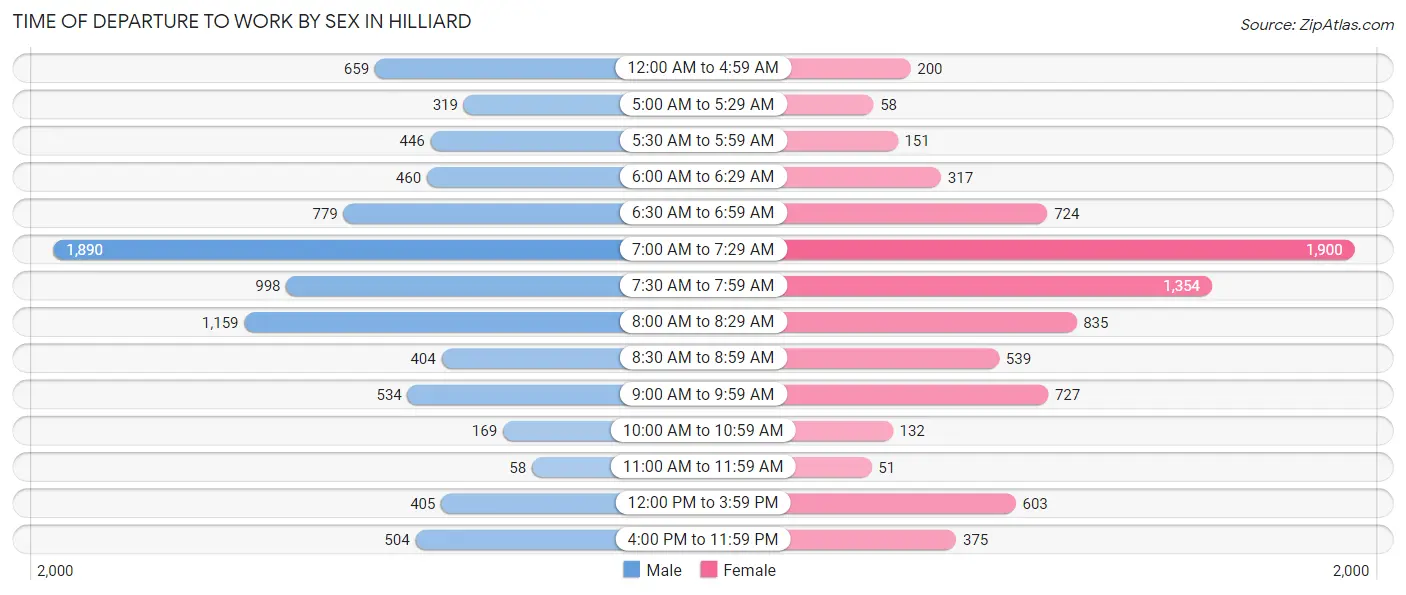
| Time of Departure | Male | Female |
| 12:00 AM to 4:59 AM | 659 (7.5%) | 200 (2.5%) |
| 5:00 AM to 5:29 AM | 319 (3.6%) | 58 (0.7%) |
| 5:30 AM to 5:59 AM | 446 (5.1%) | 151 (1.9%) |
| 6:00 AM to 6:29 AM | 460 (5.2%) | 317 (4.0%) |
| 6:30 AM to 6:59 AM | 779 (8.9%) | 724 (9.1%) |
| 7:00 AM to 7:29 AM | 1,890 (21.5%) | 1,900 (23.8%) |
| 7:30 AM to 7:59 AM | 998 (11.4%) | 1,354 (17.0%) |
| 8:00 AM to 8:29 AM | 1,159 (13.2%) | 835 (10.5%) |
| 8:30 AM to 8:59 AM | 404 (4.6%) | 539 (6.8%) |
| 9:00 AM to 9:59 AM | 534 (6.1%) | 727 (9.1%) |
| 10:00 AM to 10:59 AM | 169 (1.9%) | 132 (1.7%) |
| 11:00 AM to 11:59 AM | 58 (0.7%) | 51 (0.6%) |
| 12:00 PM to 3:59 PM | 405 (4.6%) | 603 (7.6%) |
| 4:00 PM to 11:59 PM | 504 (5.7%) | 375 (4.7%) |
| Total | 8,784 (100.0%) | 7,966 (100.0%) |
Housing Occupancy in Hilliard
Occupancy by Ownership in Hilliard
Of the total 13,887 dwellings in Hilliard, owner-occupied units account for 9,867 (71.1%), while renter-occupied units make up 4,020 (28.9%).
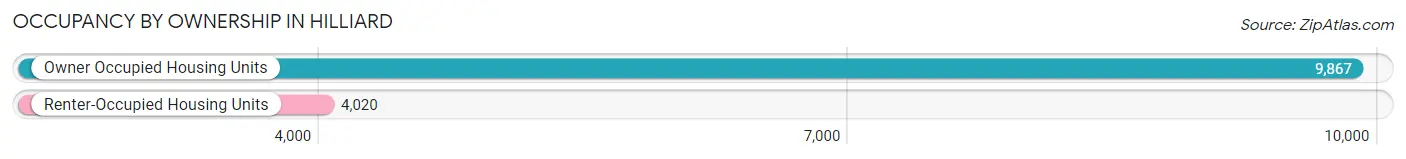
| Occupancy | # Housing Units | % Housing Units |
| Owner Occupied Housing Units | 9,867 | 71.1% |
| Renter-Occupied Housing Units | 4,020 | 28.9% |
| Total Occupied Housing Units | 13,887 | 100.0% |
Occupancy by Household Size in Hilliard
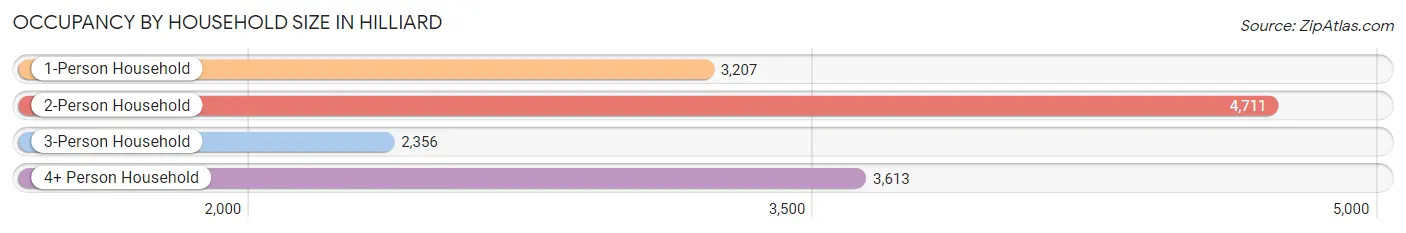
| Household Size | # Housing Units | % Housing Units |
| 1-Person Household | 3,207 | 23.1% |
| 2-Person Household | 4,711 | 33.9% |
| 3-Person Household | 2,356 | 17.0% |
| 4+ Person Household | 3,613 | 26.0% |
| Total Housing Units | 13,887 | 100.0% |
Occupancy by Ownership by Household Size in Hilliard
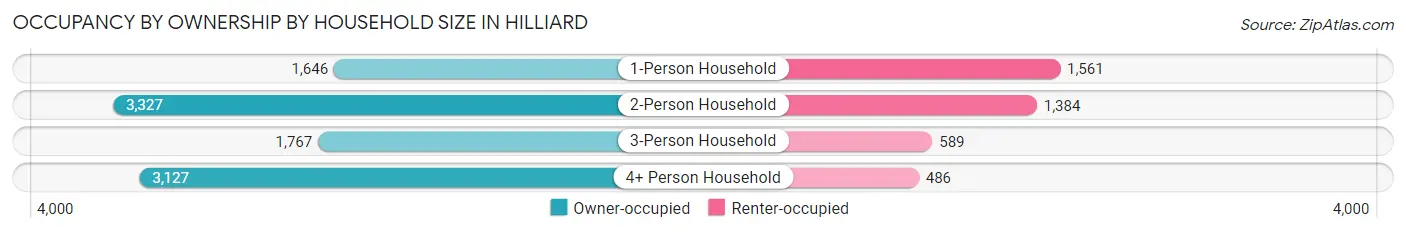
| Household Size | Owner-occupied | Renter-occupied |
| 1-Person Household | 1,646 (51.3%) | 1,561 (48.7%) |
| 2-Person Household | 3,327 (70.6%) | 1,384 (29.4%) |
| 3-Person Household | 1,767 (75.0%) | 589 (25.0%) |
| 4+ Person Household | 3,127 (86.6%) | 486 (13.5%) |
| Total Housing Units | 9,867 (71.1%) | 4,020 (28.9%) |
Occupancy by Educational Attainment in Hilliard
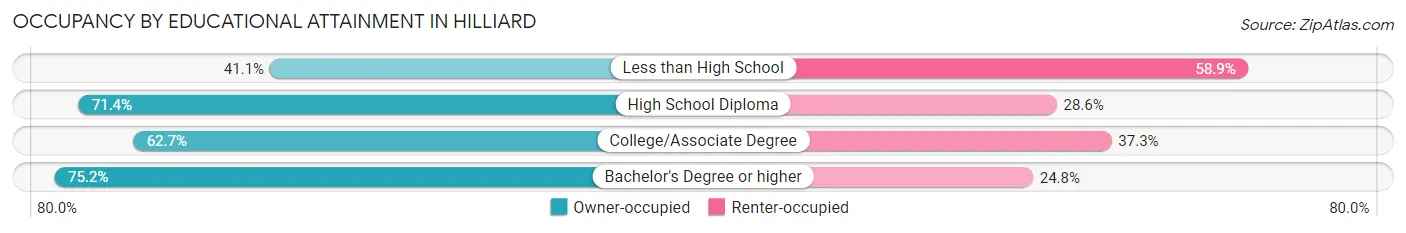
| Household Size | Owner-occupied | Renter-occupied |
| Less than High School | 113 (41.1%) | 162 (58.9%) |
| High School Diploma | 1,153 (71.4%) | 462 (28.6%) |
| College/Associate Degree | 2,092 (62.7%) | 1,245 (37.3%) |
| Bachelor's Degree or higher | 6,509 (75.2%) | 2,151 (24.8%) |
Occupancy by Age of Householder in Hilliard
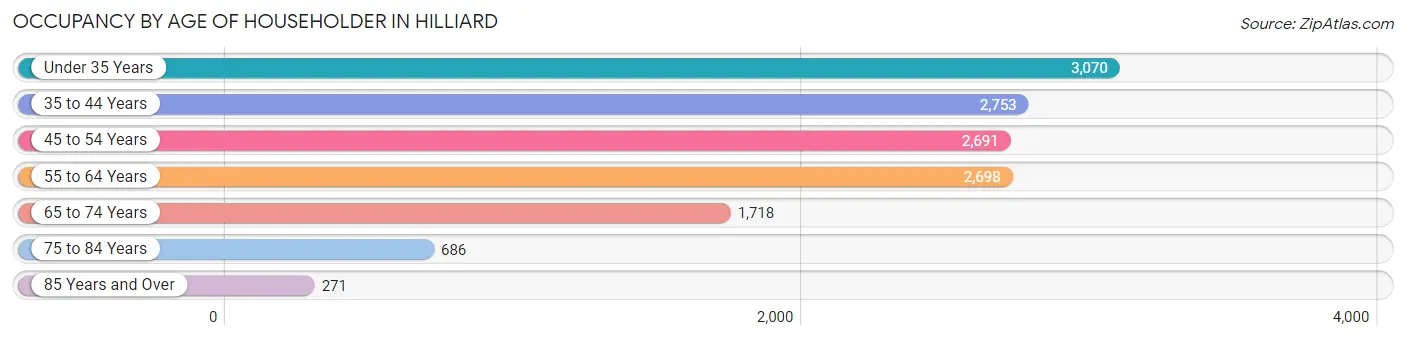
| Age Bracket | # Households | % Households |
| Under 35 Years | 3,070 | 22.1% |
| 35 to 44 Years | 2,753 | 19.8% |
| 45 to 54 Years | 2,691 | 19.4% |
| 55 to 64 Years | 2,698 | 19.4% |
| 65 to 74 Years | 1,718 | 12.4% |
| 75 to 84 Years | 686 | 4.9% |
| 85 Years and Over | 271 | 1.9% |
| Total | 13,887 | 100.0% |
Housing Finances in Hilliard
Median Income by Occupancy in Hilliard
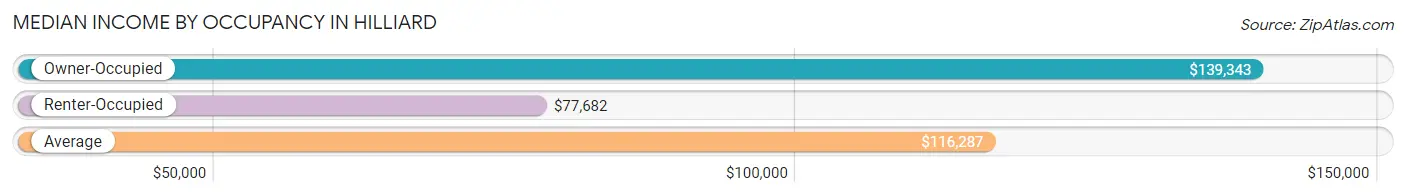
| Occupancy Type | # Households | Median Income |
| Owner-Occupied | 9,867 (71.1%) | $139,343 |
| Renter-Occupied | 4,020 (28.9%) | $77,682 |
| Average | 13,887 (100.0%) | $116,287 |
Occupancy by Householder Income Bracket in Hilliard
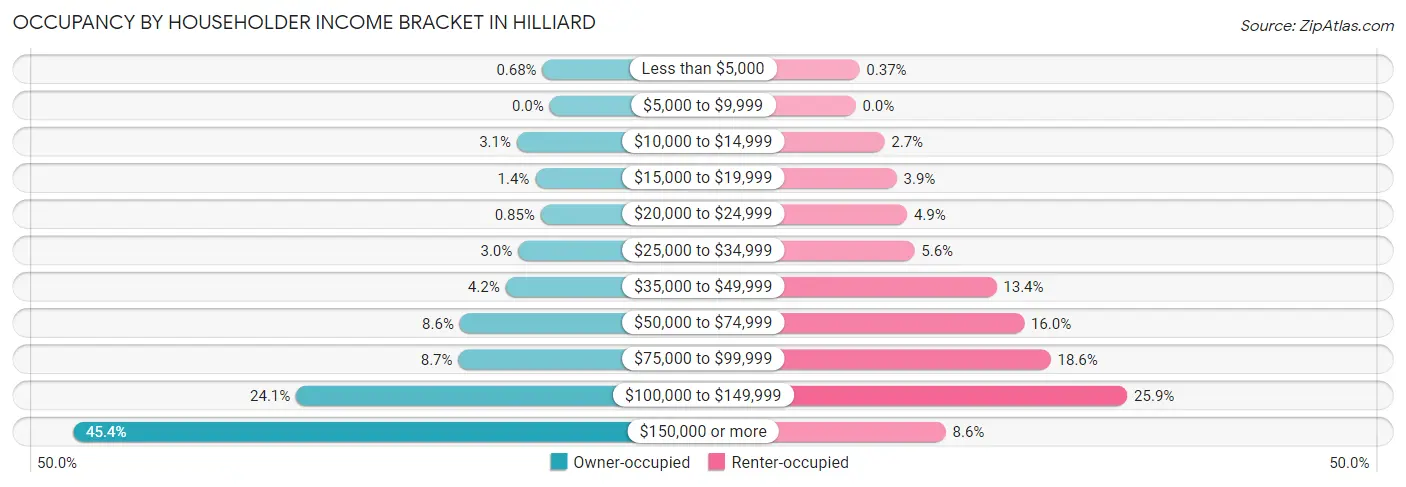
| Income Bracket | Owner-occupied | Renter-occupied |
| Less than $5,000 | 67 (0.7%) | 15 (0.4%) |
| $5,000 to $9,999 | 0 (0.0%) | 0 (0.0%) |
| $10,000 to $14,999 | 308 (3.1%) | 110 (2.7%) |
| $15,000 to $19,999 | 135 (1.4%) | 157 (3.9%) |
| $20,000 to $24,999 | 84 (0.9%) | 197 (4.9%) |
| $25,000 to $34,999 | 296 (3.0%) | 225 (5.6%) |
| $35,000 to $49,999 | 414 (4.2%) | 539 (13.4%) |
| $50,000 to $74,999 | 845 (8.6%) | 645 (16.0%) |
| $75,000 to $99,999 | 857 (8.7%) | 747 (18.6%) |
| $100,000 to $149,999 | 2,382 (24.1%) | 1,040 (25.9%) |
| $150,000 or more | 4,479 (45.4%) | 345 (8.6%) |
| Total | 9,867 (100.0%) | 4,020 (100.0%) |
Monthly Housing Cost Tiers in Hilliard
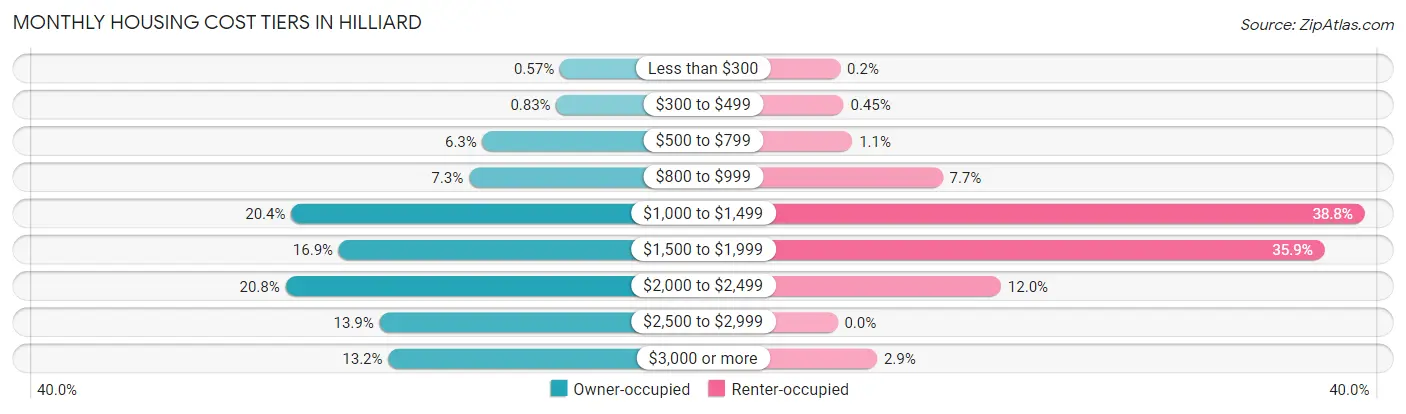
| Monthly Cost | Owner-occupied | Renter-occupied |
| Less than $300 | 56 (0.6%) | 8 (0.2%) |
| $300 to $499 | 82 (0.8%) | 18 (0.4%) |
| $500 to $799 | 619 (6.3%) | 44 (1.1%) |
| $800 to $999 | 717 (7.3%) | 311 (7.7%) |
| $1,000 to $1,499 | 2,009 (20.4%) | 1,561 (38.8%) |
| $1,500 to $1,999 | 1,663 (16.9%) | 1,442 (35.9%) |
| $2,000 to $2,499 | 2,050 (20.8%) | 484 (12.0%) |
| $2,500 to $2,999 | 1,368 (13.9%) | 0 (0.0%) |
| $3,000 or more | 1,303 (13.2%) | 117 (2.9%) |
| Total | 9,867 (100.0%) | 4,020 (100.0%) |
Physical Housing Characteristics in Hilliard
Housing Structures in Hilliard
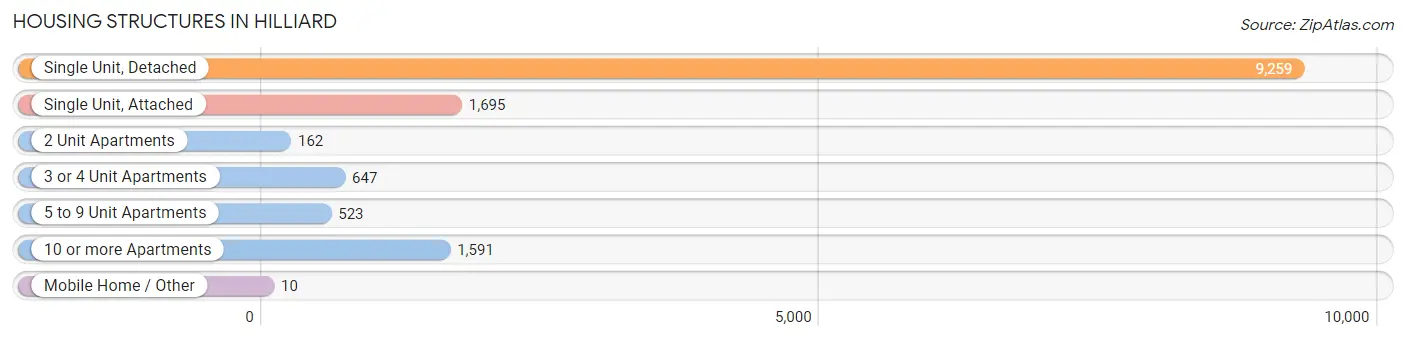
| Structure Type | # Housing Units | % Housing Units |
| Single Unit, Detached | 9,259 | 66.7% |
| Single Unit, Attached | 1,695 | 12.2% |
| 2 Unit Apartments | 162 | 1.2% |
| 3 or 4 Unit Apartments | 647 | 4.7% |
| 5 to 9 Unit Apartments | 523 | 3.8% |
| 10 or more Apartments | 1,591 | 11.5% |
| Mobile Home / Other | 10 | 0.1% |
| Total | 13,887 | 100.0% |
Housing Structures by Occupancy in Hilliard
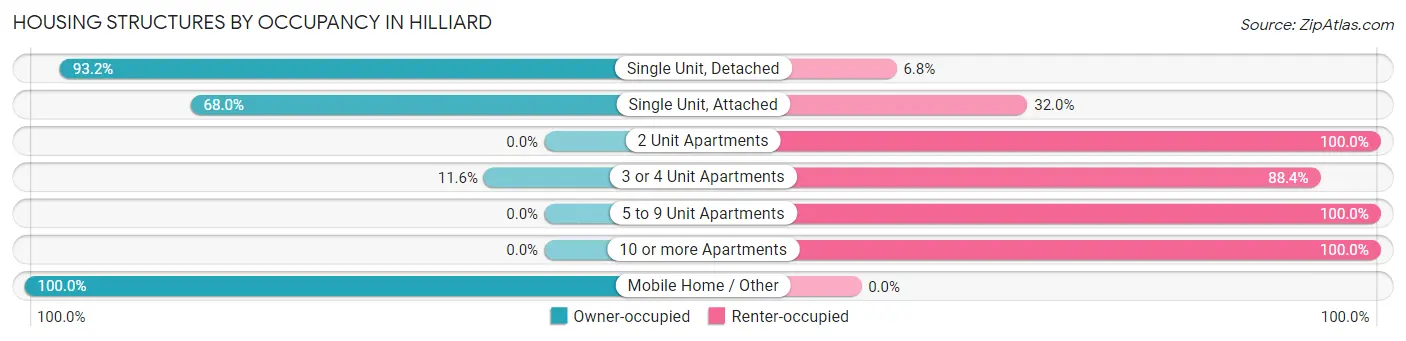
| Structure Type | Owner-occupied | Renter-occupied |
| Single Unit, Detached | 8,629 (93.2%) | 630 (6.8%) |
| Single Unit, Attached | 1,153 (68.0%) | 542 (32.0%) |
| 2 Unit Apartments | 0 (0.0%) | 162 (100.0%) |
| 3 or 4 Unit Apartments | 75 (11.6%) | 572 (88.4%) |
| 5 to 9 Unit Apartments | 0 (0.0%) | 523 (100.0%) |
| 10 or more Apartments | 0 (0.0%) | 1,591 (100.0%) |
| Mobile Home / Other | 10 (100.0%) | 0 (0.0%) |
| Total | 9,867 (71.1%) | 4,020 (28.9%) |
Housing Structures by Number of Rooms in Hilliard
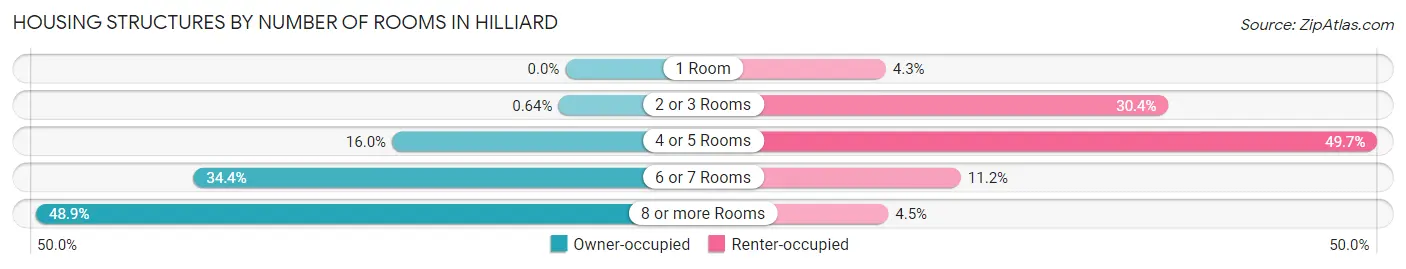
| Number of Rooms | Owner-occupied | Renter-occupied |
| 1 Room | 0 (0.0%) | 171 (4.3%) |
| 2 or 3 Rooms | 63 (0.6%) | 1,221 (30.4%) |
| 4 or 5 Rooms | 1,582 (16.0%) | 1,998 (49.7%) |
| 6 or 7 Rooms | 3,393 (34.4%) | 450 (11.2%) |
| 8 or more Rooms | 4,829 (48.9%) | 180 (4.5%) |
| Total | 9,867 (100.0%) | 4,020 (100.0%) |
Housing Structure by Heating Type in Hilliard
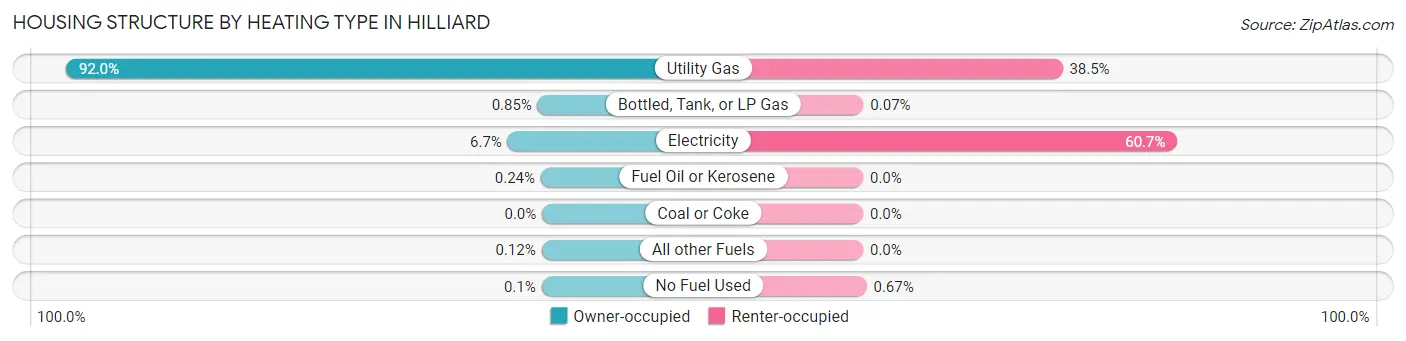
| Heating Type | Owner-occupied | Renter-occupied |
| Utility Gas | 9,081 (92.0%) | 1,549 (38.5%) |
| Bottled, Tank, or LP Gas | 84 (0.9%) | 3 (0.1%) |
| Electricity | 656 (6.7%) | 2,441 (60.7%) |
| Fuel Oil or Kerosene | 24 (0.2%) | 0 (0.0%) |
| Coal or Coke | 0 (0.0%) | 0 (0.0%) |
| All other Fuels | 12 (0.1%) | 0 (0.0%) |
| No Fuel Used | 10 (0.1%) | 27 (0.7%) |
| Total | 9,867 (100.0%) | 4,020 (100.0%) |
Household Vehicle Usage in Hilliard
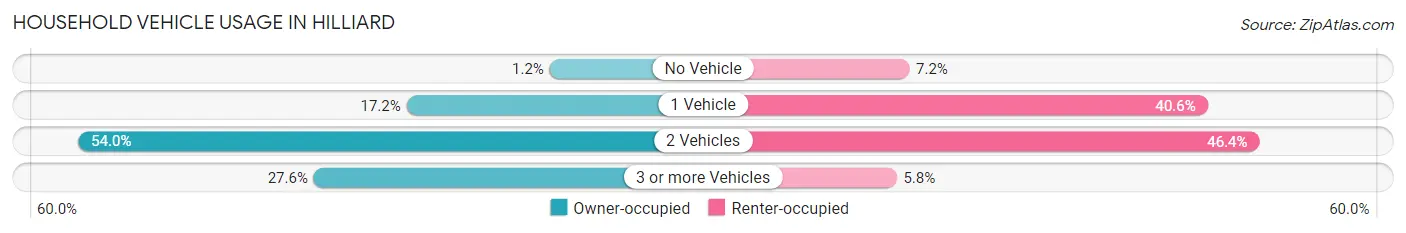
| Vehicles per Household | Owner-occupied | Renter-occupied |
| No Vehicle | 116 (1.2%) | 289 (7.2%) |
| 1 Vehicle | 1,698 (17.2%) | 1,633 (40.6%) |
| 2 Vehicles | 5,329 (54.0%) | 1,866 (46.4%) |
| 3 or more Vehicles | 2,724 (27.6%) | 232 (5.8%) |
| Total | 9,867 (100.0%) | 4,020 (100.0%) |
Real Estate & Mortgages in Hilliard
Real Estate and Mortgage Overview in Hilliard
| Characteristic | Without Mortgage | With Mortgage |
| Housing Units | 2,528 | 7,339 |
| Median Property Value | $313,800 | $342,600 |
| Median Household Income | $116,408 | $3,512 |
| Monthly Housing Costs | $986 | $1,303 |
| Real Estate Taxes | $6,529 | $33 |
Property Value by Mortgage Status in Hilliard
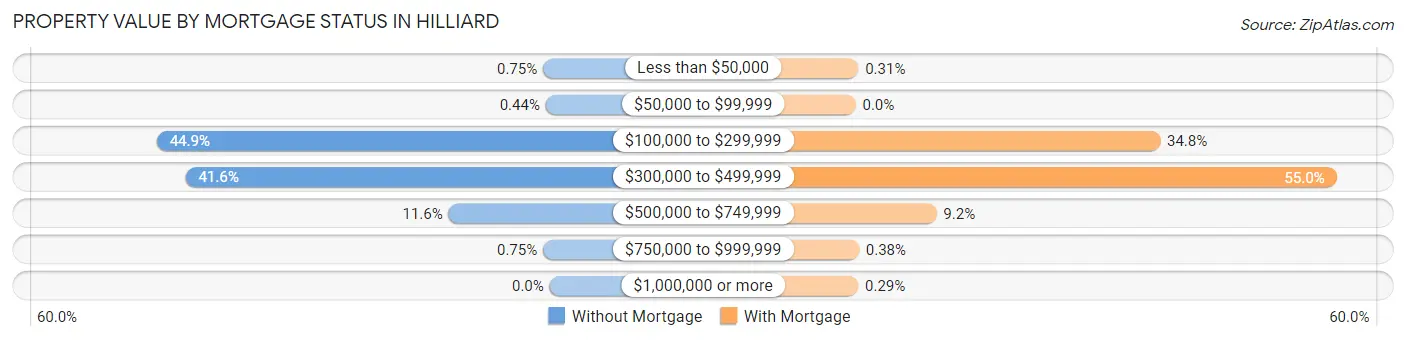
| Property Value | Without Mortgage | With Mortgage |
| Less than $50,000 | 19 (0.7%) | 23 (0.3%) |
| $50,000 to $99,999 | 11 (0.4%) | 0 (0.0%) |
| $100,000 to $299,999 | 1,135 (44.9%) | 2,554 (34.8%) |
| $300,000 to $499,999 | 1,052 (41.6%) | 4,035 (55.0%) |
| $500,000 to $749,999 | 292 (11.6%) | 678 (9.2%) |
| $750,000 to $999,999 | 19 (0.7%) | 28 (0.4%) |
| $1,000,000 or more | 0 (0.0%) | 21 (0.3%) |
| Total | 2,528 (100.0%) | 7,339 (100.0%) |
Household Income by Mortgage Status in Hilliard
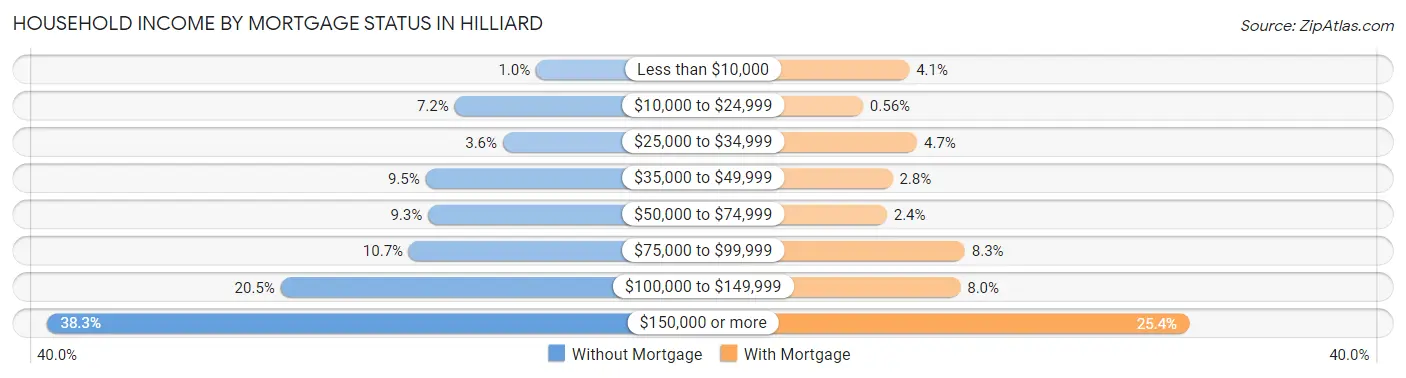
| Household Income | Without Mortgage | With Mortgage |
| Less than $10,000 | 26 (1.0%) | 300 (4.1%) |
| $10,000 to $24,999 | 183 (7.2%) | 41 (0.6%) |
| $25,000 to $34,999 | 90 (3.6%) | 344 (4.7%) |
| $35,000 to $49,999 | 239 (9.5%) | 206 (2.8%) |
| $50,000 to $74,999 | 234 (9.3%) | 175 (2.4%) |
| $75,000 to $99,999 | 271 (10.7%) | 611 (8.3%) |
| $100,000 to $149,999 | 518 (20.5%) | 586 (8.0%) |
| $150,000 or more | 967 (38.3%) | 1,864 (25.4%) |
| Total | 2,528 (100.0%) | 7,339 (100.0%) |
Property Value to Household Income Ratio in Hilliard
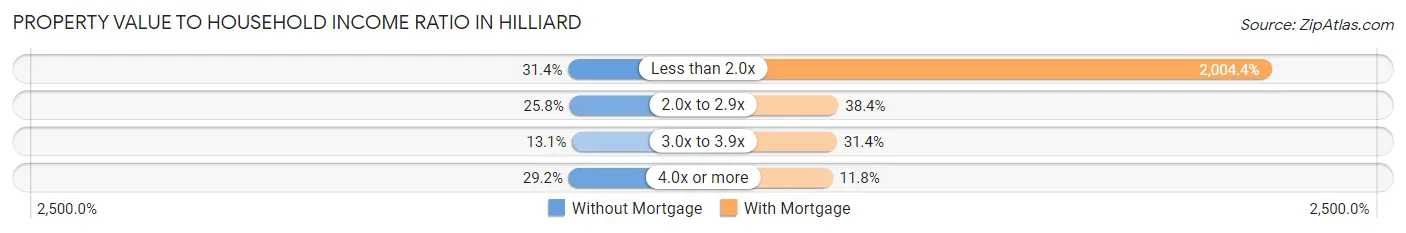
| Value-to-Income Ratio | Without Mortgage | With Mortgage |
| Less than 2.0x | 794 (31.4%) | 147,106 (2,004.4%) |
| 2.0x to 2.9x | 652 (25.8%) | 2,816 (38.4%) |
| 3.0x to 3.9x | 332 (13.1%) | 2,304 (31.4%) |
| 4.0x or more | 738 (29.2%) | 865 (11.8%) |
| Total | 2,528 (100.0%) | 7,339 (100.0%) |
Real Estate Taxes by Mortgage Status in Hilliard
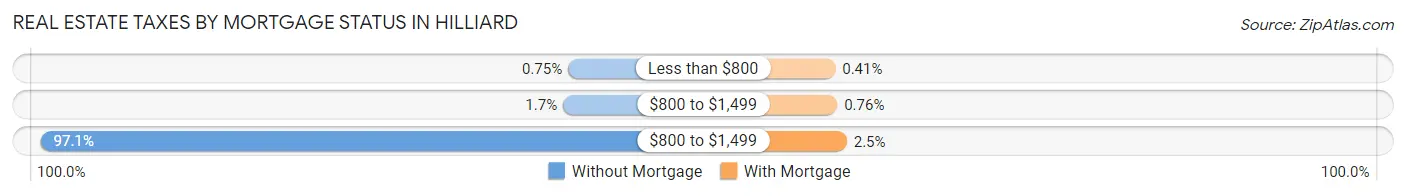
| Property Taxes | Without Mortgage | With Mortgage |
| Less than $800 | 19 (0.7%) | 30 (0.4%) |
| $800 to $1,499 | 42 (1.7%) | 56 (0.8%) |
| $800 to $1,499 | 2,454 (97.1%) | 184 (2.5%) |
| Total | 2,528 (100.0%) | 7,339 (100.0%) |
Health & Disability in Hilliard
Health Insurance Coverage by Age in Hilliard
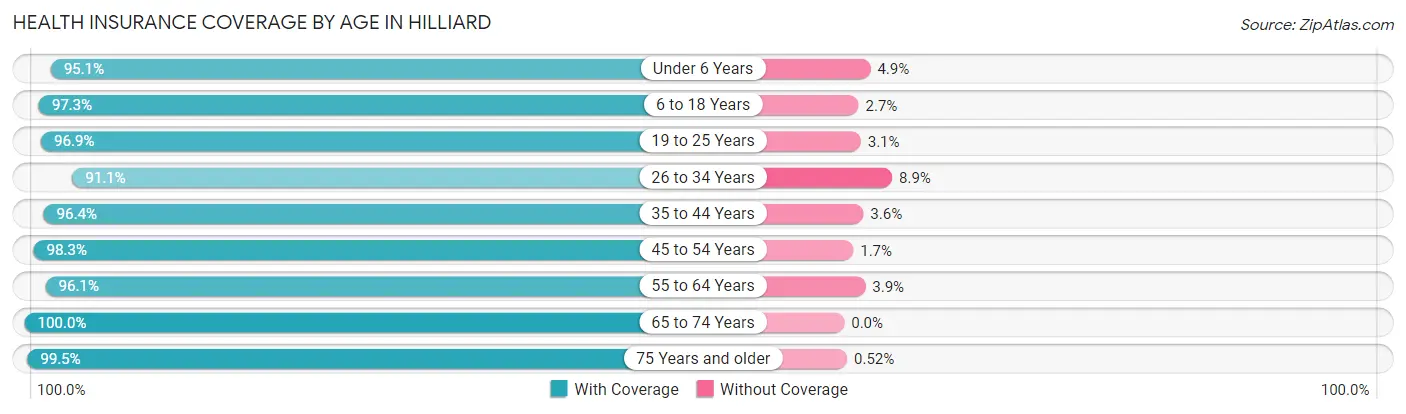
| Age Bracket | With Coverage | Without Coverage |
| Under 6 Years | 2,435 (95.1%) | 125 (4.9%) |
| 6 to 18 Years | 6,845 (97.3%) | 187 (2.7%) |
| 19 to 25 Years | 2,326 (96.9%) | 74 (3.1%) |
| 26 to 34 Years | 4,960 (91.1%) | 485 (8.9%) |
| 35 to 44 Years | 4,879 (96.4%) | 180 (3.6%) |
| 45 to 54 Years | 4,552 (98.3%) | 78 (1.7%) |
| 55 to 64 Years | 4,410 (96.1%) | 180 (3.9%) |
| 65 to 74 Years | 2,587 (100.0%) | 0 (0.0%) |
| 75 Years and older | 1,536 (99.5%) | 8 (0.5%) |
| Total | 34,530 (96.3%) | 1,317 (3.7%) |
Health Insurance Coverage by Citizenship Status in Hilliard
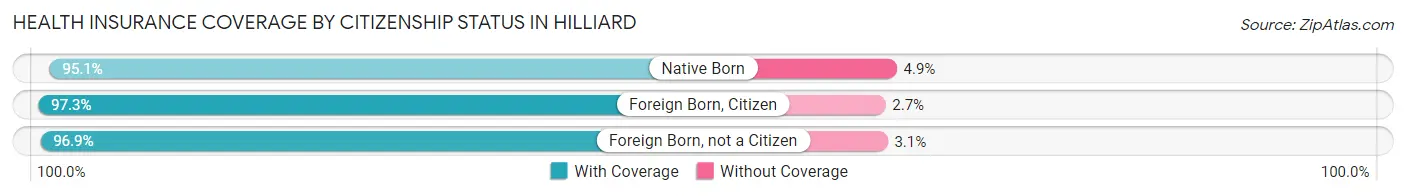
| Citizenship Status | With Coverage | Without Coverage |
| Native Born | 2,435 (95.1%) | 125 (4.9%) |
| Foreign Born, Citizen | 6,845 (97.3%) | 187 (2.7%) |
| Foreign Born, not a Citizen | 2,326 (96.9%) | 74 (3.1%) |
Health Insurance Coverage by Household Income in Hilliard
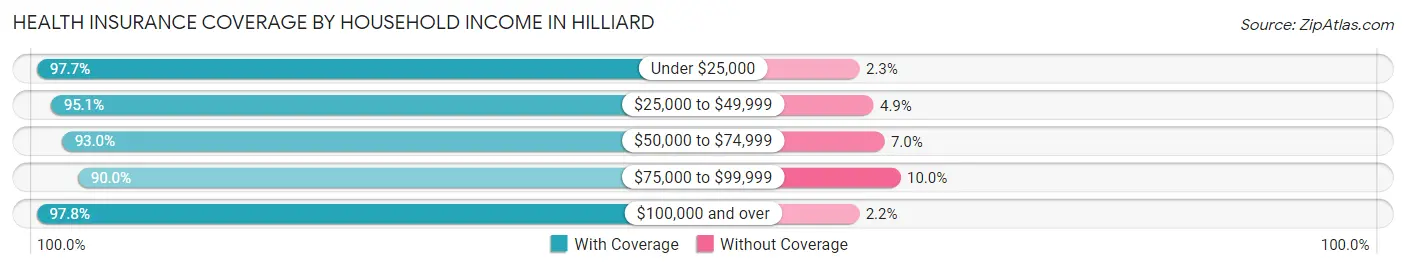
| Household Income | With Coverage | Without Coverage |
| Under $25,000 | 2,002 (97.7%) | 47 (2.3%) |
| $25,000 to $49,999 | 2,282 (95.1%) | 118 (4.9%) |
| $50,000 to $74,999 | 3,224 (93.0%) | 241 (7.0%) |
| $75,000 to $99,999 | 3,340 (90.0%) | 370 (10.0%) |
| $100,000 and over | 23,680 (97.8%) | 539 (2.2%) |
Public vs Private Health Insurance Coverage by Age in Hilliard
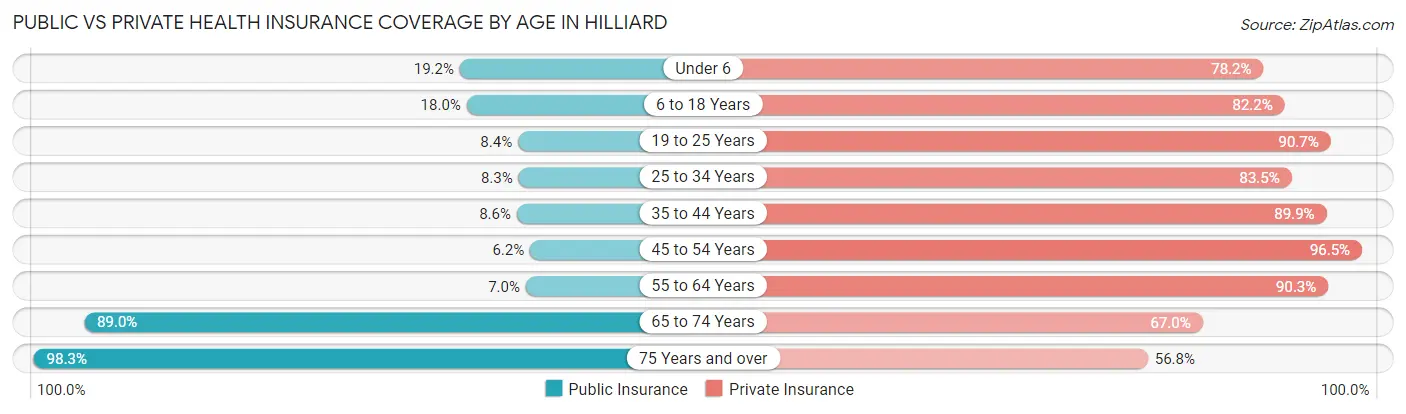
| Age Bracket | Public Insurance | Private Insurance |
| Under 6 | 492 (19.2%) | 2,003 (78.2%) |
| 6 to 18 Years | 1,262 (17.9%) | 5,779 (82.2%) |
| 19 to 25 Years | 202 (8.4%) | 2,177 (90.7%) |
| 25 to 34 Years | 453 (8.3%) | 4,545 (83.5%) |
| 35 to 44 Years | 437 (8.6%) | 4,550 (89.9%) |
| 45 to 54 Years | 286 (6.2%) | 4,470 (96.5%) |
| 55 to 64 Years | 320 (7.0%) | 4,143 (90.3%) |
| 65 to 74 Years | 2,302 (89.0%) | 1,732 (66.9%) |
| 75 Years and over | 1,518 (98.3%) | 877 (56.8%) |
| Total | 7,272 (20.3%) | 30,276 (84.5%) |
Disability Status by Sex by Age in Hilliard
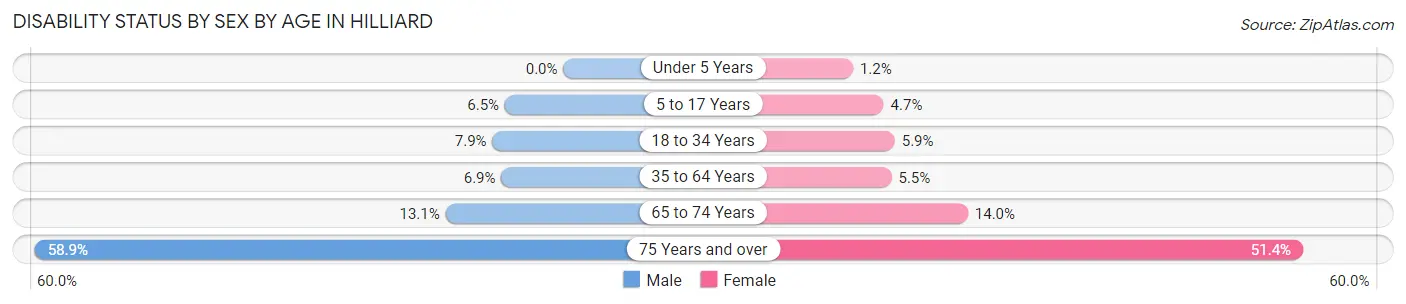
| Age Bracket | Male | Female |
| Under 5 Years | 0 (0.0%) | 14 (1.2%) |
| 5 to 17 Years | 224 (6.5%) | 172 (4.7%) |
| 18 to 34 Years | 314 (7.9%) | 246 (5.9%) |
| 35 to 64 Years | 493 (6.9%) | 395 (5.5%) |
| 65 to 74 Years | 174 (13.1%) | 177 (14.0%) |
| 75 Years and over | 385 (58.9%) | 457 (51.3%) |
Disability Class by Sex by Age in Hilliard
Disability Class: Hearing Difficulty
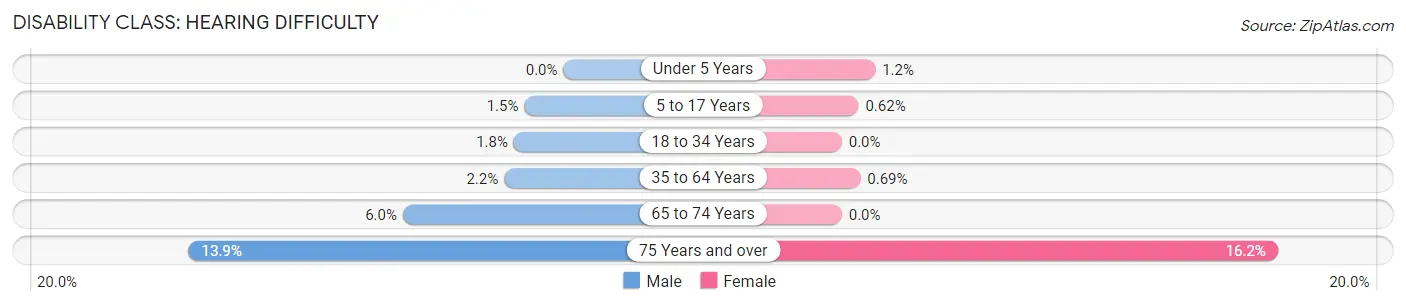
| Age Bracket | Male | Female |
| Under 5 Years | 0 (0.0%) | 14 (1.2%) |
| 5 to 17 Years | 50 (1.5%) | 23 (0.6%) |
| 18 to 34 Years | 73 (1.8%) | 0 (0.0%) |
| 35 to 64 Years | 157 (2.2%) | 49 (0.7%) |
| 65 to 74 Years | 79 (6.0%) | 0 (0.0%) |
| 75 Years and over | 91 (13.9%) | 144 (16.2%) |
Disability Class: Vision Difficulty
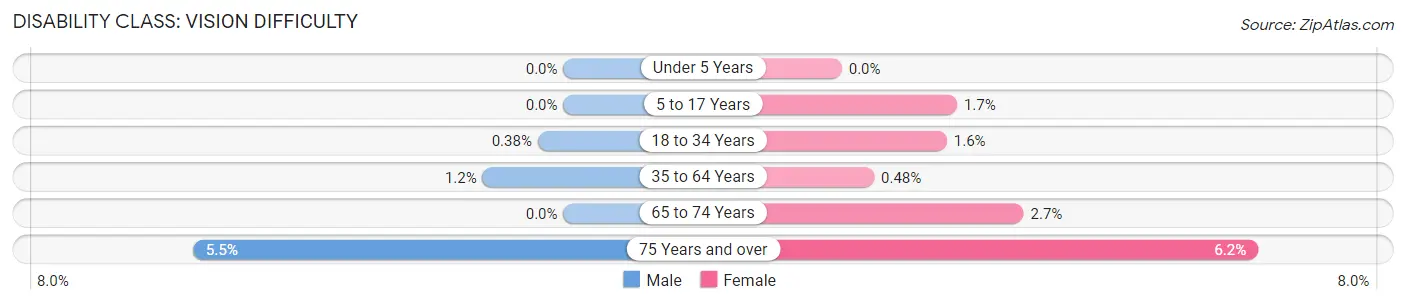
| Age Bracket | Male | Female |
| Under 5 Years | 0 (0.0%) | 0 (0.0%) |
| 5 to 17 Years | 0 (0.0%) | 63 (1.7%) |
| 18 to 34 Years | 15 (0.4%) | 65 (1.6%) |
| 35 to 64 Years | 86 (1.2%) | 34 (0.5%) |
| 65 to 74 Years | 0 (0.0%) | 34 (2.7%) |
| 75 Years and over | 36 (5.5%) | 55 (6.2%) |
Disability Class: Cognitive Difficulty
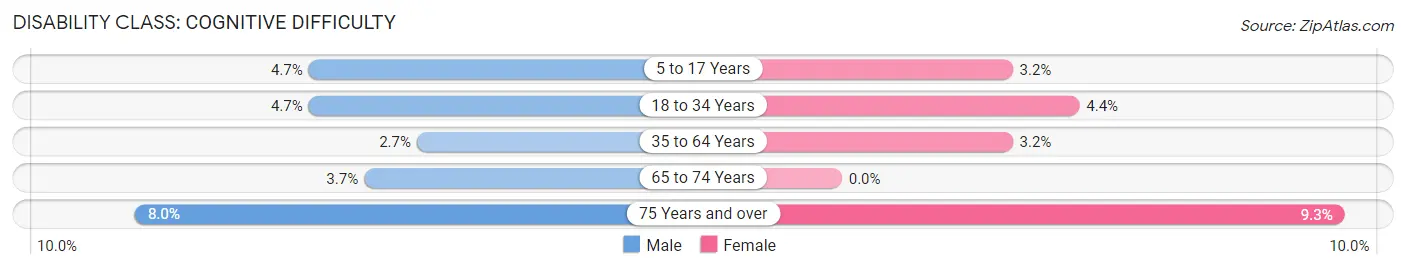
| Age Bracket | Male | Female |
| 5 to 17 Years | 163 (4.7%) | 117 (3.2%) |
| 18 to 34 Years | 188 (4.7%) | 184 (4.4%) |
| 35 to 64 Years | 194 (2.7%) | 226 (3.2%) |
| 65 to 74 Years | 49 (3.7%) | 0 (0.0%) |
| 75 Years and over | 52 (8.0%) | 83 (9.3%) |
Disability Class: Ambulatory Difficulty
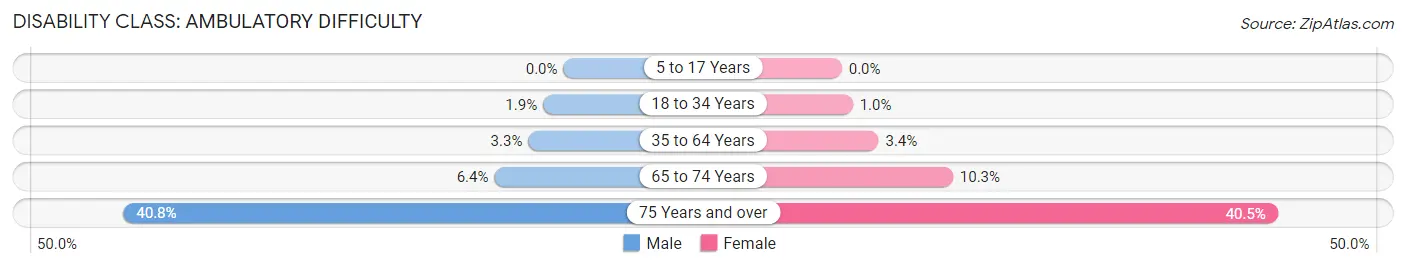
| Age Bracket | Male | Female |
| 5 to 17 Years | 0 (0.0%) | 0 (0.0%) |
| 18 to 34 Years | 75 (1.9%) | 42 (1.0%) |
| 35 to 64 Years | 233 (3.3%) | 243 (3.4%) |
| 65 to 74 Years | 85 (6.4%) | 130 (10.3%) |
| 75 Years and over | 267 (40.8%) | 360 (40.5%) |
Disability Class: Self-Care Difficulty
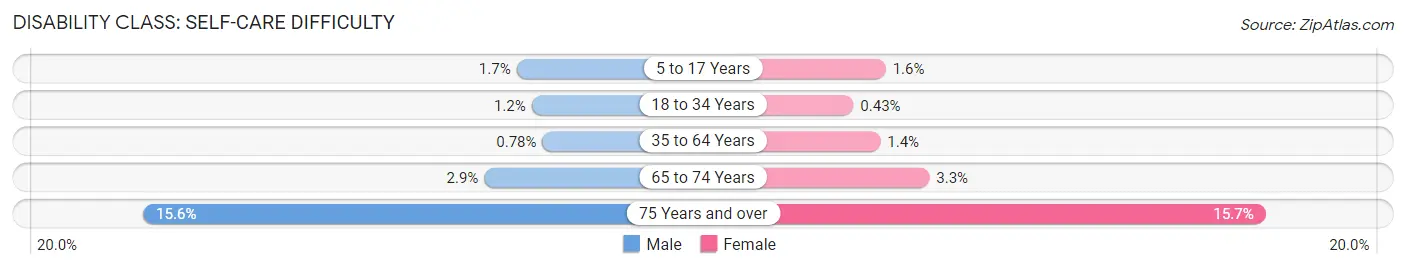
| Age Bracket | Male | Female |
| 5 to 17 Years | 60 (1.7%) | 60 (1.6%) |
| 18 to 34 Years | 47 (1.2%) | 18 (0.4%) |
| 35 to 64 Years | 56 (0.8%) | 102 (1.4%) |
| 65 to 74 Years | 39 (2.9%) | 41 (3.3%) |
| 75 Years and over | 102 (15.6%) | 140 (15.7%) |
Technology Access in Hilliard
Computing Device Access in Hilliard
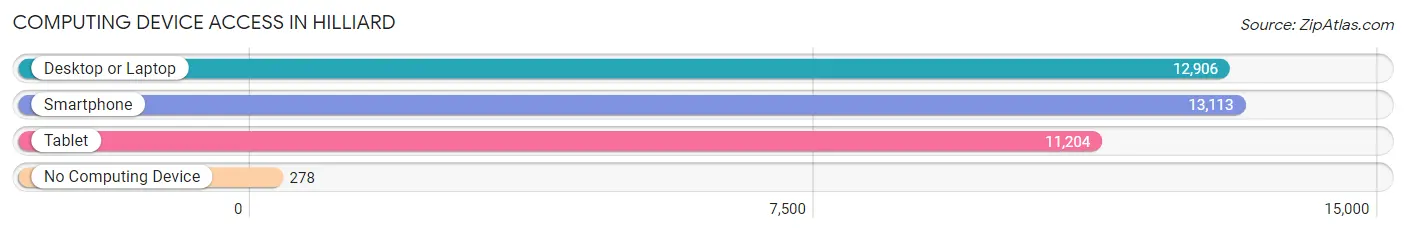
| Device Type | # Households | % Households |
| Desktop or Laptop | 12,906 | 92.9% |
| Smartphone | 13,113 | 94.4% |
| Tablet | 11,204 | 80.7% |
| No Computing Device | 278 | 2.0% |
| Total | 13,887 | 100.0% |
Internet Access in Hilliard
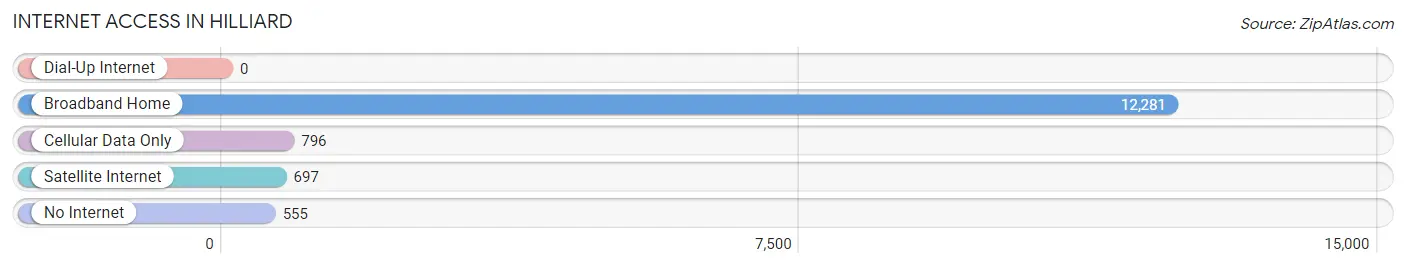
| Internet Type | # Households | % Households |
| Dial-Up Internet | 0 | 0.0% |
| Broadband Home | 12,281 | 88.4% |
| Cellular Data Only | 796 | 5.7% |
| Satellite Internet | 697 | 5.0% |
| No Internet | 555 | 4.0% |
| Total | 13,887 | 100.0% |
Hilliard Summary
Hilliard, Ohio is a city located in Franklin County, Ohio, United States. It is a suburb of Columbus, the state capital and largest city in Ohio. The population of Hilliard was estimated to be 35,435 in 2019.
History
Hilliard was founded in 1853 by John Reed Hilliard, a veteran of the War of 1812. He purchased land from the Scioto Land Company and named the area after himself. The area was originally known as Hilliard's Station, and the first post office was established in 1854. The village was incorporated in 1869 and became a city in 1960.
Geography
Hilliard is located at 40°2'43" North, 83°9'17" West (40.045278, -83.154722). It is situated in the northwest corner of Franklin County, approximately 15 miles northwest of downtown Columbus. The city covers an area of 16.3 square miles and is bordered by Upper Arlington to the east, Dublin to the south, and Plain City to the west.
Economy
Hilliard is home to a variety of businesses, including retail stores, restaurants, and professional services. The city is also home to several corporate headquarters, including Bob Evans Farms, Inc., and the OhioHealth Corporation. The city is also home to the Hilliard Business Park, which is home to a variety of businesses, including the headquarters of the Ohio Bureau of Motor Vehicles.
Demographics
As of the 2010 census, there were 28,435 people, 10,845 households, and 7,845 families residing in the city. The population density was 1,743.3 people per square mile. The racial makeup of the city was 87.2% White, 6.2% African American, 0.3% Native American, 2.7% Asian, 0.1% Pacific Islander, 1.2% from other races, and 2.3% from two or more races. Hispanic or Latino of any race were 3.2% of the population.
The median income for a household in the city was $63,945, and the median income for a family was $76,845. The per capita income for the city was $30,845. About 3.2% of families and 4.3% of the population were below the poverty line, including 5.2% of those under age 18 and 4.2% of those age 65 or over.
Hilliard is served by the Hilliard City School District, which consists of seven elementary schools, two middle schools, and one high school. The city is also home to the Hilliard Branch of the Columbus Metropolitan Library.
Common Questions
What is Per Capita Income in Hilliard?
Per Capita income in Hilliard is $52,895.
What is the Median Family Income in Hilliard?
Median Family Income in Hilliard is $136,106.
What is the Median Household income in Hilliard?
Median Household Income in Hilliard is $116,287.
What is Income or Wage Gap in Hilliard?
Income or Wage Gap in Hilliard is 25.5%.
Women in Hilliard earn 74.5 cents for every dollar earned by a man.
What is Family Income Deficit in Hilliard?
Family Income Deficit in Hilliard is $14,345.
Families that are below poverty line in Hilliard earn $14,345 less on average than the poverty threshold level.
What is Inequality or Gini Index in Hilliard?
Inequality or Gini Index in Hilliard is 0.39.
What is the Total Population of Hilliard?
Total Population of Hilliard is 36,103.
What is the Total Male Population of Hilliard?
Total Male Population of Hilliard is 17,637.
What is the Total Female Population of Hilliard?
Total Female Population of Hilliard is 18,466.
What is the Ratio of Males per 100 Females in Hilliard?
There are 95.51 Males per 100 Females in Hilliard.
What is the Ratio of Females per 100 Males in Hilliard?
There are 104.70 Females per 100 Males in Hilliard.
What is the Median Population Age in Hilliard?
Median Population Age in Hilliard is 36.2 Years.
What is the Average Family Size in Hilliard
Average Family Size in Hilliard is 3.1 People.
What is the Average Household Size in Hilliard
Average Household Size in Hilliard is 2.6 People.
How Large is the Labor Force in Hilliard?
There are 20,853 People in the Labor Forcein in Hilliard.
What is the Percentage of People in the Labor Force in Hilliard?
74.4% of People are in the Labor Force in Hilliard.
What is the Unemployment Rate in Hilliard?
Unemployment Rate in Hilliard is 2.4%.