Forest City, IA Map & Demographics
Forest City Map
Forest City Overview
$31,414
PER CAPITA INCOME
$77,105
AVG FAMILY INCOME
$58,060
AVG HOUSEHOLD INCOME
9.5%
WAGE / INCOME GAP [ % ]
90.5¢/ $1
WAGE / INCOME GAP [ $ ]
0.45
INEQUALITY / GINI INDEX
4,254
TOTAL POPULATION
2,203
MALE POPULATION
2,051
FEMALE POPULATION
107.41
MALES / 100 FEMALES
93.10
FEMALES / 100 MALES
31.7
MEDIAN AGE
3.1
AVG FAMILY SIZE
2.3
AVG HOUSEHOLD SIZE
2,291
LABOR FORCE [ PEOPLE ]
67.0%
PERCENT IN LABOR FORCE
2.4%
UNEMPLOYMENT RATE
Forest City Zip Codes
Forest City Area Codes
Income in Forest City
Income Overview in Forest City
Per Capita Income in Forest City is $31,414, while median incomes of families and households are $77,105 and $58,060 respectively.
| Characteristic | Number | Measure |
| Per Capita Income | 4,254 | $31,414 |
| Median Family Income | 924 | $77,105 |
| Mean Family Income | 924 | $111,001 |
| Median Household Income | 1,580 | $58,060 |
| Mean Household Income | 1,580 | $83,501 |
| Income Deficit | 924 | $0 |
| Wage / Income Gap (%) | 4,254 | 9.55% |
| Wage / Income Gap ($) | 4,254 | 90.45¢ per $1 |
| Gini / Inequality Index | 4,254 | 0.45 |
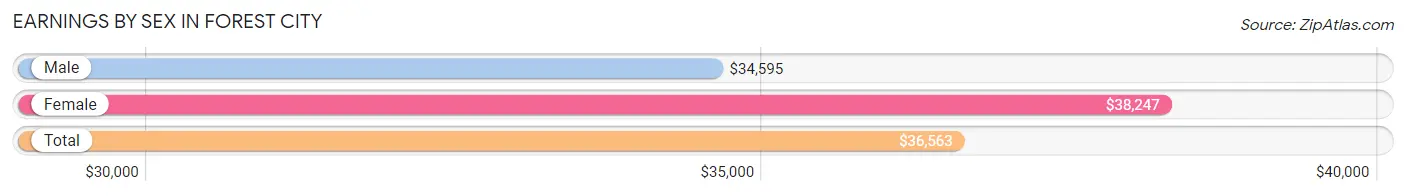
Earnings by Sex in Forest City
Average Earnings in Forest City are $36,563, $34,595 for men and $38,247 for women, a difference of 9.6%.
| Sex | Number | Average Earnings |
| Male | 1,354 (54.7%) | $34,595 |
| Female | 1,123 (45.3%) | $38,247 |
| Total | 2,477 (100.0%) | $36,563 |
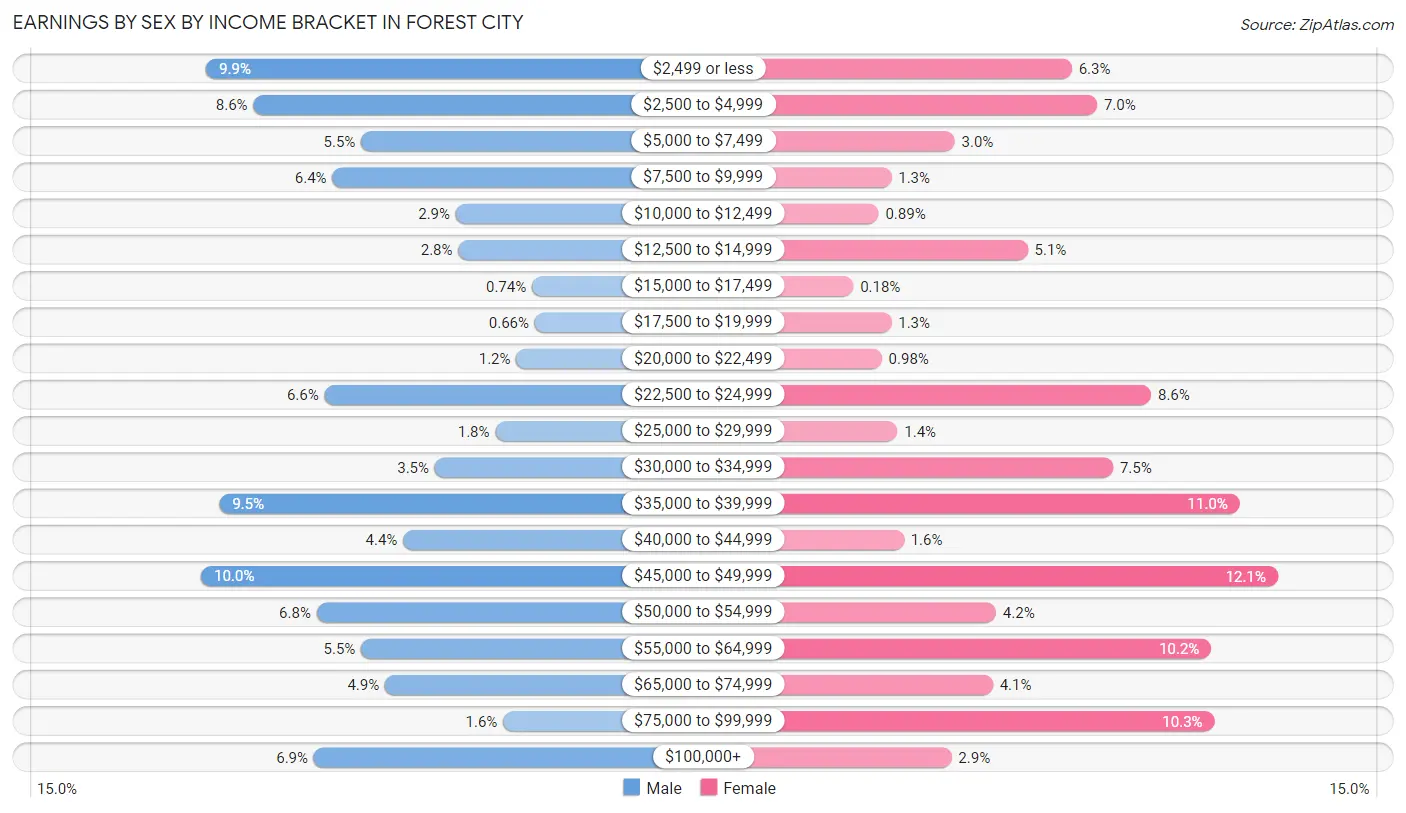
Earnings by Sex by Income Bracket in Forest City
The most common earnings brackets in Forest City are $45,000 to $49,999 for men (136 | 10.0%) and $45,000 to $49,999 for women (136 | 12.1%).
| Income | Male | Female |
| $2,499 or less | 134 (9.9%) | 71 (6.3%) |
| $2,500 to $4,999 | 116 (8.6%) | 79 (7.0%) |
| $5,000 to $7,499 | 75 (5.5%) | 34 (3.0%) |
| $7,500 to $9,999 | 86 (6.4%) | 14 (1.3%) |
| $10,000 to $12,499 | 39 (2.9%) | 10 (0.9%) |
| $12,500 to $14,999 | 38 (2.8%) | 57 (5.1%) |
| $15,000 to $17,499 | 10 (0.7%) | 2 (0.2%) |
| $17,500 to $19,999 | 9 (0.7%) | 14 (1.3%) |
| $20,000 to $22,499 | 16 (1.2%) | 11 (1.0%) |
| $22,500 to $24,999 | 89 (6.6%) | 96 (8.6%) |
| $25,000 to $29,999 | 24 (1.8%) | 16 (1.4%) |
| $30,000 to $34,999 | 47 (3.5%) | 84 (7.5%) |
| $35,000 to $39,999 | 129 (9.5%) | 124 (11.0%) |
| $40,000 to $44,999 | 59 (4.4%) | 18 (1.6%) |
| $45,000 to $49,999 | 136 (10.0%) | 136 (12.1%) |
| $50,000 to $54,999 | 92 (6.8%) | 47 (4.2%) |
| $55,000 to $64,999 | 75 (5.5%) | 115 (10.2%) |
| $65,000 to $74,999 | 66 (4.9%) | 46 (4.1%) |
| $75,000 to $99,999 | 21 (1.5%) | 116 (10.3%) |
| $100,000+ | 93 (6.9%) | 33 (2.9%) |
| Total | 1,354 (100.0%) | 1,123 (100.0%) |
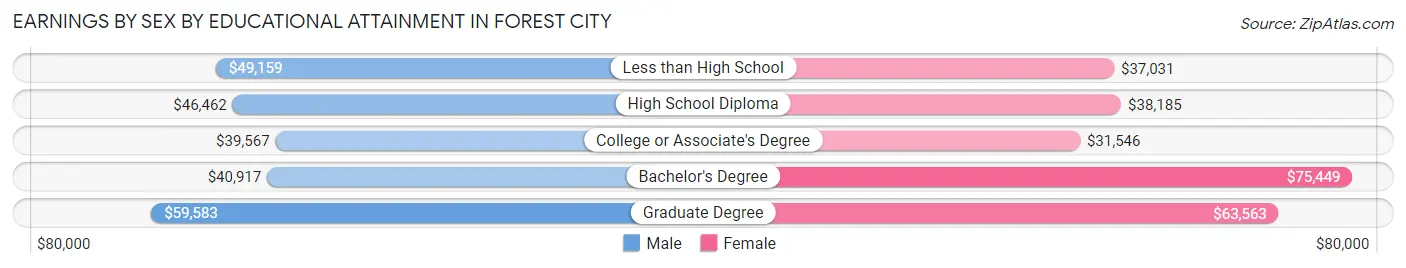
Earnings by Sex by Educational Attainment in Forest City
Average earnings in Forest City are $46,712 for men and $39,358 for women, a difference of 15.7%. Men with an educational attainment of graduate degree enjoy the highest average annual earnings of $59,583, while those with college or associate's degree education earn the least with $39,567. Women with an educational attainment of bachelor's degree earn the most with the average annual earnings of $75,449, while those with college or associate's degree education have the smallest earnings of $31,546.
| Educational Attainment | Male Income | Female Income |
| Less than High School | $49,159 | $37,031 |
| High School Diploma | $46,462 | $38,185 |
| College or Associate's Degree | $39,567 | $31,546 |
| Bachelor's Degree | $40,917 | $75,449 |
| Graduate Degree | $59,583 | $63,563 |
| Total | $46,712 | $39,358 |
Family Income in Forest City
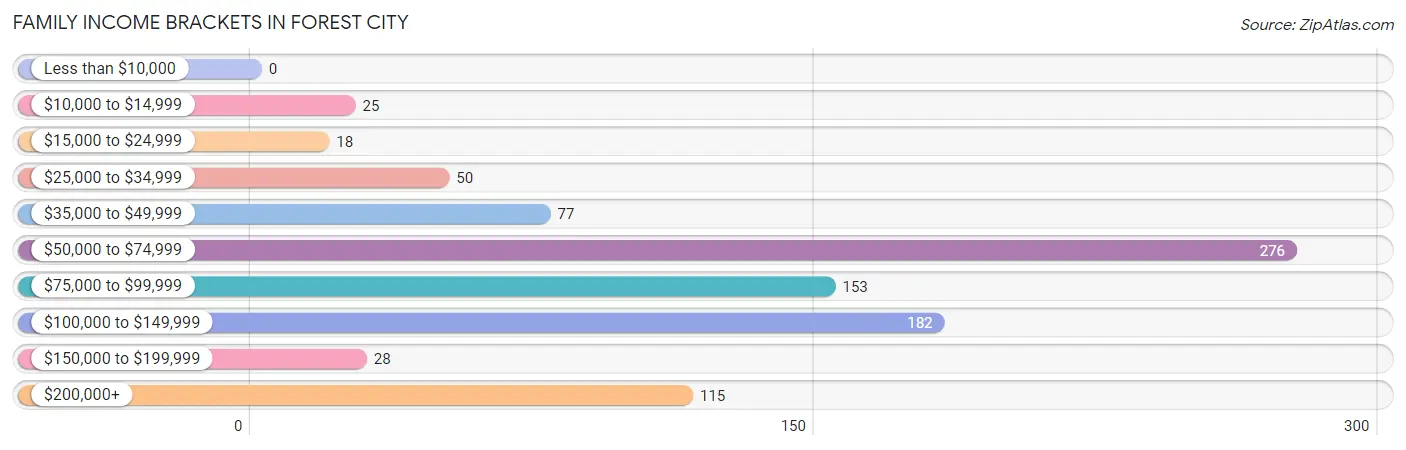
Family Income Brackets in Forest City
According to the Forest City family income data, there are 276 families falling into the $50,000 to $74,999 income range, which is the most common income bracket and makes up 29.9% of all families.
| Income Bracket | # Families | % Families |
| Less than $10,000 | 0 | 0.0% |
| $10,000 to $14,999 | 25 | 2.7% |
| $15,000 to $24,999 | 18 | 1.9% |
| $25,000 to $34,999 | 50 | 5.4% |
| $35,000 to $49,999 | 77 | 8.3% |
| $50,000 to $74,999 | 276 | 29.9% |
| $75,000 to $99,999 | 153 | 16.6% |
| $100,000 to $149,999 | 182 | 19.7% |
| $150,000 to $199,999 | 28 | 3.0% |
| $200,000+ | 115 | 12.4% |
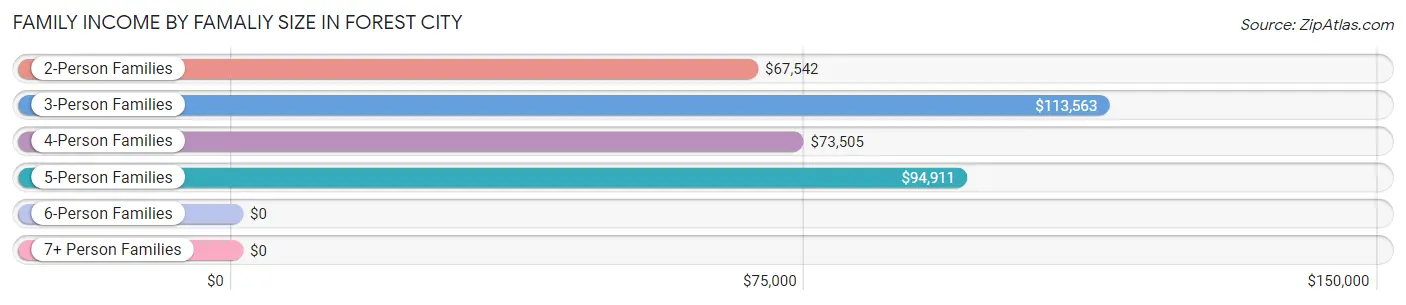
Family Income by Famaliy Size in Forest City
3-person families (227 | 24.6%) account for the highest median family income in Forest City with $113,563 per family, while 3-person families (227 | 24.6%) have the highest median income of $37,854 per family member.
| Income Bracket | # Families | Median Income |
| 2-Person Families | 379 (41.0%) | $67,542 |
| 3-Person Families | 227 (24.6%) | $113,563 |
| 4-Person Families | 217 (23.5%) | $73,505 |
| 5-Person Families | 77 (8.3%) | $94,911 |
| 6-Person Families | 16 (1.7%) | $0 |
| 7+ Person Families | 8 (0.9%) | $0 |
| Total | 924 (100.0%) | $77,105 |
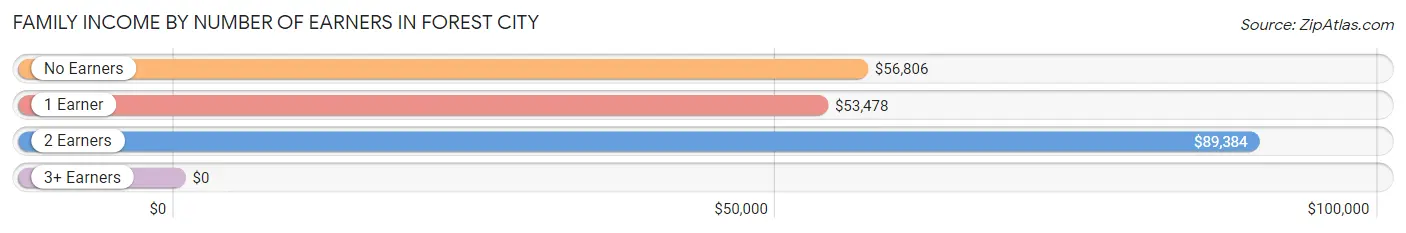
Family Income by Number of Earners in Forest City
| Number of Earners | # Families | Median Income |
| No Earners | 79 (8.6%) | $56,806 |
| 1 Earner | 208 (22.5%) | $53,478 |
| 2 Earners | 506 (54.8%) | $89,384 |
| 3+ Earners | 131 (14.2%) | $0 |
| Total | 924 (100.0%) | $77,105 |
Household Income in Forest City
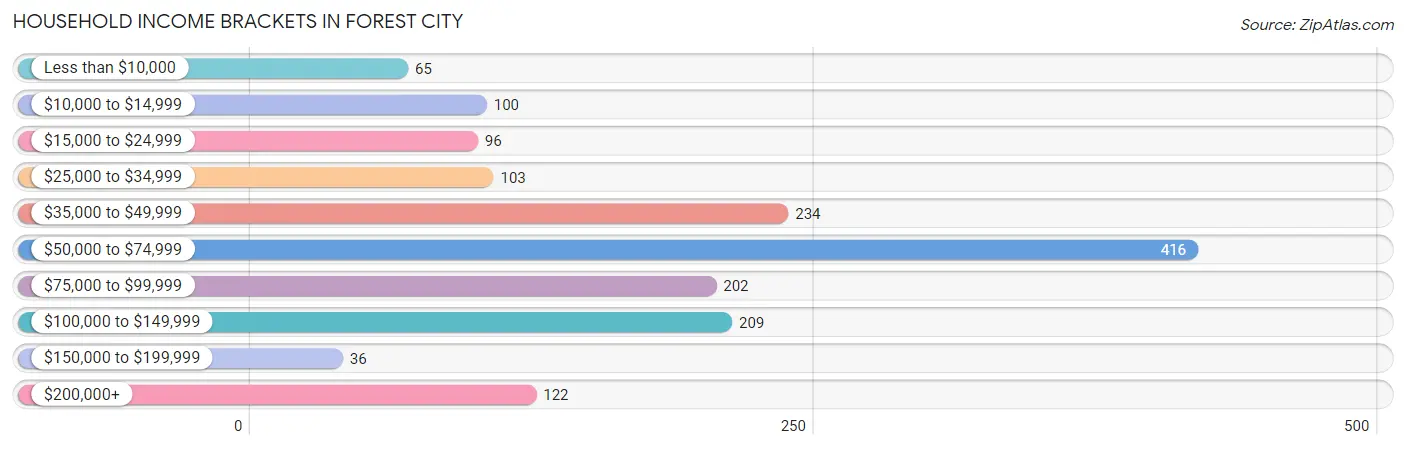
Household Income Brackets in Forest City
With 416 households falling in the category, the $50,000 to $74,999 income range is the most frequent in Forest City, accounting for 26.3% of all households. In contrast, only 36 households (2.3%) fall into the $150,000 to $199,999 income bracket, making it the least populous group.
| Income Bracket | # Households | % Households |
| Less than $10,000 | 65 | 4.1% |
| $10,000 to $14,999 | 100 | 6.3% |
| $15,000 to $24,999 | 96 | 6.1% |
| $25,000 to $34,999 | 103 | 6.5% |
| $35,000 to $49,999 | 234 | 14.8% |
| $50,000 to $74,999 | 416 | 26.3% |
| $75,000 to $99,999 | 202 | 12.8% |
| $100,000 to $149,999 | 209 | 13.2% |
| $150,000 to $199,999 | 36 | 2.3% |
| $200,000+ | 122 | 7.7% |
Household Income by Householder Age in Forest City
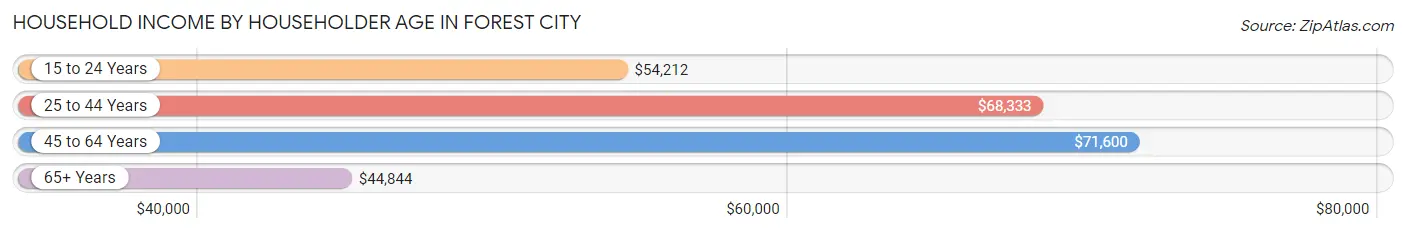
The median household income in Forest City is $58,060, with the highest median household income of $71,600 found in the 45 to 64 years age bracket for the primary householder. A total of 402 households (25.4%) fall into this category. Meanwhile, the 65+ years age bracket for the primary householder has the lowest median household income of $44,844, with 447 households (28.3%) in this group.
| Income Bracket | # Households | Median Income |
| 15 to 24 Years | 139 (8.8%) | $54,212 |
| 25 to 44 Years | 592 (37.5%) | $68,333 |
| 45 to 64 Years | 402 (25.4%) | $71,600 |
| 65+ Years | 447 (28.3%) | $44,844 |
| Total | 1,580 (100.0%) | $58,060 |
Poverty in Forest City
Income Below Poverty by Sex and Age in Forest City
With 7.1% poverty level for males and 8.6% for females among the residents of Forest City, 16 and 17 year old males and 16 and 17 year old females are the most vulnerable to poverty, with 21 males (18.1%) and 14 females (22.6%) in their respective age groups living below the poverty level.
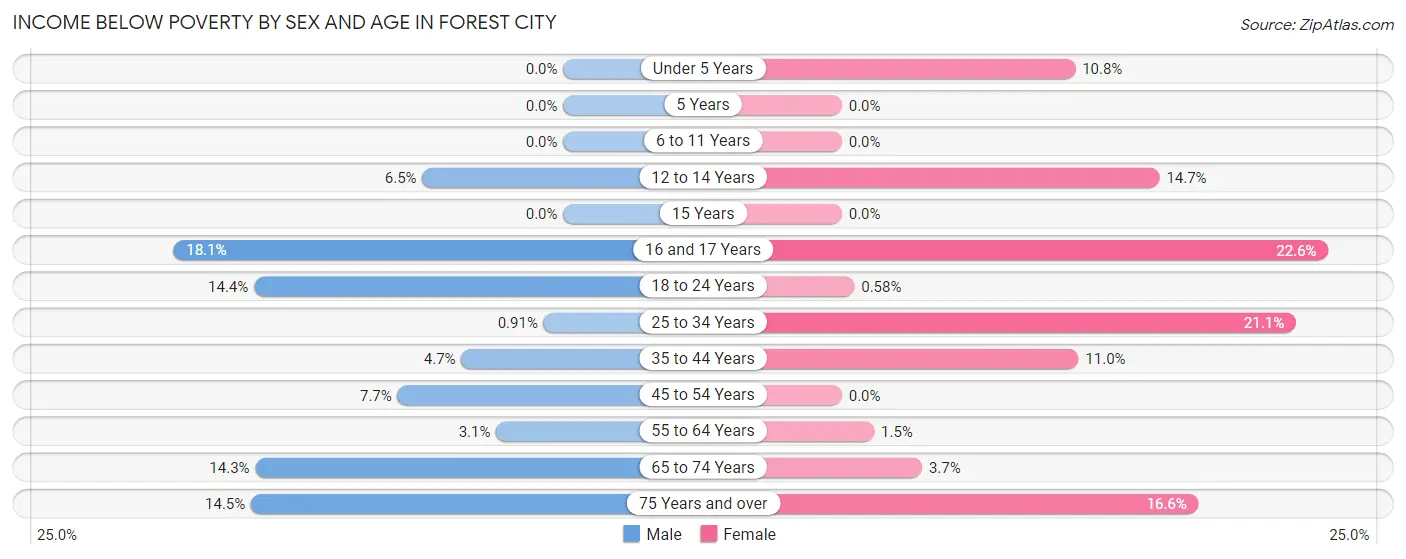
| Age Bracket | Male | Female |
| Under 5 Years | 0 (0.0%) | 13 (10.8%) |
| 5 Years | 0 (0.0%) | 0 (0.0%) |
| 6 to 11 Years | 0 (0.0%) | 0 (0.0%) |
| 12 to 14 Years | 7 (6.5%) | 23 (14.7%) |
| 15 Years | 0 (0.0%) | 0 (0.0%) |
| 16 and 17 Years | 21 (18.1%) | 14 (22.6%) |
| 18 to 24 Years | 31 (14.3%) | 1 (0.6%) |
| 25 to 34 Years | 2 (0.9%) | 39 (21.1%) |
| 35 to 44 Years | 15 (4.7%) | 38 (11.0%) |
| 45 to 54 Years | 8 (7.7%) | 0 (0.0%) |
| 55 to 64 Years | 7 (3.1%) | 2 (1.5%) |
| 65 to 74 Years | 25 (14.3%) | 8 (3.7%) |
| 75 Years and over | 10 (14.5%) | 26 (16.6%) |
| Total | 126 (7.1%) | 164 (8.6%) |
Income Above Poverty by Sex and Age in Forest City
According to the poverty statistics in Forest City, males aged under 5 years and females aged 5 years are the age groups that are most secure financially, with 100.0% of males and 100.0% of females in these age groups living above the poverty line.
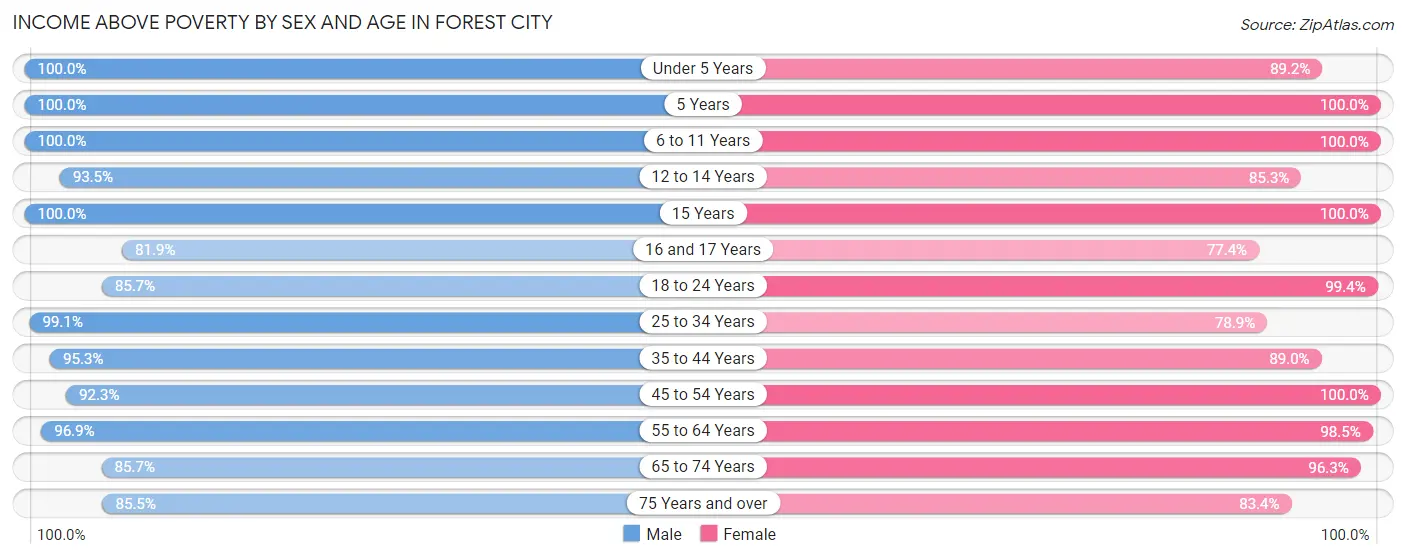
| Age Bracket | Male | Female |
| Under 5 Years | 83 (100.0%) | 107 (89.2%) |
| 5 Years | 42 (100.0%) | 95 (100.0%) |
| 6 to 11 Years | 79 (100.0%) | 97 (100.0%) |
| 12 to 14 Years | 100 (93.5%) | 133 (85.3%) |
| 15 Years | 22 (100.0%) | 34 (100.0%) |
| 16 and 17 Years | 95 (81.9%) | 48 (77.4%) |
| 18 to 24 Years | 185 (85.7%) | 172 (99.4%) |
| 25 to 34 Years | 217 (99.1%) | 146 (78.9%) |
| 35 to 44 Years | 302 (95.3%) | 308 (89.0%) |
| 45 to 54 Years | 96 (92.3%) | 146 (100.0%) |
| 55 to 64 Years | 218 (96.9%) | 131 (98.5%) |
| 65 to 74 Years | 150 (85.7%) | 207 (96.3%) |
| 75 Years and over | 59 (85.5%) | 131 (83.4%) |
| Total | 1,648 (92.9%) | 1,755 (91.4%) |
Income Below Poverty Among Married-Couple Families in Forest City
The poverty statistics for married-couple families in Forest City show that 0.7% or 5 of the total 678 families live below the poverty line. Families with no children have the highest poverty rate of 1.5%, comprising of 5 families. On the other hand, families with 1 or 2 children have the lowest poverty rate of 0.0%, which includes 0 families.
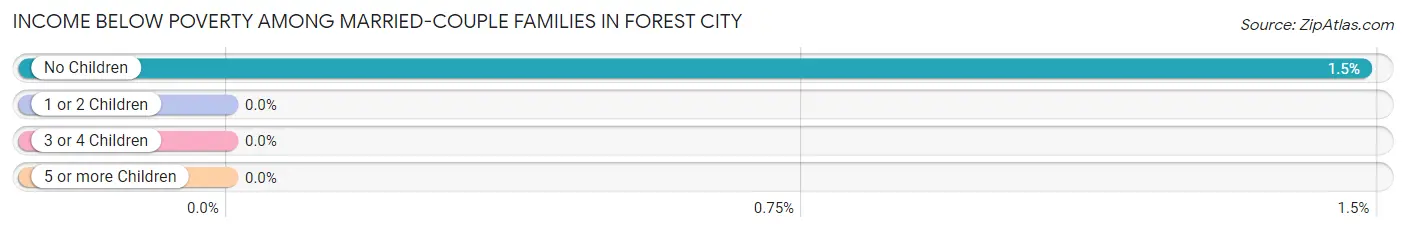
| Children | Above Poverty | Below Poverty |
| No Children | 332 (98.5%) | 5 (1.5%) |
| 1 or 2 Children | 292 (100.0%) | 0 (0.0%) |
| 3 or 4 Children | 49 (100.0%) | 0 (0.0%) |
| 5 or more Children | 0 (0.0%) | 0 (0.0%) |
| Total | 673 (99.3%) | 5 (0.7%) |
Income Below Poverty Among Single-Parent Households in Forest City
According to the poverty data in Forest City, 29.2% or 14 single-father households and 12.1% or 24 single-mother households are living below the poverty line. Among single-father households, those with 3 or 4 children have the highest poverty rate, with 14 households (100.0%) experiencing poverty. Likewise, among single-mother households, those with 1 or 2 children have the highest poverty rate, with 24 households (14.5%) falling below the poverty line.
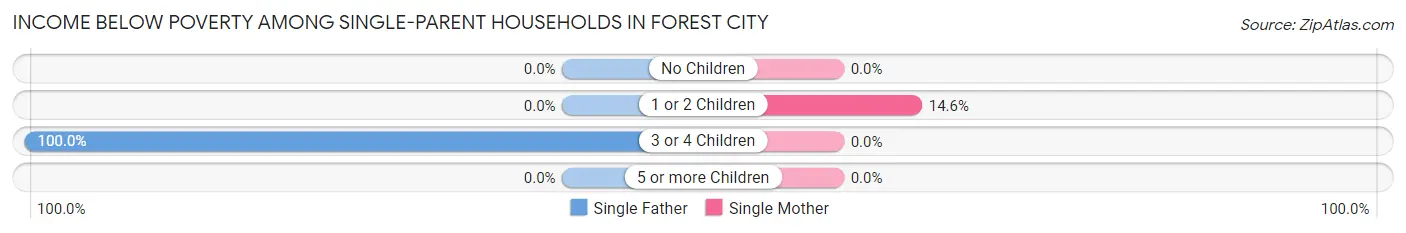
| Children | Single Father | Single Mother |
| No Children | 0 (0.0%) | 0 (0.0%) |
| 1 or 2 Children | 0 (0.0%) | 24 (14.5%) |
| 3 or 4 Children | 14 (100.0%) | 0 (0.0%) |
| 5 or more Children | 0 (0.0%) | 0 (0.0%) |
| Total | 14 (29.2%) | 24 (12.1%) |
Income Below Poverty Among Married-Couple vs Single-Parent Households in Forest City
The poverty data for Forest City shows that 5 of the married-couple family households (0.7%) and 38 of the single-parent households (15.4%) are living below the poverty level. Within the married-couple family households, those with no children have the highest poverty rate, with 5 households (1.5%) falling below the poverty line. Among the single-parent households, those with 3 or 4 children have the highest poverty rate, with 14 household (35.9%) living below poverty.
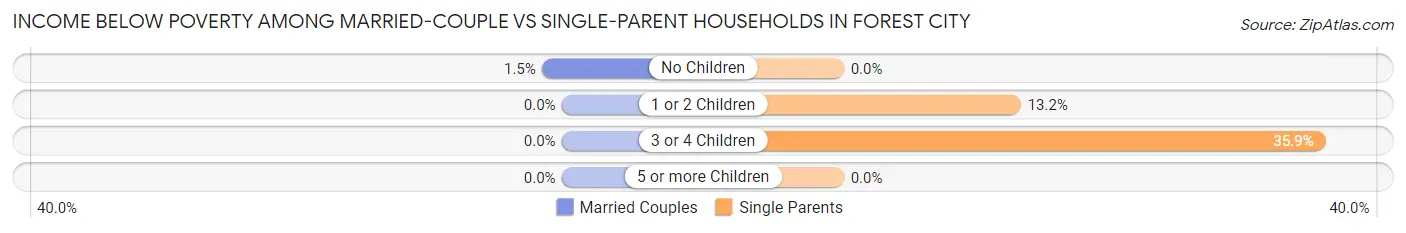
| Children | Married-Couple Families | Single-Parent Households |
| No Children | 5 (1.5%) | 0 (0.0%) |
| 1 or 2 Children | 0 (0.0%) | 24 (13.2%) |
| 3 or 4 Children | 0 (0.0%) | 14 (35.9%) |
| 5 or more Children | 0 (0.0%) | 0 (0.0%) |
| Total | 5 (0.7%) | 38 (15.4%) |
Race in Forest City
The most populous races in Forest City are White / Caucasian (3,734 | 87.8%), Asian (317 | 7.4%), and Hispanic or Latino (192 | 4.5%).
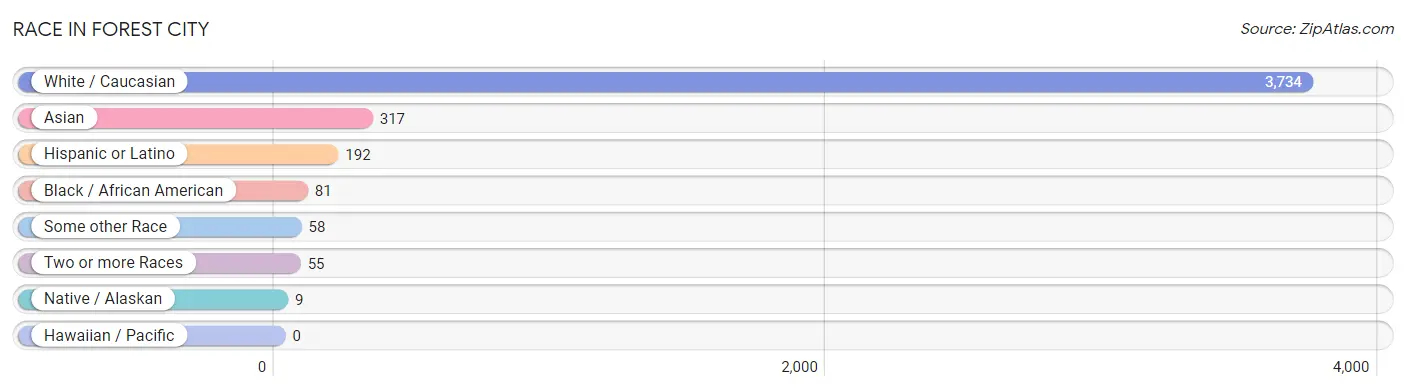
| Race | # Population | % Population |
| Asian | 317 | 7.4% |
| Black / African American | 81 | 1.9% |
| Hawaiian / Pacific | 0 | 0.0% |
| Hispanic or Latino | 192 | 4.5% |
| Native / Alaskan | 9 | 0.2% |
| White / Caucasian | 3,734 | 87.8% |
| Two or more Races | 55 | 1.3% |
| Some other Race | 58 | 1.4% |
| Total | 4,254 | 100.0% |
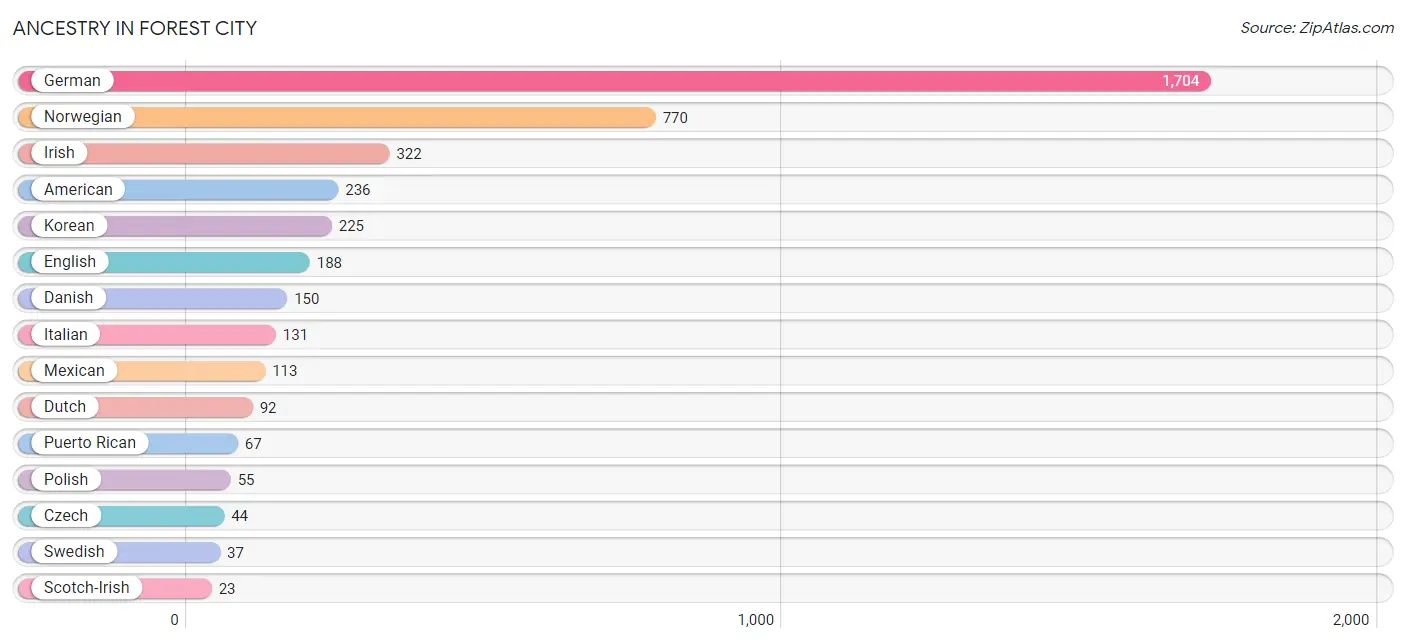
Ancestry in Forest City
The most populous ancestries reported in Forest City are German (1,704 | 40.1%), Norwegian (770 | 18.1%), Irish (322 | 7.6%), American (236 | 5.6%), and Korean (225 | 5.3%), together accounting for 76.6% of all Forest City residents.
| Ancestry | # Population | % Population |
| American | 236 | 5.6% |
| Austrian | 15 | 0.4% |
| British | 12 | 0.3% |
| Burmese | 4 | 0.1% |
| Croatian | 7 | 0.2% |
| Czech | 44 | 1.0% |
| Danish | 150 | 3.5% |
| Dutch | 92 | 2.2% |
| English | 188 | 4.4% |
| European | 8 | 0.2% |
| German | 1,704 | 40.1% |
| Greek | 5 | 0.1% |
| Haitian | 10 | 0.2% |
| Hungarian | 22 | 0.5% |
| Indian (Asian) | 9 | 0.2% |
| Irish | 322 | 7.6% |
| Italian | 131 | 3.1% |
| Korean | 225 | 5.3% |
| Mexican | 113 | 2.7% |
| Norwegian | 770 | 18.1% |
| Polish | 55 | 1.3% |
| Puerto Rican | 67 | 1.6% |
| Scandinavian | 20 | 0.5% |
| Scotch-Irish | 23 | 0.5% |
| Scottish | 15 | 0.4% |
| Sri Lankan | 10 | 0.2% |
| Swedish | 37 | 0.9% |
| Ukrainian | 6 | 0.1% |
| Welsh | 22 | 0.5% |
| Yugoslavian | 9 | 0.2% | View All 30 Rows |
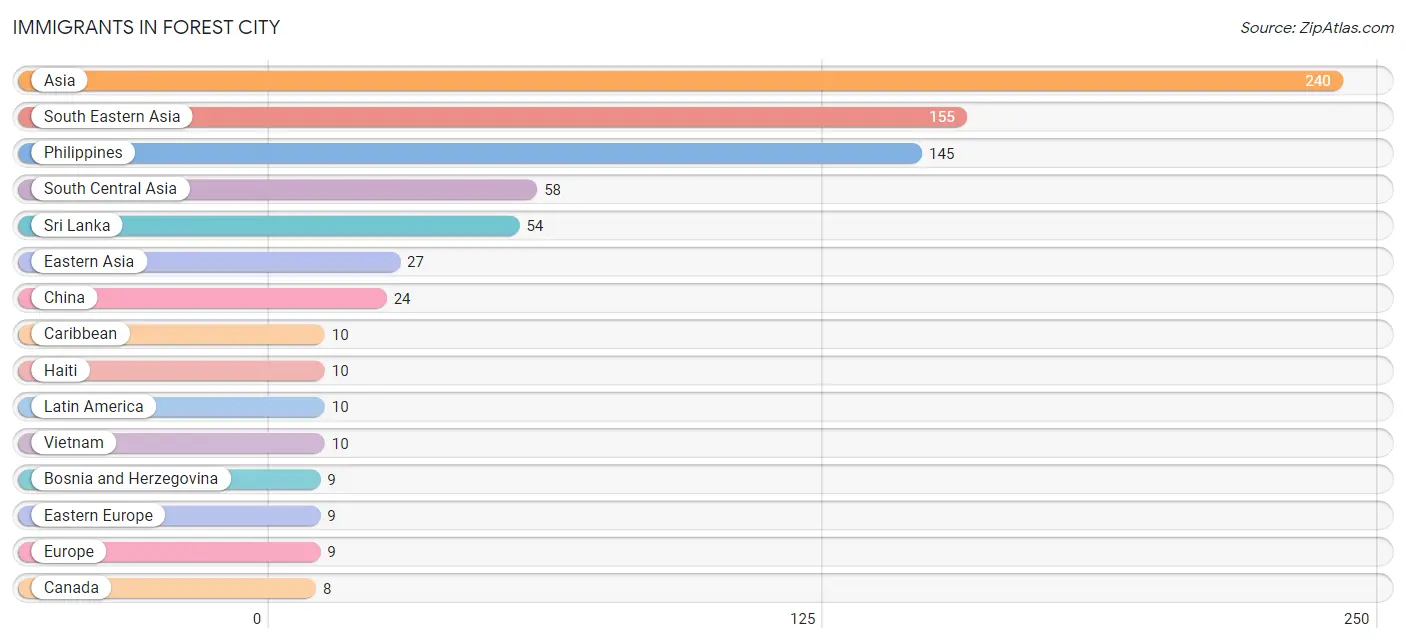
Immigrants in Forest City
The most numerous immigrant groups reported in Forest City came from Asia (240 | 5.6%), South Eastern Asia (155 | 3.6%), Philippines (145 | 3.4%), South Central Asia (58 | 1.4%), and Sri Lanka (54 | 1.3%), together accounting for 15.3% of all Forest City residents.
| Immigration Origin | # Population | % Population |
| Asia | 240 | 5.6% |
| Australia | 2 | 0.1% |
| Bosnia and Herzegovina | 9 | 0.2% |
| Canada | 8 | 0.2% |
| Caribbean | 10 | 0.2% |
| China | 24 | 0.6% |
| Eastern Asia | 27 | 0.6% |
| Eastern Europe | 9 | 0.2% |
| Europe | 9 | 0.2% |
| Haiti | 10 | 0.2% |
| Latin America | 10 | 0.2% |
| Nepal | 4 | 0.1% |
| Oceania | 2 | 0.1% |
| Philippines | 145 | 3.4% |
| South Central Asia | 58 | 1.4% |
| South Eastern Asia | 155 | 3.6% |
| Sri Lanka | 54 | 1.3% |
| Vietnam | 10 | 0.2% | View All 18 Rows |
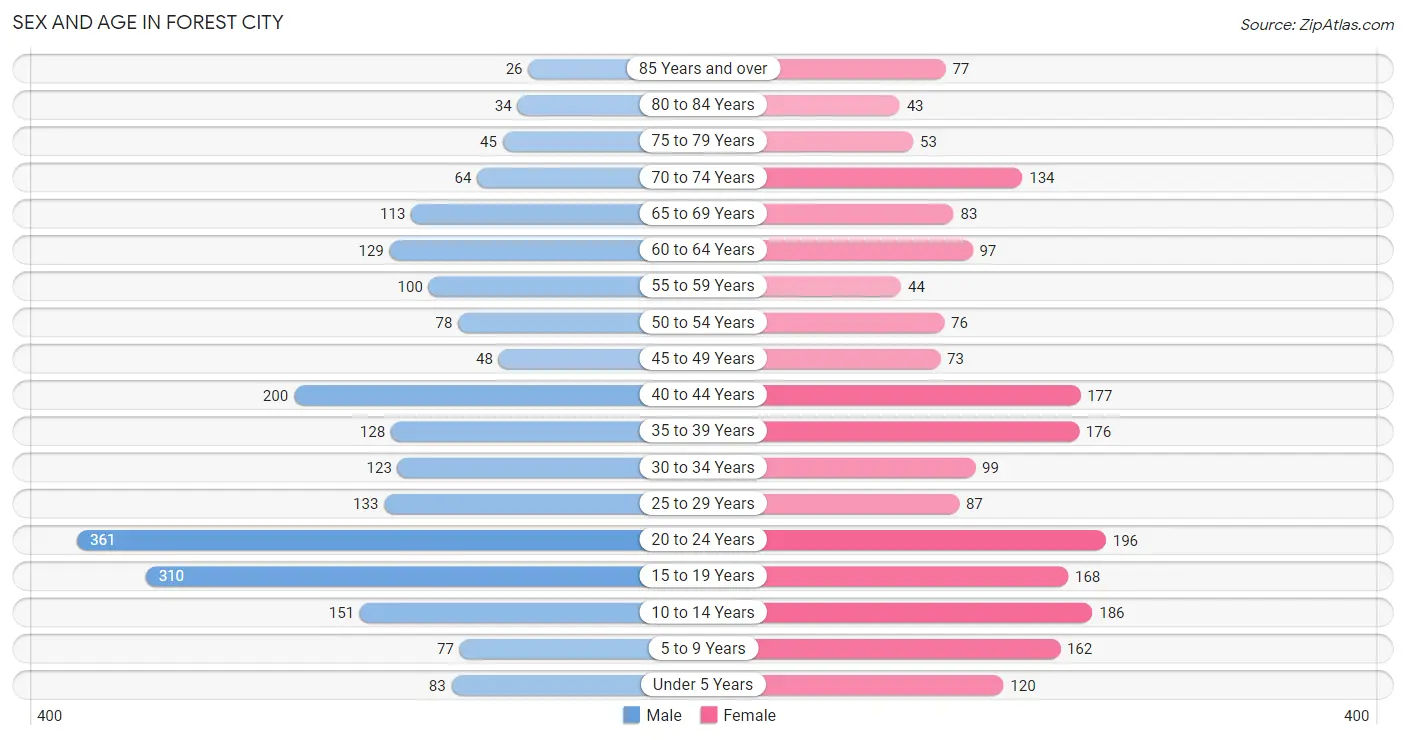
Sex and Age in Forest City
Sex and Age in Forest City
The most populous age groups in Forest City are 20 to 24 Years (361 | 16.4%) for men and 20 to 24 Years (196 | 9.6%) for women.
| Age Bracket | Male | Female |
| Under 5 Years | 83 (3.8%) | 120 (5.9%) |
| 5 to 9 Years | 77 (3.5%) | 162 (7.9%) |
| 10 to 14 Years | 151 (6.9%) | 186 (9.1%) |
| 15 to 19 Years | 310 (14.1%) | 168 (8.2%) |
| 20 to 24 Years | 361 (16.4%) | 196 (9.6%) |
| 25 to 29 Years | 133 (6.0%) | 87 (4.2%) |
| 30 to 34 Years | 123 (5.6%) | 99 (4.8%) |
| 35 to 39 Years | 128 (5.8%) | 176 (8.6%) |
| 40 to 44 Years | 200 (9.1%) | 177 (8.6%) |
| 45 to 49 Years | 48 (2.2%) | 73 (3.6%) |
| 50 to 54 Years | 78 (3.5%) | 76 (3.7%) |
| 55 to 59 Years | 100 (4.5%) | 44 (2.1%) |
| 60 to 64 Years | 129 (5.9%) | 97 (4.7%) |
| 65 to 69 Years | 113 (5.1%) | 83 (4.1%) |
| 70 to 74 Years | 64 (2.9%) | 134 (6.5%) |
| 75 to 79 Years | 45 (2.0%) | 53 (2.6%) |
| 80 to 84 Years | 34 (1.5%) | 43 (2.1%) |
| 85 Years and over | 26 (1.2%) | 77 (3.7%) |
| Total | 2,203 (100.0%) | 2,051 (100.0%) |
Families and Households in Forest City
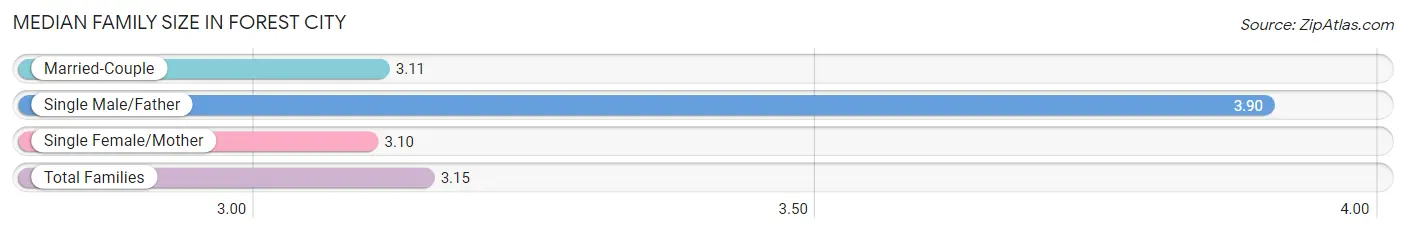
Median Family Size in Forest City
The median family size in Forest City is 3.15 persons per family, with single male/father families (48 | 5.2%) accounting for the largest median family size of 3.9 persons per family. On the other hand, single female/mother families (198 | 21.4%) represent the smallest median family size with 3.10 persons per family.
| Family Type | # Families | Family Size |
| Married-Couple | 678 (73.4%) | 3.11 |
| Single Male/Father | 48 (5.2%) | 3.90 |
| Single Female/Mother | 198 (21.4%) | 3.10 |
| Total Families | 924 (100.0%) | 3.15 |
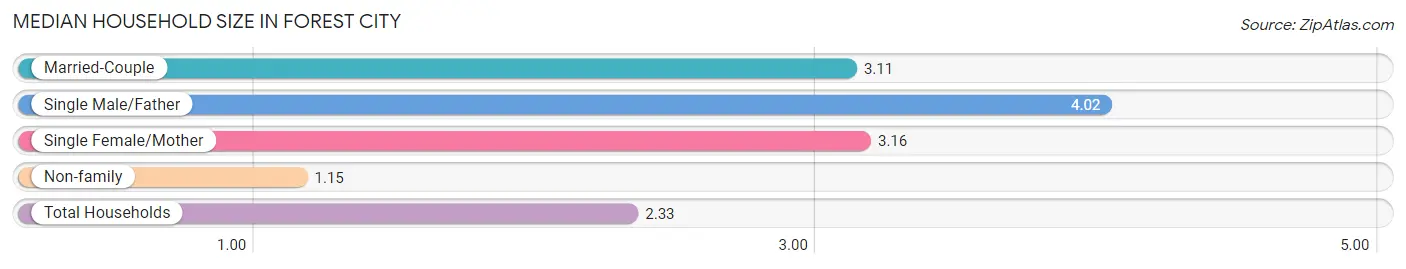
Median Household Size in Forest City
The median household size in Forest City is 2.33 persons per household, with single male/father households (48 | 3.0%) accounting for the largest median household size of 4.02 persons per household. non-family households (656 | 41.5%) represent the smallest median household size with 1.15 persons per household.
| Household Type | # Households | Household Size |
| Married-Couple | 678 (42.9%) | 3.11 |
| Single Male/Father | 48 (3.0%) | 4.02 |
| Single Female/Mother | 198 (12.5%) | 3.16 |
| Non-family | 656 (41.5%) | 1.15 |
| Total Households | 1,580 (100.0%) | 2.33 |
Household Size by Marriage Status in Forest City
Out of a total of 1,580 households in Forest City, 924 (58.5%) are family households, while 656 (41.5%) are nonfamily households. The most numerous type of family households are 2-person households, comprising 379, and the most common type of nonfamily households are 1-person households, comprising 564.
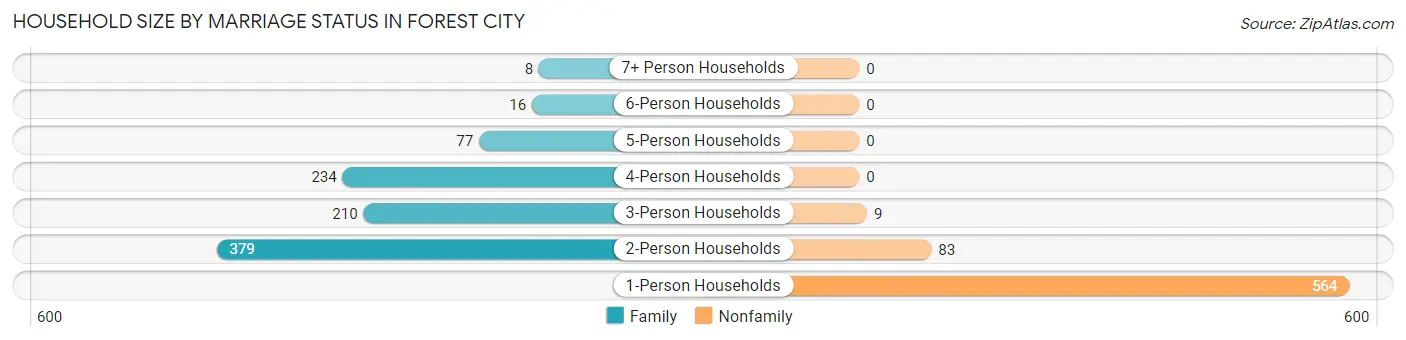
| Household Size | Family Households | Nonfamily Households |
| 1-Person Households | - | 564 (35.7%) |
| 2-Person Households | 379 (24.0%) | 83 (5.2%) |
| 3-Person Households | 210 (13.3%) | 9 (0.6%) |
| 4-Person Households | 234 (14.8%) | 0 (0.0%) |
| 5-Person Households | 77 (4.9%) | 0 (0.0%) |
| 6-Person Households | 16 (1.0%) | 0 (0.0%) |
| 7+ Person Households | 8 (0.5%) | 0 (0.0%) |
| Total | 924 (58.5%) | 656 (41.5%) |
Female Fertility in Forest City
Fertility by Age in Forest City
Average fertility rate in Forest City is 73.0 births per 1,000 women. Women in the age bracket of 20 to 34 years have the highest fertility rate with 147.0 births per 1,000 women. Women in the age bracket of 20 to 34 years acount for 78.9% of all women with births.
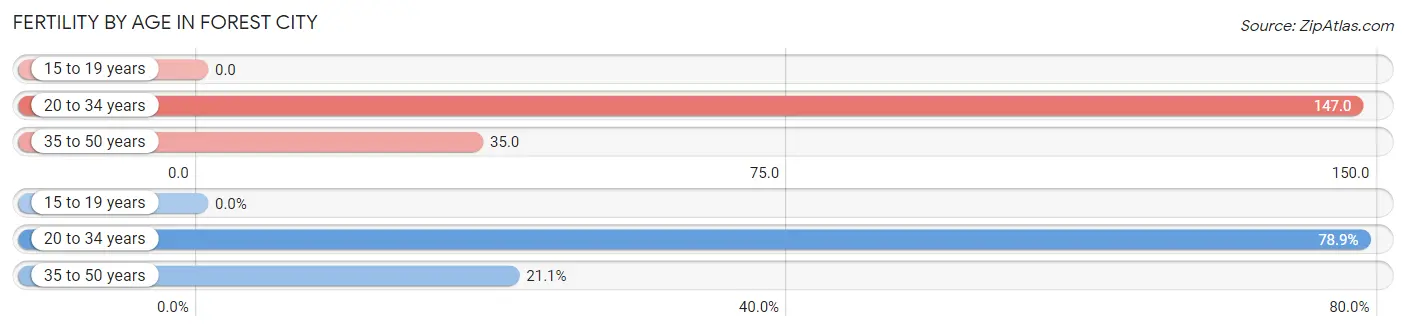
| Age Bracket | Women with Births | Births / 1,000 Women |
| 15 to 19 years | 0 (0.0%) | 0.0 |
| 20 to 34 years | 56 (78.9%) | 147.0 |
| 35 to 50 years | 15 (21.1%) | 35.0 |
| Total | 71 (100.0%) | 73.0 |
Fertility by Age by Marriage Status in Forest City
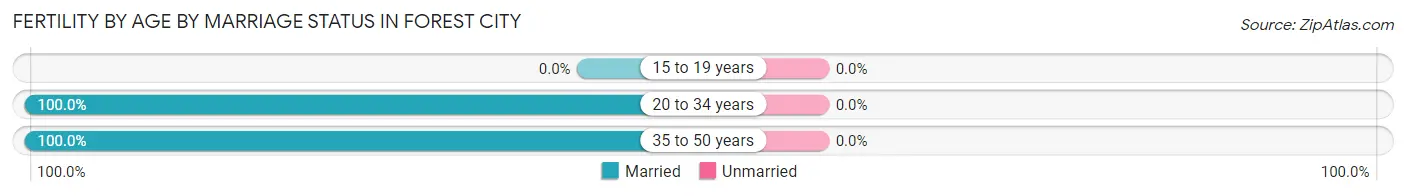
| Age Bracket | Married | Unmarried |
| 15 to 19 years | 0 (0.0%) | 0 (0.0%) |
| 20 to 34 years | 56 (100.0%) | 0 (0.0%) |
| 35 to 50 years | 15 (100.0%) | 0 (0.0%) |
| Total | 71 (100.0%) | 0 (0.0%) |
Fertility by Education in Forest City
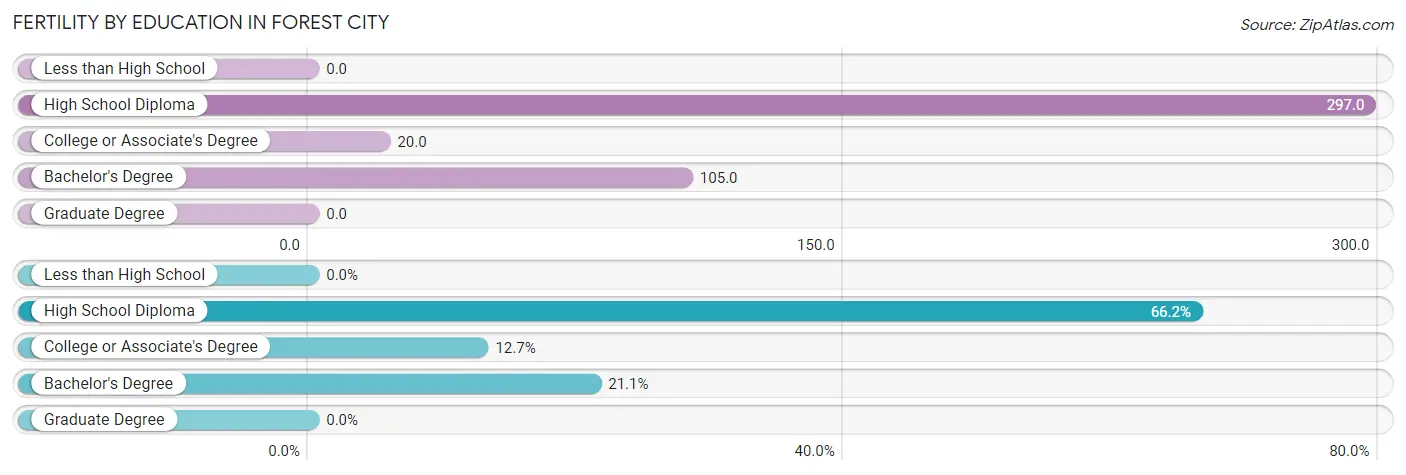
| Educational Attainment | Women with Births | Births / 1,000 Women |
| Less than High School | 0 (0.0%) | 0.0 |
| High School Diploma | 47 (66.2%) | 297.0 |
| College or Associate's Degree | 9 (12.7%) | 20.0 |
| Bachelor's Degree | 15 (21.1%) | 105.0 |
| Graduate Degree | 0 (0.0%) | 0.0 |
| Total | 71 (100.0%) | 73.0 |
Fertility by Education by Marriage Status in Forest City
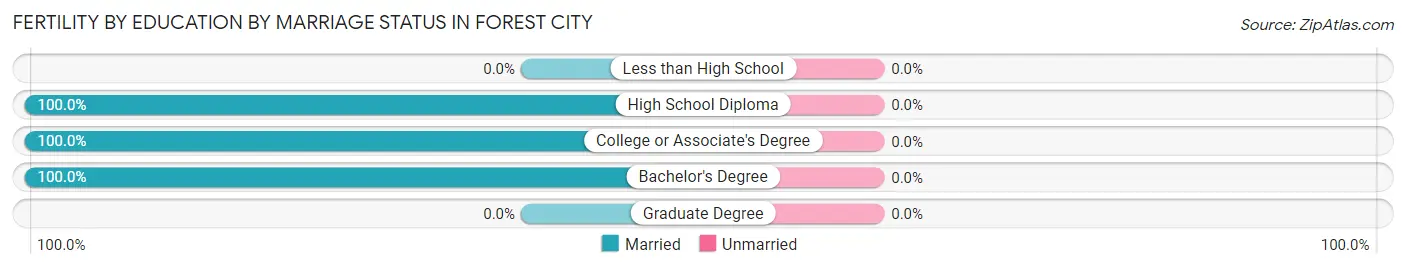
| Educational Attainment | Married | Unmarried |
| Less than High School | 0 (0.0%) | 0 (0.0%) |
| High School Diploma | 47 (100.0%) | 0 (0.0%) |
| College or Associate's Degree | 9 (100.0%) | 0 (0.0%) |
| Bachelor's Degree | 15 (100.0%) | 0 (0.0%) |
| Graduate Degree | 0 (0.0%) | 0 (0.0%) |
| Total | 71 (100.0%) | 0 (0.0%) |
Employment Characteristics in Forest City
Employment by Class of Employer in Forest City
Among the 2,181 employed individuals in Forest City, private company employees (1,535 | 70.4%), not-for-profit organizations (244 | 11.2%), and self-employed (not incorporated) (162 | 7.4%) make up the most common classes of employment.
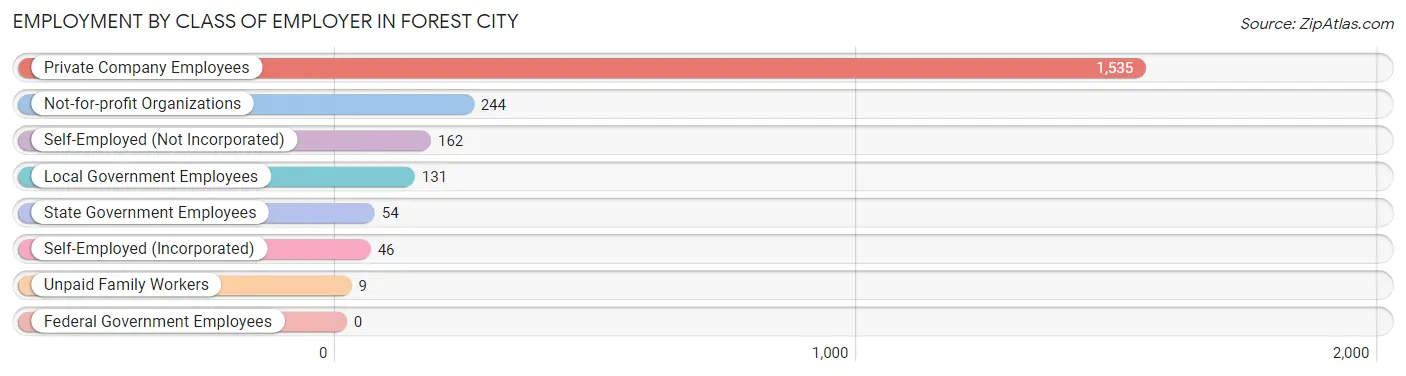
| Employer Class | # Employees | % Employees |
| Private Company Employees | 1,535 | 70.4% |
| Self-Employed (Incorporated) | 46 | 2.1% |
| Self-Employed (Not Incorporated) | 162 | 7.4% |
| Not-for-profit Organizations | 244 | 11.2% |
| Local Government Employees | 131 | 6.0% |
| State Government Employees | 54 | 2.5% |
| Federal Government Employees | 0 | 0.0% |
| Unpaid Family Workers | 9 | 0.4% |
| Total | 2,181 | 100.0% |
Employment Status by Age in Forest City
According to the labor force statistics for Forest City, out of the total population over 16 years of age (3,419), 67.0% or 2,291 individuals are in the labor force, with 2.4% or 55 of them unemployed. The age group with the highest labor force participation rate is 60 to 64 years, with 91.6% or 207 individuals in the labor force. Within the labor force, the 20 to 24 years age range has the highest percentage of unemployed individuals, with 7.5% or 33 of them being unemployed.
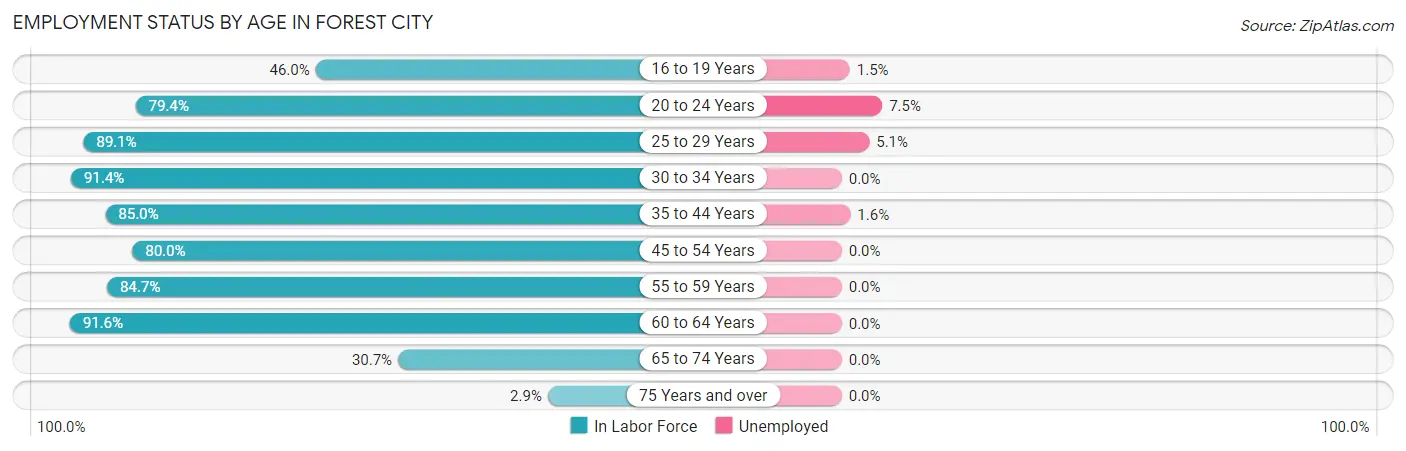
| Age Bracket | In Labor Force | Unemployed |
| 16 to 19 Years | 194 (46.0%) | 3 (1.5%) |
| 20 to 24 Years | 442 (79.4%) | 33 (7.5%) |
| 25 to 29 Years | 196 (89.1%) | 10 (5.1%) |
| 30 to 34 Years | 203 (91.4%) | 0 (0.0%) |
| 35 to 44 Years | 579 (85.0%) | 9 (1.6%) |
| 45 to 54 Years | 220 (80.0%) | 0 (0.0%) |
| 55 to 59 Years | 122 (84.7%) | 0 (0.0%) |
| 60 to 64 Years | 207 (91.6%) | 0 (0.0%) |
| 65 to 74 Years | 121 (30.7%) | 0 (0.0%) |
| 75 Years and over | 8 (2.9%) | 0 (0.0%) |
| Total | 2,291 (67.0%) | 55 (2.4%) |
Employment Status by Educational Attainment in Forest City
According to labor force statistics for Forest City, 86.4% of individuals (1,528) out of the total population between 25 and 64 years of age (1,768) are in the labor force, with 1.2% or 18 of them being unemployed. The group with the highest labor force participation rate are those with the educational attainment of less than high school, with 100.0% or 123 individuals in the labor force. Within the labor force, individuals with high school diploma education have the highest percentage of unemployment, with 4.6% or 19 of them being unemployed.
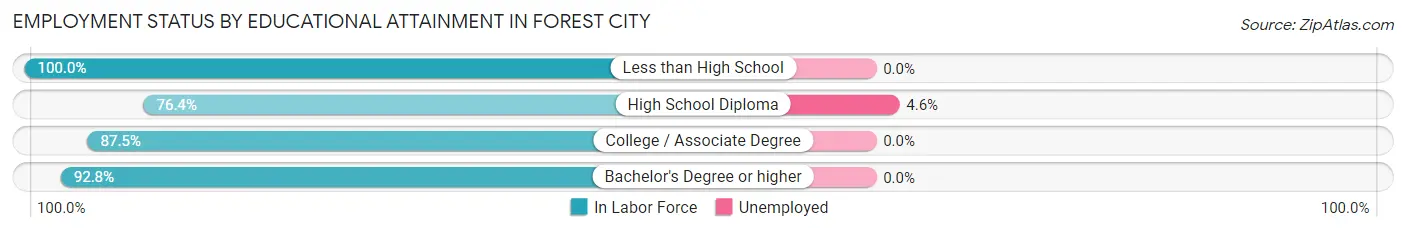
| Educational Attainment | In Labor Force | Unemployed |
| Less than High School | 123 (100.0%) | 0 (0.0%) |
| High School Diploma | 415 (76.4%) | 25 (4.6%) |
| College / Associate Degree | 562 (87.5%) | 0 (0.0%) |
| Bachelor's Degree or higher | 427 (92.8%) | 0 (0.0%) |
| Total | 1,528 (86.4%) | 21 (1.2%) |
Employment Occupations by Sex in Forest City
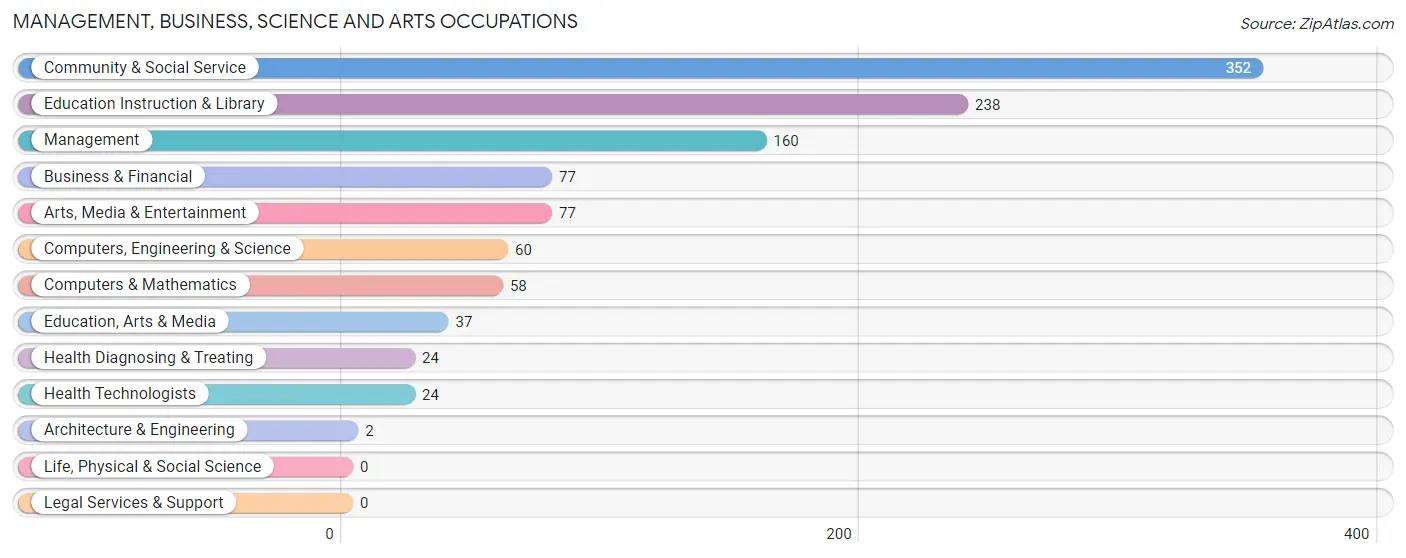
Management, Business, Science and Arts Occupations
The most common Management, Business, Science and Arts occupations in Forest City are Community & Social Service (352 | 15.7%), Education Instruction & Library (238 | 10.6%), Management (160 | 7.1%), Business & Financial (77 | 3.4%), and Arts, Media & Entertainment (77 | 3.4%).
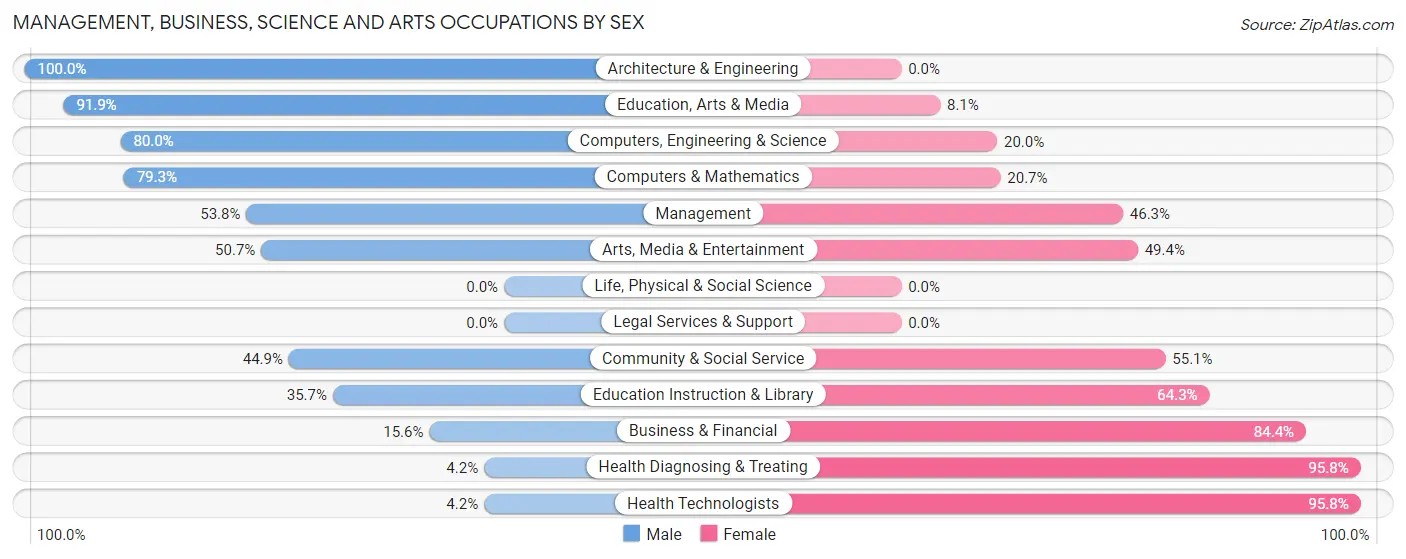
Management, Business, Science and Arts Occupations by Sex
Within the Management, Business, Science and Arts occupations in Forest City, the most male-oriented occupations are Architecture & Engineering (100.0%), Education, Arts & Media (91.9%), and Computers, Engineering & Science (80.0%), while the most female-oriented occupations are Health Diagnosing & Treating (95.8%), Health Technologists (95.8%), and Business & Financial (84.4%).
| Occupation | Male | Female |
| Management | 86 (53.7%) | 74 (46.3%) |
| Business & Financial | 12 (15.6%) | 65 (84.4%) |
| Computers, Engineering & Science | 48 (80.0%) | 12 (20.0%) |
| Computers & Mathematics | 46 (79.3%) | 12 (20.7%) |
| Architecture & Engineering | 2 (100.0%) | 0 (0.0%) |
| Life, Physical & Social Science | 0 (0.0%) | 0 (0.0%) |
| Community & Social Service | 158 (44.9%) | 194 (55.1%) |
| Education, Arts & Media | 34 (91.9%) | 3 (8.1%) |
| Legal Services & Support | 0 (0.0%) | 0 (0.0%) |
| Education Instruction & Library | 85 (35.7%) | 153 (64.3%) |
| Arts, Media & Entertainment | 39 (50.6%) | 38 (49.3%) |
| Health Diagnosing & Treating | 1 (4.2%) | 23 (95.8%) |
| Health Technologists | 1 (4.2%) | 23 (95.8%) |
| Total (Category) | 305 (45.3%) | 368 (54.7%) |
| Total (Overall) | 1,171 (52.3%) | 1,066 (47.6%) |
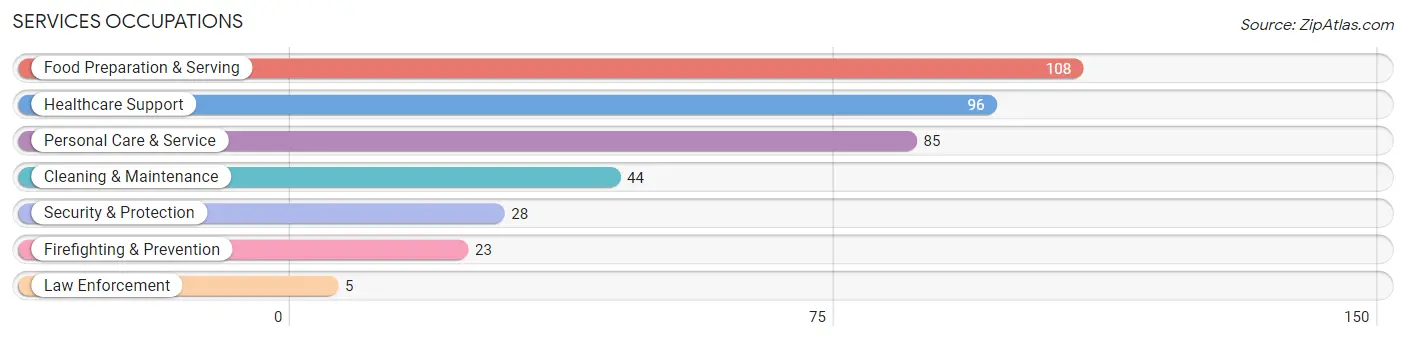
Services Occupations
The most common Services occupations in Forest City are Food Preparation & Serving (108 | 4.8%), Healthcare Support (96 | 4.3%), Personal Care & Service (85 | 3.8%), Cleaning & Maintenance (44 | 2.0%), and Security & Protection (28 | 1.3%).
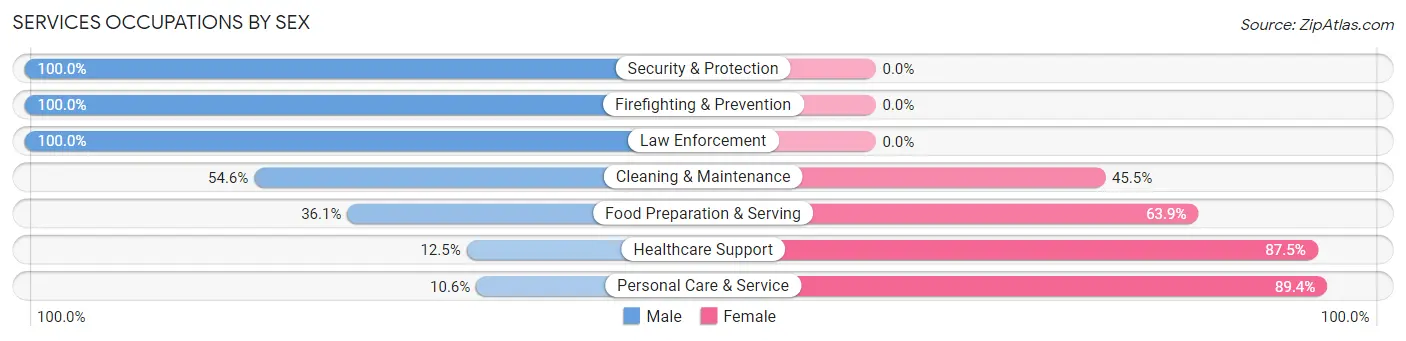
Services Occupations by Sex
Within the Services occupations in Forest City, the most male-oriented occupations are Security & Protection (100.0%), Firefighting & Prevention (100.0%), and Law Enforcement (100.0%), while the most female-oriented occupations are Personal Care & Service (89.4%), Healthcare Support (87.5%), and Food Preparation & Serving (63.9%).
| Occupation | Male | Female |
| Healthcare Support | 12 (12.5%) | 84 (87.5%) |
| Security & Protection | 28 (100.0%) | 0 (0.0%) |
| Firefighting & Prevention | 23 (100.0%) | 0 (0.0%) |
| Law Enforcement | 5 (100.0%) | 0 (0.0%) |
| Food Preparation & Serving | 39 (36.1%) | 69 (63.9%) |
| Cleaning & Maintenance | 24 (54.5%) | 20 (45.5%) |
| Personal Care & Service | 9 (10.6%) | 76 (89.4%) |
| Total (Category) | 112 (31.0%) | 249 (69.0%) |
| Total (Overall) | 1,171 (52.3%) | 1,066 (47.6%) |
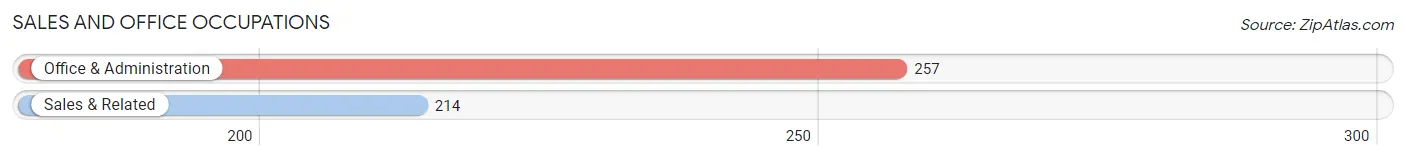
Sales and Office Occupations
The most common Sales and Office occupations in Forest City are Office & Administration (257 | 11.5%), and Sales & Related (214 | 9.6%).
Sales and Office Occupations by Sex
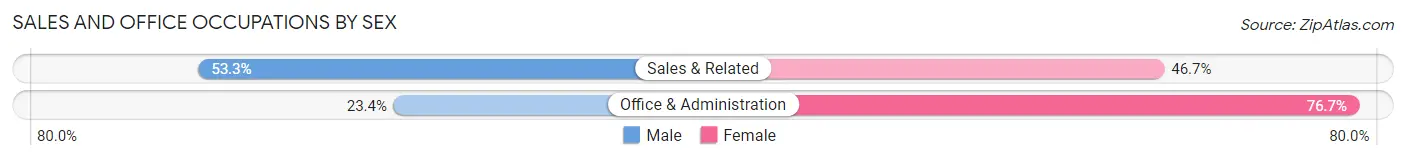
| Occupation | Male | Female |
| Sales & Related | 114 (53.3%) | 100 (46.7%) |
| Office & Administration | 60 (23.4%) | 197 (76.6%) |
| Total (Category) | 174 (36.9%) | 297 (63.1%) |
| Total (Overall) | 1,171 (52.3%) | 1,066 (47.6%) |
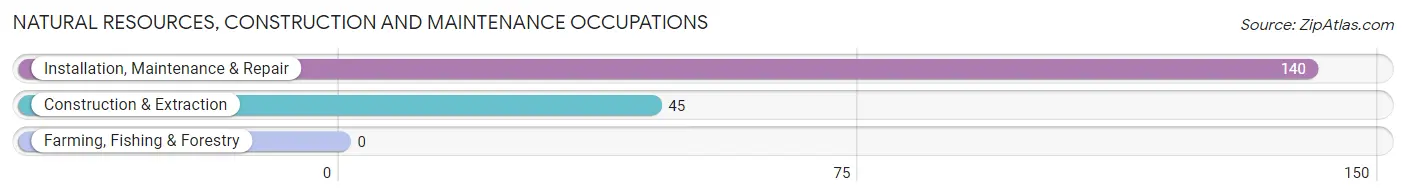
Natural Resources, Construction and Maintenance Occupations
The most common Natural Resources, Construction and Maintenance occupations in Forest City are Installation, Maintenance & Repair (140 | 6.3%), and Construction & Extraction (45 | 2.0%).
Natural Resources, Construction and Maintenance Occupations by Sex
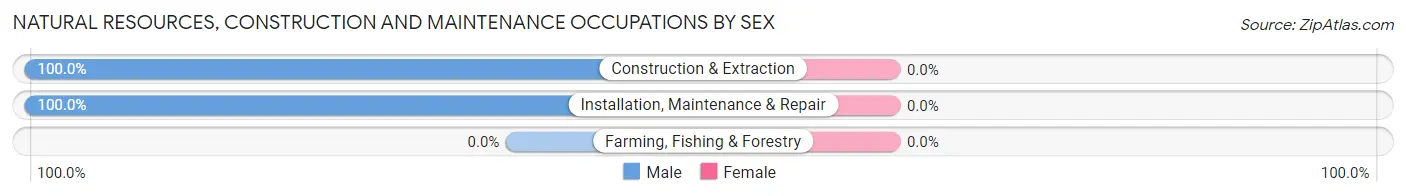
| Occupation | Male | Female |
| Farming, Fishing & Forestry | 0 (0.0%) | 0 (0.0%) |
| Construction & Extraction | 45 (100.0%) | 0 (0.0%) |
| Installation, Maintenance & Repair | 140 (100.0%) | 0 (0.0%) |
| Total (Category) | 185 (100.0%) | 0 (0.0%) |
| Total (Overall) | 1,171 (52.3%) | 1,066 (47.6%) |
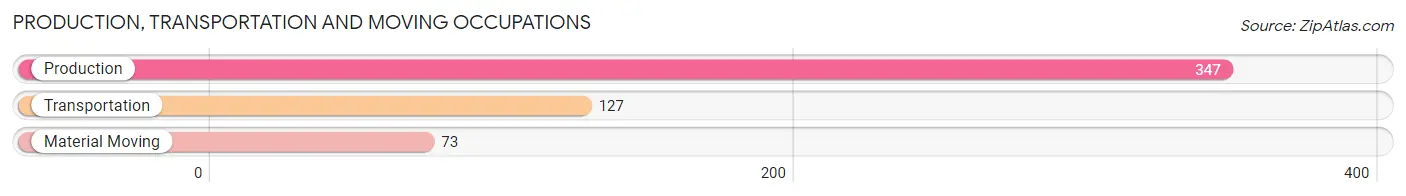
Production, Transportation and Moving Occupations
The most common Production, Transportation and Moving occupations in Forest City are Production (347 | 15.5%), Transportation (127 | 5.7%), and Material Moving (73 | 3.3%).
Production, Transportation and Moving Occupations by Sex
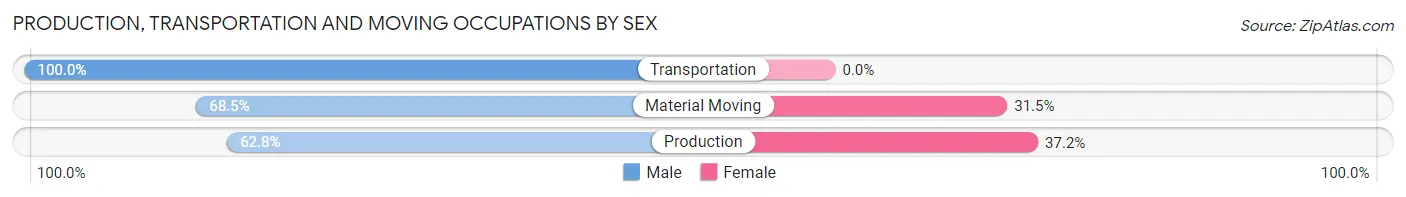
| Occupation | Male | Female |
| Production | 218 (62.8%) | 129 (37.2%) |
| Transportation | 127 (100.0%) | 0 (0.0%) |
| Material Moving | 50 (68.5%) | 23 (31.5%) |
| Total (Category) | 395 (72.2%) | 152 (27.8%) |
| Total (Overall) | 1,171 (52.3%) | 1,066 (47.6%) |
Employment Industries by Sex in Forest City
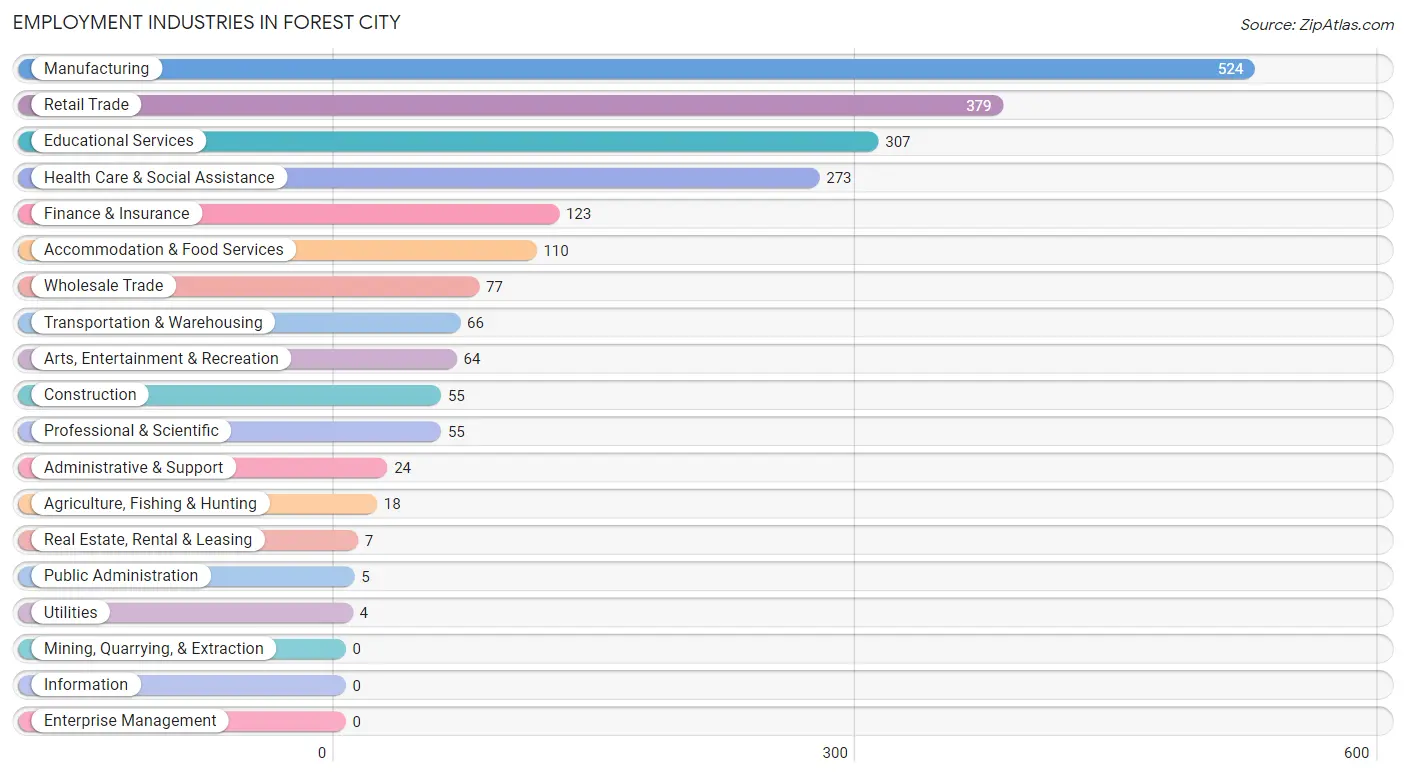
Employment Industries in Forest City
The major employment industries in Forest City include Manufacturing (524 | 23.4%), Retail Trade (379 | 16.9%), Educational Services (307 | 13.7%), Health Care & Social Assistance (273 | 12.2%), and Finance & Insurance (123 | 5.5%).
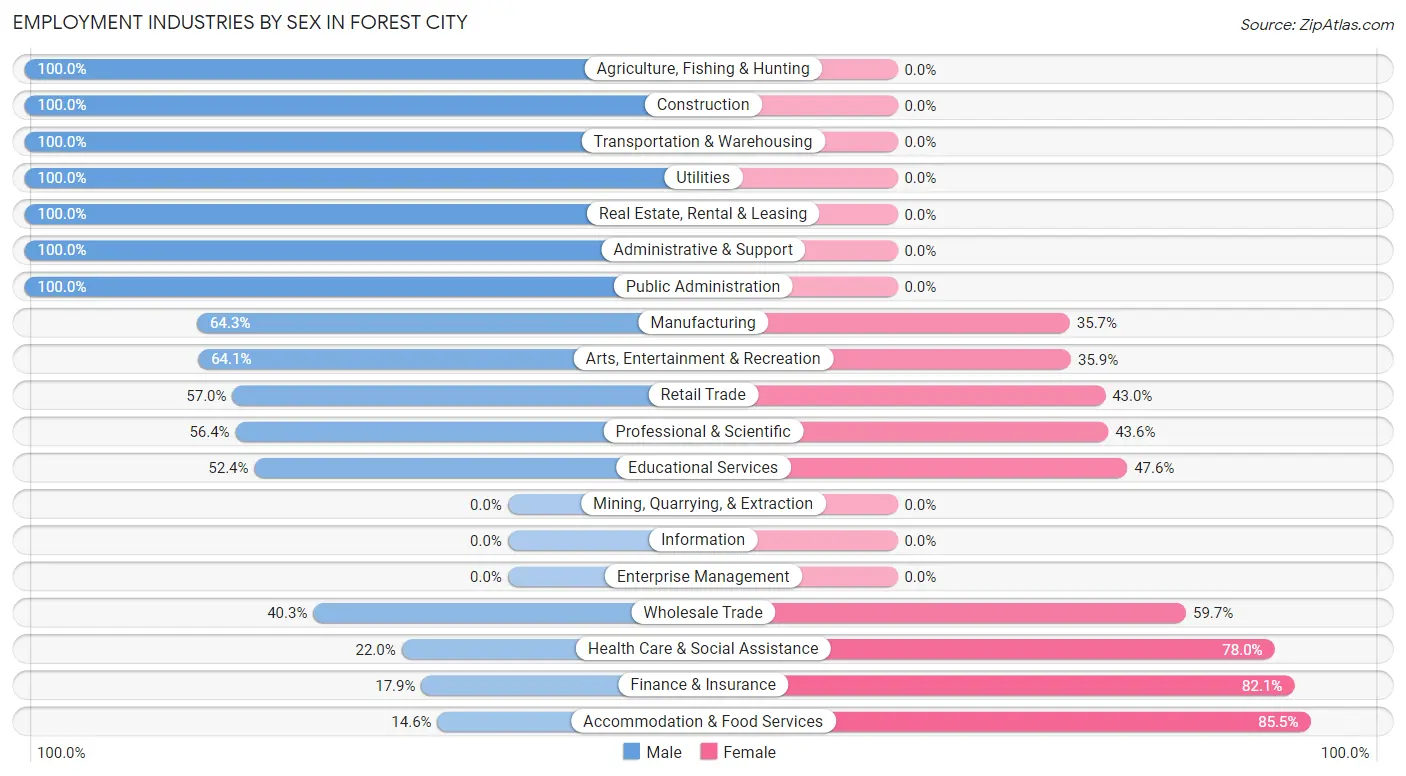
Employment Industries by Sex in Forest City
The Forest City industries that see more men than women are Agriculture, Fishing & Hunting (100.0%), Construction (100.0%), and Transportation & Warehousing (100.0%), whereas the industries that tend to have a higher number of women are Accommodation & Food Services (85.5%), Finance & Insurance (82.1%), and Health Care & Social Assistance (78.0%).
| Industry | Male | Female |
| Agriculture, Fishing & Hunting | 18 (100.0%) | 0 (0.0%) |
| Mining, Quarrying, & Extraction | 0 (0.0%) | 0 (0.0%) |
| Construction | 55 (100.0%) | 0 (0.0%) |
| Manufacturing | 337 (64.3%) | 187 (35.7%) |
| Wholesale Trade | 31 (40.3%) | 46 (59.7%) |
| Retail Trade | 216 (57.0%) | 163 (43.0%) |
| Transportation & Warehousing | 66 (100.0%) | 0 (0.0%) |
| Utilities | 4 (100.0%) | 0 (0.0%) |
| Information | 0 (0.0%) | 0 (0.0%) |
| Finance & Insurance | 22 (17.9%) | 101 (82.1%) |
| Real Estate, Rental & Leasing | 7 (100.0%) | 0 (0.0%) |
| Professional & Scientific | 31 (56.4%) | 24 (43.6%) |
| Enterprise Management | 0 (0.0%) | 0 (0.0%) |
| Administrative & Support | 24 (100.0%) | 0 (0.0%) |
| Educational Services | 161 (52.4%) | 146 (47.6%) |
| Health Care & Social Assistance | 60 (22.0%) | 213 (78.0%) |
| Arts, Entertainment & Recreation | 41 (64.1%) | 23 (35.9%) |
| Accommodation & Food Services | 16 (14.5%) | 94 (85.5%) |
| Public Administration | 5 (100.0%) | 0 (0.0%) |
| Total | 1,171 (52.3%) | 1,066 (47.6%) |
Education in Forest City
School Enrollment in Forest City
The most common levels of schooling among the 1,460 students in Forest City are college / undergraduate (543 | 37.2%), middle school (320 | 21.9%), and high school (262 | 17.9%).
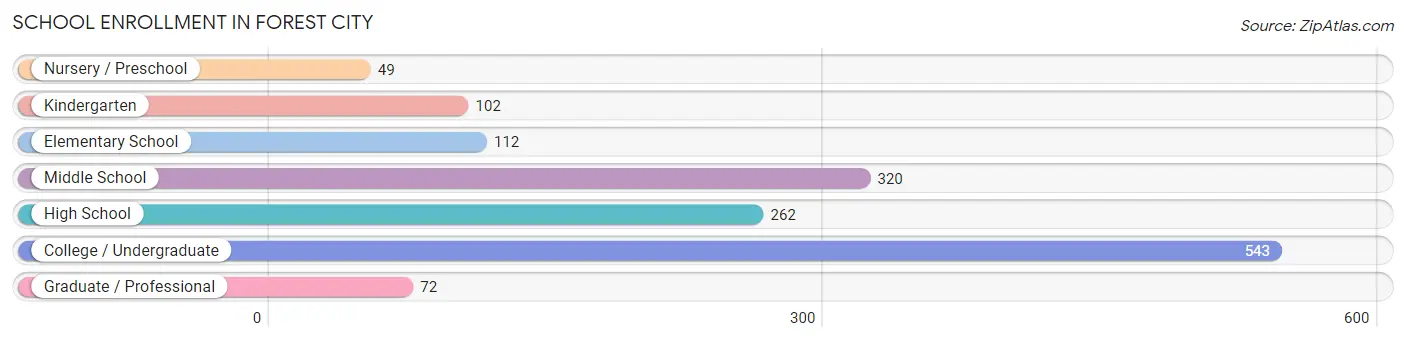
| School Level | # Students | % Students |
| Nursery / Preschool | 49 | 3.4% |
| Kindergarten | 102 | 7.0% |
| Elementary School | 112 | 7.7% |
| Middle School | 320 | 21.9% |
| High School | 262 | 17.9% |
| College / Undergraduate | 543 | 37.2% |
| Graduate / Professional | 72 | 4.9% |
| Total | 1,460 | 100.0% |
School Enrollment by Age by Funding Source in Forest City
Out of a total of 1,460 students who are enrolled in schools in Forest City, 365 (25.0%) attend a private institution, while the remaining 1,095 (75.0%) are enrolled in public schools. The age group of 25 to 34 year olds has the highest likelihood of being enrolled in private schools, with 41 (82.0% in the age bracket) enrolled. Conversely, the age group of 10 to 14 year olds has the lowest likelihood of being enrolled in a private school, with 337 (100.0% in the age bracket) attending a public institution.
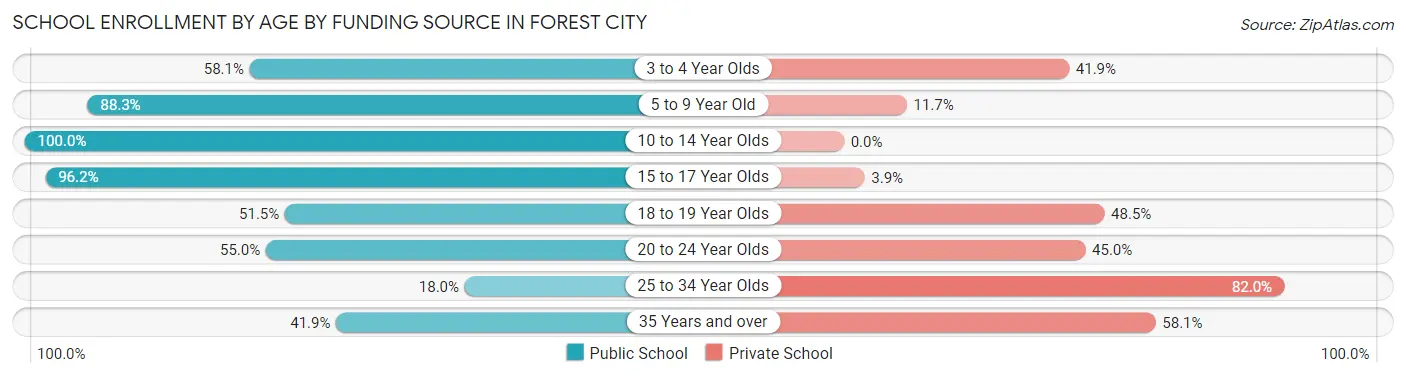
| Age Bracket | Public School | Private School |
| 3 to 4 Year Olds | 18 (58.1%) | 13 (41.9%) |
| 5 to 9 Year Old | 196 (88.3%) | 26 (11.7%) |
| 10 to 14 Year Olds | 337 (100.0%) | 0 (0.0%) |
| 15 to 17 Year Olds | 225 (96.2%) | 9 (3.8%) |
| 18 to 19 Year Olds | 122 (51.5%) | 115 (48.5%) |
| 20 to 24 Year Olds | 175 (55.0%) | 143 (45.0%) |
| 25 to 34 Year Olds | 9 (18.0%) | 41 (82.0%) |
| 35 Years and over | 13 (41.9%) | 18 (58.1%) |
| Total | 1,095 (75.0%) | 365 (25.0%) |
Educational Attainment by Field of Study in Forest City
Education (208 | 32.2%), business (141 | 21.8%), arts & humanities (61 | 9.4%), science & technology (43 | 6.7%), and physical & health sciences (34 | 5.3%) are the most common fields of study among 647 individuals in Forest City who have obtained a bachelor's degree or higher.
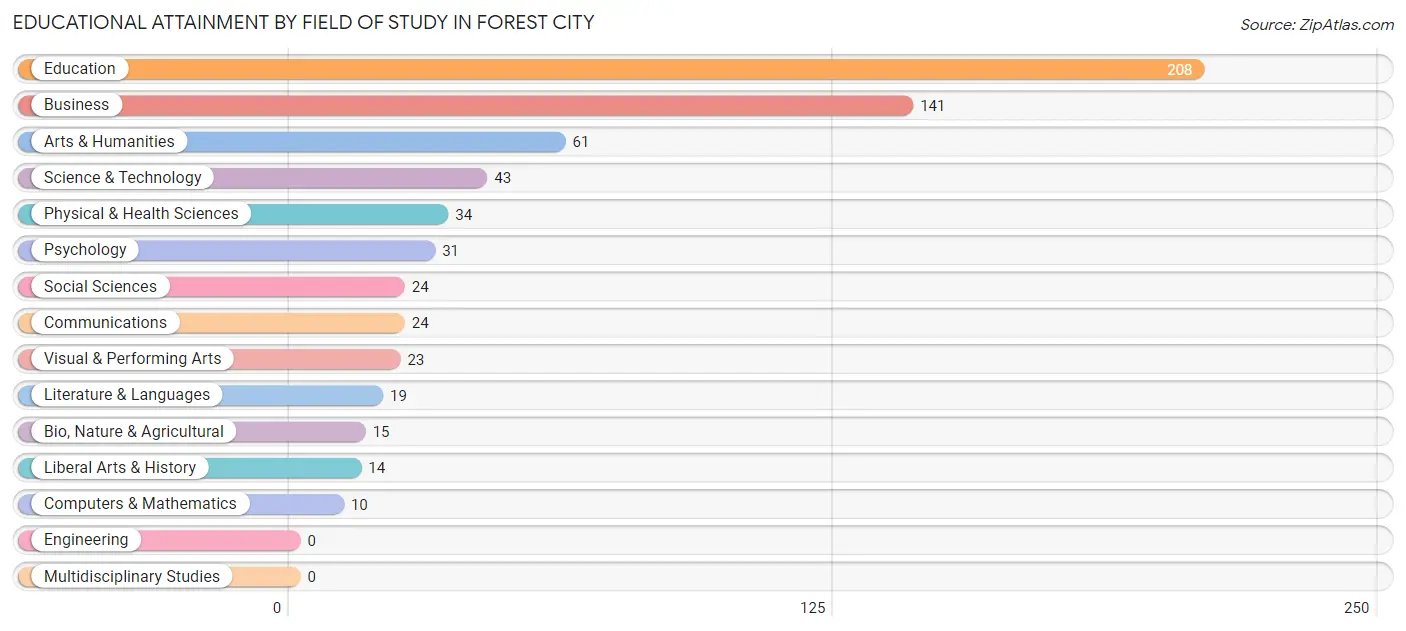
| Field of Study | # Graduates | % Graduates |
| Computers & Mathematics | 10 | 1.5% |
| Bio, Nature & Agricultural | 15 | 2.3% |
| Physical & Health Sciences | 34 | 5.3% |
| Psychology | 31 | 4.8% |
| Social Sciences | 24 | 3.7% |
| Engineering | 0 | 0.0% |
| Multidisciplinary Studies | 0 | 0.0% |
| Science & Technology | 43 | 6.7% |
| Business | 141 | 21.8% |
| Education | 208 | 32.2% |
| Literature & Languages | 19 | 2.9% |
| Liberal Arts & History | 14 | 2.2% |
| Visual & Performing Arts | 23 | 3.5% |
| Communications | 24 | 3.7% |
| Arts & Humanities | 61 | 9.4% |
| Total | 647 | 100.0% |
Transportation & Commute in Forest City
Vehicle Availability by Sex in Forest City
The most prevalent vehicle ownership categories in Forest City are males with 2 vehicles (405, accounting for 41.1%) and females with 2 vehicles (471, making up 41.2%).
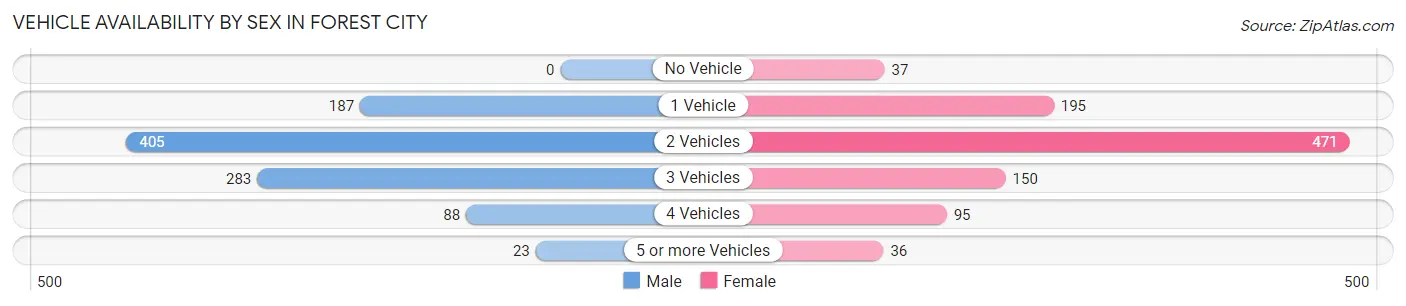
| Vehicles Available | Male | Female |
| No Vehicle | 0 (0.0%) | 37 (3.8%) |
| 1 Vehicle | 187 (19.0%) | 195 (19.8%) |
| 2 Vehicles | 405 (41.1%) | 471 (47.9%) |
| 3 Vehicles | 283 (28.7%) | 150 (15.2%) |
| 4 Vehicles | 88 (8.9%) | 95 (9.7%) |
| 5 or more Vehicles | 23 (2.3%) | 36 (3.7%) |
| Total | 986 (100.0%) | 984 (100.0%) |
Commute Time in Forest City
The most frequently occuring commute durations in Forest City are 5 to 9 minutes (752 commuters, 35.9%), less than 5 minutes (411 commuters, 19.6%), and 10 to 14 minutes (208 commuters, 9.9%).
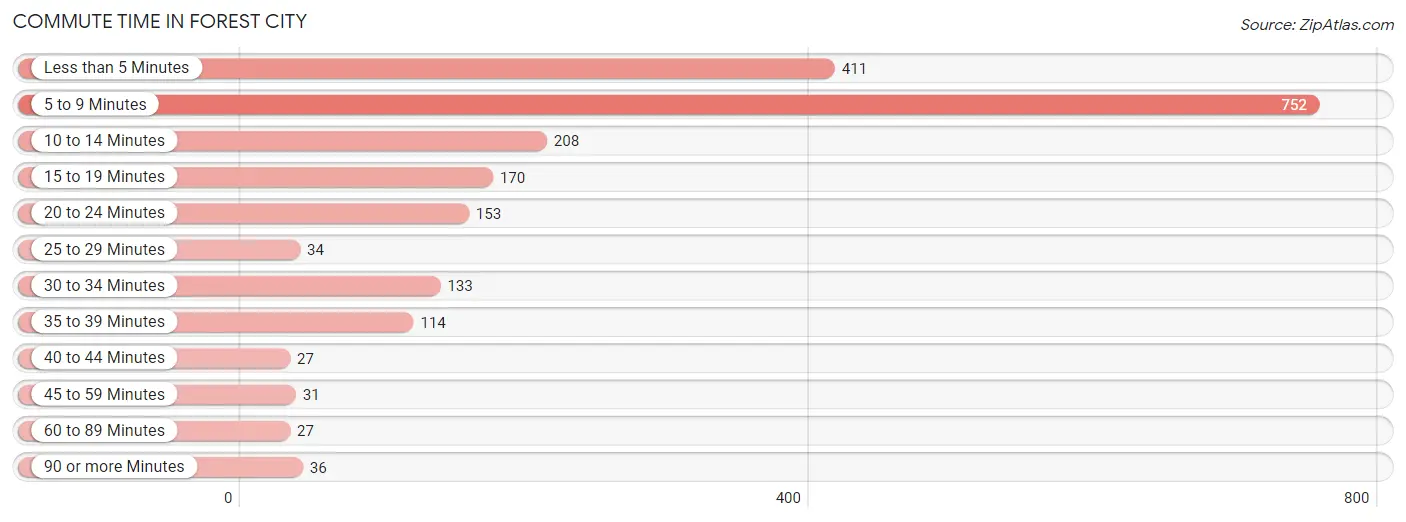
| Commute Time | # Commuters | % Commuters |
| Less than 5 Minutes | 411 | 19.6% |
| 5 to 9 Minutes | 752 | 35.9% |
| 10 to 14 Minutes | 208 | 9.9% |
| 15 to 19 Minutes | 170 | 8.1% |
| 20 to 24 Minutes | 153 | 7.3% |
| 25 to 29 Minutes | 34 | 1.6% |
| 30 to 34 Minutes | 133 | 6.4% |
| 35 to 39 Minutes | 114 | 5.4% |
| 40 to 44 Minutes | 27 | 1.3% |
| 45 to 59 Minutes | 31 | 1.5% |
| 60 to 89 Minutes | 27 | 1.3% |
| 90 or more Minutes | 36 | 1.7% |
Commute Time by Sex in Forest City
The most common commute times in Forest City are 5 to 9 minutes (366 commuters, 33.6%) for males and 5 to 9 minutes (386 commuters, 38.4%) for females.
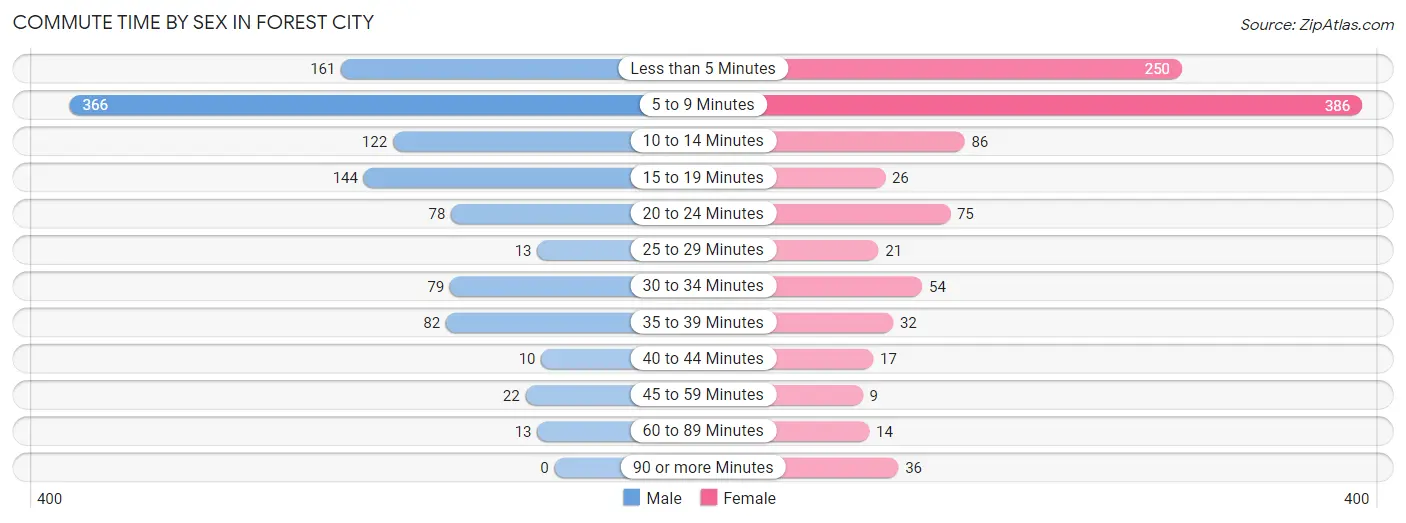
| Commute Time | Male | Female |
| Less than 5 Minutes | 161 (14.8%) | 250 (24.8%) |
| 5 to 9 Minutes | 366 (33.6%) | 386 (38.4%) |
| 10 to 14 Minutes | 122 (11.2%) | 86 (8.6%) |
| 15 to 19 Minutes | 144 (13.2%) | 26 (2.6%) |
| 20 to 24 Minutes | 78 (7.2%) | 75 (7.5%) |
| 25 to 29 Minutes | 13 (1.2%) | 21 (2.1%) |
| 30 to 34 Minutes | 79 (7.2%) | 54 (5.4%) |
| 35 to 39 Minutes | 82 (7.5%) | 32 (3.2%) |
| 40 to 44 Minutes | 10 (0.9%) | 17 (1.7%) |
| 45 to 59 Minutes | 22 (2.0%) | 9 (0.9%) |
| 60 to 89 Minutes | 13 (1.2%) | 14 (1.4%) |
| 90 or more Minutes | 0 (0.0%) | 36 (3.6%) |
Time of Departure to Work by Sex in Forest City
The most frequent times of departure to work in Forest City are 7:00 AM to 7:29 AM (167, 15.3%) for males and 7:30 AM to 7:59 AM (210, 20.9%) for females.
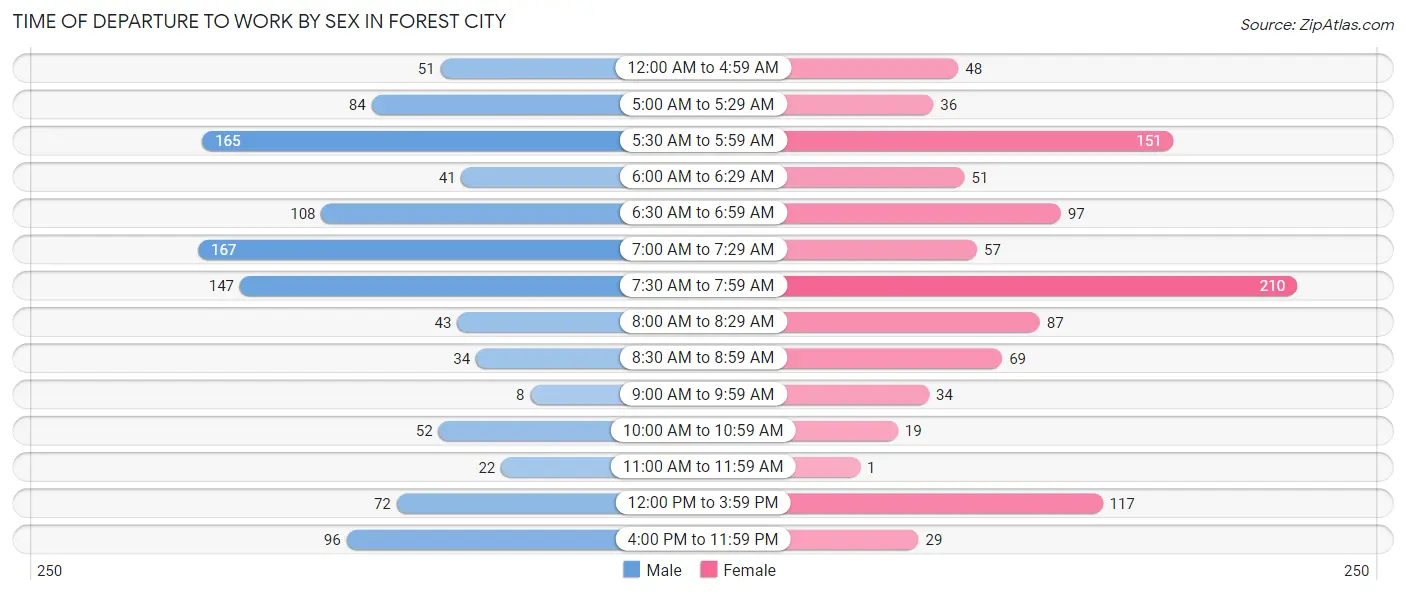
| Time of Departure | Male | Female |
| 12:00 AM to 4:59 AM | 51 (4.7%) | 48 (4.8%) |
| 5:00 AM to 5:29 AM | 84 (7.7%) | 36 (3.6%) |
| 5:30 AM to 5:59 AM | 165 (15.1%) | 151 (15.0%) |
| 6:00 AM to 6:29 AM | 41 (3.8%) | 51 (5.1%) |
| 6:30 AM to 6:59 AM | 108 (9.9%) | 97 (9.6%) |
| 7:00 AM to 7:29 AM | 167 (15.3%) | 57 (5.7%) |
| 7:30 AM to 7:59 AM | 147 (13.5%) | 210 (20.9%) |
| 8:00 AM to 8:29 AM | 43 (3.9%) | 87 (8.6%) |
| 8:30 AM to 8:59 AM | 34 (3.1%) | 69 (6.9%) |
| 9:00 AM to 9:59 AM | 8 (0.7%) | 34 (3.4%) |
| 10:00 AM to 10:59 AM | 52 (4.8%) | 19 (1.9%) |
| 11:00 AM to 11:59 AM | 22 (2.0%) | 1 (0.1%) |
| 12:00 PM to 3:59 PM | 72 (6.6%) | 117 (11.6%) |
| 4:00 PM to 11:59 PM | 96 (8.8%) | 29 (2.9%) |
| Total | 1,090 (100.0%) | 1,006 (100.0%) |
Housing Occupancy in Forest City
Occupancy by Ownership in Forest City
Of the total 1,580 dwellings in Forest City, owner-occupied units account for 1,136 (71.9%), while renter-occupied units make up 444 (28.1%).
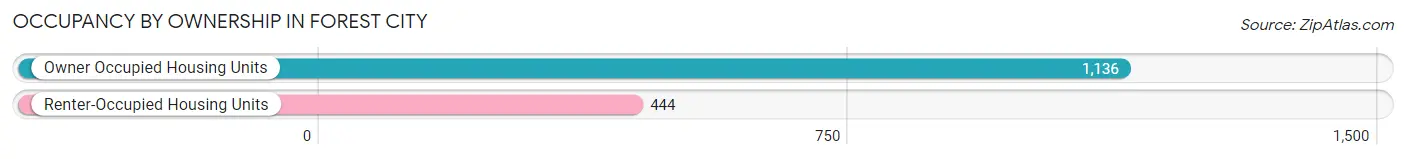
| Occupancy | # Housing Units | % Housing Units |
| Owner Occupied Housing Units | 1,136 | 71.9% |
| Renter-Occupied Housing Units | 444 | 28.1% |
| Total Occupied Housing Units | 1,580 | 100.0% |
Occupancy by Household Size in Forest City
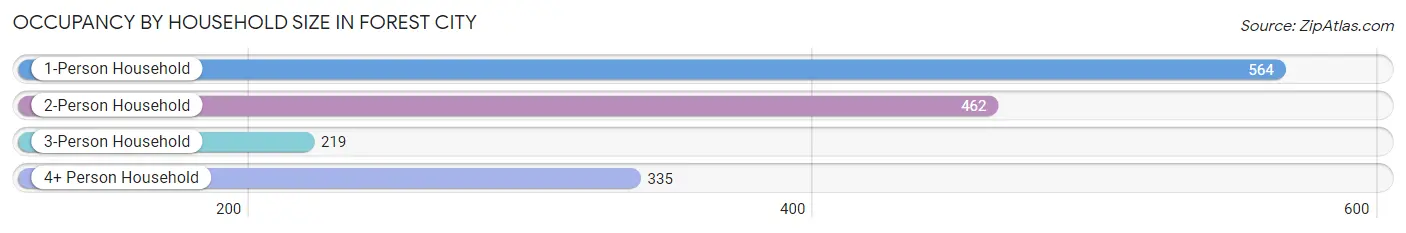
| Household Size | # Housing Units | % Housing Units |
| 1-Person Household | 564 | 35.7% |
| 2-Person Household | 462 | 29.2% |
| 3-Person Household | 219 | 13.9% |
| 4+ Person Household | 335 | 21.2% |
| Total Housing Units | 1,580 | 100.0% |
Occupancy by Ownership by Household Size in Forest City
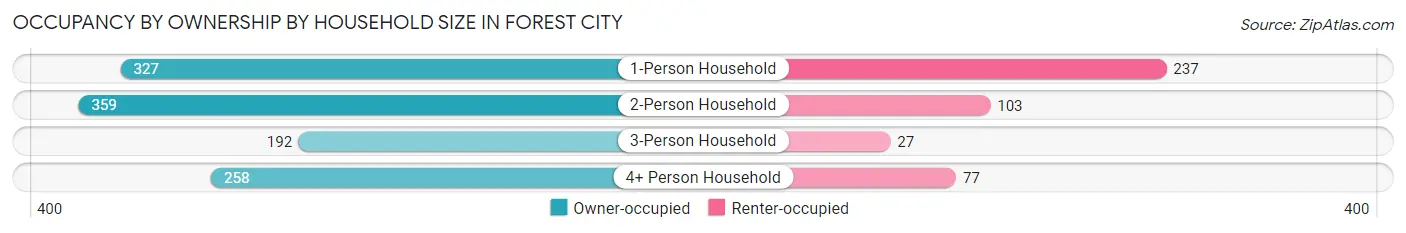
| Household Size | Owner-occupied | Renter-occupied |
| 1-Person Household | 327 (58.0%) | 237 (42.0%) |
| 2-Person Household | 359 (77.7%) | 103 (22.3%) |
| 3-Person Household | 192 (87.7%) | 27 (12.3%) |
| 4+ Person Household | 258 (77.0%) | 77 (23.0%) |
| Total Housing Units | 1,136 (71.9%) | 444 (28.1%) |
Occupancy by Educational Attainment in Forest City
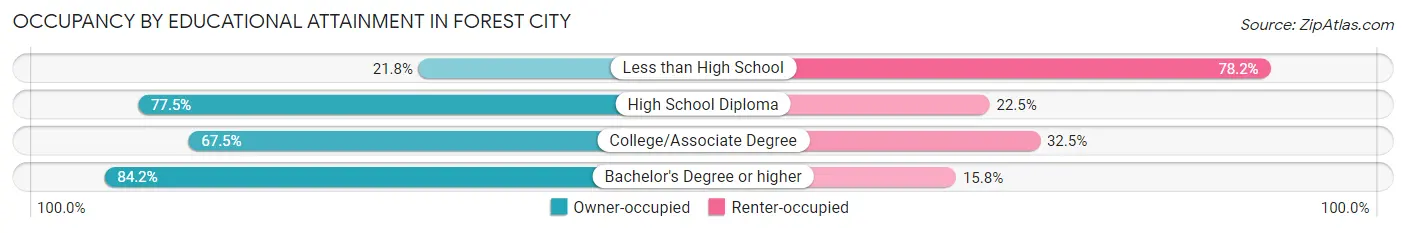
| Household Size | Owner-occupied | Renter-occupied |
| Less than High School | 19 (21.8%) | 68 (78.2%) |
| High School Diploma | 338 (77.5%) | 98 (22.5%) |
| College/Associate Degree | 449 (67.5%) | 216 (32.5%) |
| Bachelor's Degree or higher | 330 (84.2%) | 62 (15.8%) |
Occupancy by Age of Householder in Forest City
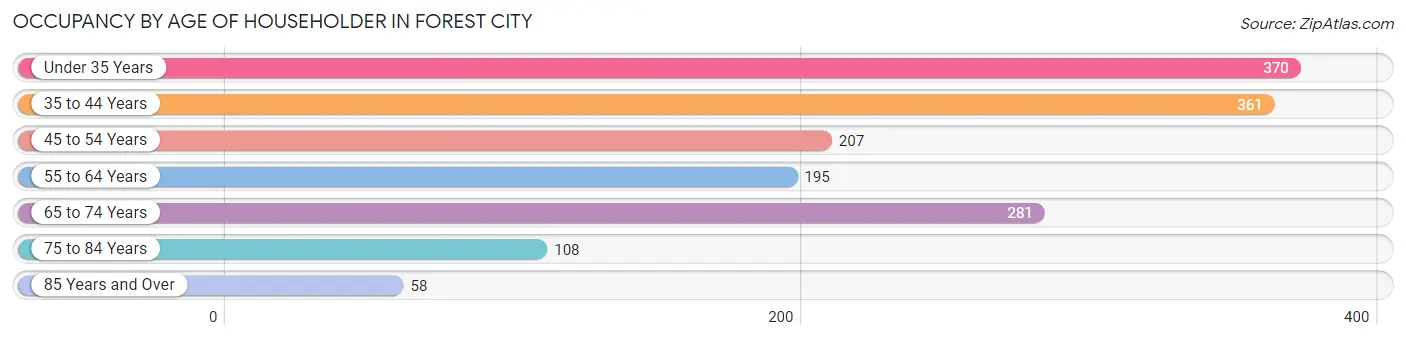
| Age Bracket | # Households | % Households |
| Under 35 Years | 370 | 23.4% |
| 35 to 44 Years | 361 | 22.9% |
| 45 to 54 Years | 207 | 13.1% |
| 55 to 64 Years | 195 | 12.3% |
| 65 to 74 Years | 281 | 17.8% |
| 75 to 84 Years | 108 | 6.8% |
| 85 Years and Over | 58 | 3.7% |
| Total | 1,580 | 100.0% |
Housing Finances in Forest City
Median Income by Occupancy in Forest City
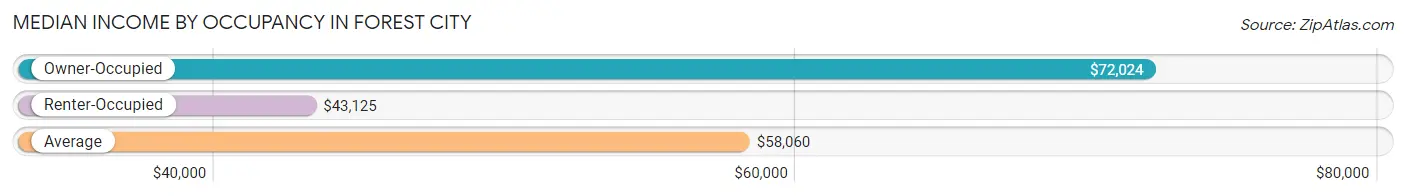
| Occupancy Type | # Households | Median Income |
| Owner-Occupied | 1,136 (71.9%) | $72,024 |
| Renter-Occupied | 444 (28.1%) | $43,125 |
| Average | 1,580 (100.0%) | $58,060 |
Occupancy by Householder Income Bracket in Forest City
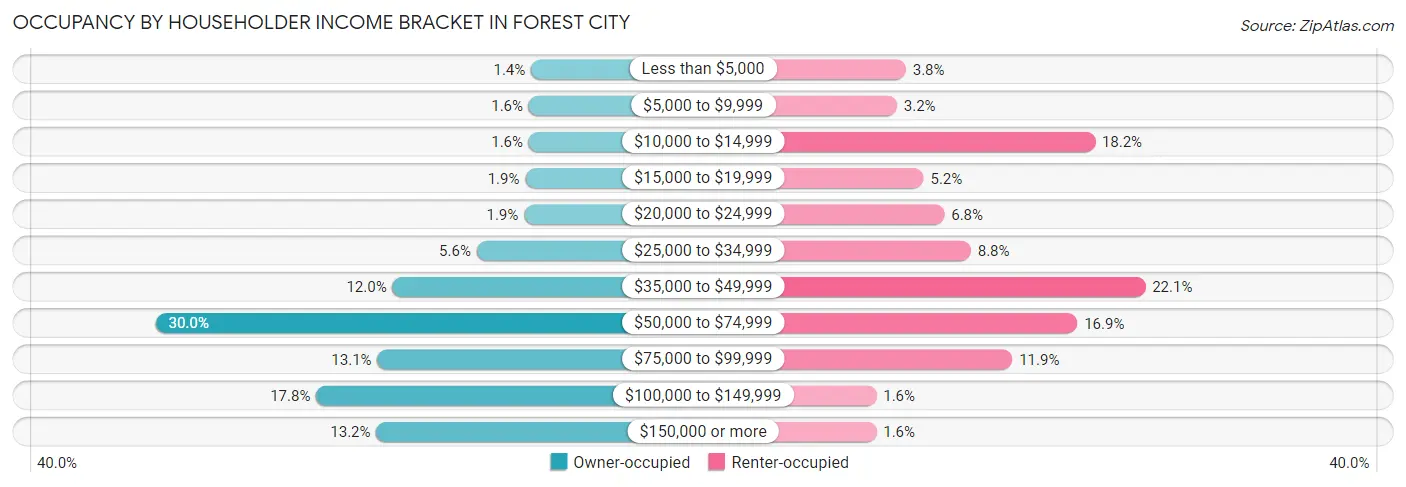
| Income Bracket | Owner-occupied | Renter-occupied |
| Less than $5,000 | 16 (1.4%) | 17 (3.8%) |
| $5,000 to $9,999 | 18 (1.6%) | 14 (3.2%) |
| $10,000 to $14,999 | 18 (1.6%) | 81 (18.2%) |
| $15,000 to $19,999 | 21 (1.8%) | 23 (5.2%) |
| $20,000 to $24,999 | 22 (1.9%) | 30 (6.8%) |
| $25,000 to $34,999 | 63 (5.6%) | 39 (8.8%) |
| $35,000 to $49,999 | 136 (12.0%) | 98 (22.1%) |
| $50,000 to $74,999 | 341 (30.0%) | 75 (16.9%) |
| $75,000 to $99,999 | 149 (13.1%) | 53 (11.9%) |
| $100,000 to $149,999 | 202 (17.8%) | 7 (1.6%) |
| $150,000 or more | 150 (13.2%) | 7 (1.6%) |
| Total | 1,136 (100.0%) | 444 (100.0%) |
Monthly Housing Cost Tiers in Forest City
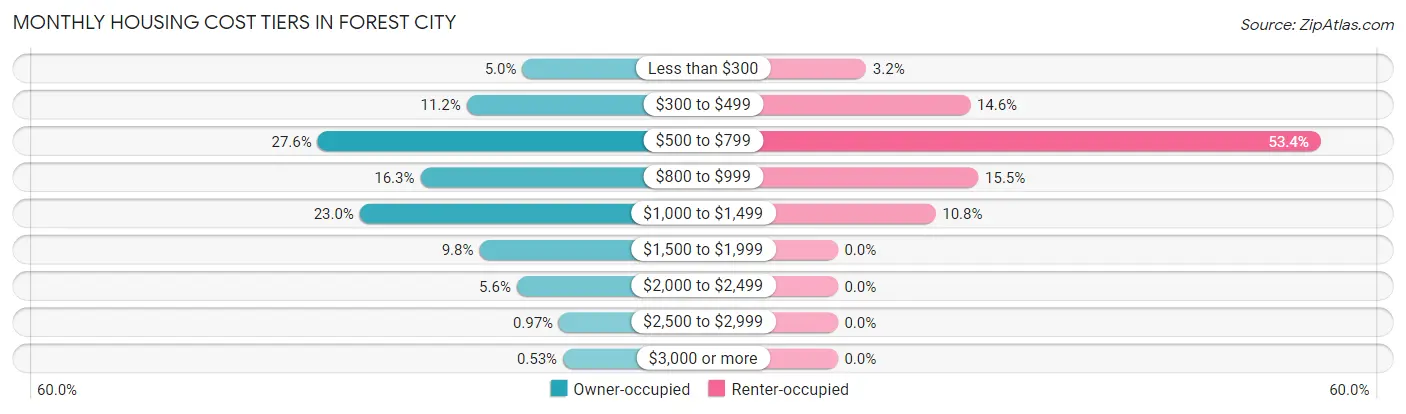
| Monthly Cost | Owner-occupied | Renter-occupied |
| Less than $300 | 57 (5.0%) | 14 (3.2%) |
| $300 to $499 | 127 (11.2%) | 65 (14.6%) |
| $500 to $799 | 314 (27.6%) | 237 (53.4%) |
| $800 to $999 | 185 (16.3%) | 69 (15.5%) |
| $1,000 to $1,499 | 261 (23.0%) | 48 (10.8%) |
| $1,500 to $1,999 | 111 (9.8%) | 0 (0.0%) |
| $2,000 to $2,499 | 64 (5.6%) | 0 (0.0%) |
| $2,500 to $2,999 | 11 (1.0%) | 0 (0.0%) |
| $3,000 or more | 6 (0.5%) | 0 (0.0%) |
| Total | 1,136 (100.0%) | 444 (100.0%) |
Physical Housing Characteristics in Forest City
Housing Structures in Forest City
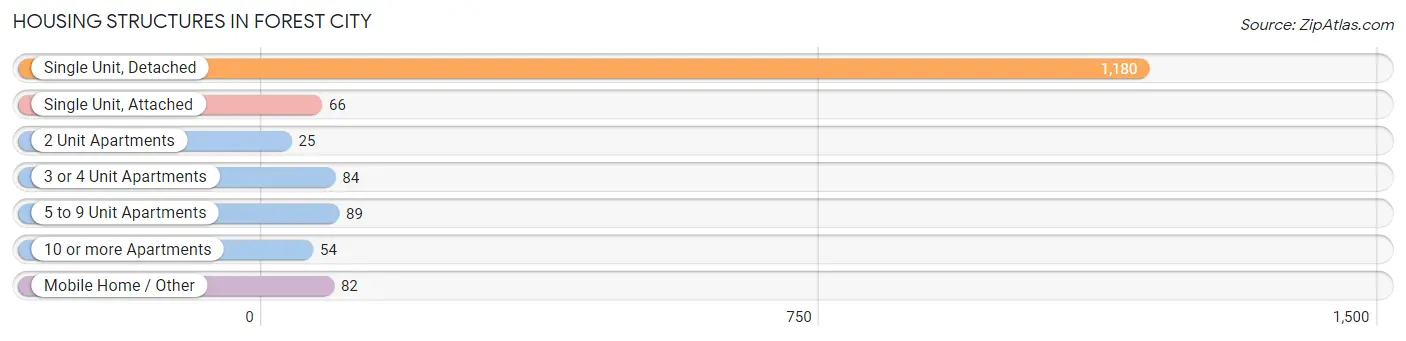
| Structure Type | # Housing Units | % Housing Units |
| Single Unit, Detached | 1,180 | 74.7% |
| Single Unit, Attached | 66 | 4.2% |
| 2 Unit Apartments | 25 | 1.6% |
| 3 or 4 Unit Apartments | 84 | 5.3% |
| 5 to 9 Unit Apartments | 89 | 5.6% |
| 10 or more Apartments | 54 | 3.4% |
| Mobile Home / Other | 82 | 5.2% |
| Total | 1,580 | 100.0% |
Housing Structures by Occupancy in Forest City
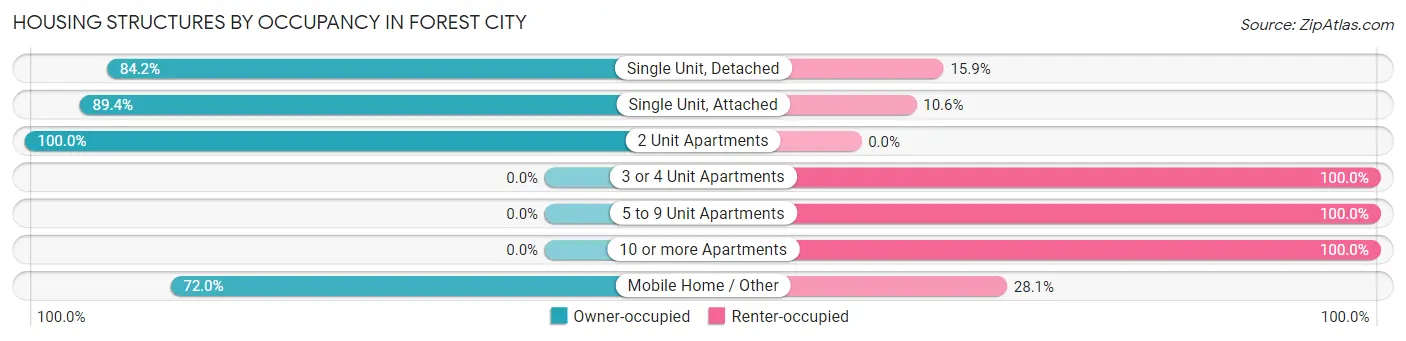
| Structure Type | Owner-occupied | Renter-occupied |
| Single Unit, Detached | 993 (84.2%) | 187 (15.9%) |
| Single Unit, Attached | 59 (89.4%) | 7 (10.6%) |
| 2 Unit Apartments | 25 (100.0%) | 0 (0.0%) |
| 3 or 4 Unit Apartments | 0 (0.0%) | 84 (100.0%) |
| 5 to 9 Unit Apartments | 0 (0.0%) | 89 (100.0%) |
| 10 or more Apartments | 0 (0.0%) | 54 (100.0%) |
| Mobile Home / Other | 59 (72.0%) | 23 (28.1%) |
| Total | 1,136 (71.9%) | 444 (28.1%) |
Housing Structures by Number of Rooms in Forest City
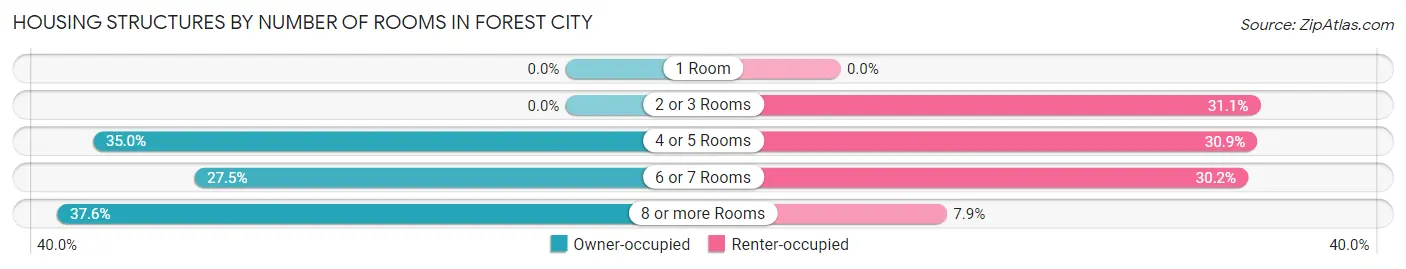
| Number of Rooms | Owner-occupied | Renter-occupied |
| 1 Room | 0 (0.0%) | 0 (0.0%) |
| 2 or 3 Rooms | 0 (0.0%) | 138 (31.1%) |
| 4 or 5 Rooms | 397 (34.9%) | 137 (30.9%) |
| 6 or 7 Rooms | 312 (27.5%) | 134 (30.2%) |
| 8 or more Rooms | 427 (37.6%) | 35 (7.9%) |
| Total | 1,136 (100.0%) | 444 (100.0%) |
Housing Structure by Heating Type in Forest City
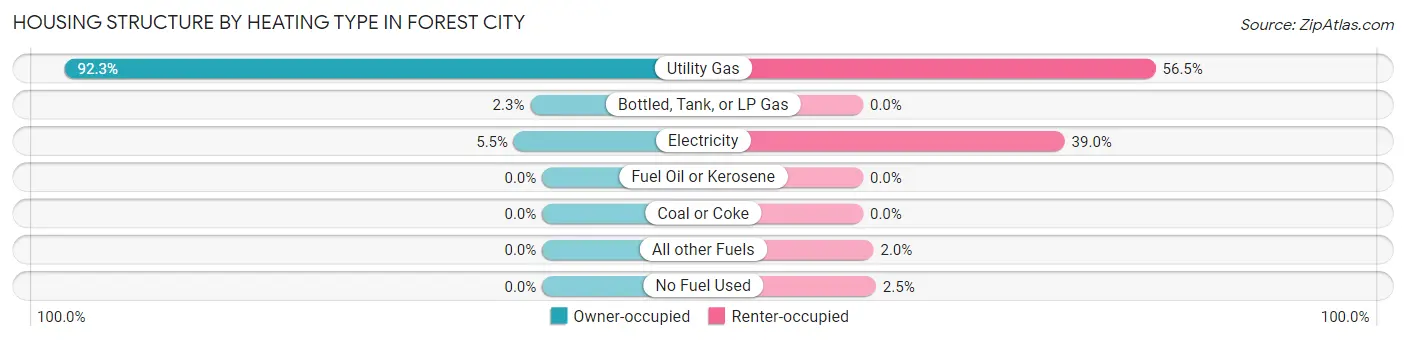
| Heating Type | Owner-occupied | Renter-occupied |
| Utility Gas | 1,048 (92.2%) | 251 (56.5%) |
| Bottled, Tank, or LP Gas | 26 (2.3%) | 0 (0.0%) |
| Electricity | 62 (5.5%) | 173 (39.0%) |
| Fuel Oil or Kerosene | 0 (0.0%) | 0 (0.0%) |
| Coal or Coke | 0 (0.0%) | 0 (0.0%) |
| All other Fuels | 0 (0.0%) | 9 (2.0%) |
| No Fuel Used | 0 (0.0%) | 11 (2.5%) |
| Total | 1,136 (100.0%) | 444 (100.0%) |
Household Vehicle Usage in Forest City
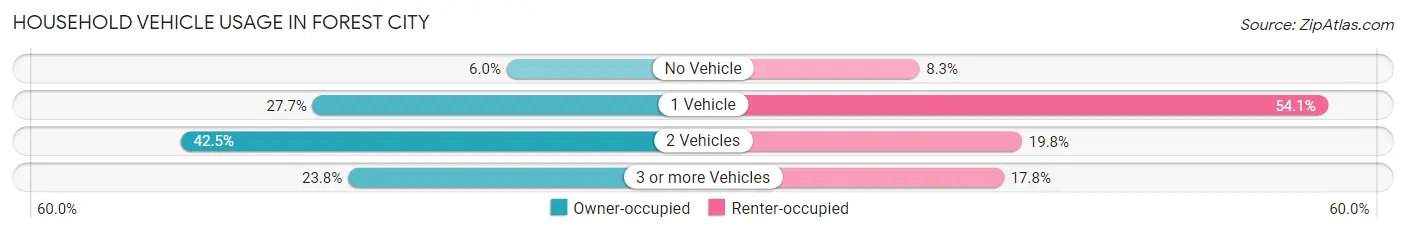
| Vehicles per Household | Owner-occupied | Renter-occupied |
| No Vehicle | 68 (6.0%) | 37 (8.3%) |
| 1 Vehicle | 315 (27.7%) | 240 (54.0%) |
| 2 Vehicles | 483 (42.5%) | 88 (19.8%) |
| 3 or more Vehicles | 270 (23.8%) | 79 (17.8%) |
| Total | 1,136 (100.0%) | 444 (100.0%) |
Real Estate & Mortgages in Forest City
Real Estate and Mortgage Overview in Forest City
| Characteristic | Without Mortgage | With Mortgage |
| Housing Units | 522 | 614 |
| Median Property Value | $117,500 | $129,700 |
| Median Household Income | $71,667 | $72 |
| Monthly Housing Costs | $597 | $6 |
| Real Estate Taxes | $2,409 | $8 |
Property Value by Mortgage Status in Forest City
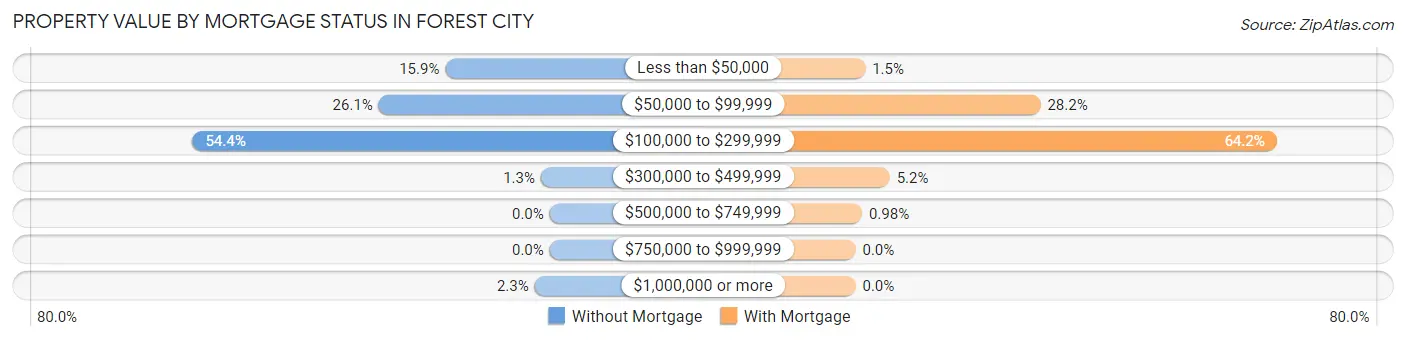
| Property Value | Without Mortgage | With Mortgage |
| Less than $50,000 | 83 (15.9%) | 9 (1.5%) |
| $50,000 to $99,999 | 136 (26.1%) | 173 (28.2%) |
| $100,000 to $299,999 | 284 (54.4%) | 394 (64.2%) |
| $300,000 to $499,999 | 7 (1.3%) | 32 (5.2%) |
| $500,000 to $749,999 | 0 (0.0%) | 6 (1.0%) |
| $750,000 to $999,999 | 0 (0.0%) | 0 (0.0%) |
| $1,000,000 or more | 12 (2.3%) | 0 (0.0%) |
| Total | 522 (100.0%) | 614 (100.0%) |
Household Income by Mortgage Status in Forest City
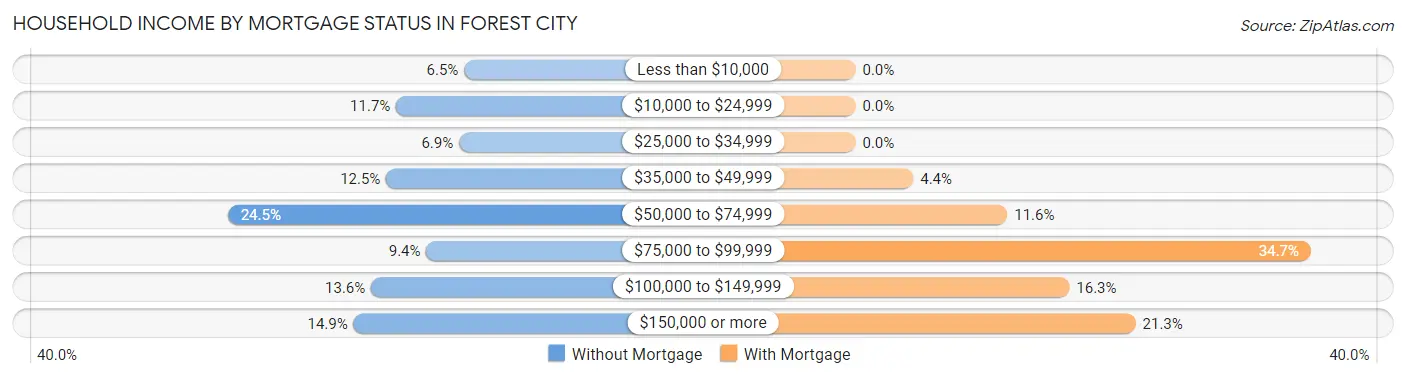
| Household Income | Without Mortgage | With Mortgage |
| Less than $10,000 | 34 (6.5%) | 0 (0.0%) |
| $10,000 to $24,999 | 61 (11.7%) | 0 (0.0%) |
| $25,000 to $34,999 | 36 (6.9%) | 0 (0.0%) |
| $35,000 to $49,999 | 65 (12.4%) | 27 (4.4%) |
| $50,000 to $74,999 | 128 (24.5%) | 71 (11.6%) |
| $75,000 to $99,999 | 49 (9.4%) | 213 (34.7%) |
| $100,000 to $149,999 | 71 (13.6%) | 100 (16.3%) |
| $150,000 or more | 78 (14.9%) | 131 (21.3%) |
| Total | 522 (100.0%) | 614 (100.0%) |
Property Value to Household Income Ratio in Forest City
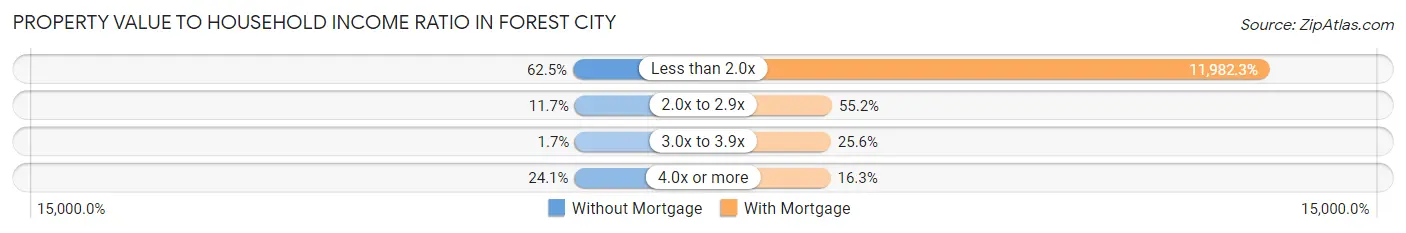
| Value-to-Income Ratio | Without Mortgage | With Mortgage |
| Less than 2.0x | 326 (62.5%) | 73,571 (11,982.3%) |
| 2.0x to 2.9x | 61 (11.7%) | 339 (55.2%) |
| 3.0x to 3.9x | 9 (1.7%) | 157 (25.6%) |
| 4.0x or more | 126 (24.1%) | 100 (16.3%) |
| Total | 522 (100.0%) | 614 (100.0%) |
Real Estate Taxes by Mortgage Status in Forest City
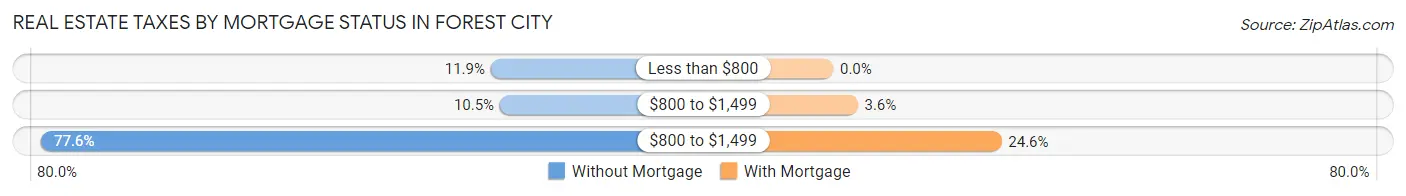
| Property Taxes | Without Mortgage | With Mortgage |
| Less than $800 | 62 (11.9%) | 0 (0.0%) |
| $800 to $1,499 | 55 (10.5%) | 22 (3.6%) |
| $800 to $1,499 | 405 (77.6%) | 151 (24.6%) |
| Total | 522 (100.0%) | 614 (100.0%) |
Health & Disability in Forest City
Health Insurance Coverage by Age in Forest City
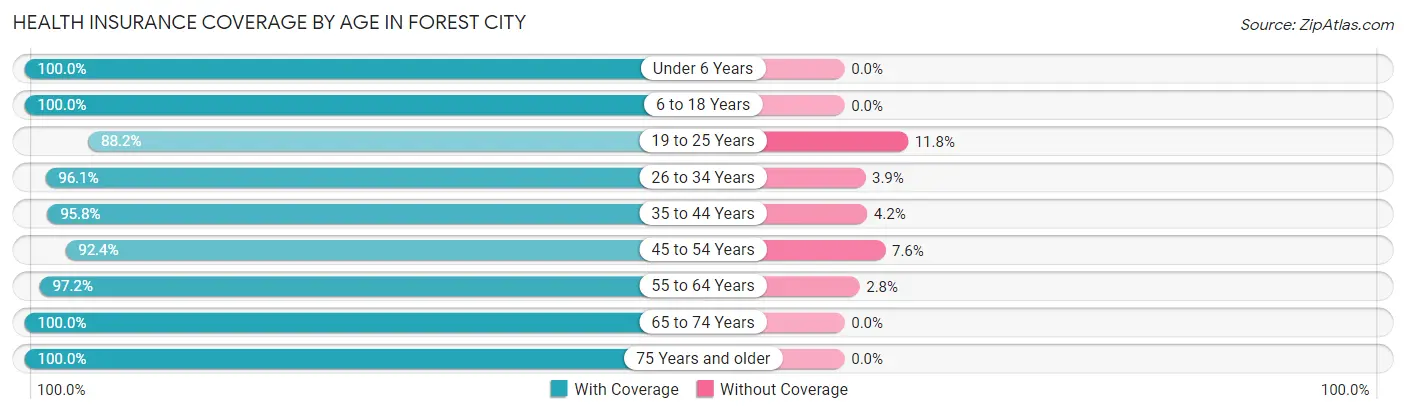
| Age Bracket | With Coverage | Without Coverage |
| Under 6 Years | 340 (100.0%) | 0 (0.0%) |
| 6 to 18 Years | 810 (100.0%) | 0 (0.0%) |
| 19 to 25 Years | 596 (88.2%) | 80 (11.8%) |
| 26 to 34 Years | 397 (96.1%) | 16 (3.9%) |
| 35 to 44 Years | 635 (95.8%) | 28 (4.2%) |
| 45 to 54 Years | 231 (92.4%) | 19 (7.6%) |
| 55 to 64 Years | 349 (97.2%) | 10 (2.8%) |
| 65 to 74 Years | 390 (100.0%) | 0 (0.0%) |
| 75 Years and older | 226 (100.0%) | 0 (0.0%) |
| Total | 3,974 (96.3%) | 153 (3.7%) |
Health Insurance Coverage by Citizenship Status in Forest City
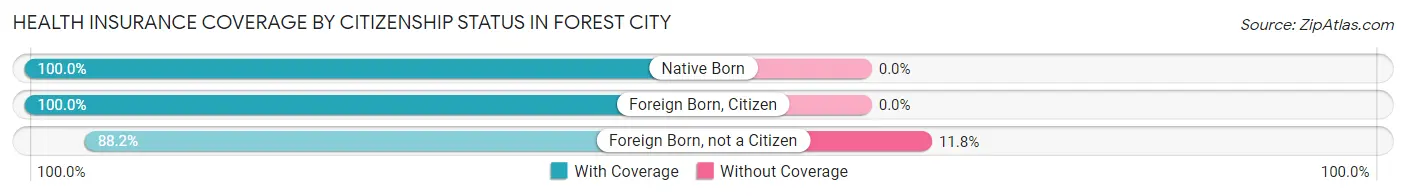
| Citizenship Status | With Coverage | Without Coverage |
| Native Born | 340 (100.0%) | 0 (0.0%) |
| Foreign Born, Citizen | 810 (100.0%) | 0 (0.0%) |
| Foreign Born, not a Citizen | 596 (88.2%) | 80 (11.8%) |
Health Insurance Coverage by Household Income in Forest City
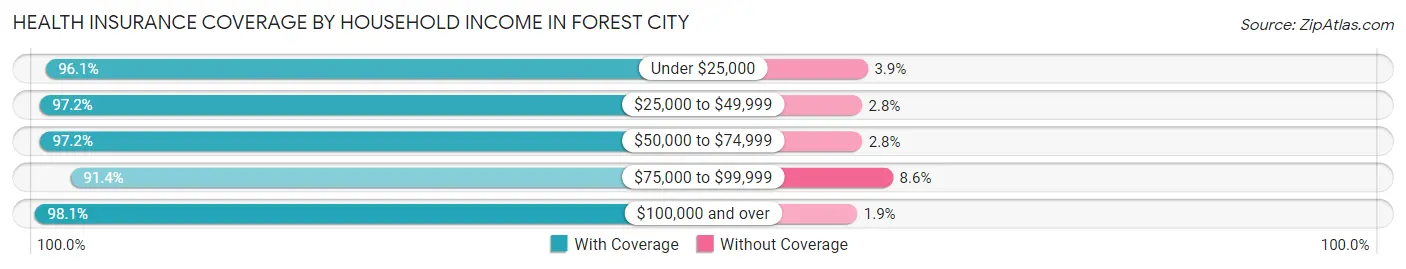
| Household Income | With Coverage | Without Coverage |
| Under $25,000 | 348 (96.1%) | 14 (3.9%) |
| $25,000 to $49,999 | 490 (97.2%) | 14 (2.8%) |
| $50,000 to $74,999 | 1,071 (97.2%) | 31 (2.8%) |
| $75,000 to $99,999 | 500 (91.4%) | 47 (8.6%) |
| $100,000 and over | 1,144 (98.1%) | 22 (1.9%) |
Public vs Private Health Insurance Coverage by Age in Forest City
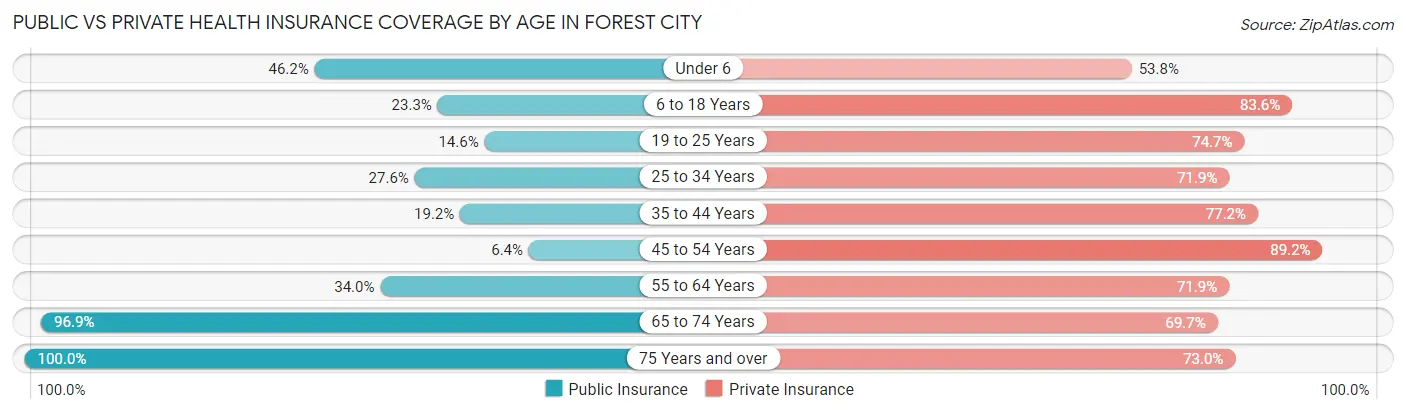
| Age Bracket | Public Insurance | Private Insurance |
| Under 6 | 157 (46.2%) | 183 (53.8%) |
| 6 to 18 Years | 189 (23.3%) | 677 (83.6%) |
| 19 to 25 Years | 99 (14.6%) | 505 (74.7%) |
| 25 to 34 Years | 114 (27.6%) | 297 (71.9%) |
| 35 to 44 Years | 127 (19.2%) | 512 (77.2%) |
| 45 to 54 Years | 16 (6.4%) | 223 (89.2%) |
| 55 to 64 Years | 122 (34.0%) | 258 (71.9%) |
| 65 to 74 Years | 378 (96.9%) | 272 (69.7%) |
| 75 Years and over | 226 (100.0%) | 165 (73.0%) |
| Total | 1,428 (34.6%) | 3,092 (74.9%) |
Disability Status by Sex by Age in Forest City
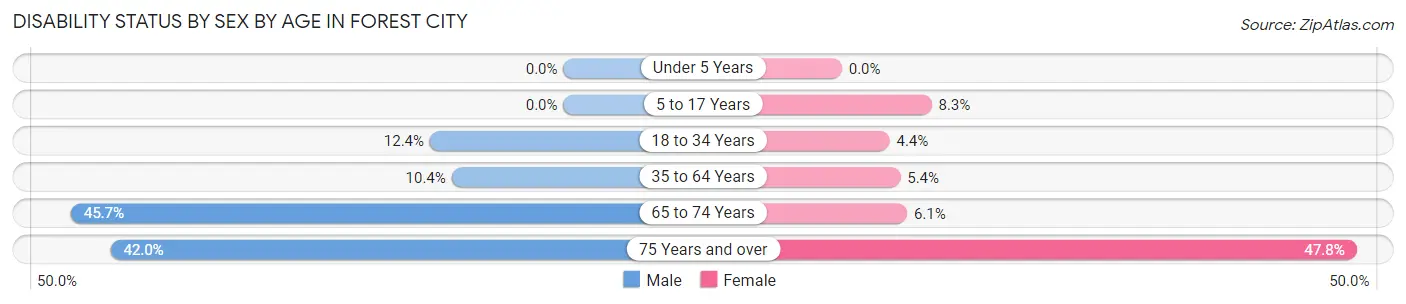
| Age Bracket | Male | Female |
| Under 5 Years | 0 (0.0%) | 0 (0.0%) |
| 5 to 17 Years | 0 (0.0%) | 37 (8.3%) |
| 18 to 34 Years | 96 (12.4%) | 20 (4.4%) |
| 35 to 64 Years | 67 (10.4%) | 34 (5.4%) |
| 65 to 74 Years | 80 (45.7%) | 13 (6.0%) |
| 75 Years and over | 29 (42.0%) | 75 (47.8%) |
Disability Class by Sex by Age in Forest City
Disability Class: Hearing Difficulty
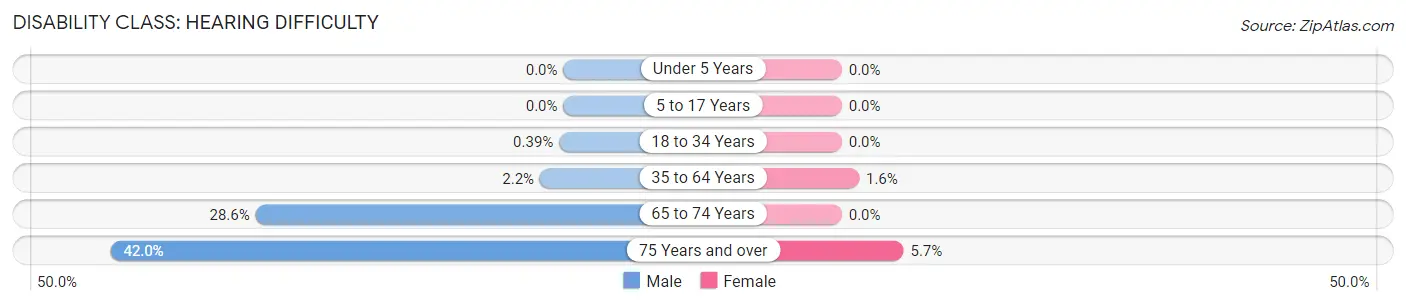
| Age Bracket | Male | Female |
| Under 5 Years | 0 (0.0%) | 0 (0.0%) |
| 5 to 17 Years | 0 (0.0%) | 0 (0.0%) |
| 18 to 34 Years | 3 (0.4%) | 0 (0.0%) |
| 35 to 64 Years | 14 (2.2%) | 10 (1.6%) |
| 65 to 74 Years | 50 (28.6%) | 0 (0.0%) |
| 75 Years and over | 29 (42.0%) | 9 (5.7%) |
Disability Class: Vision Difficulty
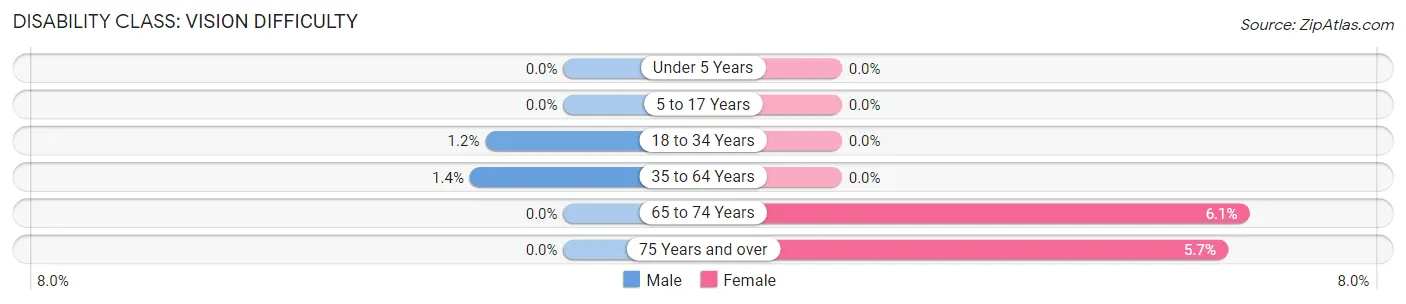
| Age Bracket | Male | Female |
| Under 5 Years | 0 (0.0%) | 0 (0.0%) |
| 5 to 17 Years | 0 (0.0%) | 0 (0.0%) |
| 18 to 34 Years | 9 (1.2%) | 0 (0.0%) |
| 35 to 64 Years | 9 (1.4%) | 0 (0.0%) |
| 65 to 74 Years | 0 (0.0%) | 13 (6.0%) |
| 75 Years and over | 0 (0.0%) | 9 (5.7%) |
Disability Class: Cognitive Difficulty
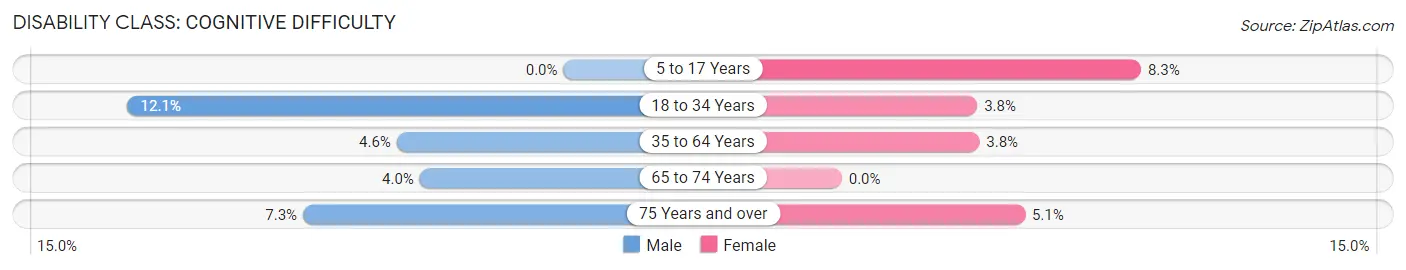
| Age Bracket | Male | Female |
| 5 to 17 Years | 0 (0.0%) | 37 (8.3%) |
| 18 to 34 Years | 94 (12.1%) | 17 (3.8%) |
| 35 to 64 Years | 30 (4.6%) | 24 (3.8%) |
| 65 to 74 Years | 7 (4.0%) | 0 (0.0%) |
| 75 Years and over | 5 (7.2%) | 8 (5.1%) |
Disability Class: Ambulatory Difficulty
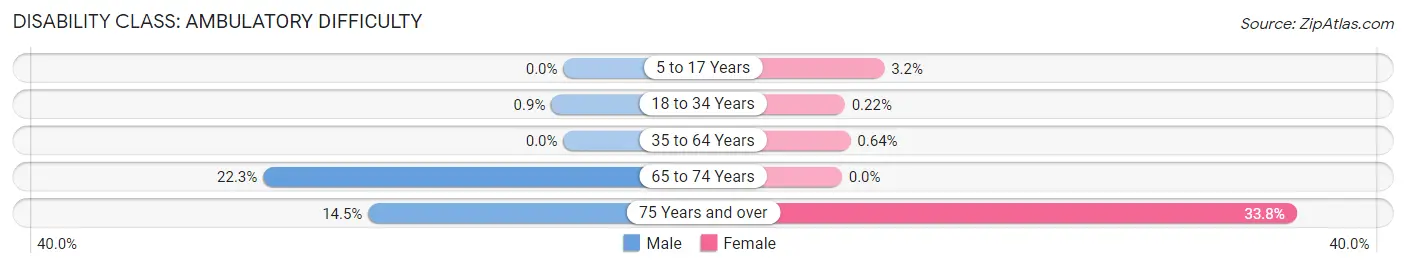
| Age Bracket | Male | Female |
| 5 to 17 Years | 0 (0.0%) | 14 (3.2%) |
| 18 to 34 Years | 7 (0.9%) | 1 (0.2%) |
| 35 to 64 Years | 0 (0.0%) | 4 (0.6%) |
| 65 to 74 Years | 39 (22.3%) | 0 (0.0%) |
| 75 Years and over | 10 (14.5%) | 53 (33.8%) |
Disability Class: Self-Care Difficulty
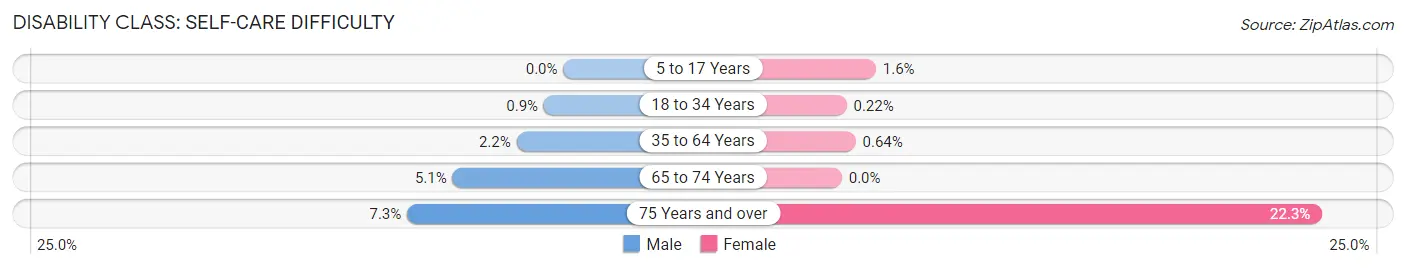
| Age Bracket | Male | Female |
| 5 to 17 Years | 0 (0.0%) | 7 (1.6%) |
| 18 to 34 Years | 7 (0.9%) | 1 (0.2%) |
| 35 to 64 Years | 14 (2.2%) | 4 (0.6%) |
| 65 to 74 Years | 9 (5.1%) | 0 (0.0%) |
| 75 Years and over | 5 (7.2%) | 35 (22.3%) |
Technology Access in Forest City
Computing Device Access in Forest City
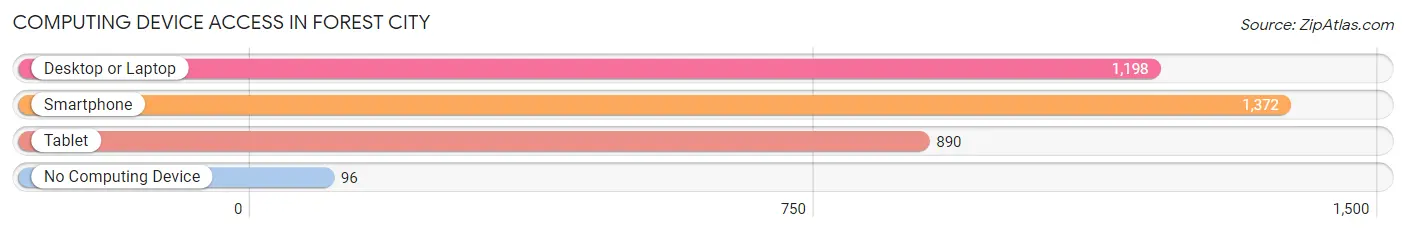
| Device Type | # Households | % Households |
| Desktop or Laptop | 1,198 | 75.8% |
| Smartphone | 1,372 | 86.8% |
| Tablet | 890 | 56.3% |
| No Computing Device | 96 | 6.1% |
| Total | 1,580 | 100.0% |
Internet Access in Forest City
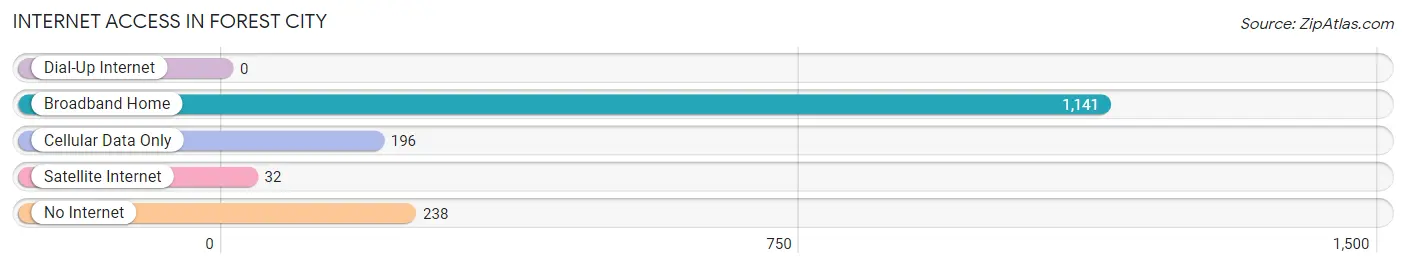
| Internet Type | # Households | % Households |
| Dial-Up Internet | 0 | 0.0% |
| Broadband Home | 1,141 | 72.2% |
| Cellular Data Only | 196 | 12.4% |
| Satellite Internet | 32 | 2.0% |
| No Internet | 238 | 15.1% |
| Total | 1,580 | 100.0% |
Forest City Summary
City of Forest City Iowa
History
The city of Forest City, Iowa is located in Winnebago County in the north-central part of the state. It was founded in 1856 by a group of settlers from New York and was originally known as Forestville. The name was changed to Forest City in 1857. The city was incorporated in 1876 and has a population of 4,085 as of the 2010 census.
The city was named for the nearby forest, which was a popular destination for hunting and fishing. The area was also known for its abundance of wild game, including deer, elk, and bear.
The city was an important stop on the Chicago, Milwaukee, St. Paul and Pacific Railroad, which ran through the city from 1881 to 1971. The railroad was a major factor in the city's growth and development.
The city is also home to a number of historic sites, including the Forest City Opera House, which was built in 1891 and is now a museum. The city also has a number of historic homes, churches, and other buildings.
Geography
Forest City is located in north-central Iowa, about 50 miles north of Des Moines. It is situated in the Winnebago County, which is part of the Iowa Great Lakes region. The city is located on the banks of the Winnebago River, which flows through the city.
The city has a total area of 4.2 square miles, all of which is land. The city is located at an elevation of 1,072 feet above sea level.
The climate in Forest City is classified as humid continental, with hot summers and cold winters. The average temperature in July is 78 degrees Fahrenheit, and the average temperature in January is 18 degrees Fahrenheit.
Economy
The economy of Forest City is largely based on agriculture and manufacturing. The city is home to a number of manufacturing companies, including a John Deere plant, a Tyson Foods plant, and a Winnebago Industries plant.
The city is also home to a number of retail stores, restaurants, and other businesses. The city is served by the Forest City Municipal Airport, which is located just outside of town.
Demographics
As of the 2010 census, the population of Forest City was 4,085. The racial makeup of the city was 97.2% White, 0.7% African American, 0.3% Native American, 0.3% Asian, 0.1% Pacific Islander, 0.5% from other races, and 0.9% from two or more races. Hispanic or Latino of any race were 1.7% of the population.
The median income for a household in the city was $41,944, and the median income for a family was $50,917. The per capita income for the city was $20,845. About 8.2% of families and 10.2% of the population were below the poverty line, including 14.2% of those under age 18 and 6.2% of those age 65 or over.
Conclusion
The city of Forest City, Iowa is a small city located in Winnebago County in the north-central part of the state. It was founded in 1856 and has a population of 4,085 as of the 2010 census. The city is largely based on agriculture and manufacturing, and is home to a number of historic sites. The city has a humid continental climate, with hot summers and cold winters. The median income for a household in the city was $41,944, and the median income for a family was $50,917.
Common Questions
What is Per Capita Income in Forest City?
Per Capita income in Forest City is $31,414.
What is the Median Family Income in Forest City?
Median Family Income in Forest City is $77,105.
What is the Median Household income in Forest City?
Median Household Income in Forest City is $58,060.
What is Income or Wage Gap in Forest City?
Income or Wage Gap in Forest City is 9.5%.
Women in Forest City earn 90.5 cents for every dollar earned by a man.
What is Inequality or Gini Index in Forest City?
Inequality or Gini Index in Forest City is 0.45.
What is the Total Population of Forest City?
Total Population of Forest City is 4,254.
What is the Total Male Population of Forest City?
Total Male Population of Forest City is 2,203.
What is the Total Female Population of Forest City?
Total Female Population of Forest City is 2,051.
What is the Ratio of Males per 100 Females in Forest City?
There are 107.41 Males per 100 Females in Forest City.
What is the Ratio of Females per 100 Males in Forest City?
There are 93.10 Females per 100 Males in Forest City.
What is the Median Population Age in Forest City?
Median Population Age in Forest City is 31.7 Years.
What is the Average Family Size in Forest City
Average Family Size in Forest City is 3.1 People.
What is the Average Household Size in Forest City
Average Household Size in Forest City is 2.3 People.
How Large is the Labor Force in Forest City?
There are 2,291 People in the Labor Forcein in Forest City.
What is the Percentage of People in the Labor Force in Forest City?
67.0% of People are in the Labor Force in Forest City.
What is the Unemployment Rate in Forest City?
Unemployment Rate in Forest City is 2.4%.