Monmouth Junction, NJ Map & Demographics
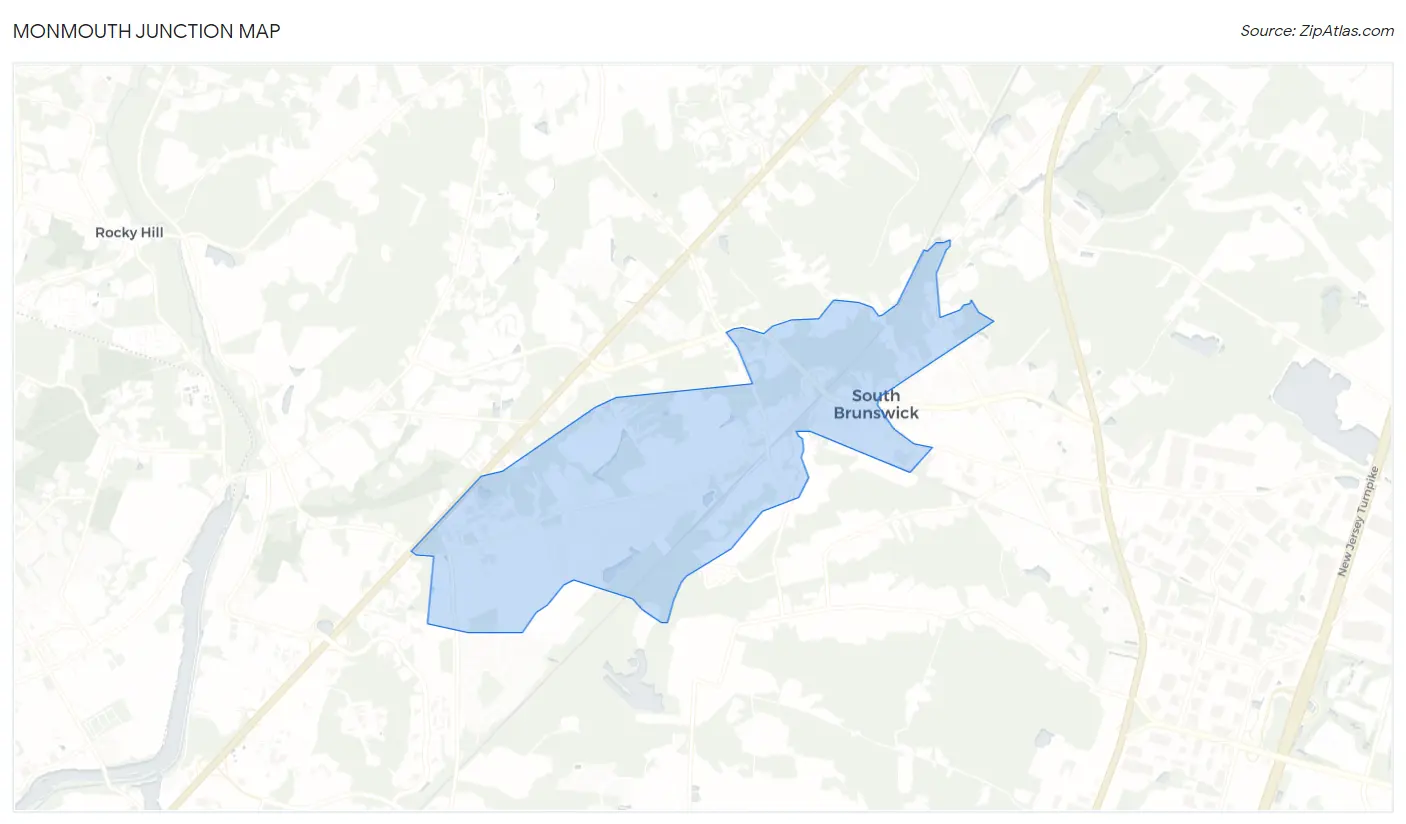
Monmouth Junction Map
Monmouth Junction Overview
$60,679
PER CAPITA INCOME
$144,612
AVG FAMILY INCOME
$121,857
AVG HOUSEHOLD INCOME
50.2%
WAGE / INCOME GAP [ % ]
49.8¢/ $1
WAGE / INCOME GAP [ $ ]
0.41
INEQUALITY / GINI INDEX
9,750
TOTAL POPULATION
4,566
MALE POPULATION
5,184
FEMALE POPULATION
88.08
MALES / 100 FEMALES
113.53
FEMALES / 100 MALES
38.6
MEDIAN AGE
3.2
AVG FAMILY SIZE
2.7
AVG HOUSEHOLD SIZE
5,698
LABOR FORCE [ PEOPLE ]
74.7%
PERCENT IN LABOR FORCE
2.9%
UNEMPLOYMENT RATE
Monmouth Junction Zip Codes
Income in Monmouth Junction
Income Overview in Monmouth Junction
Per Capita Income in Monmouth Junction is $60,679, while median incomes of families and households are $144,612 and $121,857 respectively.
| Characteristic | Number | Measure |
| Per Capita Income | 9,750 | $60,679 |
| Median Family Income | 2,691 | $144,612 |
| Mean Family Income | 2,691 | $180,869 |
| Median Household Income | 3,633 | $121,857 |
| Mean Household Income | 3,633 | $163,307 |
| Income Deficit | 2,691 | $0 |
| Wage / Income Gap (%) | 9,750 | 50.19% |
| Wage / Income Gap ($) | 9,750 | 49.81¢ per $1 |
| Gini / Inequality Index | 9,750 | 0.41 |
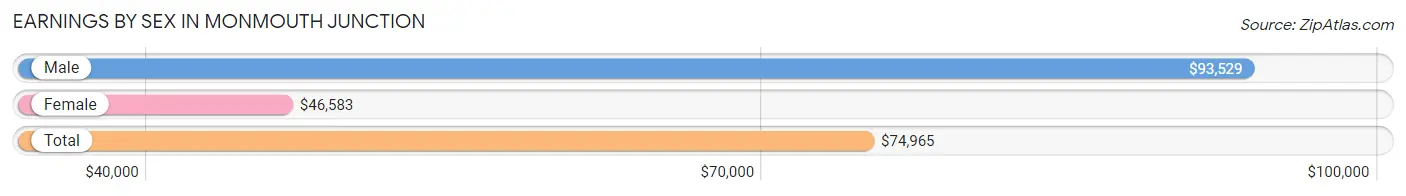
Earnings by Sex in Monmouth Junction
Average Earnings in Monmouth Junction are $74,965, $93,529 for men and $46,583 for women, a difference of 50.2%.
| Sex | Number | Average Earnings |
| Male | 3,094 (54.3%) | $93,529 |
| Female | 2,603 (45.7%) | $46,583 |
| Total | 5,697 (100.0%) | $74,965 |
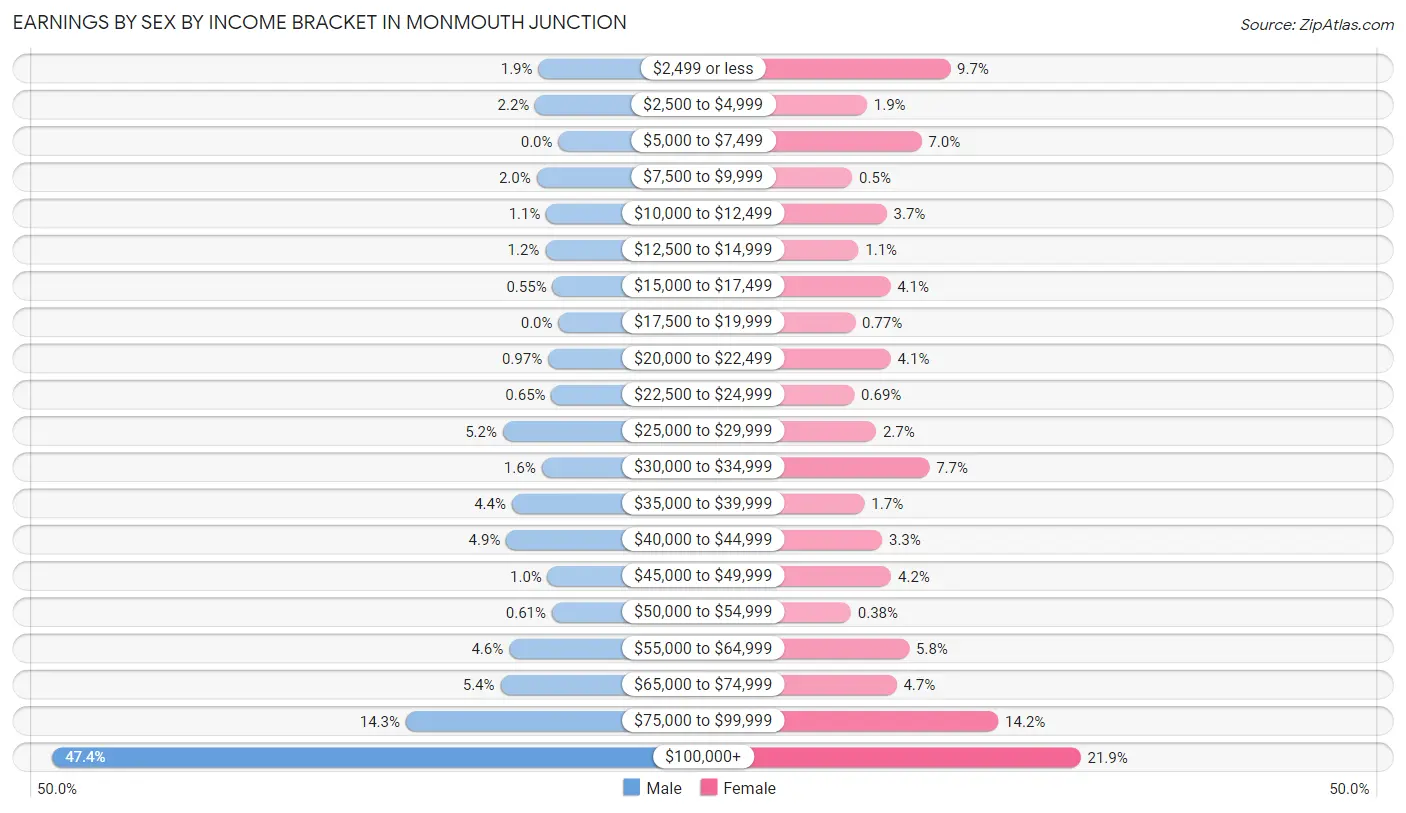
Earnings by Sex by Income Bracket in Monmouth Junction
The most common earnings brackets in Monmouth Junction are $100,000+ for men (1,467 | 47.4%) and $100,000+ for women (570 | 21.9%).
| Income | Male | Female |
| $2,499 or less | 58 (1.9%) | 252 (9.7%) |
| $2,500 to $4,999 | 67 (2.2%) | 49 (1.9%) |
| $5,000 to $7,499 | 0 (0.0%) | 182 (7.0%) |
| $7,500 to $9,999 | 63 (2.0%) | 13 (0.5%) |
| $10,000 to $12,499 | 35 (1.1%) | 97 (3.7%) |
| $12,500 to $14,999 | 38 (1.2%) | 28 (1.1%) |
| $15,000 to $17,499 | 17 (0.5%) | 106 (4.1%) |
| $17,500 to $19,999 | 0 (0.0%) | 20 (0.8%) |
| $20,000 to $22,499 | 30 (1.0%) | 107 (4.1%) |
| $22,500 to $24,999 | 20 (0.6%) | 18 (0.7%) |
| $25,000 to $29,999 | 161 (5.2%) | 71 (2.7%) |
| $30,000 to $34,999 | 49 (1.6%) | 201 (7.7%) |
| $35,000 to $39,999 | 135 (4.4%) | 43 (1.7%) |
| $40,000 to $44,999 | 151 (4.9%) | 86 (3.3%) |
| $45,000 to $49,999 | 31 (1.0%) | 108 (4.2%) |
| $50,000 to $54,999 | 19 (0.6%) | 10 (0.4%) |
| $55,000 to $64,999 | 143 (4.6%) | 152 (5.8%) |
| $65,000 to $74,999 | 168 (5.4%) | 121 (4.6%) |
| $75,000 to $99,999 | 442 (14.3%) | 369 (14.2%) |
| $100,000+ | 1,467 (47.4%) | 570 (21.9%) |
| Total | 3,094 (100.0%) | 2,603 (100.0%) |
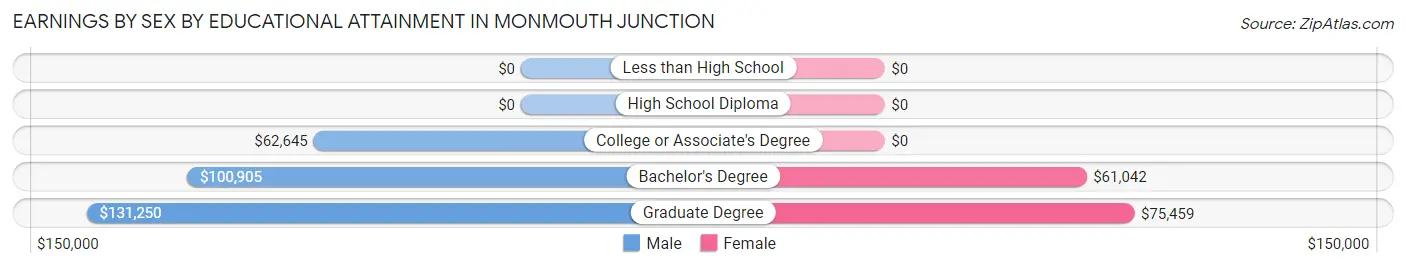
Earnings by Sex by Educational Attainment in Monmouth Junction
Average earnings in Monmouth Junction are $100,516 for men and $56,922 for women, a difference of 43.4%. Men with an educational attainment of graduate degree enjoy the highest average annual earnings of $131,250, while those with college or associate's degree education earn the least with $62,645. Women with an educational attainment of graduate degree earn the most with the average annual earnings of $75,459, while those with bachelor's degree education have the smallest earnings of $61,042.
| Educational Attainment | Male Income | Female Income |
| Less than High School | - | - |
| High School Diploma | - | - |
| College or Associate's Degree | $62,645 | $0 |
| Bachelor's Degree | $100,905 | $61,042 |
| Graduate Degree | $131,250 | $75,459 |
| Total | $100,516 | $56,922 |
Family Income in Monmouth Junction
Family Income Brackets in Monmouth Junction
According to the Monmouth Junction family income data, there are 1,052 families falling into the $200,000+ income range, which is the most common income bracket and makes up 39.1% of all families.
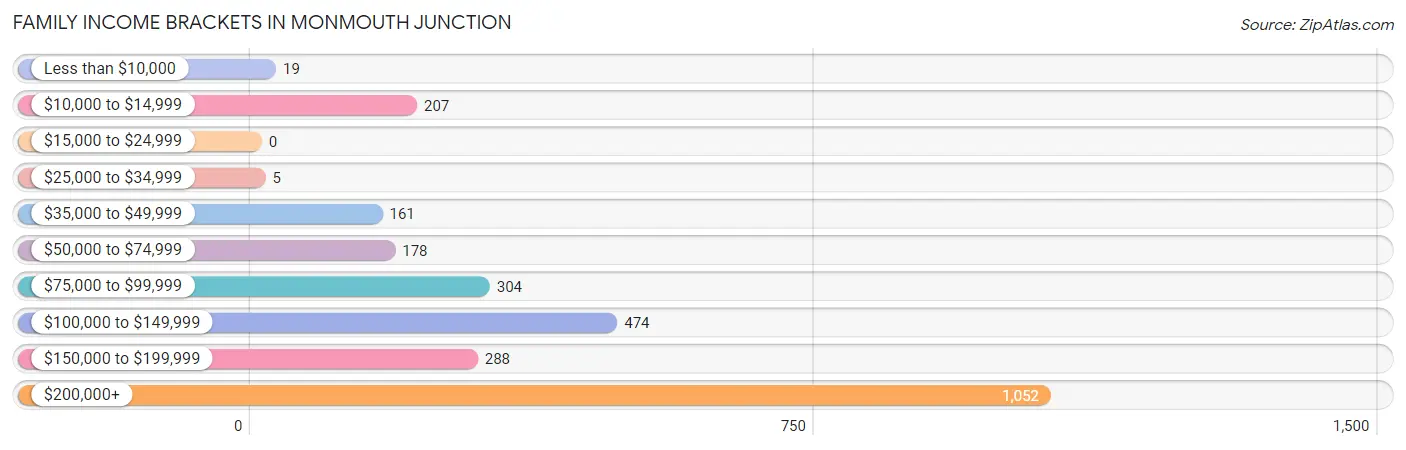
| Income Bracket | # Families | % Families |
| Less than $10,000 | 19 | 0.7% |
| $10,000 to $14,999 | 207 | 7.7% |
| $15,000 to $24,999 | 0 | 0.0% |
| $25,000 to $34,999 | 5 | 0.2% |
| $35,000 to $49,999 | 161 | 6.0% |
| $50,000 to $74,999 | 178 | 6.6% |
| $75,000 to $99,999 | 304 | 11.3% |
| $100,000 to $149,999 | 474 | 17.6% |
| $150,000 to $199,999 | 288 | 10.7% |
| $200,000+ | 1,052 | 39.1% |
Family Income by Famaliy Size in Monmouth Junction
4-person families (954 | 35.4%) account for the highest median family income in Monmouth Junction with $224,118 per family, while 4-person families (954 | 35.4%) have the highest median income of $56,030 per family member.
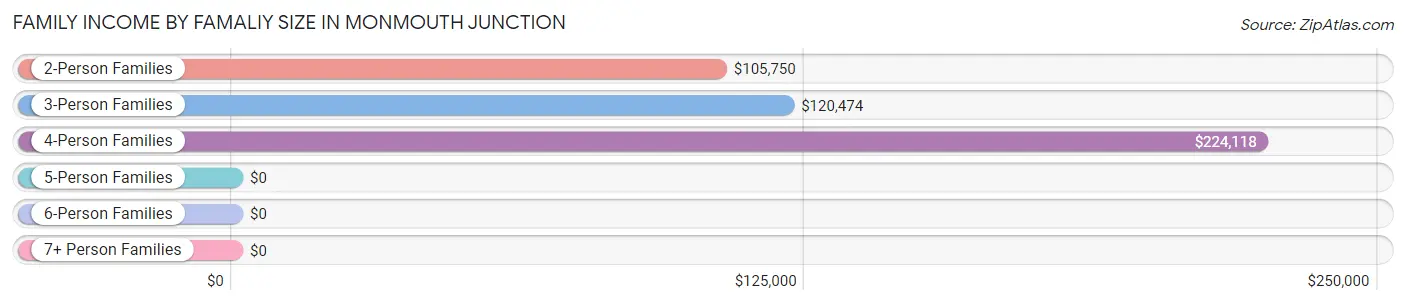
| Income Bracket | # Families | Median Income |
| 2-Person Families | 790 (29.4%) | $105,750 |
| 3-Person Families | 892 (33.2%) | $120,474 |
| 4-Person Families | 954 (35.4%) | $224,118 |
| 5-Person Families | 37 (1.4%) | $0 |
| 6-Person Families | 7 (0.3%) | $0 |
| 7+ Person Families | 11 (0.4%) | $0 |
| Total | 2,691 (100.0%) | $144,612 |
Family Income by Number of Earners in Monmouth Junction
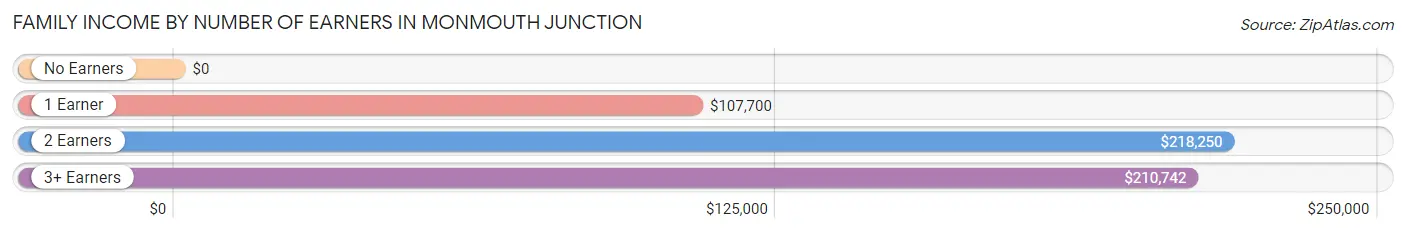
| Number of Earners | # Families | Median Income |
| No Earners | 287 (10.7%) | $0 |
| 1 Earner | 640 (23.8%) | $107,700 |
| 2 Earners | 1,193 (44.3%) | $218,250 |
| 3+ Earners | 571 (21.2%) | $210,742 |
| Total | 2,691 (100.0%) | $144,612 |
Household Income in Monmouth Junction
Household Income Brackets in Monmouth Junction
With 1,213 households falling in the category, the $200,000+ income range is the most frequent in Monmouth Junction, accounting for 33.4% of all households. In contrast, only 18 households (0.5%) fall into the less than $10,000 income bracket, making it the least populous group.
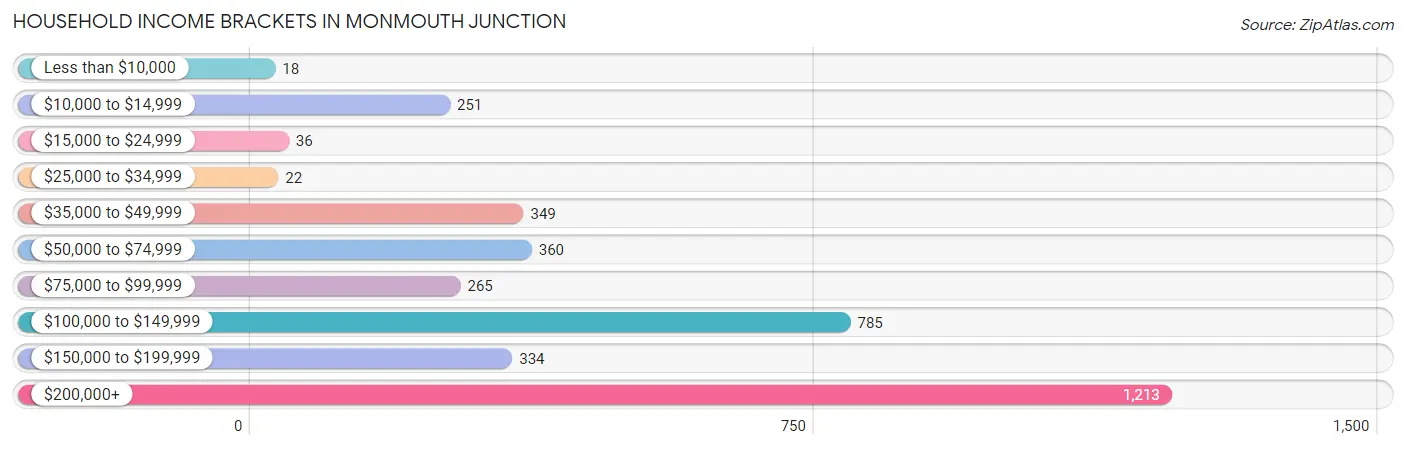
| Income Bracket | # Households | % Households |
| Less than $10,000 | 18 | 0.5% |
| $10,000 to $14,999 | 251 | 6.9% |
| $15,000 to $24,999 | 36 | 1.0% |
| $25,000 to $34,999 | 22 | 0.6% |
| $35,000 to $49,999 | 349 | 9.6% |
| $50,000 to $74,999 | 360 | 9.9% |
| $75,000 to $99,999 | 265 | 7.3% |
| $100,000 to $149,999 | 785 | 21.6% |
| $150,000 to $199,999 | 334 | 9.2% |
| $200,000+ | 1,213 | 33.4% |
Household Income by Householder Age in Monmouth Junction
The median household income in Monmouth Junction is $121,857, with the highest median household income of $196,829 found in the 45 to 64 years age bracket for the primary householder. A total of 1,850 households (50.9%) fall into this category. Meanwhile, the 15 to 24 years age bracket for the primary householder has the lowest median household income of $0, with 38 households (1.1%) in this group.
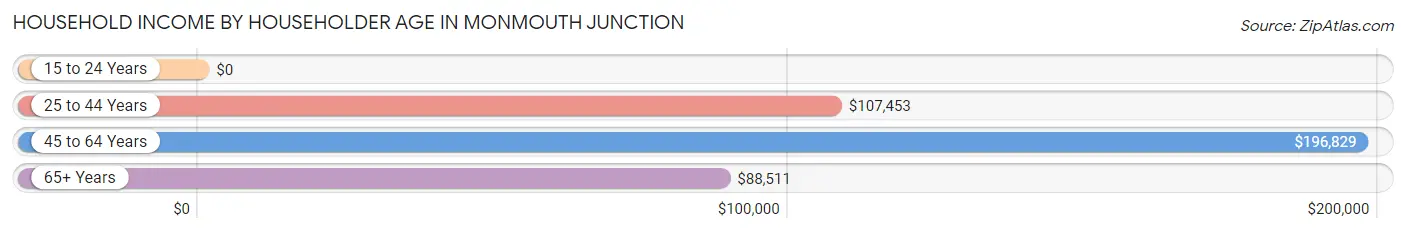
| Income Bracket | # Households | Median Income |
| 15 to 24 Years | 38 (1.1%) | $0 |
| 25 to 44 Years | 1,303 (35.9%) | $107,453 |
| 45 to 64 Years | 1,850 (50.9%) | $196,829 |
| 65+ Years | 442 (12.2%) | $88,511 |
| Total | 3,633 (100.0%) | $121,857 |
Poverty in Monmouth Junction
Income Below Poverty by Sex and Age in Monmouth Junction
With 4.0% poverty level for males and 8.6% for females among the residents of Monmouth Junction, 18 to 24 year old males and 6 to 11 year old females are the most vulnerable to poverty, with 51 males (16.5%) and 109 females (20.6%) in their respective age groups living below the poverty level.
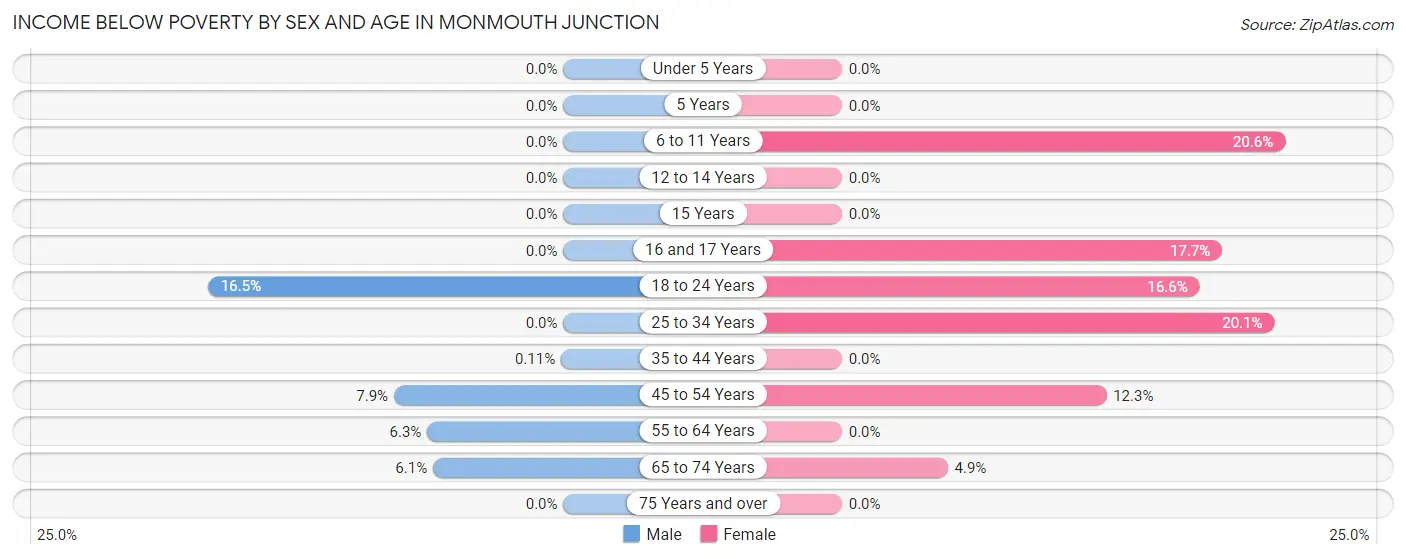
| Age Bracket | Male | Female |
| Under 5 Years | 0 (0.0%) | 0 (0.0%) |
| 5 Years | 0 (0.0%) | 0 (0.0%) |
| 6 to 11 Years | 0 (0.0%) | 109 (20.6%) |
| 12 to 14 Years | 0 (0.0%) | 0 (0.0%) |
| 15 Years | 0 (0.0%) | 0 (0.0%) |
| 16 and 17 Years | 0 (0.0%) | 24 (17.6%) |
| 18 to 24 Years | 51 (16.5%) | 85 (16.6%) |
| 25 to 34 Years | 0 (0.0%) | 116 (20.1%) |
| 35 to 44 Years | 1 (0.1%) | 0 (0.0%) |
| 45 to 54 Years | 63 (7.9%) | 92 (12.3%) |
| 55 to 64 Years | 45 (6.3%) | 0 (0.0%) |
| 65 to 74 Years | 21 (6.0%) | 19 (4.9%) |
| 75 Years and over | 0 (0.0%) | 0 (0.0%) |
| Total | 181 (4.0%) | 445 (8.6%) |
Income Above Poverty by Sex and Age in Monmouth Junction
According to the poverty statistics in Monmouth Junction, males aged under 5 years and females aged under 5 years are the age groups that are most secure financially, with 100.0% of males and 100.0% of females in these age groups living above the poverty line.
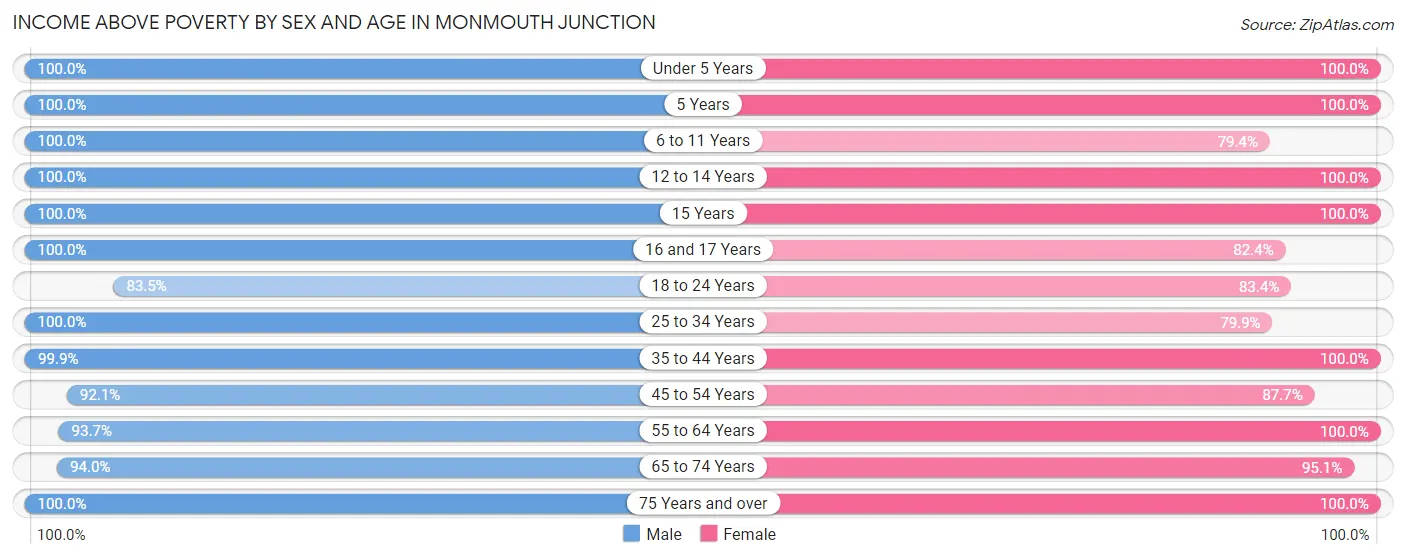
| Age Bracket | Male | Female |
| Under 5 Years | 262 (100.0%) | 284 (100.0%) |
| 5 Years | 48 (100.0%) | 82 (100.0%) |
| 6 to 11 Years | 442 (100.0%) | 421 (79.4%) |
| 12 to 14 Years | 147 (100.0%) | 133 (100.0%) |
| 15 Years | 45 (100.0%) | 149 (100.0%) |
| 16 and 17 Years | 59 (100.0%) | 112 (82.4%) |
| 18 to 24 Years | 258 (83.5%) | 427 (83.4%) |
| 25 to 34 Years | 480 (100.0%) | 462 (79.9%) |
| 35 to 44 Years | 872 (99.9%) | 782 (100.0%) |
| 45 to 54 Years | 739 (92.1%) | 658 (87.7%) |
| 55 to 64 Years | 667 (93.7%) | 750 (100.0%) |
| 65 to 74 Years | 326 (94.0%) | 368 (95.1%) |
| 75 Years and over | 40 (100.0%) | 111 (100.0%) |
| Total | 4,385 (96.0%) | 4,739 (91.4%) |
Income Below Poverty Among Married-Couple Families in Monmouth Junction
The poverty statistics for married-couple families in Monmouth Junction show that 4.8% or 111 of the total 2,321 families live below the poverty line. Families with no children have the highest poverty rate of 9.3%, comprising of 111 families. On the other hand, families with 1 or 2 children have the lowest poverty rate of 0.0%, which includes 0 families.
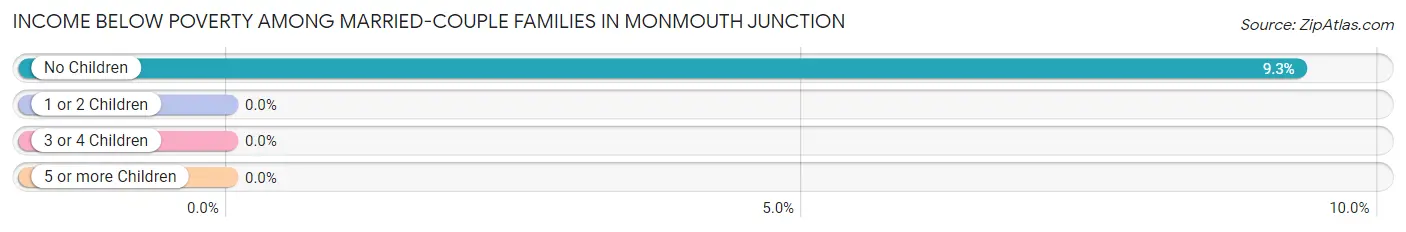
| Children | Above Poverty | Below Poverty |
| No Children | 1,082 (90.7%) | 111 (9.3%) |
| 1 or 2 Children | 1,104 (100.0%) | 0 (0.0%) |
| 3 or 4 Children | 24 (100.0%) | 0 (0.0%) |
| 5 or more Children | 0 (0.0%) | 0 (0.0%) |
| Total | 2,210 (95.2%) | 111 (4.8%) |
Income Below Poverty Among Single-Parent Households in Monmouth Junction
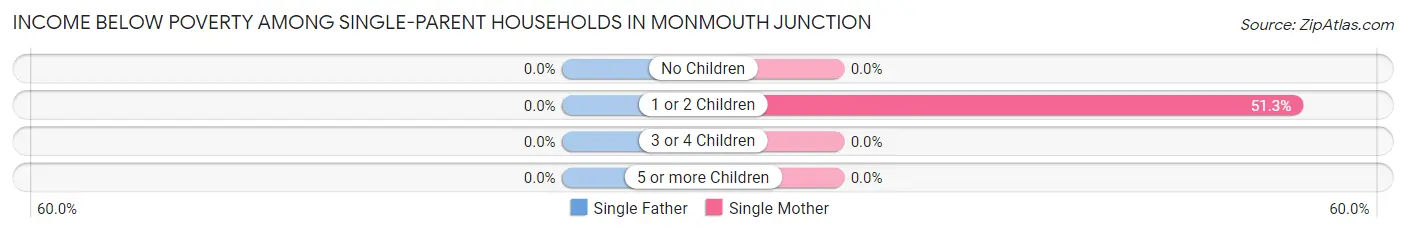
| Children | Single Father | Single Mother |
| No Children | 0 (0.0%) | 0 (0.0%) |
| 1 or 2 Children | 0 (0.0%) | 116 (51.3%) |
| 3 or 4 Children | 0 (0.0%) | 0 (0.0%) |
| 5 or more Children | 0 (0.0%) | 0 (0.0%) |
| Total | 0 (0.0%) | 116 (39.5%) |
Income Below Poverty Among Married-Couple vs Single-Parent Households in Monmouth Junction
The poverty data for Monmouth Junction shows that 111 of the married-couple family households (4.8%) and 116 of the single-parent households (31.4%) are living below the poverty level. Within the married-couple family households, those with no children have the highest poverty rate, with 111 households (9.3%) falling below the poverty line. Among the single-parent households, those with 1 or 2 children have the highest poverty rate, with 116 household (40.3%) living below poverty.
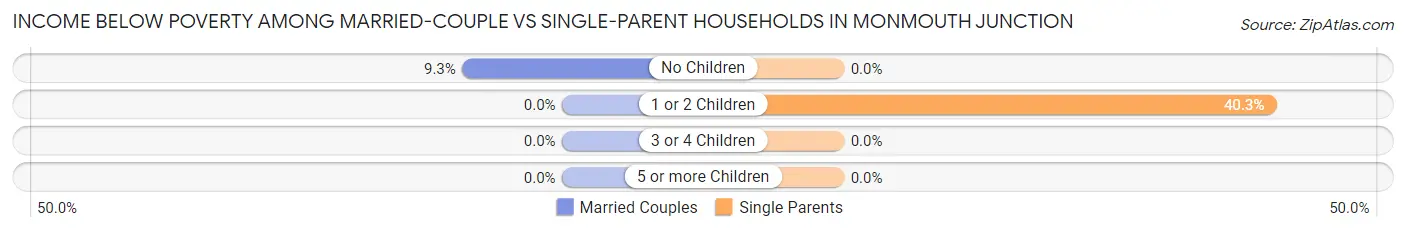
| Children | Married-Couple Families | Single-Parent Households |
| No Children | 111 (9.3%) | 0 (0.0%) |
| 1 or 2 Children | 0 (0.0%) | 116 (40.3%) |
| 3 or 4 Children | 0 (0.0%) | 0 (0.0%) |
| 5 or more Children | 0 (0.0%) | 0 (0.0%) |
| Total | 111 (4.8%) | 116 (31.4%) |
Race in Monmouth Junction
The most populous races in Monmouth Junction are Asian (5,349 | 54.9%), White / Caucasian (2,751 | 28.2%), and Hispanic or Latino (845 | 8.7%).
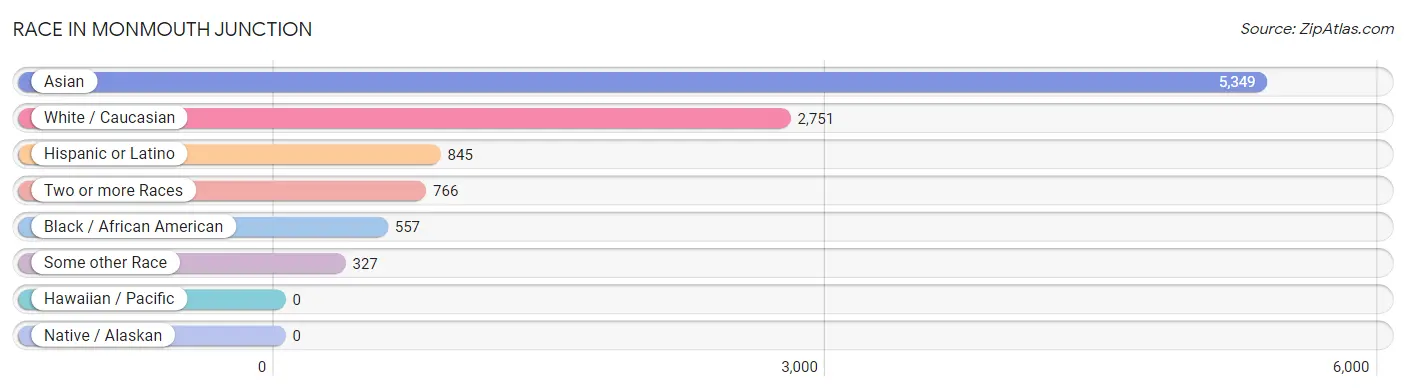
| Race | # Population | % Population |
| Asian | 5,349 | 54.9% |
| Black / African American | 557 | 5.7% |
| Hawaiian / Pacific | 0 | 0.0% |
| Hispanic or Latino | 845 | 8.7% |
| Native / Alaskan | 0 | 0.0% |
| White / Caucasian | 2,751 | 28.2% |
| Two or more Races | 766 | 7.9% |
| Some other Race | 327 | 3.4% |
| Total | 9,750 | 100.0% |
Ancestry in Monmouth Junction
The most populous ancestries reported in Monmouth Junction are Thai (4,241 | 43.5%), Italian (608 | 6.2%), Irish (574 | 5.9%), Indian (Asian) (466 | 4.8%), and American (391 | 4.0%), together accounting for 64.4% of all Monmouth Junction residents.
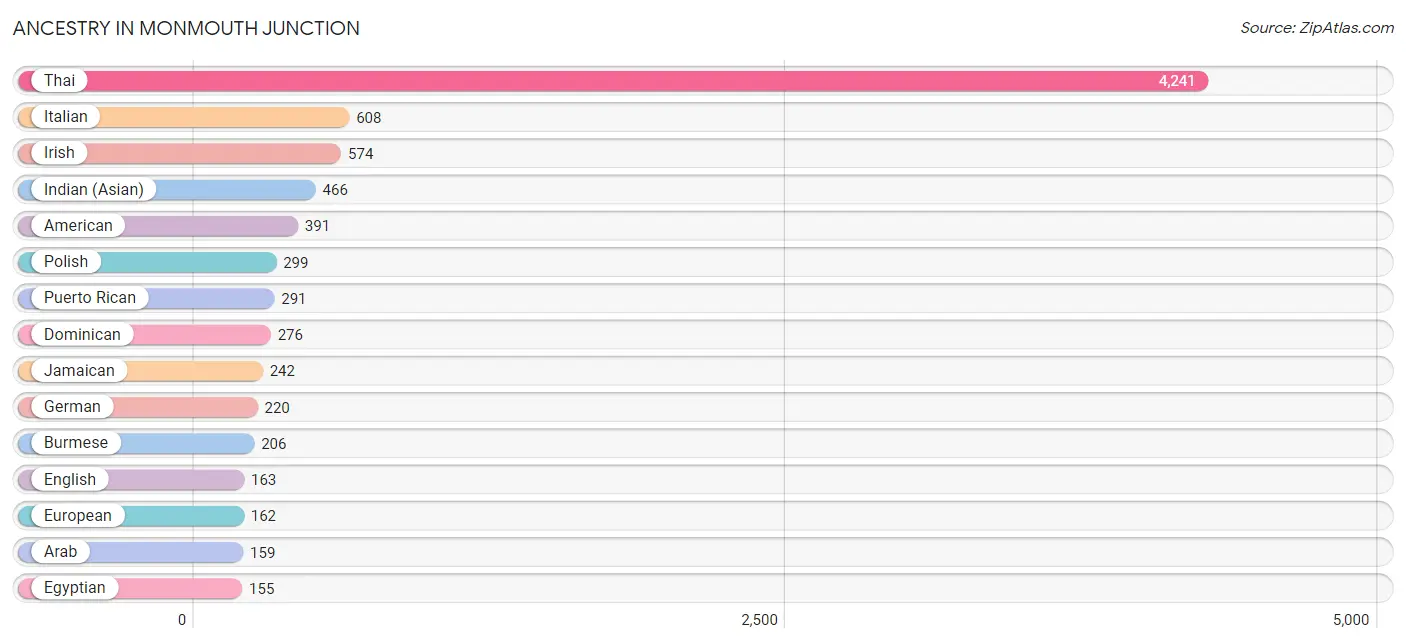
| Ancestry | # Population | % Population |
| American | 391 | 4.0% |
| Arab | 159 | 1.6% |
| Bhutanese | 142 | 1.5% |
| British | 65 | 0.7% |
| Burmese | 206 | 2.1% |
| Canadian | 19 | 0.2% |
| Central American | 92 | 0.9% |
| Colombian | 114 | 1.2% |
| Cuban | 40 | 0.4% |
| Cypriot | 14 | 0.1% |
| Dominican | 276 | 2.8% |
| Dutch | 41 | 0.4% |
| Eastern European | 28 | 0.3% |
| Egyptian | 155 | 1.6% |
| English | 163 | 1.7% |
| Estonian | 16 | 0.2% |
| European | 162 | 1.7% |
| Filipino | 10 | 0.1% |
| German | 220 | 2.3% |
| Greek | 20 | 0.2% |
| Hungarian | 76 | 0.8% |
| Indian (Asian) | 466 | 4.8% |
| Irish | 574 | 5.9% |
| Italian | 608 | 6.2% |
| Jamaican | 242 | 2.5% |
| Korean | 46 | 0.5% |
| Latvian | 16 | 0.2% |
| Lebanese | 4 | 0.0% |
| Panamanian | 92 | 0.9% |
| Polish | 299 | 3.1% |
| Puerto Rican | 291 | 3.0% |
| Romanian | 14 | 0.1% |
| Russian | 144 | 1.5% |
| Scandinavian | 58 | 0.6% |
| Scotch-Irish | 38 | 0.4% |
| South American | 146 | 1.5% |
| Swedish | 127 | 1.3% |
| Thai | 4,241 | 43.5% |
| Turkish | 11 | 0.1% |
| Ukrainian | 78 | 0.8% |
| Venezuelan | 32 | 0.3% |
| West Indian | 70 | 0.7% | View All 42 Rows |
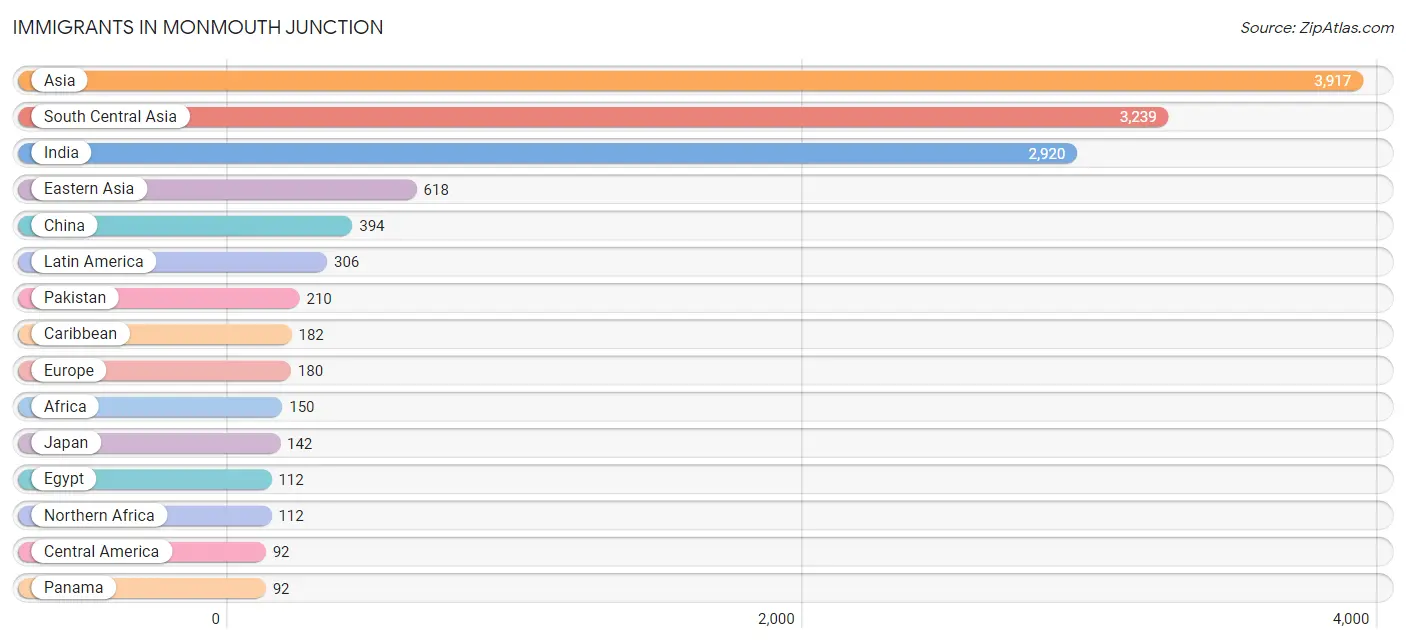
Immigrants in Monmouth Junction
The most numerous immigrant groups reported in Monmouth Junction came from Asia (3,917 | 40.2%), South Central Asia (3,239 | 33.2%), India (2,920 | 29.9%), Eastern Asia (618 | 6.3%), and China (394 | 4.0%), together accounting for 113.7% of all Monmouth Junction residents.
| Immigration Origin | # Population | % Population |
| Africa | 150 | 1.5% |
| Asia | 3,917 | 40.2% |
| Bangladesh | 40 | 0.4% |
| Canada | 4 | 0.0% |
| Caribbean | 182 | 1.9% |
| Central America | 92 | 0.9% |
| China | 394 | 4.0% |
| Cuba | 40 | 0.4% |
| Dominica | 38 | 0.4% |
| Dominican Republic | 18 | 0.2% |
| Eastern Africa | 38 | 0.4% |
| Eastern Asia | 618 | 6.3% |
| Eastern Europe | 74 | 0.8% |
| Egypt | 112 | 1.1% |
| Europe | 180 | 1.8% |
| Germany | 37 | 0.4% |
| Hong Kong | 34 | 0.4% |
| India | 2,920 | 29.9% |
| Italy | 13 | 0.1% |
| Jamaica | 86 | 0.9% |
| Japan | 142 | 1.5% |
| Kazakhstan | 10 | 0.1% |
| Kenya | 38 | 0.4% |
| Korea | 82 | 0.8% |
| Latin America | 306 | 3.1% |
| Lebanon | 4 | 0.0% |
| Northern Africa | 112 | 1.1% |
| Northern Europe | 56 | 0.6% |
| Pakistan | 210 | 2.1% |
| Panama | 92 | 0.9% |
| Philippines | 31 | 0.3% |
| Russia | 37 | 0.4% |
| Scotland | 19 | 0.2% |
| South America | 32 | 0.3% |
| South Central Asia | 3,239 | 33.2% |
| South Eastern Asia | 31 | 0.3% |
| Southern Europe | 13 | 0.1% |
| Sri Lanka | 59 | 0.6% |
| Taiwan | 90 | 0.9% |
| Turkey | 11 | 0.1% |
| Ukraine | 37 | 0.4% |
| Venezuela | 32 | 0.3% |
| Western Asia | 29 | 0.3% |
| Western Europe | 37 | 0.4% | View All 44 Rows |
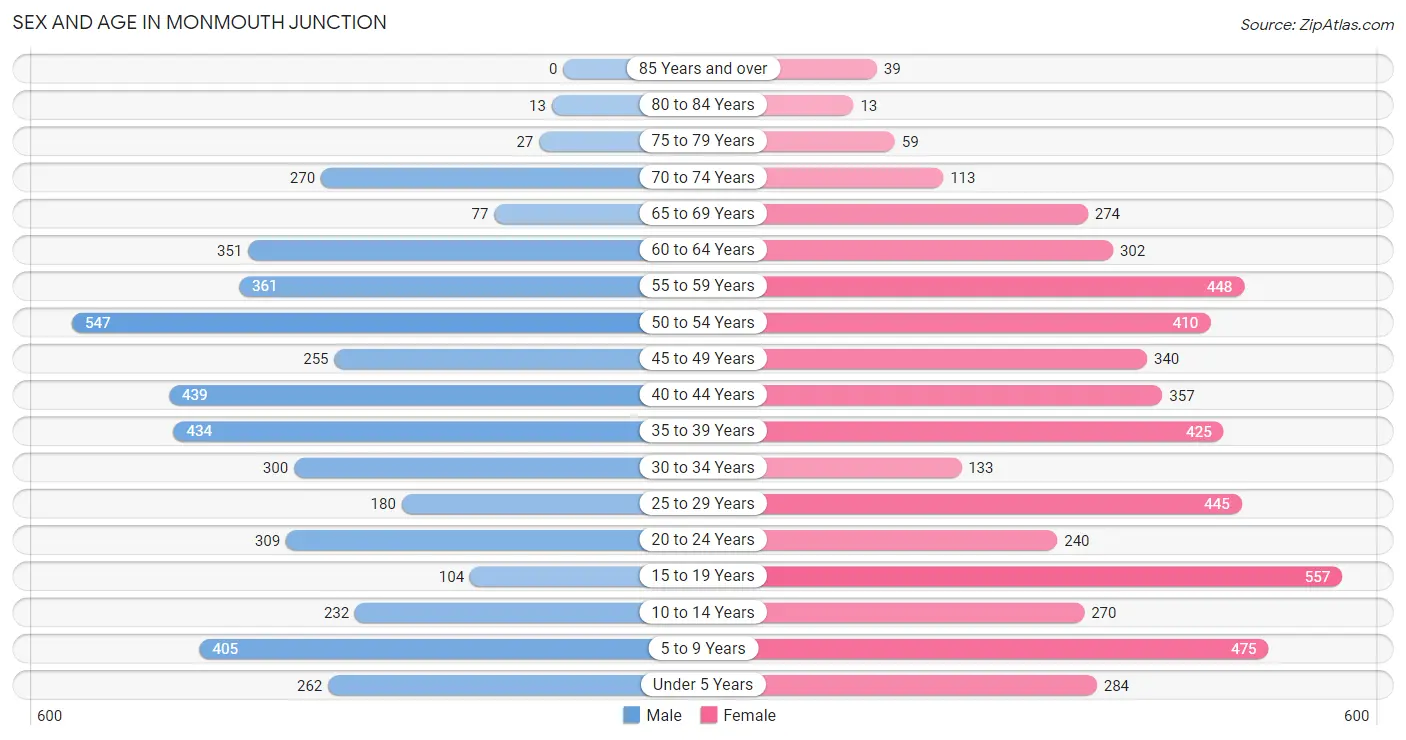
Sex and Age in Monmouth Junction
Sex and Age in Monmouth Junction
The most populous age groups in Monmouth Junction are 50 to 54 Years (547 | 12.0%) for men and 15 to 19 Years (557 | 10.7%) for women.
| Age Bracket | Male | Female |
| Under 5 Years | 262 (5.7%) | 284 (5.5%) |
| 5 to 9 Years | 405 (8.9%) | 475 (9.2%) |
| 10 to 14 Years | 232 (5.1%) | 270 (5.2%) |
| 15 to 19 Years | 104 (2.3%) | 557 (10.7%) |
| 20 to 24 Years | 309 (6.8%) | 240 (4.6%) |
| 25 to 29 Years | 180 (3.9%) | 445 (8.6%) |
| 30 to 34 Years | 300 (6.6%) | 133 (2.6%) |
| 35 to 39 Years | 434 (9.5%) | 425 (8.2%) |
| 40 to 44 Years | 439 (9.6%) | 357 (6.9%) |
| 45 to 49 Years | 255 (5.6%) | 340 (6.6%) |
| 50 to 54 Years | 547 (12.0%) | 410 (7.9%) |
| 55 to 59 Years | 361 (7.9%) | 448 (8.6%) |
| 60 to 64 Years | 351 (7.7%) | 302 (5.8%) |
| 65 to 69 Years | 77 (1.7%) | 274 (5.3%) |
| 70 to 74 Years | 270 (5.9%) | 113 (2.2%) |
| 75 to 79 Years | 27 (0.6%) | 59 (1.1%) |
| 80 to 84 Years | 13 (0.3%) | 13 (0.3%) |
| 85 Years and over | 0 (0.0%) | 39 (0.7%) |
| Total | 4,566 (100.0%) | 5,184 (100.0%) |
Families and Households in Monmouth Junction
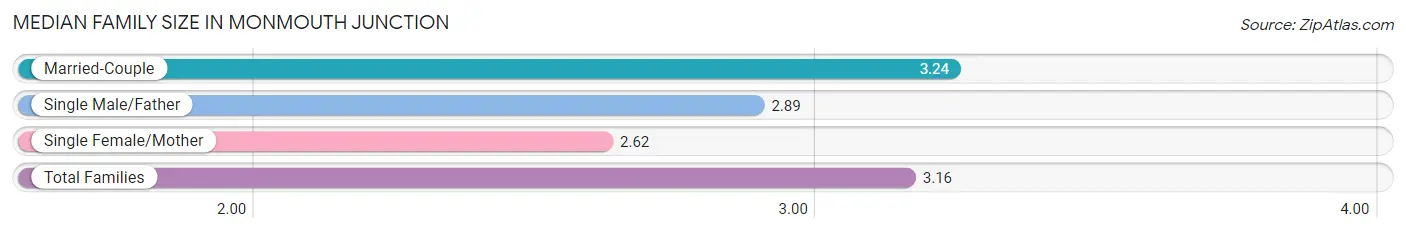
Median Family Size in Monmouth Junction
The median family size in Monmouth Junction is 3.16 persons per family, with married-couple families (2,321 | 86.3%) accounting for the largest median family size of 3.24 persons per family. On the other hand, single female/mother families (294 | 10.9%) represent the smallest median family size with 2.62 persons per family.
| Family Type | # Families | Family Size |
| Married-Couple | 2,321 (86.3%) | 3.24 |
| Single Male/Father | 76 (2.8%) | 2.89 |
| Single Female/Mother | 294 (10.9%) | 2.62 |
| Total Families | 2,691 (100.0%) | 3.16 |
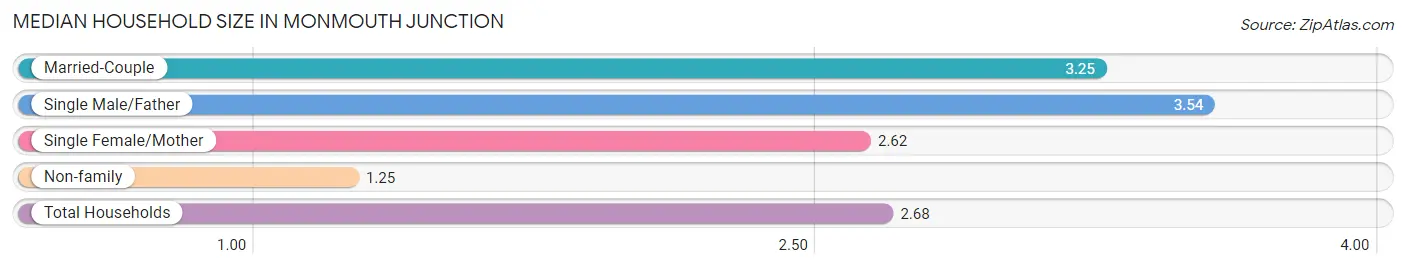
Median Household Size in Monmouth Junction
The median household size in Monmouth Junction is 2.68 persons per household, with single male/father households (76 | 2.1%) accounting for the largest median household size of 3.54 persons per household. non-family households (942 | 25.9%) represent the smallest median household size with 1.25 persons per household.
| Household Type | # Households | Household Size |
| Married-Couple | 2,321 (63.9%) | 3.25 |
| Single Male/Father | 76 (2.1%) | 3.54 |
| Single Female/Mother | 294 (8.1%) | 2.62 |
| Non-family | 942 (25.9%) | 1.25 |
| Total Households | 3,633 (100.0%) | 2.68 |
Household Size by Marriage Status in Monmouth Junction
Out of a total of 3,633 households in Monmouth Junction, 2,691 (74.1%) are family households, while 942 (25.9%) are nonfamily households. The most numerous type of family households are 4-person households, comprising 1,016, and the most common type of nonfamily households are 1-person households, comprising 817.
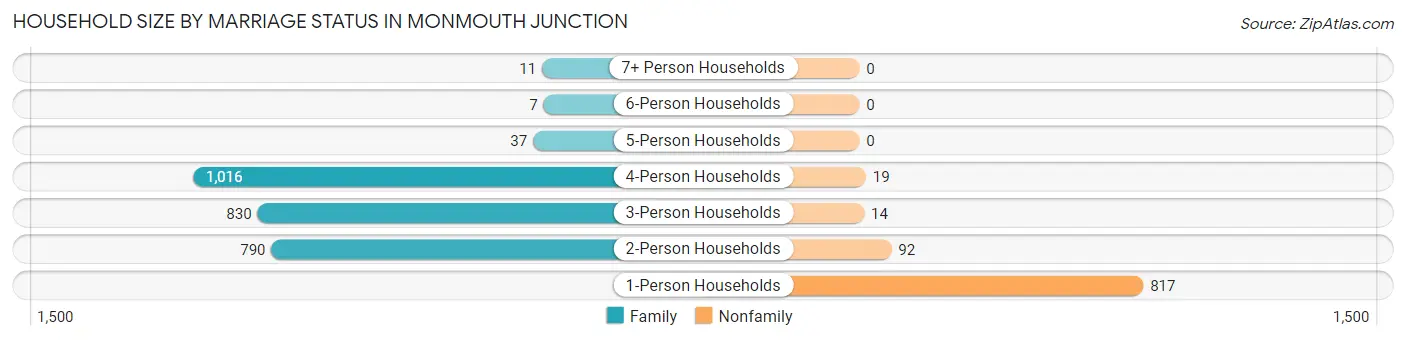
| Household Size | Family Households | Nonfamily Households |
| 1-Person Households | - | 817 (22.5%) |
| 2-Person Households | 790 (21.7%) | 92 (2.5%) |
| 3-Person Households | 830 (22.9%) | 14 (0.4%) |
| 4-Person Households | 1,016 (28.0%) | 19 (0.5%) |
| 5-Person Households | 37 (1.0%) | 0 (0.0%) |
| 6-Person Households | 7 (0.2%) | 0 (0.0%) |
| 7+ Person Households | 11 (0.3%) | 0 (0.0%) |
| Total | 2,691 (74.1%) | 942 (25.9%) |
Female Fertility in Monmouth Junction
Fertility by Age in Monmouth Junction
Average fertility rate in Monmouth Junction is 34.0 births per 1,000 women. Women in the age bracket of 35 to 50 years have the highest fertility rate with 53.0 births per 1,000 women. Women in the age bracket of 35 to 50 years acount for 71.3% of all women with births.
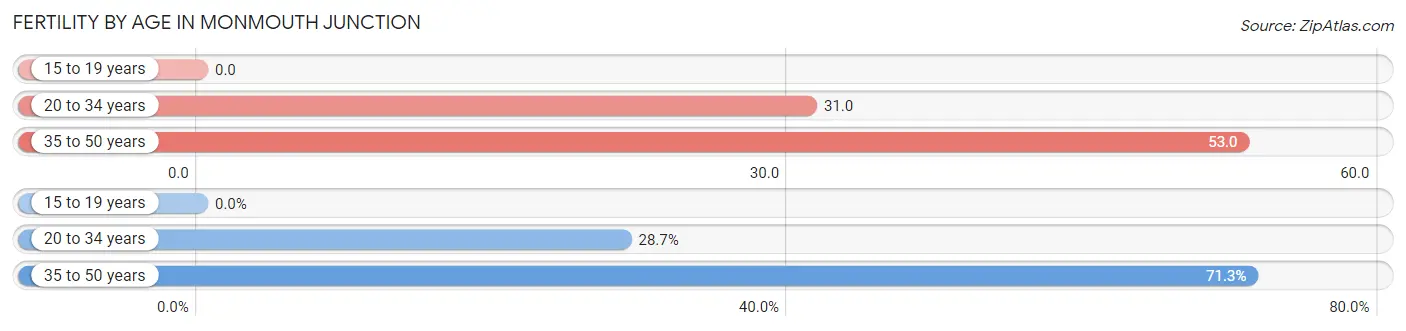
| Age Bracket | Women with Births | Births / 1,000 Women |
| 15 to 19 years | 0 (0.0%) | 0.0 |
| 20 to 34 years | 25 (28.7%) | 31.0 |
| 35 to 50 years | 62 (71.3%) | 53.0 |
| Total | 87 (100.0%) | 34.0 |
Fertility by Age by Marriage Status in Monmouth Junction
28.7% of women with births (87) in Monmouth Junction are married. The highest percentage of unmarried women with births falls into 35 to 50 years age bracket with 100.0% of them unmarried at the time of birth, while the lowest percentage of unmarried women with births belong to 20 to 34 years age bracket with 0.0% of them unmarried.
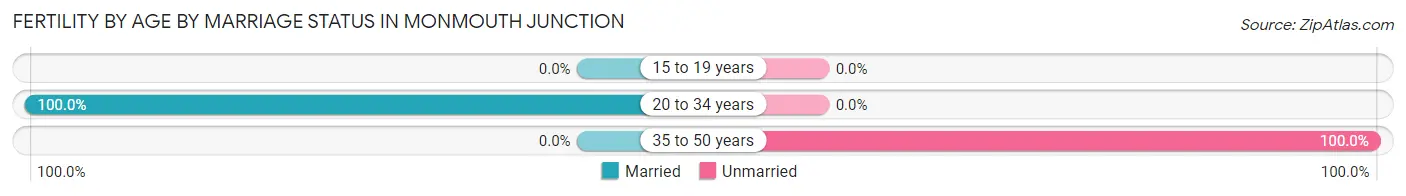
| Age Bracket | Married | Unmarried |
| 15 to 19 years | 0 (0.0%) | 0 (0.0%) |
| 20 to 34 years | 25 (100.0%) | 0 (0.0%) |
| 35 to 50 years | 0 (0.0%) | 62 (100.0%) |
| Total | 25 (28.7%) | 62 (71.3%) |
Fertility by Education in Monmouth Junction
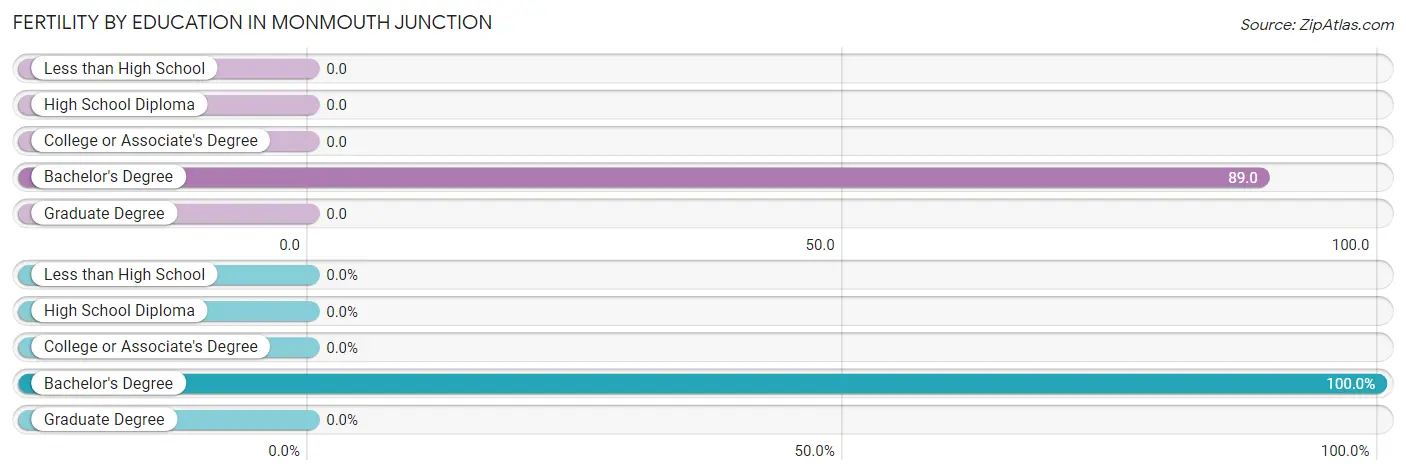
| Educational Attainment | Women with Births | Births / 1,000 Women |
| Less than High School | 0 (0.0%) | 0.0 |
| High School Diploma | 0 (0.0%) | 0.0 |
| College or Associate's Degree | 0 (0.0%) | 0.0 |
| Bachelor's Degree | 87 (100.0%) | 89.0 |
| Graduate Degree | 0 (0.0%) | 0.0 |
| Total | 87 (100.0%) | 34.0 |
Fertility by Education by Marriage Status in Monmouth Junction
71.3% of women with births in Monmouth Junction are unmarried. Women with the educational attainment of bachelor's degree are most likely to be married with 28.7% of them married at childbirth, while women with the educational attainment of bachelor's degree are least likely to be married with 71.3% of them unmarried at childbirth.
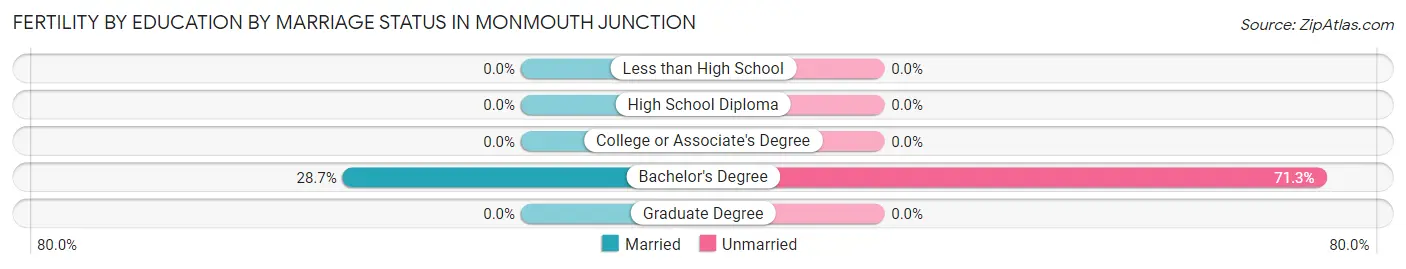
| Educational Attainment | Married | Unmarried |
| Less than High School | 0 (0.0%) | 0 (0.0%) |
| High School Diploma | 0 (0.0%) | 0 (0.0%) |
| College or Associate's Degree | 0 (0.0%) | 0 (0.0%) |
| Bachelor's Degree | 25 (28.7%) | 62 (71.3%) |
| Graduate Degree | 0 (0.0%) | 0 (0.0%) |
| Total | 25 (28.7%) | 62 (71.3%) |
Employment Characteristics in Monmouth Junction
Employment by Class of Employer in Monmouth Junction
Among the 5,466 employed individuals in Monmouth Junction, private company employees (3,819 | 69.9%), self-employed (incorporated) (483 | 8.8%), and not-for-profit organizations (368 | 6.7%) make up the most common classes of employment.
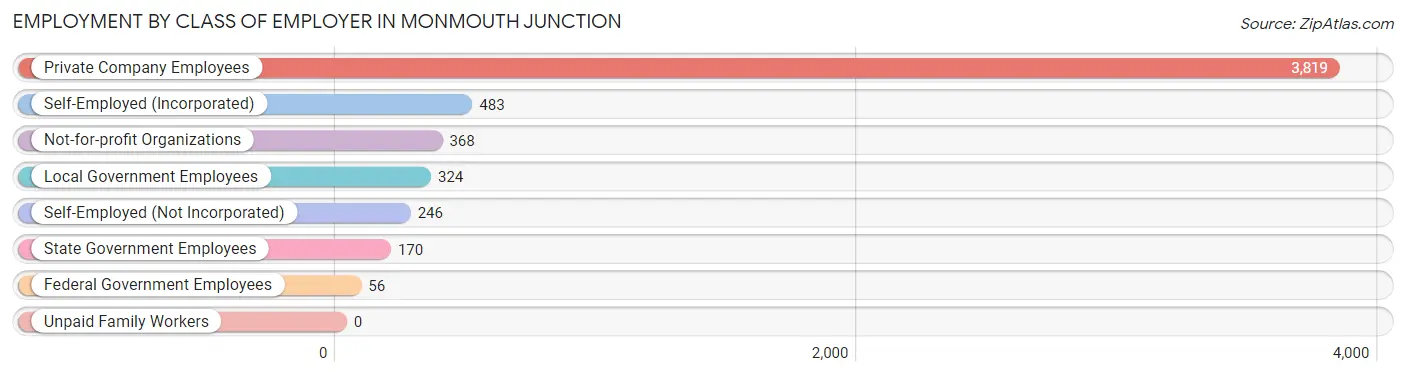
| Employer Class | # Employees | % Employees |
| Private Company Employees | 3,819 | 69.9% |
| Self-Employed (Incorporated) | 483 | 8.8% |
| Self-Employed (Not Incorporated) | 246 | 4.5% |
| Not-for-profit Organizations | 368 | 6.7% |
| Local Government Employees | 324 | 5.9% |
| State Government Employees | 170 | 3.1% |
| Federal Government Employees | 56 | 1.0% |
| Unpaid Family Workers | 0 | 0.0% |
| Total | 5,466 | 100.0% |
Employment Status by Age in Monmouth Junction
According to the labor force statistics for Monmouth Junction, out of the total population over 16 years of age (7,628), 74.7% or 5,698 individuals are in the labor force, with 2.9% or 165 of them unemployed. The age group with the highest labor force participation rate is 45 to 54 years, with 94.3% or 1,464 individuals in the labor force. Within the labor force, the 25 to 29 years age range has the highest percentage of unemployed individuals, with 22.0% or 116 of them being unemployed.
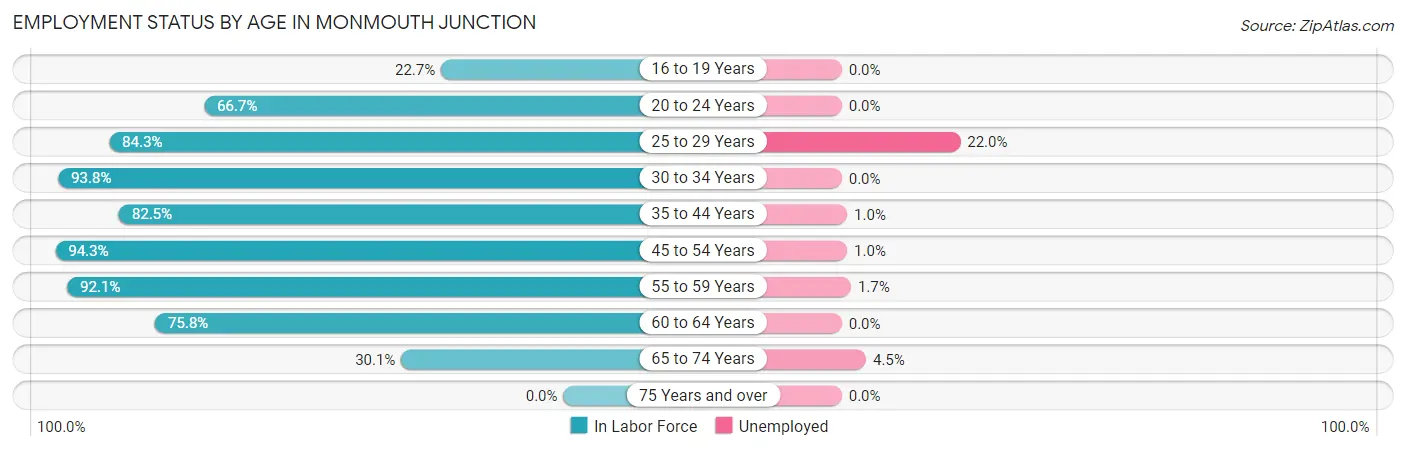
| Age Bracket | In Labor Force | Unemployed |
| 16 to 19 Years | 106 (22.7%) | 0 (0.0%) |
| 20 to 24 Years | 366 (66.7%) | 0 (0.0%) |
| 25 to 29 Years | 527 (84.3%) | 116 (22.0%) |
| 30 to 34 Years | 406 (93.8%) | 0 (0.0%) |
| 35 to 44 Years | 1,365 (82.5%) | 14 (1.0%) |
| 45 to 54 Years | 1,464 (94.3%) | 15 (1.0%) |
| 55 to 59 Years | 745 (92.1%) | 13 (1.7%) |
| 60 to 64 Years | 495 (75.8%) | 0 (0.0%) |
| 65 to 74 Years | 221 (30.1%) | 10 (4.5%) |
| 75 Years and over | 0 (0.0%) | 0 (0.0%) |
| Total | 5,698 (74.7%) | 165 (2.9%) |
Employment Status by Educational Attainment in Monmouth Junction
According to labor force statistics for Monmouth Junction, 87.3% of individuals (5,000) out of the total population between 25 and 64 years of age (5,727) are in the labor force, with 3.2% or 160 of them being unemployed. The group with the highest labor force participation rate are those with the educational attainment of college / associate degree, with 89.4% or 608 individuals in the labor force. Within the labor force, individuals with less than high school education have the highest percentage of unemployment, with 77.9% or 116 of them being unemployed.
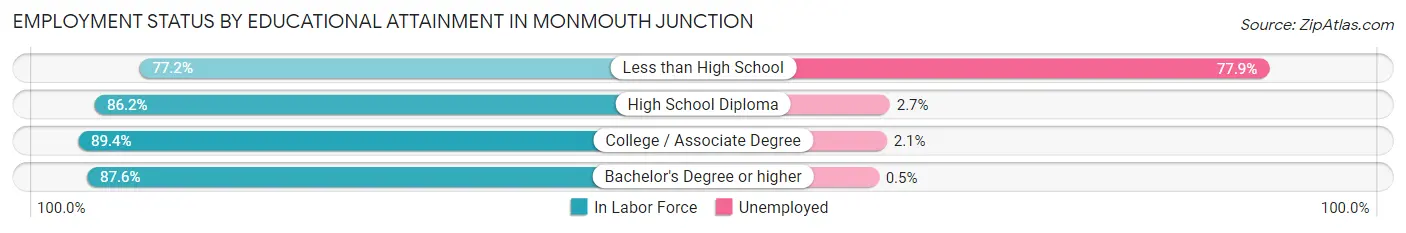
| Educational Attainment | In Labor Force | Unemployed |
| Less than High School | 149 (77.2%) | 150 (77.9%) |
| High School Diploma | 337 (86.2%) | 11 (2.7%) |
| College / Associate Degree | 608 (89.4%) | 14 (2.1%) |
| Bachelor's Degree or higher | 3,910 (87.6%) | 22 (0.5%) |
| Total | 5,000 (87.3%) | 183 (3.2%) |
Employment Occupations by Sex in Monmouth Junction
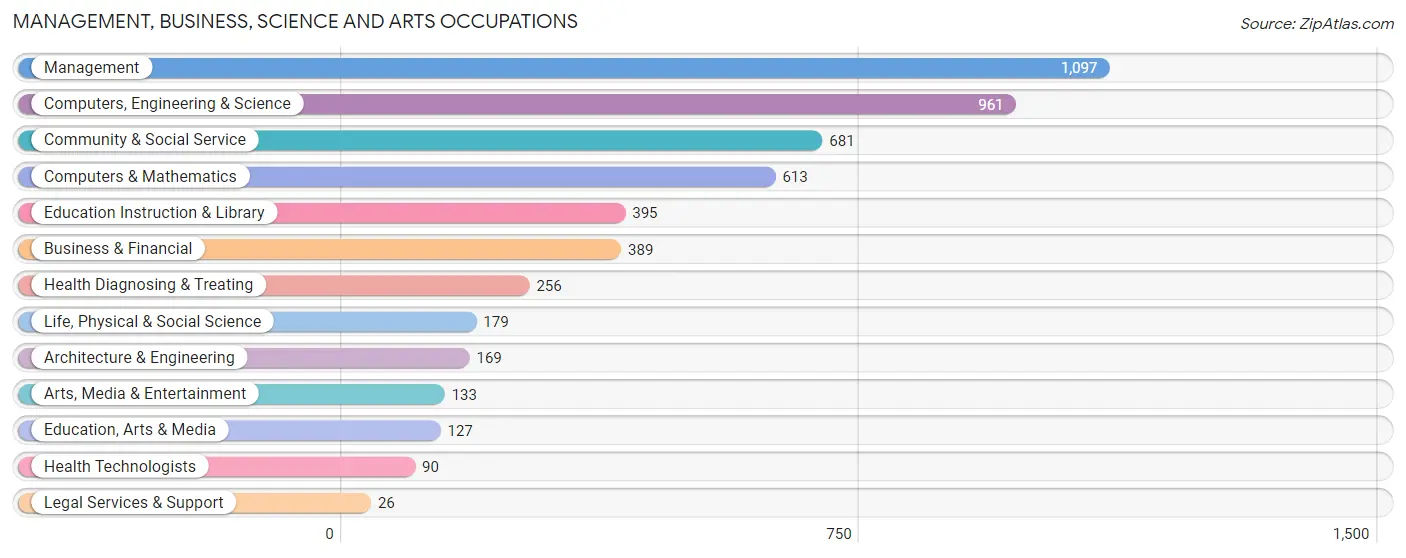
Management, Business, Science and Arts Occupations
The most common Management, Business, Science and Arts occupations in Monmouth Junction are Management (1,097 | 19.9%), Computers, Engineering & Science (961 | 17.4%), Community & Social Service (681 | 12.3%), Computers & Mathematics (613 | 11.1%), and Education Instruction & Library (395 | 7.1%).
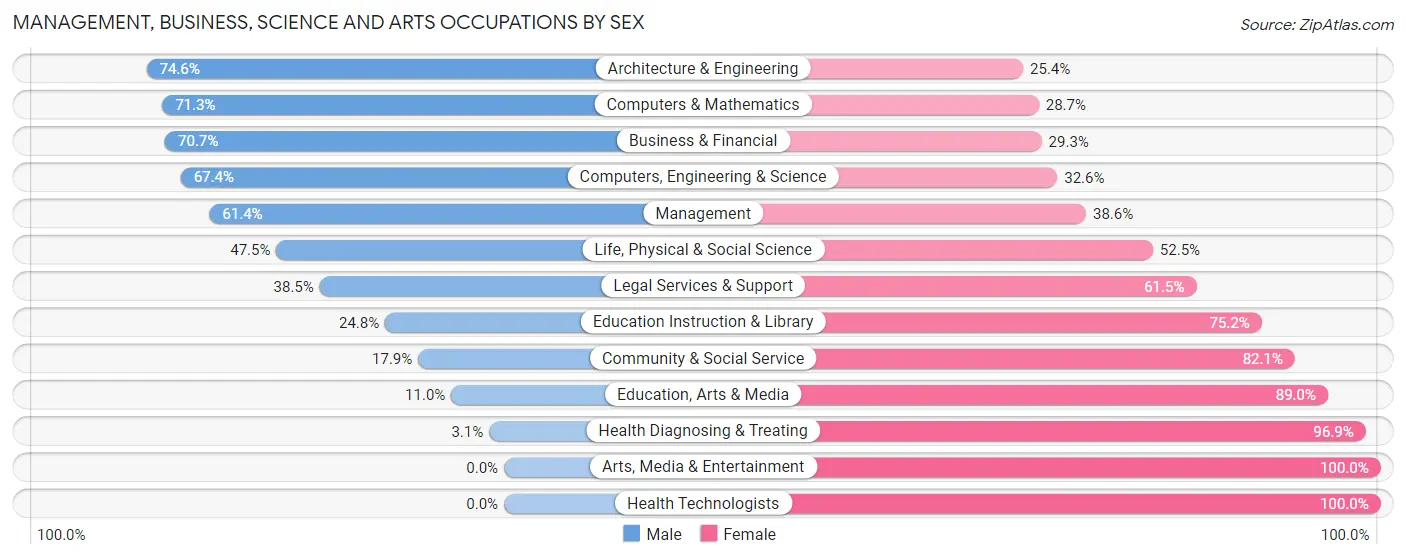
Management, Business, Science and Arts Occupations by Sex
Within the Management, Business, Science and Arts occupations in Monmouth Junction, the most male-oriented occupations are Architecture & Engineering (74.6%), Computers & Mathematics (71.3%), and Business & Financial (70.7%), while the most female-oriented occupations are Arts, Media & Entertainment (100.0%), Health Technologists (100.0%), and Health Diagnosing & Treating (96.9%).
| Occupation | Male | Female |
| Management | 674 (61.4%) | 423 (38.6%) |
| Business & Financial | 275 (70.7%) | 114 (29.3%) |
| Computers, Engineering & Science | 648 (67.4%) | 313 (32.6%) |
| Computers & Mathematics | 437 (71.3%) | 176 (28.7%) |
| Architecture & Engineering | 126 (74.6%) | 43 (25.4%) |
| Life, Physical & Social Science | 85 (47.5%) | 94 (52.5%) |
| Community & Social Service | 122 (17.9%) | 559 (82.1%) |
| Education, Arts & Media | 14 (11.0%) | 113 (89.0%) |
| Legal Services & Support | 10 (38.5%) | 16 (61.5%) |
| Education Instruction & Library | 98 (24.8%) | 297 (75.2%) |
| Arts, Media & Entertainment | 0 (0.0%) | 133 (100.0%) |
| Health Diagnosing & Treating | 8 (3.1%) | 248 (96.9%) |
| Health Technologists | 0 (0.0%) | 90 (100.0%) |
| Total (Category) | 1,727 (51.0%) | 1,657 (49.0%) |
| Total (Overall) | 3,081 (55.7%) | 2,446 (44.3%) |
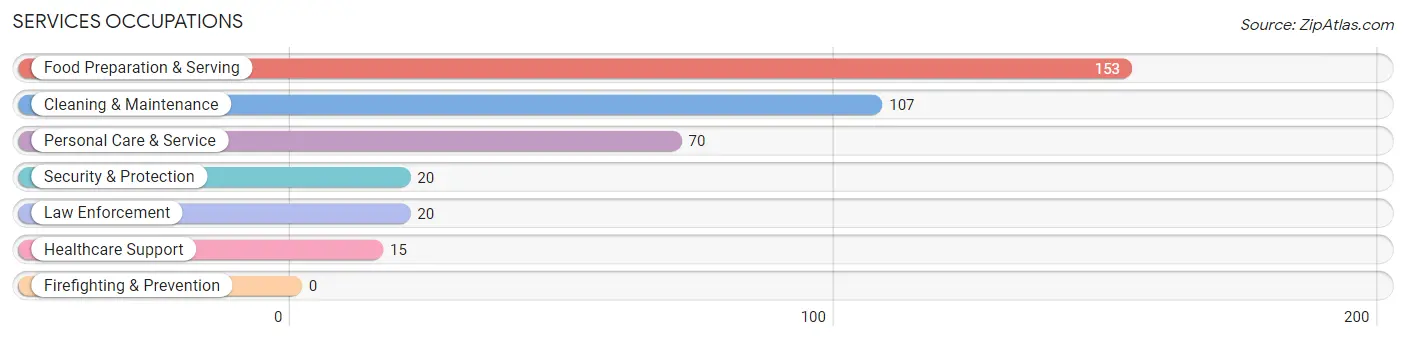
Services Occupations
The most common Services occupations in Monmouth Junction are Food Preparation & Serving (153 | 2.8%), Cleaning & Maintenance (107 | 1.9%), Personal Care & Service (70 | 1.3%), Security & Protection (20 | 0.4%), and Law Enforcement (20 | 0.4%).
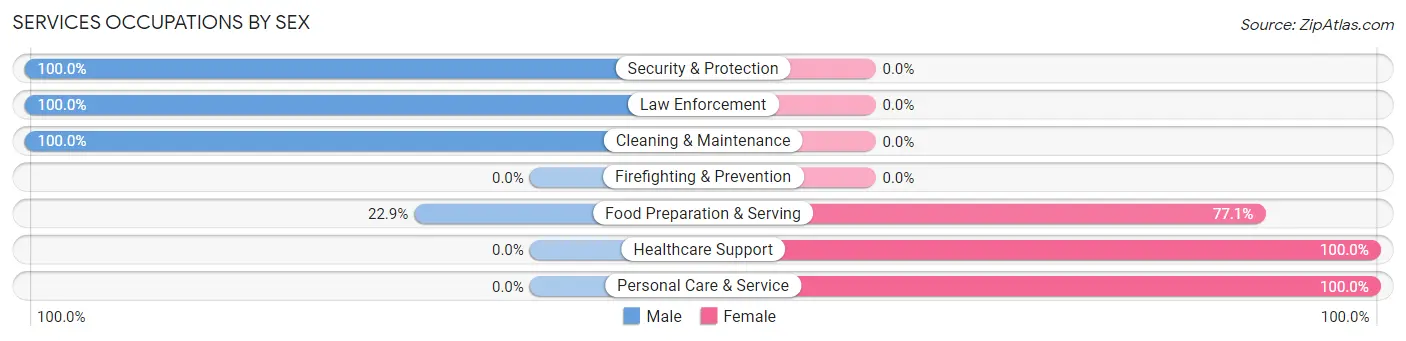
Services Occupations by Sex
Within the Services occupations in Monmouth Junction, the most male-oriented occupations are Security & Protection (100.0%), Law Enforcement (100.0%), and Cleaning & Maintenance (100.0%), while the most female-oriented occupations are Healthcare Support (100.0%), Personal Care & Service (100.0%), and Food Preparation & Serving (77.1%).
| Occupation | Male | Female |
| Healthcare Support | 0 (0.0%) | 15 (100.0%) |
| Security & Protection | 20 (100.0%) | 0 (0.0%) |
| Firefighting & Prevention | 0 (0.0%) | 0 (0.0%) |
| Law Enforcement | 20 (100.0%) | 0 (0.0%) |
| Food Preparation & Serving | 35 (22.9%) | 118 (77.1%) |
| Cleaning & Maintenance | 107 (100.0%) | 0 (0.0%) |
| Personal Care & Service | 0 (0.0%) | 70 (100.0%) |
| Total (Category) | 162 (44.4%) | 203 (55.6%) |
| Total (Overall) | 3,081 (55.7%) | 2,446 (44.3%) |
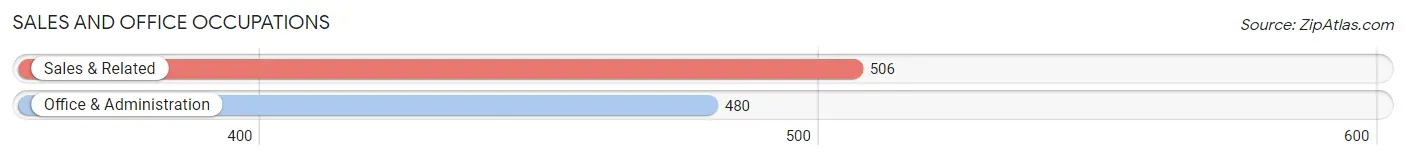
Sales and Office Occupations
The most common Sales and Office occupations in Monmouth Junction are Sales & Related (506 | 9.2%), and Office & Administration (480 | 8.7%).
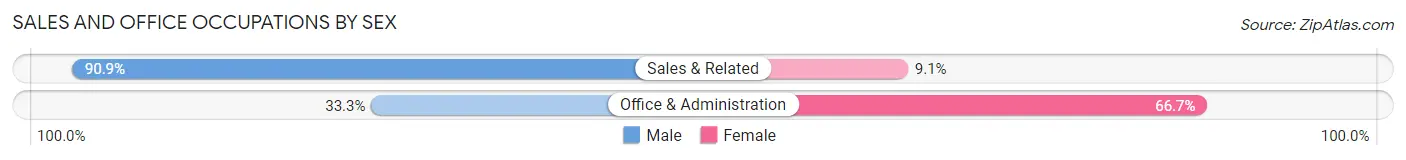
Sales and Office Occupations by Sex
| Occupation | Male | Female |
| Sales & Related | 460 (90.9%) | 46 (9.1%) |
| Office & Administration | 160 (33.3%) | 320 (66.7%) |
| Total (Category) | 620 (62.9%) | 366 (37.1%) |
| Total (Overall) | 3,081 (55.7%) | 2,446 (44.3%) |
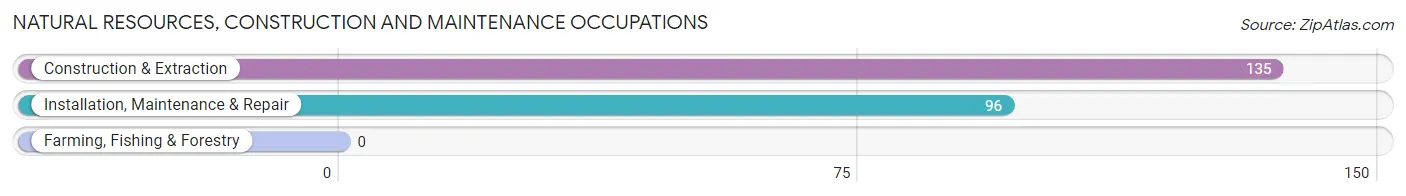
Natural Resources, Construction and Maintenance Occupations
The most common Natural Resources, Construction and Maintenance occupations in Monmouth Junction are Construction & Extraction (135 | 2.4%), and Installation, Maintenance & Repair (96 | 1.7%).
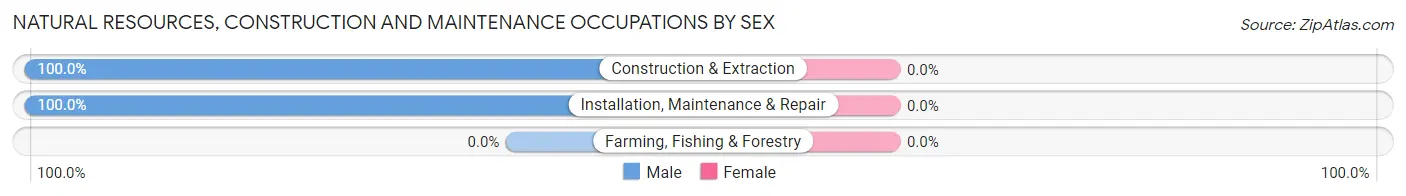
Natural Resources, Construction and Maintenance Occupations by Sex
| Occupation | Male | Female |
| Farming, Fishing & Forestry | 0 (0.0%) | 0 (0.0%) |
| Construction & Extraction | 135 (100.0%) | 0 (0.0%) |
| Installation, Maintenance & Repair | 96 (100.0%) | 0 (0.0%) |
| Total (Category) | 231 (100.0%) | 0 (0.0%) |
| Total (Overall) | 3,081 (55.7%) | 2,446 (44.3%) |
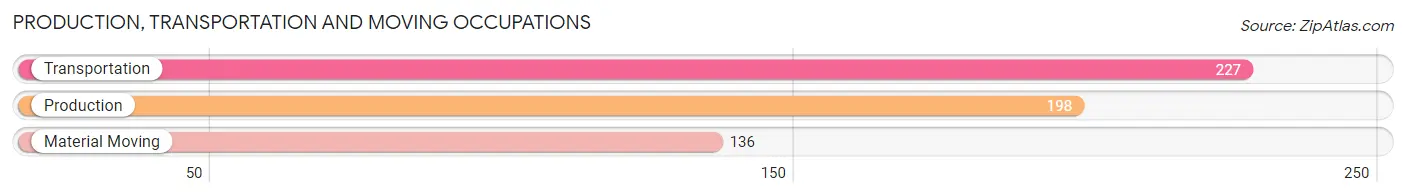
Production, Transportation and Moving Occupations
The most common Production, Transportation and Moving occupations in Monmouth Junction are Transportation (227 | 4.1%), Production (198 | 3.6%), and Material Moving (136 | 2.5%).
Production, Transportation and Moving Occupations by Sex
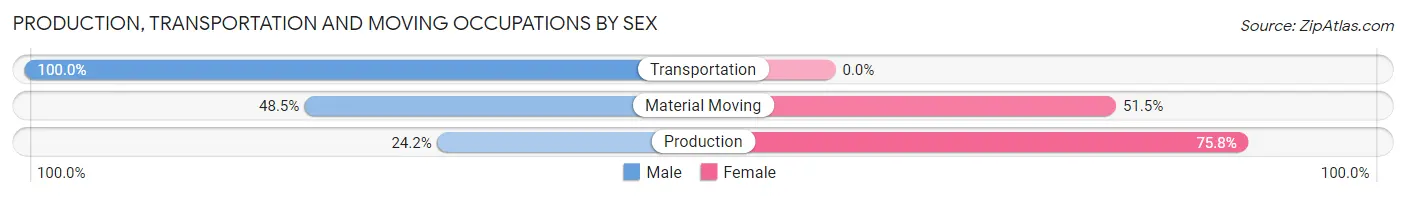
| Occupation | Male | Female |
| Production | 48 (24.2%) | 150 (75.8%) |
| Transportation | 227 (100.0%) | 0 (0.0%) |
| Material Moving | 66 (48.5%) | 70 (51.5%) |
| Total (Category) | 341 (60.8%) | 220 (39.2%) |
| Total (Overall) | 3,081 (55.7%) | 2,446 (44.3%) |
Employment Industries by Sex in Monmouth Junction
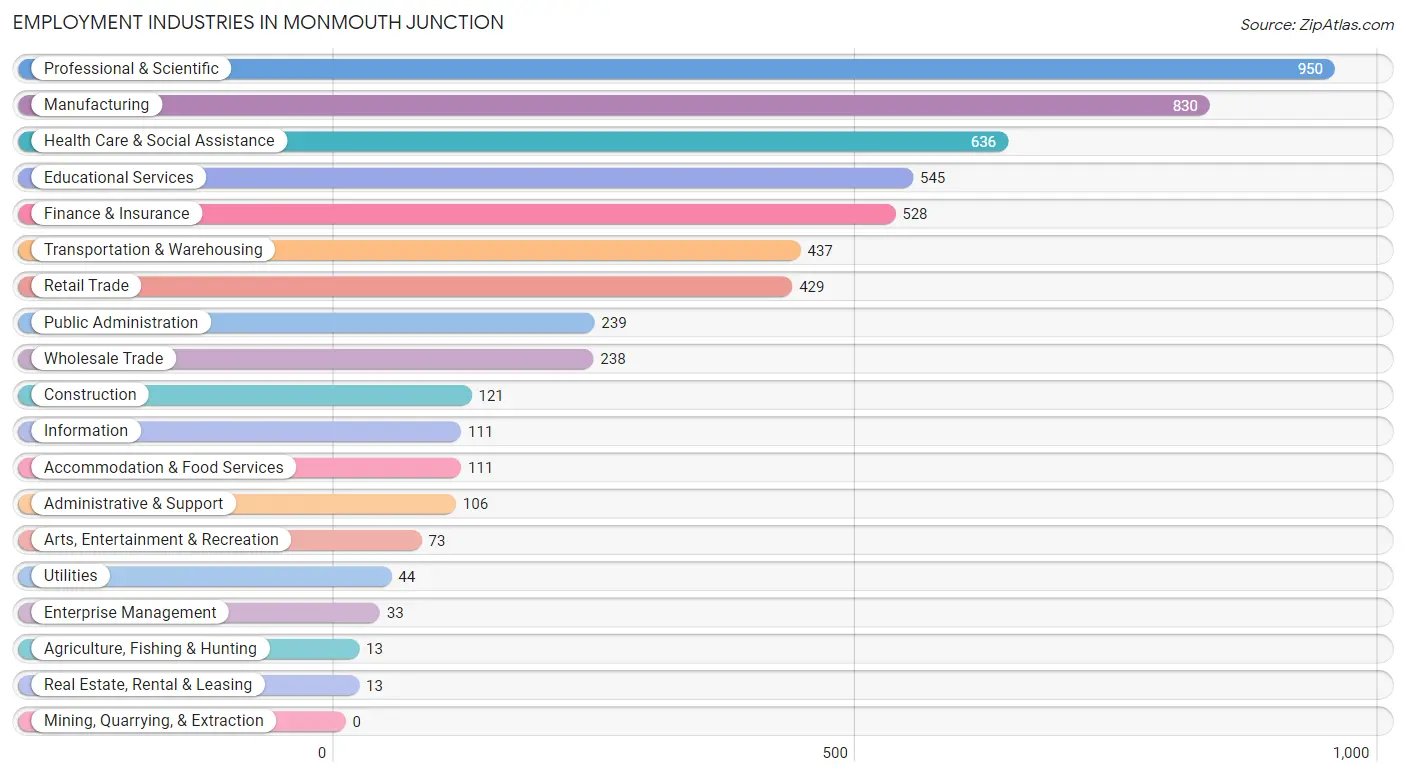
Employment Industries in Monmouth Junction
The major employment industries in Monmouth Junction include Professional & Scientific (950 | 17.2%), Manufacturing (830 | 15.0%), Health Care & Social Assistance (636 | 11.5%), Educational Services (545 | 9.9%), and Finance & Insurance (528 | 9.6%).
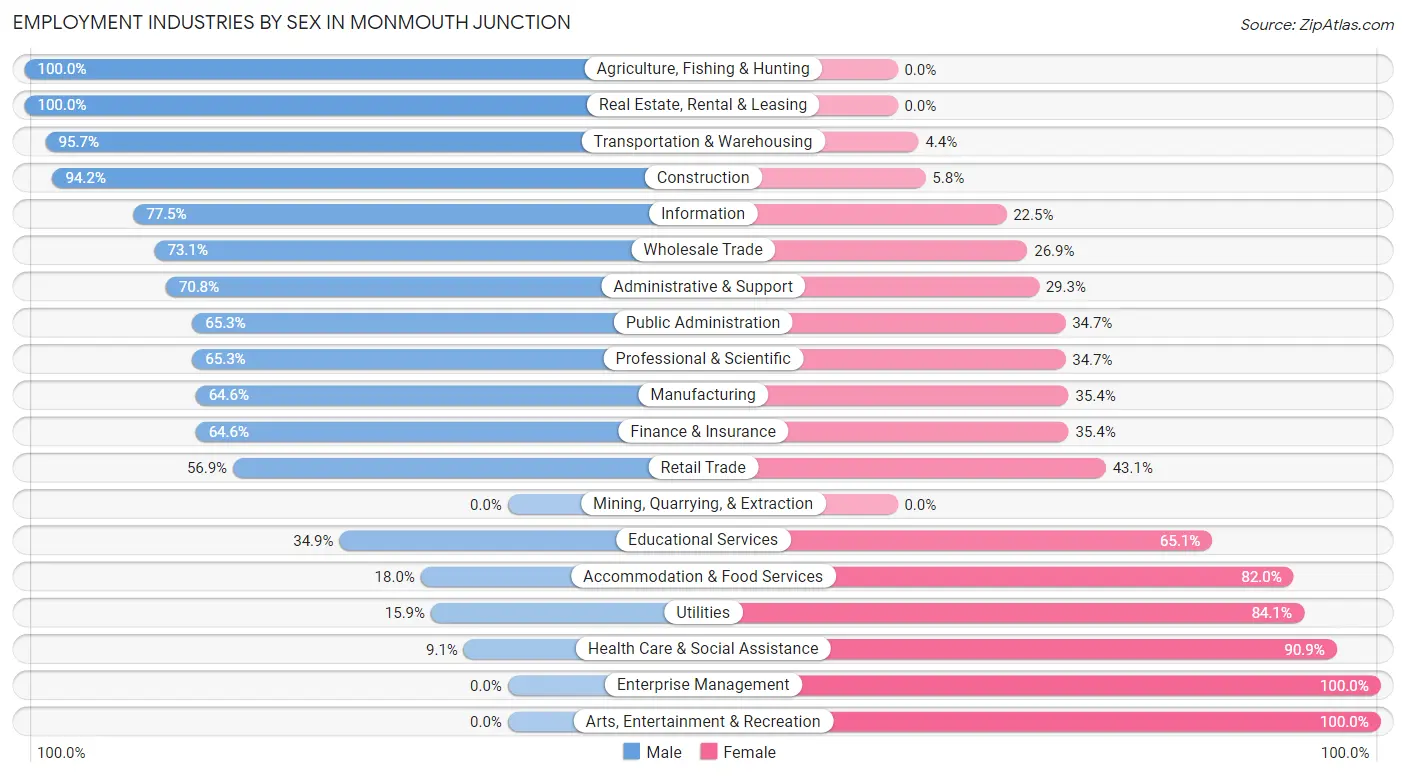
Employment Industries by Sex in Monmouth Junction
The Monmouth Junction industries that see more men than women are Agriculture, Fishing & Hunting (100.0%), Real Estate, Rental & Leasing (100.0%), and Transportation & Warehousing (95.7%), whereas the industries that tend to have a higher number of women are Enterprise Management (100.0%), Arts, Entertainment & Recreation (100.0%), and Health Care & Social Assistance (90.9%).
| Industry | Male | Female |
| Agriculture, Fishing & Hunting | 13 (100.0%) | 0 (0.0%) |
| Mining, Quarrying, & Extraction | 0 (0.0%) | 0 (0.0%) |
| Construction | 114 (94.2%) | 7 (5.8%) |
| Manufacturing | 536 (64.6%) | 294 (35.4%) |
| Wholesale Trade | 174 (73.1%) | 64 (26.9%) |
| Retail Trade | 244 (56.9%) | 185 (43.1%) |
| Transportation & Warehousing | 418 (95.7%) | 19 (4.3%) |
| Utilities | 7 (15.9%) | 37 (84.1%) |
| Information | 86 (77.5%) | 25 (22.5%) |
| Finance & Insurance | 341 (64.6%) | 187 (35.4%) |
| Real Estate, Rental & Leasing | 13 (100.0%) | 0 (0.0%) |
| Professional & Scientific | 620 (65.3%) | 330 (34.7%) |
| Enterprise Management | 0 (0.0%) | 33 (100.0%) |
| Administrative & Support | 75 (70.8%) | 31 (29.2%) |
| Educational Services | 190 (34.9%) | 355 (65.1%) |
| Health Care & Social Assistance | 58 (9.1%) | 578 (90.9%) |
| Arts, Entertainment & Recreation | 0 (0.0%) | 73 (100.0%) |
| Accommodation & Food Services | 20 (18.0%) | 91 (82.0%) |
| Public Administration | 156 (65.3%) | 83 (34.7%) |
| Total | 3,081 (55.7%) | 2,446 (44.3%) |
Education in Monmouth Junction
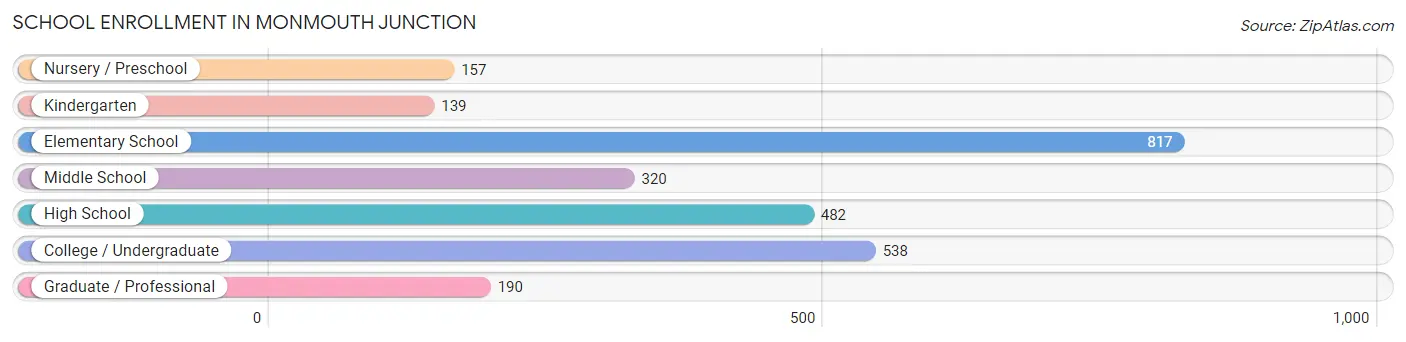
School Enrollment in Monmouth Junction
The most common levels of schooling among the 2,643 students in Monmouth Junction are elementary school (817 | 30.9%), college / undergraduate (538 | 20.4%), and high school (482 | 18.2%).
| School Level | # Students | % Students |
| Nursery / Preschool | 157 | 5.9% |
| Kindergarten | 139 | 5.3% |
| Elementary School | 817 | 30.9% |
| Middle School | 320 | 12.1% |
| High School | 482 | 18.2% |
| College / Undergraduate | 538 | 20.4% |
| Graduate / Professional | 190 | 7.2% |
| Total | 2,643 | 100.0% |
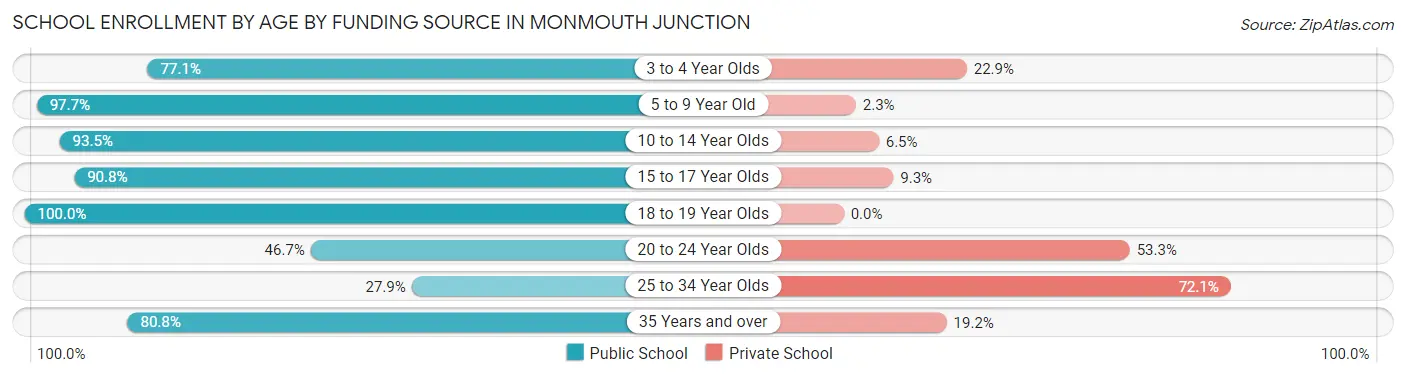
School Enrollment by Age by Funding Source in Monmouth Junction
Out of a total of 2,643 students who are enrolled in schools in Monmouth Junction, 370 (14.0%) attend a private institution, while the remaining 2,273 (86.0%) are enrolled in public schools. The age group of 25 to 34 year olds has the highest likelihood of being enrolled in private schools, with 111 (72.1% in the age bracket) enrolled. Conversely, the age group of 18 to 19 year olds has the lowest likelihood of being enrolled in a private school, with 272 (100.0% in the age bracket) attending a public institution.
| Age Bracket | Public School | Private School |
| 3 to 4 Year Olds | 121 (77.1%) | 36 (22.9%) |
| 5 to 9 Year Old | 860 (97.7%) | 20 (2.3%) |
| 10 to 14 Year Olds | 457 (93.5%) | 32 (6.5%) |
| 15 to 17 Year Olds | 353 (90.7%) | 36 (9.2%) |
| 18 to 19 Year Olds | 272 (100.0%) | 0 (0.0%) |
| 20 to 24 Year Olds | 107 (46.7%) | 122 (53.3%) |
| 25 to 34 Year Olds | 43 (27.9%) | 111 (72.1%) |
| 35 Years and over | 59 (80.8%) | 14 (19.2%) |
| Total | 2,273 (86.0%) | 370 (14.0%) |
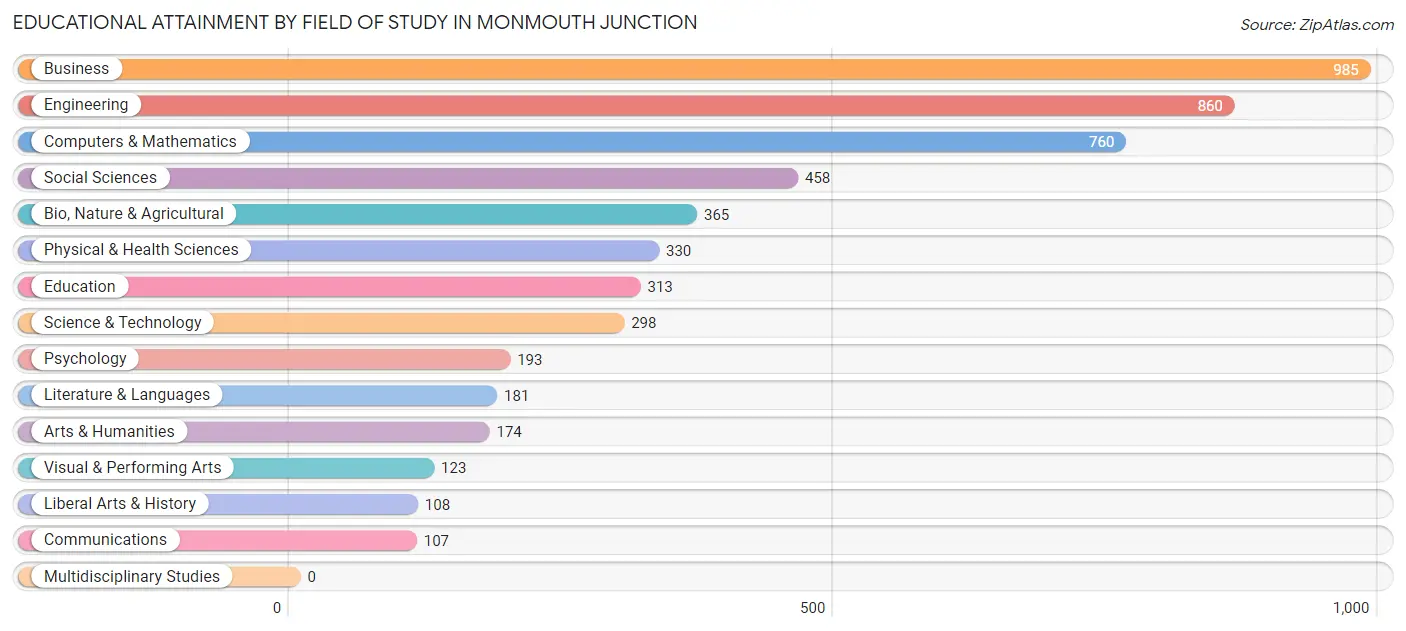
Educational Attainment by Field of Study in Monmouth Junction
Business (985 | 18.7%), engineering (860 | 16.4%), computers & mathematics (760 | 14.5%), social sciences (458 | 8.7%), and bio, nature & agricultural (365 | 7.0%) are the most common fields of study among 5,255 individuals in Monmouth Junction who have obtained a bachelor's degree or higher.
| Field of Study | # Graduates | % Graduates |
| Computers & Mathematics | 760 | 14.5% |
| Bio, Nature & Agricultural | 365 | 7.0% |
| Physical & Health Sciences | 330 | 6.3% |
| Psychology | 193 | 3.7% |
| Social Sciences | 458 | 8.7% |
| Engineering | 860 | 16.4% |
| Multidisciplinary Studies | 0 | 0.0% |
| Science & Technology | 298 | 5.7% |
| Business | 985 | 18.7% |
| Education | 313 | 6.0% |
| Literature & Languages | 181 | 3.4% |
| Liberal Arts & History | 108 | 2.1% |
| Visual & Performing Arts | 123 | 2.3% |
| Communications | 107 | 2.0% |
| Arts & Humanities | 174 | 3.3% |
| Total | 5,255 | 100.0% |
Transportation & Commute in Monmouth Junction
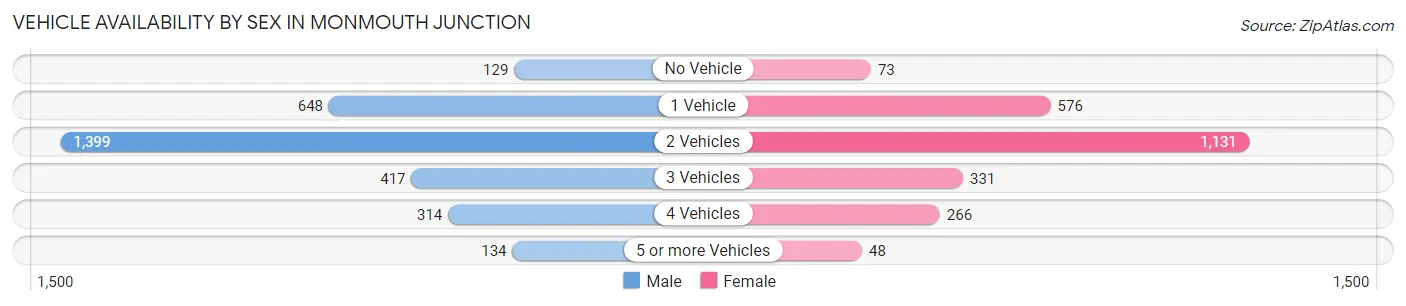
Vehicle Availability by Sex in Monmouth Junction
The most prevalent vehicle ownership categories in Monmouth Junction are males with 2 vehicles (1,399, accounting for 46.0%) and females with 2 vehicles (1,131, making up 57.7%).
| Vehicles Available | Male | Female |
| No Vehicle | 129 (4.2%) | 73 (3.0%) |
| 1 Vehicle | 648 (21.3%) | 576 (23.7%) |
| 2 Vehicles | 1,399 (46.0%) | 1,131 (46.6%) |
| 3 Vehicles | 417 (13.7%) | 331 (13.7%) |
| 4 Vehicles | 314 (10.3%) | 266 (11.0%) |
| 5 or more Vehicles | 134 (4.4%) | 48 (2.0%) |
| Total | 3,041 (100.0%) | 2,425 (100.0%) |
Commute Time in Monmouth Junction
The most frequently occuring commute durations in Monmouth Junction are 15 to 19 minutes (631 commuters, 15.1%), 45 to 59 minutes (559 commuters, 13.4%), and 30 to 34 minutes (451 commuters, 10.8%).
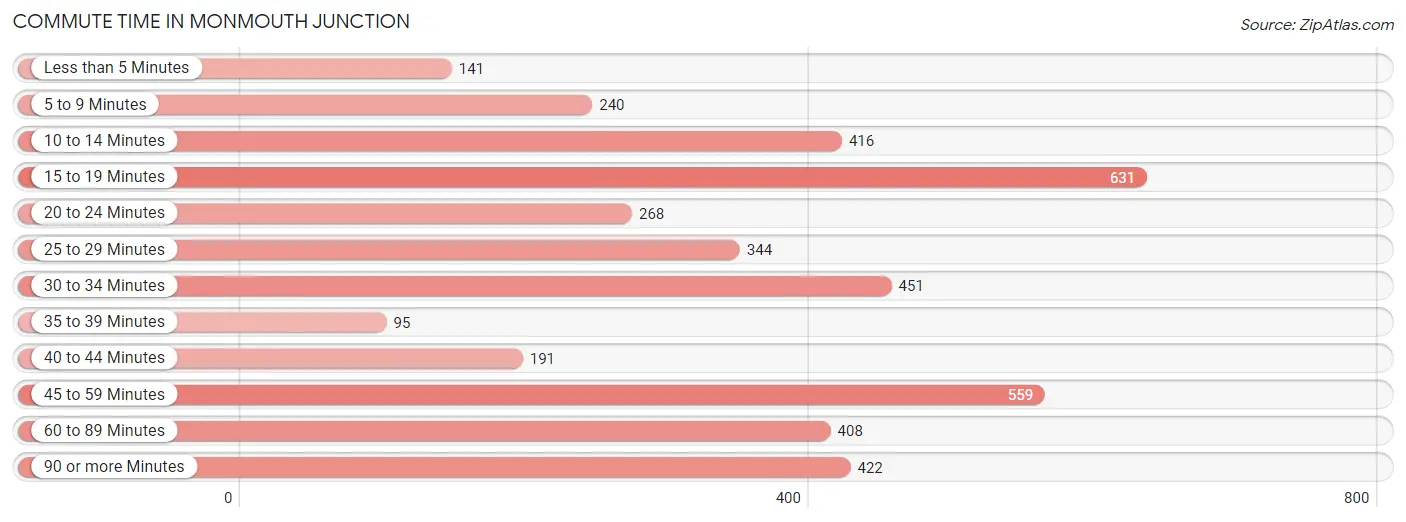
| Commute Time | # Commuters | % Commuters |
| Less than 5 Minutes | 141 | 3.4% |
| 5 to 9 Minutes | 240 | 5.8% |
| 10 to 14 Minutes | 416 | 10.0% |
| 15 to 19 Minutes | 631 | 15.1% |
| 20 to 24 Minutes | 268 | 6.4% |
| 25 to 29 Minutes | 344 | 8.3% |
| 30 to 34 Minutes | 451 | 10.8% |
| 35 to 39 Minutes | 95 | 2.3% |
| 40 to 44 Minutes | 191 | 4.6% |
| 45 to 59 Minutes | 559 | 13.4% |
| 60 to 89 Minutes | 408 | 9.8% |
| 90 or more Minutes | 422 | 10.1% |
Commute Time by Sex in Monmouth Junction
The most common commute times in Monmouth Junction are 45 to 59 minutes (379 commuters, 16.0%) for males and 15 to 19 minutes (388 commuters, 21.6%) for females.
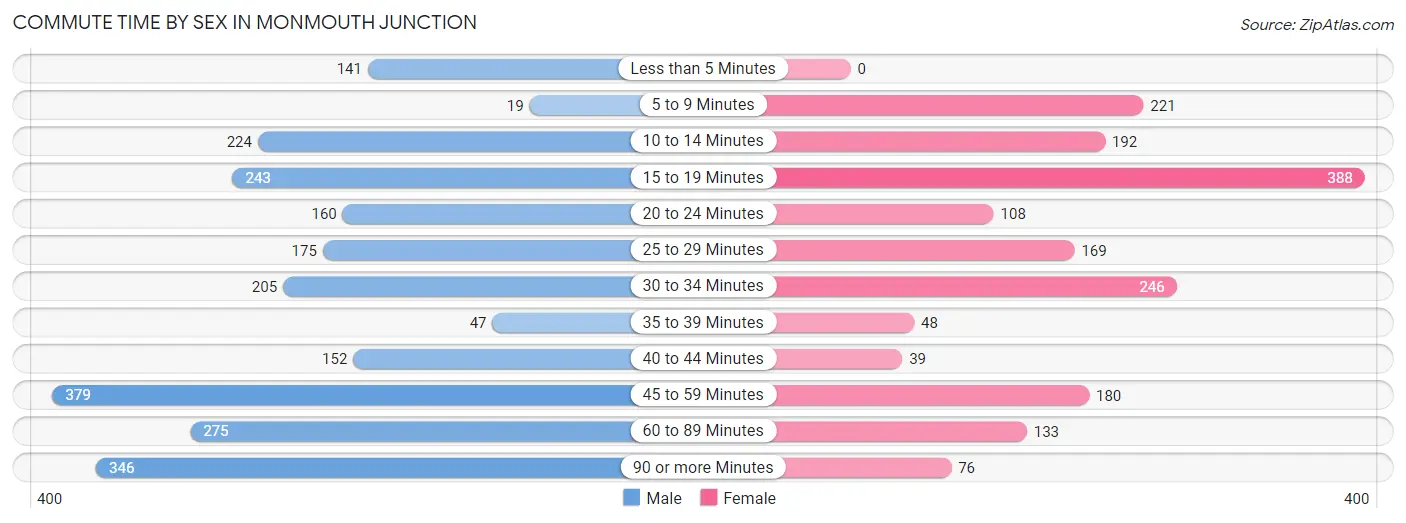
| Commute Time | Male | Female |
| Less than 5 Minutes | 141 (6.0%) | 0 (0.0%) |
| 5 to 9 Minutes | 19 (0.8%) | 221 (12.3%) |
| 10 to 14 Minutes | 224 (9.5%) | 192 (10.7%) |
| 15 to 19 Minutes | 243 (10.3%) | 388 (21.6%) |
| 20 to 24 Minutes | 160 (6.8%) | 108 (6.0%) |
| 25 to 29 Minutes | 175 (7.4%) | 169 (9.4%) |
| 30 to 34 Minutes | 205 (8.7%) | 246 (13.7%) |
| 35 to 39 Minutes | 47 (2.0%) | 48 (2.7%) |
| 40 to 44 Minutes | 152 (6.4%) | 39 (2.2%) |
| 45 to 59 Minutes | 379 (16.0%) | 180 (10.0%) |
| 60 to 89 Minutes | 275 (11.6%) | 133 (7.4%) |
| 90 or more Minutes | 346 (14.6%) | 76 (4.2%) |
Time of Departure to Work by Sex in Monmouth Junction
The most frequent times of departure to work in Monmouth Junction are 8:00 AM to 8:29 AM (353, 14.9%) for males and 7:00 AM to 7:29 AM (339, 18.8%) for females.
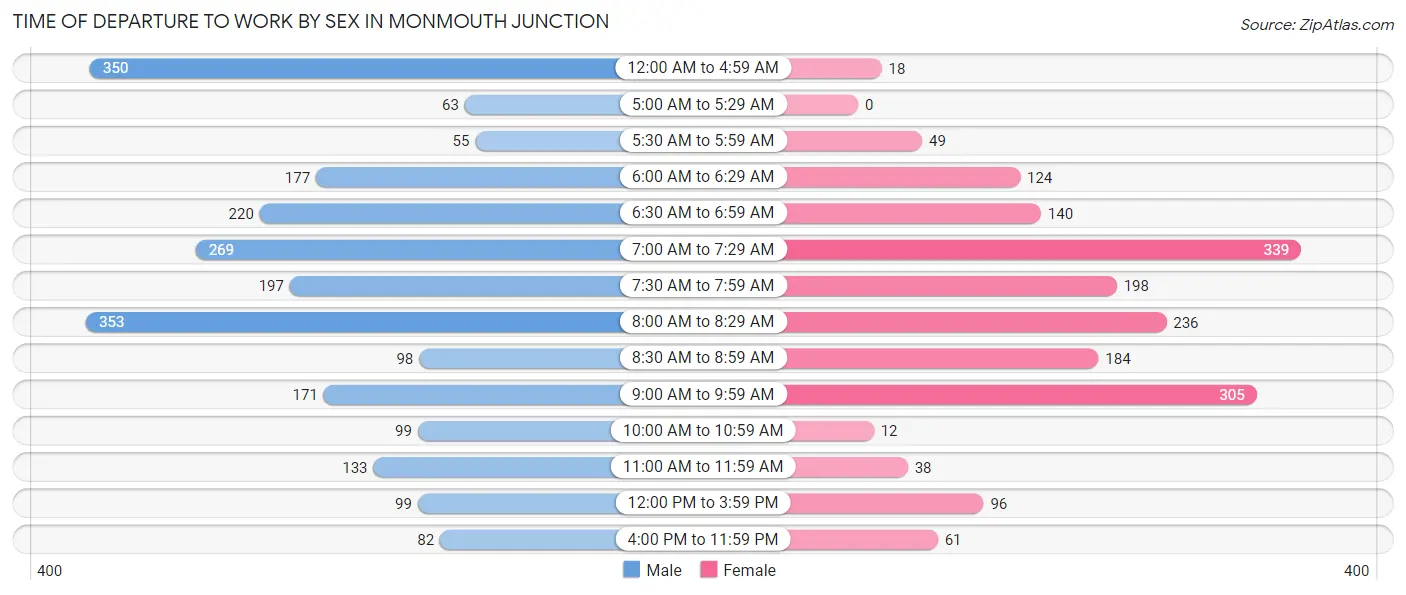
| Time of Departure | Male | Female |
| 12:00 AM to 4:59 AM | 350 (14.8%) | 18 (1.0%) |
| 5:00 AM to 5:29 AM | 63 (2.7%) | 0 (0.0%) |
| 5:30 AM to 5:59 AM | 55 (2.3%) | 49 (2.7%) |
| 6:00 AM to 6:29 AM | 177 (7.5%) | 124 (6.9%) |
| 6:30 AM to 6:59 AM | 220 (9.3%) | 140 (7.8%) |
| 7:00 AM to 7:29 AM | 269 (11.4%) | 339 (18.8%) |
| 7:30 AM to 7:59 AM | 197 (8.3%) | 198 (11.0%) |
| 8:00 AM to 8:29 AM | 353 (14.9%) | 236 (13.1%) |
| 8:30 AM to 8:59 AM | 98 (4.1%) | 184 (10.2%) |
| 9:00 AM to 9:59 AM | 171 (7.2%) | 305 (16.9%) |
| 10:00 AM to 10:59 AM | 99 (4.2%) | 12 (0.7%) |
| 11:00 AM to 11:59 AM | 133 (5.6%) | 38 (2.1%) |
| 12:00 PM to 3:59 PM | 99 (4.2%) | 96 (5.3%) |
| 4:00 PM to 11:59 PM | 82 (3.5%) | 61 (3.4%) |
| Total | 2,366 (100.0%) | 1,800 (100.0%) |
Housing Occupancy in Monmouth Junction
Occupancy by Ownership in Monmouth Junction
Of the total 3,633 dwellings in Monmouth Junction, owner-occupied units account for 2,309 (63.6%), while renter-occupied units make up 1,324 (36.4%).
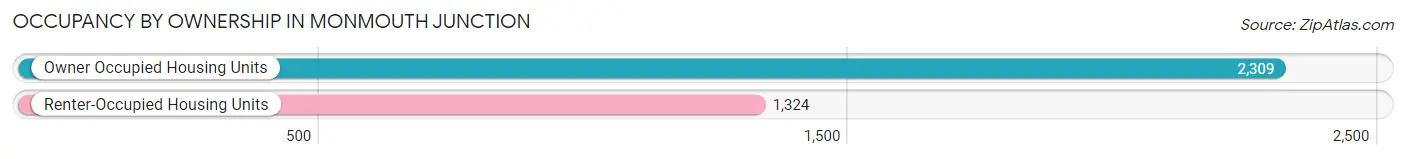
| Occupancy | # Housing Units | % Housing Units |
| Owner Occupied Housing Units | 2,309 | 63.6% |
| Renter-Occupied Housing Units | 1,324 | 36.4% |
| Total Occupied Housing Units | 3,633 | 100.0% |
Occupancy by Household Size in Monmouth Junction
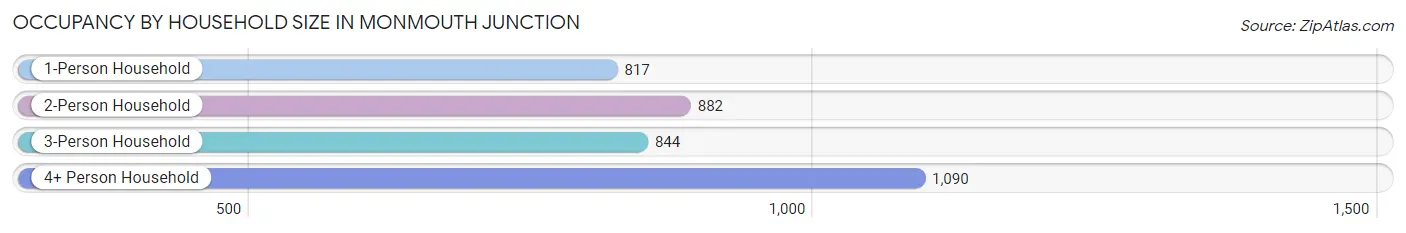
| Household Size | # Housing Units | % Housing Units |
| 1-Person Household | 817 | 22.5% |
| 2-Person Household | 882 | 24.3% |
| 3-Person Household | 844 | 23.2% |
| 4+ Person Household | 1,090 | 30.0% |
| Total Housing Units | 3,633 | 100.0% |
Occupancy by Ownership by Household Size in Monmouth Junction
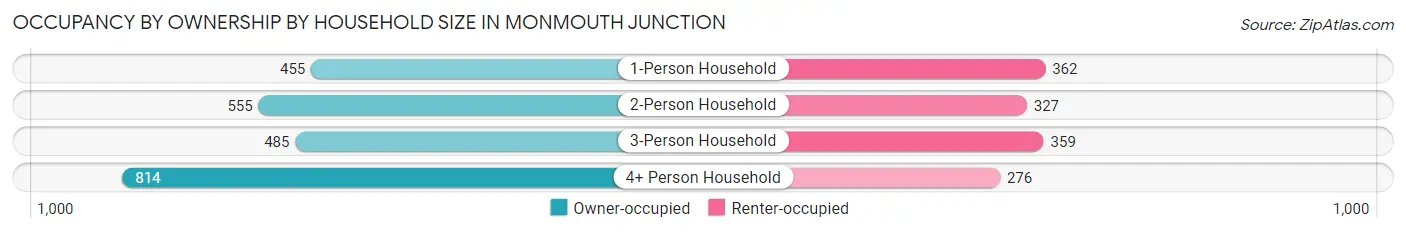
| Household Size | Owner-occupied | Renter-occupied |
| 1-Person Household | 455 (55.7%) | 362 (44.3%) |
| 2-Person Household | 555 (62.9%) | 327 (37.1%) |
| 3-Person Household | 485 (57.5%) | 359 (42.5%) |
| 4+ Person Household | 814 (74.7%) | 276 (25.3%) |
| Total Housing Units | 2,309 (63.6%) | 1,324 (36.4%) |
Occupancy by Educational Attainment in Monmouth Junction
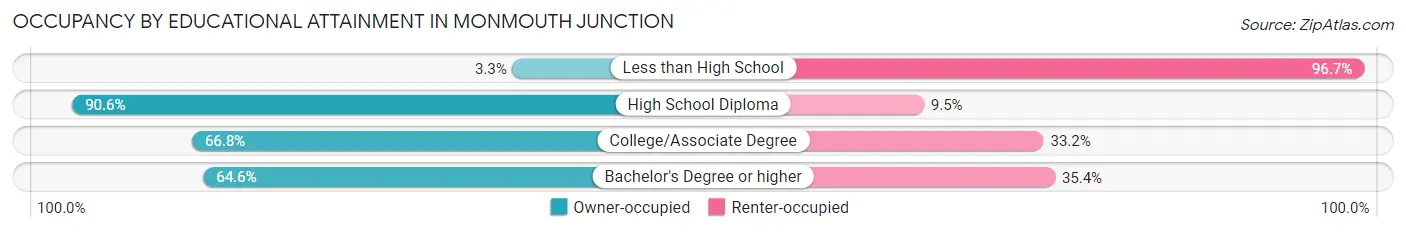
| Household Size | Owner-occupied | Renter-occupied |
| Less than High School | 6 (3.3%) | 178 (96.7%) |
| High School Diploma | 230 (90.5%) | 24 (9.5%) |
| College/Associate Degree | 310 (66.8%) | 154 (33.2%) |
| Bachelor's Degree or higher | 1,763 (64.6%) | 968 (35.4%) |
Occupancy by Age of Householder in Monmouth Junction
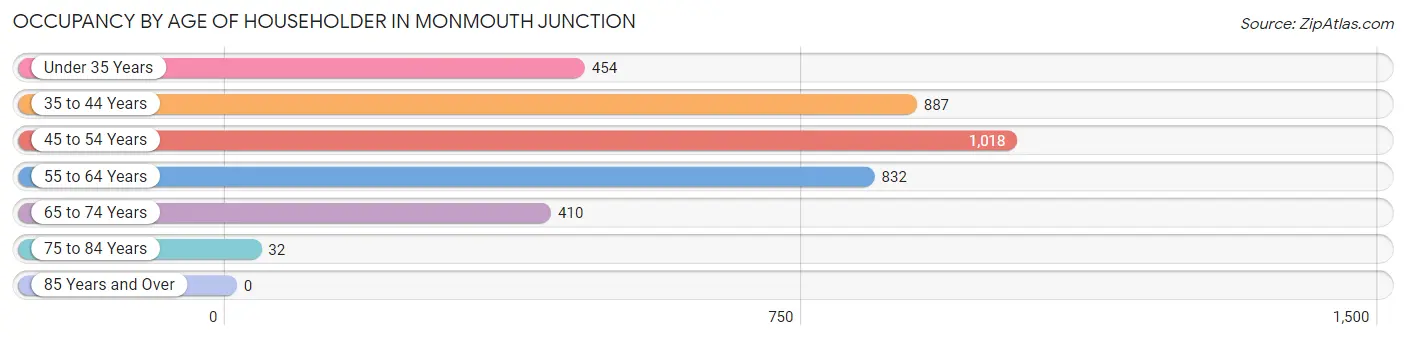
| Age Bracket | # Households | % Households |
| Under 35 Years | 454 | 12.5% |
| 35 to 44 Years | 887 | 24.4% |
| 45 to 54 Years | 1,018 | 28.0% |
| 55 to 64 Years | 832 | 22.9% |
| 65 to 74 Years | 410 | 11.3% |
| 75 to 84 Years | 32 | 0.9% |
| 85 Years and Over | 0 | 0.0% |
| Total | 3,633 | 100.0% |
Housing Finances in Monmouth Junction
Median Income by Occupancy in Monmouth Junction
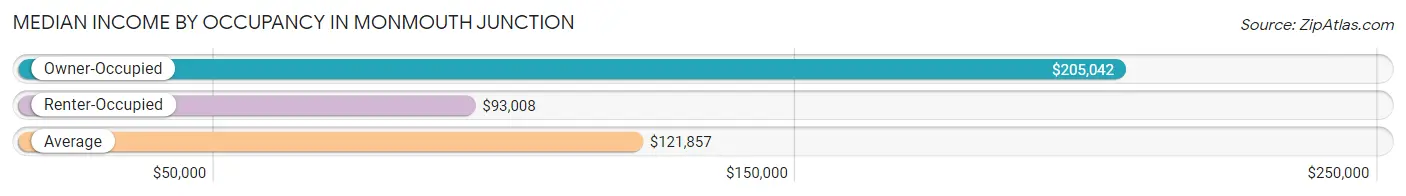
| Occupancy Type | # Households | Median Income |
| Owner-Occupied | 2,309 (63.6%) | $205,042 |
| Renter-Occupied | 1,324 (36.4%) | $93,008 |
| Average | 3,633 (100.0%) | $121,857 |
Occupancy by Householder Income Bracket in Monmouth Junction
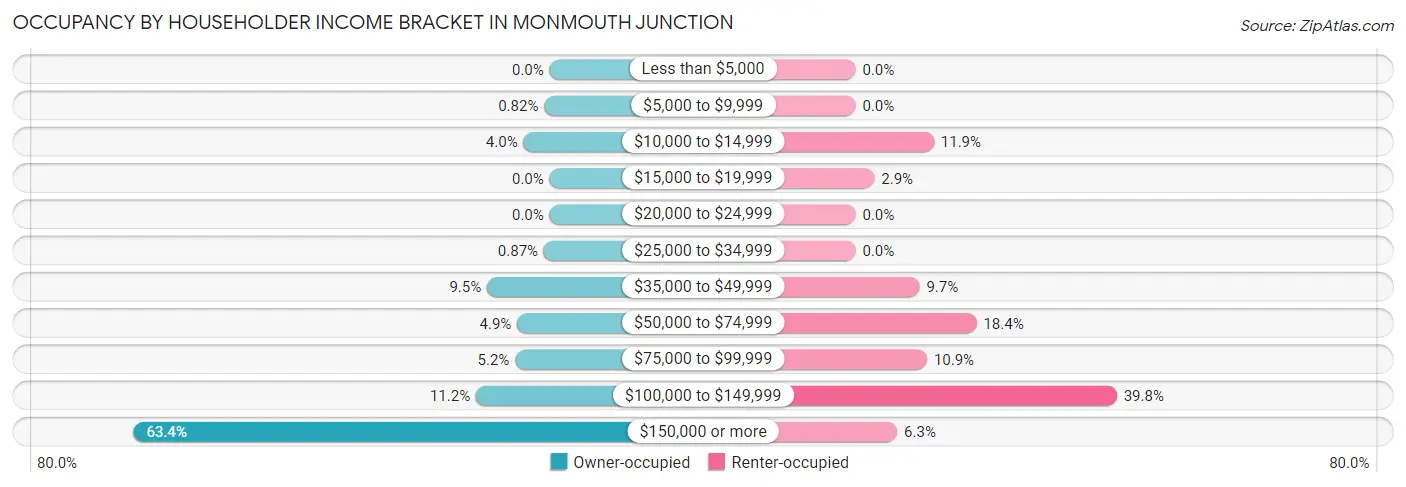
| Income Bracket | Owner-occupied | Renter-occupied |
| Less than $5,000 | 0 (0.0%) | 0 (0.0%) |
| $5,000 to $9,999 | 19 (0.8%) | 0 (0.0%) |
| $10,000 to $14,999 | 92 (4.0%) | 158 (11.9%) |
| $15,000 to $19,999 | 0 (0.0%) | 38 (2.9%) |
| $20,000 to $24,999 | 0 (0.0%) | 0 (0.0%) |
| $25,000 to $34,999 | 20 (0.9%) | 0 (0.0%) |
| $35,000 to $49,999 | 220 (9.5%) | 129 (9.7%) |
| $50,000 to $74,999 | 114 (4.9%) | 244 (18.4%) |
| $75,000 to $99,999 | 121 (5.2%) | 144 (10.9%) |
| $100,000 to $149,999 | 259 (11.2%) | 527 (39.8%) |
| $150,000 or more | 1,464 (63.4%) | 84 (6.3%) |
| Total | 2,309 (100.0%) | 1,324 (100.0%) |
Monthly Housing Cost Tiers in Monmouth Junction
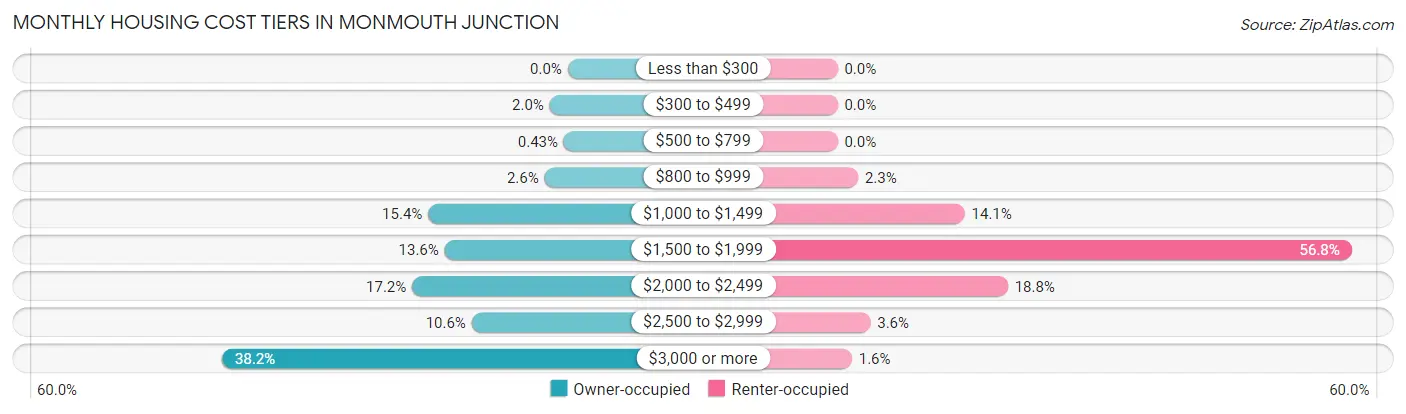
| Monthly Cost | Owner-occupied | Renter-occupied |
| Less than $300 | 0 (0.0%) | 0 (0.0%) |
| $300 to $499 | 46 (2.0%) | 0 (0.0%) |
| $500 to $799 | 10 (0.4%) | 0 (0.0%) |
| $800 to $999 | 59 (2.6%) | 30 (2.3%) |
| $1,000 to $1,499 | 356 (15.4%) | 186 (14.1%) |
| $1,500 to $1,999 | 314 (13.6%) | 752 (56.8%) |
| $2,000 to $2,499 | 397 (17.2%) | 249 (18.8%) |
| $2,500 to $2,999 | 245 (10.6%) | 48 (3.6%) |
| $3,000 or more | 882 (38.2%) | 21 (1.6%) |
| Total | 2,309 (100.0%) | 1,324 (100.0%) |
Physical Housing Characteristics in Monmouth Junction
Housing Structures in Monmouth Junction
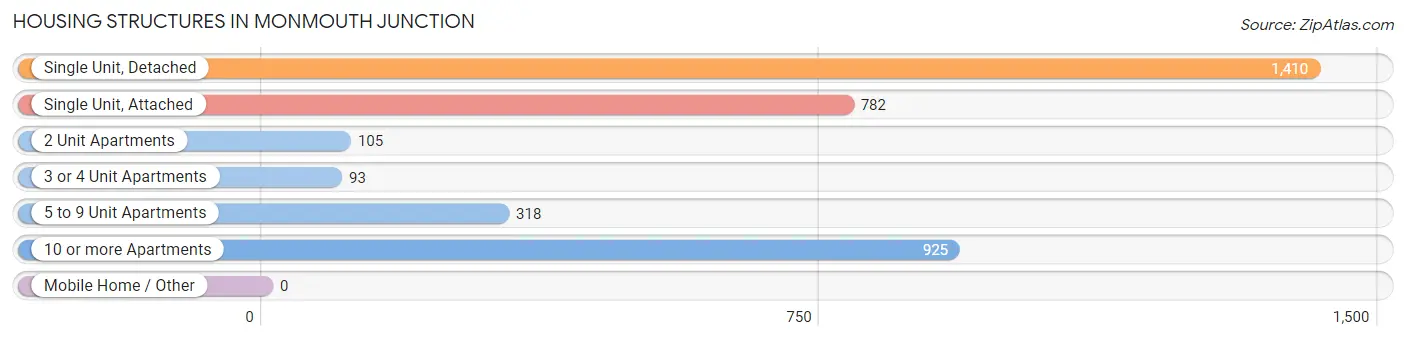
| Structure Type | # Housing Units | % Housing Units |
| Single Unit, Detached | 1,410 | 38.8% |
| Single Unit, Attached | 782 | 21.5% |
| 2 Unit Apartments | 105 | 2.9% |
| 3 or 4 Unit Apartments | 93 | 2.6% |
| 5 to 9 Unit Apartments | 318 | 8.7% |
| 10 or more Apartments | 925 | 25.5% |
| Mobile Home / Other | 0 | 0.0% |
| Total | 3,633 | 100.0% |
Housing Structures by Occupancy in Monmouth Junction
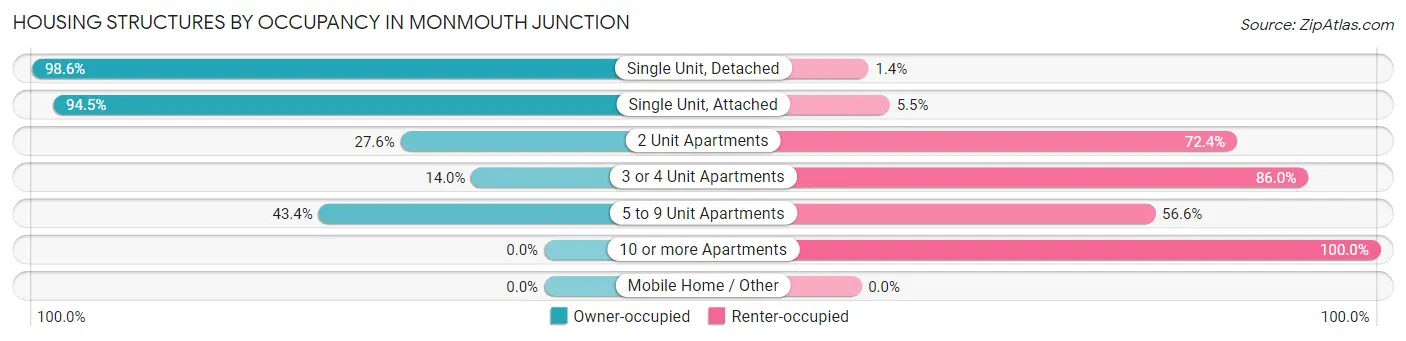
| Structure Type | Owner-occupied | Renter-occupied |
| Single Unit, Detached | 1,390 (98.6%) | 20 (1.4%) |
| Single Unit, Attached | 739 (94.5%) | 43 (5.5%) |
| 2 Unit Apartments | 29 (27.6%) | 76 (72.4%) |
| 3 or 4 Unit Apartments | 13 (14.0%) | 80 (86.0%) |
| 5 to 9 Unit Apartments | 138 (43.4%) | 180 (56.6%) |
| 10 or more Apartments | 0 (0.0%) | 925 (100.0%) |
| Mobile Home / Other | 0 (0.0%) | 0 (0.0%) |
| Total | 2,309 (63.6%) | 1,324 (36.4%) |
Housing Structures by Number of Rooms in Monmouth Junction
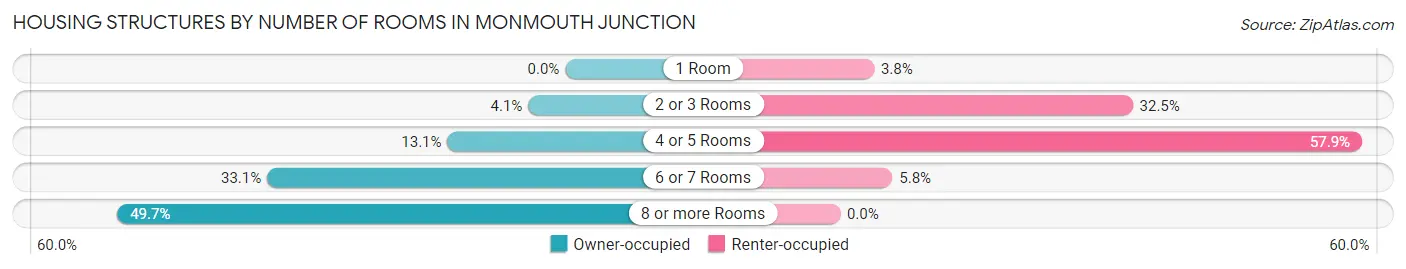
| Number of Rooms | Owner-occupied | Renter-occupied |
| 1 Room | 0 (0.0%) | 50 (3.8%) |
| 2 or 3 Rooms | 95 (4.1%) | 430 (32.5%) |
| 4 or 5 Rooms | 302 (13.1%) | 767 (57.9%) |
| 6 or 7 Rooms | 764 (33.1%) | 77 (5.8%) |
| 8 or more Rooms | 1,148 (49.7%) | 0 (0.0%) |
| Total | 2,309 (100.0%) | 1,324 (100.0%) |
Housing Structure by Heating Type in Monmouth Junction
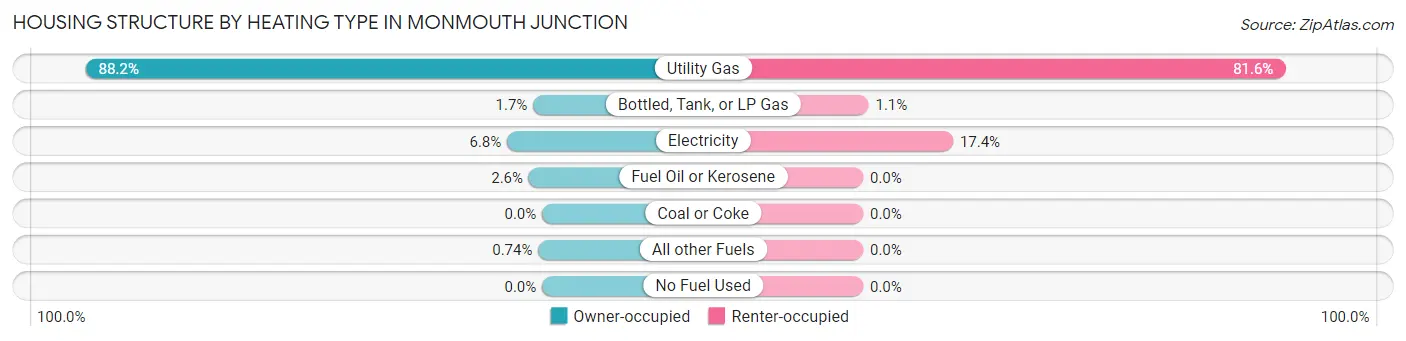
| Heating Type | Owner-occupied | Renter-occupied |
| Utility Gas | 2,037 (88.2%) | 1,080 (81.6%) |
| Bottled, Tank, or LP Gas | 40 (1.7%) | 14 (1.1%) |
| Electricity | 156 (6.8%) | 230 (17.4%) |
| Fuel Oil or Kerosene | 59 (2.6%) | 0 (0.0%) |
| Coal or Coke | 0 (0.0%) | 0 (0.0%) |
| All other Fuels | 17 (0.7%) | 0 (0.0%) |
| No Fuel Used | 0 (0.0%) | 0 (0.0%) |
| Total | 2,309 (100.0%) | 1,324 (100.0%) |
Household Vehicle Usage in Monmouth Junction
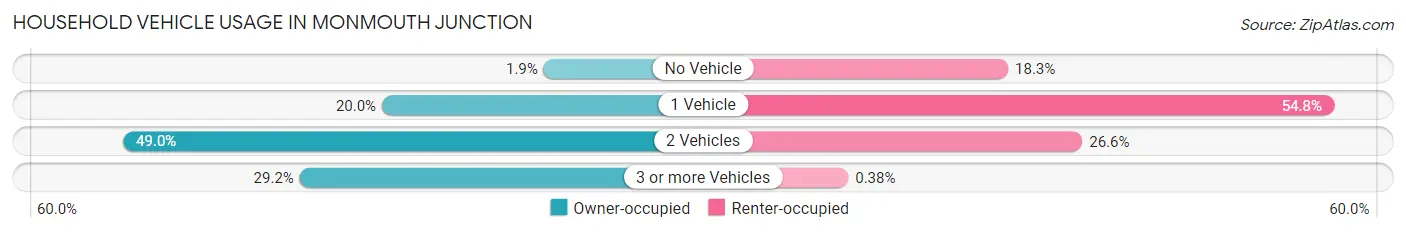
| Vehicles per Household | Owner-occupied | Renter-occupied |
| No Vehicle | 43 (1.9%) | 242 (18.3%) |
| 1 Vehicle | 461 (20.0%) | 725 (54.8%) |
| 2 Vehicles | 1,131 (49.0%) | 352 (26.6%) |
| 3 or more Vehicles | 674 (29.2%) | 5 (0.4%) |
| Total | 2,309 (100.0%) | 1,324 (100.0%) |
Real Estate & Mortgages in Monmouth Junction
Real Estate and Mortgage Overview in Monmouth Junction
| Characteristic | Without Mortgage | With Mortgage |
| Housing Units | 788 | 1,521 |
| Median Property Value | $454,800 | $484,900 |
| Median Household Income | $117,083 | $1,093 |
| Monthly Housing Costs | $1,468 | $882 |
| Real Estate Taxes | $10,001 | $0 |
Property Value by Mortgage Status in Monmouth Junction
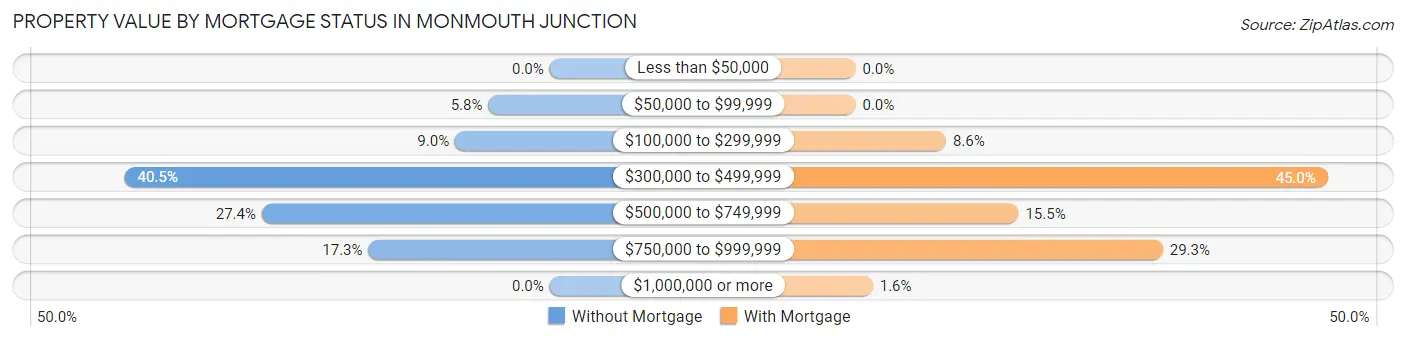
| Property Value | Without Mortgage | With Mortgage |
| Less than $50,000 | 0 (0.0%) | 0 (0.0%) |
| $50,000 to $99,999 | 46 (5.8%) | 0 (0.0%) |
| $100,000 to $299,999 | 71 (9.0%) | 131 (8.6%) |
| $300,000 to $499,999 | 319 (40.5%) | 684 (45.0%) |
| $500,000 to $749,999 | 216 (27.4%) | 236 (15.5%) |
| $750,000 to $999,999 | 136 (17.3%) | 445 (29.3%) |
| $1,000,000 or more | 0 (0.0%) | 25 (1.6%) |
| Total | 788 (100.0%) | 1,521 (100.0%) |
Household Income by Mortgage Status in Monmouth Junction
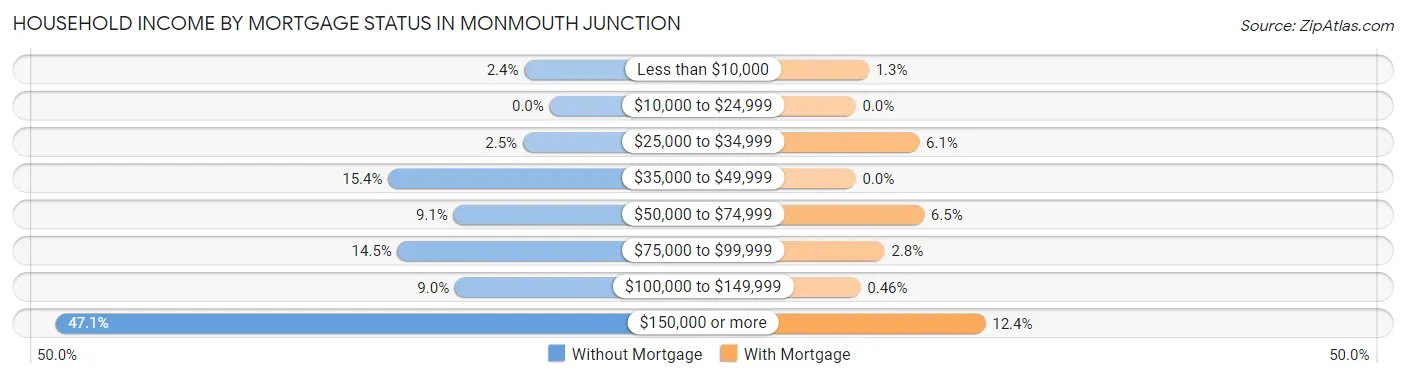
| Household Income | Without Mortgage | With Mortgage |
| Less than $10,000 | 19 (2.4%) | 19 (1.3%) |
| $10,000 to $24,999 | 0 (0.0%) | 0 (0.0%) |
| $25,000 to $34,999 | 20 (2.5%) | 92 (6.0%) |
| $35,000 to $49,999 | 121 (15.4%) | 0 (0.0%) |
| $50,000 to $74,999 | 72 (9.1%) | 99 (6.5%) |
| $75,000 to $99,999 | 114 (14.5%) | 42 (2.8%) |
| $100,000 to $149,999 | 71 (9.0%) | 7 (0.5%) |
| $150,000 or more | 371 (47.1%) | 188 (12.4%) |
| Total | 788 (100.0%) | 1,521 (100.0%) |
Property Value to Household Income Ratio in Monmouth Junction
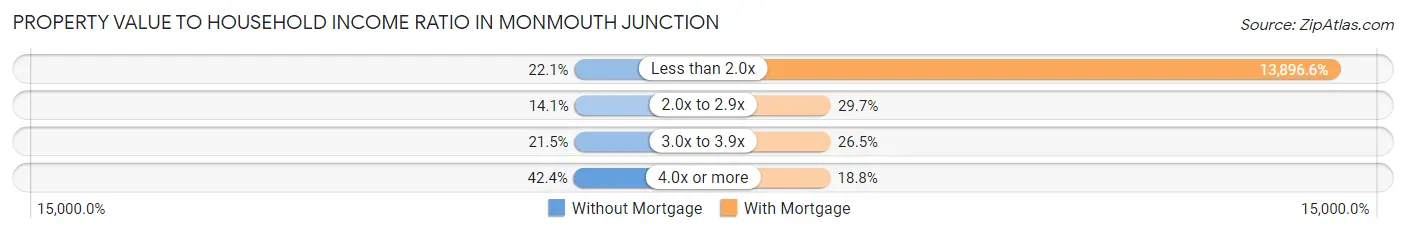
| Value-to-Income Ratio | Without Mortgage | With Mortgage |
| Less than 2.0x | 174 (22.1%) | 211,367 (13,896.6%) |
| 2.0x to 2.9x | 111 (14.1%) | 452 (29.7%) |
| 3.0x to 3.9x | 169 (21.4%) | 403 (26.5%) |
| 4.0x or more | 334 (42.4%) | 286 (18.8%) |
| Total | 788 (100.0%) | 1,521 (100.0%) |
Real Estate Taxes by Mortgage Status in Monmouth Junction
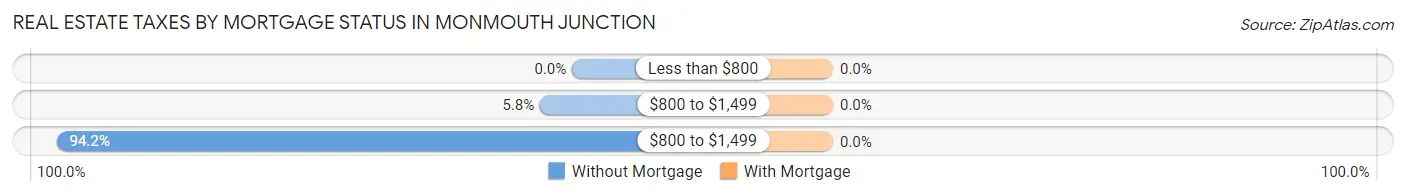
| Property Taxes | Without Mortgage | With Mortgage |
| Less than $800 | 0 (0.0%) | 0 (0.0%) |
| $800 to $1,499 | 46 (5.8%) | 0 (0.0%) |
| $800 to $1,499 | 742 (94.2%) | 0 (0.0%) |
| Total | 788 (100.0%) | 1,521 (100.0%) |
Health & Disability in Monmouth Junction
Health Insurance Coverage by Age in Monmouth Junction
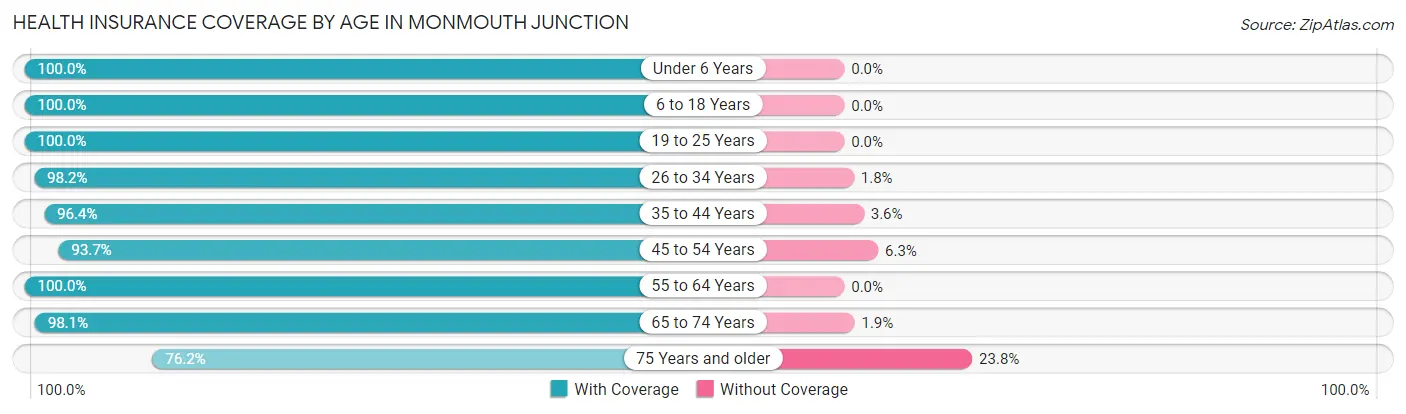
| Age Bracket | With Coverage | Without Coverage |
| Under 6 Years | 676 (100.0%) | 0 (0.0%) |
| 6 to 18 Years | 1,641 (100.0%) | 0 (0.0%) |
| 19 to 25 Years | 870 (100.0%) | 0 (0.0%) |
| 26 to 34 Years | 991 (98.2%) | 18 (1.8%) |
| 35 to 44 Years | 1,595 (96.4%) | 60 (3.6%) |
| 45 to 54 Years | 1,454 (93.7%) | 98 (6.3%) |
| 55 to 64 Years | 1,462 (100.0%) | 0 (0.0%) |
| 65 to 74 Years | 720 (98.1%) | 14 (1.9%) |
| 75 Years and older | 115 (76.2%) | 36 (23.8%) |
| Total | 9,524 (97.7%) | 226 (2.3%) |
Health Insurance Coverage by Citizenship Status in Monmouth Junction
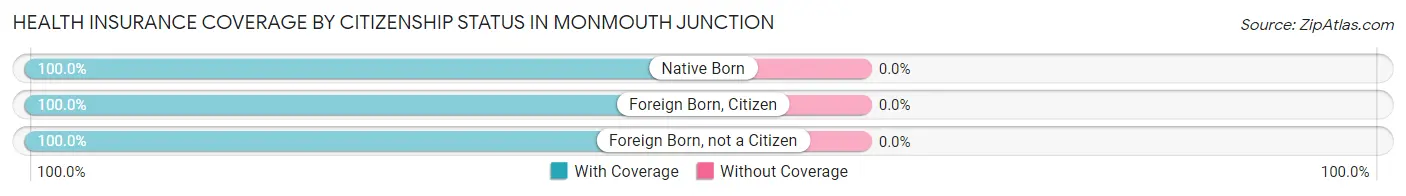
| Citizenship Status | With Coverage | Without Coverage |
| Native Born | 676 (100.0%) | 0 (0.0%) |
| Foreign Born, Citizen | 1,641 (100.0%) | 0 (0.0%) |
| Foreign Born, not a Citizen | 870 (100.0%) | 0 (0.0%) |
Health Insurance Coverage by Household Income in Monmouth Junction
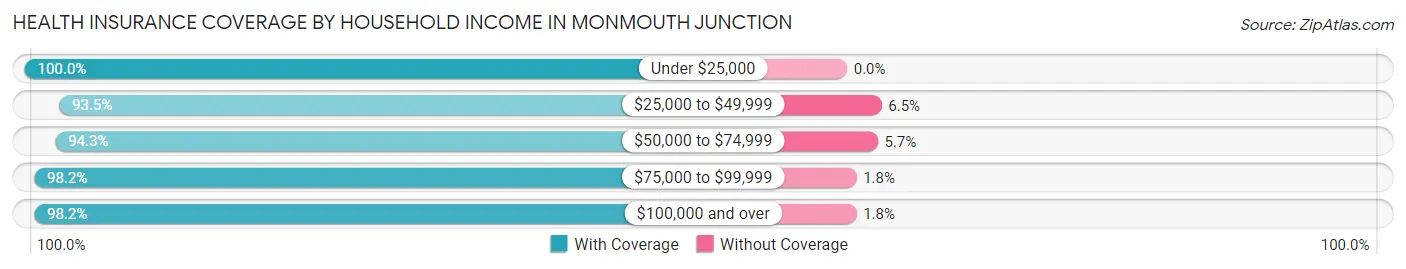
| Household Income | With Coverage | Without Coverage |
| Under $25,000 | 550 (100.0%) | 0 (0.0%) |
| $25,000 to $49,999 | 650 (93.5%) | 45 (6.5%) |
| $50,000 to $74,999 | 722 (94.3%) | 44 (5.7%) |
| $75,000 to $99,999 | 778 (98.2%) | 14 (1.8%) |
| $100,000 and over | 6,819 (98.2%) | 123 (1.8%) |
Public vs Private Health Insurance Coverage by Age in Monmouth Junction
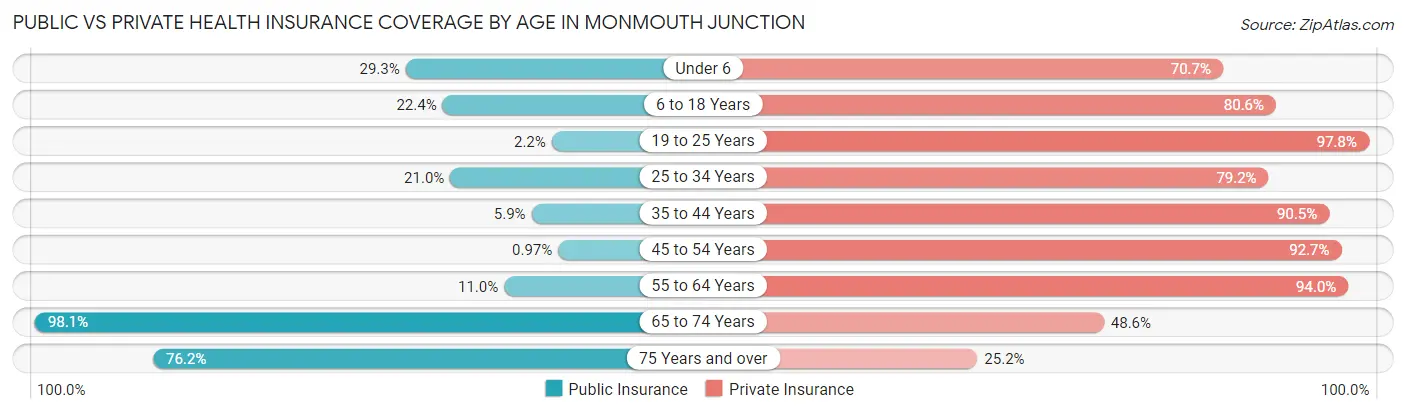
| Age Bracket | Public Insurance | Private Insurance |
| Under 6 | 198 (29.3%) | 478 (70.7%) |
| 6 to 18 Years | 368 (22.4%) | 1,322 (80.6%) |
| 19 to 25 Years | 19 (2.2%) | 851 (97.8%) |
| 25 to 34 Years | 212 (21.0%) | 799 (79.2%) |
| 35 to 44 Years | 98 (5.9%) | 1,497 (90.4%) |
| 45 to 54 Years | 15 (1.0%) | 1,439 (92.7%) |
| 55 to 64 Years | 161 (11.0%) | 1,374 (94.0%) |
| 65 to 74 Years | 720 (98.1%) | 357 (48.6%) |
| 75 Years and over | 115 (76.2%) | 38 (25.2%) |
| Total | 1,906 (19.6%) | 8,155 (83.6%) |
Disability Status by Sex by Age in Monmouth Junction
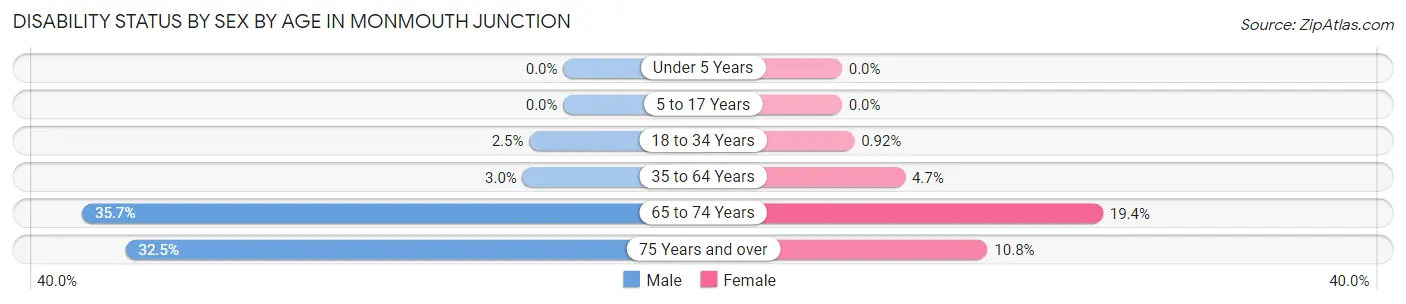
| Age Bracket | Male | Female |
| Under 5 Years | 0 (0.0%) | 0 (0.0%) |
| 5 to 17 Years | 0 (0.0%) | 0 (0.0%) |
| 18 to 34 Years | 20 (2.5%) | 10 (0.9%) |
| 35 to 64 Years | 72 (3.0%) | 107 (4.7%) |
| 65 to 74 Years | 124 (35.7%) | 75 (19.4%) |
| 75 Years and over | 13 (32.5%) | 12 (10.8%) |
Disability Class by Sex by Age in Monmouth Junction
Disability Class: Hearing Difficulty
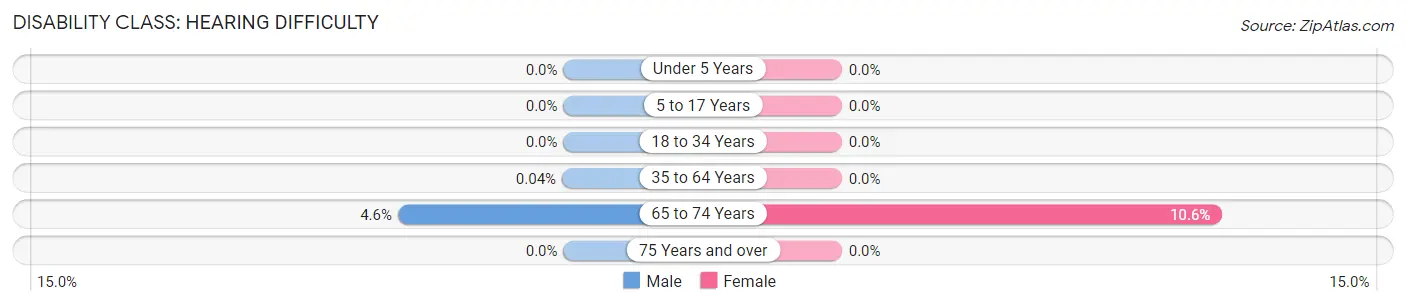
| Age Bracket | Male | Female |
| Under 5 Years | 0 (0.0%) | 0 (0.0%) |
| 5 to 17 Years | 0 (0.0%) | 0 (0.0%) |
| 18 to 34 Years | 0 (0.0%) | 0 (0.0%) |
| 35 to 64 Years | 1 (0.0%) | 0 (0.0%) |
| 65 to 74 Years | 16 (4.6%) | 41 (10.6%) |
| 75 Years and over | 0 (0.0%) | 0 (0.0%) |
Disability Class: Vision Difficulty
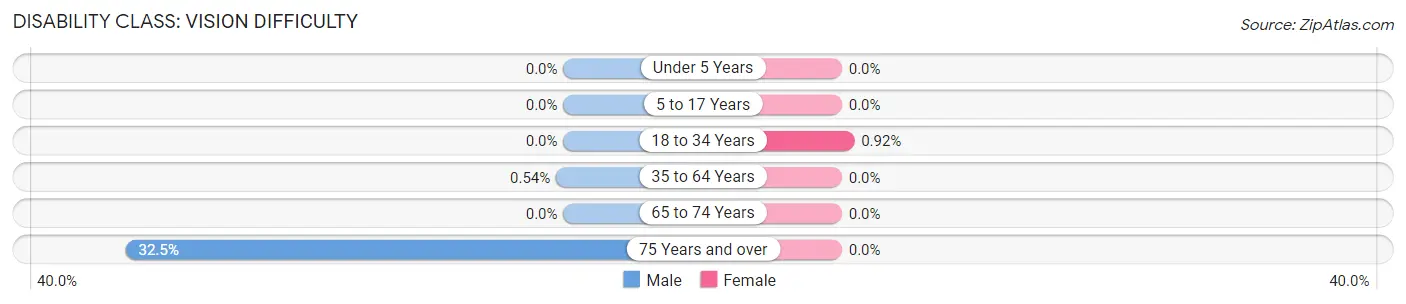
| Age Bracket | Male | Female |
| Under 5 Years | 0 (0.0%) | 0 (0.0%) |
| 5 to 17 Years | 0 (0.0%) | 0 (0.0%) |
| 18 to 34 Years | 0 (0.0%) | 10 (0.9%) |
| 35 to 64 Years | 13 (0.5%) | 0 (0.0%) |
| 65 to 74 Years | 0 (0.0%) | 0 (0.0%) |
| 75 Years and over | 13 (32.5%) | 0 (0.0%) |
Disability Class: Cognitive Difficulty
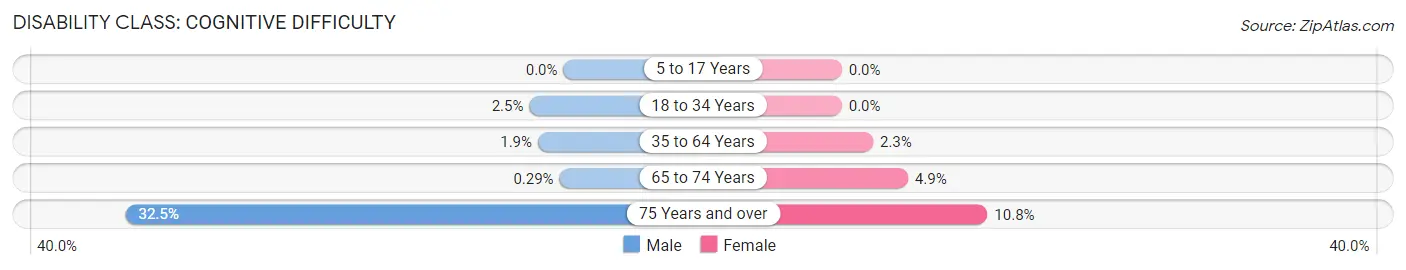
| Age Bracket | Male | Female |
| 5 to 17 Years | 0 (0.0%) | 0 (0.0%) |
| 18 to 34 Years | 20 (2.5%) | 0 (0.0%) |
| 35 to 64 Years | 45 (1.9%) | 53 (2.3%) |
| 65 to 74 Years | 1 (0.3%) | 19 (4.9%) |
| 75 Years and over | 13 (32.5%) | 12 (10.8%) |
Disability Class: Ambulatory Difficulty
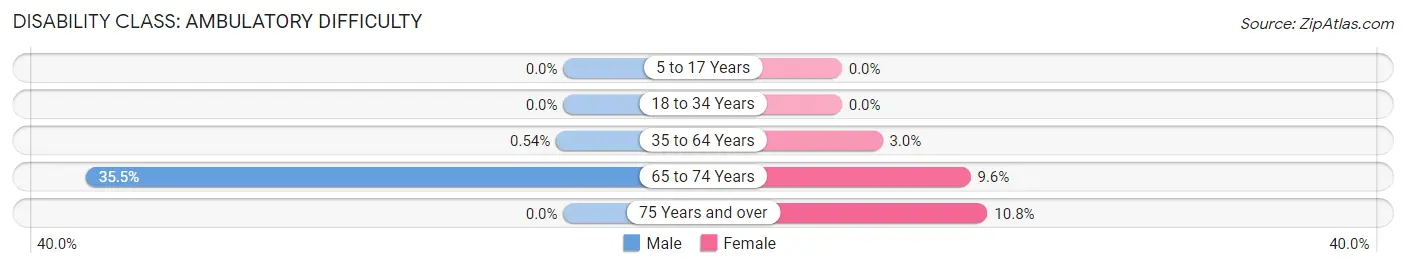
| Age Bracket | Male | Female |
| 5 to 17 Years | 0 (0.0%) | 0 (0.0%) |
| 18 to 34 Years | 0 (0.0%) | 0 (0.0%) |
| 35 to 64 Years | 13 (0.5%) | 69 (3.0%) |
| 65 to 74 Years | 123 (35.4%) | 37 (9.6%) |
| 75 Years and over | 0 (0.0%) | 12 (10.8%) |
Disability Class: Self-Care Difficulty
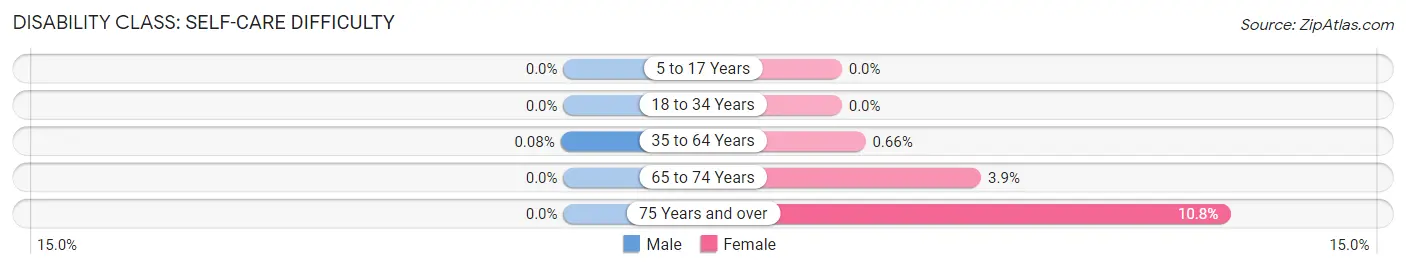
| Age Bracket | Male | Female |
| 5 to 17 Years | 0 (0.0%) | 0 (0.0%) |
| 18 to 34 Years | 0 (0.0%) | 0 (0.0%) |
| 35 to 64 Years | 2 (0.1%) | 15 (0.7%) |
| 65 to 74 Years | 0 (0.0%) | 15 (3.9%) |
| 75 Years and over | 0 (0.0%) | 12 (10.8%) |
Technology Access in Monmouth Junction
Computing Device Access in Monmouth Junction
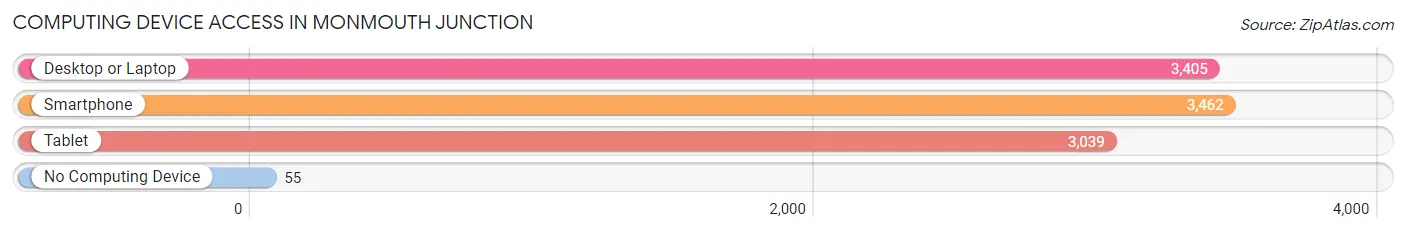
| Device Type | # Households | % Households |
| Desktop or Laptop | 3,405 | 93.7% |
| Smartphone | 3,462 | 95.3% |
| Tablet | 3,039 | 83.7% |
| No Computing Device | 55 | 1.5% |
| Total | 3,633 | 100.0% |
Internet Access in Monmouth Junction
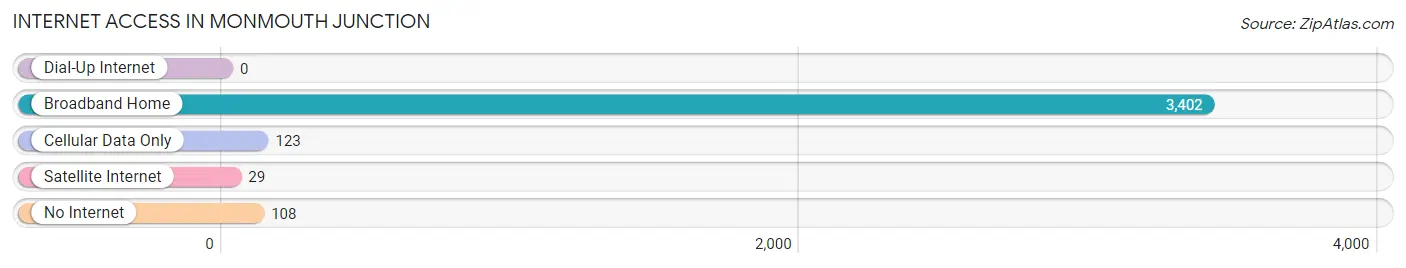
| Internet Type | # Households | % Households |
| Dial-Up Internet | 0 | 0.0% |
| Broadband Home | 3,402 | 93.6% |
| Cellular Data Only | 123 | 3.4% |
| Satellite Internet | 29 | 0.8% |
| No Internet | 108 | 3.0% |
| Total | 3,633 | 100.0% |
Monmouth Junction Summary
Monmouth Junction is a small unincorporated community located in South Brunswick Township, Middlesex County, New Jersey. It is situated along the Millstone River, approximately 25 miles southwest of New York City. The area is home to a diverse population of approximately 8,000 people, with a median household income of $90,000.
History
Monmouth Junction was first settled in the late 1700s by Dutch and English settlers. The area was originally known as “Monmouth” and was part of the larger township of South Brunswick. In 1845, the area was renamed “Monmouth Junction” after the junction of the Pennsylvania Railroad and the Camden and Amboy Railroad. The area was primarily agricultural until the late 19th century, when it began to develop into a residential community.
Geography
Monmouth Junction is located in the central part of South Brunswick Township, approximately 25 miles southwest of New York City. It is situated along the Millstone River, which flows through the area. The area is mostly flat, with some rolling hills in the northern part of the community. The climate is humid subtropical, with hot, humid summers and cold, wet winters.
Economy
Monmouth Junction is primarily a residential community, with a few small businesses located in the area. The largest employer in the area is the South Brunswick School District, which employs over 1,000 people. Other major employers include the South Brunswick Public Library, the South Brunswick Police Department, and the South Brunswick Fire Department.
Demographics
As of the 2010 census, Monmouth Junction had a population of 8,000 people. The racial makeup of the community was 79.3% White, 8.2% African American, 0.3% Native American, 8.2% Asian, and 4.0% from other races. The median household income was $90,000, and the median age was 43.
Monmouth Junction is a diverse community, with a variety of cultures and backgrounds represented. The area is home to a large number of immigrants, including those from India, China, and the Philippines. The community is also home to a large number of families, with over half of the population under the age of 18.
Monmouth Junction is a small, diverse community located in South Brunswick Township, Middlesex County, New Jersey. It is situated along the Millstone River, approximately 25 miles southwest of New York City. The area is home to a diverse population of approximately 8,000 people, with a median household income of $90,000. The area is primarily residential, with a few small businesses located in the area. The largest employer in the area is the South Brunswick School District, which employs over 1,000 people. Monmouth Junction is a diverse community, with a variety of cultures and backgrounds represented. The area is home to a large number of immigrants, including those from India, China, and the Philippines. The community is also home to a large number of families, with over half of the population under the age of 18.
Common Questions
What is Per Capita Income in Monmouth Junction?
Per Capita income in Monmouth Junction is $60,679.
What is the Median Family Income in Monmouth Junction?
Median Family Income in Monmouth Junction is $144,612.
What is the Median Household income in Monmouth Junction?
Median Household Income in Monmouth Junction is $121,857.
What is Income or Wage Gap in Monmouth Junction?
Income or Wage Gap in Monmouth Junction is 50.2%.
Women in Monmouth Junction earn 49.8 cents for every dollar earned by a man.
What is Inequality or Gini Index in Monmouth Junction?
Inequality or Gini Index in Monmouth Junction is 0.41.
What is the Total Population of Monmouth Junction?
Total Population of Monmouth Junction is 9,750.
What is the Total Male Population of Monmouth Junction?
Total Male Population of Monmouth Junction is 4,566.
What is the Total Female Population of Monmouth Junction?
Total Female Population of Monmouth Junction is 5,184.
What is the Ratio of Males per 100 Females in Monmouth Junction?
There are 88.08 Males per 100 Females in Monmouth Junction.
What is the Ratio of Females per 100 Males in Monmouth Junction?
There are 113.53 Females per 100 Males in Monmouth Junction.
What is the Median Population Age in Monmouth Junction?
Median Population Age in Monmouth Junction is 38.6 Years.
What is the Average Family Size in Monmouth Junction
Average Family Size in Monmouth Junction is 3.2 People.
What is the Average Household Size in Monmouth Junction
Average Household Size in Monmouth Junction is 2.7 People.
How Large is the Labor Force in Monmouth Junction?
There are 5,698 People in the Labor Forcein in Monmouth Junction.
What is the Percentage of People in the Labor Force in Monmouth Junction?
74.7% of People are in the Labor Force in Monmouth Junction.
What is the Unemployment Rate in Monmouth Junction?
Unemployment Rate in Monmouth Junction is 2.9%.