Traverse City, MI Map & Demographics
Traverse City Map
Traverse City Overview
$48,883
PER CAPITA INCOME
$99,595
AVG FAMILY INCOME
$70,700
AVG HOUSEHOLD INCOME
23.6%
WAGE / INCOME GAP [ % ]
76.4¢/ $1
WAGE / INCOME GAP [ $ ]
0.52
INEQUALITY / GINI INDEX
15,468
TOTAL POPULATION
7,505
MALE POPULATION
7,963
FEMALE POPULATION
94.25
MALES / 100 FEMALES
106.10
FEMALES / 100 MALES
41.9
MEDIAN AGE
2.9
AVG FAMILY SIZE
2.1
AVG HOUSEHOLD SIZE
8,319
LABOR FORCE [ PEOPLE ]
63.4%
PERCENT IN LABOR FORCE
5.3%
UNEMPLOYMENT RATE
Traverse City Area Codes
Income in Traverse City
Income Overview in Traverse City
Per Capita Income in Traverse City is $48,883, while median incomes of families and households are $99,595 and $70,700 respectively.
| Characteristic | Number | Measure |
| Per Capita Income | 15,468 | $48,883 |
| Median Family Income | 3,427 | $99,595 |
| Mean Family Income | 3,427 | $128,935 |
| Median Household Income | 7,104 | $70,700 |
| Mean Household Income | 7,104 | $103,429 |
| Income Deficit | 3,427 | $0 |
| Wage / Income Gap (%) | 15,468 | 23.57% |
| Wage / Income Gap ($) | 15,468 | 76.43¢ per $1 |
| Gini / Inequality Index | 15,468 | 0.52 |
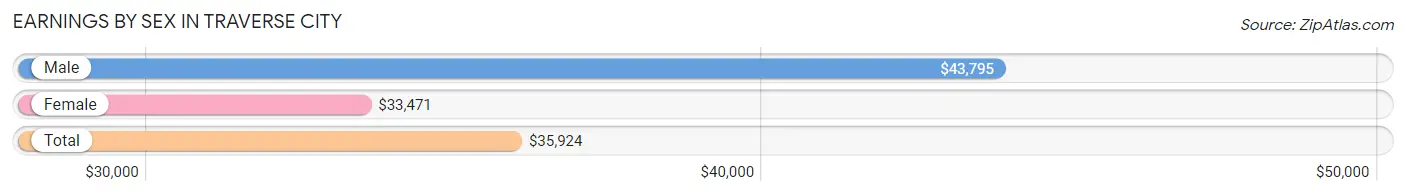
Earnings by Sex in Traverse City
Average Earnings in Traverse City are $35,924, $43,795 for men and $33,471 for women, a difference of 23.6%.
| Sex | Number | Average Earnings |
| Male | 4,583 (52.7%) | $43,795 |
| Female | 4,111 (47.3%) | $33,471 |
| Total | 8,694 (100.0%) | $35,924 |
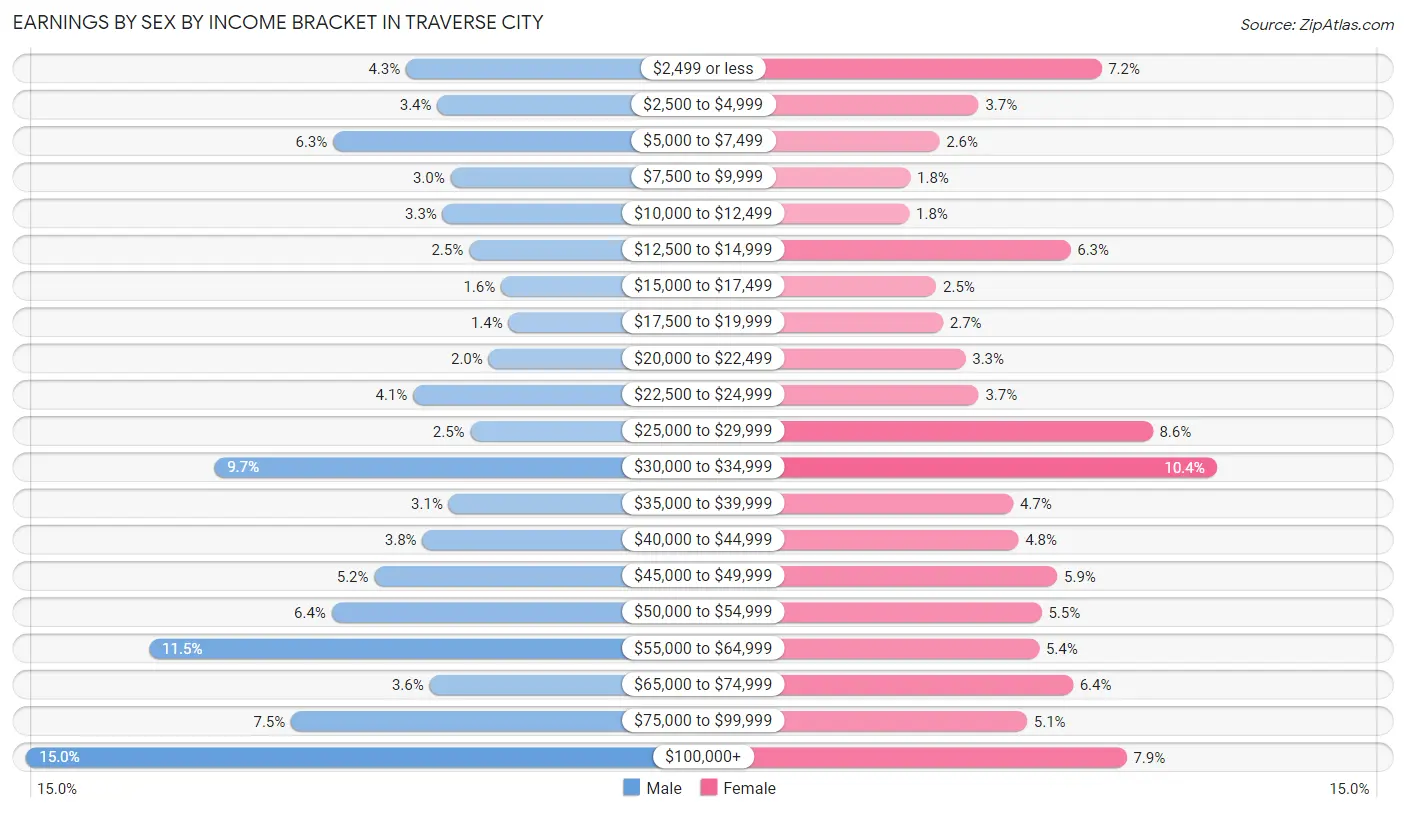
Earnings by Sex by Income Bracket in Traverse City
The most common earnings brackets in Traverse City are $100,000+ for men (685 | 14.9%) and $30,000 to $34,999 for women (427 | 10.4%).
| Income | Male | Female |
| $2,499 or less | 196 (4.3%) | 294 (7.1%) |
| $2,500 to $4,999 | 156 (3.4%) | 152 (3.7%) |
| $5,000 to $7,499 | 290 (6.3%) | 107 (2.6%) |
| $7,500 to $9,999 | 139 (3.0%) | 73 (1.8%) |
| $10,000 to $12,499 | 149 (3.3%) | 72 (1.8%) |
| $12,500 to $14,999 | 115 (2.5%) | 258 (6.3%) |
| $15,000 to $17,499 | 74 (1.6%) | 103 (2.5%) |
| $17,500 to $19,999 | 64 (1.4%) | 111 (2.7%) |
| $20,000 to $22,499 | 90 (2.0%) | 137 (3.3%) |
| $22,500 to $24,999 | 187 (4.1%) | 152 (3.7%) |
| $25,000 to $29,999 | 113 (2.5%) | 353 (8.6%) |
| $30,000 to $34,999 | 443 (9.7%) | 427 (10.4%) |
| $35,000 to $39,999 | 141 (3.1%) | 192 (4.7%) |
| $40,000 to $44,999 | 175 (3.8%) | 198 (4.8%) |
| $45,000 to $49,999 | 237 (5.2%) | 243 (5.9%) |
| $50,000 to $54,999 | 292 (6.4%) | 225 (5.5%) |
| $55,000 to $64,999 | 527 (11.5%) | 222 (5.4%) |
| $65,000 to $74,999 | 166 (3.6%) | 261 (6.4%) |
| $75,000 to $99,999 | 344 (7.5%) | 208 (5.1%) |
| $100,000+ | 685 (14.9%) | 323 (7.9%) |
| Total | 4,583 (100.0%) | 4,111 (100.0%) |
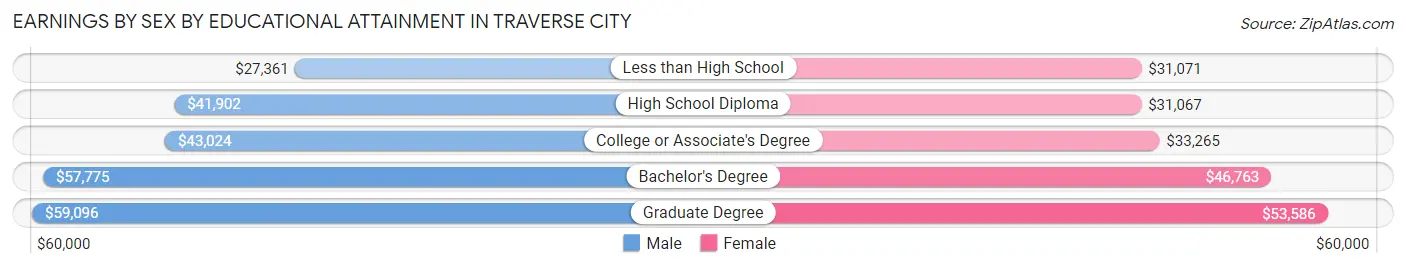
Earnings by Sex by Educational Attainment in Traverse City
Average earnings in Traverse City are $50,291 for men and $39,828 for women, a difference of 20.8%. Men with an educational attainment of graduate degree enjoy the highest average annual earnings of $59,096, while those with less than high school education earn the least with $27,361. Women with an educational attainment of graduate degree earn the most with the average annual earnings of $53,586, while those with high school diploma education have the smallest earnings of $31,067.
| Educational Attainment | Male Income | Female Income |
| Less than High School | $27,361 | $31,071 |
| High School Diploma | $41,902 | $31,067 |
| College or Associate's Degree | $43,024 | $33,265 |
| Bachelor's Degree | $57,775 | $46,763 |
| Graduate Degree | $59,096 | $53,586 |
| Total | $50,291 | $39,828 |
Family Income in Traverse City
Family Income Brackets in Traverse City
According to the Traverse City family income data, there are 864 families falling into the $100,000 to $149,999 income range, which is the most common income bracket and makes up 25.2% of all families. Conversely, the less than $10,000 income bracket is the least frequent group with only 21 families (0.6%) belonging to this category.
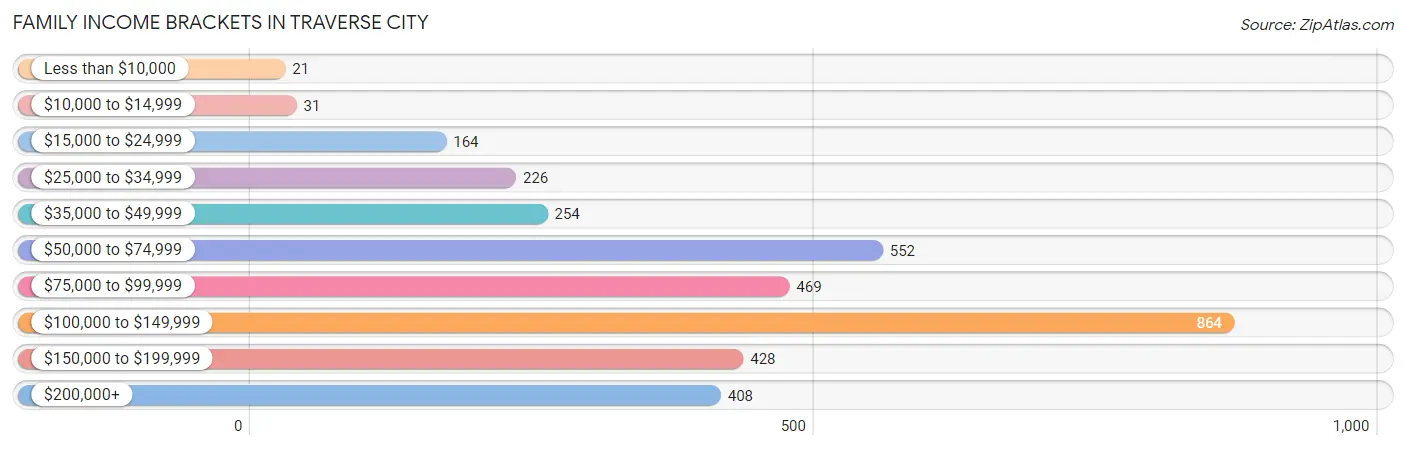
| Income Bracket | # Families | % Families |
| Less than $10,000 | 21 | 0.6% |
| $10,000 to $14,999 | 31 | 0.9% |
| $15,000 to $24,999 | 164 | 4.8% |
| $25,000 to $34,999 | 226 | 6.6% |
| $35,000 to $49,999 | 254 | 7.4% |
| $50,000 to $74,999 | 552 | 16.1% |
| $75,000 to $99,999 | 469 | 13.7% |
| $100,000 to $149,999 | 864 | 25.2% |
| $150,000 to $199,999 | 428 | 12.5% |
| $200,000+ | 408 | 11.9% |
Family Income by Famaliy Size in Traverse City
5-person families (215 | 6.3%) account for the highest median family income in Traverse City with $123,448 per family, while 2-person families (2,039 | 59.5%) have the highest median income of $46,758 per family member.
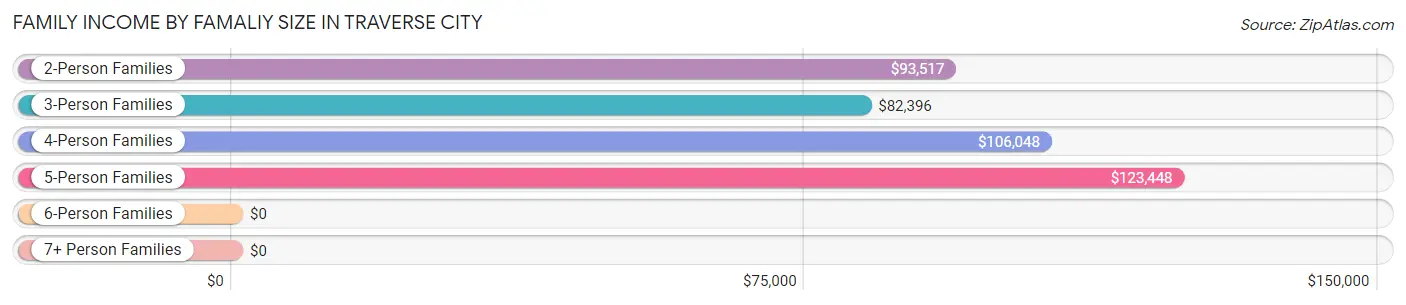
| Income Bracket | # Families | Median Income |
| 2-Person Families | 2,039 (59.5%) | $93,517 |
| 3-Person Families | 666 (19.4%) | $82,396 |
| 4-Person Families | 474 (13.8%) | $106,048 |
| 5-Person Families | 215 (6.3%) | $123,448 |
| 6-Person Families | 12 (0.4%) | $0 |
| 7+ Person Families | 21 (0.6%) | $0 |
| Total | 3,427 (100.0%) | $99,595 |
Family Income by Number of Earners in Traverse City
The median family income in Traverse City is $99,595, with families comprising 3+ earners (241) having the highest median family income of $123,972, while families with 1 earner (1,134) have the lowest median family income of $71,990, accounting for 7.0% and 33.1% of families, respectively.
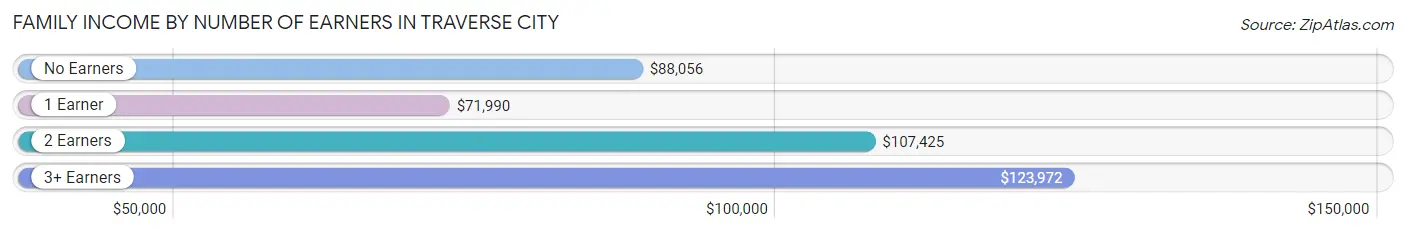
| Number of Earners | # Families | Median Income |
| No Earners | 542 (15.8%) | $88,056 |
| 1 Earner | 1,134 (33.1%) | $71,990 |
| 2 Earners | 1,510 (44.1%) | $107,425 |
| 3+ Earners | 241 (7.0%) | $123,972 |
| Total | 3,427 (100.0%) | $99,595 |
Household Income in Traverse City
Household Income Brackets in Traverse City
With 1,357 households falling in the category, the $50,000 to $74,999 income range is the most frequent in Traverse City, accounting for 19.1% of all households. In contrast, only 185 households (2.6%) fall into the $10,000 to $14,999 income bracket, making it the least populous group.
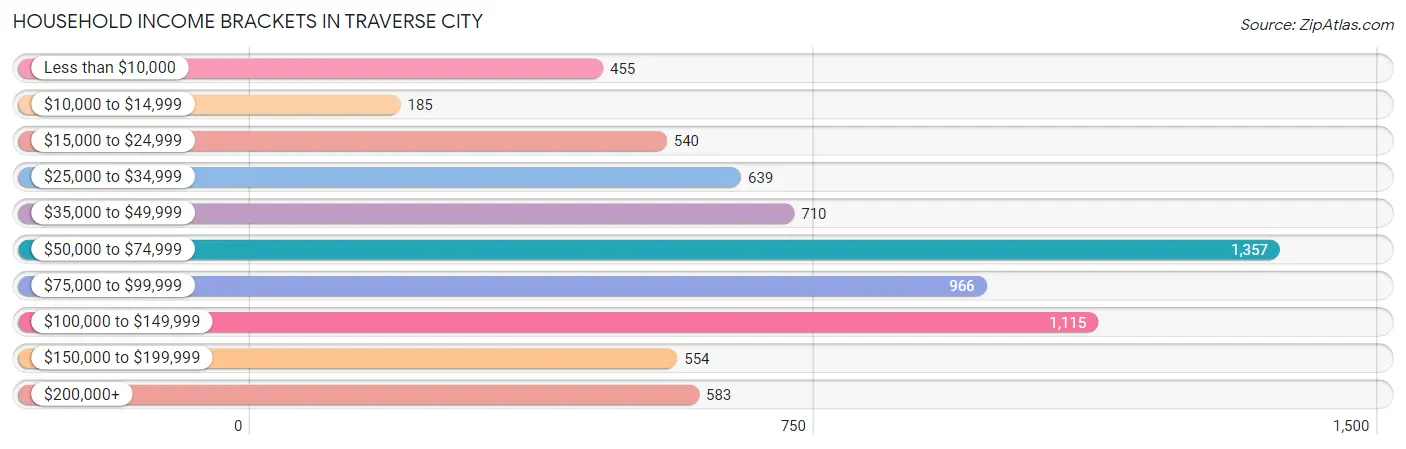
| Income Bracket | # Households | % Households |
| Less than $10,000 | 455 | 6.4% |
| $10,000 to $14,999 | 185 | 2.6% |
| $15,000 to $24,999 | 540 | 7.6% |
| $25,000 to $34,999 | 639 | 9.0% |
| $35,000 to $49,999 | 710 | 10.0% |
| $50,000 to $74,999 | 1,357 | 19.1% |
| $75,000 to $99,999 | 966 | 13.6% |
| $100,000 to $149,999 | 1,115 | 15.7% |
| $150,000 to $199,999 | 554 | 7.8% |
| $200,000+ | 583 | 8.2% |
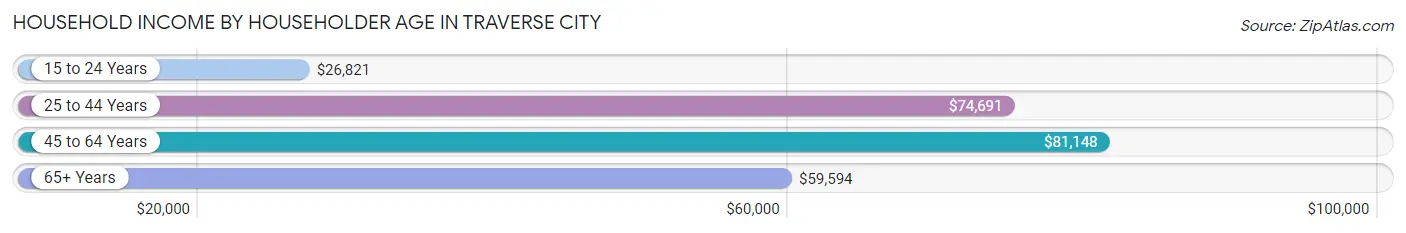
Household Income by Householder Age in Traverse City
The median household income in Traverse City is $70,700, with the highest median household income of $81,148 found in the 45 to 64 years age bracket for the primary householder. A total of 2,083 households (29.3%) fall into this category. Meanwhile, the 15 to 24 years age bracket for the primary householder has the lowest median household income of $26,821, with 215 households (3.0%) in this group.
| Income Bracket | # Households | Median Income |
| 15 to 24 Years | 215 (3.0%) | $26,821 |
| 25 to 44 Years | 2,365 (33.3%) | $74,691 |
| 45 to 64 Years | 2,083 (29.3%) | $81,148 |
| 65+ Years | 2,441 (34.4%) | $59,594 |
| Total | 7,104 (100.0%) | $70,700 |
Poverty in Traverse City
Income Below Poverty by Sex and Age in Traverse City
With 12.9% poverty level for males and 9.7% for females among the residents of Traverse City, 5 year old males and 5 year old females are the most vulnerable to poverty, with 42 males (68.9%) and 25 females (23.6%) in their respective age groups living below the poverty level.
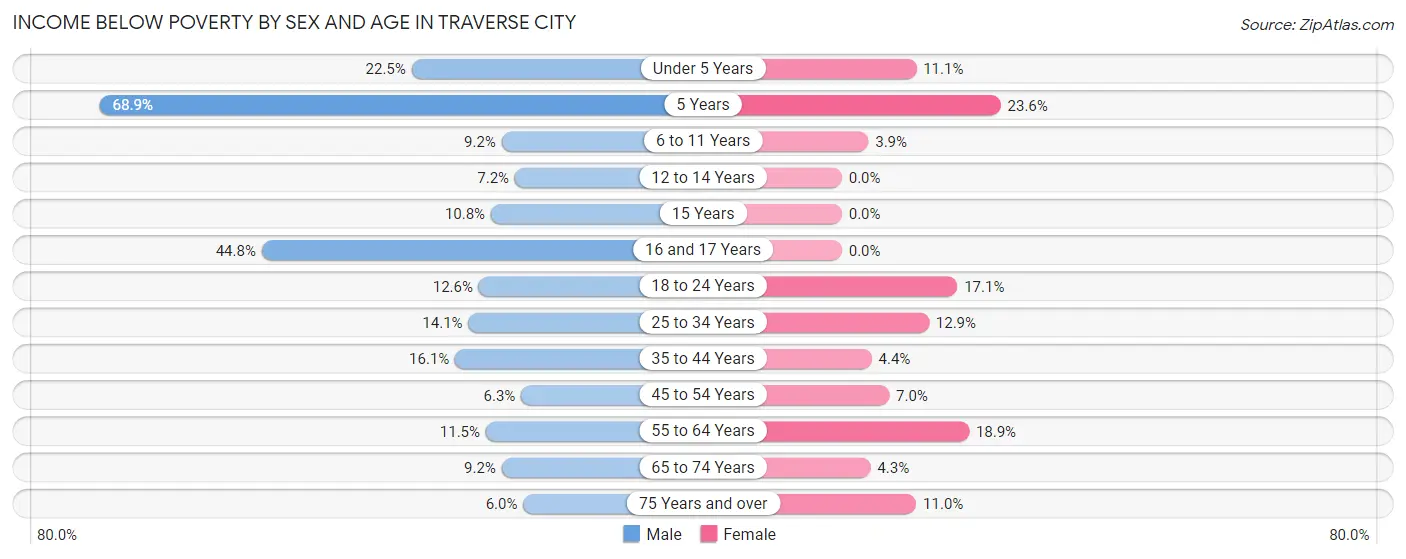
| Age Bracket | Male | Female |
| Under 5 Years | 57 (22.5%) | 43 (11.1%) |
| 5 Years | 42 (68.9%) | 25 (23.6%) |
| 6 to 11 Years | 24 (9.2%) | 17 (3.9%) |
| 12 to 14 Years | 23 (7.2%) | 0 (0.0%) |
| 15 Years | 10 (10.7%) | 0 (0.0%) |
| 16 and 17 Years | 86 (44.8%) | 0 (0.0%) |
| 18 to 24 Years | 60 (12.6%) | 115 (17.1%) |
| 25 to 34 Years | 183 (14.1%) | 131 (12.9%) |
| 35 to 44 Years | 156 (16.1%) | 39 (4.4%) |
| 45 to 54 Years | 54 (6.3%) | 53 (7.0%) |
| 55 to 64 Years | 106 (11.5%) | 186 (18.9%) |
| 65 to 74 Years | 90 (9.2%) | 54 (4.3%) |
| 75 Years and over | 26 (5.9%) | 83 (11.0%) |
| Total | 917 (12.9%) | 746 (9.7%) |
Income Above Poverty by Sex and Age in Traverse City
According to the poverty statistics in Traverse City, males aged 75 years and over and females aged 12 to 14 years are the age groups that are most secure financially, with 94.1% of males and 100.0% of females in these age groups living above the poverty line.
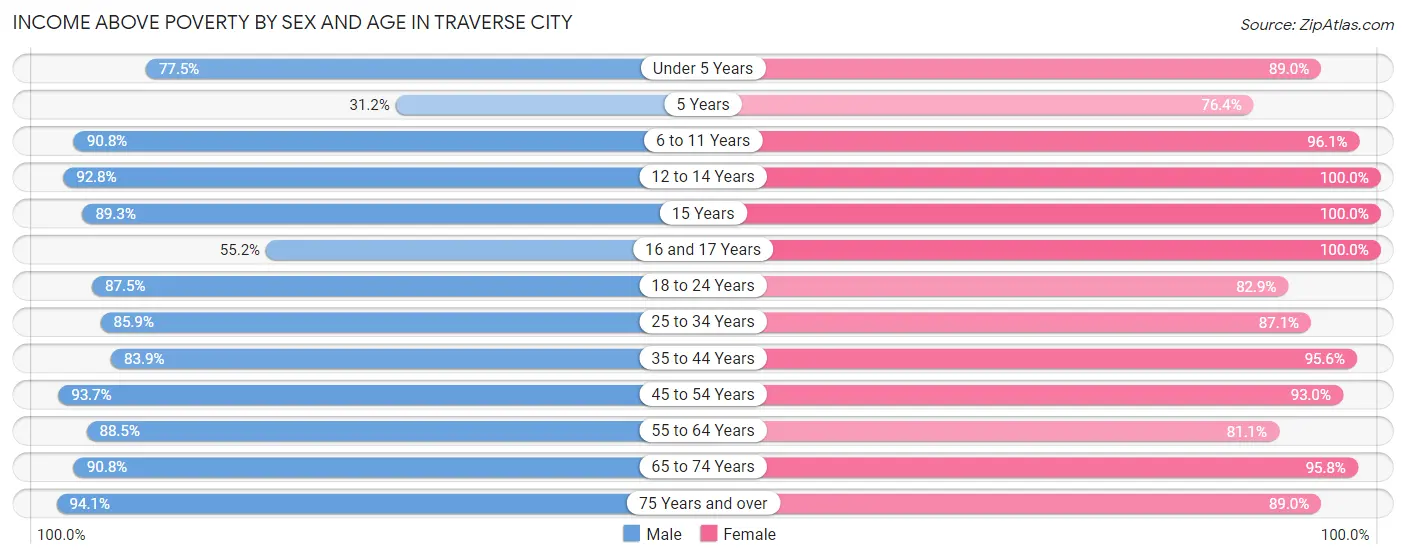
| Age Bracket | Male | Female |
| Under 5 Years | 196 (77.5%) | 346 (88.9%) |
| 5 Years | 19 (31.1%) | 81 (76.4%) |
| 6 to 11 Years | 238 (90.8%) | 416 (96.1%) |
| 12 to 14 Years | 297 (92.8%) | 325 (100.0%) |
| 15 Years | 83 (89.2%) | 59 (100.0%) |
| 16 and 17 Years | 106 (55.2%) | 88 (100.0%) |
| 18 to 24 Years | 418 (87.5%) | 556 (82.9%) |
| 25 to 34 Years | 1,115 (85.9%) | 882 (87.1%) |
| 35 to 44 Years | 815 (83.9%) | 842 (95.6%) |
| 45 to 54 Years | 808 (93.7%) | 702 (93.0%) |
| 55 to 64 Years | 815 (88.5%) | 799 (81.1%) |
| 65 to 74 Years | 892 (90.8%) | 1,217 (95.8%) |
| 75 Years and over | 411 (94.1%) | 669 (89.0%) |
| Total | 6,213 (87.1%) | 6,982 (90.3%) |
Income Below Poverty Among Married-Couple Families in Traverse City
The poverty statistics for married-couple families in Traverse City show that 1.6% or 41 of the total 2,555 families live below the poverty line. Families with 3 or 4 children have the highest poverty rate of 9.5%, comprising of 14 families. On the other hand, families with 5 or more children have the lowest poverty rate of 0.0%, which includes 0 families.
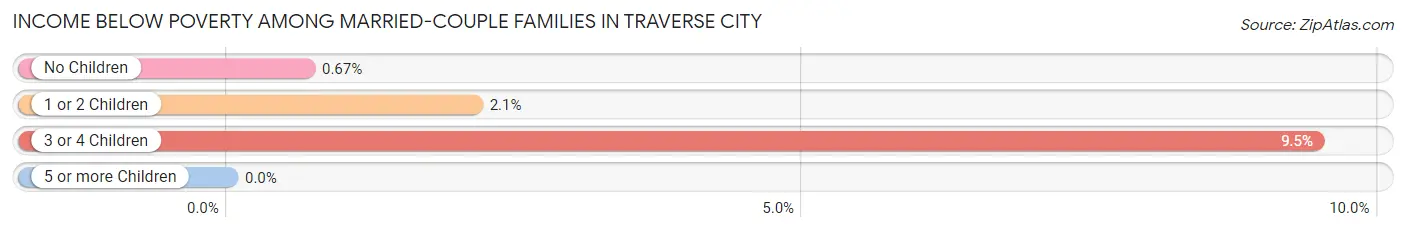
| Children | Above Poverty | Below Poverty |
| No Children | 1,624 (99.3%) | 11 (0.7%) |
| 1 or 2 Children | 735 (97.9%) | 16 (2.1%) |
| 3 or 4 Children | 134 (90.5%) | 14 (9.5%) |
| 5 or more Children | 21 (100.0%) | 0 (0.0%) |
| Total | 2,514 (98.4%) | 41 (1.6%) |
Income Below Poverty Among Single-Parent Households in Traverse City
According to the poverty data in Traverse City, 8.8% or 33 single-father households and 22.1% or 110 single-mother households are living below the poverty line. Among single-father households, those with 3 or 4 children have the highest poverty rate, with 7 households (100.0%) experiencing poverty. Likewise, among single-mother households, those with 1 or 2 children have the highest poverty rate, with 88 households (32.6%) falling below the poverty line.
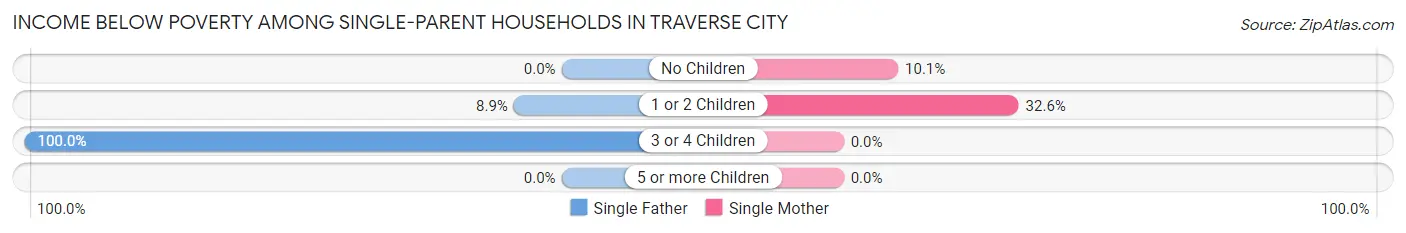
| Children | Single Father | Single Mother |
| No Children | 0 (0.0%) | 22 (10.1%) |
| 1 or 2 Children | 26 (8.9%) | 88 (32.6%) |
| 3 or 4 Children | 7 (100.0%) | 0 (0.0%) |
| 5 or more Children | 0 (0.0%) | 0 (0.0%) |
| Total | 33 (8.8%) | 110 (22.1%) |
Income Below Poverty Among Married-Couple vs Single-Parent Households in Traverse City
The poverty data for Traverse City shows that 41 of the married-couple family households (1.6%) and 143 of the single-parent households (16.4%) are living below the poverty level. Within the married-couple family households, those with 3 or 4 children have the highest poverty rate, with 14 households (9.5%) falling below the poverty line. Among the single-parent households, those with 3 or 4 children have the highest poverty rate, with 7 household (41.2%) living below poverty.
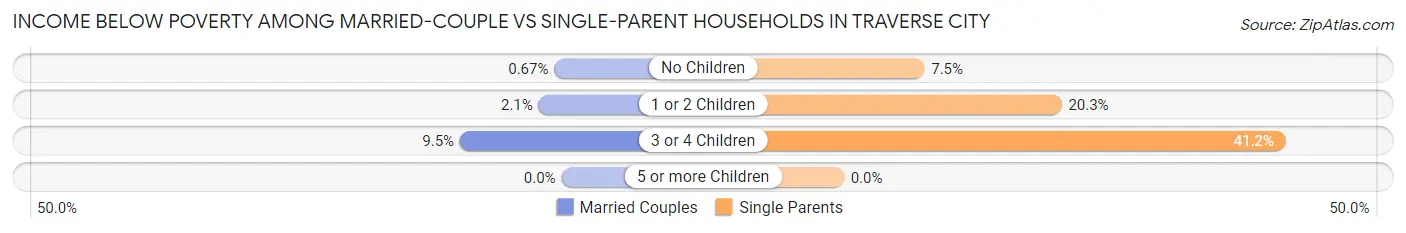
| Children | Married-Couple Families | Single-Parent Households |
| No Children | 11 (0.7%) | 22 (7.5%) |
| 1 or 2 Children | 16 (2.1%) | 114 (20.3%) |
| 3 or 4 Children | 14 (9.5%) | 7 (41.2%) |
| 5 or more Children | 0 (0.0%) | 0 (0.0%) |
| Total | 41 (1.6%) | 143 (16.4%) |
Race in Traverse City
The most populous races in Traverse City are White / Caucasian (14,230 | 92.0%), Two or more Races (650 | 4.2%), and Hispanic or Latino (544 | 3.5%).
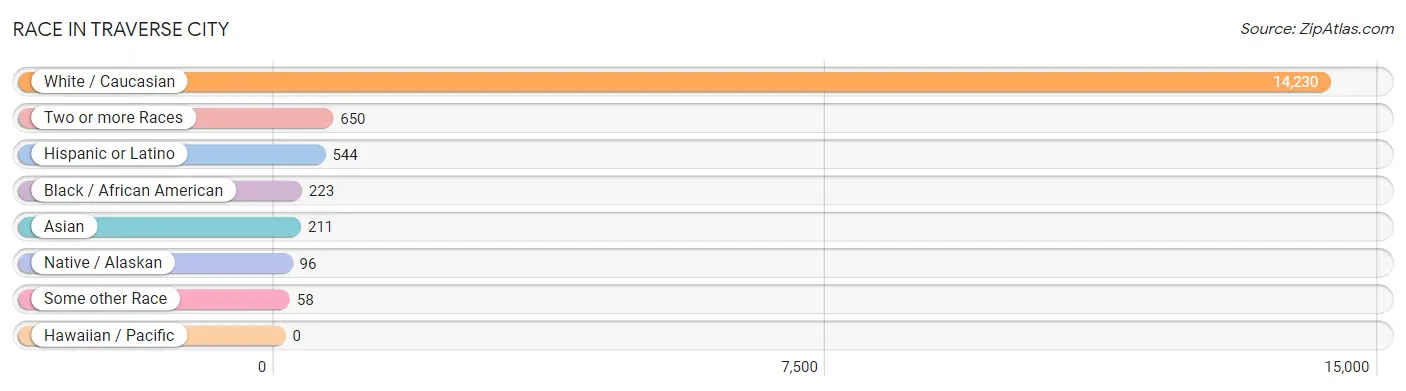
| Race | # Population | % Population |
| Asian | 211 | 1.4% |
| Black / African American | 223 | 1.4% |
| Hawaiian / Pacific | 0 | 0.0% |
| Hispanic or Latino | 544 | 3.5% |
| Native / Alaskan | 96 | 0.6% |
| White / Caucasian | 14,230 | 92.0% |
| Two or more Races | 650 | 4.2% |
| Some other Race | 58 | 0.4% |
| Total | 15,468 | 100.0% |
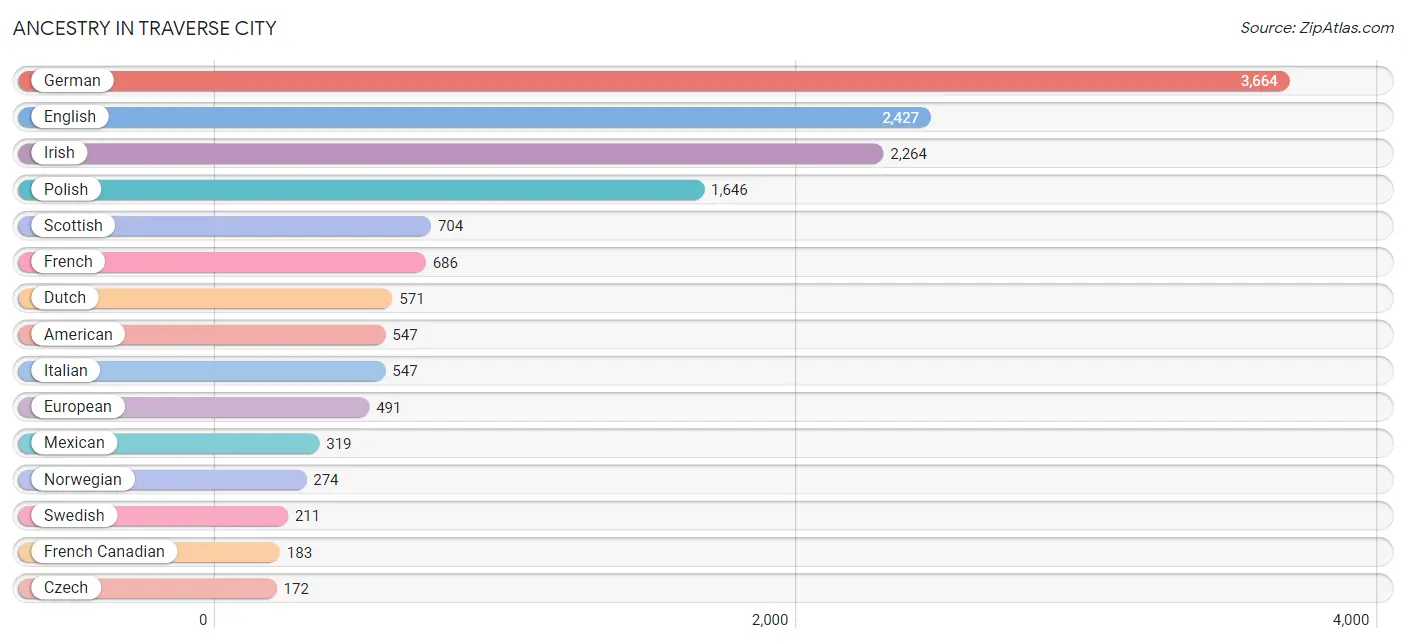
Ancestry in Traverse City
The most populous ancestries reported in Traverse City are German (3,664 | 23.7%), English (2,427 | 15.7%), Irish (2,264 | 14.6%), Polish (1,646 | 10.6%), and Scottish (704 | 4.5%), together accounting for 69.2% of all Traverse City residents.
| Ancestry | # Population | % Population |
| African | 14 | 0.1% |
| American | 547 | 3.5% |
| Arab | 31 | 0.2% |
| Armenian | 7 | 0.1% |
| Austrian | 29 | 0.2% |
| Bangladeshi | 23 | 0.2% |
| Belgian | 44 | 0.3% |
| Bhutanese | 23 | 0.2% |
| Blackfeet | 57 | 0.4% |
| British | 92 | 0.6% |
| British West Indian | 7 | 0.1% |
| Burmese | 23 | 0.2% |
| Canadian | 73 | 0.5% |
| Central American | 94 | 0.6% |
| Cherokee | 43 | 0.3% |
| Chippewa | 100 | 0.6% |
| Colombian | 24 | 0.2% |
| Croatian | 23 | 0.2% |
| Cuban | 5 | 0.0% |
| Czech | 172 | 1.1% |
| Czechoslovakian | 24 | 0.2% |
| Danish | 71 | 0.5% |
| Dutch | 571 | 3.7% |
| Eastern European | 28 | 0.2% |
| English | 2,427 | 15.7% |
| European | 491 | 3.2% |
| Finnish | 158 | 1.0% |
| French | 686 | 4.4% |
| French Canadian | 183 | 1.2% |
| German | 3,664 | 23.7% |
| Greek | 53 | 0.3% |
| Hungarian | 92 | 0.6% |
| Indian (Asian) | 37 | 0.2% |
| Irish | 2,264 | 14.6% |
| Italian | 547 | 3.5% |
| Korean | 30 | 0.2% |
| Laotian | 10 | 0.1% |
| Latvian | 7 | 0.1% |
| Lebanese | 31 | 0.2% |
| Mexican | 319 | 2.1% |
| Nigerian | 8 | 0.1% |
| Northern European | 52 | 0.3% |
| Norwegian | 274 | 1.8% |
| Pennsylvania German | 6 | 0.0% |
| Polish | 1,646 | 10.6% |
| Potawatomi | 67 | 0.4% |
| Puerto Rican | 17 | 0.1% |
| Romanian | 28 | 0.2% |
| Russian | 67 | 0.4% |
| Salvadoran | 94 | 0.6% |
| Scandinavian | 133 | 0.9% |
| Scotch-Irish | 67 | 0.4% |
| Scottish | 704 | 4.5% |
| Seminole | 14 | 0.1% |
| Serbian | 16 | 0.1% |
| Slavic | 31 | 0.2% |
| Slovak | 25 | 0.2% |
| Slovene | 10 | 0.1% |
| South American | 24 | 0.2% |
| Spaniard | 37 | 0.2% |
| Spanish | 19 | 0.1% |
| Subsaharan African | 22 | 0.1% |
| Swedish | 211 | 1.4% |
| Swiss | 61 | 0.4% |
| Thai | 58 | 0.4% |
| Turkish | 20 | 0.1% |
| Ukrainian | 130 | 0.8% |
| Vietnamese | 26 | 0.2% |
| Welsh | 95 | 0.6% | View All 69 Rows |
Immigrants in Traverse City
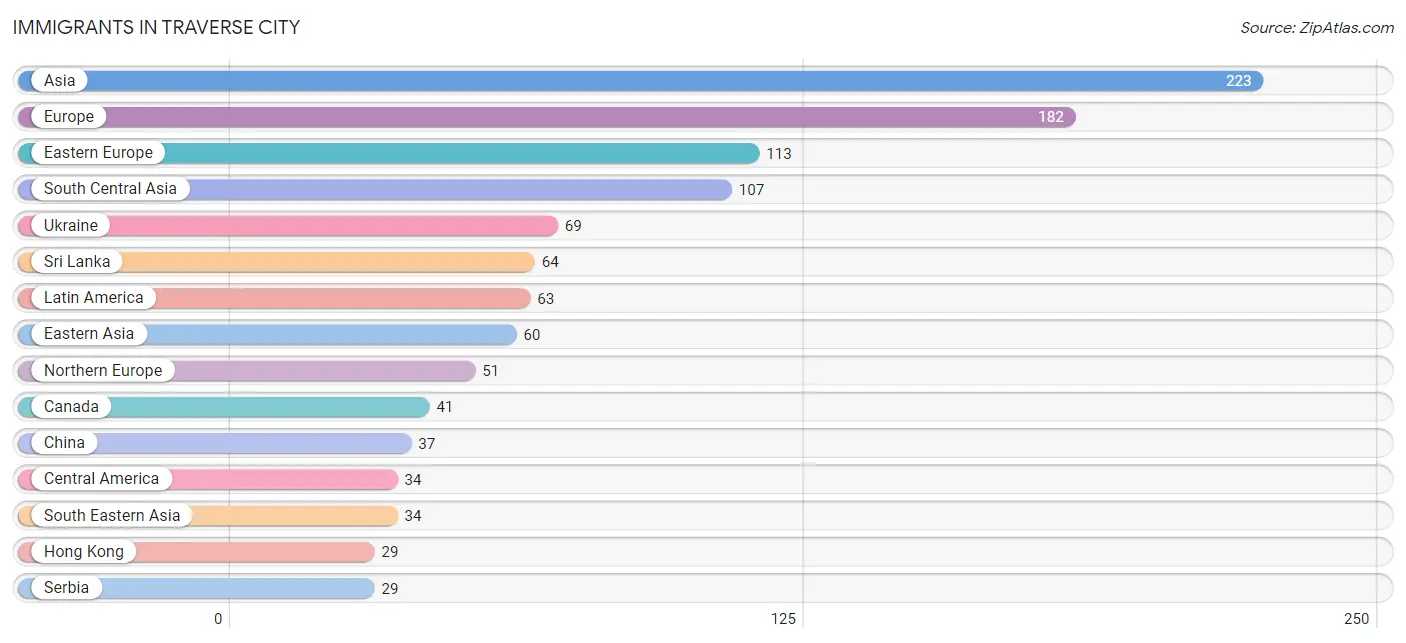
The most numerous immigrant groups reported in Traverse City came from Asia (223 | 1.4%), Europe (182 | 1.2%), Eastern Europe (113 | 0.7%), South Central Asia (107 | 0.7%), and Ukraine (69 | 0.4%), together accounting for 4.5% of all Traverse City residents.
| Immigration Origin | # Population | % Population |
| Africa | 8 | 0.1% |
| Asia | 223 | 1.4% |
| Bangladesh | 26 | 0.2% |
| Canada | 41 | 0.3% |
| Caribbean | 5 | 0.0% |
| Central America | 34 | 0.2% |
| China | 37 | 0.2% |
| Colombia | 24 | 0.2% |
| Costa Rica | 7 | 0.1% |
| Cuba | 5 | 0.0% |
| Eastern Asia | 60 | 0.4% |
| Eastern Europe | 113 | 0.7% |
| El Salvador | 20 | 0.1% |
| England | 12 | 0.1% |
| Europe | 182 | 1.2% |
| France | 12 | 0.1% |
| Germany | 6 | 0.0% |
| Hong Kong | 29 | 0.2% |
| India | 17 | 0.1% |
| Indonesia | 10 | 0.1% |
| Korea | 23 | 0.2% |
| Latin America | 63 | 0.4% |
| Lebanon | 9 | 0.1% |
| Mexico | 7 | 0.1% |
| Nigeria | 8 | 0.1% |
| Northern Europe | 51 | 0.3% |
| Philippines | 12 | 0.1% |
| Romania | 15 | 0.1% |
| Serbia | 29 | 0.2% |
| South America | 24 | 0.2% |
| South Central Asia | 107 | 0.7% |
| South Eastern Asia | 34 | 0.2% |
| Sri Lanka | 64 | 0.4% |
| Thailand | 12 | 0.1% |
| Turkey | 13 | 0.1% |
| Ukraine | 69 | 0.4% |
| Western Africa | 8 | 0.1% |
| Western Asia | 22 | 0.1% |
| Western Europe | 18 | 0.1% | View All 39 Rows |
Sex and Age in Traverse City
Sex and Age in Traverse City
The most populous age groups in Traverse City are 30 to 34 Years (740 | 9.9%) for men and 70 to 74 Years (748 | 9.4%) for women.

| Age Bracket | Male | Female |
| Under 5 Years | 253 (3.4%) | 389 (4.9%) |
| 5 to 9 Years | 278 (3.7%) | 440 (5.5%) |
| 10 to 14 Years | 385 (5.1%) | 450 (5.7%) |
| 15 to 19 Years | 461 (6.1%) | 354 (4.4%) |
| 20 to 24 Years | 446 (5.9%) | 545 (6.8%) |
| 25 to 29 Years | 626 (8.3%) | 471 (5.9%) |
| 30 to 34 Years | 740 (9.9%) | 542 (6.8%) |
| 35 to 39 Years | 572 (7.6%) | 475 (6.0%) |
| 40 to 44 Years | 446 (5.9%) | 414 (5.2%) |
| 45 to 49 Years | 427 (5.7%) | 456 (5.7%) |
| 50 to 54 Years | 442 (5.9%) | 306 (3.8%) |
| 55 to 59 Years | 485 (6.5%) | 443 (5.6%) |
| 60 to 64 Years | 444 (5.9%) | 560 (7.0%) |
| 65 to 69 Years | 623 (8.3%) | 534 (6.7%) |
| 70 to 74 Years | 396 (5.3%) | 748 (9.4%) |
| 75 to 79 Years | 239 (3.2%) | 275 (3.5%) |
| 80 to 84 Years | 95 (1.3%) | 143 (1.8%) |
| 85 Years and over | 147 (2.0%) | 418 (5.2%) |
| Total | 7,505 (100.0%) | 7,963 (100.0%) |
Families and Households in Traverse City
Median Family Size in Traverse City
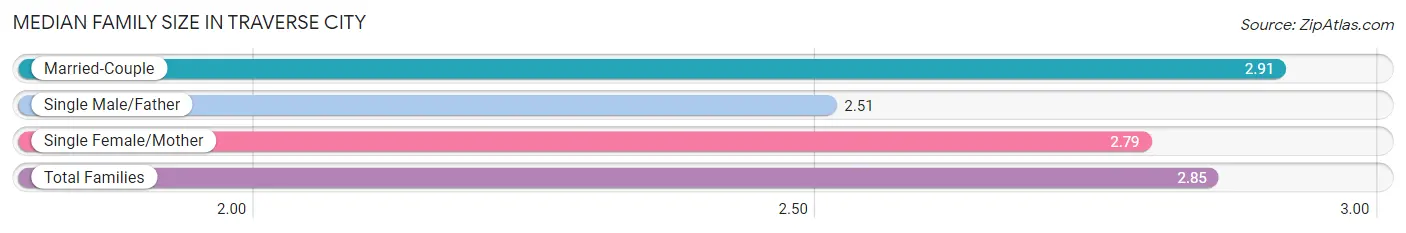
The median family size in Traverse City is 2.85 persons per family, with married-couple families (2,555 | 74.6%) accounting for the largest median family size of 2.91 persons per family. On the other hand, single male/father families (375 | 10.9%) represent the smallest median family size with 2.51 persons per family.
| Family Type | # Families | Family Size |
| Married-Couple | 2,555 (74.6%) | 2.91 |
| Single Male/Father | 375 (10.9%) | 2.51 |
| Single Female/Mother | 497 (14.5%) | 2.79 |
| Total Families | 3,427 (100.0%) | 2.85 |
Median Household Size in Traverse City
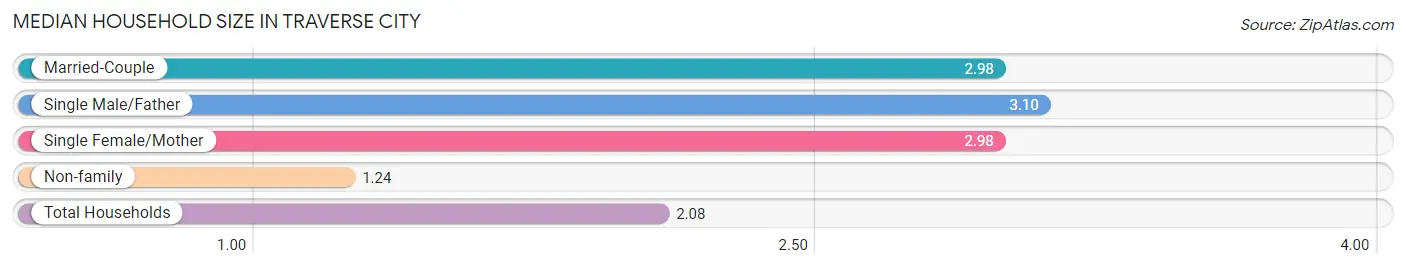
The median household size in Traverse City is 2.08 persons per household, with single male/father households (375 | 5.3%) accounting for the largest median household size of 3.1 persons per household. non-family households (3,677 | 51.8%) represent the smallest median household size with 1.24 persons per household.
| Household Type | # Households | Household Size |
| Married-Couple | 2,555 (36.0%) | 2.98 |
| Single Male/Father | 375 (5.3%) | 3.10 |
| Single Female/Mother | 497 (7.0%) | 2.98 |
| Non-family | 3,677 (51.8%) | 1.24 |
| Total Households | 7,104 (100.0%) | 2.08 |
Household Size by Marriage Status in Traverse City
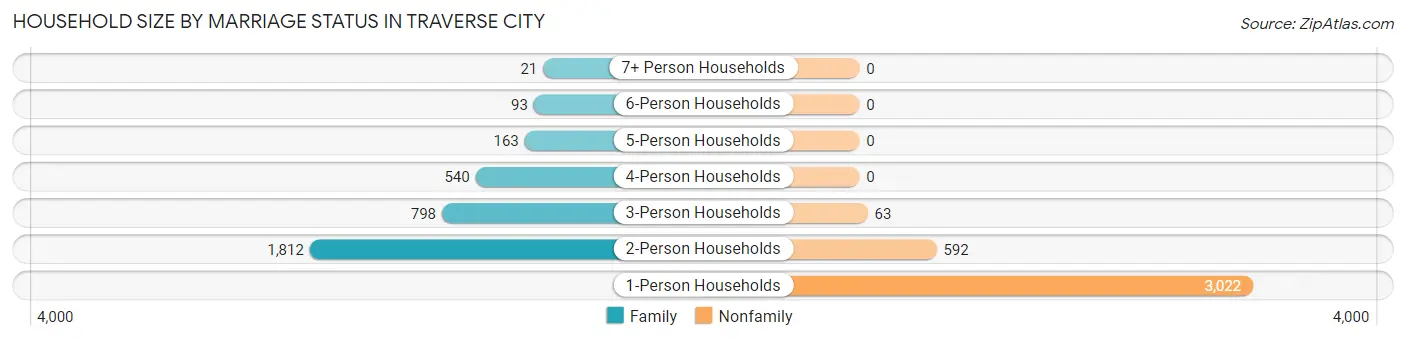
Out of a total of 7,104 households in Traverse City, 3,427 (48.2%) are family households, while 3,677 (51.8%) are nonfamily households. The most numerous type of family households are 2-person households, comprising 1,812, and the most common type of nonfamily households are 1-person households, comprising 3,022.
| Household Size | Family Households | Nonfamily Households |
| 1-Person Households | - | 3,022 (42.5%) |
| 2-Person Households | 1,812 (25.5%) | 592 (8.3%) |
| 3-Person Households | 798 (11.2%) | 63 (0.9%) |
| 4-Person Households | 540 (7.6%) | 0 (0.0%) |
| 5-Person Households | 163 (2.3%) | 0 (0.0%) |
| 6-Person Households | 93 (1.3%) | 0 (0.0%) |
| 7+ Person Households | 21 (0.3%) | 0 (0.0%) |
| Total | 3,427 (48.2%) | 3,677 (51.8%) |
Female Fertility in Traverse City
Fertility by Age in Traverse City
Average fertility rate in Traverse City is 20.0 births per 1,000 women. Women in the age bracket of 35 to 50 years have the highest fertility rate with 28.0 births per 1,000 women. Women in the age bracket of 35 to 50 years acount for 59.4% of all women with births.
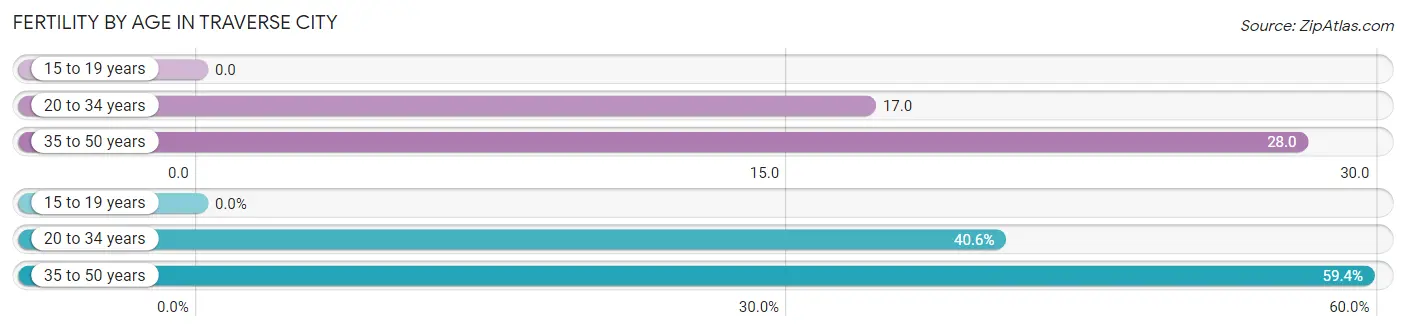
| Age Bracket | Women with Births | Births / 1,000 Women |
| 15 to 19 years | 0 (0.0%) | 0.0 |
| 20 to 34 years | 26 (40.6%) | 17.0 |
| 35 to 50 years | 38 (59.4%) | 28.0 |
| Total | 64 (100.0%) | 20.0 |
Fertility by Age by Marriage Status in Traverse City
59.4% of women with births (64) in Traverse City are married. The highest percentage of unmarried women with births falls into 35 to 50 years age bracket with 68.4% of them unmarried at the time of birth, while the lowest percentage of unmarried women with births belong to 20 to 34 years age bracket with 0.0% of them unmarried.
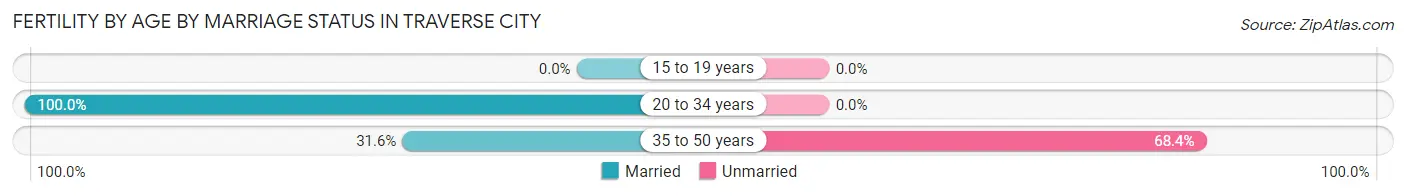
| Age Bracket | Married | Unmarried |
| 15 to 19 years | 0 (0.0%) | 0 (0.0%) |
| 20 to 34 years | 26 (100.0%) | 0 (0.0%) |
| 35 to 50 years | 12 (31.6%) | 26 (68.4%) |
| Total | 38 (59.4%) | 26 (40.6%) |
Fertility by Education in Traverse City
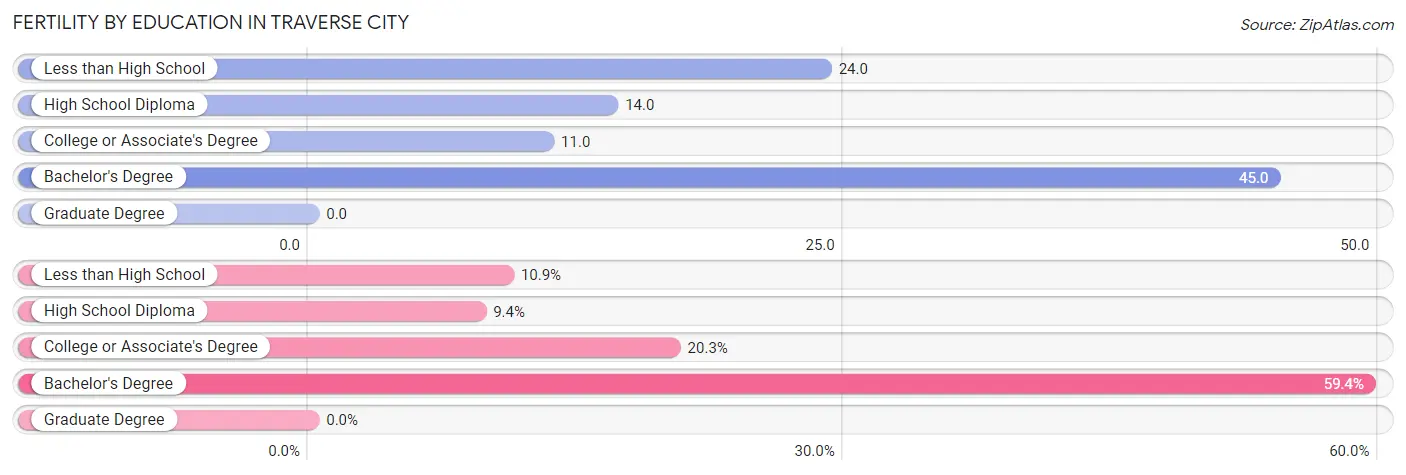
| Educational Attainment | Women with Births | Births / 1,000 Women |
| Less than High School | 7 (10.9%) | 24.0 |
| High School Diploma | 6 (9.4%) | 14.0 |
| College or Associate's Degree | 13 (20.3%) | 11.0 |
| Bachelor's Degree | 38 (59.4%) | 45.0 |
| Graduate Degree | 0 (0.0%) | 0.0 |
| Total | 64 (100.0%) | 20.0 |
Fertility by Education by Marriage Status in Traverse City
40.6% of women with births in Traverse City are unmarried. Women with the educational attainment of less than high school are most likely to be married with 100.0% of them married at childbirth, while women with the educational attainment of bachelor's degree are least likely to be married with 68.4% of them unmarried at childbirth.
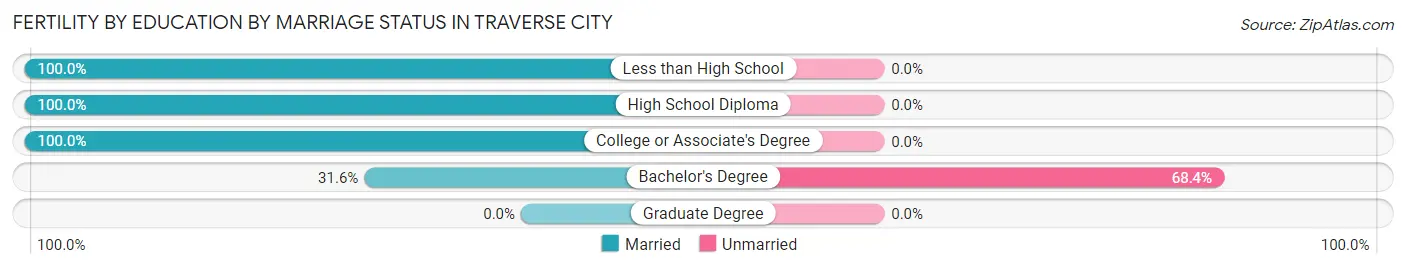
| Educational Attainment | Married | Unmarried |
| Less than High School | 7 (100.0%) | 0 (0.0%) |
| High School Diploma | 6 (100.0%) | 0 (0.0%) |
| College or Associate's Degree | 13 (100.0%) | 0 (0.0%) |
| Bachelor's Degree | 12 (31.6%) | 26 (68.4%) |
| Graduate Degree | 0 (0.0%) | 0 (0.0%) |
| Total | 38 (59.4%) | 26 (40.6%) |
Employment Characteristics in Traverse City
Employment by Class of Employer in Traverse City
Among the 7,701 employed individuals in Traverse City, private company employees (5,086 | 66.0%), not-for-profit organizations (827 | 10.7%), and local government employees (629 | 8.2%) make up the most common classes of employment.
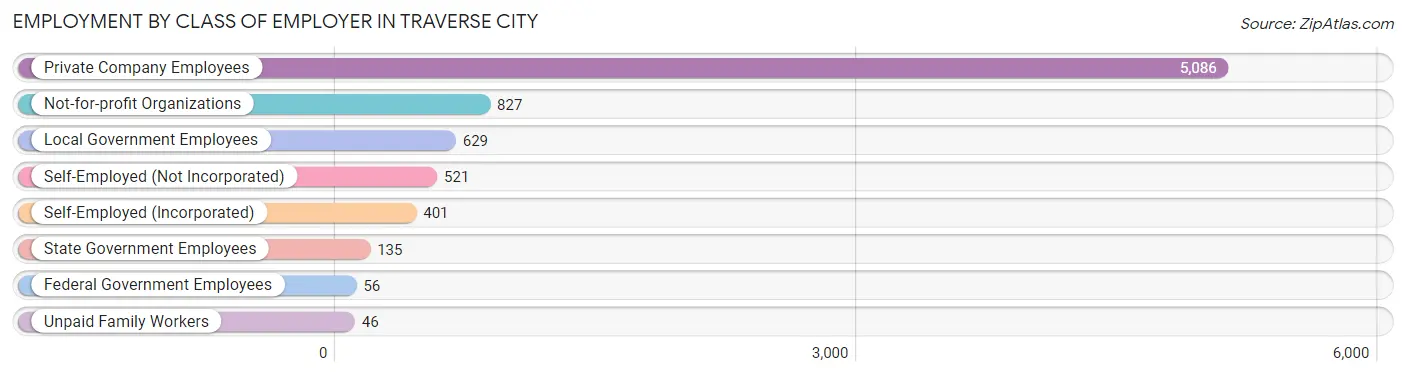
| Employer Class | # Employees | % Employees |
| Private Company Employees | 5,086 | 66.0% |
| Self-Employed (Incorporated) | 401 | 5.2% |
| Self-Employed (Not Incorporated) | 521 | 6.8% |
| Not-for-profit Organizations | 827 | 10.7% |
| Local Government Employees | 629 | 8.2% |
| State Government Employees | 135 | 1.8% |
| Federal Government Employees | 56 | 0.7% |
| Unpaid Family Workers | 46 | 0.6% |
| Total | 7,701 | 100.0% |
Employment Status by Age in Traverse City
According to the labor force statistics for Traverse City, out of the total population over 16 years of age (13,121), 63.4% or 8,319 individuals are in the labor force, with 5.3% or 441 of them unemployed. The age group with the highest labor force participation rate is 30 to 34 years, with 92.5% or 1,186 individuals in the labor force. Within the labor force, the 16 to 19 years age range has the highest percentage of unemployed individuals, with 26.1% or 95 of them being unemployed.
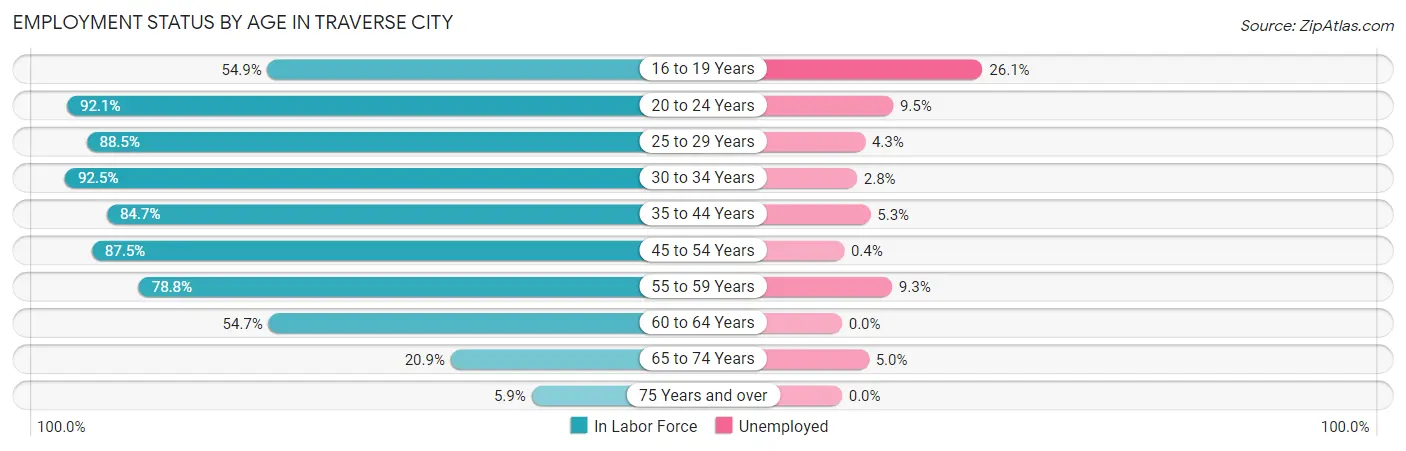
| Age Bracket | In Labor Force | Unemployed |
| 16 to 19 Years | 364 (54.9%) | 95 (26.1%) |
| 20 to 24 Years | 913 (92.1%) | 87 (9.5%) |
| 25 to 29 Years | 971 (88.5%) | 42 (4.3%) |
| 30 to 34 Years | 1,186 (92.5%) | 33 (2.8%) |
| 35 to 44 Years | 1,615 (84.7%) | 86 (5.3%) |
| 45 to 54 Years | 1,427 (87.5%) | 6 (0.4%) |
| 55 to 59 Years | 731 (78.8%) | 68 (9.3%) |
| 60 to 64 Years | 549 (54.7%) | 0 (0.0%) |
| 65 to 74 Years | 481 (20.9%) | 24 (5.0%) |
| 75 Years and over | 78 (5.9%) | 0 (0.0%) |
| Total | 8,319 (63.4%) | 441 (5.3%) |
Employment Status by Educational Attainment in Traverse City
According to labor force statistics for Traverse City, 82.5% of individuals (6,475) out of the total population between 25 and 64 years of age (7,849) are in the labor force, with 3.6% or 233 of them being unemployed. The group with the highest labor force participation rate are those with the educational attainment of bachelor's degree or higher, with 89.3% or 3,326 individuals in the labor force. Within the labor force, individuals with high school diploma education have the highest percentage of unemployment, with 10.1% or 85 of them being unemployed.
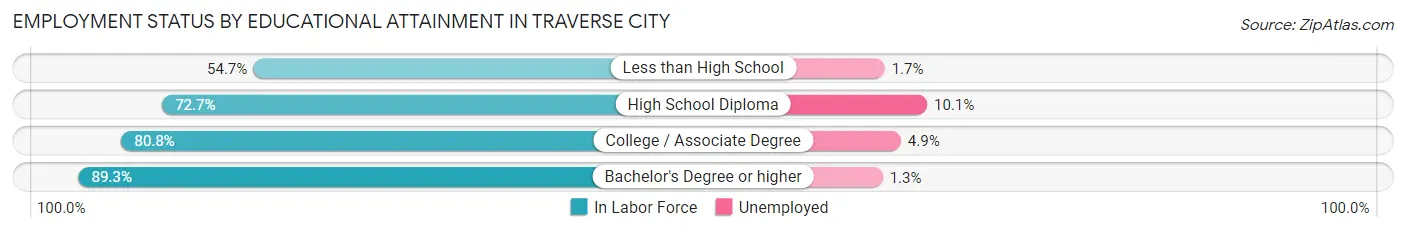
| Educational Attainment | In Labor Force | Unemployed |
| Less than High School | 180 (54.7%) | 6 (1.7%) |
| High School Diploma | 846 (72.7%) | 117 (10.1%) |
| College / Associate Degree | 2,127 (80.8%) | 129 (4.9%) |
| Bachelor's Degree or higher | 3,326 (89.3%) | 48 (1.3%) |
| Total | 6,475 (82.5%) | 283 (3.6%) |
Employment Occupations by Sex in Traverse City
Management, Business, Science and Arts Occupations
The most common Management, Business, Science and Arts occupations in Traverse City are Community & Social Service (1,200 | 15.3%), Management (670 | 8.5%), Education Instruction & Library (628 | 8.0%), Health Diagnosing & Treating (581 | 7.4%), and Health Technologists (458 | 5.8%).
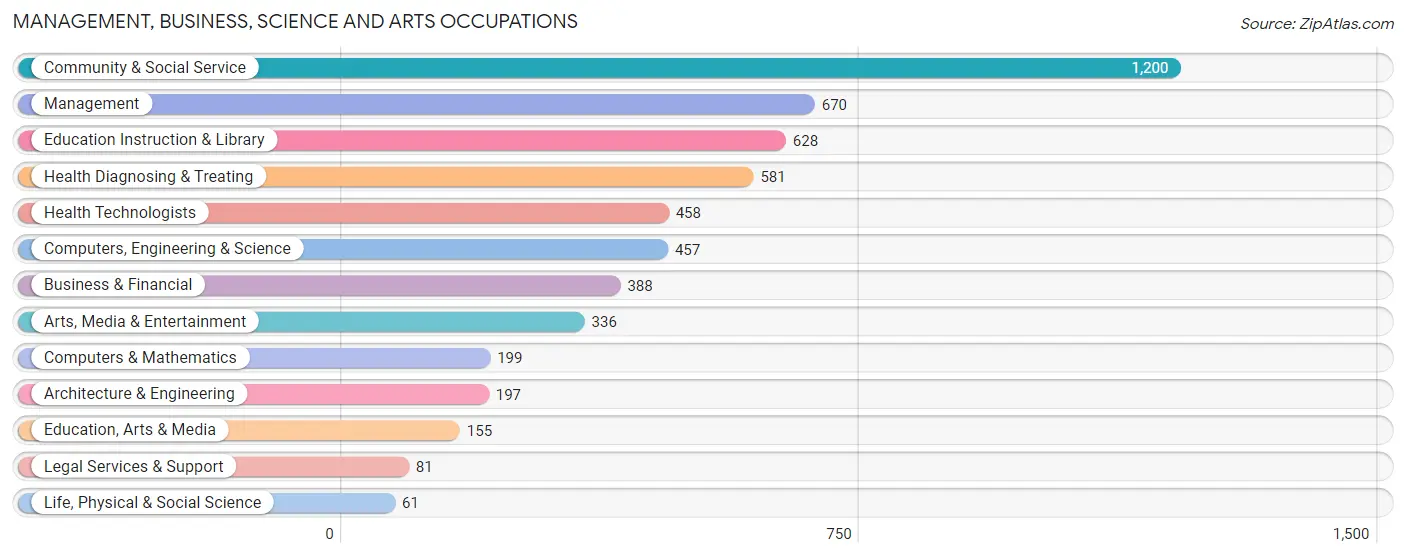
Management, Business, Science and Arts Occupations by Sex
Within the Management, Business, Science and Arts occupations in Traverse City, the most male-oriented occupations are Architecture & Engineering (96.5%), Computers, Engineering & Science (85.1%), and Life, Physical & Social Science (82.0%), while the most female-oriented occupations are Education, Arts & Media (84.5%), Health Diagnosing & Treating (78.3%), and Health Technologists (72.5%).
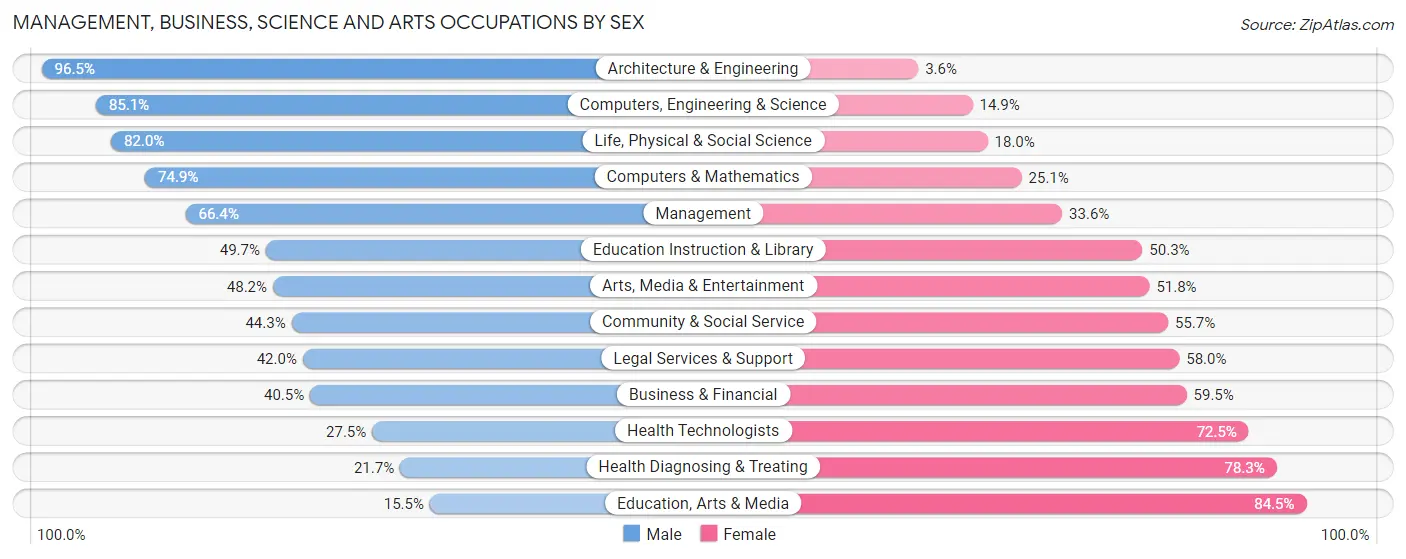
| Occupation | Male | Female |
| Management | 445 (66.4%) | 225 (33.6%) |
| Business & Financial | 157 (40.5%) | 231 (59.5%) |
| Computers, Engineering & Science | 389 (85.1%) | 68 (14.9%) |
| Computers & Mathematics | 149 (74.9%) | 50 (25.1%) |
| Architecture & Engineering | 190 (96.5%) | 7 (3.5%) |
| Life, Physical & Social Science | 50 (82.0%) | 11 (18.0%) |
| Community & Social Service | 532 (44.3%) | 668 (55.7%) |
| Education, Arts & Media | 24 (15.5%) | 131 (84.5%) |
| Legal Services & Support | 34 (42.0%) | 47 (58.0%) |
| Education Instruction & Library | 312 (49.7%) | 316 (50.3%) |
| Arts, Media & Entertainment | 162 (48.2%) | 174 (51.8%) |
| Health Diagnosing & Treating | 126 (21.7%) | 455 (78.3%) |
| Health Technologists | 126 (27.5%) | 332 (72.5%) |
| Total (Category) | 1,649 (50.0%) | 1,647 (50.0%) |
| Total (Overall) | 4,158 (52.9%) | 3,708 (47.1%) |
Services Occupations
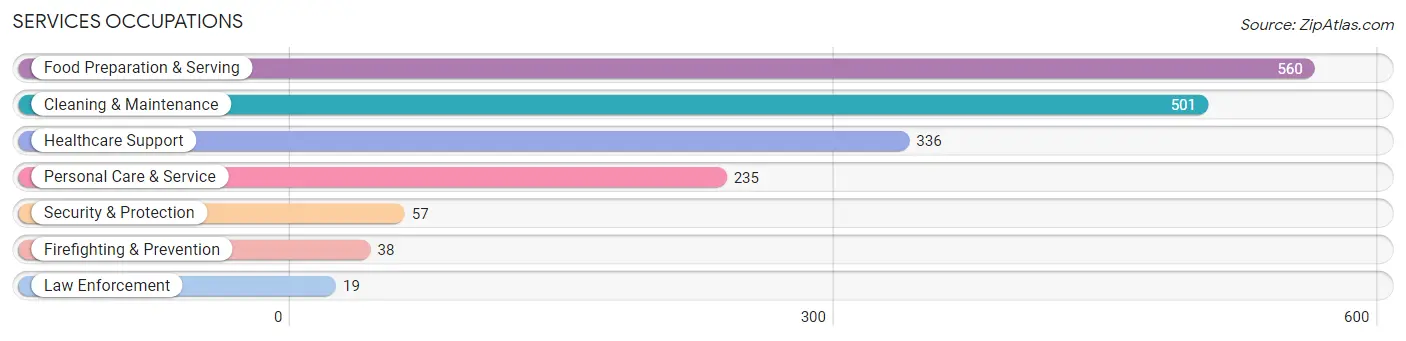
The most common Services occupations in Traverse City are Food Preparation & Serving (560 | 7.1%), Cleaning & Maintenance (501 | 6.4%), Healthcare Support (336 | 4.3%), Personal Care & Service (235 | 3.0%), and Security & Protection (57 | 0.7%).
Services Occupations by Sex
Within the Services occupations in Traverse City, the most male-oriented occupations are Security & Protection (100.0%), Firefighting & Prevention (100.0%), and Law Enforcement (100.0%), while the most female-oriented occupations are Healthcare Support (95.5%), Personal Care & Service (58.3%), and Food Preparation & Serving (52.3%).
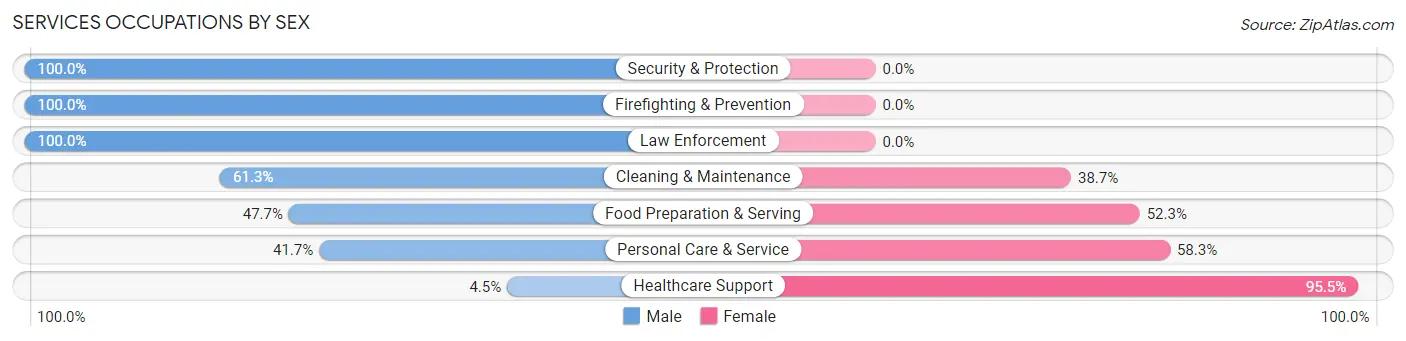
| Occupation | Male | Female |
| Healthcare Support | 15 (4.5%) | 321 (95.5%) |
| Security & Protection | 57 (100.0%) | 0 (0.0%) |
| Firefighting & Prevention | 38 (100.0%) | 0 (0.0%) |
| Law Enforcement | 19 (100.0%) | 0 (0.0%) |
| Food Preparation & Serving | 267 (47.7%) | 293 (52.3%) |
| Cleaning & Maintenance | 307 (61.3%) | 194 (38.7%) |
| Personal Care & Service | 98 (41.7%) | 137 (58.3%) |
| Total (Category) | 744 (44.1%) | 945 (55.9%) |
| Total (Overall) | 4,158 (52.9%) | 3,708 (47.1%) |
Sales and Office Occupations
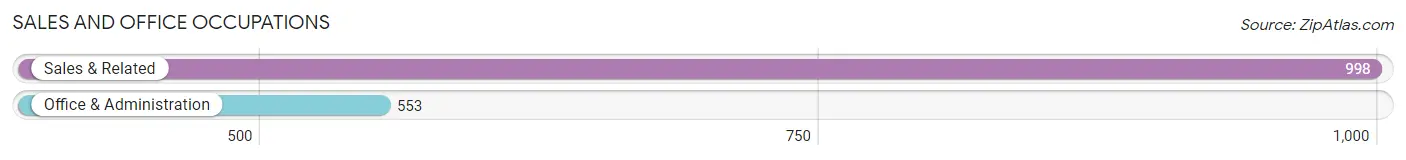
The most common Sales and Office occupations in Traverse City are Sales & Related (998 | 12.7%), and Office & Administration (553 | 7.0%).
Sales and Office Occupations by Sex
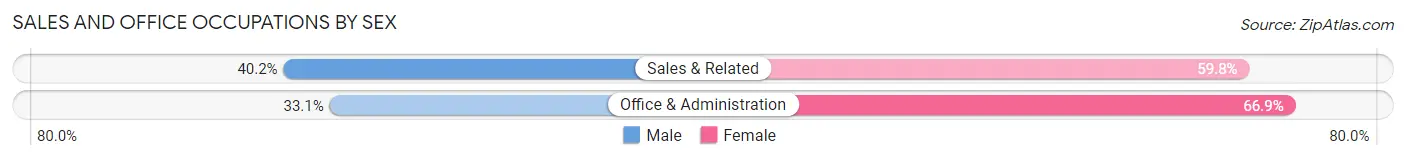
| Occupation | Male | Female |
| Sales & Related | 401 (40.2%) | 597 (59.8%) |
| Office & Administration | 183 (33.1%) | 370 (66.9%) |
| Total (Category) | 584 (37.7%) | 967 (62.4%) |
| Total (Overall) | 4,158 (52.9%) | 3,708 (47.1%) |
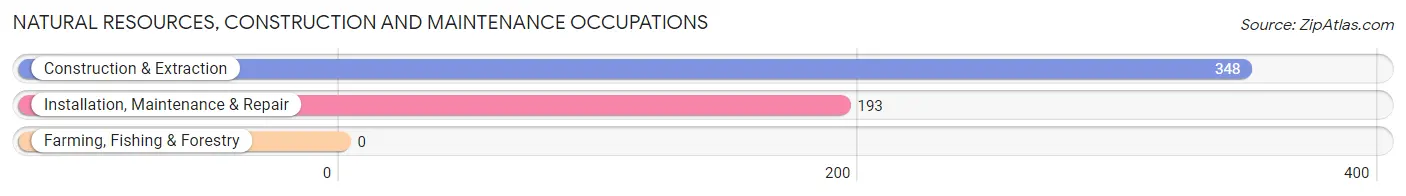
Natural Resources, Construction and Maintenance Occupations
The most common Natural Resources, Construction and Maintenance occupations in Traverse City are Construction & Extraction (348 | 4.4%), and Installation, Maintenance & Repair (193 | 2.5%).
Natural Resources, Construction and Maintenance Occupations by Sex
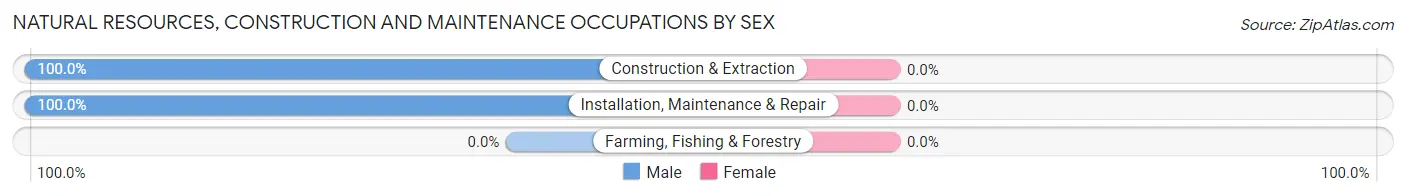
| Occupation | Male | Female |
| Farming, Fishing & Forestry | 0 (0.0%) | 0 (0.0%) |
| Construction & Extraction | 348 (100.0%) | 0 (0.0%) |
| Installation, Maintenance & Repair | 193 (100.0%) | 0 (0.0%) |
| Total (Category) | 541 (100.0%) | 0 (0.0%) |
| Total (Overall) | 4,158 (52.9%) | 3,708 (47.1%) |
Production, Transportation and Moving Occupations
The most common Production, Transportation and Moving occupations in Traverse City are Production (392 | 5.0%), Material Moving (283 | 3.6%), and Transportation (114 | 1.5%).
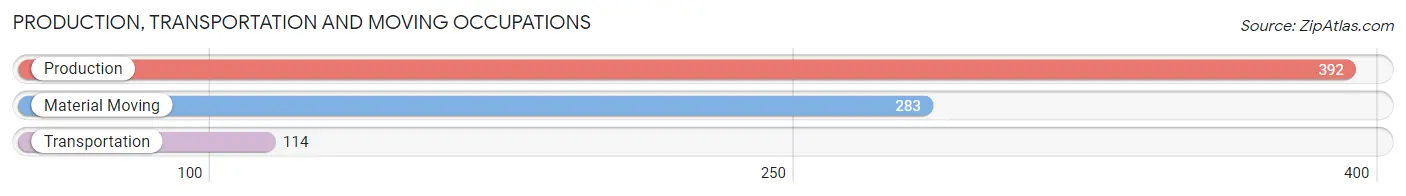
Production, Transportation and Moving Occupations by Sex
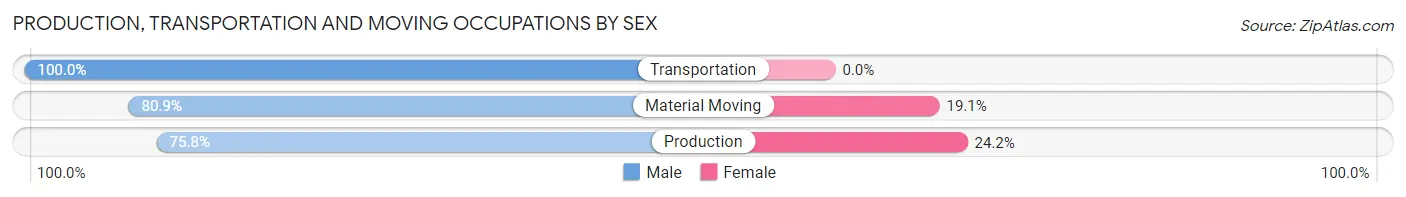
| Occupation | Male | Female |
| Production | 297 (75.8%) | 95 (24.2%) |
| Transportation | 114 (100.0%) | 0 (0.0%) |
| Material Moving | 229 (80.9%) | 54 (19.1%) |
| Total (Category) | 640 (81.1%) | 149 (18.9%) |
| Total (Overall) | 4,158 (52.9%) | 3,708 (47.1%) |
Employment Industries by Sex in Traverse City
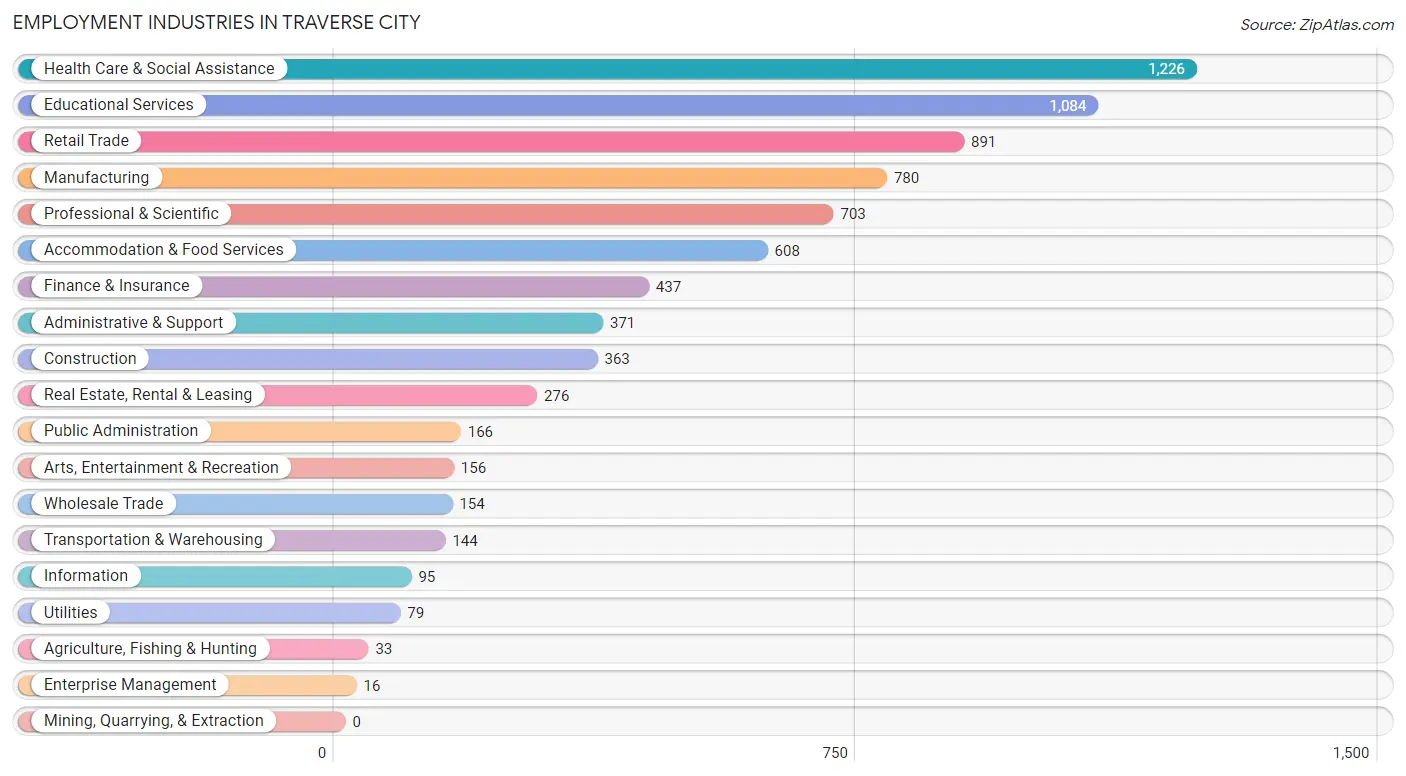
Employment Industries in Traverse City
The major employment industries in Traverse City include Health Care & Social Assistance (1,226 | 15.6%), Educational Services (1,084 | 13.8%), Retail Trade (891 | 11.3%), Manufacturing (780 | 9.9%), and Professional & Scientific (703 | 8.9%).
Employment Industries by Sex in Traverse City
The Traverse City industries that see more men than women are Agriculture, Fishing & Hunting (100.0%), Construction (100.0%), and Enterprise Management (100.0%), whereas the industries that tend to have a higher number of women are Health Care & Social Assistance (86.4%), Finance & Insurance (62.0%), and Retail Trade (57.8%).
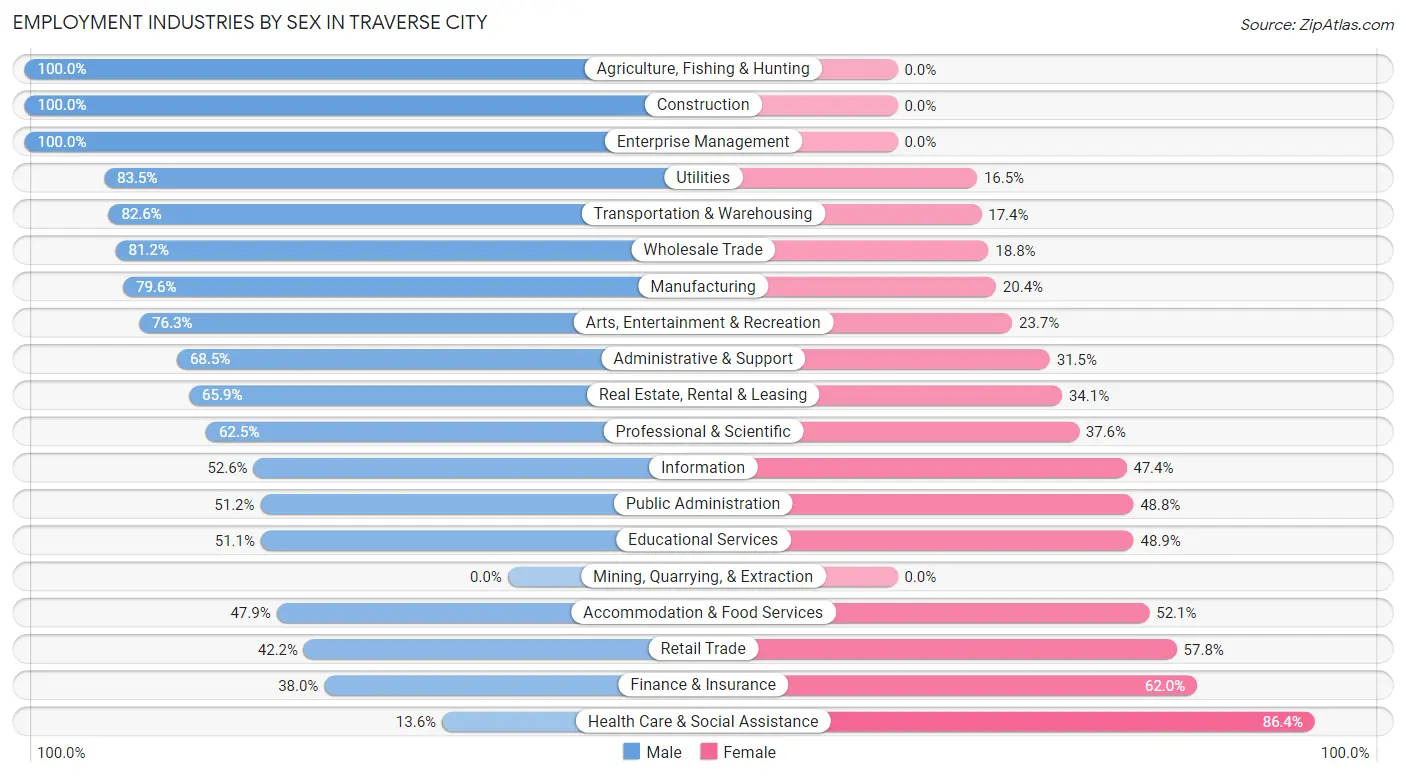
| Industry | Male | Female |
| Agriculture, Fishing & Hunting | 33 (100.0%) | 0 (0.0%) |
| Mining, Quarrying, & Extraction | 0 (0.0%) | 0 (0.0%) |
| Construction | 363 (100.0%) | 0 (0.0%) |
| Manufacturing | 621 (79.6%) | 159 (20.4%) |
| Wholesale Trade | 125 (81.2%) | 29 (18.8%) |
| Retail Trade | 376 (42.2%) | 515 (57.8%) |
| Transportation & Warehousing | 119 (82.6%) | 25 (17.4%) |
| Utilities | 66 (83.5%) | 13 (16.5%) |
| Information | 50 (52.6%) | 45 (47.4%) |
| Finance & Insurance | 166 (38.0%) | 271 (62.0%) |
| Real Estate, Rental & Leasing | 182 (65.9%) | 94 (34.1%) |
| Professional & Scientific | 439 (62.5%) | 264 (37.6%) |
| Enterprise Management | 16 (100.0%) | 0 (0.0%) |
| Administrative & Support | 254 (68.5%) | 117 (31.5%) |
| Educational Services | 554 (51.1%) | 530 (48.9%) |
| Health Care & Social Assistance | 167 (13.6%) | 1,059 (86.4%) |
| Arts, Entertainment & Recreation | 119 (76.3%) | 37 (23.7%) |
| Accommodation & Food Services | 291 (47.9%) | 317 (52.1%) |
| Public Administration | 85 (51.2%) | 81 (48.8%) |
| Total | 4,158 (52.9%) | 3,708 (47.1%) |
Education in Traverse City
School Enrollment in Traverse City
The most common levels of schooling among the 3,369 students in Traverse City are college / undergraduate (1,042 | 30.9%), middle school (665 | 19.7%), and high school (619 | 18.4%).
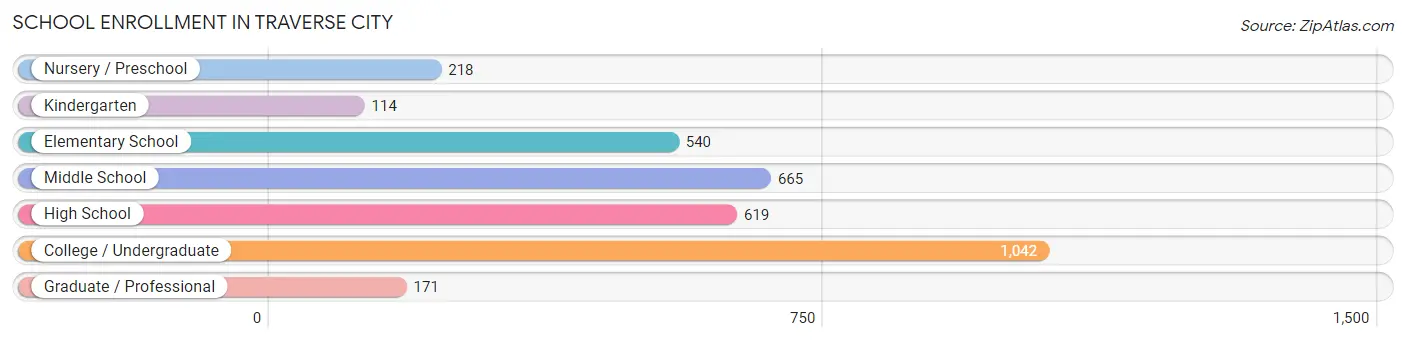
| School Level | # Students | % Students |
| Nursery / Preschool | 218 | 6.5% |
| Kindergarten | 114 | 3.4% |
| Elementary School | 540 | 16.0% |
| Middle School | 665 | 19.7% |
| High School | 619 | 18.4% |
| College / Undergraduate | 1,042 | 30.9% |
| Graduate / Professional | 171 | 5.1% |
| Total | 3,369 | 100.0% |
School Enrollment by Age by Funding Source in Traverse City
Out of a total of 3,369 students who are enrolled in schools in Traverse City, 499 (14.8%) attend a private institution, while the remaining 2,870 (85.2%) are enrolled in public schools. The age group of 3 to 4 year olds has the highest likelihood of being enrolled in private schools, with 41 (46.1% in the age bracket) enrolled. Conversely, the age group of 25 to 34 year olds has the lowest likelihood of being enrolled in a private school, with 323 (96.7% in the age bracket) attending a public institution.
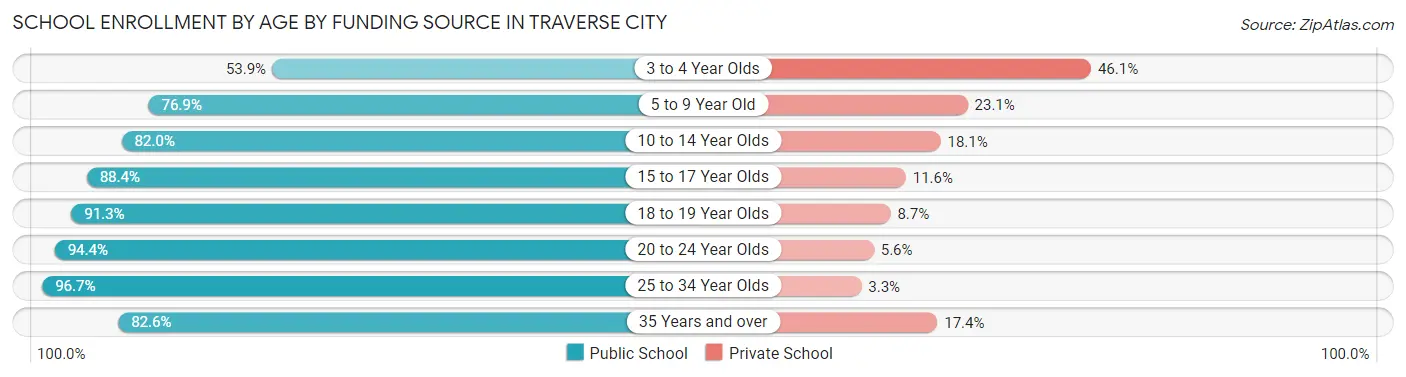
| Age Bracket | Public School | Private School |
| 3 to 4 Year Olds | 48 (53.9%) | 41 (46.1%) |
| 5 to 9 Year Old | 543 (76.9%) | 163 (23.1%) |
| 10 to 14 Year Olds | 663 (82.0%) | 146 (18.0%) |
| 15 to 17 Year Olds | 382 (88.4%) | 50 (11.6%) |
| 18 to 19 Year Olds | 283 (91.3%) | 27 (8.7%) |
| 20 to 24 Year Olds | 488 (94.4%) | 29 (5.6%) |
| 25 to 34 Year Olds | 323 (96.7%) | 11 (3.3%) |
| 35 Years and over | 142 (82.6%) | 30 (17.4%) |
| Total | 2,870 (85.2%) | 499 (14.8%) |
Educational Attainment by Field of Study in Traverse City
Education (978 | 16.4%), business (685 | 11.5%), social sciences (563 | 9.4%), science & technology (518 | 8.7%), and engineering (444 | 7.4%) are the most common fields of study among 5,981 individuals in Traverse City who have obtained a bachelor's degree or higher.
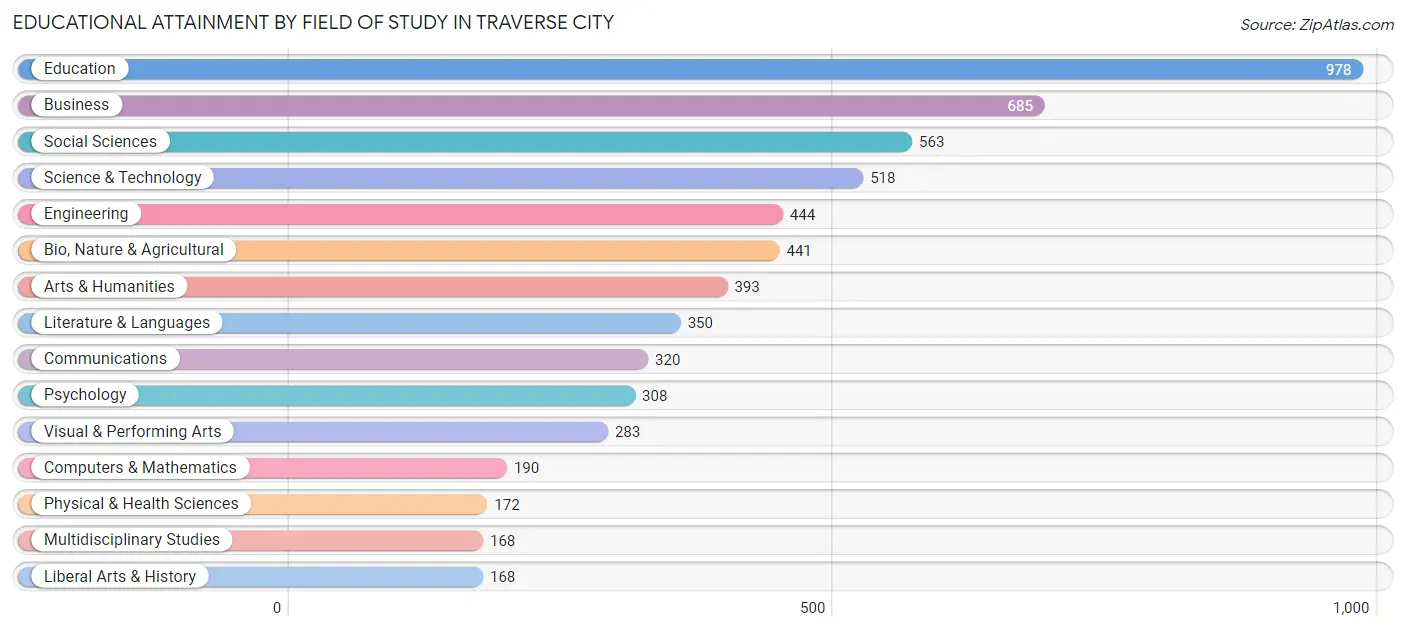
| Field of Study | # Graduates | % Graduates |
| Computers & Mathematics | 190 | 3.2% |
| Bio, Nature & Agricultural | 441 | 7.4% |
| Physical & Health Sciences | 172 | 2.9% |
| Psychology | 308 | 5.1% |
| Social Sciences | 563 | 9.4% |
| Engineering | 444 | 7.4% |
| Multidisciplinary Studies | 168 | 2.8% |
| Science & Technology | 518 | 8.7% |
| Business | 685 | 11.5% |
| Education | 978 | 16.4% |
| Literature & Languages | 350 | 5.9% |
| Liberal Arts & History | 168 | 2.8% |
| Visual & Performing Arts | 283 | 4.7% |
| Communications | 320 | 5.3% |
| Arts & Humanities | 393 | 6.6% |
| Total | 5,981 | 100.0% |
Transportation & Commute in Traverse City
Vehicle Availability by Sex in Traverse City
The most prevalent vehicle ownership categories in Traverse City are males with 2 vehicles (1,935, accounting for 48.9%) and females with 2 vehicles (1,591, making up 54.2%).
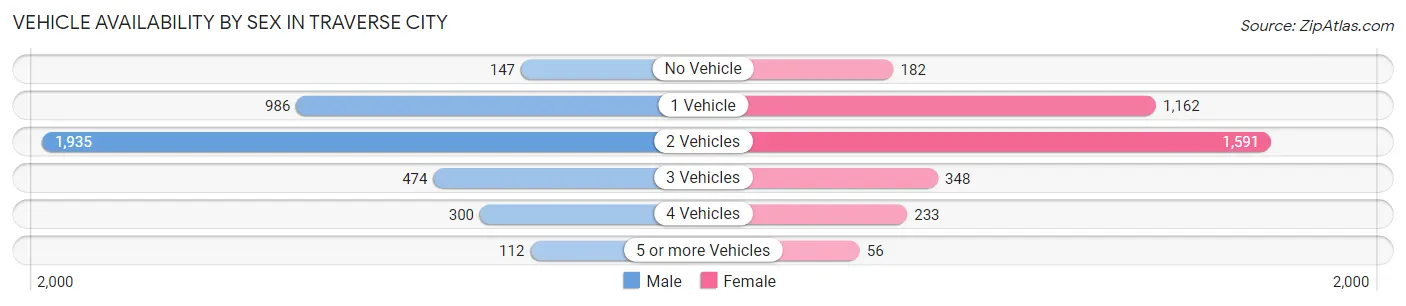
| Vehicles Available | Male | Female |
| No Vehicle | 147 (3.7%) | 182 (5.1%) |
| 1 Vehicle | 986 (24.9%) | 1,162 (32.5%) |
| 2 Vehicles | 1,935 (48.9%) | 1,591 (44.5%) |
| 3 Vehicles | 474 (12.0%) | 348 (9.7%) |
| 4 Vehicles | 300 (7.6%) | 233 (6.5%) |
| 5 or more Vehicles | 112 (2.8%) | 56 (1.6%) |
| Total | 3,954 (100.0%) | 3,572 (100.0%) |
Commute Time in Traverse City
The most frequently occuring commute durations in Traverse City are 10 to 14 minutes (1,574 commuters, 23.8%), 5 to 9 minutes (1,527 commuters, 23.1%), and 15 to 19 minutes (1,161 commuters, 17.6%).
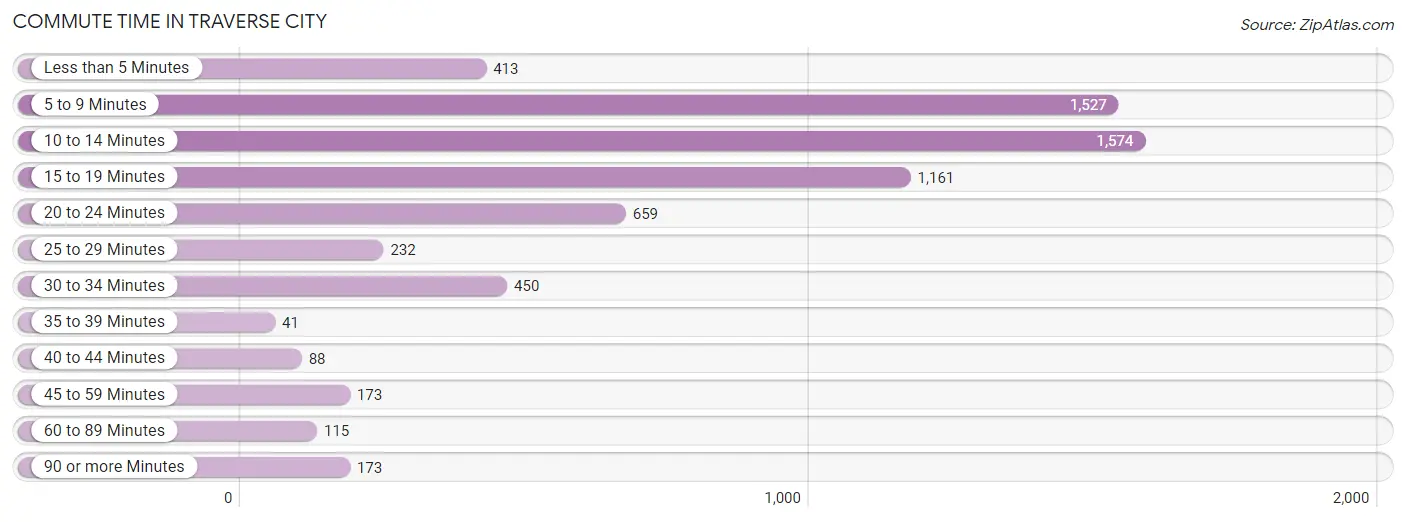
| Commute Time | # Commuters | % Commuters |
| Less than 5 Minutes | 413 | 6.2% |
| 5 to 9 Minutes | 1,527 | 23.1% |
| 10 to 14 Minutes | 1,574 | 23.8% |
| 15 to 19 Minutes | 1,161 | 17.6% |
| 20 to 24 Minutes | 659 | 10.0% |
| 25 to 29 Minutes | 232 | 3.5% |
| 30 to 34 Minutes | 450 | 6.8% |
| 35 to 39 Minutes | 41 | 0.6% |
| 40 to 44 Minutes | 88 | 1.3% |
| 45 to 59 Minutes | 173 | 2.6% |
| 60 to 89 Minutes | 115 | 1.7% |
| 90 or more Minutes | 173 | 2.6% |
Commute Time by Sex in Traverse City
The most common commute times in Traverse City are 10 to 14 minutes (787 commuters, 22.4%) for males and 5 to 9 minutes (814 commuters, 26.3%) for females.
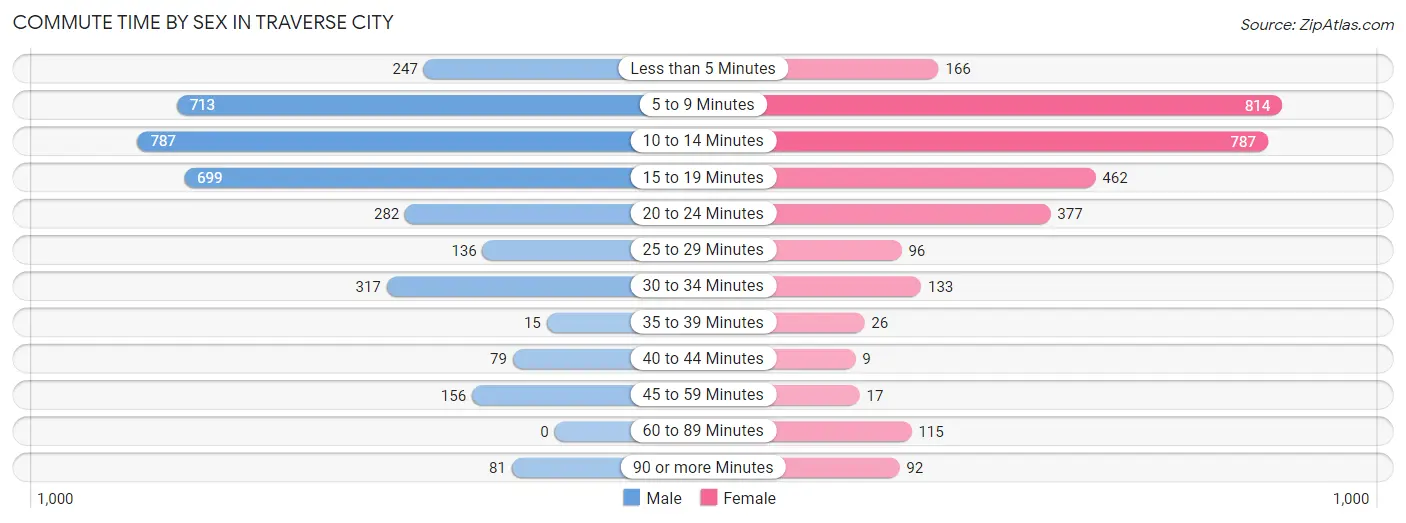
| Commute Time | Male | Female |
| Less than 5 Minutes | 247 (7.0%) | 166 (5.4%) |
| 5 to 9 Minutes | 713 (20.3%) | 814 (26.3%) |
| 10 to 14 Minutes | 787 (22.4%) | 787 (25.4%) |
| 15 to 19 Minutes | 699 (19.9%) | 462 (14.9%) |
| 20 to 24 Minutes | 282 (8.0%) | 377 (12.2%) |
| 25 to 29 Minutes | 136 (3.9%) | 96 (3.1%) |
| 30 to 34 Minutes | 317 (9.0%) | 133 (4.3%) |
| 35 to 39 Minutes | 15 (0.4%) | 26 (0.8%) |
| 40 to 44 Minutes | 79 (2.2%) | 9 (0.3%) |
| 45 to 59 Minutes | 156 (4.4%) | 17 (0.5%) |
| 60 to 89 Minutes | 0 (0.0%) | 115 (3.7%) |
| 90 or more Minutes | 81 (2.3%) | 92 (3.0%) |
Time of Departure to Work by Sex in Traverse City
The most frequent times of departure to work in Traverse City are 7:00 AM to 7:29 AM (634, 18.0%) for males and 8:00 AM to 8:29 AM (514, 16.6%) for females.
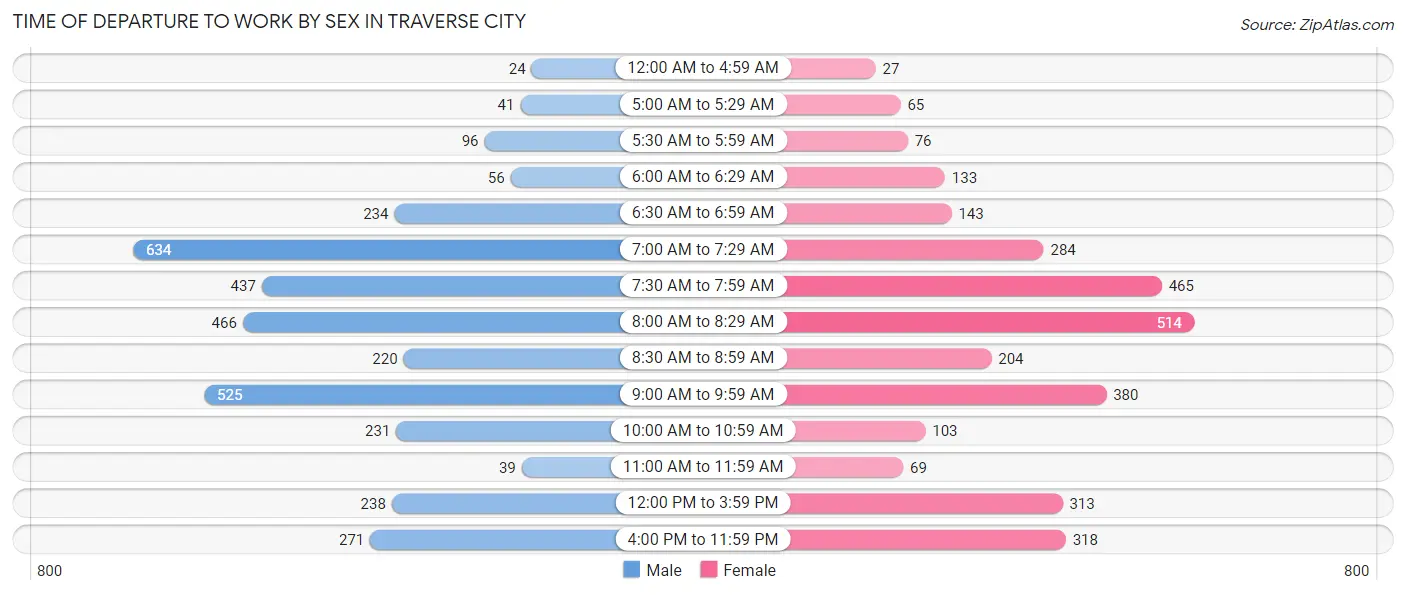
| Time of Departure | Male | Female |
| 12:00 AM to 4:59 AM | 24 (0.7%) | 27 (0.9%) |
| 5:00 AM to 5:29 AM | 41 (1.2%) | 65 (2.1%) |
| 5:30 AM to 5:59 AM | 96 (2.7%) | 76 (2.5%) |
| 6:00 AM to 6:29 AM | 56 (1.6%) | 133 (4.3%) |
| 6:30 AM to 6:59 AM | 234 (6.7%) | 143 (4.6%) |
| 7:00 AM to 7:29 AM | 634 (18.0%) | 284 (9.2%) |
| 7:30 AM to 7:59 AM | 437 (12.4%) | 465 (15.0%) |
| 8:00 AM to 8:29 AM | 466 (13.3%) | 514 (16.6%) |
| 8:30 AM to 8:59 AM | 220 (6.3%) | 204 (6.6%) |
| 9:00 AM to 9:59 AM | 525 (14.9%) | 380 (12.3%) |
| 10:00 AM to 10:59 AM | 231 (6.6%) | 103 (3.3%) |
| 11:00 AM to 11:59 AM | 39 (1.1%) | 69 (2.2%) |
| 12:00 PM to 3:59 PM | 238 (6.8%) | 313 (10.1%) |
| 4:00 PM to 11:59 PM | 271 (7.7%) | 318 (10.3%) |
| Total | 3,512 (100.0%) | 3,094 (100.0%) |
Housing Occupancy in Traverse City
Occupancy by Ownership in Traverse City
Of the total 7,104 dwellings in Traverse City, owner-occupied units account for 4,377 (61.6%), while renter-occupied units make up 2,727 (38.4%).
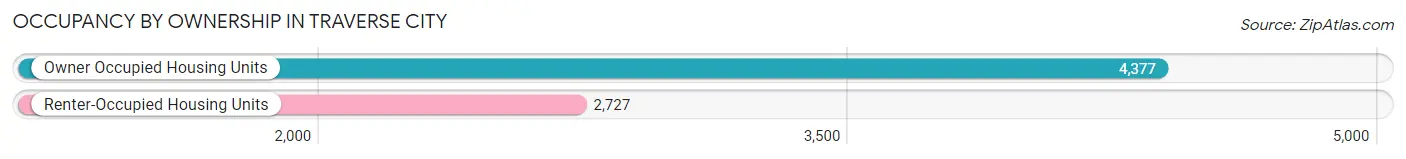
| Occupancy | # Housing Units | % Housing Units |
| Owner Occupied Housing Units | 4,377 | 61.6% |
| Renter-Occupied Housing Units | 2,727 | 38.4% |
| Total Occupied Housing Units | 7,104 | 100.0% |
Occupancy by Household Size in Traverse City
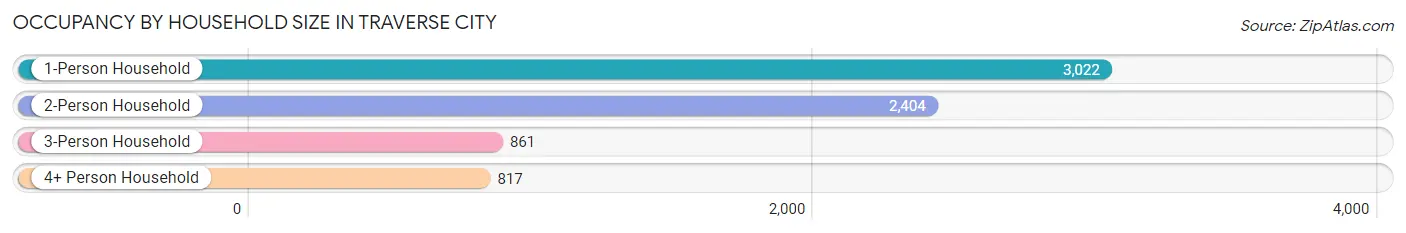
| Household Size | # Housing Units | % Housing Units |
| 1-Person Household | 3,022 | 42.5% |
| 2-Person Household | 2,404 | 33.8% |
| 3-Person Household | 861 | 12.1% |
| 4+ Person Household | 817 | 11.5% |
| Total Housing Units | 7,104 | 100.0% |
Occupancy by Ownership by Household Size in Traverse City

| Household Size | Owner-occupied | Renter-occupied |
| 1-Person Household | 1,538 (50.9%) | 1,484 (49.1%) |
| 2-Person Household | 1,683 (70.0%) | 721 (30.0%) |
| 3-Person Household | 548 (63.6%) | 313 (36.3%) |
| 4+ Person Household | 608 (74.4%) | 209 (25.6%) |
| Total Housing Units | 4,377 (61.6%) | 2,727 (38.4%) |
Occupancy by Educational Attainment in Traverse City
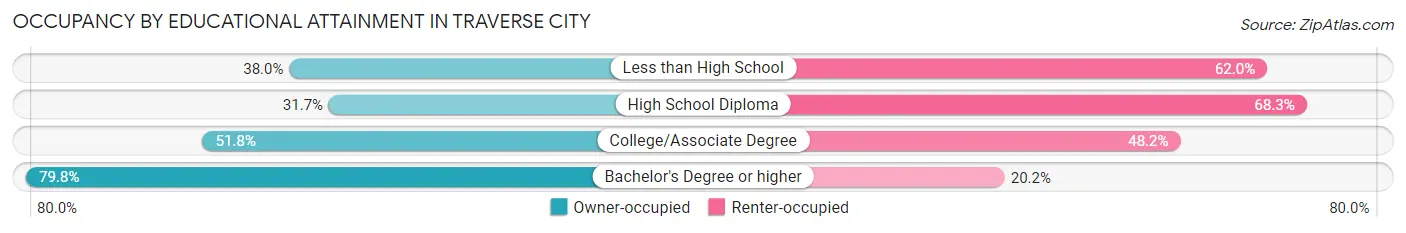
| Household Size | Owner-occupied | Renter-occupied |
| Less than High School | 92 (38.0%) | 150 (62.0%) |
| High School Diploma | 336 (31.7%) | 723 (68.3%) |
| College/Associate Degree | 1,257 (51.8%) | 1,171 (48.2%) |
| Bachelor's Degree or higher | 2,692 (79.8%) | 683 (20.2%) |
Occupancy by Age of Householder in Traverse City
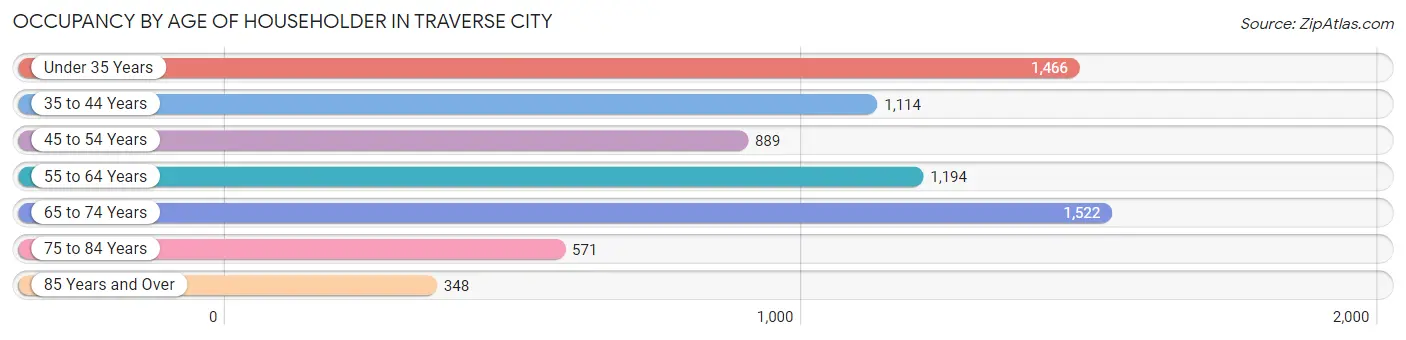
| Age Bracket | # Households | % Households |
| Under 35 Years | 1,466 | 20.6% |
| 35 to 44 Years | 1,114 | 15.7% |
| 45 to 54 Years | 889 | 12.5% |
| 55 to 64 Years | 1,194 | 16.8% |
| 65 to 74 Years | 1,522 | 21.4% |
| 75 to 84 Years | 571 | 8.0% |
| 85 Years and Over | 348 | 4.9% |
| Total | 7,104 | 100.0% |
Housing Finances in Traverse City
Median Income by Occupancy in Traverse City
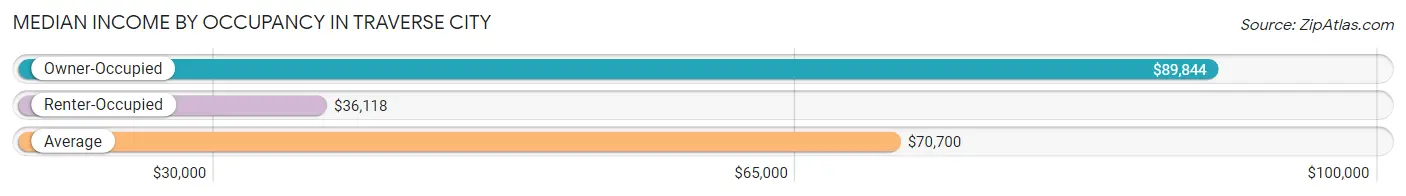
| Occupancy Type | # Households | Median Income |
| Owner-Occupied | 4,377 (61.6%) | $89,844 |
| Renter-Occupied | 2,727 (38.4%) | $36,118 |
| Average | 7,104 (100.0%) | $70,700 |
Occupancy by Householder Income Bracket in Traverse City
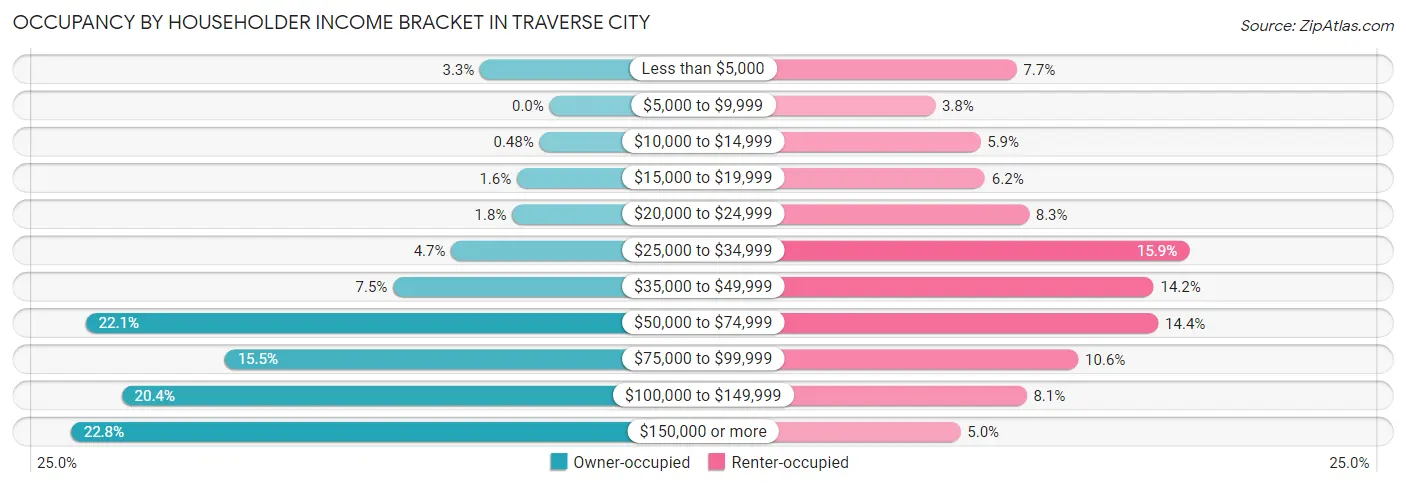
| Income Bracket | Owner-occupied | Renter-occupied |
| Less than $5,000 | 145 (3.3%) | 209 (7.7%) |
| $5,000 to $9,999 | 0 (0.0%) | 103 (3.8%) |
| $10,000 to $14,999 | 21 (0.5%) | 162 (5.9%) |
| $15,000 to $19,999 | 68 (1.5%) | 168 (6.2%) |
| $20,000 to $24,999 | 78 (1.8%) | 225 (8.3%) |
| $25,000 to $34,999 | 205 (4.7%) | 433 (15.9%) |
| $35,000 to $49,999 | 326 (7.4%) | 387 (14.2%) |
| $50,000 to $74,999 | 967 (22.1%) | 393 (14.4%) |
| $75,000 to $99,999 | 677 (15.5%) | 289 (10.6%) |
| $100,000 to $149,999 | 892 (20.4%) | 222 (8.1%) |
| $150,000 or more | 998 (22.8%) | 136 (5.0%) |
| Total | 4,377 (100.0%) | 2,727 (100.0%) |
Monthly Housing Cost Tiers in Traverse City
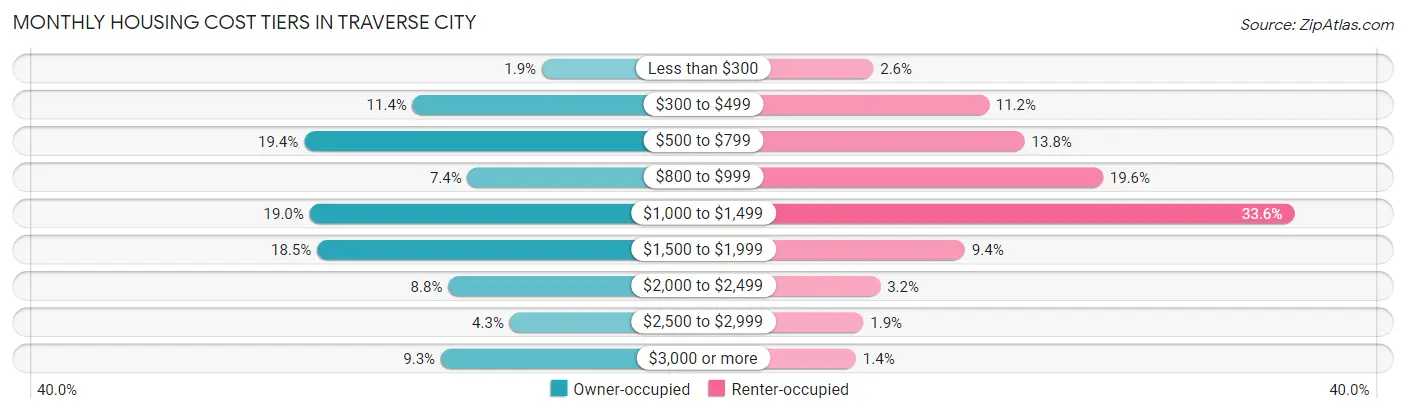
| Monthly Cost | Owner-occupied | Renter-occupied |
| Less than $300 | 83 (1.9%) | 72 (2.6%) |
| $300 to $499 | 500 (11.4%) | 304 (11.2%) |
| $500 to $799 | 850 (19.4%) | 376 (13.8%) |
| $800 to $999 | 323 (7.4%) | 533 (19.6%) |
| $1,000 to $1,499 | 832 (19.0%) | 917 (33.6%) |
| $1,500 to $1,999 | 808 (18.5%) | 256 (9.4%) |
| $2,000 to $2,499 | 385 (8.8%) | 86 (3.2%) |
| $2,500 to $2,999 | 187 (4.3%) | 52 (1.9%) |
| $3,000 or more | 409 (9.3%) | 37 (1.4%) |
| Total | 4,377 (100.0%) | 2,727 (100.0%) |
Physical Housing Characteristics in Traverse City
Housing Structures in Traverse City
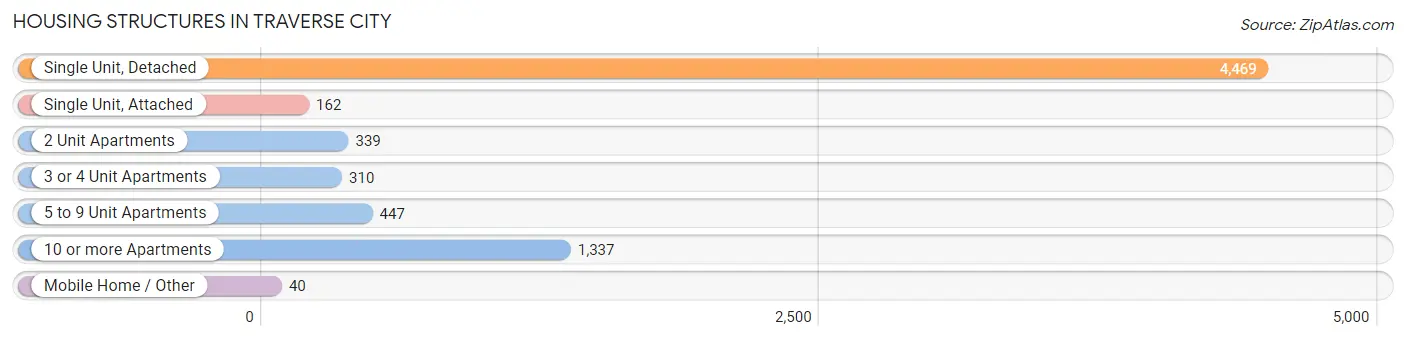
| Structure Type | # Housing Units | % Housing Units |
| Single Unit, Detached | 4,469 | 62.9% |
| Single Unit, Attached | 162 | 2.3% |
| 2 Unit Apartments | 339 | 4.8% |
| 3 or 4 Unit Apartments | 310 | 4.4% |
| 5 to 9 Unit Apartments | 447 | 6.3% |
| 10 or more Apartments | 1,337 | 18.8% |
| Mobile Home / Other | 40 | 0.6% |
| Total | 7,104 | 100.0% |
Housing Structures by Occupancy in Traverse City
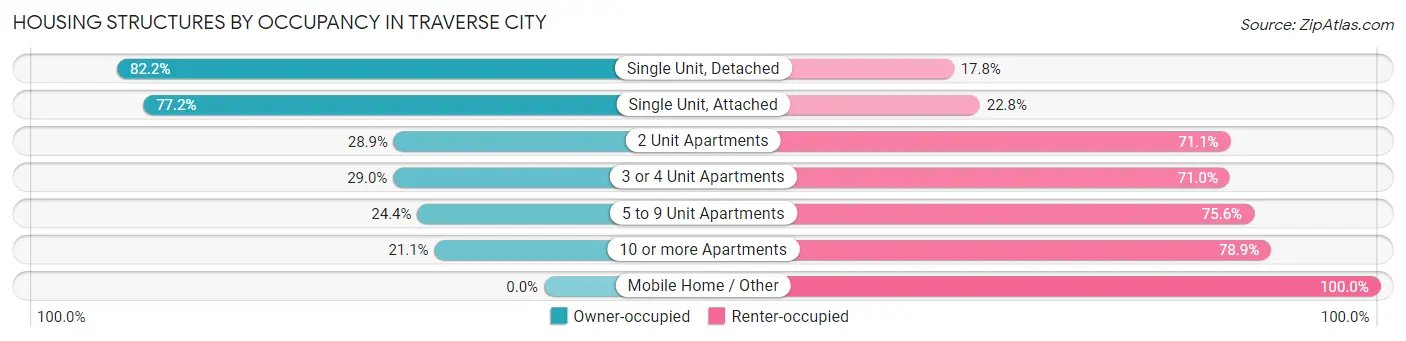
| Structure Type | Owner-occupied | Renter-occupied |
| Single Unit, Detached | 3,673 (82.2%) | 796 (17.8%) |
| Single Unit, Attached | 125 (77.2%) | 37 (22.8%) |
| 2 Unit Apartments | 98 (28.9%) | 241 (71.1%) |
| 3 or 4 Unit Apartments | 90 (29.0%) | 220 (71.0%) |
| 5 to 9 Unit Apartments | 109 (24.4%) | 338 (75.6%) |
| 10 or more Apartments | 282 (21.1%) | 1,055 (78.9%) |
| Mobile Home / Other | 0 (0.0%) | 40 (100.0%) |
| Total | 4,377 (61.6%) | 2,727 (38.4%) |
Housing Structures by Number of Rooms in Traverse City
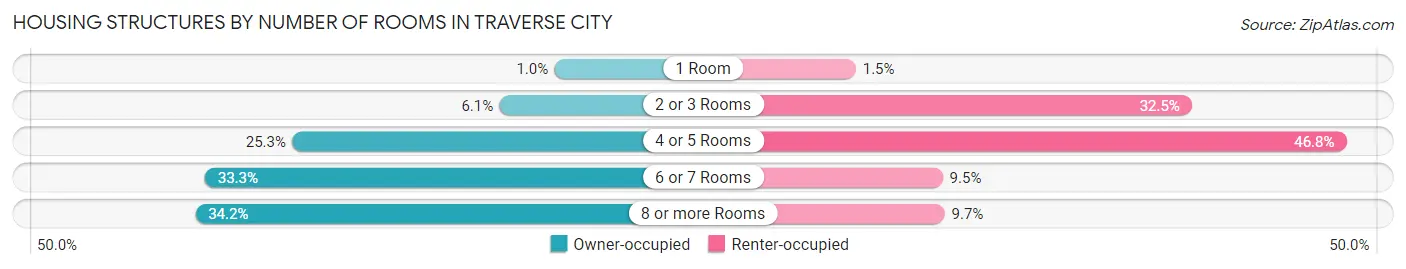
| Number of Rooms | Owner-occupied | Renter-occupied |
| 1 Room | 45 (1.0%) | 40 (1.5%) |
| 2 or 3 Rooms | 268 (6.1%) | 887 (32.5%) |
| 4 or 5 Rooms | 1,107 (25.3%) | 1,277 (46.8%) |
| 6 or 7 Rooms | 1,459 (33.3%) | 259 (9.5%) |
| 8 or more Rooms | 1,498 (34.2%) | 264 (9.7%) |
| Total | 4,377 (100.0%) | 2,727 (100.0%) |
Housing Structure by Heating Type in Traverse City
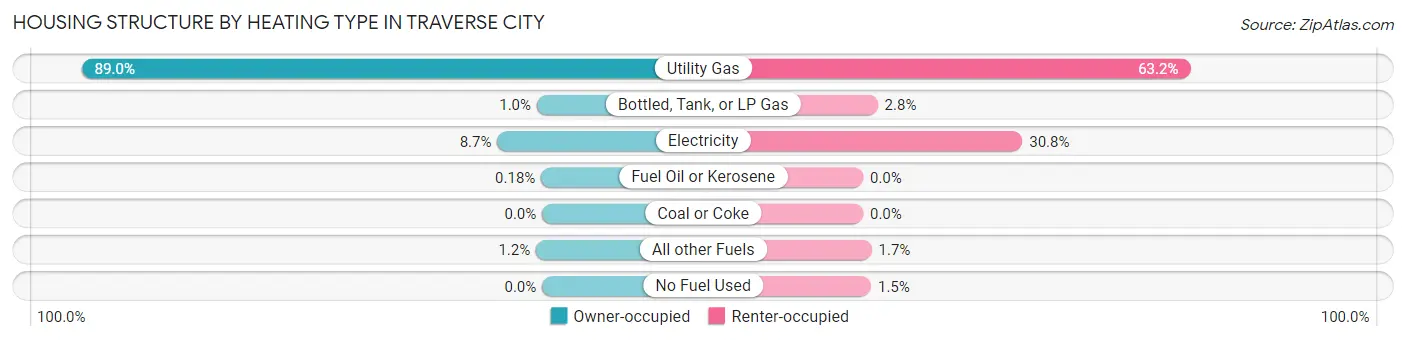
| Heating Type | Owner-occupied | Renter-occupied |
| Utility Gas | 3,895 (89.0%) | 1,724 (63.2%) |
| Bottled, Tank, or LP Gas | 44 (1.0%) | 77 (2.8%) |
| Electricity | 379 (8.7%) | 839 (30.8%) |
| Fuel Oil or Kerosene | 8 (0.2%) | 0 (0.0%) |
| Coal or Coke | 0 (0.0%) | 0 (0.0%) |
| All other Fuels | 51 (1.2%) | 45 (1.7%) |
| No Fuel Used | 0 (0.0%) | 42 (1.5%) |
| Total | 4,377 (100.0%) | 2,727 (100.0%) |
Household Vehicle Usage in Traverse City
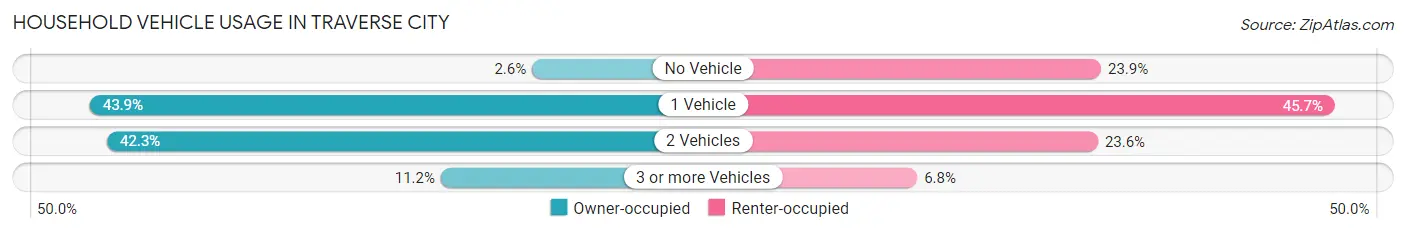
| Vehicles per Household | Owner-occupied | Renter-occupied |
| No Vehicle | 115 (2.6%) | 652 (23.9%) |
| 1 Vehicle | 1,922 (43.9%) | 1,247 (45.7%) |
| 2 Vehicles | 1,852 (42.3%) | 644 (23.6%) |
| 3 or more Vehicles | 488 (11.2%) | 184 (6.8%) |
| Total | 4,377 (100.0%) | 2,727 (100.0%) |
Real Estate & Mortgages in Traverse City
Real Estate and Mortgage Overview in Traverse City
| Characteristic | Without Mortgage | With Mortgage |
| Housing Units | 1,761 | 2,616 |
| Median Property Value | $330,100 | $340,600 |
| Median Household Income | $72,892 | $692 |
| Monthly Housing Costs | $596 | $391 |
| Real Estate Taxes | $3,979 | $0 |
Property Value by Mortgage Status in Traverse City
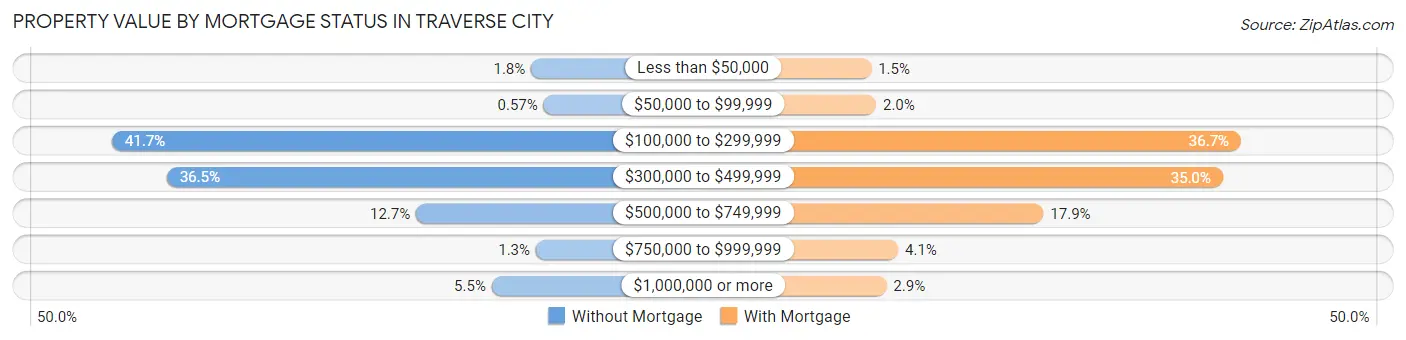
| Property Value | Without Mortgage | With Mortgage |
| Less than $50,000 | 31 (1.8%) | 39 (1.5%) |
| $50,000 to $99,999 | 10 (0.6%) | 51 (1.9%) |
| $100,000 to $299,999 | 734 (41.7%) | 960 (36.7%) |
| $300,000 to $499,999 | 642 (36.5%) | 915 (35.0%) |
| $500,000 to $749,999 | 224 (12.7%) | 468 (17.9%) |
| $750,000 to $999,999 | 23 (1.3%) | 106 (4.1%) |
| $1,000,000 or more | 97 (5.5%) | 77 (2.9%) |
| Total | 1,761 (100.0%) | 2,616 (100.0%) |
Household Income by Mortgage Status in Traverse City
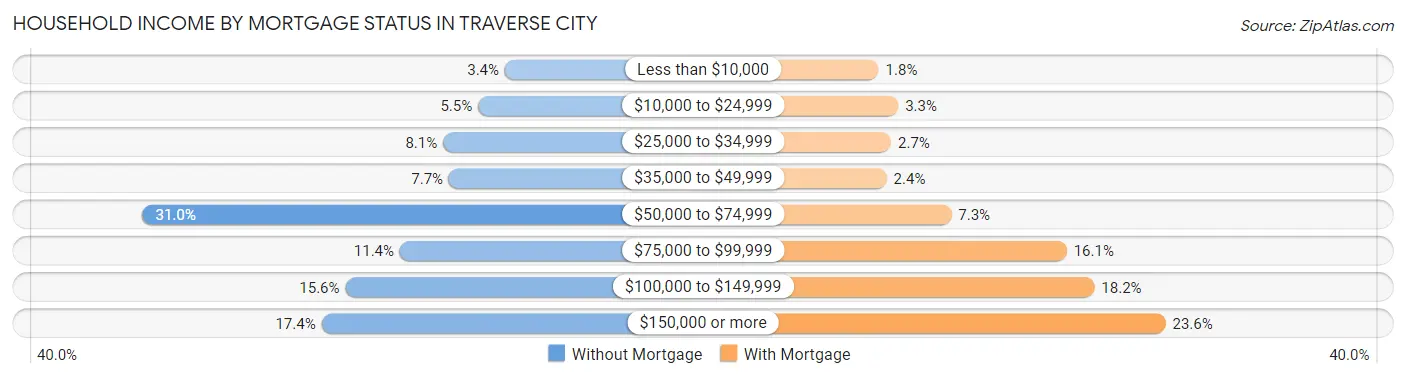
| Household Income | Without Mortgage | With Mortgage |
| Less than $10,000 | 60 (3.4%) | 46 (1.8%) |
| $10,000 to $24,999 | 96 (5.4%) | 85 (3.3%) |
| $25,000 to $34,999 | 143 (8.1%) | 71 (2.7%) |
| $35,000 to $49,999 | 135 (7.7%) | 62 (2.4%) |
| $50,000 to $74,999 | 546 (31.0%) | 191 (7.3%) |
| $75,000 to $99,999 | 201 (11.4%) | 421 (16.1%) |
| $100,000 to $149,999 | 274 (15.6%) | 476 (18.2%) |
| $150,000 or more | 306 (17.4%) | 618 (23.6%) |
| Total | 1,761 (100.0%) | 2,616 (100.0%) |
Property Value to Household Income Ratio in Traverse City
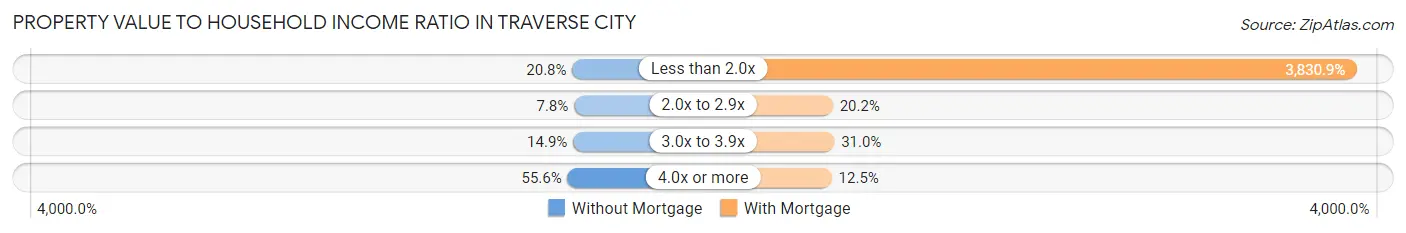
| Value-to-Income Ratio | Without Mortgage | With Mortgage |
| Less than 2.0x | 367 (20.8%) | 100,217 (3,830.9%) |
| 2.0x to 2.9x | 138 (7.8%) | 527 (20.2%) |
| 3.0x to 3.9x | 263 (14.9%) | 812 (31.0%) |
| 4.0x or more | 979 (55.6%) | 327 (12.5%) |
| Total | 1,761 (100.0%) | 2,616 (100.0%) |
Real Estate Taxes by Mortgage Status in Traverse City
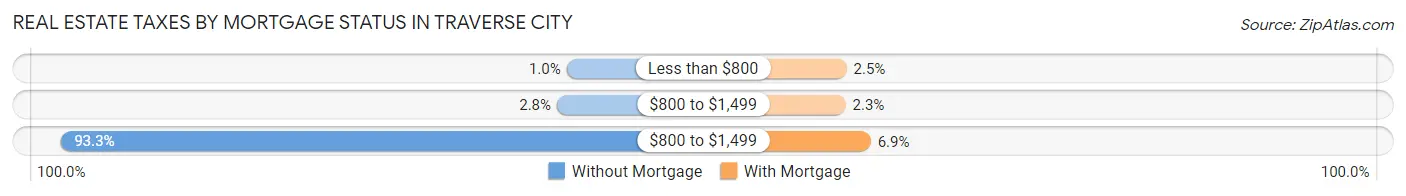
| Property Taxes | Without Mortgage | With Mortgage |
| Less than $800 | 18 (1.0%) | 65 (2.5%) |
| $800 to $1,499 | 49 (2.8%) | 60 (2.3%) |
| $800 to $1,499 | 1,643 (93.3%) | 180 (6.9%) |
| Total | 1,761 (100.0%) | 2,616 (100.0%) |
Health & Disability in Traverse City
Health Insurance Coverage by Age in Traverse City
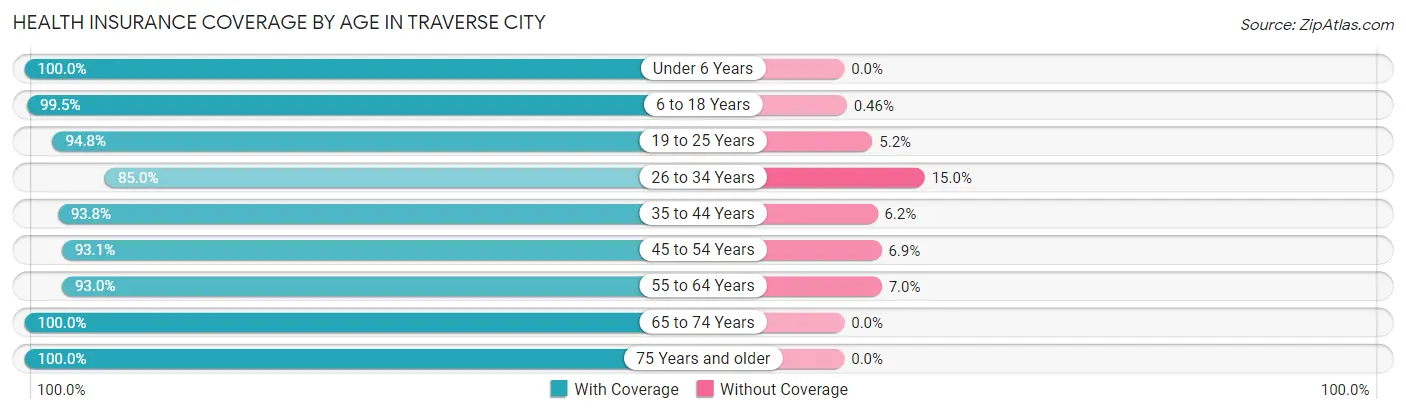
| Age Bracket | With Coverage | Without Coverage |
| Under 6 Years | 809 (100.0%) | 0 (0.0%) |
| 6 to 18 Years | 1,927 (99.5%) | 9 (0.5%) |
| 19 to 25 Years | 1,304 (94.8%) | 72 (5.2%) |
| 26 to 34 Years | 1,842 (85.0%) | 325 (15.0%) |
| 35 to 44 Years | 1,731 (93.8%) | 114 (6.2%) |
| 45 to 54 Years | 1,505 (93.1%) | 112 (6.9%) |
| 55 to 64 Years | 1,773 (93.0%) | 133 (7.0%) |
| 65 to 74 Years | 2,253 (100.0%) | 0 (0.0%) |
| 75 Years and older | 1,189 (100.0%) | 0 (0.0%) |
| Total | 14,333 (94.9%) | 765 (5.1%) |
Health Insurance Coverage by Citizenship Status in Traverse City
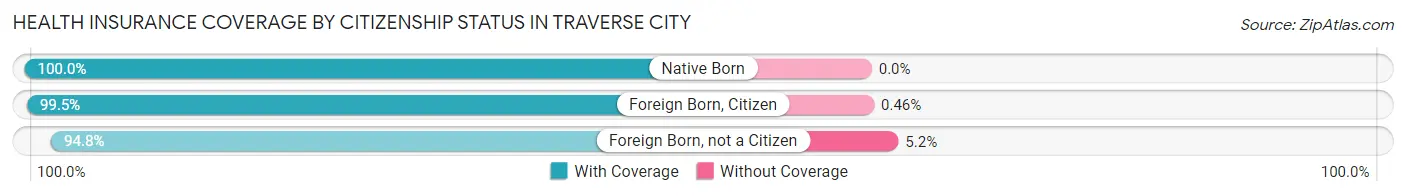
| Citizenship Status | With Coverage | Without Coverage |
| Native Born | 809 (100.0%) | 0 (0.0%) |
| Foreign Born, Citizen | 1,927 (99.5%) | 9 (0.5%) |
| Foreign Born, not a Citizen | 1,304 (94.8%) | 72 (5.2%) |
Health Insurance Coverage by Household Income in Traverse City
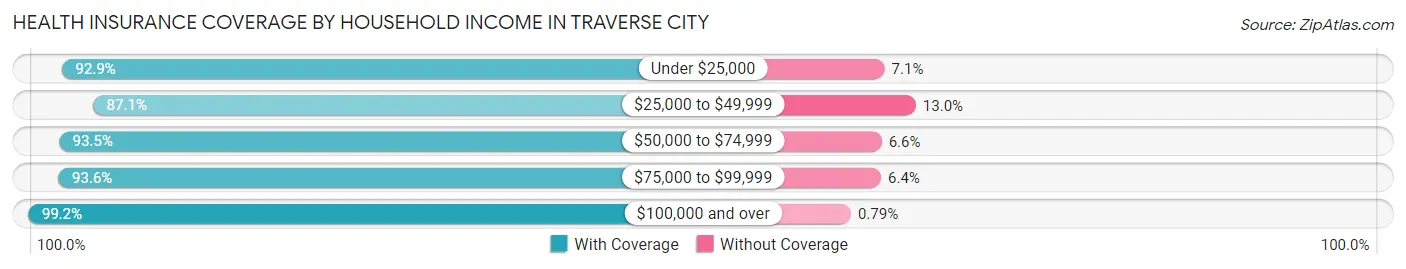
| Household Income | With Coverage | Without Coverage |
| Under $25,000 | 1,403 (92.9%) | 107 (7.1%) |
| $25,000 to $49,999 | 1,869 (87.1%) | 278 (13.0%) |
| $50,000 to $74,999 | 2,552 (93.4%) | 179 (6.6%) |
| $75,000 to $99,999 | 1,963 (93.6%) | 135 (6.4%) |
| $100,000 and over | 6,265 (99.2%) | 50 (0.8%) |
Public vs Private Health Insurance Coverage by Age in Traverse City
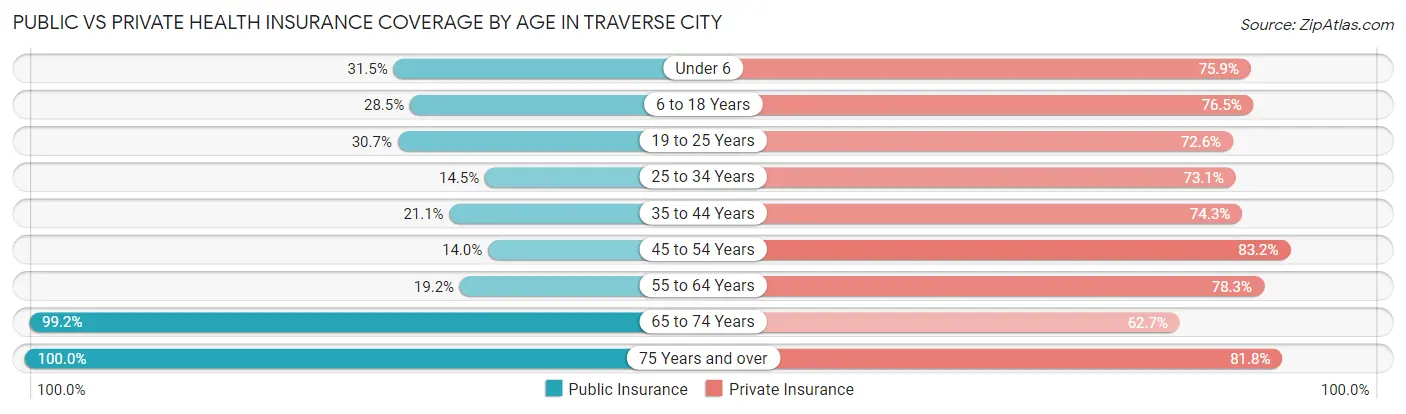
| Age Bracket | Public Insurance | Private Insurance |
| Under 6 | 255 (31.5%) | 614 (75.9%) |
| 6 to 18 Years | 551 (28.5%) | 1,480 (76.4%) |
| 19 to 25 Years | 423 (30.7%) | 999 (72.6%) |
| 25 to 34 Years | 315 (14.5%) | 1,584 (73.1%) |
| 35 to 44 Years | 390 (21.1%) | 1,371 (74.3%) |
| 45 to 54 Years | 226 (14.0%) | 1,346 (83.2%) |
| 55 to 64 Years | 366 (19.2%) | 1,493 (78.3%) |
| 65 to 74 Years | 2,234 (99.2%) | 1,413 (62.7%) |
| 75 Years and over | 1,189 (100.0%) | 972 (81.8%) |
| Total | 5,949 (39.4%) | 11,272 (74.7%) |
Disability Status by Sex by Age in Traverse City
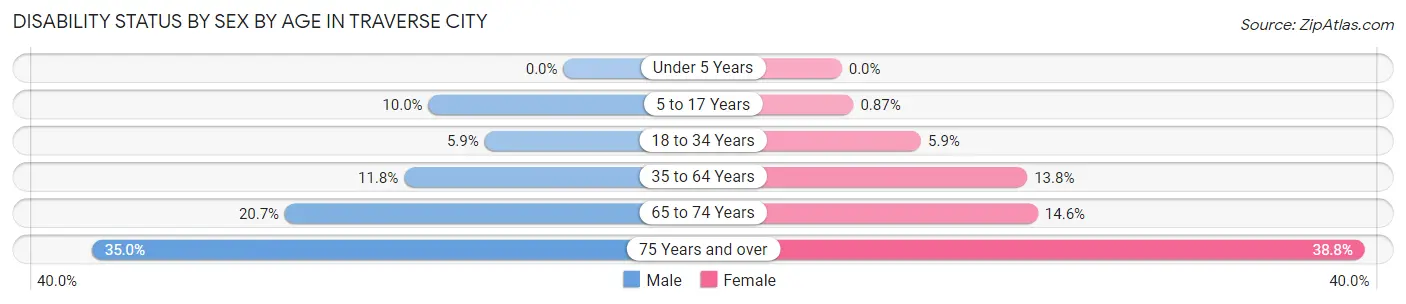
| Age Bracket | Male | Female |
| Under 5 Years | 0 (0.0%) | 0 (0.0%) |
| 5 to 17 Years | 95 (10.0%) | 9 (0.9%) |
| 18 to 34 Years | 111 (5.9%) | 104 (5.9%) |
| 35 to 64 Years | 325 (11.8%) | 361 (13.8%) |
| 65 to 74 Years | 203 (20.7%) | 185 (14.6%) |
| 75 Years and over | 153 (35.0%) | 292 (38.8%) |
Disability Class by Sex by Age in Traverse City
Disability Class: Hearing Difficulty
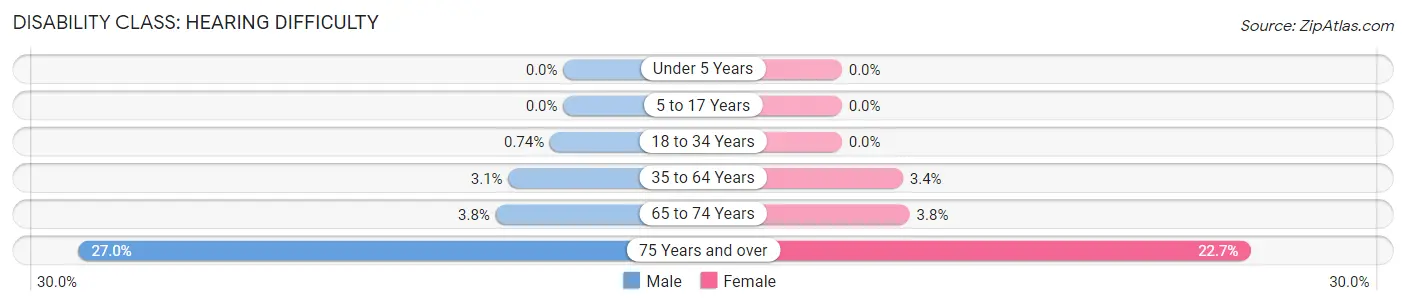
| Age Bracket | Male | Female |
| Under 5 Years | 0 (0.0%) | 0 (0.0%) |
| 5 to 17 Years | 0 (0.0%) | 0 (0.0%) |
| 18 to 34 Years | 14 (0.7%) | 0 (0.0%) |
| 35 to 64 Years | 84 (3.1%) | 89 (3.4%) |
| 65 to 74 Years | 37 (3.8%) | 48 (3.8%) |
| 75 Years and over | 118 (27.0%) | 171 (22.7%) |
Disability Class: Vision Difficulty
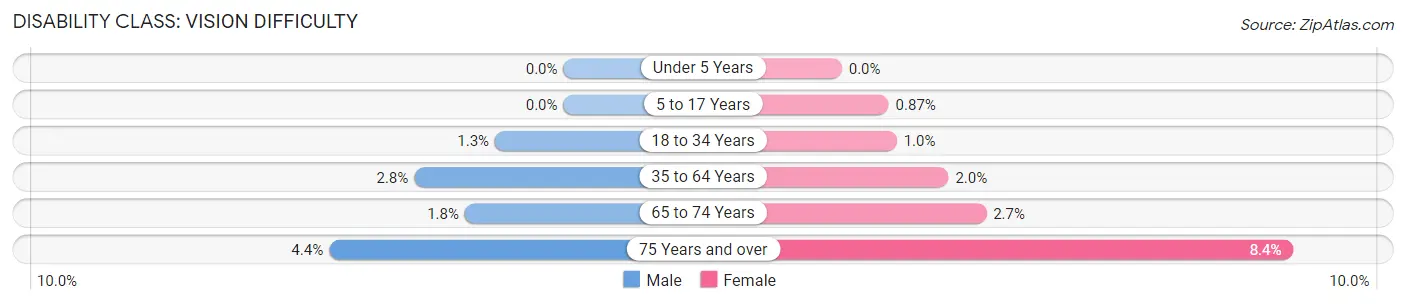
| Age Bracket | Male | Female |
| Under 5 Years | 0 (0.0%) | 0 (0.0%) |
| 5 to 17 Years | 0 (0.0%) | 9 (0.9%) |
| 18 to 34 Years | 24 (1.3%) | 18 (1.0%) |
| 35 to 64 Years | 76 (2.8%) | 52 (2.0%) |
| 65 to 74 Years | 18 (1.8%) | 34 (2.7%) |
| 75 Years and over | 19 (4.3%) | 63 (8.4%) |
Disability Class: Cognitive Difficulty
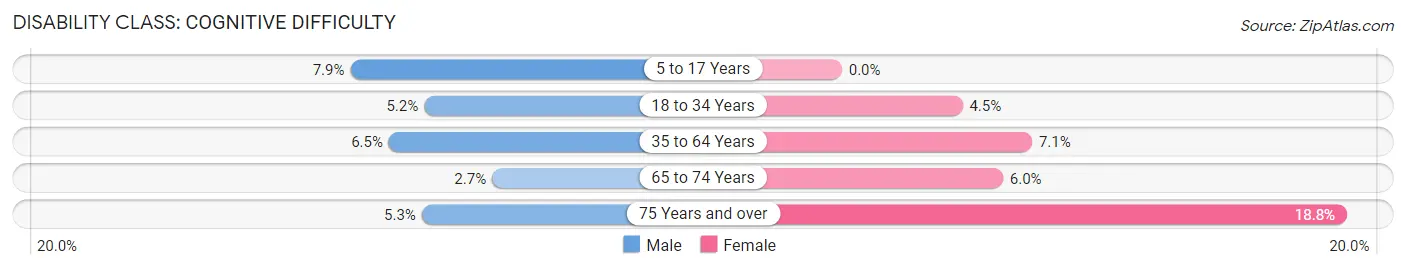
| Age Bracket | Male | Female |
| 5 to 17 Years | 75 (7.9%) | 0 (0.0%) |
| 18 to 34 Years | 98 (5.2%) | 79 (4.5%) |
| 35 to 64 Years | 178 (6.5%) | 185 (7.1%) |
| 65 to 74 Years | 26 (2.6%) | 76 (6.0%) |
| 75 Years and over | 23 (5.3%) | 141 (18.8%) |
Disability Class: Ambulatory Difficulty
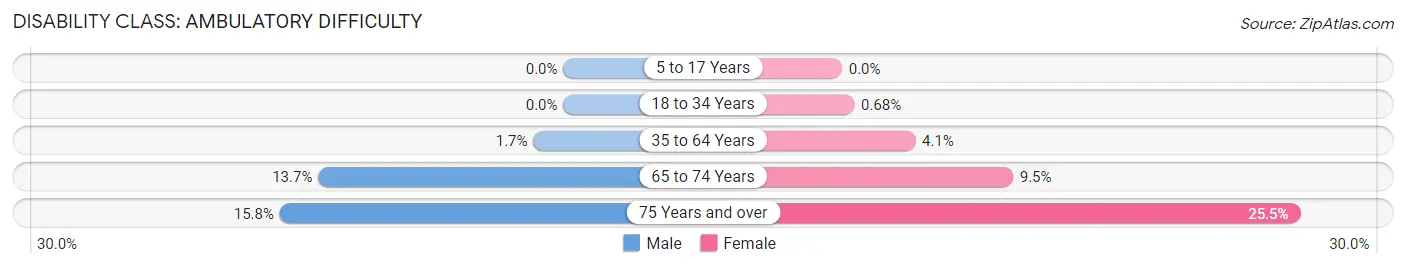
| Age Bracket | Male | Female |
| 5 to 17 Years | 0 (0.0%) | 0 (0.0%) |
| 18 to 34 Years | 0 (0.0%) | 12 (0.7%) |
| 35 to 64 Years | 46 (1.7%) | 107 (4.1%) |
| 65 to 74 Years | 134 (13.7%) | 121 (9.5%) |
| 75 Years and over | 69 (15.8%) | 192 (25.5%) |
Disability Class: Self-Care Difficulty
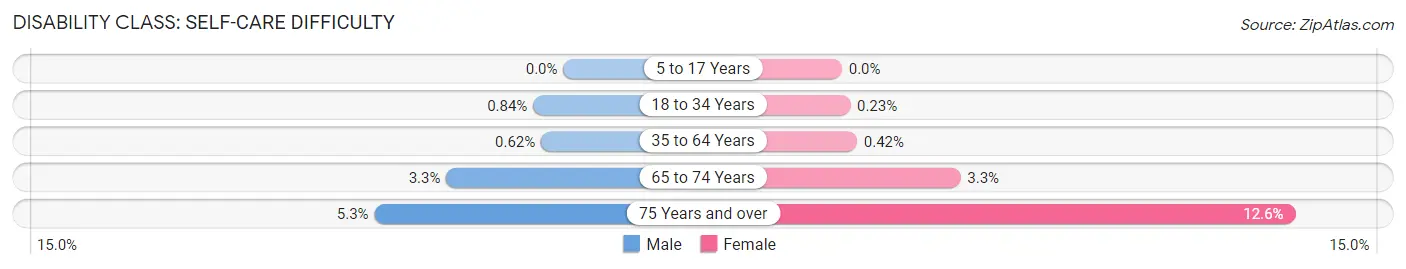
| Age Bracket | Male | Female |
| 5 to 17 Years | 0 (0.0%) | 0 (0.0%) |
| 18 to 34 Years | 16 (0.8%) | 4 (0.2%) |
| 35 to 64 Years | 17 (0.6%) | 11 (0.4%) |
| 65 to 74 Years | 32 (3.3%) | 42 (3.3%) |
| 75 Years and over | 23 (5.3%) | 95 (12.6%) |
Technology Access in Traverse City
Computing Device Access in Traverse City
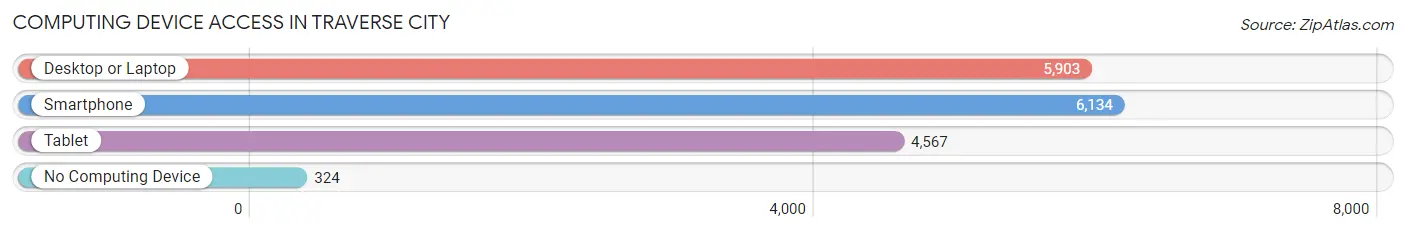
| Device Type | # Households | % Households |
| Desktop or Laptop | 5,903 | 83.1% |
| Smartphone | 6,134 | 86.4% |
| Tablet | 4,567 | 64.3% |
| No Computing Device | 324 | 4.6% |
| Total | 7,104 | 100.0% |
Internet Access in Traverse City
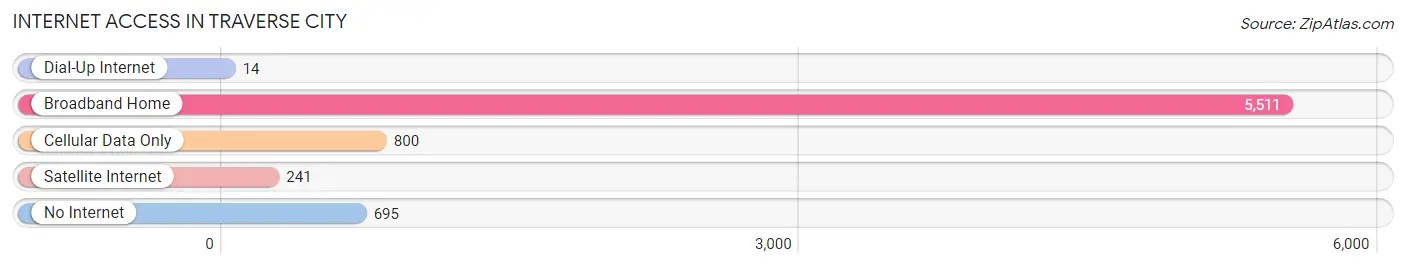
| Internet Type | # Households | % Households |
| Dial-Up Internet | 14 | 0.2% |
| Broadband Home | 5,511 | 77.6% |
| Cellular Data Only | 800 | 11.3% |
| Satellite Internet | 241 | 3.4% |
| No Internet | 695 | 9.8% |
| Total | 7,104 | 100.0% |
Traverse City Summary
Traverse City, Michigan is a city located in the northwestern part of the state, in Grand Traverse County. It is the county seat and the largest city in the county. The city is situated on the shores of Grand Traverse Bay, which is part of Lake Michigan. The city is known for its cherry production, and is the home of the National Cherry Festival.
History
The area that is now Traverse City was first inhabited by the Ottawa and Chippewa Native American tribes. The first European settlers arrived in the area in 1847, led by a man named Peter Doughtery. The settlement was originally called Boardmanville, after the Boardman River, which runs through the city. In 1851, the settlement was renamed Traverse City, after the Grand Traverse Bay.
The city was incorporated in 1869, and the first mayor was elected in 1870. The city quickly grew, and by the late 19th century, it was a major port and commercial center. The city was also a popular tourist destination, and many of the city’s historic buildings were built during this period.
In the early 20th century, the city’s economy shifted from a reliance on shipping and tourism to a focus on agriculture and manufacturing. The city’s population grew steadily throughout the 20th century, and by the 2000 census, the population was 14,547.
Geography
Traverse City is located in the northwestern part of Michigan, in Grand Traverse County. The city is situated on the shores of Grand Traverse Bay, which is part of Lake Michigan. The city is surrounded by rolling hills and forests, and is located near the Sleeping Bear Dunes National Lakeshore.
The city has a total area of 10.3 square miles, of which 9.9 square miles is land and 0.4 square miles is water. The city is located at the intersection of US-31 and M-37.
Economy
The economy of Traverse City is largely based on tourism, agriculture, and manufacturing. The city is home to several large employers, including Munson Medical Center, Traverse City State Bank, and the Grand Traverse Resort and Spa.
The city is also home to several wineries and breweries, and is a popular destination for wine and beer tourism. The city is also home to several cherry orchards, and is the home of the National Cherry Festival.
Demographics
As of the 2010 census, the population of Traverse City was 14,674. The racial makeup of the city was 92.3% White, 2.2% African American, 0.7% Native American, 1.7% Asian, 0.1% Pacific Islander, 1.2% from other races, and 2.0% from two or more races. Hispanic or Latino of any race were 3.3% of the population.
The median income for a household in the city was $41,945, and the median income for a family was $51,945. The per capita income for the city was $25,945. About 11.2% of families and 15.2% of the population were below the poverty line, including 22.2% of those under age 18 and 8.2% of those age 65 or over.
Common Questions
What is Per Capita Income in Traverse City?
Per Capita income in Traverse City is $48,883.
What is the Median Family Income in Traverse City?
Median Family Income in Traverse City is $99,595.
What is the Median Household income in Traverse City?
Median Household Income in Traverse City is $70,700.
What is Income or Wage Gap in Traverse City?
Income or Wage Gap in Traverse City is 23.6%.
Women in Traverse City earn 76.4 cents for every dollar earned by a man.
What is Inequality or Gini Index in Traverse City?
Inequality or Gini Index in Traverse City is 0.52.
What is the Total Population of Traverse City?
Total Population of Traverse City is 15,468.
What is the Total Male Population of Traverse City?
Total Male Population of Traverse City is 7,505.
What is the Total Female Population of Traverse City?
Total Female Population of Traverse City is 7,963.
What is the Ratio of Males per 100 Females in Traverse City?
There are 94.25 Males per 100 Females in Traverse City.
What is the Ratio of Females per 100 Males in Traverse City?
There are 106.10 Females per 100 Males in Traverse City.
What is the Median Population Age in Traverse City?
Median Population Age in Traverse City is 41.9 Years.
What is the Average Family Size in Traverse City
Average Family Size in Traverse City is 2.9 People.
What is the Average Household Size in Traverse City
Average Household Size in Traverse City is 2.1 People.
How Large is the Labor Force in Traverse City?
There are 8,319 People in the Labor Forcein in Traverse City.
What is the Percentage of People in the Labor Force in Traverse City?
63.4% of People are in the Labor Force in Traverse City.
What is the Unemployment Rate in Traverse City?
Unemployment Rate in Traverse City is 5.3%.