Haines, AK Map & Demographics
Haines Map
Haines Overview
$29,388
PER CAPITA INCOME
$99,583
AVG FAMILY INCOME
$69,612
AVG HOUSEHOLD INCOME
25.9%
WAGE / INCOME GAP [ % ]
74.1¢/ $1
WAGE / INCOME GAP [ $ ]
0.42
INEQUALITY / GINI INDEX
1,762
TOTAL POPULATION
898
MALE POPULATION
864
FEMALE POPULATION
103.94
MALES / 100 FEMALES
96.21
FEMALES / 100 MALES
41.3
MEDIAN AGE
3.8
AVG FAMILY SIZE
2.9
AVG HOUSEHOLD SIZE
665
LABOR FORCE [ PEOPLE ]
55.0%
PERCENT IN LABOR FORCE
5.4%
UNEMPLOYMENT RATE
Haines Zip Codes
Haines Area Codes
Income in Haines
Income Overview in Haines
Per Capita Income in Haines is $29,388, while median incomes of families and households are $99,583 and $69,612 respectively.
| Characteristic | Number | Measure |
| Per Capita Income | 1,762 | $29,388 |
| Median Family Income | 371 | $99,583 |
| Mean Family Income | 371 | $101,036 |
| Median Household Income | 615 | $69,612 |
| Mean Household Income | 615 | $78,737 |
| Income Deficit | 371 | $0 |
| Wage / Income Gap (%) | 1,762 | 25.93% |
| Wage / Income Gap ($) | 1,762 | 74.07¢ per $1 |
| Gini / Inequality Index | 1,762 | 0.42 |
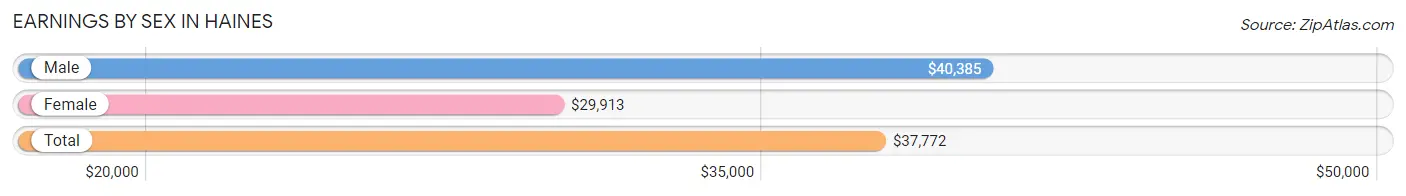
Earnings by Sex in Haines
Average Earnings in Haines are $37,772, $40,385 for men and $29,913 for women, a difference of 25.9%.
| Sex | Number | Average Earnings |
| Male | 432 (54.7%) | $40,385 |
| Female | 357 (45.3%) | $29,913 |
| Total | 789 (100.0%) | $37,772 |
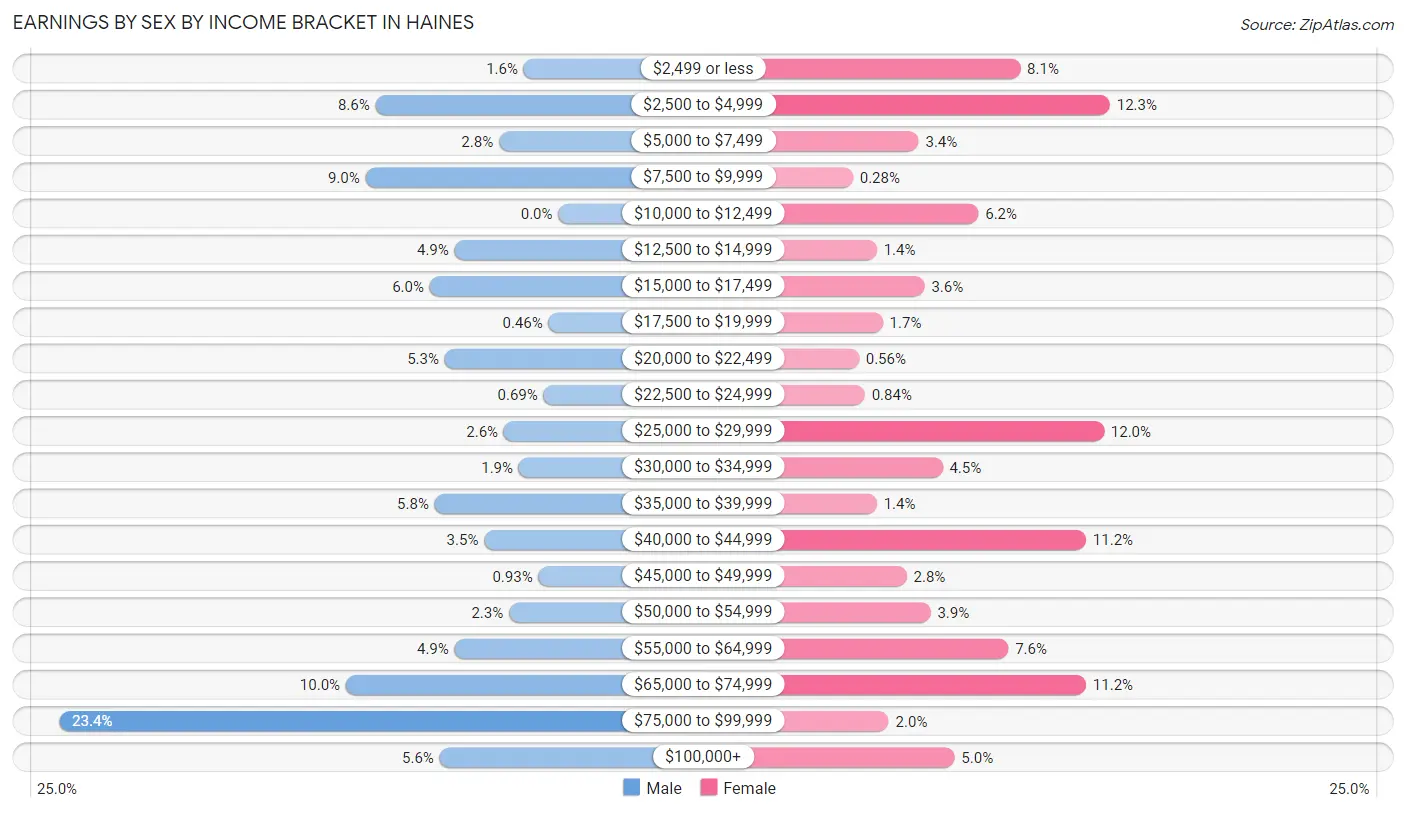
Earnings by Sex by Income Bracket in Haines
The most common earnings brackets in Haines are $75,000 to $99,999 for men (101 | 23.4%) and $2,500 to $4,999 for women (44 | 12.3%).
| Income | Male | Female |
| $2,499 or less | 7 (1.6%) | 29 (8.1%) |
| $2,500 to $4,999 | 37 (8.6%) | 44 (12.3%) |
| $5,000 to $7,499 | 12 (2.8%) | 12 (3.4%) |
| $7,500 to $9,999 | 39 (9.0%) | 1 (0.3%) |
| $10,000 to $12,499 | 0 (0.0%) | 22 (6.2%) |
| $12,500 to $14,999 | 21 (4.9%) | 5 (1.4%) |
| $15,000 to $17,499 | 26 (6.0%) | 13 (3.6%) |
| $17,500 to $19,999 | 2 (0.5%) | 6 (1.7%) |
| $20,000 to $22,499 | 23 (5.3%) | 2 (0.6%) |
| $22,500 to $24,999 | 3 (0.7%) | 3 (0.8%) |
| $25,000 to $29,999 | 11 (2.5%) | 43 (12.0%) |
| $30,000 to $34,999 | 8 (1.8%) | 16 (4.5%) |
| $35,000 to $39,999 | 25 (5.8%) | 5 (1.4%) |
| $40,000 to $44,999 | 15 (3.5%) | 40 (11.2%) |
| $45,000 to $49,999 | 4 (0.9%) | 10 (2.8%) |
| $50,000 to $54,999 | 10 (2.3%) | 14 (3.9%) |
| $55,000 to $64,999 | 21 (4.9%) | 27 (7.6%) |
| $65,000 to $74,999 | 43 (10.0%) | 40 (11.2%) |
| $75,000 to $99,999 | 101 (23.4%) | 7 (2.0%) |
| $100,000+ | 24 (5.6%) | 18 (5.0%) |
| Total | 432 (100.0%) | 357 (100.0%) |
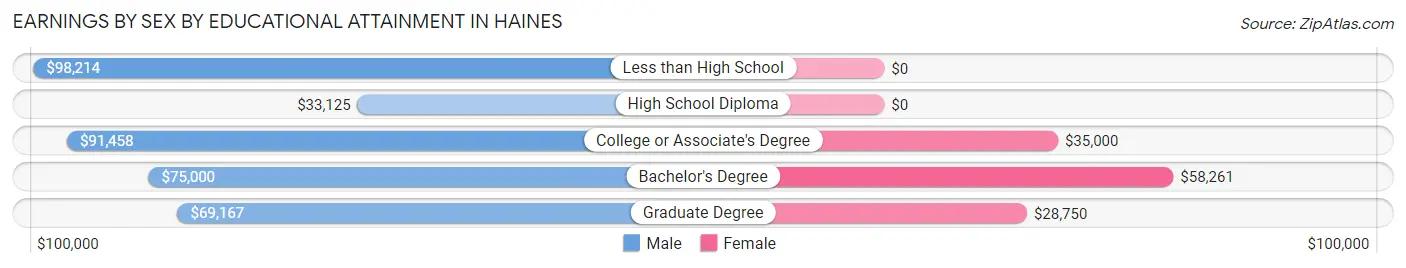
Earnings by Sex by Educational Attainment in Haines
Average earnings in Haines are $57,768 for men and $34,875 for women, a difference of 39.6%. Men with an educational attainment of less than high school enjoy the highest average annual earnings of $98,214, while those with high school diploma education earn the least with $33,125. Women with an educational attainment of bachelor's degree earn the most with the average annual earnings of $58,261, while those with graduate degree education have the smallest earnings of $28,750.
| Educational Attainment | Male Income | Female Income |
| Less than High School | $98,214 | $0 |
| High School Diploma | $33,125 | $0 |
| College or Associate's Degree | $91,458 | $35,000 |
| Bachelor's Degree | $75,000 | $58,261 |
| Graduate Degree | $69,167 | $28,750 |
| Total | $57,768 | $34,875 |
Family Income in Haines
Family Income Brackets in Haines
According to the Haines family income data, there are 123 families falling into the $100,000 to $149,999 income range, which is the most common income bracket and makes up 33.2% of all families. Conversely, the less than $10,000 income bracket is the least frequent group with only 4 families (1.1%) belonging to this category.
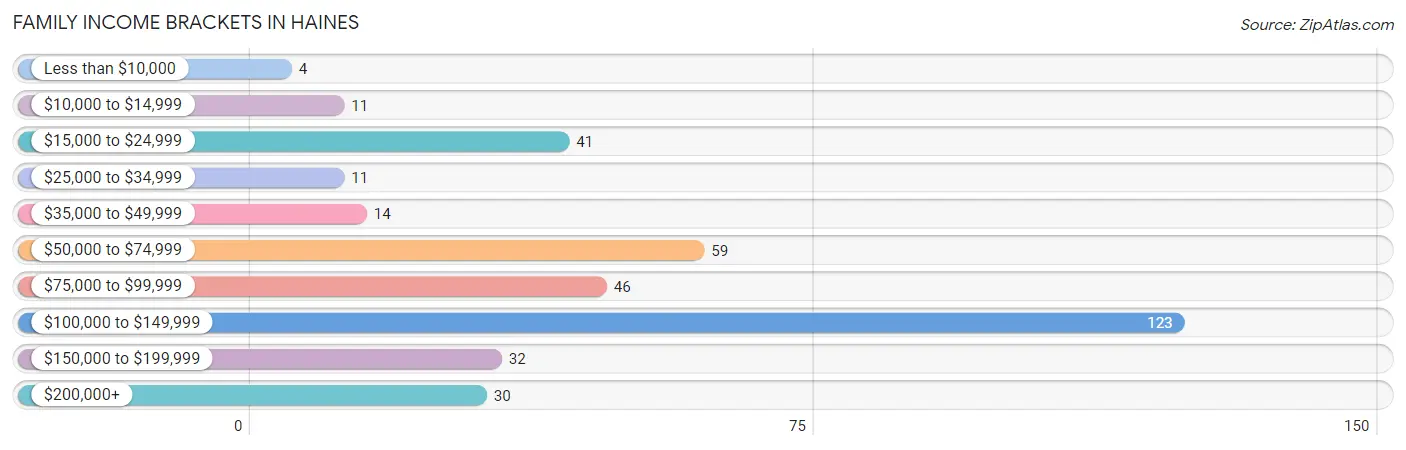
| Income Bracket | # Families | % Families |
| Less than $10,000 | 4 | 1.1% |
| $10,000 to $14,999 | 11 | 3.0% |
| $15,000 to $24,999 | 41 | 11.1% |
| $25,000 to $34,999 | 11 | 3.0% |
| $35,000 to $49,999 | 14 | 3.8% |
| $50,000 to $74,999 | 59 | 15.9% |
| $75,000 to $99,999 | 46 | 12.4% |
| $100,000 to $149,999 | 123 | 33.2% |
| $150,000 to $199,999 | 32 | 8.6% |
| $200,000+ | 30 | 8.1% |
Family Income by Famaliy Size in Haines
6-person families (23 | 6.2%) account for the highest median family income in Haines with $228,309 per family, while 3-person families (30 | 8.1%) have the highest median income of $42,583 per family member.
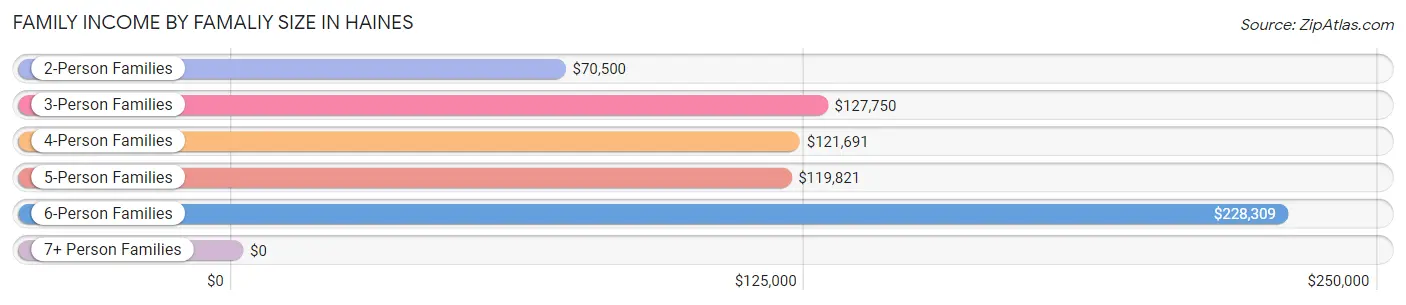
| Income Bracket | # Families | Median Income |
| 2-Person Families | 206 (55.5%) | $70,500 |
| 3-Person Families | 30 (8.1%) | $127,750 |
| 4-Person Families | 67 (18.1%) | $121,691 |
| 5-Person Families | 19 (5.1%) | $119,821 |
| 6-Person Families | 23 (6.2%) | $228,309 |
| 7+ Person Families | 26 (7.0%) | $0 |
| Total | 371 (100.0%) | $99,583 |
Family Income by Number of Earners in Haines
The median family income in Haines is $99,583, with families comprising 3+ earners (28) having the highest median family income of $227,941, while families with no earners (65) have the lowest median family income of $21,738, accounting for 7.5% and 17.5% of families, respectively.
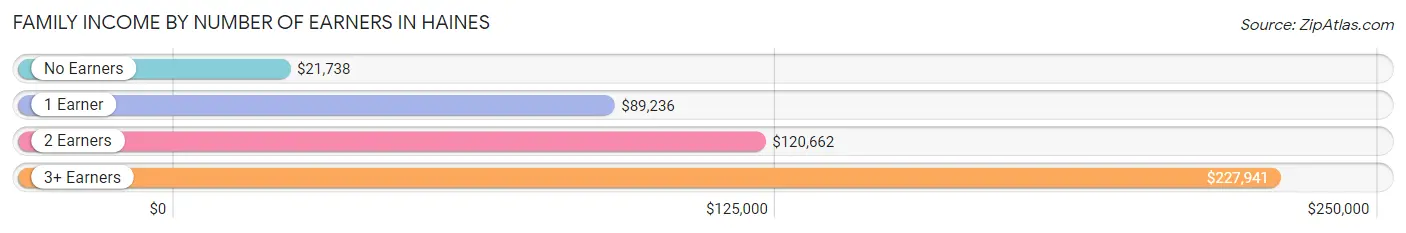
| Number of Earners | # Families | Median Income |
| No Earners | 65 (17.5%) | $21,738 |
| 1 Earner | 73 (19.7%) | $89,236 |
| 2 Earners | 205 (55.3%) | $120,662 |
| 3+ Earners | 28 (7.5%) | $227,941 |
| Total | 371 (100.0%) | $99,583 |
Household Income in Haines
Household Income Brackets in Haines
With 135 households falling in the category, the $100,000 to $149,999 income range is the most frequent in Haines, accounting for 22.0% of all households. In contrast, only 31 households (5.0%) fall into the $35,000 to $49,999 income bracket, making it the least populous group.
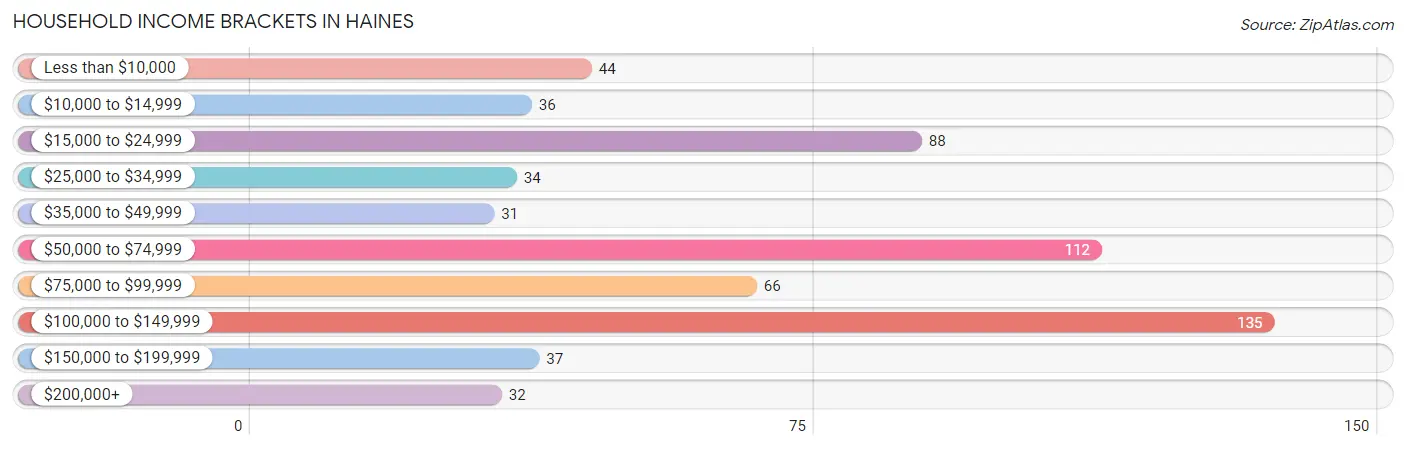
| Income Bracket | # Households | % Households |
| Less than $10,000 | 44 | 7.2% |
| $10,000 to $14,999 | 36 | 5.9% |
| $15,000 to $24,999 | 88 | 14.3% |
| $25,000 to $34,999 | 34 | 5.5% |
| $35,000 to $49,999 | 31 | 5.0% |
| $50,000 to $74,999 | 112 | 18.2% |
| $75,000 to $99,999 | 66 | 10.7% |
| $100,000 to $149,999 | 135 | 22.0% |
| $150,000 to $199,999 | 37 | 6.0% |
| $200,000+ | 32 | 5.2% |
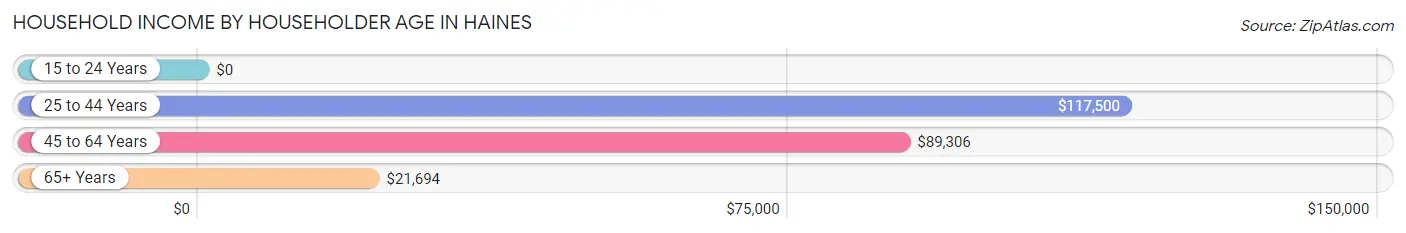
Household Income by Householder Age in Haines
The median household income in Haines is $69,612, with the highest median household income of $117,500 found in the 25 to 44 years age bracket for the primary householder. A total of 152 households (24.7%) fall into this category.
| Income Bracket | # Households | Median Income |
| 15 to 24 Years | 0 (0.0%) | $0 |
| 25 to 44 Years | 152 (24.7%) | $117,500 |
| 45 to 64 Years | 226 (36.7%) | $89,306 |
| 65+ Years | 237 (38.5%) | $21,694 |
| Total | 615 (100.0%) | $69,612 |
Poverty in Haines
Income Below Poverty by Sex and Age in Haines
With 7.1% poverty level for males and 3.4% for females among the residents of Haines, 65 to 74 year old males and 45 to 54 year old females are the most vulnerable to poverty, with 48 males (46.2%) and 14 females (17.7%) in their respective age groups living below the poverty level.
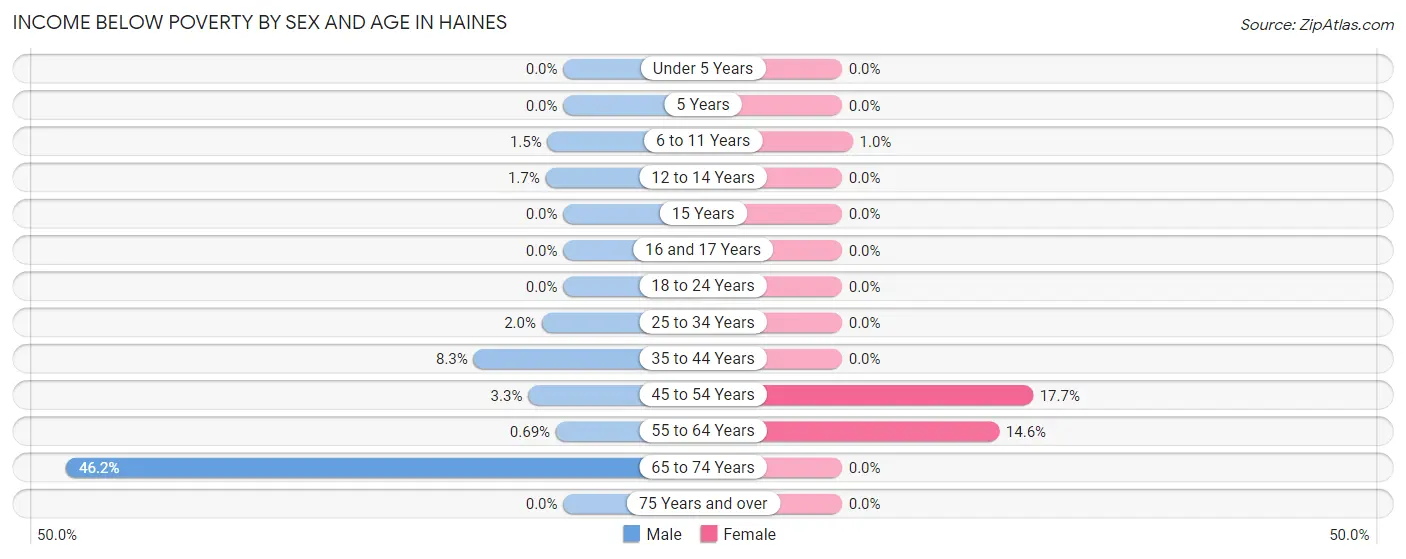
| Age Bracket | Male | Female |
| Under 5 Years | 0 (0.0%) | 0 (0.0%) |
| 5 Years | 0 (0.0%) | 0 (0.0%) |
| 6 to 11 Years | 1 (1.5%) | 1 (1.0%) |
| 12 to 14 Years | 2 (1.7%) | 0 (0.0%) |
| 15 Years | 0 (0.0%) | 0 (0.0%) |
| 16 and 17 Years | 0 (0.0%) | 0 (0.0%) |
| 18 to 24 Years | 0 (0.0%) | 0 (0.0%) |
| 25 to 34 Years | 1 (2.0%) | 0 (0.0%) |
| 35 to 44 Years | 7 (8.3%) | 0 (0.0%) |
| 45 to 54 Years | 3 (3.3%) | 14 (17.7%) |
| 55 to 64 Years | 1 (0.7%) | 14 (14.6%) |
| 65 to 74 Years | 48 (46.2%) | 0 (0.0%) |
| 75 Years and over | 0 (0.0%) | 0 (0.0%) |
| Total | 63 (7.1%) | 29 (3.4%) |
Income Above Poverty by Sex and Age in Haines
According to the poverty statistics in Haines, males aged under 5 years and females aged under 5 years are the age groups that are most secure financially, with 100.0% of males and 100.0% of females in these age groups living above the poverty line.
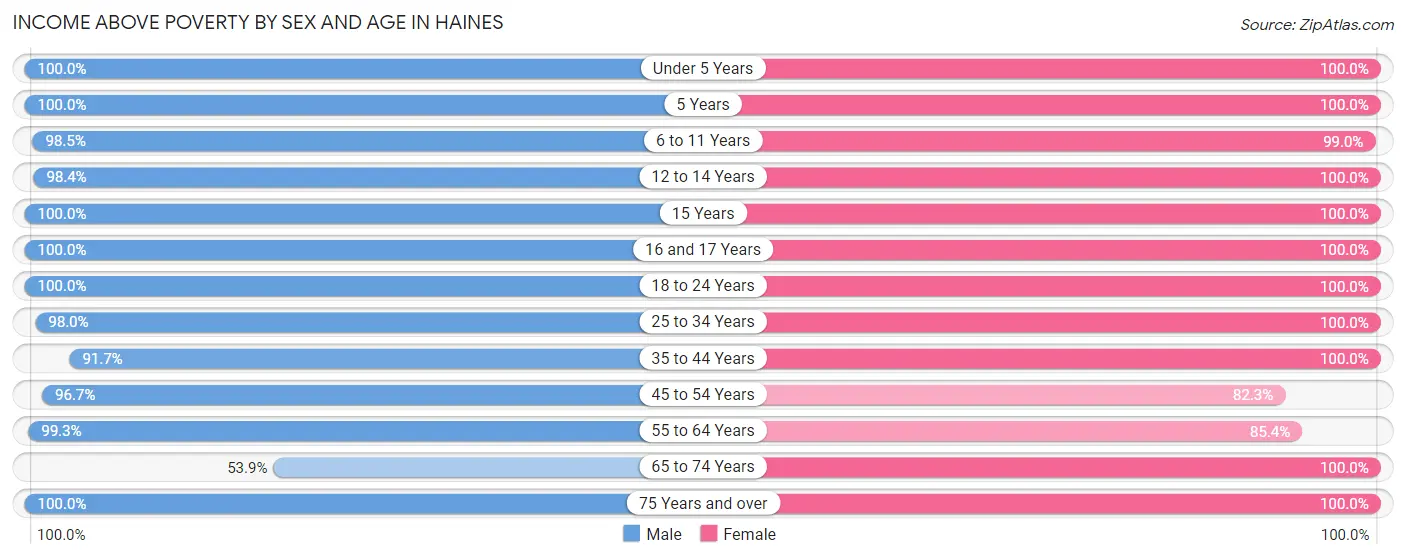
| Age Bracket | Male | Female |
| Under 5 Years | 53 (100.0%) | 24 (100.0%) |
| 5 Years | 5 (100.0%) | 27 (100.0%) |
| 6 to 11 Years | 67 (98.5%) | 99 (99.0%) |
| 12 to 14 Years | 119 (98.4%) | 61 (100.0%) |
| 15 Years | 78 (100.0%) | 16 (100.0%) |
| 16 and 17 Years | 39 (100.0%) | 36 (100.0%) |
| 18 to 24 Years | 25 (100.0%) | 5 (100.0%) |
| 25 to 34 Years | 49 (98.0%) | 47 (100.0%) |
| 35 to 44 Years | 77 (91.7%) | 163 (100.0%) |
| 45 to 54 Years | 89 (96.7%) | 65 (82.3%) |
| 55 to 64 Years | 144 (99.3%) | 82 (85.4%) |
| 65 to 74 Years | 56 (53.8%) | 129 (100.0%) |
| 75 Years and over | 27 (100.0%) | 80 (100.0%) |
| Total | 828 (92.9%) | 834 (96.6%) |
Income Below Poverty Among Married-Couple Families in Haines
The poverty statistics for married-couple families in Haines show that 3.3% or 11 of the total 333 families live below the poverty line. Families with no children have the highest poverty rate of 5.9%, comprising of 11 families. On the other hand, families with 1 or 2 children have the lowest poverty rate of 0.0%, which includes 0 families.
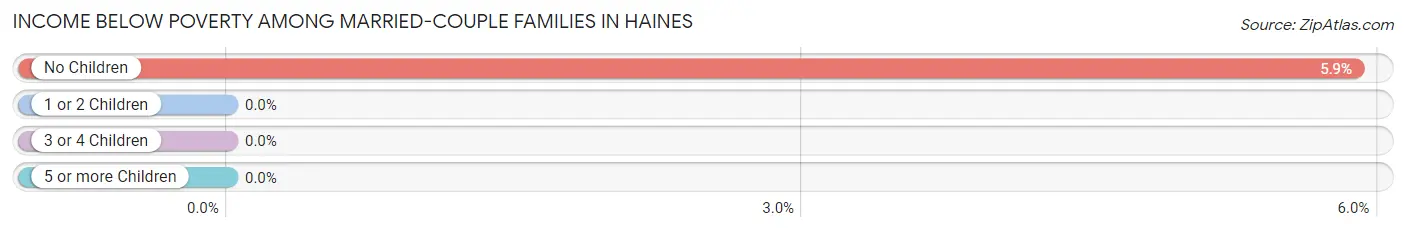
| Children | Above Poverty | Below Poverty |
| No Children | 176 (94.1%) | 11 (5.9%) |
| 1 or 2 Children | 80 (100.0%) | 0 (0.0%) |
| 3 or 4 Children | 40 (100.0%) | 0 (0.0%) |
| 5 or more Children | 26 (100.0%) | 0 (0.0%) |
| Total | 322 (96.7%) | 11 (3.3%) |
Income Below Poverty Among Single-Parent Households in Haines
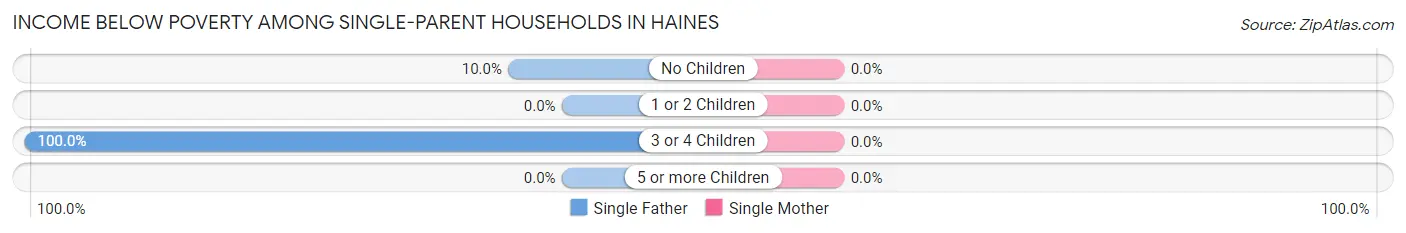
| Children | Single Father | Single Mother |
| No Children | 2 (10.0%) | 0 (0.0%) |
| 1 or 2 Children | 0 (0.0%) | 0 (0.0%) |
| 3 or 4 Children | 2 (100.0%) | 0 (0.0%) |
| 5 or more Children | 0 (0.0%) | 0 (0.0%) |
| Total | 4 (15.4%) | 0 (0.0%) |
Income Below Poverty Among Married-Couple vs Single-Parent Households in Haines
The poverty data for Haines shows that 11 of the married-couple family households (3.3%) and 4 of the single-parent households (10.5%) are living below the poverty level. Within the married-couple family households, those with no children have the highest poverty rate, with 11 households (5.9%) falling below the poverty line. Among the single-parent households, those with 3 or 4 children have the highest poverty rate, with 2 household (100.0%) living below poverty.
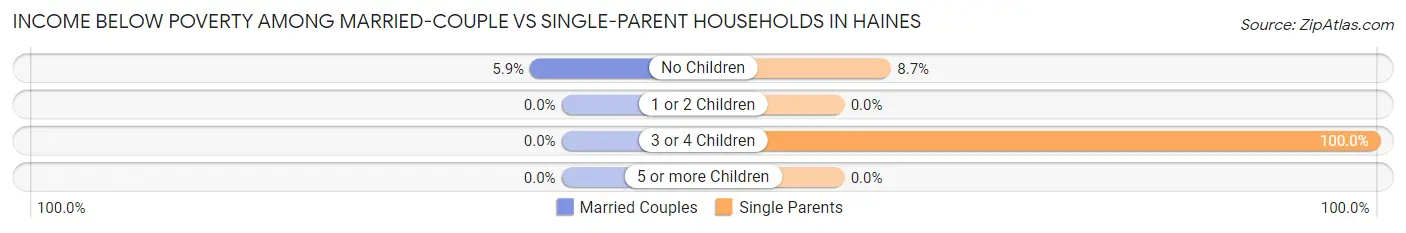
| Children | Married-Couple Families | Single-Parent Households |
| No Children | 11 (5.9%) | 2 (8.7%) |
| 1 or 2 Children | 0 (0.0%) | 0 (0.0%) |
| 3 or 4 Children | 0 (0.0%) | 2 (100.0%) |
| 5 or more Children | 0 (0.0%) | 0 (0.0%) |
| Total | 11 (3.3%) | 4 (10.5%) |
Race in Haines
The most populous races in Haines are White / Caucasian (1,391 | 78.9%), Two or more Races (191 | 10.8%), and Hispanic or Latino (168 | 9.5%).
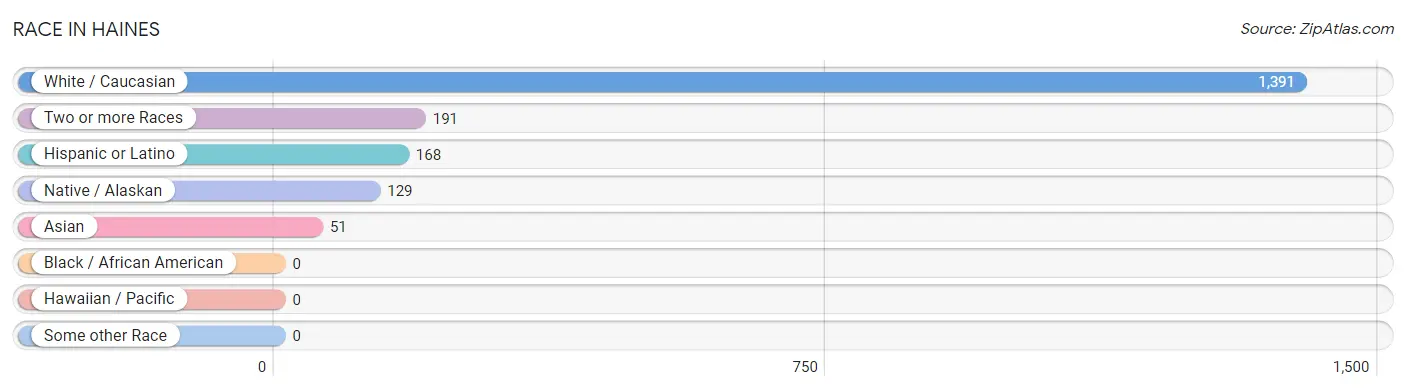
| Race | # Population | % Population |
| Asian | 51 | 2.9% |
| Black / African American | 0 | 0.0% |
| Hawaiian / Pacific | 0 | 0.0% |
| Hispanic or Latino | 168 | 9.5% |
| Native / Alaskan | 129 | 7.3% |
| White / Caucasian | 1,391 | 78.9% |
| Two or more Races | 191 | 10.8% |
| Some other Race | 0 | 0.0% |
| Total | 1,762 | 100.0% |
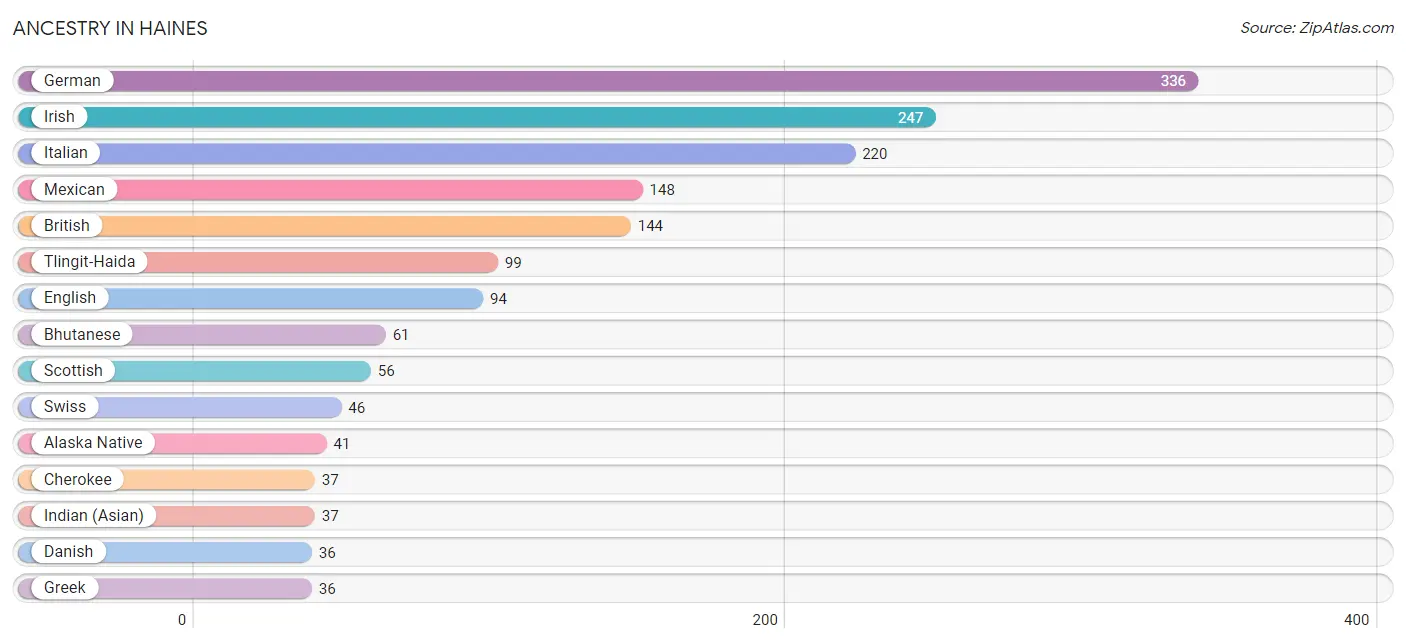
Ancestry in Haines
The most populous ancestries reported in Haines are German (336 | 19.1%), Irish (247 | 14.0%), Italian (220 | 12.5%), Mexican (148 | 8.4%), and British (144 | 8.2%), together accounting for 62.1% of all Haines residents.
| Ancestry | # Population | % Population |
| Alaska Native | 41 | 2.3% |
| Alaskan Athabascan | 5 | 0.3% |
| American | 13 | 0.7% |
| Australian | 1 | 0.1% |
| Basque | 12 | 0.7% |
| Bhutanese | 61 | 3.5% |
| British | 144 | 8.2% |
| Canadian | 25 | 1.4% |
| Cherokee | 37 | 2.1% |
| Cuban | 20 | 1.1% |
| Czech | 7 | 0.4% |
| Danish | 36 | 2.0% |
| Dutch | 30 | 1.7% |
| Eastern European | 2 | 0.1% |
| English | 94 | 5.3% |
| European | 13 | 0.7% |
| Finnish | 18 | 1.0% |
| French | 30 | 1.7% |
| French American Indian | 11 | 0.6% |
| French Canadian | 2 | 0.1% |
| German | 336 | 19.1% |
| Greek | 36 | 2.0% |
| Guamanian / Chamorro | 1 | 0.1% |
| Indian (Asian) | 37 | 2.1% |
| Inupiat | 3 | 0.2% |
| Irish | 247 | 14.0% |
| Italian | 220 | 12.5% |
| Korean | 25 | 1.4% |
| Mexican | 148 | 8.4% |
| Northern European | 2 | 0.1% |
| Norwegian | 35 | 2.0% |
| Pakistani | 11 | 0.6% |
| Pennsylvania German | 4 | 0.2% |
| Polish | 13 | 0.7% |
| Portuguese | 5 | 0.3% |
| Russian | 4 | 0.2% |
| Scandinavian | 9 | 0.5% |
| Scotch-Irish | 4 | 0.2% |
| Scottish | 56 | 3.2% |
| Shoshone | 2 | 0.1% |
| Slavic | 3 | 0.2% |
| Swedish | 36 | 2.0% |
| Swiss | 46 | 2.6% |
| Tlingit-Haida | 99 | 5.6% |
| Tsimshian | 1 | 0.1% |
| Ukrainian | 4 | 0.2% |
| Welsh | 2 | 0.1% |
| Yup'ik | 1 | 0.1% | View All 48 Rows |
Immigrants in Haines
The most numerous immigrant groups reported in Haines came from Asia (51 | 2.9%), South Eastern Asia (34 | 1.9%), Philippines (23 | 1.3%), South Central Asia (17 | 1.0%), and Sri Lanka (17 | 1.0%), together accounting for 8.1% of all Haines residents.
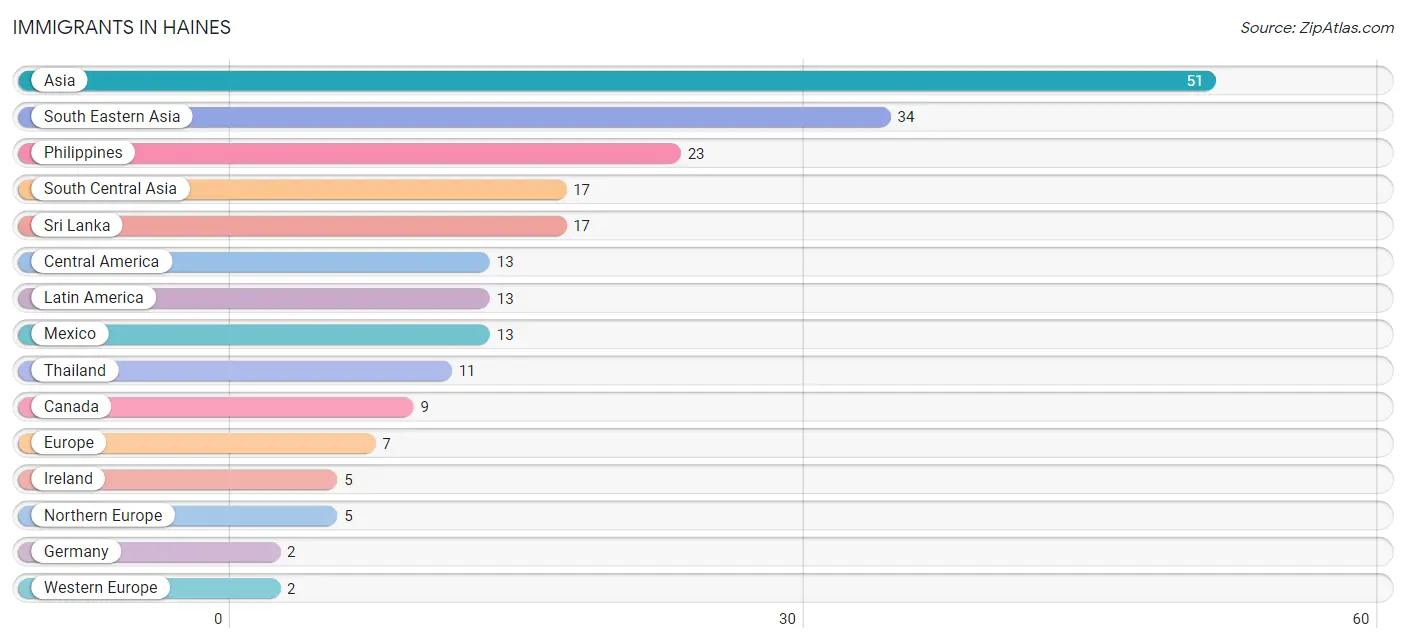
| Immigration Origin | # Population | % Population |
| Asia | 51 | 2.9% |
| Canada | 9 | 0.5% |
| Central America | 13 | 0.7% |
| Europe | 7 | 0.4% |
| Germany | 2 | 0.1% |
| Ireland | 5 | 0.3% |
| Latin America | 13 | 0.7% |
| Mexico | 13 | 0.7% |
| Northern Europe | 5 | 0.3% |
| Philippines | 23 | 1.3% |
| South Central Asia | 17 | 1.0% |
| South Eastern Asia | 34 | 1.9% |
| Sri Lanka | 17 | 1.0% |
| Thailand | 11 | 0.6% |
| Western Europe | 2 | 0.1% | View All 15 Rows |
Sex and Age in Haines
Sex and Age in Haines
The most populous age groups in Haines are 10 to 14 Years (148 | 16.5%) for men and 5 to 9 Years (103 | 11.9%) for women.
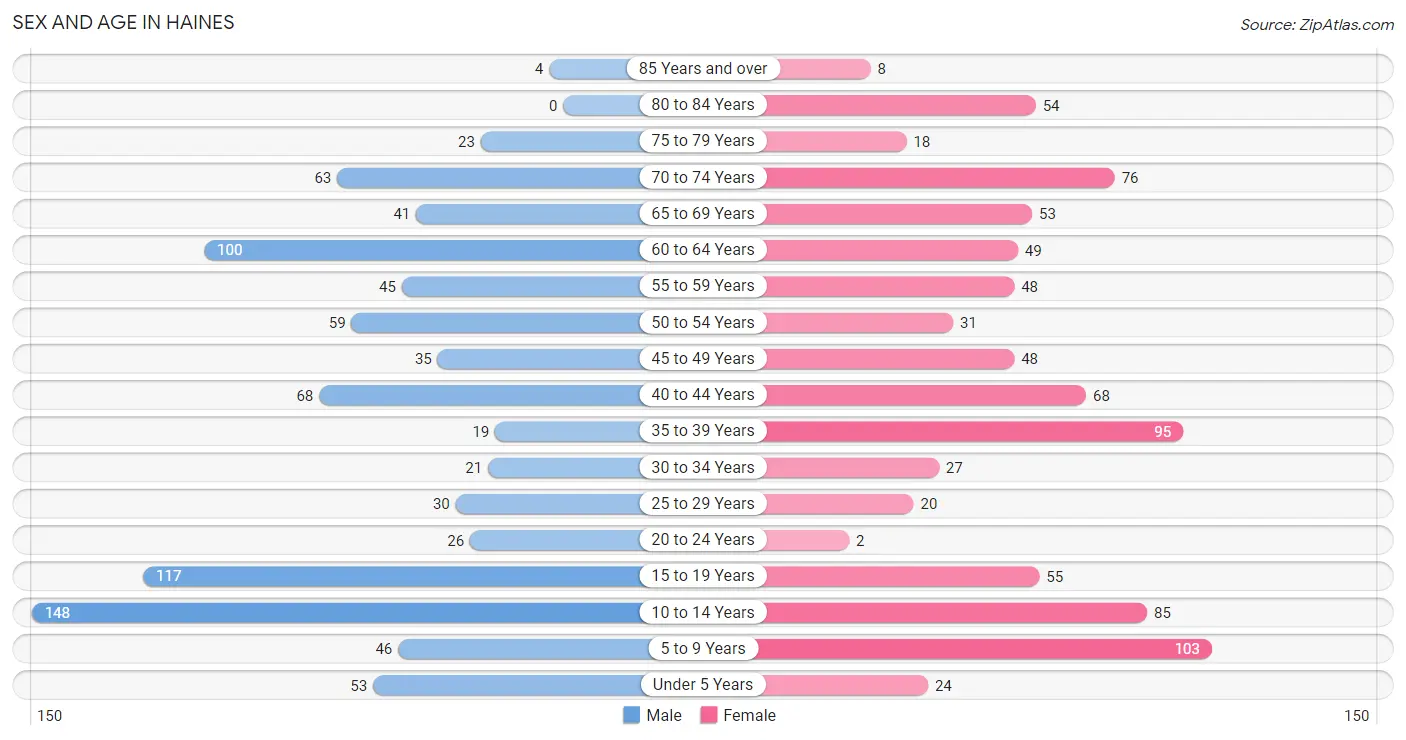
| Age Bracket | Male | Female |
| Under 5 Years | 53 (5.9%) | 24 (2.8%) |
| 5 to 9 Years | 46 (5.1%) | 103 (11.9%) |
| 10 to 14 Years | 148 (16.5%) | 85 (9.8%) |
| 15 to 19 Years | 117 (13.0%) | 55 (6.4%) |
| 20 to 24 Years | 26 (2.9%) | 2 (0.2%) |
| 25 to 29 Years | 30 (3.3%) | 20 (2.3%) |
| 30 to 34 Years | 21 (2.3%) | 27 (3.1%) |
| 35 to 39 Years | 19 (2.1%) | 95 (11.0%) |
| 40 to 44 Years | 68 (7.6%) | 68 (7.9%) |
| 45 to 49 Years | 35 (3.9%) | 48 (5.6%) |
| 50 to 54 Years | 59 (6.6%) | 31 (3.6%) |
| 55 to 59 Years | 45 (5.0%) | 48 (5.6%) |
| 60 to 64 Years | 100 (11.1%) | 49 (5.7%) |
| 65 to 69 Years | 41 (4.6%) | 53 (6.1%) |
| 70 to 74 Years | 63 (7.0%) | 76 (8.8%) |
| 75 to 79 Years | 23 (2.6%) | 18 (2.1%) |
| 80 to 84 Years | 0 (0.0%) | 54 (6.2%) |
| 85 Years and over | 4 (0.4%) | 8 (0.9%) |
| Total | 898 (100.0%) | 864 (100.0%) |
Families and Households in Haines
Median Family Size in Haines
The median family size in Haines is 3.84 persons per family, with married-couple families (333 | 89.8%) accounting for the largest median family size of 3.89 persons per family. On the other hand, single female/mother families (12 | 3.2%) represent the smallest median family size with 3.08 persons per family.
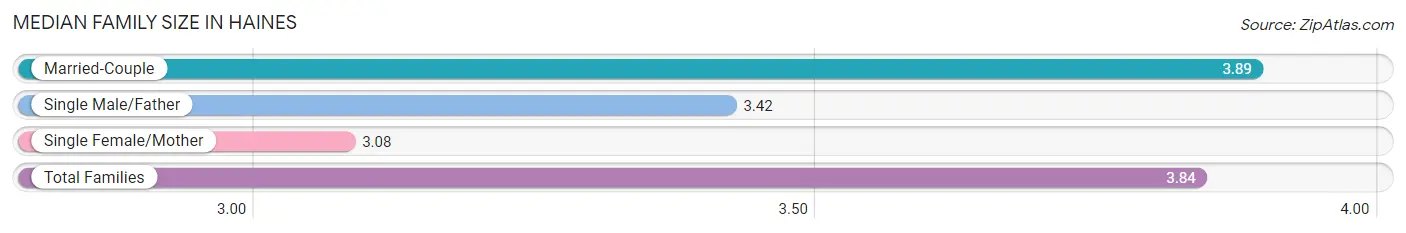
| Family Type | # Families | Family Size |
| Married-Couple | 333 (89.8%) | 3.89 |
| Single Male/Father | 26 (7.0%) | 3.42 |
| Single Female/Mother | 12 (3.2%) | 3.08 |
| Total Families | 371 (100.0%) | 3.84 |
Median Household Size in Haines
The median household size in Haines is 2.85 persons per household, with married-couple households (333 | 54.1%) accounting for the largest median household size of 3.9 persons per household. non-family households (244 | 39.7%) represent the smallest median household size with 1.32 persons per household.
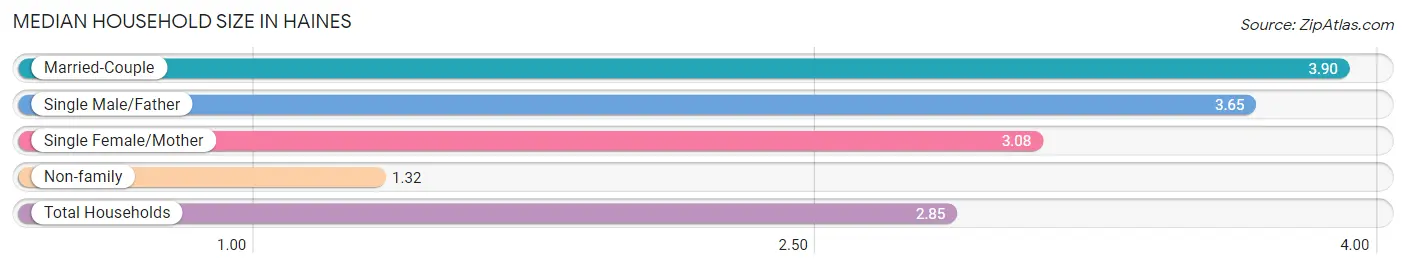
| Household Type | # Households | Household Size |
| Married-Couple | 333 (54.1%) | 3.90 |
| Single Male/Father | 26 (4.2%) | 3.65 |
| Single Female/Mother | 12 (1.9%) | 3.08 |
| Non-family | 244 (39.7%) | 1.32 |
| Total Households | 615 (100.0%) | 2.85 |
Household Size by Marriage Status in Haines
Out of a total of 615 households in Haines, 371 (60.3%) are family households, while 244 (39.7%) are nonfamily households. The most numerous type of family households are 2-person households, comprising 204, and the most common type of nonfamily households are 1-person households, comprising 199.
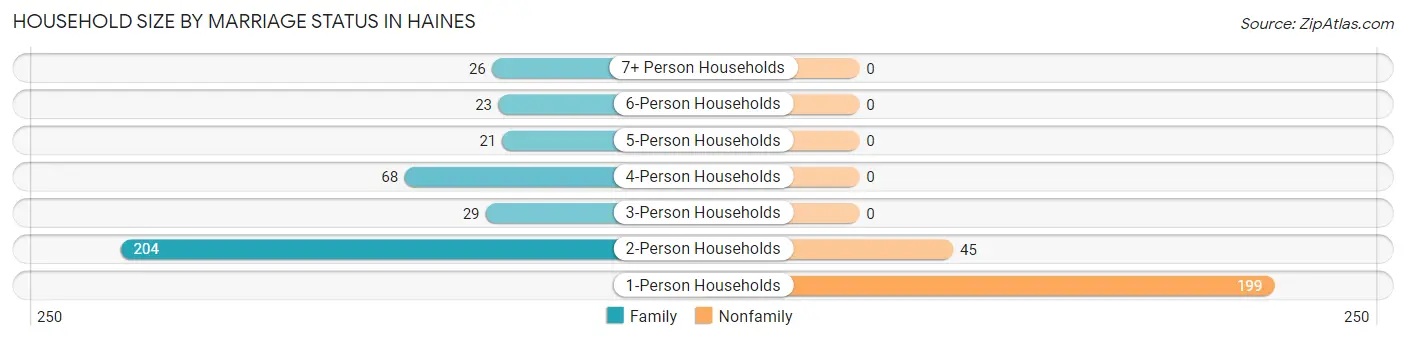
| Household Size | Family Households | Nonfamily Households |
| 1-Person Households | - | 199 (32.4%) |
| 2-Person Households | 204 (33.2%) | 45 (7.3%) |
| 3-Person Households | 29 (4.7%) | 0 (0.0%) |
| 4-Person Households | 68 (11.1%) | 0 (0.0%) |
| 5-Person Households | 21 (3.4%) | 0 (0.0%) |
| 6-Person Households | 23 (3.7%) | 0 (0.0%) |
| 7+ Person Households | 26 (4.2%) | 0 (0.0%) |
| Total | 371 (60.3%) | 244 (39.7%) |
Female Fertility in Haines
Fertility by Age in Haines
Average fertility rate in Haines is 19.0 births per 1,000 women. Women in the age bracket of 20 to 34 years have the highest fertility rate with 122.0 births per 1,000 women. Women in the age bracket of 20 to 34 years acount for 100.0% of all women with births.
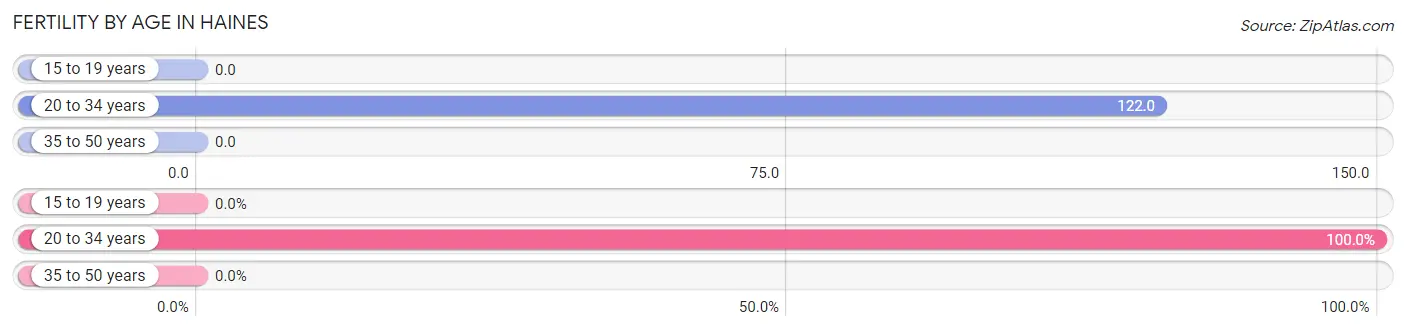
| Age Bracket | Women with Births | Births / 1,000 Women |
| 15 to 19 years | 0 (0.0%) | 0.0 |
| 20 to 34 years | 6 (100.0%) | 122.0 |
| 35 to 50 years | 0 (0.0%) | 0.0 |
| Total | 6 (100.0%) | 19.0 |
Fertility by Age by Marriage Status in Haines
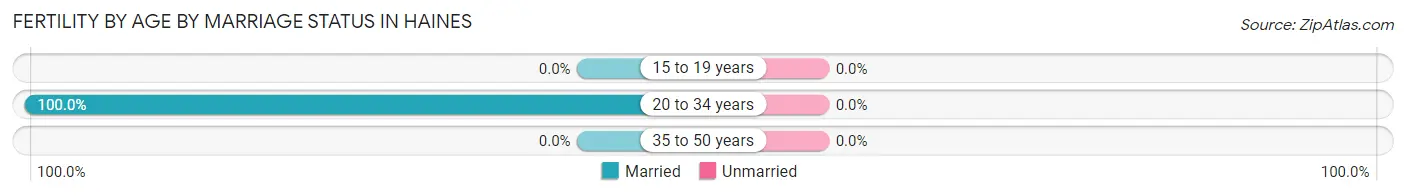
| Age Bracket | Married | Unmarried |
| 15 to 19 years | 0 (0.0%) | 0 (0.0%) |
| 20 to 34 years | 6 (100.0%) | 0 (0.0%) |
| 35 to 50 years | 0 (0.0%) | 0 (0.0%) |
| Total | 6 (100.0%) | 0 (0.0%) |
Fertility by Education in Haines
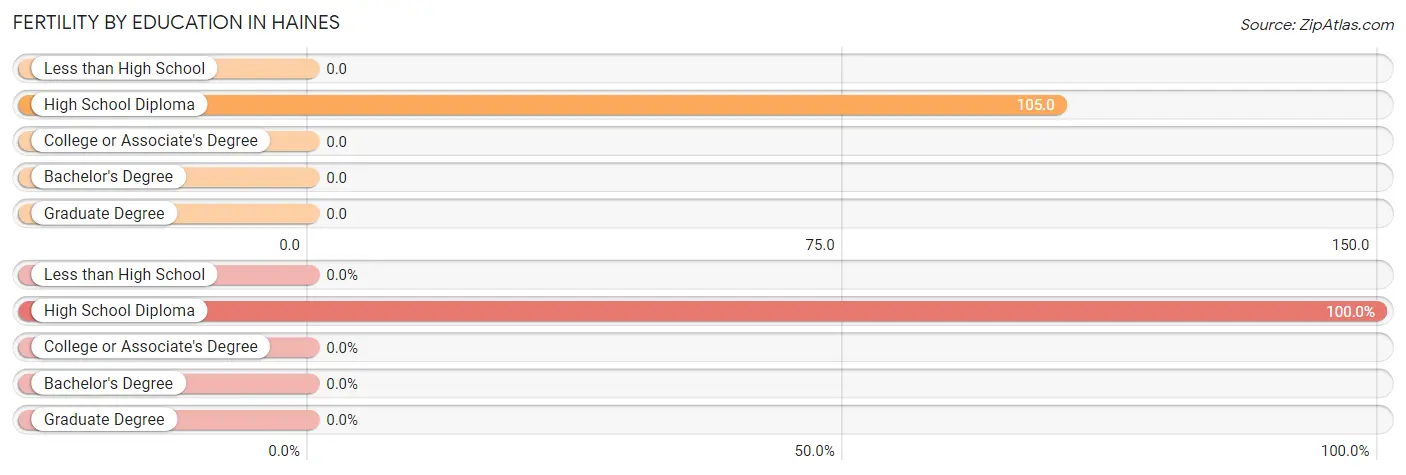
| Educational Attainment | Women with Births | Births / 1,000 Women |
| Less than High School | 0 (0.0%) | 0.0 |
| High School Diploma | 6 (100.0%) | 105.0 |
| College or Associate's Degree | 0 (0.0%) | 0.0 |
| Bachelor's Degree | 0 (0.0%) | 0.0 |
| Graduate Degree | 0 (0.0%) | 0.0 |
| Total | 6 (100.0%) | 19.0 |
Fertility by Education by Marriage Status in Haines
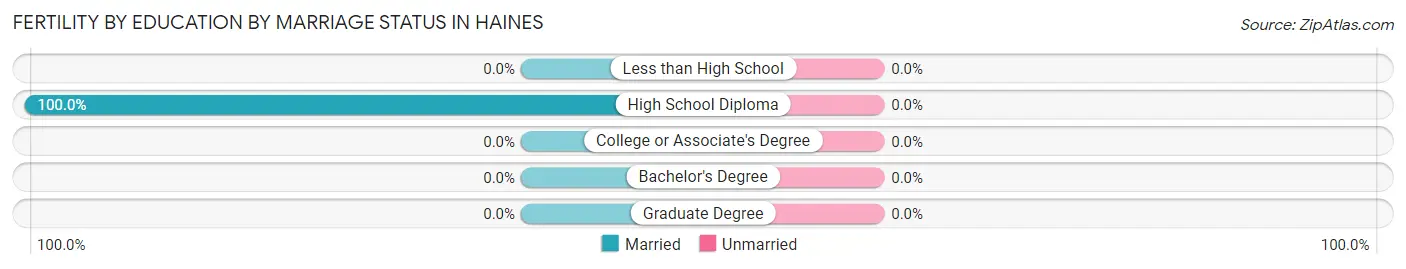
| Educational Attainment | Married | Unmarried |
| Less than High School | 0 (0.0%) | 0 (0.0%) |
| High School Diploma | 6 (100.0%) | 0 (0.0%) |
| College or Associate's Degree | 0 (0.0%) | 0 (0.0%) |
| Bachelor's Degree | 0 (0.0%) | 0 (0.0%) |
| Graduate Degree | 0 (0.0%) | 0 (0.0%) |
| Total | 6 (100.0%) | 0 (0.0%) |
Employment Characteristics in Haines
Employment by Class of Employer in Haines
Among the 614 employed individuals in Haines, private company employees (295 | 48.0%), local government employees (102 | 16.6%), and not-for-profit organizations (73 | 11.9%) make up the most common classes of employment.
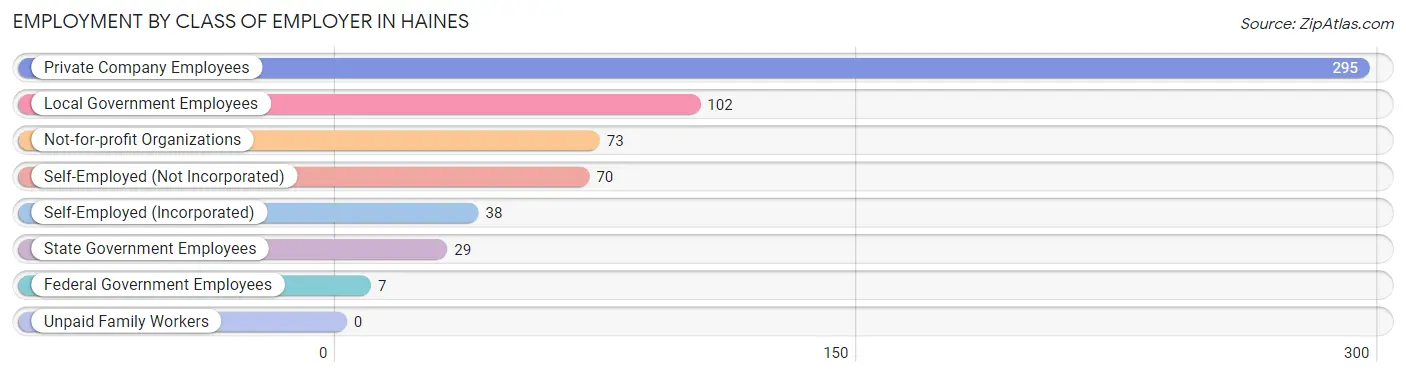
| Employer Class | # Employees | % Employees |
| Private Company Employees | 295 | 48.0% |
| Self-Employed (Incorporated) | 38 | 6.2% |
| Self-Employed (Not Incorporated) | 70 | 11.4% |
| Not-for-profit Organizations | 73 | 11.9% |
| Local Government Employees | 102 | 16.6% |
| State Government Employees | 29 | 4.7% |
| Federal Government Employees | 7 | 1.1% |
| Unpaid Family Workers | 0 | 0.0% |
| Total | 614 | 100.0% |
Employment Status by Age in Haines
According to the labor force statistics for Haines, out of the total population over 16 years of age (1,209), 55.0% or 665 individuals are in the labor force, with 5.4% or 36 of them unemployed. The age group with the highest labor force participation rate is 20 to 24 years, with 96.4% or 27 individuals in the labor force. Within the labor force, the 60 to 64 years age range has the highest percentage of unemployed individuals, with 23.7% or 18 of them being unemployed.
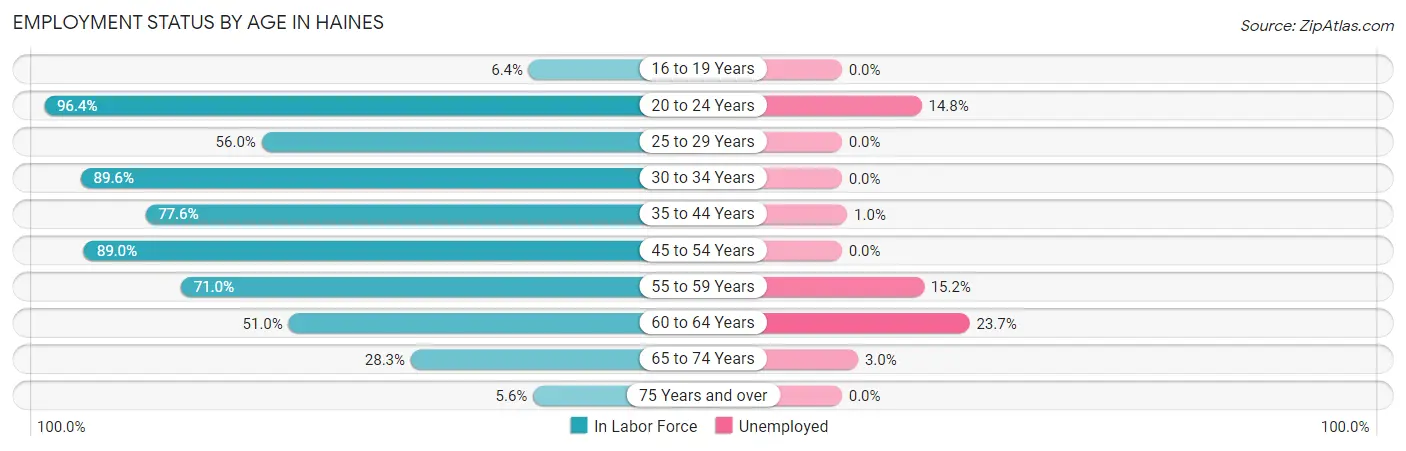
| Age Bracket | In Labor Force | Unemployed |
| 16 to 19 Years | 5 (6.4%) | 0 (0.0%) |
| 20 to 24 Years | 27 (96.4%) | 4 (14.8%) |
| 25 to 29 Years | 28 (56.0%) | 0 (0.0%) |
| 30 to 34 Years | 43 (89.6%) | 0 (0.0%) |
| 35 to 44 Years | 194 (77.6%) | 2 (1.0%) |
| 45 to 54 Years | 154 (89.0%) | 0 (0.0%) |
| 55 to 59 Years | 66 (71.0%) | 10 (15.2%) |
| 60 to 64 Years | 76 (51.0%) | 18 (23.7%) |
| 65 to 74 Years | 66 (28.3%) | 2 (3.0%) |
| 75 Years and over | 6 (5.6%) | 0 (0.0%) |
| Total | 665 (55.0%) | 36 (5.4%) |
Employment Status by Educational Attainment in Haines
According to labor force statistics for Haines, 73.5% of individuals (561) out of the total population between 25 and 64 years of age (763) are in the labor force, with 5.3% or 30 of them being unemployed. The group with the highest labor force participation rate are those with the educational attainment of less than high school, with 83.3% or 10 individuals in the labor force. Within the labor force, individuals with high school diploma education have the highest percentage of unemployment, with 9.8% or 18 of them being unemployed.
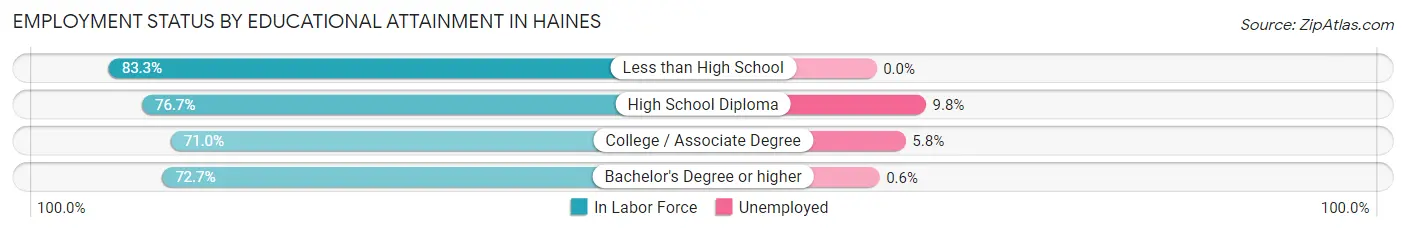
| Educational Attainment | In Labor Force | Unemployed |
| Less than High School | 10 (83.3%) | 0 (0.0%) |
| High School Diploma | 184 (76.7%) | 24 (9.8%) |
| College / Associate Degree | 191 (71.0%) | 16 (5.8%) |
| Bachelor's Degree or higher | 176 (72.7%) | 1 (0.6%) |
| Total | 561 (73.5%) | 40 (5.3%) |
Employment Occupations by Sex in Haines
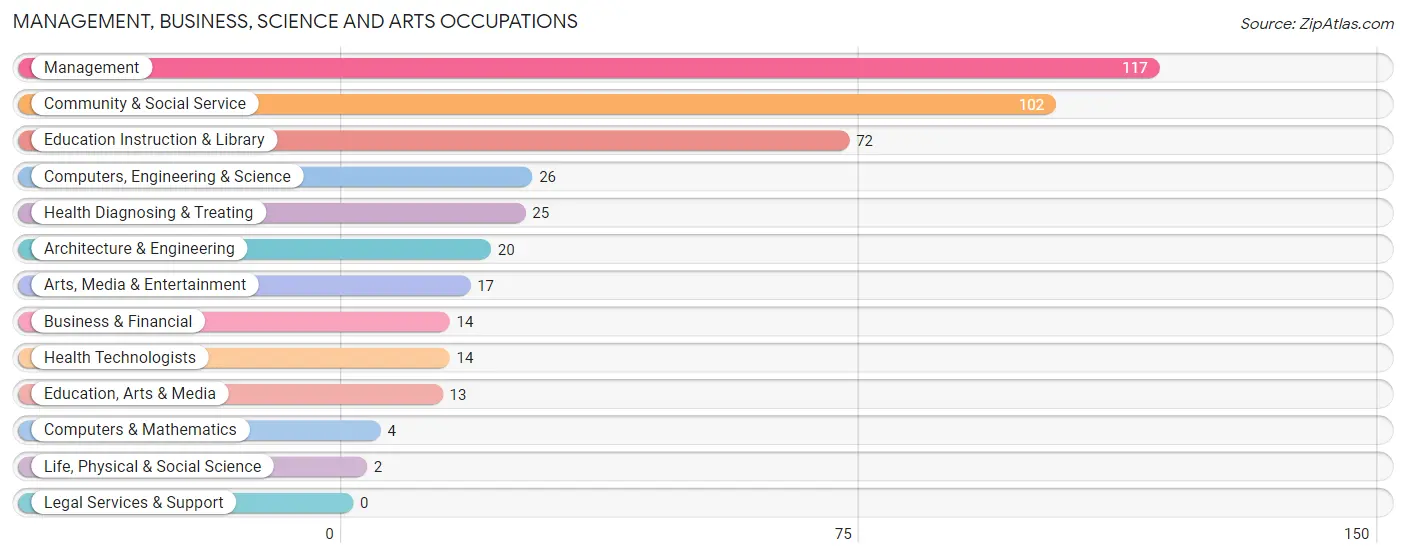
Management, Business, Science and Arts Occupations
The most common Management, Business, Science and Arts occupations in Haines are Management (117 | 18.6%), Community & Social Service (102 | 16.2%), Education Instruction & Library (72 | 11.5%), Computers, Engineering & Science (26 | 4.1%), and Health Diagnosing & Treating (25 | 4.0%).
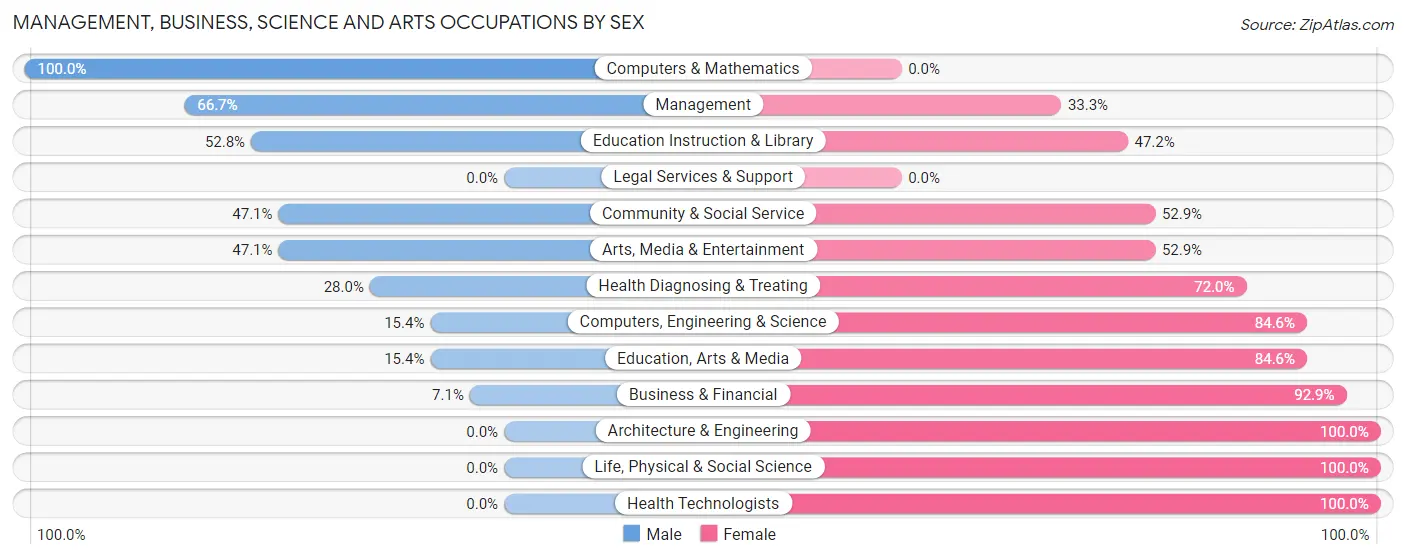
Management, Business, Science and Arts Occupations by Sex
Within the Management, Business, Science and Arts occupations in Haines, the most male-oriented occupations are Computers & Mathematics (100.0%), Management (66.7%), and Education Instruction & Library (52.8%), while the most female-oriented occupations are Architecture & Engineering (100.0%), Life, Physical & Social Science (100.0%), and Health Technologists (100.0%).
| Occupation | Male | Female |
| Management | 78 (66.7%) | 39 (33.3%) |
| Business & Financial | 1 (7.1%) | 13 (92.9%) |
| Computers, Engineering & Science | 4 (15.4%) | 22 (84.6%) |
| Computers & Mathematics | 4 (100.0%) | 0 (0.0%) |
| Architecture & Engineering | 0 (0.0%) | 20 (100.0%) |
| Life, Physical & Social Science | 0 (0.0%) | 2 (100.0%) |
| Community & Social Service | 48 (47.1%) | 54 (52.9%) |
| Education, Arts & Media | 2 (15.4%) | 11 (84.6%) |
| Legal Services & Support | 0 (0.0%) | 0 (0.0%) |
| Education Instruction & Library | 38 (52.8%) | 34 (47.2%) |
| Arts, Media & Entertainment | 8 (47.1%) | 9 (52.9%) |
| Health Diagnosing & Treating | 7 (28.0%) | 18 (72.0%) |
| Health Technologists | 0 (0.0%) | 14 (100.0%) |
| Total (Category) | 138 (48.6%) | 146 (51.4%) |
| Total (Overall) | 347 (55.2%) | 282 (44.8%) |
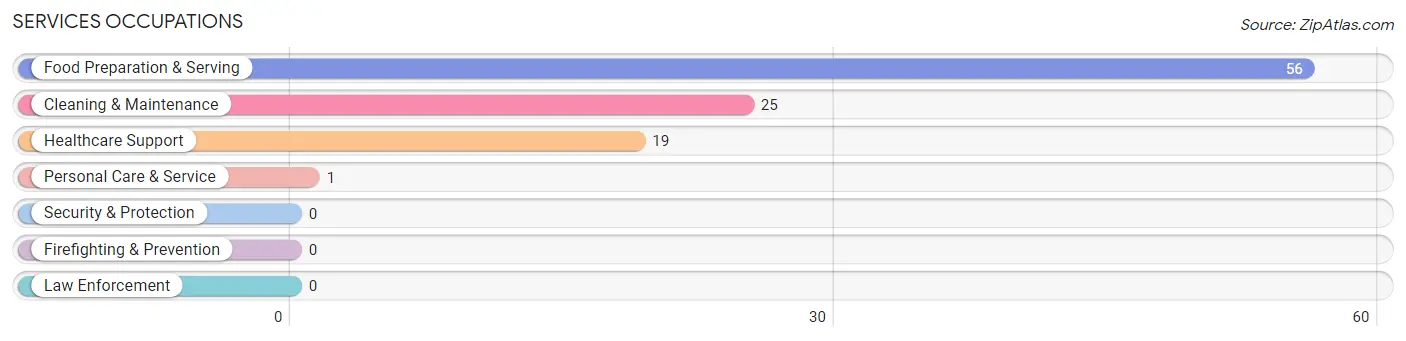
Services Occupations
The most common Services occupations in Haines are Food Preparation & Serving (56 | 8.9%), Cleaning & Maintenance (25 | 4.0%), Healthcare Support (19 | 3.0%), and Personal Care & Service (1 | 0.2%).
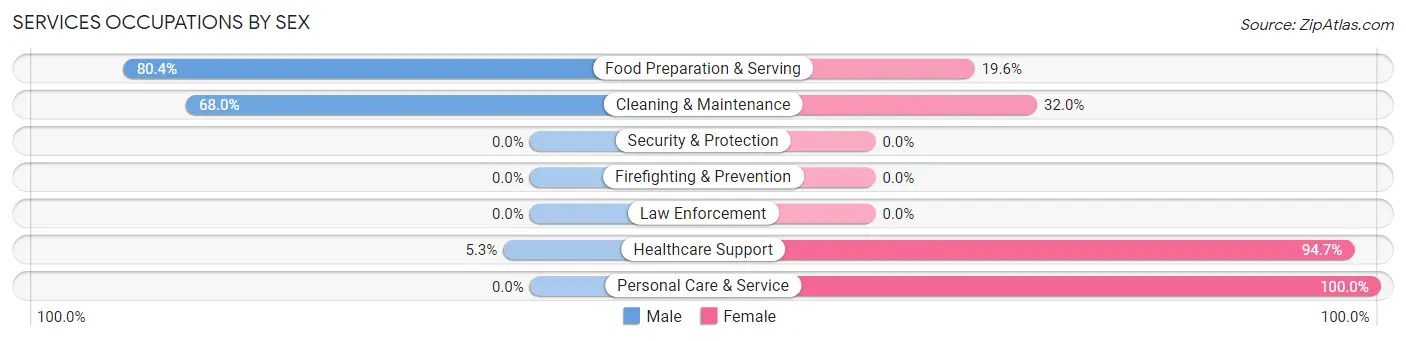
Services Occupations by Sex
Within the Services occupations in Haines, the most male-oriented occupations are Food Preparation & Serving (80.4%), Cleaning & Maintenance (68.0%), and Healthcare Support (5.3%), while the most female-oriented occupations are Personal Care & Service (100.0%), Healthcare Support (94.7%), and Cleaning & Maintenance (32.0%).
| Occupation | Male | Female |
| Healthcare Support | 1 (5.3%) | 18 (94.7%) |
| Security & Protection | 0 (0.0%) | 0 (0.0%) |
| Firefighting & Prevention | 0 (0.0%) | 0 (0.0%) |
| Law Enforcement | 0 (0.0%) | 0 (0.0%) |
| Food Preparation & Serving | 45 (80.4%) | 11 (19.6%) |
| Cleaning & Maintenance | 17 (68.0%) | 8 (32.0%) |
| Personal Care & Service | 0 (0.0%) | 1 (100.0%) |
| Total (Category) | 63 (62.4%) | 38 (37.6%) |
| Total (Overall) | 347 (55.2%) | 282 (44.8%) |
Sales and Office Occupations
The most common Sales and Office occupations in Haines are Sales & Related (72 | 11.5%), and Office & Administration (50 | 8.0%).
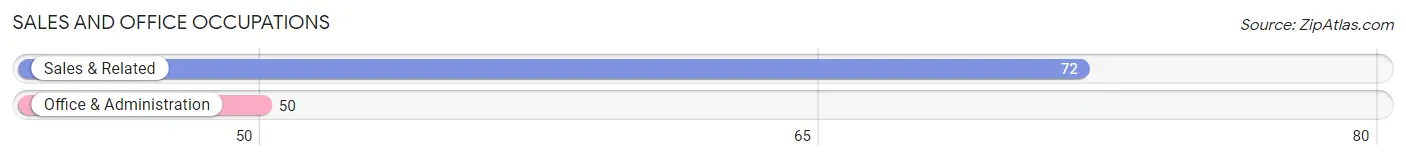
Sales and Office Occupations by Sex
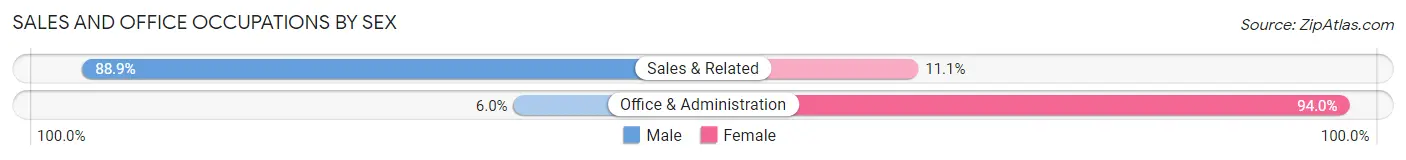
| Occupation | Male | Female |
| Sales & Related | 64 (88.9%) | 8 (11.1%) |
| Office & Administration | 3 (6.0%) | 47 (94.0%) |
| Total (Category) | 67 (54.9%) | 55 (45.1%) |
| Total (Overall) | 347 (55.2%) | 282 (44.8%) |
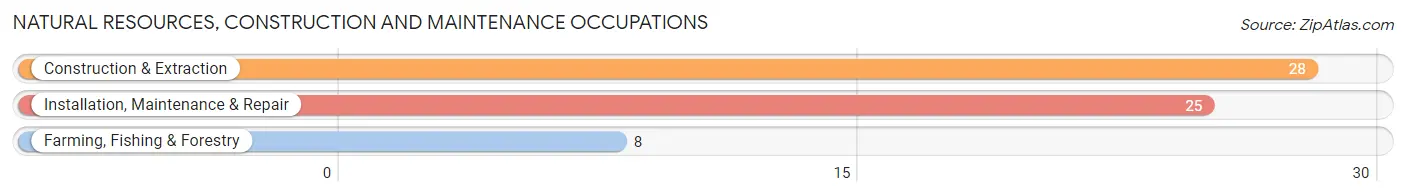
Natural Resources, Construction and Maintenance Occupations
The most common Natural Resources, Construction and Maintenance occupations in Haines are Construction & Extraction (28 | 4.4%), Installation, Maintenance & Repair (25 | 4.0%), and Farming, Fishing & Forestry (8 | 1.3%).
Natural Resources, Construction and Maintenance Occupations by Sex
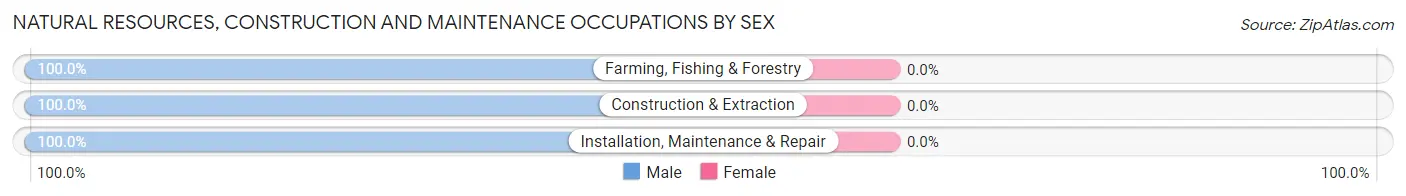
| Occupation | Male | Female |
| Farming, Fishing & Forestry | 8 (100.0%) | 0 (0.0%) |
| Construction & Extraction | 28 (100.0%) | 0 (0.0%) |
| Installation, Maintenance & Repair | 25 (100.0%) | 0 (0.0%) |
| Total (Category) | 61 (100.0%) | 0 (0.0%) |
| Total (Overall) | 347 (55.2%) | 282 (44.8%) |
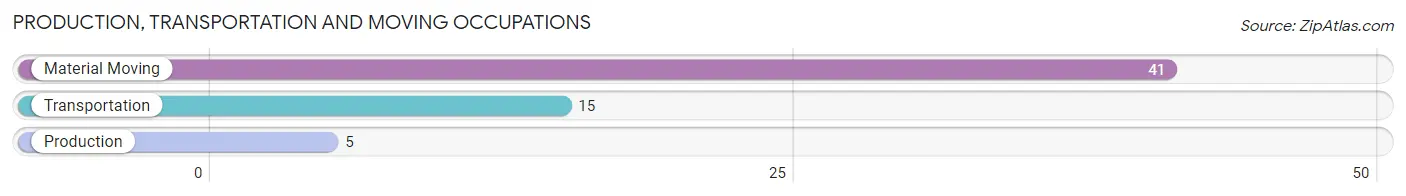
Production, Transportation and Moving Occupations
The most common Production, Transportation and Moving occupations in Haines are Material Moving (41 | 6.5%), Transportation (15 | 2.4%), and Production (5 | 0.8%).
Production, Transportation and Moving Occupations by Sex
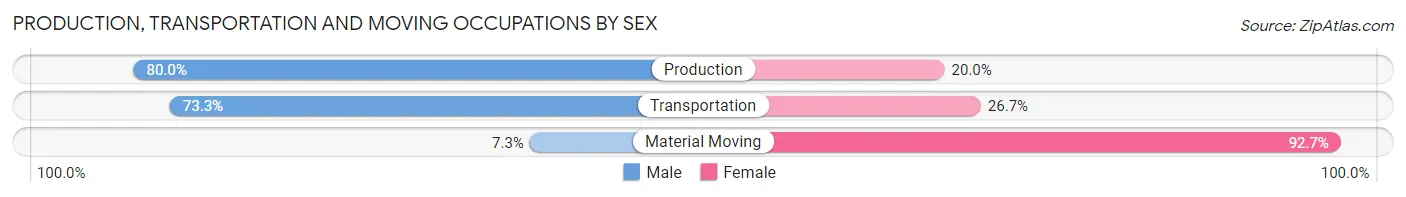
| Occupation | Male | Female |
| Production | 4 (80.0%) | 1 (20.0%) |
| Transportation | 11 (73.3%) | 4 (26.7%) |
| Material Moving | 3 (7.3%) | 38 (92.7%) |
| Total (Category) | 18 (29.5%) | 43 (70.5%) |
| Total (Overall) | 347 (55.2%) | 282 (44.8%) |
Employment Industries by Sex in Haines
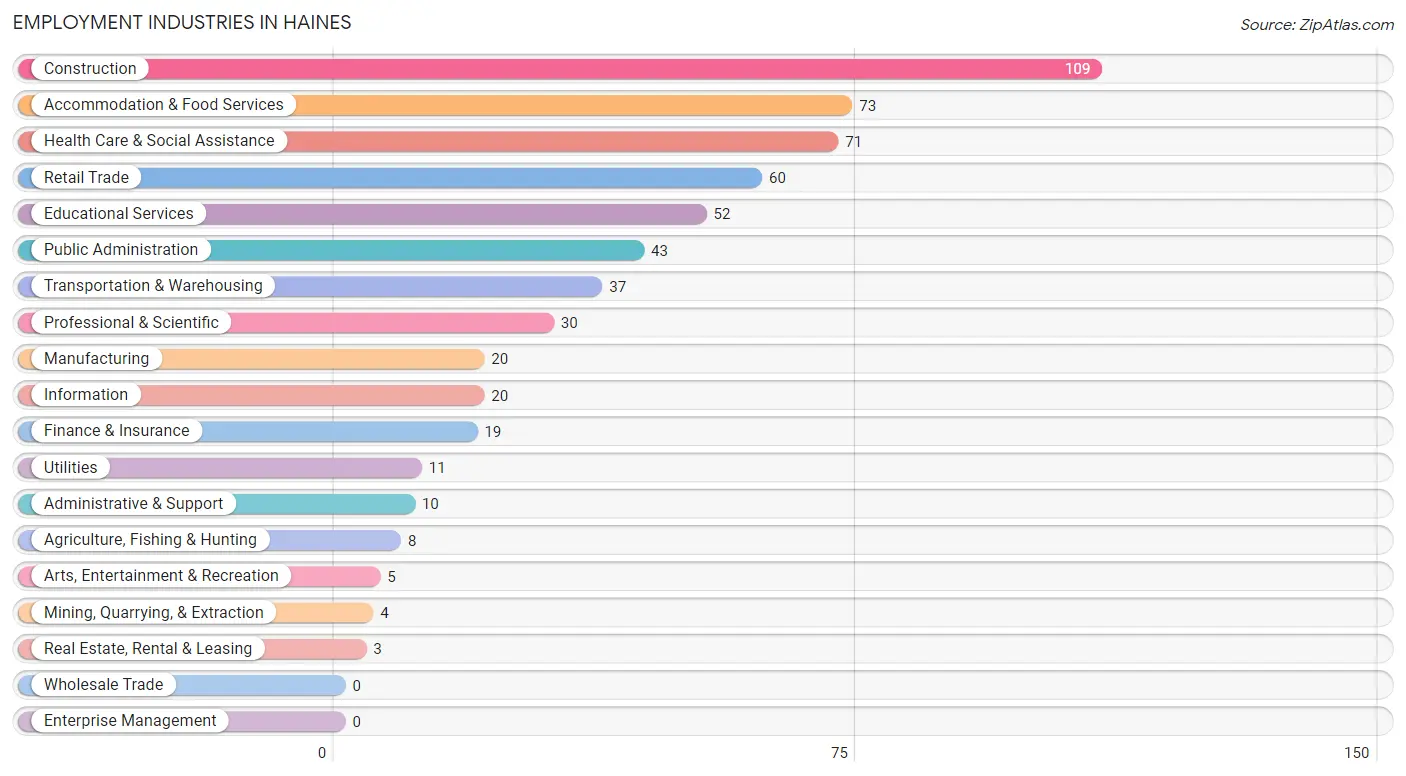
Employment Industries in Haines
The major employment industries in Haines include Construction (109 | 17.3%), Accommodation & Food Services (73 | 11.6%), Health Care & Social Assistance (71 | 11.3%), Retail Trade (60 | 9.5%), and Educational Services (52 | 8.3%).
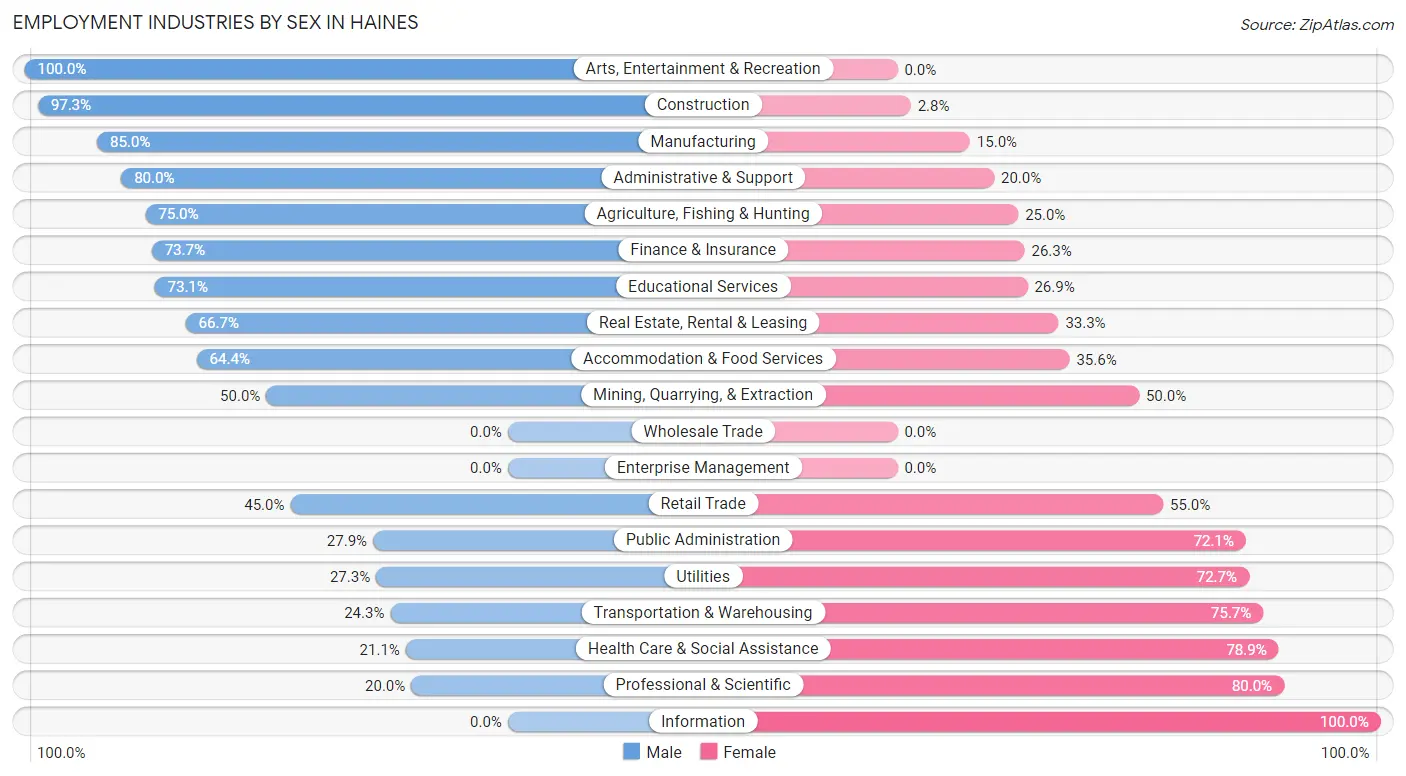
Employment Industries by Sex in Haines
The Haines industries that see more men than women are Arts, Entertainment & Recreation (100.0%), Construction (97.3%), and Manufacturing (85.0%), whereas the industries that tend to have a higher number of women are Information (100.0%), Professional & Scientific (80.0%), and Health Care & Social Assistance (78.9%).
| Industry | Male | Female |
| Agriculture, Fishing & Hunting | 6 (75.0%) | 2 (25.0%) |
| Mining, Quarrying, & Extraction | 2 (50.0%) | 2 (50.0%) |
| Construction | 106 (97.3%) | 3 (2.8%) |
| Manufacturing | 17 (85.0%) | 3 (15.0%) |
| Wholesale Trade | 0 (0.0%) | 0 (0.0%) |
| Retail Trade | 27 (45.0%) | 33 (55.0%) |
| Transportation & Warehousing | 9 (24.3%) | 28 (75.7%) |
| Utilities | 3 (27.3%) | 8 (72.7%) |
| Information | 0 (0.0%) | 20 (100.0%) |
| Finance & Insurance | 14 (73.7%) | 5 (26.3%) |
| Real Estate, Rental & Leasing | 2 (66.7%) | 1 (33.3%) |
| Professional & Scientific | 6 (20.0%) | 24 (80.0%) |
| Enterprise Management | 0 (0.0%) | 0 (0.0%) |
| Administrative & Support | 8 (80.0%) | 2 (20.0%) |
| Educational Services | 38 (73.1%) | 14 (26.9%) |
| Health Care & Social Assistance | 15 (21.1%) | 56 (78.9%) |
| Arts, Entertainment & Recreation | 5 (100.0%) | 0 (0.0%) |
| Accommodation & Food Services | 47 (64.4%) | 26 (35.6%) |
| Public Administration | 12 (27.9%) | 31 (72.1%) |
| Total | 347 (55.2%) | 282 (44.8%) |
Education in Haines
School Enrollment in Haines
The most common levels of schooling among the 570 students in Haines are high school (211 | 37.0%), middle school (193 | 33.9%), and elementary school (92 | 16.1%).
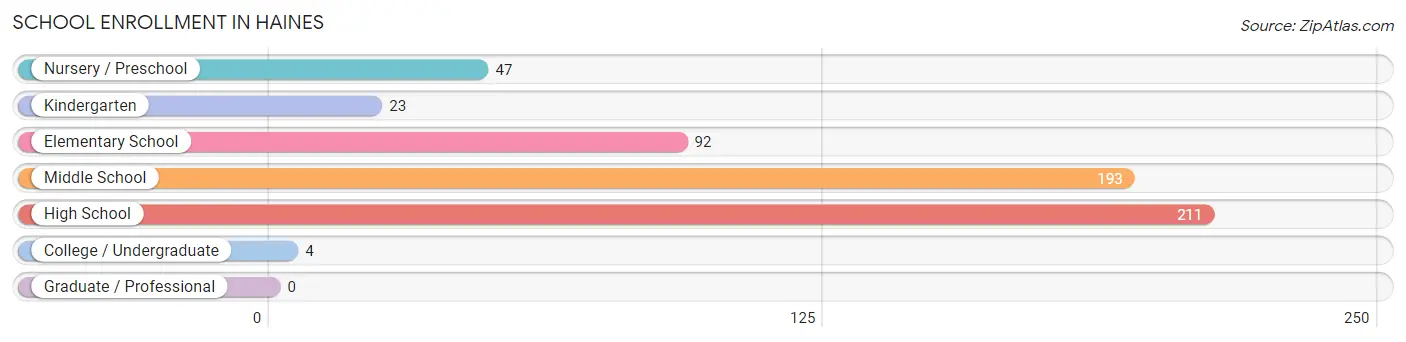
| School Level | # Students | % Students |
| Nursery / Preschool | 47 | 8.3% |
| Kindergarten | 23 | 4.0% |
| Elementary School | 92 | 16.1% |
| Middle School | 193 | 33.9% |
| High School | 211 | 37.0% |
| College / Undergraduate | 4 | 0.7% |
| Graduate / Professional | 0 | 0.0% |
| Total | 570 | 100.0% |
School Enrollment by Age by Funding Source in Haines
Out of a total of 570 students who are enrolled in schools in Haines, 31 (5.4%) attend a private institution, while the remaining 539 (94.6%) are enrolled in public schools. The age group of 3 to 4 year olds has the highest likelihood of being enrolled in private schools, with 14 (82.4% in the age bracket) enrolled. Conversely, the age group of 35 years and over has the lowest likelihood of being enrolled in a private school, with 4 (100.0% in the age bracket) attending a public institution.
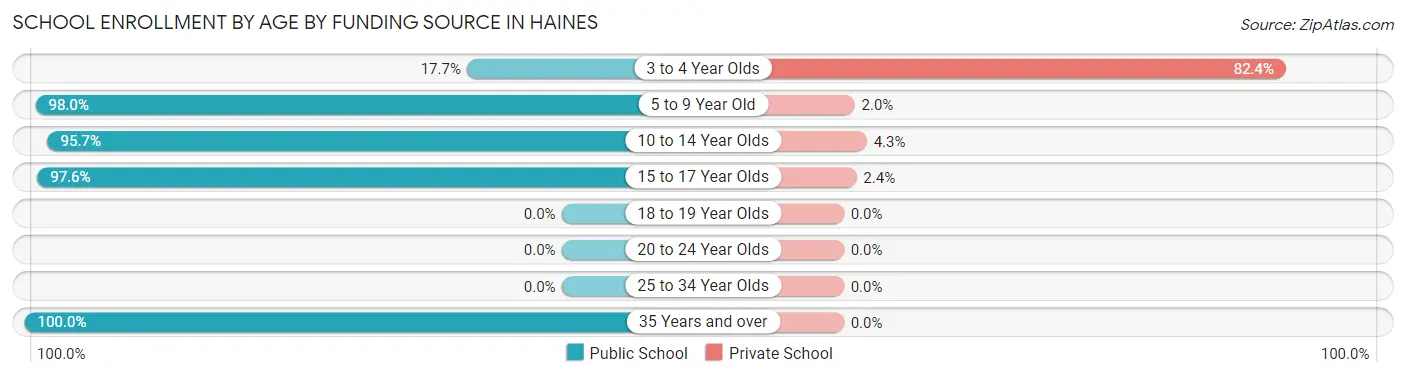
| Age Bracket | Public School | Private School |
| 3 to 4 Year Olds | 3 (17.6%) | 14 (82.4%) |
| 5 to 9 Year Old | 144 (98.0%) | 3 (2.0%) |
| 10 to 14 Year Olds | 223 (95.7%) | 10 (4.3%) |
| 15 to 17 Year Olds | 165 (97.6%) | 4 (2.4%) |
| 18 to 19 Year Olds | 0 (0.0%) | 0 (0.0%) |
| 20 to 24 Year Olds | 0 (0.0%) | 0 (0.0%) |
| 25 to 34 Year Olds | 0 (0.0%) | 0 (0.0%) |
| 35 Years and over | 4 (100.0%) | 0 (0.0%) |
| Total | 539 (94.6%) | 31 (5.4%) |
Educational Attainment by Field of Study in Haines
Social sciences (107 | 28.6%), science & technology (72 | 19.3%), education (48 | 12.8%), psychology (26 | 7.0%), and business (26 | 7.0%) are the most common fields of study among 374 individuals in Haines who have obtained a bachelor's degree or higher.
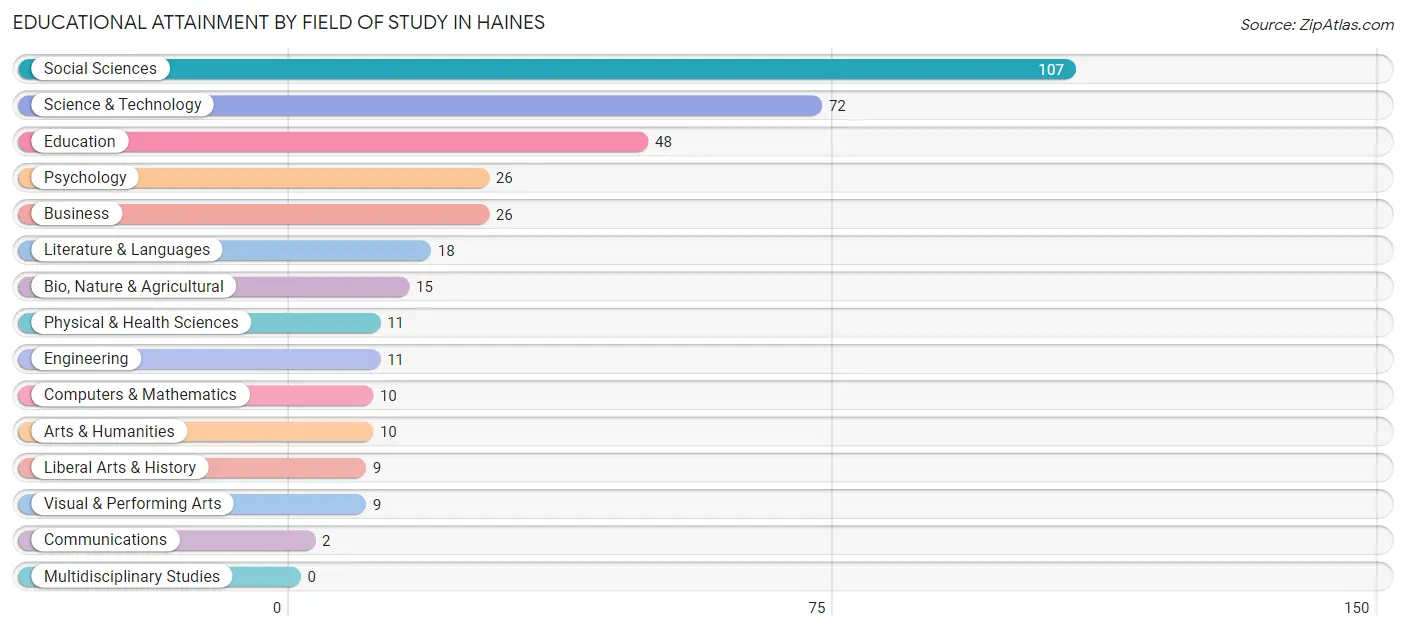
| Field of Study | # Graduates | % Graduates |
| Computers & Mathematics | 10 | 2.7% |
| Bio, Nature & Agricultural | 15 | 4.0% |
| Physical & Health Sciences | 11 | 2.9% |
| Psychology | 26 | 7.0% |
| Social Sciences | 107 | 28.6% |
| Engineering | 11 | 2.9% |
| Multidisciplinary Studies | 0 | 0.0% |
| Science & Technology | 72 | 19.3% |
| Business | 26 | 7.0% |
| Education | 48 | 12.8% |
| Literature & Languages | 18 | 4.8% |
| Liberal Arts & History | 9 | 2.4% |
| Visual & Performing Arts | 9 | 2.4% |
| Communications | 2 | 0.5% |
| Arts & Humanities | 10 | 2.7% |
| Total | 374 | 100.0% |
Transportation & Commute in Haines
Vehicle Availability by Sex in Haines
The most prevalent vehicle ownership categories in Haines are males with 1 vehicle (95, accounting for 27.9%) and females with 1 vehicle (61, making up 34.9%).
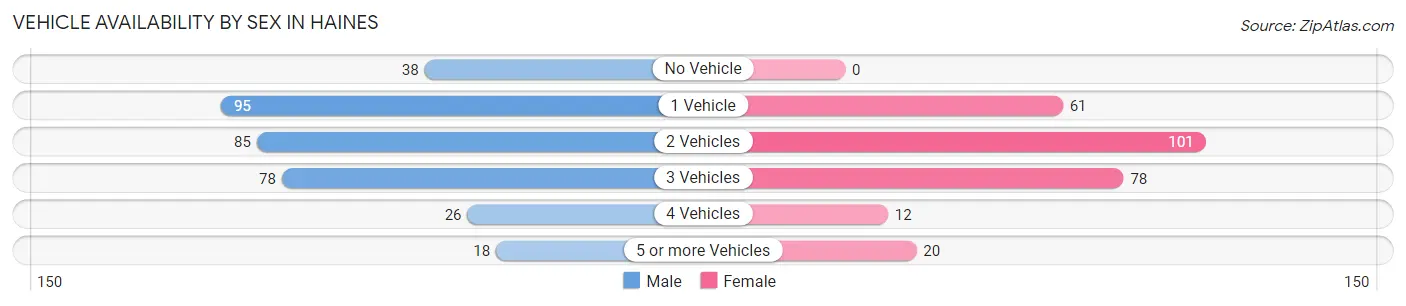
| Vehicles Available | Male | Female |
| No Vehicle | 38 (11.2%) | 0 (0.0%) |
| 1 Vehicle | 95 (27.9%) | 61 (22.4%) |
| 2 Vehicles | 85 (25.0%) | 101 (37.1%) |
| 3 Vehicles | 78 (22.9%) | 78 (28.7%) |
| 4 Vehicles | 26 (7.6%) | 12 (4.4%) |
| 5 or more Vehicles | 18 (5.3%) | 20 (7.3%) |
| Total | 340 (100.0%) | 272 (100.0%) |
Commute Time in Haines
The most frequently occuring commute durations in Haines are 5 to 9 minutes (236 commuters, 42.4%), less than 5 minutes (157 commuters, 28.2%), and 10 to 14 minutes (52 commuters, 9.3%).
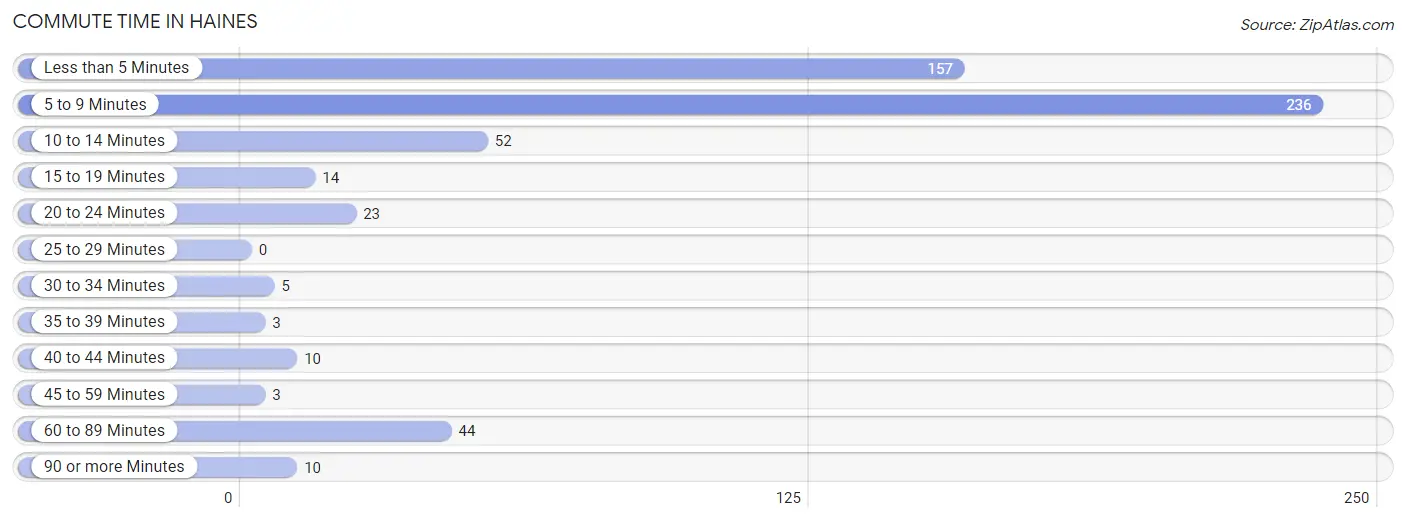
| Commute Time | # Commuters | % Commuters |
| Less than 5 Minutes | 157 | 28.2% |
| 5 to 9 Minutes | 236 | 42.4% |
| 10 to 14 Minutes | 52 | 9.3% |
| 15 to 19 Minutes | 14 | 2.5% |
| 20 to 24 Minutes | 23 | 4.1% |
| 25 to 29 Minutes | 0 | 0.0% |
| 30 to 34 Minutes | 5 | 0.9% |
| 35 to 39 Minutes | 3 | 0.5% |
| 40 to 44 Minutes | 10 | 1.8% |
| 45 to 59 Minutes | 3 | 0.5% |
| 60 to 89 Minutes | 44 | 7.9% |
| 90 or more Minutes | 10 | 1.8% |
Commute Time by Sex in Haines
The most common commute times in Haines are 5 to 9 minutes (129 commuters, 41.9%) for males and 5 to 9 minutes (107 commuters, 43.0%) for females.
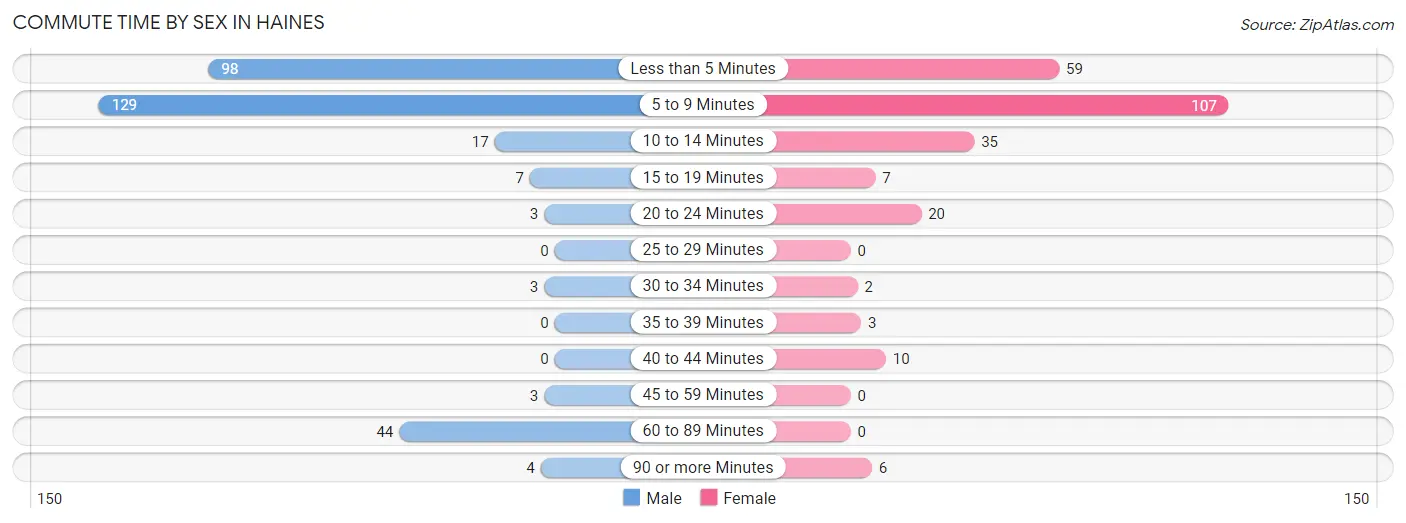
| Commute Time | Male | Female |
| Less than 5 Minutes | 98 (31.8%) | 59 (23.7%) |
| 5 to 9 Minutes | 129 (41.9%) | 107 (43.0%) |
| 10 to 14 Minutes | 17 (5.5%) | 35 (14.1%) |
| 15 to 19 Minutes | 7 (2.3%) | 7 (2.8%) |
| 20 to 24 Minutes | 3 (1.0%) | 20 (8.0%) |
| 25 to 29 Minutes | 0 (0.0%) | 0 (0.0%) |
| 30 to 34 Minutes | 3 (1.0%) | 2 (0.8%) |
| 35 to 39 Minutes | 0 (0.0%) | 3 (1.2%) |
| 40 to 44 Minutes | 0 (0.0%) | 10 (4.0%) |
| 45 to 59 Minutes | 3 (1.0%) | 0 (0.0%) |
| 60 to 89 Minutes | 44 (14.3%) | 0 (0.0%) |
| 90 or more Minutes | 4 (1.3%) | 6 (2.4%) |
Time of Departure to Work by Sex in Haines
The most frequent times of departure to work in Haines are 8:00 AM to 8:29 AM (81, 26.3%) for males and 8:00 AM to 8:29 AM (63, 25.3%) for females.
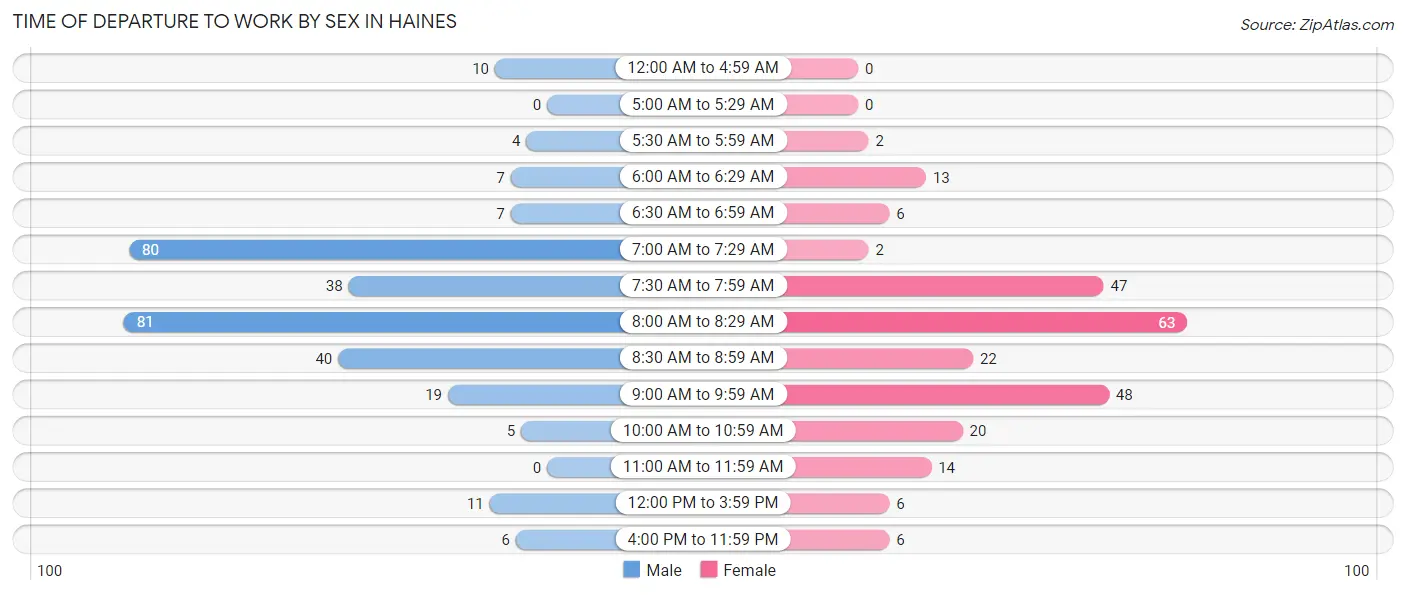
| Time of Departure | Male | Female |
| 12:00 AM to 4:59 AM | 10 (3.3%) | 0 (0.0%) |
| 5:00 AM to 5:29 AM | 0 (0.0%) | 0 (0.0%) |
| 5:30 AM to 5:59 AM | 4 (1.3%) | 2 (0.8%) |
| 6:00 AM to 6:29 AM | 7 (2.3%) | 13 (5.2%) |
| 6:30 AM to 6:59 AM | 7 (2.3%) | 6 (2.4%) |
| 7:00 AM to 7:29 AM | 80 (26.0%) | 2 (0.8%) |
| 7:30 AM to 7:59 AM | 38 (12.3%) | 47 (18.9%) |
| 8:00 AM to 8:29 AM | 81 (26.3%) | 63 (25.3%) |
| 8:30 AM to 8:59 AM | 40 (13.0%) | 22 (8.8%) |
| 9:00 AM to 9:59 AM | 19 (6.2%) | 48 (19.3%) |
| 10:00 AM to 10:59 AM | 5 (1.6%) | 20 (8.0%) |
| 11:00 AM to 11:59 AM | 0 (0.0%) | 14 (5.6%) |
| 12:00 PM to 3:59 PM | 11 (3.6%) | 6 (2.4%) |
| 4:00 PM to 11:59 PM | 6 (1.9%) | 6 (2.4%) |
| Total | 308 (100.0%) | 249 (100.0%) |
Housing Occupancy in Haines
Occupancy by Ownership in Haines
Of the total 615 dwellings in Haines, owner-occupied units account for 408 (66.3%), while renter-occupied units make up 207 (33.7%).
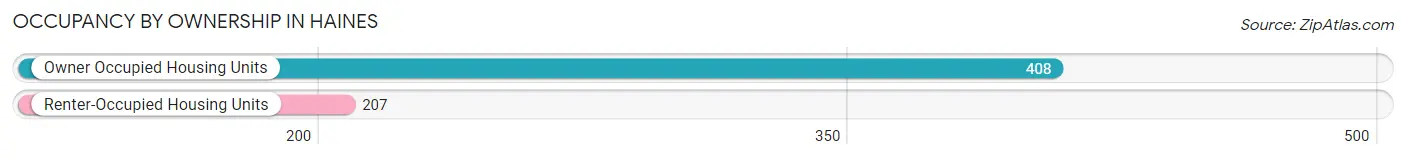
| Occupancy | # Housing Units | % Housing Units |
| Owner Occupied Housing Units | 408 | 66.3% |
| Renter-Occupied Housing Units | 207 | 33.7% |
| Total Occupied Housing Units | 615 | 100.0% |
Occupancy by Household Size in Haines
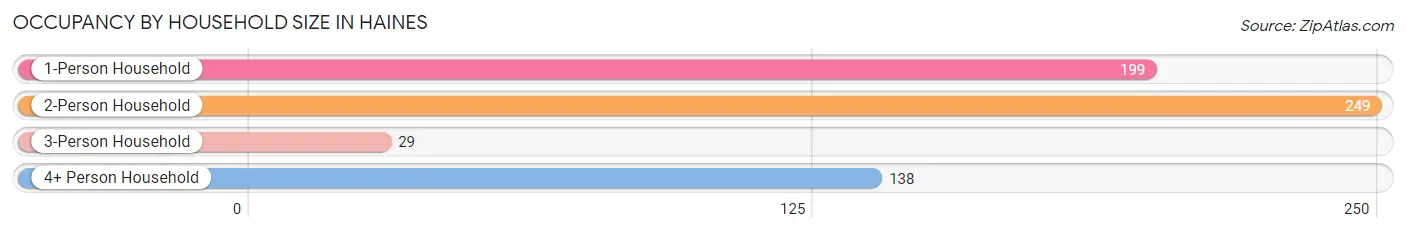
| Household Size | # Housing Units | % Housing Units |
| 1-Person Household | 199 | 32.4% |
| 2-Person Household | 249 | 40.5% |
| 3-Person Household | 29 | 4.7% |
| 4+ Person Household | 138 | 22.4% |
| Total Housing Units | 615 | 100.0% |
Occupancy by Ownership by Household Size in Haines
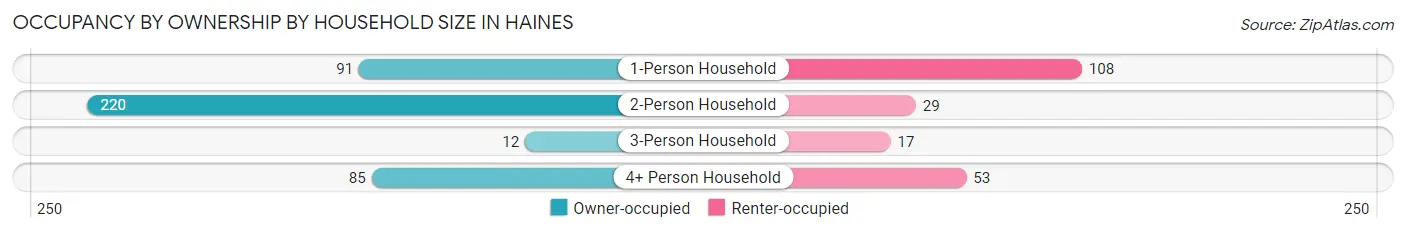
| Household Size | Owner-occupied | Renter-occupied |
| 1-Person Household | 91 (45.7%) | 108 (54.3%) |
| 2-Person Household | 220 (88.3%) | 29 (11.7%) |
| 3-Person Household | 12 (41.4%) | 17 (58.6%) |
| 4+ Person Household | 85 (61.6%) | 53 (38.4%) |
| Total Housing Units | 408 (66.3%) | 207 (33.7%) |
Occupancy by Educational Attainment in Haines
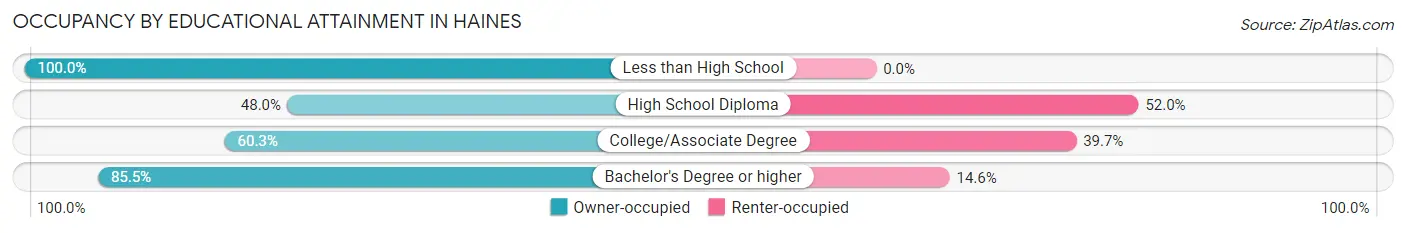
| Household Size | Owner-occupied | Renter-occupied |
| Less than High School | 16 (100.0%) | 0 (0.0%) |
| High School Diploma | 96 (48.0%) | 104 (52.0%) |
| College/Associate Degree | 108 (60.3%) | 71 (39.7%) |
| Bachelor's Degree or higher | 188 (85.5%) | 32 (14.5%) |
Occupancy by Age of Householder in Haines
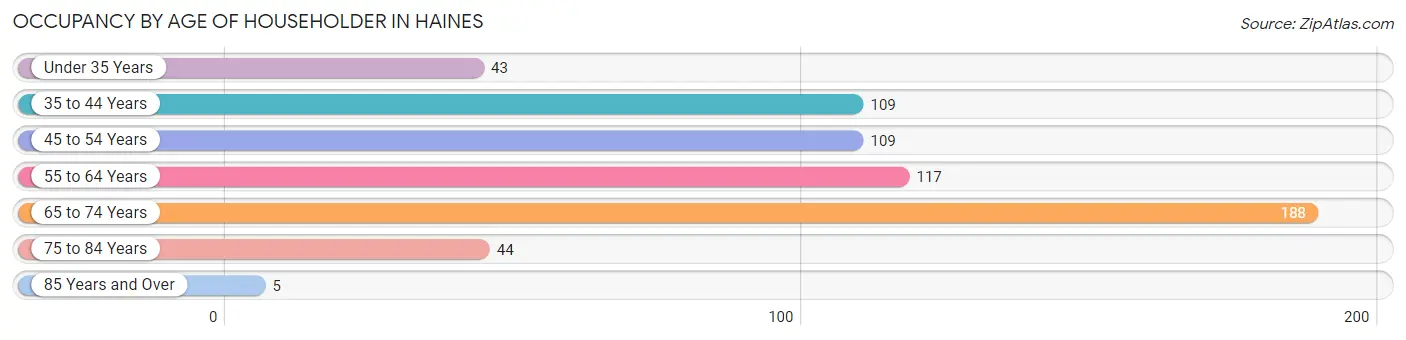
| Age Bracket | # Households | % Households |
| Under 35 Years | 43 | 7.0% |
| 35 to 44 Years | 109 | 17.7% |
| 45 to 54 Years | 109 | 17.7% |
| 55 to 64 Years | 117 | 19.0% |
| 65 to 74 Years | 188 | 30.6% |
| 75 to 84 Years | 44 | 7.1% |
| 85 Years and Over | 5 | 0.8% |
| Total | 615 | 100.0% |
Housing Finances in Haines
Median Income by Occupancy in Haines
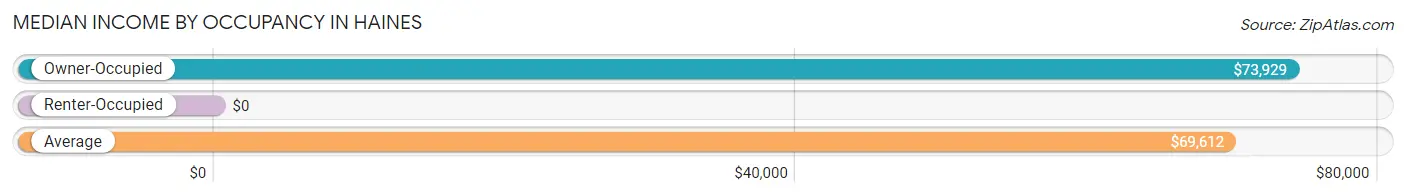
| Occupancy Type | # Households | Median Income |
| Owner-Occupied | 408 (66.3%) | $73,929 |
| Renter-Occupied | 207 (33.7%) | $0 |
| Average | 615 (100.0%) | $69,612 |
Occupancy by Householder Income Bracket in Haines
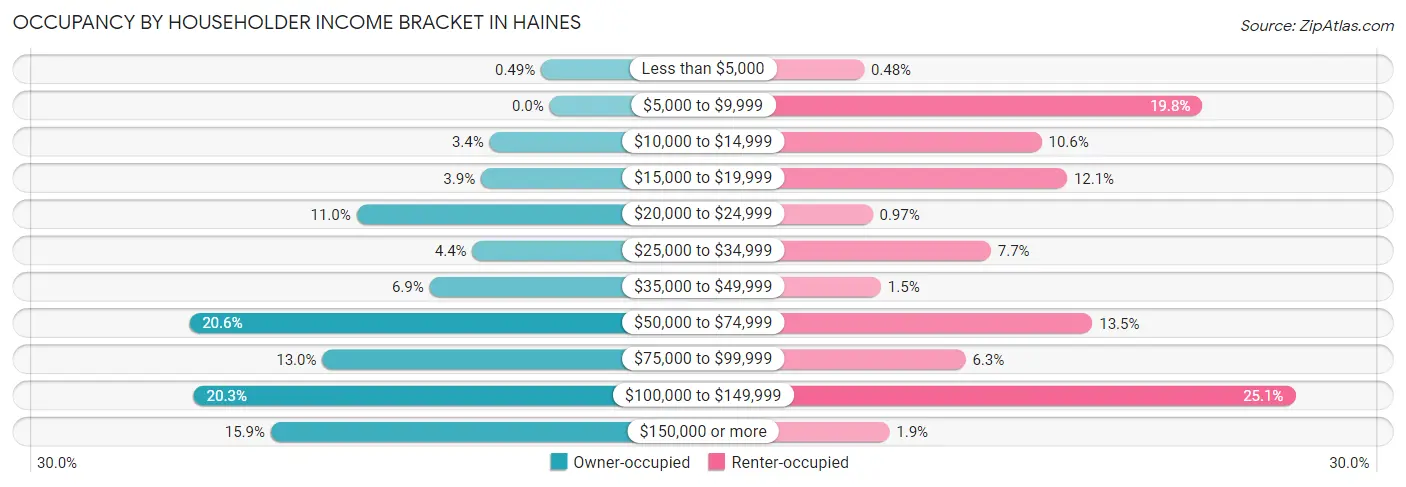
| Income Bracket | Owner-occupied | Renter-occupied |
| Less than $5,000 | 2 (0.5%) | 1 (0.5%) |
| $5,000 to $9,999 | 0 (0.0%) | 41 (19.8%) |
| $10,000 to $14,999 | 14 (3.4%) | 22 (10.6%) |
| $15,000 to $19,999 | 16 (3.9%) | 25 (12.1%) |
| $20,000 to $24,999 | 45 (11.0%) | 2 (1.0%) |
| $25,000 to $34,999 | 18 (4.4%) | 16 (7.7%) |
| $35,000 to $49,999 | 28 (6.9%) | 3 (1.5%) |
| $50,000 to $74,999 | 84 (20.6%) | 28 (13.5%) |
| $75,000 to $99,999 | 53 (13.0%) | 13 (6.3%) |
| $100,000 to $149,999 | 83 (20.3%) | 52 (25.1%) |
| $150,000 or more | 65 (15.9%) | 4 (1.9%) |
| Total | 408 (100.0%) | 207 (100.0%) |
Monthly Housing Cost Tiers in Haines
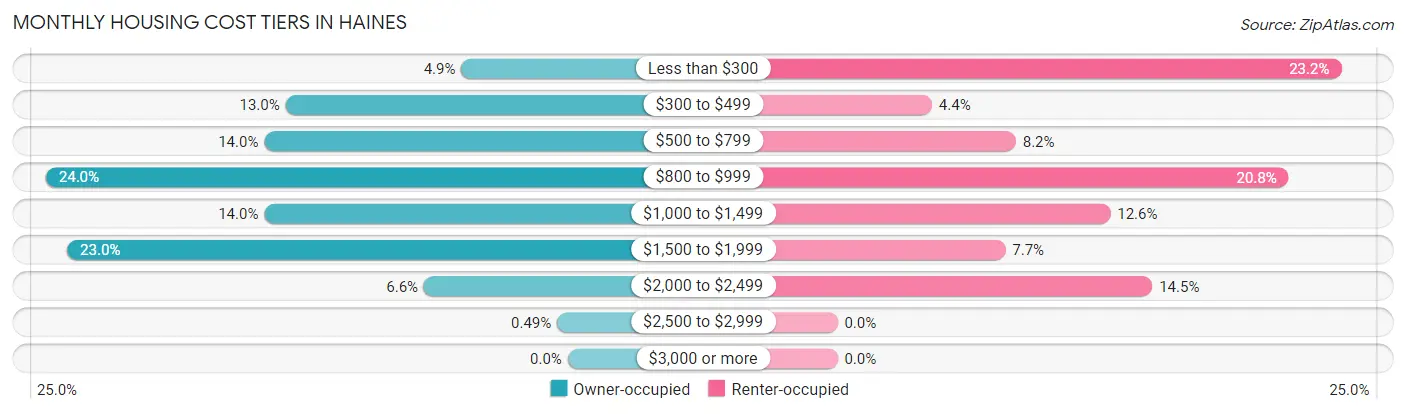
| Monthly Cost | Owner-occupied | Renter-occupied |
| Less than $300 | 20 (4.9%) | 48 (23.2%) |
| $300 to $499 | 53 (13.0%) | 9 (4.3%) |
| $500 to $799 | 57 (14.0%) | 17 (8.2%) |
| $800 to $999 | 98 (24.0%) | 43 (20.8%) |
| $1,000 to $1,499 | 57 (14.0%) | 26 (12.6%) |
| $1,500 to $1,999 | 94 (23.0%) | 16 (7.7%) |
| $2,000 to $2,499 | 27 (6.6%) | 30 (14.5%) |
| $2,500 to $2,999 | 2 (0.5%) | 0 (0.0%) |
| $3,000 or more | 0 (0.0%) | 0 (0.0%) |
| Total | 408 (100.0%) | 207 (100.0%) |
Physical Housing Characteristics in Haines
Housing Structures in Haines
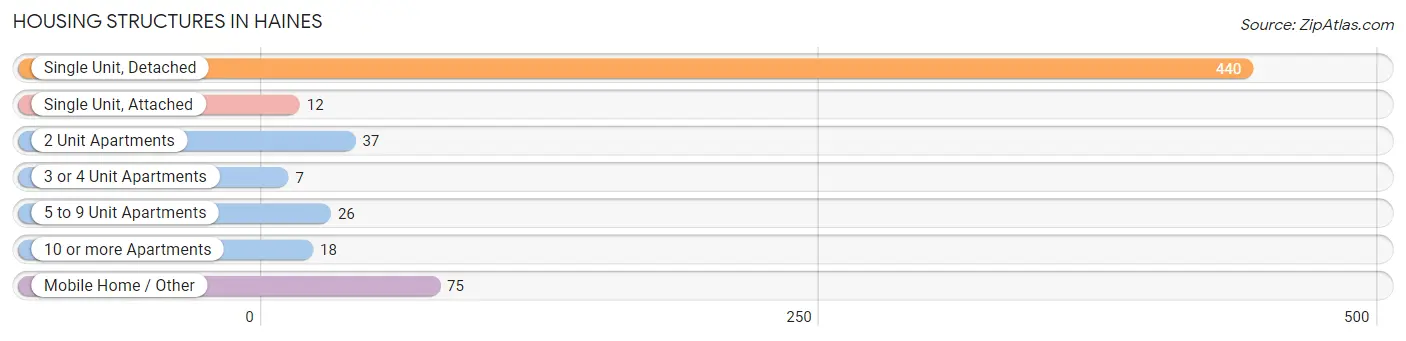
| Structure Type | # Housing Units | % Housing Units |
| Single Unit, Detached | 440 | 71.5% |
| Single Unit, Attached | 12 | 1.9% |
| 2 Unit Apartments | 37 | 6.0% |
| 3 or 4 Unit Apartments | 7 | 1.1% |
| 5 to 9 Unit Apartments | 26 | 4.2% |
| 10 or more Apartments | 18 | 2.9% |
| Mobile Home / Other | 75 | 12.2% |
| Total | 615 | 100.0% |
Housing Structures by Occupancy in Haines
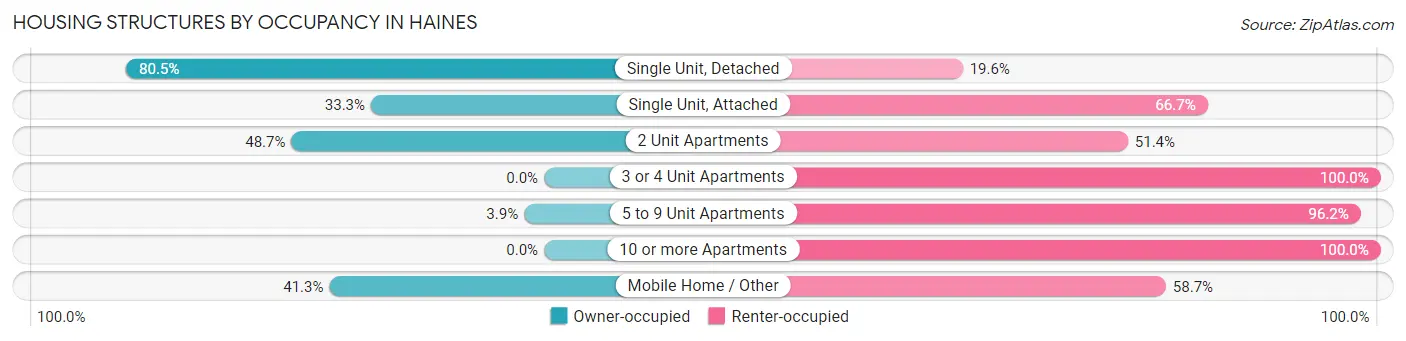
| Structure Type | Owner-occupied | Renter-occupied |
| Single Unit, Detached | 354 (80.4%) | 86 (19.6%) |
| Single Unit, Attached | 4 (33.3%) | 8 (66.7%) |
| 2 Unit Apartments | 18 (48.6%) | 19 (51.3%) |
| 3 or 4 Unit Apartments | 0 (0.0%) | 7 (100.0%) |
| 5 to 9 Unit Apartments | 1 (3.8%) | 25 (96.2%) |
| 10 or more Apartments | 0 (0.0%) | 18 (100.0%) |
| Mobile Home / Other | 31 (41.3%) | 44 (58.7%) |
| Total | 408 (66.3%) | 207 (33.7%) |
Housing Structures by Number of Rooms in Haines
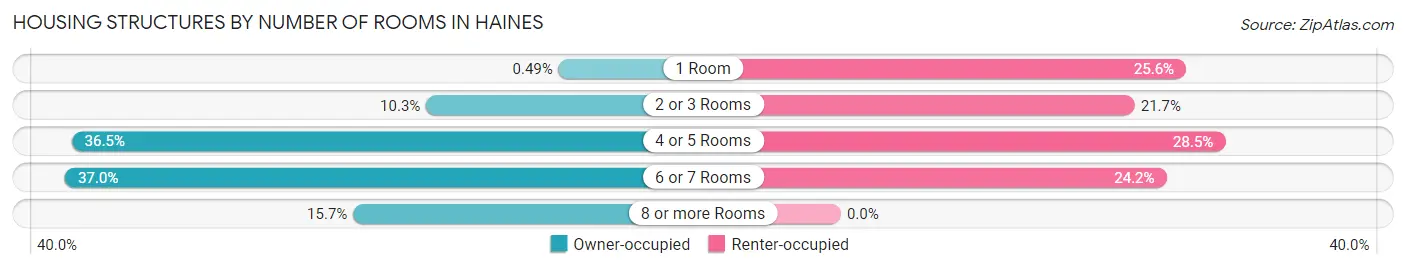
| Number of Rooms | Owner-occupied | Renter-occupied |
| 1 Room | 2 (0.5%) | 53 (25.6%) |
| 2 or 3 Rooms | 42 (10.3%) | 45 (21.7%) |
| 4 or 5 Rooms | 149 (36.5%) | 59 (28.5%) |
| 6 or 7 Rooms | 151 (37.0%) | 50 (24.1%) |
| 8 or more Rooms | 64 (15.7%) | 0 (0.0%) |
| Total | 408 (100.0%) | 207 (100.0%) |
Housing Structure by Heating Type in Haines
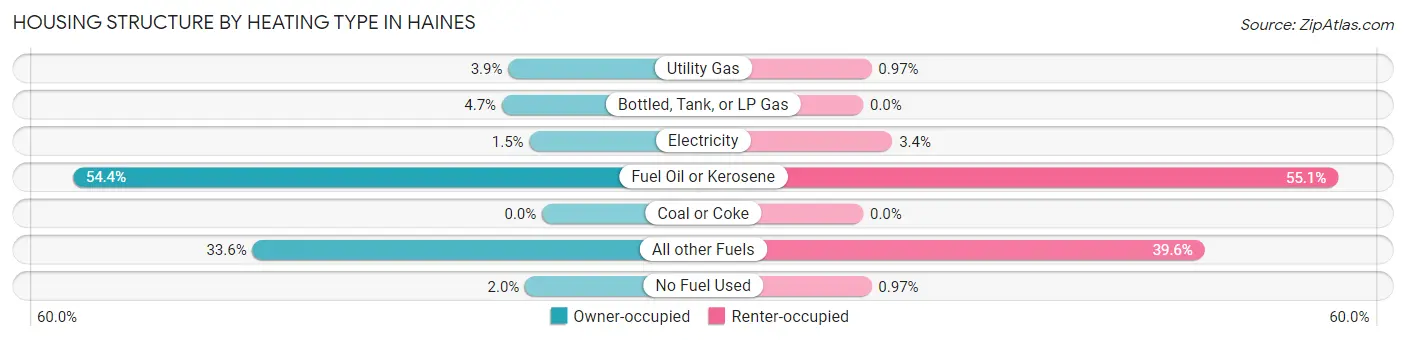
| Heating Type | Owner-occupied | Renter-occupied |
| Utility Gas | 16 (3.9%) | 2 (1.0%) |
| Bottled, Tank, or LP Gas | 19 (4.7%) | 0 (0.0%) |
| Electricity | 6 (1.5%) | 7 (3.4%) |
| Fuel Oil or Kerosene | 222 (54.4%) | 114 (55.1%) |
| Coal or Coke | 0 (0.0%) | 0 (0.0%) |
| All other Fuels | 137 (33.6%) | 82 (39.6%) |
| No Fuel Used | 8 (2.0%) | 2 (1.0%) |
| Total | 408 (100.0%) | 207 (100.0%) |
Household Vehicle Usage in Haines
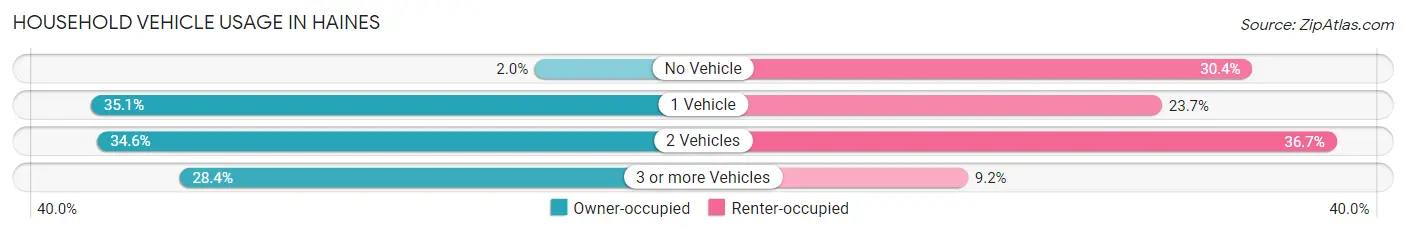
| Vehicles per Household | Owner-occupied | Renter-occupied |
| No Vehicle | 8 (2.0%) | 63 (30.4%) |
| 1 Vehicle | 143 (35.0%) | 49 (23.7%) |
| 2 Vehicles | 141 (34.6%) | 76 (36.7%) |
| 3 or more Vehicles | 116 (28.4%) | 19 (9.2%) |
| Total | 408 (100.0%) | 207 (100.0%) |
Real Estate & Mortgages in Haines
Real Estate and Mortgage Overview in Haines
| Characteristic | Without Mortgage | With Mortgage |
| Housing Units | 198 | 210 |
| Median Property Value | $341,300 | $275,800 |
| Median Household Income | $51,875 | $48 |
| Monthly Housing Costs | $673 | $0 |
| Real Estate Taxes | $2,391 | $39 |
Property Value by Mortgage Status in Haines
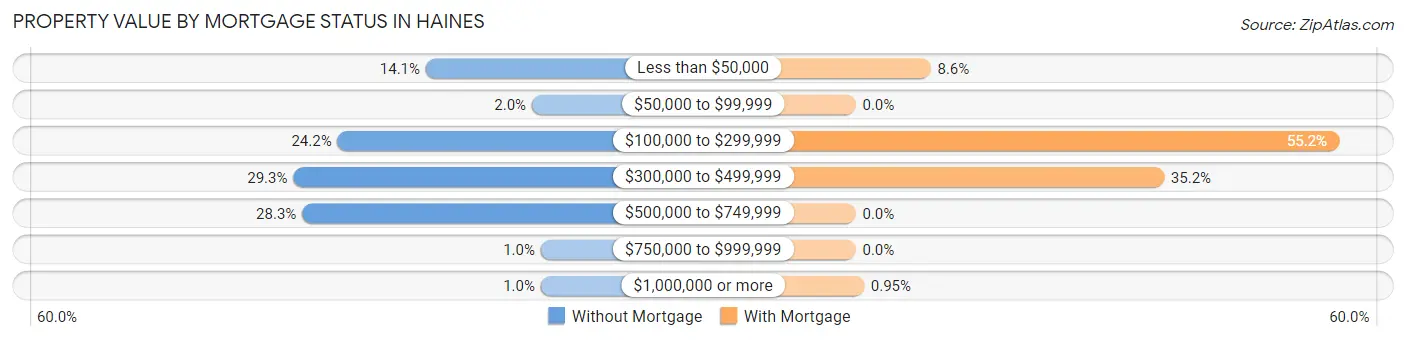
| Property Value | Without Mortgage | With Mortgage |
| Less than $50,000 | 28 (14.1%) | 18 (8.6%) |
| $50,000 to $99,999 | 4 (2.0%) | 0 (0.0%) |
| $100,000 to $299,999 | 48 (24.2%) | 116 (55.2%) |
| $300,000 to $499,999 | 58 (29.3%) | 74 (35.2%) |
| $500,000 to $749,999 | 56 (28.3%) | 0 (0.0%) |
| $750,000 to $999,999 | 2 (1.0%) | 0 (0.0%) |
| $1,000,000 or more | 2 (1.0%) | 2 (0.9%) |
| Total | 198 (100.0%) | 210 (100.0%) |
Household Income by Mortgage Status in Haines
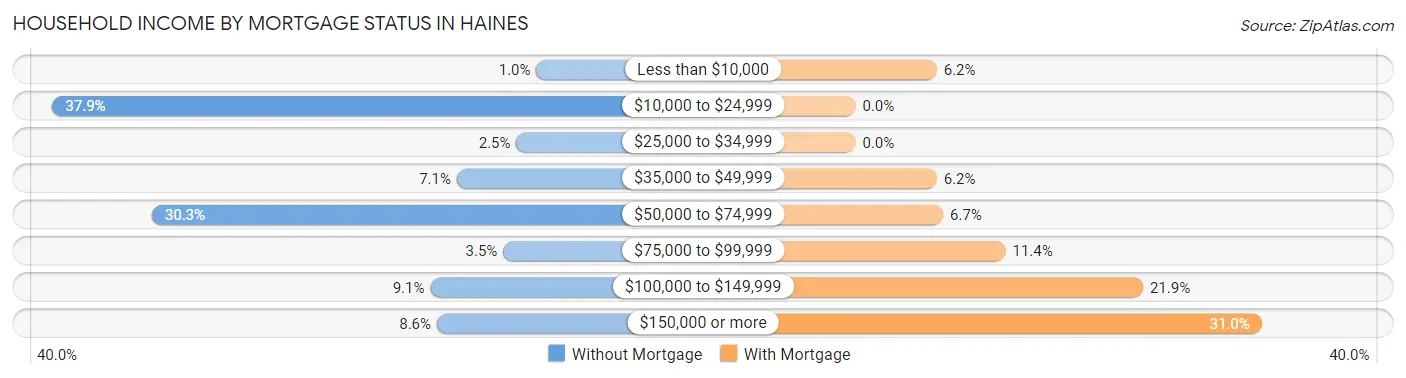
| Household Income | Without Mortgage | With Mortgage |
| Less than $10,000 | 2 (1.0%) | 13 (6.2%) |
| $10,000 to $24,999 | 75 (37.9%) | 0 (0.0%) |
| $25,000 to $34,999 | 5 (2.5%) | 0 (0.0%) |
| $35,000 to $49,999 | 14 (7.1%) | 13 (6.2%) |
| $50,000 to $74,999 | 60 (30.3%) | 14 (6.7%) |
| $75,000 to $99,999 | 7 (3.5%) | 24 (11.4%) |
| $100,000 to $149,999 | 18 (9.1%) | 46 (21.9%) |
| $150,000 or more | 17 (8.6%) | 65 (30.9%) |
| Total | 198 (100.0%) | 210 (100.0%) |
Property Value to Household Income Ratio in Haines
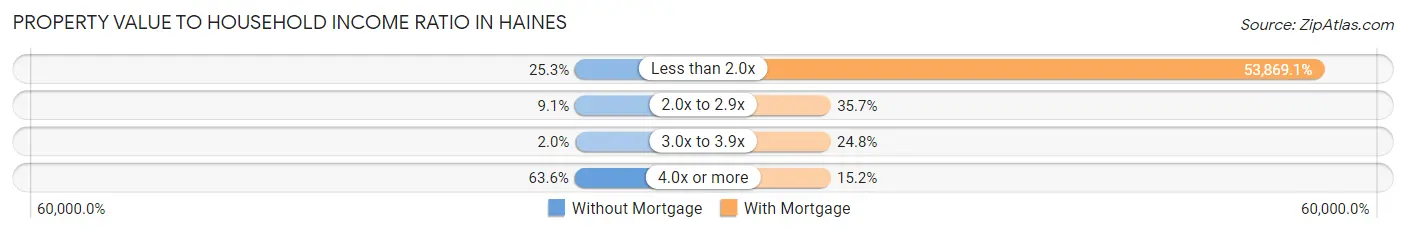
| Value-to-Income Ratio | Without Mortgage | With Mortgage |
| Less than 2.0x | 50 (25.3%) | 113,125 (53,869.1%) |
| 2.0x to 2.9x | 18 (9.1%) | 75 (35.7%) |
| 3.0x to 3.9x | 4 (2.0%) | 52 (24.8%) |
| 4.0x or more | 126 (63.6%) | 32 (15.2%) |
| Total | 198 (100.0%) | 210 (100.0%) |
Real Estate Taxes by Mortgage Status in Haines
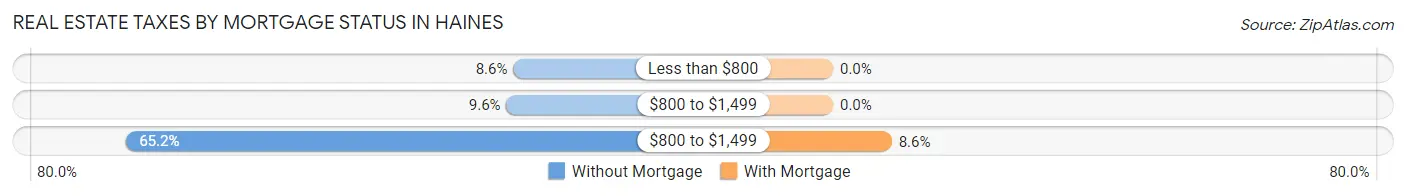
| Property Taxes | Without Mortgage | With Mortgage |
| Less than $800 | 17 (8.6%) | 0 (0.0%) |
| $800 to $1,499 | 19 (9.6%) | 0 (0.0%) |
| $800 to $1,499 | 129 (65.1%) | 18 (8.6%) |
| Total | 198 (100.0%) | 210 (100.0%) |
Health & Disability in Haines
Health Insurance Coverage by Age in Haines
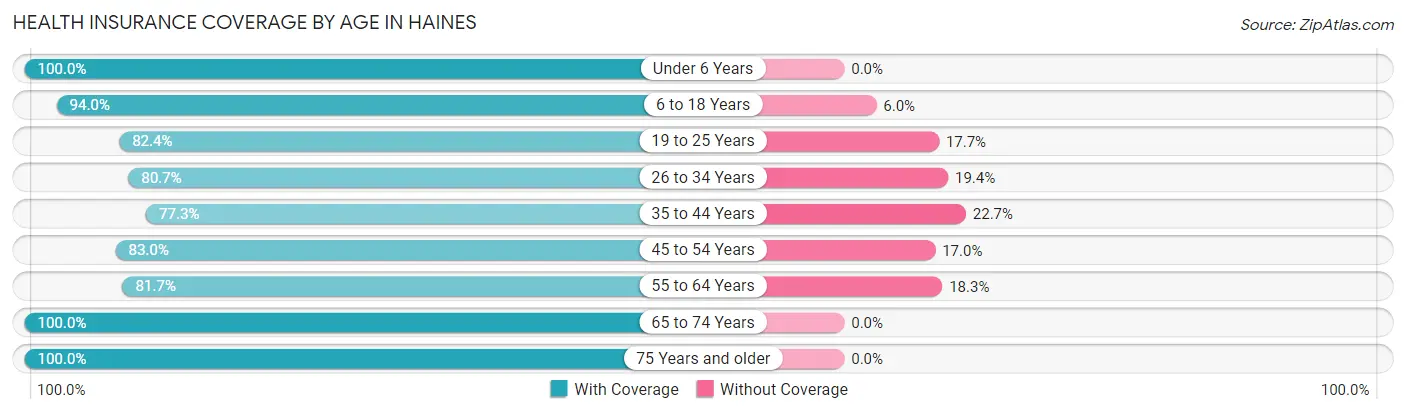
| Age Bracket | With Coverage | Without Coverage |
| Under 6 Years | 109 (100.0%) | 0 (0.0%) |
| 6 to 18 Years | 488 (94.0%) | 31 (6.0%) |
| 19 to 25 Years | 28 (82.4%) | 6 (17.6%) |
| 26 to 34 Years | 75 (80.6%) | 18 (19.4%) |
| 35 to 44 Years | 191 (77.3%) | 56 (22.7%) |
| 45 to 54 Years | 142 (83.0%) | 29 (17.0%) |
| 55 to 64 Years | 197 (81.7%) | 44 (18.3%) |
| 65 to 74 Years | 233 (100.0%) | 0 (0.0%) |
| 75 Years and older | 107 (100.0%) | 0 (0.0%) |
| Total | 1,570 (89.5%) | 184 (10.5%) |
Health Insurance Coverage by Citizenship Status in Haines
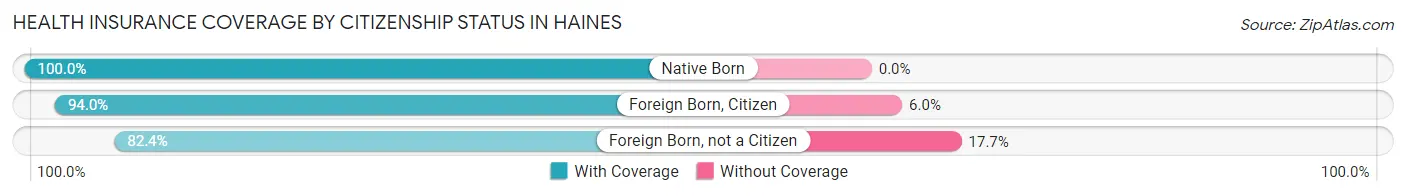
| Citizenship Status | With Coverage | Without Coverage |
| Native Born | 109 (100.0%) | 0 (0.0%) |
| Foreign Born, Citizen | 488 (94.0%) | 31 (6.0%) |
| Foreign Born, not a Citizen | 28 (82.4%) | 6 (17.6%) |
Health Insurance Coverage by Household Income in Haines
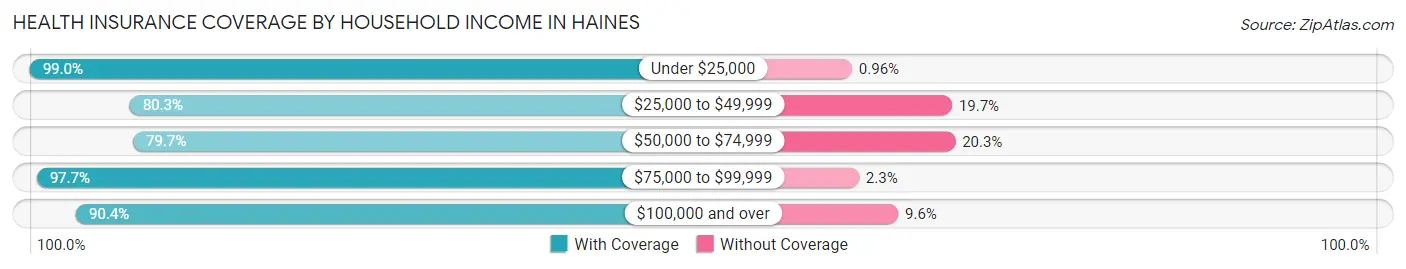
| Household Income | With Coverage | Without Coverage |
| Under $25,000 | 206 (99.0%) | 2 (1.0%) |
| $25,000 to $49,999 | 106 (80.3%) | 26 (19.7%) |
| $50,000 to $74,999 | 208 (79.7%) | 53 (20.3%) |
| $75,000 to $99,999 | 129 (97.7%) | 3 (2.3%) |
| $100,000 and over | 921 (90.4%) | 98 (9.6%) |
Public vs Private Health Insurance Coverage by Age in Haines
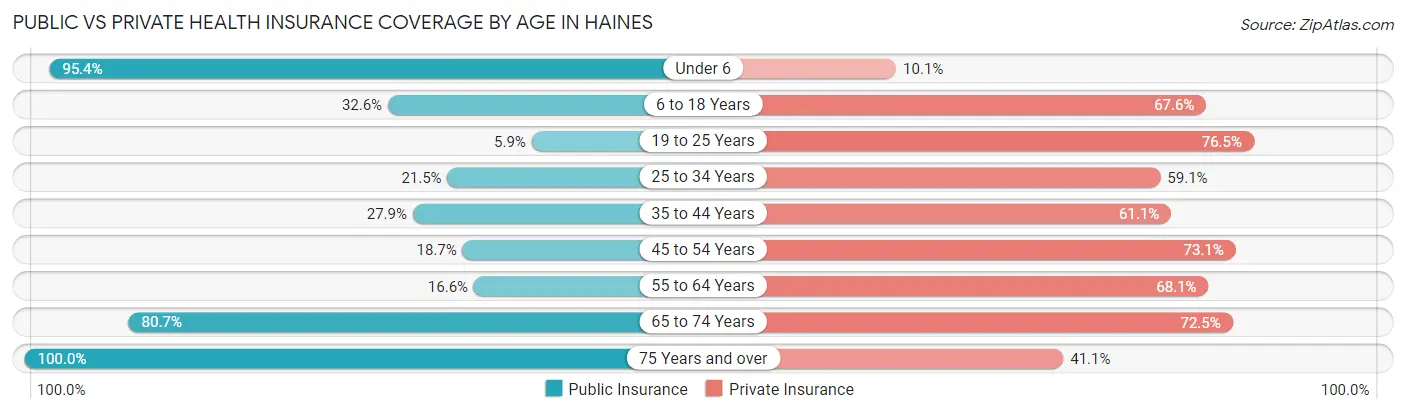
| Age Bracket | Public Insurance | Private Insurance |
| Under 6 | 104 (95.4%) | 11 (10.1%) |
| 6 to 18 Years | 169 (32.6%) | 351 (67.6%) |
| 19 to 25 Years | 2 (5.9%) | 26 (76.5%) |
| 25 to 34 Years | 20 (21.5%) | 55 (59.1%) |
| 35 to 44 Years | 69 (27.9%) | 151 (61.1%) |
| 45 to 54 Years | 32 (18.7%) | 125 (73.1%) |
| 55 to 64 Years | 40 (16.6%) | 164 (68.0%) |
| 65 to 74 Years | 188 (80.7%) | 169 (72.5%) |
| 75 Years and over | 107 (100.0%) | 44 (41.1%) |
| Total | 731 (41.7%) | 1,096 (62.5%) |
Disability Status by Sex by Age in Haines
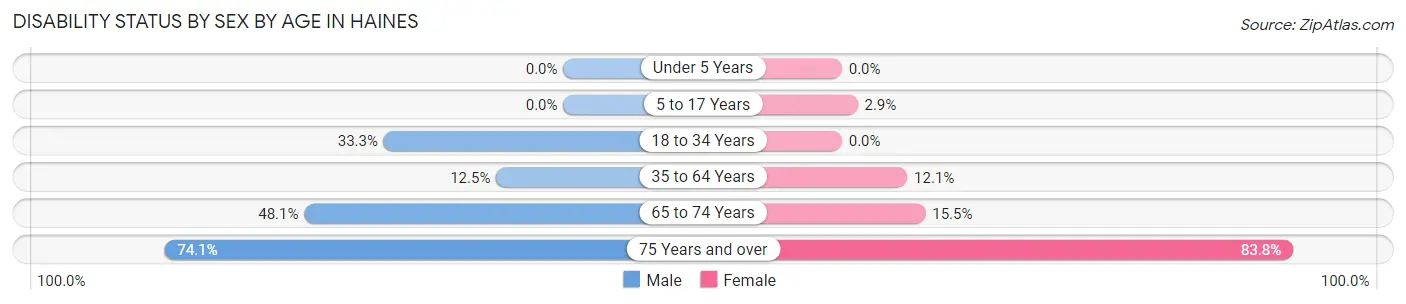
| Age Bracket | Male | Female |
| Under 5 Years | 0 (0.0%) | 0 (0.0%) |
| 5 to 17 Years | 0 (0.0%) | 7 (2.9%) |
| 18 to 34 Years | 25 (33.3%) | 0 (0.0%) |
| 35 to 64 Years | 40 (12.5%) | 41 (12.1%) |
| 65 to 74 Years | 50 (48.1%) | 20 (15.5%) |
| 75 Years and over | 20 (74.1%) | 67 (83.8%) |
Disability Class by Sex by Age in Haines
Disability Class: Hearing Difficulty
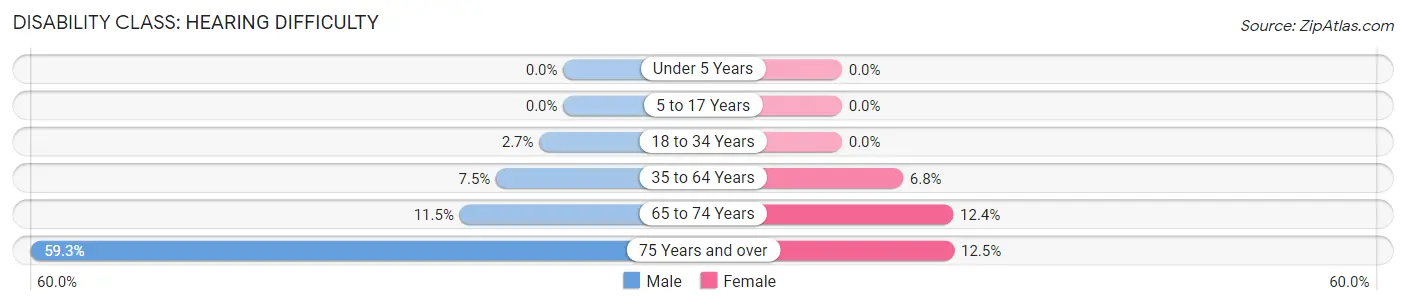
| Age Bracket | Male | Female |
| Under 5 Years | 0 (0.0%) | 0 (0.0%) |
| 5 to 17 Years | 0 (0.0%) | 0 (0.0%) |
| 18 to 34 Years | 2 (2.7%) | 0 (0.0%) |
| 35 to 64 Years | 24 (7.5%) | 23 (6.8%) |
| 65 to 74 Years | 12 (11.5%) | 16 (12.4%) |
| 75 Years and over | 16 (59.3%) | 10 (12.5%) |
Disability Class: Vision Difficulty
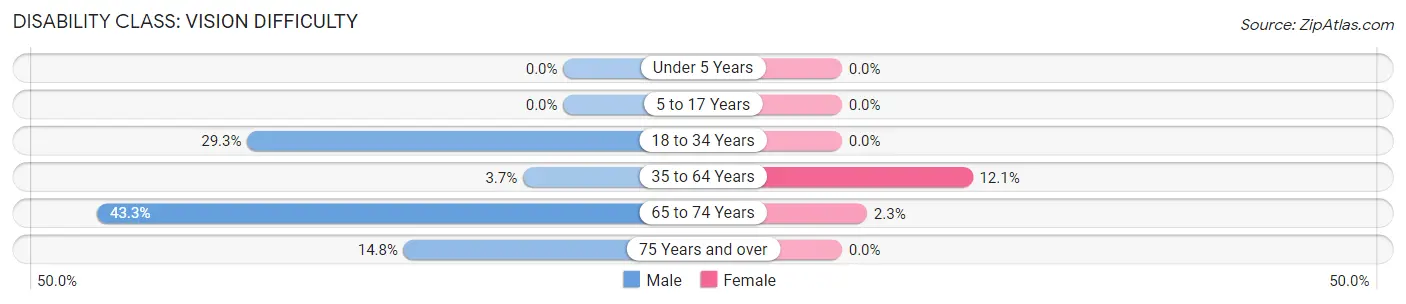
| Age Bracket | Male | Female |
| Under 5 Years | 0 (0.0%) | 0 (0.0%) |
| 5 to 17 Years | 0 (0.0%) | 0 (0.0%) |
| 18 to 34 Years | 22 (29.3%) | 0 (0.0%) |
| 35 to 64 Years | 12 (3.7%) | 41 (12.1%) |
| 65 to 74 Years | 45 (43.3%) | 3 (2.3%) |
| 75 Years and over | 4 (14.8%) | 0 (0.0%) |
Disability Class: Cognitive Difficulty
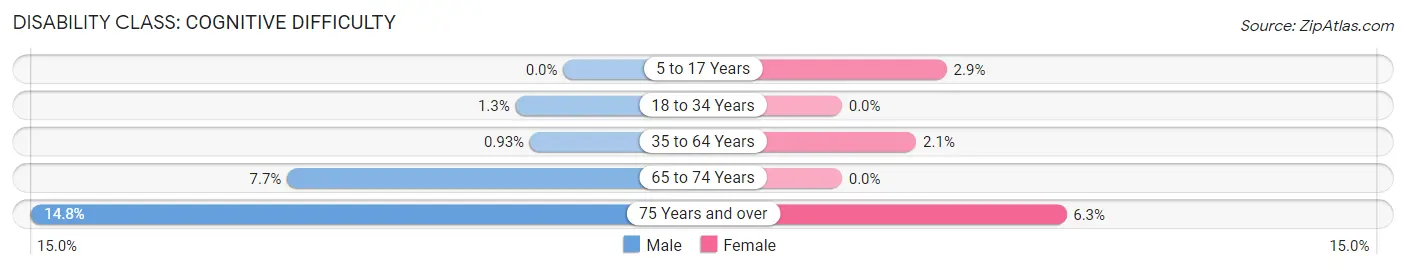
| Age Bracket | Male | Female |
| 5 to 17 Years | 0 (0.0%) | 7 (2.9%) |
| 18 to 34 Years | 1 (1.3%) | 0 (0.0%) |
| 35 to 64 Years | 3 (0.9%) | 7 (2.1%) |
| 65 to 74 Years | 8 (7.7%) | 0 (0.0%) |
| 75 Years and over | 4 (14.8%) | 5 (6.2%) |
Disability Class: Ambulatory Difficulty
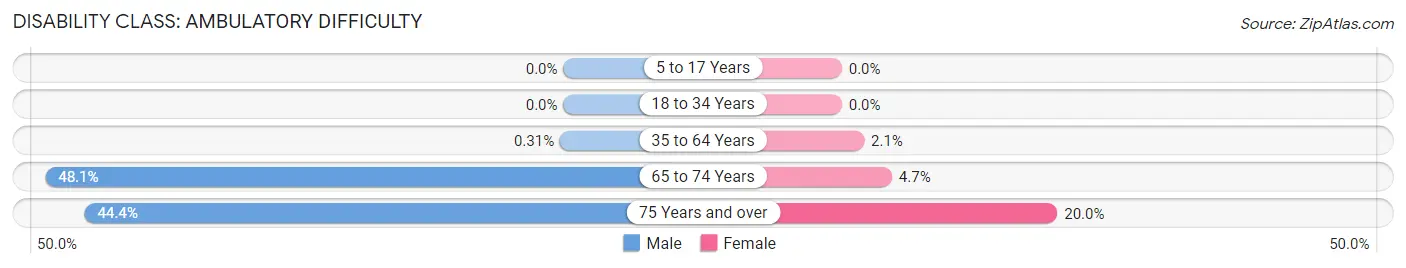
| Age Bracket | Male | Female |
| 5 to 17 Years | 0 (0.0%) | 0 (0.0%) |
| 18 to 34 Years | 0 (0.0%) | 0 (0.0%) |
| 35 to 64 Years | 1 (0.3%) | 7 (2.1%) |
| 65 to 74 Years | 50 (48.1%) | 6 (4.6%) |
| 75 Years and over | 12 (44.4%) | 16 (20.0%) |
Disability Class: Self-Care Difficulty
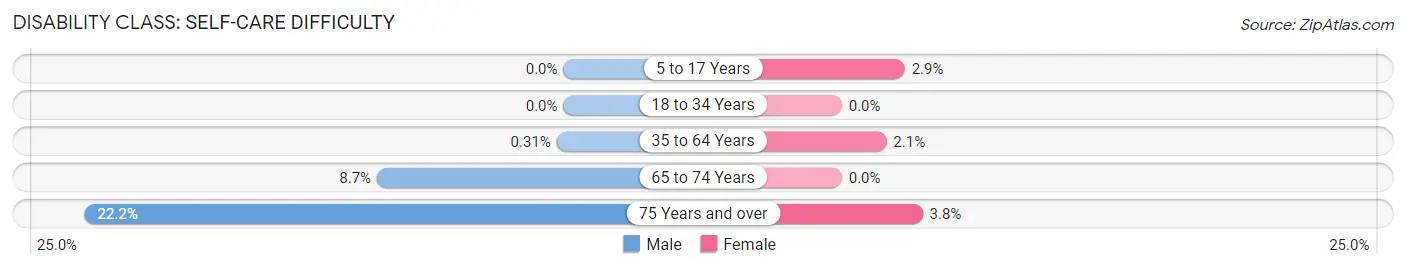
| Age Bracket | Male | Female |
| 5 to 17 Years | 0 (0.0%) | 7 (2.9%) |
| 18 to 34 Years | 0 (0.0%) | 0 (0.0%) |
| 35 to 64 Years | 1 (0.3%) | 7 (2.1%) |
| 65 to 74 Years | 9 (8.6%) | 0 (0.0%) |
| 75 Years and over | 6 (22.2%) | 3 (3.7%) |
Technology Access in Haines
Computing Device Access in Haines
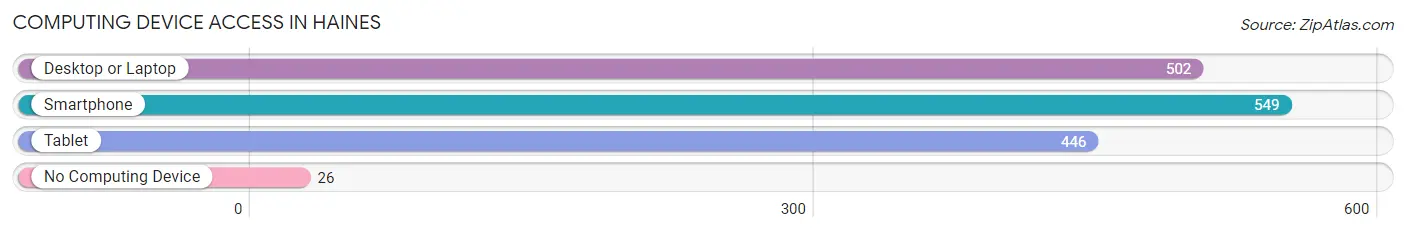
| Device Type | # Households | % Households |
| Desktop or Laptop | 502 | 81.6% |
| Smartphone | 549 | 89.3% |
| Tablet | 446 | 72.5% |
| No Computing Device | 26 | 4.2% |
| Total | 615 | 100.0% |
Internet Access in Haines
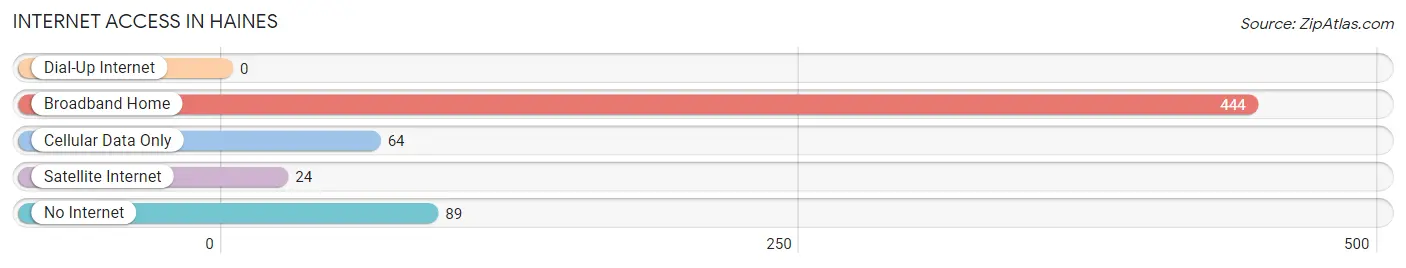
| Internet Type | # Households | % Households |
| Dial-Up Internet | 0 | 0.0% |
| Broadband Home | 444 | 72.2% |
| Cellular Data Only | 64 | 10.4% |
| Satellite Internet | 24 | 3.9% |
| No Internet | 89 | 14.5% |
| Total | 615 | 100.0% |
Haines Summary
Haines, Alaska is a small town located in the southeastern corner of the state, near the border of Canada. It is situated on the Chilkat River, and is the gateway to the Chilkat Bald Eagle Preserve. The town has a population of 2,508 people, according to the 2010 census.
Geography
Haines is located in the southeastern corner of Alaska, near the border of Canada. It is situated on the Chilkat River, and is the gateway to the Chilkat Bald Eagle Preserve. The town is surrounded by mountains, and is located in a temperate rainforest climate. The average annual temperature is 45°F, and the average annual precipitation is around 40 inches.
Economy
Haines’ economy is largely based on tourism, fishing, and logging. The town is a popular destination for tourists, who come to experience the natural beauty of the area and to take part in activities such as fishing, hiking, and wildlife viewing. The fishing industry is also important to the local economy, with salmon, halibut, and other fish being caught in the area. Logging is also an important industry in Haines, with timber being harvested from the surrounding forests.
Demographics
According to the 2010 census, Haines has a population of 2,508 people. The population is predominantly white (90.2%), with Native Americans making up the largest minority group (7.2%). The median household income is $50,902, and the median age is 44.7 years.
Education
Haines is served by the Haines Borough School District, which operates two elementary schools, one middle school, and one high school. The district also operates a vocational-technical school, which offers courses in carpentry, welding, and other trades.
Conclusion
Haines, Alaska is a small town located in the southeastern corner of the state, near the border of Canada. It is situated on the Chilkat River, and is the gateway to the Chilkat Bald Eagle Preserve. The town has a population of 2,508 people, according to the 2010 census. The economy is largely based on tourism, fishing, and logging, and the population is predominantly white. The town is served by the Haines Borough School District, which operates two elementary schools, one middle school, and one high school.
Common Questions
What is Per Capita Income in Haines?
Per Capita income in Haines is $29,388.
What is the Median Family Income in Haines?
Median Family Income in Haines is $99,583.
What is the Median Household income in Haines?
Median Household Income in Haines is $69,612.
What is Income or Wage Gap in Haines?
Income or Wage Gap in Haines is 25.9%.
Women in Haines earn 74.1 cents for every dollar earned by a man.
What is Inequality or Gini Index in Haines?
Inequality or Gini Index in Haines is 0.42.
What is the Total Population of Haines?
Total Population of Haines is 1,762.
What is the Total Male Population of Haines?
Total Male Population of Haines is 898.
What is the Total Female Population of Haines?
Total Female Population of Haines is 864.
What is the Ratio of Males per 100 Females in Haines?
There are 103.94 Males per 100 Females in Haines.
What is the Ratio of Females per 100 Males in Haines?
There are 96.21 Females per 100 Males in Haines.
What is the Median Population Age in Haines?
Median Population Age in Haines is 41.3 Years.
What is the Average Family Size in Haines
Average Family Size in Haines is 3.8 People.
What is the Average Household Size in Haines
Average Household Size in Haines is 2.9 People.
How Large is the Labor Force in Haines?
There are 665 People in the Labor Forcein in Haines.
What is the Percentage of People in the Labor Force in Haines?
55.0% of People are in the Labor Force in Haines.
What is the Unemployment Rate in Haines?
Unemployment Rate in Haines is 5.4%.