Red Lodge, MT Map & Demographics
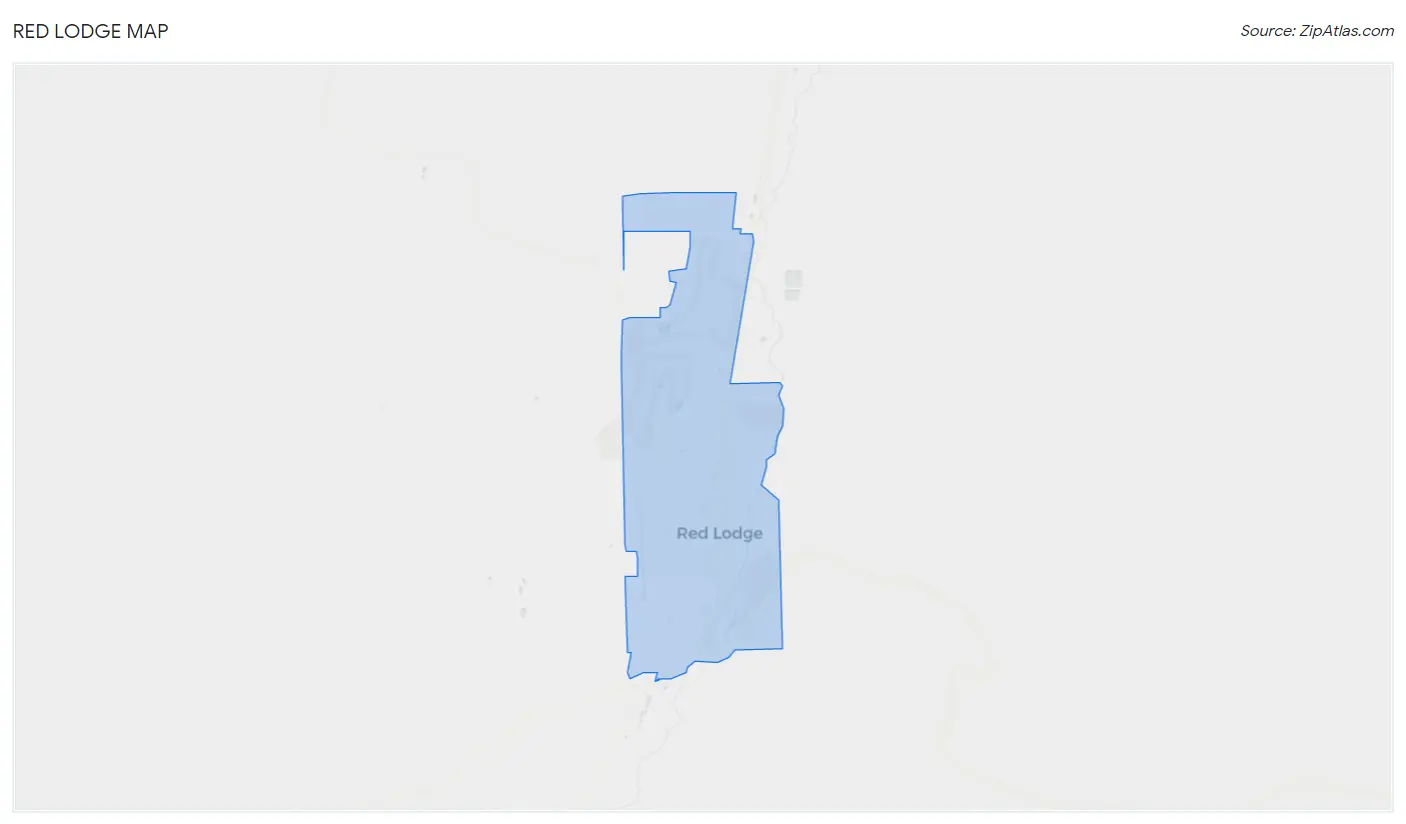
Red Lodge Map
Red Lodge Overview
$39,379
PER CAPITA INCOME
$74,107
AVG FAMILY INCOME
$39,472
AVG HOUSEHOLD INCOME
19.8%
WAGE / INCOME GAP [ % ]
80.2¢/ $1
WAGE / INCOME GAP [ $ ]
0.47
INEQUALITY / GINI INDEX
2,321
TOTAL POPULATION
1,079
MALE POPULATION
1,242
FEMALE POPULATION
86.88
MALES / 100 FEMALES
115.11
FEMALES / 100 MALES
52.9
MEDIAN AGE
2.5
AVG FAMILY SIZE
1.8
AVG HOUSEHOLD SIZE
1,178
LABOR FORCE [ PEOPLE ]
59.6%
PERCENT IN LABOR FORCE
4.2%
UNEMPLOYMENT RATE
Red Lodge Zip Codes
Red Lodge Area Codes
Income in Red Lodge
Income Overview in Red Lodge
Per Capita Income in Red Lodge is $39,379, while median incomes of families and households are $74,107 and $39,472 respectively.
| Characteristic | Number | Measure |
| Per Capita Income | 2,321 | $39,379 |
| Median Family Income | 562 | $74,107 |
| Mean Family Income | 562 | $104,276 |
| Median Household Income | 1,282 | $39,472 |
| Mean Household Income | 1,282 | $68,599 |
| Income Deficit | 562 | $0 |
| Wage / Income Gap (%) | 2,321 | 19.82% |
| Wage / Income Gap ($) | 2,321 | 80.18¢ per $1 |
| Gini / Inequality Index | 2,321 | 0.47 |
Earnings by Sex in Red Lodge
Average Earnings in Red Lodge are $30,699, $33,790 for men and $27,092 for women, a difference of 19.8%.
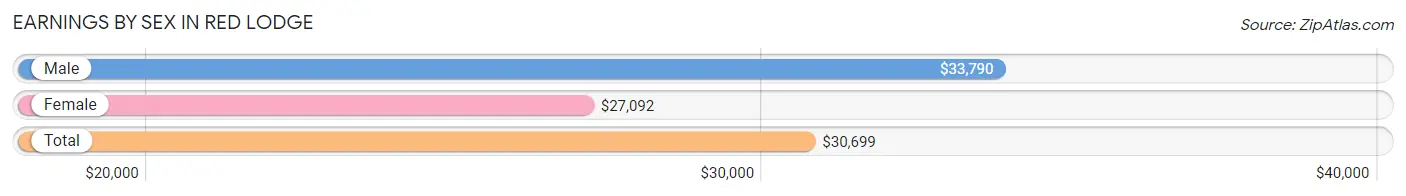
| Sex | Number | Average Earnings |
| Male | 565 (45.1%) | $33,790 |
| Female | 689 (54.9%) | $27,092 |
| Total | 1,254 (100.0%) | $30,699 |
Earnings by Sex by Income Bracket in Red Lodge
The most common earnings brackets in Red Lodge are $20,000 to $22,499 for men (141 | 25.0%) and $25,000 to $29,999 for women (129 | 18.7%).
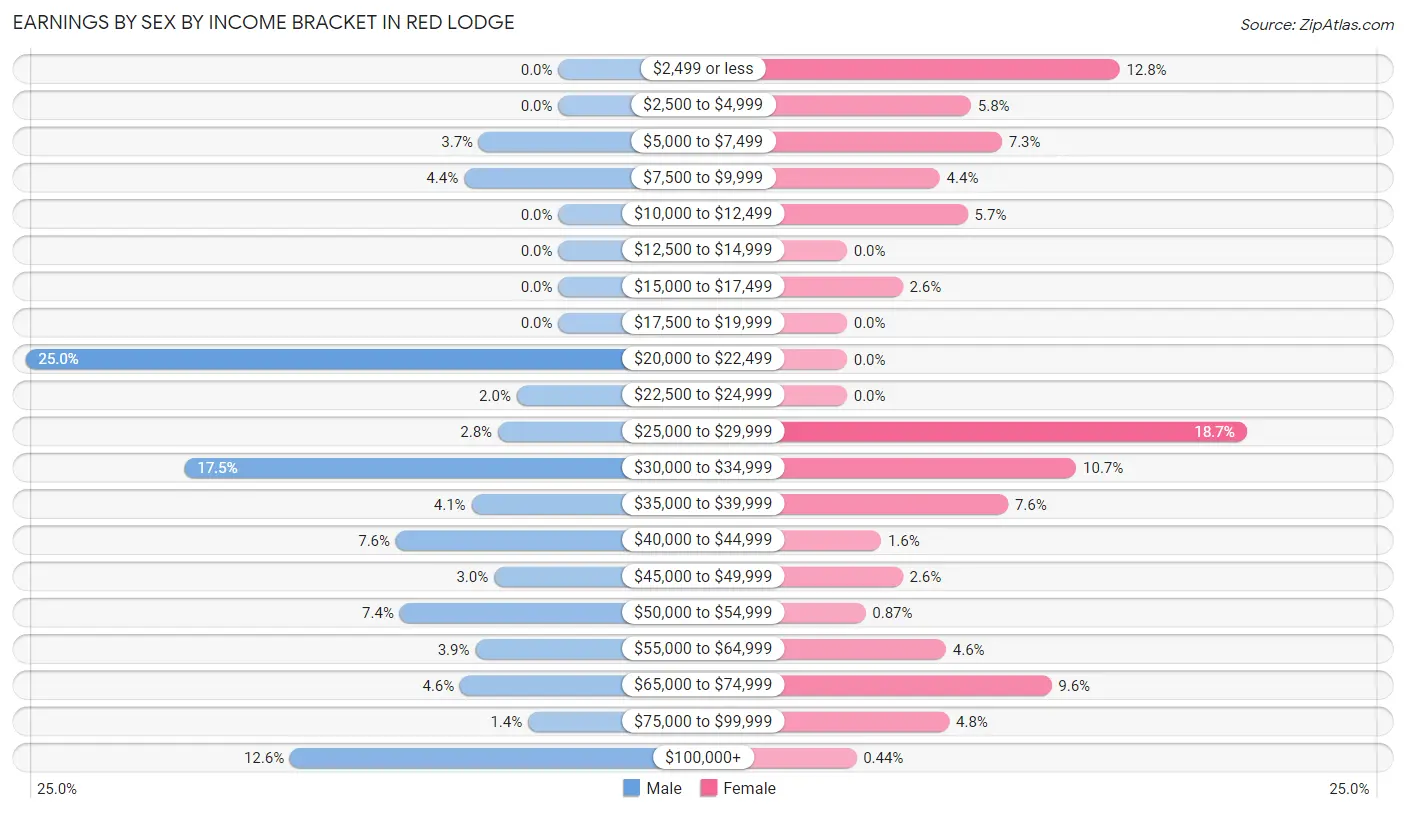
| Income | Male | Female |
| $2,499 or less | 0 (0.0%) | 88 (12.8%) |
| $2,500 to $4,999 | 0 (0.0%) | 40 (5.8%) |
| $5,000 to $7,499 | 21 (3.7%) | 50 (7.3%) |
| $7,500 to $9,999 | 25 (4.4%) | 30 (4.3%) |
| $10,000 to $12,499 | 0 (0.0%) | 39 (5.7%) |
| $12,500 to $14,999 | 0 (0.0%) | 0 (0.0%) |
| $15,000 to $17,499 | 0 (0.0%) | 18 (2.6%) |
| $17,500 to $19,999 | 0 (0.0%) | 0 (0.0%) |
| $20,000 to $22,499 | 141 (25.0%) | 0 (0.0%) |
| $22,500 to $24,999 | 11 (1.9%) | 0 (0.0%) |
| $25,000 to $29,999 | 16 (2.8%) | 129 (18.7%) |
| $30,000 to $34,999 | 99 (17.5%) | 74 (10.7%) |
| $35,000 to $39,999 | 23 (4.1%) | 52 (7.5%) |
| $40,000 to $44,999 | 43 (7.6%) | 11 (1.6%) |
| $45,000 to $49,999 | 17 (3.0%) | 18 (2.6%) |
| $50,000 to $54,999 | 42 (7.4%) | 6 (0.9%) |
| $55,000 to $64,999 | 22 (3.9%) | 32 (4.6%) |
| $65,000 to $74,999 | 26 (4.6%) | 66 (9.6%) |
| $75,000 to $99,999 | 8 (1.4%) | 33 (4.8%) |
| $100,000+ | 71 (12.6%) | 3 (0.4%) |
| Total | 565 (100.0%) | 689 (100.0%) |
Earnings by Sex by Educational Attainment in Red Lodge
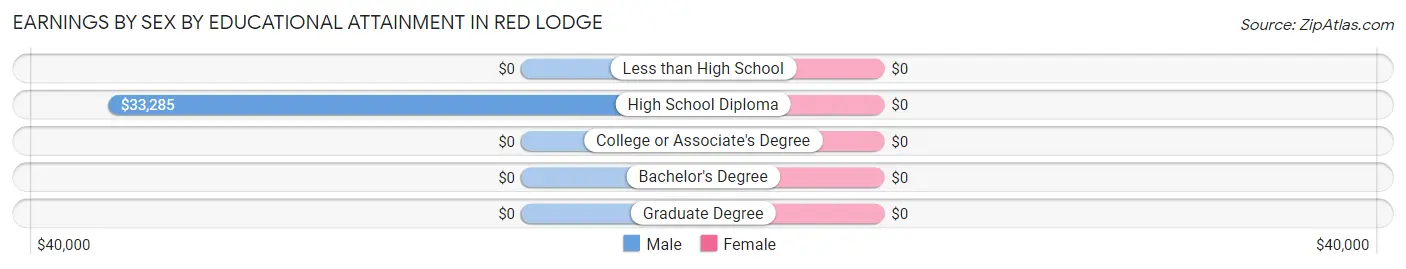
| Educational Attainment | Male Income | Female Income |
| Less than High School | - | - |
| High School Diploma | $33,285 | $0 |
| College or Associate's Degree | - | - |
| Bachelor's Degree | - | - |
| Graduate Degree | - | - |
| Total | $34,841 | $29,301 |
Family Income in Red Lodge
Family Income Brackets in Red Lodge
According to the Red Lodge family income data, there are 140 families falling into the $50,000 to $74,999 income range, which is the most common income bracket and makes up 24.9% of all families.
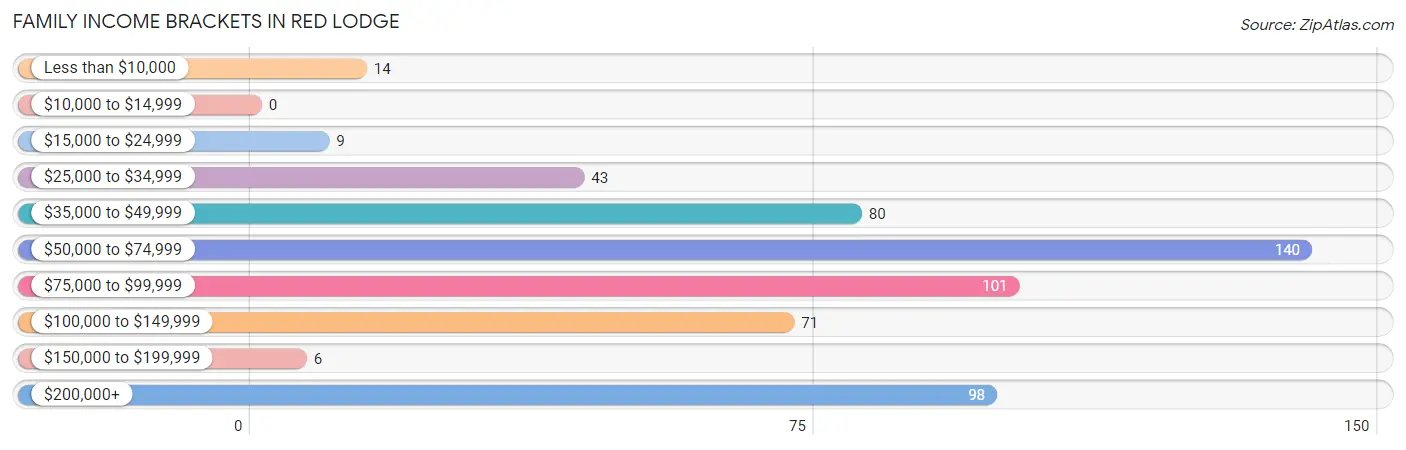
| Income Bracket | # Families | % Families |
| Less than $10,000 | 14 | 2.5% |
| $10,000 to $14,999 | 0 | 0.0% |
| $15,000 to $24,999 | 9 | 1.6% |
| $25,000 to $34,999 | 43 | 7.7% |
| $35,000 to $49,999 | 80 | 14.2% |
| $50,000 to $74,999 | 140 | 24.9% |
| $75,000 to $99,999 | 101 | 18.0% |
| $100,000 to $149,999 | 71 | 12.6% |
| $150,000 to $199,999 | 6 | 1.1% |
| $200,000+ | 98 | 17.4% |
Family Income by Famaliy Size in Red Lodge
2-person families (418 | 74.4%) account for the highest median family income in Red Lodge with $96,731 per family, while 2-person families (418 | 74.4%) have the highest median income of $48,366 per family member.
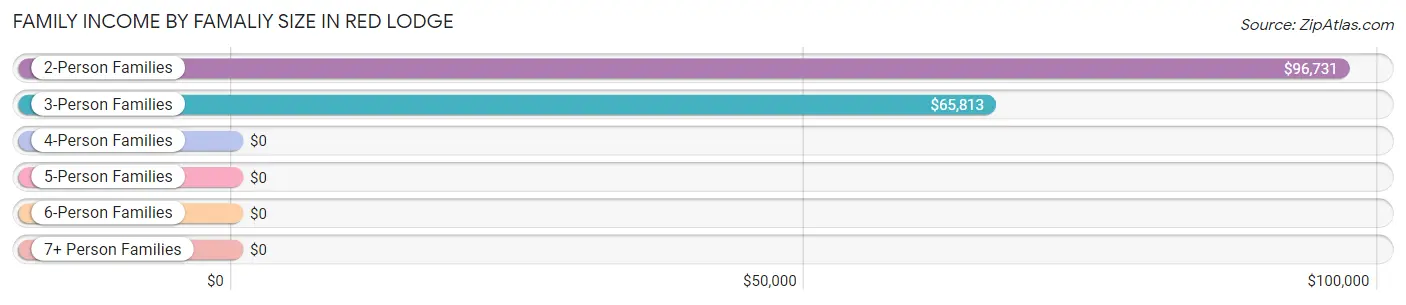
| Income Bracket | # Families | Median Income |
| 2-Person Families | 418 (74.4%) | $96,731 |
| 3-Person Families | 99 (17.6%) | $65,813 |
| 4-Person Families | 2 (0.4%) | $0 |
| 5-Person Families | 43 (7.6%) | $0 |
| 6-Person Families | 0 (0.0%) | $0 |
| 7+ Person Families | 0 (0.0%) | $0 |
| Total | 562 (100.0%) | $74,107 |
Family Income by Number of Earners in Red Lodge
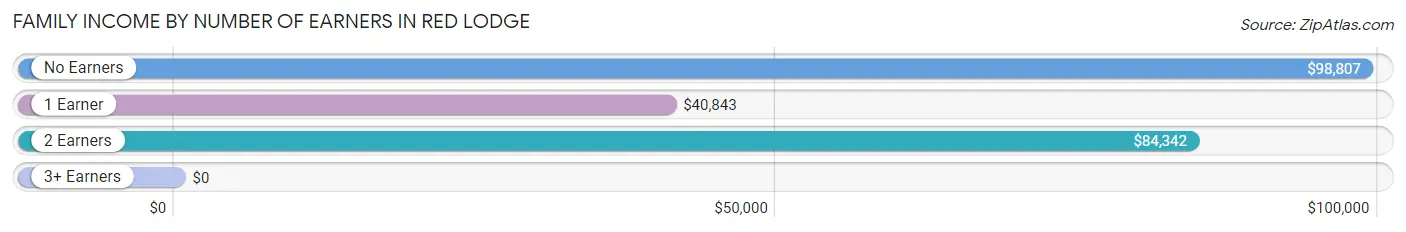
| Number of Earners | # Families | Median Income |
| No Earners | 197 (35.0%) | $98,807 |
| 1 Earner | 189 (33.6%) | $40,843 |
| 2 Earners | 176 (31.3%) | $84,342 |
| 3+ Earners | 0 (0.0%) | $0 |
| Total | 562 (100.0%) | $74,107 |
Household Income in Red Lodge
Household Income Brackets in Red Lodge
With 260 households falling in the category, the $15,000 to $24,999 income range is the most frequent in Red Lodge, accounting for 20.3% of all households. In contrast, only 26 households (2.0%) fall into the $150,000 to $199,999 income bracket, making it the least populous group.
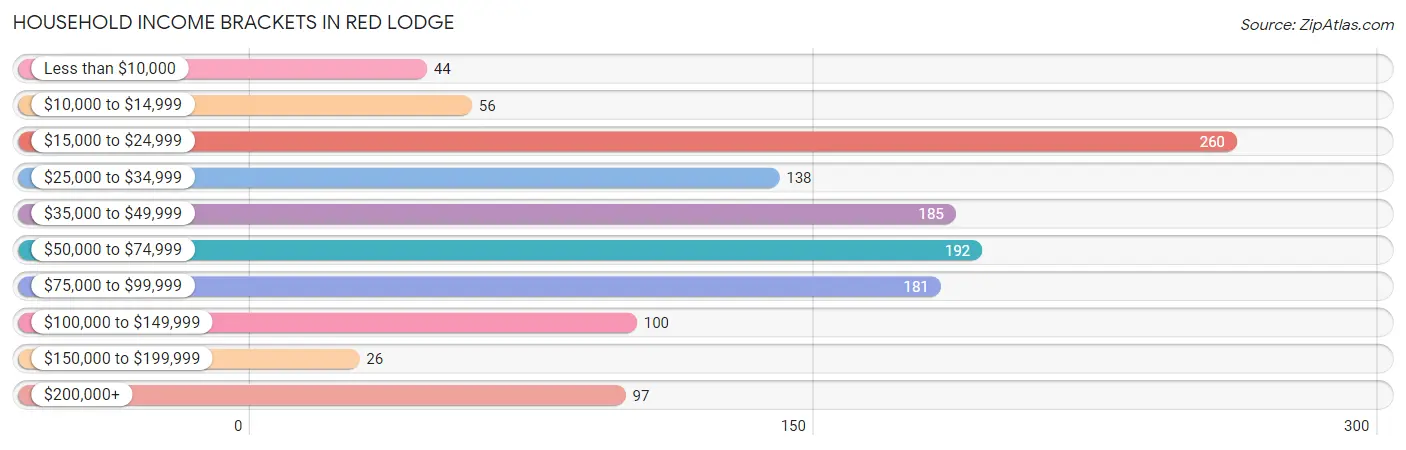
| Income Bracket | # Households | % Households |
| Less than $10,000 | 44 | 3.4% |
| $10,000 to $14,999 | 56 | 4.4% |
| $15,000 to $24,999 | 260 | 20.3% |
| $25,000 to $34,999 | 138 | 10.8% |
| $35,000 to $49,999 | 185 | 14.4% |
| $50,000 to $74,999 | 192 | 15.0% |
| $75,000 to $99,999 | 181 | 14.1% |
| $100,000 to $149,999 | 100 | 7.8% |
| $150,000 to $199,999 | 26 | 2.0% |
| $200,000+ | 97 | 7.6% |
Household Income by Householder Age in Red Lodge
The median household income in Red Lodge is $39,472, with the highest median household income of $75,938 found in the 65+ years age bracket for the primary householder. A total of 379 households (29.6%) fall into this category. Meanwhile, the 15 to 24 years age bracket for the primary householder has the lowest median household income of $0, with 53 households (4.1%) in this group.
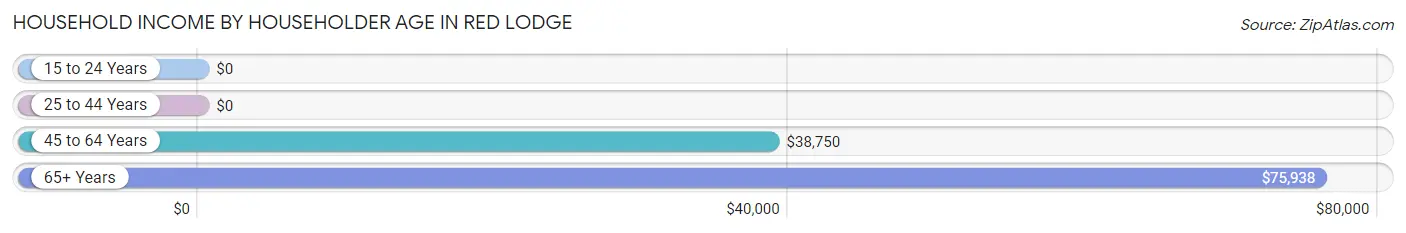
| Income Bracket | # Households | Median Income |
| 15 to 24 Years | 53 (4.1%) | $0 |
| 25 to 44 Years | 366 (28.5%) | $0 |
| 45 to 64 Years | 484 (37.8%) | $38,750 |
| 65+ Years | 379 (29.6%) | $75,938 |
| Total | 1,282 (100.0%) | $39,472 |
Poverty in Red Lodge
Income Below Poverty by Sex and Age in Red Lodge
With 8.8% poverty level for males and 17.5% for females among the residents of Red Lodge, under 5 year old males and under 5 year old females are the most vulnerable to poverty, with 44 males (100.0%) and 33 females (89.2%) in their respective age groups living below the poverty level.
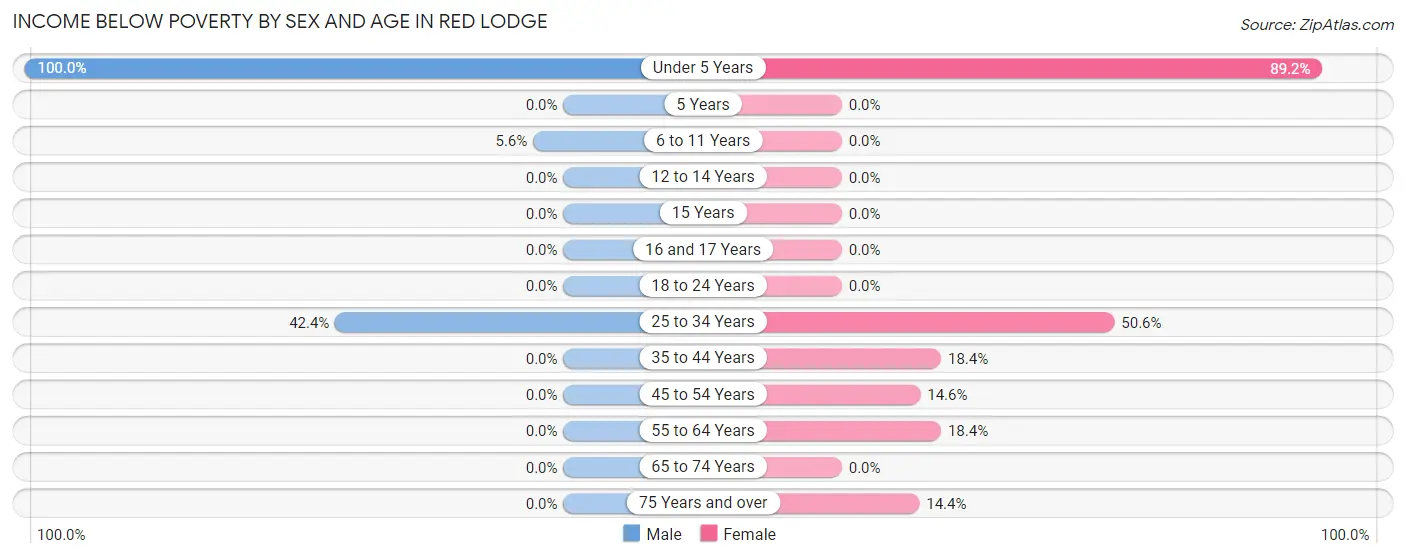
| Age Bracket | Male | Female |
| Under 5 Years | 44 (100.0%) | 33 (89.2%) |
| 5 Years | 0 (0.0%) | 0 (0.0%) |
| 6 to 11 Years | 6 (5.6%) | 0 (0.0%) |
| 12 to 14 Years | 0 (0.0%) | 0 (0.0%) |
| 15 Years | 0 (0.0%) | 0 (0.0%) |
| 16 and 17 Years | 0 (0.0%) | 0 (0.0%) |
| 18 to 24 Years | 0 (0.0%) | 0 (0.0%) |
| 25 to 34 Years | 36 (42.3%) | 43 (50.6%) |
| 35 to 44 Years | 0 (0.0%) | 42 (18.4%) |
| 45 to 54 Years | 0 (0.0%) | 22 (14.6%) |
| 55 to 64 Years | 0 (0.0%) | 51 (18.4%) |
| 65 to 74 Years | 0 (0.0%) | 0 (0.0%) |
| 75 Years and over | 0 (0.0%) | 20 (14.4%) |
| Total | 86 (8.8%) | 211 (17.5%) |
Income Above Poverty by Sex and Age in Red Lodge
According to the poverty statistics in Red Lodge, males aged 15 years and females aged 5 years are the age groups that are most secure financially, with 100.0% of males and 100.0% of females in these age groups living above the poverty line.
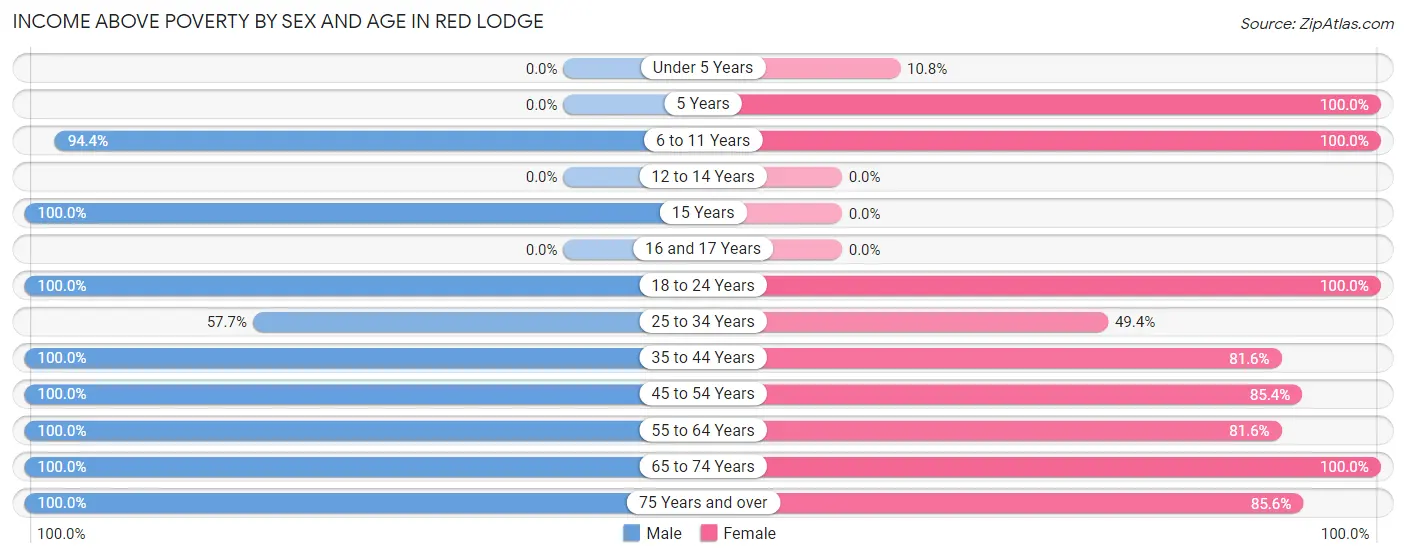
| Age Bracket | Male | Female |
| Under 5 Years | 0 (0.0%) | 4 (10.8%) |
| 5 Years | 0 (0.0%) | 4 (100.0%) |
| 6 to 11 Years | 101 (94.4%) | 43 (100.0%) |
| 12 to 14 Years | 0 (0.0%) | 0 (0.0%) |
| 15 Years | 29 (100.0%) | 0 (0.0%) |
| 16 and 17 Years | 0 (0.0%) | 0 (0.0%) |
| 18 to 24 Years | 53 (100.0%) | 80 (100.0%) |
| 25 to 34 Years | 49 (57.7%) | 42 (49.4%) |
| 35 to 44 Years | 64 (100.0%) | 186 (81.6%) |
| 45 to 54 Years | 100 (100.0%) | 129 (85.4%) |
| 55 to 64 Years | 239 (100.0%) | 226 (81.6%) |
| 65 to 74 Years | 189 (100.0%) | 162 (100.0%) |
| 75 Years and over | 72 (100.0%) | 119 (85.6%) |
| Total | 896 (91.2%) | 995 (82.5%) |
Income Below Poverty Among Married-Couple Families in Red Lodge
The poverty statistics for married-couple families in Red Lodge show that 10.0% or 43 of the total 432 families live below the poverty line. Families with 3 or 4 children have the highest poverty rate of 100.0%, comprising of 43 families. On the other hand, families with no children have the lowest poverty rate of 0.0%, which includes 0 families.
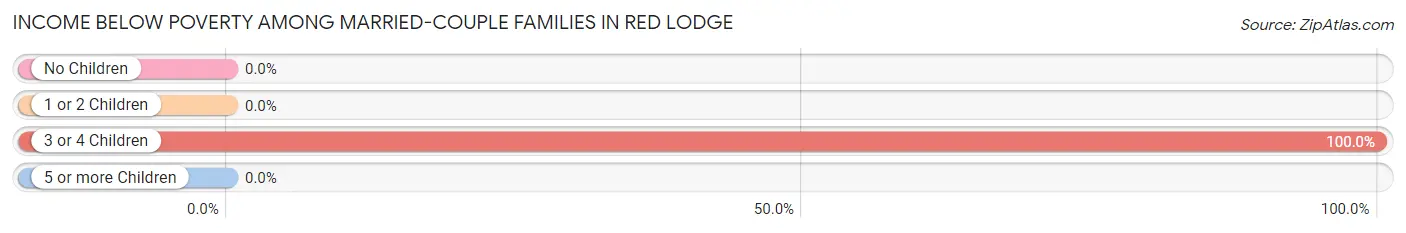
| Children | Above Poverty | Below Poverty |
| No Children | 367 (100.0%) | 0 (0.0%) |
| 1 or 2 Children | 22 (100.0%) | 0 (0.0%) |
| 3 or 4 Children | 0 (0.0%) | 43 (100.0%) |
| 5 or more Children | 0 (0.0%) | 0 (0.0%) |
| Total | 389 (90.0%) | 43 (10.0%) |
Income Below Poverty Among Single-Parent Households in Red Lodge
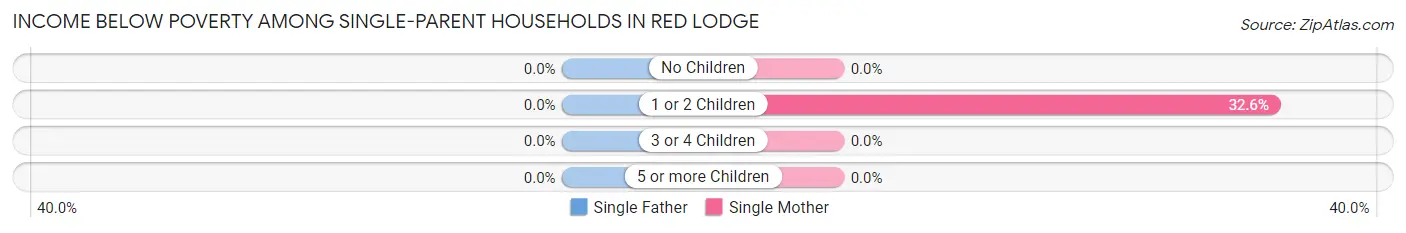
| Children | Single Father | Single Mother |
| No Children | 0 (0.0%) | 0 (0.0%) |
| 1 or 2 Children | 0 (0.0%) | 14 (32.6%) |
| 3 or 4 Children | 0 (0.0%) | 0 (0.0%) |
| 5 or more Children | 0 (0.0%) | 0 (0.0%) |
| Total | 0 (0.0%) | 14 (20.3%) |
Income Below Poverty Among Married-Couple vs Single-Parent Households in Red Lodge
The poverty data for Red Lodge shows that 43 of the married-couple family households (10.0%) and 14 of the single-parent households (10.8%) are living below the poverty level. Within the married-couple family households, those with 3 or 4 children have the highest poverty rate, with 43 households (100.0%) falling below the poverty line. Among the single-parent households, those with 1 or 2 children have the highest poverty rate, with 14 household (16.3%) living below poverty.
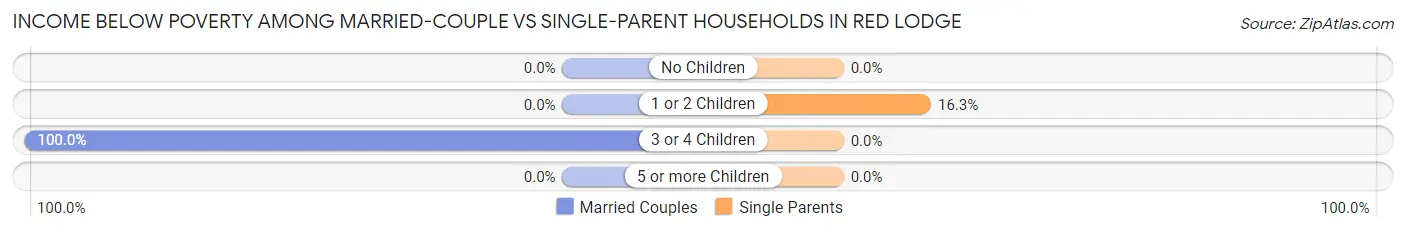
| Children | Married-Couple Families | Single-Parent Households |
| No Children | 0 (0.0%) | 0 (0.0%) |
| 1 or 2 Children | 0 (0.0%) | 14 (16.3%) |
| 3 or 4 Children | 43 (100.0%) | 0 (0.0%) |
| 5 or more Children | 0 (0.0%) | 0 (0.0%) |
| Total | 43 (10.0%) | 14 (10.8%) |
Race in Red Lodge
The most populous races in Red Lodge are White / Caucasian (2,159 | 93.0%), Hispanic or Latino (105 | 4.5%), and Asian (48 | 2.1%).
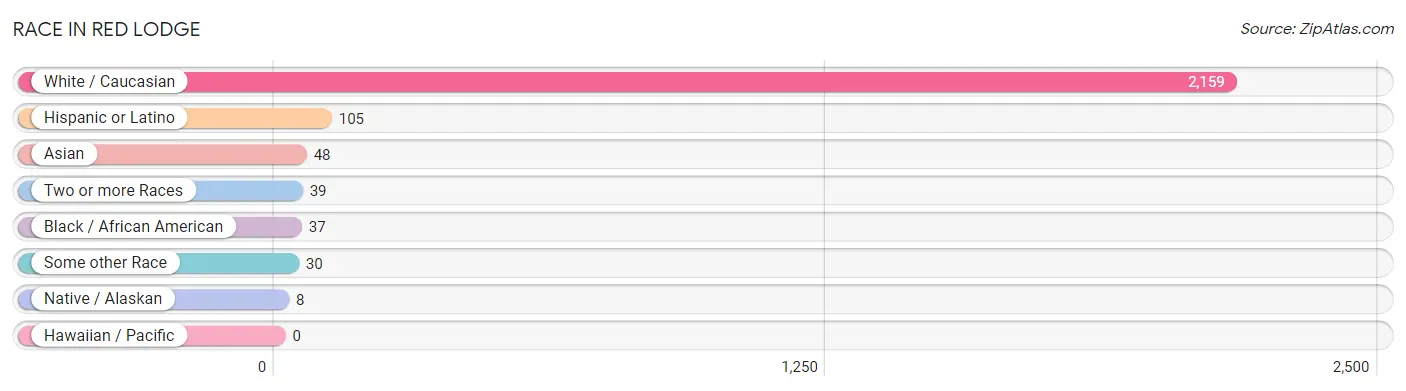
| Race | # Population | % Population |
| Asian | 48 | 2.1% |
| Black / African American | 37 | 1.6% |
| Hawaiian / Pacific | 0 | 0.0% |
| Hispanic or Latino | 105 | 4.5% |
| Native / Alaskan | 8 | 0.3% |
| White / Caucasian | 2,159 | 93.0% |
| Two or more Races | 39 | 1.7% |
| Some other Race | 30 | 1.3% |
| Total | 2,321 | 100.0% |
Ancestry in Red Lodge
The most populous ancestries reported in Red Lodge are German (442 | 19.0%), Norwegian (241 | 10.4%), Irish (239 | 10.3%), English (196 | 8.4%), and French (170 | 7.3%), together accounting for 55.5% of all Red Lodge residents.
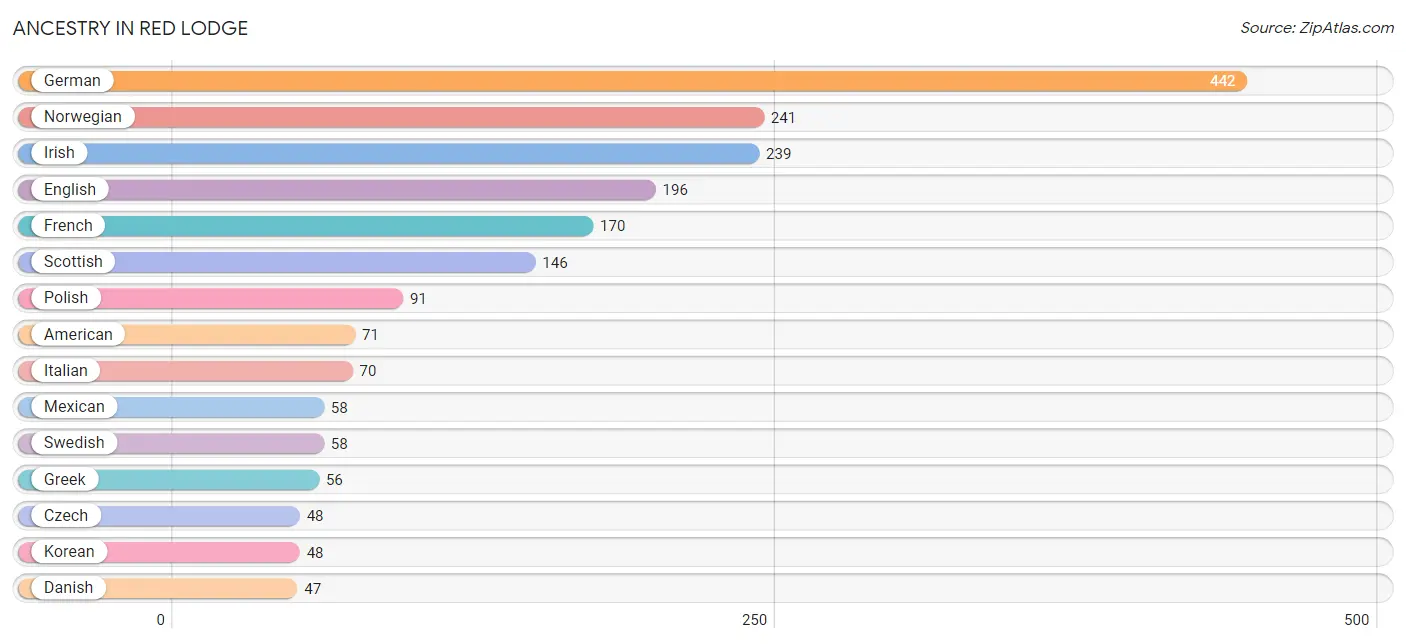
| Ancestry | # Population | % Population |
| American | 71 | 3.1% |
| Argentinean | 25 | 1.1% |
| Canadian | 32 | 1.4% |
| Cheyenne | 4 | 0.2% |
| Czech | 48 | 2.1% |
| Danish | 47 | 2.0% |
| Eastern European | 5 | 0.2% |
| English | 196 | 8.4% |
| European | 29 | 1.3% |
| Finnish | 29 | 1.3% |
| French | 170 | 7.3% |
| French Canadian | 25 | 1.1% |
| German | 442 | 19.0% |
| Greek | 56 | 2.4% |
| Irish | 239 | 10.3% |
| Italian | 70 | 3.0% |
| Korean | 48 | 2.1% |
| Mexican | 58 | 2.5% |
| Norwegian | 241 | 10.4% |
| Peruvian | 13 | 0.6% |
| Polish | 91 | 3.9% |
| Scandinavian | 39 | 1.7% |
| Scotch-Irish | 39 | 1.7% |
| Scottish | 146 | 6.3% |
| Slovak | 3 | 0.1% |
| South American | 38 | 1.6% |
| Spanish | 9 | 0.4% |
| Swedish | 58 | 2.5% |
| Welsh | 20 | 0.9% | View All 29 Rows |
Immigrants in Red Lodge
The most numerous immigrant groups reported in Red Lodge came from Asia (68 | 2.9%), South Central Asia (48 | 2.1%), Sri Lanka (31 | 1.3%), Argentina (25 | 1.1%), and Latin America (25 | 1.1%), together accounting for 8.5% of all Red Lodge residents.
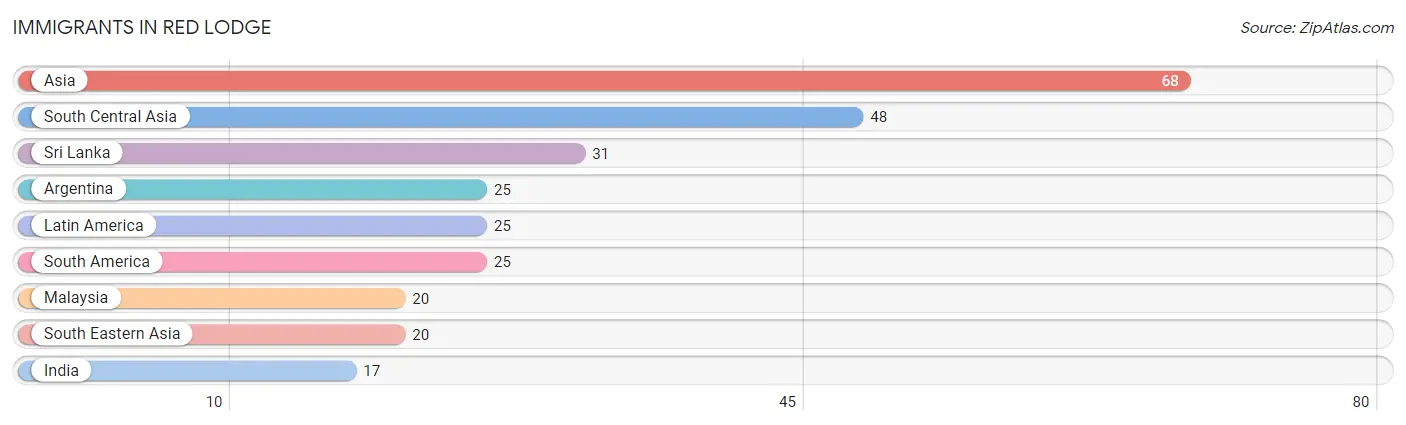
| Immigration Origin | # Population | % Population |
| Argentina | 25 | 1.1% |
| Asia | 68 | 2.9% |
| India | 17 | 0.7% |
| Latin America | 25 | 1.1% |
| Malaysia | 20 | 0.9% |
| South America | 25 | 1.1% |
| South Central Asia | 48 | 2.1% |
| South Eastern Asia | 20 | 0.9% |
| Sri Lanka | 31 | 1.3% | View All 9 Rows |
Sex and Age in Red Lodge
Sex and Age in Red Lodge
The most populous age groups in Red Lodge are 5 to 9 Years (155 | 14.4%) for men and 60 to 64 Years (214 | 17.2%) for women.
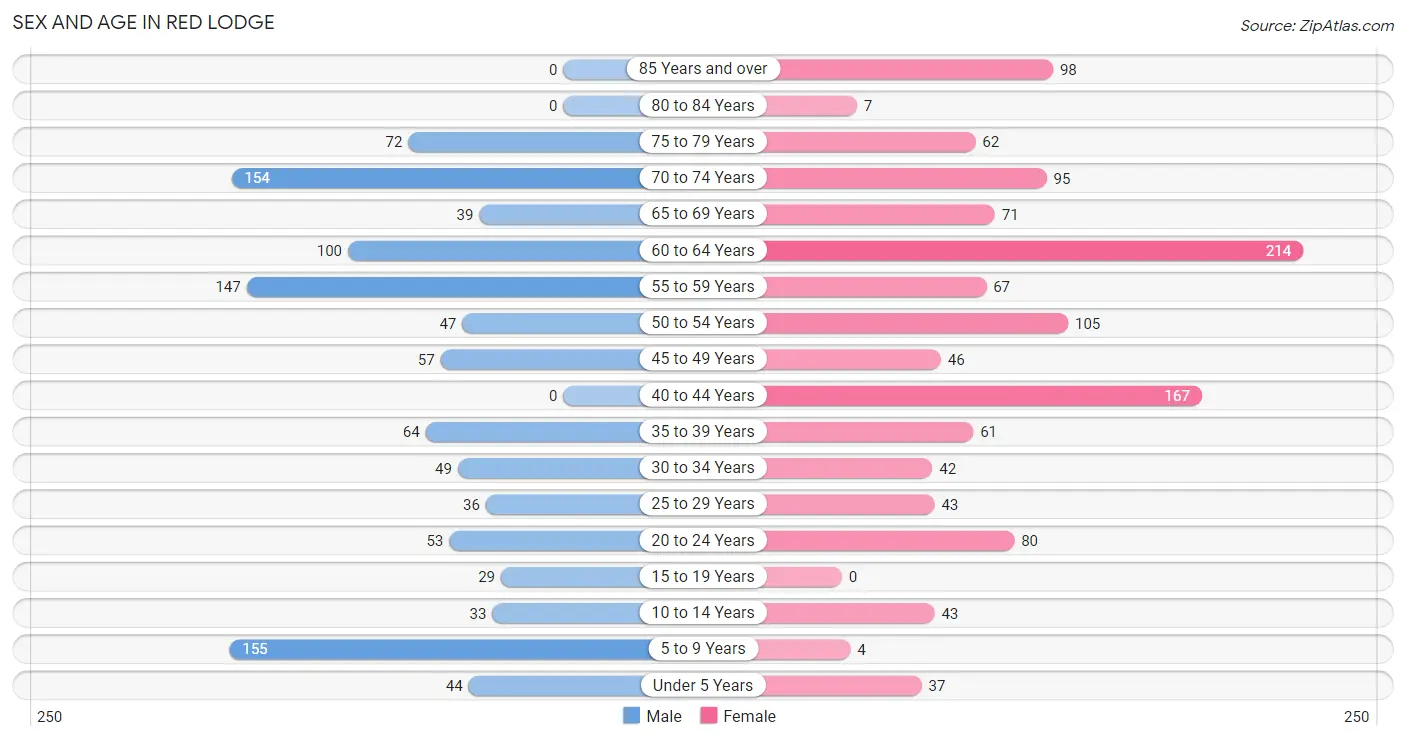
| Age Bracket | Male | Female |
| Under 5 Years | 44 (4.1%) | 37 (3.0%) |
| 5 to 9 Years | 155 (14.4%) | 4 (0.3%) |
| 10 to 14 Years | 33 (3.1%) | 43 (3.5%) |
| 15 to 19 Years | 29 (2.7%) | 0 (0.0%) |
| 20 to 24 Years | 53 (4.9%) | 80 (6.4%) |
| 25 to 29 Years | 36 (3.3%) | 43 (3.5%) |
| 30 to 34 Years | 49 (4.5%) | 42 (3.4%) |
| 35 to 39 Years | 64 (5.9%) | 61 (4.9%) |
| 40 to 44 Years | 0 (0.0%) | 167 (13.5%) |
| 45 to 49 Years | 57 (5.3%) | 46 (3.7%) |
| 50 to 54 Years | 47 (4.4%) | 105 (8.5%) |
| 55 to 59 Years | 147 (13.6%) | 67 (5.4%) |
| 60 to 64 Years | 100 (9.3%) | 214 (17.2%) |
| 65 to 69 Years | 39 (3.6%) | 71 (5.7%) |
| 70 to 74 Years | 154 (14.3%) | 95 (7.6%) |
| 75 to 79 Years | 72 (6.7%) | 62 (5.0%) |
| 80 to 84 Years | 0 (0.0%) | 7 (0.6%) |
| 85 Years and over | 0 (0.0%) | 98 (7.9%) |
| Total | 1,079 (100.0%) | 1,242 (100.0%) |
Families and Households in Red Lodge
Median Family Size in Red Lodge
The median family size in Red Lodge is 2.46 persons per family, with single female/mother families (69 | 12.3%) accounting for the largest median family size of 3.58 persons per family. On the other hand, married-couple families (432 | 76.9%) represent the smallest median family size with 2.26 persons per family.
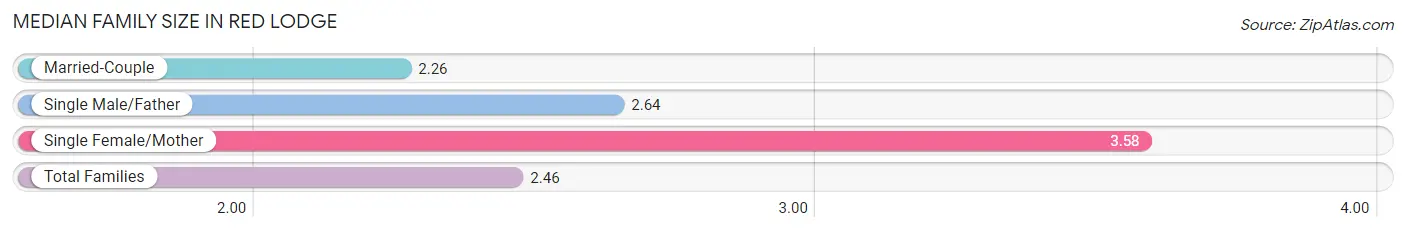
| Family Type | # Families | Family Size |
| Married-Couple | 432 (76.9%) | 2.26 |
| Single Male/Father | 61 (10.8%) | 2.64 |
| Single Female/Mother | 69 (12.3%) | 3.58 |
| Total Families | 562 (100.0%) | 2.46 |
Median Household Size in Red Lodge
The median household size in Red Lodge is 1.76 persons per household, with single female/mother households (69 | 5.4%) accounting for the largest median household size of 3.58 persons per household. non-family households (720 | 56.2%) represent the smallest median household size with 1.17 persons per household.
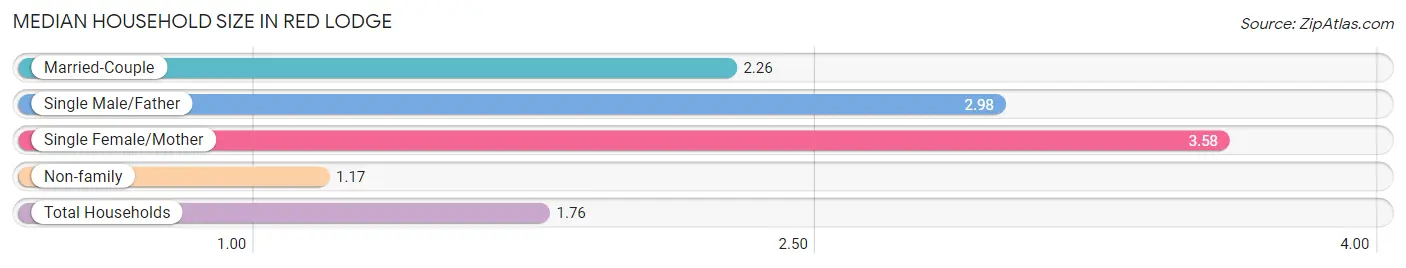
| Household Type | # Households | Household Size |
| Married-Couple | 432 (33.7%) | 2.26 |
| Single Male/Father | 61 (4.8%) | 2.98 |
| Single Female/Mother | 69 (5.4%) | 3.58 |
| Non-family | 720 (56.2%) | 1.17 |
| Total Households | 1,282 (100.0%) | 1.76 |
Household Size by Marriage Status in Red Lodge
Out of a total of 1,282 households in Red Lodge, 562 (43.8%) are family households, while 720 (56.2%) are nonfamily households. The most numerous type of family households are 2-person households, comprising 418, and the most common type of nonfamily households are 1-person households, comprising 611.
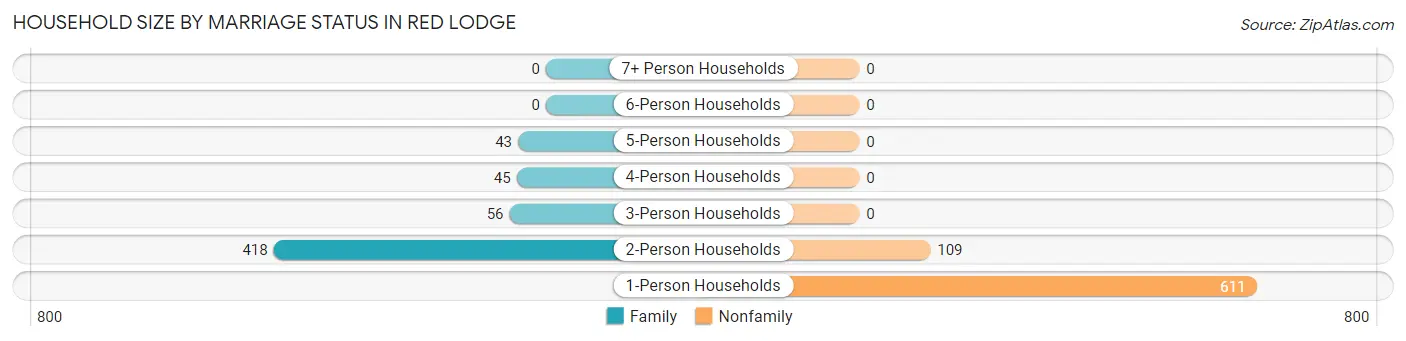
| Household Size | Family Households | Nonfamily Households |
| 1-Person Households | - | 611 (47.7%) |
| 2-Person Households | 418 (32.6%) | 109 (8.5%) |
| 3-Person Households | 56 (4.4%) | 0 (0.0%) |
| 4-Person Households | 45 (3.5%) | 0 (0.0%) |
| 5-Person Households | 43 (3.4%) | 0 (0.0%) |
| 6-Person Households | 0 (0.0%) | 0 (0.0%) |
| 7+ Person Households | 0 (0.0%) | 0 (0.0%) |
| Total | 562 (43.8%) | 720 (56.2%) |
Female Fertility in Red Lodge
Fertility by Age in Red Lodge
Average fertility rate in Red Lodge is 96.0 births per 1,000 women. Women in the age bracket of 20 to 34 years have the highest fertility rate with 261.0 births per 1,000 women. Women in the age bracket of 20 to 34 years acount for 100.0% of all women with births.
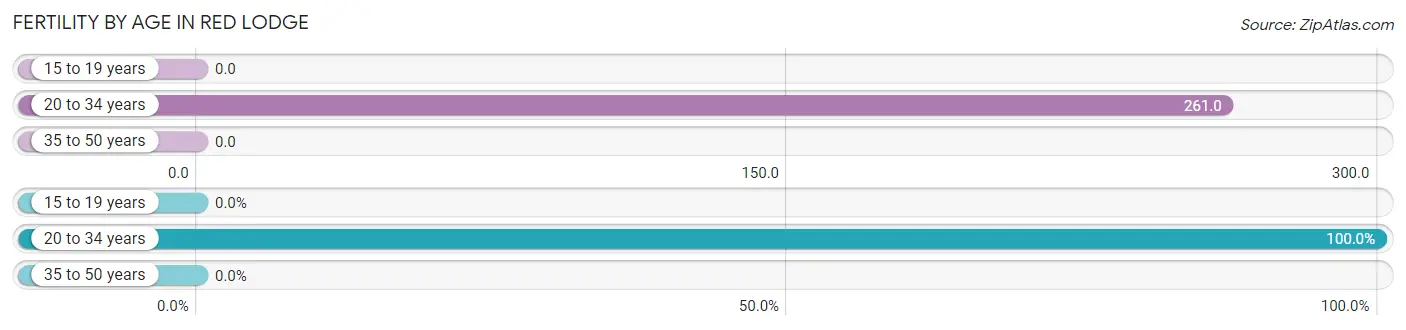
| Age Bracket | Women with Births | Births / 1,000 Women |
| 15 to 19 years | 0 (0.0%) | 0.0 |
| 20 to 34 years | 43 (100.0%) | 261.0 |
| 35 to 50 years | 0 (0.0%) | 0.0 |
| Total | 43 (100.0%) | 96.0 |
Fertility by Age by Marriage Status in Red Lodge
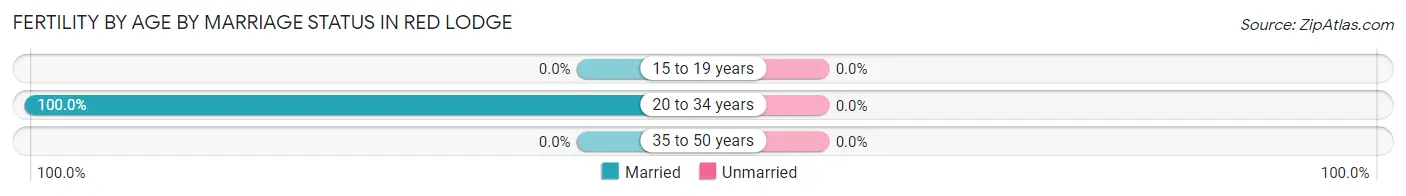
| Age Bracket | Married | Unmarried |
| 15 to 19 years | 0 (0.0%) | 0 (0.0%) |
| 20 to 34 years | 43 (100.0%) | 0 (0.0%) |
| 35 to 50 years | 0 (0.0%) | 0 (0.0%) |
| Total | 43 (100.0%) | 0 (0.0%) |
Fertility by Education in Red Lodge
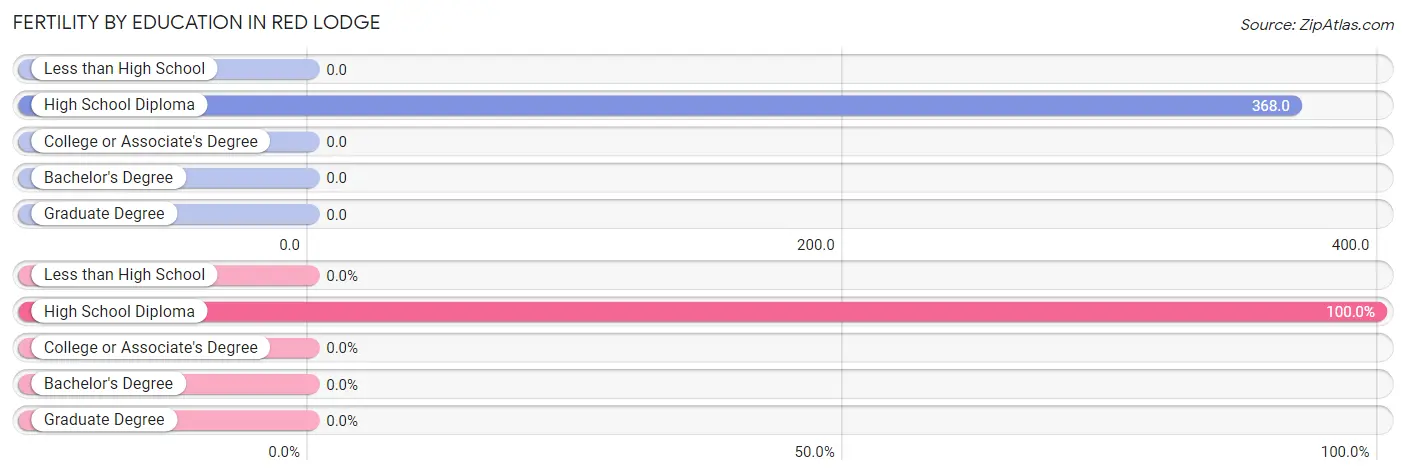
| Educational Attainment | Women with Births | Births / 1,000 Women |
| Less than High School | 0 (0.0%) | 0.0 |
| High School Diploma | 43 (100.0%) | 368.0 |
| College or Associate's Degree | 0 (0.0%) | 0.0 |
| Bachelor's Degree | 0 (0.0%) | 0.0 |
| Graduate Degree | 0 (0.0%) | 0.0 |
| Total | 43 (100.0%) | 96.0 |
Fertility by Education by Marriage Status in Red Lodge
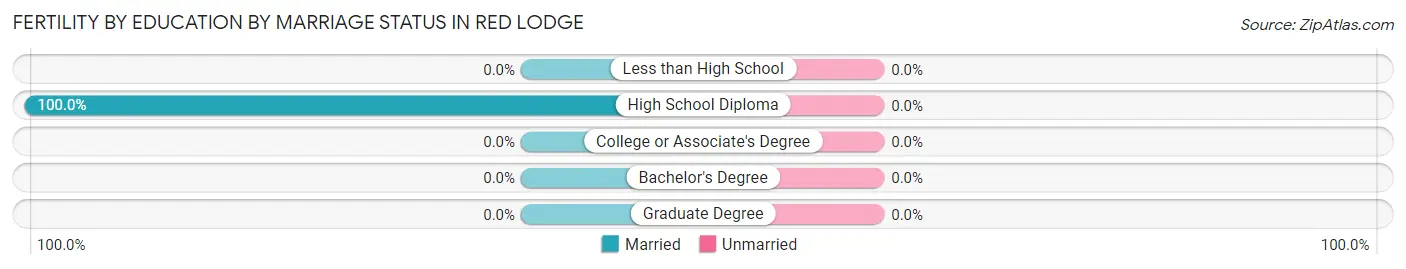
| Educational Attainment | Married | Unmarried |
| Less than High School | 0 (0.0%) | 0 (0.0%) |
| High School Diploma | 43 (100.0%) | 0 (0.0%) |
| College or Associate's Degree | 0 (0.0%) | 0 (0.0%) |
| Bachelor's Degree | 0 (0.0%) | 0 (0.0%) |
| Graduate Degree | 0 (0.0%) | 0 (0.0%) |
| Total | 43 (100.0%) | 0 (0.0%) |
Employment Characteristics in Red Lodge
Employment by Class of Employer in Red Lodge
Among the 1,108 employed individuals in Red Lodge, private company employees (665 | 60.0%), not-for-profit organizations (208 | 18.8%), and self-employed (incorporated) (138 | 12.4%) make up the most common classes of employment.
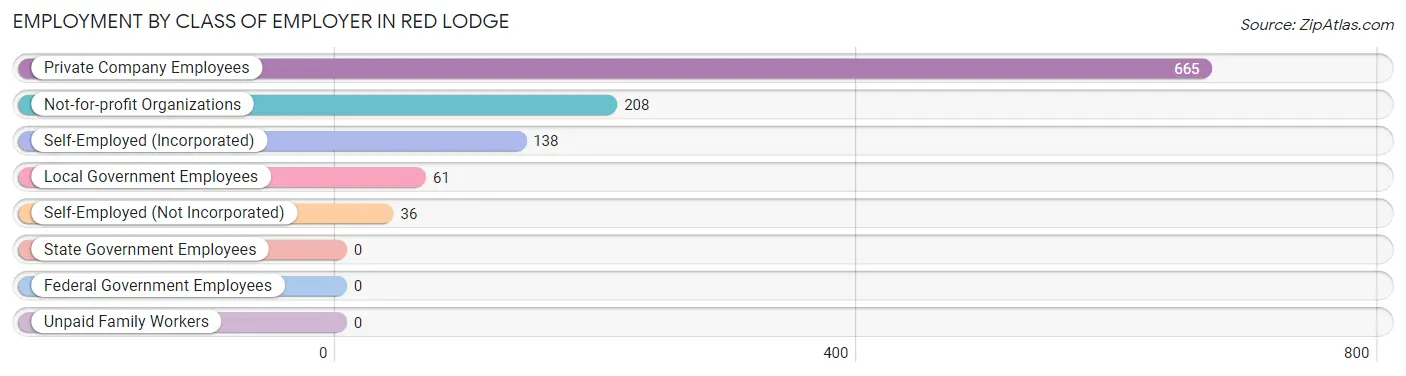
| Employer Class | # Employees | % Employees |
| Private Company Employees | 665 | 60.0% |
| Self-Employed (Incorporated) | 138 | 12.4% |
| Self-Employed (Not Incorporated) | 36 | 3.3% |
| Not-for-profit Organizations | 208 | 18.8% |
| Local Government Employees | 61 | 5.5% |
| State Government Employees | 0 | 0.0% |
| Federal Government Employees | 0 | 0.0% |
| Unpaid Family Workers | 0 | 0.0% |
| Total | 1,108 | 100.0% |
Employment Status by Age in Red Lodge
According to the labor force statistics for Red Lodge, out of the total population over 16 years of age (1,976), 59.6% or 1,178 individuals are in the labor force, with 4.2% or 49 of them unemployed. The age group with the highest labor force participation rate is 20 to 24 years, with 100.0% or 133 individuals in the labor force. Within the labor force, the 60 to 64 years age range has the highest percentage of unemployed individuals, with 32.2% or 49 of them being unemployed.
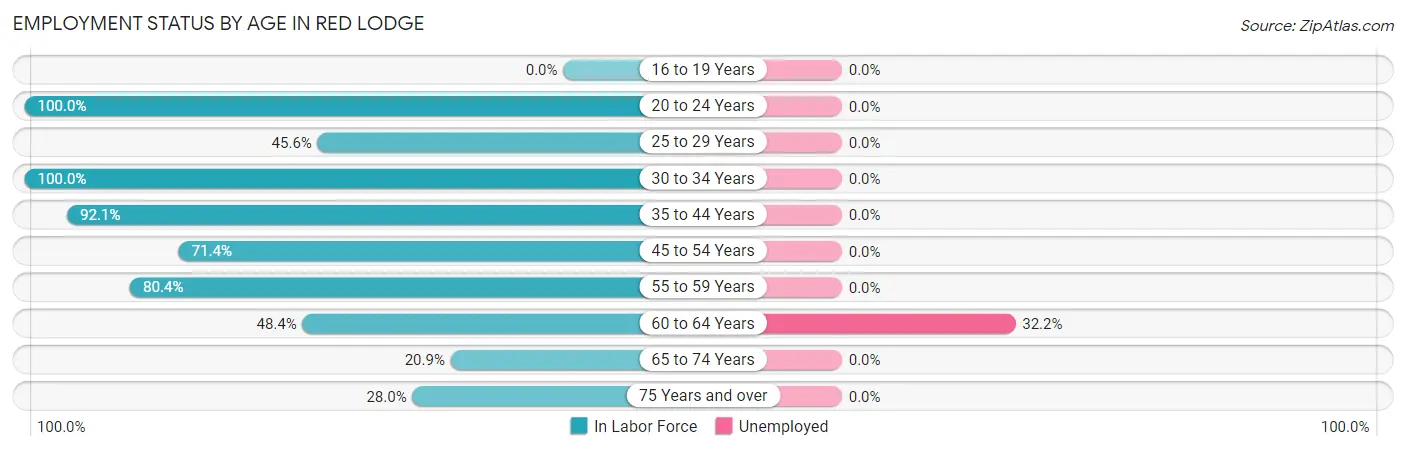
| Age Bracket | In Labor Force | Unemployed |
| 16 to 19 Years | 0 (0.0%) | 0 (0.0%) |
| 20 to 24 Years | 133 (100.0%) | 0 (0.0%) |
| 25 to 29 Years | 36 (45.6%) | 0 (0.0%) |
| 30 to 34 Years | 91 (100.0%) | 0 (0.0%) |
| 35 to 44 Years | 269 (92.1%) | 0 (0.0%) |
| 45 to 54 Years | 182 (71.4%) | 0 (0.0%) |
| 55 to 59 Years | 172 (80.4%) | 0 (0.0%) |
| 60 to 64 Years | 152 (48.4%) | 49 (32.2%) |
| 65 to 74 Years | 75 (20.9%) | 0 (0.0%) |
| 75 Years and over | 67 (28.0%) | 0 (0.0%) |
| Total | 1,178 (59.6%) | 49 (4.2%) |
Employment Status by Educational Attainment in Red Lodge
According to labor force statistics for Red Lodge, 72.4% of individuals (901) out of the total population between 25 and 64 years of age (1,245) are in the labor force, with 5.4% or 49 of them being unemployed. The group with the highest labor force participation rate are those with the educational attainment of bachelor's degree or higher, with 74.5% or 306 individuals in the labor force. Within the labor force, individuals with bachelor's degree or higher education have the highest percentage of unemployment, with 16.0% or 49 of them being unemployed.
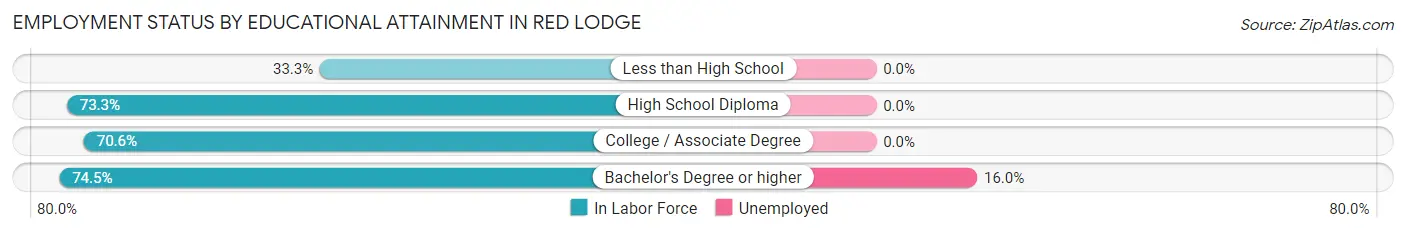
| Educational Attainment | In Labor Force | Unemployed |
| Less than High School | 4 (33.3%) | 0 (0.0%) |
| High School Diploma | 308 (73.3%) | 0 (0.0%) |
| College / Associate Degree | 284 (70.6%) | 0 (0.0%) |
| Bachelor's Degree or higher | 306 (74.5%) | 66 (16.0%) |
| Total | 901 (72.4%) | 67 (5.4%) |
Employment Occupations by Sex in Red Lodge
Management, Business, Science and Arts Occupations
The most common Management, Business, Science and Arts occupations in Red Lodge are Management (156 | 13.8%), Community & Social Service (100 | 8.9%), Health Diagnosing & Treating (85 | 7.5%), Education Instruction & Library (63 | 5.6%), and Health Technologists (61 | 5.4%).
Management, Business, Science and Arts Occupations by Sex
Within the Management, Business, Science and Arts occupations in Red Lodge, the most male-oriented occupations are Computers, Engineering & Science (100.0%), Architecture & Engineering (100.0%), and Life, Physical & Social Science (100.0%), while the most female-oriented occupations are Education Instruction & Library (100.0%), Community & Social Service (80.0%), and Business & Financial (54.3%).
| Occupation | Male | Female |
| Management | 112 (71.8%) | 44 (28.2%) |
| Business & Financial | 16 (45.7%) | 19 (54.3%) |
| Computers, Engineering & Science | 32 (100.0%) | 0 (0.0%) |
| Computers & Mathematics | 0 (0.0%) | 0 (0.0%) |
| Architecture & Engineering | 29 (100.0%) | 0 (0.0%) |
| Life, Physical & Social Science | 3 (100.0%) | 0 (0.0%) |
| Community & Social Service | 20 (20.0%) | 80 (80.0%) |
| Education, Arts & Media | 0 (0.0%) | 0 (0.0%) |
| Legal Services & Support | 0 (0.0%) | 0 (0.0%) |
| Education Instruction & Library | 0 (0.0%) | 63 (100.0%) |
| Arts, Media & Entertainment | 20 (54.0%) | 17 (46.0%) |
| Health Diagnosing & Treating | 73 (85.9%) | 12 (14.1%) |
| Health Technologists | 56 (91.8%) | 5 (8.2%) |
| Total (Category) | 253 (62.0%) | 155 (38.0%) |
| Total (Overall) | 565 (50.1%) | 563 (49.9%) |
Services Occupations
The most common Services occupations in Red Lodge are Food Preparation & Serving (110 | 9.8%), Cleaning & Maintenance (87 | 7.7%), Healthcare Support (66 | 5.9%), and Personal Care & Service (11 | 1.0%).
Services Occupations by Sex
Within the Services occupations in Red Lodge, the most male-oriented occupations are Personal Care & Service (100.0%), and Food Preparation & Serving (72.7%), while the most female-oriented occupations are Healthcare Support (100.0%), Cleaning & Maintenance (100.0%), and Food Preparation & Serving (27.3%).
| Occupation | Male | Female |
| Healthcare Support | 0 (0.0%) | 66 (100.0%) |
| Security & Protection | 0 (0.0%) | 0 (0.0%) |
| Firefighting & Prevention | 0 (0.0%) | 0 (0.0%) |
| Law Enforcement | 0 (0.0%) | 0 (0.0%) |
| Food Preparation & Serving | 80 (72.7%) | 30 (27.3%) |
| Cleaning & Maintenance | 0 (0.0%) | 87 (100.0%) |
| Personal Care & Service | 11 (100.0%) | 0 (0.0%) |
| Total (Category) | 91 (33.2%) | 183 (66.8%) |
| Total (Overall) | 565 (50.1%) | 563 (49.9%) |
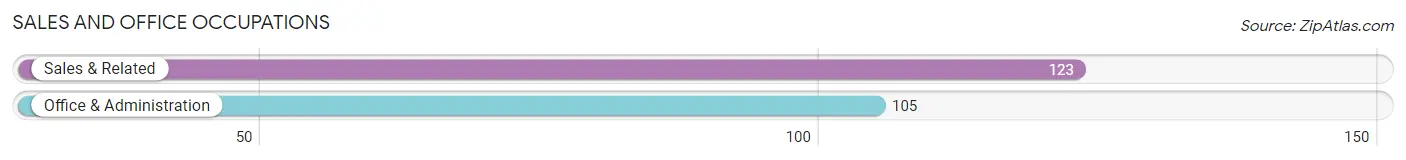
Sales and Office Occupations
The most common Sales and Office occupations in Red Lodge are Sales & Related (123 | 10.9%), and Office & Administration (105 | 9.3%).
Sales and Office Occupations by Sex
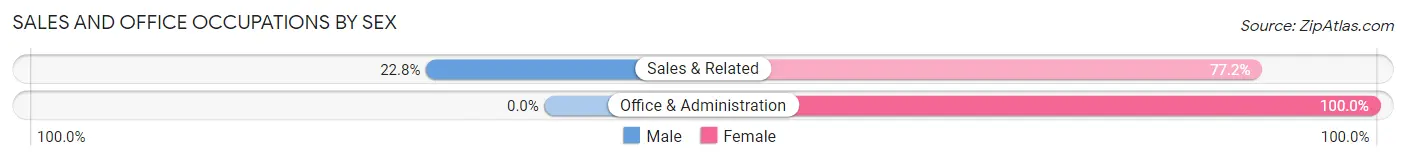
| Occupation | Male | Female |
| Sales & Related | 28 (22.8%) | 95 (77.2%) |
| Office & Administration | 0 (0.0%) | 105 (100.0%) |
| Total (Category) | 28 (12.3%) | 200 (87.7%) |
| Total (Overall) | 565 (50.1%) | 563 (49.9%) |
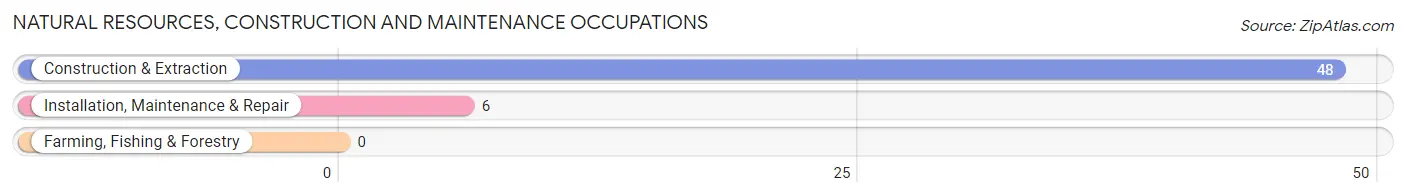
Natural Resources, Construction and Maintenance Occupations
The most common Natural Resources, Construction and Maintenance occupations in Red Lodge are Construction & Extraction (48 | 4.3%), and Installation, Maintenance & Repair (6 | 0.5%).
Natural Resources, Construction and Maintenance Occupations by Sex
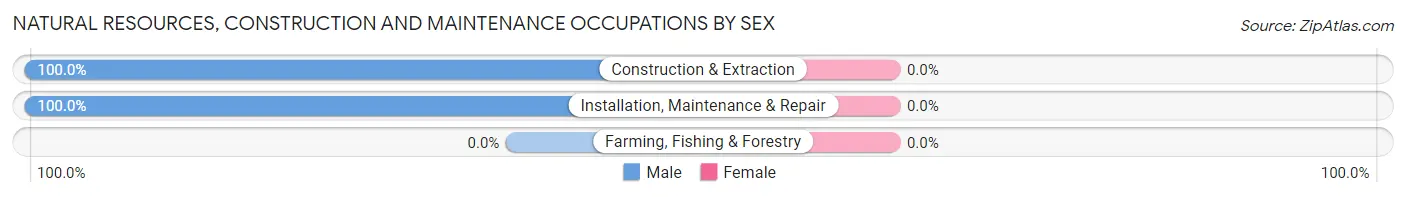
| Occupation | Male | Female |
| Farming, Fishing & Forestry | 0 (0.0%) | 0 (0.0%) |
| Construction & Extraction | 48 (100.0%) | 0 (0.0%) |
| Installation, Maintenance & Repair | 6 (100.0%) | 0 (0.0%) |
| Total (Category) | 54 (100.0%) | 0 (0.0%) |
| Total (Overall) | 565 (50.1%) | 563 (49.9%) |
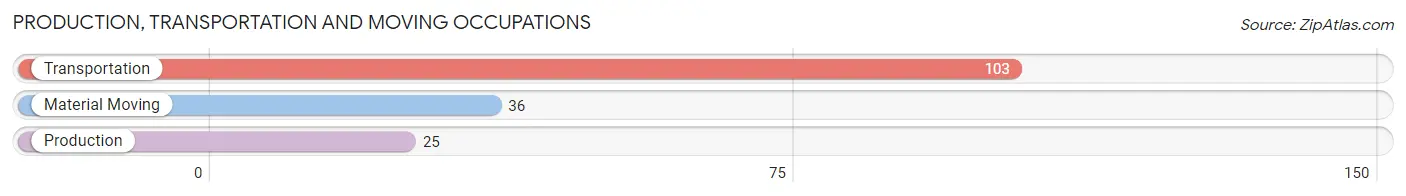
Production, Transportation and Moving Occupations
The most common Production, Transportation and Moving occupations in Red Lodge are Transportation (103 | 9.1%), Material Moving (36 | 3.2%), and Production (25 | 2.2%).
Production, Transportation and Moving Occupations by Sex
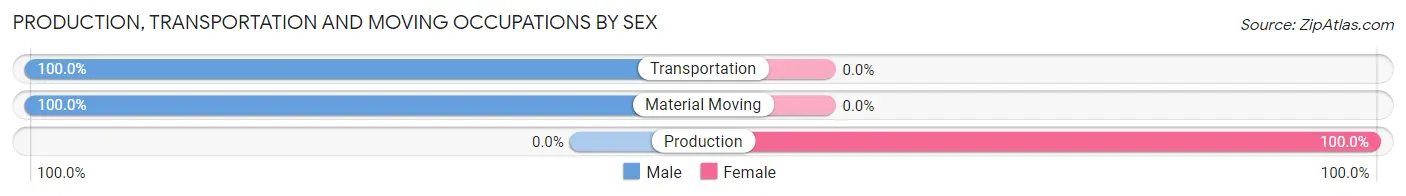
| Occupation | Male | Female |
| Production | 0 (0.0%) | 25 (100.0%) |
| Transportation | 103 (100.0%) | 0 (0.0%) |
| Material Moving | 36 (100.0%) | 0 (0.0%) |
| Total (Category) | 139 (84.8%) | 25 (15.2%) |
| Total (Overall) | 565 (50.1%) | 563 (49.9%) |
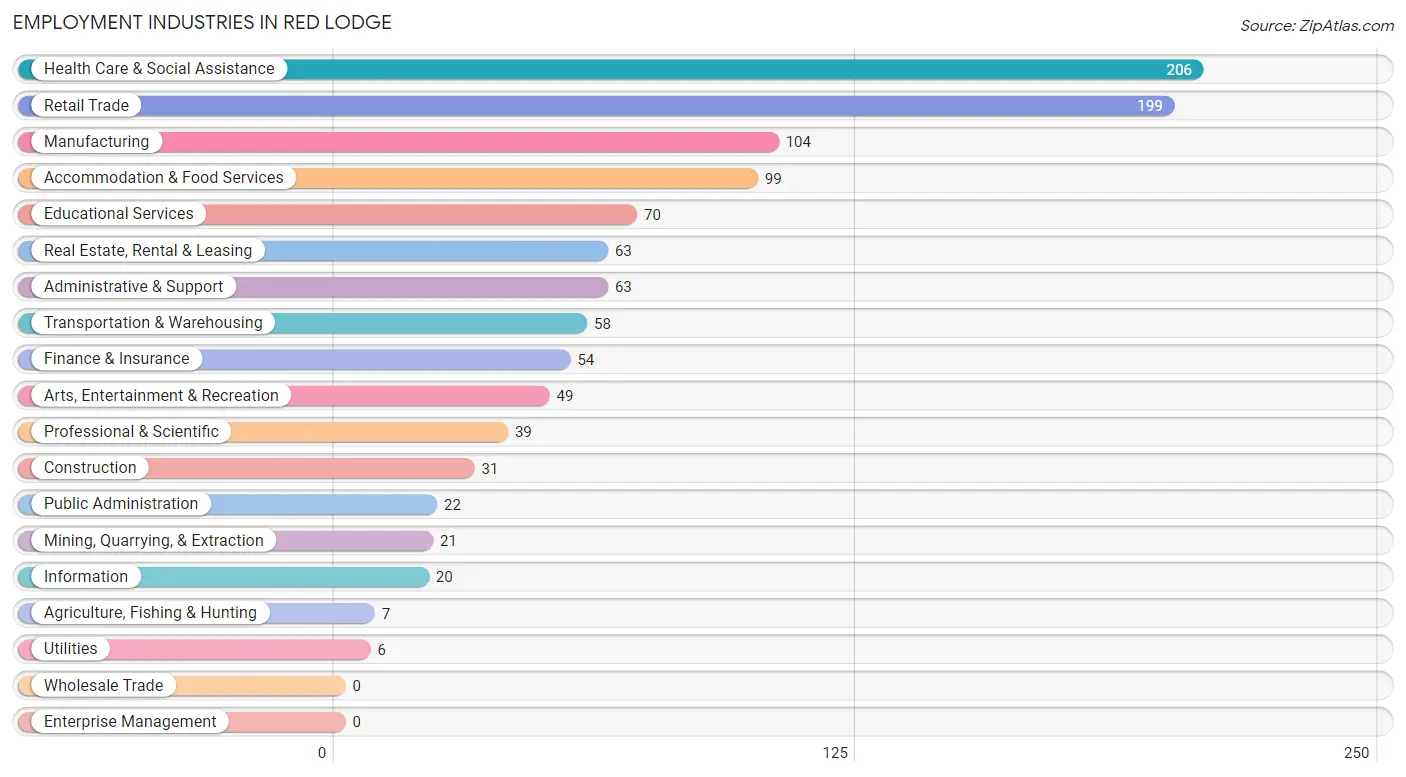
Employment Industries by Sex in Red Lodge
Employment Industries in Red Lodge
The major employment industries in Red Lodge include Health Care & Social Assistance (206 | 18.3%), Retail Trade (199 | 17.6%), Manufacturing (104 | 9.2%), Accommodation & Food Services (99 | 8.8%), and Educational Services (70 | 6.2%).
Employment Industries by Sex in Red Lodge
The Red Lodge industries that see more men than women are Agriculture, Fishing & Hunting (100.0%), Mining, Quarrying, & Extraction (100.0%), and Construction (100.0%), whereas the industries that tend to have a higher number of women are Finance & Insurance (100.0%), Real Estate, Rental & Leasing (100.0%), and Educational Services (100.0%).
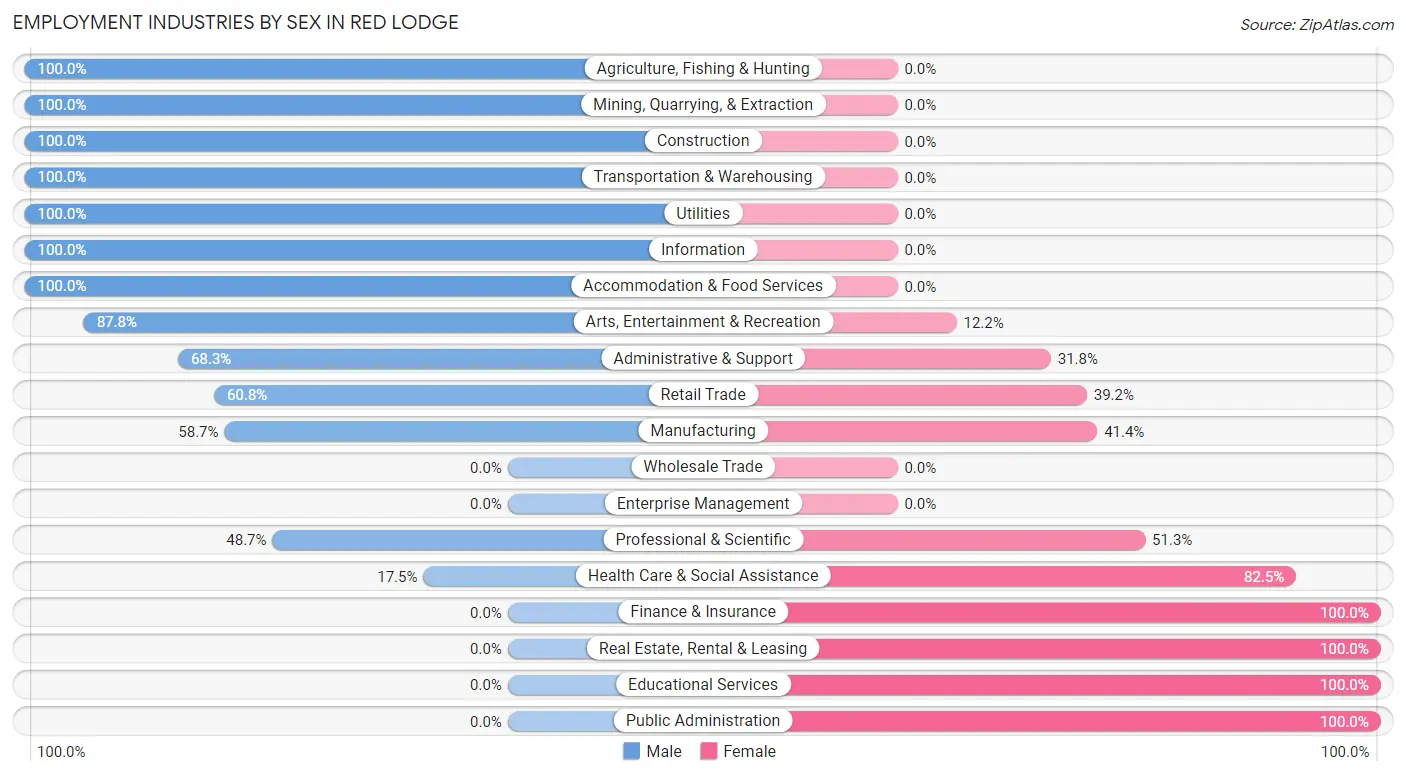
| Industry | Male | Female |
| Agriculture, Fishing & Hunting | 7 (100.0%) | 0 (0.0%) |
| Mining, Quarrying, & Extraction | 21 (100.0%) | 0 (0.0%) |
| Construction | 31 (100.0%) | 0 (0.0%) |
| Manufacturing | 61 (58.7%) | 43 (41.3%) |
| Wholesale Trade | 0 (0.0%) | 0 (0.0%) |
| Retail Trade | 121 (60.8%) | 78 (39.2%) |
| Transportation & Warehousing | 58 (100.0%) | 0 (0.0%) |
| Utilities | 6 (100.0%) | 0 (0.0%) |
| Information | 20 (100.0%) | 0 (0.0%) |
| Finance & Insurance | 0 (0.0%) | 54 (100.0%) |
| Real Estate, Rental & Leasing | 0 (0.0%) | 63 (100.0%) |
| Professional & Scientific | 19 (48.7%) | 20 (51.3%) |
| Enterprise Management | 0 (0.0%) | 0 (0.0%) |
| Administrative & Support | 43 (68.2%) | 20 (31.8%) |
| Educational Services | 0 (0.0%) | 70 (100.0%) |
| Health Care & Social Assistance | 36 (17.5%) | 170 (82.5%) |
| Arts, Entertainment & Recreation | 43 (87.8%) | 6 (12.2%) |
| Accommodation & Food Services | 99 (100.0%) | 0 (0.0%) |
| Public Administration | 0 (0.0%) | 22 (100.0%) |
| Total | 565 (50.1%) | 563 (49.9%) |
Education in Red Lodge
School Enrollment in Red Lodge
The most common levels of schooling among the 242 students in Red Lodge are elementary school (81 | 33.5%), middle school (76 | 31.4%), and graduate / professional (46 | 19.0%).
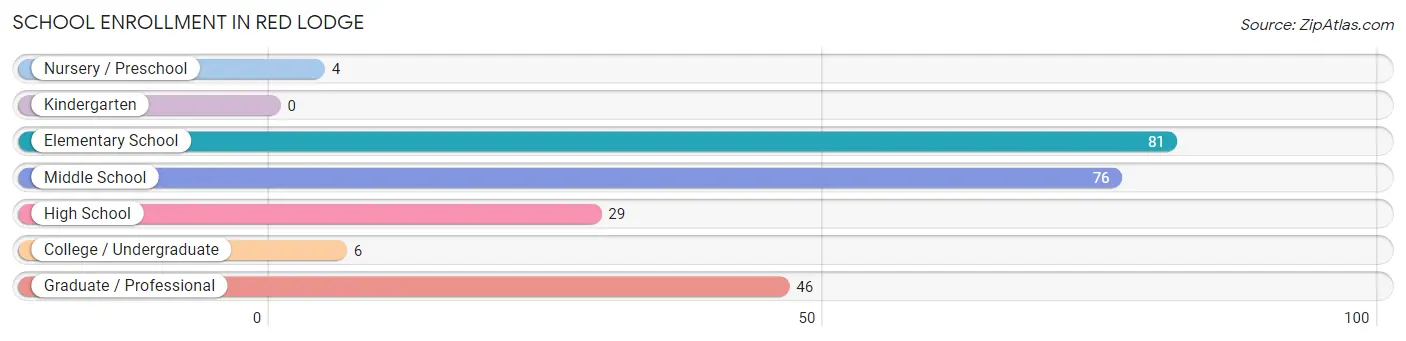
| School Level | # Students | % Students |
| Nursery / Preschool | 4 | 1.7% |
| Kindergarten | 0 | 0.0% |
| Elementary School | 81 | 33.5% |
| Middle School | 76 | 31.4% |
| High School | 29 | 12.0% |
| College / Undergraduate | 6 | 2.5% |
| Graduate / Professional | 46 | 19.0% |
| Total | 242 | 100.0% |
School Enrollment by Age by Funding Source in Red Lodge
Out of a total of 242 students who are enrolled in schools in Red Lodge, 17 (7.0%) attend a private institution, while the remaining 225 (93.0%) are enrolled in public schools. The age group of 35 years and over has the highest likelihood of being enrolled in private schools, with 17 (37.0% in the age bracket) enrolled. Conversely, the age group of 5 to 9 year old has the lowest likelihood of being enrolled in a private school, with 85 (100.0% in the age bracket) attending a public institution.
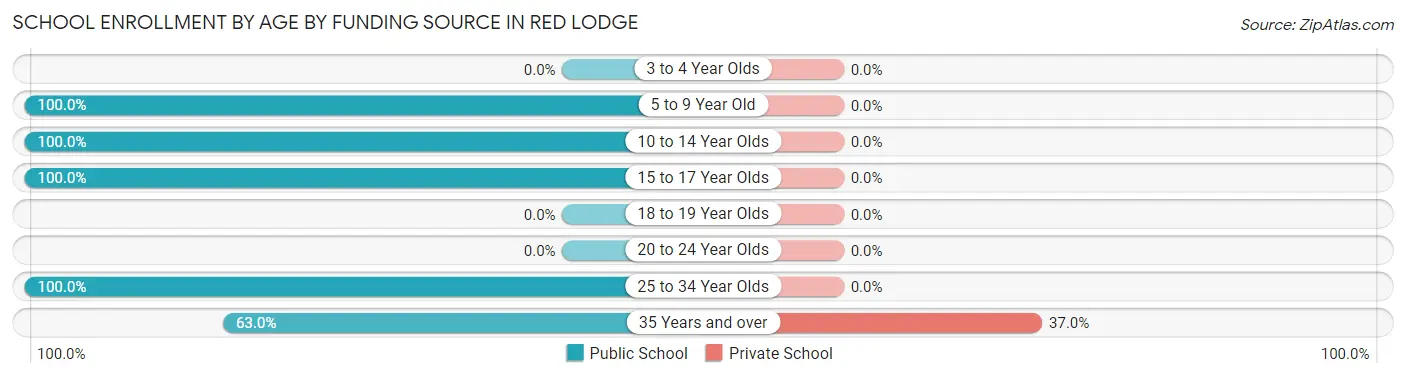
| Age Bracket | Public School | Private School |
| 3 to 4 Year Olds | 0 (0.0%) | 0 (0.0%) |
| 5 to 9 Year Old | 85 (100.0%) | 0 (0.0%) |
| 10 to 14 Year Olds | 76 (100.0%) | 0 (0.0%) |
| 15 to 17 Year Olds | 29 (100.0%) | 0 (0.0%) |
| 18 to 19 Year Olds | 0 (0.0%) | 0 (0.0%) |
| 20 to 24 Year Olds | 0 (0.0%) | 0 (0.0%) |
| 25 to 34 Year Olds | 6 (100.0%) | 0 (0.0%) |
| 35 Years and over | 29 (63.0%) | 17 (37.0%) |
| Total | 225 (93.0%) | 17 (7.0%) |
Educational Attainment by Field of Study in Red Lodge
Social sciences (130 | 15.3%), education (127 | 14.9%), business (96 | 11.3%), arts & humanities (91 | 10.7%), and literature & languages (85 | 10.0%) are the most common fields of study among 852 individuals in Red Lodge who have obtained a bachelor's degree or higher.
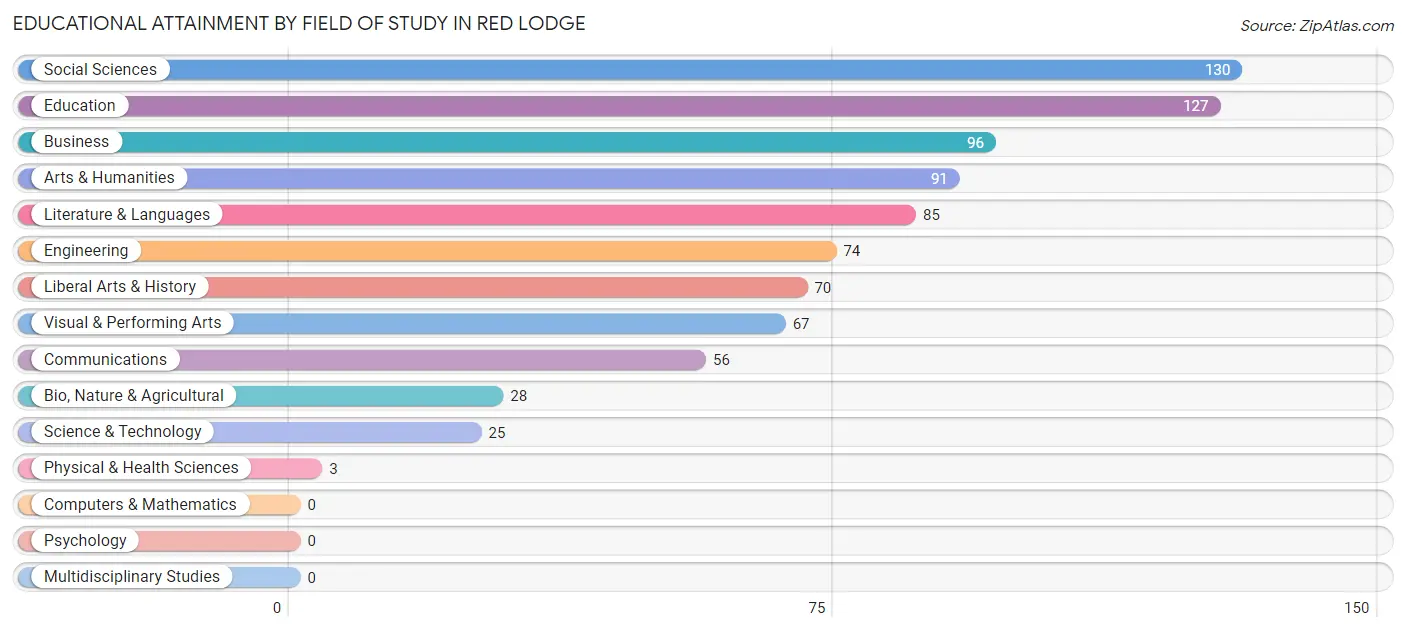
| Field of Study | # Graduates | % Graduates |
| Computers & Mathematics | 0 | 0.0% |
| Bio, Nature & Agricultural | 28 | 3.3% |
| Physical & Health Sciences | 3 | 0.4% |
| Psychology | 0 | 0.0% |
| Social Sciences | 130 | 15.3% |
| Engineering | 74 | 8.7% |
| Multidisciplinary Studies | 0 | 0.0% |
| Science & Technology | 25 | 2.9% |
| Business | 96 | 11.3% |
| Education | 127 | 14.9% |
| Literature & Languages | 85 | 10.0% |
| Liberal Arts & History | 70 | 8.2% |
| Visual & Performing Arts | 67 | 7.9% |
| Communications | 56 | 6.6% |
| Arts & Humanities | 91 | 10.7% |
| Total | 852 | 100.0% |
Transportation & Commute in Red Lodge
Vehicle Availability by Sex in Red Lodge
The most prevalent vehicle ownership categories in Red Lodge are males with 2 vehicles (256, accounting for 45.6%) and females with 2 vehicles (108, making up 48.3%).
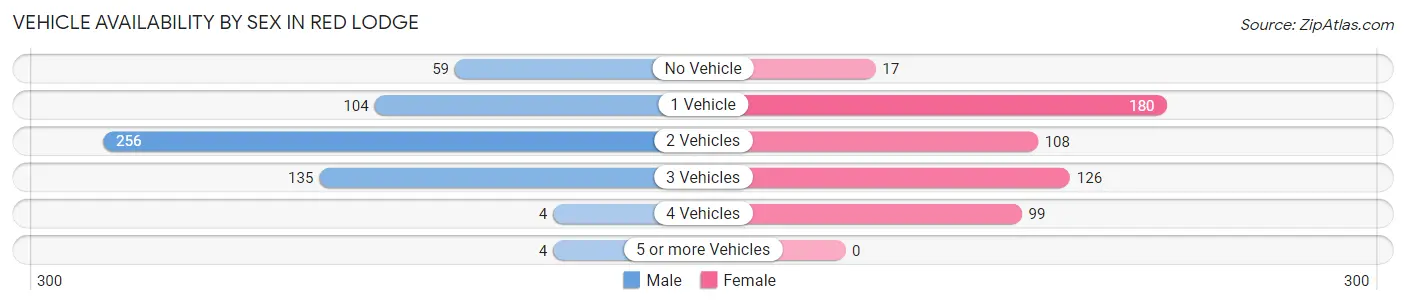
| Vehicles Available | Male | Female |
| No Vehicle | 59 (10.5%) | 17 (3.2%) |
| 1 Vehicle | 104 (18.5%) | 180 (34.0%) |
| 2 Vehicles | 256 (45.6%) | 108 (20.4%) |
| 3 Vehicles | 135 (24.0%) | 126 (23.8%) |
| 4 Vehicles | 4 (0.7%) | 99 (18.7%) |
| 5 or more Vehicles | 4 (0.7%) | 0 (0.0%) |
| Total | 562 (100.0%) | 530 (100.0%) |
Commute Time in Red Lodge
The most frequently occuring commute durations in Red Lodge are 5 to 9 minutes (436 commuters, 43.6%), 10 to 14 minutes (175 commuters, 17.5%), and less than 5 minutes (173 commuters, 17.3%).
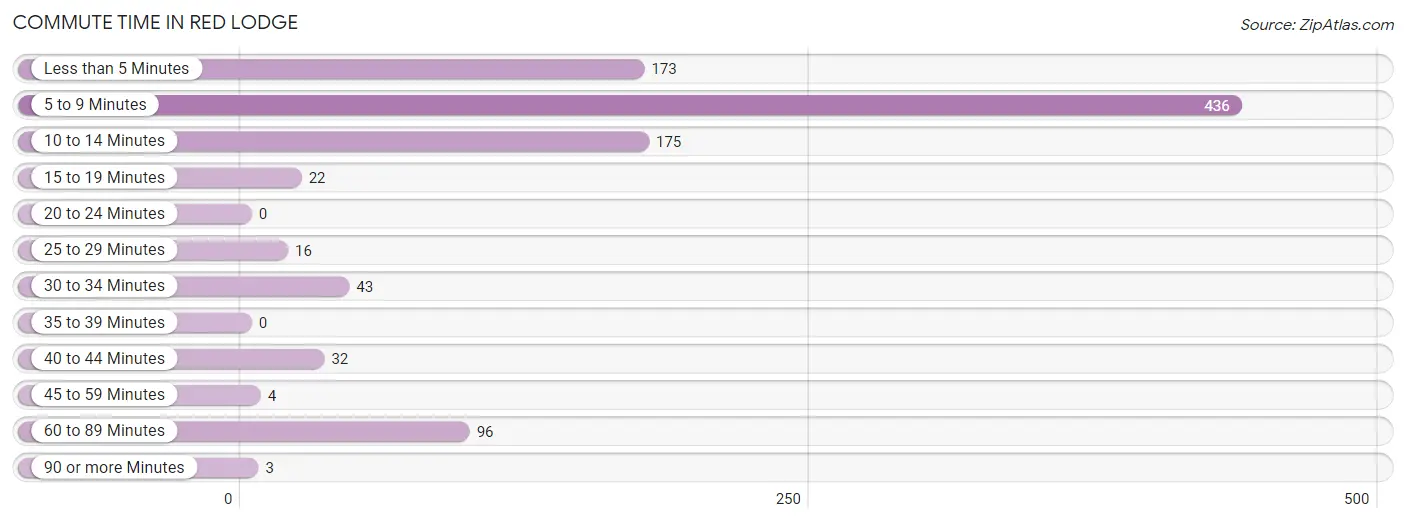
| Commute Time | # Commuters | % Commuters |
| Less than 5 Minutes | 173 | 17.3% |
| 5 to 9 Minutes | 436 | 43.6% |
| 10 to 14 Minutes | 175 | 17.5% |
| 15 to 19 Minutes | 22 | 2.2% |
| 20 to 24 Minutes | 0 | 0.0% |
| 25 to 29 Minutes | 16 | 1.6% |
| 30 to 34 Minutes | 43 | 4.3% |
| 35 to 39 Minutes | 0 | 0.0% |
| 40 to 44 Minutes | 32 | 3.2% |
| 45 to 59 Minutes | 4 | 0.4% |
| 60 to 89 Minutes | 96 | 9.6% |
| 90 or more Minutes | 3 | 0.3% |
Commute Time by Sex in Red Lodge
The most common commute times in Red Lodge are 5 to 9 minutes (164 commuters, 30.4%) for males and 5 to 9 minutes (272 commuters, 59.1%) for females.
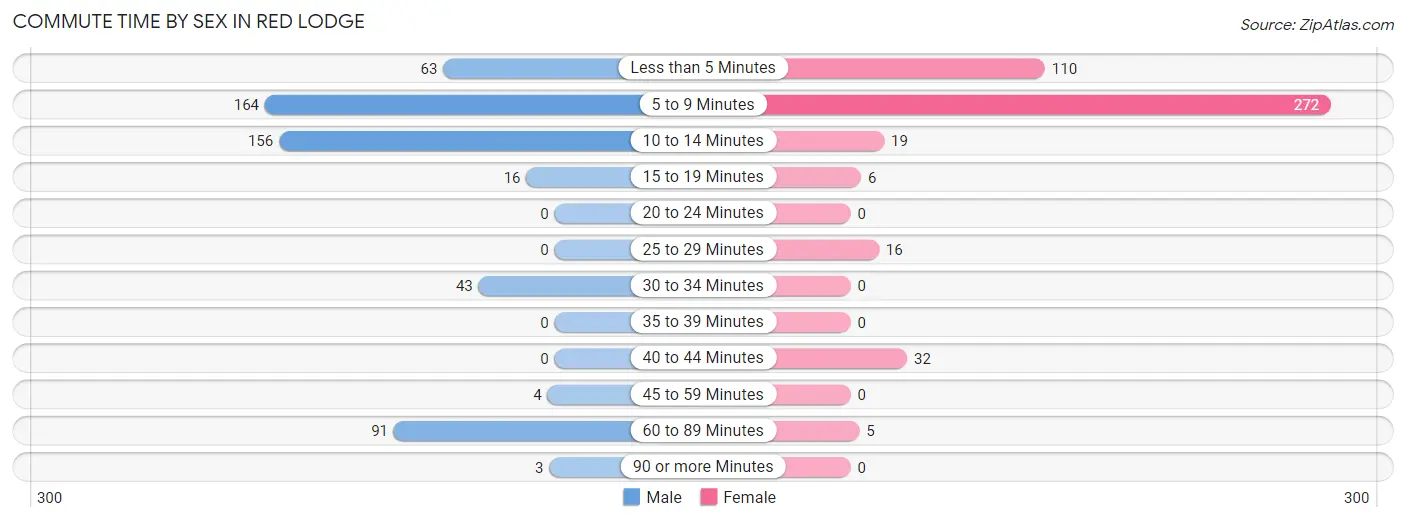
| Commute Time | Male | Female |
| Less than 5 Minutes | 63 (11.7%) | 110 (23.9%) |
| 5 to 9 Minutes | 164 (30.4%) | 272 (59.1%) |
| 10 to 14 Minutes | 156 (28.9%) | 19 (4.1%) |
| 15 to 19 Minutes | 16 (3.0%) | 6 (1.3%) |
| 20 to 24 Minutes | 0 (0.0%) | 0 (0.0%) |
| 25 to 29 Minutes | 0 (0.0%) | 16 (3.5%) |
| 30 to 34 Minutes | 43 (8.0%) | 0 (0.0%) |
| 35 to 39 Minutes | 0 (0.0%) | 0 (0.0%) |
| 40 to 44 Minutes | 0 (0.0%) | 32 (7.0%) |
| 45 to 59 Minutes | 4 (0.7%) | 0 (0.0%) |
| 60 to 89 Minutes | 91 (16.9%) | 5 (1.1%) |
| 90 or more Minutes | 3 (0.6%) | 0 (0.0%) |
Time of Departure to Work by Sex in Red Lodge
The most frequent times of departure to work in Red Lodge are 8:00 AM to 8:29 AM (121, 22.4%) for males and 8:00 AM to 8:29 AM (154, 33.5%) for females.
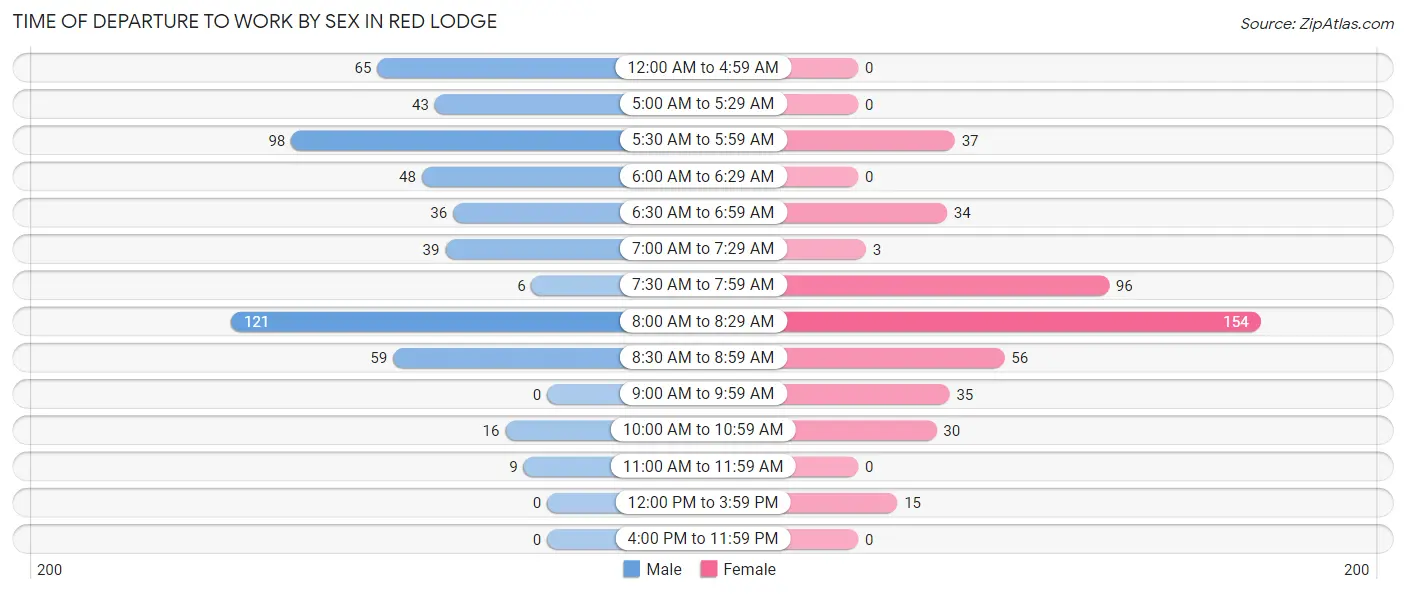
| Time of Departure | Male | Female |
| 12:00 AM to 4:59 AM | 65 (12.0%) | 0 (0.0%) |
| 5:00 AM to 5:29 AM | 43 (8.0%) | 0 (0.0%) |
| 5:30 AM to 5:59 AM | 98 (18.1%) | 37 (8.0%) |
| 6:00 AM to 6:29 AM | 48 (8.9%) | 0 (0.0%) |
| 6:30 AM to 6:59 AM | 36 (6.7%) | 34 (7.4%) |
| 7:00 AM to 7:29 AM | 39 (7.2%) | 3 (0.6%) |
| 7:30 AM to 7:59 AM | 6 (1.1%) | 96 (20.9%) |
| 8:00 AM to 8:29 AM | 121 (22.4%) | 154 (33.5%) |
| 8:30 AM to 8:59 AM | 59 (10.9%) | 56 (12.2%) |
| 9:00 AM to 9:59 AM | 0 (0.0%) | 35 (7.6%) |
| 10:00 AM to 10:59 AM | 16 (3.0%) | 30 (6.5%) |
| 11:00 AM to 11:59 AM | 9 (1.7%) | 0 (0.0%) |
| 12:00 PM to 3:59 PM | 0 (0.0%) | 15 (3.3%) |
| 4:00 PM to 11:59 PM | 0 (0.0%) | 0 (0.0%) |
| Total | 540 (100.0%) | 460 (100.0%) |
Housing Occupancy in Red Lodge
Occupancy by Ownership in Red Lodge
Of the total 1,282 dwellings in Red Lodge, owner-occupied units account for 766 (59.8%), while renter-occupied units make up 516 (40.3%).
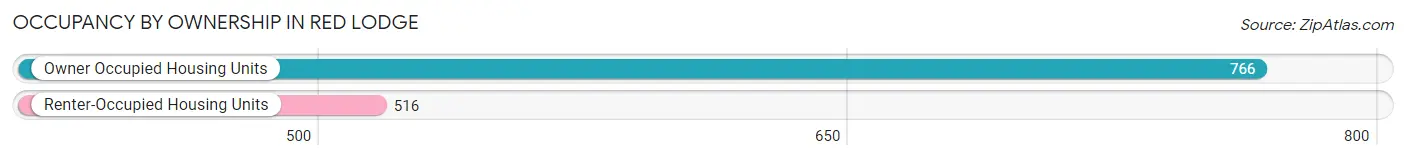
| Occupancy | # Housing Units | % Housing Units |
| Owner Occupied Housing Units | 766 | 59.8% |
| Renter-Occupied Housing Units | 516 | 40.3% |
| Total Occupied Housing Units | 1,282 | 100.0% |
Occupancy by Household Size in Red Lodge
| Household Size | # Housing Units | % Housing Units |
| 1-Person Household | 611 | 47.7% |
| 2-Person Household | 527 | 41.1% |
| 3-Person Household | 56 | 4.4% |
| 4+ Person Household | 88 | 6.9% |
| Total Housing Units | 1,282 | 100.0% |
Occupancy by Ownership by Household Size in Red Lodge
| Household Size | Owner-occupied | Renter-occupied |
| 1-Person Household | 259 (42.4%) | 352 (57.6%) |
| 2-Person Household | 435 (82.5%) | 92 (17.5%) |
| 3-Person Household | 27 (48.2%) | 29 (51.8%) |
| 4+ Person Household | 45 (51.1%) | 43 (48.9%) |
| Total Housing Units | 766 (59.8%) | 516 (40.3%) |
Occupancy by Educational Attainment in Red Lodge
| Household Size | Owner-occupied | Renter-occupied |
| Less than High School | 9 (69.2%) | 4 (30.8%) |
| High School Diploma | 146 (41.7%) | 204 (58.3%) |
| College/Associate Degree | 222 (54.7%) | 184 (45.3%) |
| Bachelor's Degree or higher | 389 (75.8%) | 124 (24.2%) |
Occupancy by Age of Householder in Red Lodge
| Age Bracket | # Households | % Households |
| Under 35 Years | 176 | 13.7% |
| 35 to 44 Years | 243 | 19.0% |
| 45 to 54 Years | 119 | 9.3% |
| 55 to 64 Years | 365 | 28.5% |
| 65 to 74 Years | 224 | 17.5% |
| 75 to 84 Years | 106 | 8.3% |
| 85 Years and Over | 49 | 3.8% |
| Total | 1,282 | 100.0% |
Housing Finances in Red Lodge
Median Income by Occupancy in Red Lodge
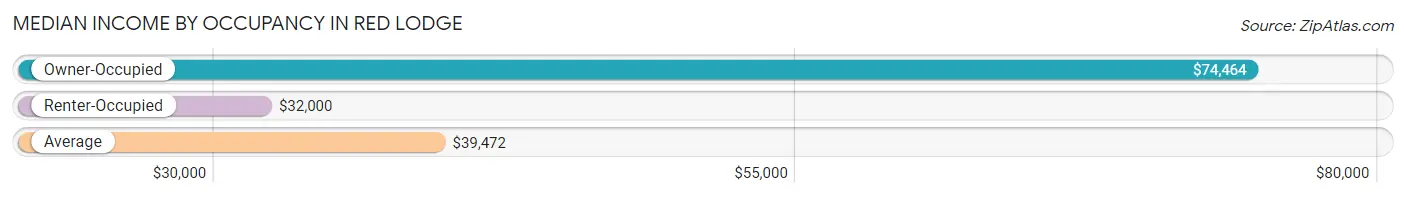
| Occupancy Type | # Households | Median Income |
| Owner-Occupied | 766 (59.8%) | $74,464 |
| Renter-Occupied | 516 (40.3%) | $32,000 |
| Average | 1,282 (100.0%) | $39,472 |
Occupancy by Householder Income Bracket in Red Lodge
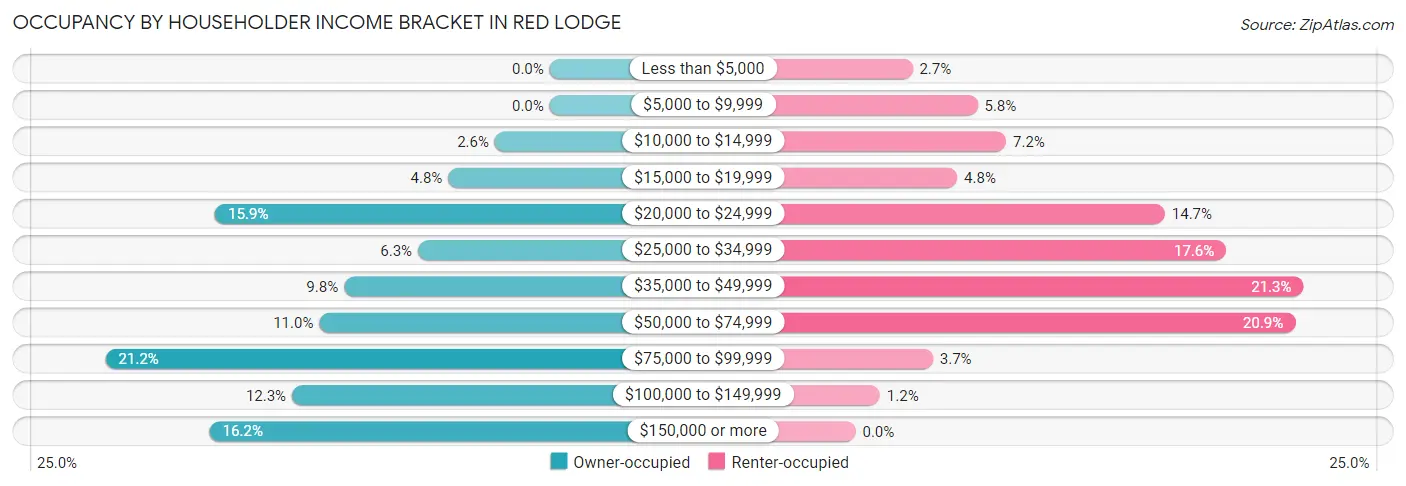
| Income Bracket | Owner-occupied | Renter-occupied |
| Less than $5,000 | 0 (0.0%) | 14 (2.7%) |
| $5,000 to $9,999 | 0 (0.0%) | 30 (5.8%) |
| $10,000 to $14,999 | 20 (2.6%) | 37 (7.2%) |
| $15,000 to $19,999 | 37 (4.8%) | 25 (4.8%) |
| $20,000 to $24,999 | 122 (15.9%) | 76 (14.7%) |
| $25,000 to $34,999 | 48 (6.3%) | 91 (17.6%) |
| $35,000 to $49,999 | 75 (9.8%) | 110 (21.3%) |
| $50,000 to $74,999 | 84 (11.0%) | 108 (20.9%) |
| $75,000 to $99,999 | 162 (21.1%) | 19 (3.7%) |
| $100,000 to $149,999 | 94 (12.3%) | 6 (1.2%) |
| $150,000 or more | 124 (16.2%) | 0 (0.0%) |
| Total | 766 (100.0%) | 516 (100.0%) |
Monthly Housing Cost Tiers in Red Lodge
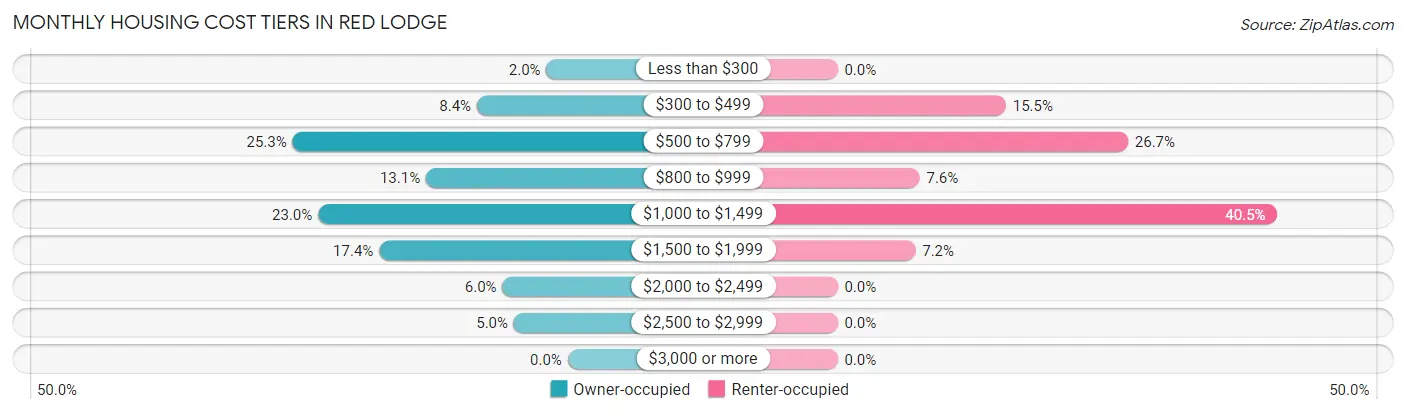
| Monthly Cost | Owner-occupied | Renter-occupied |
| Less than $300 | 15 (2.0%) | 0 (0.0%) |
| $300 to $499 | 64 (8.4%) | 80 (15.5%) |
| $500 to $799 | 194 (25.3%) | 138 (26.7%) |
| $800 to $999 | 100 (13.1%) | 39 (7.6%) |
| $1,000 to $1,499 | 176 (23.0%) | 209 (40.5%) |
| $1,500 to $1,999 | 133 (17.4%) | 37 (7.2%) |
| $2,000 to $2,499 | 46 (6.0%) | 0 (0.0%) |
| $2,500 to $2,999 | 38 (5.0%) | 0 (0.0%) |
| $3,000 or more | 0 (0.0%) | 0 (0.0%) |
| Total | 766 (100.0%) | 516 (100.0%) |
Physical Housing Characteristics in Red Lodge
Housing Structures in Red Lodge
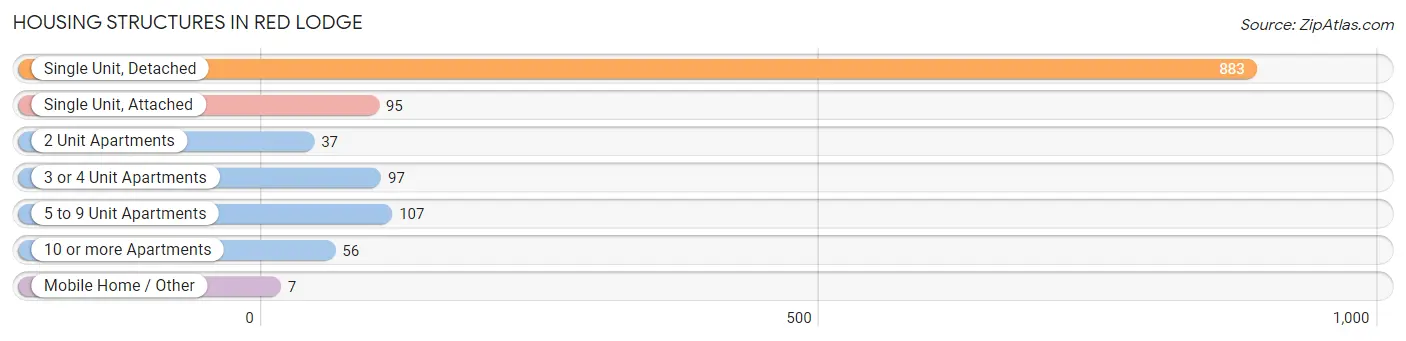
| Structure Type | # Housing Units | % Housing Units |
| Single Unit, Detached | 883 | 68.9% |
| Single Unit, Attached | 95 | 7.4% |
| 2 Unit Apartments | 37 | 2.9% |
| 3 or 4 Unit Apartments | 97 | 7.6% |
| 5 to 9 Unit Apartments | 107 | 8.4% |
| 10 or more Apartments | 56 | 4.4% |
| Mobile Home / Other | 7 | 0.5% |
| Total | 1,282 | 100.0% |
Housing Structures by Occupancy in Red Lodge
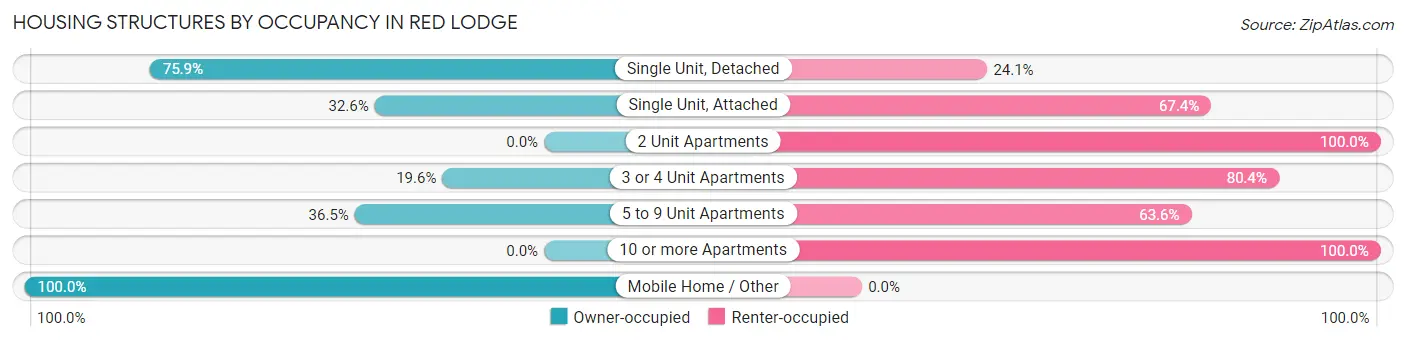
| Structure Type | Owner-occupied | Renter-occupied |
| Single Unit, Detached | 670 (75.9%) | 213 (24.1%) |
| Single Unit, Attached | 31 (32.6%) | 64 (67.4%) |
| 2 Unit Apartments | 0 (0.0%) | 37 (100.0%) |
| 3 or 4 Unit Apartments | 19 (19.6%) | 78 (80.4%) |
| 5 to 9 Unit Apartments | 39 (36.4%) | 68 (63.5%) |
| 10 or more Apartments | 0 (0.0%) | 56 (100.0%) |
| Mobile Home / Other | 7 (100.0%) | 0 (0.0%) |
| Total | 766 (59.8%) | 516 (40.3%) |
Housing Structures by Number of Rooms in Red Lodge
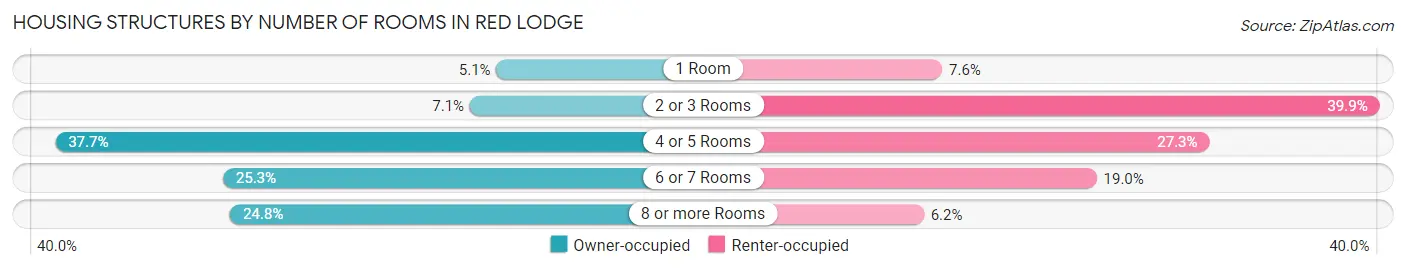
| Number of Rooms | Owner-occupied | Renter-occupied |
| 1 Room | 39 (5.1%) | 39 (7.6%) |
| 2 or 3 Rooms | 54 (7.0%) | 206 (39.9%) |
| 4 or 5 Rooms | 289 (37.7%) | 141 (27.3%) |
| 6 or 7 Rooms | 194 (25.3%) | 98 (19.0%) |
| 8 or more Rooms | 190 (24.8%) | 32 (6.2%) |
| Total | 766 (100.0%) | 516 (100.0%) |
Housing Structure by Heating Type in Red Lodge
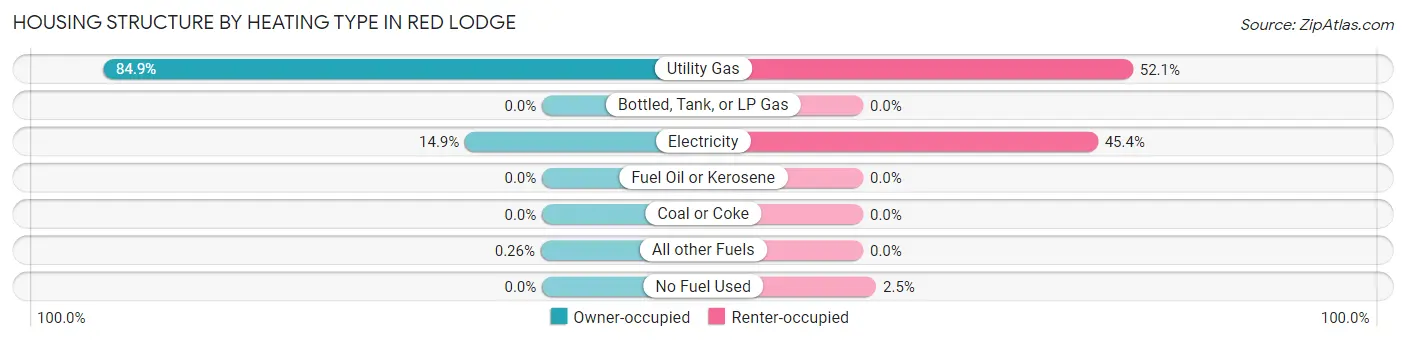
| Heating Type | Owner-occupied | Renter-occupied |
| Utility Gas | 650 (84.9%) | 269 (52.1%) |
| Bottled, Tank, or LP Gas | 0 (0.0%) | 0 (0.0%) |
| Electricity | 114 (14.9%) | 234 (45.4%) |
| Fuel Oil or Kerosene | 0 (0.0%) | 0 (0.0%) |
| Coal or Coke | 0 (0.0%) | 0 (0.0%) |
| All other Fuels | 2 (0.3%) | 0 (0.0%) |
| No Fuel Used | 0 (0.0%) | 13 (2.5%) |
| Total | 766 (100.0%) | 516 (100.0%) |
Household Vehicle Usage in Red Lodge
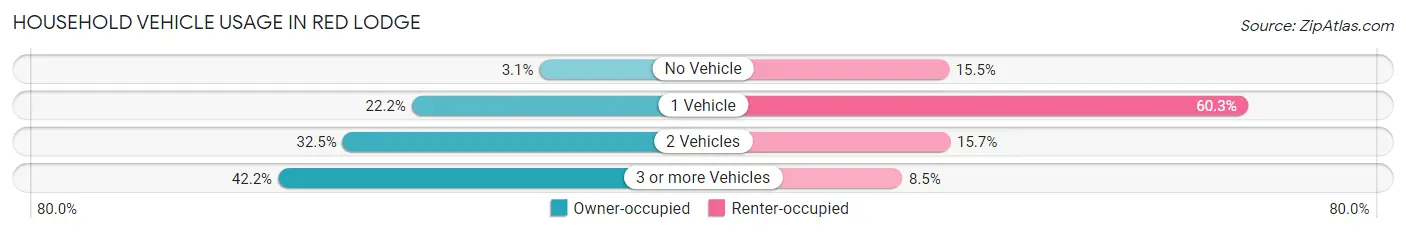
| Vehicles per Household | Owner-occupied | Renter-occupied |
| No Vehicle | 24 (3.1%) | 80 (15.5%) |
| 1 Vehicle | 170 (22.2%) | 311 (60.3%) |
| 2 Vehicles | 249 (32.5%) | 81 (15.7%) |
| 3 or more Vehicles | 323 (42.2%) | 44 (8.5%) |
| Total | 766 (100.0%) | 516 (100.0%) |
Real Estate & Mortgages in Red Lodge
Real Estate and Mortgage Overview in Red Lodge
| Characteristic | Without Mortgage | With Mortgage |
| Housing Units | 354 | 412 |
| Median Property Value | $330,000 | $382,200 |
| Median Household Income | $75,833 | $48 |
| Monthly Housing Costs | $559 | $0 |
| Real Estate Taxes | $2,425 | $0 |
Property Value by Mortgage Status in Red Lodge
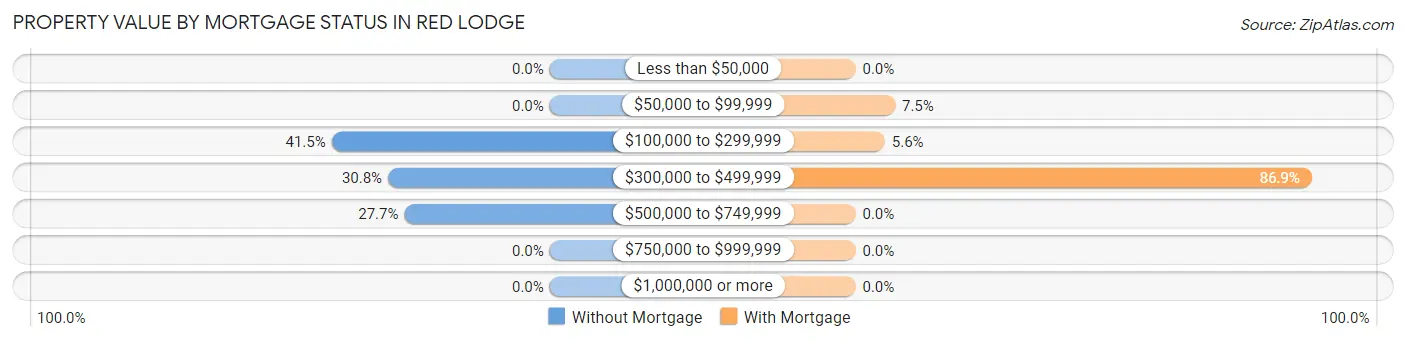
| Property Value | Without Mortgage | With Mortgage |
| Less than $50,000 | 0 (0.0%) | 0 (0.0%) |
| $50,000 to $99,999 | 0 (0.0%) | 31 (7.5%) |
| $100,000 to $299,999 | 147 (41.5%) | 23 (5.6%) |
| $300,000 to $499,999 | 109 (30.8%) | 358 (86.9%) |
| $500,000 to $749,999 | 98 (27.7%) | 0 (0.0%) |
| $750,000 to $999,999 | 0 (0.0%) | 0 (0.0%) |
| $1,000,000 or more | 0 (0.0%) | 0 (0.0%) |
| Total | 354 (100.0%) | 412 (100.0%) |
Household Income by Mortgage Status in Red Lodge
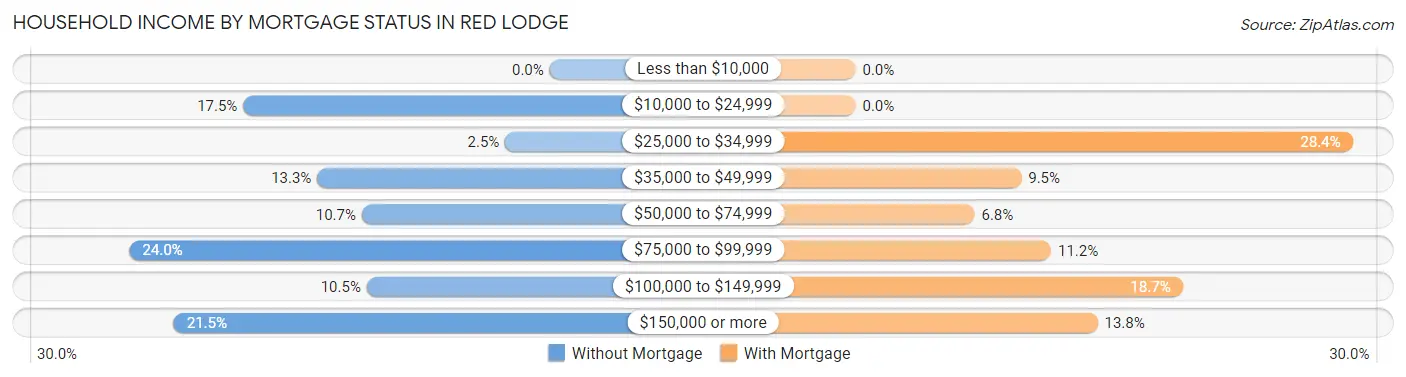
| Household Income | Without Mortgage | With Mortgage |
| Less than $10,000 | 0 (0.0%) | 0 (0.0%) |
| $10,000 to $24,999 | 62 (17.5%) | 0 (0.0%) |
| $25,000 to $34,999 | 9 (2.5%) | 117 (28.4%) |
| $35,000 to $49,999 | 47 (13.3%) | 39 (9.5%) |
| $50,000 to $74,999 | 38 (10.7%) | 28 (6.8%) |
| $75,000 to $99,999 | 85 (24.0%) | 46 (11.2%) |
| $100,000 to $149,999 | 37 (10.4%) | 77 (18.7%) |
| $150,000 or more | 76 (21.5%) | 57 (13.8%) |
| Total | 354 (100.0%) | 412 (100.0%) |
Property Value to Household Income Ratio in Red Lodge
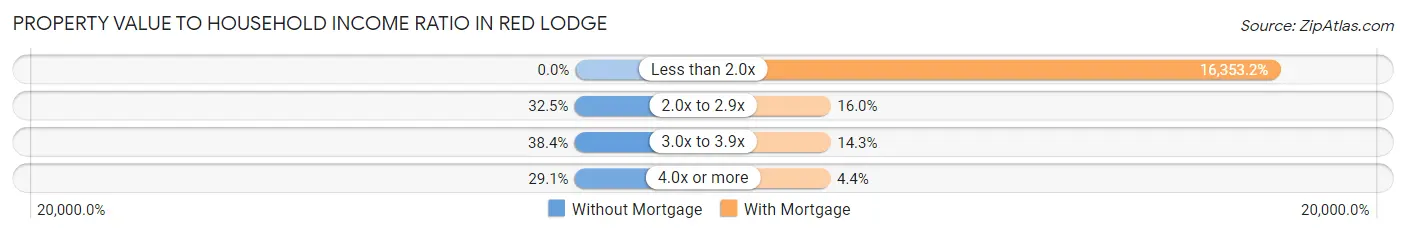
| Value-to-Income Ratio | Without Mortgage | With Mortgage |
| Less than 2.0x | 0 (0.0%) | 67,375 (16,353.2%) |
| 2.0x to 2.9x | 115 (32.5%) | 66 (16.0%) |
| 3.0x to 3.9x | 136 (38.4%) | 59 (14.3%) |
| 4.0x or more | 103 (29.1%) | 18 (4.4%) |
| Total | 354 (100.0%) | 412 (100.0%) |
Real Estate Taxes by Mortgage Status in Red Lodge
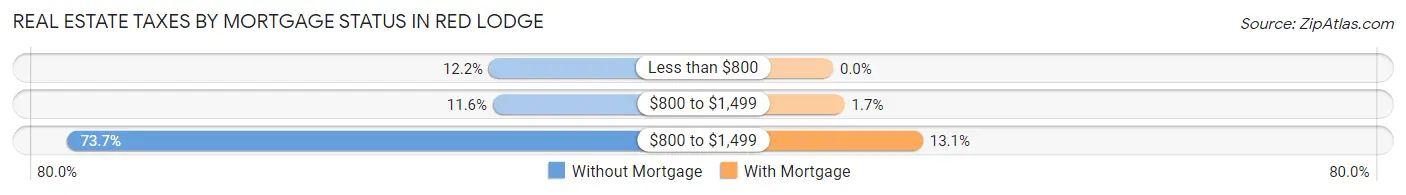
| Property Taxes | Without Mortgage | With Mortgage |
| Less than $800 | 43 (12.1%) | 0 (0.0%) |
| $800 to $1,499 | 41 (11.6%) | 7 (1.7%) |
| $800 to $1,499 | 261 (73.7%) | 54 (13.1%) |
| Total | 354 (100.0%) | 412 (100.0%) |
Health & Disability in Red Lodge
Health Insurance Coverage by Age in Red Lodge
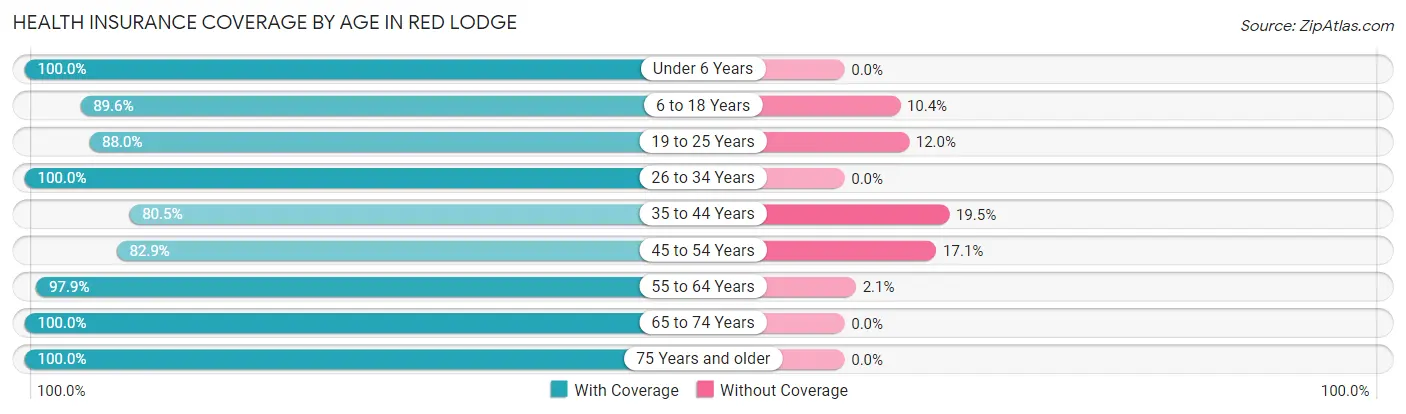
| Age Bracket | With Coverage | Without Coverage |
| Under 6 Years | 85 (100.0%) | 0 (0.0%) |
| 6 to 18 Years | 233 (89.6%) | 27 (10.4%) |
| 19 to 25 Years | 117 (88.0%) | 16 (12.0%) |
| 26 to 34 Years | 170 (100.0%) | 0 (0.0%) |
| 35 to 44 Years | 235 (80.5%) | 57 (19.5%) |
| 45 to 54 Years | 208 (82.9%) | 43 (17.1%) |
| 55 to 64 Years | 505 (97.9%) | 11 (2.1%) |
| 65 to 74 Years | 351 (100.0%) | 0 (0.0%) |
| 75 Years and older | 211 (100.0%) | 0 (0.0%) |
| Total | 2,115 (93.2%) | 154 (6.8%) |
Health Insurance Coverage by Citizenship Status in Red Lodge
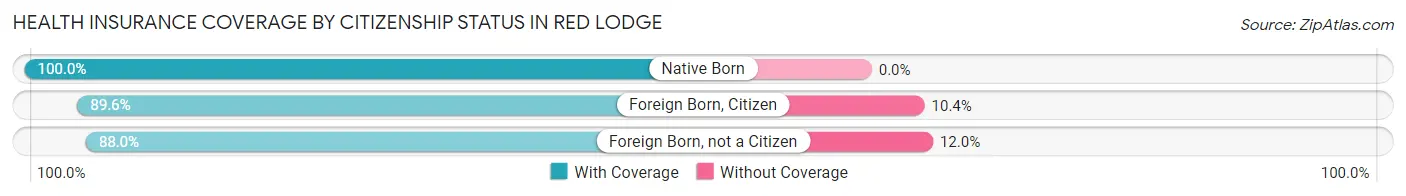
| Citizenship Status | With Coverage | Without Coverage |
| Native Born | 85 (100.0%) | 0 (0.0%) |
| Foreign Born, Citizen | 233 (89.6%) | 27 (10.4%) |
| Foreign Born, not a Citizen | 117 (88.0%) | 16 (12.0%) |
Health Insurance Coverage by Household Income in Red Lodge
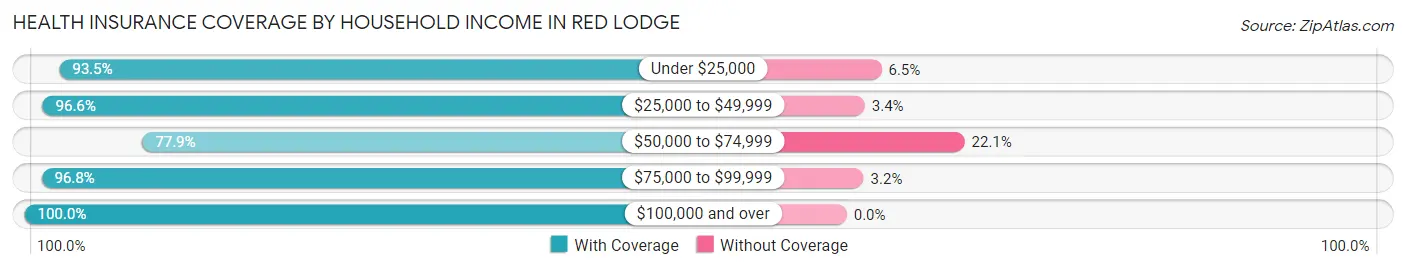
| Household Income | With Coverage | Without Coverage |
| Under $25,000 | 431 (93.5%) | 30 (6.5%) |
| $25,000 to $49,999 | 458 (96.6%) | 16 (3.4%) |
| $50,000 to $74,999 | 332 (77.9%) | 94 (22.1%) |
| $75,000 to $99,999 | 429 (96.8%) | 14 (3.2%) |
| $100,000 and over | 446 (100.0%) | 0 (0.0%) |
Public vs Private Health Insurance Coverage by Age in Red Lodge
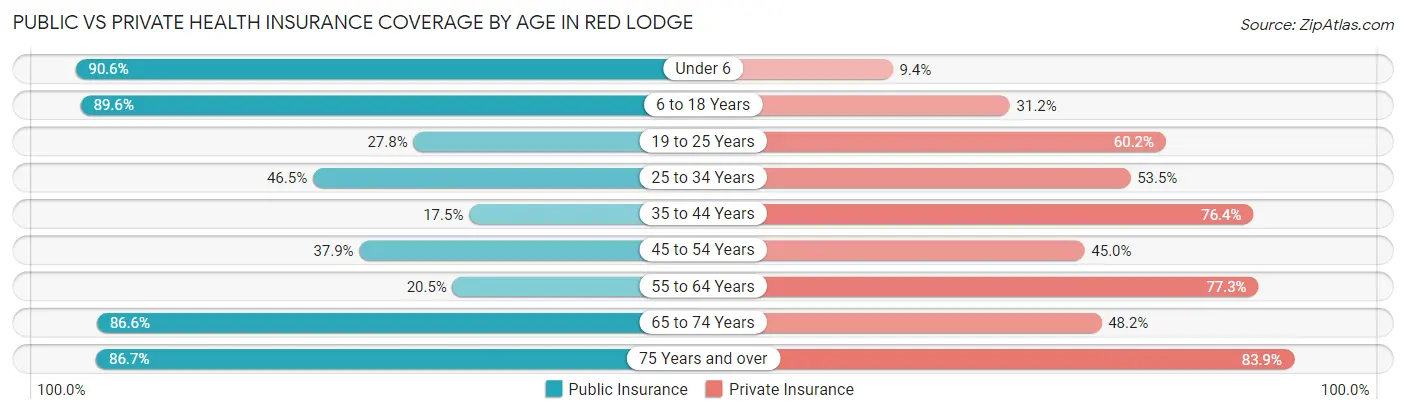
| Age Bracket | Public Insurance | Private Insurance |
| Under 6 | 77 (90.6%) | 8 (9.4%) |
| 6 to 18 Years | 233 (89.6%) | 81 (31.1%) |
| 19 to 25 Years | 37 (27.8%) | 80 (60.2%) |
| 25 to 34 Years | 79 (46.5%) | 91 (53.5%) |
| 35 to 44 Years | 51 (17.5%) | 223 (76.4%) |
| 45 to 54 Years | 95 (37.9%) | 113 (45.0%) |
| 55 to 64 Years | 106 (20.5%) | 399 (77.3%) |
| 65 to 74 Years | 304 (86.6%) | 169 (48.1%) |
| 75 Years and over | 183 (86.7%) | 177 (83.9%) |
| Total | 1,165 (51.3%) | 1,341 (59.1%) |
Disability Status by Sex by Age in Red Lodge
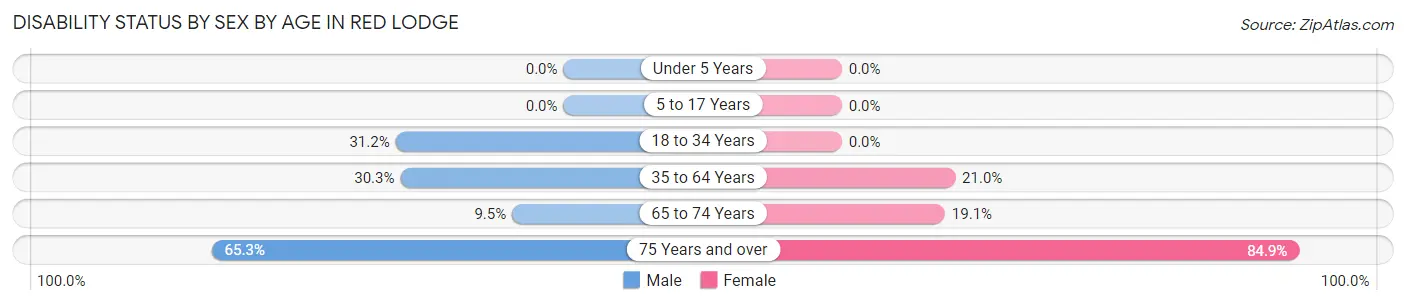
| Age Bracket | Male | Female |
| Under 5 Years | 0 (0.0%) | 0 (0.0%) |
| 5 to 17 Years | 0 (0.0%) | 0 (0.0%) |
| 18 to 34 Years | 43 (31.2%) | 0 (0.0%) |
| 35 to 64 Years | 122 (30.3%) | 138 (21.0%) |
| 65 to 74 Years | 18 (9.5%) | 31 (19.1%) |
| 75 Years and over | 47 (65.3%) | 118 (84.9%) |
Disability Class by Sex by Age in Red Lodge
Disability Class: Hearing Difficulty
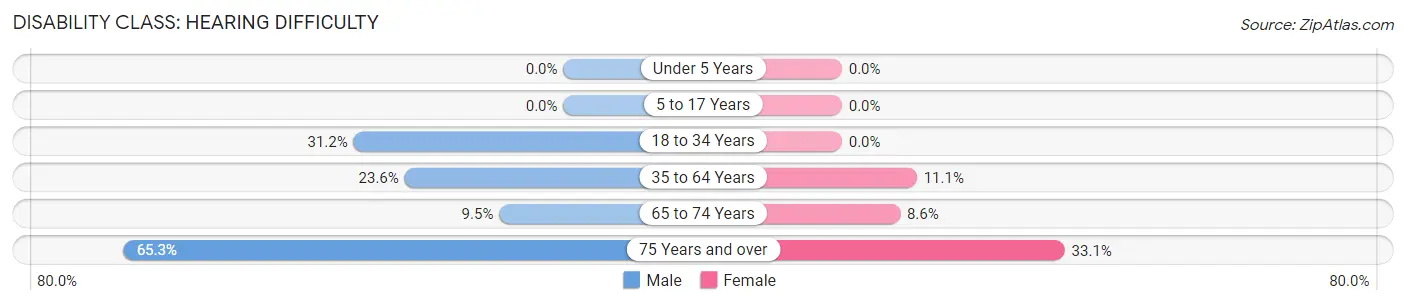
| Age Bracket | Male | Female |
| Under 5 Years | 0 (0.0%) | 0 (0.0%) |
| 5 to 17 Years | 0 (0.0%) | 0 (0.0%) |
| 18 to 34 Years | 43 (31.2%) | 0 (0.0%) |
| 35 to 64 Years | 95 (23.6%) | 73 (11.1%) |
| 65 to 74 Years | 18 (9.5%) | 14 (8.6%) |
| 75 Years and over | 47 (65.3%) | 46 (33.1%) |
Disability Class: Vision Difficulty
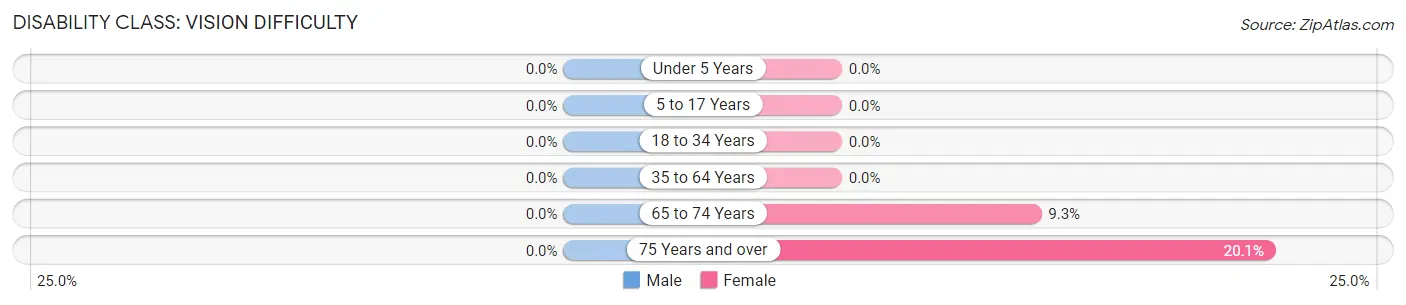
| Age Bracket | Male | Female |
| Under 5 Years | 0 (0.0%) | 0 (0.0%) |
| 5 to 17 Years | 0 (0.0%) | 0 (0.0%) |
| 18 to 34 Years | 0 (0.0%) | 0 (0.0%) |
| 35 to 64 Years | 0 (0.0%) | 0 (0.0%) |
| 65 to 74 Years | 0 (0.0%) | 15 (9.3%) |
| 75 Years and over | 0 (0.0%) | 28 (20.1%) |
Disability Class: Cognitive Difficulty
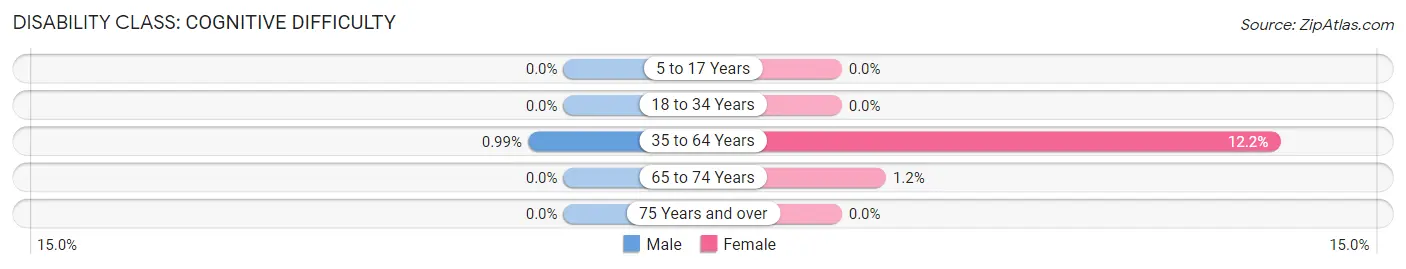
| Age Bracket | Male | Female |
| 5 to 17 Years | 0 (0.0%) | 0 (0.0%) |
| 18 to 34 Years | 0 (0.0%) | 0 (0.0%) |
| 35 to 64 Years | 4 (1.0%) | 80 (12.2%) |
| 65 to 74 Years | 0 (0.0%) | 2 (1.2%) |
| 75 Years and over | 0 (0.0%) | 0 (0.0%) |
Disability Class: Ambulatory Difficulty
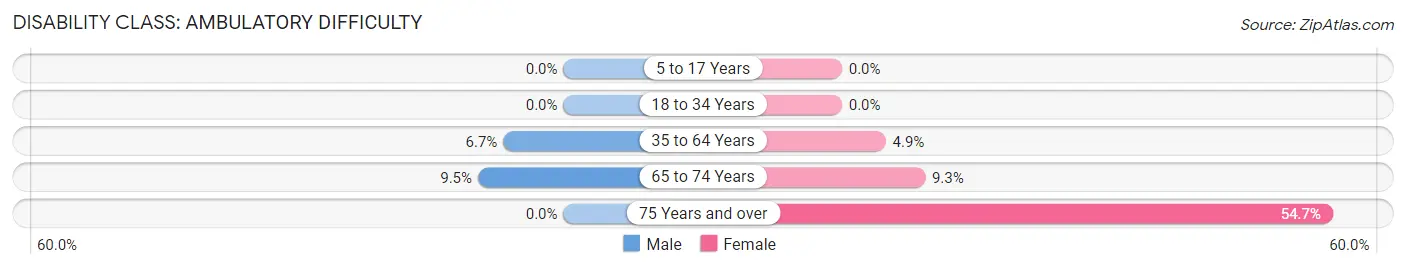
| Age Bracket | Male | Female |
| 5 to 17 Years | 0 (0.0%) | 0 (0.0%) |
| 18 to 34 Years | 0 (0.0%) | 0 (0.0%) |
| 35 to 64 Years | 27 (6.7%) | 32 (4.9%) |
| 65 to 74 Years | 18 (9.5%) | 15 (9.3%) |
| 75 Years and over | 0 (0.0%) | 76 (54.7%) |
Disability Class: Self-Care Difficulty
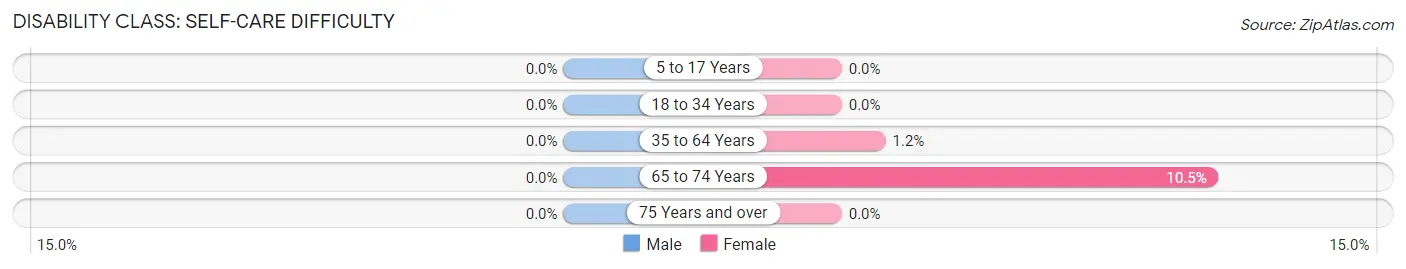
| Age Bracket | Male | Female |
| 5 to 17 Years | 0 (0.0%) | 0 (0.0%) |
| 18 to 34 Years | 0 (0.0%) | 0 (0.0%) |
| 35 to 64 Years | 0 (0.0%) | 8 (1.2%) |
| 65 to 74 Years | 0 (0.0%) | 17 (10.5%) |
| 75 Years and over | 0 (0.0%) | 0 (0.0%) |
Technology Access in Red Lodge
Computing Device Access in Red Lodge
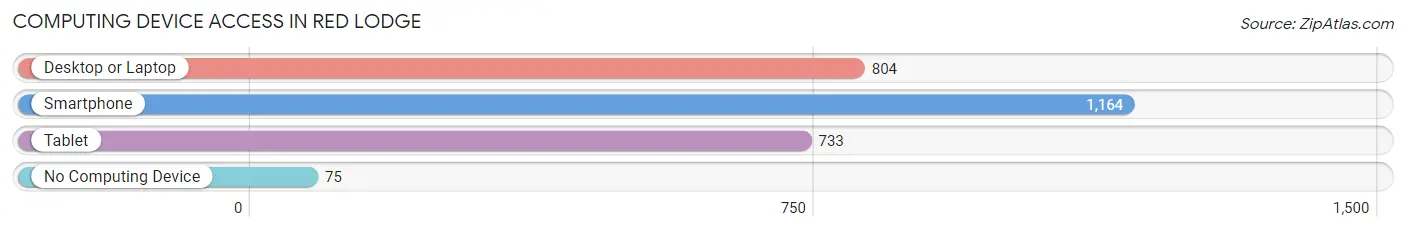
| Device Type | # Households | % Households |
| Desktop or Laptop | 804 | 62.7% |
| Smartphone | 1,164 | 90.8% |
| Tablet | 733 | 57.2% |
| No Computing Device | 75 | 5.9% |
| Total | 1,282 | 100.0% |
Internet Access in Red Lodge
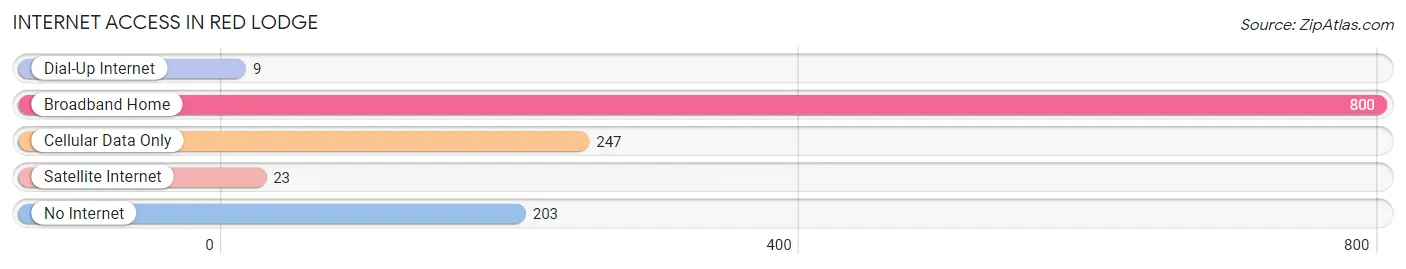
| Internet Type | # Households | % Households |
| Dial-Up Internet | 9 | 0.7% |
| Broadband Home | 800 | 62.4% |
| Cellular Data Only | 247 | 19.3% |
| Satellite Internet | 23 | 1.8% |
| No Internet | 203 | 15.8% |
| Total | 1,282 | 100.0% |
Red Lodge Summary
History
Red Lodge, Montana is a small town located in the Beartooth Mountains of Carbon County, Montana. It was founded in 1884 by a group of miners who were looking for gold and silver. The town was named after the red-colored sandstone cliffs that surrounded the area. The town quickly grew and became a popular destination for tourists and outdoor enthusiasts.
The town was originally a mining town, but it soon became a popular tourist destination. The town was home to a variety of businesses, including hotels, saloons, and stores. The town was also home to a variety of cultural events, such as the Red Lodge Music Festival, which was held annually from 1885 to 1895.
The town was also home to a variety of industries, including logging, ranching, and coal mining. The coal mining industry was particularly important to the town, as it provided jobs and income for many of the town’s residents. The coal mining industry also provided the town with a source of electricity, which was used to power the town’s businesses and homes.
The town was also home to a variety of cultural events, such as the Red Lodge Music Festival, which was held annually from 1885 to 1895. The festival featured a variety of musical acts, including classical, jazz, and folk music. The festival was a popular event and attracted visitors from all over the country.
The town was also home to a variety of businesses, including hotels, saloons, and stores. The town was also home to a variety of cultural events, such as the Red Lodge Music Festival, which was held annually from 1885 to 1895.
Geography
Red Lodge is located in the Beartooth Mountains of Carbon County, Montana. The town is situated at an elevation of 5,400 feet and is surrounded by the Beartooth Mountains. The town is located approximately 40 miles south of Billings, Montana and is approximately 60 miles north of Cody, Wyoming.
The town is located in a valley surrounded by the Beartooth Mountains. The town is located in a valley that is approximately 10 miles wide and 20 miles long. The town is located at the intersection of two rivers, the Clarks Fork of the Yellowstone River and the Stillwater River.
The town is located in a semi-arid climate, with hot summers and cold winters. The average temperature in the summer is around 70 degrees Fahrenheit, while the average temperature in the winter is around 20 degrees Fahrenheit. The town receives an average of 16 inches of precipitation per year.
Economy
The economy of Red Lodge is largely based on tourism and outdoor recreation. The town is home to a variety of businesses, including hotels, restaurants, and stores. The town is also home to a variety of cultural events, such as the Red Lodge Music Festival, which is held annually from 1885 to 1895.
The town is also home to a variety of industries, including logging, ranching, and coal mining. The coal mining industry was particularly important to the town, as it provided jobs and income for many of the town’s residents. The coal mining industry also provided the town with a source of electricity, which was used to power the town’s businesses and homes.
The town is also home to a variety of outdoor recreation activities, such as hiking, camping, fishing, and skiing. The town is also home to a variety of cultural events, such as the Red Lodge Music Festival, which is held annually from 1885 to 1895.
Demographics
As of the 2010 census, the population of Red Lodge was 2,325. The population is predominantly white, with approximately 95% of the population being white. The median age of the population is 44.7 years old. The median household income is $41,944.
The town is home to a variety of businesses, including hotels, restaurants, and stores. The town is also home to a variety of cultural events, such as the Red Lodge Music Festival, which is held annually from 1885 to 1895. The town is also home to a variety of outdoor recreation activities, such as hiking, camping, fishing, and skiing.
Conclusion
Red Lodge, Montana is a small town located in the Beartooth Mountains of Carbon County, Montana. It was founded in 1884 by a group of miners who were looking for gold and silver. The town was originally a mining town, but it soon became a popular tourist destination. The town is home to a variety of businesses, including hotels, saloons, and stores. The town is also home to a variety of cultural events, such as the Red Lodge Music Festival, which is held annually from 1885 to 1895. The town is also home to a variety of industries, including logging, ranching, and coal mining. The town is also home to a variety of outdoor recreation activities, such as hiking, camping, fishing, and skiing. The population of Red Lodge is predominantly white, with approximately 95% of the population being white. The median age of the population is 44.7 years old. The median household income is $41,944. Red Lodge is a popular destination for tourists and outdoor enthusiasts, and it is a great place to live and work.
Common Questions
What is Per Capita Income in Red Lodge?
Per Capita income in Red Lodge is $39,379.
What is the Median Family Income in Red Lodge?
Median Family Income in Red Lodge is $74,107.
What is the Median Household income in Red Lodge?
Median Household Income in Red Lodge is $39,472.
What is Income or Wage Gap in Red Lodge?
Income or Wage Gap in Red Lodge is 19.8%.
Women in Red Lodge earn 80.2 cents for every dollar earned by a man.
What is Inequality or Gini Index in Red Lodge?
Inequality or Gini Index in Red Lodge is 0.47.
What is the Total Population of Red Lodge?
Total Population of Red Lodge is 2,321.
What is the Total Male Population of Red Lodge?
Total Male Population of Red Lodge is 1,079.
What is the Total Female Population of Red Lodge?
Total Female Population of Red Lodge is 1,242.
What is the Ratio of Males per 100 Females in Red Lodge?
There are 86.88 Males per 100 Females in Red Lodge.
What is the Ratio of Females per 100 Males in Red Lodge?
There are 115.11 Females per 100 Males in Red Lodge.
What is the Median Population Age in Red Lodge?
Median Population Age in Red Lodge is 52.9 Years.
What is the Average Family Size in Red Lodge
Average Family Size in Red Lodge is 2.5 People.
What is the Average Household Size in Red Lodge
Average Household Size in Red Lodge is 1.8 People.
How Large is the Labor Force in Red Lodge?
There are 1,178 People in the Labor Forcein in Red Lodge.
What is the Percentage of People in the Labor Force in Red Lodge?
59.6% of People are in the Labor Force in Red Lodge.
What is the Unemployment Rate in Red Lodge?
Unemployment Rate in Red Lodge is 4.2%.