Ojai, CA Map & Demographics
Ojai Map
Ojai Overview
$53,663
PER CAPITA INCOME
$98,221
AVG FAMILY INCOME
$76,569
AVG HOUSEHOLD INCOME
43.3%
WAGE / INCOME GAP [ % ]
56.7¢/ $1
WAGE / INCOME GAP [ $ ]
$14,451
FAMILY INCOME DEFICIT
0.53
INEQUALITY / GINI INDEX
7,610
TOTAL POPULATION
3,526
MALE POPULATION
4,084
FEMALE POPULATION
86.34
MALES / 100 FEMALES
115.83
FEMALES / 100 MALES
50.4
MEDIAN AGE
3.0
AVG FAMILY SIZE
2.4
AVG HOUSEHOLD SIZE
3,406
LABOR FORCE [ PEOPLE ]
53.3%
PERCENT IN LABOR FORCE
6.5%
UNEMPLOYMENT RATE
Ojai Zip Codes
Ojai Area Codes
Income in Ojai
Income Overview in Ojai
Per Capita Income in Ojai is $53,663, while median incomes of families and households are $98,221 and $76,569 respectively.
| Characteristic | Number | Measure |
| Per Capita Income | 7,610 | $53,663 |
| Median Family Income | 1,853 | $98,221 |
| Mean Family Income | 1,853 | $163,794 |
| Median Household Income | 3,048 | $76,569 |
| Mean Household Income | 3,048 | $130,615 |
| Income Deficit | 1,853 | $14,451 |
| Wage / Income Gap (%) | 7,610 | 43.30% |
| Wage / Income Gap ($) | 7,610 | 56.70¢ per $1 |
| Gini / Inequality Index | 7,610 | 0.53 |
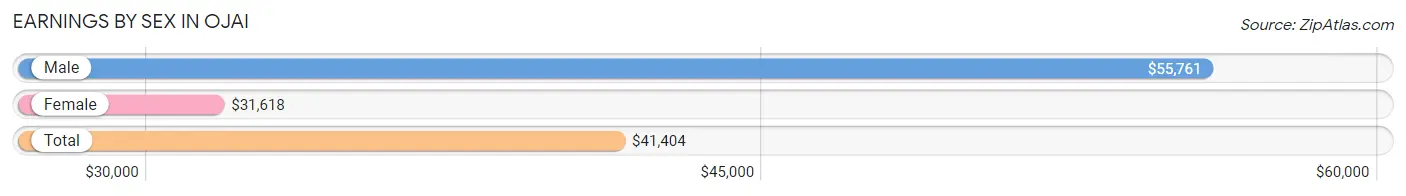
Earnings by Sex in Ojai
Average Earnings in Ojai are $41,404, $55,761 for men and $31,618 for women, a difference of 43.3%.
| Sex | Number | Average Earnings |
| Male | 1,794 (49.5%) | $55,761 |
| Female | 1,828 (50.5%) | $31,618 |
| Total | 3,622 (100.0%) | $41,404 |
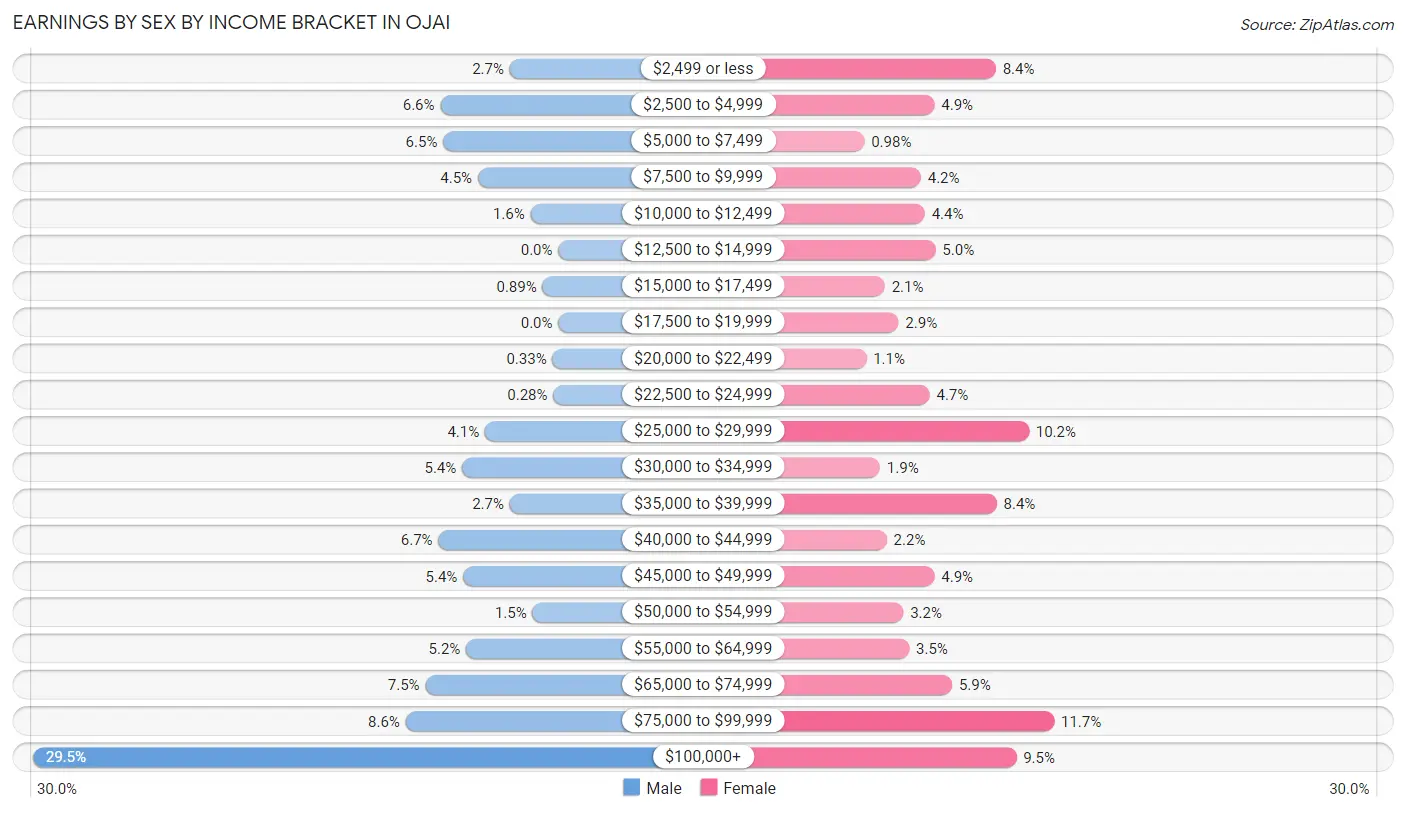
Earnings by Sex by Income Bracket in Ojai
The most common earnings brackets in Ojai are $100,000+ for men (530 | 29.5%) and $75,000 to $99,999 for women (213 | 11.7%).
| Income | Male | Female |
| $2,499 or less | 49 (2.7%) | 153 (8.4%) |
| $2,500 to $4,999 | 119 (6.6%) | 90 (4.9%) |
| $5,000 to $7,499 | 116 (6.5%) | 18 (1.0%) |
| $7,500 to $9,999 | 81 (4.5%) | 76 (4.2%) |
| $10,000 to $12,499 | 28 (1.6%) | 80 (4.4%) |
| $12,500 to $14,999 | 0 (0.0%) | 91 (5.0%) |
| $15,000 to $17,499 | 16 (0.9%) | 39 (2.1%) |
| $17,500 to $19,999 | 0 (0.0%) | 53 (2.9%) |
| $20,000 to $22,499 | 6 (0.3%) | 20 (1.1%) |
| $22,500 to $24,999 | 5 (0.3%) | 85 (4.6%) |
| $25,000 to $29,999 | 74 (4.1%) | 187 (10.2%) |
| $30,000 to $34,999 | 97 (5.4%) | 34 (1.9%) |
| $35,000 to $39,999 | 49 (2.7%) | 154 (8.4%) |
| $40,000 to $44,999 | 121 (6.7%) | 41 (2.2%) |
| $45,000 to $49,999 | 96 (5.3%) | 90 (4.9%) |
| $50,000 to $54,999 | 26 (1.5%) | 58 (3.2%) |
| $55,000 to $64,999 | 93 (5.2%) | 64 (3.5%) |
| $65,000 to $74,999 | 134 (7.5%) | 108 (5.9%) |
| $75,000 to $99,999 | 154 (8.6%) | 213 (11.7%) |
| $100,000+ | 530 (29.5%) | 174 (9.5%) |
| Total | 1,794 (100.0%) | 1,828 (100.0%) |
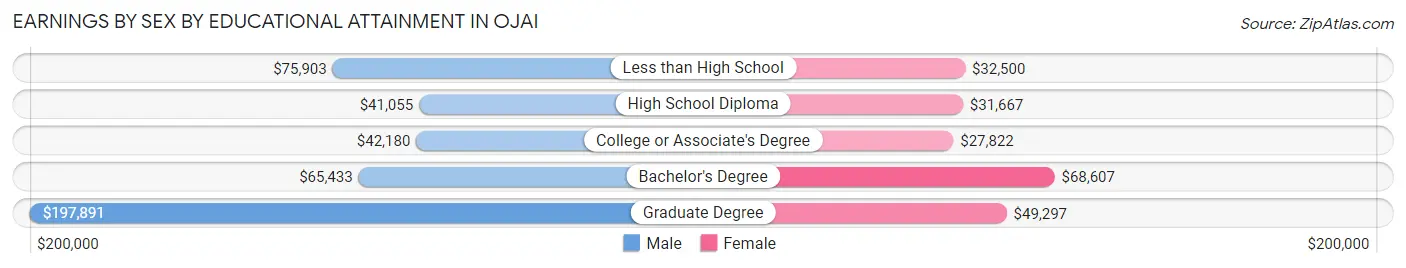
Earnings by Sex by Educational Attainment in Ojai
Average earnings in Ojai are $59,016 for men and $37,966 for women, a difference of 35.7%. Men with an educational attainment of graduate degree enjoy the highest average annual earnings of $197,891, while those with high school diploma education earn the least with $41,055. Women with an educational attainment of bachelor's degree earn the most with the average annual earnings of $68,607, while those with college or associate's degree education have the smallest earnings of $27,822.
| Educational Attainment | Male Income | Female Income |
| Less than High School | $75,903 | $32,500 |
| High School Diploma | $41,055 | $31,667 |
| College or Associate's Degree | $42,180 | $27,822 |
| Bachelor's Degree | $65,433 | $68,607 |
| Graduate Degree | $197,891 | $49,297 |
| Total | $59,016 | $37,966 |
Family Income in Ojai
Family Income Brackets in Ojai
According to the Ojai family income data, there are 435 families falling into the $200,000+ income range, which is the most common income bracket and makes up 23.5% of all families.
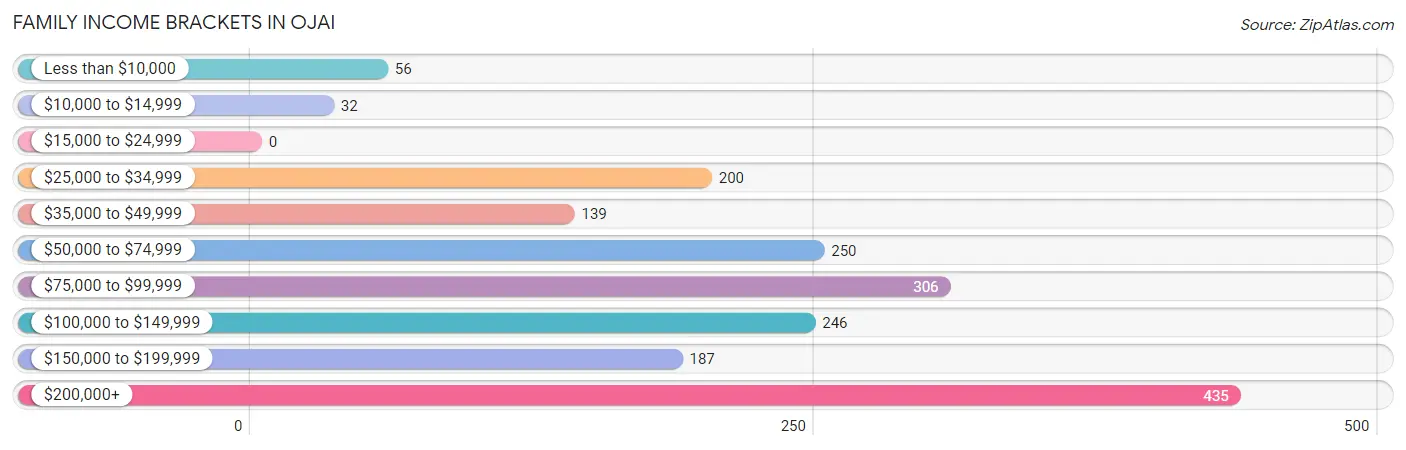
| Income Bracket | # Families | % Families |
| Less than $10,000 | 56 | 3.0% |
| $10,000 to $14,999 | 32 | 1.7% |
| $15,000 to $24,999 | 0 | 0.0% |
| $25,000 to $34,999 | 200 | 10.8% |
| $35,000 to $49,999 | 139 | 7.5% |
| $50,000 to $74,999 | 250 | 13.5% |
| $75,000 to $99,999 | 306 | 16.5% |
| $100,000 to $149,999 | 246 | 13.3% |
| $150,000 to $199,999 | 187 | 10.1% |
| $200,000+ | 435 | 23.5% |
Family Income by Famaliy Size in Ojai
4-person families (348 | 18.8%) account for the highest median family income in Ojai with $119,519 per family, while 2-person families (956 | 51.6%) have the highest median income of $47,884 per family member.
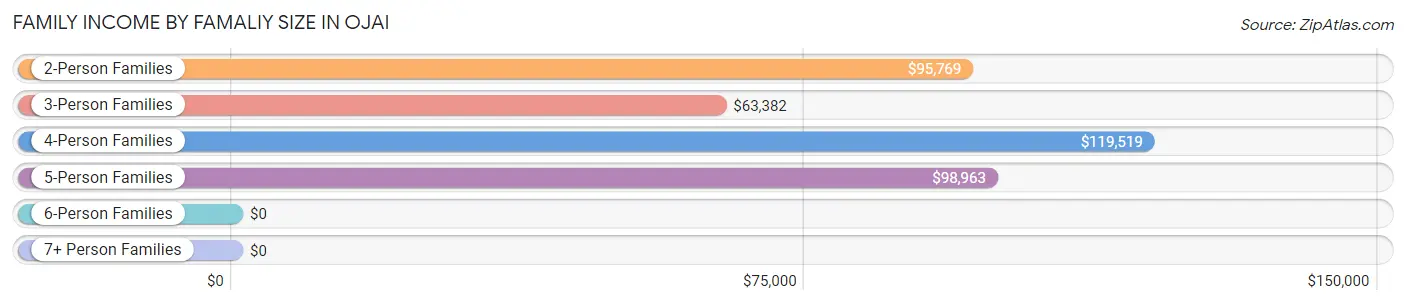
| Income Bracket | # Families | Median Income |
| 2-Person Families | 956 (51.6%) | $95,769 |
| 3-Person Families | 438 (23.6%) | $63,382 |
| 4-Person Families | 348 (18.8%) | $119,519 |
| 5-Person Families | 72 (3.9%) | $98,963 |
| 6-Person Families | 29 (1.6%) | $0 |
| 7+ Person Families | 10 (0.5%) | $0 |
| Total | 1,853 (100.0%) | $98,221 |
Family Income by Number of Earners in Ojai
The median family income in Ojai is $98,221, with families comprising 2 earners (659) having the highest median family income of $135,380, while families with no earners (378) have the lowest median family income of $70,882, accounting for 35.6% and 20.4% of families, respectively.
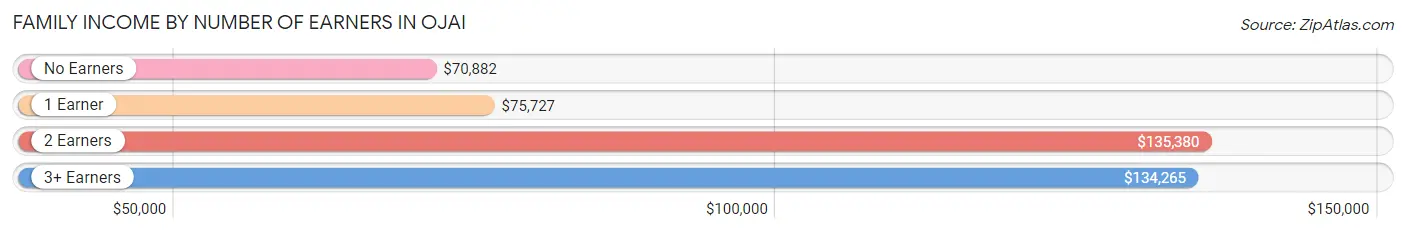
| Number of Earners | # Families | Median Income |
| No Earners | 378 (20.4%) | $70,882 |
| 1 Earner | 684 (36.9%) | $75,727 |
| 2 Earners | 659 (35.6%) | $135,380 |
| 3+ Earners | 132 (7.1%) | $134,265 |
| Total | 1,853 (100.0%) | $98,221 |
Household Income in Ojai
Household Income Brackets in Ojai
With 570 households falling in the category, the $200,000+ income range is the most frequent in Ojai, accounting for 18.7% of all households. In contrast, only 88 households (2.9%) fall into the $10,000 to $14,999 income bracket, making it the least populous group.
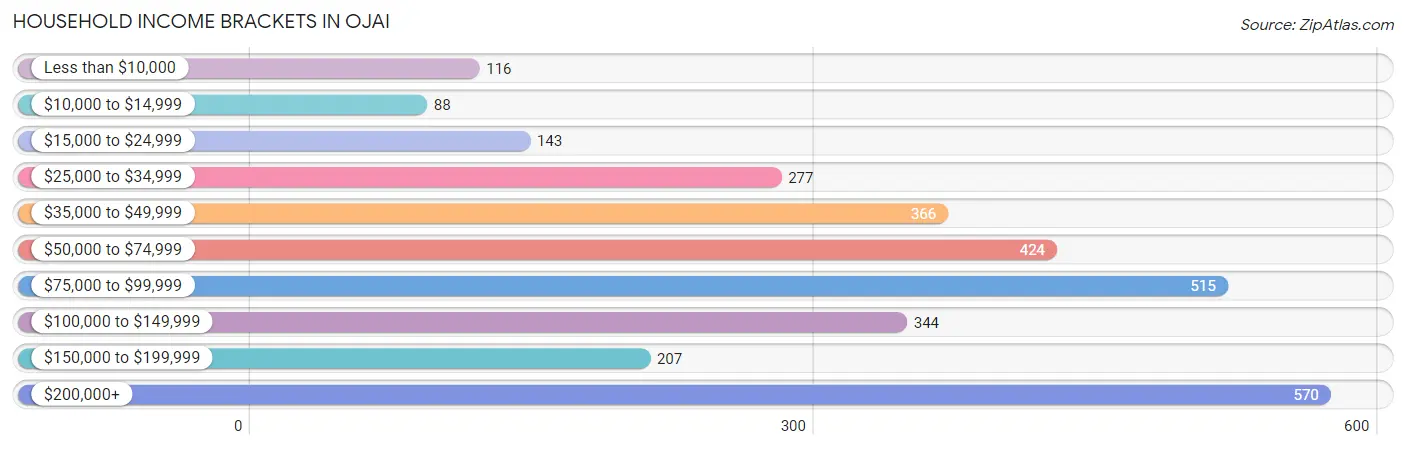
| Income Bracket | # Households | % Households |
| Less than $10,000 | 116 | 3.8% |
| $10,000 to $14,999 | 88 | 2.9% |
| $15,000 to $24,999 | 143 | 4.7% |
| $25,000 to $34,999 | 277 | 9.1% |
| $35,000 to $49,999 | 366 | 12.0% |
| $50,000 to $74,999 | 424 | 13.9% |
| $75,000 to $99,999 | 515 | 16.9% |
| $100,000 to $149,999 | 344 | 11.3% |
| $150,000 to $199,999 | 207 | 6.8% |
| $200,000+ | 570 | 18.7% |
Household Income by Householder Age in Ojai
The median household income in Ojai is $76,569, with the highest median household income of $97,649 found in the 25 to 44 years age bracket for the primary householder. A total of 560 households (18.4%) fall into this category. Meanwhile, the 15 to 24 years age bracket for the primary householder has the lowest median household income of $0, with 12 households (0.4%) in this group.
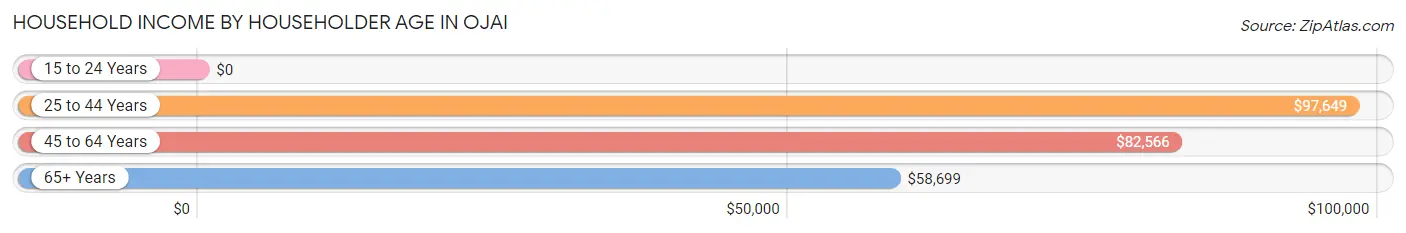
| Income Bracket | # Households | Median Income |
| 15 to 24 Years | 12 (0.4%) | $0 |
| 25 to 44 Years | 560 (18.4%) | $97,649 |
| 45 to 64 Years | 1,159 (38.0%) | $82,566 |
| 65+ Years | 1,317 (43.2%) | $58,699 |
| Total | 3,048 (100.0%) | $76,569 |
Poverty in Ojai
Income Below Poverty by Sex and Age in Ojai
With 4.6% poverty level for males and 9.7% for females among the residents of Ojai, 18 to 24 year old males and 6 to 11 year old females are the most vulnerable to poverty, with 25 males (13.1%) and 69 females (23.4%) in their respective age groups living below the poverty level.
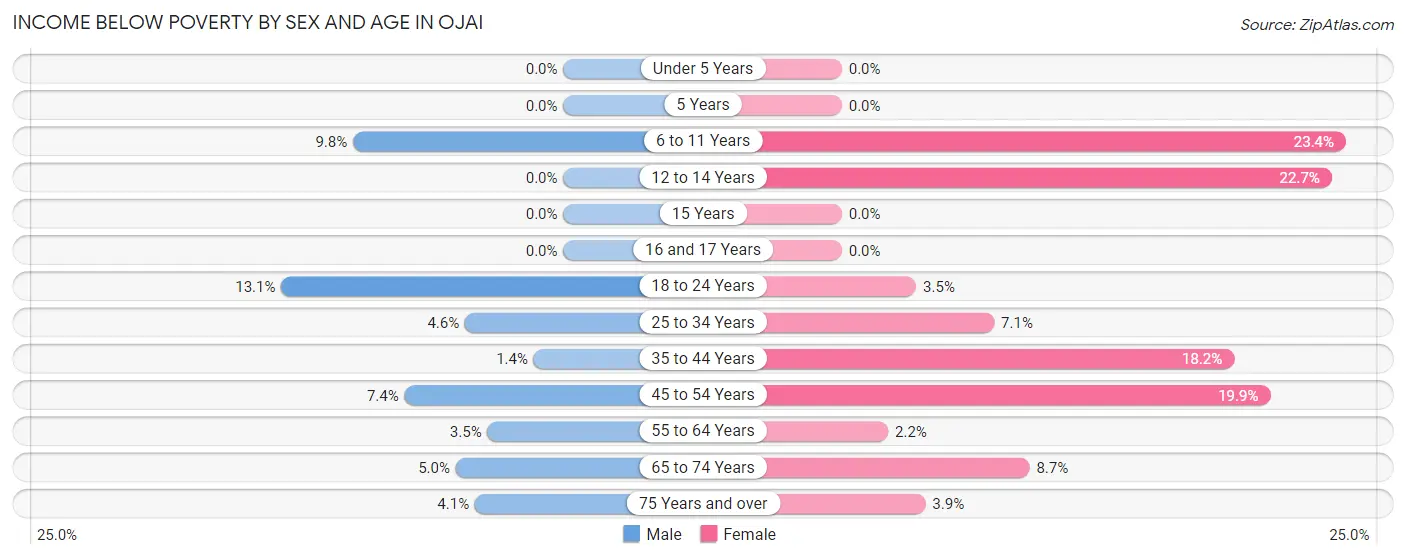
| Age Bracket | Male | Female |
| Under 5 Years | 0 (0.0%) | 0 (0.0%) |
| 5 Years | 0 (0.0%) | 0 (0.0%) |
| 6 to 11 Years | 24 (9.8%) | 69 (23.4%) |
| 12 to 14 Years | 0 (0.0%) | 20 (22.7%) |
| 15 Years | 0 (0.0%) | 0 (0.0%) |
| 16 and 17 Years | 0 (0.0%) | 0 (0.0%) |
| 18 to 24 Years | 25 (13.1%) | 5 (3.5%) |
| 25 to 34 Years | 14 (4.6%) | 20 (7.1%) |
| 35 to 44 Years | 6 (1.4%) | 87 (18.2%) |
| 45 to 54 Years | 30 (7.4%) | 103 (19.9%) |
| 55 to 64 Years | 12 (3.5%) | 14 (2.1%) |
| 65 to 74 Years | 30 (5.0%) | 50 (8.7%) |
| 75 Years and over | 19 (4.1%) | 23 (3.9%) |
| Total | 160 (4.6%) | 391 (9.7%) |
Income Above Poverty by Sex and Age in Ojai
According to the poverty statistics in Ojai, males aged under 5 years and females aged under 5 years are the age groups that are most secure financially, with 100.0% of males and 100.0% of females in these age groups living above the poverty line.
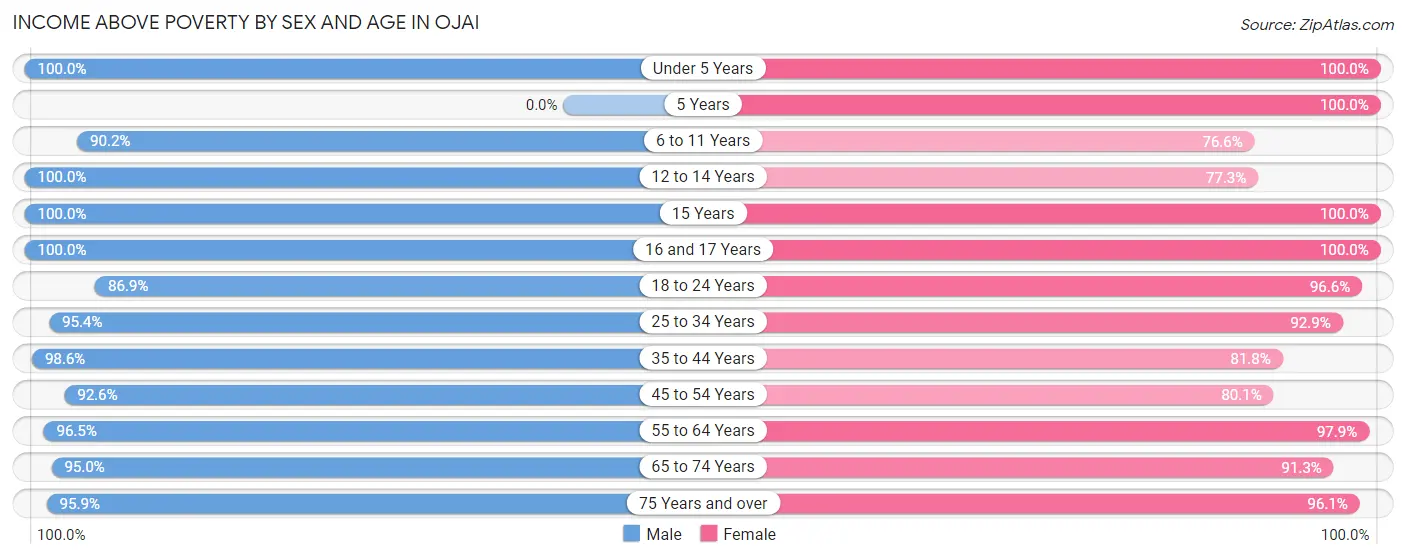
| Age Bracket | Male | Female |
| Under 5 Years | 103 (100.0%) | 109 (100.0%) |
| 5 Years | 0 (0.0%) | 11 (100.0%) |
| 6 to 11 Years | 222 (90.2%) | 226 (76.6%) |
| 12 to 14 Years | 230 (100.0%) | 68 (77.3%) |
| 15 Years | 19 (100.0%) | 119 (100.0%) |
| 16 and 17 Years | 107 (100.0%) | 153 (100.0%) |
| 18 to 24 Years | 166 (86.9%) | 140 (96.6%) |
| 25 to 34 Years | 293 (95.4%) | 263 (92.9%) |
| 35 to 44 Years | 433 (98.6%) | 391 (81.8%) |
| 45 to 54 Years | 377 (92.6%) | 415 (80.1%) |
| 55 to 64 Years | 329 (96.5%) | 638 (97.9%) |
| 65 to 74 Years | 571 (95.0%) | 524 (91.3%) |
| 75 Years and over | 444 (95.9%) | 570 (96.1%) |
| Total | 3,294 (95.4%) | 3,627 (90.3%) |
Income Below Poverty Among Married-Couple Families in Ojai
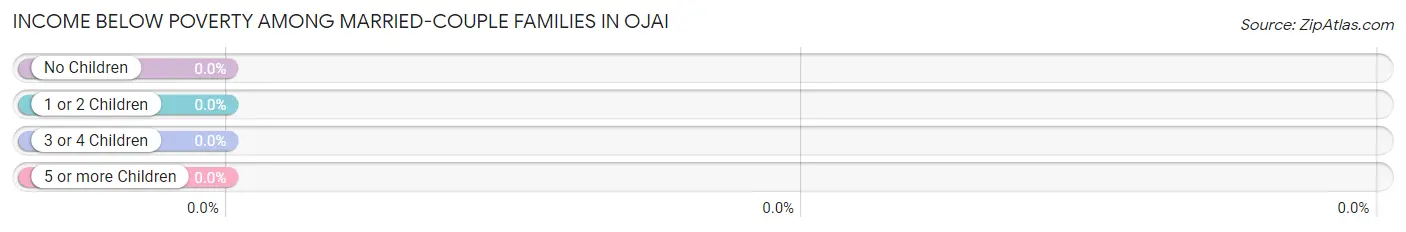
| Children | Above Poverty | Below Poverty |
| No Children | 885 (100.0%) | 0 (0.0%) |
| 1 or 2 Children | 313 (100.0%) | 0 (0.0%) |
| 3 or 4 Children | 29 (100.0%) | 0 (0.0%) |
| 5 or more Children | 0 (0.0%) | 0 (0.0%) |
| Total | 1,227 (100.0%) | 0 (0.0%) |
Income Below Poverty Among Single-Parent Households in Ojai
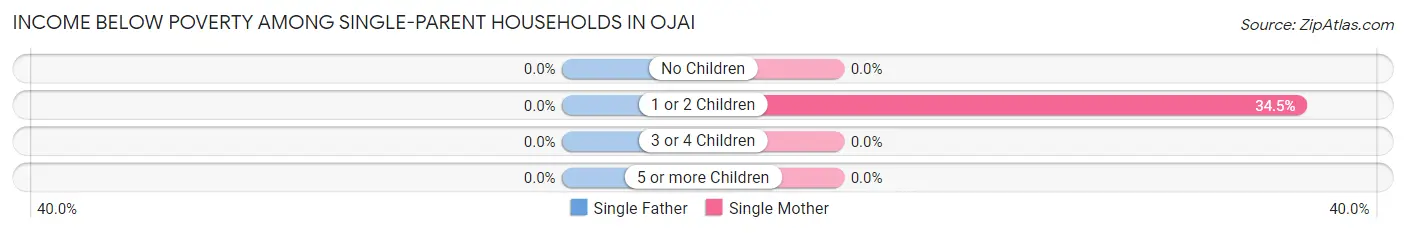
| Children | Single Father | Single Mother |
| No Children | 0 (0.0%) | 0 (0.0%) |
| 1 or 2 Children | 0 (0.0%) | 86 (34.5%) |
| 3 or 4 Children | 0 (0.0%) | 0 (0.0%) |
| 5 or more Children | 0 (0.0%) | 0 (0.0%) |
| Total | 0 (0.0%) | 86 (20.1%) |
Income Below Poverty Among Married-Couple vs Single-Parent Households in Ojai
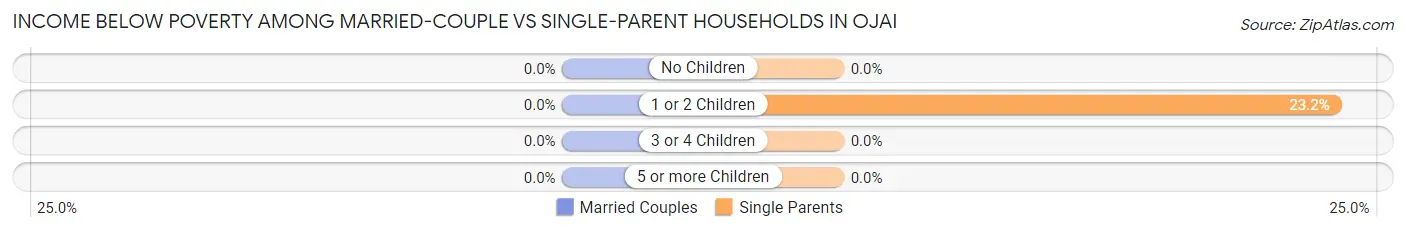
| Children | Married-Couple Families | Single-Parent Households |
| No Children | 0 (0.0%) | 0 (0.0%) |
| 1 or 2 Children | 0 (0.0%) | 86 (23.2%) |
| 3 or 4 Children | 0 (0.0%) | 0 (0.0%) |
| 5 or more Children | 0 (0.0%) | 0 (0.0%) |
| Total | 0 (0.0%) | 86 (13.7%) |
Race in Ojai
The most populous races in Ojai are White / Caucasian (6,243 | 82.0%), Hispanic or Latino (1,572 | 20.7%), and Some other Race (524 | 6.9%).
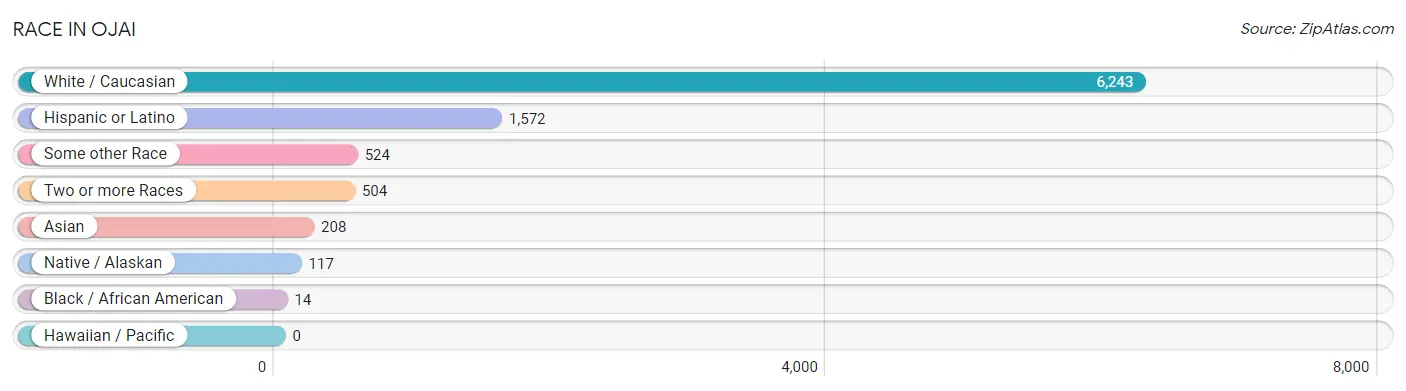
| Race | # Population | % Population |
| Asian | 208 | 2.7% |
| Black / African American | 14 | 0.2% |
| Hawaiian / Pacific | 0 | 0.0% |
| Hispanic or Latino | 1,572 | 20.7% |
| Native / Alaskan | 117 | 1.5% |
| White / Caucasian | 6,243 | 82.0% |
| Two or more Races | 504 | 6.6% |
| Some other Race | 524 | 6.9% |
| Total | 7,610 | 100.0% |
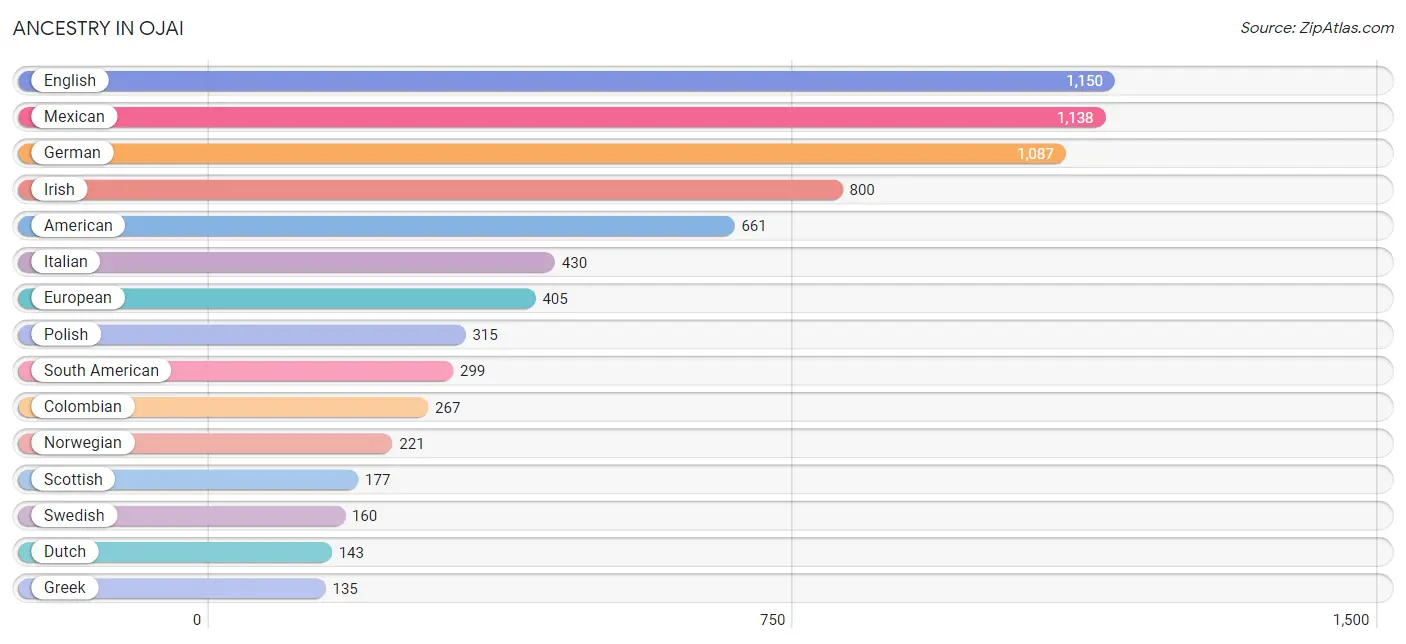
Ancestry in Ojai
The most populous ancestries reported in Ojai are English (1,150 | 15.1%), Mexican (1,138 | 14.9%), German (1,087 | 14.3%), Irish (800 | 10.5%), and American (661 | 8.7%), together accounting for 63.5% of all Ojai residents.
| Ancestry | # Population | % Population |
| Albanian | 6 | 0.1% |
| American | 661 | 8.7% |
| Apache | 19 | 0.3% |
| Arab | 117 | 1.5% |
| Assyrian / Chaldean / Syriac | 10 | 0.1% |
| Austrian | 43 | 0.6% |
| Basque | 17 | 0.2% |
| Bhutanese | 100 | 1.3% |
| Blackfeet | 45 | 0.6% |
| British | 75 | 1.0% |
| Burmese | 73 | 1.0% |
| Canadian | 29 | 0.4% |
| Central American | 99 | 1.3% |
| Colombian | 267 | 3.5% |
| Croatian | 20 | 0.3% |
| Czech | 36 | 0.5% |
| Czechoslovakian | 10 | 0.1% |
| Danish | 70 | 0.9% |
| Dutch | 143 | 1.9% |
| Eastern European | 68 | 0.9% |
| English | 1,150 | 15.1% |
| European | 405 | 5.3% |
| Finnish | 32 | 0.4% |
| French | 133 | 1.8% |
| French Canadian | 55 | 0.7% |
| German | 1,087 | 14.3% |
| Greek | 135 | 1.8% |
| Hungarian | 113 | 1.5% |
| Irish | 800 | 10.5% |
| Italian | 430 | 5.7% |
| Jamaican | 3 | 0.0% |
| Japanese | 23 | 0.3% |
| Korean | 35 | 0.5% |
| Lebanese | 63 | 0.8% |
| Lithuanian | 18 | 0.2% |
| Mexican | 1,138 | 14.9% |
| Mexican American Indian | 26 | 0.3% |
| Native Hawaiian | 121 | 1.6% |
| Navajo | 5 | 0.1% |
| Northern European | 10 | 0.1% |
| Norwegian | 221 | 2.9% |
| Peruvian | 32 | 0.4% |
| Polish | 315 | 4.1% |
| Portuguese | 48 | 0.6% |
| Puerto Rican | 5 | 0.1% |
| Romanian | 37 | 0.5% |
| Russian | 76 | 1.0% |
| Salvadoran | 99 | 1.3% |
| Scandinavian | 93 | 1.2% |
| Scotch-Irish | 104 | 1.4% |
| Scottish | 177 | 2.3% |
| Slavic | 16 | 0.2% |
| South American | 299 | 3.9% |
| Spaniard | 20 | 0.3% |
| Spanish | 11 | 0.1% |
| Sri Lankan | 38 | 0.5% |
| Swedish | 160 | 2.1% |
| Thai | 36 | 0.5% |
| Ukrainian | 66 | 0.9% |
| Welsh | 62 | 0.8% | View All 60 Rows |
Immigrants in Ojai
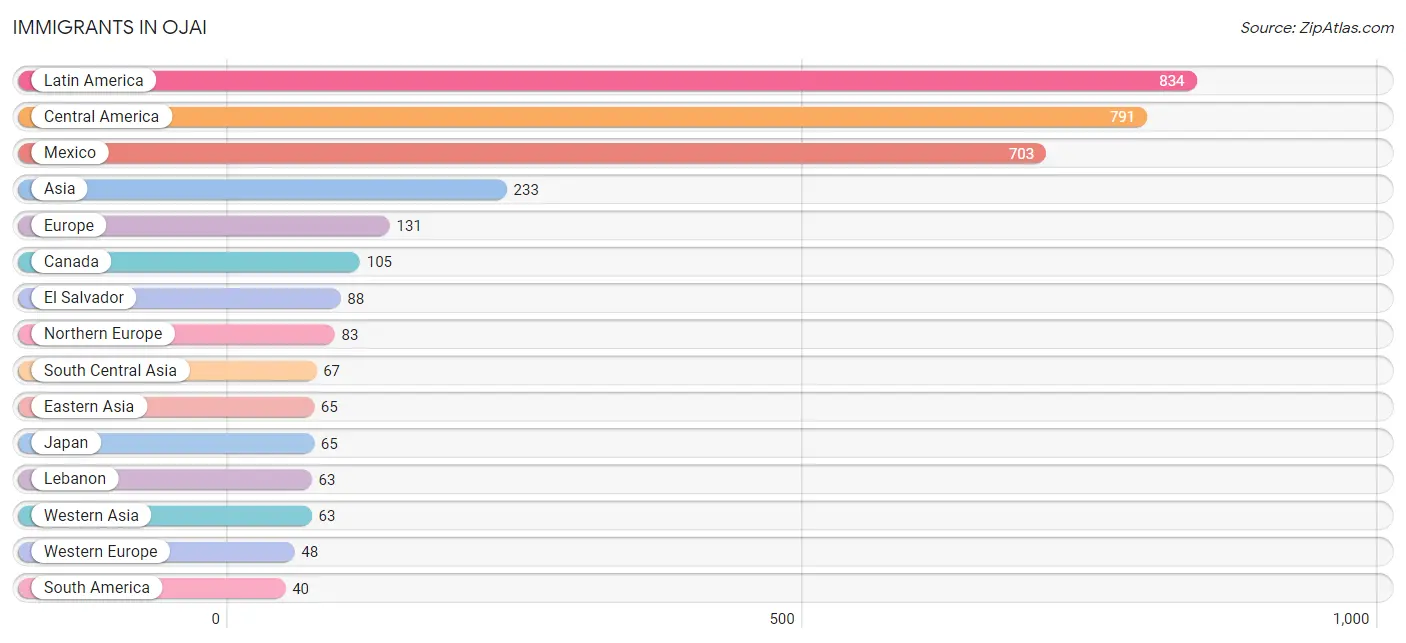
The most numerous immigrant groups reported in Ojai came from Latin America (834 | 11.0%), Central America (791 | 10.4%), Mexico (703 | 9.2%), Asia (233 | 3.1%), and Europe (131 | 1.7%), together accounting for 35.4% of all Ojai residents.
| Immigration Origin | # Population | % Population |
| Argentina | 10 | 0.1% |
| Asia | 233 | 3.1% |
| Austria | 8 | 0.1% |
| Cambodia | 23 | 0.3% |
| Canada | 105 | 1.4% |
| Caribbean | 3 | 0.0% |
| Central America | 791 | 10.4% |
| Colombia | 8 | 0.1% |
| Denmark | 10 | 0.1% |
| Eastern Asia | 65 | 0.9% |
| El Salvador | 88 | 1.2% |
| England | 16 | 0.2% |
| Europe | 131 | 1.7% |
| France | 17 | 0.2% |
| India | 36 | 0.5% |
| Jamaica | 3 | 0.0% |
| Japan | 65 | 0.9% |
| Latin America | 834 | 11.0% |
| Lebanon | 63 | 0.8% |
| Mexico | 703 | 9.2% |
| Netherlands | 23 | 0.3% |
| Northern Europe | 83 | 1.1% |
| Peru | 22 | 0.3% |
| South America | 40 | 0.5% |
| South Central Asia | 67 | 0.9% |
| South Eastern Asia | 38 | 0.5% |
| Sri Lanka | 31 | 0.4% |
| Sweden | 14 | 0.2% |
| Vietnam | 15 | 0.2% |
| Western Asia | 63 | 0.8% |
| Western Europe | 48 | 0.6% | View All 31 Rows |
Sex and Age in Ojai
Sex and Age in Ojai
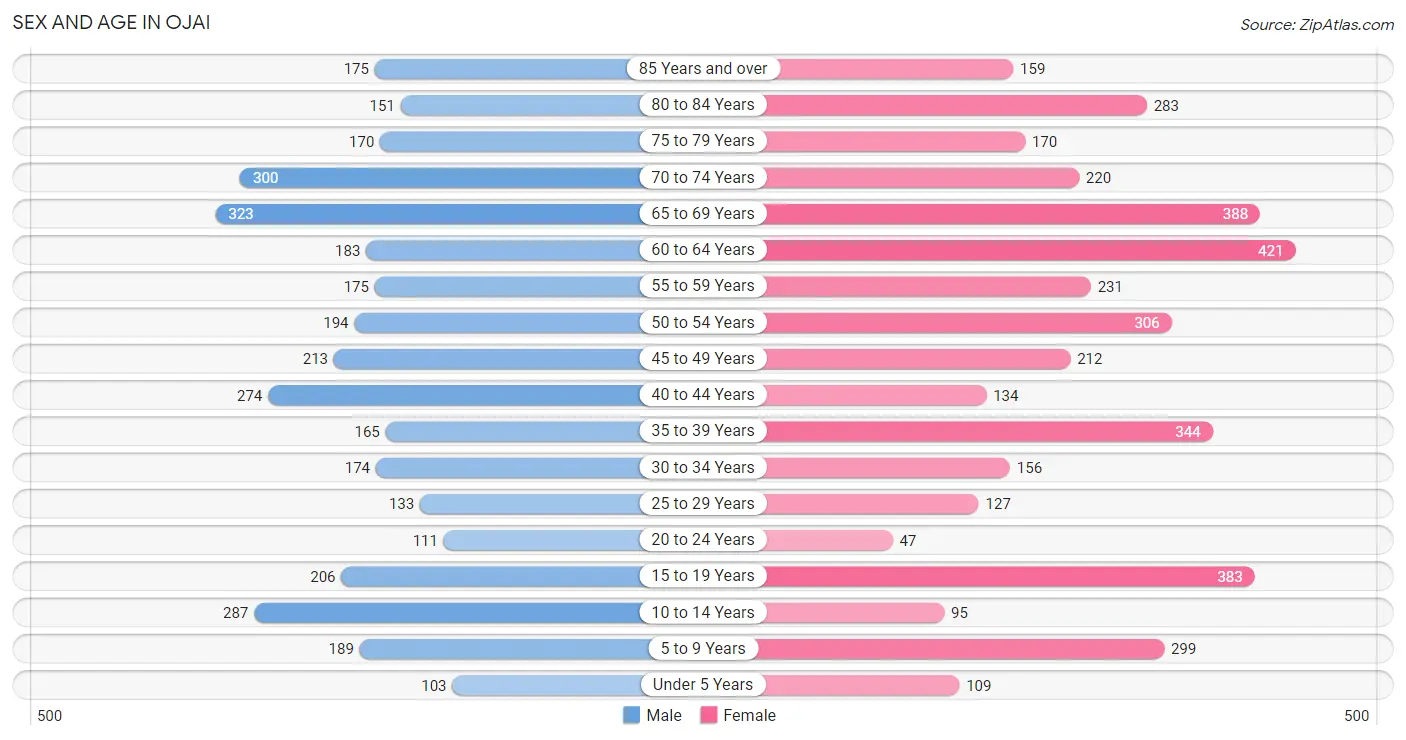
The most populous age groups in Ojai are 65 to 69 Years (323 | 9.2%) for men and 60 to 64 Years (421 | 10.3%) for women.
| Age Bracket | Male | Female |
| Under 5 Years | 103 (2.9%) | 109 (2.7%) |
| 5 to 9 Years | 189 (5.4%) | 299 (7.3%) |
| 10 to 14 Years | 287 (8.1%) | 95 (2.3%) |
| 15 to 19 Years | 206 (5.8%) | 383 (9.4%) |
| 20 to 24 Years | 111 (3.2%) | 47 (1.1%) |
| 25 to 29 Years | 133 (3.8%) | 127 (3.1%) |
| 30 to 34 Years | 174 (4.9%) | 156 (3.8%) |
| 35 to 39 Years | 165 (4.7%) | 344 (8.4%) |
| 40 to 44 Years | 274 (7.8%) | 134 (3.3%) |
| 45 to 49 Years | 213 (6.0%) | 212 (5.2%) |
| 50 to 54 Years | 194 (5.5%) | 306 (7.5%) |
| 55 to 59 Years | 175 (5.0%) | 231 (5.7%) |
| 60 to 64 Years | 183 (5.2%) | 421 (10.3%) |
| 65 to 69 Years | 323 (9.2%) | 388 (9.5%) |
| 70 to 74 Years | 300 (8.5%) | 220 (5.4%) |
| 75 to 79 Years | 170 (4.8%) | 170 (4.2%) |
| 80 to 84 Years | 151 (4.3%) | 283 (6.9%) |
| 85 Years and over | 175 (5.0%) | 159 (3.9%) |
| Total | 3,526 (100.0%) | 4,084 (100.0%) |
Families and Households in Ojai
Median Family Size in Ojai
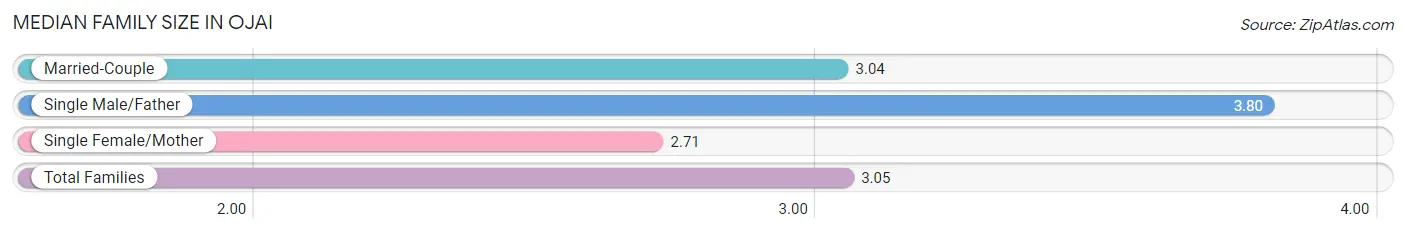
The median family size in Ojai is 3.05 persons per family, with single male/father families (198 | 10.7%) accounting for the largest median family size of 3.8 persons per family. On the other hand, single female/mother families (428 | 23.1%) represent the smallest median family size with 2.71 persons per family.
| Family Type | # Families | Family Size |
| Married-Couple | 1,227 (66.2%) | 3.04 |
| Single Male/Father | 198 (10.7%) | 3.80 |
| Single Female/Mother | 428 (23.1%) | 2.71 |
| Total Families | 1,853 (100.0%) | 3.05 |
Median Household Size in Ojai
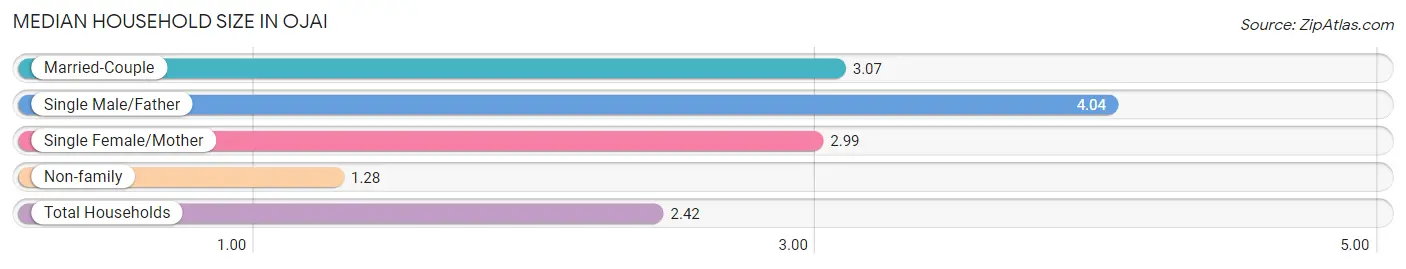
The median household size in Ojai is 2.42 persons per household, with single male/father households (198 | 6.5%) accounting for the largest median household size of 4.04 persons per household. non-family households (1,195 | 39.2%) represent the smallest median household size with 1.28 persons per household.
| Household Type | # Households | Household Size |
| Married-Couple | 1,227 (40.3%) | 3.07 |
| Single Male/Father | 198 (6.5%) | 4.04 |
| Single Female/Mother | 428 (14.0%) | 2.99 |
| Non-family | 1,195 (39.2%) | 1.28 |
| Total Households | 3,048 (100.0%) | 2.42 |
Household Size by Marriage Status in Ojai
Out of a total of 3,048 households in Ojai, 1,853 (60.8%) are family households, while 1,195 (39.2%) are nonfamily households. The most numerous type of family households are 2-person households, comprising 872, and the most common type of nonfamily households are 1-person households, comprising 936.
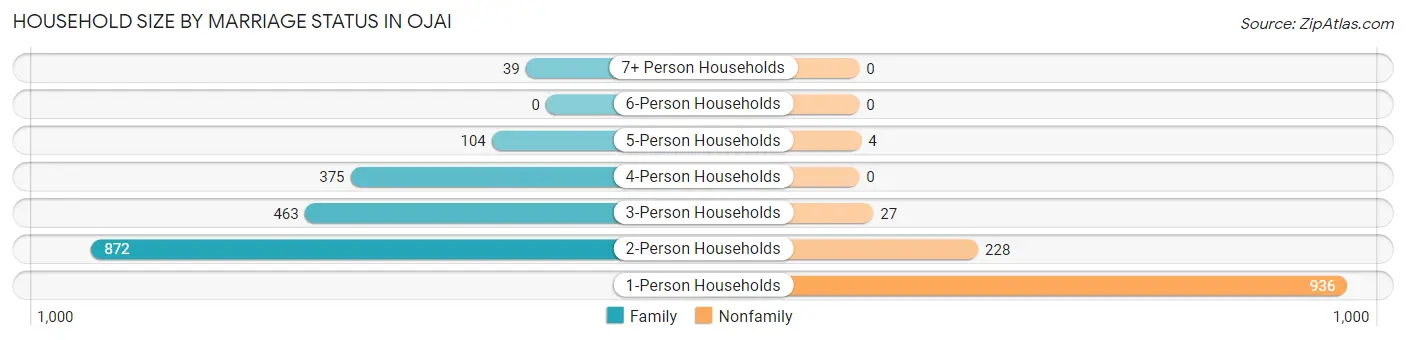
| Household Size | Family Households | Nonfamily Households |
| 1-Person Households | - | 936 (30.7%) |
| 2-Person Households | 872 (28.6%) | 228 (7.5%) |
| 3-Person Households | 463 (15.2%) | 27 (0.9%) |
| 4-Person Households | 375 (12.3%) | 0 (0.0%) |
| 5-Person Households | 104 (3.4%) | 4 (0.1%) |
| 6-Person Households | 0 (0.0%) | 0 (0.0%) |
| 7+ Person Households | 39 (1.3%) | 0 (0.0%) |
| Total | 1,853 (60.8%) | 1,195 (39.2%) |
Female Fertility in Ojai
Fertility by Age in Ojai
| Age Bracket | Women with Births | Births / 1,000 Women |
| 15 to 19 years | 0 (0.0%) | 0.0 |
| 20 to 34 years | 0 (0.0%) | 0.0 |
| 35 to 50 years | 0 (0.0%) | 0.0 |
| Total | 0 (0.0%) | 0.0 |
Fertility by Age by Marriage Status in Ojai
| Age Bracket | Married | Unmarried |
| 15 to 19 years | 0 (0.0%) | 0 (0.0%) |
| 20 to 34 years | 0 (0.0%) | 0 (0.0%) |
| 35 to 50 years | 0 (0.0%) | 0 (0.0%) |
| Total | 0 (0.0%) | 0 (0.0%) |
Fertility by Education in Ojai
| Educational Attainment | Women with Births | Births / 1,000 Women |
| Less than High School | 0 (0.0%) | 0.0 |
| High School Diploma | 0 (0.0%) | 0.0 |
| College or Associate's Degree | 0 (0.0%) | 0.0 |
| Bachelor's Degree | 0 (0.0%) | 0.0 |
| Graduate Degree | 0 (0.0%) | 0.0 |
| Total | 0 (0.0%) | 0.0 |
Fertility by Education by Marriage Status in Ojai
| Educational Attainment | Married | Unmarried |
| Less than High School | 0 (0.0%) | 0 (0.0%) |
| High School Diploma | 0 (0.0%) | 0 (0.0%) |
| College or Associate's Degree | 0 (0.0%) | 0 (0.0%) |
| Bachelor's Degree | 0 (0.0%) | 0 (0.0%) |
| Graduate Degree | 0 (0.0%) | 0 (0.0%) |
| Total | 0 (0.0%) | 0 (0.0%) |
Employment Characteristics in Ojai
Employment by Class of Employer in Ojai
Among the 3,080 employed individuals in Ojai, private company employees (1,743 | 56.6%), self-employed (not incorporated) (373 | 12.1%), and local government employees (357 | 11.6%) make up the most common classes of employment.
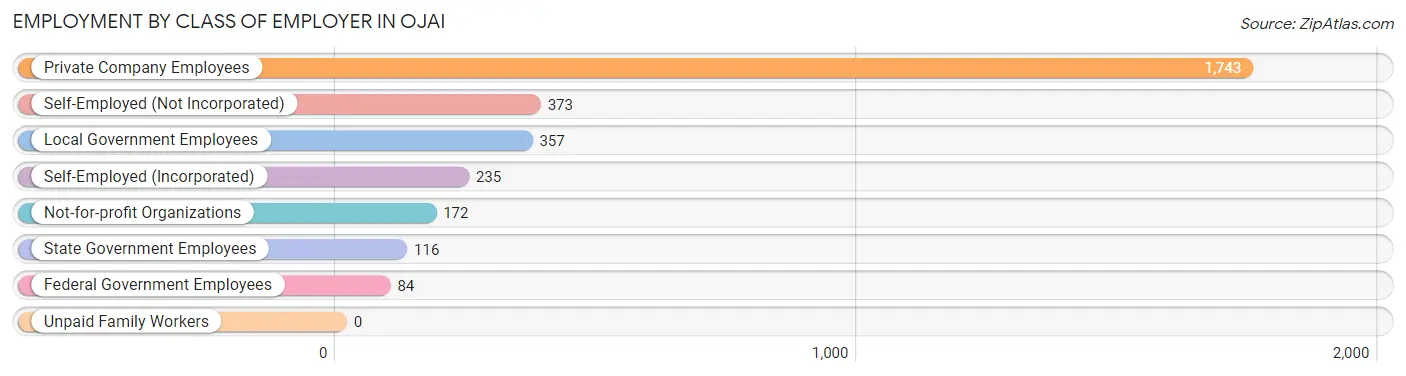
| Employer Class | # Employees | % Employees |
| Private Company Employees | 1,743 | 56.6% |
| Self-Employed (Incorporated) | 235 | 7.6% |
| Self-Employed (Not Incorporated) | 373 | 12.1% |
| Not-for-profit Organizations | 172 | 5.6% |
| Local Government Employees | 357 | 11.6% |
| State Government Employees | 116 | 3.8% |
| Federal Government Employees | 84 | 2.7% |
| Unpaid Family Workers | 0 | 0.0% |
| Total | 3,080 | 100.0% |
Employment Status by Age in Ojai
According to the labor force statistics for Ojai, out of the total population over 16 years of age (6,390), 53.3% or 3,406 individuals are in the labor force, with 6.5% or 221 of them unemployed. The age group with the highest labor force participation rate is 20 to 24 years, with 88.0% or 139 individuals in the labor force. Within the labor force, the 20 to 24 years age range has the highest percentage of unemployed individuals, with 18.7% or 26 of them being unemployed.
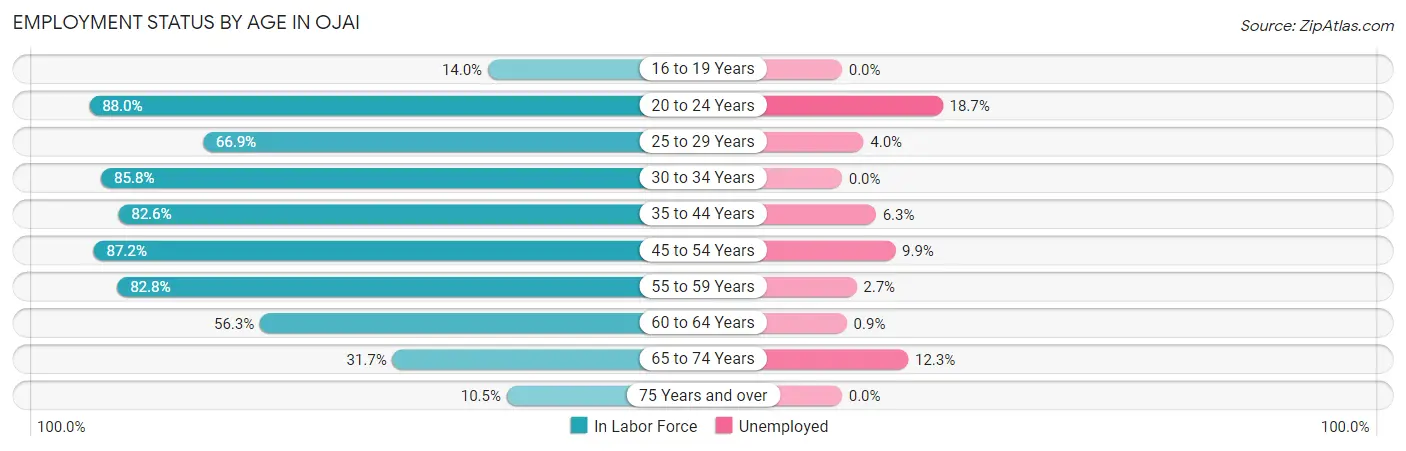
| Age Bracket | In Labor Force | Unemployed |
| 16 to 19 Years | 63 (14.0%) | 0 (0.0%) |
| 20 to 24 Years | 139 (88.0%) | 26 (18.7%) |
| 25 to 29 Years | 174 (66.9%) | 7 (4.0%) |
| 30 to 34 Years | 283 (85.8%) | 0 (0.0%) |
| 35 to 44 Years | 757 (82.6%) | 48 (6.3%) |
| 45 to 54 Years | 807 (87.2%) | 80 (9.9%) |
| 55 to 59 Years | 336 (82.8%) | 9 (2.7%) |
| 60 to 64 Years | 340 (56.3%) | 3 (0.9%) |
| 65 to 74 Years | 390 (31.7%) | 48 (12.3%) |
| 75 Years and over | 116 (10.5%) | 0 (0.0%) |
| Total | 3,406 (53.3%) | 221 (6.5%) |
Employment Status by Educational Attainment in Ojai
According to labor force statistics for Ojai, 78.4% of individuals (2,699) out of the total population between 25 and 64 years of age (3,442) are in the labor force, with 5.4% or 146 of them being unemployed. The group with the highest labor force participation rate are those with the educational attainment of bachelor's degree or higher, with 83.3% or 1,284 individuals in the labor force. Within the labor force, individuals with high school diploma education have the highest percentage of unemployment, with 16.5% or 67 of them being unemployed.
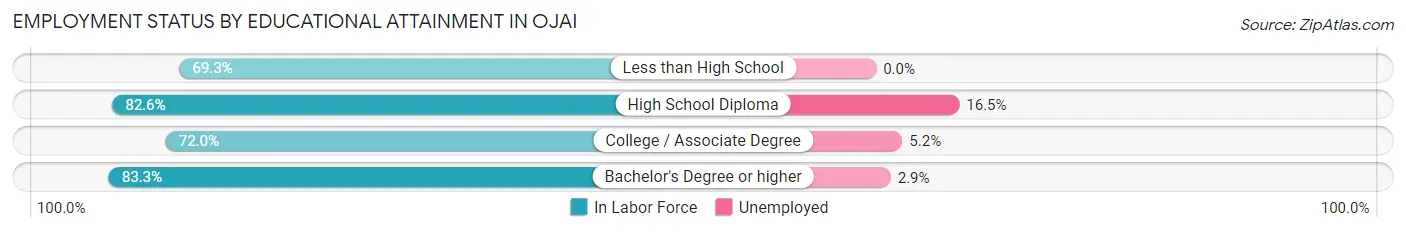
| Educational Attainment | In Labor Force | Unemployed |
| Less than High School | 217 (69.3%) | 0 (0.0%) |
| High School Diploma | 407 (82.6%) | 81 (16.5%) |
| College / Associate Degree | 788 (72.0%) | 57 (5.2%) |
| Bachelor's Degree or higher | 1,284 (83.3%) | 45 (2.9%) |
| Total | 2,699 (78.4%) | 186 (5.4%) |
Employment Occupations by Sex in Ojai
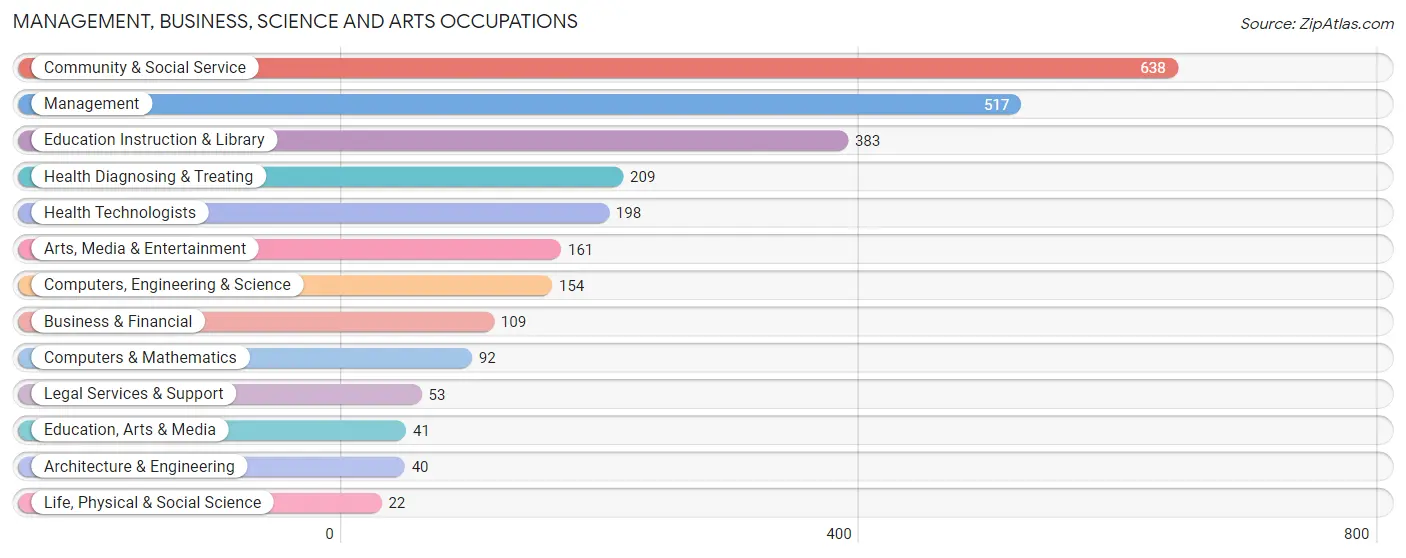
Management, Business, Science and Arts Occupations
The most common Management, Business, Science and Arts occupations in Ojai are Community & Social Service (638 | 20.2%), Management (517 | 16.4%), Education Instruction & Library (383 | 12.1%), Health Diagnosing & Treating (209 | 6.6%), and Health Technologists (198 | 6.3%).
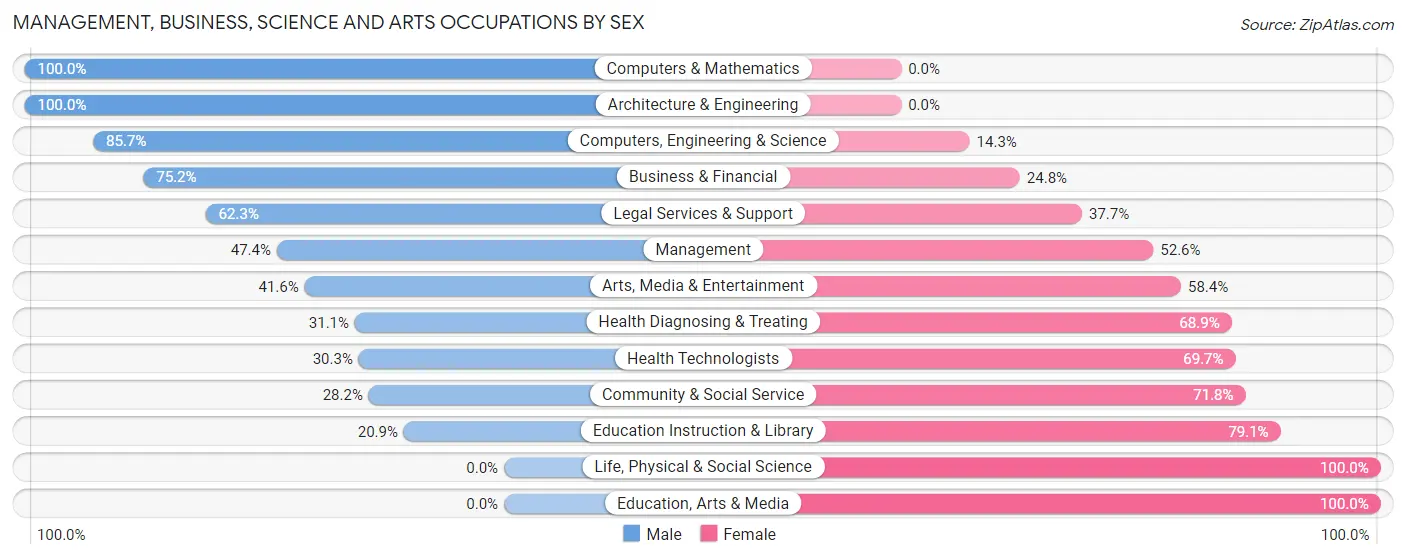
Management, Business, Science and Arts Occupations by Sex
Within the Management, Business, Science and Arts occupations in Ojai, the most male-oriented occupations are Computers & Mathematics (100.0%), Architecture & Engineering (100.0%), and Computers, Engineering & Science (85.7%), while the most female-oriented occupations are Life, Physical & Social Science (100.0%), Education, Arts & Media (100.0%), and Education Instruction & Library (79.1%).
| Occupation | Male | Female |
| Management | 245 (47.4%) | 272 (52.6%) |
| Business & Financial | 82 (75.2%) | 27 (24.8%) |
| Computers, Engineering & Science | 132 (85.7%) | 22 (14.3%) |
| Computers & Mathematics | 92 (100.0%) | 0 (0.0%) |
| Architecture & Engineering | 40 (100.0%) | 0 (0.0%) |
| Life, Physical & Social Science | 0 (0.0%) | 22 (100.0%) |
| Community & Social Service | 180 (28.2%) | 458 (71.8%) |
| Education, Arts & Media | 0 (0.0%) | 41 (100.0%) |
| Legal Services & Support | 33 (62.3%) | 20 (37.7%) |
| Education Instruction & Library | 80 (20.9%) | 303 (79.1%) |
| Arts, Media & Entertainment | 67 (41.6%) | 94 (58.4%) |
| Health Diagnosing & Treating | 65 (31.1%) | 144 (68.9%) |
| Health Technologists | 60 (30.3%) | 138 (69.7%) |
| Total (Category) | 704 (43.3%) | 923 (56.7%) |
| Total (Overall) | 1,648 (52.1%) | 1,513 (47.9%) |
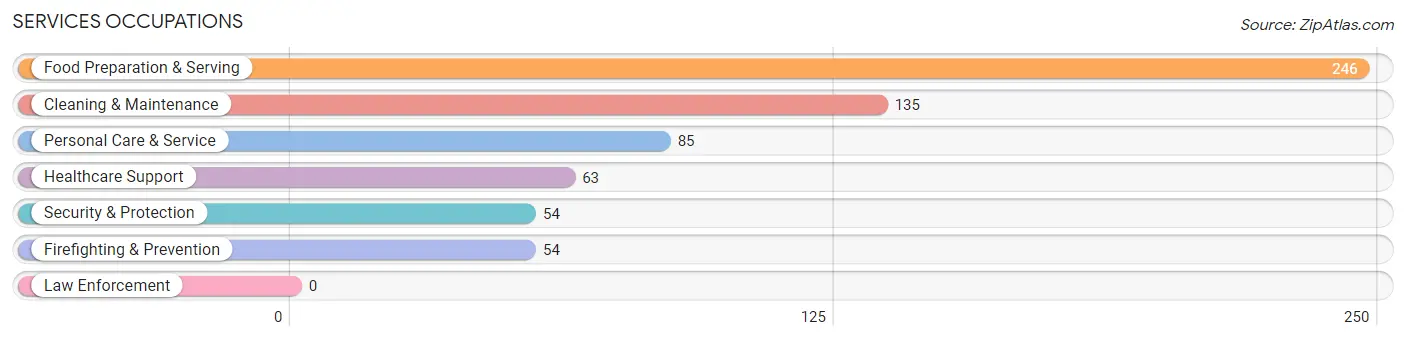
Services Occupations
The most common Services occupations in Ojai are Food Preparation & Serving (246 | 7.8%), Cleaning & Maintenance (135 | 4.3%), Personal Care & Service (85 | 2.7%), Healthcare Support (63 | 2.0%), and Security & Protection (54 | 1.7%).
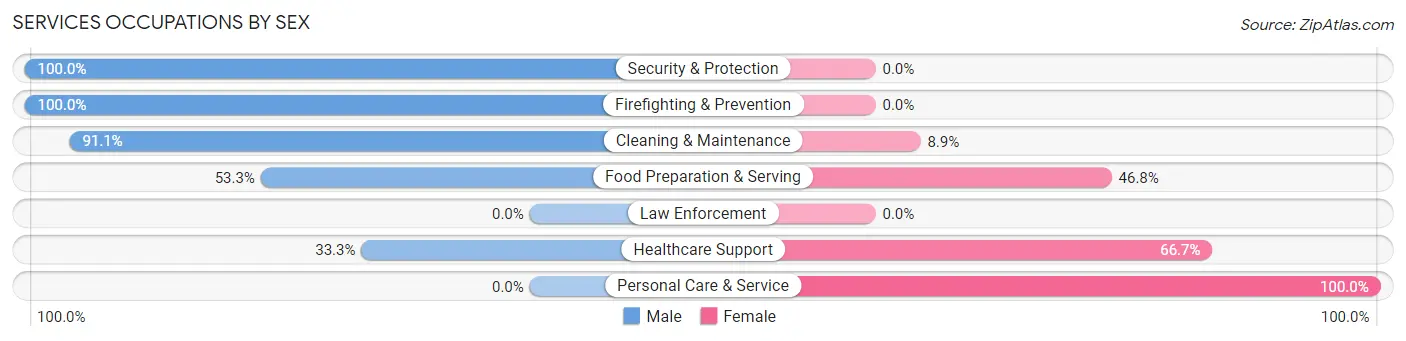
Services Occupations by Sex
Within the Services occupations in Ojai, the most male-oriented occupations are Security & Protection (100.0%), Firefighting & Prevention (100.0%), and Cleaning & Maintenance (91.1%), while the most female-oriented occupations are Personal Care & Service (100.0%), Healthcare Support (66.7%), and Food Preparation & Serving (46.8%).
| Occupation | Male | Female |
| Healthcare Support | 21 (33.3%) | 42 (66.7%) |
| Security & Protection | 54 (100.0%) | 0 (0.0%) |
| Firefighting & Prevention | 54 (100.0%) | 0 (0.0%) |
| Law Enforcement | 0 (0.0%) | 0 (0.0%) |
| Food Preparation & Serving | 131 (53.2%) | 115 (46.8%) |
| Cleaning & Maintenance | 123 (91.1%) | 12 (8.9%) |
| Personal Care & Service | 0 (0.0%) | 85 (100.0%) |
| Total (Category) | 329 (56.4%) | 254 (43.6%) |
| Total (Overall) | 1,648 (52.1%) | 1,513 (47.9%) |
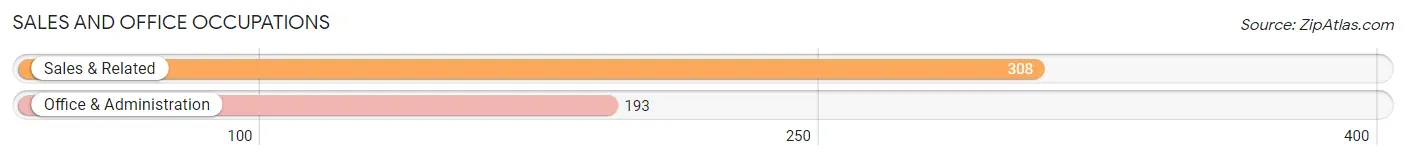
Sales and Office Occupations
The most common Sales and Office occupations in Ojai are Sales & Related (308 | 9.7%), and Office & Administration (193 | 6.1%).
Sales and Office Occupations by Sex
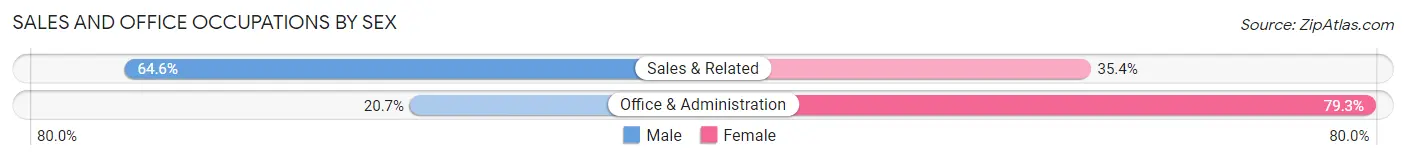
| Occupation | Male | Female |
| Sales & Related | 199 (64.6%) | 109 (35.4%) |
| Office & Administration | 40 (20.7%) | 153 (79.3%) |
| Total (Category) | 239 (47.7%) | 262 (52.3%) |
| Total (Overall) | 1,648 (52.1%) | 1,513 (47.9%) |
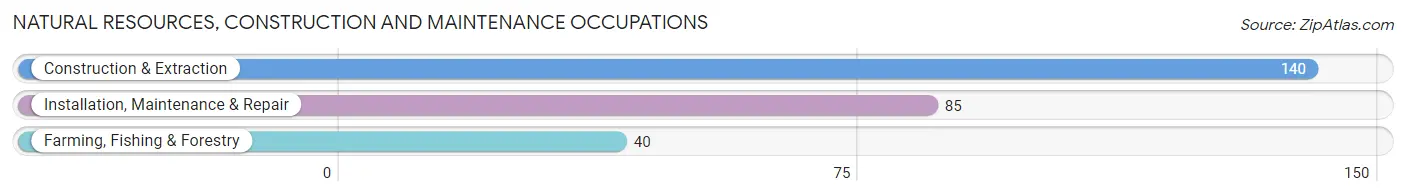
Natural Resources, Construction and Maintenance Occupations
The most common Natural Resources, Construction and Maintenance occupations in Ojai are Construction & Extraction (140 | 4.4%), Installation, Maintenance & Repair (85 | 2.7%), and Farming, Fishing & Forestry (40 | 1.3%).
Natural Resources, Construction and Maintenance Occupations by Sex
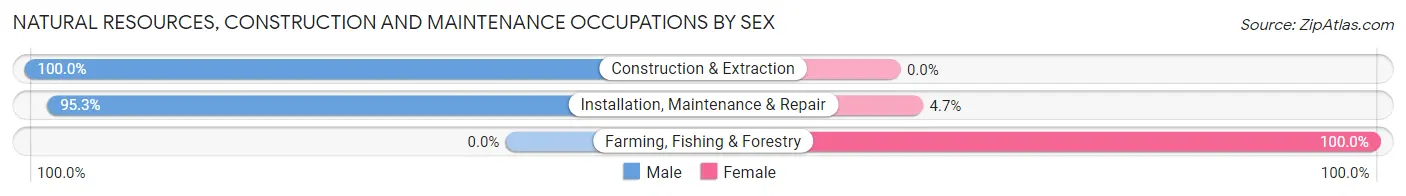
| Occupation | Male | Female |
| Farming, Fishing & Forestry | 0 (0.0%) | 40 (100.0%) |
| Construction & Extraction | 140 (100.0%) | 0 (0.0%) |
| Installation, Maintenance & Repair | 81 (95.3%) | 4 (4.7%) |
| Total (Category) | 221 (83.4%) | 44 (16.6%) |
| Total (Overall) | 1,648 (52.1%) | 1,513 (47.9%) |
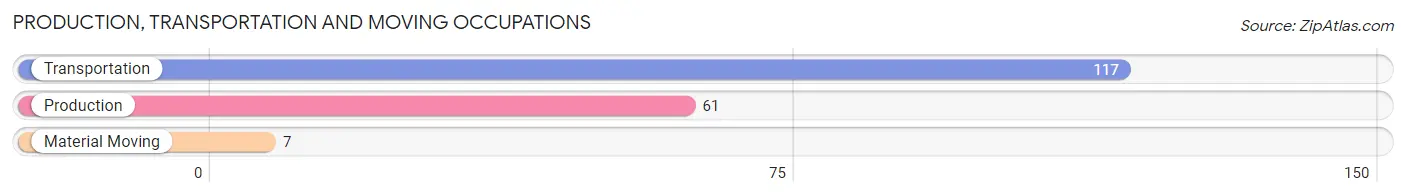
Production, Transportation and Moving Occupations
The most common Production, Transportation and Moving occupations in Ojai are Transportation (117 | 3.7%), Production (61 | 1.9%), and Material Moving (7 | 0.2%).
Production, Transportation and Moving Occupations by Sex
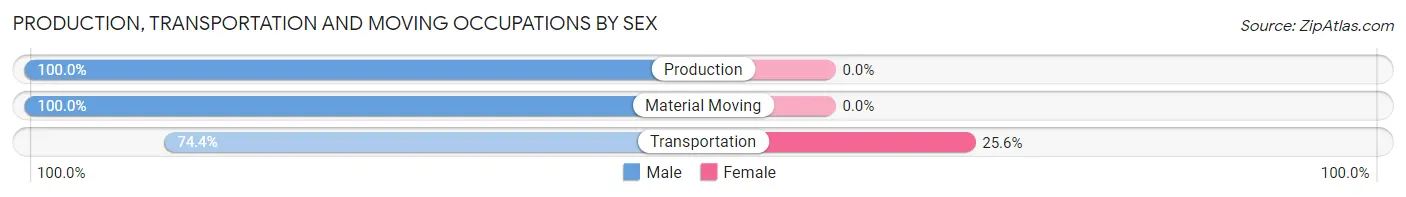
| Occupation | Male | Female |
| Production | 61 (100.0%) | 0 (0.0%) |
| Transportation | 87 (74.4%) | 30 (25.6%) |
| Material Moving | 7 (100.0%) | 0 (0.0%) |
| Total (Category) | 155 (83.8%) | 30 (16.2%) |
| Total (Overall) | 1,648 (52.1%) | 1,513 (47.9%) |
Employment Industries by Sex in Ojai
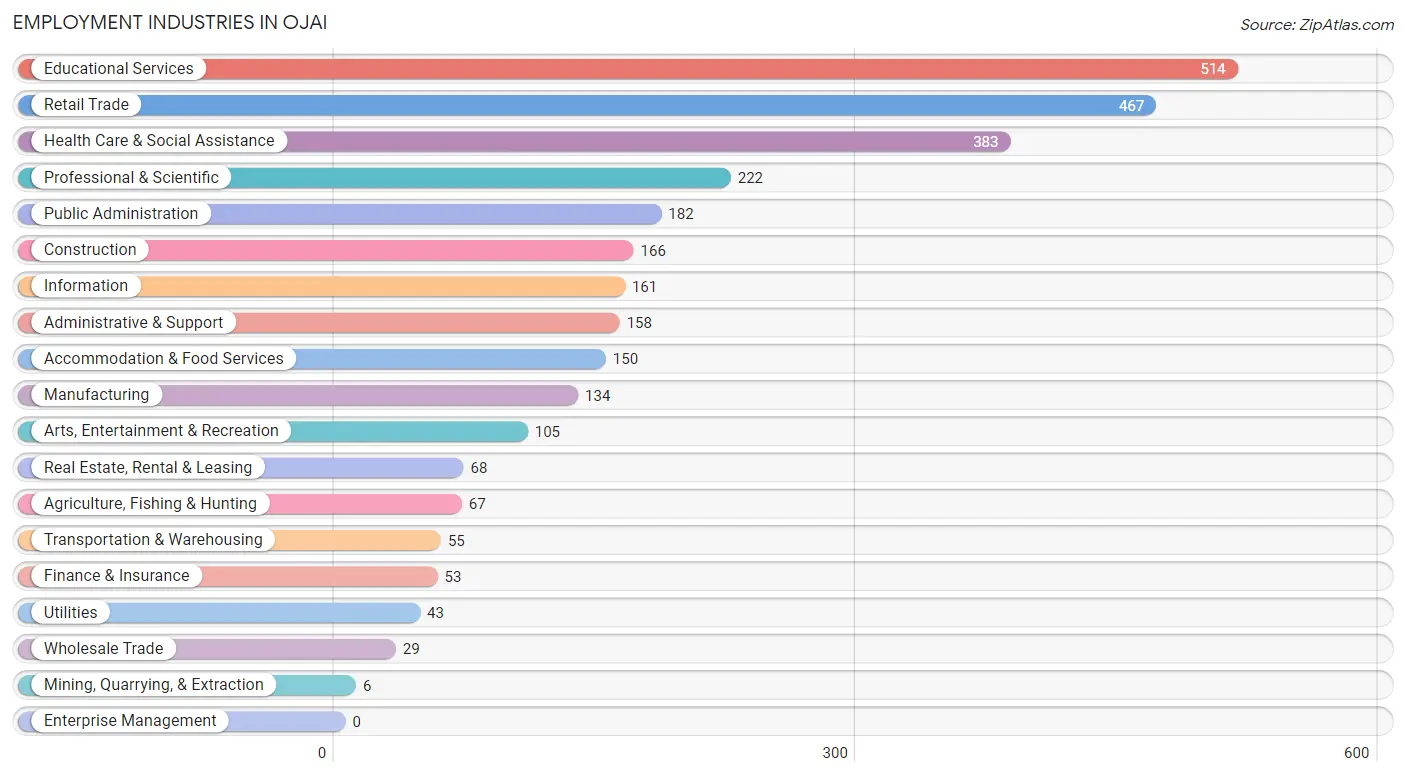
Employment Industries in Ojai
The major employment industries in Ojai include Educational Services (514 | 16.3%), Retail Trade (467 | 14.8%), Health Care & Social Assistance (383 | 12.1%), Professional & Scientific (222 | 7.0%), and Public Administration (182 | 5.8%).
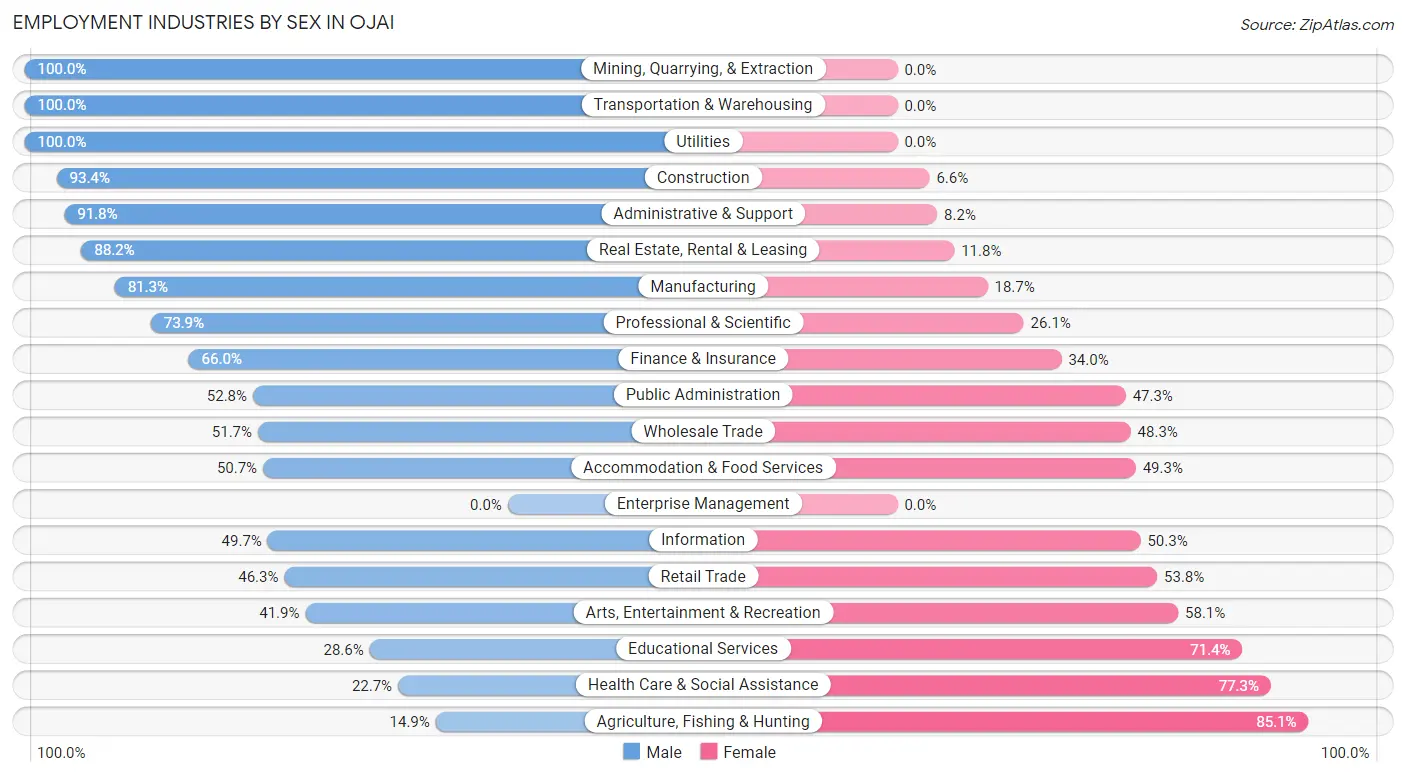
Employment Industries by Sex in Ojai
The Ojai industries that see more men than women are Mining, Quarrying, & Extraction (100.0%), Transportation & Warehousing (100.0%), and Utilities (100.0%), whereas the industries that tend to have a higher number of women are Agriculture, Fishing & Hunting (85.1%), Health Care & Social Assistance (77.3%), and Educational Services (71.4%).
| Industry | Male | Female |
| Agriculture, Fishing & Hunting | 10 (14.9%) | 57 (85.1%) |
| Mining, Quarrying, & Extraction | 6 (100.0%) | 0 (0.0%) |
| Construction | 155 (93.4%) | 11 (6.6%) |
| Manufacturing | 109 (81.3%) | 25 (18.7%) |
| Wholesale Trade | 15 (51.7%) | 14 (48.3%) |
| Retail Trade | 216 (46.3%) | 251 (53.7%) |
| Transportation & Warehousing | 55 (100.0%) | 0 (0.0%) |
| Utilities | 43 (100.0%) | 0 (0.0%) |
| Information | 80 (49.7%) | 81 (50.3%) |
| Finance & Insurance | 35 (66.0%) | 18 (34.0%) |
| Real Estate, Rental & Leasing | 60 (88.2%) | 8 (11.8%) |
| Professional & Scientific | 164 (73.9%) | 58 (26.1%) |
| Enterprise Management | 0 (0.0%) | 0 (0.0%) |
| Administrative & Support | 145 (91.8%) | 13 (8.2%) |
| Educational Services | 147 (28.6%) | 367 (71.4%) |
| Health Care & Social Assistance | 87 (22.7%) | 296 (77.3%) |
| Arts, Entertainment & Recreation | 44 (41.9%) | 61 (58.1%) |
| Accommodation & Food Services | 76 (50.7%) | 74 (49.3%) |
| Public Administration | 96 (52.7%) | 86 (47.2%) |
| Total | 1,648 (52.1%) | 1,513 (47.9%) |
Education in Ojai
School Enrollment in Ojai
The most common levels of schooling among the 1,604 students in Ojai are high school (536 | 33.4%), elementary school (428 | 26.7%), and middle school (297 | 18.5%).
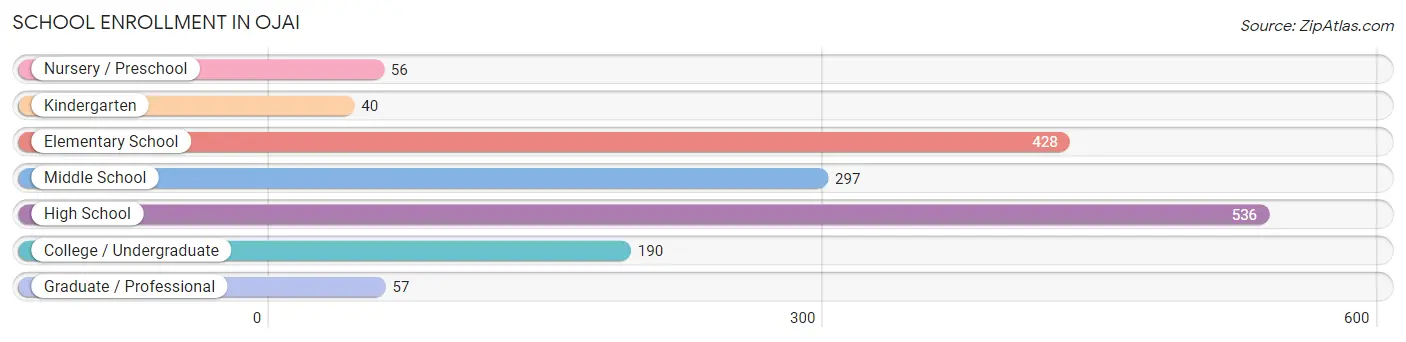
| School Level | # Students | % Students |
| Nursery / Preschool | 56 | 3.5% |
| Kindergarten | 40 | 2.5% |
| Elementary School | 428 | 26.7% |
| Middle School | 297 | 18.5% |
| High School | 536 | 33.4% |
| College / Undergraduate | 190 | 11.8% |
| Graduate / Professional | 57 | 3.5% |
| Total | 1,604 | 100.0% |
School Enrollment by Age by Funding Source in Ojai
Out of a total of 1,604 students who are enrolled in schools in Ojai, 377 (23.5%) attend a private institution, while the remaining 1,227 (76.5%) are enrolled in public schools. The age group of 5 to 9 year old has the highest likelihood of being enrolled in private schools, with 266 (56.8% in the age bracket) enrolled. Conversely, the age group of 25 to 34 year olds has the lowest likelihood of being enrolled in a private school, with 25 (100.0% in the age bracket) attending a public institution.
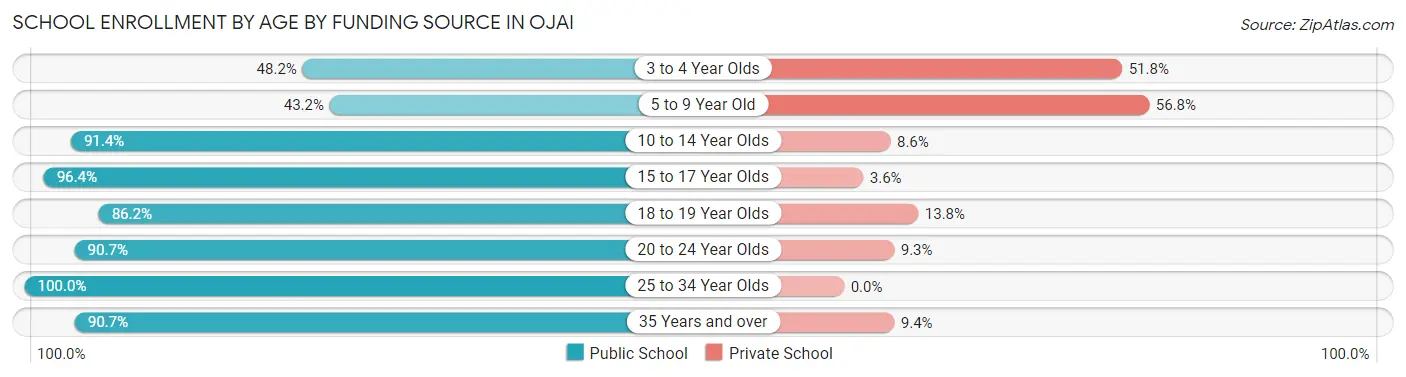
| Age Bracket | Public School | Private School |
| 3 to 4 Year Olds | 27 (48.2%) | 29 (51.8%) |
| 5 to 9 Year Old | 202 (43.2%) | 266 (56.8%) |
| 10 to 14 Year Olds | 349 (91.4%) | 33 (8.6%) |
| 15 to 17 Year Olds | 324 (96.4%) | 12 (3.6%) |
| 18 to 19 Year Olds | 106 (86.2%) | 17 (13.8%) |
| 20 to 24 Year Olds | 68 (90.7%) | 7 (9.3%) |
| 25 to 34 Year Olds | 25 (100.0%) | 0 (0.0%) |
| 35 Years and over | 126 (90.6%) | 13 (9.3%) |
| Total | 1,227 (76.5%) | 377 (23.5%) |
Educational Attainment by Field of Study in Ojai
Literature & languages (317 | 11.7%), business (309 | 11.4%), bio, nature & agricultural (300 | 11.0%), visual & performing arts (280 | 10.3%), and social sciences (264 | 9.7%) are the most common fields of study among 2,722 individuals in Ojai who have obtained a bachelor's degree or higher.
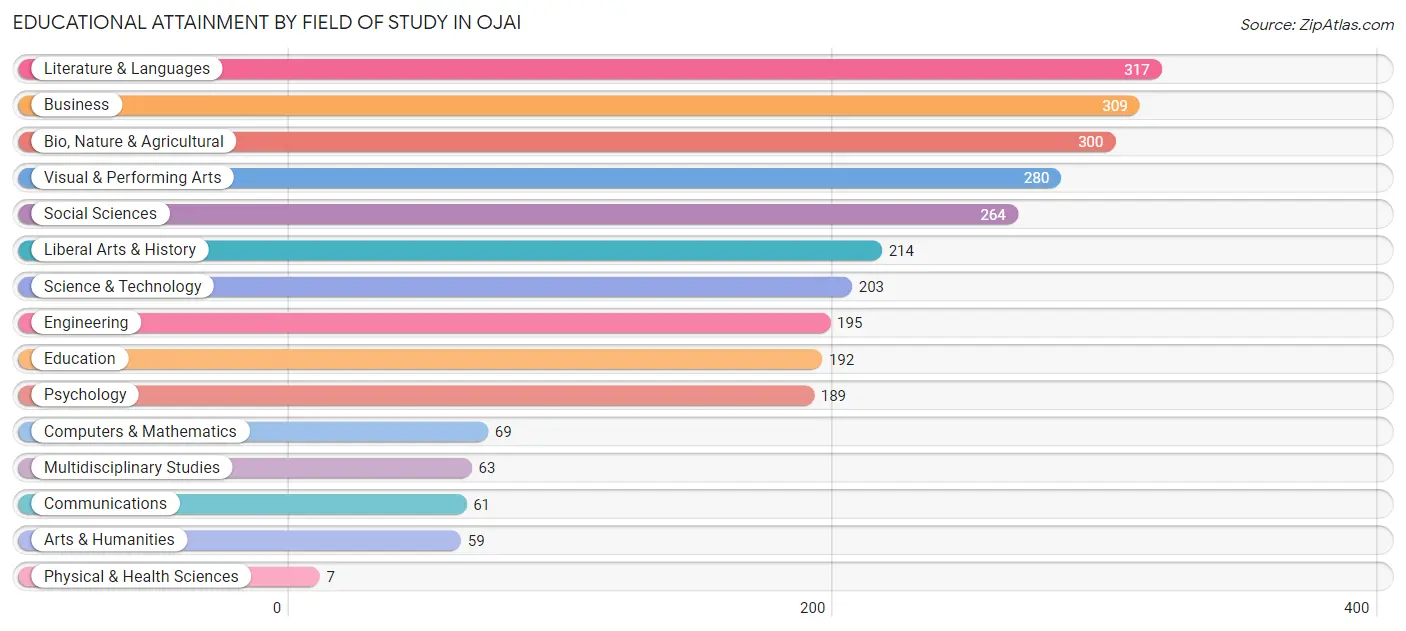
| Field of Study | # Graduates | % Graduates |
| Computers & Mathematics | 69 | 2.5% |
| Bio, Nature & Agricultural | 300 | 11.0% |
| Physical & Health Sciences | 7 | 0.3% |
| Psychology | 189 | 6.9% |
| Social Sciences | 264 | 9.7% |
| Engineering | 195 | 7.2% |
| Multidisciplinary Studies | 63 | 2.3% |
| Science & Technology | 203 | 7.5% |
| Business | 309 | 11.4% |
| Education | 192 | 7.0% |
| Literature & Languages | 317 | 11.7% |
| Liberal Arts & History | 214 | 7.9% |
| Visual & Performing Arts | 280 | 10.3% |
| Communications | 61 | 2.2% |
| Arts & Humanities | 59 | 2.2% |
| Total | 2,722 | 100.0% |
Transportation & Commute in Ojai
Vehicle Availability by Sex in Ojai
The most prevalent vehicle ownership categories in Ojai are males with 2 vehicles (679, accounting for 43.5%) and females with 2 vehicles (390, making up 46.9%).
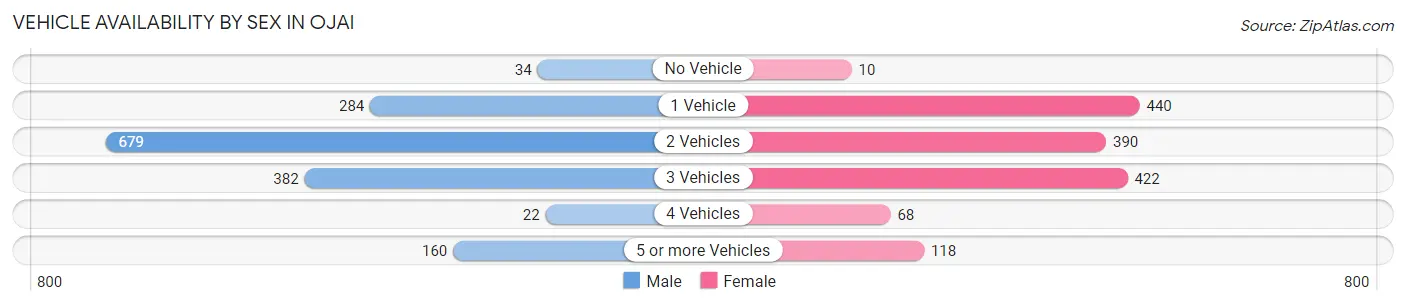
| Vehicles Available | Male | Female |
| No Vehicle | 34 (2.2%) | 10 (0.7%) |
| 1 Vehicle | 284 (18.2%) | 440 (30.4%) |
| 2 Vehicles | 679 (43.5%) | 390 (26.9%) |
| 3 Vehicles | 382 (24.5%) | 422 (29.1%) |
| 4 Vehicles | 22 (1.4%) | 68 (4.7%) |
| 5 or more Vehicles | 160 (10.2%) | 118 (8.2%) |
| Total | 1,561 (100.0%) | 1,448 (100.0%) |
Commute Time in Ojai
The most frequently occuring commute durations in Ojai are 5 to 9 minutes (457 commuters, 18.2%), 10 to 14 minutes (420 commuters, 16.8%), and 30 to 34 minutes (392 commuters, 15.6%).
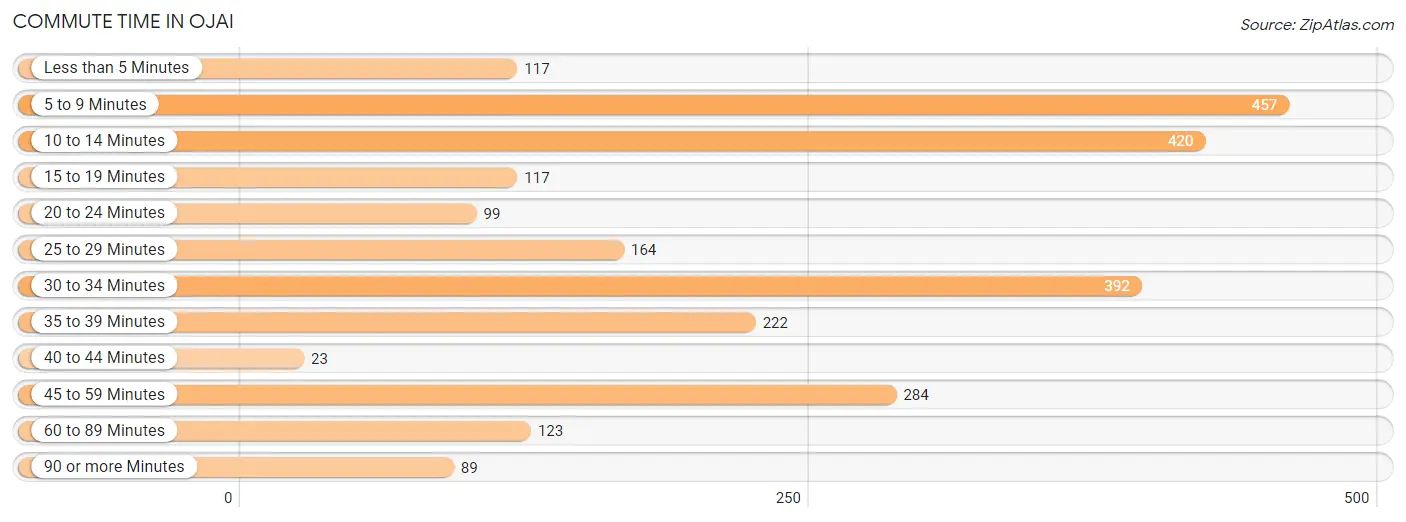
| Commute Time | # Commuters | % Commuters |
| Less than 5 Minutes | 117 | 4.7% |
| 5 to 9 Minutes | 457 | 18.2% |
| 10 to 14 Minutes | 420 | 16.8% |
| 15 to 19 Minutes | 117 | 4.7% |
| 20 to 24 Minutes | 99 | 4.0% |
| 25 to 29 Minutes | 164 | 6.5% |
| 30 to 34 Minutes | 392 | 15.6% |
| 35 to 39 Minutes | 222 | 8.9% |
| 40 to 44 Minutes | 23 | 0.9% |
| 45 to 59 Minutes | 284 | 11.3% |
| 60 to 89 Minutes | 123 | 4.9% |
| 90 or more Minutes | 89 | 3.5% |
Commute Time by Sex in Ojai
The most common commute times in Ojai are 45 to 59 minutes (249 commuters, 18.9%) for males and 10 to 14 minutes (306 commuters, 25.8%) for females.
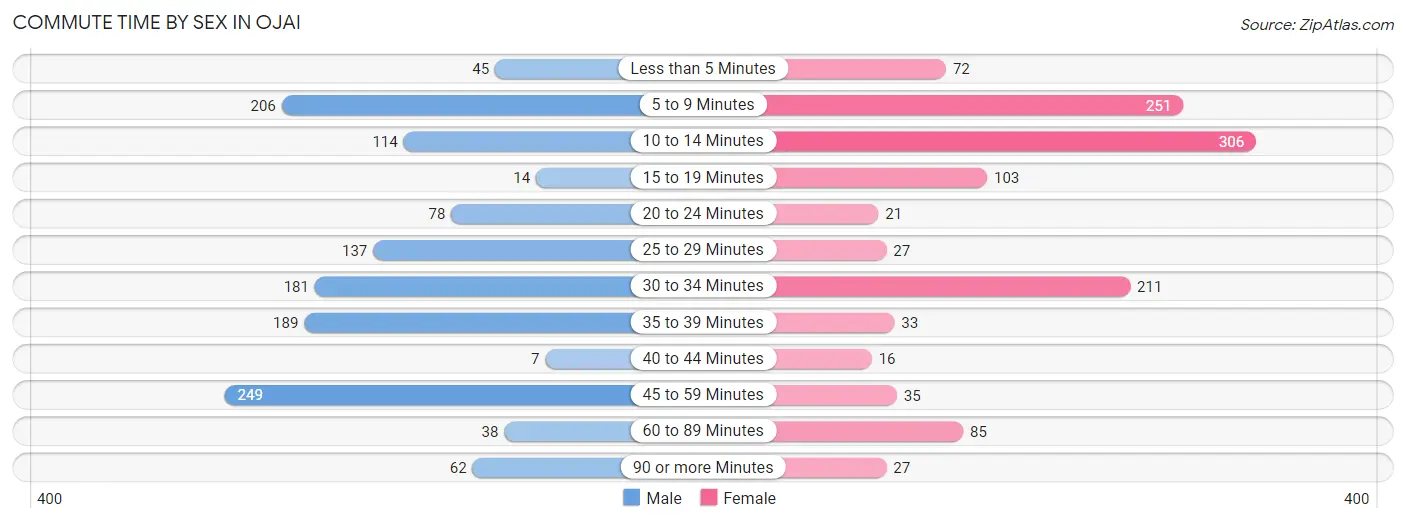
| Commute Time | Male | Female |
| Less than 5 Minutes | 45 (3.4%) | 72 (6.1%) |
| 5 to 9 Minutes | 206 (15.6%) | 251 (21.1%) |
| 10 to 14 Minutes | 114 (8.6%) | 306 (25.8%) |
| 15 to 19 Minutes | 14 (1.1%) | 103 (8.7%) |
| 20 to 24 Minutes | 78 (5.9%) | 21 (1.8%) |
| 25 to 29 Minutes | 137 (10.4%) | 27 (2.3%) |
| 30 to 34 Minutes | 181 (13.7%) | 211 (17.8%) |
| 35 to 39 Minutes | 189 (14.3%) | 33 (2.8%) |
| 40 to 44 Minutes | 7 (0.5%) | 16 (1.3%) |
| 45 to 59 Minutes | 249 (18.9%) | 35 (2.9%) |
| 60 to 89 Minutes | 38 (2.9%) | 85 (7.2%) |
| 90 or more Minutes | 62 (4.7%) | 27 (2.3%) |
Time of Departure to Work by Sex in Ojai
The most frequent times of departure to work in Ojai are 7:00 AM to 7:29 AM (250, 18.9%) for males and 8:00 AM to 8:29 AM (342, 28.8%) for females.
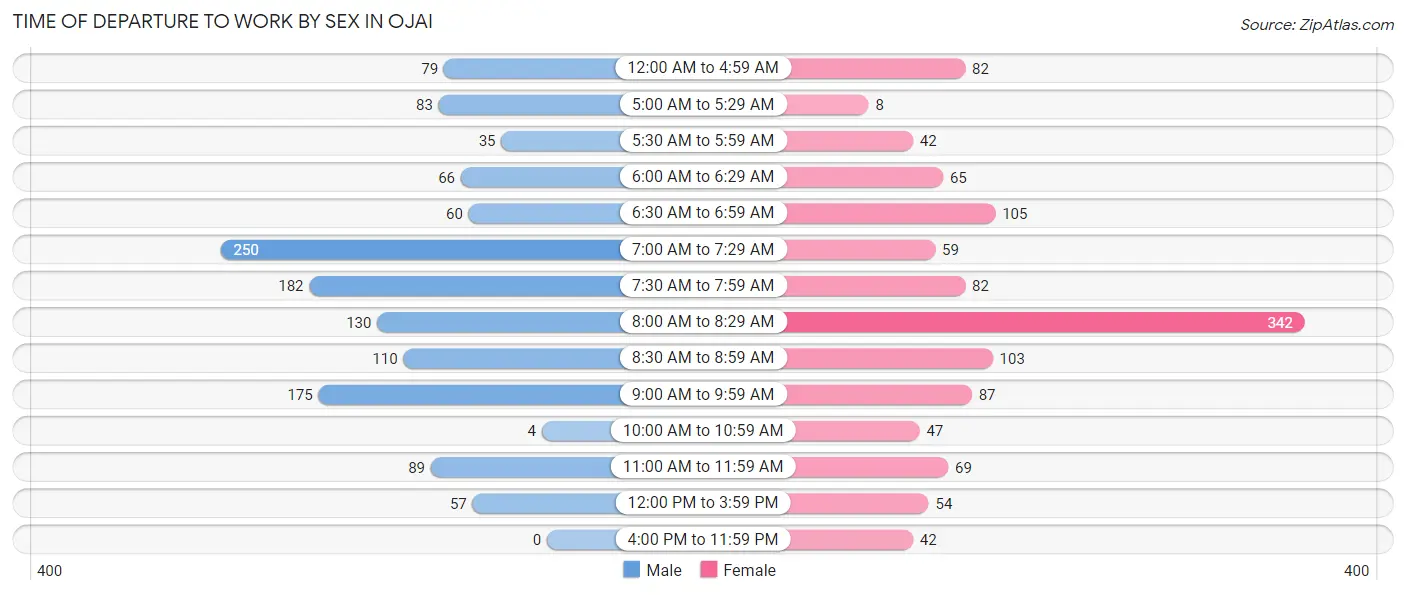
| Time of Departure | Male | Female |
| 12:00 AM to 4:59 AM | 79 (6.0%) | 82 (6.9%) |
| 5:00 AM to 5:29 AM | 83 (6.3%) | 8 (0.7%) |
| 5:30 AM to 5:59 AM | 35 (2.6%) | 42 (3.5%) |
| 6:00 AM to 6:29 AM | 66 (5.0%) | 65 (5.5%) |
| 6:30 AM to 6:59 AM | 60 (4.5%) | 105 (8.8%) |
| 7:00 AM to 7:29 AM | 250 (18.9%) | 59 (5.0%) |
| 7:30 AM to 7:59 AM | 182 (13.8%) | 82 (6.9%) |
| 8:00 AM to 8:29 AM | 130 (9.9%) | 342 (28.8%) |
| 8:30 AM to 8:59 AM | 110 (8.3%) | 103 (8.7%) |
| 9:00 AM to 9:59 AM | 175 (13.3%) | 87 (7.3%) |
| 10:00 AM to 10:59 AM | 4 (0.3%) | 47 (4.0%) |
| 11:00 AM to 11:59 AM | 89 (6.7%) | 69 (5.8%) |
| 12:00 PM to 3:59 PM | 57 (4.3%) | 54 (4.5%) |
| 4:00 PM to 11:59 PM | 0 (0.0%) | 42 (3.5%) |
| Total | 1,320 (100.0%) | 1,187 (100.0%) |
Housing Occupancy in Ojai
Occupancy by Ownership in Ojai
Of the total 3,048 dwellings in Ojai, owner-occupied units account for 1,791 (58.8%), while renter-occupied units make up 1,257 (41.2%).
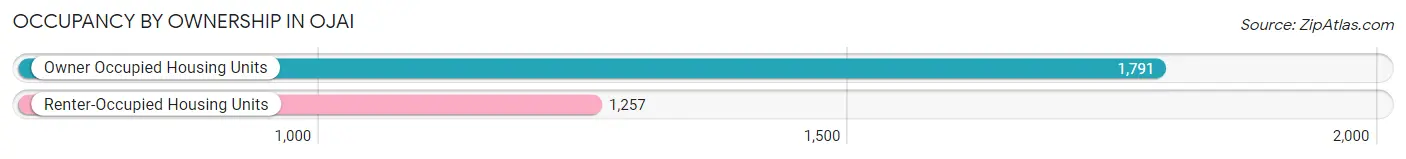
| Occupancy | # Housing Units | % Housing Units |
| Owner Occupied Housing Units | 1,791 | 58.8% |
| Renter-Occupied Housing Units | 1,257 | 41.2% |
| Total Occupied Housing Units | 3,048 | 100.0% |
Occupancy by Household Size in Ojai
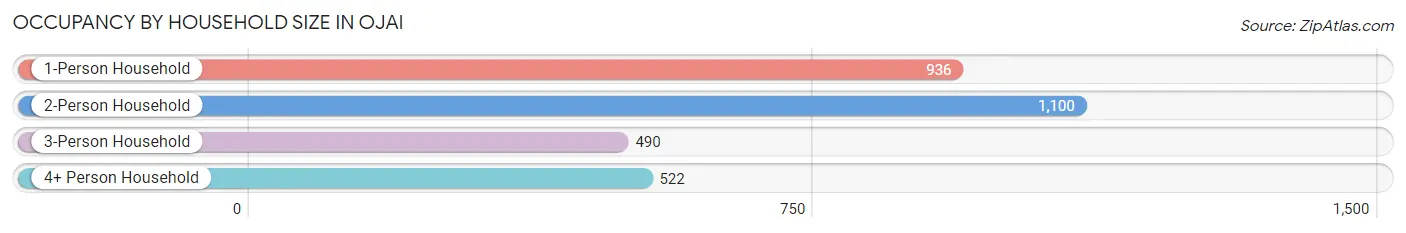
| Household Size | # Housing Units | % Housing Units |
| 1-Person Household | 936 | 30.7% |
| 2-Person Household | 1,100 | 36.1% |
| 3-Person Household | 490 | 16.1% |
| 4+ Person Household | 522 | 17.1% |
| Total Housing Units | 3,048 | 100.0% |
Occupancy by Ownership by Household Size in Ojai
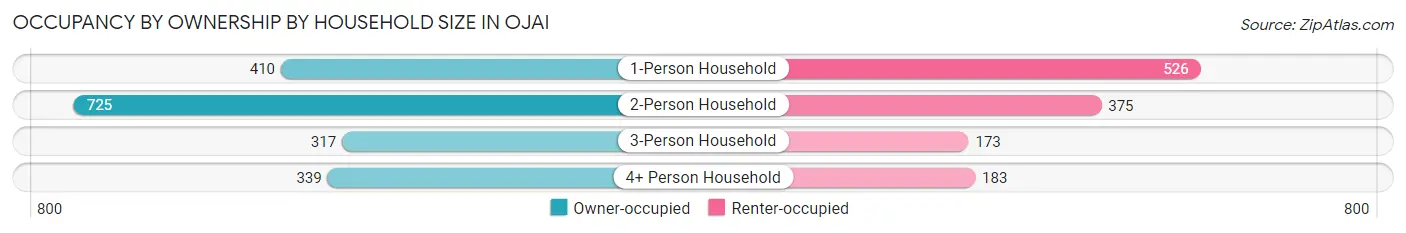
| Household Size | Owner-occupied | Renter-occupied |
| 1-Person Household | 410 (43.8%) | 526 (56.2%) |
| 2-Person Household | 725 (65.9%) | 375 (34.1%) |
| 3-Person Household | 317 (64.7%) | 173 (35.3%) |
| 4+ Person Household | 339 (64.9%) | 183 (35.1%) |
| Total Housing Units | 1,791 (58.8%) | 1,257 (41.2%) |
Occupancy by Educational Attainment in Ojai
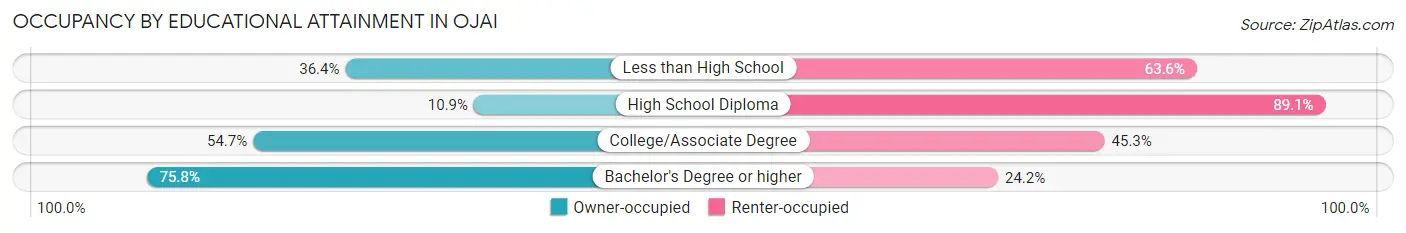
| Household Size | Owner-occupied | Renter-occupied |
| Less than High School | 59 (36.4%) | 103 (63.6%) |
| High School Diploma | 41 (10.9%) | 334 (89.1%) |
| College/Associate Degree | 552 (54.7%) | 457 (45.3%) |
| Bachelor's Degree or higher | 1,139 (75.8%) | 363 (24.2%) |
Occupancy by Age of Householder in Ojai
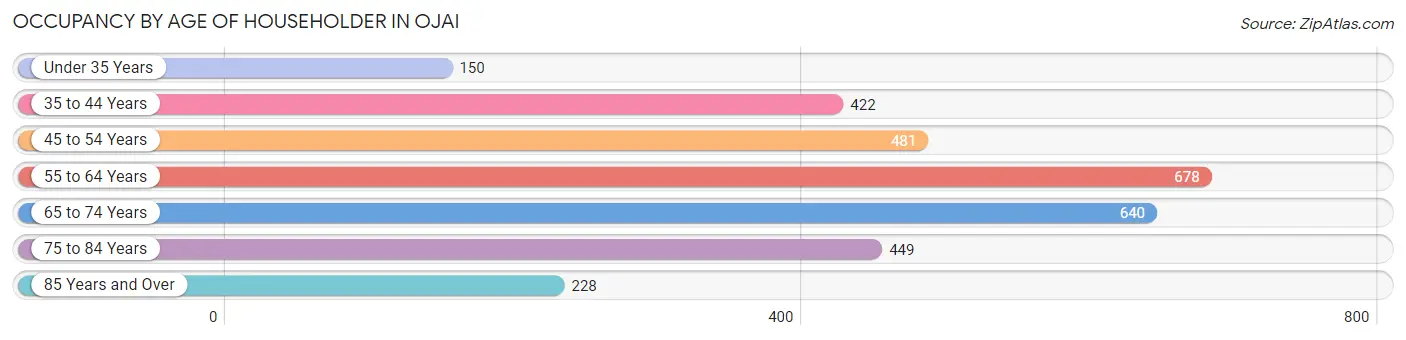
| Age Bracket | # Households | % Households |
| Under 35 Years | 150 | 4.9% |
| 35 to 44 Years | 422 | 13.9% |
| 45 to 54 Years | 481 | 15.8% |
| 55 to 64 Years | 678 | 22.2% |
| 65 to 74 Years | 640 | 21.0% |
| 75 to 84 Years | 449 | 14.7% |
| 85 Years and Over | 228 | 7.5% |
| Total | 3,048 | 100.0% |
Housing Finances in Ojai
Median Income by Occupancy in Ojai
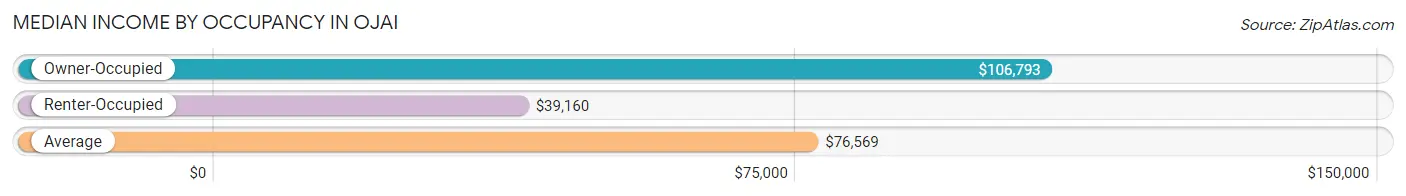
| Occupancy Type | # Households | Median Income |
| Owner-Occupied | 1,791 (58.8%) | $106,793 |
| Renter-Occupied | 1,257 (41.2%) | $39,160 |
| Average | 3,048 (100.0%) | $76,569 |
Occupancy by Householder Income Bracket in Ojai
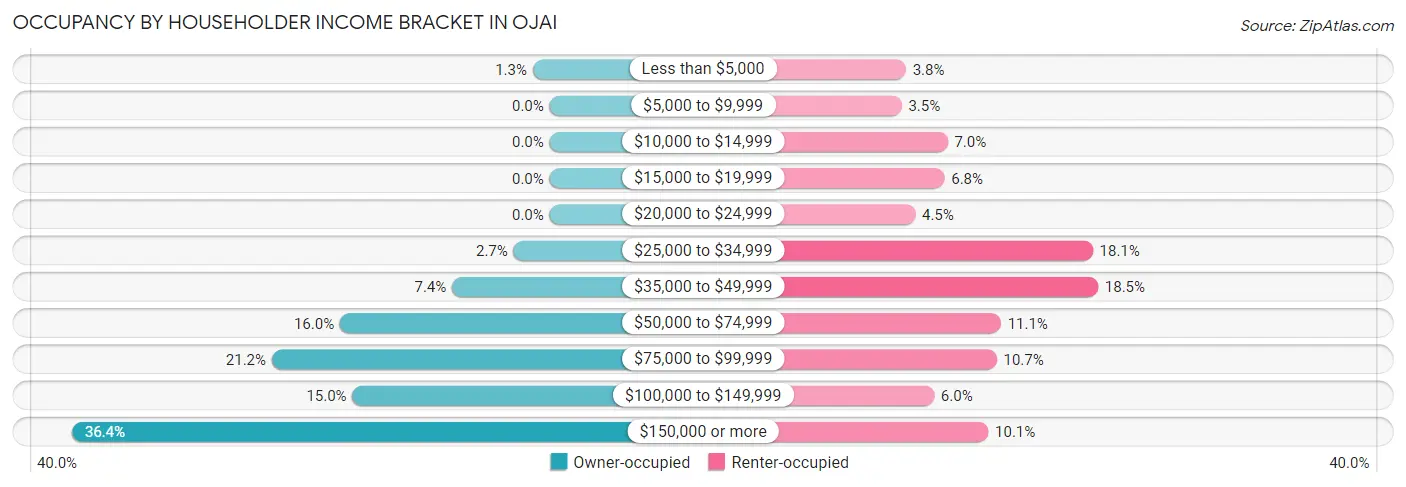
| Income Bracket | Owner-occupied | Renter-occupied |
| Less than $5,000 | 23 (1.3%) | 48 (3.8%) |
| $5,000 to $9,999 | 0 (0.0%) | 44 (3.5%) |
| $10,000 to $14,999 | 0 (0.0%) | 88 (7.0%) |
| $15,000 to $19,999 | 0 (0.0%) | 85 (6.8%) |
| $20,000 to $24,999 | 0 (0.0%) | 57 (4.5%) |
| $25,000 to $34,999 | 49 (2.7%) | 227 (18.1%) |
| $35,000 to $49,999 | 133 (7.4%) | 232 (18.5%) |
| $50,000 to $74,999 | 286 (16.0%) | 139 (11.1%) |
| $75,000 to $99,999 | 379 (21.2%) | 135 (10.7%) |
| $100,000 to $149,999 | 269 (15.0%) | 75 (6.0%) |
| $150,000 or more | 652 (36.4%) | 127 (10.1%) |
| Total | 1,791 (100.0%) | 1,257 (100.0%) |
Monthly Housing Cost Tiers in Ojai
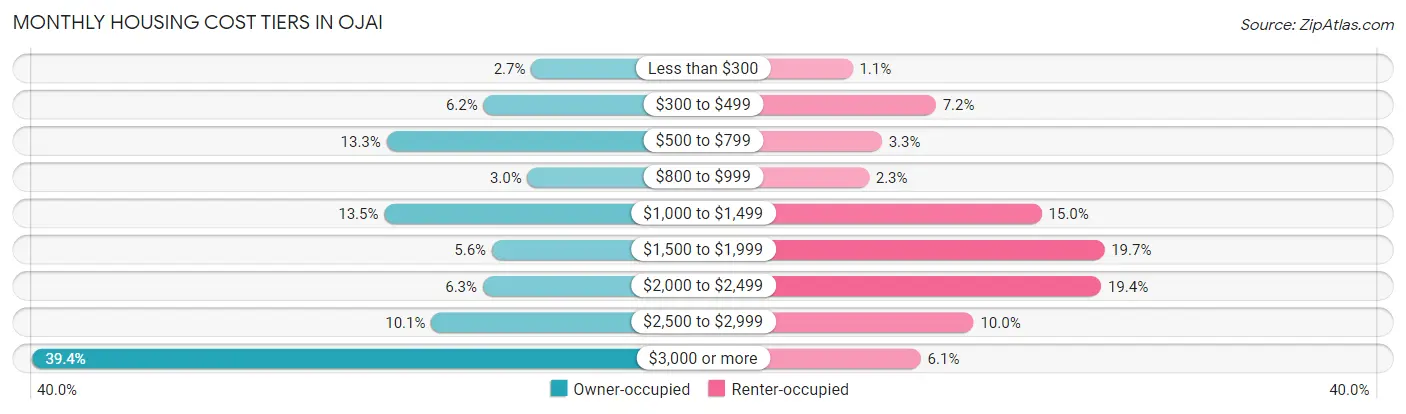
| Monthly Cost | Owner-occupied | Renter-occupied |
| Less than $300 | 48 (2.7%) | 14 (1.1%) |
| $300 to $499 | 111 (6.2%) | 91 (7.2%) |
| $500 to $799 | 239 (13.3%) | 41 (3.3%) |
| $800 to $999 | 53 (3.0%) | 29 (2.3%) |
| $1,000 to $1,499 | 242 (13.5%) | 189 (15.0%) |
| $1,500 to $1,999 | 100 (5.6%) | 247 (19.7%) |
| $2,000 to $2,499 | 112 (6.2%) | 244 (19.4%) |
| $2,500 to $2,999 | 180 (10.1%) | 126 (10.0%) |
| $3,000 or more | 706 (39.4%) | 77 (6.1%) |
| Total | 1,791 (100.0%) | 1,257 (100.0%) |
Physical Housing Characteristics in Ojai
Housing Structures in Ojai
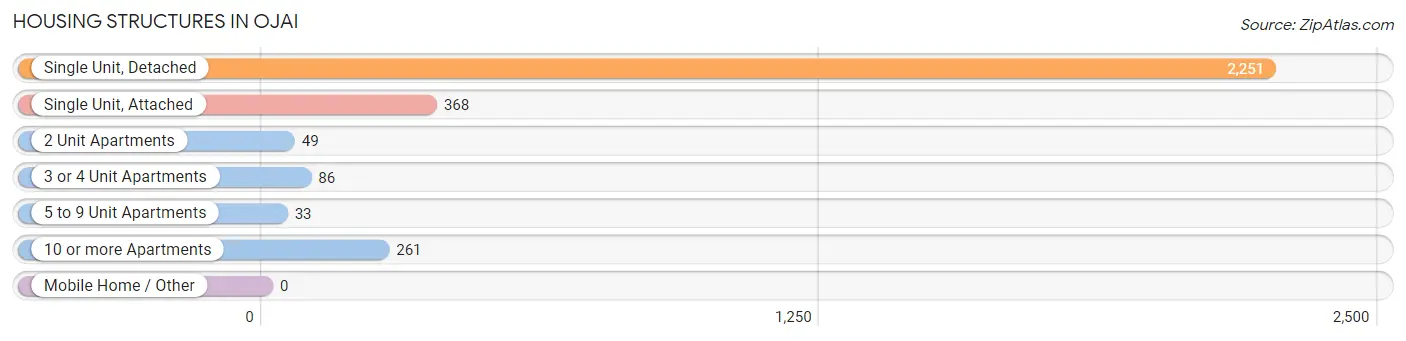
| Structure Type | # Housing Units | % Housing Units |
| Single Unit, Detached | 2,251 | 73.9% |
| Single Unit, Attached | 368 | 12.1% |
| 2 Unit Apartments | 49 | 1.6% |
| 3 or 4 Unit Apartments | 86 | 2.8% |
| 5 to 9 Unit Apartments | 33 | 1.1% |
| 10 or more Apartments | 261 | 8.6% |
| Mobile Home / Other | 0 | 0.0% |
| Total | 3,048 | 100.0% |
Housing Structures by Occupancy in Ojai
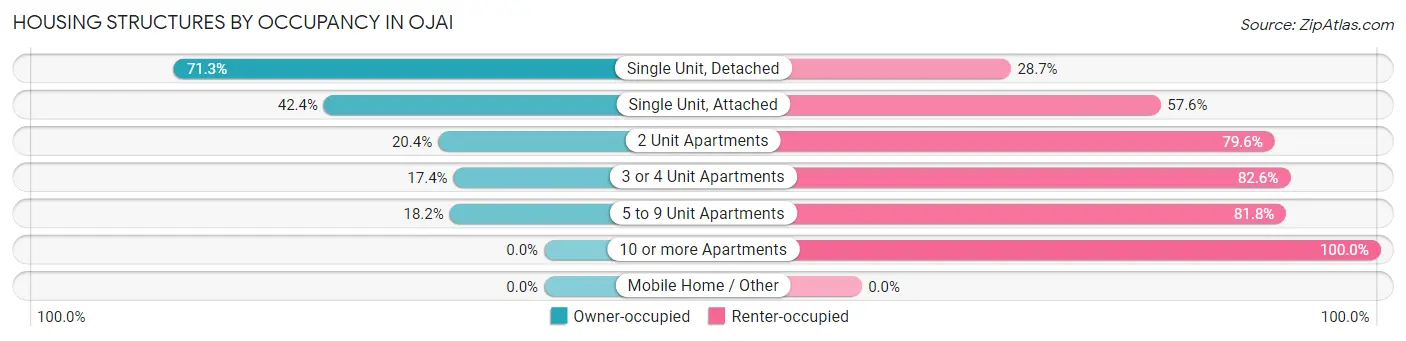
| Structure Type | Owner-occupied | Renter-occupied |
| Single Unit, Detached | 1,604 (71.3%) | 647 (28.7%) |
| Single Unit, Attached | 156 (42.4%) | 212 (57.6%) |
| 2 Unit Apartments | 10 (20.4%) | 39 (79.6%) |
| 3 or 4 Unit Apartments | 15 (17.4%) | 71 (82.6%) |
| 5 to 9 Unit Apartments | 6 (18.2%) | 27 (81.8%) |
| 10 or more Apartments | 0 (0.0%) | 261 (100.0%) |
| Mobile Home / Other | 0 (0.0%) | 0 (0.0%) |
| Total | 1,791 (58.8%) | 1,257 (41.2%) |
Housing Structures by Number of Rooms in Ojai
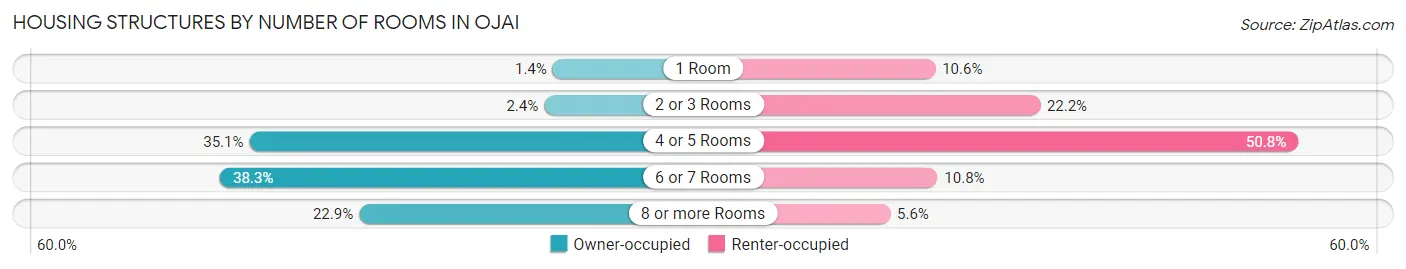
| Number of Rooms | Owner-occupied | Renter-occupied |
| 1 Room | 25 (1.4%) | 133 (10.6%) |
| 2 or 3 Rooms | 42 (2.4%) | 279 (22.2%) |
| 4 or 5 Rooms | 628 (35.1%) | 639 (50.8%) |
| 6 or 7 Rooms | 686 (38.3%) | 136 (10.8%) |
| 8 or more Rooms | 410 (22.9%) | 70 (5.6%) |
| Total | 1,791 (100.0%) | 1,257 (100.0%) |
Housing Structure by Heating Type in Ojai
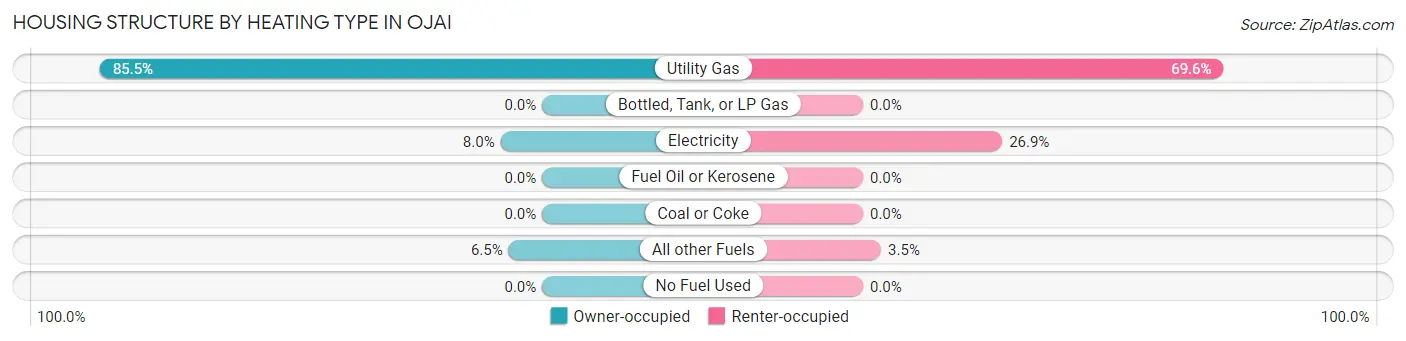
| Heating Type | Owner-occupied | Renter-occupied |
| Utility Gas | 1,531 (85.5%) | 875 (69.6%) |
| Bottled, Tank, or LP Gas | 0 (0.0%) | 0 (0.0%) |
| Electricity | 144 (8.0%) | 338 (26.9%) |
| Fuel Oil or Kerosene | 0 (0.0%) | 0 (0.0%) |
| Coal or Coke | 0 (0.0%) | 0 (0.0%) |
| All other Fuels | 116 (6.5%) | 44 (3.5%) |
| No Fuel Used | 0 (0.0%) | 0 (0.0%) |
| Total | 1,791 (100.0%) | 1,257 (100.0%) |
Household Vehicle Usage in Ojai
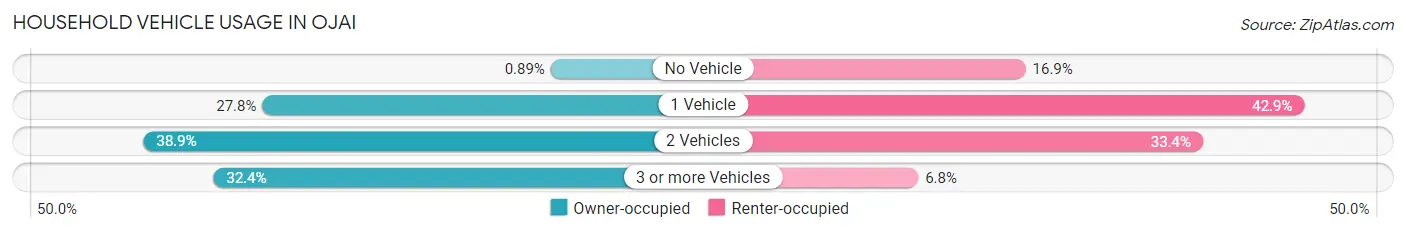
| Vehicles per Household | Owner-occupied | Renter-occupied |
| No Vehicle | 16 (0.9%) | 212 (16.9%) |
| 1 Vehicle | 498 (27.8%) | 539 (42.9%) |
| 2 Vehicles | 697 (38.9%) | 420 (33.4%) |
| 3 or more Vehicles | 580 (32.4%) | 86 (6.8%) |
| Total | 1,791 (100.0%) | 1,257 (100.0%) |
Real Estate & Mortgages in Ojai
Real Estate and Mortgage Overview in Ojai
| Characteristic | Without Mortgage | With Mortgage |
| Housing Units | 633 | 1,158 |
| Median Property Value | $811,000 | $925,700 |
| Median Household Income | $80,391 | $523 |
| Monthly Housing Costs | $738 | $699 |
| Real Estate Taxes | $5,721 | $0 |
Property Value by Mortgage Status in Ojai
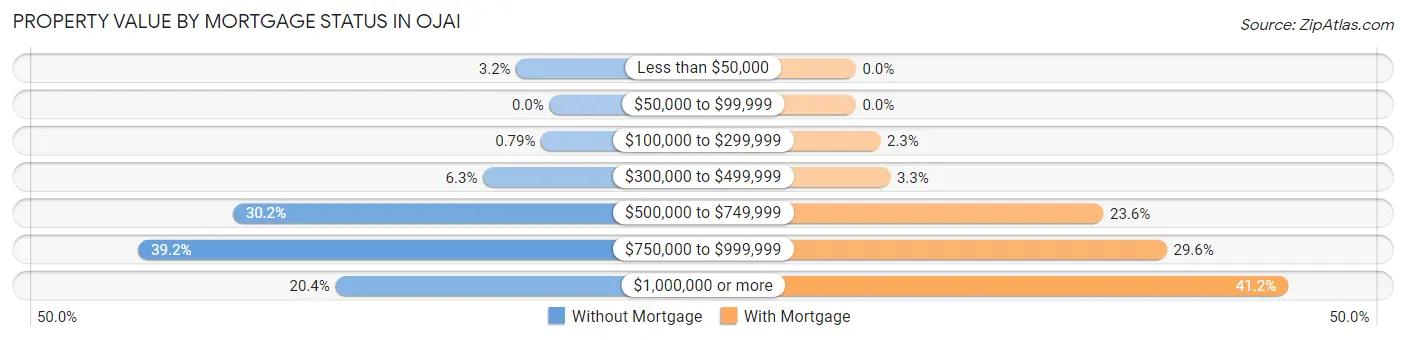
| Property Value | Without Mortgage | With Mortgage |
| Less than $50,000 | 20 (3.2%) | 0 (0.0%) |
| $50,000 to $99,999 | 0 (0.0%) | 0 (0.0%) |
| $100,000 to $299,999 | 5 (0.8%) | 27 (2.3%) |
| $300,000 to $499,999 | 40 (6.3%) | 38 (3.3%) |
| $500,000 to $749,999 | 191 (30.2%) | 273 (23.6%) |
| $750,000 to $999,999 | 248 (39.2%) | 343 (29.6%) |
| $1,000,000 or more | 129 (20.4%) | 477 (41.2%) |
| Total | 633 (100.0%) | 1,158 (100.0%) |
Household Income by Mortgage Status in Ojai
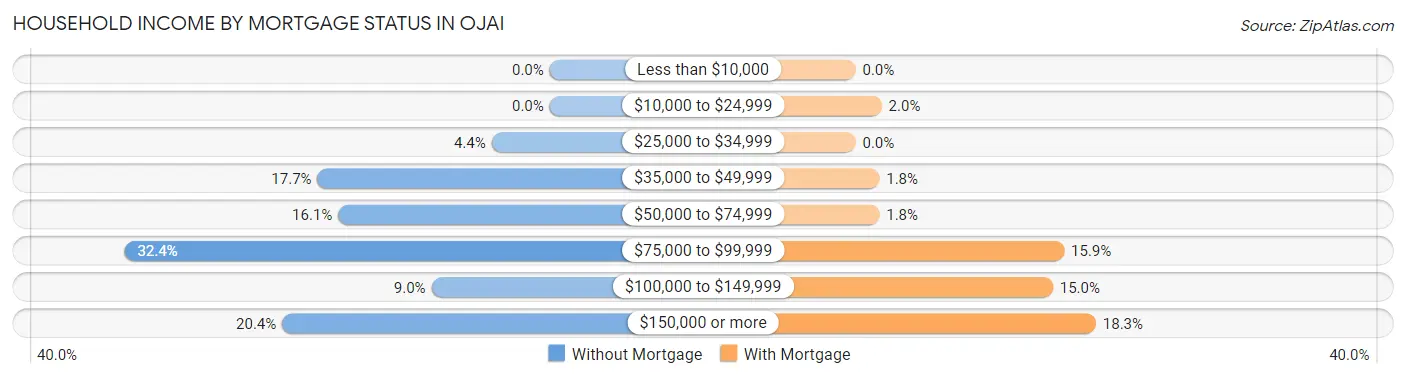
| Household Income | Without Mortgage | With Mortgage |
| Less than $10,000 | 0 (0.0%) | 0 (0.0%) |
| $10,000 to $24,999 | 0 (0.0%) | 23 (2.0%) |
| $25,000 to $34,999 | 28 (4.4%) | 0 (0.0%) |
| $35,000 to $49,999 | 112 (17.7%) | 21 (1.8%) |
| $50,000 to $74,999 | 102 (16.1%) | 21 (1.8%) |
| $75,000 to $99,999 | 205 (32.4%) | 184 (15.9%) |
| $100,000 to $149,999 | 57 (9.0%) | 174 (15.0%) |
| $150,000 or more | 129 (20.4%) | 212 (18.3%) |
| Total | 633 (100.0%) | 1,158 (100.0%) |
Property Value to Household Income Ratio in Ojai
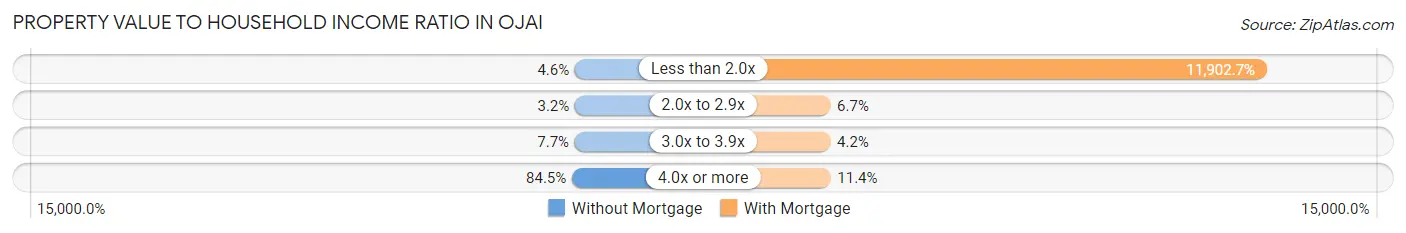
| Value-to-Income Ratio | Without Mortgage | With Mortgage |
| Less than 2.0x | 29 (4.6%) | 137,833 (11,902.7%) |
| 2.0x to 2.9x | 20 (3.2%) | 78 (6.7%) |
| 3.0x to 3.9x | 49 (7.7%) | 48 (4.2%) |
| 4.0x or more | 535 (84.5%) | 132 (11.4%) |
| Total | 633 (100.0%) | 1,158 (100.0%) |
Real Estate Taxes by Mortgage Status in Ojai
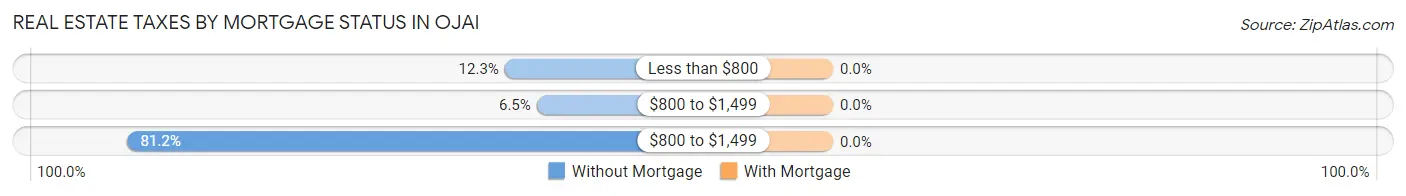
| Property Taxes | Without Mortgage | With Mortgage |
| Less than $800 | 78 (12.3%) | 0 (0.0%) |
| $800 to $1,499 | 41 (6.5%) | 0 (0.0%) |
| $800 to $1,499 | 514 (81.2%) | 0 (0.0%) |
| Total | 633 (100.0%) | 1,158 (100.0%) |
Health & Disability in Ojai
Health Insurance Coverage by Age in Ojai
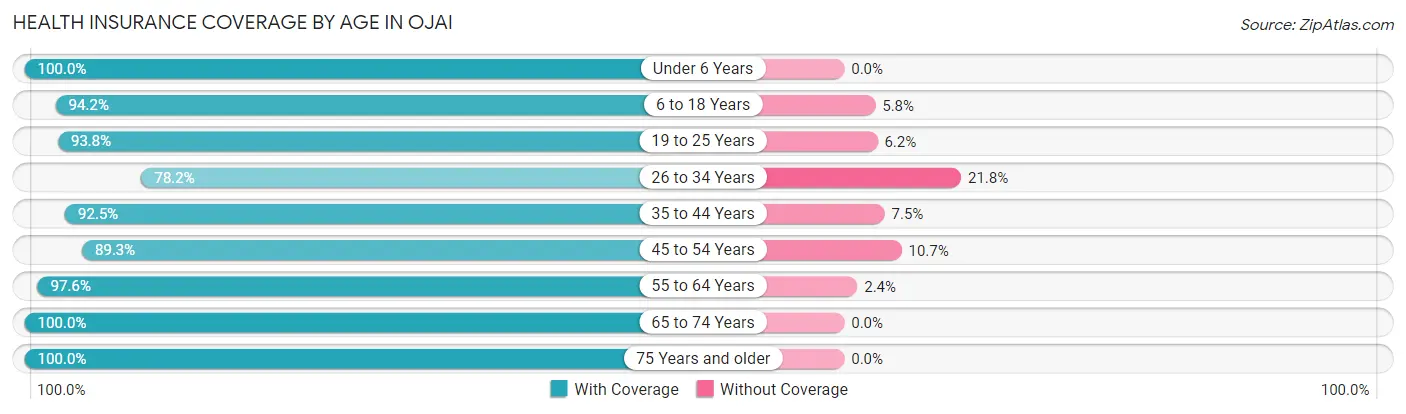
| Age Bracket | With Coverage | Without Coverage |
| Under 6 Years | 223 (100.0%) | 0 (0.0%) |
| 6 to 18 Years | 1,255 (94.2%) | 77 (5.8%) |
| 19 to 25 Years | 273 (93.8%) | 18 (6.2%) |
| 26 to 34 Years | 442 (78.2%) | 123 (21.8%) |
| 35 to 44 Years | 848 (92.5%) | 69 (7.5%) |
| 45 to 54 Years | 811 (89.3%) | 97 (10.7%) |
| 55 to 64 Years | 969 (97.6%) | 24 (2.4%) |
| 65 to 74 Years | 1,175 (100.0%) | 0 (0.0%) |
| 75 Years and older | 1,056 (100.0%) | 0 (0.0%) |
| Total | 7,052 (94.5%) | 408 (5.5%) |
Health Insurance Coverage by Citizenship Status in Ojai
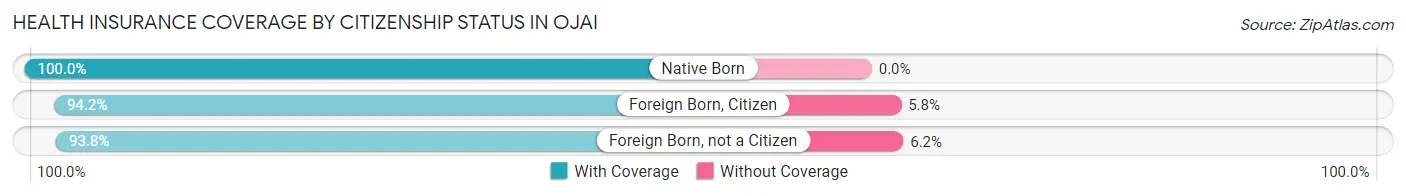
| Citizenship Status | With Coverage | Without Coverage |
| Native Born | 223 (100.0%) | 0 (0.0%) |
| Foreign Born, Citizen | 1,255 (94.2%) | 77 (5.8%) |
| Foreign Born, not a Citizen | 273 (93.8%) | 18 (6.2%) |
Health Insurance Coverage by Household Income in Ojai
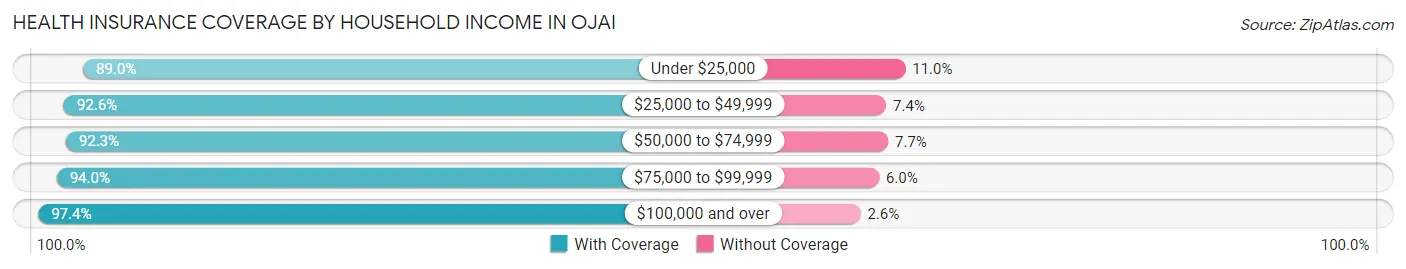
| Household Income | With Coverage | Without Coverage |
| Under $25,000 | 333 (89.0%) | 41 (11.0%) |
| $25,000 to $49,999 | 1,182 (92.6%) | 94 (7.4%) |
| $50,000 to $74,999 | 1,013 (92.3%) | 85 (7.7%) |
| $75,000 to $99,999 | 1,309 (94.0%) | 84 (6.0%) |
| $100,000 and over | 3,124 (97.4%) | 82 (2.6%) |
Public vs Private Health Insurance Coverage by Age in Ojai
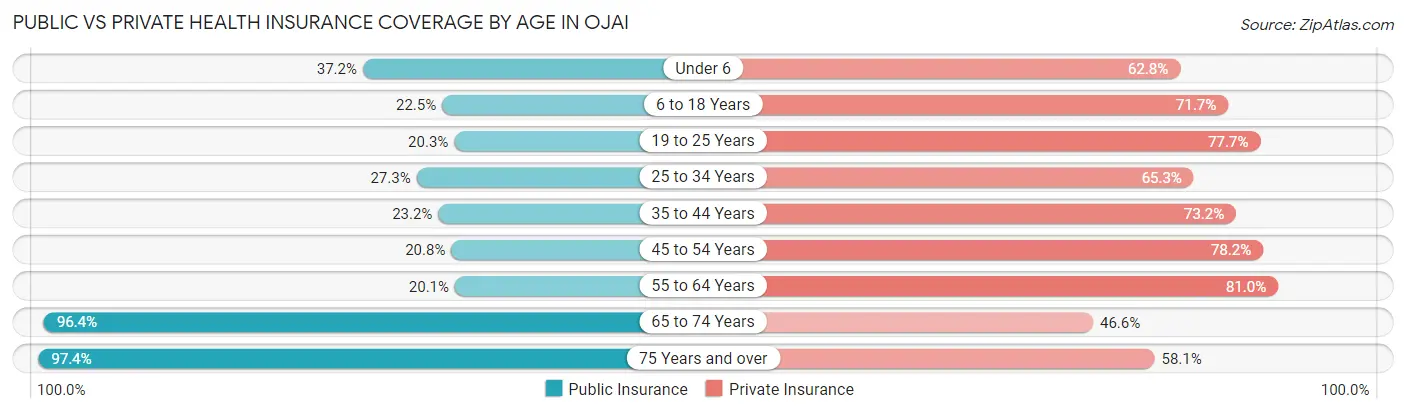
| Age Bracket | Public Insurance | Private Insurance |
| Under 6 | 83 (37.2%) | 140 (62.8%) |
| 6 to 18 Years | 300 (22.5%) | 955 (71.7%) |
| 19 to 25 Years | 59 (20.3%) | 226 (77.7%) |
| 25 to 34 Years | 154 (27.3%) | 369 (65.3%) |
| 35 to 44 Years | 213 (23.2%) | 671 (73.2%) |
| 45 to 54 Years | 189 (20.8%) | 710 (78.2%) |
| 55 to 64 Years | 200 (20.1%) | 804 (81.0%) |
| 65 to 74 Years | 1,133 (96.4%) | 548 (46.6%) |
| 75 Years and over | 1,029 (97.4%) | 613 (58.1%) |
| Total | 3,360 (45.0%) | 5,036 (67.5%) |
Disability Status by Sex by Age in Ojai
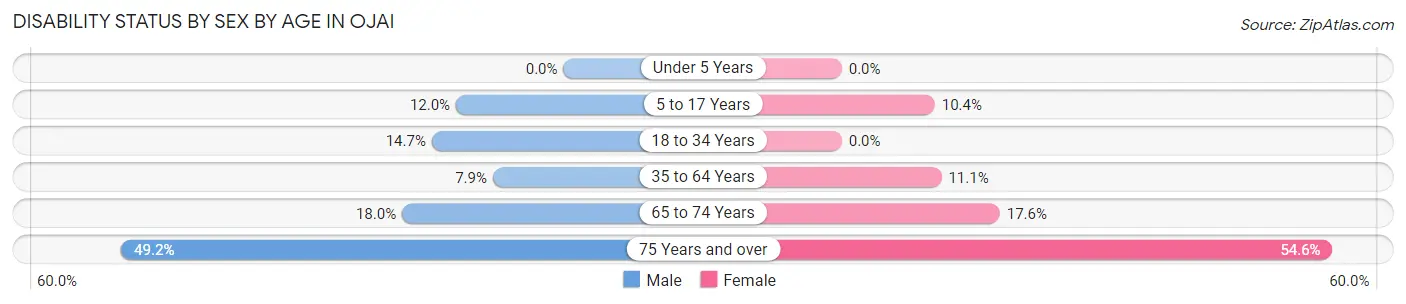
| Age Bracket | Male | Female |
| Under 5 Years | 0 (0.0%) | 0 (0.0%) |
| 5 to 17 Years | 72 (12.0%) | 69 (10.4%) |
| 18 to 34 Years | 73 (14.7%) | 0 (0.0%) |
| 35 to 64 Years | 92 (7.9%) | 183 (11.1%) |
| 65 to 74 Years | 108 (18.0%) | 101 (17.6%) |
| 75 Years and over | 228 (49.2%) | 324 (54.6%) |
Disability Class by Sex by Age in Ojai
Disability Class: Hearing Difficulty
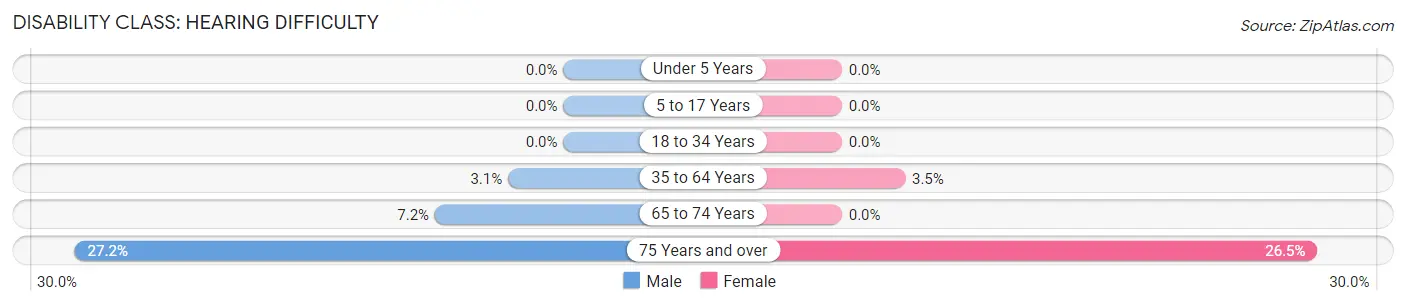
| Age Bracket | Male | Female |
| Under 5 Years | 0 (0.0%) | 0 (0.0%) |
| 5 to 17 Years | 0 (0.0%) | 0 (0.0%) |
| 18 to 34 Years | 0 (0.0%) | 0 (0.0%) |
| 35 to 64 Years | 36 (3.1%) | 58 (3.5%) |
| 65 to 74 Years | 43 (7.1%) | 0 (0.0%) |
| 75 Years and over | 126 (27.2%) | 157 (26.5%) |
Disability Class: Vision Difficulty
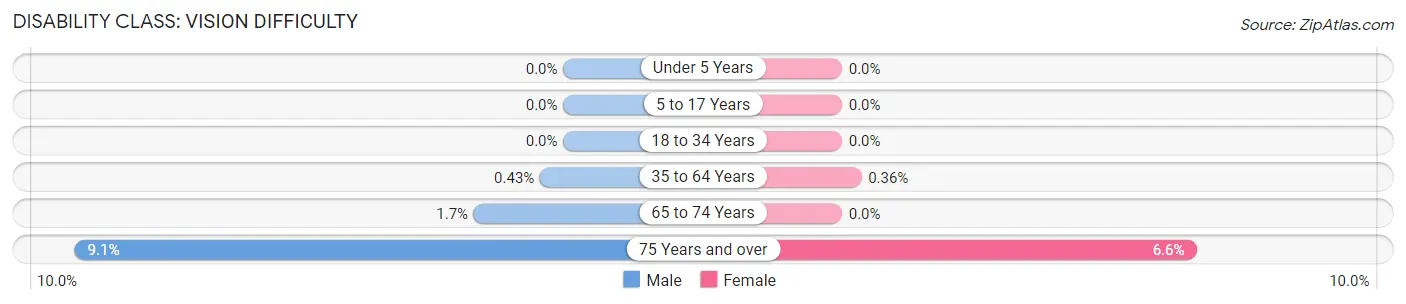
| Age Bracket | Male | Female |
| Under 5 Years | 0 (0.0%) | 0 (0.0%) |
| 5 to 17 Years | 0 (0.0%) | 0 (0.0%) |
| 18 to 34 Years | 0 (0.0%) | 0 (0.0%) |
| 35 to 64 Years | 5 (0.4%) | 6 (0.4%) |
| 65 to 74 Years | 10 (1.7%) | 0 (0.0%) |
| 75 Years and over | 42 (9.1%) | 39 (6.6%) |
Disability Class: Cognitive Difficulty
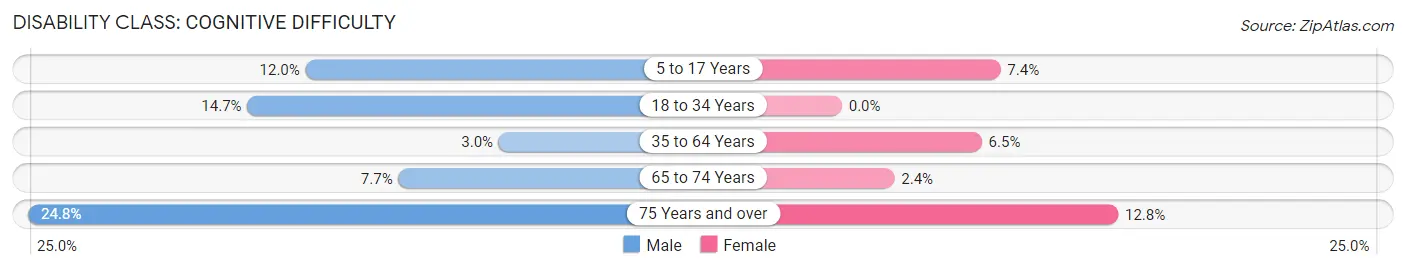
| Age Bracket | Male | Female |
| 5 to 17 Years | 72 (12.0%) | 49 (7.4%) |
| 18 to 34 Years | 73 (14.7%) | 0 (0.0%) |
| 35 to 64 Years | 35 (3.0%) | 107 (6.5%) |
| 65 to 74 Years | 46 (7.6%) | 14 (2.4%) |
| 75 Years and over | 115 (24.8%) | 76 (12.8%) |
Disability Class: Ambulatory Difficulty
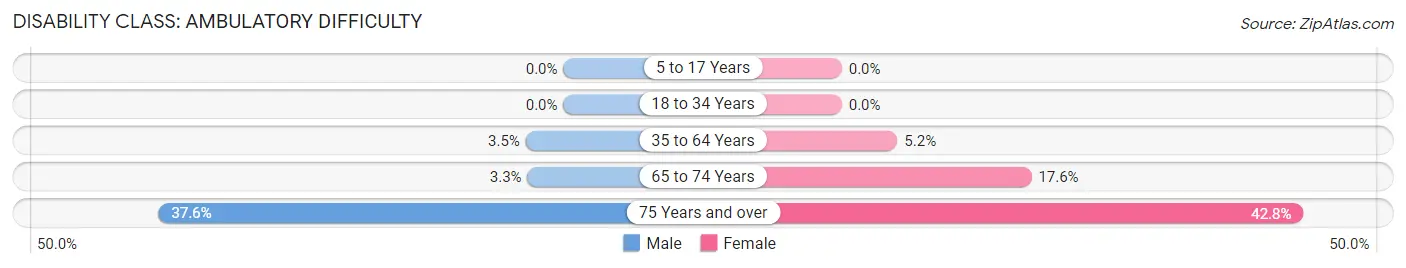
| Age Bracket | Male | Female |
| 5 to 17 Years | 0 (0.0%) | 0 (0.0%) |
| 18 to 34 Years | 0 (0.0%) | 0 (0.0%) |
| 35 to 64 Years | 41 (3.5%) | 85 (5.2%) |
| 65 to 74 Years | 20 (3.3%) | 101 (17.6%) |
| 75 Years and over | 174 (37.6%) | 254 (42.8%) |
Disability Class: Self-Care Difficulty
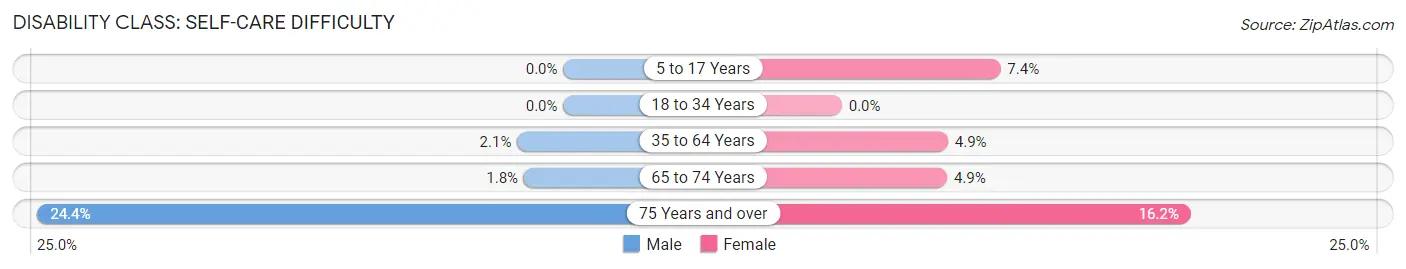
| Age Bracket | Male | Female |
| 5 to 17 Years | 0 (0.0%) | 49 (7.4%) |
| 18 to 34 Years | 0 (0.0%) | 0 (0.0%) |
| 35 to 64 Years | 25 (2.1%) | 81 (4.9%) |
| 65 to 74 Years | 11 (1.8%) | 28 (4.9%) |
| 75 Years and over | 113 (24.4%) | 96 (16.2%) |
Technology Access in Ojai
Computing Device Access in Ojai
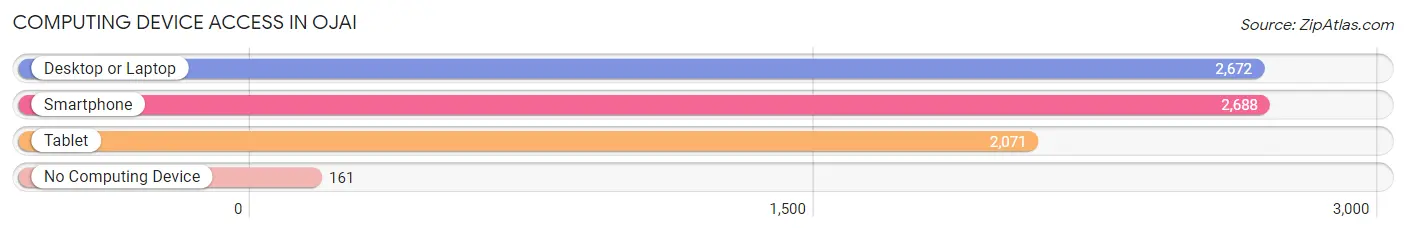
| Device Type | # Households | % Households |
| Desktop or Laptop | 2,672 | 87.7% |
| Smartphone | 2,688 | 88.2% |
| Tablet | 2,071 | 67.9% |
| No Computing Device | 161 | 5.3% |
| Total | 3,048 | 100.0% |
Internet Access in Ojai
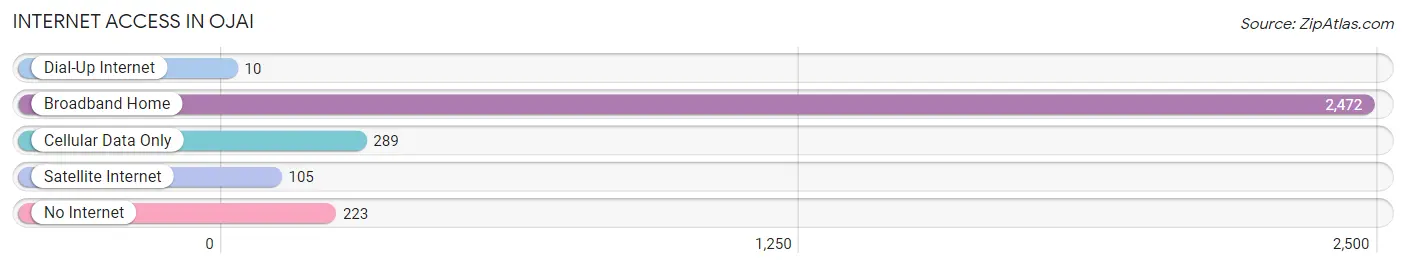
| Internet Type | # Households | % Households |
| Dial-Up Internet | 10 | 0.3% |
| Broadband Home | 2,472 | 81.1% |
| Cellular Data Only | 289 | 9.5% |
| Satellite Internet | 105 | 3.4% |
| No Internet | 223 | 7.3% |
| Total | 3,048 | 100.0% |
Ojai Summary
Ojai, California is a small city located in Ventura County, approximately 97 miles northwest of Los Angeles. It is situated in the Ojai Valley, surrounded by the Topatopa Mountains. The city has a population of approximately 8,000 people and covers an area of 8.4 square miles.
History
The Chumash people were the first inhabitants of the Ojai Valley, living in the area for thousands of years before the arrival of Europeans. The name “Ojai” is derived from the Chumash word “Awhay,” which means “nest.” The first Europeans to settle in the area were Spanish missionaries, who established the Mission San Buenaventura in 1782. The mission was the first permanent European settlement in the area.
In 1837, the Mexican government granted the land to Don Antonio del Valle, who established a large ranch in the valley. The ranch was later divided into smaller parcels and sold to settlers. The city of Ojai was officially incorporated in 1910.
Geography
Ojai is located in the Ojai Valley, which is surrounded by the Topatopa Mountains. The valley is approximately 10 miles long and 3 miles wide. The city is situated at an elevation of 805 feet above sea level. The climate is mild, with temperatures rarely exceeding 90 degrees Fahrenheit in the summer and rarely dropping below 40 degrees Fahrenheit in the winter.
The city is divided into several neighborhoods, including Downtown Ojai, East End, and Libbey Park. The downtown area is the commercial center of the city, with a variety of shops, restaurants, and other businesses. East End is a residential neighborhood, while Libbey Park is a popular recreational area.
Economy
The economy of Ojai is largely based on tourism. The city is a popular destination for outdoor activities, such as hiking, biking, and camping. The Ojai Valley Inn & Spa is a popular resort in the area, offering a variety of amenities and activities. The city also has a thriving arts and culture scene, with several galleries, museums, and theaters.
The city is also home to several businesses, including a variety of retail stores, restaurants, and professional services. The largest employers in the city are the Ojai Valley Community Hospital, the Ojai Unified School District, and the Ojai Valley News.
Demographics
As of the 2010 census, the population of Ojai was 8,006. The racial makeup of the city was 79.2% White, 0.7% African American, 0.9% Native American, 1.3% Asian, 0.1% Pacific Islander, 14.2% from other races, and 3.6% from two or more races. Hispanic or Latino of any race were 24.3% of the population.
The median household income in Ojai was $60,945, and the median family income was $71,917. The per capita income was $31,945. About 11.2% of the population was below the poverty line.
Ojai is a small city with a rich history and a vibrant culture. The city is a popular destination for outdoor activities and is home to a variety of businesses and attractions. The economy is largely based on tourism, and the city has a diverse population.
Common Questions
What is Per Capita Income in Ojai?
Per Capita income in Ojai is $53,663.
What is the Median Family Income in Ojai?
Median Family Income in Ojai is $98,221.
What is the Median Household income in Ojai?
Median Household Income in Ojai is $76,569.
What is Income or Wage Gap in Ojai?
Income or Wage Gap in Ojai is 43.3%.
Women in Ojai earn 56.7 cents for every dollar earned by a man.
What is Family Income Deficit in Ojai?
Family Income Deficit in Ojai is $14,451.
Families that are below poverty line in Ojai earn $14,451 less on average than the poverty threshold level.
What is Inequality or Gini Index in Ojai?
Inequality or Gini Index in Ojai is 0.53.
What is the Total Population of Ojai?
Total Population of Ojai is 7,610.
What is the Total Male Population of Ojai?
Total Male Population of Ojai is 3,526.
What is the Total Female Population of Ojai?
Total Female Population of Ojai is 4,084.
What is the Ratio of Males per 100 Females in Ojai?
There are 86.34 Males per 100 Females in Ojai.
What is the Ratio of Females per 100 Males in Ojai?
There are 115.83 Females per 100 Males in Ojai.
What is the Median Population Age in Ojai?
Median Population Age in Ojai is 50.4 Years.
What is the Average Family Size in Ojai
Average Family Size in Ojai is 3.0 People.
What is the Average Household Size in Ojai
Average Household Size in Ojai is 2.4 People.
How Large is the Labor Force in Ojai?
There are 3,406 People in the Labor Forcein in Ojai.
What is the Percentage of People in the Labor Force in Ojai?
53.3% of People are in the Labor Force in Ojai.
What is the Unemployment Rate in Ojai?
Unemployment Rate in Ojai is 6.5%.