Brighton, NY Map & Demographics
Brighton Map
Brighton Overview
$56,430
PER CAPITA INCOME
$126,042
AVG FAMILY INCOME
$78,570
AVG HOUSEHOLD INCOME
25.4%
WAGE / INCOME GAP [ % ]
74.6¢/ $1
WAGE / INCOME GAP [ $ ]
0.52
INEQUALITY / GINI INDEX
36,819
TOTAL POPULATION
17,775
MALE POPULATION
19,044
FEMALE POPULATION
93.34
MALES / 100 FEMALES
107.14
FEMALES / 100 MALES
39.1
MEDIAN AGE
2.9
AVG FAMILY SIZE
2.2
AVG HOUSEHOLD SIZE
19,708
LABOR FORCE [ PEOPLE ]
64.0%
PERCENT IN LABOR FORCE
4.4%
UNEMPLOYMENT RATE
Brighton Area Codes
Income in Brighton
Income Overview in Brighton
Per Capita Income in Brighton is $56,430, while median incomes of families and households are $126,042 and $78,570 respectively.
| Characteristic | Number | Measure |
| Per Capita Income | 36,819 | $56,430 |
| Median Family Income | 8,503 | $126,042 |
| Mean Family Income | 8,503 | $180,049 |
| Median Household Income | 15,929 | $78,570 |
| Mean Household Income | 15,929 | $126,971 |
| Income Deficit | 8,503 | $0 |
| Wage / Income Gap (%) | 36,819 | 25.41% |
| Wage / Income Gap ($) | 36,819 | 74.59¢ per $1 |
| Gini / Inequality Index | 36,819 | 0.52 |
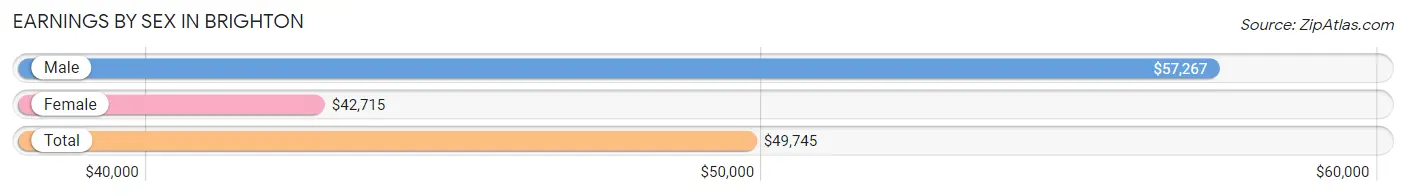
Earnings by Sex in Brighton
Average Earnings in Brighton are $49,745, $57,267 for men and $42,715 for women, a difference of 25.4%.
| Sex | Number | Average Earnings |
| Male | 10,928 (51.9%) | $57,267 |
| Female | 10,111 (48.1%) | $42,715 |
| Total | 21,039 (100.0%) | $49,745 |
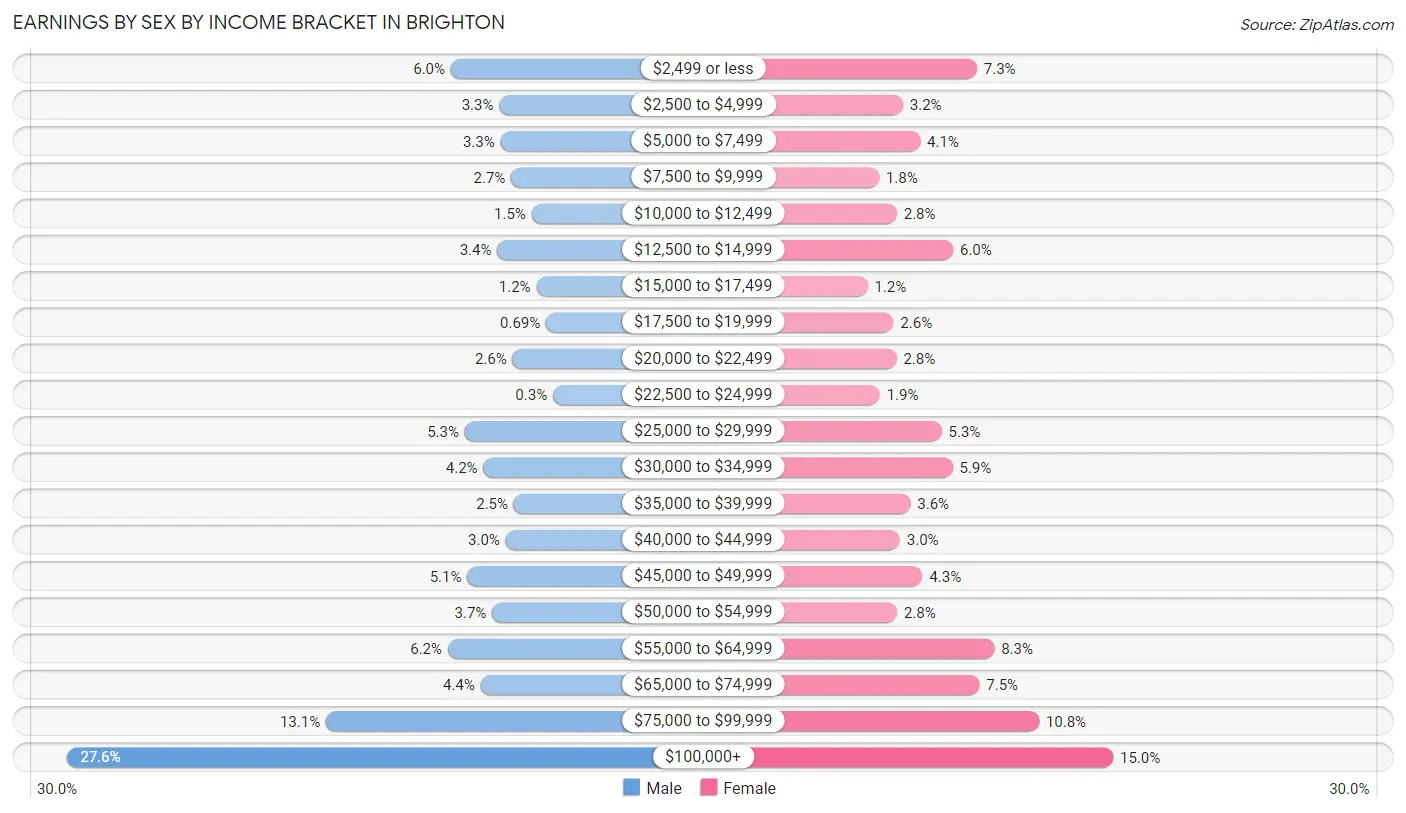
Earnings by Sex by Income Bracket in Brighton
The most common earnings brackets in Brighton are $100,000+ for men (3,016 | 27.6%) and $100,000+ for women (1,514 | 15.0%).
| Income | Male | Female |
| $2,499 or less | 660 (6.0%) | 739 (7.3%) |
| $2,500 to $4,999 | 363 (3.3%) | 319 (3.2%) |
| $5,000 to $7,499 | 355 (3.3%) | 417 (4.1%) |
| $7,500 to $9,999 | 290 (2.6%) | 183 (1.8%) |
| $10,000 to $12,499 | 164 (1.5%) | 284 (2.8%) |
| $12,500 to $14,999 | 375 (3.4%) | 604 (6.0%) |
| $15,000 to $17,499 | 134 (1.2%) | 117 (1.2%) |
| $17,500 to $19,999 | 75 (0.7%) | 265 (2.6%) |
| $20,000 to $22,499 | 281 (2.6%) | 282 (2.8%) |
| $22,500 to $24,999 | 33 (0.3%) | 187 (1.8%) |
| $25,000 to $29,999 | 575 (5.3%) | 539 (5.3%) |
| $30,000 to $34,999 | 460 (4.2%) | 601 (5.9%) |
| $35,000 to $39,999 | 273 (2.5%) | 361 (3.6%) |
| $40,000 to $44,999 | 324 (3.0%) | 301 (3.0%) |
| $45,000 to $49,999 | 560 (5.1%) | 430 (4.3%) |
| $50,000 to $54,999 | 406 (3.7%) | 285 (2.8%) |
| $55,000 to $64,999 | 679 (6.2%) | 838 (8.3%) |
| $65,000 to $74,999 | 478 (4.4%) | 753 (7.4%) |
| $75,000 to $99,999 | 1,427 (13.1%) | 1,092 (10.8%) |
| $100,000+ | 3,016 (27.6%) | 1,514 (15.0%) |
| Total | 10,928 (100.0%) | 10,111 (100.0%) |
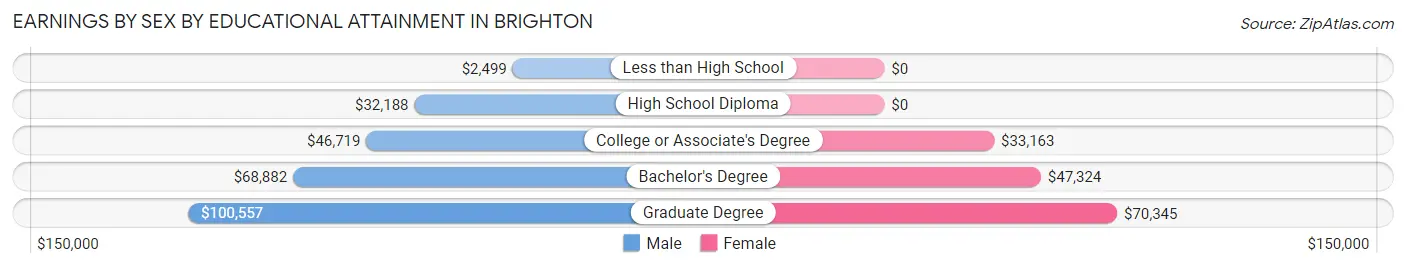
Earnings by Sex by Educational Attainment in Brighton
Average earnings in Brighton are $73,545 for men and $54,915 for women, a difference of 25.3%. Men with an educational attainment of graduate degree enjoy the highest average annual earnings of $100,557, while those with less than high school education earn the least with $2,499. Women with an educational attainment of graduate degree earn the most with the average annual earnings of $70,345, while those with college or associate's degree education have the smallest earnings of $33,163.
| Educational Attainment | Male Income | Female Income |
| Less than High School | $2,499 | $0 |
| High School Diploma | $32,188 | $0 |
| College or Associate's Degree | $46,719 | $33,163 |
| Bachelor's Degree | $68,882 | $47,324 |
| Graduate Degree | $100,557 | $70,345 |
| Total | $73,545 | $54,915 |
Family Income in Brighton
Family Income Brackets in Brighton
According to the Brighton family income data, there are 2,355 families falling into the $200,000+ income range, which is the most common income bracket and makes up 27.7% of all families. Conversely, the less than $10,000 income bracket is the least frequent group with only 34 families (0.4%) belonging to this category.
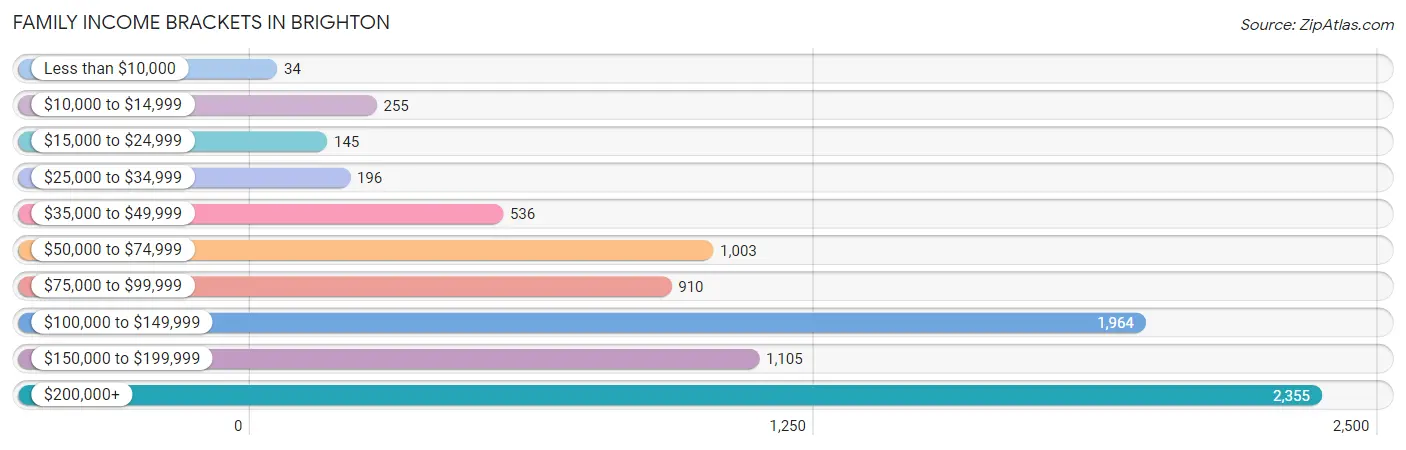
| Income Bracket | # Families | % Families |
| Less than $10,000 | 34 | 0.4% |
| $10,000 to $14,999 | 255 | 3.0% |
| $15,000 to $24,999 | 145 | 1.7% |
| $25,000 to $34,999 | 196 | 2.3% |
| $35,000 to $49,999 | 536 | 6.3% |
| $50,000 to $74,999 | 1,003 | 11.8% |
| $75,000 to $99,999 | 910 | 10.7% |
| $100,000 to $149,999 | 1,964 | 23.1% |
| $150,000 to $199,999 | 1,105 | 13.0% |
| $200,000+ | 2,355 | 27.7% |
Family Income by Famaliy Size in Brighton
6-person families (76 | 0.9%) account for the highest median family income in Brighton with $202,833 per family, while 2-person families (4,451 | 52.3%) have the highest median income of $58,031 per family member.
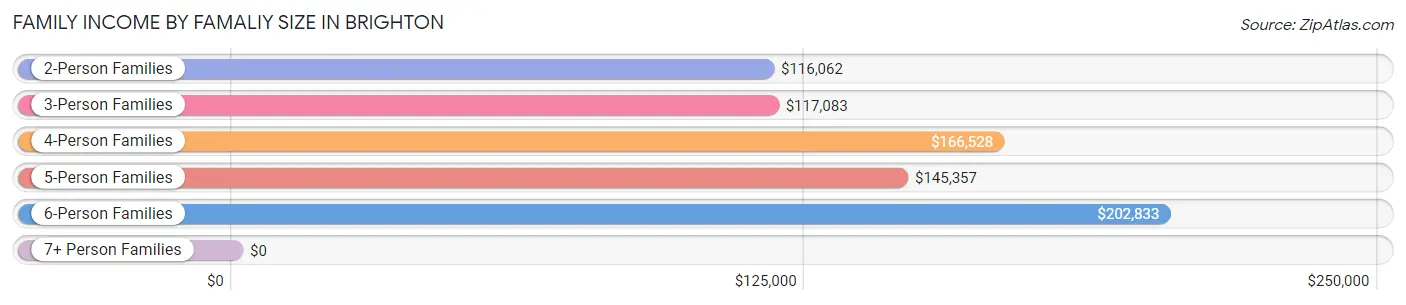
| Income Bracket | # Families | Median Income |
| 2-Person Families | 4,451 (52.3%) | $116,062 |
| 3-Person Families | 1,694 (19.9%) | $117,083 |
| 4-Person Families | 1,627 (19.1%) | $166,528 |
| 5-Person Families | 638 (7.5%) | $145,357 |
| 6-Person Families | 76 (0.9%) | $202,833 |
| 7+ Person Families | 17 (0.2%) | $0 |
| Total | 8,503 (100.0%) | $126,042 |
Family Income by Number of Earners in Brighton
The median family income in Brighton is $126,042, with families comprising 3+ earners (730) having the highest median family income of $202,981, while families with no earners (1,182) have the lowest median family income of $59,348, accounting for 8.6% and 13.9% of families, respectively.
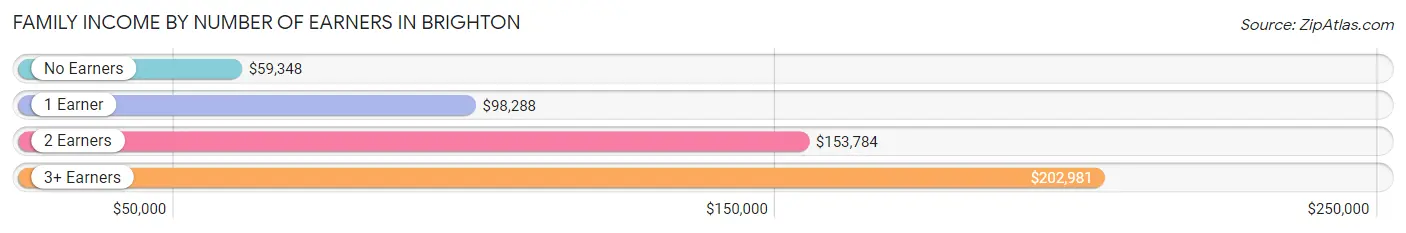
| Number of Earners | # Families | Median Income |
| No Earners | 1,182 (13.9%) | $59,348 |
| 1 Earner | 2,463 (29.0%) | $98,288 |
| 2 Earners | 4,128 (48.5%) | $153,784 |
| 3+ Earners | 730 (8.6%) | $202,981 |
| Total | 8,503 (100.0%) | $126,042 |
Household Income in Brighton
Household Income Brackets in Brighton
With 2,676 households falling in the category, the $200,000+ income range is the most frequent in Brighton, accounting for 16.8% of all households. In contrast, only 605 households (3.8%) fall into the $10,000 to $14,999 income bracket, making it the least populous group.
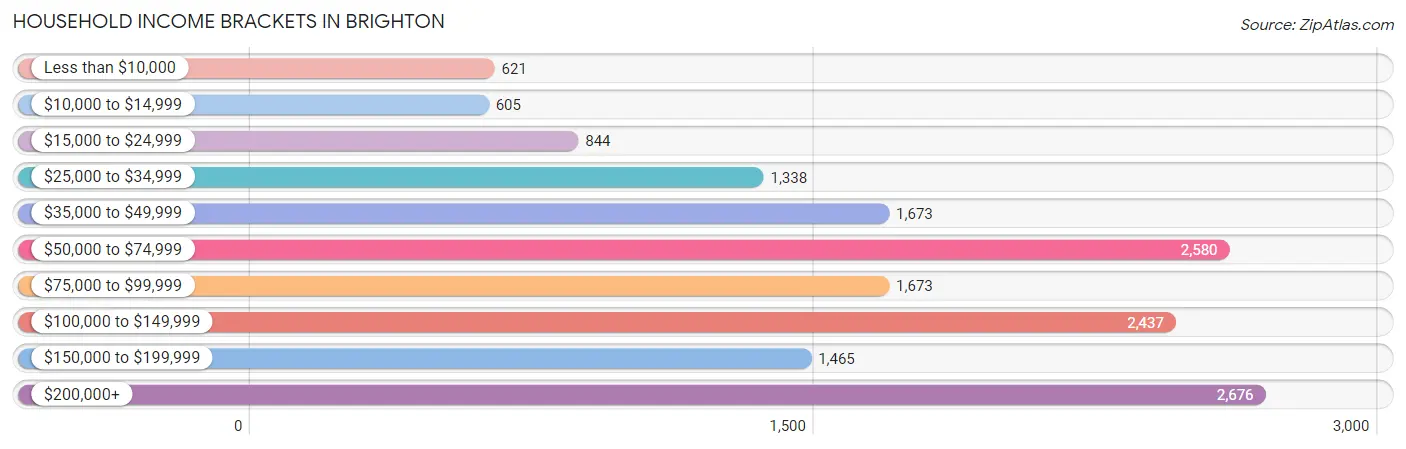
| Income Bracket | # Households | % Households |
| Less than $10,000 | 621 | 3.9% |
| $10,000 to $14,999 | 605 | 3.8% |
| $15,000 to $24,999 | 844 | 5.3% |
| $25,000 to $34,999 | 1,338 | 8.4% |
| $35,000 to $49,999 | 1,673 | 10.5% |
| $50,000 to $74,999 | 2,580 | 16.2% |
| $75,000 to $99,999 | 1,673 | 10.5% |
| $100,000 to $149,999 | 2,437 | 15.3% |
| $150,000 to $199,999 | 1,465 | 9.2% |
| $200,000+ | 2,676 | 16.8% |
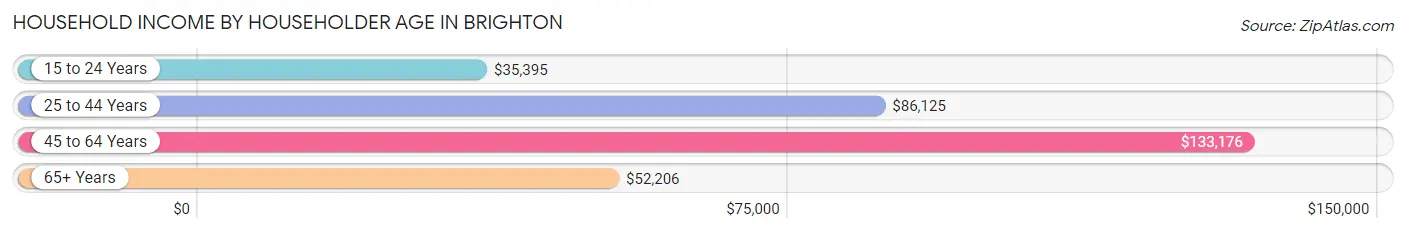
Household Income by Householder Age in Brighton
The median household income in Brighton is $78,570, with the highest median household income of $133,176 found in the 45 to 64 years age bracket for the primary householder. A total of 4,884 households (30.7%) fall into this category. Meanwhile, the 15 to 24 years age bracket for the primary householder has the lowest median household income of $35,395, with 982 households (6.2%) in this group.
| Income Bracket | # Households | Median Income |
| 15 to 24 Years | 982 (6.2%) | $35,395 |
| 25 to 44 Years | 5,157 (32.4%) | $86,125 |
| 45 to 64 Years | 4,884 (30.7%) | $133,176 |
| 65+ Years | 4,906 (30.8%) | $52,206 |
| Total | 15,929 (100.0%) | $78,570 |
Poverty in Brighton
Income Below Poverty by Sex and Age in Brighton
With 8.2% poverty level for males and 9.9% for females among the residents of Brighton, 18 to 24 year old males and 18 to 24 year old females are the most vulnerable to poverty, with 359 males (23.0%) and 370 females (26.0%) in their respective age groups living below the poverty level.
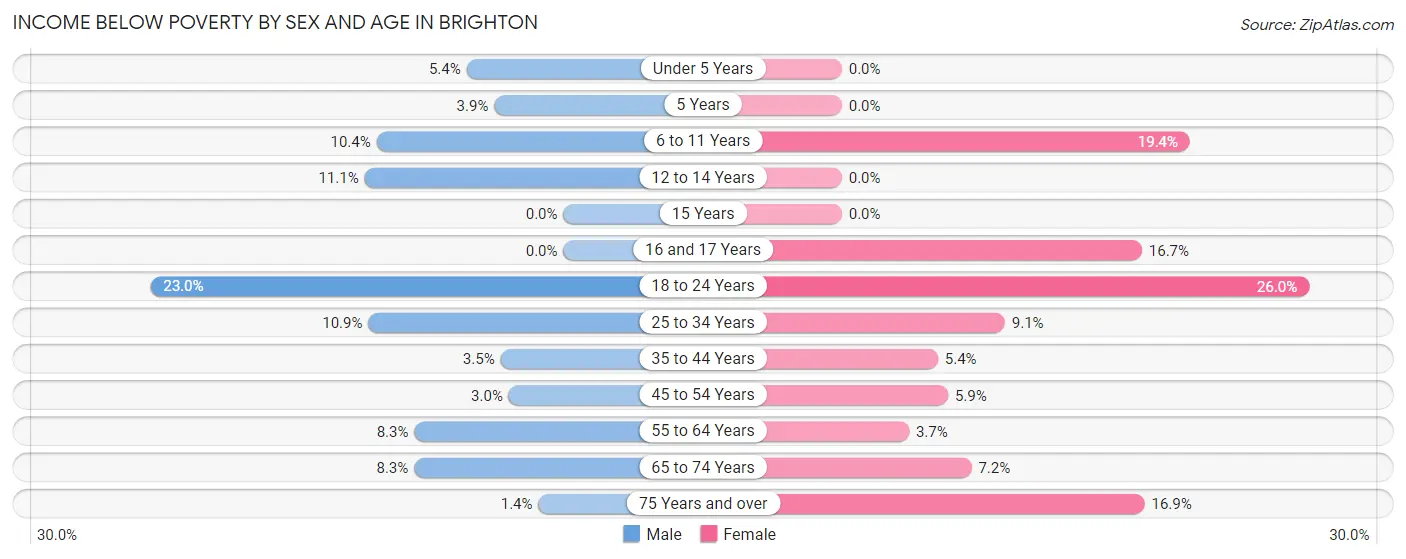
| Age Bracket | Male | Female |
| Under 5 Years | 35 (5.4%) | 0 (0.0%) |
| 5 Years | 6 (3.8%) | 0 (0.0%) |
| 6 to 11 Years | 134 (10.4%) | 273 (19.4%) |
| 12 to 14 Years | 81 (11.1%) | 0 (0.0%) |
| 15 Years | 0 (0.0%) | 0 (0.0%) |
| 16 and 17 Years | 0 (0.0%) | 62 (16.7%) |
| 18 to 24 Years | 359 (23.0%) | 370 (26.0%) |
| 25 to 34 Years | 284 (10.9%) | 241 (9.1%) |
| 35 to 44 Years | 71 (3.5%) | 115 (5.3%) |
| 45 to 54 Years | 60 (3.0%) | 123 (5.9%) |
| 55 to 64 Years | 183 (8.3%) | 87 (3.7%) |
| 65 to 74 Years | 136 (8.3%) | 140 (7.2%) |
| 75 Years and over | 15 (1.4%) | 366 (16.9%) |
| Total | 1,364 (8.2%) | 1,777 (9.9%) |
Income Above Poverty by Sex and Age in Brighton
According to the poverty statistics in Brighton, males aged 15 years and females aged under 5 years are the age groups that are most secure financially, with 100.0% of males and 100.0% of females in these age groups living above the poverty line.
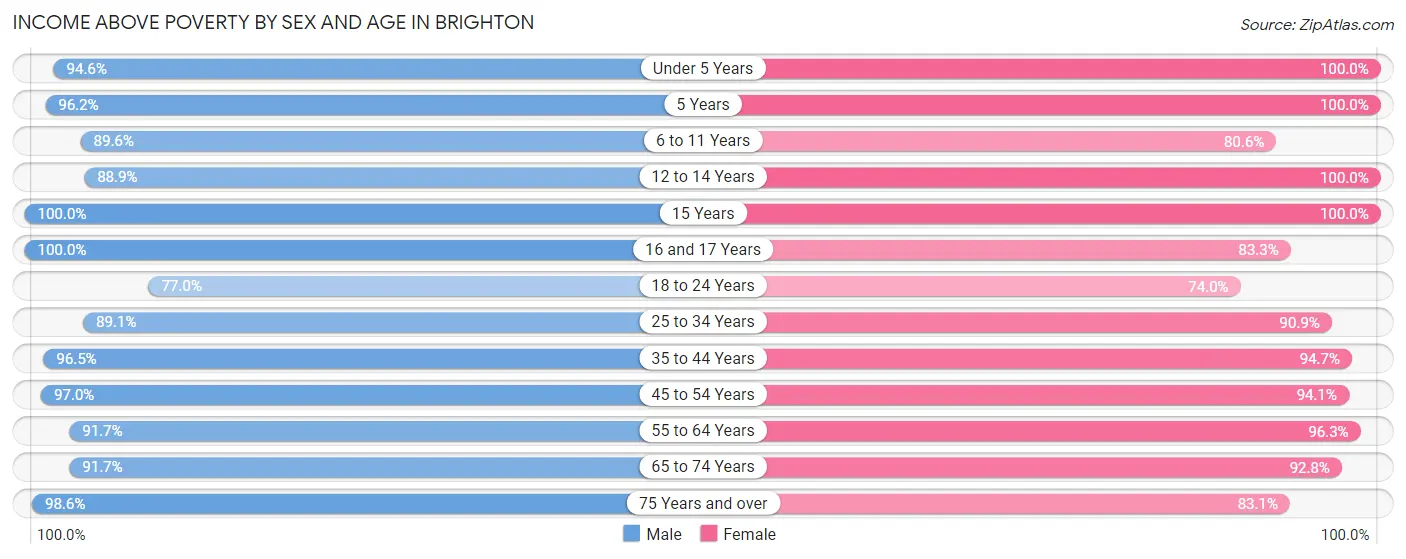
| Age Bracket | Male | Female |
| Under 5 Years | 614 (94.6%) | 631 (100.0%) |
| 5 Years | 150 (96.2%) | 221 (100.0%) |
| 6 to 11 Years | 1,154 (89.6%) | 1,136 (80.6%) |
| 12 to 14 Years | 651 (88.9%) | 440 (100.0%) |
| 15 Years | 319 (100.0%) | 111 (100.0%) |
| 16 and 17 Years | 417 (100.0%) | 309 (83.3%) |
| 18 to 24 Years | 1,202 (77.0%) | 1,052 (74.0%) |
| 25 to 34 Years | 2,332 (89.1%) | 2,412 (90.9%) |
| 35 to 44 Years | 1,955 (96.5%) | 2,035 (94.7%) |
| 45 to 54 Years | 1,916 (97.0%) | 1,958 (94.1%) |
| 55 to 64 Years | 2,022 (91.7%) | 2,242 (96.3%) |
| 65 to 74 Years | 1,500 (91.7%) | 1,798 (92.8%) |
| 75 Years and over | 1,063 (98.6%) | 1,805 (83.1%) |
| Total | 15,295 (91.8%) | 16,150 (90.1%) |
Income Below Poverty Among Married-Couple Families in Brighton
The poverty statistics for married-couple families in Brighton show that 3.6% or 249 of the total 7,000 families live below the poverty line. Families with 3 or 4 children have the highest poverty rate of 10.0%, comprising of 46 families. On the other hand, families with 5 or more children have the lowest poverty rate of 0.0%, which includes 0 families.
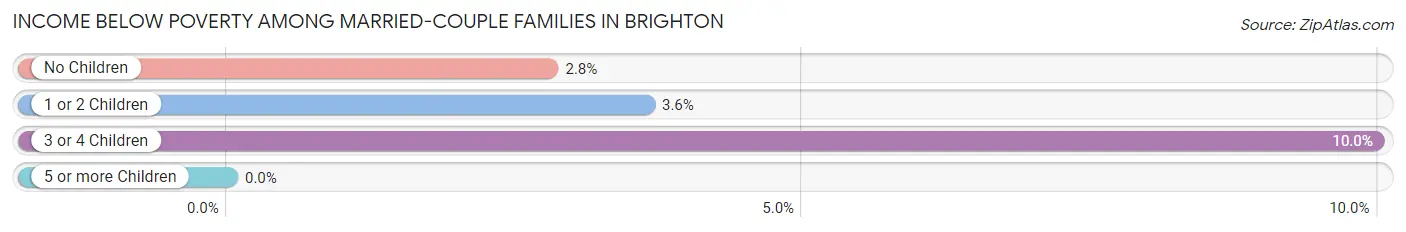
| Children | Above Poverty | Below Poverty |
| No Children | 3,904 (97.2%) | 112 (2.8%) |
| 1 or 2 Children | 2,415 (96.4%) | 91 (3.6%) |
| 3 or 4 Children | 415 (90.0%) | 46 (10.0%) |
| 5 or more Children | 17 (100.0%) | 0 (0.0%) |
| Total | 6,751 (96.4%) | 249 (3.6%) |
Income Below Poverty Among Single-Parent Households in Brighton
According to the poverty data in Brighton, 16.8% or 67 single-father households and 8.5% or 94 single-mother households are living below the poverty line. Among single-father households, those with 1 or 2 children have the highest poverty rate, with 67 households (59.3%) experiencing poverty. Likewise, among single-mother households, those with 3 or 4 children have the highest poverty rate, with 12 households (15.8%) falling below the poverty line.
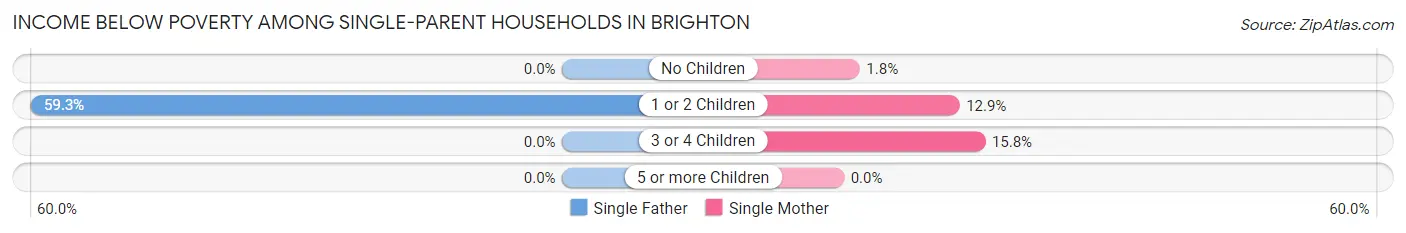
| Children | Single Father | Single Mother |
| No Children | 0 (0.0%) | 8 (1.8%) |
| 1 or 2 Children | 67 (59.3%) | 74 (12.9%) |
| 3 or 4 Children | 0 (0.0%) | 12 (15.8%) |
| 5 or more Children | 0 (0.0%) | 0 (0.0%) |
| Total | 67 (16.8%) | 94 (8.5%) |
Income Below Poverty Among Married-Couple vs Single-Parent Households in Brighton
The poverty data for Brighton shows that 249 of the married-couple family households (3.6%) and 161 of the single-parent households (10.7%) are living below the poverty level. Within the married-couple family households, those with 3 or 4 children have the highest poverty rate, with 46 households (10.0%) falling below the poverty line. Among the single-parent households, those with 1 or 2 children have the highest poverty rate, with 141 household (20.5%) living below poverty.
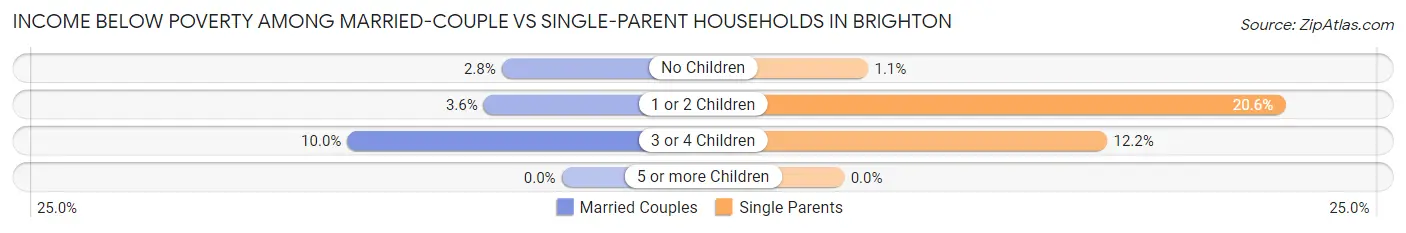
| Children | Married-Couple Families | Single-Parent Households |
| No Children | 112 (2.8%) | 8 (1.1%) |
| 1 or 2 Children | 91 (3.6%) | 141 (20.5%) |
| 3 or 4 Children | 46 (10.0%) | 12 (12.2%) |
| 5 or more Children | 0 (0.0%) | 0 (0.0%) |
| Total | 249 (3.6%) | 161 (10.7%) |
Race in Brighton
The most populous races in Brighton are White / Caucasian (28,490 | 77.4%), Asian (3,544 | 9.6%), and Black / African American (2,529 | 6.9%).
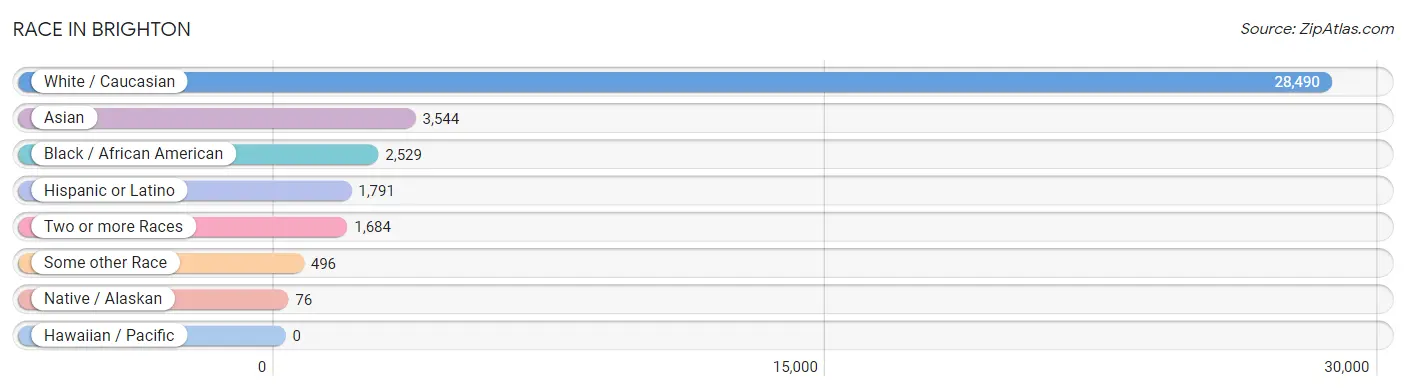
| Race | # Population | % Population |
| Asian | 3,544 | 9.6% |
| Black / African American | 2,529 | 6.9% |
| Hawaiian / Pacific | 0 | 0.0% |
| Hispanic or Latino | 1,791 | 4.9% |
| Native / Alaskan | 76 | 0.2% |
| White / Caucasian | 28,490 | 77.4% |
| Two or more Races | 1,684 | 4.6% |
| Some other Race | 496 | 1.3% |
| Total | 36,819 | 100.0% |
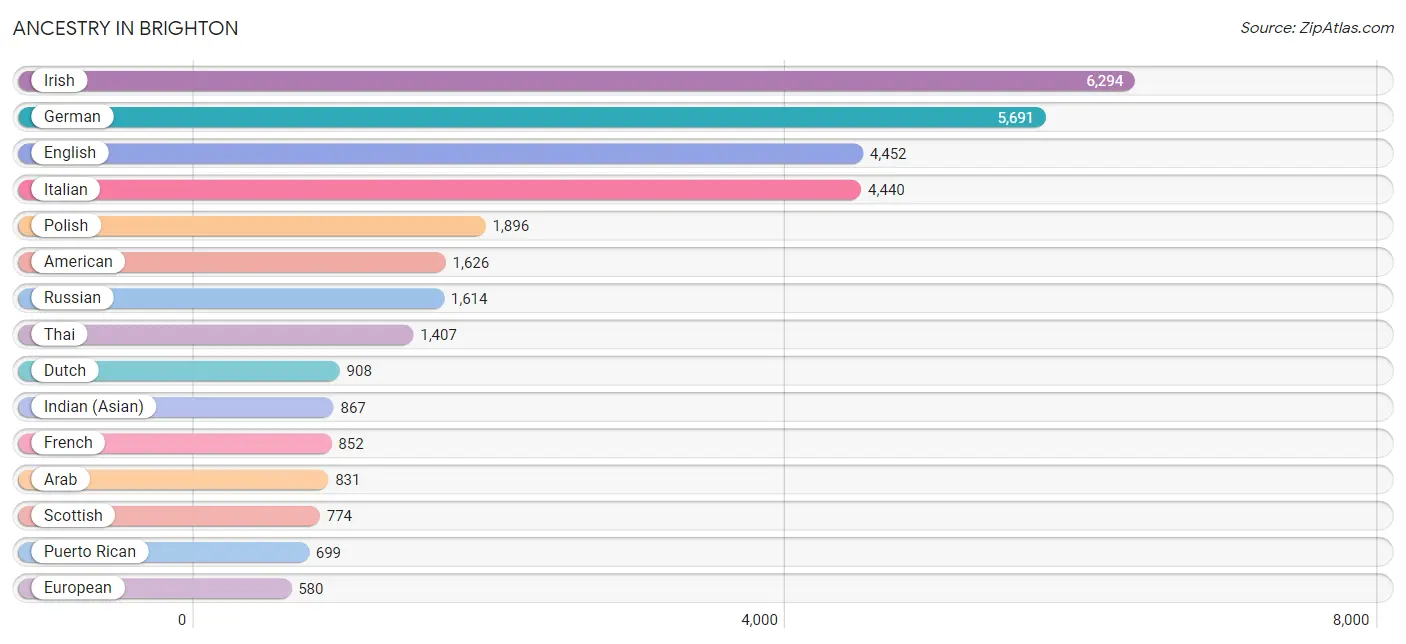
Ancestry in Brighton
The most populous ancestries reported in Brighton are Irish (6,294 | 17.1%), German (5,691 | 15.5%), English (4,452 | 12.1%), Italian (4,440 | 12.1%), and Polish (1,896 | 5.1%), together accounting for 61.9% of all Brighton residents.
| Ancestry | # Population | % Population |
| Afghan | 26 | 0.1% |
| African | 311 | 0.8% |
| Albanian | 61 | 0.2% |
| Alsatian | 15 | 0.0% |
| American | 1,626 | 4.4% |
| Arab | 831 | 2.3% |
| Argentinean | 12 | 0.0% |
| Armenian | 14 | 0.0% |
| Austrian | 93 | 0.3% |
| Belgian | 12 | 0.0% |
| Bhutanese | 148 | 0.4% |
| Brazilian | 34 | 0.1% |
| British | 225 | 0.6% |
| Bulgarian | 29 | 0.1% |
| Burmese | 480 | 1.3% |
| Canadian | 120 | 0.3% |
| Carpatho Rusyn | 11 | 0.0% |
| Celtic | 14 | 0.0% |
| Central American | 210 | 0.6% |
| Colombian | 46 | 0.1% |
| Croatian | 15 | 0.0% |
| Cuban | 291 | 0.8% |
| Czech | 94 | 0.3% |
| Czechoslovakian | 10 | 0.0% |
| Danish | 213 | 0.6% |
| Dominican | 55 | 0.2% |
| Dutch | 908 | 2.5% |
| Eastern European | 307 | 0.8% |
| Ecuadorian | 22 | 0.1% |
| Egyptian | 143 | 0.4% |
| English | 4,452 | 12.1% |
| Ethiopian | 5 | 0.0% |
| European | 580 | 1.6% |
| Filipino | 42 | 0.1% |
| Finnish | 93 | 0.3% |
| French | 852 | 2.3% |
| French Canadian | 193 | 0.5% |
| German | 5,691 | 15.5% |
| Ghanaian | 79 | 0.2% |
| Greek | 108 | 0.3% |
| Guatemalan | 158 | 0.4% |
| Haitian | 15 | 0.0% |
| Honduran | 34 | 0.1% |
| Hungarian | 213 | 0.6% |
| Indian (Asian) | 867 | 2.4% |
| Indonesian | 40 | 0.1% |
| Iranian | 77 | 0.2% |
| Iraqi | 50 | 0.1% |
| Irish | 6,294 | 17.1% |
| Iroquois | 65 | 0.2% |
| Israeli | 52 | 0.1% |
| Italian | 4,440 | 12.1% |
| Jamaican | 150 | 0.4% |
| Japanese | 8 | 0.0% |
| Korean | 170 | 0.5% |
| Latvian | 27 | 0.1% |
| Lebanese | 214 | 0.6% |
| Liberian | 4 | 0.0% |
| Lithuanian | 142 | 0.4% |
| Macedonian | 5 | 0.0% |
| Malaysian | 19 | 0.1% |
| Mexican | 189 | 0.5% |
| Moroccan | 11 | 0.0% |
| Native Hawaiian | 10 | 0.0% |
| Navajo | 7 | 0.0% |
| Nicaraguan | 18 | 0.1% |
| Nigerian | 24 | 0.1% |
| Northern European | 19 | 0.1% |
| Norwegian | 165 | 0.4% |
| Paraguayan | 31 | 0.1% |
| Peruvian | 16 | 0.0% |
| Polish | 1,896 | 5.1% |
| Portuguese | 34 | 0.1% |
| Puerto Rican | 699 | 1.9% |
| Romanian | 65 | 0.2% |
| Russian | 1,614 | 4.4% |
| Scandinavian | 308 | 0.8% |
| Scotch-Irish | 336 | 0.9% |
| Scottish | 774 | 2.1% |
| Serbian | 72 | 0.2% |
| Slavic | 127 | 0.3% |
| Slovak | 8 | 0.0% |
| Slovene | 17 | 0.1% |
| South American | 127 | 0.3% |
| Spaniard | 92 | 0.3% |
| Spanish | 85 | 0.2% |
| Sri Lankan | 71 | 0.2% |
| Subsaharan African | 436 | 1.2% |
| Swedish | 348 | 0.9% |
| Swiss | 195 | 0.5% |
| Syrian | 38 | 0.1% |
| Thai | 1,407 | 3.8% |
| Turkish | 428 | 1.2% |
| Ukrainian | 495 | 1.3% |
| Welsh | 276 | 0.7% |
| West Indian | 25 | 0.1% | View All 96 Rows |
Immigrants in Brighton
The most numerous immigrant groups reported in Brighton came from Asia (3,192 | 8.7%), South Central Asia (1,597 | 4.3%), Europe (1,226 | 3.3%), Eastern Asia (1,128 | 3.1%), and India (1,032 | 2.8%), together accounting for 22.2% of all Brighton residents.
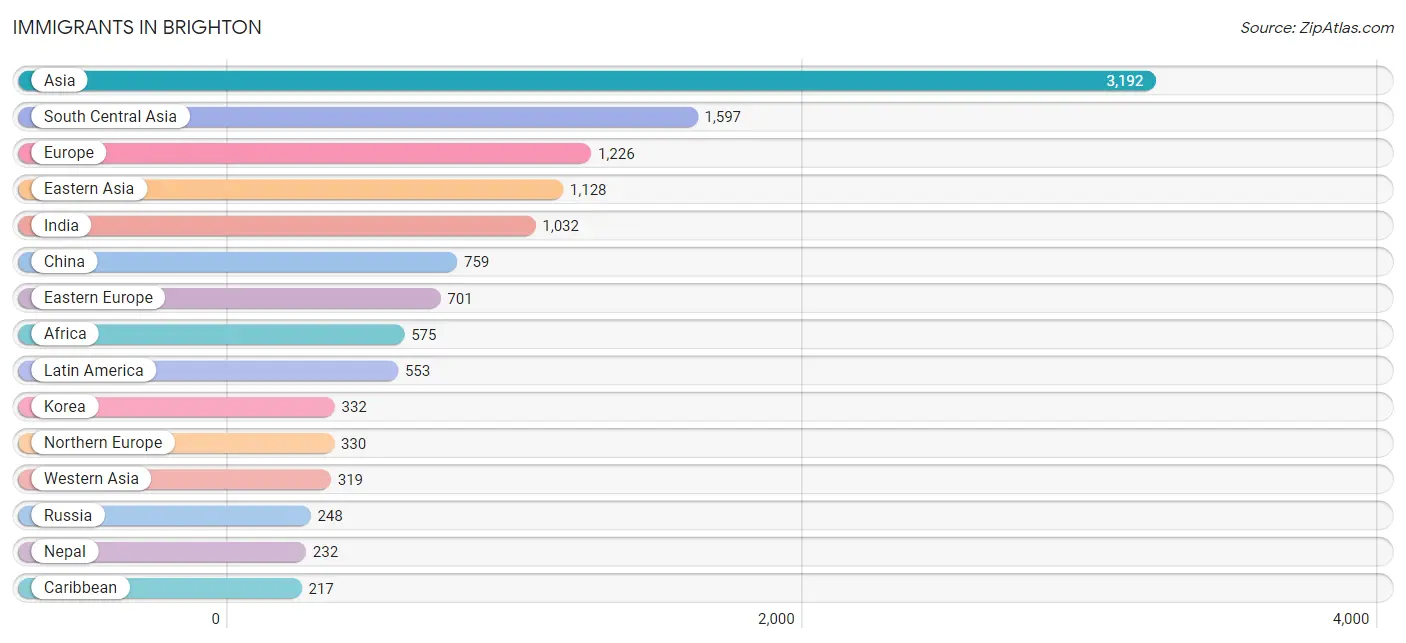
| Immigration Origin | # Population | % Population |
| Afghanistan | 26 | 0.1% |
| Africa | 575 | 1.6% |
| Albania | 47 | 0.1% |
| Argentina | 50 | 0.1% |
| Asia | 3,192 | 8.7% |
| Austria | 5 | 0.0% |
| Belarus | 98 | 0.3% |
| Belgium | 18 | 0.1% |
| Brazil | 34 | 0.1% |
| Bulgaria | 60 | 0.2% |
| Cameroon | 83 | 0.2% |
| Canada | 207 | 0.6% |
| Caribbean | 217 | 0.6% |
| Central America | 191 | 0.5% |
| China | 759 | 2.1% |
| Colombia | 8 | 0.0% |
| Cuba | 115 | 0.3% |
| Dominican Republic | 39 | 0.1% |
| Eastern Africa | 139 | 0.4% |
| Eastern Asia | 1,128 | 3.1% |
| Eastern Europe | 701 | 1.9% |
| Ecuador | 22 | 0.1% |
| Egypt | 94 | 0.3% |
| England | 141 | 0.4% |
| Ethiopia | 112 | 0.3% |
| Europe | 1,226 | 3.3% |
| Germany | 31 | 0.1% |
| Ghana | 40 | 0.1% |
| Greece | 10 | 0.0% |
| Guatemala | 104 | 0.3% |
| Haiti | 38 | 0.1% |
| Honduras | 6 | 0.0% |
| Hong Kong | 17 | 0.1% |
| India | 1,032 | 2.8% |
| Iran | 39 | 0.1% |
| Iraq | 150 | 0.4% |
| Ireland | 75 | 0.2% |
| Israel | 92 | 0.3% |
| Italy | 38 | 0.1% |
| Jamaica | 25 | 0.1% |
| Japan | 37 | 0.1% |
| Jordan | 49 | 0.1% |
| Kazakhstan | 10 | 0.0% |
| Kenya | 14 | 0.0% |
| Korea | 332 | 0.9% |
| Kuwait | 2 | 0.0% |
| Latin America | 553 | 1.5% |
| Liberia | 22 | 0.1% |
| Mexico | 58 | 0.2% |
| Middle Africa | 83 | 0.2% |
| Moldova | 23 | 0.1% |
| Nepal | 232 | 0.6% |
| Netherlands | 40 | 0.1% |
| Nicaragua | 23 | 0.1% |
| Nigeria | 24 | 0.1% |
| North Macedonia | 2 | 0.0% |
| Northern Africa | 140 | 0.4% |
| Northern Europe | 330 | 0.9% |
| Philippines | 83 | 0.2% |
| Poland | 72 | 0.2% |
| Russia | 248 | 0.7% |
| Saudi Arabia | 26 | 0.1% |
| Scotland | 42 | 0.1% |
| Serbia | 25 | 0.1% |
| Singapore | 15 | 0.0% |
| South Africa | 115 | 0.3% |
| South America | 145 | 0.4% |
| South Central Asia | 1,597 | 4.3% |
| South Eastern Asia | 148 | 0.4% |
| Southern Europe | 101 | 0.3% |
| Spain | 53 | 0.1% |
| Sri Lanka | 181 | 0.5% |
| Taiwan | 138 | 0.4% |
| Ukraine | 33 | 0.1% |
| Uzbekistan | 55 | 0.2% |
| Vietnam | 10 | 0.0% |
| Western Africa | 86 | 0.2% |
| Western Asia | 319 | 0.9% |
| Western Europe | 94 | 0.3% | View All 79 Rows |
Sex and Age in Brighton
Sex and Age in Brighton
The most populous age groups in Brighton are 15 to 19 Years (1,560 | 8.8%) for men and 55 to 59 Years (1,461 | 7.7%) for women.
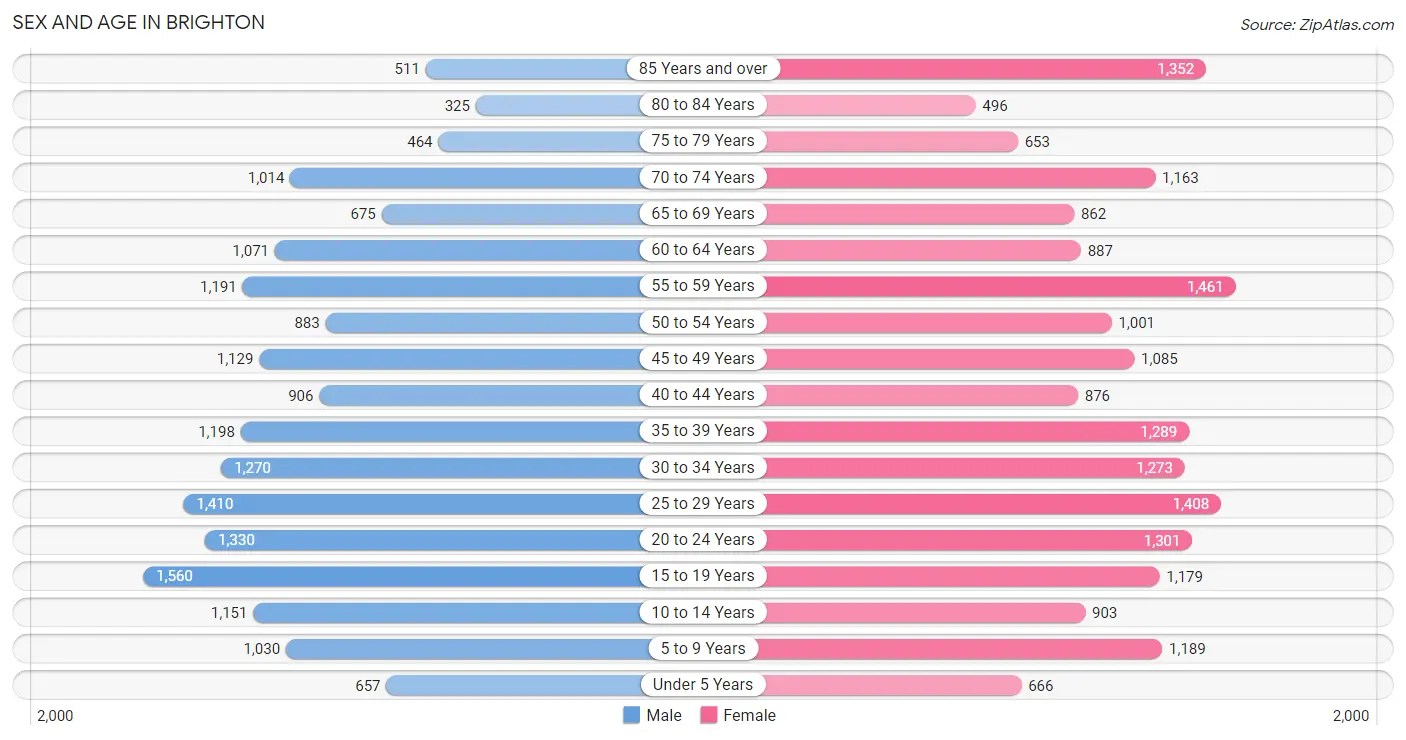
| Age Bracket | Male | Female |
| Under 5 Years | 657 (3.7%) | 666 (3.5%) |
| 5 to 9 Years | 1,030 (5.8%) | 1,189 (6.2%) |
| 10 to 14 Years | 1,151 (6.5%) | 903 (4.7%) |
| 15 to 19 Years | 1,560 (8.8%) | 1,179 (6.2%) |
| 20 to 24 Years | 1,330 (7.5%) | 1,301 (6.8%) |
| 25 to 29 Years | 1,410 (7.9%) | 1,408 (7.4%) |
| 30 to 34 Years | 1,270 (7.1%) | 1,273 (6.7%) |
| 35 to 39 Years | 1,198 (6.7%) | 1,289 (6.8%) |
| 40 to 44 Years | 906 (5.1%) | 876 (4.6%) |
| 45 to 49 Years | 1,129 (6.4%) | 1,085 (5.7%) |
| 50 to 54 Years | 883 (5.0%) | 1,001 (5.3%) |
| 55 to 59 Years | 1,191 (6.7%) | 1,461 (7.7%) |
| 60 to 64 Years | 1,071 (6.0%) | 887 (4.7%) |
| 65 to 69 Years | 675 (3.8%) | 862 (4.5%) |
| 70 to 74 Years | 1,014 (5.7%) | 1,163 (6.1%) |
| 75 to 79 Years | 464 (2.6%) | 653 (3.4%) |
| 80 to 84 Years | 325 (1.8%) | 496 (2.6%) |
| 85 Years and over | 511 (2.9%) | 1,352 (7.1%) |
| Total | 17,775 (100.0%) | 19,044 (100.0%) |
Families and Households in Brighton
Median Family Size in Brighton
The median family size in Brighton is 2.91 persons per family, with married-couple families (7,000 | 82.3%) accounting for the largest median family size of 2.97 persons per family. On the other hand, single male/father families (400 | 4.7%) represent the smallest median family size with 2.42 persons per family.
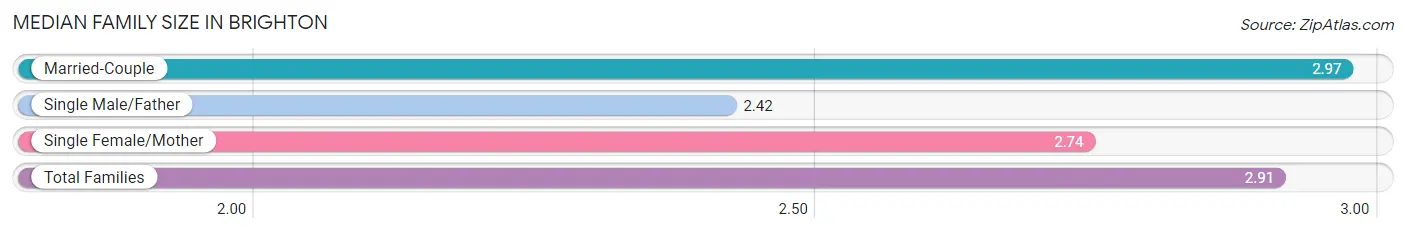
| Family Type | # Families | Family Size |
| Married-Couple | 7,000 (82.3%) | 2.97 |
| Single Male/Father | 400 (4.7%) | 2.42 |
| Single Female/Mother | 1,103 (13.0%) | 2.74 |
| Total Families | 8,503 (100.0%) | 2.91 |
Median Household Size in Brighton
The median household size in Brighton is 2.16 persons per household, with single female/mother households (1,103 | 6.9%) accounting for the largest median household size of 2.98 persons per household. non-family households (7,426 | 46.6%) represent the smallest median household size with 1.24 persons per household.
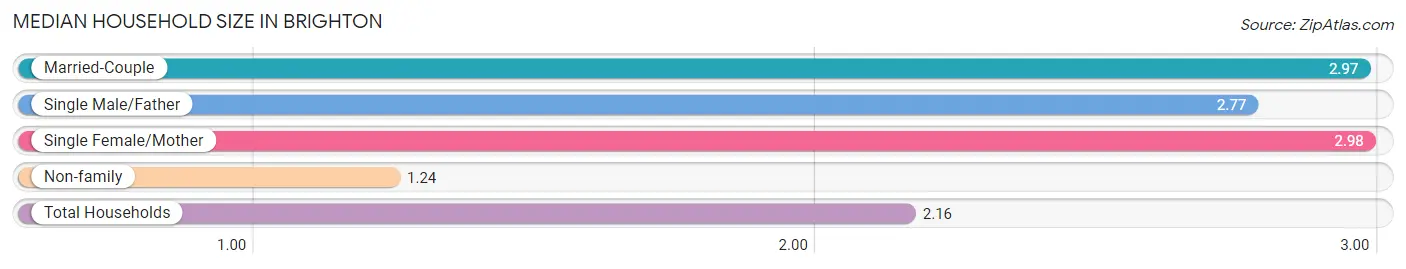
| Household Type | # Households | Household Size |
| Married-Couple | 7,000 (44.0%) | 2.97 |
| Single Male/Father | 400 (2.5%) | 2.77 |
| Single Female/Mother | 1,103 (6.9%) | 2.98 |
| Non-family | 7,426 (46.6%) | 1.24 |
| Total Households | 15,929 (100.0%) | 2.16 |
Household Size by Marriage Status in Brighton
Out of a total of 15,929 households in Brighton, 8,503 (53.4%) are family households, while 7,426 (46.6%) are nonfamily households. The most numerous type of family households are 2-person households, comprising 4,251, and the most common type of nonfamily households are 1-person households, comprising 5,791.
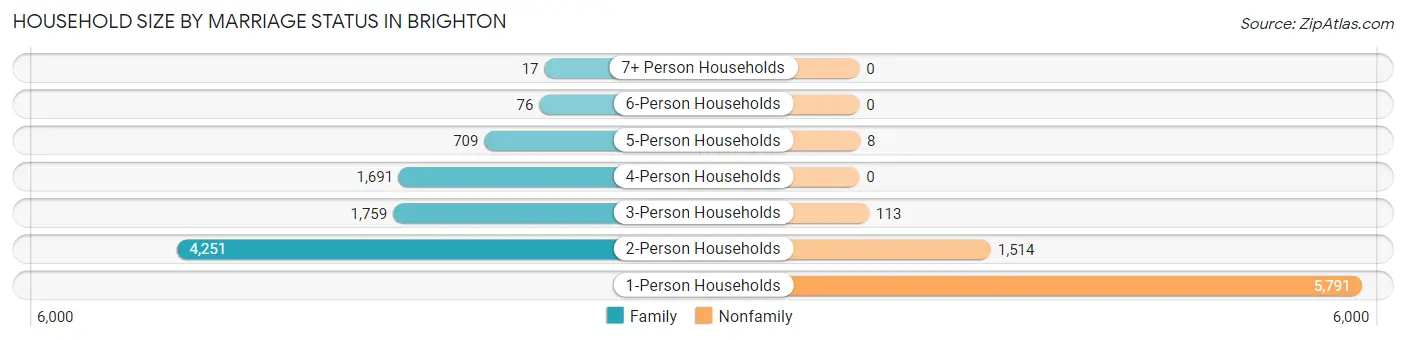
| Household Size | Family Households | Nonfamily Households |
| 1-Person Households | - | 5,791 (36.4%) |
| 2-Person Households | 4,251 (26.7%) | 1,514 (9.5%) |
| 3-Person Households | 1,759 (11.0%) | 113 (0.7%) |
| 4-Person Households | 1,691 (10.6%) | 0 (0.0%) |
| 5-Person Households | 709 (4.4%) | 8 (0.1%) |
| 6-Person Households | 76 (0.5%) | 0 (0.0%) |
| 7+ Person Households | 17 (0.1%) | 0 (0.0%) |
| Total | 8,503 (53.4%) | 7,426 (46.6%) |
Female Fertility in Brighton
Fertility by Age in Brighton
Average fertility rate in Brighton is 28.0 births per 1,000 women. Women in the age bracket of 20 to 34 years have the highest fertility rate with 37.0 births per 1,000 women. Women in the age bracket of 20 to 34 years acount for 60.3% of all women with births.
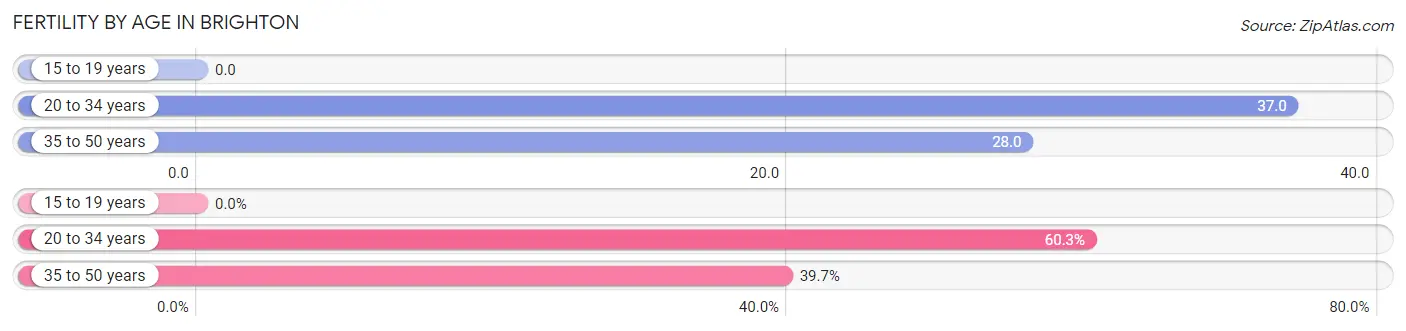
| Age Bracket | Women with Births | Births / 1,000 Women |
| 15 to 19 years | 0 (0.0%) | 0.0 |
| 20 to 34 years | 149 (60.3%) | 37.0 |
| 35 to 50 years | 98 (39.7%) | 28.0 |
| Total | 247 (100.0%) | 28.0 |
Fertility by Age by Marriage Status in Brighton
93.9% of women with births (247) in Brighton are married. The highest percentage of unmarried women with births falls into 20 to 34 years age bracket with 10.1% of them unmarried at the time of birth, while the lowest percentage of unmarried women with births belong to 35 to 50 years age bracket with 0.0% of them unmarried.
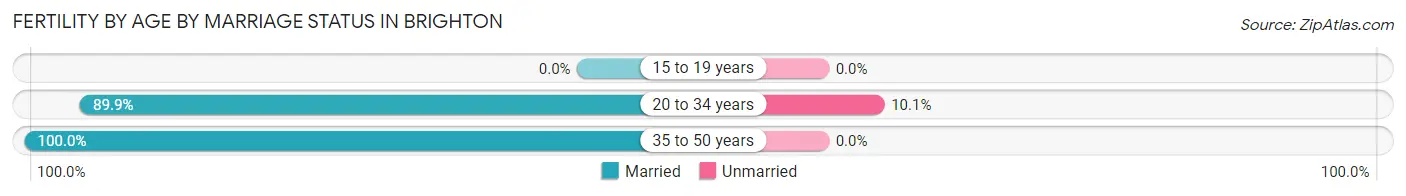
| Age Bracket | Married | Unmarried |
| 15 to 19 years | 0 (0.0%) | 0 (0.0%) |
| 20 to 34 years | 134 (89.9%) | 15 (10.1%) |
| 35 to 50 years | 98 (100.0%) | 0 (0.0%) |
| Total | 232 (93.9%) | 15 (6.1%) |
Fertility by Education in Brighton
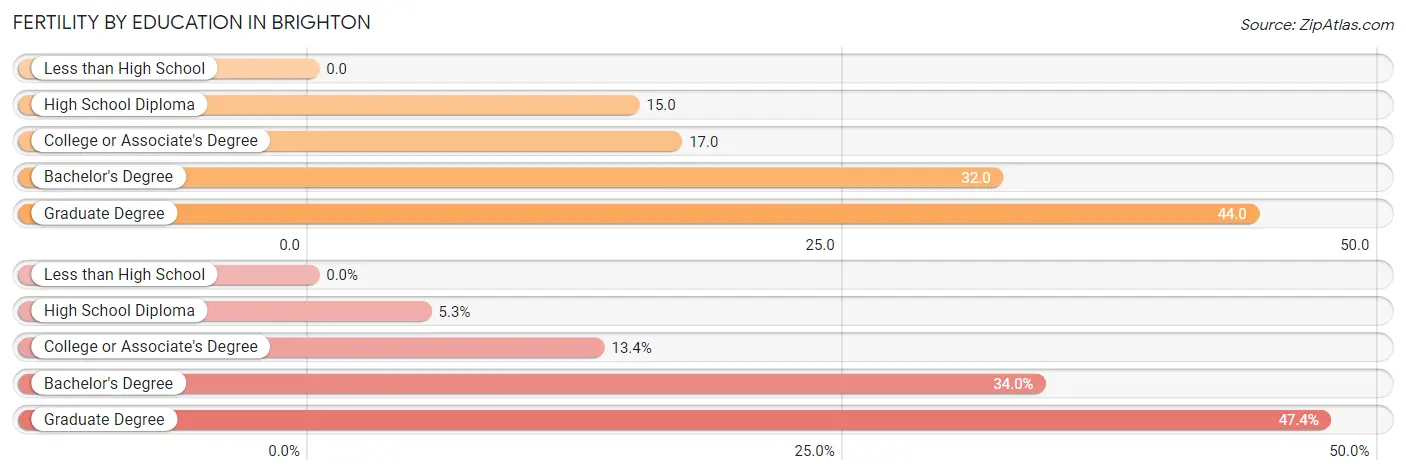
| Educational Attainment | Women with Births | Births / 1,000 Women |
| Less than High School | 0 (0.0%) | 0.0 |
| High School Diploma | 13 (5.3%) | 15.0 |
| College or Associate's Degree | 33 (13.4%) | 17.0 |
| Bachelor's Degree | 84 (34.0%) | 32.0 |
| Graduate Degree | 117 (47.4%) | 44.0 |
| Total | 247 (100.0%) | 28.0 |
Fertility by Education by Marriage Status in Brighton
6.1% of women with births in Brighton are unmarried. Women with the educational attainment of high school diploma are most likely to be married with 100.0% of them married at childbirth, while women with the educational attainment of college or associate's degree are least likely to be married with 45.5% of them unmarried at childbirth.
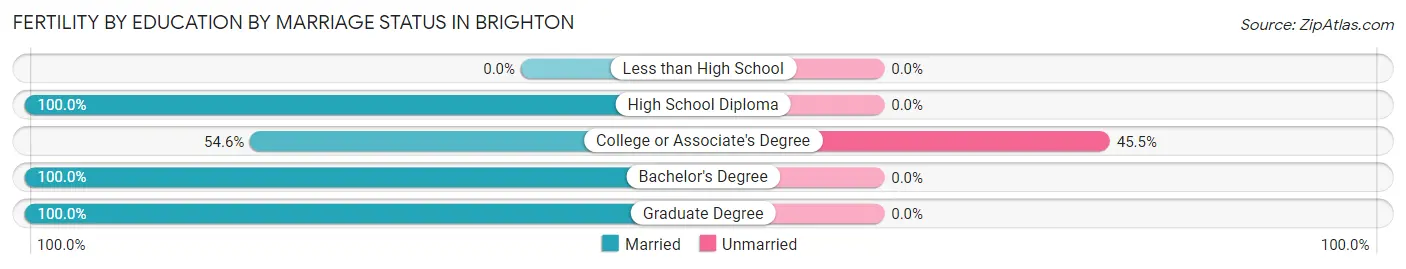
| Educational Attainment | Married | Unmarried |
| Less than High School | 0 (0.0%) | 0 (0.0%) |
| High School Diploma | 13 (100.0%) | 0 (0.0%) |
| College or Associate's Degree | 18 (54.5%) | 15 (45.5%) |
| Bachelor's Degree | 84 (100.0%) | 0 (0.0%) |
| Graduate Degree | 117 (100.0%) | 0 (0.0%) |
| Total | 232 (93.9%) | 15 (6.1%) |
Employment Characteristics in Brighton
Employment by Class of Employer in Brighton
Among the 18,691 employed individuals in Brighton, private company employees (10,563 | 56.5%), not-for-profit organizations (3,792 | 20.3%), and local government employees (1,456 | 7.8%) make up the most common classes of employment.
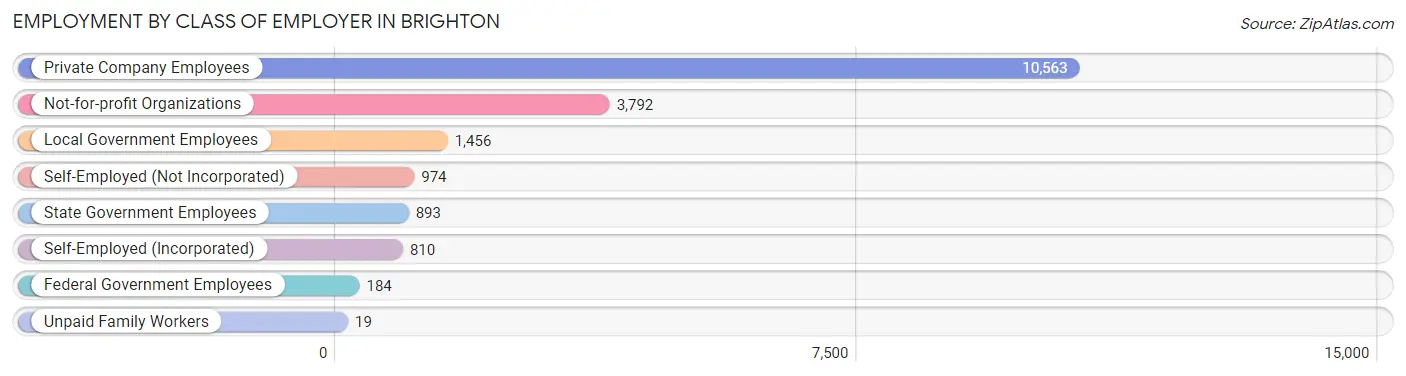
| Employer Class | # Employees | % Employees |
| Private Company Employees | 10,563 | 56.5% |
| Self-Employed (Incorporated) | 810 | 4.3% |
| Self-Employed (Not Incorporated) | 974 | 5.2% |
| Not-for-profit Organizations | 3,792 | 20.3% |
| Local Government Employees | 1,456 | 7.8% |
| State Government Employees | 893 | 4.8% |
| Federal Government Employees | 184 | 1.0% |
| Unpaid Family Workers | 19 | 0.1% |
| Total | 18,691 | 100.0% |
Employment Status by Age in Brighton
According to the labor force statistics for Brighton, out of the total population over 16 years of age (30,793), 64.0% or 19,708 individuals are in the labor force, with 4.4% or 867 of them unemployed. The age group with the highest labor force participation rate is 35 to 44 years, with 88.8% or 3,791 individuals in the labor force. Within the labor force, the 16 to 19 years age range has the highest percentage of unemployed individuals, with 28.6% or 299 of them being unemployed.
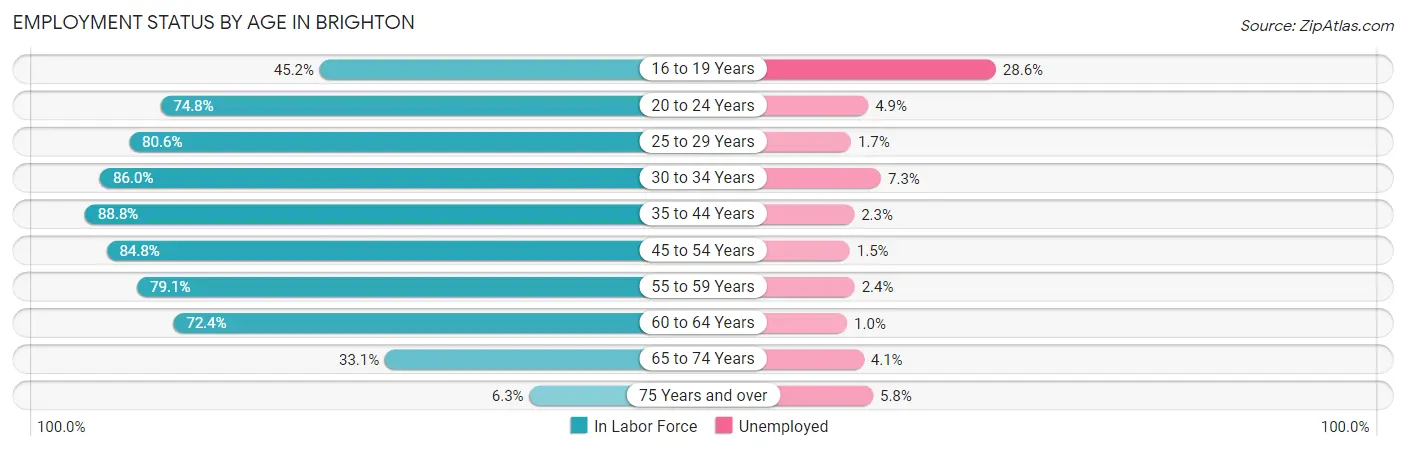
| Age Bracket | In Labor Force | Unemployed |
| 16 to 19 Years | 1,044 (45.2%) | 299 (28.6%) |
| 20 to 24 Years | 1,968 (74.8%) | 96 (4.9%) |
| 25 to 29 Years | 2,271 (80.6%) | 39 (1.7%) |
| 30 to 34 Years | 2,187 (86.0%) | 160 (7.3%) |
| 35 to 44 Years | 3,791 (88.8%) | 87 (2.3%) |
| 45 to 54 Years | 3,475 (84.8%) | 52 (1.5%) |
| 55 to 59 Years | 2,098 (79.1%) | 50 (2.4%) |
| 60 to 64 Years | 1,418 (72.4%) | 14 (1.0%) |
| 65 to 74 Years | 1,229 (33.1%) | 50 (4.1%) |
| 75 Years and over | 239 (6.3%) | 14 (5.8%) |
| Total | 19,708 (64.0%) | 867 (4.4%) |
Employment Status by Educational Attainment in Brighton
According to labor force statistics for Brighton, 83.1% of individuals (15,239) out of the total population between 25 and 64 years of age (18,338) are in the labor force, with 2.6% or 396 of them being unemployed. The group with the highest labor force participation rate are those with the educational attainment of bachelor's degree or higher, with 85.7% or 11,673 individuals in the labor force. Within the labor force, individuals with less than high school education have the highest percentage of unemployment, with 29.5% or 67 of them being unemployed.
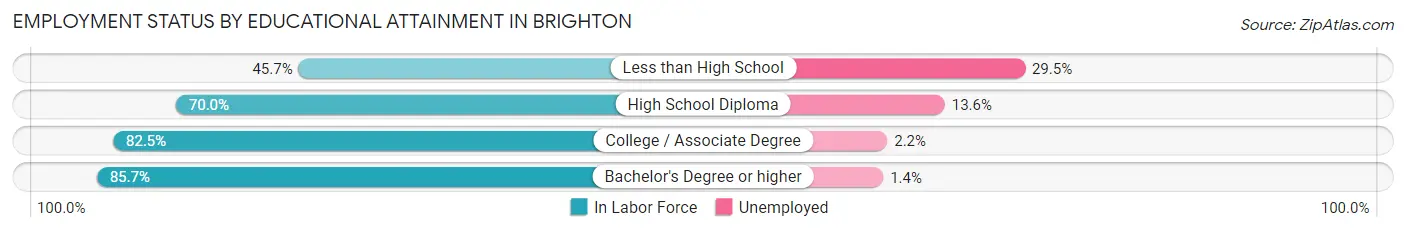
| Educational Attainment | In Labor Force | Unemployed |
| Less than High School | 227 (45.7%) | 147 (29.5%) |
| High School Diploma | 794 (70.0%) | 154 (13.6%) |
| College / Associate Degree | 2,546 (82.5%) | 68 (2.2%) |
| Bachelor's Degree or higher | 11,673 (85.7%) | 191 (1.4%) |
| Total | 15,239 (83.1%) | 477 (2.6%) |
Employment Occupations by Sex in Brighton
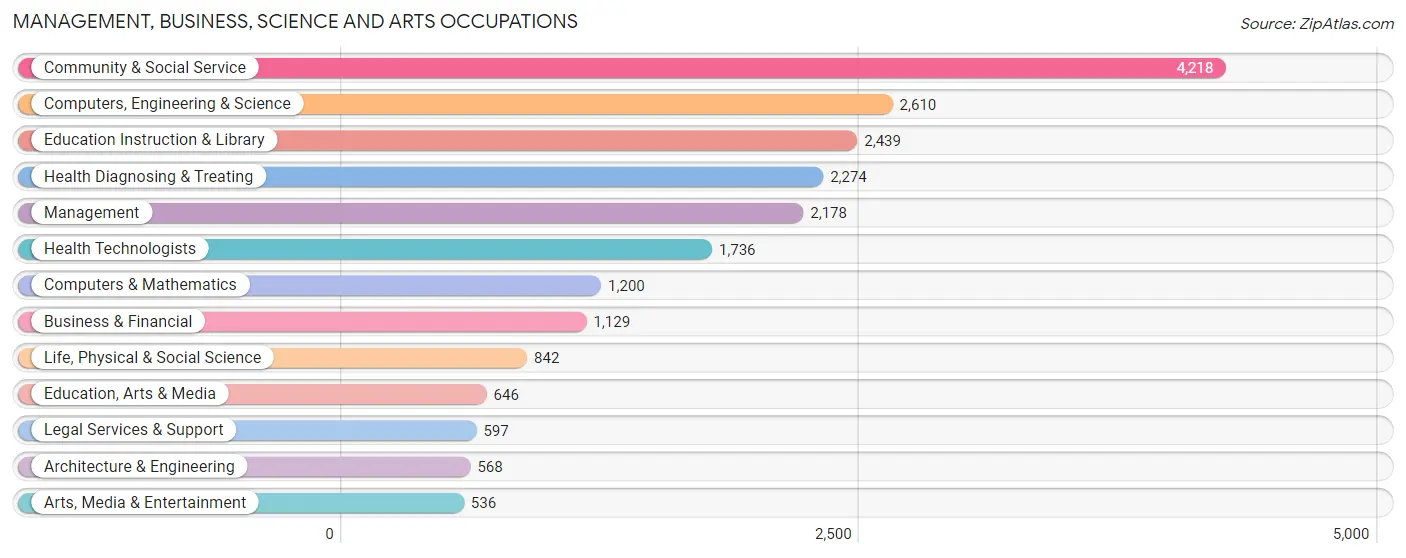
Management, Business, Science and Arts Occupations
The most common Management, Business, Science and Arts occupations in Brighton are Community & Social Service (4,218 | 22.4%), Computers, Engineering & Science (2,610 | 13.9%), Education Instruction & Library (2,439 | 12.9%), Health Diagnosing & Treating (2,274 | 12.1%), and Management (2,178 | 11.6%).
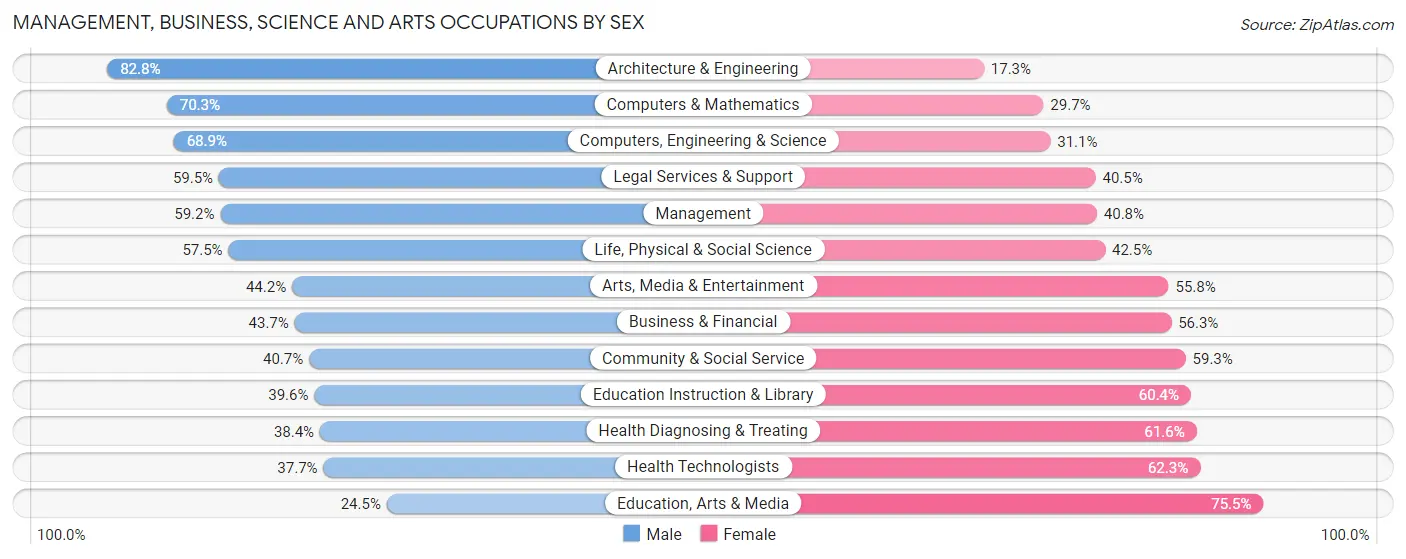
Management, Business, Science and Arts Occupations by Sex
Within the Management, Business, Science and Arts occupations in Brighton, the most male-oriented occupations are Architecture & Engineering (82.8%), Computers & Mathematics (70.3%), and Computers, Engineering & Science (68.9%), while the most female-oriented occupations are Education, Arts & Media (75.5%), Health Technologists (62.3%), and Health Diagnosing & Treating (61.6%).
| Occupation | Male | Female |
| Management | 1,289 (59.2%) | 889 (40.8%) |
| Business & Financial | 493 (43.7%) | 636 (56.3%) |
| Computers, Engineering & Science | 1,798 (68.9%) | 812 (31.1%) |
| Computers & Mathematics | 844 (70.3%) | 356 (29.7%) |
| Architecture & Engineering | 470 (82.8%) | 98 (17.2%) |
| Life, Physical & Social Science | 484 (57.5%) | 358 (42.5%) |
| Community & Social Service | 1,715 (40.7%) | 2,503 (59.3%) |
| Education, Arts & Media | 158 (24.5%) | 488 (75.5%) |
| Legal Services & Support | 355 (59.5%) | 242 (40.5%) |
| Education Instruction & Library | 965 (39.6%) | 1,474 (60.4%) |
| Arts, Media & Entertainment | 237 (44.2%) | 299 (55.8%) |
| Health Diagnosing & Treating | 873 (38.4%) | 1,401 (61.6%) |
| Health Technologists | 654 (37.7%) | 1,082 (62.3%) |
| Total (Category) | 6,168 (49.7%) | 6,241 (50.3%) |
| Total (Overall) | 9,684 (51.4%) | 9,166 (48.6%) |
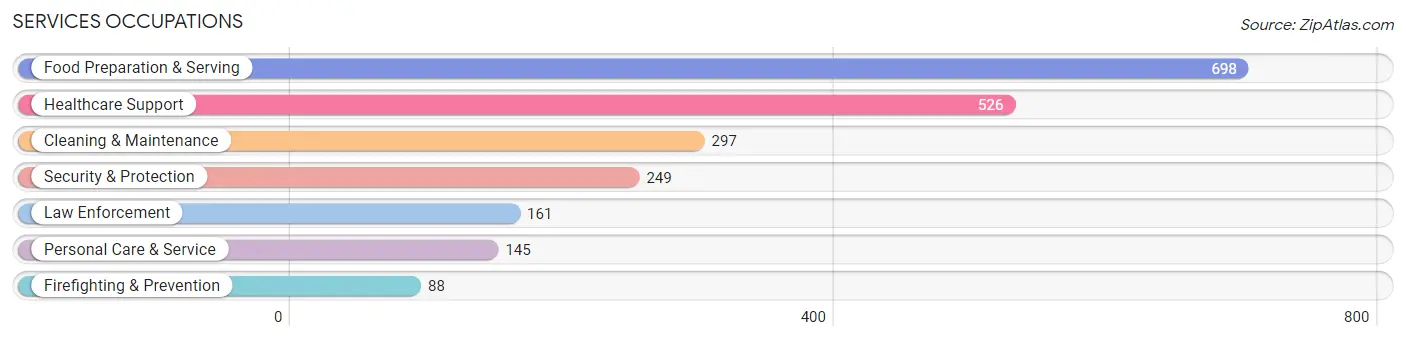
Services Occupations
The most common Services occupations in Brighton are Food Preparation & Serving (698 | 3.7%), Healthcare Support (526 | 2.8%), Cleaning & Maintenance (297 | 1.6%), Security & Protection (249 | 1.3%), and Law Enforcement (161 | 0.9%).
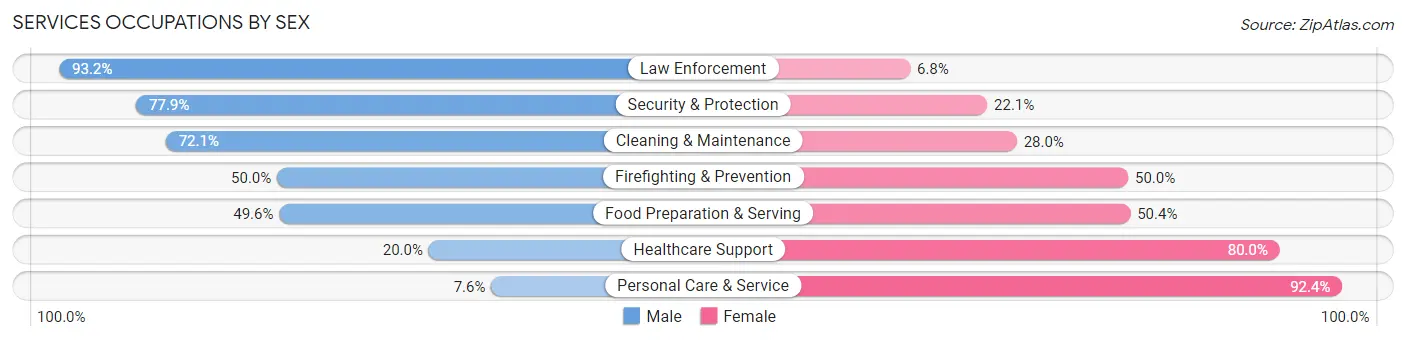
Services Occupations by Sex
Within the Services occupations in Brighton, the most male-oriented occupations are Law Enforcement (93.2%), Security & Protection (77.9%), and Cleaning & Maintenance (72.1%), while the most female-oriented occupations are Personal Care & Service (92.4%), Healthcare Support (80.0%), and Food Preparation & Serving (50.4%).
| Occupation | Male | Female |
| Healthcare Support | 105 (20.0%) | 421 (80.0%) |
| Security & Protection | 194 (77.9%) | 55 (22.1%) |
| Firefighting & Prevention | 44 (50.0%) | 44 (50.0%) |
| Law Enforcement | 150 (93.2%) | 11 (6.8%) |
| Food Preparation & Serving | 346 (49.6%) | 352 (50.4%) |
| Cleaning & Maintenance | 214 (72.1%) | 83 (28.0%) |
| Personal Care & Service | 11 (7.6%) | 134 (92.4%) |
| Total (Category) | 870 (45.4%) | 1,045 (54.6%) |
| Total (Overall) | 9,684 (51.4%) | 9,166 (48.6%) |
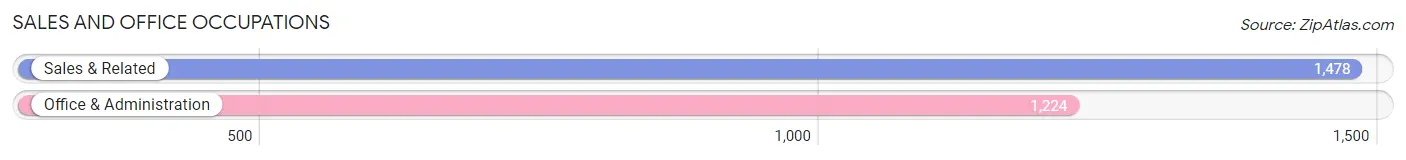
Sales and Office Occupations
The most common Sales and Office occupations in Brighton are Sales & Related (1,478 | 7.8%), and Office & Administration (1,224 | 6.5%).
Sales and Office Occupations by Sex
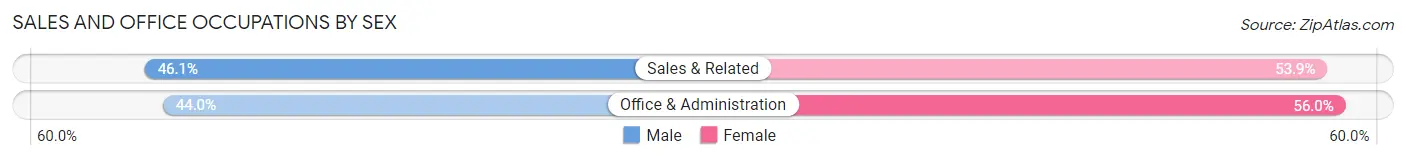
| Occupation | Male | Female |
| Sales & Related | 682 (46.1%) | 796 (53.9%) |
| Office & Administration | 539 (44.0%) | 685 (56.0%) |
| Total (Category) | 1,221 (45.2%) | 1,481 (54.8%) |
| Total (Overall) | 9,684 (51.4%) | 9,166 (48.6%) |
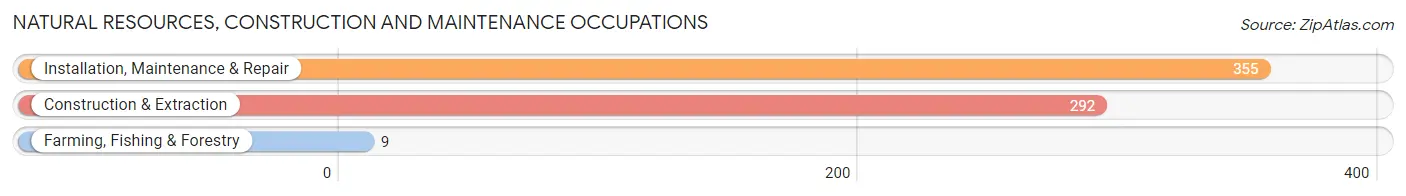
Natural Resources, Construction and Maintenance Occupations
The most common Natural Resources, Construction and Maintenance occupations in Brighton are Installation, Maintenance & Repair (355 | 1.9%), Construction & Extraction (292 | 1.5%), and Farming, Fishing & Forestry (9 | 0.1%).
Natural Resources, Construction and Maintenance Occupations by Sex
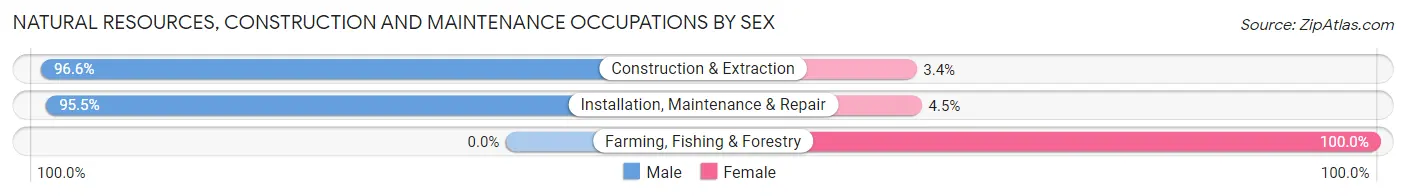
| Occupation | Male | Female |
| Farming, Fishing & Forestry | 0 (0.0%) | 9 (100.0%) |
| Construction & Extraction | 282 (96.6%) | 10 (3.4%) |
| Installation, Maintenance & Repair | 339 (95.5%) | 16 (4.5%) |
| Total (Category) | 621 (94.7%) | 35 (5.3%) |
| Total (Overall) | 9,684 (51.4%) | 9,166 (48.6%) |
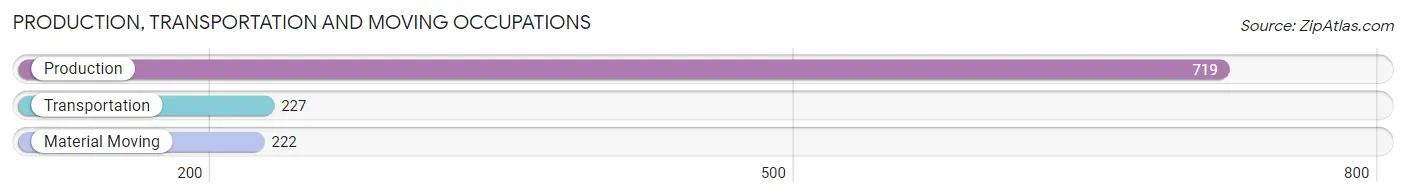
Production, Transportation and Moving Occupations
The most common Production, Transportation and Moving occupations in Brighton are Production (719 | 3.8%), Transportation (227 | 1.2%), and Material Moving (222 | 1.2%).
Production, Transportation and Moving Occupations by Sex
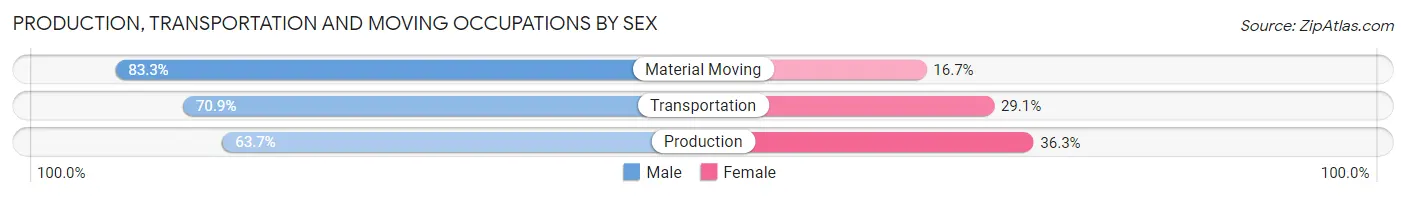
| Occupation | Male | Female |
| Production | 458 (63.7%) | 261 (36.3%) |
| Transportation | 161 (70.9%) | 66 (29.1%) |
| Material Moving | 185 (83.3%) | 37 (16.7%) |
| Total (Category) | 804 (68.8%) | 364 (31.2%) |
| Total (Overall) | 9,684 (51.4%) | 9,166 (48.6%) |
Employment Industries by Sex in Brighton
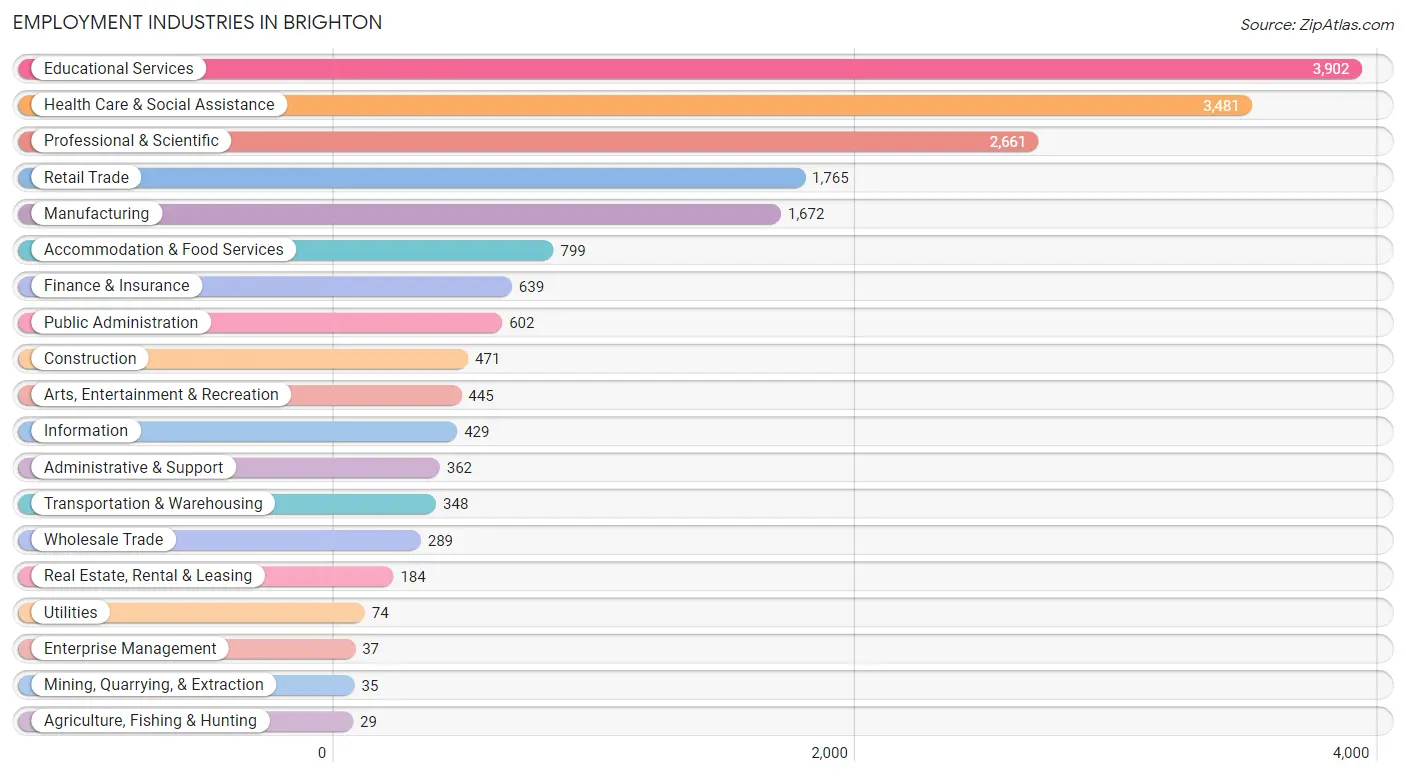
Employment Industries in Brighton
The major employment industries in Brighton include Educational Services (3,902 | 20.7%), Health Care & Social Assistance (3,481 | 18.5%), Professional & Scientific (2,661 | 14.1%), Retail Trade (1,765 | 9.4%), and Manufacturing (1,672 | 8.9%).
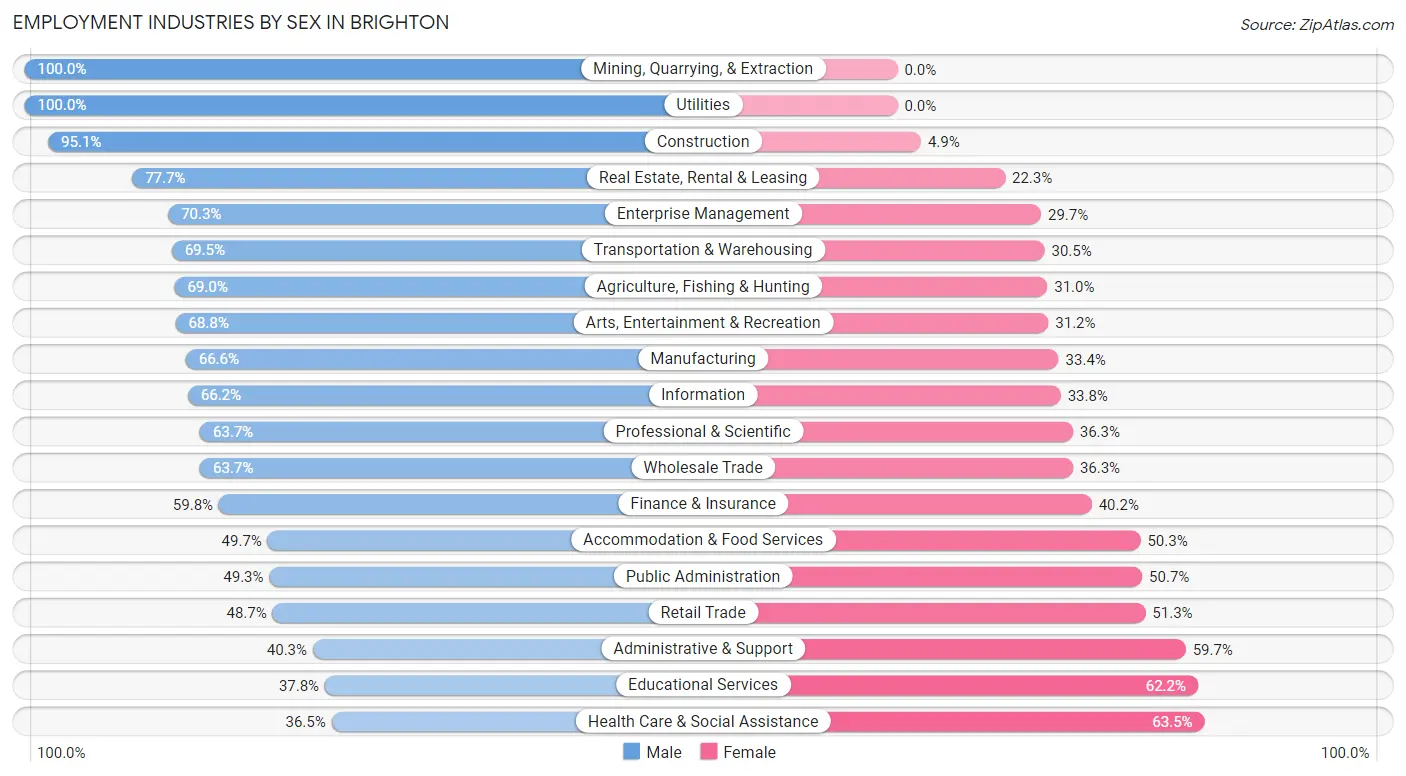
Employment Industries by Sex in Brighton
The Brighton industries that see more men than women are Mining, Quarrying, & Extraction (100.0%), Utilities (100.0%), and Construction (95.1%), whereas the industries that tend to have a higher number of women are Health Care & Social Assistance (63.5%), Educational Services (62.2%), and Administrative & Support (59.7%).
| Industry | Male | Female |
| Agriculture, Fishing & Hunting | 20 (69.0%) | 9 (31.0%) |
| Mining, Quarrying, & Extraction | 35 (100.0%) | 0 (0.0%) |
| Construction | 448 (95.1%) | 23 (4.9%) |
| Manufacturing | 1,114 (66.6%) | 558 (33.4%) |
| Wholesale Trade | 184 (63.7%) | 105 (36.3%) |
| Retail Trade | 859 (48.7%) | 906 (51.3%) |
| Transportation & Warehousing | 242 (69.5%) | 106 (30.5%) |
| Utilities | 74 (100.0%) | 0 (0.0%) |
| Information | 284 (66.2%) | 145 (33.8%) |
| Finance & Insurance | 382 (59.8%) | 257 (40.2%) |
| Real Estate, Rental & Leasing | 143 (77.7%) | 41 (22.3%) |
| Professional & Scientific | 1,695 (63.7%) | 966 (36.3%) |
| Enterprise Management | 26 (70.3%) | 11 (29.7%) |
| Administrative & Support | 146 (40.3%) | 216 (59.7%) |
| Educational Services | 1,476 (37.8%) | 2,426 (62.2%) |
| Health Care & Social Assistance | 1,269 (36.5%) | 2,212 (63.5%) |
| Arts, Entertainment & Recreation | 306 (68.8%) | 139 (31.2%) |
| Accommodation & Food Services | 397 (49.7%) | 402 (50.3%) |
| Public Administration | 297 (49.3%) | 305 (50.7%) |
| Total | 9,684 (51.4%) | 9,166 (48.6%) |
Education in Brighton
School Enrollment in Brighton
The most common levels of schooling among the 10,189 students in Brighton are college / undergraduate (2,717 | 26.7%), graduate / professional (1,683 | 16.5%), and high school (1,668 | 16.4%).
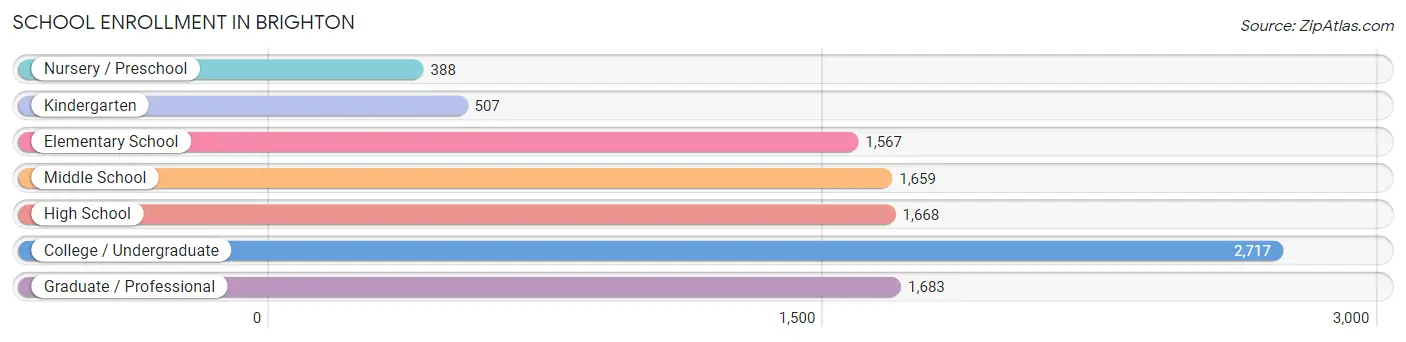
| School Level | # Students | % Students |
| Nursery / Preschool | 388 | 3.8% |
| Kindergarten | 507 | 5.0% |
| Elementary School | 1,567 | 15.4% |
| Middle School | 1,659 | 16.3% |
| High School | 1,668 | 16.4% |
| College / Undergraduate | 2,717 | 26.7% |
| Graduate / Professional | 1,683 | 16.5% |
| Total | 10,189 | 100.0% |
School Enrollment by Age by Funding Source in Brighton
Out of a total of 10,189 students who are enrolled in schools in Brighton, 3,077 (30.2%) attend a private institution, while the remaining 7,112 (69.8%) are enrolled in public schools. The age group of 25 to 34 year olds has the highest likelihood of being enrolled in private schools, with 896 (75.2% in the age bracket) enrolled. Conversely, the age group of 15 to 17 year olds has the lowest likelihood of being enrolled in a private school, with 1,114 (91.6% in the age bracket) attending a public institution.
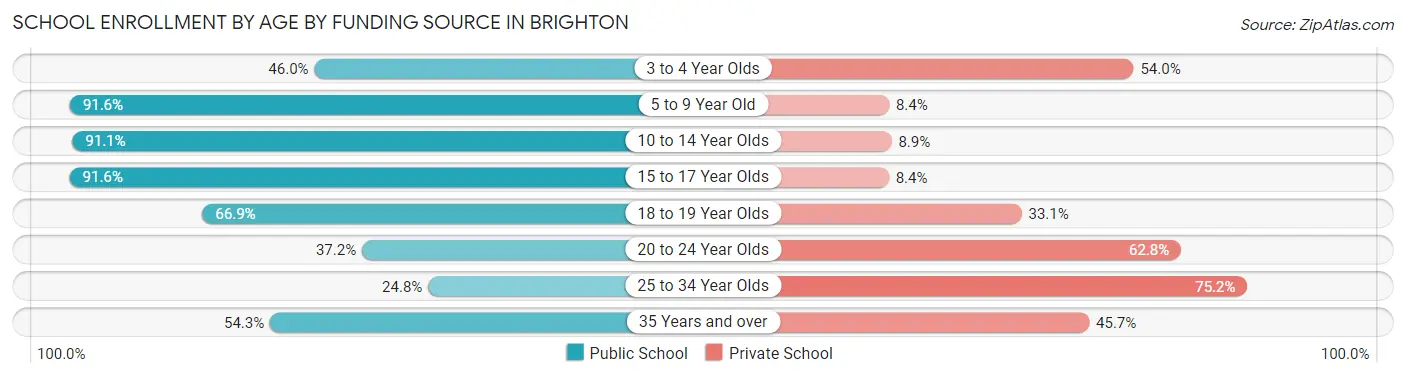
| Age Bracket | Public School | Private School |
| 3 to 4 Year Olds | 133 (46.0%) | 156 (54.0%) |
| 5 to 9 Year Old | 1,942 (91.6%) | 179 (8.4%) |
| 10 to 14 Year Olds | 1,862 (91.1%) | 182 (8.9%) |
| 15 to 17 Year Olds | 1,114 (91.6%) | 102 (8.4%) |
| 18 to 19 Year Olds | 985 (66.9%) | 488 (33.1%) |
| 20 to 24 Year Olds | 498 (37.2%) | 842 (62.8%) |
| 25 to 34 Year Olds | 296 (24.8%) | 896 (75.2%) |
| 35 Years and over | 279 (54.3%) | 235 (45.7%) |
| Total | 7,112 (69.8%) | 3,077 (30.2%) |
Educational Attainment by Field of Study in Brighton
Business (2,429 | 12.6%), education (1,934 | 10.0%), social sciences (1,710 | 8.9%), bio, nature & agricultural (1,643 | 8.5%), and engineering (1,605 | 8.3%) are the most common fields of study among 19,256 individuals in Brighton who have obtained a bachelor's degree or higher.
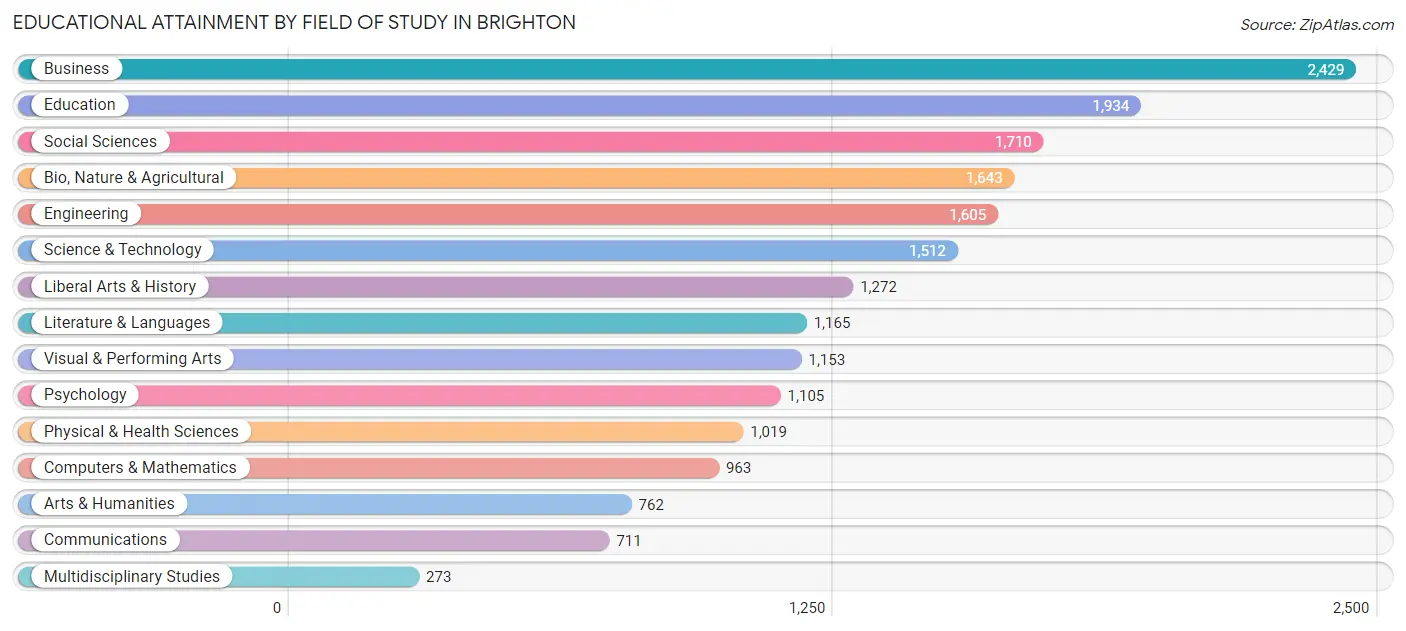
| Field of Study | # Graduates | % Graduates |
| Computers & Mathematics | 963 | 5.0% |
| Bio, Nature & Agricultural | 1,643 | 8.5% |
| Physical & Health Sciences | 1,019 | 5.3% |
| Psychology | 1,105 | 5.7% |
| Social Sciences | 1,710 | 8.9% |
| Engineering | 1,605 | 8.3% |
| Multidisciplinary Studies | 273 | 1.4% |
| Science & Technology | 1,512 | 7.9% |
| Business | 2,429 | 12.6% |
| Education | 1,934 | 10.0% |
| Literature & Languages | 1,165 | 6.0% |
| Liberal Arts & History | 1,272 | 6.6% |
| Visual & Performing Arts | 1,153 | 6.0% |
| Communications | 711 | 3.7% |
| Arts & Humanities | 762 | 4.0% |
| Total | 19,256 | 100.0% |
Transportation & Commute in Brighton
Vehicle Availability by Sex in Brighton
The most prevalent vehicle ownership categories in Brighton are males with 2 vehicles (5,192, accounting for 54.9%) and females with 2 vehicles (4,298, making up 59.4%).
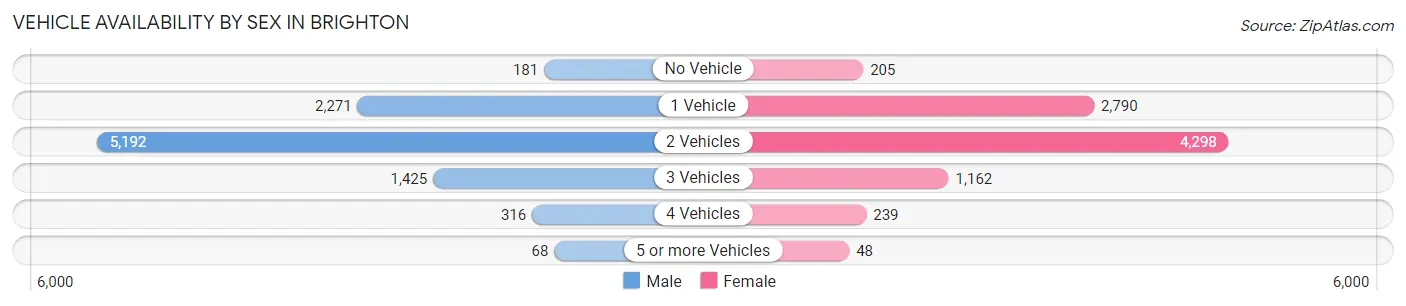
| Vehicles Available | Male | Female |
| No Vehicle | 181 (1.9%) | 205 (2.4%) |
| 1 Vehicle | 2,271 (24.0%) | 2,790 (31.9%) |
| 2 Vehicles | 5,192 (54.9%) | 4,298 (49.2%) |
| 3 Vehicles | 1,425 (15.1%) | 1,162 (13.3%) |
| 4 Vehicles | 316 (3.3%) | 239 (2.7%) |
| 5 or more Vehicles | 68 (0.7%) | 48 (0.5%) |
| Total | 9,453 (100.0%) | 8,742 (100.0%) |
Commute Time in Brighton
The most frequently occuring commute durations in Brighton are 10 to 14 minutes (4,403 commuters, 28.7%), 15 to 19 minutes (4,097 commuters, 26.7%), and 20 to 24 minutes (2,425 commuters, 15.8%).
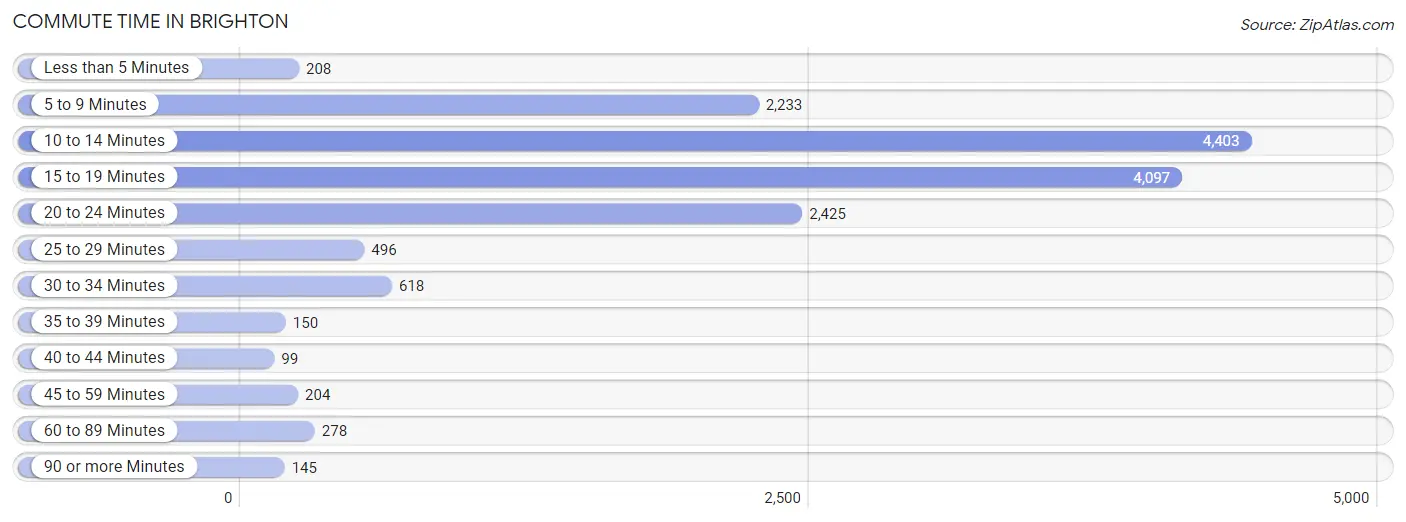
| Commute Time | # Commuters | % Commuters |
| Less than 5 Minutes | 208 | 1.3% |
| 5 to 9 Minutes | 2,233 | 14.5% |
| 10 to 14 Minutes | 4,403 | 28.7% |
| 15 to 19 Minutes | 4,097 | 26.7% |
| 20 to 24 Minutes | 2,425 | 15.8% |
| 25 to 29 Minutes | 496 | 3.2% |
| 30 to 34 Minutes | 618 | 4.0% |
| 35 to 39 Minutes | 150 | 1.0% |
| 40 to 44 Minutes | 99 | 0.6% |
| 45 to 59 Minutes | 204 | 1.3% |
| 60 to 89 Minutes | 278 | 1.8% |
| 90 or more Minutes | 145 | 0.9% |
Commute Time by Sex in Brighton
The most common commute times in Brighton are 15 to 19 minutes (2,227 commuters, 28.4%) for males and 10 to 14 minutes (2,429 commuters, 32.3%) for females.
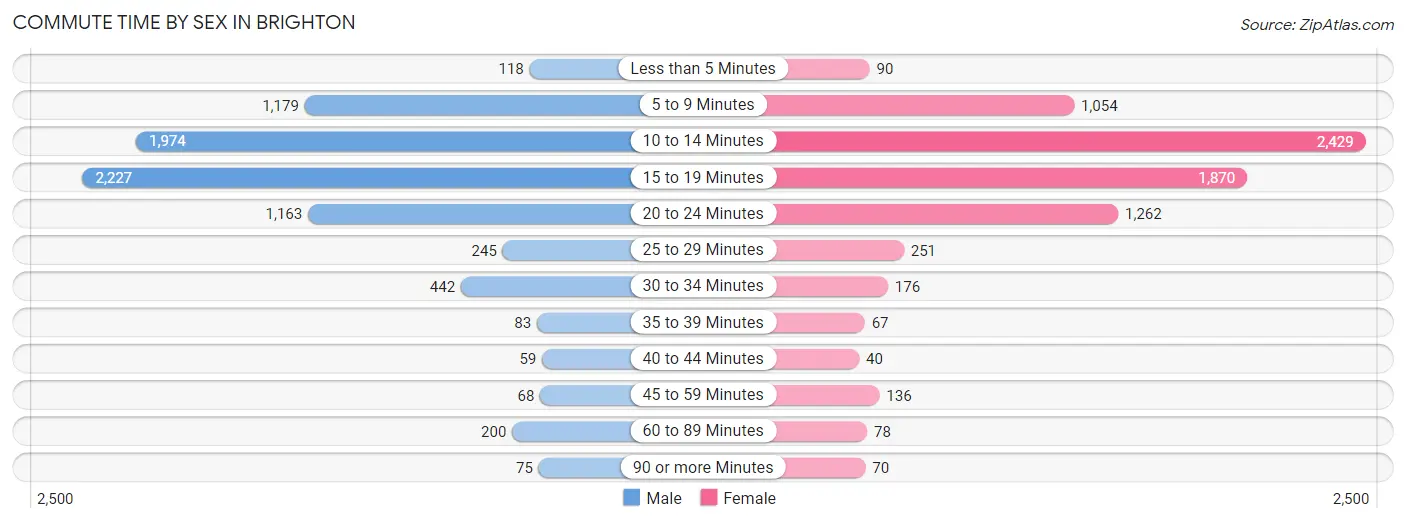
| Commute Time | Male | Female |
| Less than 5 Minutes | 118 (1.5%) | 90 (1.2%) |
| 5 to 9 Minutes | 1,179 (15.0%) | 1,054 (14.0%) |
| 10 to 14 Minutes | 1,974 (25.2%) | 2,429 (32.3%) |
| 15 to 19 Minutes | 2,227 (28.4%) | 1,870 (24.9%) |
| 20 to 24 Minutes | 1,163 (14.8%) | 1,262 (16.8%) |
| 25 to 29 Minutes | 245 (3.1%) | 251 (3.3%) |
| 30 to 34 Minutes | 442 (5.6%) | 176 (2.3%) |
| 35 to 39 Minutes | 83 (1.1%) | 67 (0.9%) |
| 40 to 44 Minutes | 59 (0.7%) | 40 (0.5%) |
| 45 to 59 Minutes | 68 (0.9%) | 136 (1.8%) |
| 60 to 89 Minutes | 200 (2.5%) | 78 (1.0%) |
| 90 or more Minutes | 75 (1.0%) | 70 (0.9%) |
Time of Departure to Work by Sex in Brighton
The most frequent times of departure to work in Brighton are 7:30 AM to 7:59 AM (1,493, 19.1%) for males and 7:30 AM to 7:59 AM (1,312, 17.4%) for females.
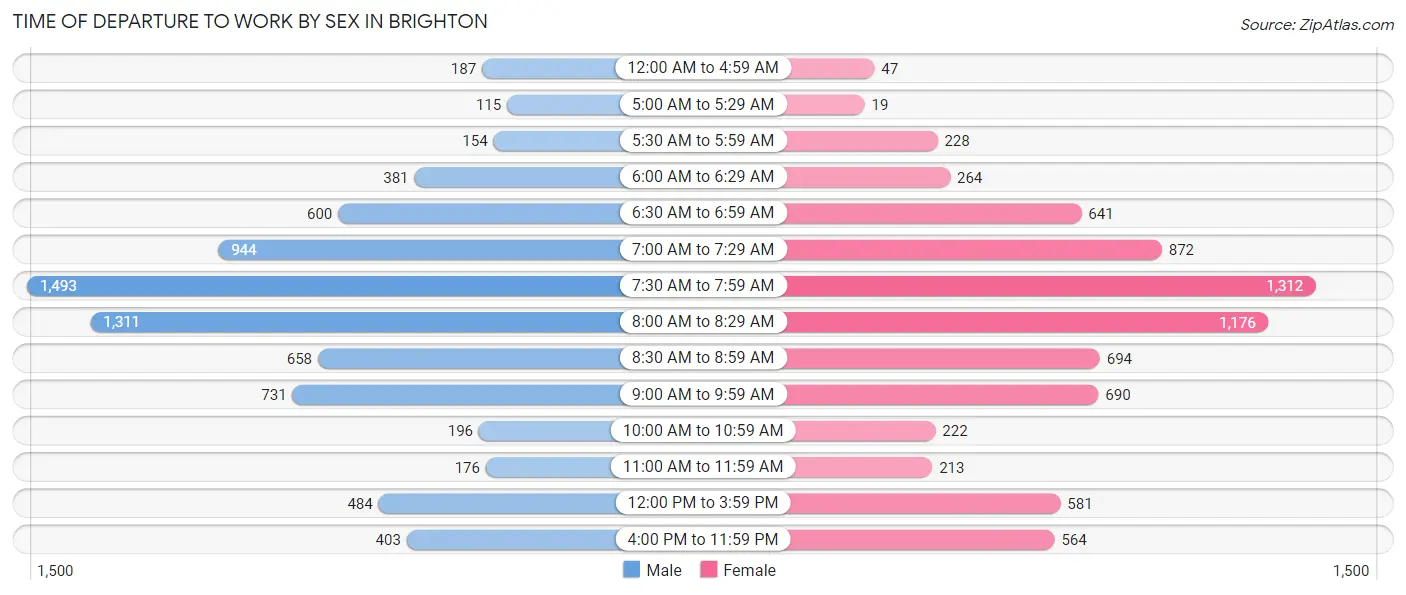
| Time of Departure | Male | Female |
| 12:00 AM to 4:59 AM | 187 (2.4%) | 47 (0.6%) |
| 5:00 AM to 5:29 AM | 115 (1.5%) | 19 (0.3%) |
| 5:30 AM to 5:59 AM | 154 (2.0%) | 228 (3.0%) |
| 6:00 AM to 6:29 AM | 381 (4.9%) | 264 (3.5%) |
| 6:30 AM to 6:59 AM | 600 (7.7%) | 641 (8.5%) |
| 7:00 AM to 7:29 AM | 944 (12.0%) | 872 (11.6%) |
| 7:30 AM to 7:59 AM | 1,493 (19.1%) | 1,312 (17.4%) |
| 8:00 AM to 8:29 AM | 1,311 (16.7%) | 1,176 (15.6%) |
| 8:30 AM to 8:59 AM | 658 (8.4%) | 694 (9.2%) |
| 9:00 AM to 9:59 AM | 731 (9.3%) | 690 (9.2%) |
| 10:00 AM to 10:59 AM | 196 (2.5%) | 222 (2.9%) |
| 11:00 AM to 11:59 AM | 176 (2.2%) | 213 (2.8%) |
| 12:00 PM to 3:59 PM | 484 (6.2%) | 581 (7.7%) |
| 4:00 PM to 11:59 PM | 403 (5.1%) | 564 (7.5%) |
| Total | 7,833 (100.0%) | 7,523 (100.0%) |
Housing Occupancy in Brighton
Occupancy by Ownership in Brighton
Of the total 15,929 dwellings in Brighton, owner-occupied units account for 8,855 (55.6%), while renter-occupied units make up 7,074 (44.4%).
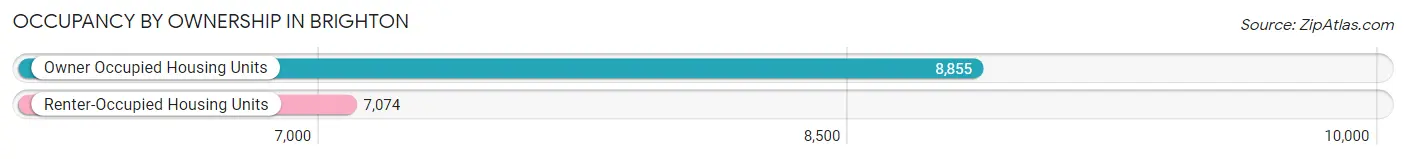
| Occupancy | # Housing Units | % Housing Units |
| Owner Occupied Housing Units | 8,855 | 55.6% |
| Renter-Occupied Housing Units | 7,074 | 44.4% |
| Total Occupied Housing Units | 15,929 | 100.0% |
Occupancy by Household Size in Brighton
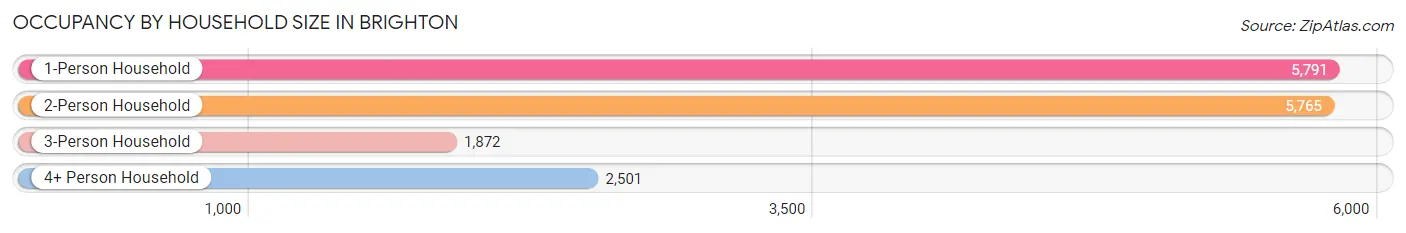
| Household Size | # Housing Units | % Housing Units |
| 1-Person Household | 5,791 | 36.4% |
| 2-Person Household | 5,765 | 36.2% |
| 3-Person Household | 1,872 | 11.7% |
| 4+ Person Household | 2,501 | 15.7% |
| Total Housing Units | 15,929 | 100.0% |
Occupancy by Ownership by Household Size in Brighton
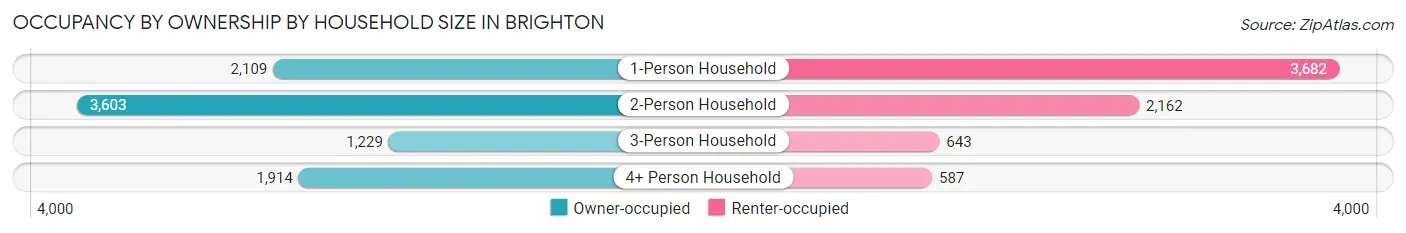
| Household Size | Owner-occupied | Renter-occupied |
| 1-Person Household | 2,109 (36.4%) | 3,682 (63.6%) |
| 2-Person Household | 3,603 (62.5%) | 2,162 (37.5%) |
| 3-Person Household | 1,229 (65.6%) | 643 (34.4%) |
| 4+ Person Household | 1,914 (76.5%) | 587 (23.5%) |
| Total Housing Units | 8,855 (55.6%) | 7,074 (44.4%) |
Occupancy by Educational Attainment in Brighton
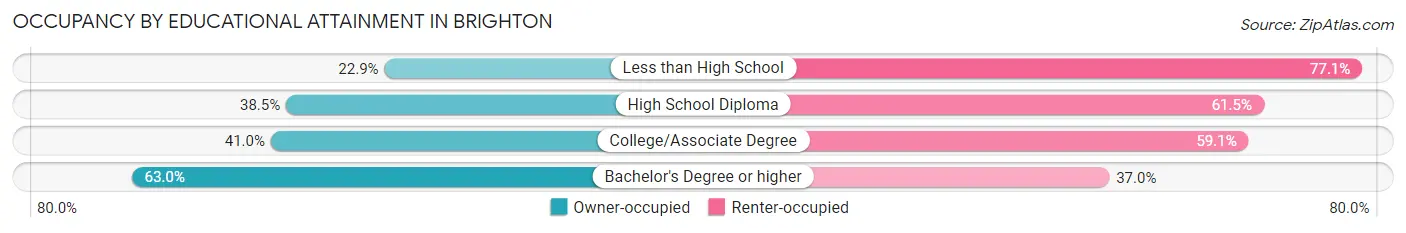
| Household Size | Owner-occupied | Renter-occupied |
| Less than High School | 97 (22.9%) | 326 (77.1%) |
| High School Diploma | 512 (38.5%) | 817 (61.5%) |
| College/Associate Degree | 1,279 (40.9%) | 1,844 (59.1%) |
| Bachelor's Degree or higher | 6,967 (63.0%) | 4,087 (37.0%) |
Occupancy by Age of Householder in Brighton
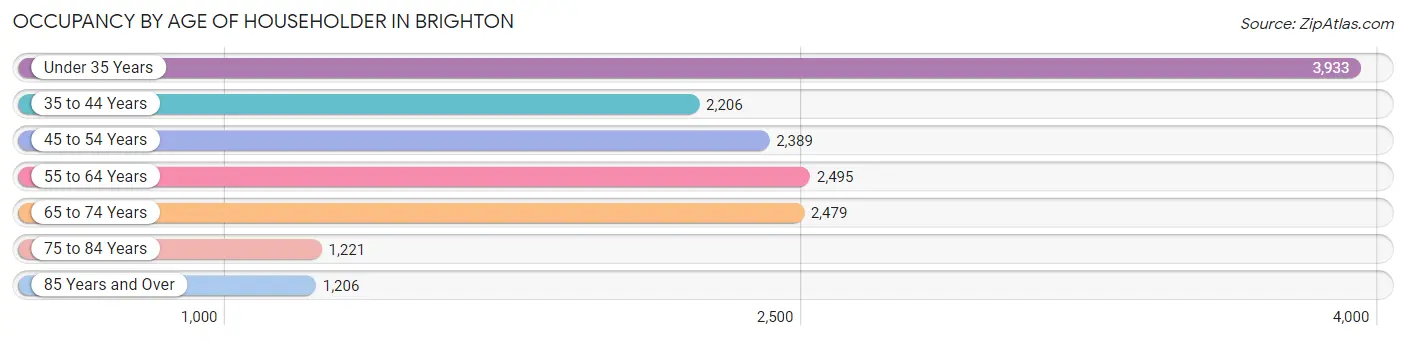
| Age Bracket | # Households | % Households |
| Under 35 Years | 3,933 | 24.7% |
| 35 to 44 Years | 2,206 | 13.9% |
| 45 to 54 Years | 2,389 | 15.0% |
| 55 to 64 Years | 2,495 | 15.7% |
| 65 to 74 Years | 2,479 | 15.6% |
| 75 to 84 Years | 1,221 | 7.7% |
| 85 Years and Over | 1,206 | 7.6% |
| Total | 15,929 | 100.0% |
Housing Finances in Brighton
Median Income by Occupancy in Brighton
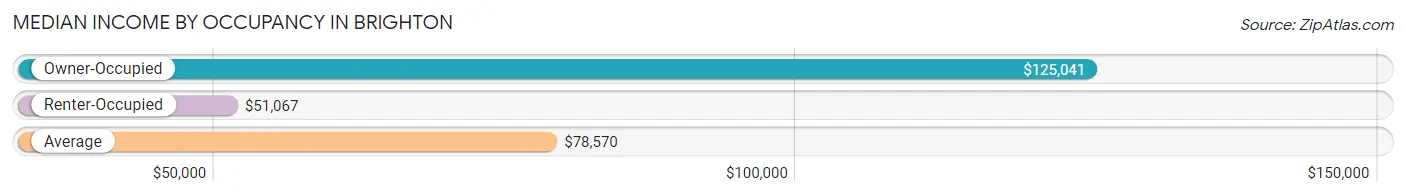
| Occupancy Type | # Households | Median Income |
| Owner-Occupied | 8,855 (55.6%) | $125,041 |
| Renter-Occupied | 7,074 (44.4%) | $51,067 |
| Average | 15,929 (100.0%) | $78,570 |
Occupancy by Householder Income Bracket in Brighton
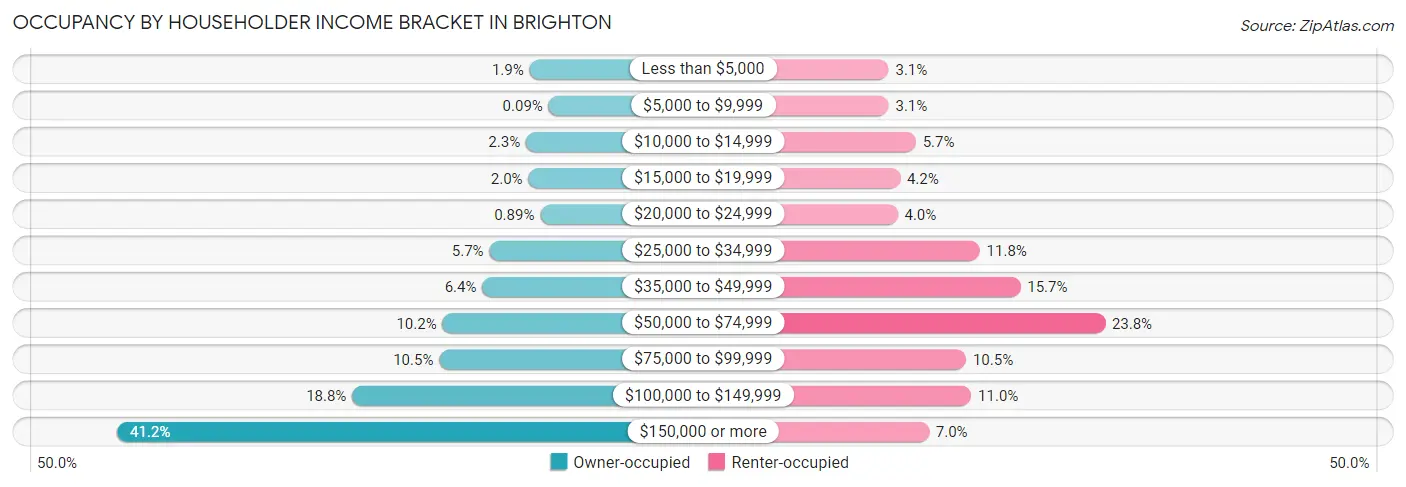
| Income Bracket | Owner-occupied | Renter-occupied |
| Less than $5,000 | 169 (1.9%) | 222 (3.1%) |
| $5,000 to $9,999 | 8 (0.1%) | 222 (3.1%) |
| $10,000 to $14,999 | 199 (2.2%) | 405 (5.7%) |
| $15,000 to $19,999 | 179 (2.0%) | 299 (4.2%) |
| $20,000 to $24,999 | 79 (0.9%) | 283 (4.0%) |
| $25,000 to $34,999 | 507 (5.7%) | 836 (11.8%) |
| $35,000 to $49,999 | 568 (6.4%) | 1,110 (15.7%) |
| $50,000 to $74,999 | 903 (10.2%) | 1,680 (23.7%) |
| $75,000 to $99,999 | 931 (10.5%) | 744 (10.5%) |
| $100,000 to $149,999 | 1,665 (18.8%) | 779 (11.0%) |
| $150,000 or more | 3,647 (41.2%) | 494 (7.0%) |
| Total | 8,855 (100.0%) | 7,074 (100.0%) |
Monthly Housing Cost Tiers in Brighton
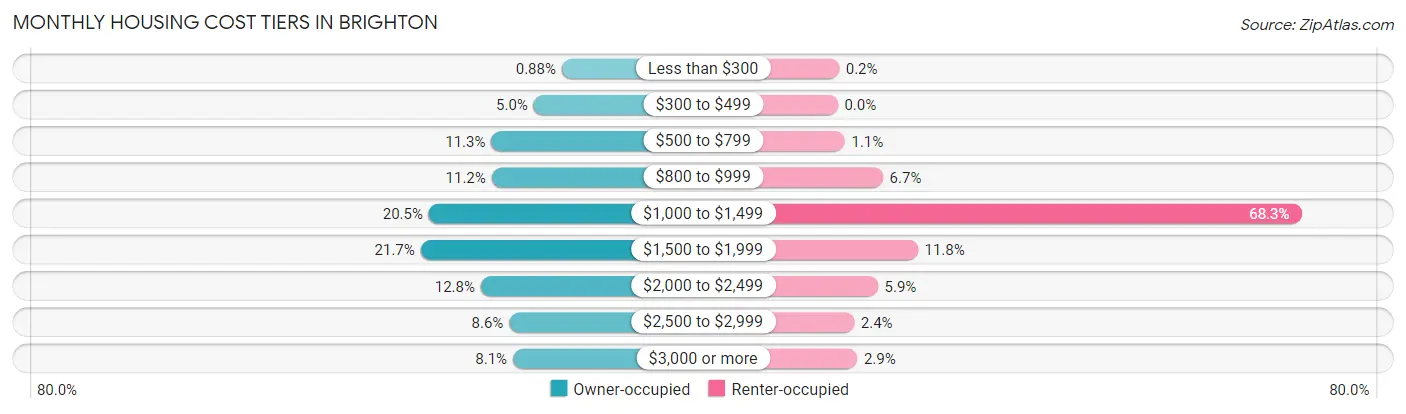
| Monthly Cost | Owner-occupied | Renter-occupied |
| Less than $300 | 78 (0.9%) | 14 (0.2%) |
| $300 to $499 | 444 (5.0%) | 0 (0.0%) |
| $500 to $799 | 997 (11.3%) | 74 (1.1%) |
| $800 to $999 | 993 (11.2%) | 471 (6.7%) |
| $1,000 to $1,499 | 1,812 (20.5%) | 4,833 (68.3%) |
| $1,500 to $1,999 | 1,919 (21.7%) | 835 (11.8%) |
| $2,000 to $2,499 | 1,134 (12.8%) | 419 (5.9%) |
| $2,500 to $2,999 | 763 (8.6%) | 171 (2.4%) |
| $3,000 or more | 715 (8.1%) | 204 (2.9%) |
| Total | 8,855 (100.0%) | 7,074 (100.0%) |
Physical Housing Characteristics in Brighton
Housing Structures in Brighton
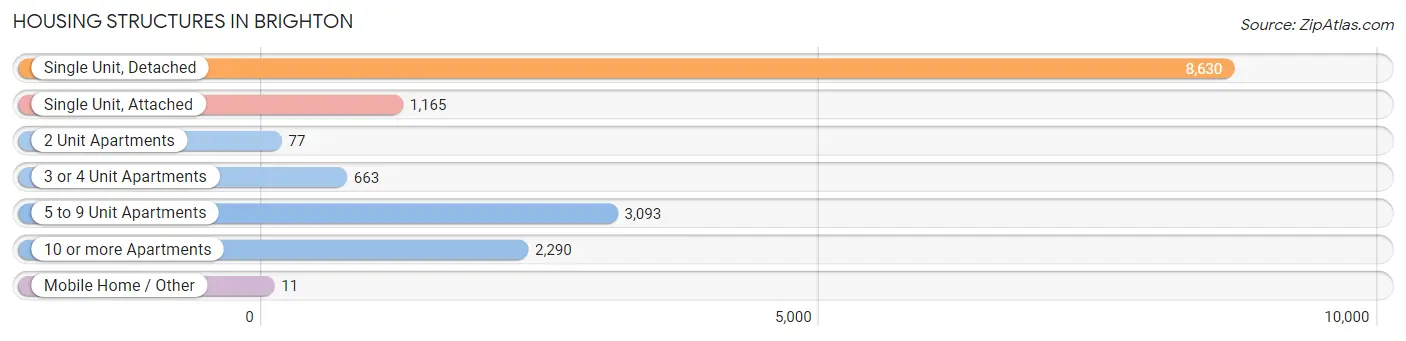
| Structure Type | # Housing Units | % Housing Units |
| Single Unit, Detached | 8,630 | 54.2% |
| Single Unit, Attached | 1,165 | 7.3% |
| 2 Unit Apartments | 77 | 0.5% |
| 3 or 4 Unit Apartments | 663 | 4.2% |
| 5 to 9 Unit Apartments | 3,093 | 19.4% |
| 10 or more Apartments | 2,290 | 14.4% |
| Mobile Home / Other | 11 | 0.1% |
| Total | 15,929 | 100.0% |
Housing Structures by Occupancy in Brighton
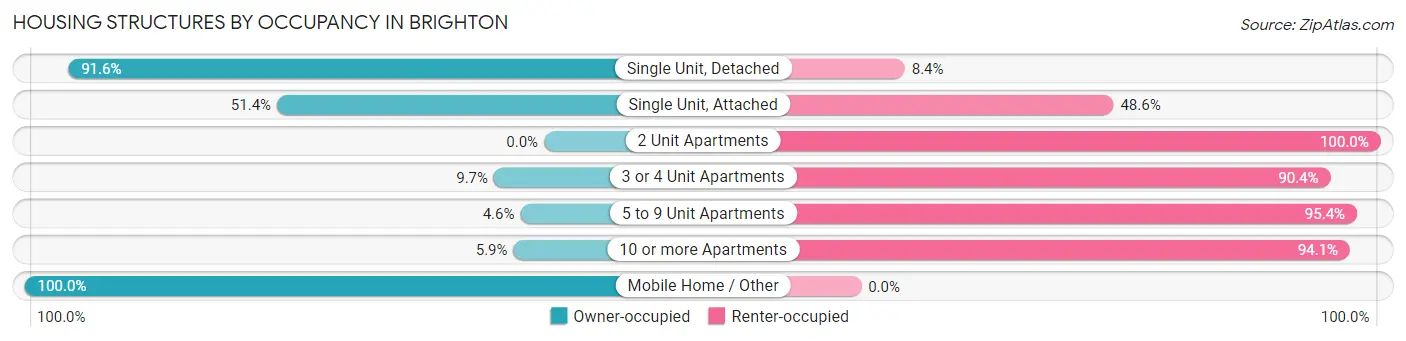
| Structure Type | Owner-occupied | Renter-occupied |
| Single Unit, Detached | 7,905 (91.6%) | 725 (8.4%) |
| Single Unit, Attached | 599 (51.4%) | 566 (48.6%) |
| 2 Unit Apartments | 0 (0.0%) | 77 (100.0%) |
| 3 or 4 Unit Apartments | 64 (9.7%) | 599 (90.3%) |
| 5 to 9 Unit Apartments | 141 (4.6%) | 2,952 (95.4%) |
| 10 or more Apartments | 135 (5.9%) | 2,155 (94.1%) |
| Mobile Home / Other | 11 (100.0%) | 0 (0.0%) |
| Total | 8,855 (55.6%) | 7,074 (44.4%) |
Housing Structures by Number of Rooms in Brighton
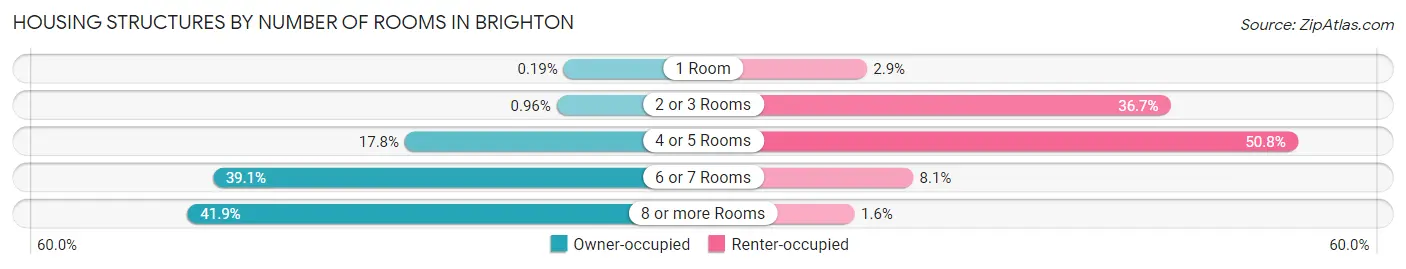
| Number of Rooms | Owner-occupied | Renter-occupied |
| 1 Room | 17 (0.2%) | 207 (2.9%) |
| 2 or 3 Rooms | 85 (1.0%) | 2,593 (36.7%) |
| 4 or 5 Rooms | 1,576 (17.8%) | 3,592 (50.8%) |
| 6 or 7 Rooms | 3,464 (39.1%) | 571 (8.1%) |
| 8 or more Rooms | 3,713 (41.9%) | 111 (1.6%) |
| Total | 8,855 (100.0%) | 7,074 (100.0%) |
Housing Structure by Heating Type in Brighton
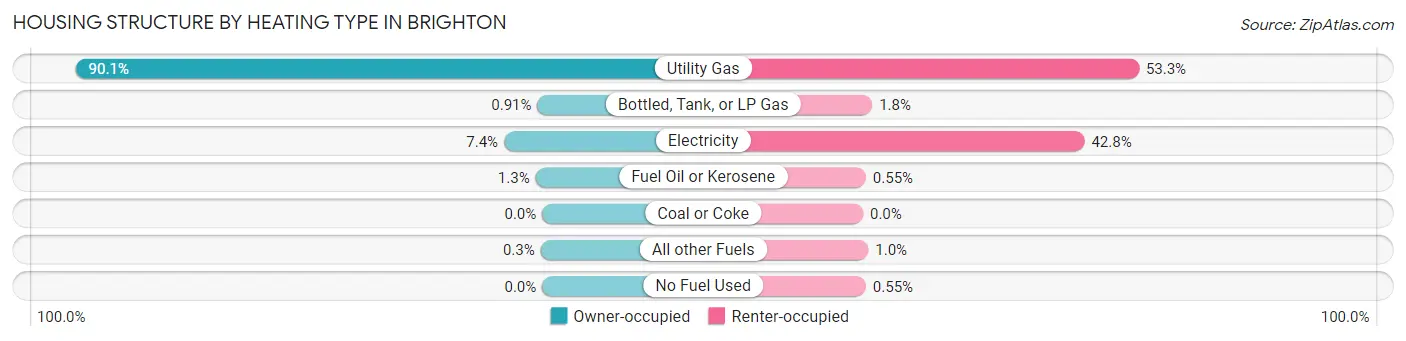
| Heating Type | Owner-occupied | Renter-occupied |
| Utility Gas | 7,981 (90.1%) | 3,771 (53.3%) |
| Bottled, Tank, or LP Gas | 81 (0.9%) | 125 (1.8%) |
| Electricity | 653 (7.4%) | 3,027 (42.8%) |
| Fuel Oil or Kerosene | 113 (1.3%) | 39 (0.5%) |
| Coal or Coke | 0 (0.0%) | 0 (0.0%) |
| All other Fuels | 27 (0.3%) | 73 (1.0%) |
| No Fuel Used | 0 (0.0%) | 39 (0.5%) |
| Total | 8,855 (100.0%) | 7,074 (100.0%) |
Household Vehicle Usage in Brighton
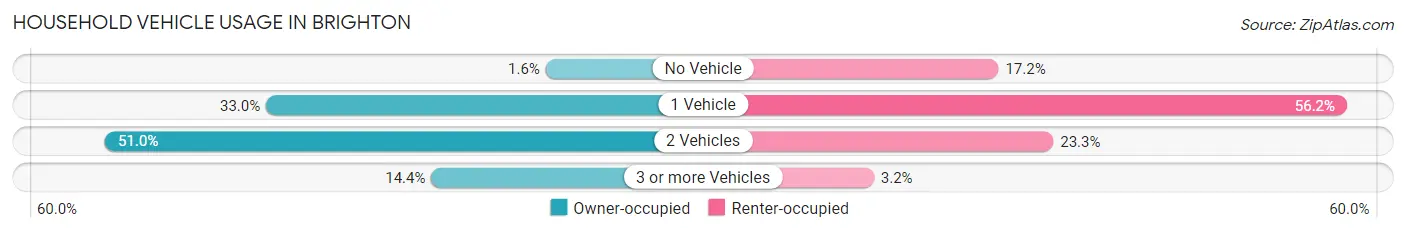
| Vehicles per Household | Owner-occupied | Renter-occupied |
| No Vehicle | 144 (1.6%) | 1,217 (17.2%) |
| 1 Vehicle | 2,918 (33.0%) | 3,977 (56.2%) |
| 2 Vehicles | 4,514 (51.0%) | 1,651 (23.3%) |
| 3 or more Vehicles | 1,279 (14.4%) | 229 (3.2%) |
| Total | 8,855 (100.0%) | 7,074 (100.0%) |
Real Estate & Mortgages in Brighton
Real Estate and Mortgage Overview in Brighton
| Characteristic | Without Mortgage | With Mortgage |
| Housing Units | 3,712 | 5,143 |
| Median Property Value | $233,500 | $239,300 |
| Median Household Income | $96,959 | $2,272 |
| Monthly Housing Costs | $898 | $703 |
| Real Estate Taxes | $6,631 | $35 |
Property Value by Mortgage Status in Brighton
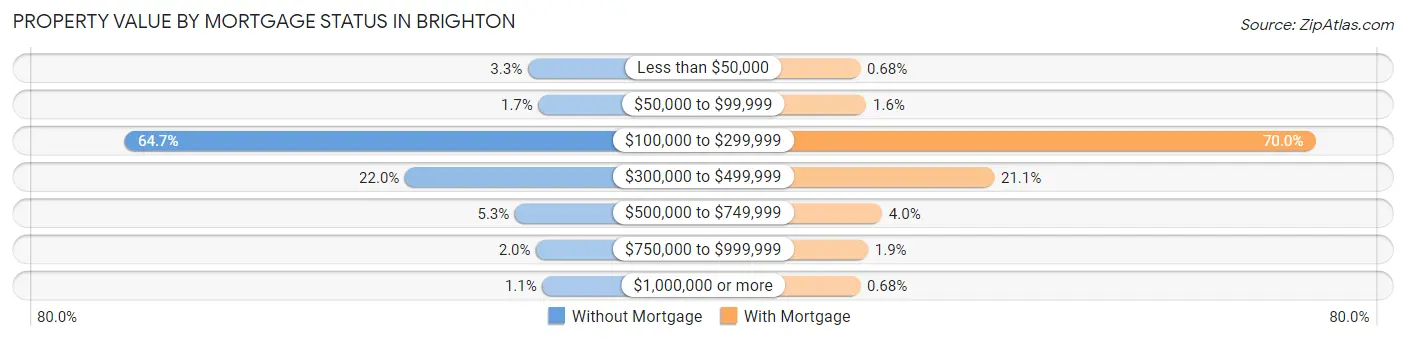
| Property Value | Without Mortgage | With Mortgage |
| Less than $50,000 | 122 (3.3%) | 35 (0.7%) |
| $50,000 to $99,999 | 62 (1.7%) | 83 (1.6%) |
| $100,000 to $299,999 | 2,401 (64.7%) | 3,602 (70.0%) |
| $300,000 to $499,999 | 817 (22.0%) | 1,085 (21.1%) |
| $500,000 to $749,999 | 195 (5.2%) | 207 (4.0%) |
| $750,000 to $999,999 | 75 (2.0%) | 96 (1.9%) |
| $1,000,000 or more | 40 (1.1%) | 35 (0.7%) |
| Total | 3,712 (100.0%) | 5,143 (100.0%) |
Household Income by Mortgage Status in Brighton
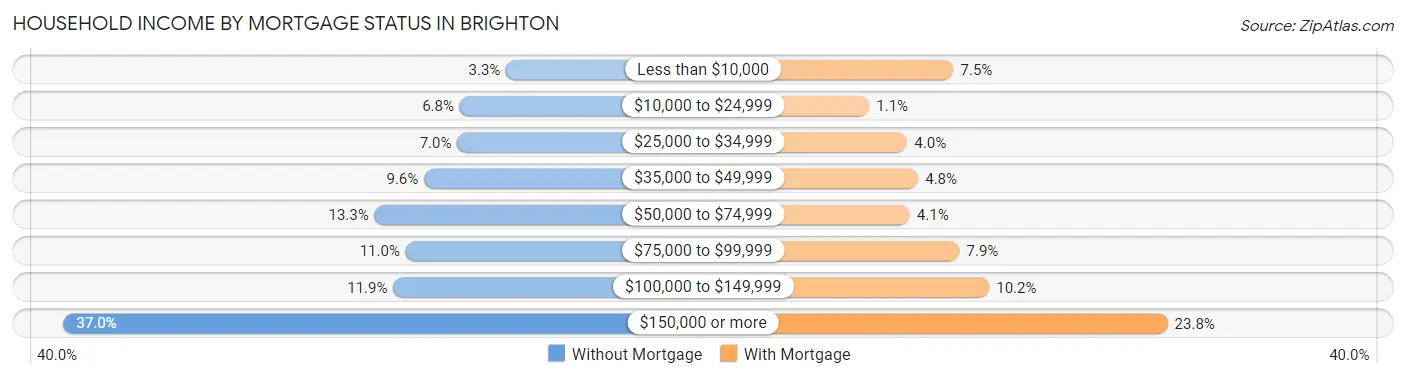
| Household Income | Without Mortgage | With Mortgage |
| Less than $10,000 | 123 (3.3%) | 384 (7.5%) |
| $10,000 to $24,999 | 254 (6.8%) | 54 (1.1%) |
| $25,000 to $34,999 | 261 (7.0%) | 203 (4.0%) |
| $35,000 to $49,999 | 355 (9.6%) | 246 (4.8%) |
| $50,000 to $74,999 | 495 (13.3%) | 213 (4.1%) |
| $75,000 to $99,999 | 407 (11.0%) | 408 (7.9%) |
| $100,000 to $149,999 | 442 (11.9%) | 524 (10.2%) |
| $150,000 or more | 1,375 (37.0%) | 1,223 (23.8%) |
| Total | 3,712 (100.0%) | 5,143 (100.0%) |
Property Value to Household Income Ratio in Brighton
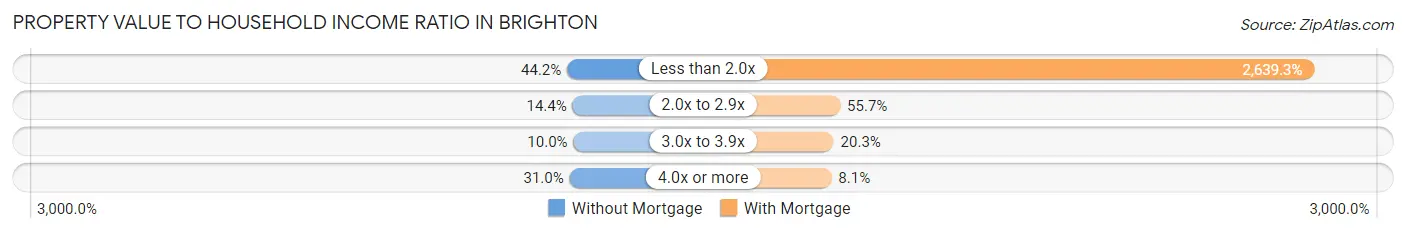
| Value-to-Income Ratio | Without Mortgage | With Mortgage |
| Less than 2.0x | 1,641 (44.2%) | 135,740 (2,639.3%) |
| 2.0x to 2.9x | 535 (14.4%) | 2,866 (55.7%) |
| 3.0x to 3.9x | 371 (10.0%) | 1,046 (20.3%) |
| 4.0x or more | 1,151 (31.0%) | 416 (8.1%) |
| Total | 3,712 (100.0%) | 5,143 (100.0%) |
Real Estate Taxes by Mortgage Status in Brighton
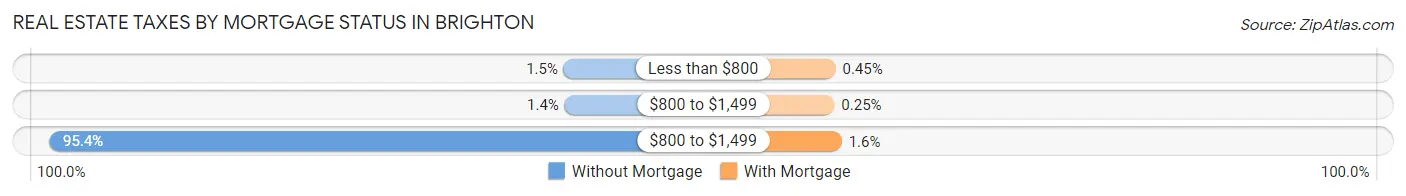
| Property Taxes | Without Mortgage | With Mortgage |
| Less than $800 | 56 (1.5%) | 23 (0.4%) |
| $800 to $1,499 | 50 (1.3%) | 13 (0.3%) |
| $800 to $1,499 | 3,540 (95.4%) | 82 (1.6%) |
| Total | 3,712 (100.0%) | 5,143 (100.0%) |
Health & Disability in Brighton
Health Insurance Coverage by Age in Brighton
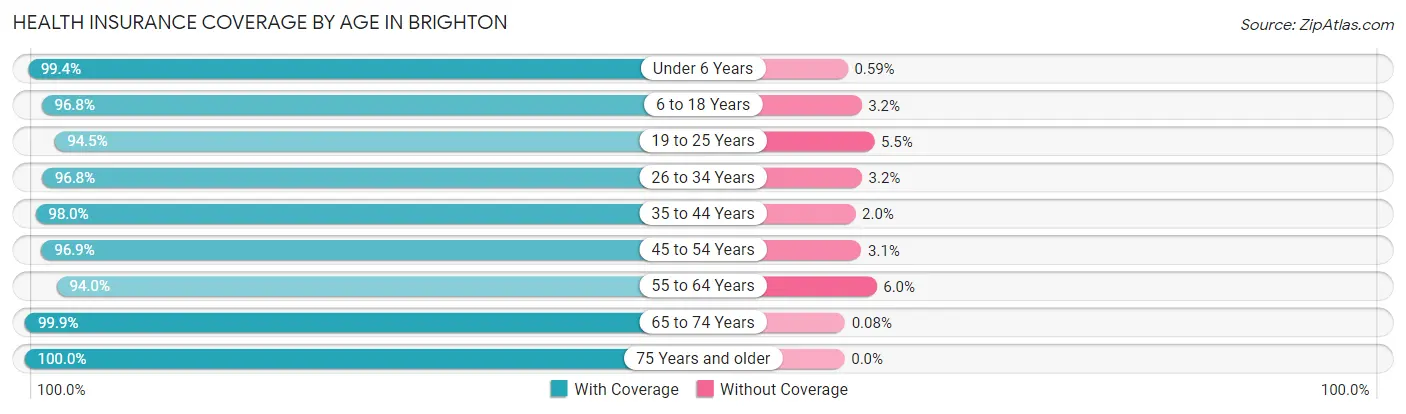
| Age Bracket | With Coverage | Without Coverage |
| Under 6 Years | 1,691 (99.4%) | 10 (0.6%) |
| 6 to 18 Years | 5,657 (96.8%) | 185 (3.2%) |
| 19 to 25 Years | 3,652 (94.5%) | 214 (5.5%) |
| 26 to 34 Years | 4,640 (96.8%) | 155 (3.2%) |
| 35 to 44 Years | 4,092 (98.0%) | 84 (2.0%) |
| 45 to 54 Years | 3,930 (96.9%) | 127 (3.1%) |
| 55 to 64 Years | 4,264 (94.0%) | 270 (6.0%) |
| 65 to 74 Years | 3,571 (99.9%) | 3 (0.1%) |
| 75 Years and older | 3,249 (100.0%) | 0 (0.0%) |
| Total | 34,746 (97.1%) | 1,048 (2.9%) |
Health Insurance Coverage by Citizenship Status in Brighton
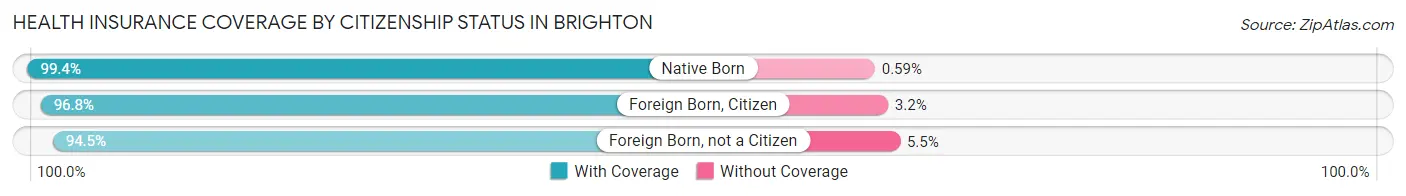
| Citizenship Status | With Coverage | Without Coverage |
| Native Born | 1,691 (99.4%) | 10 (0.6%) |
| Foreign Born, Citizen | 5,657 (96.8%) | 185 (3.2%) |
| Foreign Born, not a Citizen | 3,652 (94.5%) | 214 (5.5%) |
Health Insurance Coverage by Household Income in Brighton
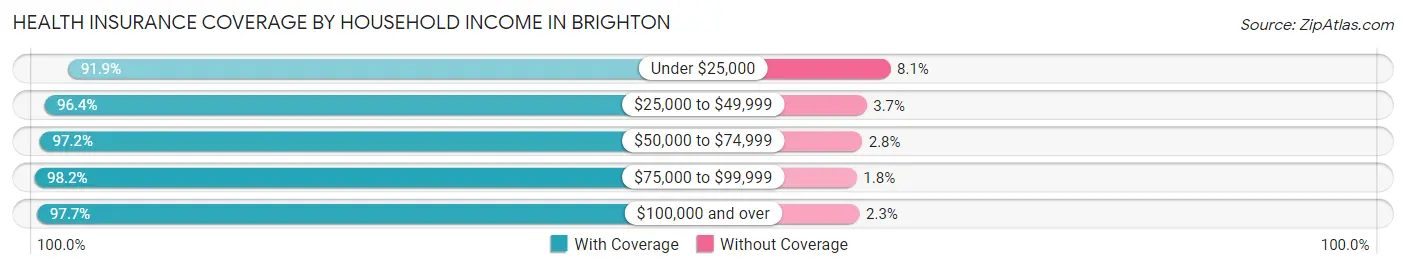
| Household Income | With Coverage | Without Coverage |
| Under $25,000 | 2,720 (91.9%) | 240 (8.1%) |
| $25,000 to $49,999 | 4,467 (96.4%) | 169 (3.6%) |
| $50,000 to $74,999 | 4,706 (97.2%) | 136 (2.8%) |
| $75,000 to $99,999 | 3,227 (98.2%) | 59 (1.8%) |
| $100,000 and over | 18,216 (97.7%) | 431 (2.3%) |
Public vs Private Health Insurance Coverage by Age in Brighton
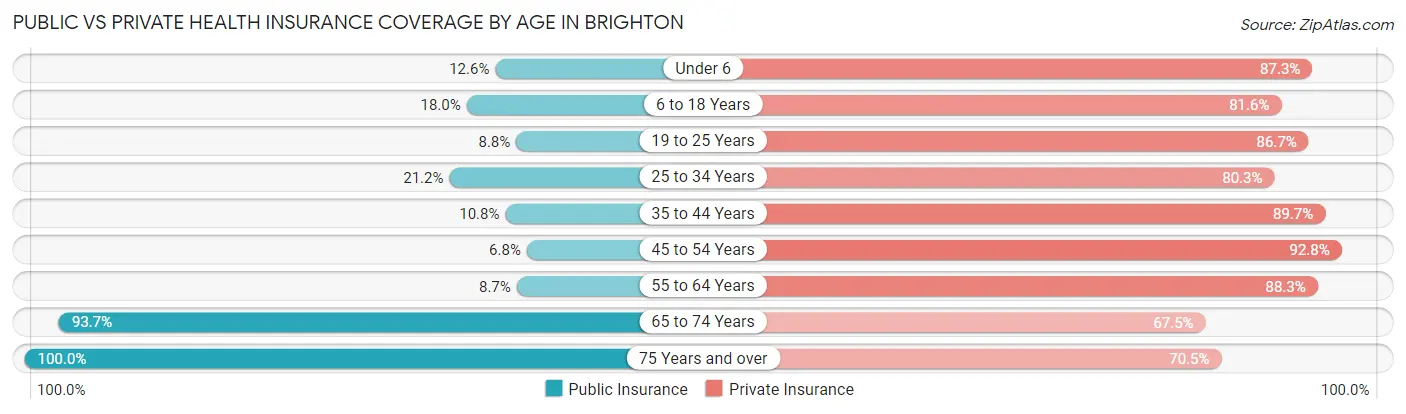
| Age Bracket | Public Insurance | Private Insurance |
| Under 6 | 215 (12.6%) | 1,485 (87.3%) |
| 6 to 18 Years | 1,049 (18.0%) | 4,765 (81.6%) |
| 19 to 25 Years | 339 (8.8%) | 3,350 (86.7%) |
| 25 to 34 Years | 1,015 (21.2%) | 3,849 (80.3%) |
| 35 to 44 Years | 450 (10.8%) | 3,746 (89.7%) |
| 45 to 54 Years | 276 (6.8%) | 3,763 (92.7%) |
| 55 to 64 Years | 393 (8.7%) | 4,004 (88.3%) |
| 65 to 74 Years | 3,347 (93.6%) | 2,412 (67.5%) |
| 75 Years and over | 3,249 (100.0%) | 2,289 (70.5%) |
| Total | 10,333 (28.9%) | 29,663 (82.9%) |
Disability Status by Sex by Age in Brighton
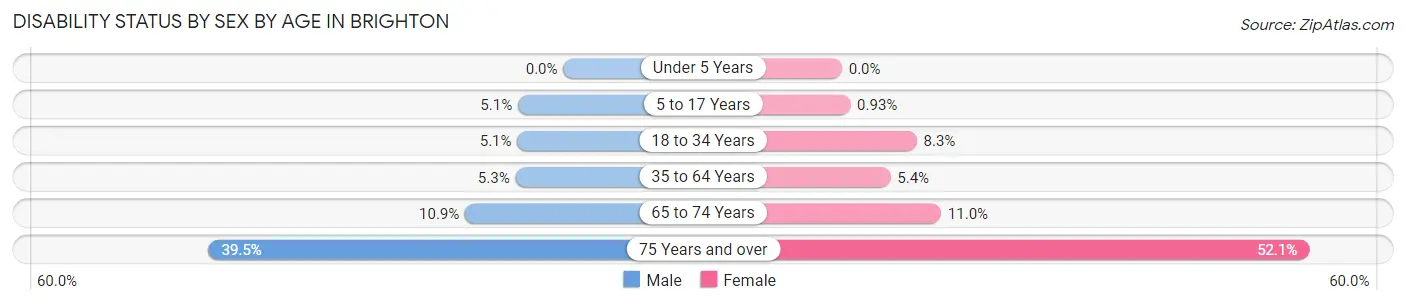
| Age Bracket | Male | Female |
| Under 5 Years | 0 (0.0%) | 0 (0.0%) |
| 5 to 17 Years | 148 (5.1%) | 24 (0.9%) |
| 18 to 34 Years | 242 (5.1%) | 387 (8.3%) |
| 35 to 64 Years | 331 (5.3%) | 355 (5.4%) |
| 65 to 74 Years | 179 (10.9%) | 214 (11.0%) |
| 75 Years and over | 426 (39.5%) | 1,130 (52.0%) |
Disability Class by Sex by Age in Brighton
Disability Class: Hearing Difficulty
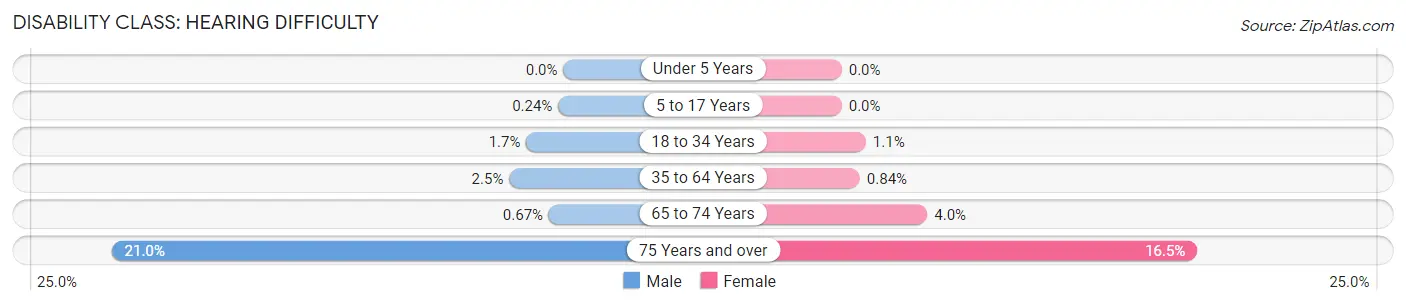
| Age Bracket | Male | Female |
| Under 5 Years | 0 (0.0%) | 0 (0.0%) |
| 5 to 17 Years | 7 (0.2%) | 0 (0.0%) |
| 18 to 34 Years | 81 (1.7%) | 52 (1.1%) |
| 35 to 64 Years | 156 (2.5%) | 55 (0.8%) |
| 65 to 74 Years | 11 (0.7%) | 77 (4.0%) |
| 75 Years and over | 226 (21.0%) | 358 (16.5%) |
Disability Class: Vision Difficulty
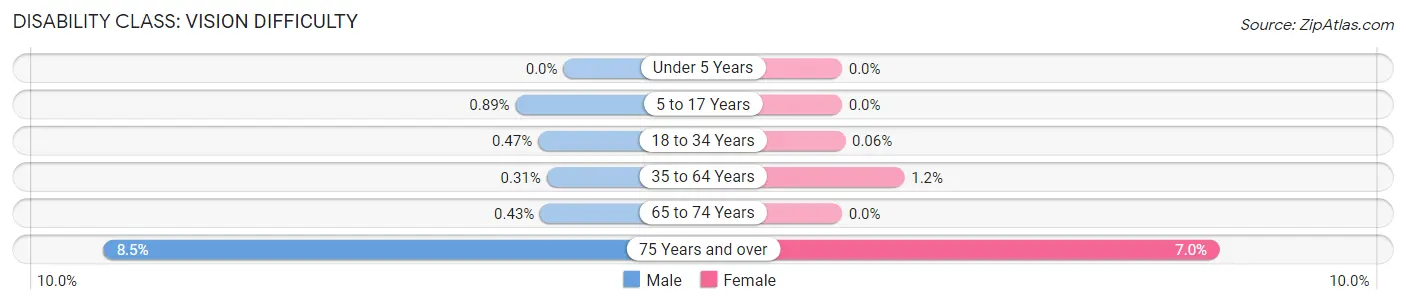
| Age Bracket | Male | Female |
| Under 5 Years | 0 (0.0%) | 0 (0.0%) |
| 5 to 17 Years | 26 (0.9%) | 0 (0.0%) |
| 18 to 34 Years | 22 (0.5%) | 3 (0.1%) |
| 35 to 64 Years | 19 (0.3%) | 76 (1.2%) |
| 65 to 74 Years | 7 (0.4%) | 0 (0.0%) |
| 75 Years and over | 92 (8.5%) | 152 (7.0%) |
Disability Class: Cognitive Difficulty
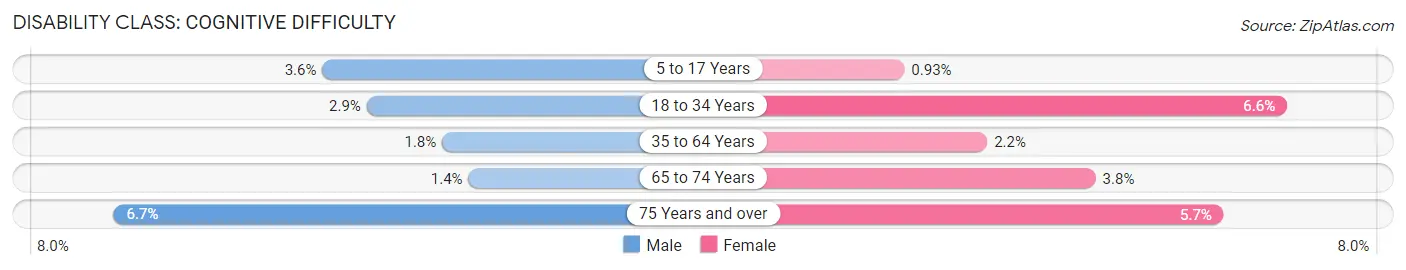
| Age Bracket | Male | Female |
| 5 to 17 Years | 105 (3.6%) | 24 (0.9%) |
| 18 to 34 Years | 138 (2.9%) | 307 (6.6%) |
| 35 to 64 Years | 112 (1.8%) | 142 (2.2%) |
| 65 to 74 Years | 23 (1.4%) | 73 (3.8%) |
| 75 Years and over | 72 (6.7%) | 123 (5.7%) |
Disability Class: Ambulatory Difficulty
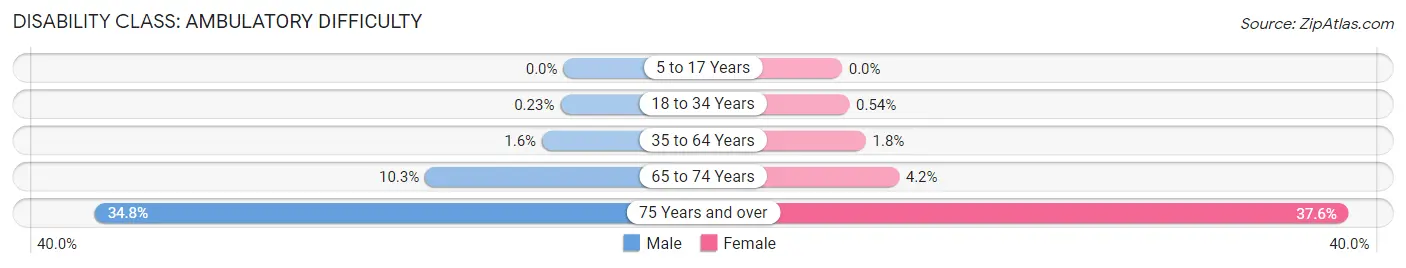
| Age Bracket | Male | Female |
| 5 to 17 Years | 0 (0.0%) | 0 (0.0%) |
| 18 to 34 Years | 11 (0.2%) | 25 (0.5%) |
| 35 to 64 Years | 99 (1.6%) | 116 (1.8%) |
| 65 to 74 Years | 168 (10.3%) | 82 (4.2%) |
| 75 Years and over | 375 (34.8%) | 817 (37.6%) |
Disability Class: Self-Care Difficulty
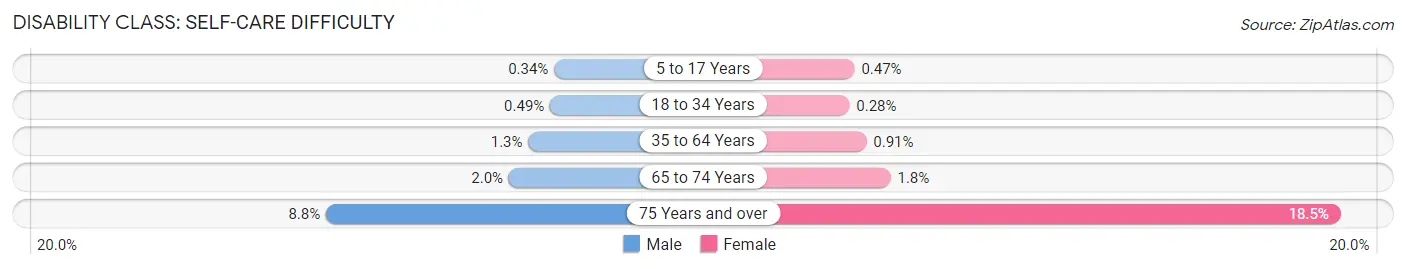
| Age Bracket | Male | Female |
| 5 to 17 Years | 10 (0.3%) | 12 (0.5%) |
| 18 to 34 Years | 23 (0.5%) | 13 (0.3%) |
| 35 to 64 Years | 81 (1.3%) | 60 (0.9%) |
| 65 to 74 Years | 33 (2.0%) | 35 (1.8%) |
| 75 Years and over | 95 (8.8%) | 402 (18.5%) |
Technology Access in Brighton
Computing Device Access in Brighton
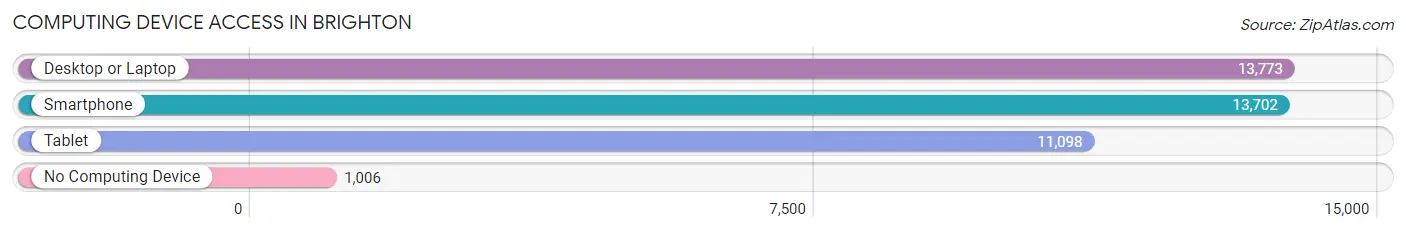
| Device Type | # Households | % Households |
| Desktop or Laptop | 13,773 | 86.5% |
| Smartphone | 13,702 | 86.0% |
| Tablet | 11,098 | 69.7% |
| No Computing Device | 1,006 | 6.3% |
| Total | 15,929 | 100.0% |
Internet Access in Brighton
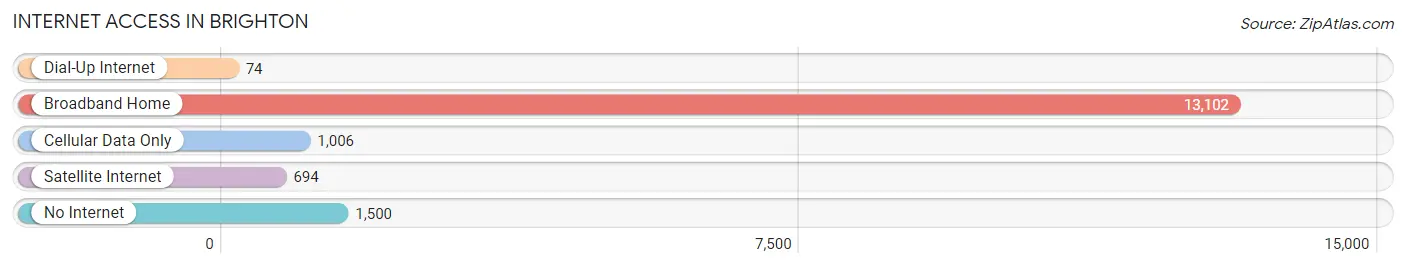
| Internet Type | # Households | % Households |
| Dial-Up Internet | 74 | 0.5% |
| Broadband Home | 13,102 | 82.3% |
| Cellular Data Only | 1,006 | 6.3% |
| Satellite Internet | 694 | 4.4% |
| No Internet | 1,500 | 9.4% |
| Total | 15,929 | 100.0% |
Brighton Summary
Brighton is a town located in Monroe County, New York, United States. It is a suburb of Rochester, located just south of the city. As of the 2010 census, the town had a total population of 36,609.
History
The area that is now Brighton was originally part of the Town of Northampton, which was established in 1812. In 1814, the Town of Brighton was formed from the western part of Northampton. The town was named after Brighton, England.
In 1817, the Town of Brighton was divided into two towns, Brighton and Pittsford. In 1845, the Town of Brighton was further divided into the Town of Brighton and the Town of East Rochester.
In 1853, the Town of Brighton was divided into the Town of Brighton and the Town of Irondequoit. In 1855, the Town of Brighton was further divided into the Town of Brighton and the Town of Henrietta.
In 1873, the Town of Brighton was divided into the Town of Brighton and the Town of Brighton Heights. In 1875, the Town of Brighton was further divided into the Town of Brighton and the Town of Brighton Park.
In 1887, the Town of Brighton was divided into the Town of Brighton and the Town of Brighton Beach. In 1895, the Town of Brighton was further divided into the Town of Brighton and the Town of Brighton Park.
Geography
Brighton is located in the western part of Monroe County, just south of the City of Rochester. It is bordered by the towns of Pittsford to the north, Henrietta to the east, Irondequoit to the southeast, and East Rochester to the south.
The town has a total area of 24.2 square miles, of which 24.1 square miles is land and 0.1 square miles is water. The Genesee River flows through the town, and there are several small lakes and ponds.
Economy
The economy of Brighton is largely based on services and retail. The town is home to several large employers, including Wegmans, University of Rochester, and Rochester Institute of Technology.
The town also has a number of small businesses, including restaurants, shops, and professional services.
Demographics
As of the 2010 census, there were 36,609 people, 14,945 households, and 9,845 families living in the town. The population density was 1,517.3 people per square mile.
The racial makeup of the town was 87.2% White, 5.7% African American, 0.3% Native American, 3.3% Asian, 0.1% Pacific Islander, 1.2% from other races, and 2.4% from two or more races. Hispanic or Latino of any race were 4.2% of the population.
The median income for a household in the town was $63,945, and the median income for a family was $77,945. The per capita income for the town was $31,945. About 4.2% of families and 6.7% of the population were below the poverty line, including 8.2% of those under age 18 and 4.2% of those age 65 or over.
Common Questions
What is Per Capita Income in Brighton?
Per Capita income in Brighton is $56,430.
What is the Median Family Income in Brighton?
Median Family Income in Brighton is $126,042.
What is the Median Household income in Brighton?
Median Household Income in Brighton is $78,570.
What is Income or Wage Gap in Brighton?
Income or Wage Gap in Brighton is 25.4%.
Women in Brighton earn 74.6 cents for every dollar earned by a man.
What is Inequality or Gini Index in Brighton?
Inequality or Gini Index in Brighton is 0.52.
What is the Total Population of Brighton?
Total Population of Brighton is 36,819.
What is the Total Male Population of Brighton?
Total Male Population of Brighton is 17,775.
What is the Total Female Population of Brighton?
Total Female Population of Brighton is 19,044.
What is the Ratio of Males per 100 Females in Brighton?
There are 93.34 Males per 100 Females in Brighton.
What is the Ratio of Females per 100 Males in Brighton?
There are 107.14 Females per 100 Males in Brighton.
What is the Median Population Age in Brighton?
Median Population Age in Brighton is 39.1 Years.
What is the Average Family Size in Brighton
Average Family Size in Brighton is 2.9 People.
What is the Average Household Size in Brighton
Average Household Size in Brighton is 2.2 People.
How Large is the Labor Force in Brighton?
There are 19,708 People in the Labor Forcein in Brighton.
What is the Percentage of People in the Labor Force in Brighton?
64.0% of People are in the Labor Force in Brighton.
What is the Unemployment Rate in Brighton?
Unemployment Rate in Brighton is 4.4%.