Kingwood, WV Map & Demographics
Kingwood Map
Kingwood Overview
$33,066
PER CAPITA INCOME
$99,871
AVG FAMILY INCOME
$74,961
AVG HOUSEHOLD INCOME
30.3%
WAGE / INCOME GAP [ % ]
69.7¢/ $1
WAGE / INCOME GAP [ $ ]
0.38
INEQUALITY / GINI INDEX
2,997
TOTAL POPULATION
1,343
MALE POPULATION
1,654
FEMALE POPULATION
81.20
MALES / 100 FEMALES
123.16
FEMALES / 100 MALES
40.0
MEDIAN AGE
3.0
AVG FAMILY SIZE
2.4
AVG HOUSEHOLD SIZE
1,464
LABOR FORCE [ PEOPLE ]
62.7%
PERCENT IN LABOR FORCE
7.4%
UNEMPLOYMENT RATE
Kingwood Zip Codes
Kingwood Area Codes
Income in Kingwood
Income Overview in Kingwood
Per Capita Income in Kingwood is $33,066, while median incomes of families and households are $99,871 and $74,961 respectively.
| Characteristic | Number | Measure |
| Per Capita Income | 2,997 | $33,066 |
| Median Family Income | 837 | $99,871 |
| Mean Family Income | 837 | $98,671 |
| Median Household Income | 1,211 | $74,961 |
| Mean Household Income | 1,211 | $81,029 |
| Income Deficit | 837 | $0 |
| Wage / Income Gap (%) | 2,997 | 30.31% |
| Wage / Income Gap ($) | 2,997 | 69.69¢ per $1 |
| Gini / Inequality Index | 2,997 | 0.38 |
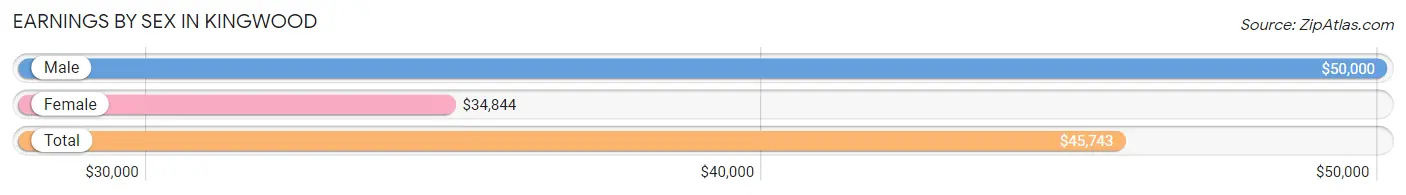
Earnings by Sex in Kingwood
Average Earnings in Kingwood are $45,743, $50,000 for men and $34,844 for women, a difference of 30.3%.
| Sex | Number | Average Earnings |
| Male | 734 (48.4%) | $50,000 |
| Female | 782 (51.6%) | $34,844 |
| Total | 1,516 (100.0%) | $45,743 |
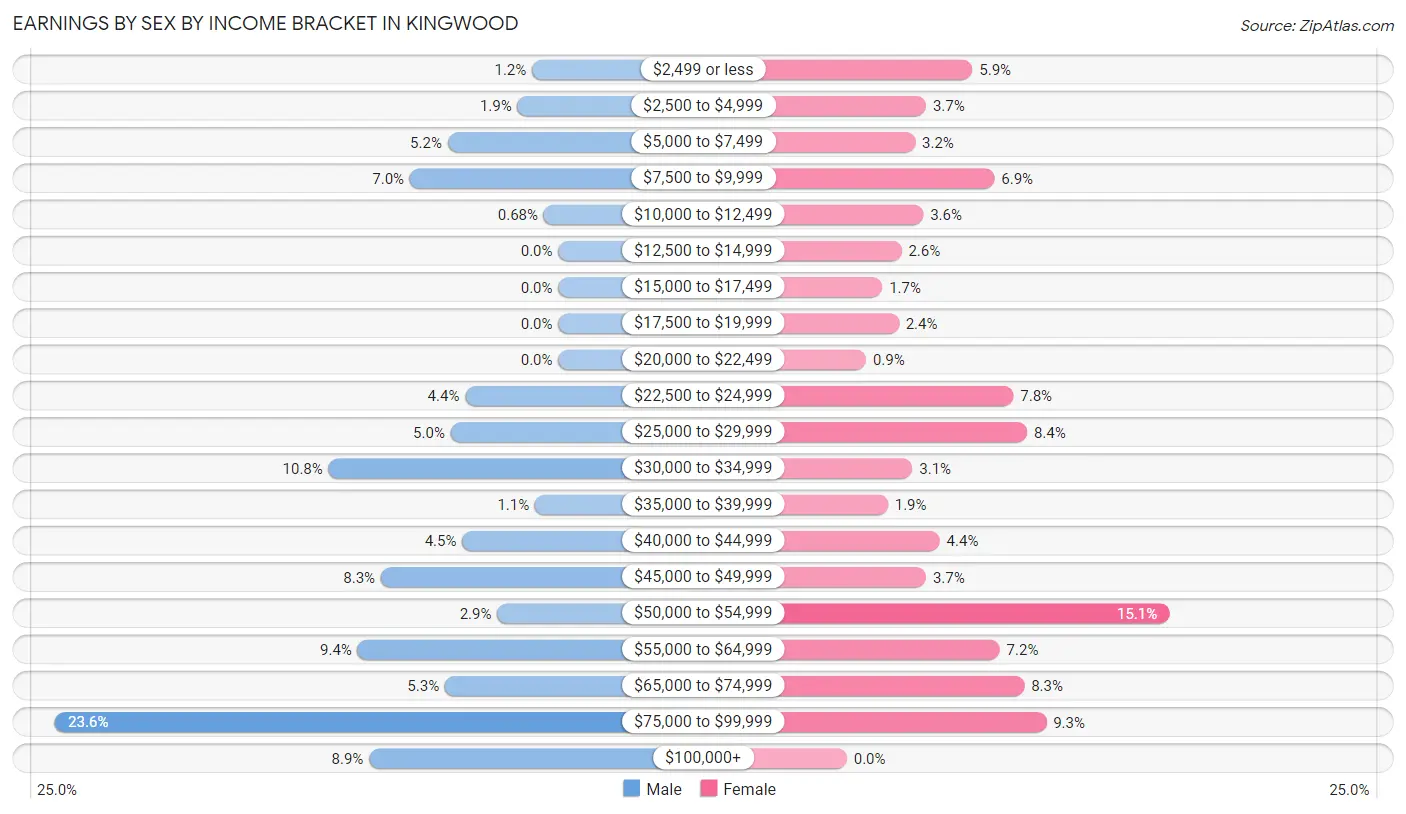
Earnings by Sex by Income Bracket in Kingwood
The most common earnings brackets in Kingwood are $75,000 to $99,999 for men (173 | 23.6%) and $50,000 to $54,999 for women (118 | 15.1%).
| Income | Male | Female |
| $2,499 or less | 9 (1.2%) | 46 (5.9%) |
| $2,500 to $4,999 | 14 (1.9%) | 29 (3.7%) |
| $5,000 to $7,499 | 38 (5.2%) | 25 (3.2%) |
| $7,500 to $9,999 | 51 (7.0%) | 54 (6.9%) |
| $10,000 to $12,499 | 5 (0.7%) | 28 (3.6%) |
| $12,500 to $14,999 | 0 (0.0%) | 20 (2.6%) |
| $15,000 to $17,499 | 0 (0.0%) | 13 (1.7%) |
| $17,500 to $19,999 | 0 (0.0%) | 19 (2.4%) |
| $20,000 to $22,499 | 0 (0.0%) | 7 (0.9%) |
| $22,500 to $24,999 | 32 (4.4%) | 61 (7.8%) |
| $25,000 to $29,999 | 37 (5.0%) | 66 (8.4%) |
| $30,000 to $34,999 | 79 (10.8%) | 24 (3.1%) |
| $35,000 to $39,999 | 8 (1.1%) | 15 (1.9%) |
| $40,000 to $44,999 | 33 (4.5%) | 34 (4.3%) |
| $45,000 to $49,999 | 61 (8.3%) | 29 (3.7%) |
| $50,000 to $54,999 | 21 (2.9%) | 118 (15.1%) |
| $55,000 to $64,999 | 69 (9.4%) | 56 (7.2%) |
| $65,000 to $74,999 | 39 (5.3%) | 65 (8.3%) |
| $75,000 to $99,999 | 173 (23.6%) | 73 (9.3%) |
| $100,000+ | 65 (8.9%) | 0 (0.0%) |
| Total | 734 (100.0%) | 782 (100.0%) |
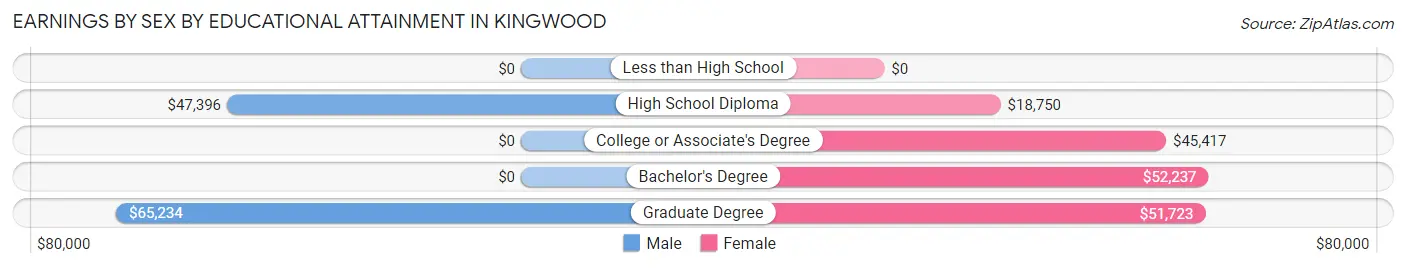
Earnings by Sex by Educational Attainment in Kingwood
Average earnings in Kingwood are $50,536 for men and $46,042 for women, a difference of 8.9%. Men with an educational attainment of graduate degree enjoy the highest average annual earnings of $65,234, while those with high school diploma education earn the least with $47,396. Women with an educational attainment of bachelor's degree earn the most with the average annual earnings of $52,237, while those with high school diploma education have the smallest earnings of $18,750.
| Educational Attainment | Male Income | Female Income |
| Less than High School | - | - |
| High School Diploma | $47,396 | $18,750 |
| College or Associate's Degree | - | - |
| Bachelor's Degree | - | - |
| Graduate Degree | $65,234 | $51,723 |
| Total | $50,536 | $46,042 |
Family Income in Kingwood
Family Income Brackets in Kingwood
According to the Kingwood family income data, there are 313 families falling into the $100,000 to $149,999 income range, which is the most common income bracket and makes up 37.4% of all families. Conversely, the $25,000 to $34,999 income bracket is the least frequent group with only 13 families (1.5%) belonging to this category.
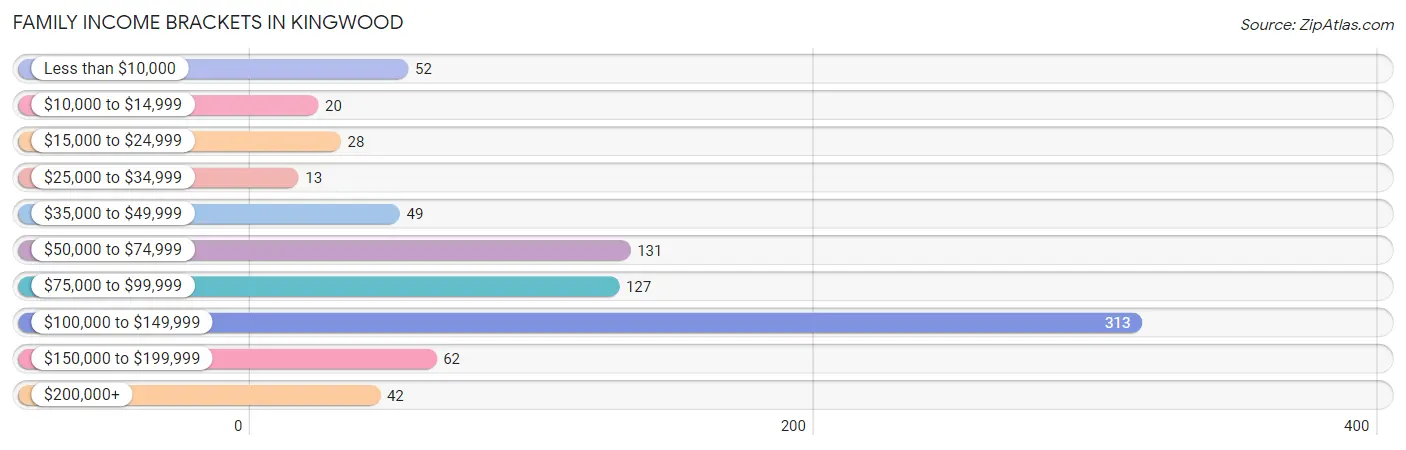
| Income Bracket | # Families | % Families |
| Less than $10,000 | 52 | 6.2% |
| $10,000 to $14,999 | 20 | 2.4% |
| $15,000 to $24,999 | 28 | 3.3% |
| $25,000 to $34,999 | 13 | 1.6% |
| $35,000 to $49,999 | 49 | 5.9% |
| $50,000 to $74,999 | 131 | 15.7% |
| $75,000 to $99,999 | 127 | 15.2% |
| $100,000 to $149,999 | 313 | 37.4% |
| $150,000 to $199,999 | 62 | 7.4% |
| $200,000+ | 42 | 5.0% |
Family Income by Famaliy Size in Kingwood
2-person families (450 | 53.8%) account for the highest median family income in Kingwood with $100,429 per family, while 2-person families (450 | 53.8%) have the highest median income of $50,214 per family member.
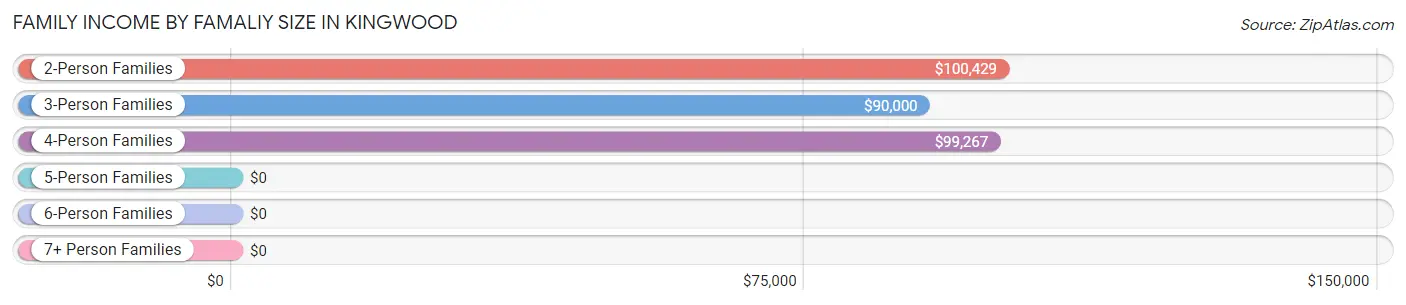
| Income Bracket | # Families | Median Income |
| 2-Person Families | 450 (53.8%) | $100,429 |
| 3-Person Families | 148 (17.7%) | $90,000 |
| 4-Person Families | 143 (17.1%) | $99,267 |
| 5-Person Families | 30 (3.6%) | $0 |
| 6-Person Families | 43 (5.1%) | $0 |
| 7+ Person Families | 23 (2.8%) | $0 |
| Total | 837 (100.0%) | $99,871 |
Family Income by Number of Earners in Kingwood
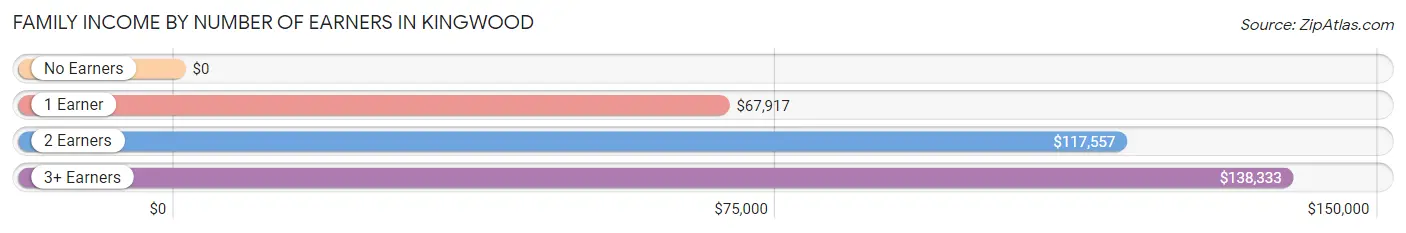
| Number of Earners | # Families | Median Income |
| No Earners | 146 (17.4%) | $0 |
| 1 Earner | 177 (21.1%) | $67,917 |
| 2 Earners | 440 (52.6%) | $117,557 |
| 3+ Earners | 74 (8.8%) | $138,333 |
| Total | 837 (100.0%) | $99,871 |
Household Income in Kingwood
Household Income Brackets in Kingwood
With 326 households falling in the category, the $100,000 to $149,999 income range is the most frequent in Kingwood, accounting for 26.9% of all households. In contrast, only 33 households (2.7%) fall into the $10,000 to $14,999 income bracket, making it the least populous group.
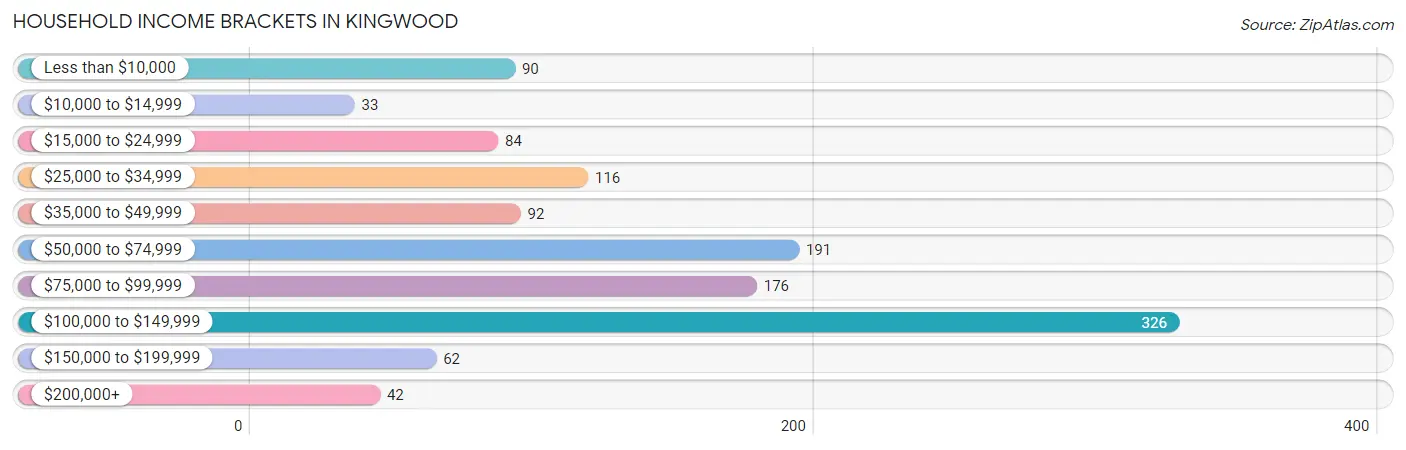
| Income Bracket | # Households | % Households |
| Less than $10,000 | 90 | 7.4% |
| $10,000 to $14,999 | 33 | 2.7% |
| $15,000 to $24,999 | 84 | 6.9% |
| $25,000 to $34,999 | 116 | 9.6% |
| $35,000 to $49,999 | 92 | 7.6% |
| $50,000 to $74,999 | 191 | 15.8% |
| $75,000 to $99,999 | 176 | 14.5% |
| $100,000 to $149,999 | 326 | 26.9% |
| $150,000 to $199,999 | 62 | 5.1% |
| $200,000+ | 42 | 3.5% |
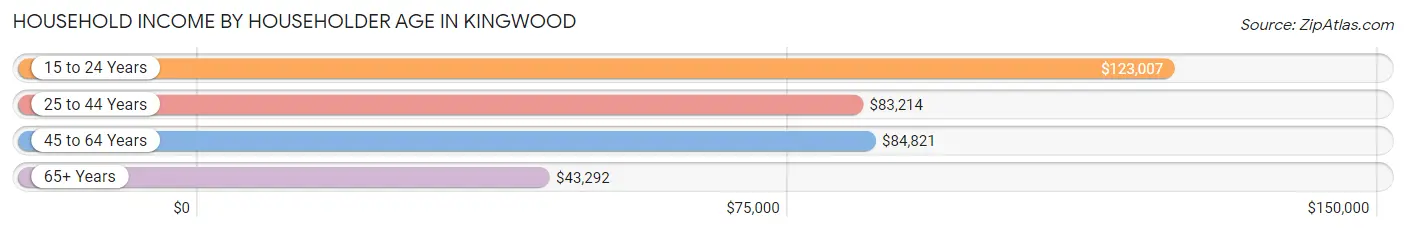
Household Income by Householder Age in Kingwood
The median household income in Kingwood is $74,961, with the highest median household income of $123,007 found in the 15 to 24 years age bracket for the primary householder. A total of 59 households (4.9%) fall into this category. Meanwhile, the 65+ years age bracket for the primary householder has the lowest median household income of $43,292, with 403 households (33.3%) in this group.
| Income Bracket | # Households | Median Income |
| 15 to 24 Years | 59 (4.9%) | $123,007 |
| 25 to 44 Years | 342 (28.2%) | $83,214 |
| 45 to 64 Years | 407 (33.6%) | $84,821 |
| 65+ Years | 403 (33.3%) | $43,292 |
| Total | 1,211 (100.0%) | $74,961 |
Poverty in Kingwood
Income Below Poverty by Sex and Age in Kingwood
With 7.2% poverty level for males and 18.4% for females among the residents of Kingwood, 75 year old and over males and 5 year old females are the most vulnerable to poverty, with 38 males (36.9%) and 21 females (100.0%) in their respective age groups living below the poverty level.
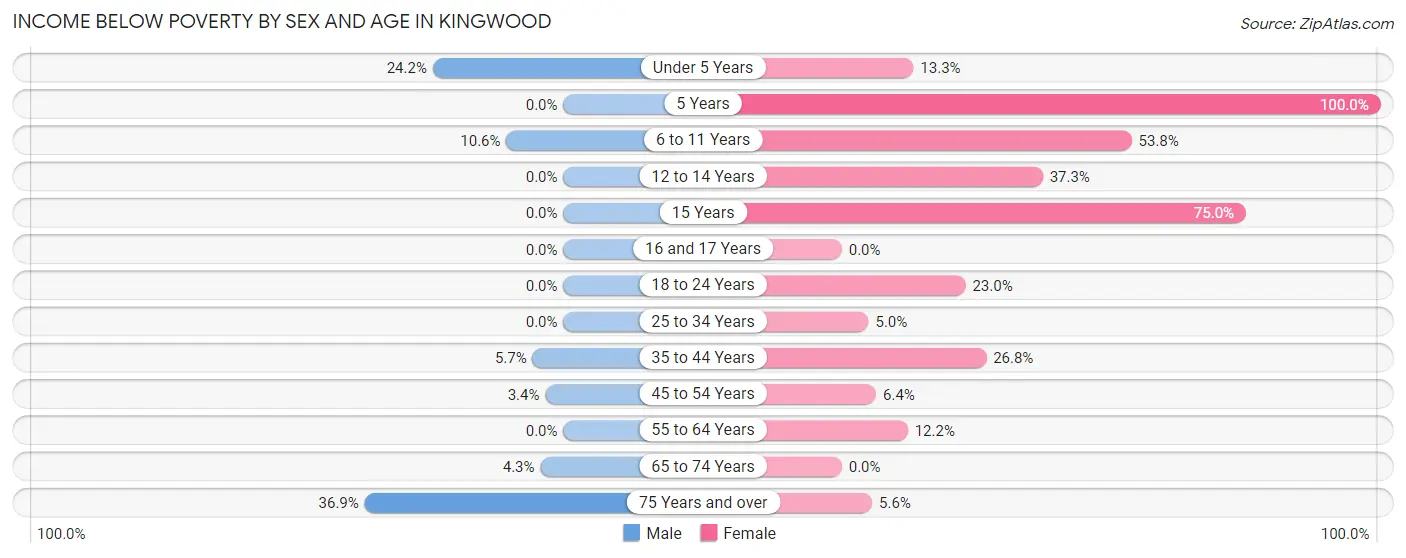
| Age Bracket | Male | Female |
| Under 5 Years | 24 (24.2%) | 21 (13.3%) |
| 5 Years | 0 (0.0%) | 21 (100.0%) |
| 6 to 11 Years | 11 (10.6%) | 71 (53.8%) |
| 12 to 14 Years | 0 (0.0%) | 22 (37.3%) |
| 15 Years | 0 (0.0%) | 24 (75.0%) |
| 16 and 17 Years | 0 (0.0%) | 0 (0.0%) |
| 18 to 24 Years | 0 (0.0%) | 31 (23.0%) |
| 25 to 34 Years | 0 (0.0%) | 7 (5.0%) |
| 35 to 44 Years | 10 (5.7%) | 52 (26.8%) |
| 45 to 54 Years | 7 (3.4%) | 14 (6.4%) |
| 55 to 64 Years | 0 (0.0%) | 18 (12.2%) |
| 65 to 74 Years | 5 (4.3%) | 0 (0.0%) |
| 75 Years and over | 38 (36.9%) | 9 (5.6%) |
| Total | 95 (7.2%) | 290 (18.4%) |
Income Above Poverty by Sex and Age in Kingwood
According to the poverty statistics in Kingwood, males aged 5 years and females aged 16 and 17 years are the age groups that are most secure financially, with 100.0% of males and 100.0% of females in these age groups living above the poverty line.
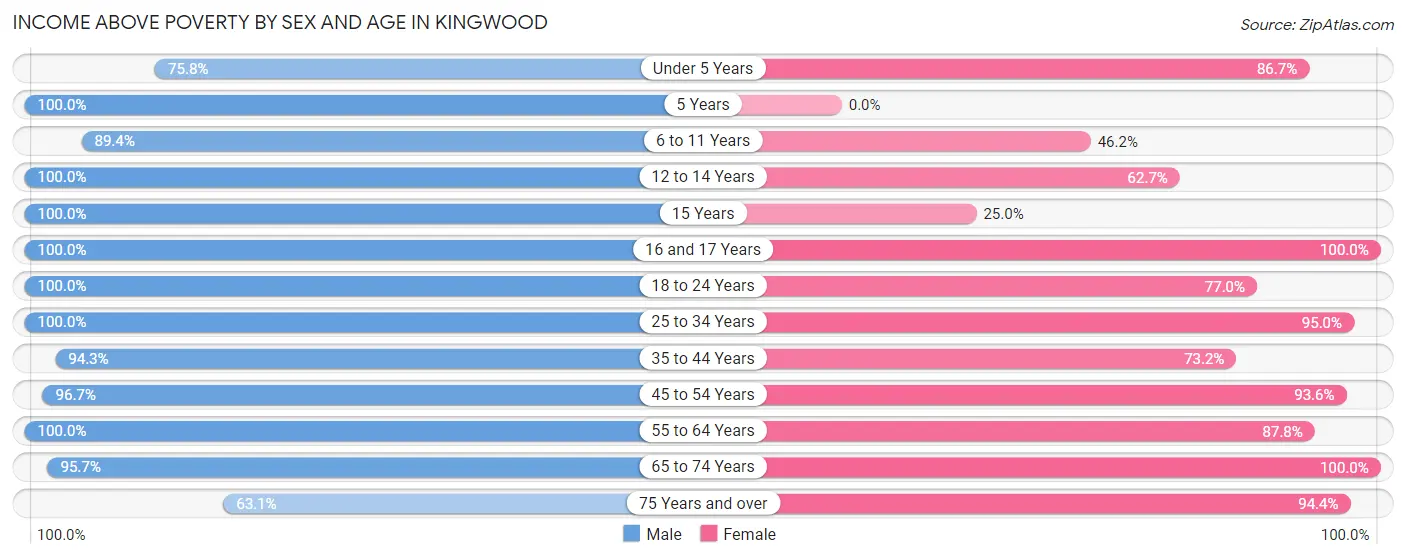
| Age Bracket | Male | Female |
| Under 5 Years | 75 (75.8%) | 137 (86.7%) |
| 5 Years | 9 (100.0%) | 0 (0.0%) |
| 6 to 11 Years | 93 (89.4%) | 61 (46.2%) |
| 12 to 14 Years | 30 (100.0%) | 37 (62.7%) |
| 15 Years | 18 (100.0%) | 8 (25.0%) |
| 16 and 17 Years | 26 (100.0%) | 9 (100.0%) |
| 18 to 24 Years | 33 (100.0%) | 104 (77.0%) |
| 25 to 34 Years | 258 (100.0%) | 134 (95.0%) |
| 35 to 44 Years | 165 (94.3%) | 142 (73.2%) |
| 45 to 54 Years | 202 (96.7%) | 206 (93.6%) |
| 55 to 64 Years | 130 (100.0%) | 129 (87.8%) |
| 65 to 74 Years | 112 (95.7%) | 165 (100.0%) |
| 75 Years and over | 65 (63.1%) | 151 (94.4%) |
| Total | 1,216 (92.7%) | 1,283 (81.6%) |
Income Below Poverty Among Married-Couple Families in Kingwood
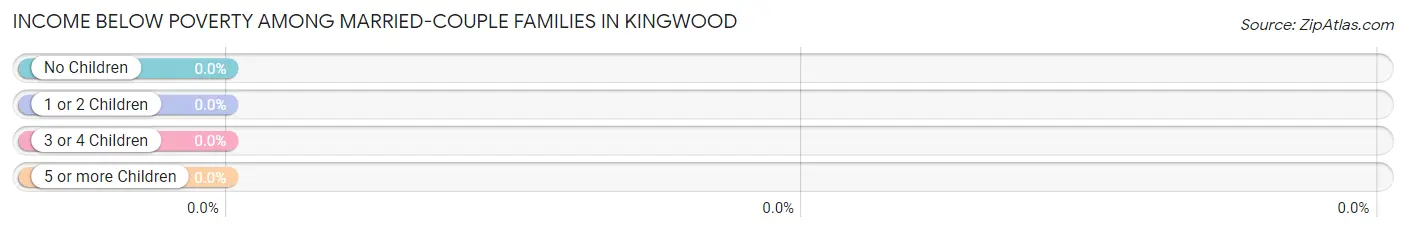
| Children | Above Poverty | Below Poverty |
| No Children | 420 (100.0%) | 0 (0.0%) |
| 1 or 2 Children | 214 (100.0%) | 0 (0.0%) |
| 3 or 4 Children | 50 (100.0%) | 0 (0.0%) |
| 5 or more Children | 0 (0.0%) | 0 (0.0%) |
| Total | 684 (100.0%) | 0 (0.0%) |
Income Below Poverty Among Single-Parent Households in Kingwood
According to the poverty data in Kingwood, 32.3% or 10 single-father households and 50.8% or 62 single-mother households are living below the poverty line. Among single-father households, those with 1 or 2 children have the highest poverty rate, with 10 households (40.0%) experiencing poverty. Likewise, among single-mother households, those with 5 or more children have the highest poverty rate, with 23 households (100.0%) falling below the poverty line.
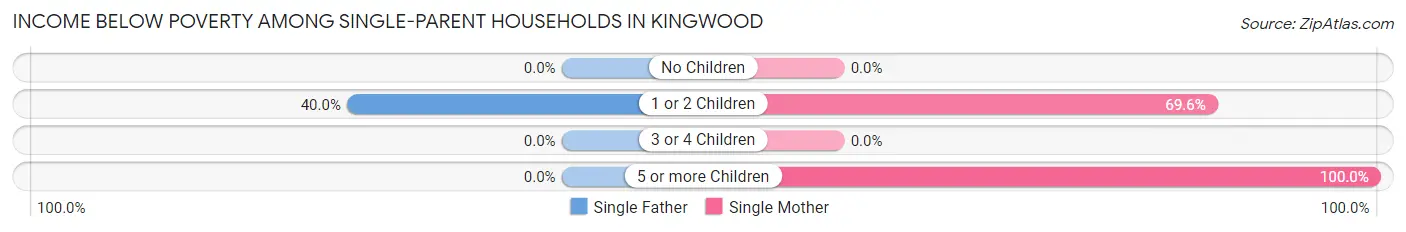
| Children | Single Father | Single Mother |
| No Children | 0 (0.0%) | 0 (0.0%) |
| 1 or 2 Children | 10 (40.0%) | 39 (69.6%) |
| 3 or 4 Children | 0 (0.0%) | 0 (0.0%) |
| 5 or more Children | 0 (0.0%) | 23 (100.0%) |
| Total | 10 (32.3%) | 62 (50.8%) |
Income Below Poverty Among Married-Couple vs Single-Parent Households in Kingwood
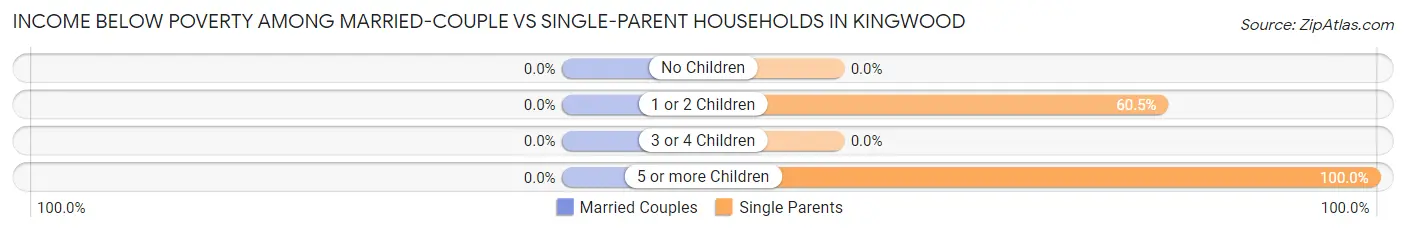
| Children | Married-Couple Families | Single-Parent Households |
| No Children | 0 (0.0%) | 0 (0.0%) |
| 1 or 2 Children | 0 (0.0%) | 49 (60.5%) |
| 3 or 4 Children | 0 (0.0%) | 0 (0.0%) |
| 5 or more Children | 0 (0.0%) | 23 (100.0%) |
| Total | 0 (0.0%) | 72 (47.1%) |
Race in Kingwood
The most populous races in Kingwood are White / Caucasian (2,836 | 94.6%), Two or more Races (70 | 2.3%), and Black / African American (59 | 2.0%).
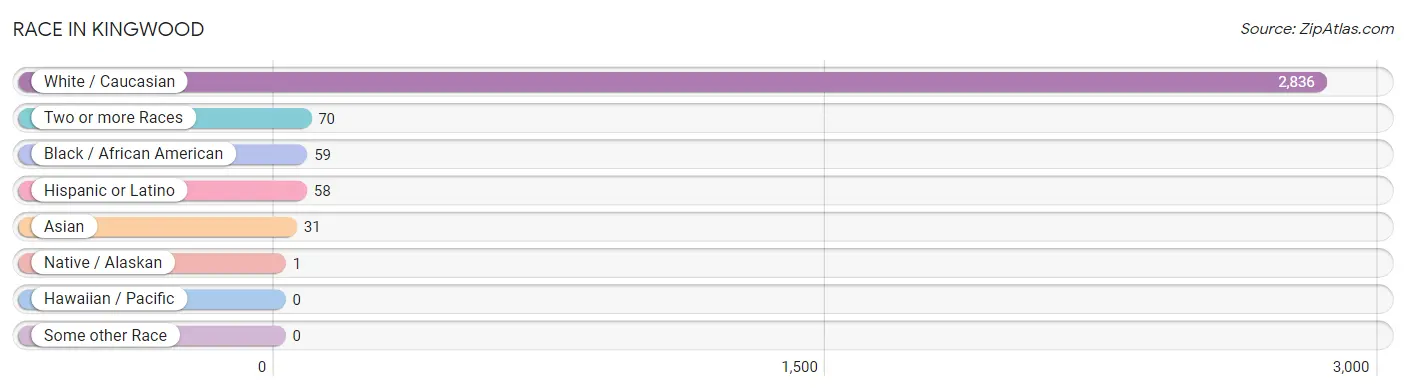
| Race | # Population | % Population |
| Asian | 31 | 1.0% |
| Black / African American | 59 | 2.0% |
| Hawaiian / Pacific | 0 | 0.0% |
| Hispanic or Latino | 58 | 1.9% |
| Native / Alaskan | 1 | 0.0% |
| White / Caucasian | 2,836 | 94.6% |
| Two or more Races | 70 | 2.3% |
| Some other Race | 0 | 0.0% |
| Total | 2,997 | 100.0% |
Ancestry in Kingwood
The most populous ancestries reported in Kingwood are American (806 | 26.9%), German (436 | 14.5%), English (260 | 8.7%), Irish (254 | 8.5%), and Scottish (242 | 8.1%), together accounting for 66.7% of all Kingwood residents.
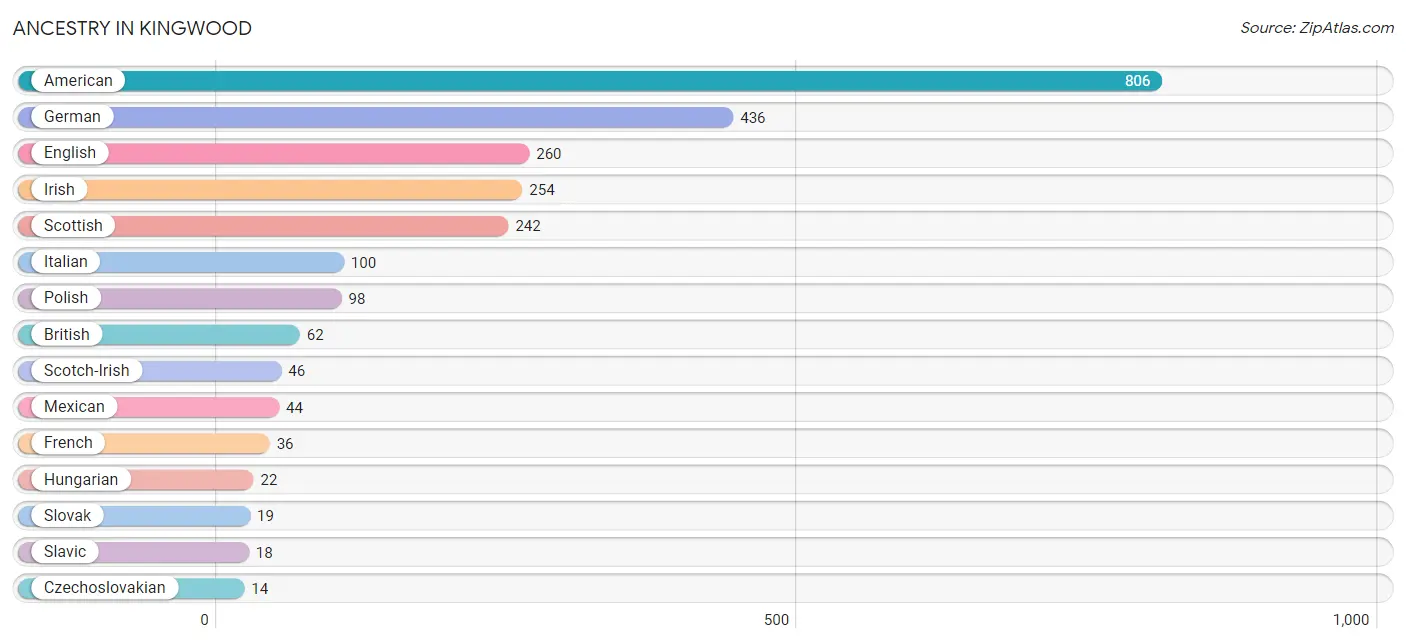
| Ancestry | # Population | % Population |
| American | 806 | 26.9% |
| British | 62 | 2.1% |
| Choctaw | 1 | 0.0% |
| Czechoslovakian | 14 | 0.5% |
| Dutch | 9 | 0.3% |
| English | 260 | 8.7% |
| European | 8 | 0.3% |
| French | 36 | 1.2% |
| German | 436 | 14.5% |
| Hungarian | 22 | 0.7% |
| Irish | 254 | 8.5% |
| Italian | 100 | 3.3% |
| Mexican | 44 | 1.5% |
| Polish | 98 | 3.3% |
| Scotch-Irish | 46 | 1.5% |
| Scottish | 242 | 8.1% |
| Slavic | 18 | 0.6% |
| Slovak | 19 | 0.6% |
| Spanish | 14 | 0.5% |
| Ukrainian | 8 | 0.3% |
| Welsh | 10 | 0.3% |
| West Indian | 10 | 0.3% | View All 22 Rows |
Immigrants in Kingwood
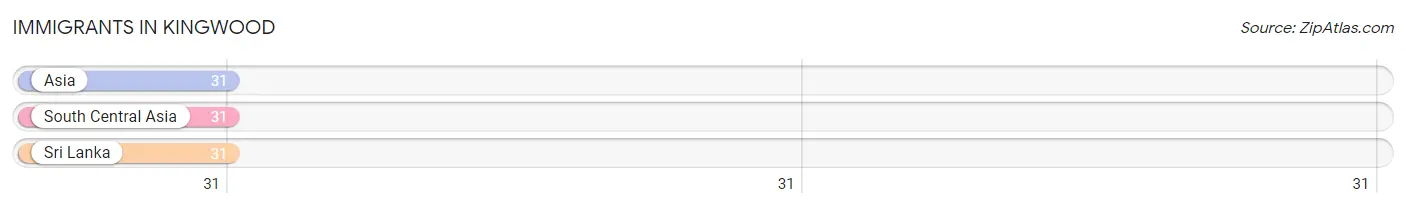
The most numerous immigrant groups reported in Kingwood came from Asia (31 | 1.0%), South Central Asia (31 | 1.0%), and Sri Lanka (31 | 1.0%), together accounting for 3.1% of all Kingwood residents.
| Immigration Origin | # Population | % Population |
| Asia | 31 | 1.0% |
| South Central Asia | 31 | 1.0% |
| Sri Lanka | 31 | 1.0% | View All 3 Rows |
Sex and Age in Kingwood
Sex and Age in Kingwood
The most populous age groups in Kingwood are 25 to 29 Years (169 | 12.6%) for men and Under 5 Years (158 | 9.6%) for women.
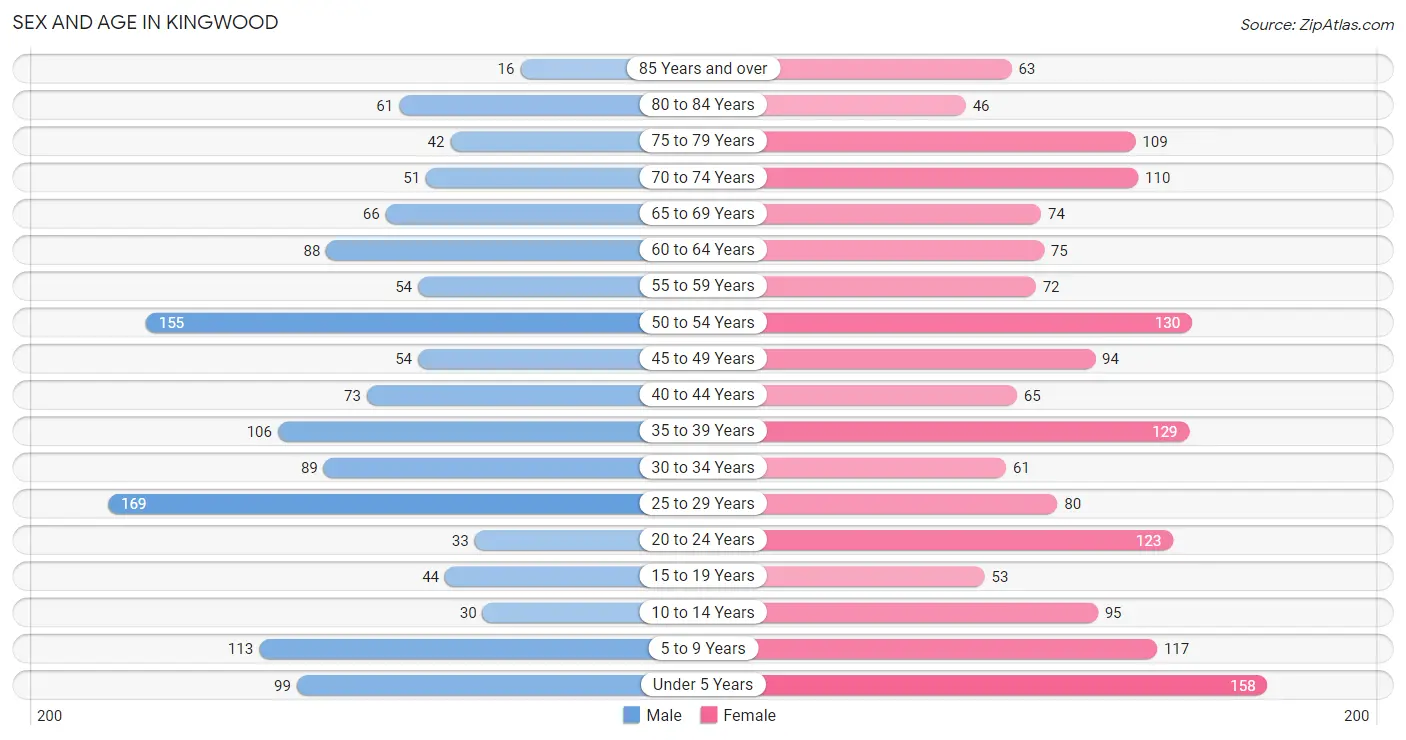
| Age Bracket | Male | Female |
| Under 5 Years | 99 (7.4%) | 158 (9.6%) |
| 5 to 9 Years | 113 (8.4%) | 117 (7.1%) |
| 10 to 14 Years | 30 (2.2%) | 95 (5.7%) |
| 15 to 19 Years | 44 (3.3%) | 53 (3.2%) |
| 20 to 24 Years | 33 (2.5%) | 123 (7.4%) |
| 25 to 29 Years | 169 (12.6%) | 80 (4.8%) |
| 30 to 34 Years | 89 (6.6%) | 61 (3.7%) |
| 35 to 39 Years | 106 (7.9%) | 129 (7.8%) |
| 40 to 44 Years | 73 (5.4%) | 65 (3.9%) |
| 45 to 49 Years | 54 (4.0%) | 94 (5.7%) |
| 50 to 54 Years | 155 (11.5%) | 130 (7.9%) |
| 55 to 59 Years | 54 (4.0%) | 72 (4.3%) |
| 60 to 64 Years | 88 (6.6%) | 75 (4.5%) |
| 65 to 69 Years | 66 (4.9%) | 74 (4.5%) |
| 70 to 74 Years | 51 (3.8%) | 110 (6.7%) |
| 75 to 79 Years | 42 (3.1%) | 109 (6.6%) |
| 80 to 84 Years | 61 (4.5%) | 46 (2.8%) |
| 85 Years and over | 16 (1.2%) | 63 (3.8%) |
| Total | 1,343 (100.0%) | 1,654 (100.0%) |
Families and Households in Kingwood
Median Family Size in Kingwood
The median family size in Kingwood is 2.96 persons per family, with single female/mother families (122 | 14.6%) accounting for the largest median family size of 3.74 persons per family. On the other hand, single male/father families (31 | 3.7%) represent the smallest median family size with 2.06 persons per family.
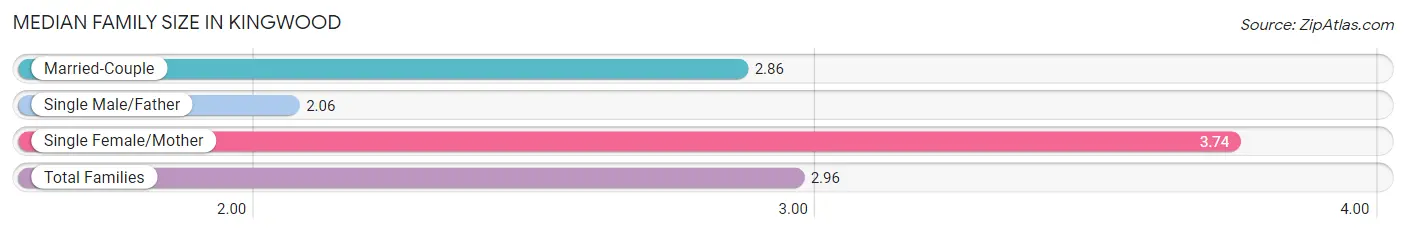
| Family Type | # Families | Family Size |
| Married-Couple | 684 (81.7%) | 2.86 |
| Single Male/Father | 31 (3.7%) | 2.06 |
| Single Female/Mother | 122 (14.6%) | 3.74 |
| Total Families | 837 (100.0%) | 2.96 |
Median Household Size in Kingwood
The median household size in Kingwood is 2.38 persons per household, with single female/mother households (122 | 10.1%) accounting for the largest median household size of 3.78 persons per household. non-family households (374 | 30.9%) represent the smallest median household size with 1.08 persons per household.
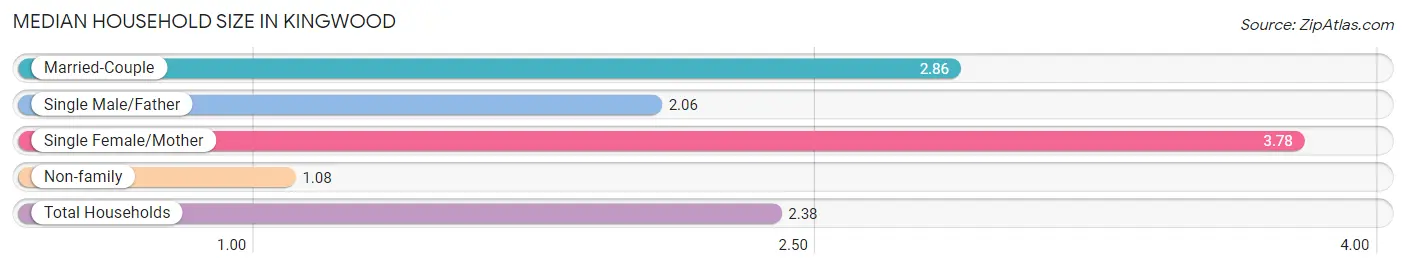
| Household Type | # Households | Household Size |
| Married-Couple | 684 (56.5%) | 2.86 |
| Single Male/Father | 31 (2.6%) | 2.06 |
| Single Female/Mother | 122 (10.1%) | 3.78 |
| Non-family | 374 (30.9%) | 1.08 |
| Total Households | 1,211 (100.0%) | 2.38 |
Household Size by Marriage Status in Kingwood
Out of a total of 1,211 households in Kingwood, 837 (69.1%) are family households, while 374 (30.9%) are nonfamily households. The most numerous type of family households are 2-person households, comprising 441, and the most common type of nonfamily households are 1-person households, comprising 338.
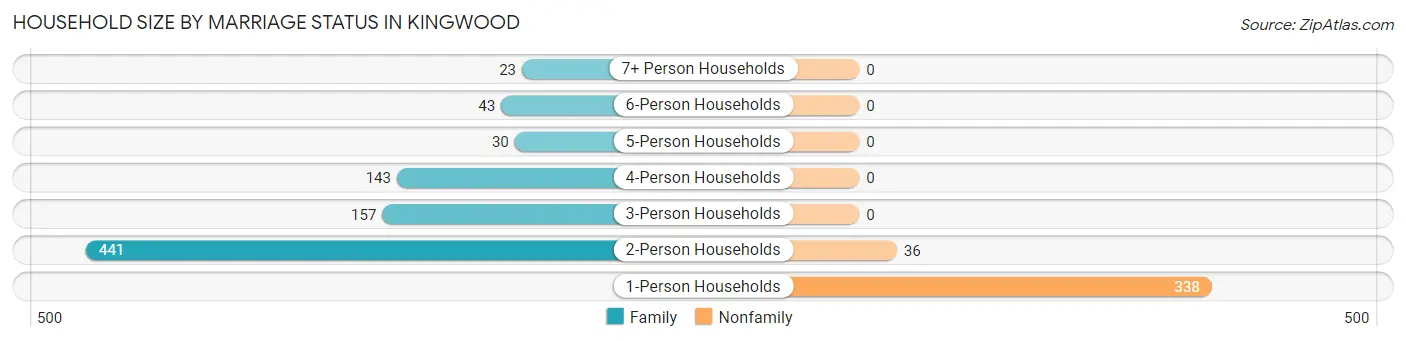
| Household Size | Family Households | Nonfamily Households |
| 1-Person Households | - | 338 (27.9%) |
| 2-Person Households | 441 (36.4%) | 36 (3.0%) |
| 3-Person Households | 157 (13.0%) | 0 (0.0%) |
| 4-Person Households | 143 (11.8%) | 0 (0.0%) |
| 5-Person Households | 30 (2.5%) | 0 (0.0%) |
| 6-Person Households | 43 (3.5%) | 0 (0.0%) |
| 7+ Person Households | 23 (1.9%) | 0 (0.0%) |
| Total | 837 (69.1%) | 374 (30.9%) |
Female Fertility in Kingwood
Fertility by Age in Kingwood
Average fertility rate in Kingwood is 20.0 births per 1,000 women. Women in the age bracket of 15 to 19 years have the highest fertility rate with 226.0 births per 1,000 women. Women in the age bracket of 15 to 19 years acount for 100.0% of all women with births.
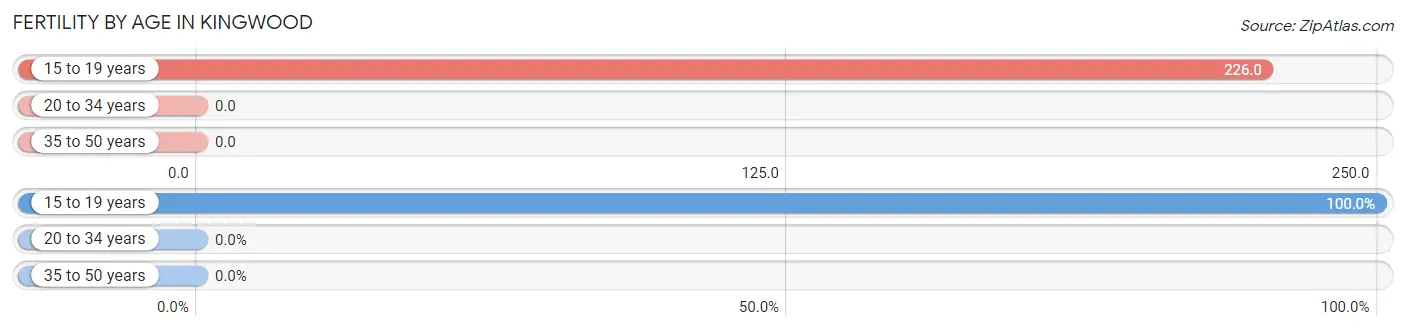
| Age Bracket | Women with Births | Births / 1,000 Women |
| 15 to 19 years | 12 (100.0%) | 226.0 |
| 20 to 34 years | 0 (0.0%) | 0.0 |
| 35 to 50 years | 0 (0.0%) | 0.0 |
| Total | 12 (100.0%) | 20.0 |
Fertility by Age by Marriage Status in Kingwood
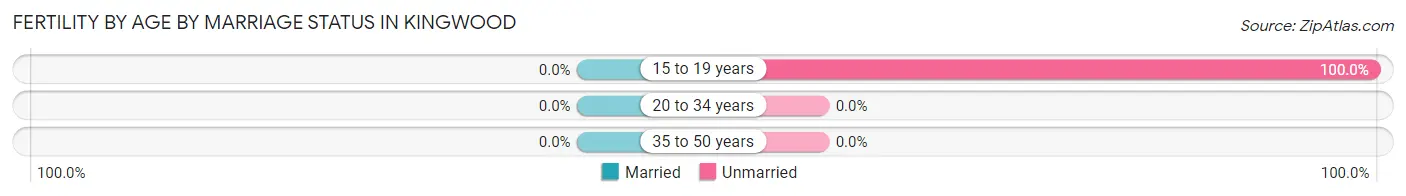
| Age Bracket | Married | Unmarried |
| 15 to 19 years | 0 (0.0%) | 12 (100.0%) |
| 20 to 34 years | 0 (0.0%) | 0 (0.0%) |
| 35 to 50 years | 0 (0.0%) | 0 (0.0%) |
| Total | 0 (0.0%) | 12 (100.0%) |
Fertility by Education in Kingwood
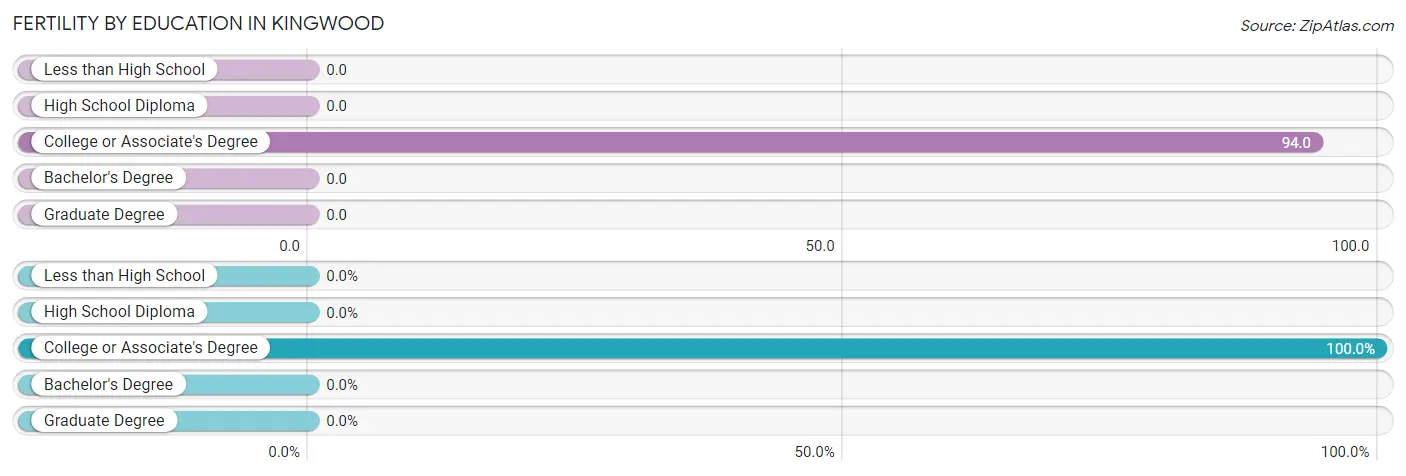
| Educational Attainment | Women with Births | Births / 1,000 Women |
| Less than High School | 0 (0.0%) | 0.0 |
| High School Diploma | 0 (0.0%) | 0.0 |
| College or Associate's Degree | 12 (100.0%) | 94.0 |
| Bachelor's Degree | 0 (0.0%) | 0.0 |
| Graduate Degree | 0 (0.0%) | 0.0 |
| Total | 12 (100.0%) | 20.0 |
Fertility by Education by Marriage Status in Kingwood
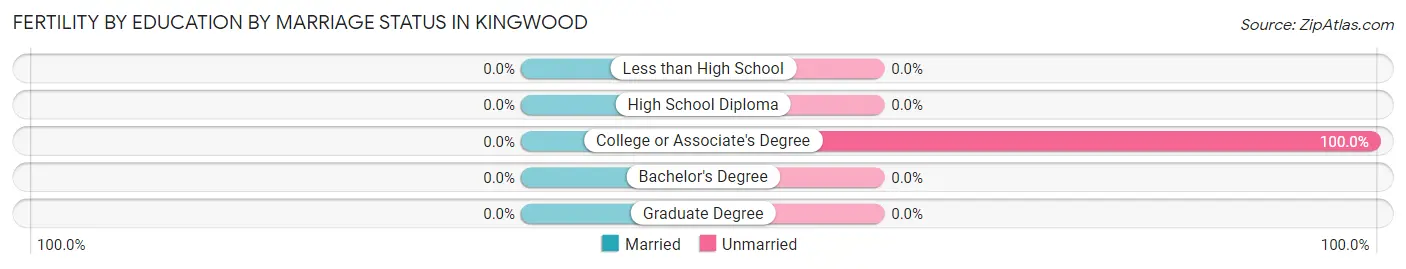
| Educational Attainment | Married | Unmarried |
| Less than High School | 0 (0.0%) | 0 (0.0%) |
| High School Diploma | 0 (0.0%) | 0 (0.0%) |
| College or Associate's Degree | 0 (0.0%) | 12 (100.0%) |
| Bachelor's Degree | 0 (0.0%) | 0 (0.0%) |
| Graduate Degree | 0 (0.0%) | 0 (0.0%) |
| Total | 0 (0.0%) | 12 (100.0%) |
Employment Characteristics in Kingwood
Employment by Class of Employer in Kingwood
Among the 1,328 employed individuals in Kingwood, private company employees (724 | 54.5%), local government employees (224 | 16.9%), and not-for-profit organizations (131 | 9.9%) make up the most common classes of employment.
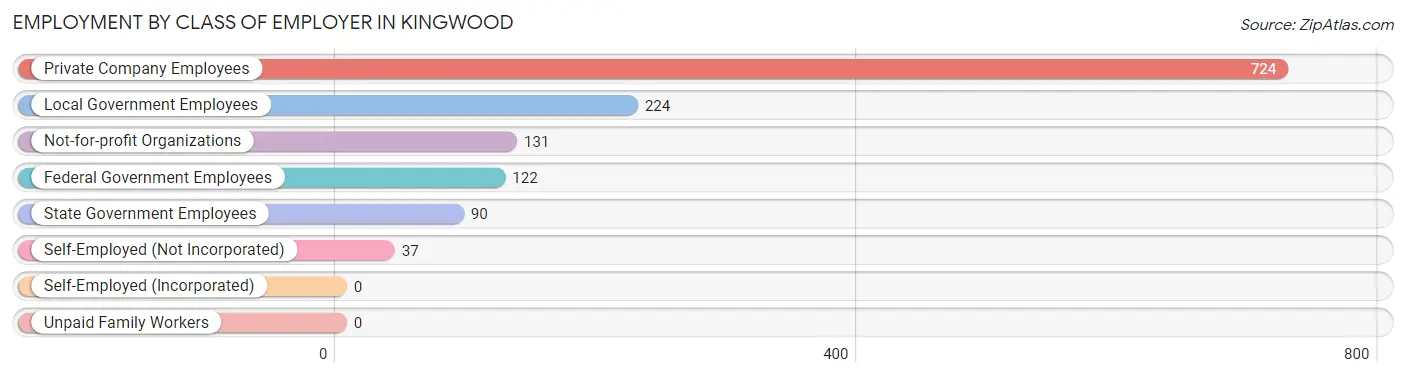
| Employer Class | # Employees | % Employees |
| Private Company Employees | 724 | 54.5% |
| Self-Employed (Incorporated) | 0 | 0.0% |
| Self-Employed (Not Incorporated) | 37 | 2.8% |
| Not-for-profit Organizations | 131 | 9.9% |
| Local Government Employees | 224 | 16.9% |
| State Government Employees | 90 | 6.8% |
| Federal Government Employees | 122 | 9.2% |
| Unpaid Family Workers | 0 | 0.0% |
| Total | 1,328 | 100.0% |
Employment Status by Age in Kingwood
According to the labor force statistics for Kingwood, out of the total population over 16 years of age (2,335), 62.7% or 1,464 individuals are in the labor force, with 7.4% or 108 of them unemployed. The age group with the highest labor force participation rate is 30 to 34 years, with 100.0% or 150 individuals in the labor force. Within the labor force, the 16 to 19 years age range has the highest percentage of unemployed individuals, with 50.0% or 9 of them being unemployed.
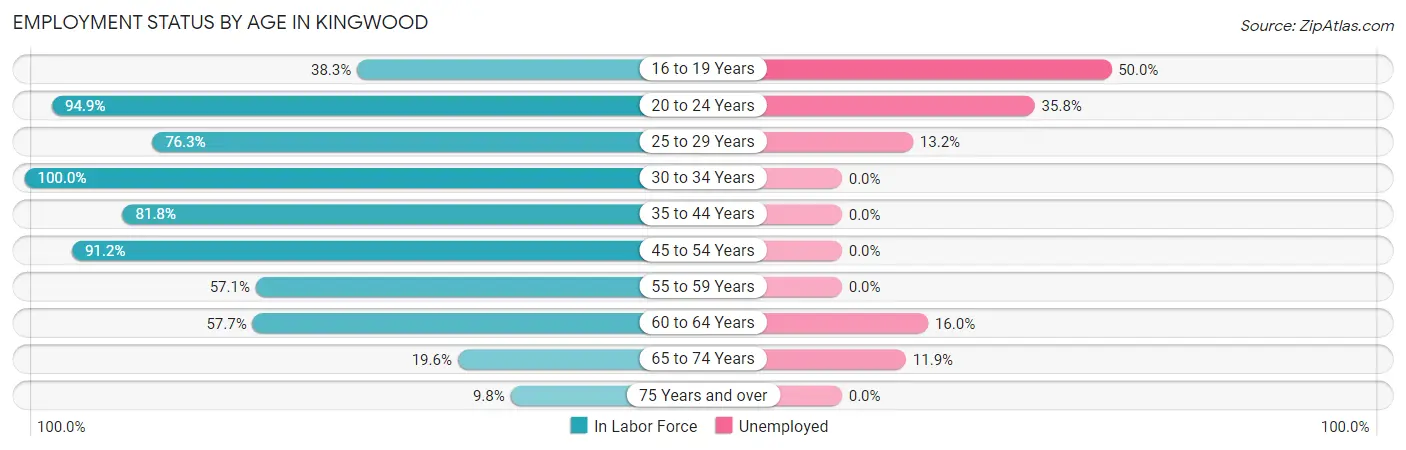
| Age Bracket | In Labor Force | Unemployed |
| 16 to 19 Years | 18 (38.3%) | 9 (50.0%) |
| 20 to 24 Years | 148 (94.9%) | 53 (35.8%) |
| 25 to 29 Years | 190 (76.3%) | 25 (13.2%) |
| 30 to 34 Years | 150 (100.0%) | 0 (0.0%) |
| 35 to 44 Years | 305 (81.8%) | 0 (0.0%) |
| 45 to 54 Years | 395 (91.2%) | 0 (0.0%) |
| 55 to 59 Years | 72 (57.1%) | 0 (0.0%) |
| 60 to 64 Years | 94 (57.7%) | 15 (16.0%) |
| 65 to 74 Years | 59 (19.6%) | 7 (11.9%) |
| 75 Years and over | 33 (9.8%) | 0 (0.0%) |
| Total | 1,464 (62.7%) | 108 (7.4%) |
Employment Status by Educational Attainment in Kingwood
According to labor force statistics for Kingwood, 80.7% of individuals (1,206) out of the total population between 25 and 64 years of age (1,494) are in the labor force, with 3.3% or 40 of them being unemployed. The group with the highest labor force participation rate are those with the educational attainment of bachelor's degree or higher, with 96.6% or 490 individuals in the labor force. Within the labor force, individuals with high school diploma education have the highest percentage of unemployment, with 9.3% or 40 of them being unemployed.
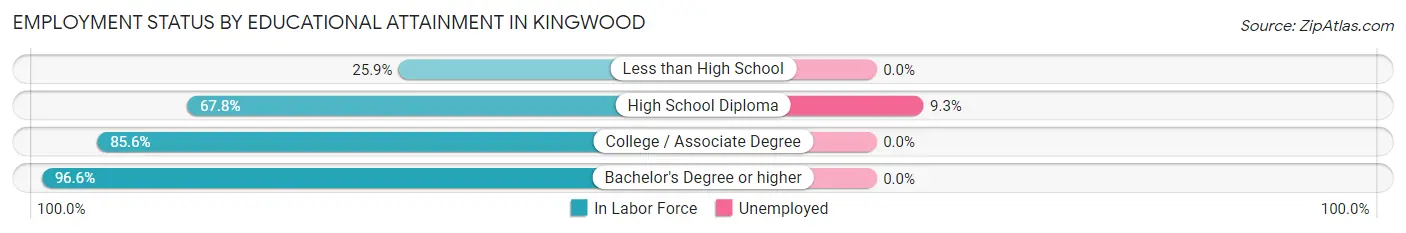
| Educational Attainment | In Labor Force | Unemployed |
| Less than High School | 7 (25.9%) | 0 (0.0%) |
| High School Diploma | 430 (67.8%) | 59 (9.3%) |
| College / Associate Degree | 279 (85.6%) | 0 (0.0%) |
| Bachelor's Degree or higher | 490 (96.6%) | 0 (0.0%) |
| Total | 1,206 (80.7%) | 49 (3.3%) |
Employment Occupations by Sex in Kingwood
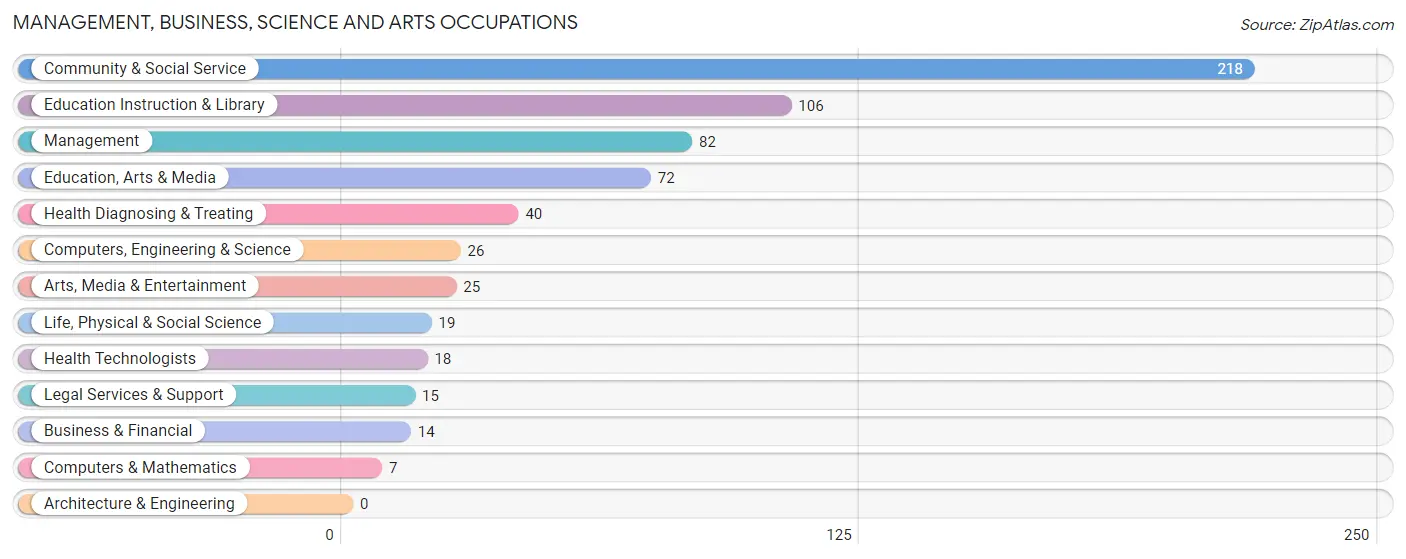
Management, Business, Science and Arts Occupations
The most common Management, Business, Science and Arts occupations in Kingwood are Community & Social Service (218 | 16.1%), Education Instruction & Library (106 | 7.8%), Management (82 | 6.0%), Education, Arts & Media (72 | 5.3%), and Health Diagnosing & Treating (40 | 2.9%).
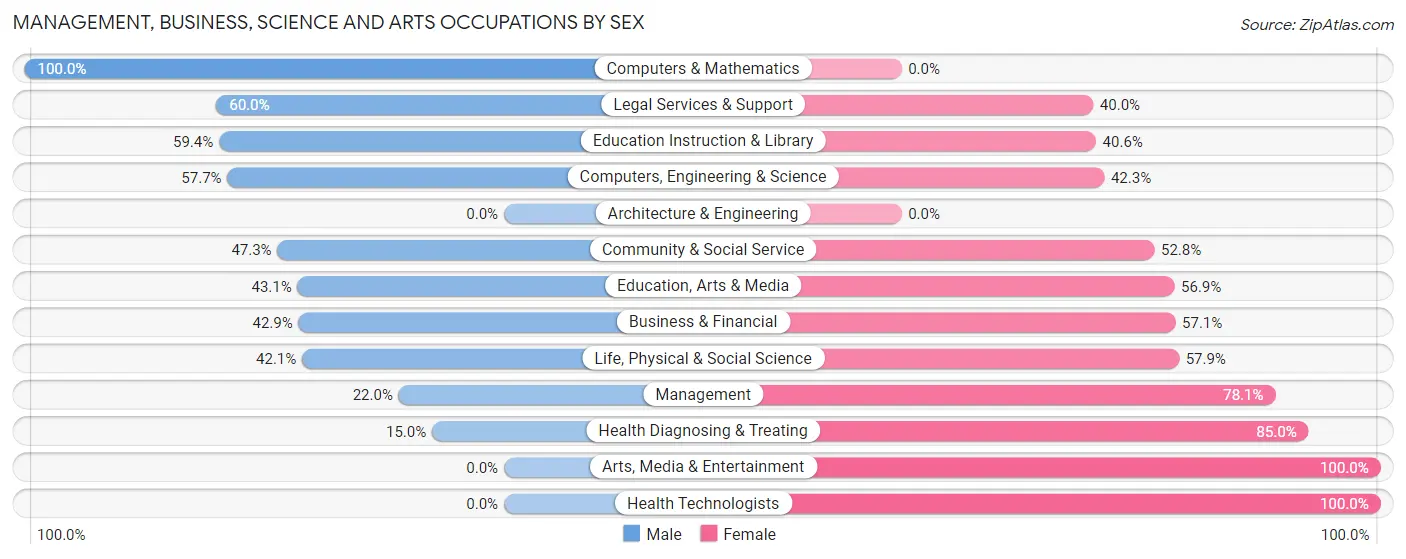
Management, Business, Science and Arts Occupations by Sex
Within the Management, Business, Science and Arts occupations in Kingwood, the most male-oriented occupations are Computers & Mathematics (100.0%), Legal Services & Support (60.0%), and Education Instruction & Library (59.4%), while the most female-oriented occupations are Arts, Media & Entertainment (100.0%), Health Technologists (100.0%), and Health Diagnosing & Treating (85.0%).
| Occupation | Male | Female |
| Management | 18 (22.0%) | 64 (78.0%) |
| Business & Financial | 6 (42.9%) | 8 (57.1%) |
| Computers, Engineering & Science | 15 (57.7%) | 11 (42.3%) |
| Computers & Mathematics | 7 (100.0%) | 0 (0.0%) |
| Architecture & Engineering | 0 (0.0%) | 0 (0.0%) |
| Life, Physical & Social Science | 8 (42.1%) | 11 (57.9%) |
| Community & Social Service | 103 (47.2%) | 115 (52.7%) |
| Education, Arts & Media | 31 (43.1%) | 41 (56.9%) |
| Legal Services & Support | 9 (60.0%) | 6 (40.0%) |
| Education Instruction & Library | 63 (59.4%) | 43 (40.6%) |
| Arts, Media & Entertainment | 0 (0.0%) | 25 (100.0%) |
| Health Diagnosing & Treating | 6 (15.0%) | 34 (85.0%) |
| Health Technologists | 0 (0.0%) | 18 (100.0%) |
| Total (Category) | 148 (39.0%) | 232 (61.1%) |
| Total (Overall) | 649 (47.9%) | 706 (52.1%) |
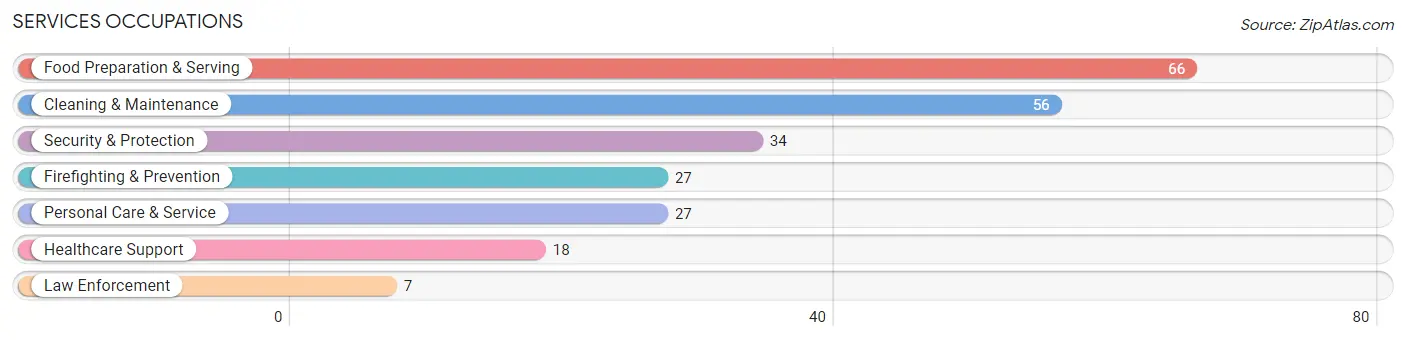
Services Occupations
The most common Services occupations in Kingwood are Food Preparation & Serving (66 | 4.9%), Cleaning & Maintenance (56 | 4.1%), Security & Protection (34 | 2.5%), Firefighting & Prevention (27 | 2.0%), and Personal Care & Service (27 | 2.0%).
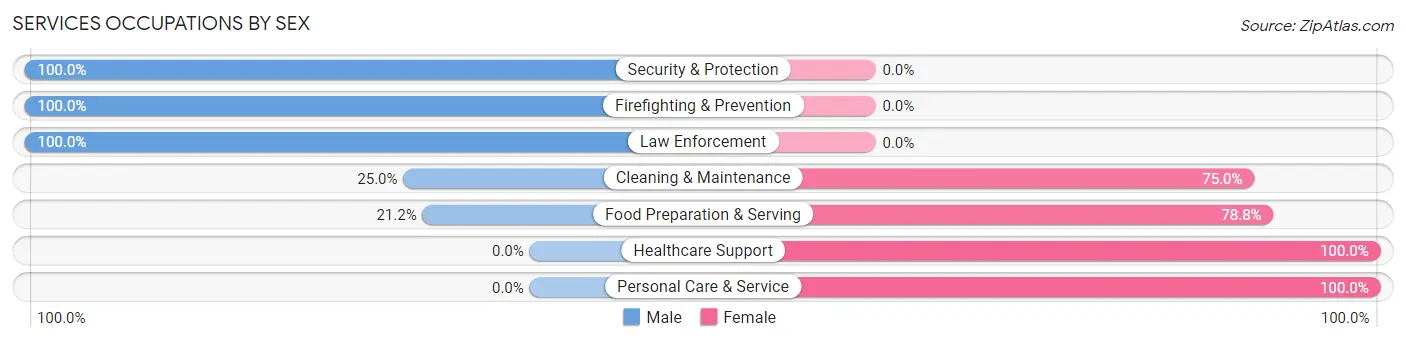
Services Occupations by Sex
Within the Services occupations in Kingwood, the most male-oriented occupations are Security & Protection (100.0%), Firefighting & Prevention (100.0%), and Law Enforcement (100.0%), while the most female-oriented occupations are Healthcare Support (100.0%), Personal Care & Service (100.0%), and Food Preparation & Serving (78.8%).
| Occupation | Male | Female |
| Healthcare Support | 0 (0.0%) | 18 (100.0%) |
| Security & Protection | 34 (100.0%) | 0 (0.0%) |
| Firefighting & Prevention | 27 (100.0%) | 0 (0.0%) |
| Law Enforcement | 7 (100.0%) | 0 (0.0%) |
| Food Preparation & Serving | 14 (21.2%) | 52 (78.8%) |
| Cleaning & Maintenance | 14 (25.0%) | 42 (75.0%) |
| Personal Care & Service | 0 (0.0%) | 27 (100.0%) |
| Total (Category) | 62 (30.8%) | 139 (69.2%) |
| Total (Overall) | 649 (47.9%) | 706 (52.1%) |
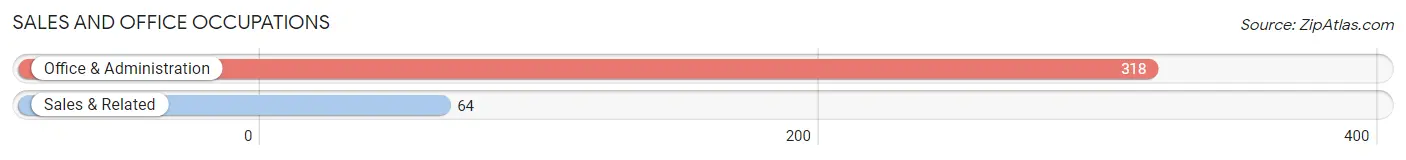
Sales and Office Occupations
The most common Sales and Office occupations in Kingwood are Office & Administration (318 | 23.5%), and Sales & Related (64 | 4.7%).
Sales and Office Occupations by Sex
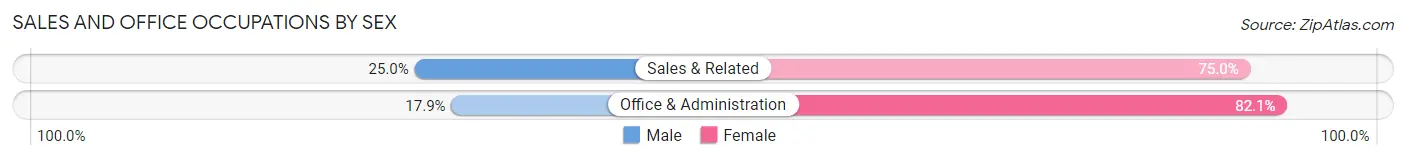
| Occupation | Male | Female |
| Sales & Related | 16 (25.0%) | 48 (75.0%) |
| Office & Administration | 57 (17.9%) | 261 (82.1%) |
| Total (Category) | 73 (19.1%) | 309 (80.9%) |
| Total (Overall) | 649 (47.9%) | 706 (52.1%) |
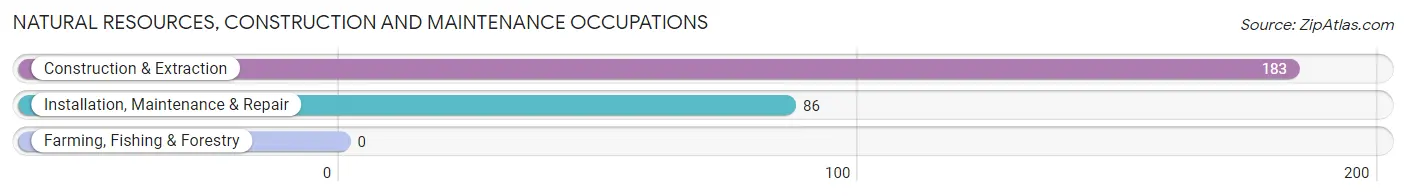
Natural Resources, Construction and Maintenance Occupations
The most common Natural Resources, Construction and Maintenance occupations in Kingwood are Construction & Extraction (183 | 13.5%), and Installation, Maintenance & Repair (86 | 6.4%).
Natural Resources, Construction and Maintenance Occupations by Sex
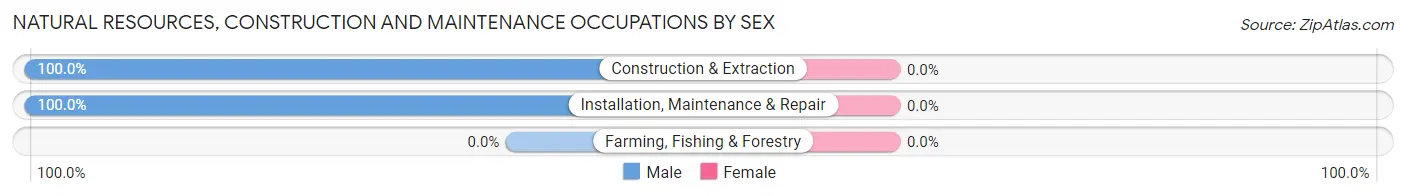
| Occupation | Male | Female |
| Farming, Fishing & Forestry | 0 (0.0%) | 0 (0.0%) |
| Construction & Extraction | 183 (100.0%) | 0 (0.0%) |
| Installation, Maintenance & Repair | 86 (100.0%) | 0 (0.0%) |
| Total (Category) | 269 (100.0%) | 0 (0.0%) |
| Total (Overall) | 649 (47.9%) | 706 (52.1%) |
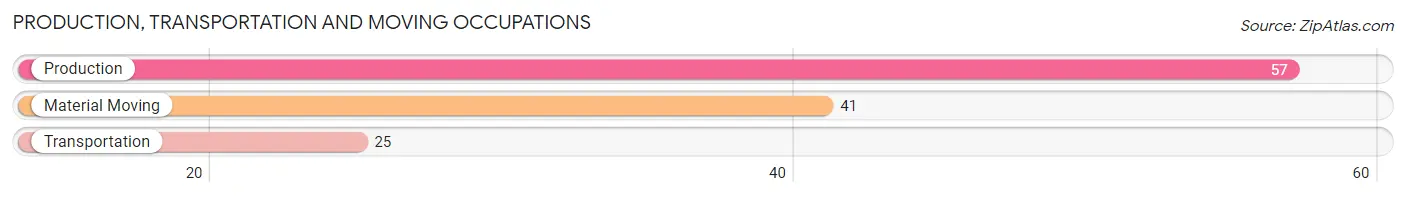
Production, Transportation and Moving Occupations
The most common Production, Transportation and Moving occupations in Kingwood are Production (57 | 4.2%), Material Moving (41 | 3.0%), and Transportation (25 | 1.8%).
Production, Transportation and Moving Occupations by Sex
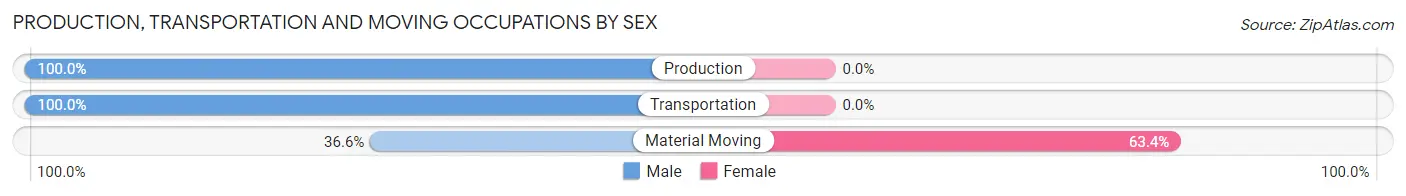
| Occupation | Male | Female |
| Production | 57 (100.0%) | 0 (0.0%) |
| Transportation | 25 (100.0%) | 0 (0.0%) |
| Material Moving | 15 (36.6%) | 26 (63.4%) |
| Total (Category) | 97 (78.9%) | 26 (21.1%) |
| Total (Overall) | 649 (47.9%) | 706 (52.1%) |
Employment Industries by Sex in Kingwood
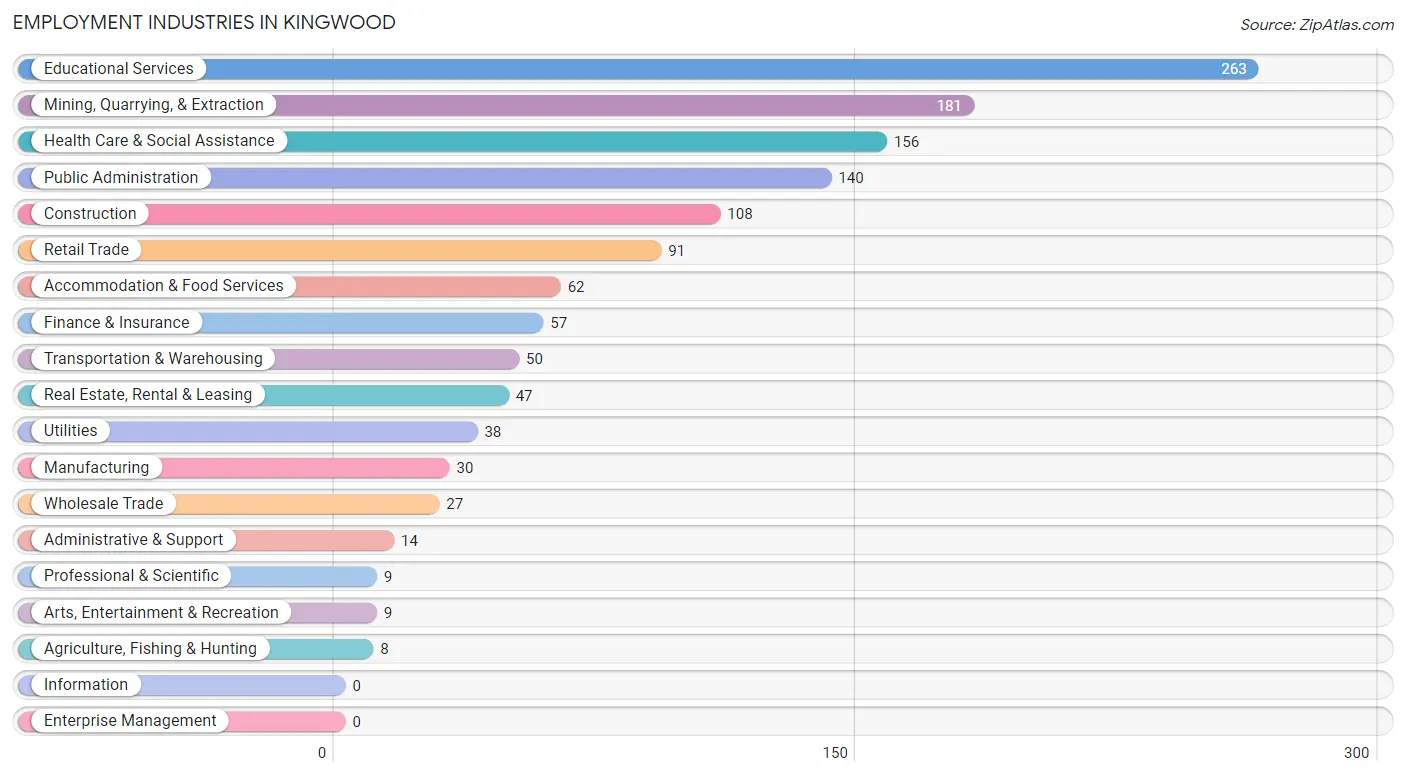
Employment Industries in Kingwood
The major employment industries in Kingwood include Educational Services (263 | 19.4%), Mining, Quarrying, & Extraction (181 | 13.4%), Health Care & Social Assistance (156 | 11.5%), Public Administration (140 | 10.3%), and Construction (108 | 8.0%).
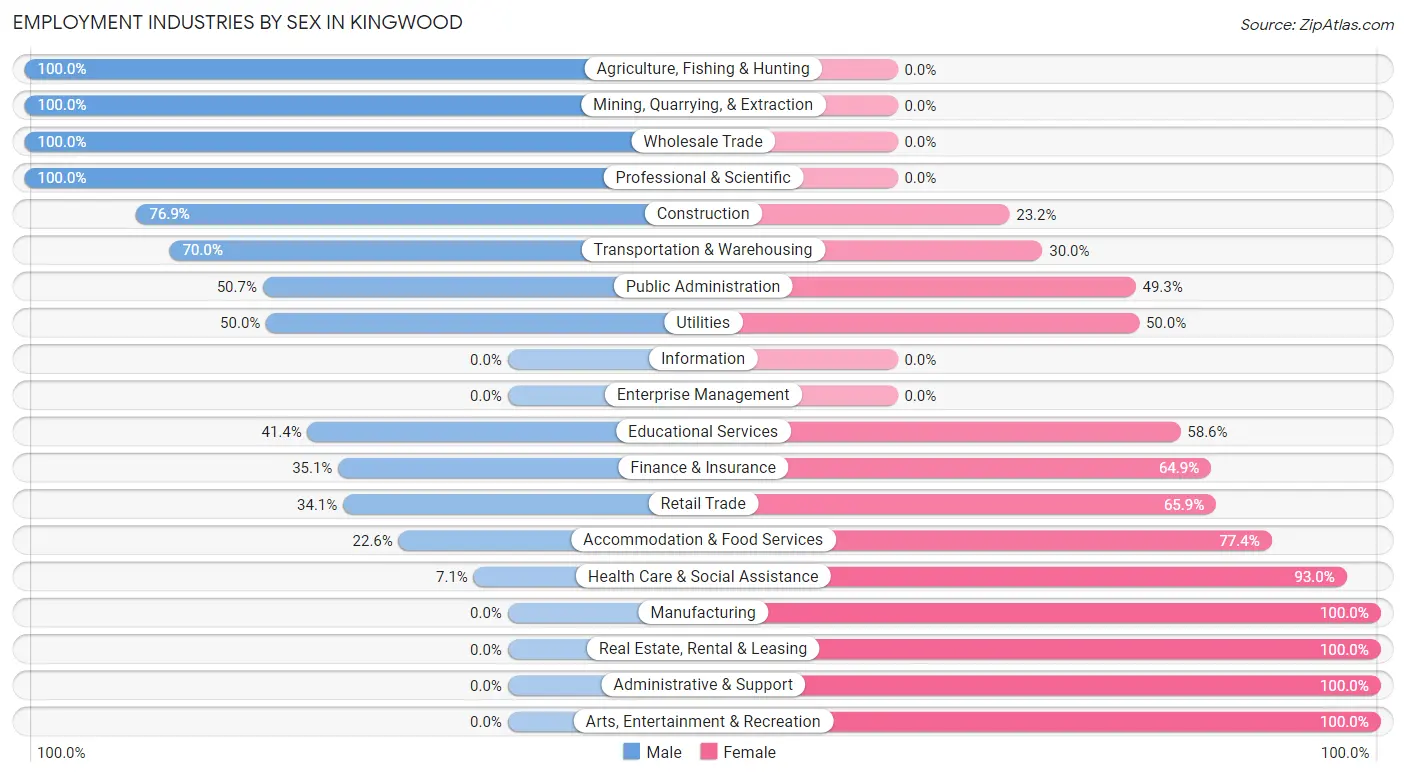
Employment Industries by Sex in Kingwood
The Kingwood industries that see more men than women are Agriculture, Fishing & Hunting (100.0%), Mining, Quarrying, & Extraction (100.0%), and Wholesale Trade (100.0%), whereas the industries that tend to have a higher number of women are Manufacturing (100.0%), Real Estate, Rental & Leasing (100.0%), and Administrative & Support (100.0%).
| Industry | Male | Female |
| Agriculture, Fishing & Hunting | 8 (100.0%) | 0 (0.0%) |
| Mining, Quarrying, & Extraction | 181 (100.0%) | 0 (0.0%) |
| Construction | 83 (76.8%) | 25 (23.2%) |
| Manufacturing | 0 (0.0%) | 30 (100.0%) |
| Wholesale Trade | 27 (100.0%) | 0 (0.0%) |
| Retail Trade | 31 (34.1%) | 60 (65.9%) |
| Transportation & Warehousing | 35 (70.0%) | 15 (30.0%) |
| Utilities | 19 (50.0%) | 19 (50.0%) |
| Information | 0 (0.0%) | 0 (0.0%) |
| Finance & Insurance | 20 (35.1%) | 37 (64.9%) |
| Real Estate, Rental & Leasing | 0 (0.0%) | 47 (100.0%) |
| Professional & Scientific | 9 (100.0%) | 0 (0.0%) |
| Enterprise Management | 0 (0.0%) | 0 (0.0%) |
| Administrative & Support | 0 (0.0%) | 14 (100.0%) |
| Educational Services | 109 (41.4%) | 154 (58.6%) |
| Health Care & Social Assistance | 11 (7.0%) | 145 (92.9%) |
| Arts, Entertainment & Recreation | 0 (0.0%) | 9 (100.0%) |
| Accommodation & Food Services | 14 (22.6%) | 48 (77.4%) |
| Public Administration | 71 (50.7%) | 69 (49.3%) |
| Total | 649 (47.9%) | 706 (52.1%) |
Education in Kingwood
School Enrollment in Kingwood
The most common levels of schooling among the 471 students in Kingwood are elementary school (183 | 38.9%), high school (102 | 21.7%), and middle school (72 | 15.3%).
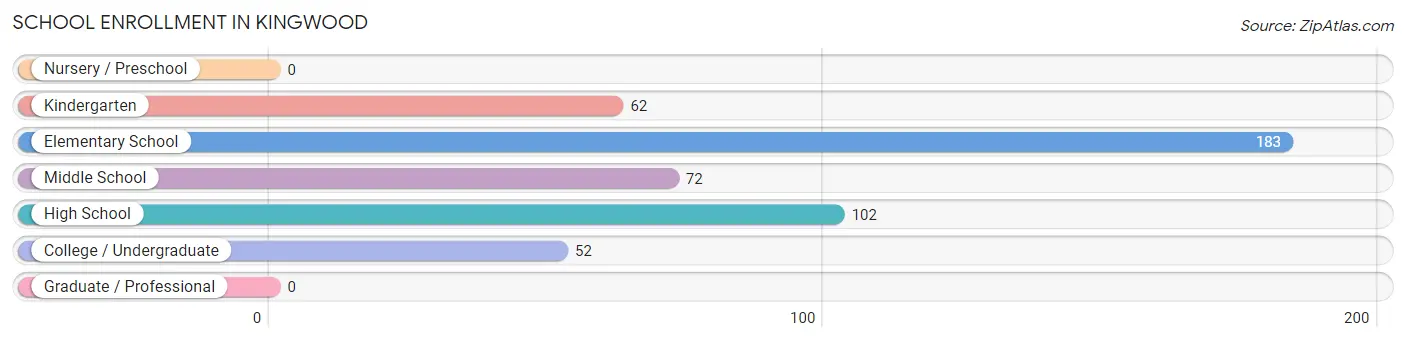
| School Level | # Students | % Students |
| Nursery / Preschool | 0 | 0.0% |
| Kindergarten | 62 | 13.2% |
| Elementary School | 183 | 38.9% |
| Middle School | 72 | 15.3% |
| High School | 102 | 21.7% |
| College / Undergraduate | 52 | 11.0% |
| Graduate / Professional | 0 | 0.0% |
| Total | 471 | 100.0% |
School Enrollment by Age by Funding Source in Kingwood
Out of a total of 471 students who are enrolled in schools in Kingwood, 95 (20.2%) attend a private institution, while the remaining 376 (79.8%) are enrolled in public schools. The age group of 5 to 9 year old has the highest likelihood of being enrolled in private schools, with 81 (38.8% in the age bracket) enrolled. Conversely, the age group of 15 to 17 year olds has the lowest likelihood of being enrolled in a private school, with 85 (100.0% in the age bracket) attending a public institution.
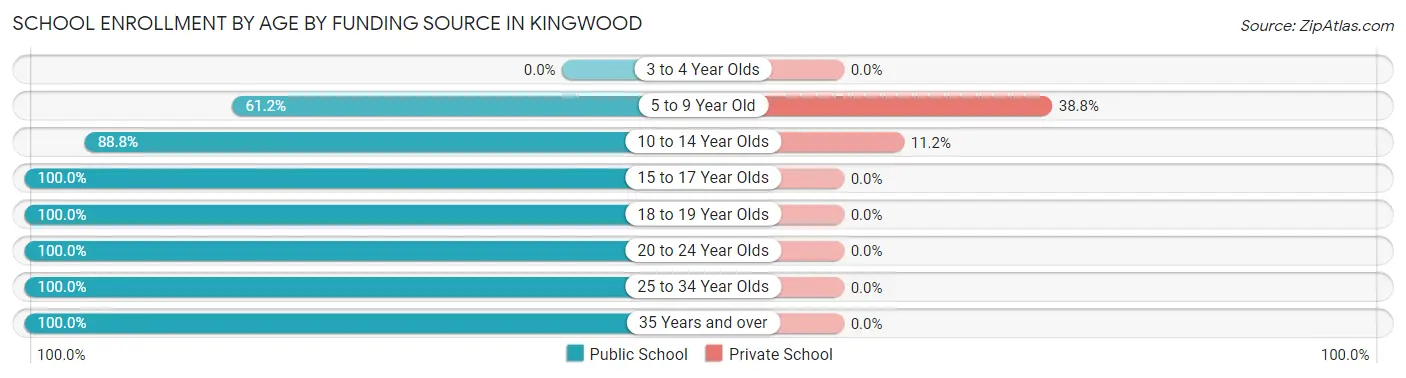
| Age Bracket | Public School | Private School |
| 3 to 4 Year Olds | 0 (0.0%) | 0 (0.0%) |
| 5 to 9 Year Old | 128 (61.2%) | 81 (38.8%) |
| 10 to 14 Year Olds | 111 (88.8%) | 14 (11.2%) |
| 15 to 17 Year Olds | 85 (100.0%) | 0 (0.0%) |
| 18 to 19 Year Olds | 12 (100.0%) | 0 (0.0%) |
| 20 to 24 Year Olds | 11 (100.0%) | 0 (0.0%) |
| 25 to 34 Year Olds | 21 (100.0%) | 0 (0.0%) |
| 35 Years and over | 8 (100.0%) | 0 (0.0%) |
| Total | 376 (79.8%) | 95 (20.2%) |
Educational Attainment by Field of Study in Kingwood
Education (196 | 27.2%), business (147 | 20.4%), bio, nature & agricultural (91 | 12.6%), science & technology (72 | 10.0%), and arts & humanities (54 | 7.5%) are the most common fields of study among 720 individuals in Kingwood who have obtained a bachelor's degree or higher.
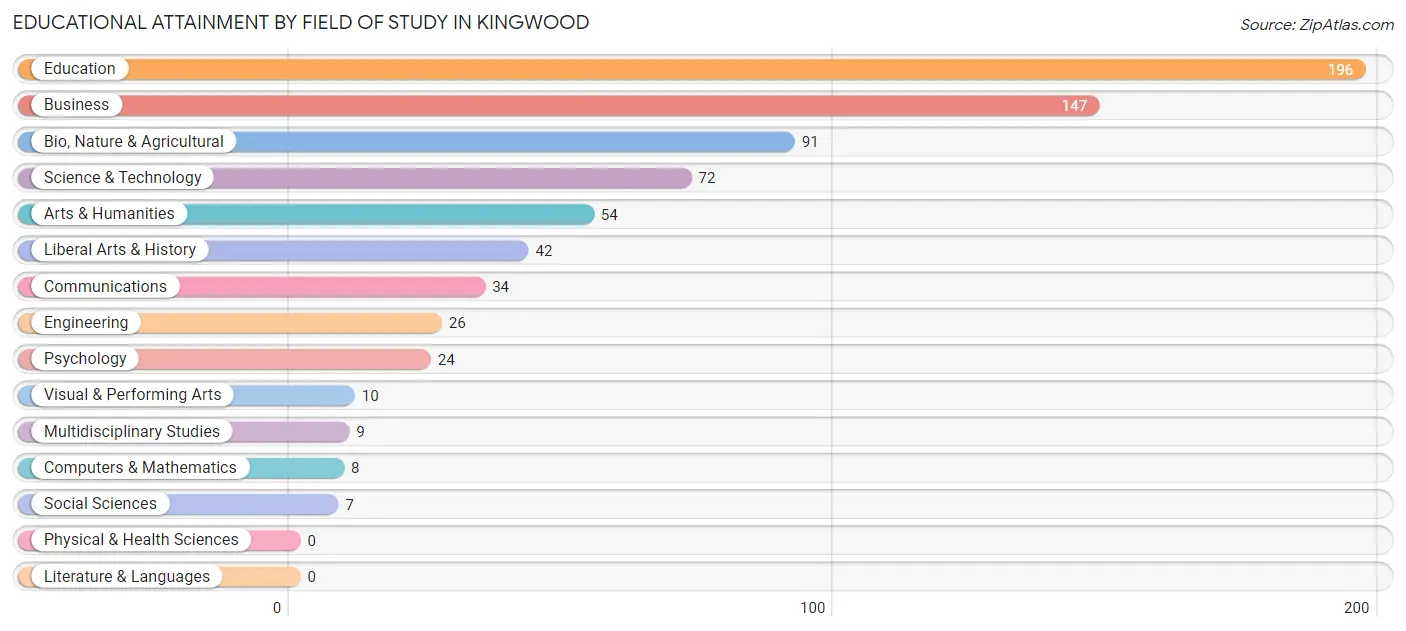
| Field of Study | # Graduates | % Graduates |
| Computers & Mathematics | 8 | 1.1% |
| Bio, Nature & Agricultural | 91 | 12.6% |
| Physical & Health Sciences | 0 | 0.0% |
| Psychology | 24 | 3.3% |
| Social Sciences | 7 | 1.0% |
| Engineering | 26 | 3.6% |
| Multidisciplinary Studies | 9 | 1.3% |
| Science & Technology | 72 | 10.0% |
| Business | 147 | 20.4% |
| Education | 196 | 27.2% |
| Literature & Languages | 0 | 0.0% |
| Liberal Arts & History | 42 | 5.8% |
| Visual & Performing Arts | 10 | 1.4% |
| Communications | 34 | 4.7% |
| Arts & Humanities | 54 | 7.5% |
| Total | 720 | 100.0% |
Transportation & Commute in Kingwood
Vehicle Availability by Sex in Kingwood
The most prevalent vehicle ownership categories in Kingwood are males with 2 vehicles (437, accounting for 69.4%) and females with 2 vehicles (449, making up 62.6%).
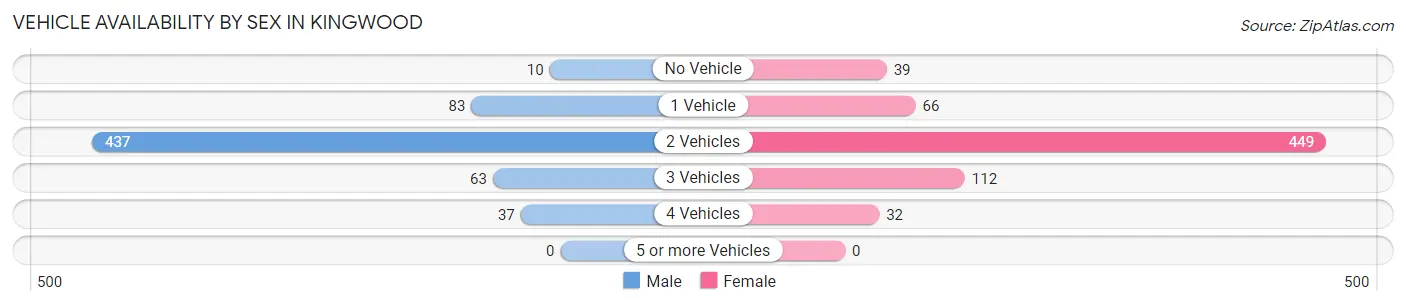
| Vehicles Available | Male | Female |
| No Vehicle | 10 (1.6%) | 39 (5.6%) |
| 1 Vehicle | 83 (13.2%) | 66 (9.5%) |
| 2 Vehicles | 437 (69.4%) | 449 (64.3%) |
| 3 Vehicles | 63 (10.0%) | 112 (16.1%) |
| 4 Vehicles | 37 (5.9%) | 32 (4.6%) |
| 5 or more Vehicles | 0 (0.0%) | 0 (0.0%) |
| Total | 630 (100.0%) | 698 (100.0%) |
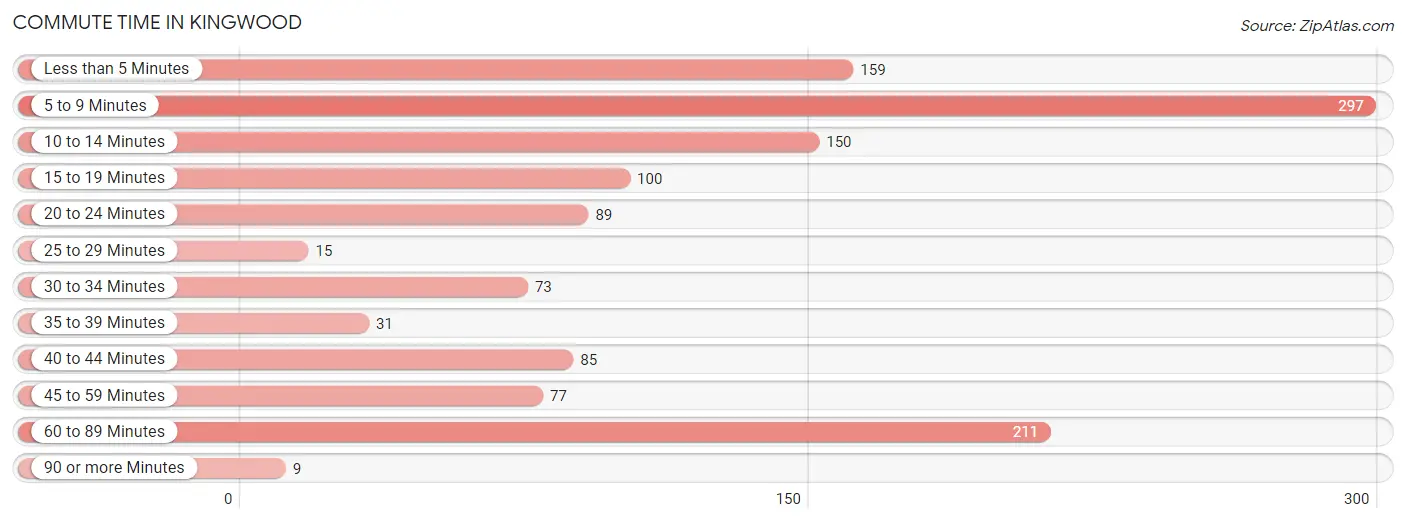
Commute Time in Kingwood
The most frequently occuring commute durations in Kingwood are 5 to 9 minutes (297 commuters, 22.9%), 60 to 89 minutes (211 commuters, 16.3%), and less than 5 minutes (159 commuters, 12.3%).
| Commute Time | # Commuters | % Commuters |
| Less than 5 Minutes | 159 | 12.3% |
| 5 to 9 Minutes | 297 | 22.9% |
| 10 to 14 Minutes | 150 | 11.6% |
| 15 to 19 Minutes | 100 | 7.7% |
| 20 to 24 Minutes | 89 | 6.9% |
| 25 to 29 Minutes | 15 | 1.2% |
| 30 to 34 Minutes | 73 | 5.6% |
| 35 to 39 Minutes | 31 | 2.4% |
| 40 to 44 Minutes | 85 | 6.6% |
| 45 to 59 Minutes | 77 | 5.9% |
| 60 to 89 Minutes | 211 | 16.3% |
| 90 or more Minutes | 9 | 0.7% |
Commute Time by Sex in Kingwood
The most common commute times in Kingwood are 60 to 89 minutes (192 commuters, 30.5%) for males and 5 to 9 minutes (167 commuters, 25.1%) for females.
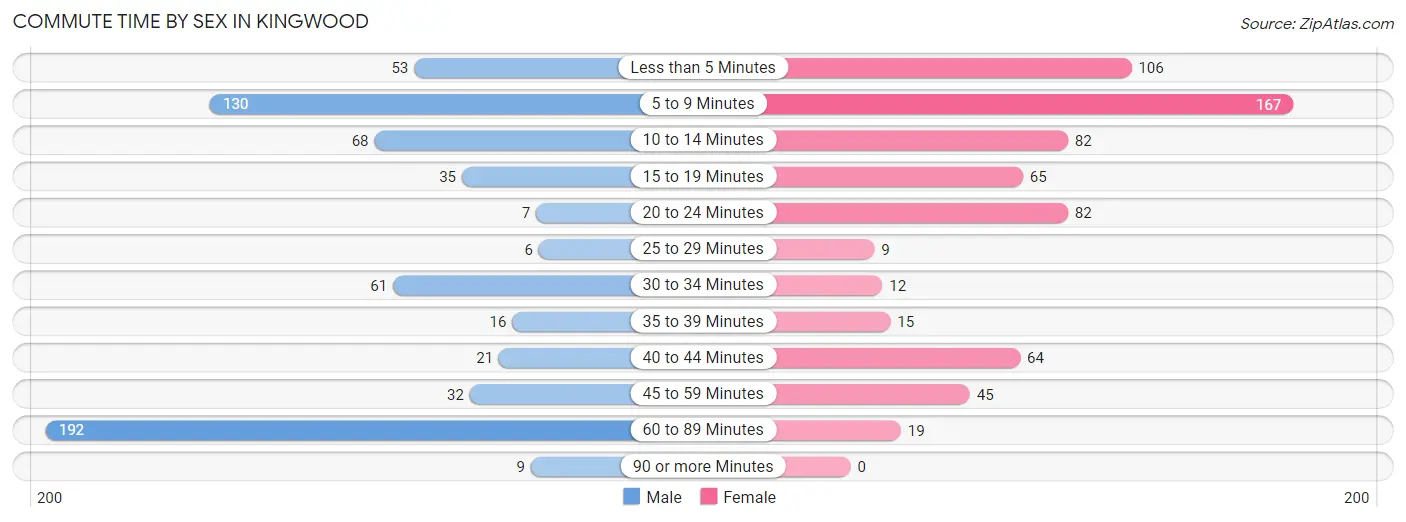
| Commute Time | Male | Female |
| Less than 5 Minutes | 53 (8.4%) | 106 (15.9%) |
| 5 to 9 Minutes | 130 (20.6%) | 167 (25.1%) |
| 10 to 14 Minutes | 68 (10.8%) | 82 (12.3%) |
| 15 to 19 Minutes | 35 (5.6%) | 65 (9.8%) |
| 20 to 24 Minutes | 7 (1.1%) | 82 (12.3%) |
| 25 to 29 Minutes | 6 (0.9%) | 9 (1.3%) |
| 30 to 34 Minutes | 61 (9.7%) | 12 (1.8%) |
| 35 to 39 Minutes | 16 (2.5%) | 15 (2.2%) |
| 40 to 44 Minutes | 21 (3.3%) | 64 (9.6%) |
| 45 to 59 Minutes | 32 (5.1%) | 45 (6.8%) |
| 60 to 89 Minutes | 192 (30.5%) | 19 (2.9%) |
| 90 or more Minutes | 9 (1.4%) | 0 (0.0%) |
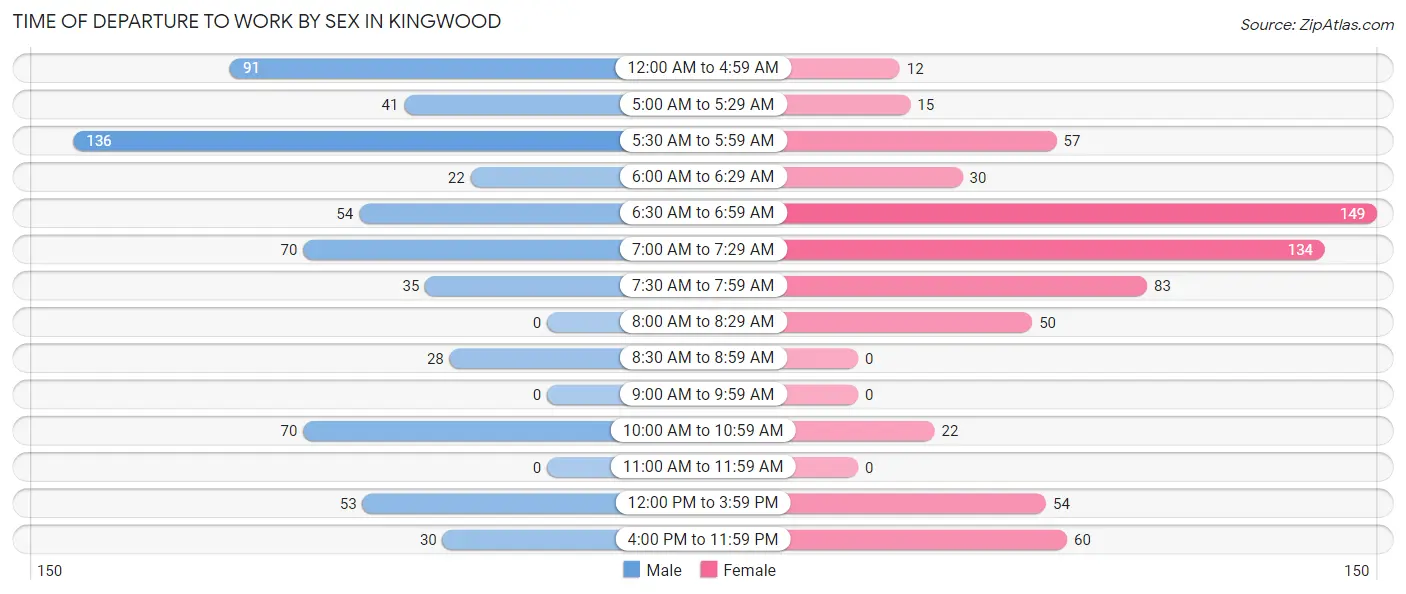
Time of Departure to Work by Sex in Kingwood
The most frequent times of departure to work in Kingwood are 5:30 AM to 5:59 AM (136, 21.6%) for males and 6:30 AM to 6:59 AM (149, 22.4%) for females.
| Time of Departure | Male | Female |
| 12:00 AM to 4:59 AM | 91 (14.4%) | 12 (1.8%) |
| 5:00 AM to 5:29 AM | 41 (6.5%) | 15 (2.2%) |
| 5:30 AM to 5:59 AM | 136 (21.6%) | 57 (8.6%) |
| 6:00 AM to 6:29 AM | 22 (3.5%) | 30 (4.5%) |
| 6:30 AM to 6:59 AM | 54 (8.6%) | 149 (22.4%) |
| 7:00 AM to 7:29 AM | 70 (11.1%) | 134 (20.1%) |
| 7:30 AM to 7:59 AM | 35 (5.6%) | 83 (12.5%) |
| 8:00 AM to 8:29 AM | 0 (0.0%) | 50 (7.5%) |
| 8:30 AM to 8:59 AM | 28 (4.4%) | 0 (0.0%) |
| 9:00 AM to 9:59 AM | 0 (0.0%) | 0 (0.0%) |
| 10:00 AM to 10:59 AM | 70 (11.1%) | 22 (3.3%) |
| 11:00 AM to 11:59 AM | 0 (0.0%) | 0 (0.0%) |
| 12:00 PM to 3:59 PM | 53 (8.4%) | 54 (8.1%) |
| 4:00 PM to 11:59 PM | 30 (4.8%) | 60 (9.0%) |
| Total | 630 (100.0%) | 666 (100.0%) |
Housing Occupancy in Kingwood
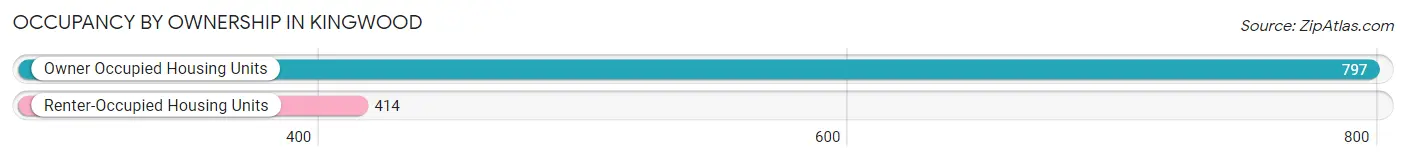
Occupancy by Ownership in Kingwood
Of the total 1,211 dwellings in Kingwood, owner-occupied units account for 797 (65.8%), while renter-occupied units make up 414 (34.2%).
| Occupancy | # Housing Units | % Housing Units |
| Owner Occupied Housing Units | 797 | 65.8% |
| Renter-Occupied Housing Units | 414 | 34.2% |
| Total Occupied Housing Units | 1,211 | 100.0% |
Occupancy by Household Size in Kingwood
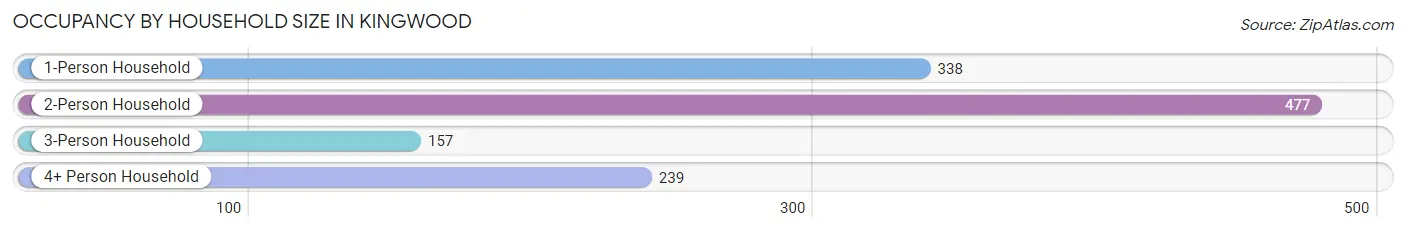
| Household Size | # Housing Units | % Housing Units |
| 1-Person Household | 338 | 27.9% |
| 2-Person Household | 477 | 39.4% |
| 3-Person Household | 157 | 13.0% |
| 4+ Person Household | 239 | 19.7% |
| Total Housing Units | 1,211 | 100.0% |
Occupancy by Ownership by Household Size in Kingwood
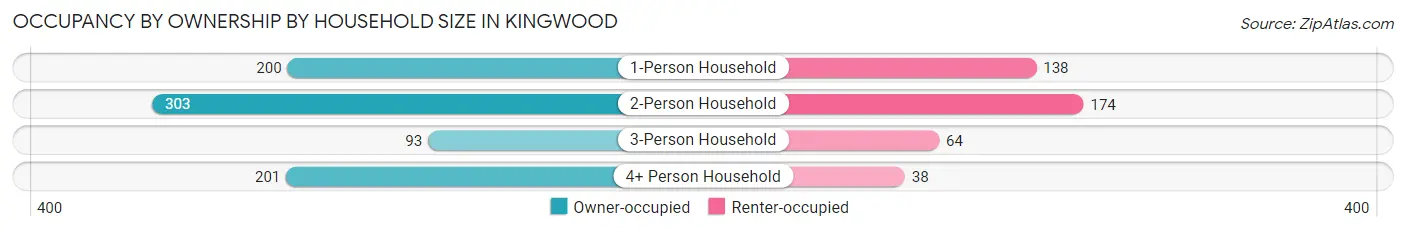
| Household Size | Owner-occupied | Renter-occupied |
| 1-Person Household | 200 (59.2%) | 138 (40.8%) |
| 2-Person Household | 303 (63.5%) | 174 (36.5%) |
| 3-Person Household | 93 (59.2%) | 64 (40.8%) |
| 4+ Person Household | 201 (84.1%) | 38 (15.9%) |
| Total Housing Units | 797 (65.8%) | 414 (34.2%) |
Occupancy by Educational Attainment in Kingwood
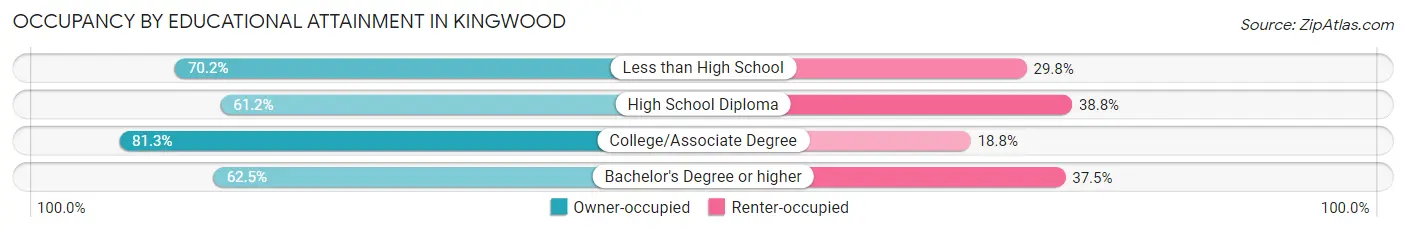
| Household Size | Owner-occupied | Renter-occupied |
| Less than High School | 40 (70.2%) | 17 (29.8%) |
| High School Diploma | 290 (61.2%) | 184 (38.8%) |
| College/Associate Degree | 182 (81.2%) | 42 (18.8%) |
| Bachelor's Degree or higher | 285 (62.5%) | 171 (37.5%) |
Occupancy by Age of Householder in Kingwood
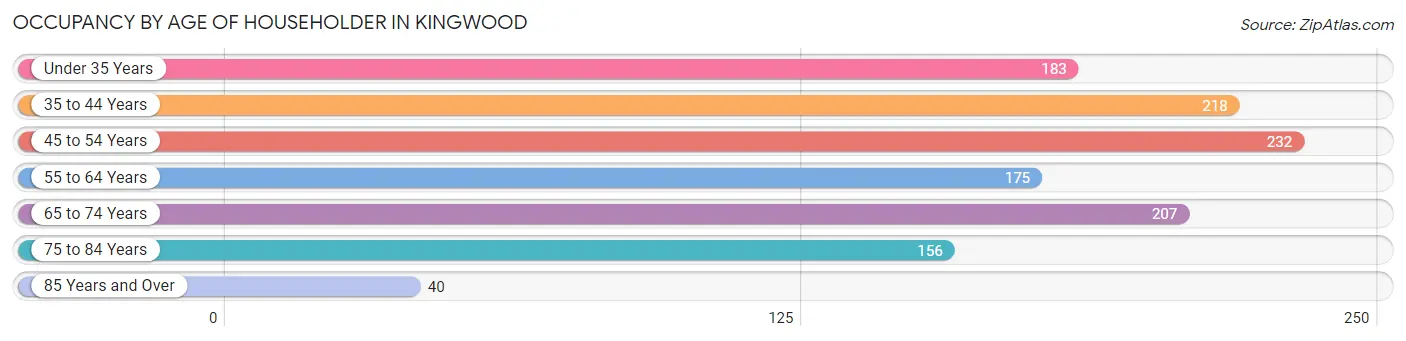
| Age Bracket | # Households | % Households |
| Under 35 Years | 183 | 15.1% |
| 35 to 44 Years | 218 | 18.0% |
| 45 to 54 Years | 232 | 19.2% |
| 55 to 64 Years | 175 | 14.4% |
| 65 to 74 Years | 207 | 17.1% |
| 75 to 84 Years | 156 | 12.9% |
| 85 Years and Over | 40 | 3.3% |
| Total | 1,211 | 100.0% |
Housing Finances in Kingwood
Median Income by Occupancy in Kingwood
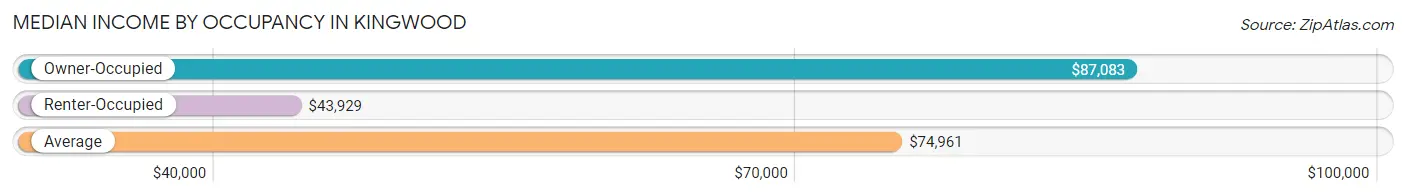
| Occupancy Type | # Households | Median Income |
| Owner-Occupied | 797 (65.8%) | $87,083 |
| Renter-Occupied | 414 (34.2%) | $43,929 |
| Average | 1,211 (100.0%) | $74,961 |
Occupancy by Householder Income Bracket in Kingwood
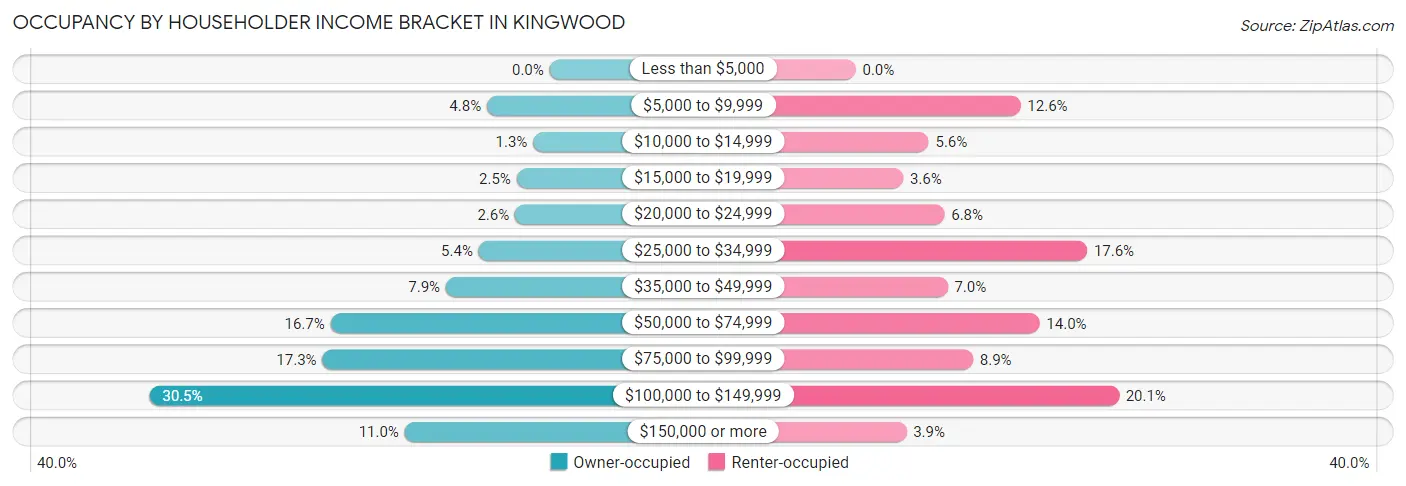
| Income Bracket | Owner-occupied | Renter-occupied |
| Less than $5,000 | 0 (0.0%) | 0 (0.0%) |
| $5,000 to $9,999 | 38 (4.8%) | 52 (12.6%) |
| $10,000 to $14,999 | 10 (1.3%) | 23 (5.6%) |
| $15,000 to $19,999 | 20 (2.5%) | 15 (3.6%) |
| $20,000 to $24,999 | 21 (2.6%) | 28 (6.8%) |
| $25,000 to $34,999 | 43 (5.4%) | 73 (17.6%) |
| $35,000 to $49,999 | 63 (7.9%) | 29 (7.0%) |
| $50,000 to $74,999 | 133 (16.7%) | 58 (14.0%) |
| $75,000 to $99,999 | 138 (17.3%) | 37 (8.9%) |
| $100,000 to $149,999 | 243 (30.5%) | 83 (20.1%) |
| $150,000 or more | 88 (11.0%) | 16 (3.9%) |
| Total | 797 (100.0%) | 414 (100.0%) |
Monthly Housing Cost Tiers in Kingwood
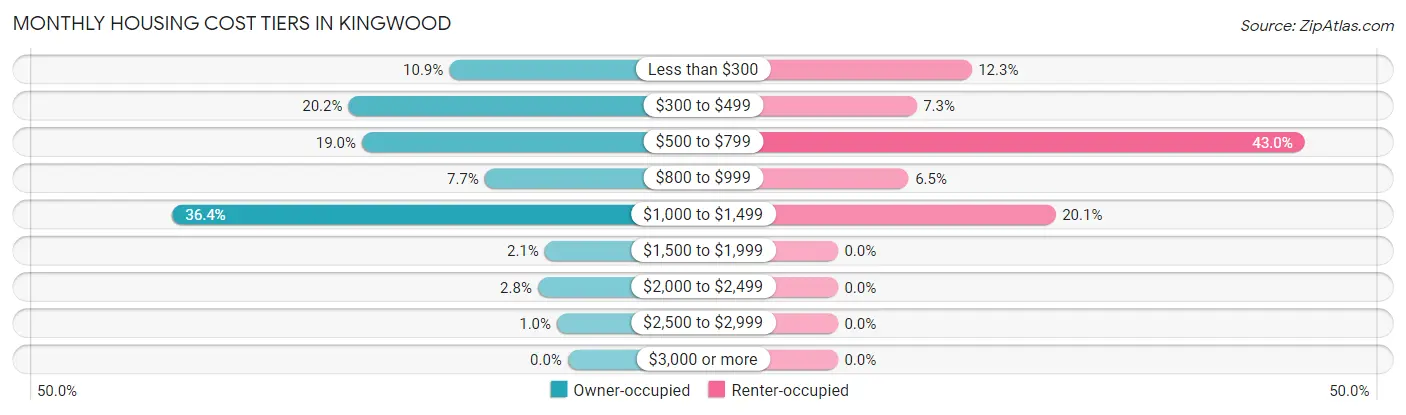
| Monthly Cost | Owner-occupied | Renter-occupied |
| Less than $300 | 87 (10.9%) | 51 (12.3%) |
| $300 to $499 | 161 (20.2%) | 30 (7.2%) |
| $500 to $799 | 151 (19.0%) | 178 (43.0%) |
| $800 to $999 | 61 (7.6%) | 27 (6.5%) |
| $1,000 to $1,499 | 290 (36.4%) | 83 (20.1%) |
| $1,500 to $1,999 | 17 (2.1%) | 0 (0.0%) |
| $2,000 to $2,499 | 22 (2.8%) | 0 (0.0%) |
| $2,500 to $2,999 | 8 (1.0%) | 0 (0.0%) |
| $3,000 or more | 0 (0.0%) | 0 (0.0%) |
| Total | 797 (100.0%) | 414 (100.0%) |
Physical Housing Characteristics in Kingwood
Housing Structures in Kingwood
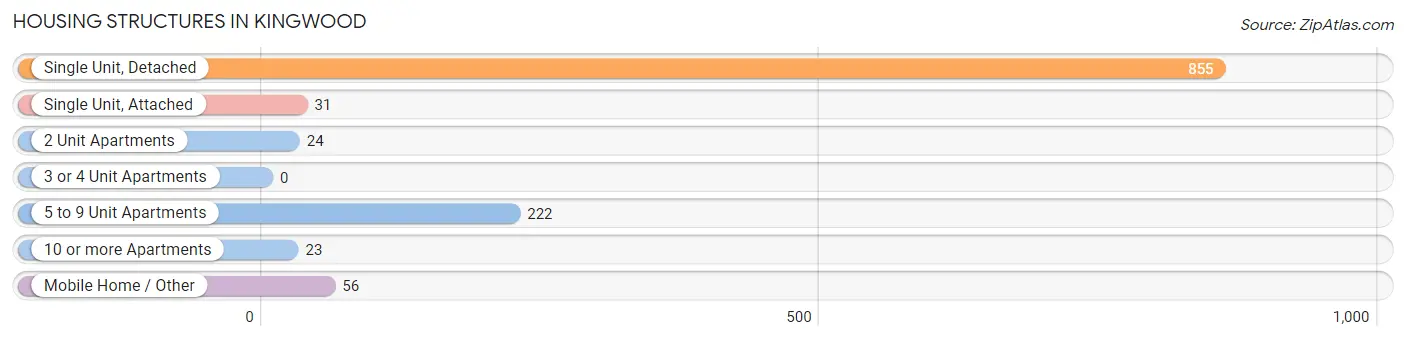
| Structure Type | # Housing Units | % Housing Units |
| Single Unit, Detached | 855 | 70.6% |
| Single Unit, Attached | 31 | 2.6% |
| 2 Unit Apartments | 24 | 2.0% |
| 3 or 4 Unit Apartments | 0 | 0.0% |
| 5 to 9 Unit Apartments | 222 | 18.3% |
| 10 or more Apartments | 23 | 1.9% |
| Mobile Home / Other | 56 | 4.6% |
| Total | 1,211 | 100.0% |
Housing Structures by Occupancy in Kingwood
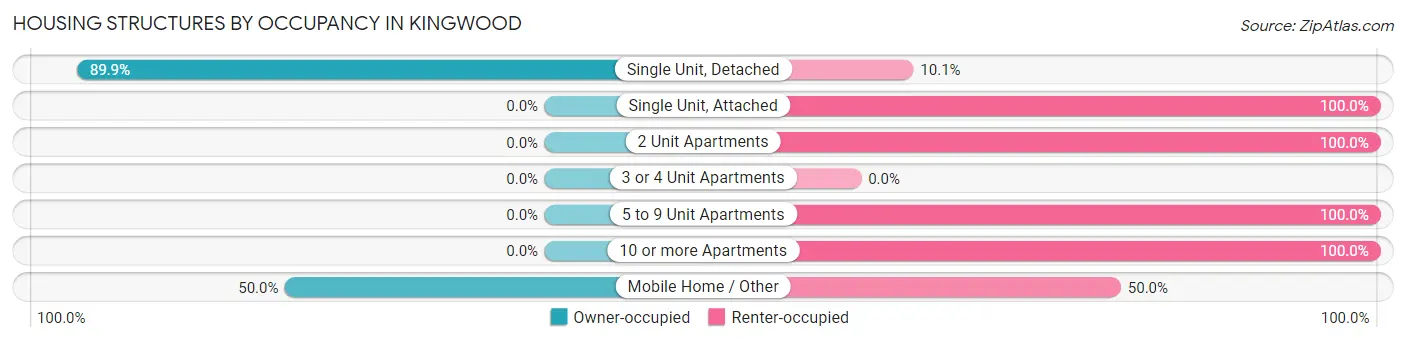
| Structure Type | Owner-occupied | Renter-occupied |
| Single Unit, Detached | 769 (89.9%) | 86 (10.1%) |
| Single Unit, Attached | 0 (0.0%) | 31 (100.0%) |
| 2 Unit Apartments | 0 (0.0%) | 24 (100.0%) |
| 3 or 4 Unit Apartments | 0 (0.0%) | 0 (0.0%) |
| 5 to 9 Unit Apartments | 0 (0.0%) | 222 (100.0%) |
| 10 or more Apartments | 0 (0.0%) | 23 (100.0%) |
| Mobile Home / Other | 28 (50.0%) | 28 (50.0%) |
| Total | 797 (65.8%) | 414 (34.2%) |
Housing Structures by Number of Rooms in Kingwood
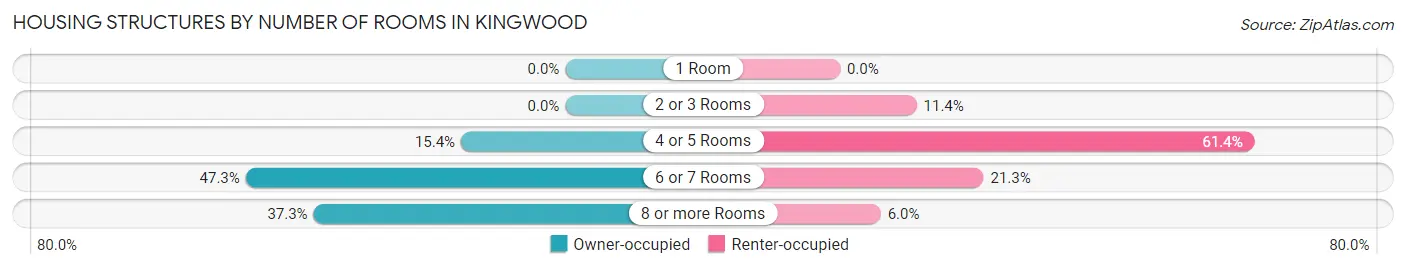
| Number of Rooms | Owner-occupied | Renter-occupied |
| 1 Room | 0 (0.0%) | 0 (0.0%) |
| 2 or 3 Rooms | 0 (0.0%) | 47 (11.4%) |
| 4 or 5 Rooms | 123 (15.4%) | 254 (61.4%) |
| 6 or 7 Rooms | 377 (47.3%) | 88 (21.3%) |
| 8 or more Rooms | 297 (37.3%) | 25 (6.0%) |
| Total | 797 (100.0%) | 414 (100.0%) |
Housing Structure by Heating Type in Kingwood
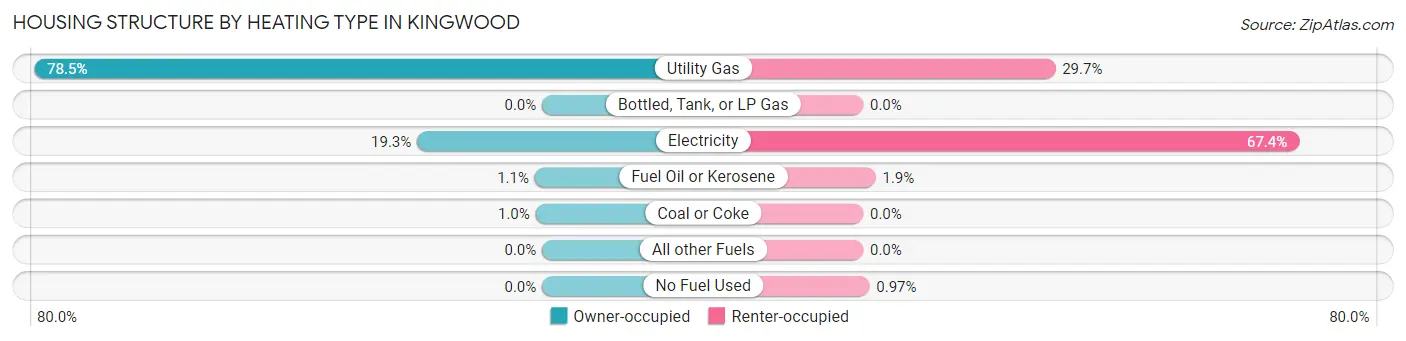
| Heating Type | Owner-occupied | Renter-occupied |
| Utility Gas | 626 (78.5%) | 123 (29.7%) |
| Bottled, Tank, or LP Gas | 0 (0.0%) | 0 (0.0%) |
| Electricity | 154 (19.3%) | 279 (67.4%) |
| Fuel Oil or Kerosene | 9 (1.1%) | 8 (1.9%) |
| Coal or Coke | 8 (1.0%) | 0 (0.0%) |
| All other Fuels | 0 (0.0%) | 0 (0.0%) |
| No Fuel Used | 0 (0.0%) | 4 (1.0%) |
| Total | 797 (100.0%) | 414 (100.0%) |
Household Vehicle Usage in Kingwood
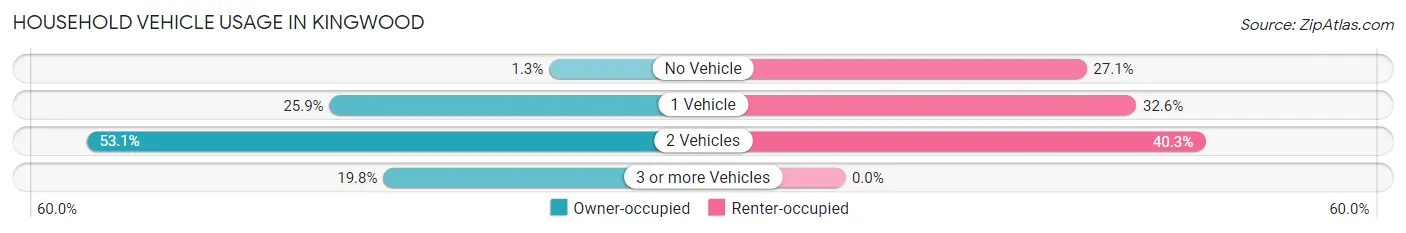
| Vehicles per Household | Owner-occupied | Renter-occupied |
| No Vehicle | 10 (1.3%) | 112 (27.1%) |
| 1 Vehicle | 206 (25.9%) | 135 (32.6%) |
| 2 Vehicles | 423 (53.1%) | 167 (40.3%) |
| 3 or more Vehicles | 158 (19.8%) | 0 (0.0%) |
| Total | 797 (100.0%) | 414 (100.0%) |
Real Estate & Mortgages in Kingwood
Real Estate and Mortgage Overview in Kingwood
| Characteristic | Without Mortgage | With Mortgage |
| Housing Units | 316 | 481 |
| Median Property Value | $163,100 | $162,600 |
| Median Household Income | $69,091 | $79 |
| Monthly Housing Costs | $399 | $0 |
| Real Estate Taxes | $792 | $0 |
Property Value by Mortgage Status in Kingwood
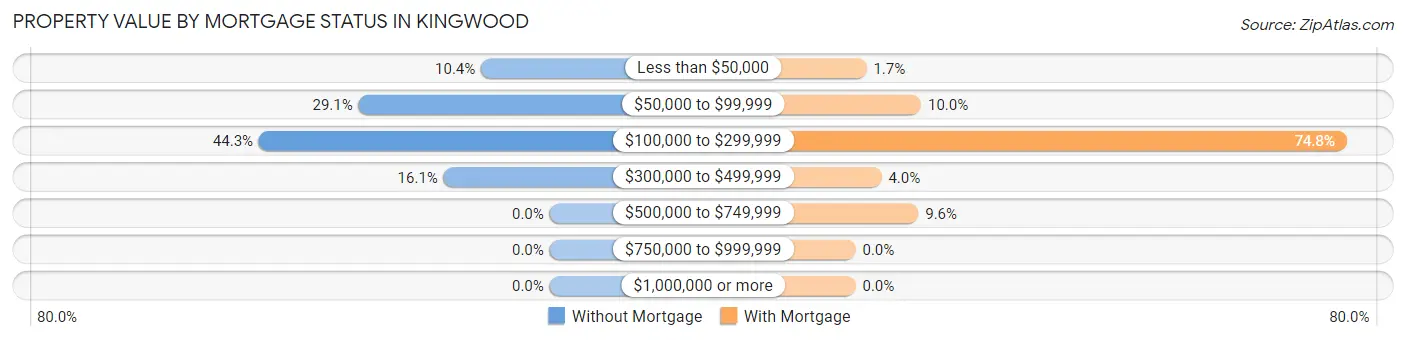
| Property Value | Without Mortgage | With Mortgage |
| Less than $50,000 | 33 (10.4%) | 8 (1.7%) |
| $50,000 to $99,999 | 92 (29.1%) | 48 (10.0%) |
| $100,000 to $299,999 | 140 (44.3%) | 360 (74.8%) |
| $300,000 to $499,999 | 51 (16.1%) | 19 (4.0%) |
| $500,000 to $749,999 | 0 (0.0%) | 46 (9.6%) |
| $750,000 to $999,999 | 0 (0.0%) | 0 (0.0%) |
| $1,000,000 or more | 0 (0.0%) | 0 (0.0%) |
| Total | 316 (100.0%) | 481 (100.0%) |
Household Income by Mortgage Status in Kingwood
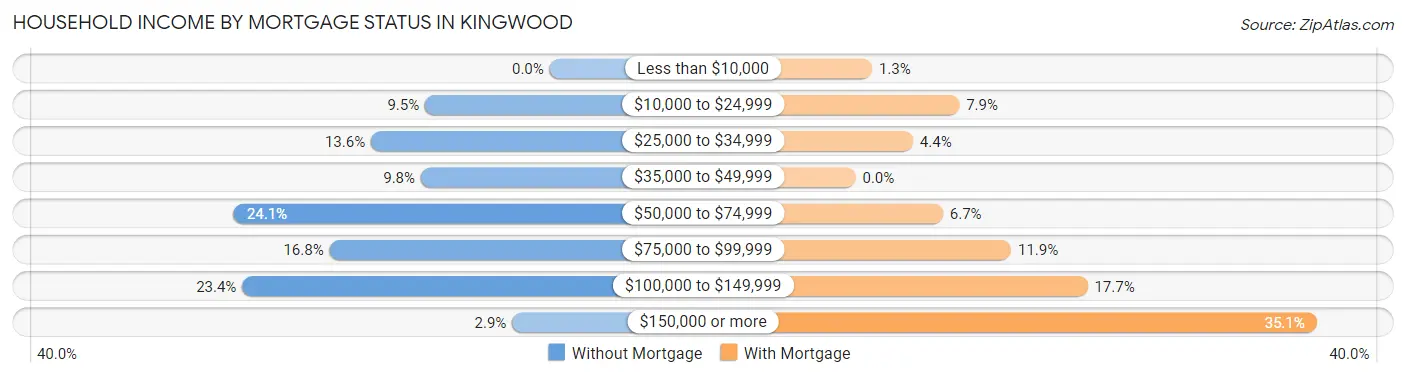
| Household Income | Without Mortgage | With Mortgage |
| Less than $10,000 | 0 (0.0%) | 6 (1.3%) |
| $10,000 to $24,999 | 30 (9.5%) | 38 (7.9%) |
| $25,000 to $34,999 | 43 (13.6%) | 21 (4.4%) |
| $35,000 to $49,999 | 31 (9.8%) | 0 (0.0%) |
| $50,000 to $74,999 | 76 (24.0%) | 32 (6.7%) |
| $75,000 to $99,999 | 53 (16.8%) | 57 (11.8%) |
| $100,000 to $149,999 | 74 (23.4%) | 85 (17.7%) |
| $150,000 or more | 9 (2.9%) | 169 (35.1%) |
| Total | 316 (100.0%) | 481 (100.0%) |
Property Value to Household Income Ratio in Kingwood
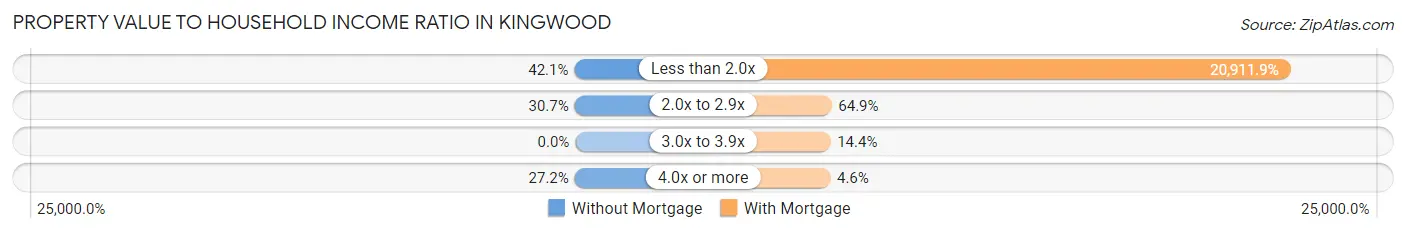
| Value-to-Income Ratio | Without Mortgage | With Mortgage |
| Less than 2.0x | 133 (42.1%) | 100,586 (20,911.9%) |
| 2.0x to 2.9x | 97 (30.7%) | 312 (64.9%) |
| 3.0x to 3.9x | 0 (0.0%) | 69 (14.3%) |
| 4.0x or more | 86 (27.2%) | 22 (4.6%) |
| Total | 316 (100.0%) | 481 (100.0%) |
Real Estate Taxes by Mortgage Status in Kingwood
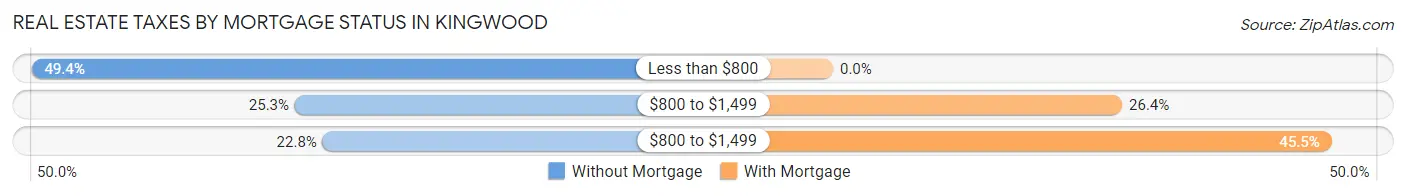
| Property Taxes | Without Mortgage | With Mortgage |
| Less than $800 | 156 (49.4%) | 0 (0.0%) |
| $800 to $1,499 | 80 (25.3%) | 127 (26.4%) |
| $800 to $1,499 | 72 (22.8%) | 219 (45.5%) |
| Total | 316 (100.0%) | 481 (100.0%) |
Health & Disability in Kingwood
Health Insurance Coverage by Age in Kingwood
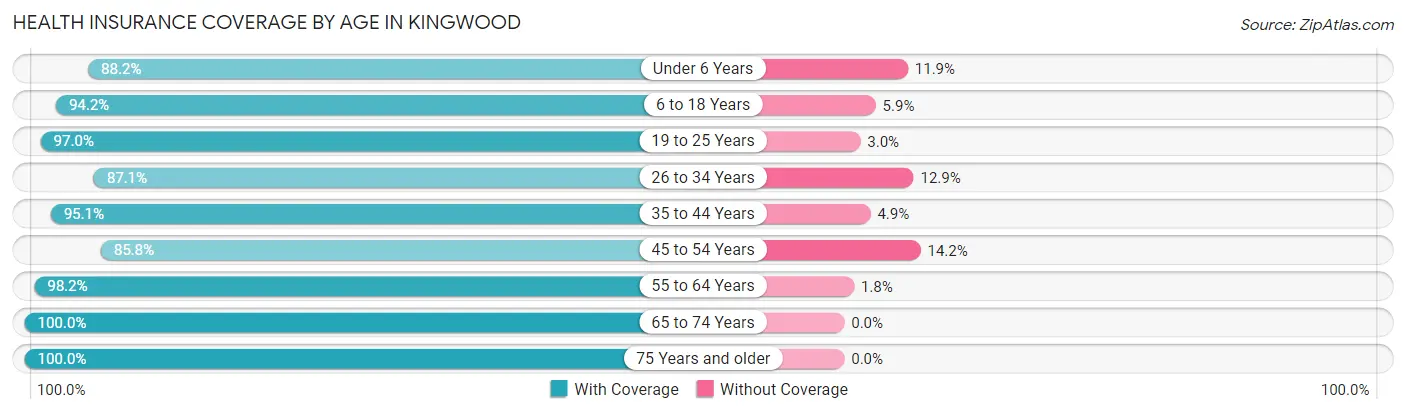
| Age Bracket | With Coverage | Without Coverage |
| Under 6 Years | 253 (88.1%) | 34 (11.8%) |
| 6 to 18 Years | 386 (94.2%) | 24 (5.9%) |
| 19 to 25 Years | 227 (97.0%) | 7 (3.0%) |
| 26 to 34 Years | 290 (87.1%) | 43 (12.9%) |
| 35 to 44 Years | 351 (95.1%) | 18 (4.9%) |
| 45 to 54 Years | 368 (85.8%) | 61 (14.2%) |
| 55 to 64 Years | 272 (98.2%) | 5 (1.8%) |
| 65 to 74 Years | 282 (100.0%) | 0 (0.0%) |
| 75 Years and older | 263 (100.0%) | 0 (0.0%) |
| Total | 2,692 (93.3%) | 192 (6.7%) |
Health Insurance Coverage by Citizenship Status in Kingwood
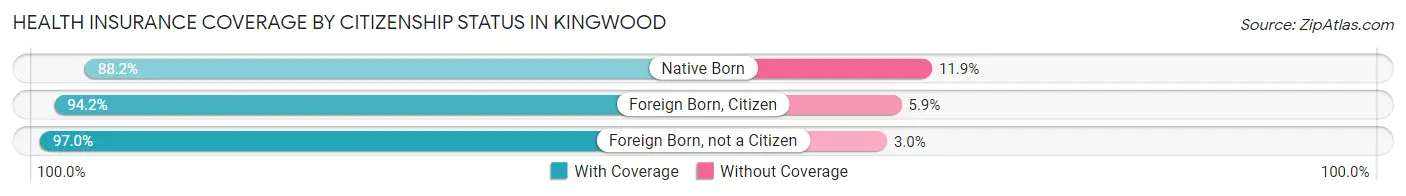
| Citizenship Status | With Coverage | Without Coverage |
| Native Born | 253 (88.1%) | 34 (11.8%) |
| Foreign Born, Citizen | 386 (94.2%) | 24 (5.9%) |
| Foreign Born, not a Citizen | 227 (97.0%) | 7 (3.0%) |
Health Insurance Coverage by Household Income in Kingwood
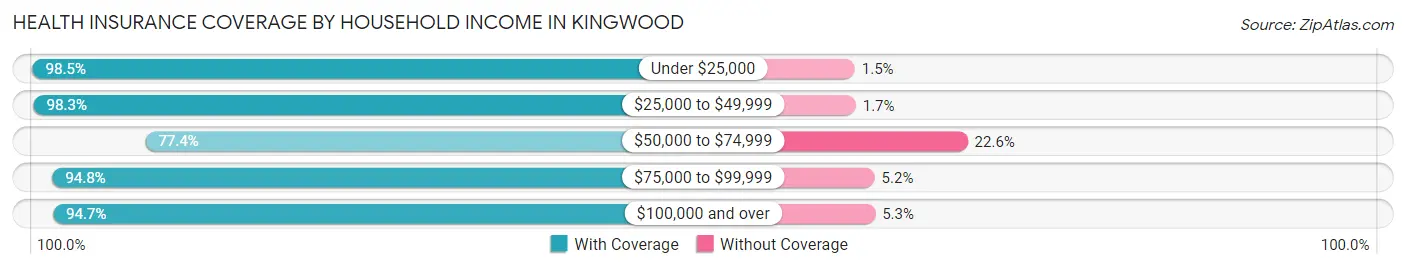
| Household Income | With Coverage | Without Coverage |
| Under $25,000 | 458 (98.5%) | 7 (1.5%) |
| $25,000 to $49,999 | 350 (98.3%) | 6 (1.7%) |
| $50,000 to $74,999 | 311 (77.4%) | 91 (22.6%) |
| $75,000 to $99,999 | 454 (94.8%) | 25 (5.2%) |
| $100,000 and over | 1,119 (94.7%) | 63 (5.3%) |
Public vs Private Health Insurance Coverage by Age in Kingwood
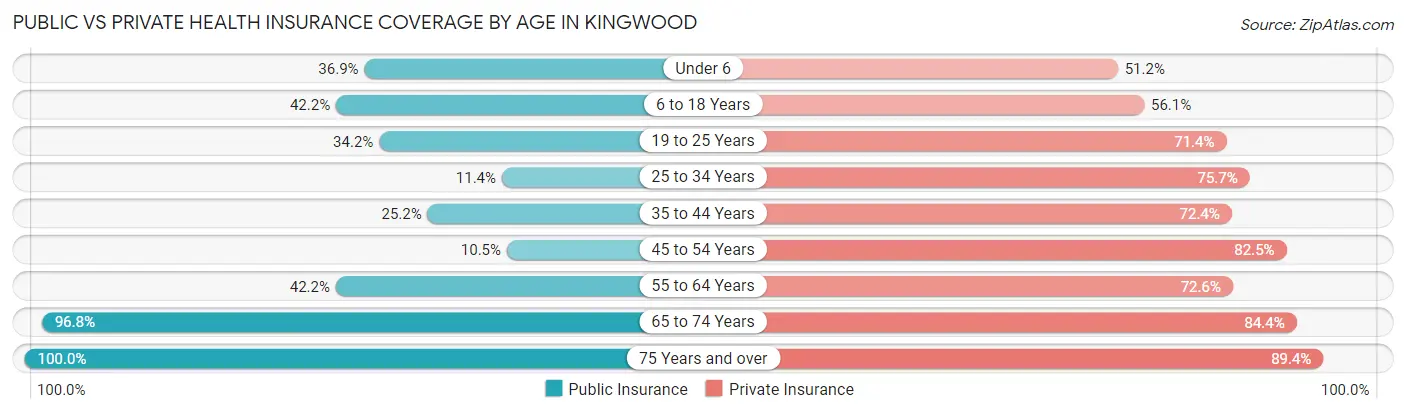
| Age Bracket | Public Insurance | Private Insurance |
| Under 6 | 106 (36.9%) | 147 (51.2%) |
| 6 to 18 Years | 173 (42.2%) | 230 (56.1%) |
| 19 to 25 Years | 80 (34.2%) | 167 (71.4%) |
| 25 to 34 Years | 38 (11.4%) | 252 (75.7%) |
| 35 to 44 Years | 93 (25.2%) | 267 (72.4%) |
| 45 to 54 Years | 45 (10.5%) | 354 (82.5%) |
| 55 to 64 Years | 117 (42.2%) | 201 (72.6%) |
| 65 to 74 Years | 273 (96.8%) | 238 (84.4%) |
| 75 Years and over | 263 (100.0%) | 235 (89.3%) |
| Total | 1,188 (41.2%) | 2,091 (72.5%) |
Disability Status by Sex by Age in Kingwood
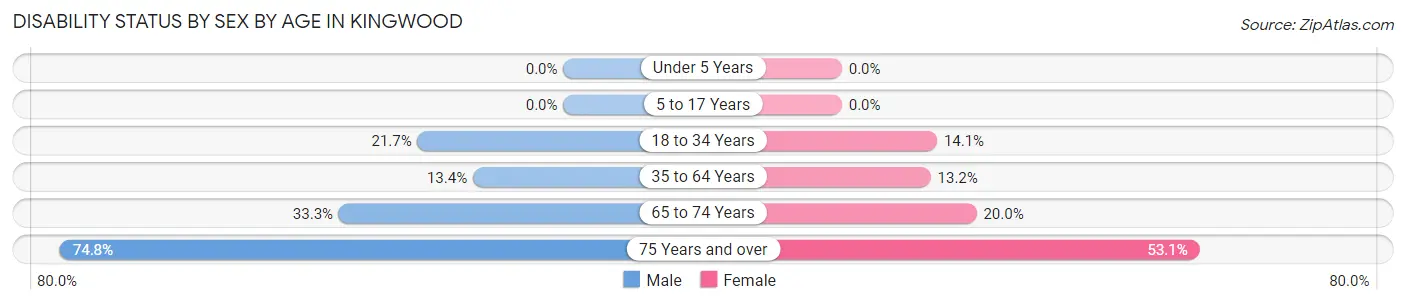
| Age Bracket | Male | Female |
| Under 5 Years | 0 (0.0%) | 0 (0.0%) |
| 5 to 17 Years | 0 (0.0%) | 0 (0.0%) |
| 18 to 34 Years | 63 (21.6%) | 39 (14.1%) |
| 35 to 64 Years | 69 (13.4%) | 74 (13.2%) |
| 65 to 74 Years | 39 (33.3%) | 33 (20.0%) |
| 75 Years and over | 77 (74.8%) | 85 (53.1%) |
Disability Class by Sex by Age in Kingwood
Disability Class: Hearing Difficulty
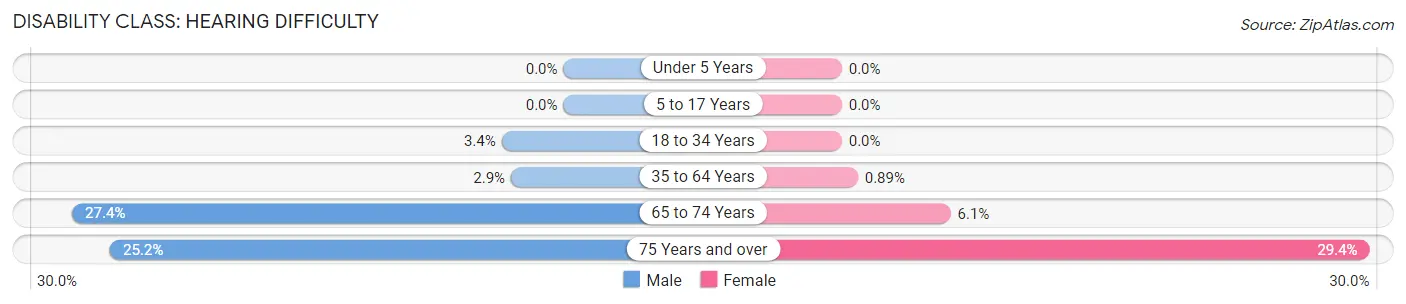
| Age Bracket | Male | Female |
| Under 5 Years | 0 (0.0%) | 0 (0.0%) |
| 5 to 17 Years | 0 (0.0%) | 0 (0.0%) |
| 18 to 34 Years | 10 (3.4%) | 0 (0.0%) |
| 35 to 64 Years | 15 (2.9%) | 5 (0.9%) |
| 65 to 74 Years | 32 (27.4%) | 10 (6.1%) |
| 75 Years and over | 26 (25.2%) | 47 (29.4%) |
Disability Class: Vision Difficulty
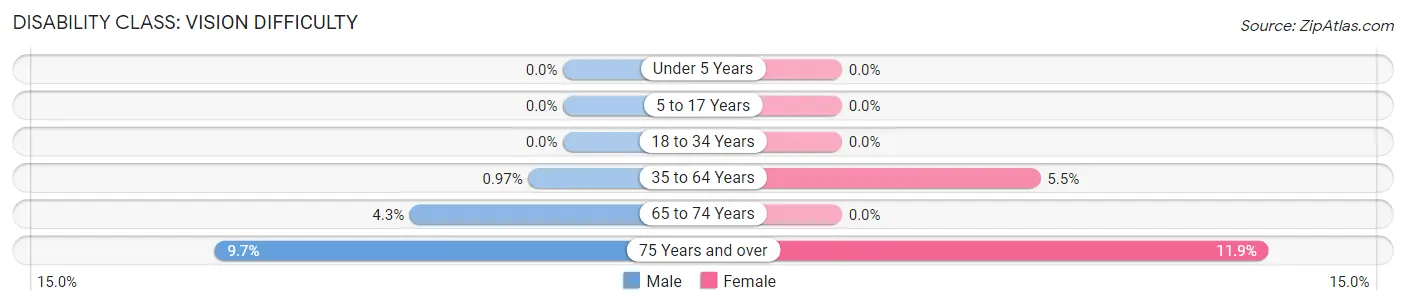
| Age Bracket | Male | Female |
| Under 5 Years | 0 (0.0%) | 0 (0.0%) |
| 5 to 17 Years | 0 (0.0%) | 0 (0.0%) |
| 18 to 34 Years | 0 (0.0%) | 0 (0.0%) |
| 35 to 64 Years | 5 (1.0%) | 31 (5.5%) |
| 65 to 74 Years | 5 (4.3%) | 0 (0.0%) |
| 75 Years and over | 10 (9.7%) | 19 (11.9%) |
Disability Class: Cognitive Difficulty
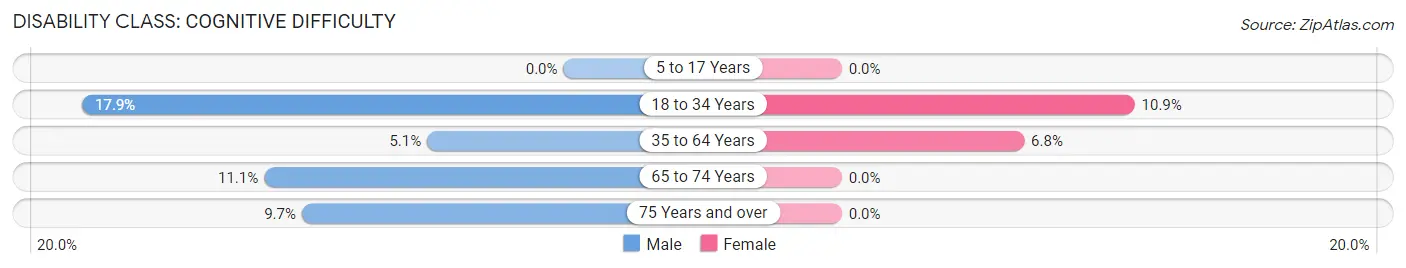
| Age Bracket | Male | Female |
| 5 to 17 Years | 0 (0.0%) | 0 (0.0%) |
| 18 to 34 Years | 52 (17.9%) | 30 (10.9%) |
| 35 to 64 Years | 26 (5.1%) | 38 (6.8%) |
| 65 to 74 Years | 13 (11.1%) | 0 (0.0%) |
| 75 Years and over | 10 (9.7%) | 0 (0.0%) |
Disability Class: Ambulatory Difficulty
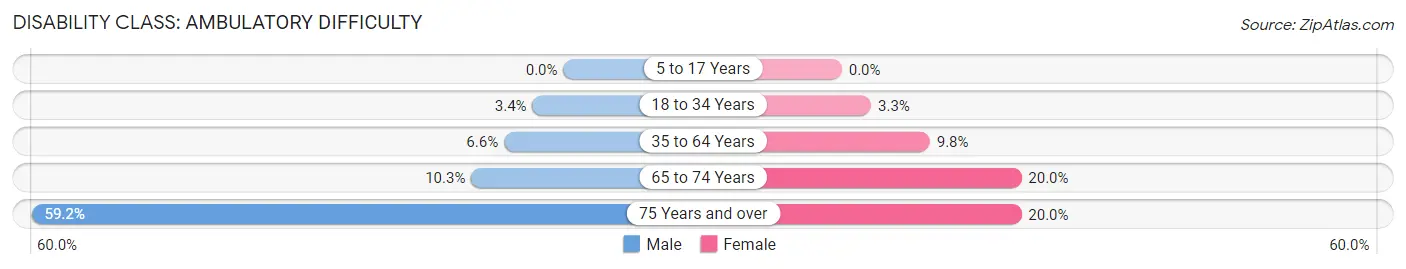
| Age Bracket | Male | Female |
| 5 to 17 Years | 0 (0.0%) | 0 (0.0%) |
| 18 to 34 Years | 10 (3.4%) | 9 (3.3%) |
| 35 to 64 Years | 34 (6.6%) | 55 (9.8%) |
| 65 to 74 Years | 12 (10.3%) | 33 (20.0%) |
| 75 Years and over | 61 (59.2%) | 32 (20.0%) |
Disability Class: Self-Care Difficulty
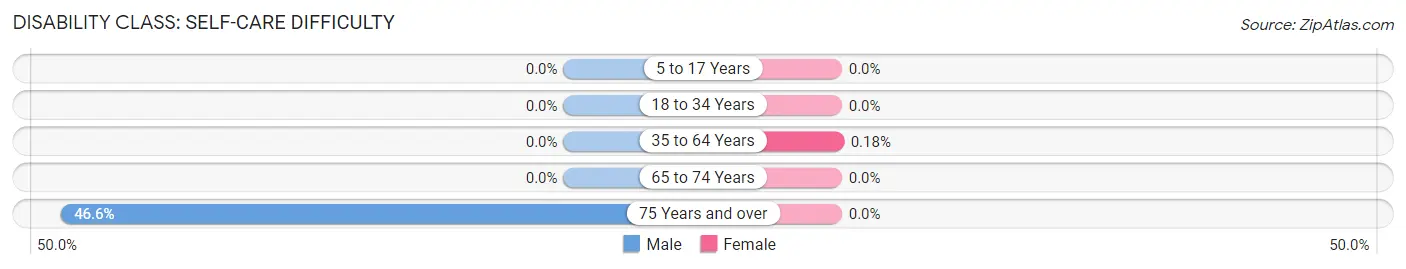
| Age Bracket | Male | Female |
| 5 to 17 Years | 0 (0.0%) | 0 (0.0%) |
| 18 to 34 Years | 0 (0.0%) | 0 (0.0%) |
| 35 to 64 Years | 0 (0.0%) | 1 (0.2%) |
| 65 to 74 Years | 0 (0.0%) | 0 (0.0%) |
| 75 Years and over | 48 (46.6%) | 0 (0.0%) |
Technology Access in Kingwood
Computing Device Access in Kingwood
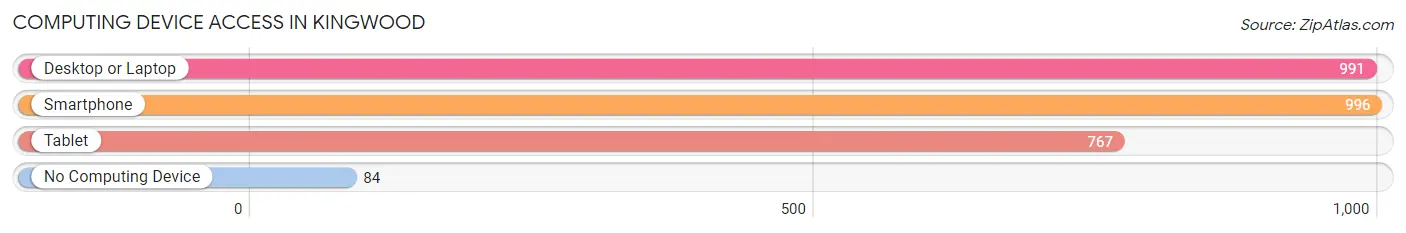
| Device Type | # Households | % Households |
| Desktop or Laptop | 991 | 81.8% |
| Smartphone | 996 | 82.3% |
| Tablet | 767 | 63.3% |
| No Computing Device | 84 | 6.9% |
| Total | 1,211 | 100.0% |
Internet Access in Kingwood
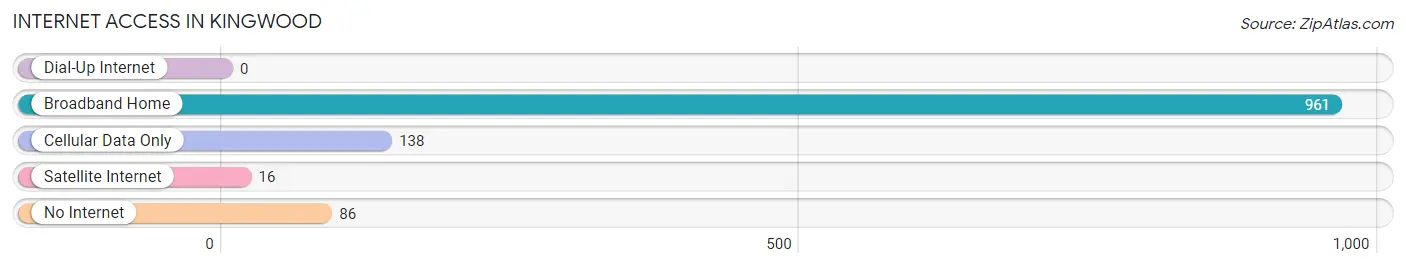
| Internet Type | # Households | % Households |
| Dial-Up Internet | 0 | 0.0% |
| Broadband Home | 961 | 79.4% |
| Cellular Data Only | 138 | 11.4% |
| Satellite Internet | 16 | 1.3% |
| No Internet | 86 | 7.1% |
| Total | 1,211 | 100.0% |
Kingwood Summary
Kingwood is a town located in Preston County, West Virginia, United States. It is the county seat of Preston County and is located along the Cheat River. The population was 2,902 at the 2010 census.
History
Kingwood was founded in 1796 by a group of settlers from Maryland and Pennsylvania. The town was named after Kingwood Manor, a large estate owned by the local settlers. The town was incorporated in 1817 and became the county seat of Preston County in 1818.
In the 19th century, Kingwood was a major center of commerce and industry. The town was home to several mills, including a woolen mill, a grist mill, and a saw mill. The town also had a tannery, a blacksmith shop, and a brickyard.
In the early 20th century, Kingwood was a major railroad hub. The Baltimore and Ohio Railroad and the Western Maryland Railway both had lines running through the town. The town also had a large lumber industry, with several sawmills located in the area.
Geography
Kingwood is located at 39°25'25" North, 79°37'45" West (39.423, -79.629). The town is situated in the Appalachian Mountains, at an elevation of 1,845 feet (562 m).
The town is located in the Cheat River Valley, which is part of the Allegheny Plateau. The valley is surrounded by steep hills and mountains, including Cheat Mountain to the east and the Allegheny Front to the west.
Economy
The economy of Kingwood is largely based on tourism and agriculture. The town is home to several tourist attractions, including the Preston County Historical Museum, the Kingwood Railroad Museum, and the Kingwood Country Club.
Agriculture is also an important part of the local economy. The town is home to several farms, which produce a variety of crops, including corn, wheat, hay, and apples.
Demographics
As of the 2010 census, there were 2,902 people, 1,214 households, and 790 families living in Kingwood. The population density was 1,092.3 people per square mile (421.7/km2). The racial makeup of the town was 97.2% White, 0.7% African American, 0.2% Native American, 0.3% Asian, 0.1% Pacific Islander, 0.3% from other races, and 1.3% from two or more races. Hispanic or Latino of any race were 1.2% of the population.
The median income for a household in Kingwood was $31,250, and the median income for a family was $41,250. Males had a median income of $30,000 versus $21,250 for females. The per capita income for the town was $17,845. About 11.2% of families and 14.2% of the population were below the poverty line, including 18.2% of those under age 18 and 8.2% of those age 65 or over.
Common Questions
What is Per Capita Income in Kingwood?
Per Capita income in Kingwood is $33,066.
What is the Median Family Income in Kingwood?
Median Family Income in Kingwood is $99,871.
What is the Median Household income in Kingwood?
Median Household Income in Kingwood is $74,961.
What is Income or Wage Gap in Kingwood?
Income or Wage Gap in Kingwood is 30.3%.
Women in Kingwood earn 69.7 cents for every dollar earned by a man.
What is Inequality or Gini Index in Kingwood?
Inequality or Gini Index in Kingwood is 0.38.
What is the Total Population of Kingwood?
Total Population of Kingwood is 2,997.
What is the Total Male Population of Kingwood?
Total Male Population of Kingwood is 1,343.
What is the Total Female Population of Kingwood?
Total Female Population of Kingwood is 1,654.
What is the Ratio of Males per 100 Females in Kingwood?
There are 81.20 Males per 100 Females in Kingwood.
What is the Ratio of Females per 100 Males in Kingwood?
There are 123.16 Females per 100 Males in Kingwood.
What is the Median Population Age in Kingwood?
Median Population Age in Kingwood is 40.0 Years.
What is the Average Family Size in Kingwood
Average Family Size in Kingwood is 3.0 People.
What is the Average Household Size in Kingwood
Average Household Size in Kingwood is 2.4 People.
How Large is the Labor Force in Kingwood?
There are 1,464 People in the Labor Forcein in Kingwood.
What is the Percentage of People in the Labor Force in Kingwood?
62.7% of People are in the Labor Force in Kingwood.
What is the Unemployment Rate in Kingwood?
Unemployment Rate in Kingwood is 7.4%.