Curtice, OH Map & Demographics
Curtice Map
Curtice Overview
$48,105
PER CAPITA INCOME
$118,929
AVG FAMILY INCOME
$96,207
AVG HOUSEHOLD INCOME
56.2%
WAGE / INCOME GAP [ % ]
43.8¢/ $1
WAGE / INCOME GAP [ $ ]
0.36
INEQUALITY / GINI INDEX
1,501
TOTAL POPULATION
852
MALE POPULATION
649
FEMALE POPULATION
131.28
MALES / 100 FEMALES
76.17
FEMALES / 100 MALES
45.4
MEDIAN AGE
3.1
AVG FAMILY SIZE
2.7
AVG HOUSEHOLD SIZE
924
LABOR FORCE [ PEOPLE ]
73.3%
PERCENT IN LABOR FORCE
0.5%
UNEMPLOYMENT RATE
Curtice Zip Codes
Curtice Area Codes
Income in Curtice
Income Overview in Curtice
Per Capita Income in Curtice is $48,105, while median incomes of families and households are $118,929 and $96,207 respectively.
| Characteristic | Number | Measure |
| Per Capita Income | 1,501 | $48,105 |
| Median Family Income | 446 | $118,929 |
| Mean Family Income | 446 | $144,431 |
| Median Household Income | 560 | $96,207 |
| Mean Household Income | 560 | $127,164 |
| Income Deficit | 446 | $0 |
| Wage / Income Gap (%) | 1,501 | 56.19% |
| Wage / Income Gap ($) | 1,501 | 43.81¢ per $1 |
| Gini / Inequality Index | 1,501 | 0.36 |
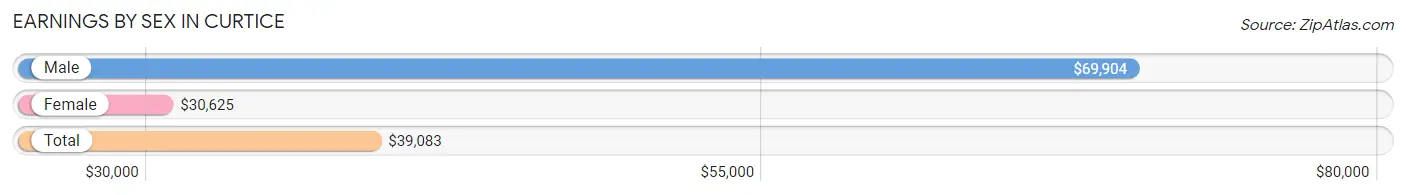
Earnings by Sex in Curtice
Average Earnings in Curtice are $39,083, $69,904 for men and $30,625 for women, a difference of 56.2%.
| Sex | Number | Average Earnings |
| Male | 523 (55.5%) | $69,904 |
| Female | 419 (44.5%) | $30,625 |
| Total | 942 (100.0%) | $39,083 |
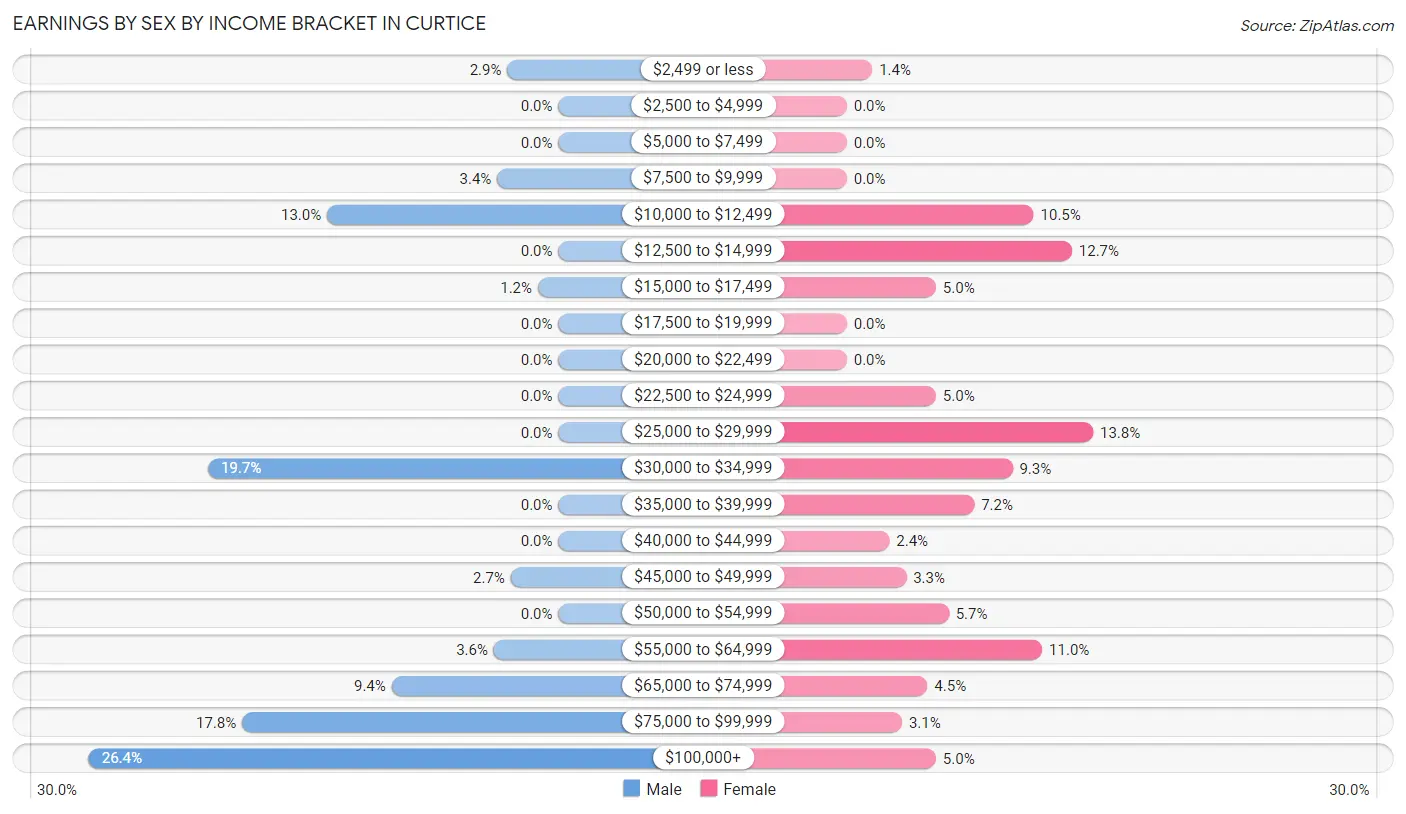
Earnings by Sex by Income Bracket in Curtice
The most common earnings brackets in Curtice are $100,000+ for men (138 | 26.4%) and $25,000 to $29,999 for women (58 | 13.8%).
| Income | Male | Female |
| $2,499 or less | 15 (2.9%) | 6 (1.4%) |
| $2,500 to $4,999 | 0 (0.0%) | 0 (0.0%) |
| $5,000 to $7,499 | 0 (0.0%) | 0 (0.0%) |
| $7,500 to $9,999 | 18 (3.4%) | 0 (0.0%) |
| $10,000 to $12,499 | 68 (13.0%) | 44 (10.5%) |
| $12,500 to $14,999 | 0 (0.0%) | 53 (12.7%) |
| $15,000 to $17,499 | 6 (1.1%) | 21 (5.0%) |
| $17,500 to $19,999 | 0 (0.0%) | 0 (0.0%) |
| $20,000 to $22,499 | 0 (0.0%) | 0 (0.0%) |
| $22,500 to $24,999 | 0 (0.0%) | 21 (5.0%) |
| $25,000 to $29,999 | 0 (0.0%) | 58 (13.8%) |
| $30,000 to $34,999 | 103 (19.7%) | 39 (9.3%) |
| $35,000 to $39,999 | 0 (0.0%) | 30 (7.2%) |
| $40,000 to $44,999 | 0 (0.0%) | 10 (2.4%) |
| $45,000 to $49,999 | 14 (2.7%) | 14 (3.3%) |
| $50,000 to $54,999 | 0 (0.0%) | 24 (5.7%) |
| $55,000 to $64,999 | 19 (3.6%) | 46 (11.0%) |
| $65,000 to $74,999 | 49 (9.4%) | 19 (4.5%) |
| $75,000 to $99,999 | 93 (17.8%) | 13 (3.1%) |
| $100,000+ | 138 (26.4%) | 21 (5.0%) |
| Total | 523 (100.0%) | 419 (100.0%) |
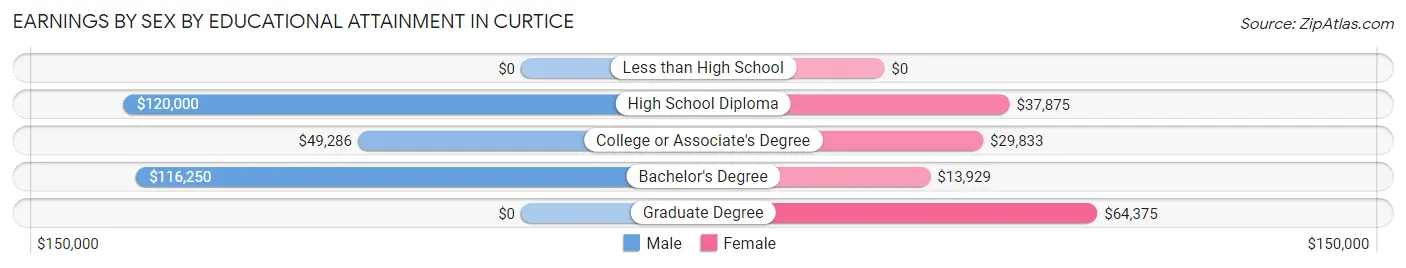
Earnings by Sex by Educational Attainment in Curtice
Average earnings in Curtice are $79,915 for men and $37,917 for women, a difference of 52.5%. Men with an educational attainment of high school diploma enjoy the highest average annual earnings of $120,000, while those with college or associate's degree education earn the least with $49,286. Women with an educational attainment of graduate degree earn the most with the average annual earnings of $64,375, while those with bachelor's degree education have the smallest earnings of $13,929.
| Educational Attainment | Male Income | Female Income |
| Less than High School | - | - |
| High School Diploma | $120,000 | $37,875 |
| College or Associate's Degree | $49,286 | $29,833 |
| Bachelor's Degree | $116,250 | $13,929 |
| Graduate Degree | - | - |
| Total | $79,915 | $37,917 |
Family Income in Curtice
Family Income Brackets in Curtice
According to the Curtice family income data, there are 98 families falling into the $200,000+ income range, which is the most common income bracket and makes up 22.0% of all families.
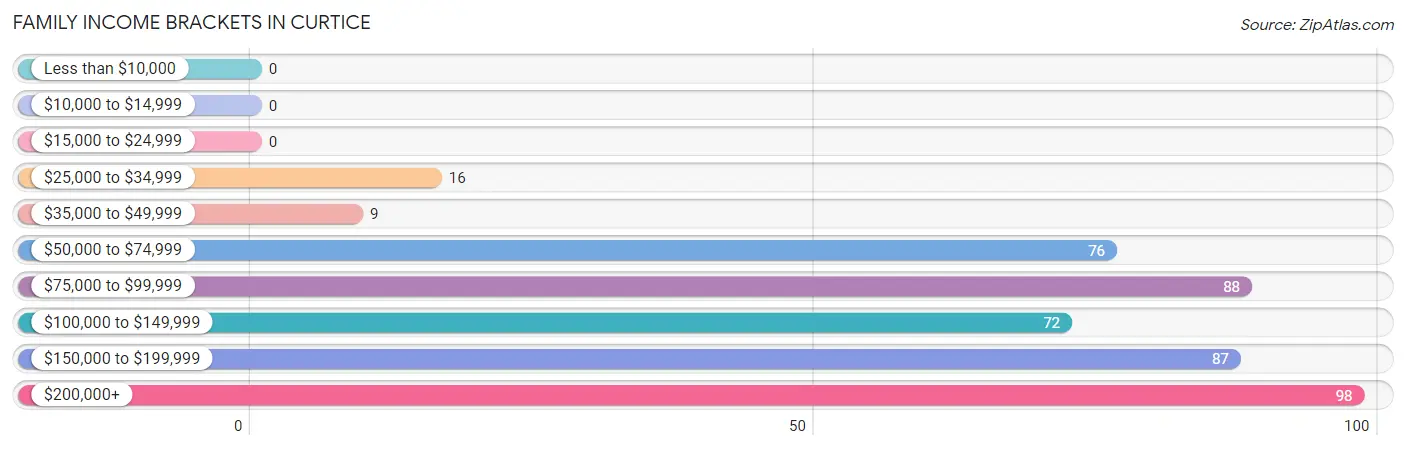
| Income Bracket | # Families | % Families |
| Less than $10,000 | 0 | 0.0% |
| $10,000 to $14,999 | 0 | 0.0% |
| $15,000 to $24,999 | 0 | 0.0% |
| $25,000 to $34,999 | 16 | 3.6% |
| $35,000 to $49,999 | 9 | 2.0% |
| $50,000 to $74,999 | 76 | 17.0% |
| $75,000 to $99,999 | 88 | 19.7% |
| $100,000 to $149,999 | 72 | 16.1% |
| $150,000 to $199,999 | 87 | 19.5% |
| $200,000+ | 98 | 22.0% |
Family Income by Famaliy Size in Curtice
4-person families (44 | 9.9%) account for the highest median family income in Curtice with $127,857 per family, while 2-person families (228 | 51.1%) have the highest median income of $60,166 per family member.
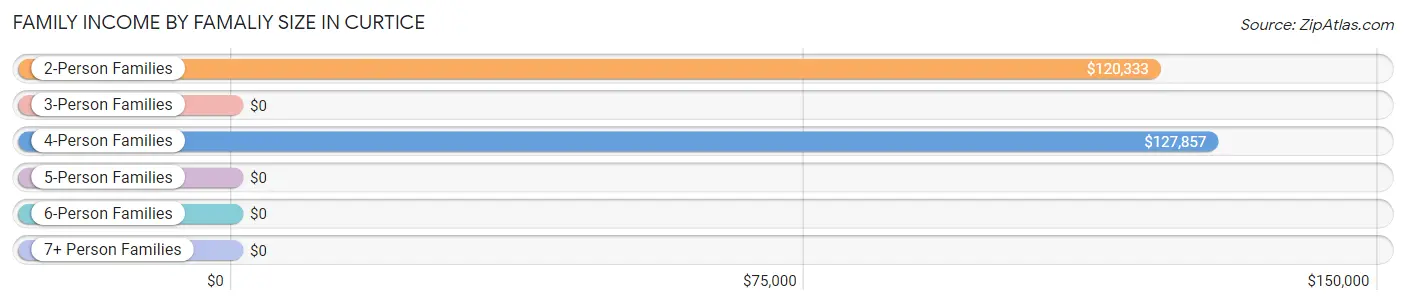
| Income Bracket | # Families | Median Income |
| 2-Person Families | 228 (51.1%) | $120,333 |
| 3-Person Families | 96 (21.5%) | $0 |
| 4-Person Families | 44 (9.9%) | $127,857 |
| 5-Person Families | 78 (17.5%) | $0 |
| 6-Person Families | 0 (0.0%) | $0 |
| 7+ Person Families | 0 (0.0%) | $0 |
| Total | 446 (100.0%) | $118,929 |
Family Income by Number of Earners in Curtice
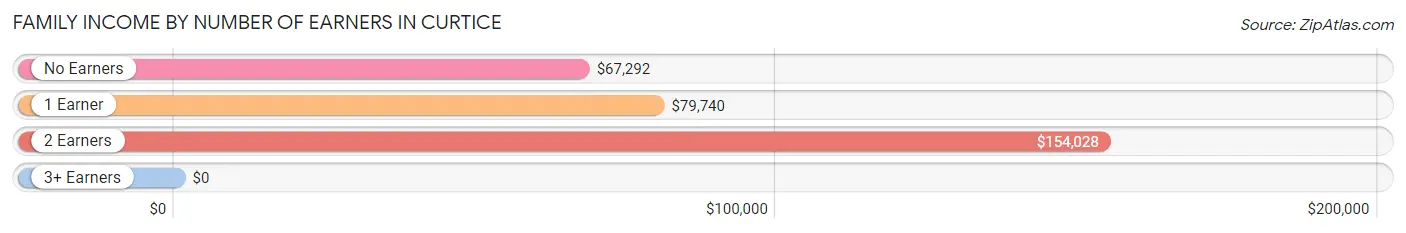
| Number of Earners | # Families | Median Income |
| No Earners | 29 (6.5%) | $67,292 |
| 1 Earner | 95 (21.3%) | $79,740 |
| 2 Earners | 240 (53.8%) | $154,028 |
| 3+ Earners | 82 (18.4%) | $0 |
| Total | 446 (100.0%) | $118,929 |
Household Income in Curtice
Household Income Brackets in Curtice
With 118 households falling in the category, the $75,000 to $99,999 income range is the most frequent in Curtice, accounting for 21.1% of all households.
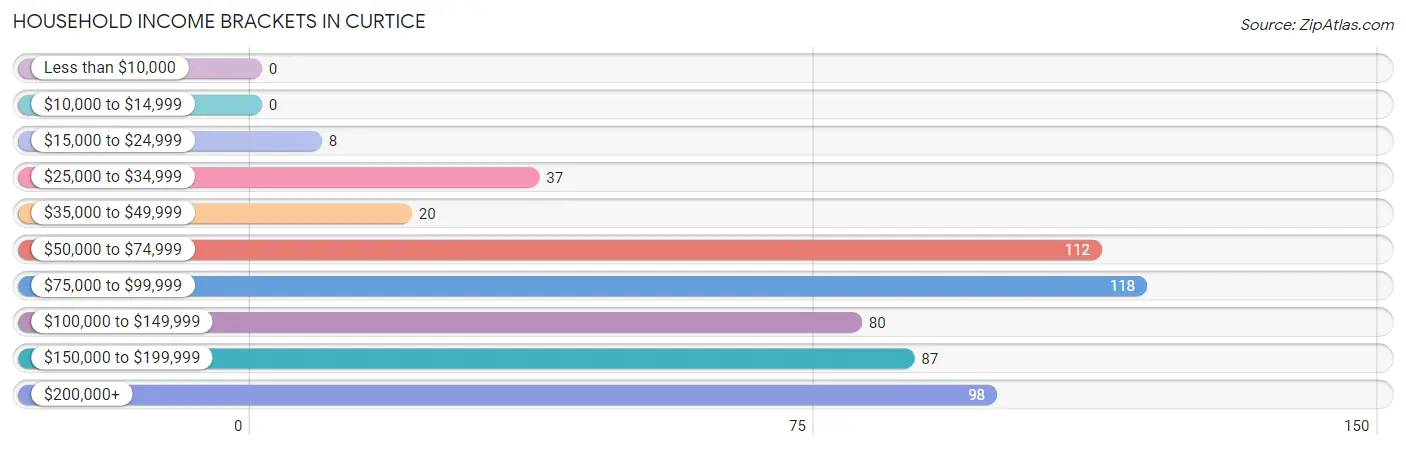
| Income Bracket | # Households | % Households |
| Less than $10,000 | 0 | 0.0% |
| $10,000 to $14,999 | 0 | 0.0% |
| $15,000 to $24,999 | 8 | 1.4% |
| $25,000 to $34,999 | 37 | 6.6% |
| $35,000 to $49,999 | 20 | 3.6% |
| $50,000 to $74,999 | 112 | 20.0% |
| $75,000 to $99,999 | 118 | 21.1% |
| $100,000 to $149,999 | 80 | 14.3% |
| $150,000 to $199,999 | 87 | 15.5% |
| $200,000+ | 98 | 17.5% |
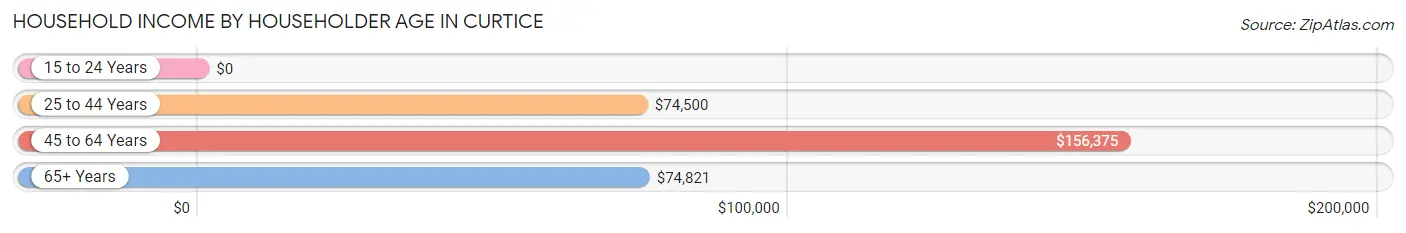
Household Income by Householder Age in Curtice
The median household income in Curtice is $96,207, with the highest median household income of $156,375 found in the 45 to 64 years age bracket for the primary householder. A total of 293 households (52.3%) fall into this category.
| Income Bracket | # Households | Median Income |
| 15 to 24 Years | 0 (0.0%) | $0 |
| 25 to 44 Years | 146 (26.1%) | $74,500 |
| 45 to 64 Years | 293 (52.3%) | $156,375 |
| 65+ Years | 121 (21.6%) | $74,821 |
| Total | 560 (100.0%) | $96,207 |
Poverty in Curtice
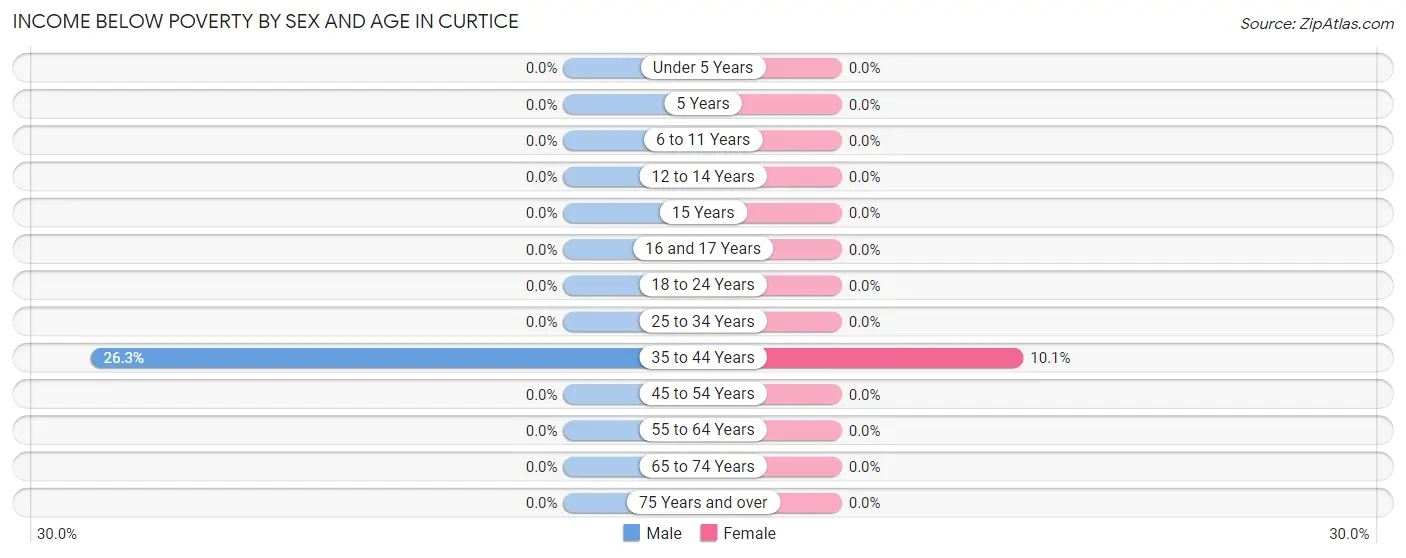
Income Below Poverty by Sex and Age in Curtice
With 1.2% poverty level for males and 1.4% for females among the residents of Curtice, 35 to 44 year old males and 35 to 44 year old females are the most vulnerable to poverty, with 10 males (26.3%) and 9 females (10.1%) in their respective age groups living below the poverty level.
| Age Bracket | Male | Female |
| Under 5 Years | 0 (0.0%) | 0 (0.0%) |
| 5 Years | 0 (0.0%) | 0 (0.0%) |
| 6 to 11 Years | 0 (0.0%) | 0 (0.0%) |
| 12 to 14 Years | 0 (0.0%) | 0 (0.0%) |
| 15 Years | 0 (0.0%) | 0 (0.0%) |
| 16 and 17 Years | 0 (0.0%) | 0 (0.0%) |
| 18 to 24 Years | 0 (0.0%) | 0 (0.0%) |
| 25 to 34 Years | 0 (0.0%) | 0 (0.0%) |
| 35 to 44 Years | 10 (26.3%) | 9 (10.1%) |
| 45 to 54 Years | 0 (0.0%) | 0 (0.0%) |
| 55 to 64 Years | 0 (0.0%) | 0 (0.0%) |
| 65 to 74 Years | 0 (0.0%) | 0 (0.0%) |
| 75 Years and over | 0 (0.0%) | 0 (0.0%) |
| Total | 10 (1.2%) | 9 (1.4%) |
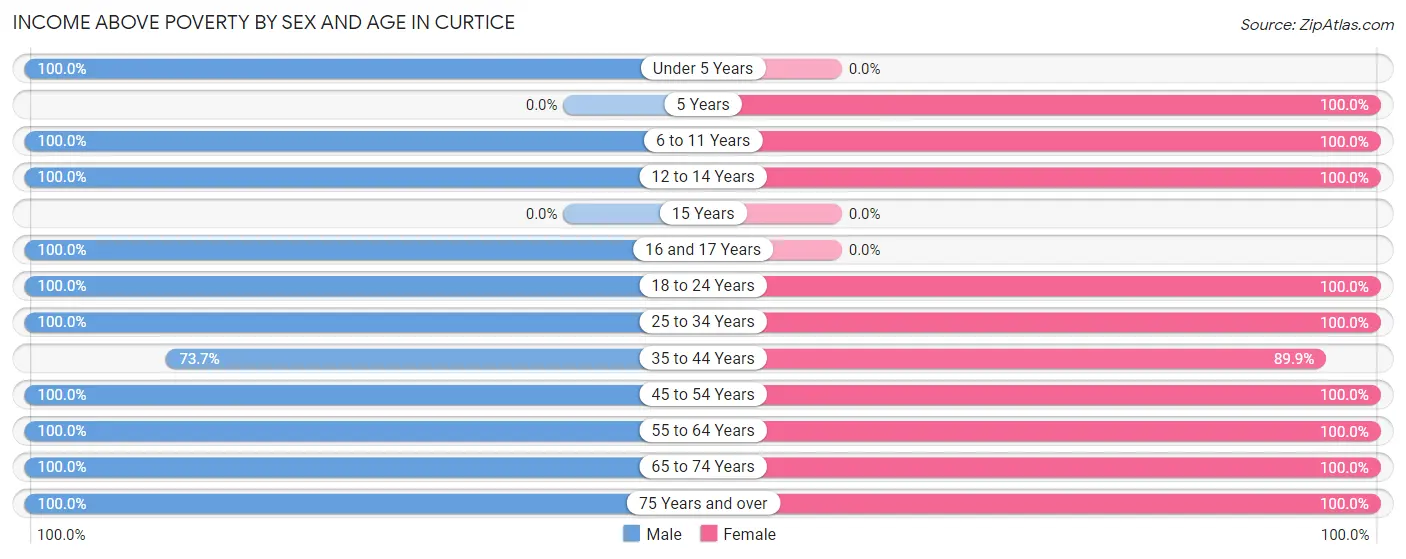
Income Above Poverty by Sex and Age in Curtice
According to the poverty statistics in Curtice, males aged under 5 years and females aged 5 years are the age groups that are most secure financially, with 100.0% of males and 100.0% of females in these age groups living above the poverty line.
| Age Bracket | Male | Female |
| Under 5 Years | 66 (100.0%) | 0 (0.0%) |
| 5 Years | 0 (0.0%) | 23 (100.0%) |
| 6 to 11 Years | 41 (100.0%) | 48 (100.0%) |
| 12 to 14 Years | 60 (100.0%) | 3 (100.0%) |
| 15 Years | 0 (0.0%) | 0 (0.0%) |
| 16 and 17 Years | 7 (100.0%) | 0 (0.0%) |
| 18 to 24 Years | 139 (100.0%) | 90 (100.0%) |
| 25 to 34 Years | 56 (100.0%) | 69 (100.0%) |
| 35 to 44 Years | 28 (73.7%) | 80 (89.9%) |
| 45 to 54 Years | 133 (100.0%) | 96 (100.0%) |
| 55 to 64 Years | 201 (100.0%) | 123 (100.0%) |
| 65 to 74 Years | 22 (100.0%) | 31 (100.0%) |
| 75 Years and over | 89 (100.0%) | 77 (100.0%) |
| Total | 842 (98.8%) | 640 (98.6%) |
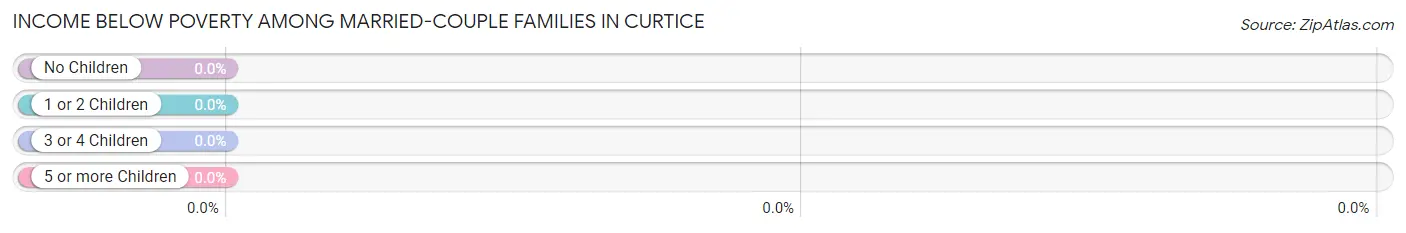
Income Below Poverty Among Married-Couple Families in Curtice
| Children | Above Poverty | Below Poverty |
| No Children | 277 (100.0%) | 0 (0.0%) |
| 1 or 2 Children | 79 (100.0%) | 0 (0.0%) |
| 3 or 4 Children | 32 (100.0%) | 0 (0.0%) |
| 5 or more Children | 0 (0.0%) | 0 (0.0%) |
| Total | 388 (100.0%) | 0 (0.0%) |
Income Below Poverty Among Single-Parent Households in Curtice
| Children | Single Father | Single Mother |
| No Children | 0 (0.0%) | 0 (0.0%) |
| 1 or 2 Children | 0 (0.0%) | 0 (0.0%) |
| 3 or 4 Children | 0 (0.0%) | 0 (0.0%) |
| 5 or more Children | 0 (0.0%) | 0 (0.0%) |
| Total | 0 (0.0%) | 0 (0.0%) |
Income Below Poverty Among Married-Couple vs Single-Parent Households in Curtice
| Children | Married-Couple Families | Single-Parent Households |
| No Children | 0 (0.0%) | 0 (0.0%) |
| 1 or 2 Children | 0 (0.0%) | 0 (0.0%) |
| 3 or 4 Children | 0 (0.0%) | 0 (0.0%) |
| 5 or more Children | 0 (0.0%) | 0 (0.0%) |
| Total | 0 (0.0%) | 0 (0.0%) |
Race in Curtice
The most populous races in Curtice are White / Caucasian (1,403 | 93.5%), Two or more Races (98 | 6.5%), and Hispanic or Latino (30 | 2.0%).
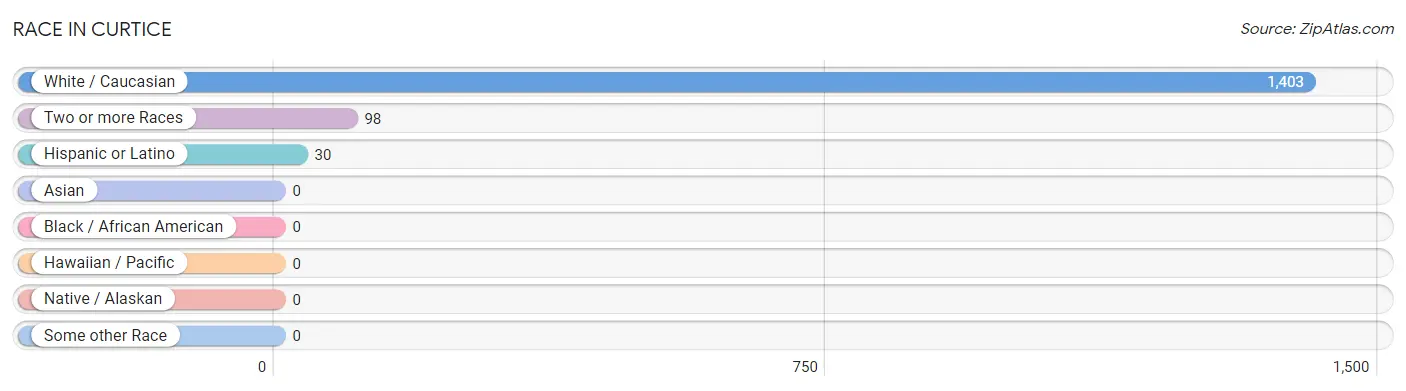
| Race | # Population | % Population |
| Asian | 0 | 0.0% |
| Black / African American | 0 | 0.0% |
| Hawaiian / Pacific | 0 | 0.0% |
| Hispanic or Latino | 30 | 2.0% |
| Native / Alaskan | 0 | 0.0% |
| White / Caucasian | 1,403 | 93.5% |
| Two or more Races | 98 | 6.5% |
| Some other Race | 0 | 0.0% |
| Total | 1,501 | 100.0% |
Ancestry in Curtice
The most populous ancestries reported in Curtice are German (576 | 38.4%), Arab (179 | 11.9%), English (98 | 6.5%), Irish (97 | 6.5%), and Scottish (90 | 6.0%), together accounting for 69.3% of all Curtice residents.
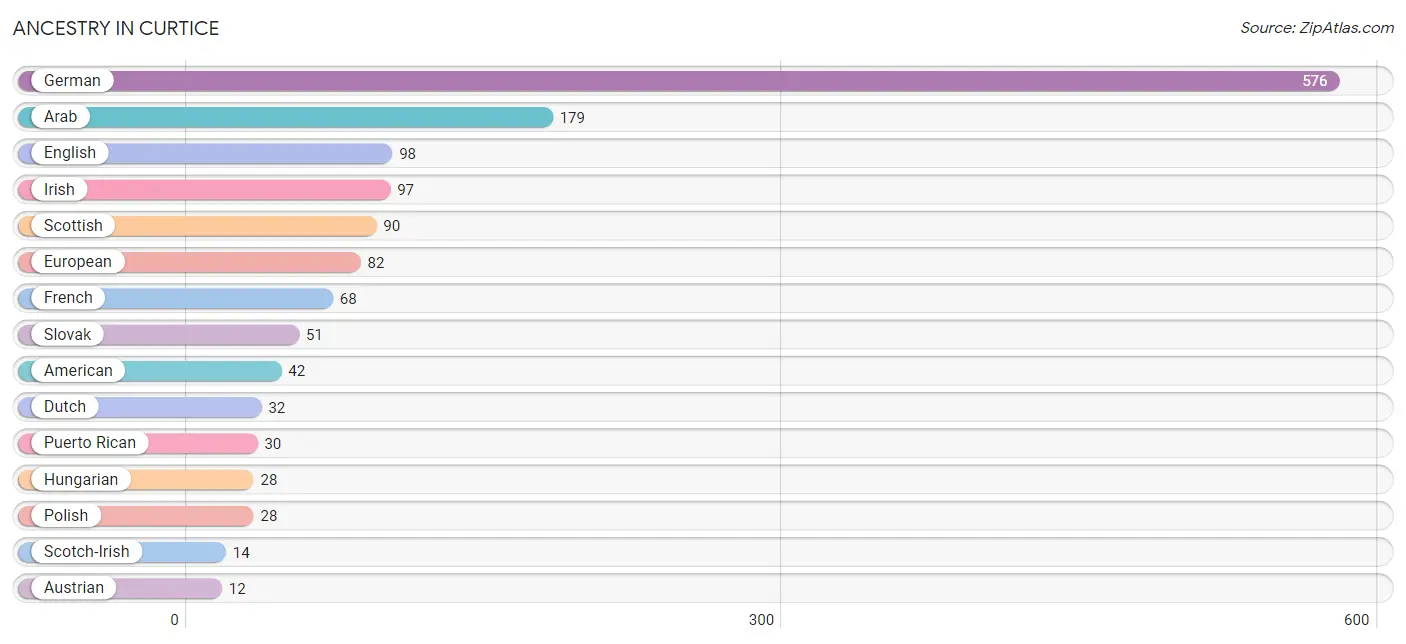
| Ancestry | # Population | % Population |
| American | 42 | 2.8% |
| Arab | 179 | 11.9% |
| Austrian | 12 | 0.8% |
| British | 5 | 0.3% |
| Dutch | 32 | 2.1% |
| English | 98 | 6.5% |
| European | 82 | 5.5% |
| French | 68 | 4.5% |
| German | 576 | 38.4% |
| Hungarian | 28 | 1.9% |
| Irish | 97 | 6.5% |
| Polish | 28 | 1.9% |
| Puerto Rican | 30 | 2.0% |
| Scotch-Irish | 14 | 0.9% |
| Scottish | 90 | 6.0% |
| Slovak | 51 | 3.4% |
| Swedish | 12 | 0.8% |
| Swiss | 9 | 0.6% | View All 18 Rows |
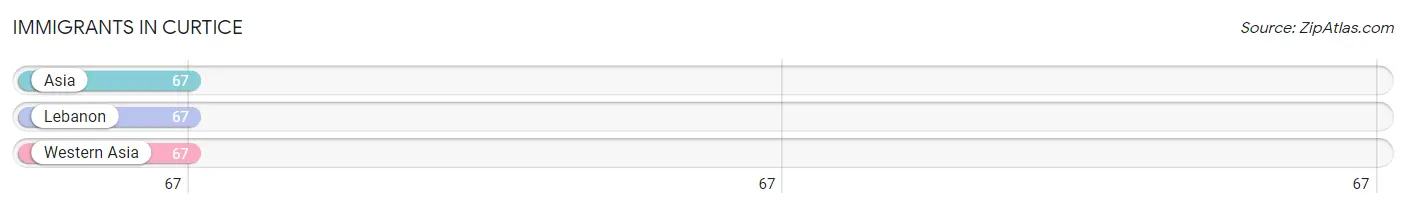
Immigrants in Curtice
The most numerous immigrant groups reported in Curtice came from Asia (67 | 4.5%), Lebanon (67 | 4.5%), and Western Asia (67 | 4.5%), together accounting for 13.4% of all Curtice residents.
| Immigration Origin | # Population | % Population |
| Asia | 67 | 4.5% |
| Lebanon | 67 | 4.5% |
| Western Asia | 67 | 4.5% | View All 3 Rows |
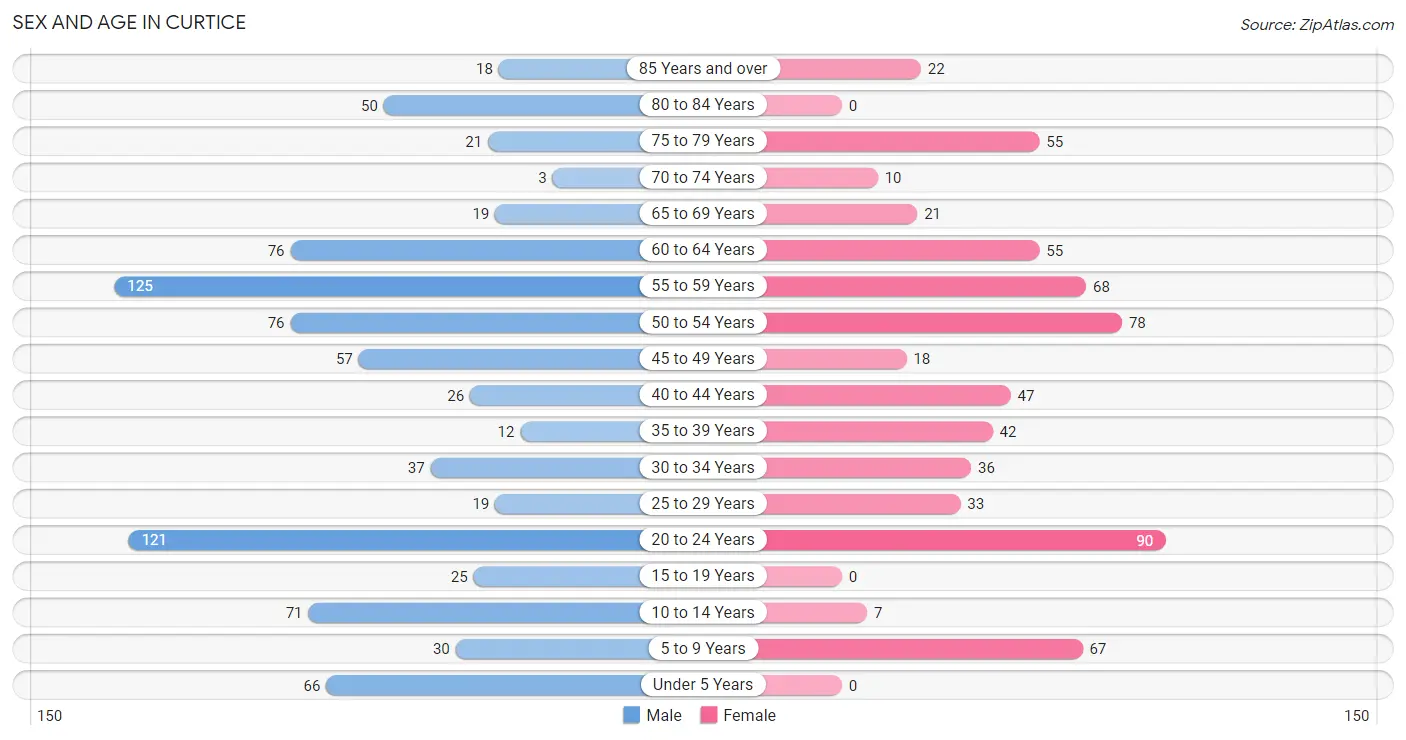
Sex and Age in Curtice
Sex and Age in Curtice
The most populous age groups in Curtice are 55 to 59 Years (125 | 14.7%) for men and 20 to 24 Years (90 | 13.9%) for women.
| Age Bracket | Male | Female |
| Under 5 Years | 66 (7.7%) | 0 (0.0%) |
| 5 to 9 Years | 30 (3.5%) | 67 (10.3%) |
| 10 to 14 Years | 71 (8.3%) | 7 (1.1%) |
| 15 to 19 Years | 25 (2.9%) | 0 (0.0%) |
| 20 to 24 Years | 121 (14.2%) | 90 (13.9%) |
| 25 to 29 Years | 19 (2.2%) | 33 (5.1%) |
| 30 to 34 Years | 37 (4.3%) | 36 (5.6%) |
| 35 to 39 Years | 12 (1.4%) | 42 (6.5%) |
| 40 to 44 Years | 26 (3.0%) | 47 (7.2%) |
| 45 to 49 Years | 57 (6.7%) | 18 (2.8%) |
| 50 to 54 Years | 76 (8.9%) | 78 (12.0%) |
| 55 to 59 Years | 125 (14.7%) | 68 (10.5%) |
| 60 to 64 Years | 76 (8.9%) | 55 (8.5%) |
| 65 to 69 Years | 19 (2.2%) | 21 (3.2%) |
| 70 to 74 Years | 3 (0.4%) | 10 (1.5%) |
| 75 to 79 Years | 21 (2.5%) | 55 (8.5%) |
| 80 to 84 Years | 50 (5.9%) | 0 (0.0%) |
| 85 Years and over | 18 (2.1%) | 22 (3.4%) |
| Total | 852 (100.0%) | 649 (100.0%) |
Families and Households in Curtice
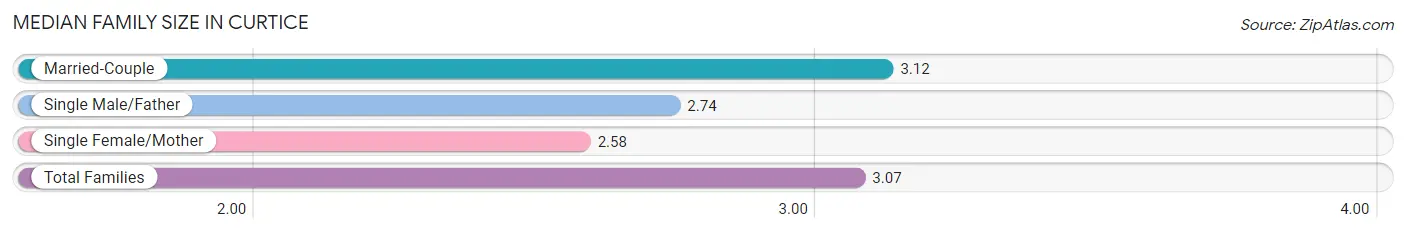
Median Family Size in Curtice
The median family size in Curtice is 3.07 persons per family, with married-couple families (388 | 87.0%) accounting for the largest median family size of 3.12 persons per family. On the other hand, single female/mother families (19 | 4.3%) represent the smallest median family size with 2.58 persons per family.
| Family Type | # Families | Family Size |
| Married-Couple | 388 (87.0%) | 3.12 |
| Single Male/Father | 39 (8.7%) | 2.74 |
| Single Female/Mother | 19 (4.3%) | 2.58 |
| Total Families | 446 (100.0%) | 3.07 |
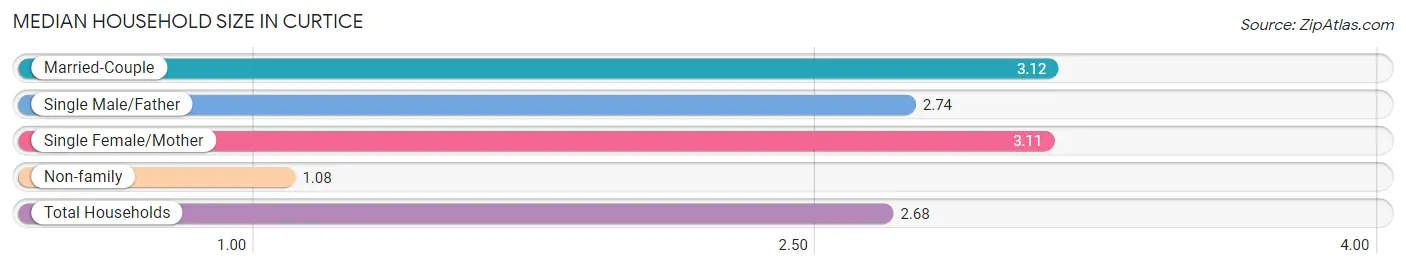
Median Household Size in Curtice
The median household size in Curtice is 2.68 persons per household, with married-couple households (388 | 69.3%) accounting for the largest median household size of 3.12 persons per household. non-family households (114 | 20.4%) represent the smallest median household size with 1.08 persons per household.
| Household Type | # Households | Household Size |
| Married-Couple | 388 (69.3%) | 3.12 |
| Single Male/Father | 39 (7.0%) | 2.74 |
| Single Female/Mother | 19 (3.4%) | 3.11 |
| Non-family | 114 (20.4%) | 1.08 |
| Total Households | 560 (100.0%) | 2.68 |
Household Size by Marriage Status in Curtice
Out of a total of 560 households in Curtice, 446 (79.6%) are family households, while 114 (20.4%) are nonfamily households. The most numerous type of family households are 2-person households, comprising 228, and the most common type of nonfamily households are 1-person households, comprising 106.
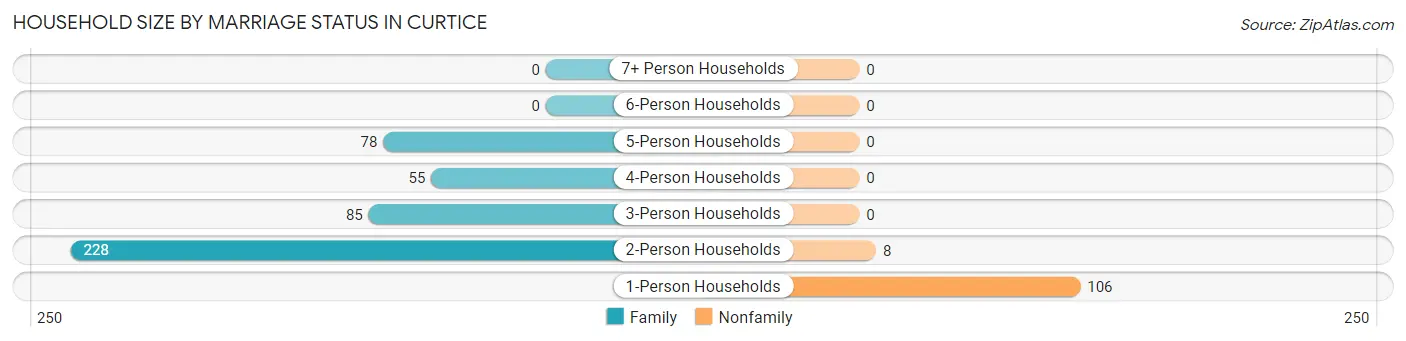
| Household Size | Family Households | Nonfamily Households |
| 1-Person Households | - | 106 (18.9%) |
| 2-Person Households | 228 (40.7%) | 8 (1.4%) |
| 3-Person Households | 85 (15.2%) | 0 (0.0%) |
| 4-Person Households | 55 (9.8%) | 0 (0.0%) |
| 5-Person Households | 78 (13.9%) | 0 (0.0%) |
| 6-Person Households | 0 (0.0%) | 0 (0.0%) |
| 7+ Person Households | 0 (0.0%) | 0 (0.0%) |
| Total | 446 (79.6%) | 114 (20.4%) |
Female Fertility in Curtice
Fertility by Age in Curtice
Average fertility rate in Curtice is 167.0 births per 1,000 women. Women in the age bracket of 35 to 50 years have the highest fertility rate with 276.0 births per 1,000 women. Women in the age bracket of 35 to 50 years acount for 72.3% of all women with births.
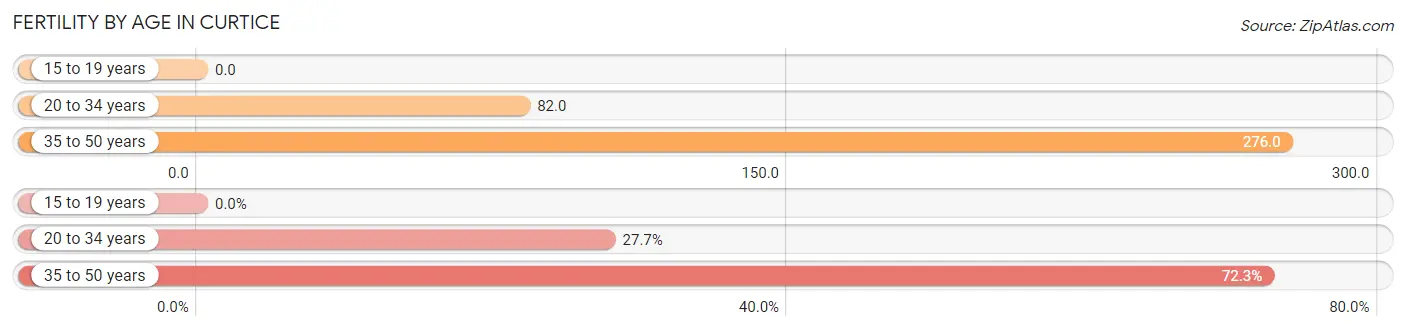
| Age Bracket | Women with Births | Births / 1,000 Women |
| 15 to 19 years | 0 (0.0%) | 0.0 |
| 20 to 34 years | 13 (27.7%) | 82.0 |
| 35 to 50 years | 34 (72.3%) | 276.0 |
| Total | 47 (100.0%) | 167.0 |
Fertility by Age by Marriage Status in Curtice
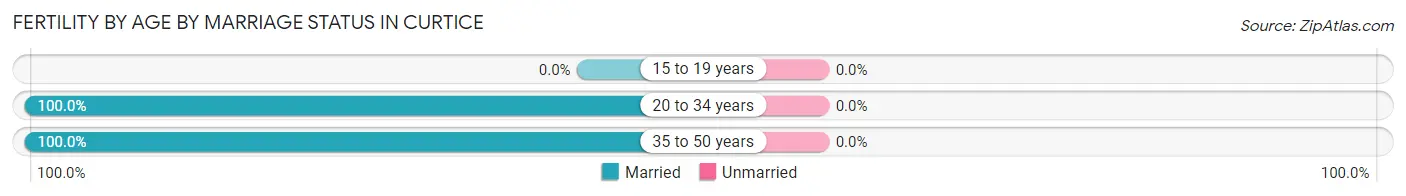
| Age Bracket | Married | Unmarried |
| 15 to 19 years | 0 (0.0%) | 0 (0.0%) |
| 20 to 34 years | 13 (100.0%) | 0 (0.0%) |
| 35 to 50 years | 34 (100.0%) | 0 (0.0%) |
| Total | 47 (100.0%) | 0 (0.0%) |
Fertility by Education in Curtice
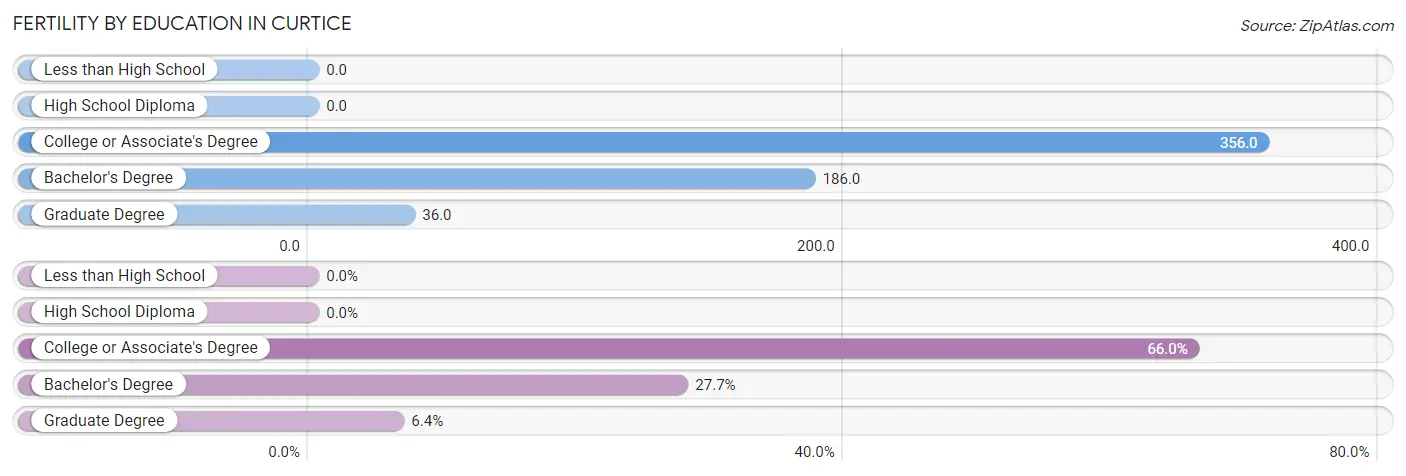
| Educational Attainment | Women with Births | Births / 1,000 Women |
| Less than High School | 0 (0.0%) | 0.0 |
| High School Diploma | 0 (0.0%) | 0.0 |
| College or Associate's Degree | 31 (66.0%) | 356.0 |
| Bachelor's Degree | 13 (27.7%) | 186.0 |
| Graduate Degree | 3 (6.4%) | 36.0 |
| Total | 47 (100.0%) | 167.0 |
Fertility by Education by Marriage Status in Curtice
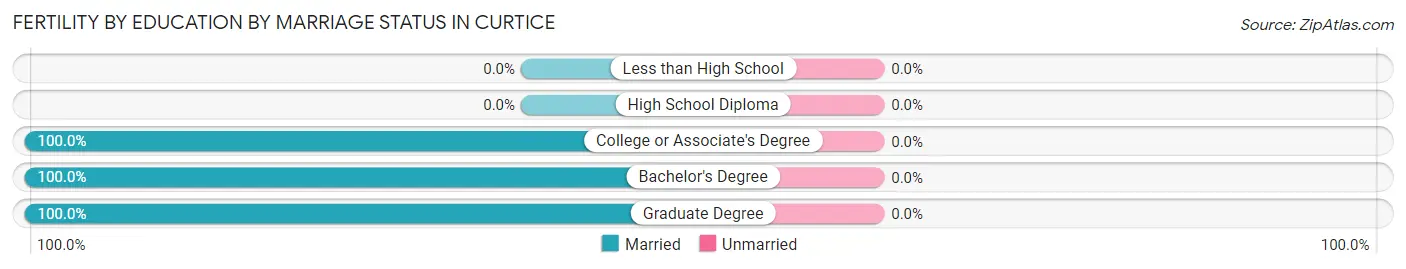
| Educational Attainment | Married | Unmarried |
| Less than High School | 0 (0.0%) | 0 (0.0%) |
| High School Diploma | 0 (0.0%) | 0 (0.0%) |
| College or Associate's Degree | 31 (100.0%) | 0 (0.0%) |
| Bachelor's Degree | 13 (100.0%) | 0 (0.0%) |
| Graduate Degree | 3 (100.0%) | 0 (0.0%) |
| Total | 47 (100.0%) | 0 (0.0%) |
Employment Characteristics in Curtice
Employment by Class of Employer in Curtice
Among the 871 employed individuals in Curtice, private company employees (625 | 71.8%), not-for-profit organizations (141 | 16.2%), and self-employed (incorporated) (41 | 4.7%) make up the most common classes of employment.
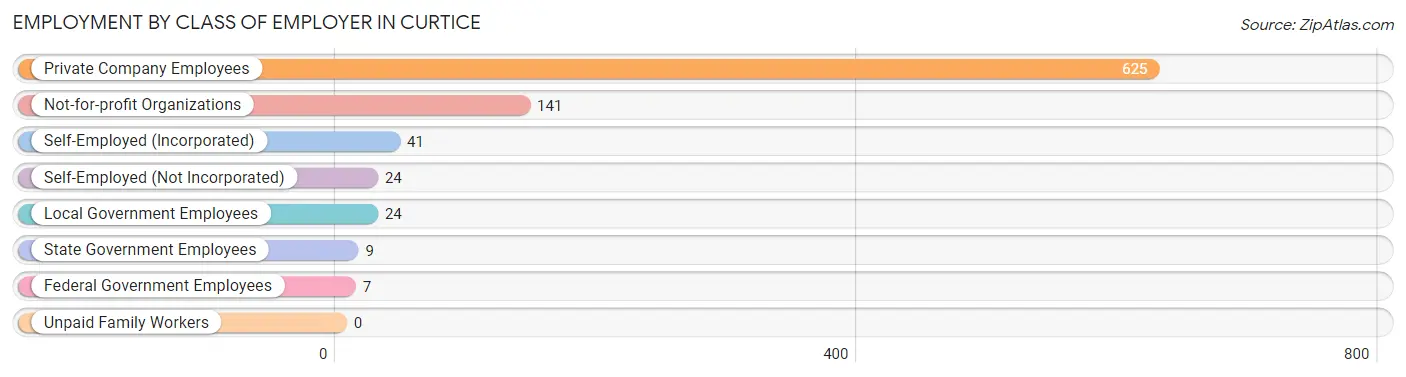
| Employer Class | # Employees | % Employees |
| Private Company Employees | 625 | 71.8% |
| Self-Employed (Incorporated) | 41 | 4.7% |
| Self-Employed (Not Incorporated) | 24 | 2.8% |
| Not-for-profit Organizations | 141 | 16.2% |
| Local Government Employees | 24 | 2.8% |
| State Government Employees | 9 | 1.0% |
| Federal Government Employees | 7 | 0.8% |
| Unpaid Family Workers | 0 | 0.0% |
| Total | 871 | 100.0% |
Employment Status by Age in Curtice
According to the labor force statistics for Curtice, out of the total population over 16 years of age (1,260), 73.3% or 924 individuals are in the labor force, with 0.5% or 5 of them unemployed. The age group with the highest labor force participation rate is 25 to 29 years, with 100.0% or 52 individuals in the labor force. Within the labor force, the 55 to 59 years age range has the highest percentage of unemployed individuals, with 2.7% or 5 of them being unemployed.
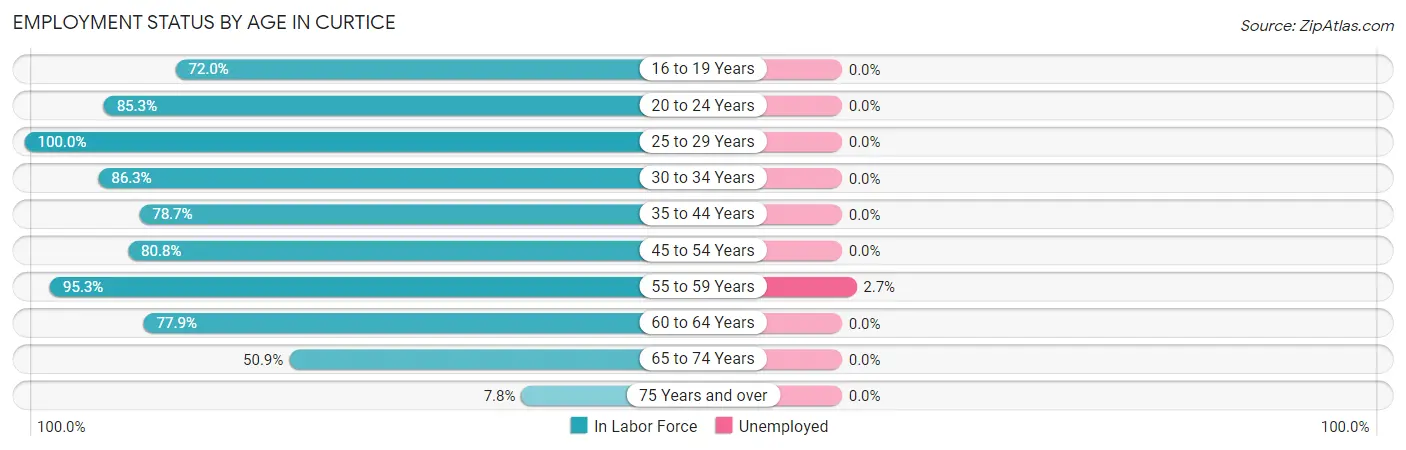
| Age Bracket | In Labor Force | Unemployed |
| 16 to 19 Years | 18 (72.0%) | 0 (0.0%) |
| 20 to 24 Years | 180 (85.3%) | 0 (0.0%) |
| 25 to 29 Years | 52 (100.0%) | 0 (0.0%) |
| 30 to 34 Years | 63 (86.3%) | 0 (0.0%) |
| 35 to 44 Years | 100 (78.7%) | 0 (0.0%) |
| 45 to 54 Years | 185 (80.8%) | 0 (0.0%) |
| 55 to 59 Years | 184 (95.3%) | 5 (2.7%) |
| 60 to 64 Years | 102 (77.9%) | 0 (0.0%) |
| 65 to 74 Years | 27 (50.9%) | 0 (0.0%) |
| 75 Years and over | 13 (7.8%) | 0 (0.0%) |
| Total | 924 (73.3%) | 5 (0.5%) |
Employment Status by Educational Attainment in Curtice
According to labor force statistics for Curtice, 85.2% of individuals (686) out of the total population between 25 and 64 years of age (805) are in the labor force, with 0.7% or 5 of them being unemployed. The group with the highest labor force participation rate are those with the educational attainment of less than high school, with 100.0% or 24 individuals in the labor force. Within the labor force, individuals with high school diploma education have the highest percentage of unemployment, with 2.7% or 5 of them being unemployed.
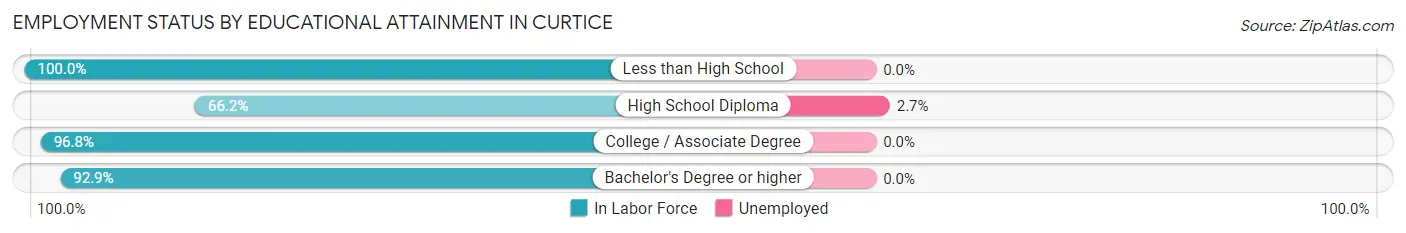
| Educational Attainment | In Labor Force | Unemployed |
| Less than High School | 24 (100.0%) | 0 (0.0%) |
| High School Diploma | 182 (66.2%) | 7 (2.7%) |
| College / Associate Degree | 243 (96.8%) | 0 (0.0%) |
| Bachelor's Degree or higher | 237 (92.9%) | 0 (0.0%) |
| Total | 686 (85.2%) | 6 (0.7%) |
Employment Occupations by Sex in Curtice
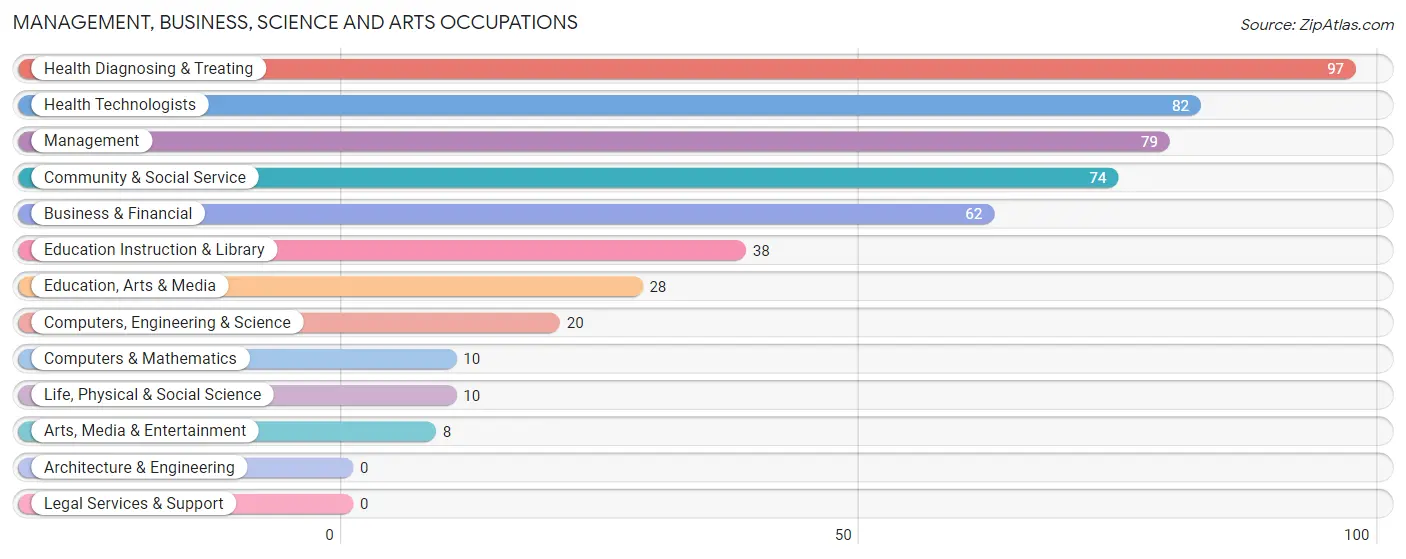
Management, Business, Science and Arts Occupations
The most common Management, Business, Science and Arts occupations in Curtice are Health Diagnosing & Treating (97 | 10.5%), Health Technologists (82 | 8.9%), Management (79 | 8.6%), Community & Social Service (74 | 8.1%), and Business & Financial (62 | 6.8%).
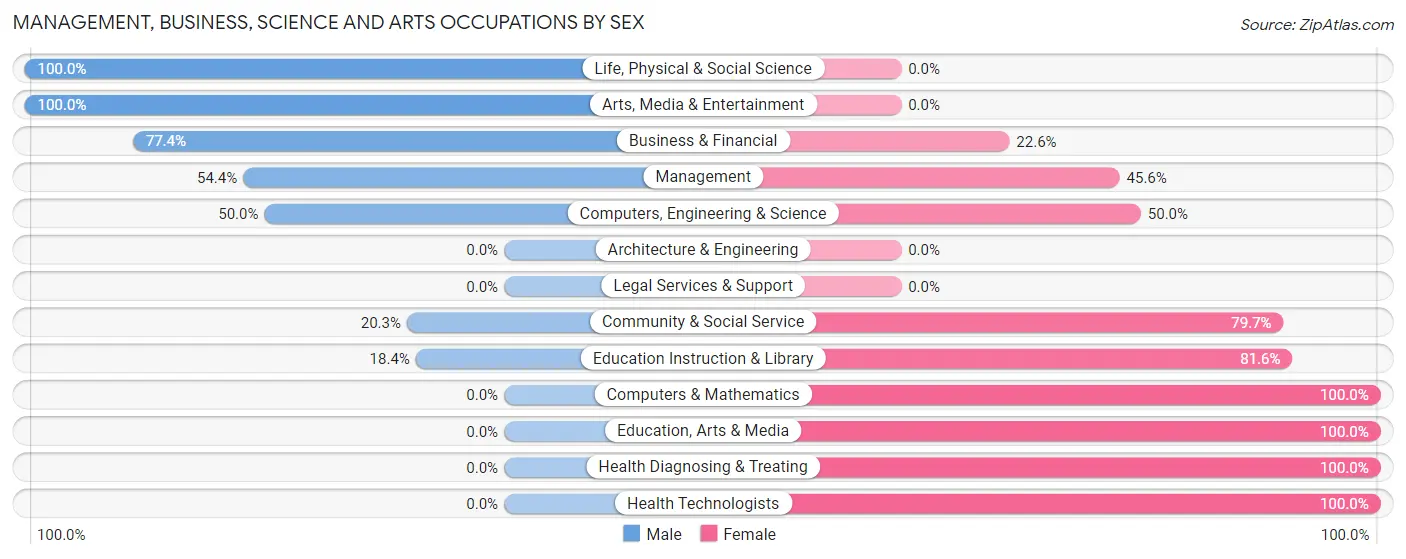
Management, Business, Science and Arts Occupations by Sex
Within the Management, Business, Science and Arts occupations in Curtice, the most male-oriented occupations are Life, Physical & Social Science (100.0%), Arts, Media & Entertainment (100.0%), and Business & Financial (77.4%), while the most female-oriented occupations are Computers & Mathematics (100.0%), Education, Arts & Media (100.0%), and Health Diagnosing & Treating (100.0%).
| Occupation | Male | Female |
| Management | 43 (54.4%) | 36 (45.6%) |
| Business & Financial | 48 (77.4%) | 14 (22.6%) |
| Computers, Engineering & Science | 10 (50.0%) | 10 (50.0%) |
| Computers & Mathematics | 0 (0.0%) | 10 (100.0%) |
| Architecture & Engineering | 0 (0.0%) | 0 (0.0%) |
| Life, Physical & Social Science | 10 (100.0%) | 0 (0.0%) |
| Community & Social Service | 15 (20.3%) | 59 (79.7%) |
| Education, Arts & Media | 0 (0.0%) | 28 (100.0%) |
| Legal Services & Support | 0 (0.0%) | 0 (0.0%) |
| Education Instruction & Library | 7 (18.4%) | 31 (81.6%) |
| Arts, Media & Entertainment | 8 (100.0%) | 0 (0.0%) |
| Health Diagnosing & Treating | 0 (0.0%) | 97 (100.0%) |
| Health Technologists | 0 (0.0%) | 82 (100.0%) |
| Total (Category) | 116 (34.9%) | 216 (65.1%) |
| Total (Overall) | 500 (54.4%) | 419 (45.6%) |
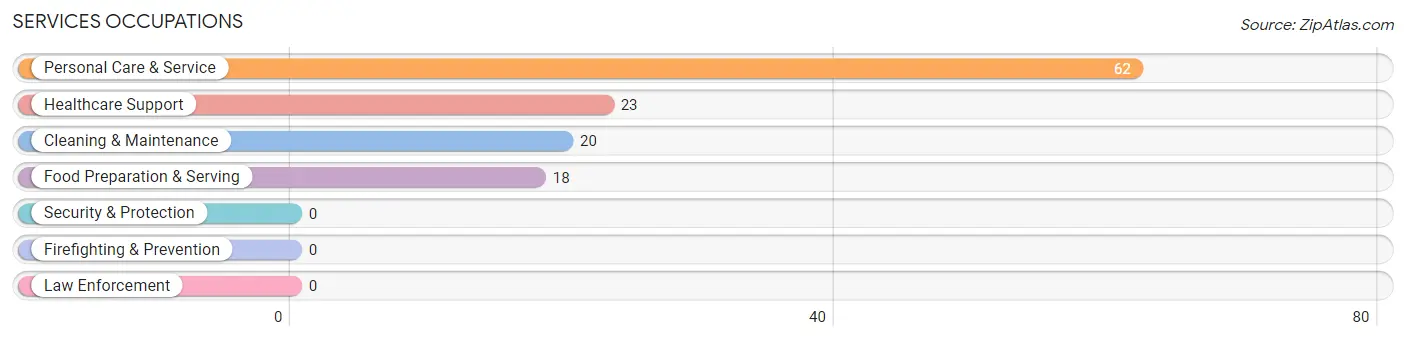
Services Occupations
The most common Services occupations in Curtice are Personal Care & Service (62 | 6.8%), Healthcare Support (23 | 2.5%), Cleaning & Maintenance (20 | 2.2%), and Food Preparation & Serving (18 | 2.0%).
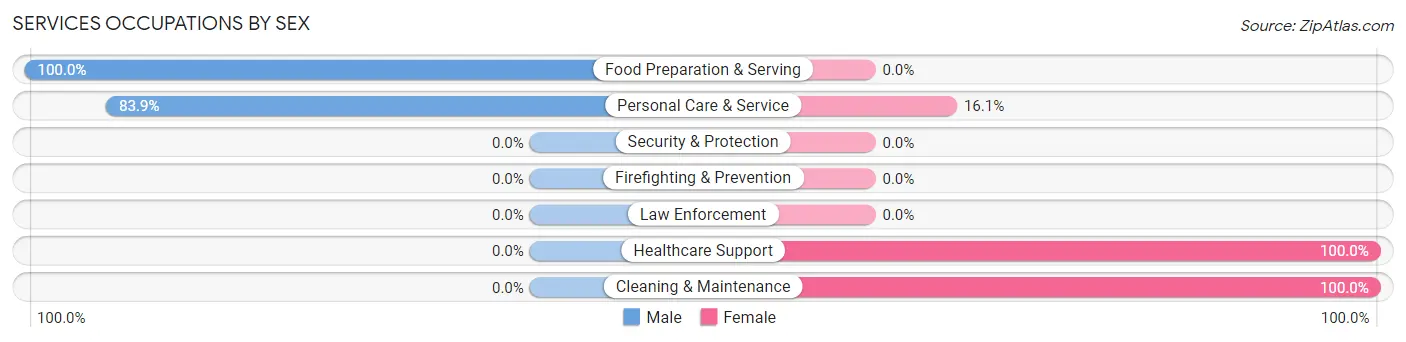
Services Occupations by Sex
Within the Services occupations in Curtice, the most male-oriented occupations are Food Preparation & Serving (100.0%), and Personal Care & Service (83.9%), while the most female-oriented occupations are Healthcare Support (100.0%), Cleaning & Maintenance (100.0%), and Personal Care & Service (16.1%).
| Occupation | Male | Female |
| Healthcare Support | 0 (0.0%) | 23 (100.0%) |
| Security & Protection | 0 (0.0%) | 0 (0.0%) |
| Firefighting & Prevention | 0 (0.0%) | 0 (0.0%) |
| Law Enforcement | 0 (0.0%) | 0 (0.0%) |
| Food Preparation & Serving | 18 (100.0%) | 0 (0.0%) |
| Cleaning & Maintenance | 0 (0.0%) | 20 (100.0%) |
| Personal Care & Service | 52 (83.9%) | 10 (16.1%) |
| Total (Category) | 70 (56.9%) | 53 (43.1%) |
| Total (Overall) | 500 (54.4%) | 419 (45.6%) |
Sales and Office Occupations
The most common Sales and Office occupations in Curtice are Office & Administration (174 | 18.9%), and Sales & Related (50 | 5.4%).
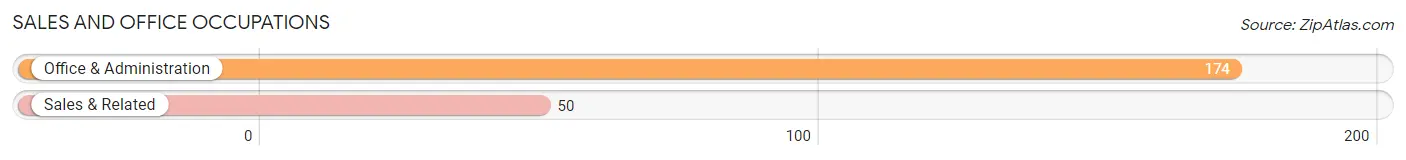
Sales and Office Occupations by Sex

| Occupation | Male | Female |
| Sales & Related | 50 (100.0%) | 0 (0.0%) |
| Office & Administration | 24 (13.8%) | 150 (86.2%) |
| Total (Category) | 74 (33.0%) | 150 (67.0%) |
| Total (Overall) | 500 (54.4%) | 419 (45.6%) |
Natural Resources, Construction and Maintenance Occupations
The most common Natural Resources, Construction and Maintenance occupations in Curtice are Construction & Extraction (50 | 5.4%), and Installation, Maintenance & Repair (44 | 4.8%).
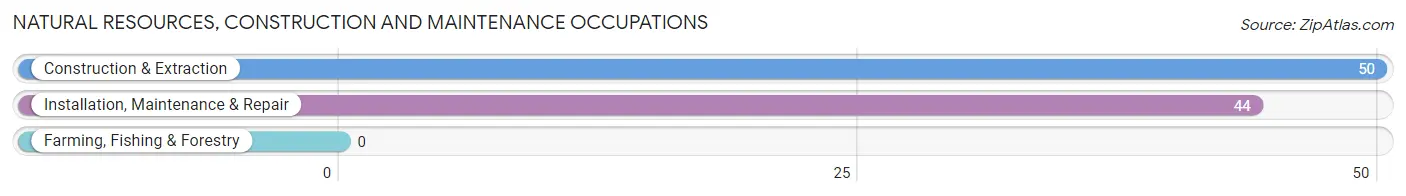
Natural Resources, Construction and Maintenance Occupations by Sex
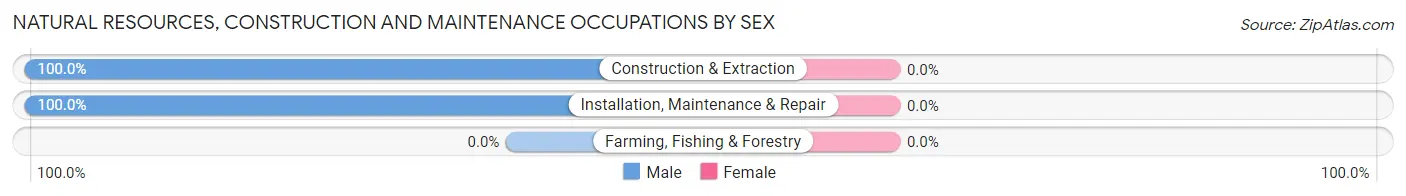
| Occupation | Male | Female |
| Farming, Fishing & Forestry | 0 (0.0%) | 0 (0.0%) |
| Construction & Extraction | 50 (100.0%) | 0 (0.0%) |
| Installation, Maintenance & Repair | 44 (100.0%) | 0 (0.0%) |
| Total (Category) | 94 (100.0%) | 0 (0.0%) |
| Total (Overall) | 500 (54.4%) | 419 (45.6%) |
Production, Transportation and Moving Occupations
The most common Production, Transportation and Moving occupations in Curtice are Production (96 | 10.4%), and Transportation (50 | 5.4%).
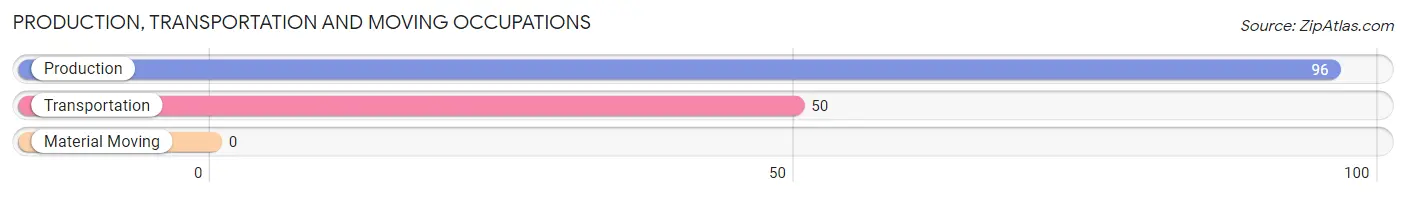
Production, Transportation and Moving Occupations by Sex
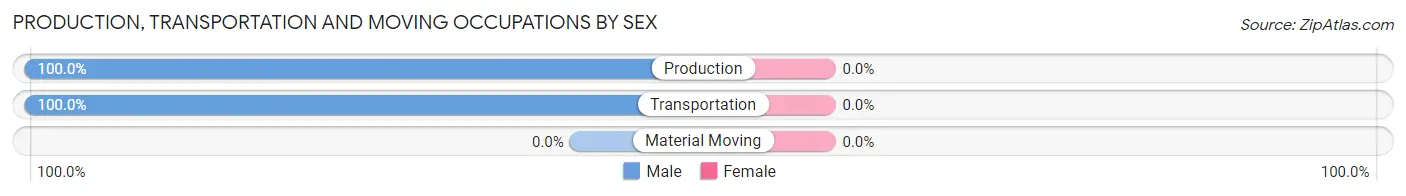
| Occupation | Male | Female |
| Production | 96 (100.0%) | 0 (0.0%) |
| Transportation | 50 (100.0%) | 0 (0.0%) |
| Material Moving | 0 (0.0%) | 0 (0.0%) |
| Total (Category) | 146 (100.0%) | 0 (0.0%) |
| Total (Overall) | 500 (54.4%) | 419 (45.6%) |
Employment Industries by Sex in Curtice
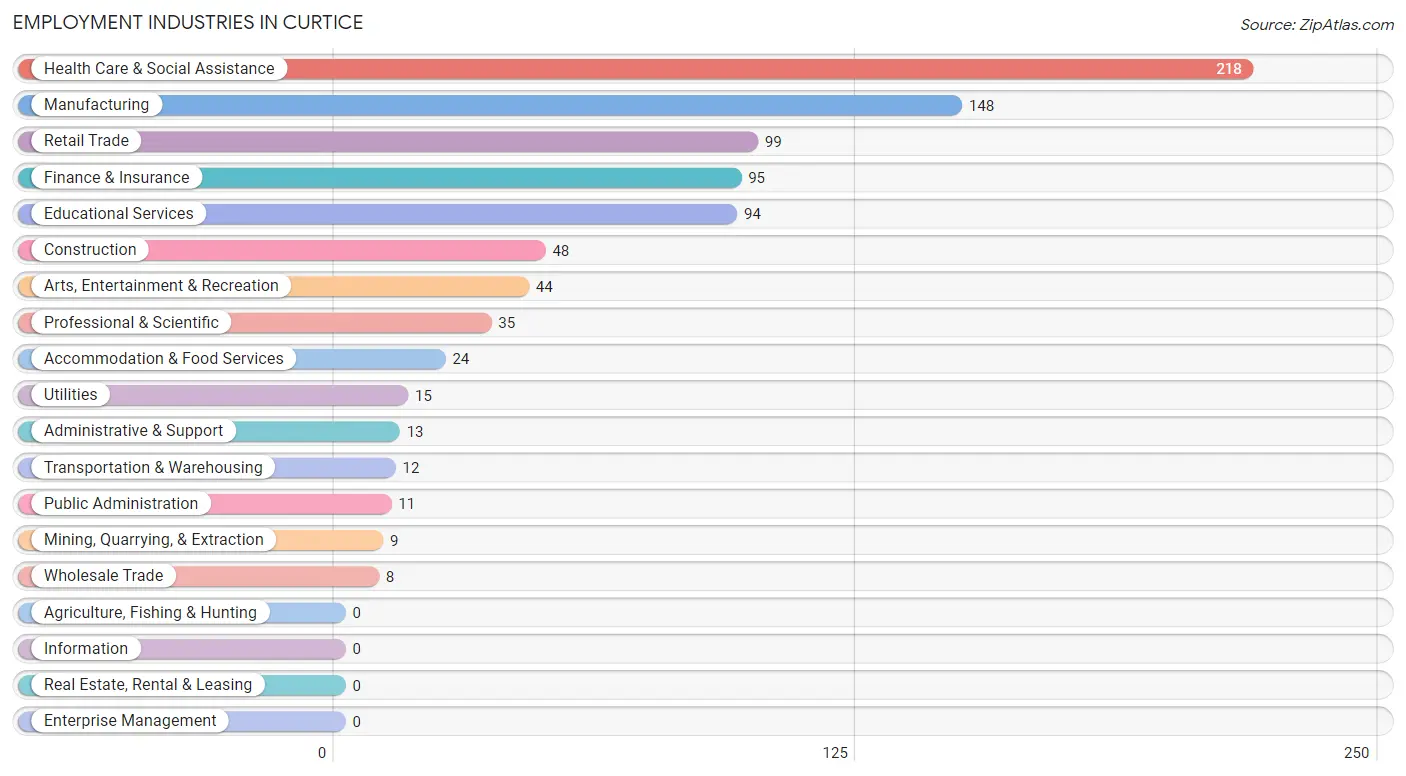
Employment Industries in Curtice
The major employment industries in Curtice include Health Care & Social Assistance (218 | 23.7%), Manufacturing (148 | 16.1%), Retail Trade (99 | 10.8%), Finance & Insurance (95 | 10.3%), and Educational Services (94 | 10.2%).
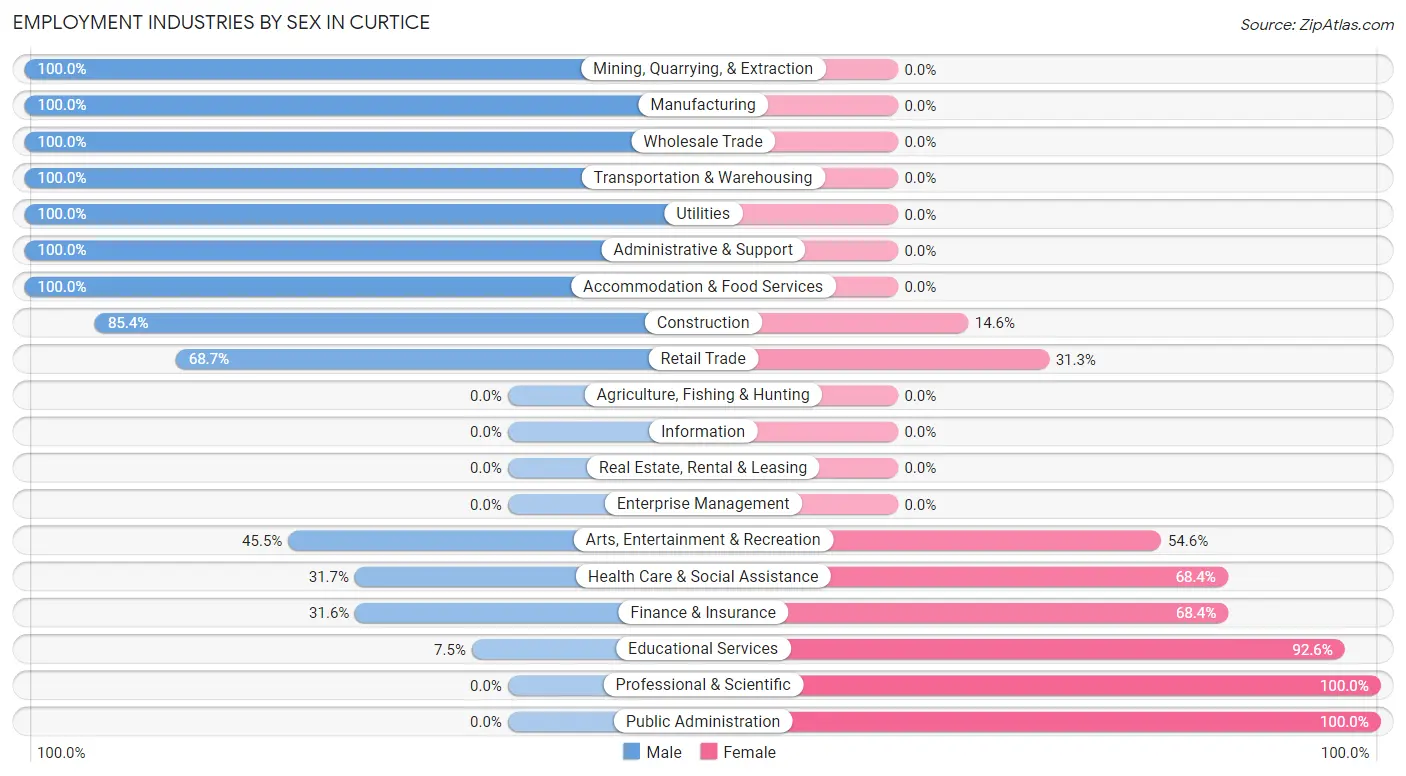
Employment Industries by Sex in Curtice
The Curtice industries that see more men than women are Mining, Quarrying, & Extraction (100.0%), Manufacturing (100.0%), and Wholesale Trade (100.0%), whereas the industries that tend to have a higher number of women are Professional & Scientific (100.0%), Public Administration (100.0%), and Educational Services (92.5%).
| Industry | Male | Female |
| Agriculture, Fishing & Hunting | 0 (0.0%) | 0 (0.0%) |
| Mining, Quarrying, & Extraction | 9 (100.0%) | 0 (0.0%) |
| Construction | 41 (85.4%) | 7 (14.6%) |
| Manufacturing | 148 (100.0%) | 0 (0.0%) |
| Wholesale Trade | 8 (100.0%) | 0 (0.0%) |
| Retail Trade | 68 (68.7%) | 31 (31.3%) |
| Transportation & Warehousing | 12 (100.0%) | 0 (0.0%) |
| Utilities | 15 (100.0%) | 0 (0.0%) |
| Information | 0 (0.0%) | 0 (0.0%) |
| Finance & Insurance | 30 (31.6%) | 65 (68.4%) |
| Real Estate, Rental & Leasing | 0 (0.0%) | 0 (0.0%) |
| Professional & Scientific | 0 (0.0%) | 35 (100.0%) |
| Enterprise Management | 0 (0.0%) | 0 (0.0%) |
| Administrative & Support | 13 (100.0%) | 0 (0.0%) |
| Educational Services | 7 (7.4%) | 87 (92.5%) |
| Health Care & Social Assistance | 69 (31.7%) | 149 (68.3%) |
| Arts, Entertainment & Recreation | 20 (45.5%) | 24 (54.5%) |
| Accommodation & Food Services | 24 (100.0%) | 0 (0.0%) |
| Public Administration | 0 (0.0%) | 11 (100.0%) |
| Total | 500 (54.4%) | 419 (45.6%) |
Education in Curtice
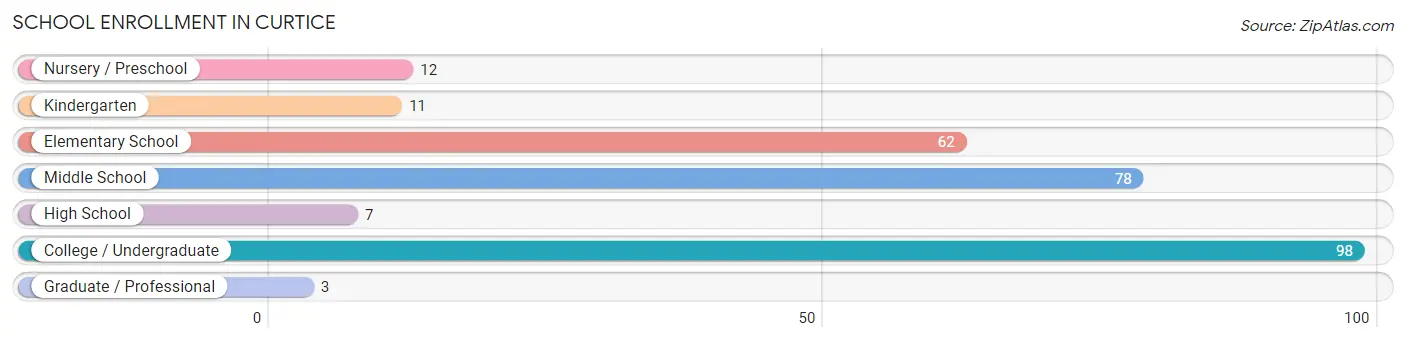
School Enrollment in Curtice
The most common levels of schooling among the 271 students in Curtice are college / undergraduate (98 | 36.2%), middle school (78 | 28.8%), and elementary school (62 | 22.9%).
| School Level | # Students | % Students |
| Nursery / Preschool | 12 | 4.4% |
| Kindergarten | 11 | 4.1% |
| Elementary School | 62 | 22.9% |
| Middle School | 78 | 28.8% |
| High School | 7 | 2.6% |
| College / Undergraduate | 98 | 36.2% |
| Graduate / Professional | 3 | 1.1% |
| Total | 271 | 100.0% |
School Enrollment by Age by Funding Source in Curtice
Out of a total of 271 students who are enrolled in schools in Curtice, 67 (24.7%) attend a private institution, while the remaining 204 (75.3%) are enrolled in public schools. The age group of 35 years and over has the highest likelihood of being enrolled in private schools, with 3 (100.0% in the age bracket) enrolled. Conversely, the age group of 5 to 9 year old has the lowest likelihood of being enrolled in a private school, with 85 (100.0% in the age bracket) attending a public institution.
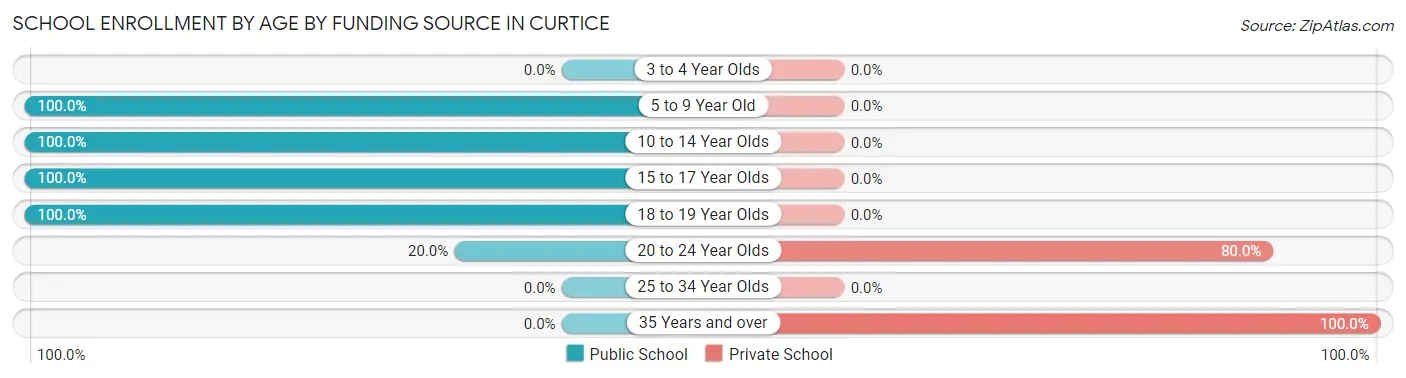
| Age Bracket | Public School | Private School |
| 3 to 4 Year Olds | 0 (0.0%) | 0 (0.0%) |
| 5 to 9 Year Old | 85 (100.0%) | 0 (0.0%) |
| 10 to 14 Year Olds | 78 (100.0%) | 0 (0.0%) |
| 15 to 17 Year Olds | 7 (100.0%) | 0 (0.0%) |
| 18 to 19 Year Olds | 18 (100.0%) | 0 (0.0%) |
| 20 to 24 Year Olds | 16 (20.0%) | 64 (80.0%) |
| 25 to 34 Year Olds | 0 (0.0%) | 0 (0.0%) |
| 35 Years and over | 0 (0.0%) | 3 (100.0%) |
| Total | 204 (75.3%) | 67 (24.7%) |
Educational Attainment by Field of Study in Curtice
Business (86 | 24.7%), education (63 | 18.1%), science & technology (54 | 15.5%), arts & humanities (35 | 10.1%), and psychology (24 | 6.9%) are the most common fields of study among 348 individuals in Curtice who have obtained a bachelor's degree or higher.
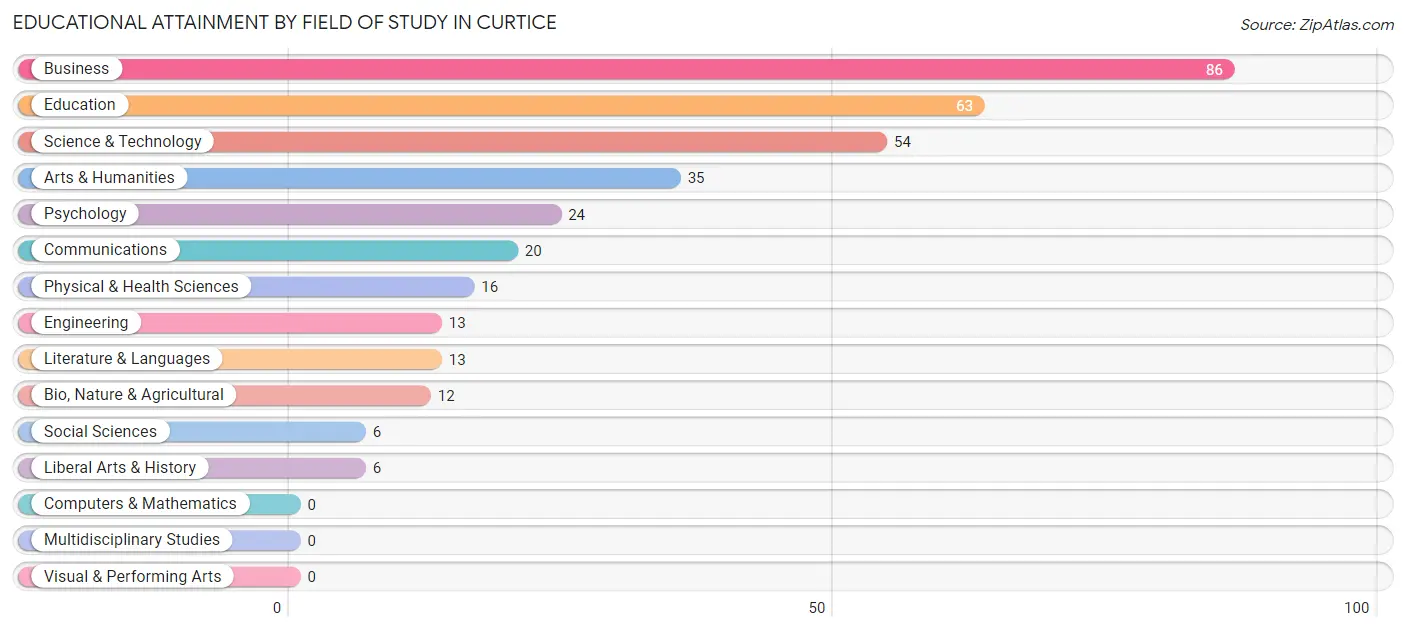
| Field of Study | # Graduates | % Graduates |
| Computers & Mathematics | 0 | 0.0% |
| Bio, Nature & Agricultural | 12 | 3.5% |
| Physical & Health Sciences | 16 | 4.6% |
| Psychology | 24 | 6.9% |
| Social Sciences | 6 | 1.7% |
| Engineering | 13 | 3.7% |
| Multidisciplinary Studies | 0 | 0.0% |
| Science & Technology | 54 | 15.5% |
| Business | 86 | 24.7% |
| Education | 63 | 18.1% |
| Literature & Languages | 13 | 3.7% |
| Liberal Arts & History | 6 | 1.7% |
| Visual & Performing Arts | 0 | 0.0% |
| Communications | 20 | 5.8% |
| Arts & Humanities | 35 | 10.1% |
| Total | 348 | 100.0% |
Transportation & Commute in Curtice
Vehicle Availability by Sex in Curtice
The most prevalent vehicle ownership categories in Curtice are males with 2 vehicles (199, accounting for 42.8%) and females with 2 vehicles (181, making up 49.0%).
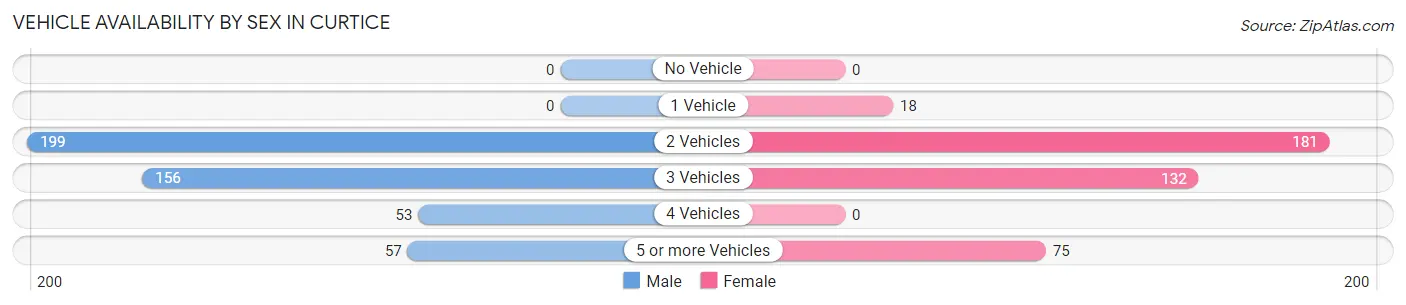
| Vehicles Available | Male | Female |
| No Vehicle | 0 (0.0%) | 0 (0.0%) |
| 1 Vehicle | 0 (0.0%) | 18 (4.4%) |
| 2 Vehicles | 199 (42.8%) | 181 (44.6%) |
| 3 Vehicles | 156 (33.6%) | 132 (32.5%) |
| 4 Vehicles | 53 (11.4%) | 0 (0.0%) |
| 5 or more Vehicles | 57 (12.3%) | 75 (18.5%) |
| Total | 465 (100.0%) | 406 (100.0%) |
Commute Time in Curtice
The most frequently occuring commute durations in Curtice are 15 to 19 minutes (244 commuters, 29.3%), 10 to 14 minutes (242 commuters, 29.1%), and 30 to 34 minutes (111 commuters, 13.3%).
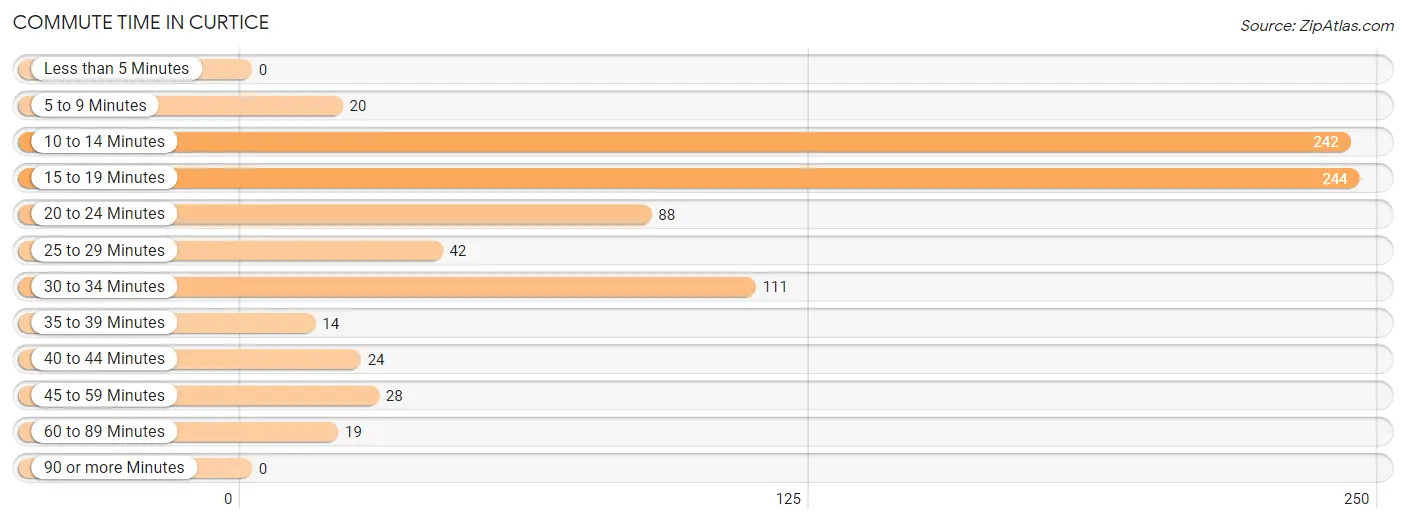
| Commute Time | # Commuters | % Commuters |
| Less than 5 Minutes | 0 | 0.0% |
| 5 to 9 Minutes | 20 | 2.4% |
| 10 to 14 Minutes | 242 | 29.1% |
| 15 to 19 Minutes | 244 | 29.3% |
| 20 to 24 Minutes | 88 | 10.6% |
| 25 to 29 Minutes | 42 | 5.1% |
| 30 to 34 Minutes | 111 | 13.3% |
| 35 to 39 Minutes | 14 | 1.7% |
| 40 to 44 Minutes | 24 | 2.9% |
| 45 to 59 Minutes | 28 | 3.4% |
| 60 to 89 Minutes | 19 | 2.3% |
| 90 or more Minutes | 0 | 0.0% |
Commute Time by Sex in Curtice
The most common commute times in Curtice are 15 to 19 minutes (163 commuters, 37.7%) for males and 10 to 14 minutes (165 commuters, 41.2%) for females.
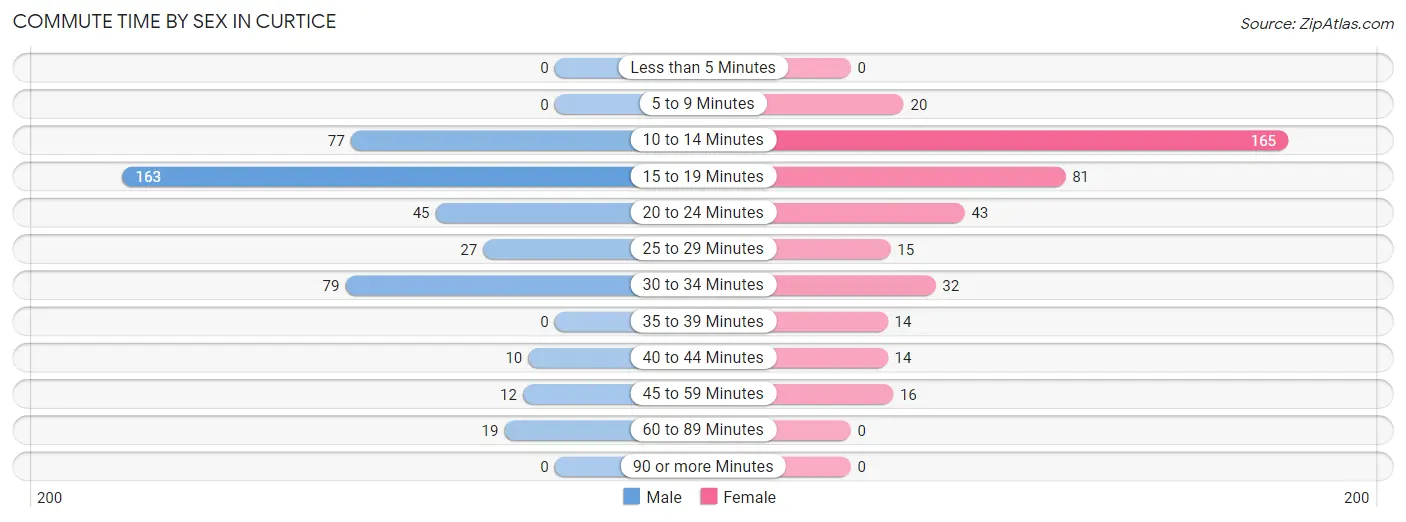
| Commute Time | Male | Female |
| Less than 5 Minutes | 0 (0.0%) | 0 (0.0%) |
| 5 to 9 Minutes | 0 (0.0%) | 20 (5.0%) |
| 10 to 14 Minutes | 77 (17.8%) | 165 (41.2%) |
| 15 to 19 Minutes | 163 (37.7%) | 81 (20.3%) |
| 20 to 24 Minutes | 45 (10.4%) | 43 (10.7%) |
| 25 to 29 Minutes | 27 (6.2%) | 15 (3.7%) |
| 30 to 34 Minutes | 79 (18.3%) | 32 (8.0%) |
| 35 to 39 Minutes | 0 (0.0%) | 14 (3.5%) |
| 40 to 44 Minutes | 10 (2.3%) | 14 (3.5%) |
| 45 to 59 Minutes | 12 (2.8%) | 16 (4.0%) |
| 60 to 89 Minutes | 19 (4.4%) | 0 (0.0%) |
| 90 or more Minutes | 0 (0.0%) | 0 (0.0%) |
Time of Departure to Work by Sex in Curtice
The most frequent times of departure to work in Curtice are 12:00 AM to 4:59 AM (90, 20.8%) for males and 7:00 AM to 7:29 AM (71, 17.7%) for females.
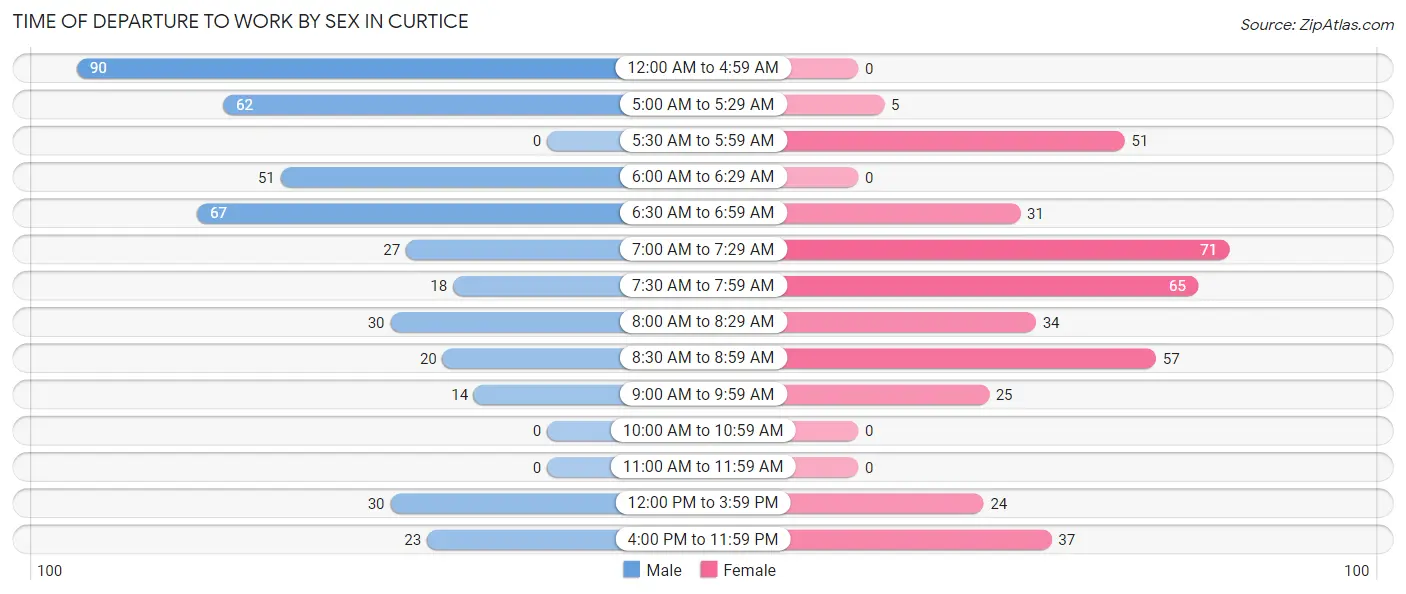
| Time of Departure | Male | Female |
| 12:00 AM to 4:59 AM | 90 (20.8%) | 0 (0.0%) |
| 5:00 AM to 5:29 AM | 62 (14.3%) | 5 (1.3%) |
| 5:30 AM to 5:59 AM | 0 (0.0%) | 51 (12.8%) |
| 6:00 AM to 6:29 AM | 51 (11.8%) | 0 (0.0%) |
| 6:30 AM to 6:59 AM | 67 (15.5%) | 31 (7.7%) |
| 7:00 AM to 7:29 AM | 27 (6.2%) | 71 (17.7%) |
| 7:30 AM to 7:59 AM | 18 (4.2%) | 65 (16.3%) |
| 8:00 AM to 8:29 AM | 30 (6.9%) | 34 (8.5%) |
| 8:30 AM to 8:59 AM | 20 (4.6%) | 57 (14.2%) |
| 9:00 AM to 9:59 AM | 14 (3.2%) | 25 (6.2%) |
| 10:00 AM to 10:59 AM | 0 (0.0%) | 0 (0.0%) |
| 11:00 AM to 11:59 AM | 0 (0.0%) | 0 (0.0%) |
| 12:00 PM to 3:59 PM | 30 (6.9%) | 24 (6.0%) |
| 4:00 PM to 11:59 PM | 23 (5.3%) | 37 (9.2%) |
| Total | 432 (100.0%) | 400 (100.0%) |
Housing Occupancy in Curtice
Occupancy by Ownership in Curtice
Of the total 560 dwellings in Curtice, owner-occupied units account for 544 (97.1%), while renter-occupied units make up 16 (2.9%).
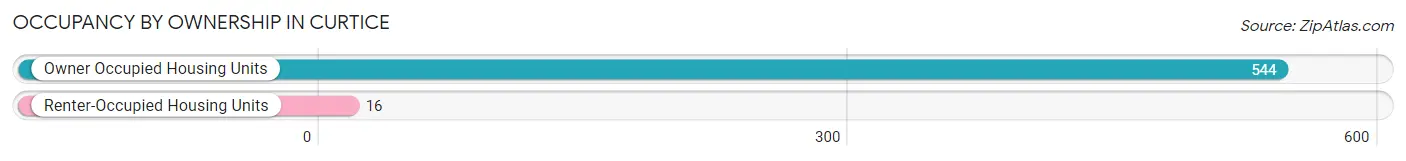
| Occupancy | # Housing Units | % Housing Units |
| Owner Occupied Housing Units | 544 | 97.1% |
| Renter-Occupied Housing Units | 16 | 2.9% |
| Total Occupied Housing Units | 560 | 100.0% |
Occupancy by Household Size in Curtice
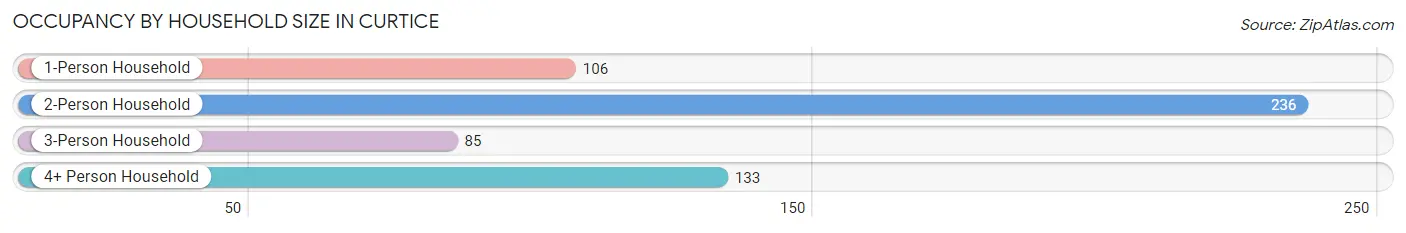
| Household Size | # Housing Units | % Housing Units |
| 1-Person Household | 106 | 18.9% |
| 2-Person Household | 236 | 42.1% |
| 3-Person Household | 85 | 15.2% |
| 4+ Person Household | 133 | 23.7% |
| Total Housing Units | 560 | 100.0% |
Occupancy by Ownership by Household Size in Curtice
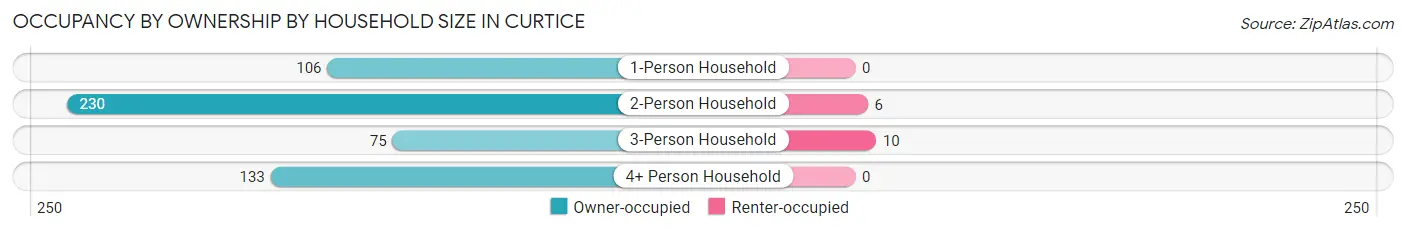
| Household Size | Owner-occupied | Renter-occupied |
| 1-Person Household | 106 (100.0%) | 0 (0.0%) |
| 2-Person Household | 230 (97.5%) | 6 (2.5%) |
| 3-Person Household | 75 (88.2%) | 10 (11.8%) |
| 4+ Person Household | 133 (100.0%) | 0 (0.0%) |
| Total Housing Units | 544 (97.1%) | 16 (2.9%) |
Occupancy by Educational Attainment in Curtice
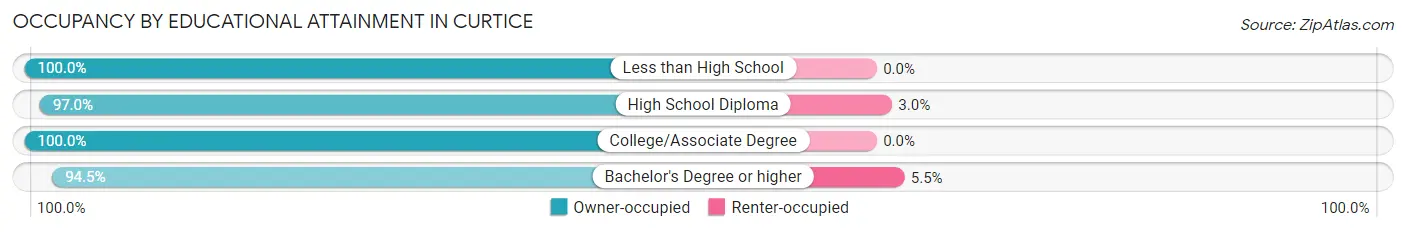
| Household Size | Owner-occupied | Renter-occupied |
| Less than High School | 24 (100.0%) | 0 (0.0%) |
| High School Diploma | 193 (97.0%) | 6 (3.0%) |
| College/Associate Degree | 155 (100.0%) | 0 (0.0%) |
| Bachelor's Degree or higher | 172 (94.5%) | 10 (5.5%) |
Occupancy by Age of Householder in Curtice
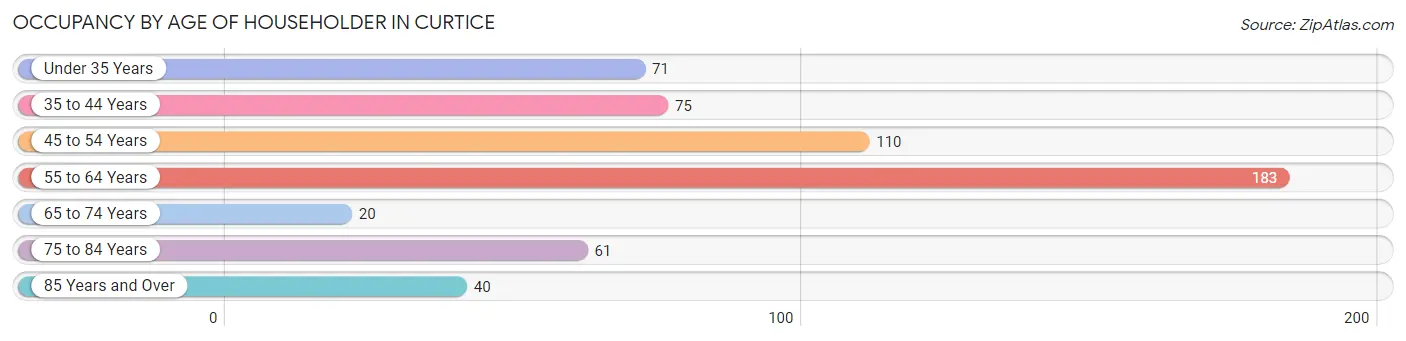
| Age Bracket | # Households | % Households |
| Under 35 Years | 71 | 12.7% |
| 35 to 44 Years | 75 | 13.4% |
| 45 to 54 Years | 110 | 19.6% |
| 55 to 64 Years | 183 | 32.7% |
| 65 to 74 Years | 20 | 3.6% |
| 75 to 84 Years | 61 | 10.9% |
| 85 Years and Over | 40 | 7.1% |
| Total | 560 | 100.0% |
Housing Finances in Curtice
Median Income by Occupancy in Curtice
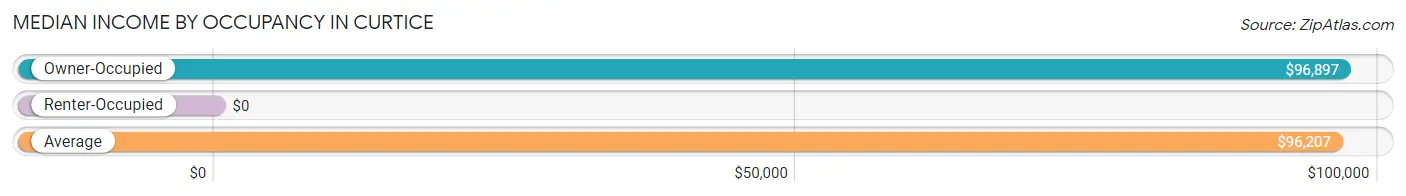
| Occupancy Type | # Households | Median Income |
| Owner-Occupied | 544 (97.1%) | $96,897 |
| Renter-Occupied | 16 (2.9%) | $0 |
| Average | 560 (100.0%) | $96,207 |
Occupancy by Householder Income Bracket in Curtice
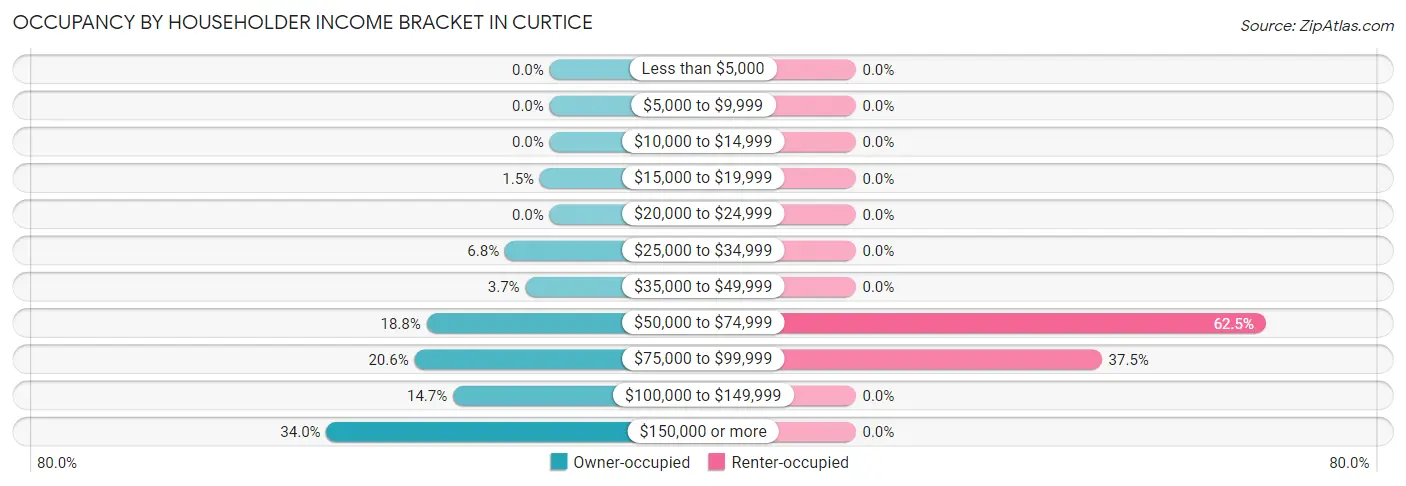
| Income Bracket | Owner-occupied | Renter-occupied |
| Less than $5,000 | 0 (0.0%) | 0 (0.0%) |
| $5,000 to $9,999 | 0 (0.0%) | 0 (0.0%) |
| $10,000 to $14,999 | 0 (0.0%) | 0 (0.0%) |
| $15,000 to $19,999 | 8 (1.5%) | 0 (0.0%) |
| $20,000 to $24,999 | 0 (0.0%) | 0 (0.0%) |
| $25,000 to $34,999 | 37 (6.8%) | 0 (0.0%) |
| $35,000 to $49,999 | 20 (3.7%) | 0 (0.0%) |
| $50,000 to $74,999 | 102 (18.8%) | 10 (62.5%) |
| $75,000 to $99,999 | 112 (20.6%) | 6 (37.5%) |
| $100,000 to $149,999 | 80 (14.7%) | 0 (0.0%) |
| $150,000 or more | 185 (34.0%) | 0 (0.0%) |
| Total | 544 (100.0%) | 16 (100.0%) |
Monthly Housing Cost Tiers in Curtice
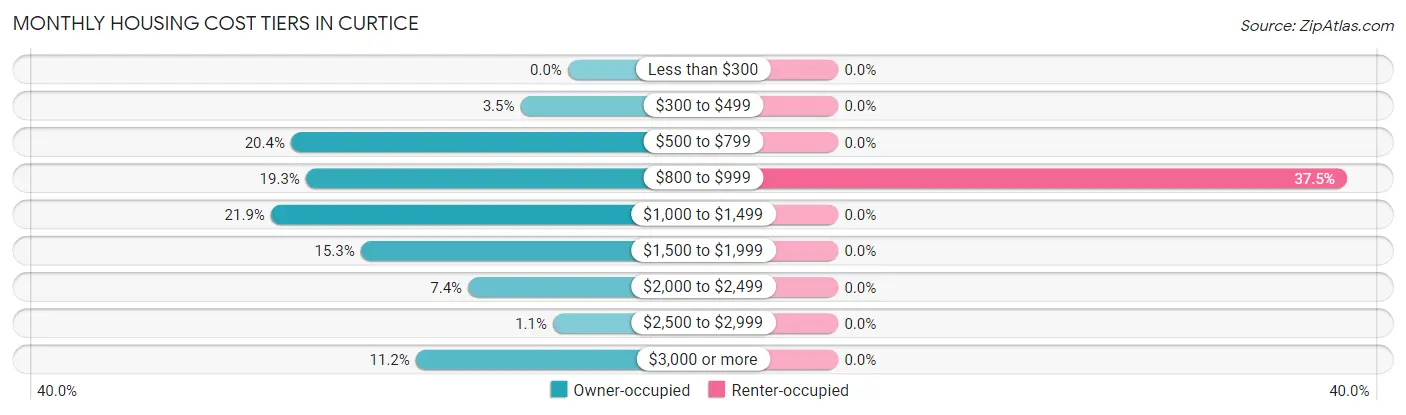
| Monthly Cost | Owner-occupied | Renter-occupied |
| Less than $300 | 0 (0.0%) | 0 (0.0%) |
| $300 to $499 | 19 (3.5%) | 0 (0.0%) |
| $500 to $799 | 111 (20.4%) | 0 (0.0%) |
| $800 to $999 | 105 (19.3%) | 6 (37.5%) |
| $1,000 to $1,499 | 119 (21.9%) | 0 (0.0%) |
| $1,500 to $1,999 | 83 (15.3%) | 0 (0.0%) |
| $2,000 to $2,499 | 40 (7.3%) | 0 (0.0%) |
| $2,500 to $2,999 | 6 (1.1%) | 0 (0.0%) |
| $3,000 or more | 61 (11.2%) | 0 (0.0%) |
| Total | 544 (100.0%) | 16 (100.0%) |
Physical Housing Characteristics in Curtice
Housing Structures in Curtice
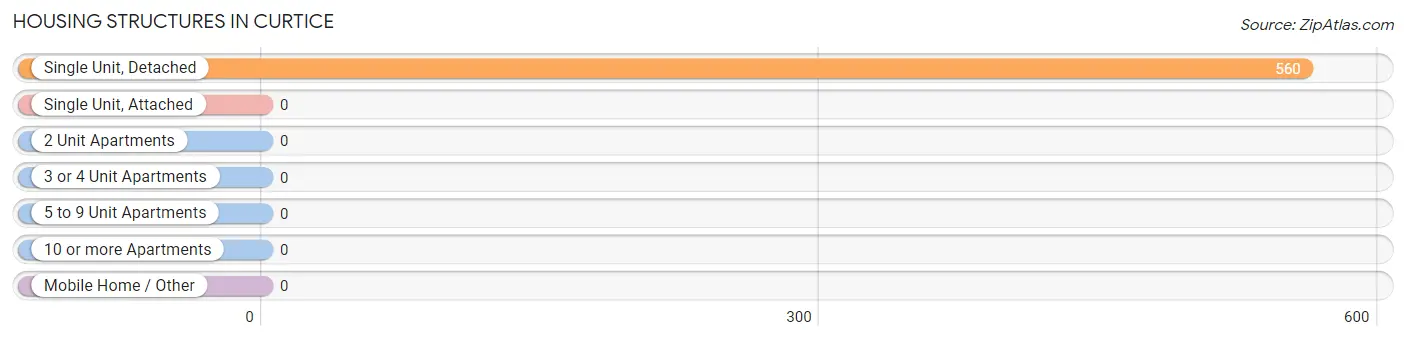
| Structure Type | # Housing Units | % Housing Units |
| Single Unit, Detached | 560 | 100.0% |
| Single Unit, Attached | 0 | 0.0% |
| 2 Unit Apartments | 0 | 0.0% |
| 3 or 4 Unit Apartments | 0 | 0.0% |
| 5 to 9 Unit Apartments | 0 | 0.0% |
| 10 or more Apartments | 0 | 0.0% |
| Mobile Home / Other | 0 | 0.0% |
| Total | 560 | 100.0% |
Housing Structures by Occupancy in Curtice
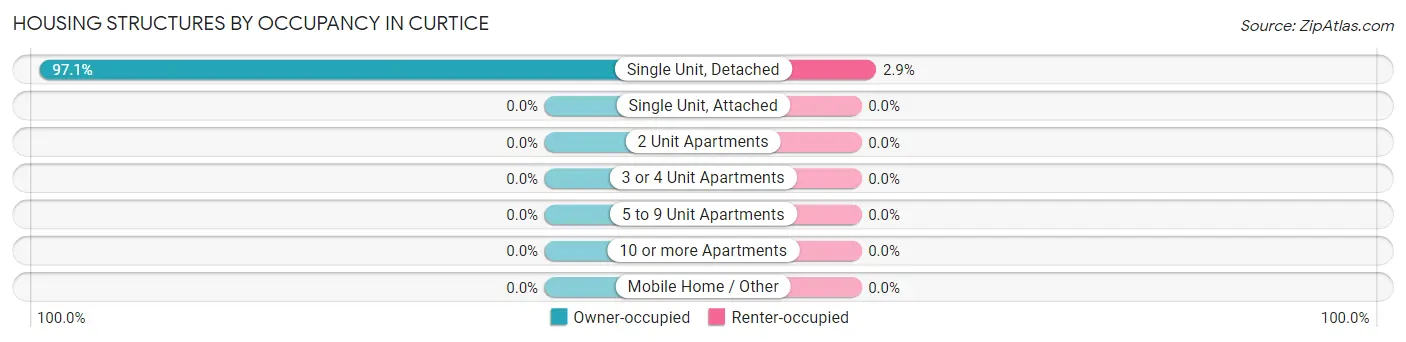
| Structure Type | Owner-occupied | Renter-occupied |
| Single Unit, Detached | 544 (97.1%) | 16 (2.9%) |
| Single Unit, Attached | 0 (0.0%) | 0 (0.0%) |
| 2 Unit Apartments | 0 (0.0%) | 0 (0.0%) |
| 3 or 4 Unit Apartments | 0 (0.0%) | 0 (0.0%) |
| 5 to 9 Unit Apartments | 0 (0.0%) | 0 (0.0%) |
| 10 or more Apartments | 0 (0.0%) | 0 (0.0%) |
| Mobile Home / Other | 0 (0.0%) | 0 (0.0%) |
| Total | 544 (97.1%) | 16 (2.9%) |
Housing Structures by Number of Rooms in Curtice
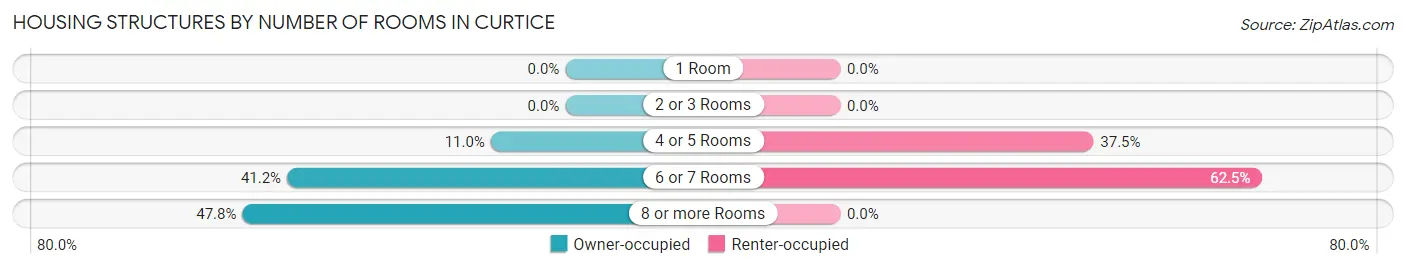
| Number of Rooms | Owner-occupied | Renter-occupied |
| 1 Room | 0 (0.0%) | 0 (0.0%) |
| 2 or 3 Rooms | 0 (0.0%) | 0 (0.0%) |
| 4 or 5 Rooms | 60 (11.0%) | 6 (37.5%) |
| 6 or 7 Rooms | 224 (41.2%) | 10 (62.5%) |
| 8 or more Rooms | 260 (47.8%) | 0 (0.0%) |
| Total | 544 (100.0%) | 16 (100.0%) |
Housing Structure by Heating Type in Curtice
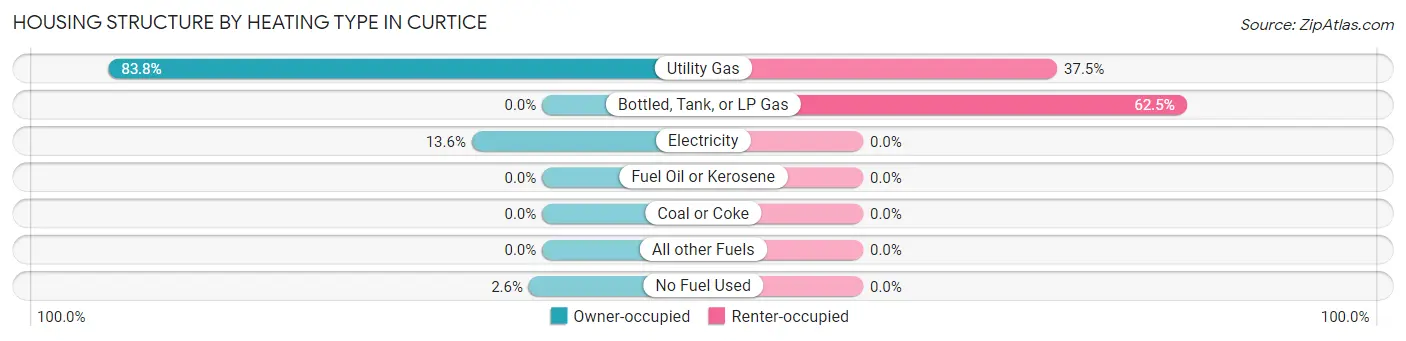
| Heating Type | Owner-occupied | Renter-occupied |
| Utility Gas | 456 (83.8%) | 6 (37.5%) |
| Bottled, Tank, or LP Gas | 0 (0.0%) | 10 (62.5%) |
| Electricity | 74 (13.6%) | 0 (0.0%) |
| Fuel Oil or Kerosene | 0 (0.0%) | 0 (0.0%) |
| Coal or Coke | 0 (0.0%) | 0 (0.0%) |
| All other Fuels | 0 (0.0%) | 0 (0.0%) |
| No Fuel Used | 14 (2.6%) | 0 (0.0%) |
| Total | 544 (100.0%) | 16 (100.0%) |
Household Vehicle Usage in Curtice
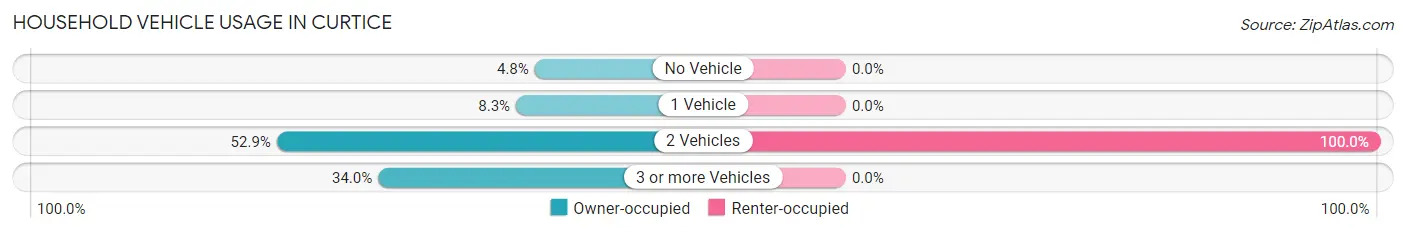
| Vehicles per Household | Owner-occupied | Renter-occupied |
| No Vehicle | 26 (4.8%) | 0 (0.0%) |
| 1 Vehicle | 45 (8.3%) | 0 (0.0%) |
| 2 Vehicles | 288 (52.9%) | 16 (100.0%) |
| 3 or more Vehicles | 185 (34.0%) | 0 (0.0%) |
| Total | 544 (100.0%) | 16 (100.0%) |
Real Estate & Mortgages in Curtice
Real Estate and Mortgage Overview in Curtice
| Characteristic | Without Mortgage | With Mortgage |
| Housing Units | 187 | 357 |
| Median Property Value | $305,800 | $229,600 |
| Median Household Income | $107,679 | $113 |
| Monthly Housing Costs | $633 | $61 |
| Real Estate Taxes | $3,797 | $17 |
Property Value by Mortgage Status in Curtice
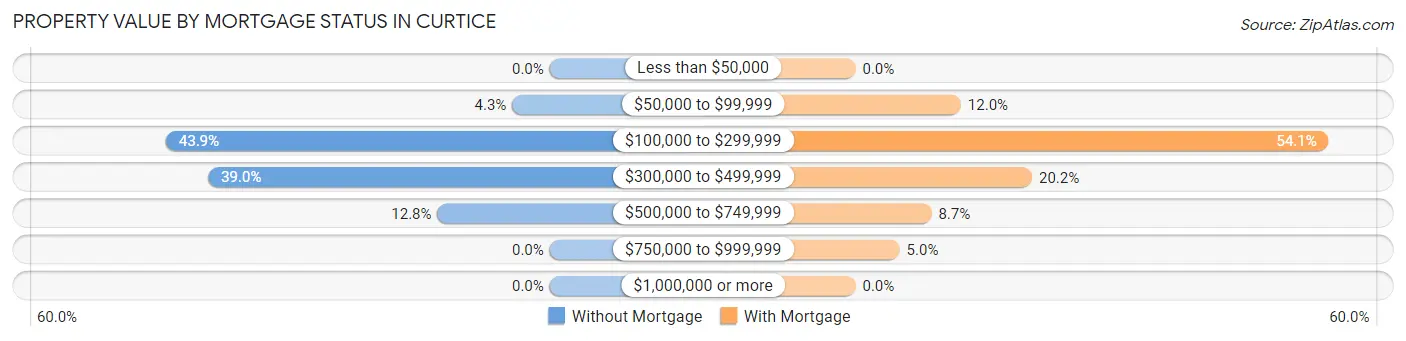
| Property Value | Without Mortgage | With Mortgage |
| Less than $50,000 | 0 (0.0%) | 0 (0.0%) |
| $50,000 to $99,999 | 8 (4.3%) | 43 (12.0%) |
| $100,000 to $299,999 | 82 (43.9%) | 193 (54.1%) |
| $300,000 to $499,999 | 73 (39.0%) | 72 (20.2%) |
| $500,000 to $749,999 | 24 (12.8%) | 31 (8.7%) |
| $750,000 to $999,999 | 0 (0.0%) | 18 (5.0%) |
| $1,000,000 or more | 0 (0.0%) | 0 (0.0%) |
| Total | 187 (100.0%) | 357 (100.0%) |
Household Income by Mortgage Status in Curtice
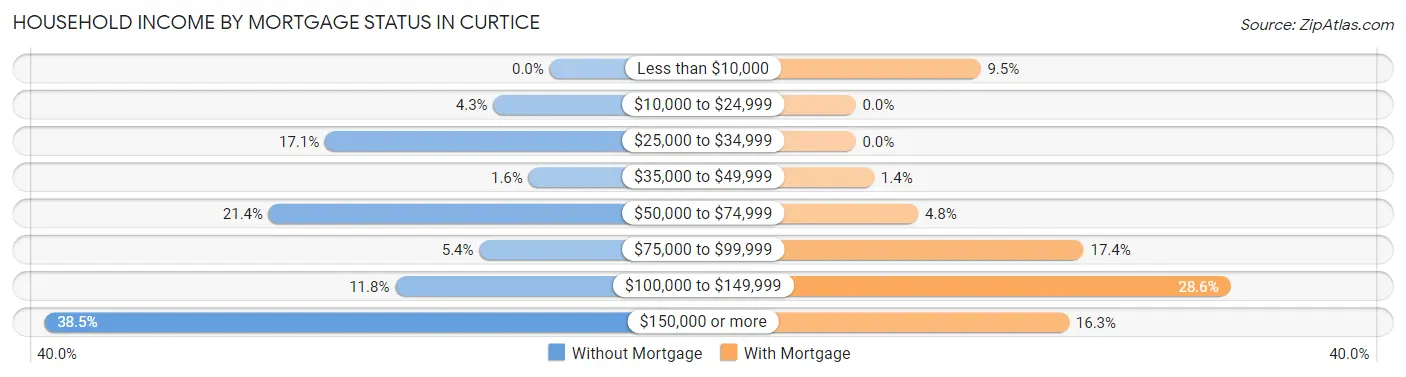
| Household Income | Without Mortgage | With Mortgage |
| Less than $10,000 | 0 (0.0%) | 34 (9.5%) |
| $10,000 to $24,999 | 8 (4.3%) | 0 (0.0%) |
| $25,000 to $34,999 | 32 (17.1%) | 0 (0.0%) |
| $35,000 to $49,999 | 3 (1.6%) | 5 (1.4%) |
| $50,000 to $74,999 | 40 (21.4%) | 17 (4.8%) |
| $75,000 to $99,999 | 10 (5.3%) | 62 (17.4%) |
| $100,000 to $149,999 | 22 (11.8%) | 102 (28.6%) |
| $150,000 or more | 72 (38.5%) | 58 (16.3%) |
| Total | 187 (100.0%) | 357 (100.0%) |
Property Value to Household Income Ratio in Curtice
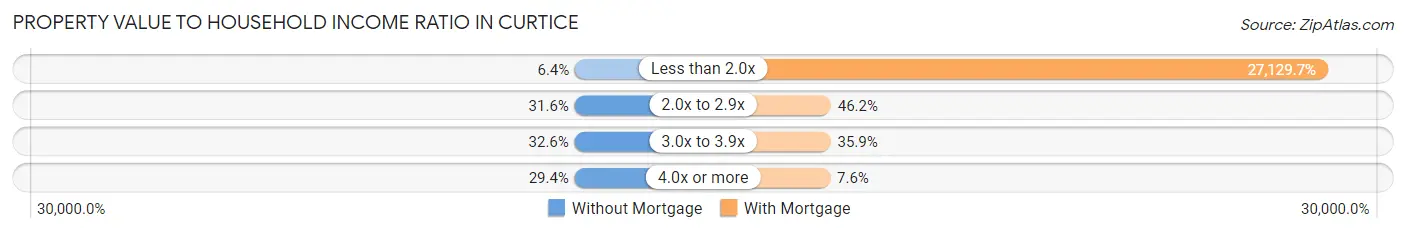
| Value-to-Income Ratio | Without Mortgage | With Mortgage |
| Less than 2.0x | 12 (6.4%) | 96,853 (27,129.7%) |
| 2.0x to 2.9x | 59 (31.6%) | 165 (46.2%) |
| 3.0x to 3.9x | 61 (32.6%) | 128 (35.8%) |
| 4.0x or more | 55 (29.4%) | 27 (7.6%) |
| Total | 187 (100.0%) | 357 (100.0%) |
Real Estate Taxes by Mortgage Status in Curtice
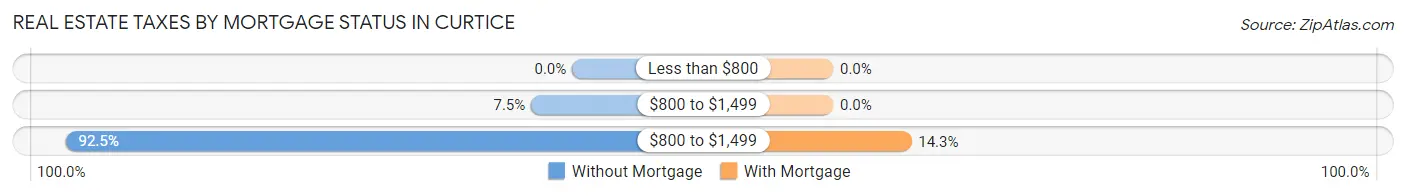
| Property Taxes | Without Mortgage | With Mortgage |
| Less than $800 | 0 (0.0%) | 0 (0.0%) |
| $800 to $1,499 | 14 (7.5%) | 0 (0.0%) |
| $800 to $1,499 | 173 (92.5%) | 51 (14.3%) |
| Total | 187 (100.0%) | 357 (100.0%) |
Health & Disability in Curtice
Health Insurance Coverage by Age in Curtice
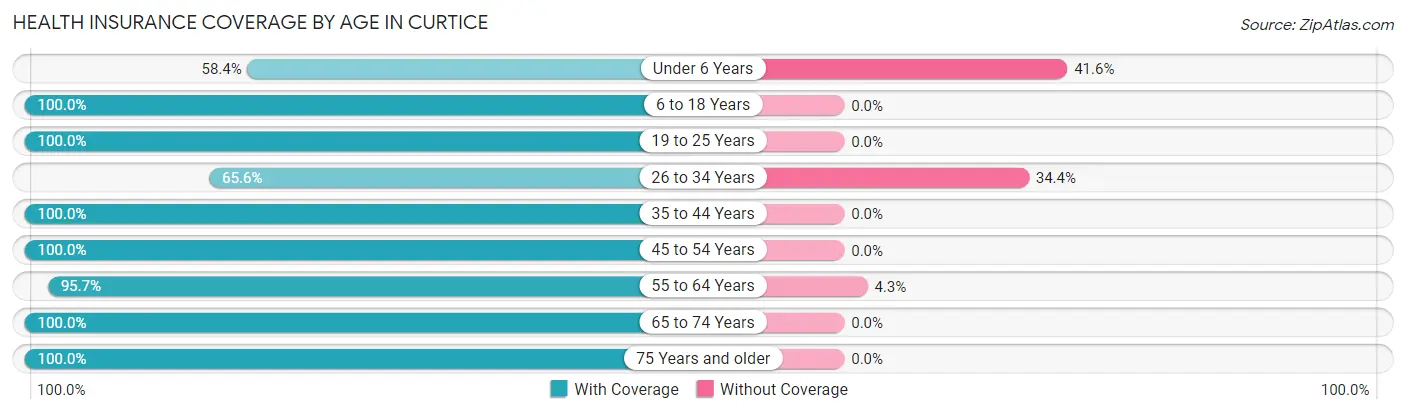
| Age Bracket | With Coverage | Without Coverage |
| Under 6 Years | 52 (58.4%) | 37 (41.6%) |
| 6 to 18 Years | 159 (100.0%) | 0 (0.0%) |
| 19 to 25 Years | 229 (100.0%) | 0 (0.0%) |
| 26 to 34 Years | 82 (65.6%) | 43 (34.4%) |
| 35 to 44 Years | 127 (100.0%) | 0 (0.0%) |
| 45 to 54 Years | 229 (100.0%) | 0 (0.0%) |
| 55 to 64 Years | 310 (95.7%) | 14 (4.3%) |
| 65 to 74 Years | 53 (100.0%) | 0 (0.0%) |
| 75 Years and older | 166 (100.0%) | 0 (0.0%) |
| Total | 1,407 (93.7%) | 94 (6.3%) |
Health Insurance Coverage by Citizenship Status in Curtice
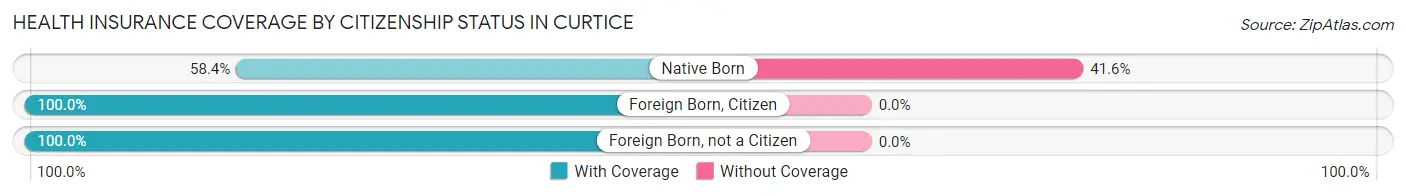
| Citizenship Status | With Coverage | Without Coverage |
| Native Born | 52 (58.4%) | 37 (41.6%) |
| Foreign Born, Citizen | 159 (100.0%) | 0 (0.0%) |
| Foreign Born, not a Citizen | 229 (100.0%) | 0 (0.0%) |
Health Insurance Coverage by Household Income in Curtice
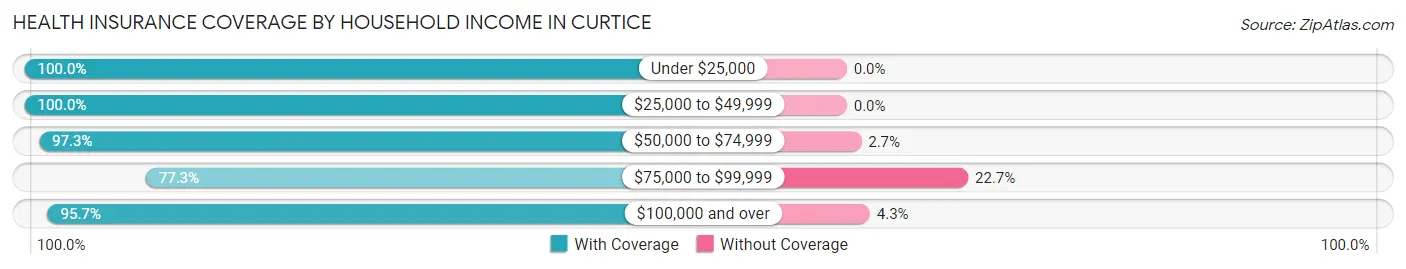
| Household Income | With Coverage | Without Coverage |
| Under $25,000 | 8 (100.0%) | 0 (0.0%) |
| $25,000 to $49,999 | 130 (100.0%) | 0 (0.0%) |
| $50,000 to $74,999 | 323 (97.3%) | 9 (2.7%) |
| $75,000 to $99,999 | 170 (77.3%) | 50 (22.7%) |
| $100,000 and over | 776 (95.7%) | 35 (4.3%) |
Public vs Private Health Insurance Coverage by Age in Curtice
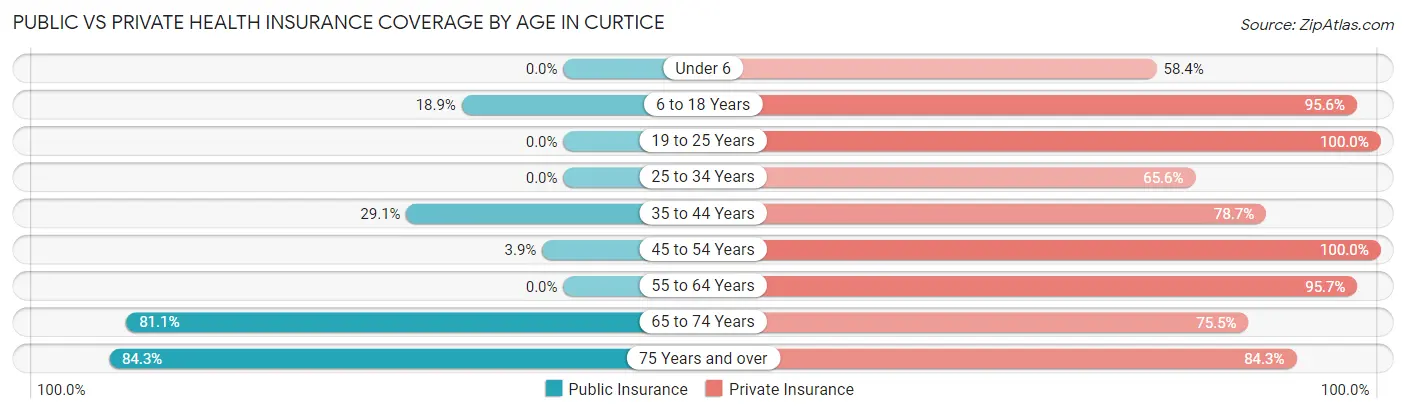
| Age Bracket | Public Insurance | Private Insurance |
| Under 6 | 0 (0.0%) | 52 (58.4%) |
| 6 to 18 Years | 30 (18.9%) | 152 (95.6%) |
| 19 to 25 Years | 0 (0.0%) | 229 (100.0%) |
| 25 to 34 Years | 0 (0.0%) | 82 (65.6%) |
| 35 to 44 Years | 37 (29.1%) | 100 (78.7%) |
| 45 to 54 Years | 9 (3.9%) | 229 (100.0%) |
| 55 to 64 Years | 0 (0.0%) | 310 (95.7%) |
| 65 to 74 Years | 43 (81.1%) | 40 (75.5%) |
| 75 Years and over | 140 (84.3%) | 140 (84.3%) |
| Total | 259 (17.3%) | 1,334 (88.9%) |
Disability Status by Sex by Age in Curtice
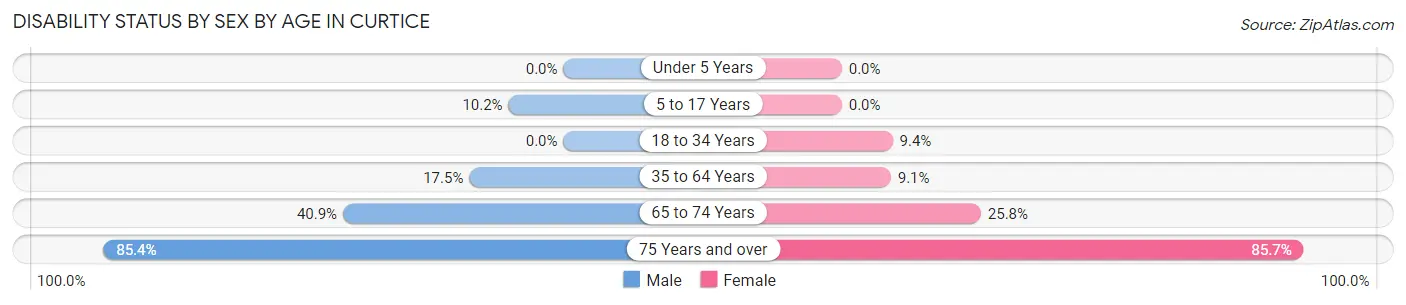
| Age Bracket | Male | Female |
| Under 5 Years | 0 (0.0%) | 0 (0.0%) |
| 5 to 17 Years | 11 (10.2%) | 0 (0.0%) |
| 18 to 34 Years | 0 (0.0%) | 15 (9.4%) |
| 35 to 64 Years | 65 (17.5%) | 28 (9.1%) |
| 65 to 74 Years | 9 (40.9%) | 8 (25.8%) |
| 75 Years and over | 76 (85.4%) | 66 (85.7%) |
Disability Class by Sex by Age in Curtice
Disability Class: Hearing Difficulty
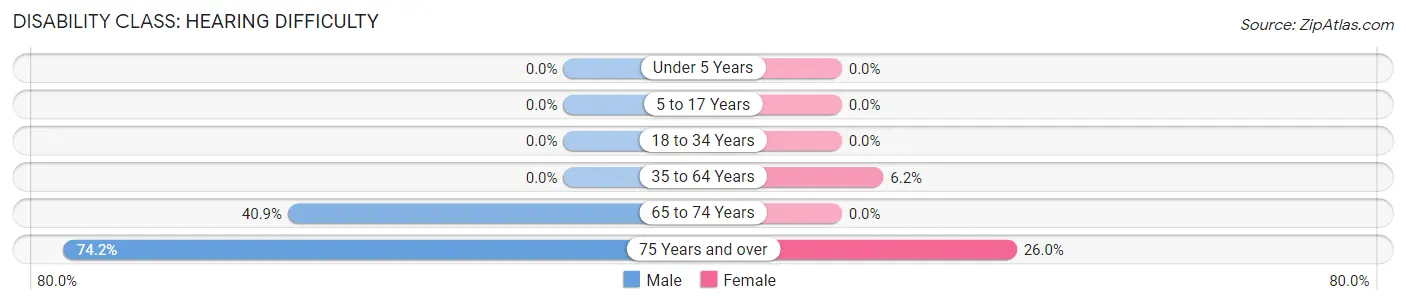
| Age Bracket | Male | Female |
| Under 5 Years | 0 (0.0%) | 0 (0.0%) |
| 5 to 17 Years | 0 (0.0%) | 0 (0.0%) |
| 18 to 34 Years | 0 (0.0%) | 0 (0.0%) |
| 35 to 64 Years | 0 (0.0%) | 19 (6.2%) |
| 65 to 74 Years | 9 (40.9%) | 0 (0.0%) |
| 75 Years and over | 66 (74.2%) | 20 (26.0%) |
Disability Class: Vision Difficulty
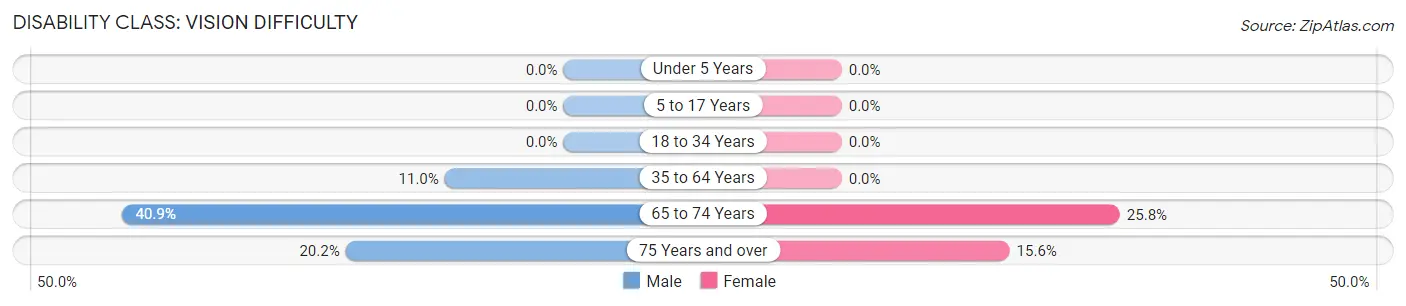
| Age Bracket | Male | Female |
| Under 5 Years | 0 (0.0%) | 0 (0.0%) |
| 5 to 17 Years | 0 (0.0%) | 0 (0.0%) |
| 18 to 34 Years | 0 (0.0%) | 0 (0.0%) |
| 35 to 64 Years | 41 (11.0%) | 0 (0.0%) |
| 65 to 74 Years | 9 (40.9%) | 8 (25.8%) |
| 75 Years and over | 18 (20.2%) | 12 (15.6%) |
Disability Class: Cognitive Difficulty
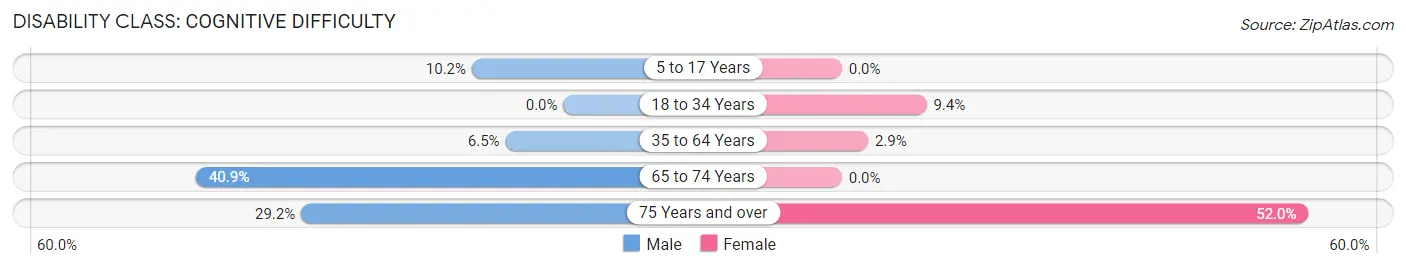
| Age Bracket | Male | Female |
| 5 to 17 Years | 11 (10.2%) | 0 (0.0%) |
| 18 to 34 Years | 0 (0.0%) | 15 (9.4%) |
| 35 to 64 Years | 24 (6.5%) | 9 (2.9%) |
| 65 to 74 Years | 9 (40.9%) | 0 (0.0%) |
| 75 Years and over | 26 (29.2%) | 40 (51.9%) |
Disability Class: Ambulatory Difficulty
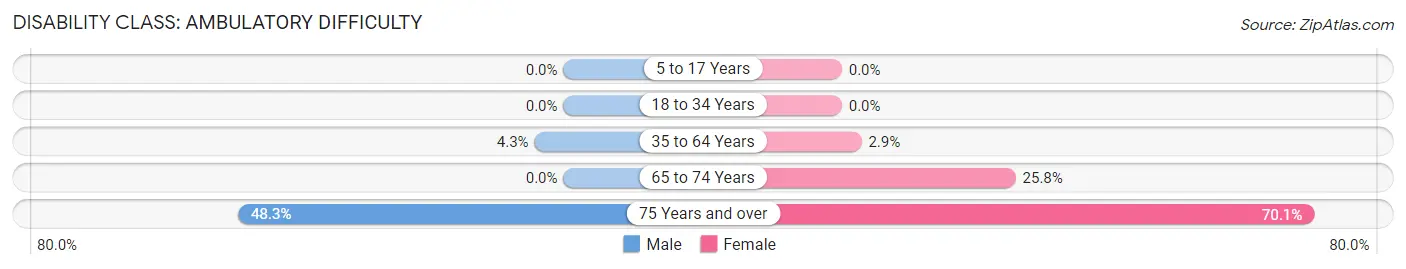
| Age Bracket | Male | Female |
| 5 to 17 Years | 0 (0.0%) | 0 (0.0%) |
| 18 to 34 Years | 0 (0.0%) | 0 (0.0%) |
| 35 to 64 Years | 16 (4.3%) | 9 (2.9%) |
| 65 to 74 Years | 0 (0.0%) | 8 (25.8%) |
| 75 Years and over | 43 (48.3%) | 54 (70.1%) |
Disability Class: Self-Care Difficulty
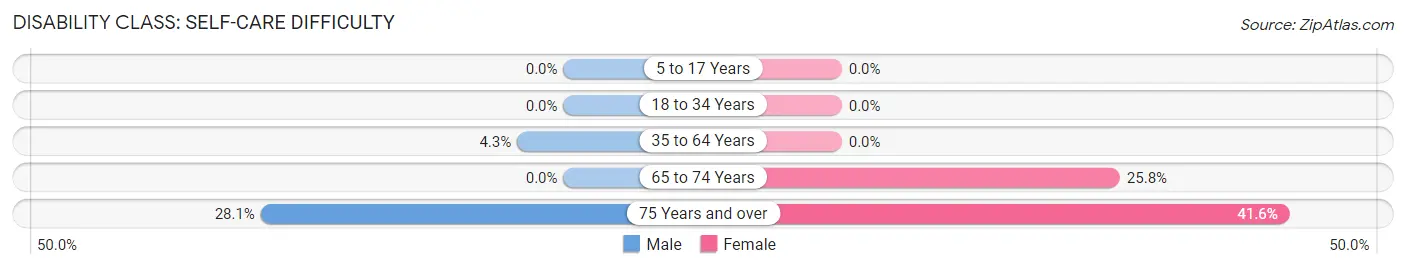
| Age Bracket | Male | Female |
| 5 to 17 Years | 0 (0.0%) | 0 (0.0%) |
| 18 to 34 Years | 0 (0.0%) | 0 (0.0%) |
| 35 to 64 Years | 16 (4.3%) | 0 (0.0%) |
| 65 to 74 Years | 0 (0.0%) | 8 (25.8%) |
| 75 Years and over | 25 (28.1%) | 32 (41.6%) |
Technology Access in Curtice
Computing Device Access in Curtice
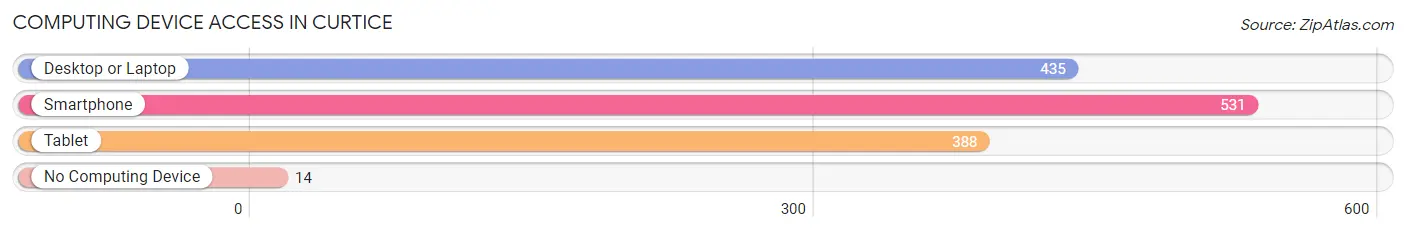
| Device Type | # Households | % Households |
| Desktop or Laptop | 435 | 77.7% |
| Smartphone | 531 | 94.8% |
| Tablet | 388 | 69.3% |
| No Computing Device | 14 | 2.5% |
| Total | 560 | 100.0% |
Internet Access in Curtice
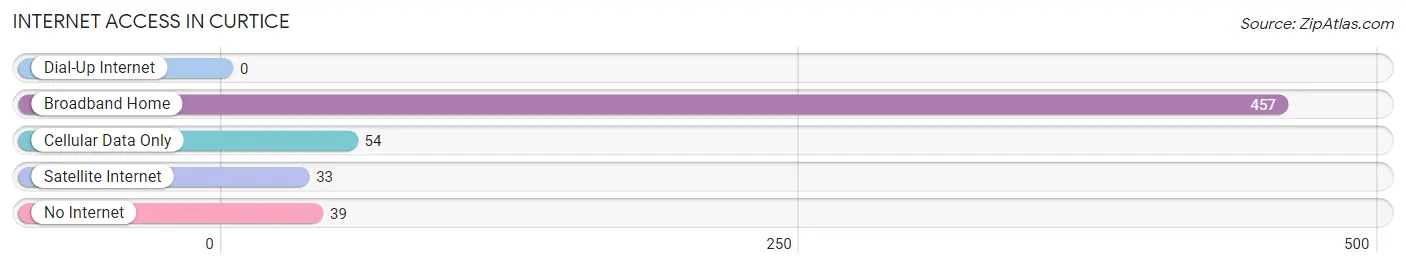
| Internet Type | # Households | % Households |
| Dial-Up Internet | 0 | 0.0% |
| Broadband Home | 457 | 81.6% |
| Cellular Data Only | 54 | 9.6% |
| Satellite Internet | 33 | 5.9% |
| No Internet | 39 | 7.0% |
| Total | 560 | 100.0% |
Curtice Summary
Curtice is a small unincorporated community located in Ottawa County, Ohio. It is situated on the western shore of Lake Erie, approximately 10 miles east of Toledo. The population of Curtice was estimated to be 1,845 in the year 2000.
History
Curtice was founded in 1837 by William Curtice, a farmer from New York. He purchased the land from the government and began to develop the area. The first post office was established in 1845 and the village was officially incorporated in 1854.
The village was originally a farming community, but it soon became a popular summer resort destination. The area was known for its beautiful beaches and scenic views of Lake Erie. In the late 19th century, Curtice became a popular destination for wealthy vacationers from Toledo and other nearby cities.
In the early 20th century, Curtice began to experience a decline in popularity as a resort destination. The Great Depression and World War II caused many of the wealthy vacationers to stay away. The village also experienced a decline in population as many of the residents moved away in search of better economic opportunities.
Geography
Curtice is located in the western part of Ottawa County, Ohio. It is situated on the western shore of Lake Erie, approximately 10 miles east of Toledo. The village is bordered by the cities of Oregon and Genoa to the north, and the townships of Allen and Jerusalem to the south.
The terrain of Curtice is mostly flat, with some rolling hills in the northern part of the village. The soil is mostly sandy and loamy, with some areas of clay. The climate is humid continental, with hot summers and cold winters.
Economy
The economy of Curtice is largely based on agriculture and tourism. The village is home to several farms, which produce a variety of crops including corn, soybeans, wheat, and hay. The area is also known for its wineries, which produce a variety of wines.
Tourism is an important part of the local economy. The village is home to several popular attractions, including the Curtice Beach Park, the Curtice Marina, and the Curtice Historical Museum. The village also hosts several annual festivals and events, such as the Curtice Summer Festival and the Curtice Fall Festival.
Demographics
As of the year 2000, the population of Curtice was estimated to be 1,845. The racial makeup of the village was 97.3% White, 0.7% African American, 0.3% Native American, 0.2% Asian, and 1.5% from other races. The median household income was $41,250, and the median family income was $50,000.
The majority of the population (90.3%) was over the age of 18, and the median age was 38. The village had a higher percentage of females (51.3%) than males (48.7%). The majority of the population (90.3%) was married, and the median household size was 2.5 people.
Conclusion
Curtice is a small unincorporated community located in Ottawa County, Ohio. It is situated on the western shore of Lake Erie, approximately 10 miles east of Toledo. The population of Curtice was estimated to be 1,845 in the year 2000. The economy of Curtice is largely based on agriculture and tourism, and the village is home to several popular attractions. The racial makeup of the village was 97.3% White, 0.7% African American, 0.3% Native American, 0.2% Asian, and 1.5% from other races. The majority of the population (90.3%) was over the age of 18, and the median age was 38. The village had a higher percentage of females (51.3%) than males (48.7%).
Common Questions
What is Per Capita Income in Curtice?
Per Capita income in Curtice is $48,105.
What is the Median Family Income in Curtice?
Median Family Income in Curtice is $118,929.
What is the Median Household income in Curtice?
Median Household Income in Curtice is $96,207.
What is Income or Wage Gap in Curtice?
Income or Wage Gap in Curtice is 56.2%.
Women in Curtice earn 43.8 cents for every dollar earned by a man.
What is Inequality or Gini Index in Curtice?
Inequality or Gini Index in Curtice is 0.36.
What is the Total Population of Curtice?
Total Population of Curtice is 1,501.
What is the Total Male Population of Curtice?
Total Male Population of Curtice is 852.
What is the Total Female Population of Curtice?
Total Female Population of Curtice is 649.
What is the Ratio of Males per 100 Females in Curtice?
There are 131.28 Males per 100 Females in Curtice.
What is the Ratio of Females per 100 Males in Curtice?
There are 76.17 Females per 100 Males in Curtice.
What is the Median Population Age in Curtice?
Median Population Age in Curtice is 45.4 Years.
What is the Average Family Size in Curtice
Average Family Size in Curtice is 3.1 People.
What is the Average Household Size in Curtice
Average Household Size in Curtice is 2.7 People.
How Large is the Labor Force in Curtice?
There are 924 People in the Labor Forcein in Curtice.
What is the Percentage of People in the Labor Force in Curtice?
73.3% of People are in the Labor Force in Curtice.
What is the Unemployment Rate in Curtice?
Unemployment Rate in Curtice is 0.5%.