Hillsborough, NC Map & Demographics
Hillsborough Map
Hillsborough Overview
$50,500
PER CAPITA INCOME
$127,625
AVG FAMILY INCOME
$86,250
AVG HOUSEHOLD INCOME
14.8%
WAGE / INCOME GAP [ % ]
85.2¢/ $1
WAGE / INCOME GAP [ $ ]
0.46
INEQUALITY / GINI INDEX
9,534
TOTAL POPULATION
4,617
MALE POPULATION
4,917
FEMALE POPULATION
93.90
MALES / 100 FEMALES
106.50
FEMALES / 100 MALES
44.1
MEDIAN AGE
2.9
AVG FAMILY SIZE
2.3
AVG HOUSEHOLD SIZE
4,950
LABOR FORCE [ PEOPLE ]
63.7%
PERCENT IN LABOR FORCE
7.2%
UNEMPLOYMENT RATE
Hillsborough Zip Codes
Hillsborough Area Codes
Income in Hillsborough
Income Overview in Hillsborough
Per Capita Income in Hillsborough is $50,500, while median incomes of families and households are $127,625 and $86,250 respectively.
| Characteristic | Number | Measure |
| Per Capita Income | 9,534 | $50,500 |
| Median Family Income | 2,481 | $127,625 |
| Mean Family Income | 2,481 | $147,638 |
| Median Household Income | 3,988 | $86,250 |
| Mean Household Income | 3,988 | $119,656 |
| Income Deficit | 2,481 | $0 |
| Wage / Income Gap (%) | 9,534 | 14.84% |
| Wage / Income Gap ($) | 9,534 | 85.16¢ per $1 |
| Gini / Inequality Index | 9,534 | 0.46 |
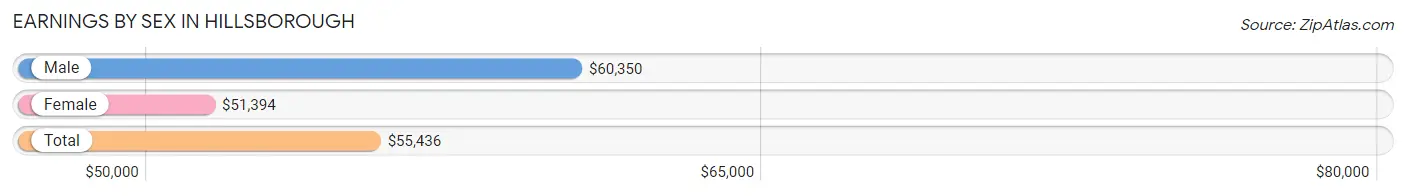
Earnings by Sex in Hillsborough
Average Earnings in Hillsborough are $55,436, $60,350 for men and $51,394 for women, a difference of 14.8%.
| Sex | Number | Average Earnings |
| Male | 2,576 (50.4%) | $60,350 |
| Female | 2,539 (49.6%) | $51,394 |
| Total | 5,115 (100.0%) | $55,436 |
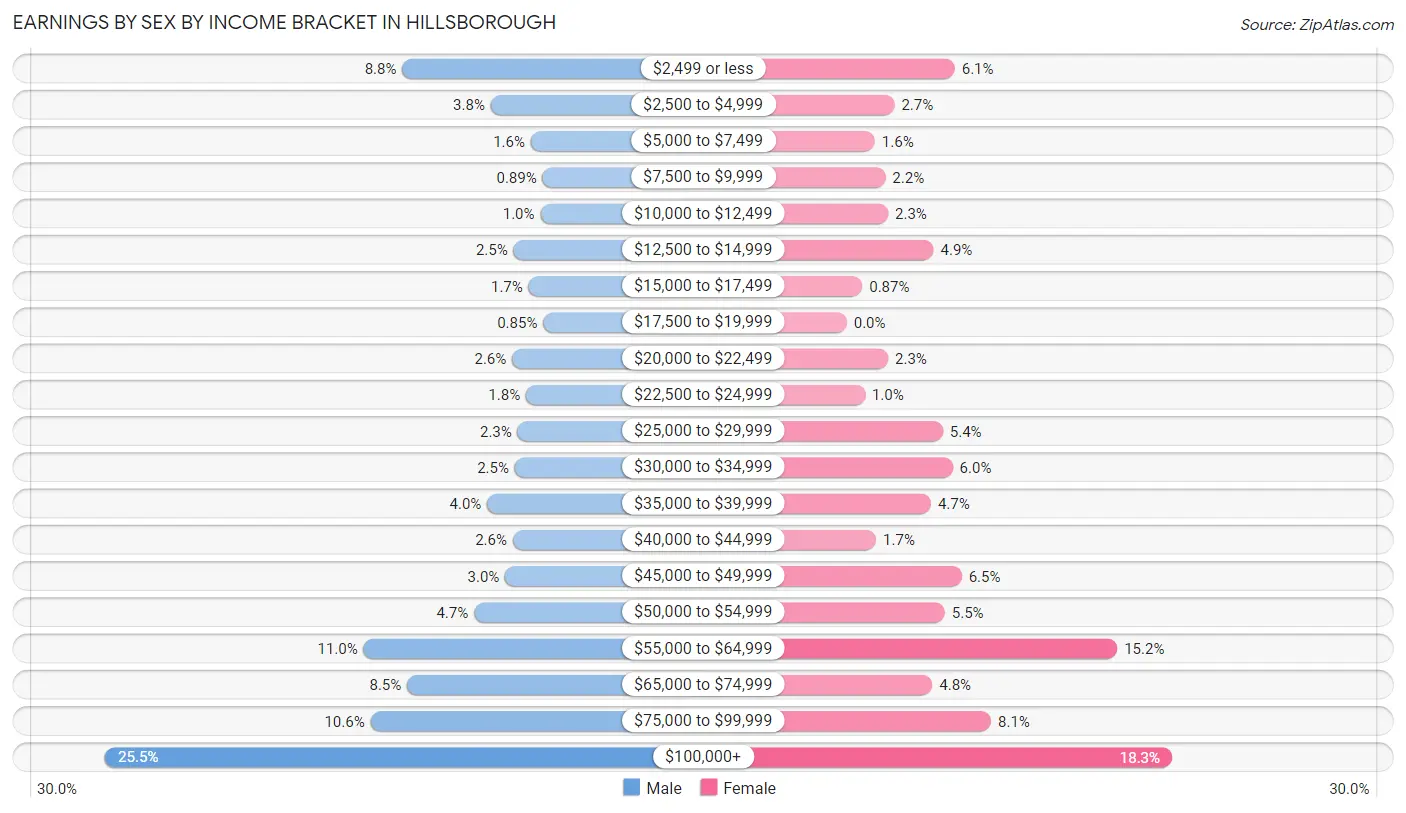
Earnings by Sex by Income Bracket in Hillsborough
The most common earnings brackets in Hillsborough are $100,000+ for men (656 | 25.5%) and $100,000+ for women (464 | 18.3%).
| Income | Male | Female |
| $2,499 or less | 226 (8.8%) | 154 (6.1%) |
| $2,500 to $4,999 | 98 (3.8%) | 68 (2.7%) |
| $5,000 to $7,499 | 40 (1.5%) | 40 (1.6%) |
| $7,500 to $9,999 | 23 (0.9%) | 55 (2.2%) |
| $10,000 to $12,499 | 26 (1.0%) | 59 (2.3%) |
| $12,500 to $14,999 | 65 (2.5%) | 124 (4.9%) |
| $15,000 to $17,499 | 43 (1.7%) | 22 (0.9%) |
| $17,500 to $19,999 | 22 (0.9%) | 0 (0.0%) |
| $20,000 to $22,499 | 67 (2.6%) | 59 (2.3%) |
| $22,500 to $24,999 | 47 (1.8%) | 26 (1.0%) |
| $25,000 to $29,999 | 59 (2.3%) | 137 (5.4%) |
| $30,000 to $34,999 | 63 (2.5%) | 151 (5.9%) |
| $35,000 to $39,999 | 103 (4.0%) | 120 (4.7%) |
| $40,000 to $44,999 | 66 (2.6%) | 42 (1.7%) |
| $45,000 to $49,999 | 77 (3.0%) | 164 (6.5%) |
| $50,000 to $54,999 | 122 (4.7%) | 140 (5.5%) |
| $55,000 to $64,999 | 282 (11.0%) | 386 (15.2%) |
| $65,000 to $74,999 | 219 (8.5%) | 122 (4.8%) |
| $75,000 to $99,999 | 272 (10.6%) | 206 (8.1%) |
| $100,000+ | 656 (25.5%) | 464 (18.3%) |
| Total | 2,576 (100.0%) | 2,539 (100.0%) |
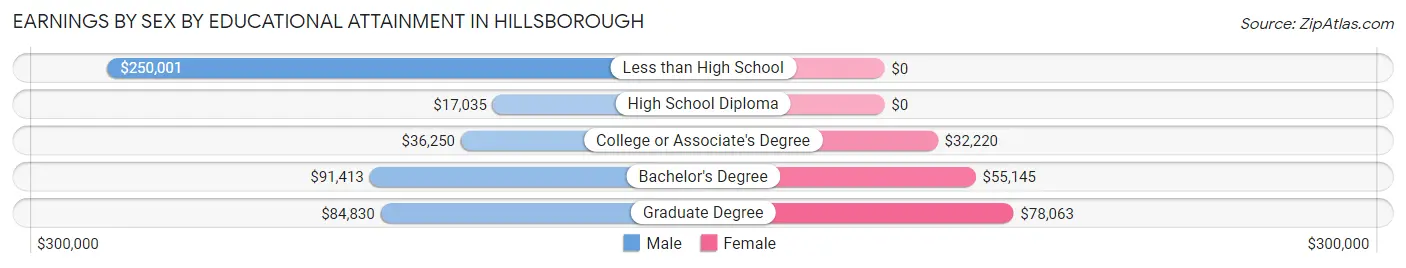
Earnings by Sex by Educational Attainment in Hillsborough
Average earnings in Hillsborough are $64,523 for men and $55,238 for women, a difference of 14.4%. Men with an educational attainment of less than high school enjoy the highest average annual earnings of $250,001, while those with high school diploma education earn the least with $17,035. Women with an educational attainment of graduate degree earn the most with the average annual earnings of $78,063, while those with college or associate's degree education have the smallest earnings of $32,220.
| Educational Attainment | Male Income | Female Income |
| Less than High School | $250,001 | $0 |
| High School Diploma | $17,035 | $0 |
| College or Associate's Degree | $36,250 | $32,220 |
| Bachelor's Degree | $91,413 | $55,145 |
| Graduate Degree | $84,830 | $78,063 |
| Total | $64,523 | $55,238 |
Family Income in Hillsborough
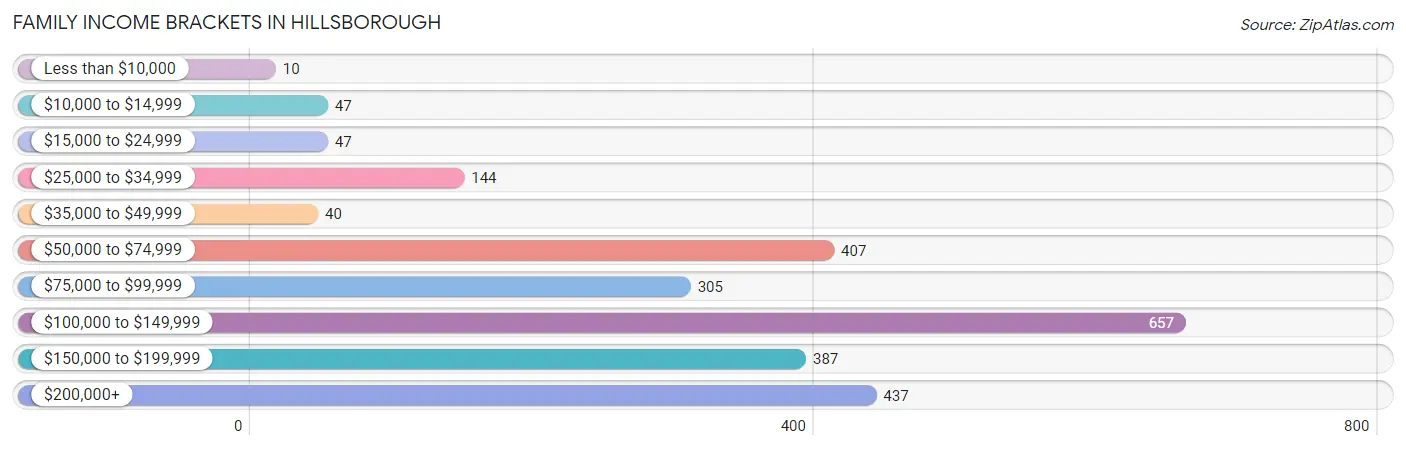
Family Income Brackets in Hillsborough
According to the Hillsborough family income data, there are 657 families falling into the $100,000 to $149,999 income range, which is the most common income bracket and makes up 26.5% of all families. Conversely, the less than $10,000 income bracket is the least frequent group with only 10 families (0.4%) belonging to this category.
| Income Bracket | # Families | % Families |
| Less than $10,000 | 10 | 0.4% |
| $10,000 to $14,999 | 47 | 1.9% |
| $15,000 to $24,999 | 47 | 1.9% |
| $25,000 to $34,999 | 144 | 5.8% |
| $35,000 to $49,999 | 40 | 1.6% |
| $50,000 to $74,999 | 407 | 16.4% |
| $75,000 to $99,999 | 305 | 12.3% |
| $100,000 to $149,999 | 657 | 26.5% |
| $150,000 to $199,999 | 387 | 15.6% |
| $200,000+ | 437 | 17.6% |
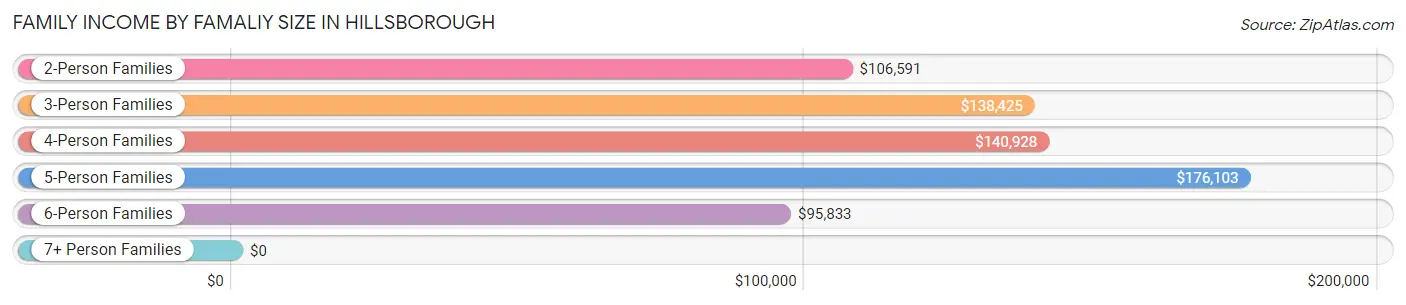
Family Income by Famaliy Size in Hillsborough
5-person families (59 | 2.4%) account for the highest median family income in Hillsborough with $176,103 per family, while 2-person families (1,228 | 49.5%) have the highest median income of $53,296 per family member.
| Income Bracket | # Families | Median Income |
| 2-Person Families | 1,228 (49.5%) | $106,591 |
| 3-Person Families | 493 (19.9%) | $138,425 |
| 4-Person Families | 639 (25.8%) | $140,928 |
| 5-Person Families | 59 (2.4%) | $176,103 |
| 6-Person Families | 44 (1.8%) | $95,833 |
| 7+ Person Families | 18 (0.7%) | $0 |
| Total | 2,481 (100.0%) | $127,625 |
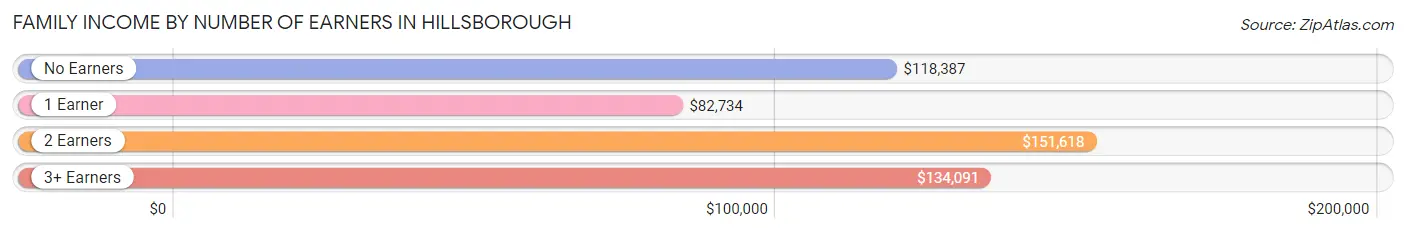
Family Income by Number of Earners in Hillsborough
The median family income in Hillsborough is $127,625, with families comprising 2 earners (924) having the highest median family income of $151,618, while families with 1 earner (1,015) have the lowest median family income of $82,734, accounting for 37.2% and 40.9% of families, respectively.
| Number of Earners | # Families | Median Income |
| No Earners | 216 (8.7%) | $118,387 |
| 1 Earner | 1,015 (40.9%) | $82,734 |
| 2 Earners | 924 (37.2%) | $151,618 |
| 3+ Earners | 326 (13.1%) | $134,091 |
| Total | 2,481 (100.0%) | $127,625 |
Household Income in Hillsborough
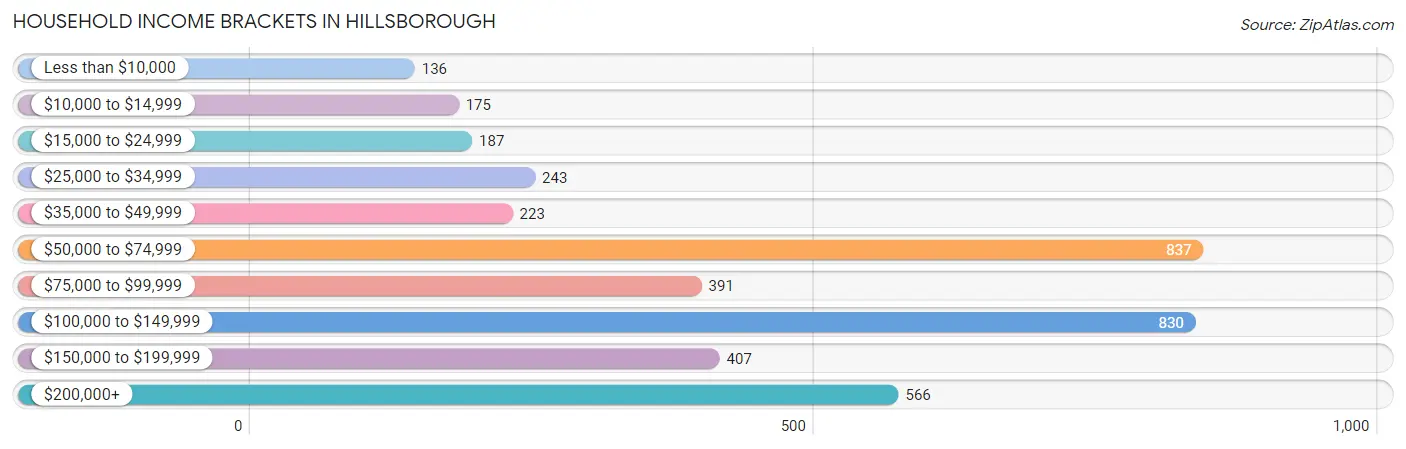
Household Income Brackets in Hillsborough
With 837 households falling in the category, the $50,000 to $74,999 income range is the most frequent in Hillsborough, accounting for 21.0% of all households. In contrast, only 136 households (3.4%) fall into the less than $10,000 income bracket, making it the least populous group.
| Income Bracket | # Households | % Households |
| Less than $10,000 | 136 | 3.4% |
| $10,000 to $14,999 | 175 | 4.4% |
| $15,000 to $24,999 | 187 | 4.7% |
| $25,000 to $34,999 | 243 | 6.1% |
| $35,000 to $49,999 | 223 | 5.6% |
| $50,000 to $74,999 | 837 | 21.0% |
| $75,000 to $99,999 | 391 | 9.8% |
| $100,000 to $149,999 | 830 | 20.8% |
| $150,000 to $199,999 | 407 | 10.2% |
| $200,000+ | 566 | 14.2% |
Household Income by Householder Age in Hillsborough
The median household income in Hillsborough is $86,250, with the highest median household income of $128,167 found in the 45 to 64 years age bracket for the primary householder. A total of 1,620 households (40.6%) fall into this category. Meanwhile, the 15 to 24 years age bracket for the primary householder has the lowest median household income of $0, with 27 households (0.7%) in this group.
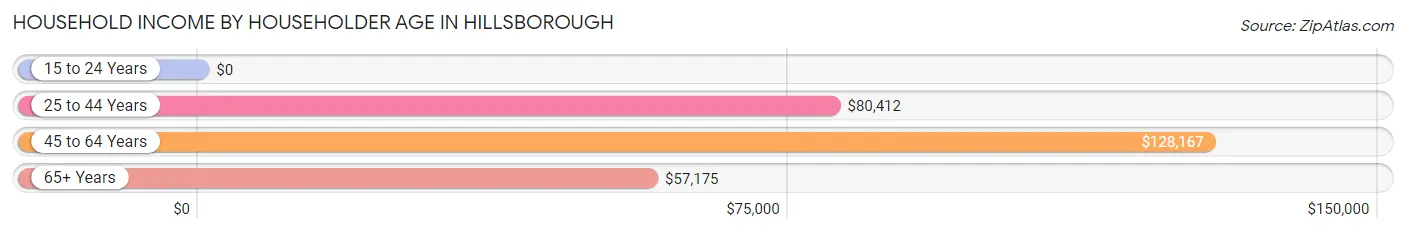
| Income Bracket | # Households | Median Income |
| 15 to 24 Years | 27 (0.7%) | $0 |
| 25 to 44 Years | 1,369 (34.3%) | $80,412 |
| 45 to 64 Years | 1,620 (40.6%) | $128,167 |
| 65+ Years | 972 (24.4%) | $57,175 |
| Total | 3,988 (100.0%) | $86,250 |
Poverty in Hillsborough
Income Below Poverty by Sex and Age in Hillsborough
With 9.3% poverty level for males and 6.7% for females among the residents of Hillsborough, 15 year old males and 35 to 44 year old females are the most vulnerable to poverty, with 24 males (31.6%) and 139 females (14.3%) in their respective age groups living below the poverty level.
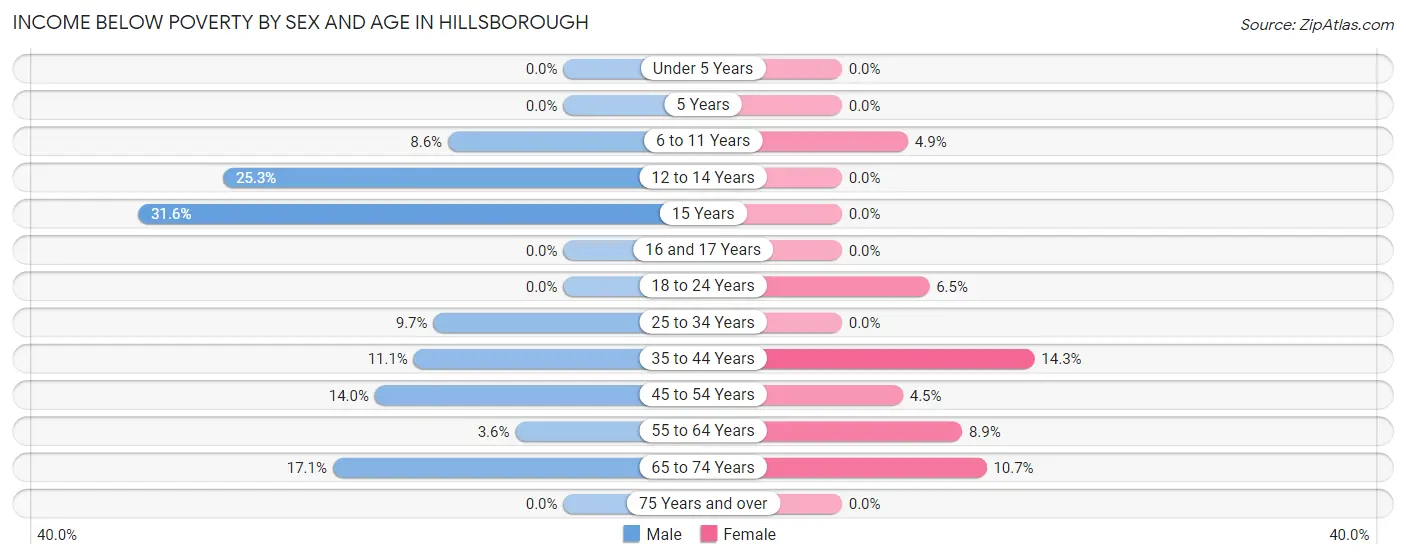
| Age Bracket | Male | Female |
| Under 5 Years | 0 (0.0%) | 0 (0.0%) |
| 5 Years | 0 (0.0%) | 0 (0.0%) |
| 6 to 11 Years | 24 (8.6%) | 20 (4.9%) |
| 12 to 14 Years | 23 (25.3%) | 0 (0.0%) |
| 15 Years | 24 (31.6%) | 0 (0.0%) |
| 16 and 17 Years | 0 (0.0%) | 0 (0.0%) |
| 18 to 24 Years | 0 (0.0%) | 10 (6.5%) |
| 25 to 34 Years | 44 (9.7%) | 0 (0.0%) |
| 35 to 44 Years | 58 (11.1%) | 139 (14.3%) |
| 45 to 54 Years | 111 (14.0%) | 25 (4.5%) |
| 55 to 64 Years | 27 (3.6%) | 75 (8.9%) |
| 65 to 74 Years | 81 (17.1%) | 55 (10.7%) |
| 75 Years and over | 0 (0.0%) | 0 (0.0%) |
| Total | 392 (9.3%) | 324 (6.7%) |
Income Above Poverty by Sex and Age in Hillsborough
According to the poverty statistics in Hillsborough, males aged under 5 years and females aged under 5 years are the age groups that are most secure financially, with 100.0% of males and 100.0% of females in these age groups living above the poverty line.
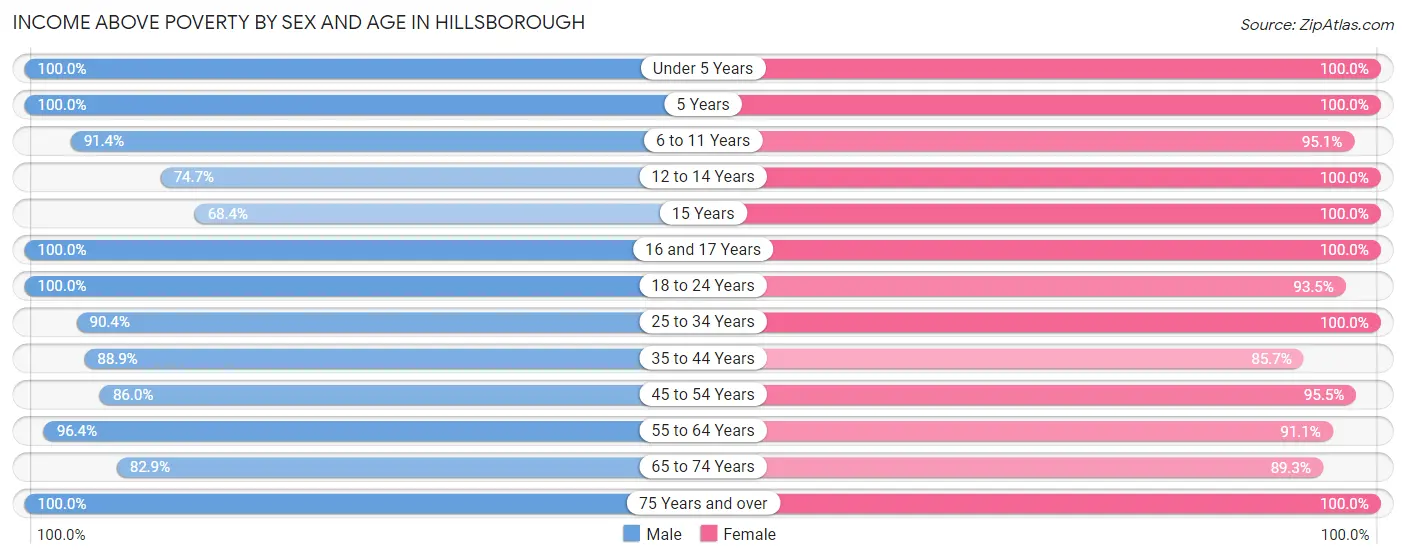
| Age Bracket | Male | Female |
| Under 5 Years | 345 (100.0%) | 231 (100.0%) |
| 5 Years | 54 (100.0%) | 53 (100.0%) |
| 6 to 11 Years | 256 (91.4%) | 387 (95.1%) |
| 12 to 14 Years | 68 (74.7%) | 85 (100.0%) |
| 15 Years | 52 (68.4%) | 50 (100.0%) |
| 16 and 17 Years | 80 (100.0%) | 159 (100.0%) |
| 18 to 24 Years | 189 (100.0%) | 144 (93.5%) |
| 25 to 34 Years | 412 (90.3%) | 465 (100.0%) |
| 35 to 44 Years | 464 (88.9%) | 833 (85.7%) |
| 45 to 54 Years | 682 (86.0%) | 527 (95.5%) |
| 55 to 64 Years | 729 (96.4%) | 766 (91.1%) |
| 65 to 74 Years | 392 (82.9%) | 457 (89.3%) |
| 75 Years and over | 90 (100.0%) | 350 (100.0%) |
| Total | 3,813 (90.7%) | 4,507 (93.3%) |
Income Below Poverty Among Married-Couple Families in Hillsborough
The poverty statistics for married-couple families in Hillsborough show that 0.5% or 11 of the total 2,085 families live below the poverty line. Families with no children have the highest poverty rate of 0.9%, comprising of 11 families. On the other hand, families with 1 or 2 children have the lowest poverty rate of 0.0%, which includes 0 families.
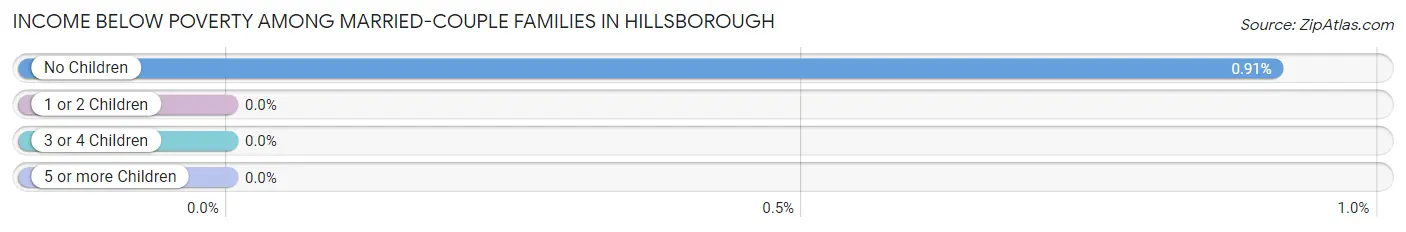
| Children | Above Poverty | Below Poverty |
| No Children | 1,192 (99.1%) | 11 (0.9%) |
| 1 or 2 Children | 782 (100.0%) | 0 (0.0%) |
| 3 or 4 Children | 82 (100.0%) | 0 (0.0%) |
| 5 or more Children | 18 (100.0%) | 0 (0.0%) |
| Total | 2,074 (99.5%) | 11 (0.5%) |
Income Below Poverty Among Single-Parent Households in Hillsborough
According to the poverty data in Hillsborough, 20.8% or 20 single-father households and 15.3% or 46 single-mother households are living below the poverty line. Among single-father households, those with 1 or 2 children have the highest poverty rate, with 20 households (30.3%) experiencing poverty. Likewise, among single-mother households, those with no children have the highest poverty rate, with 23 households (23.5%) falling below the poverty line.
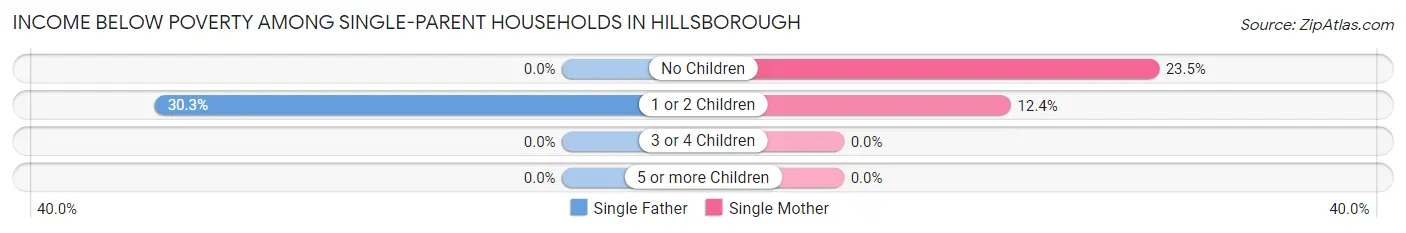
| Children | Single Father | Single Mother |
| No Children | 0 (0.0%) | 23 (23.5%) |
| 1 or 2 Children | 20 (30.3%) | 23 (12.4%) |
| 3 or 4 Children | 0 (0.0%) | 0 (0.0%) |
| 5 or more Children | 0 (0.0%) | 0 (0.0%) |
| Total | 20 (20.8%) | 46 (15.3%) |
Income Below Poverty Among Married-Couple vs Single-Parent Households in Hillsborough
The poverty data for Hillsborough shows that 11 of the married-couple family households (0.5%) and 66 of the single-parent households (16.7%) are living below the poverty level. Within the married-couple family households, those with no children have the highest poverty rate, with 11 households (0.9%) falling below the poverty line. Among the single-parent households, those with no children have the highest poverty rate, with 23 household (18.0%) living below poverty.
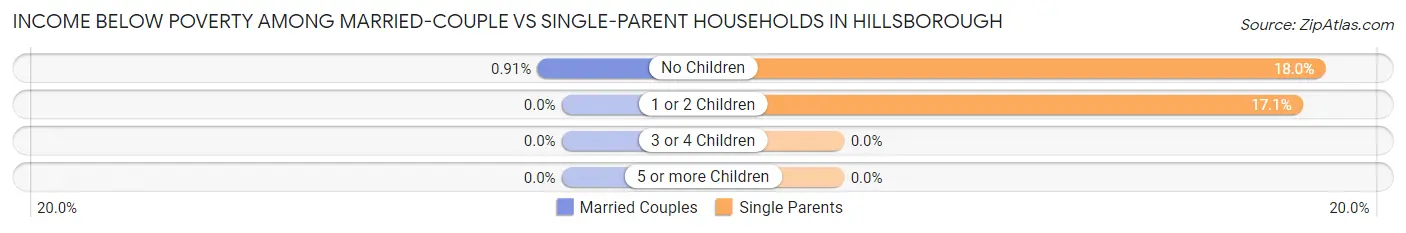
| Children | Married-Couple Families | Single-Parent Households |
| No Children | 11 (0.9%) | 23 (18.0%) |
| 1 or 2 Children | 0 (0.0%) | 43 (17.1%) |
| 3 or 4 Children | 0 (0.0%) | 0 (0.0%) |
| 5 or more Children | 0 (0.0%) | 0 (0.0%) |
| Total | 11 (0.5%) | 66 (16.7%) |
Race in Hillsborough
The most populous races in Hillsborough are White / Caucasian (7,252 | 76.1%), Black / African American (1,208 | 12.7%), and Hispanic or Latino (762 | 8.0%).
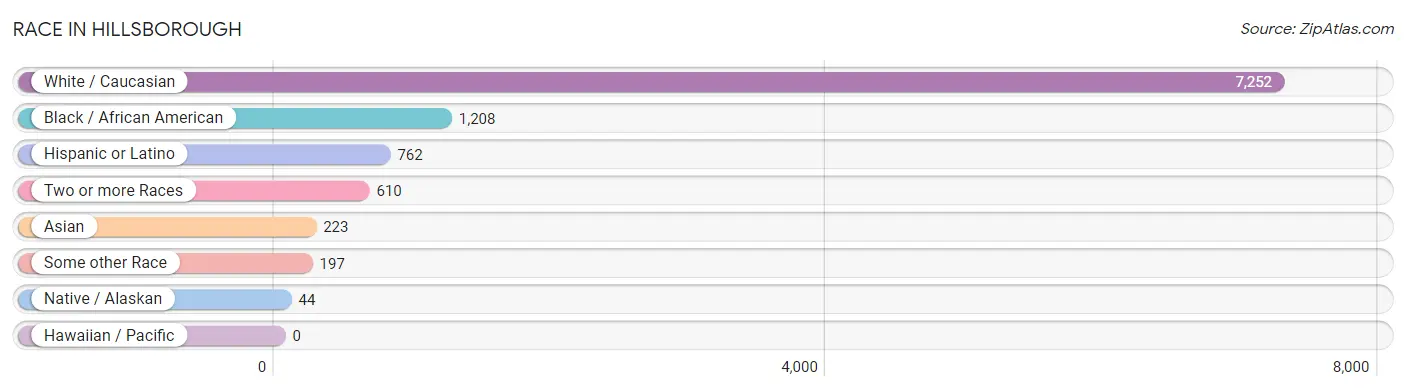
| Race | # Population | % Population |
| Asian | 223 | 2.3% |
| Black / African American | 1,208 | 12.7% |
| Hawaiian / Pacific | 0 | 0.0% |
| Hispanic or Latino | 762 | 8.0% |
| Native / Alaskan | 44 | 0.5% |
| White / Caucasian | 7,252 | 76.1% |
| Two or more Races | 610 | 6.4% |
| Some other Race | 197 | 2.1% |
| Total | 9,534 | 100.0% |
Ancestry in Hillsborough
The most populous ancestries reported in Hillsborough are English (1,662 | 17.4%), Irish (1,192 | 12.5%), German (1,092 | 11.5%), Italian (649 | 6.8%), and Scottish (586 | 6.1%), together accounting for 54.3% of all Hillsborough residents.
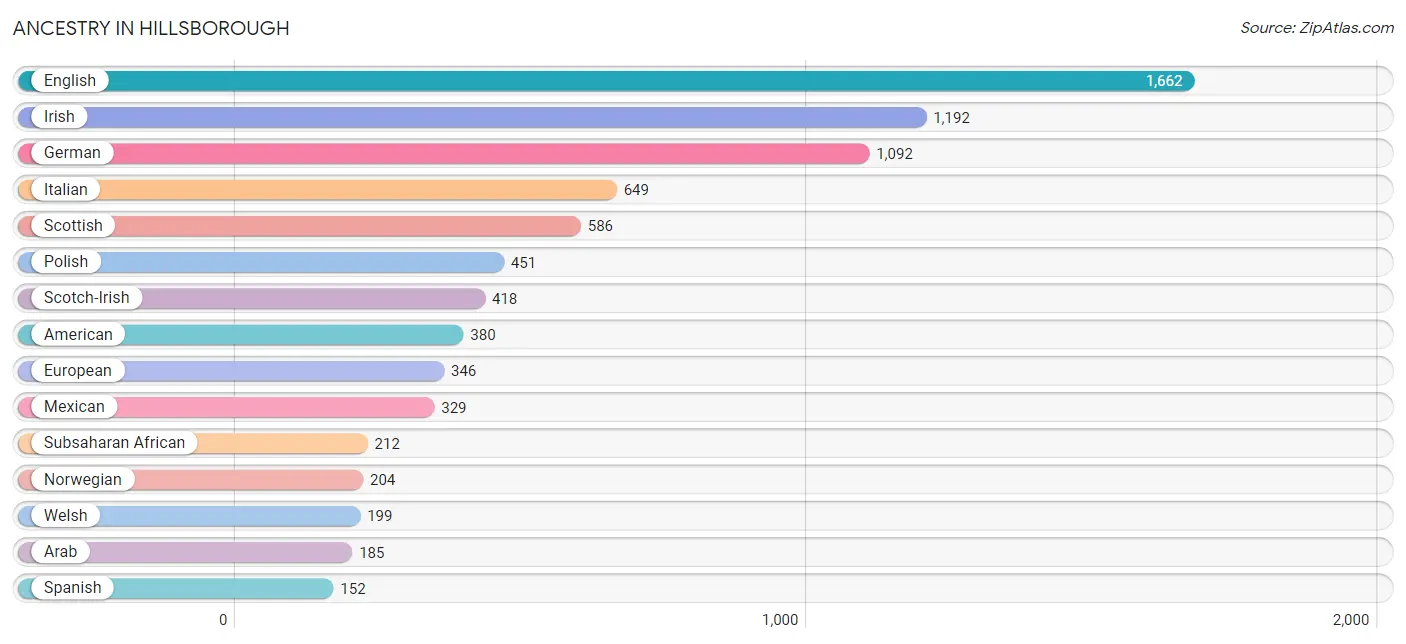
| Ancestry | # Population | % Population |
| African | 58 | 0.6% |
| American | 380 | 4.0% |
| Arab | 185 | 1.9% |
| Argentinean | 9 | 0.1% |
| Bangladeshi | 65 | 0.7% |
| Belgian | 20 | 0.2% |
| Brazilian | 47 | 0.5% |
| British | 84 | 0.9% |
| Burmese | 66 | 0.7% |
| Cajun | 33 | 0.4% |
| Canadian | 2 | 0.0% |
| Central American | 34 | 0.4% |
| Cherokee | 36 | 0.4% |
| Creek | 20 | 0.2% |
| Czechoslovakian | 18 | 0.2% |
| Danish | 56 | 0.6% |
| Dominican | 17 | 0.2% |
| Dutch | 97 | 1.0% |
| Eastern European | 24 | 0.3% |
| English | 1,662 | 17.4% |
| European | 346 | 3.6% |
| French | 116 | 1.2% |
| French Canadian | 15 | 0.2% |
| German | 1,092 | 11.5% |
| Ghanaian | 99 | 1.0% |
| Greek | 32 | 0.3% |
| Guatemalan | 34 | 0.4% |
| Hungarian | 74 | 0.8% |
| Indian (Asian) | 121 | 1.3% |
| Irish | 1,192 | 12.5% |
| Italian | 649 | 6.8% |
| Korean | 114 | 1.2% |
| Lebanese | 139 | 1.5% |
| Lithuanian | 15 | 0.2% |
| Mexican | 329 | 3.5% |
| Mexican American Indian | 16 | 0.2% |
| Northern European | 78 | 0.8% |
| Norwegian | 204 | 2.1% |
| Polish | 451 | 4.7% |
| Portuguese | 60 | 0.6% |
| Potawatomi | 19 | 0.2% |
| Puerto Rican | 111 | 1.2% |
| Russian | 78 | 0.8% |
| Scotch-Irish | 418 | 4.4% |
| Scottish | 586 | 6.1% |
| Slovak | 45 | 0.5% |
| South African | 55 | 0.6% |
| South American | 9 | 0.1% |
| Spaniard | 110 | 1.1% |
| Spanish | 152 | 1.6% |
| Subsaharan African | 212 | 2.2% |
| Swedish | 50 | 0.5% |
| Swiss | 78 | 0.8% |
| Ukrainian | 10 | 0.1% |
| Welsh | 199 | 2.1% | View All 55 Rows |
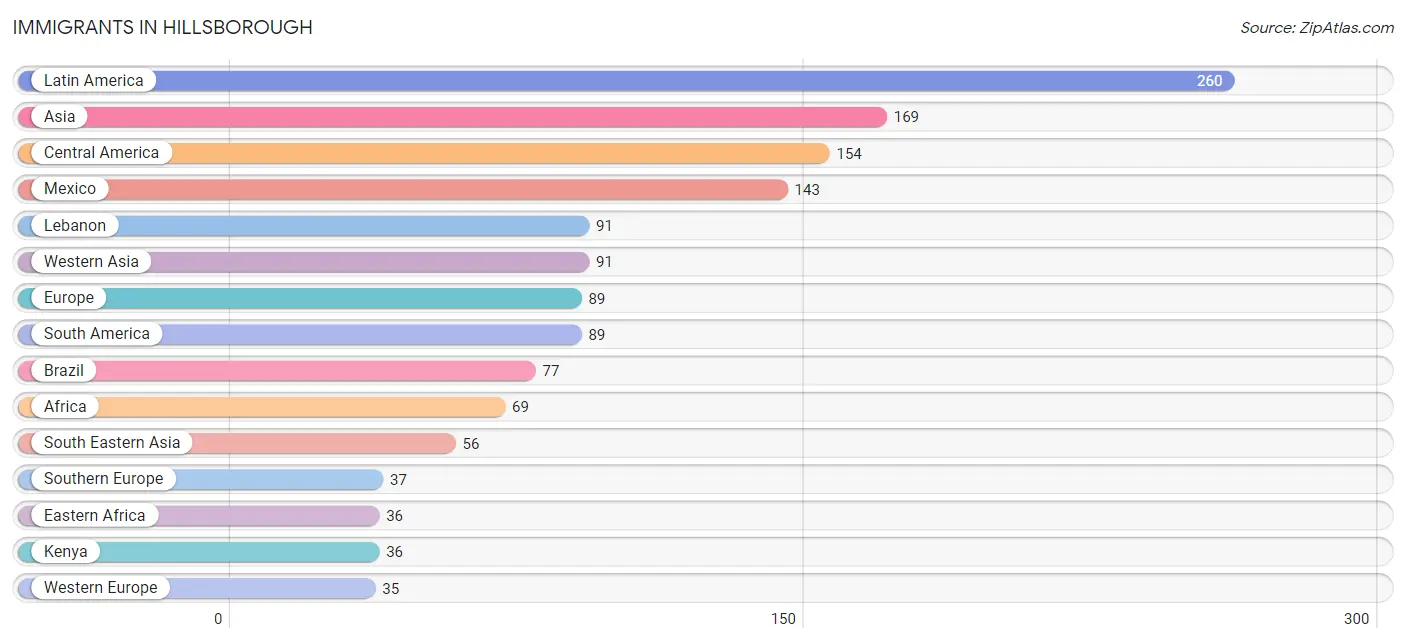
Immigrants in Hillsborough
The most numerous immigrant groups reported in Hillsborough came from Latin America (260 | 2.7%), Asia (169 | 1.8%), Central America (154 | 1.6%), Mexico (143 | 1.5%), and Lebanon (91 | 0.9%), together accounting for 8.6% of all Hillsborough residents.
| Immigration Origin | # Population | % Population |
| Africa | 69 | 0.7% |
| Asia | 169 | 1.8% |
| Belgium | 20 | 0.2% |
| Brazil | 77 | 0.8% |
| Caribbean | 17 | 0.2% |
| Central America | 154 | 1.6% |
| Colombia | 12 | 0.1% |
| Dominican Republic | 17 | 0.2% |
| Eastern Africa | 36 | 0.4% |
| Eastern Asia | 22 | 0.2% |
| Eastern Europe | 17 | 0.2% |
| Europe | 89 | 0.9% |
| Guatemala | 11 | 0.1% |
| Hungary | 17 | 0.2% |
| Kenya | 36 | 0.4% |
| Korea | 22 | 0.2% |
| Latin America | 260 | 2.7% |
| Lebanon | 91 | 0.9% |
| Malaysia | 12 | 0.1% |
| Mexico | 143 | 1.5% |
| Netherlands | 15 | 0.2% |
| Philippines | 24 | 0.3% |
| Portugal | 22 | 0.2% |
| South Africa | 33 | 0.4% |
| South America | 89 | 0.9% |
| South Eastern Asia | 56 | 0.6% |
| Southern Europe | 37 | 0.4% |
| Spain | 15 | 0.2% |
| Thailand | 20 | 0.2% |
| Western Asia | 91 | 0.9% |
| Western Europe | 35 | 0.4% | View All 31 Rows |
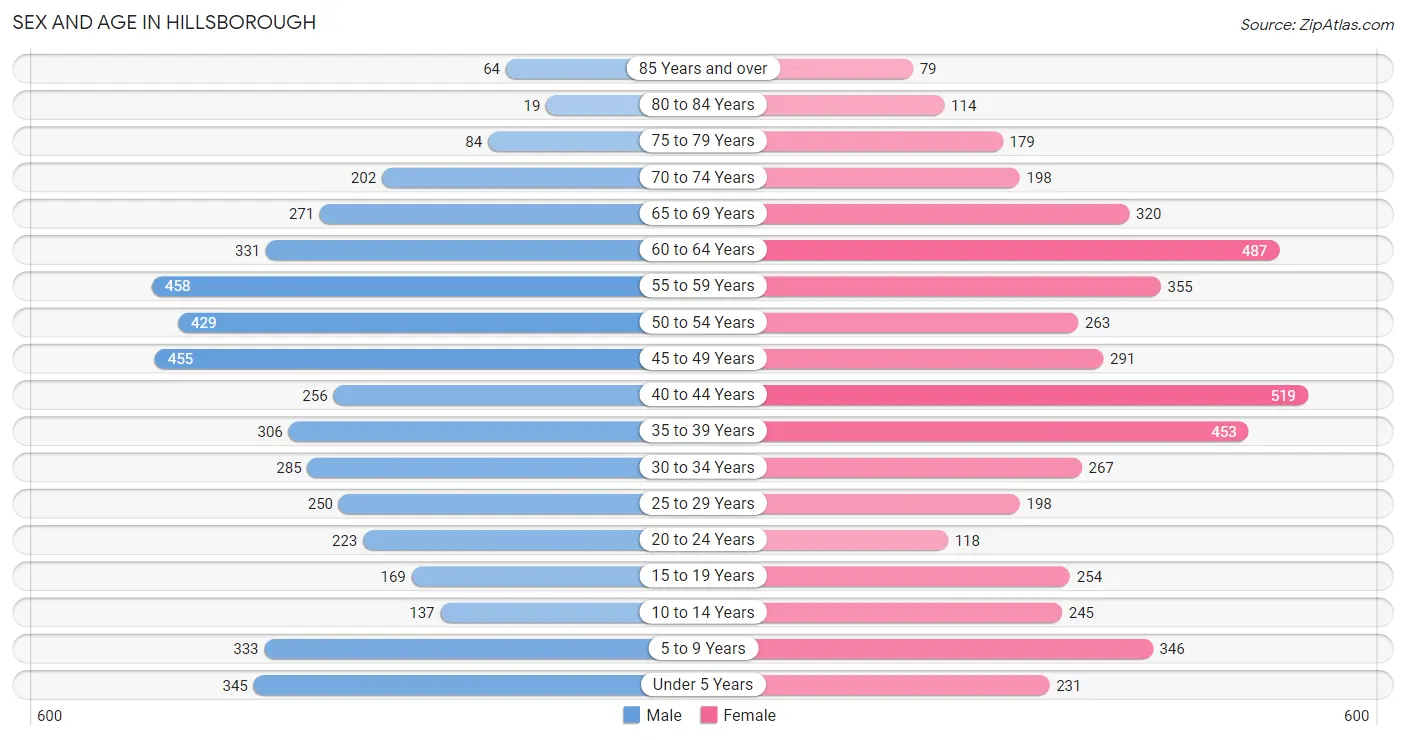
Sex and Age in Hillsborough
Sex and Age in Hillsborough
The most populous age groups in Hillsborough are 55 to 59 Years (458 | 9.9%) for men and 40 to 44 Years (519 | 10.6%) for women.
| Age Bracket | Male | Female |
| Under 5 Years | 345 (7.5%) | 231 (4.7%) |
| 5 to 9 Years | 333 (7.2%) | 346 (7.0%) |
| 10 to 14 Years | 137 (3.0%) | 245 (5.0%) |
| 15 to 19 Years | 169 (3.7%) | 254 (5.2%) |
| 20 to 24 Years | 223 (4.8%) | 118 (2.4%) |
| 25 to 29 Years | 250 (5.4%) | 198 (4.0%) |
| 30 to 34 Years | 285 (6.2%) | 267 (5.4%) |
| 35 to 39 Years | 306 (6.6%) | 453 (9.2%) |
| 40 to 44 Years | 256 (5.5%) | 519 (10.6%) |
| 45 to 49 Years | 455 (9.9%) | 291 (5.9%) |
| 50 to 54 Years | 429 (9.3%) | 263 (5.3%) |
| 55 to 59 Years | 458 (9.9%) | 355 (7.2%) |
| 60 to 64 Years | 331 (7.2%) | 487 (9.9%) |
| 65 to 69 Years | 271 (5.9%) | 320 (6.5%) |
| 70 to 74 Years | 202 (4.4%) | 198 (4.0%) |
| 75 to 79 Years | 84 (1.8%) | 179 (3.6%) |
| 80 to 84 Years | 19 (0.4%) | 114 (2.3%) |
| 85 Years and over | 64 (1.4%) | 79 (1.6%) |
| Total | 4,617 (100.0%) | 4,917 (100.0%) |
Families and Households in Hillsborough
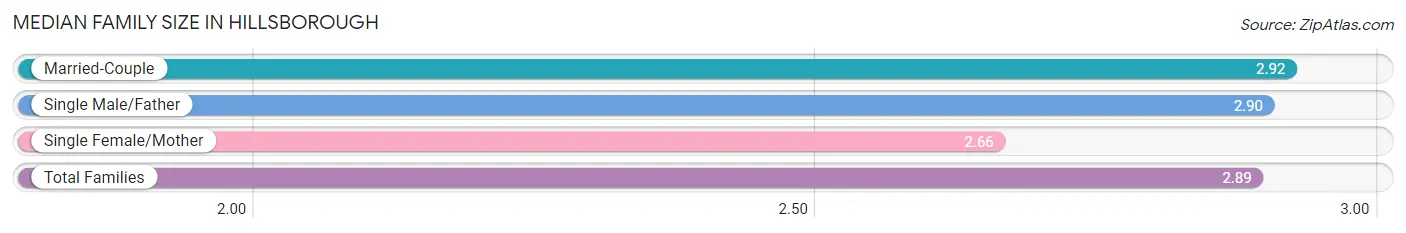
Median Family Size in Hillsborough
The median family size in Hillsborough is 2.89 persons per family, with married-couple families (2,085 | 84.0%) accounting for the largest median family size of 2.92 persons per family. On the other hand, single female/mother families (300 | 12.1%) represent the smallest median family size with 2.66 persons per family.
| Family Type | # Families | Family Size |
| Married-Couple | 2,085 (84.0%) | 2.92 |
| Single Male/Father | 96 (3.9%) | 2.90 |
| Single Female/Mother | 300 (12.1%) | 2.66 |
| Total Families | 2,481 (100.0%) | 2.89 |
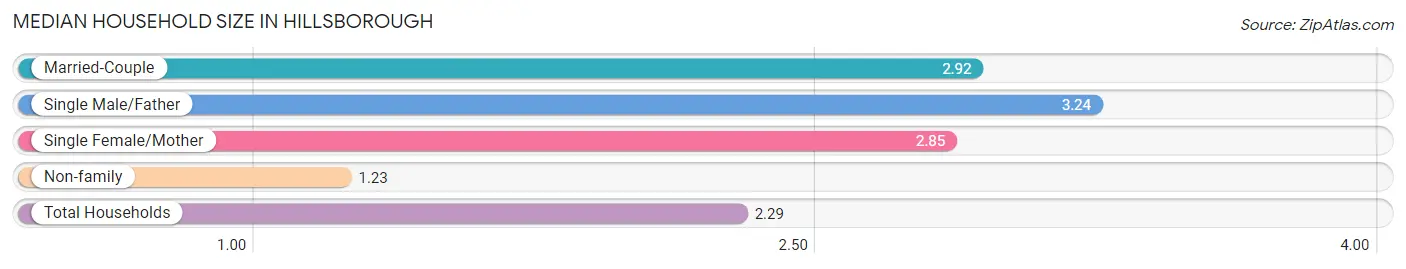
Median Household Size in Hillsborough
The median household size in Hillsborough is 2.29 persons per household, with single male/father households (96 | 2.4%) accounting for the largest median household size of 3.24 persons per household. non-family households (1,507 | 37.8%) represent the smallest median household size with 1.23 persons per household.
| Household Type | # Households | Household Size |
| Married-Couple | 2,085 (52.3%) | 2.92 |
| Single Male/Father | 96 (2.4%) | 3.24 |
| Single Female/Mother | 300 (7.5%) | 2.85 |
| Non-family | 1,507 (37.8%) | 1.23 |
| Total Households | 3,988 (100.0%) | 2.29 |
Household Size by Marriage Status in Hillsborough
Out of a total of 3,988 households in Hillsborough, 2,481 (62.2%) are family households, while 1,507 (37.8%) are nonfamily households. The most numerous type of family households are 2-person households, comprising 1,220, and the most common type of nonfamily households are 1-person households, comprising 1,281.
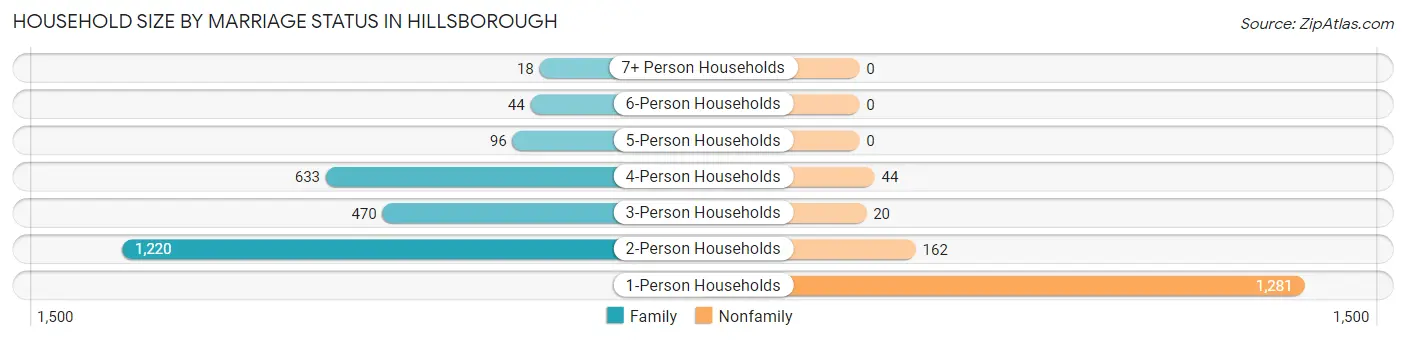
| Household Size | Family Households | Nonfamily Households |
| 1-Person Households | - | 1,281 (32.1%) |
| 2-Person Households | 1,220 (30.6%) | 162 (4.1%) |
| 3-Person Households | 470 (11.8%) | 20 (0.5%) |
| 4-Person Households | 633 (15.9%) | 44 (1.1%) |
| 5-Person Households | 96 (2.4%) | 0 (0.0%) |
| 6-Person Households | 44 (1.1%) | 0 (0.0%) |
| 7+ Person Households | 18 (0.4%) | 0 (0.0%) |
| Total | 2,481 (62.2%) | 1,507 (37.8%) |
Female Fertility in Hillsborough
Fertility by Age in Hillsborough
Average fertility rate in Hillsborough is 61.0 births per 1,000 women. Women in the age bracket of 35 to 50 years have the highest fertility rate with 78.0 births per 1,000 women. Women in the age bracket of 35 to 50 years acount for 78.6% of all women with births.
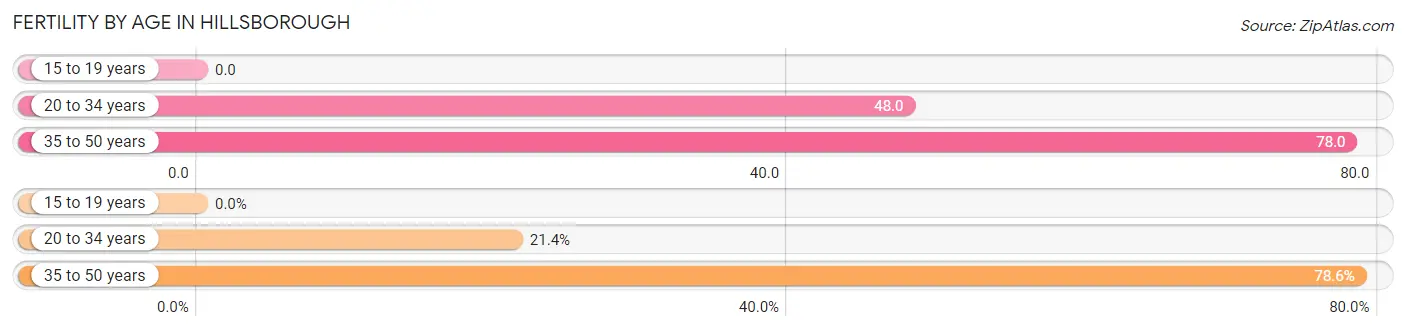
| Age Bracket | Women with Births | Births / 1,000 Women |
| 15 to 19 years | 0 (0.0%) | 0.0 |
| 20 to 34 years | 28 (21.4%) | 48.0 |
| 35 to 50 years | 103 (78.6%) | 78.0 |
| Total | 131 (100.0%) | 61.0 |
Fertility by Age by Marriage Status in Hillsborough
85.5% of women with births (131) in Hillsborough are married. The highest percentage of unmarried women with births falls into 20 to 34 years age bracket with 67.9% of them unmarried at the time of birth, while the lowest percentage of unmarried women with births belong to 35 to 50 years age bracket with 0.0% of them unmarried.
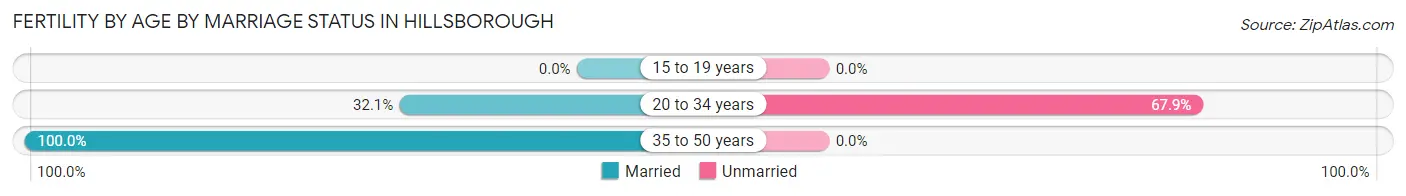
| Age Bracket | Married | Unmarried |
| 15 to 19 years | 0 (0.0%) | 0 (0.0%) |
| 20 to 34 years | 9 (32.1%) | 19 (67.9%) |
| 35 to 50 years | 103 (100.0%) | 0 (0.0%) |
| Total | 112 (85.5%) | 19 (14.5%) |
Fertility by Education in Hillsborough
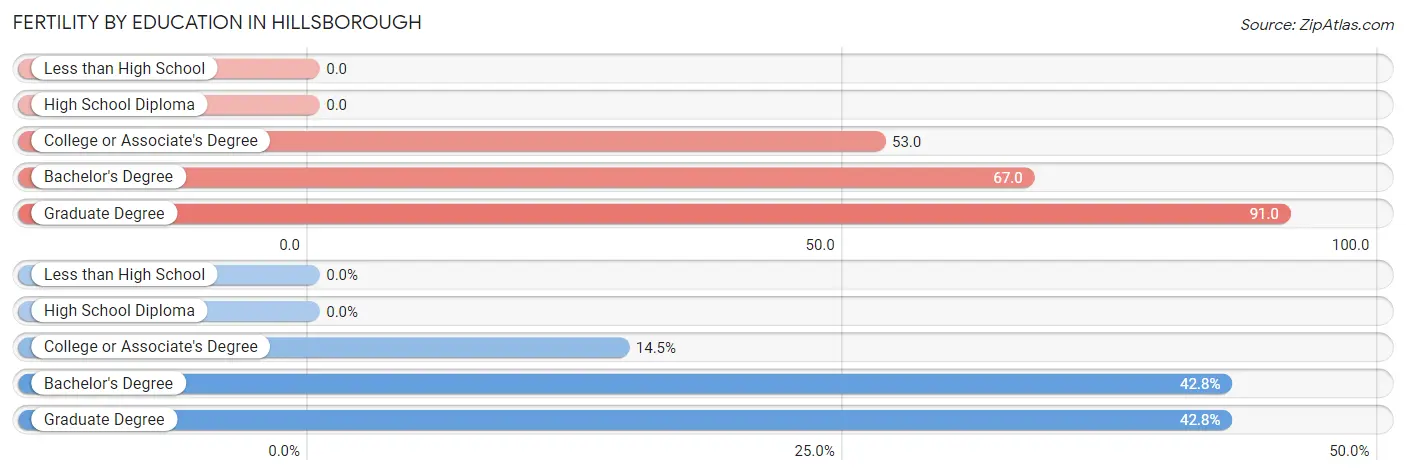
| Educational Attainment | Women with Births | Births / 1,000 Women |
| Less than High School | 0 (0.0%) | 0.0 |
| High School Diploma | 0 (0.0%) | 0.0 |
| College or Associate's Degree | 19 (14.5%) | 53.0 |
| Bachelor's Degree | 56 (42.7%) | 67.0 |
| Graduate Degree | 56 (42.7%) | 91.0 |
| Total | 131 (100.0%) | 61.0 |
Fertility by Education by Marriage Status in Hillsborough
14.5% of women with births in Hillsborough are unmarried. Women with the educational attainment of bachelor's degree are most likely to be married with 100.0% of them married at childbirth, while women with the educational attainment of college or associate's degree are least likely to be married with 100.0% of them unmarried at childbirth.
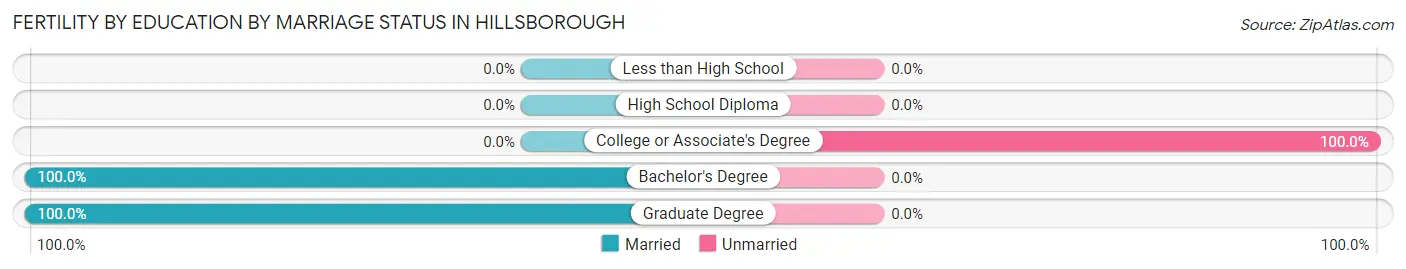
| Educational Attainment | Married | Unmarried |
| Less than High School | 0 (0.0%) | 0 (0.0%) |
| High School Diploma | 0 (0.0%) | 0 (0.0%) |
| College or Associate's Degree | 0 (0.0%) | 19 (100.0%) |
| Bachelor's Degree | 56 (100.0%) | 0 (0.0%) |
| Graduate Degree | 56 (100.0%) | 0 (0.0%) |
| Total | 112 (85.5%) | 19 (14.5%) |
Employment Characteristics in Hillsborough
Employment by Class of Employer in Hillsborough
Among the 4,441 employed individuals in Hillsborough, private company employees (1,969 | 44.3%), not-for-profit organizations (796 | 17.9%), and self-employed (not incorporated) (509 | 11.5%) make up the most common classes of employment.
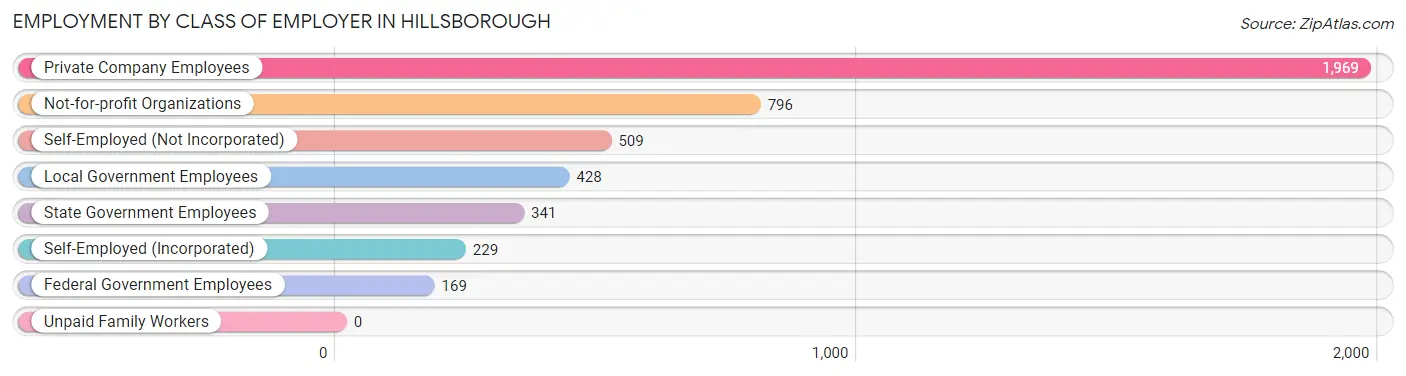
| Employer Class | # Employees | % Employees |
| Private Company Employees | 1,969 | 44.3% |
| Self-Employed (Incorporated) | 229 | 5.2% |
| Self-Employed (Not Incorporated) | 509 | 11.5% |
| Not-for-profit Organizations | 796 | 17.9% |
| Local Government Employees | 428 | 9.6% |
| State Government Employees | 341 | 7.7% |
| Federal Government Employees | 169 | 3.8% |
| Unpaid Family Workers | 0 | 0.0% |
| Total | 4,441 | 100.0% |
Employment Status by Age in Hillsborough
According to the labor force statistics for Hillsborough, out of the total population over 16 years of age (7,771), 63.7% or 4,950 individuals are in the labor force, with 7.2% or 356 of them unemployed. The age group with the highest labor force participation rate is 30 to 34 years, with 91.3% or 504 individuals in the labor force. Within the labor force, the 35 to 44 years age range has the highest percentage of unemployed individuals, with 14.5% or 186 of them being unemployed.
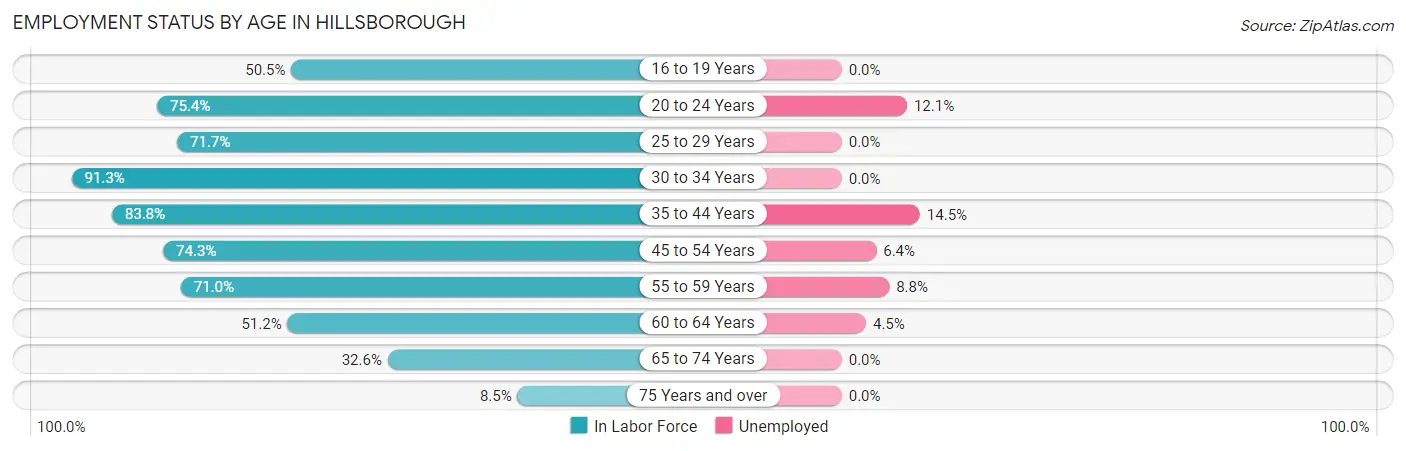
| Age Bracket | In Labor Force | Unemployed |
| 16 to 19 Years | 150 (50.5%) | 0 (0.0%) |
| 20 to 24 Years | 257 (75.4%) | 31 (12.1%) |
| 25 to 29 Years | 321 (71.7%) | 0 (0.0%) |
| 30 to 34 Years | 504 (91.3%) | 0 (0.0%) |
| 35 to 44 Years | 1,285 (83.8%) | 186 (14.5%) |
| 45 to 54 Years | 1,068 (74.3%) | 68 (6.4%) |
| 55 to 59 Years | 577 (71.0%) | 51 (8.8%) |
| 60 to 64 Years | 419 (51.2%) | 19 (4.5%) |
| 65 to 74 Years | 323 (32.6%) | 0 (0.0%) |
| 75 Years and over | 46 (8.5%) | 0 (0.0%) |
| Total | 4,950 (63.7%) | 356 (7.2%) |
Employment Status by Educational Attainment in Hillsborough
According to labor force statistics for Hillsborough, 74.5% of individuals (4,174) out of the total population between 25 and 64 years of age (5,603) are in the labor force, with 7.8% or 326 of them being unemployed. The group with the highest labor force participation rate are those with the educational attainment of bachelor's degree or higher, with 87.6% or 2,984 individuals in the labor force. Within the labor force, individuals with high school diploma education have the highest percentage of unemployment, with 23.8% or 110 of them being unemployed.
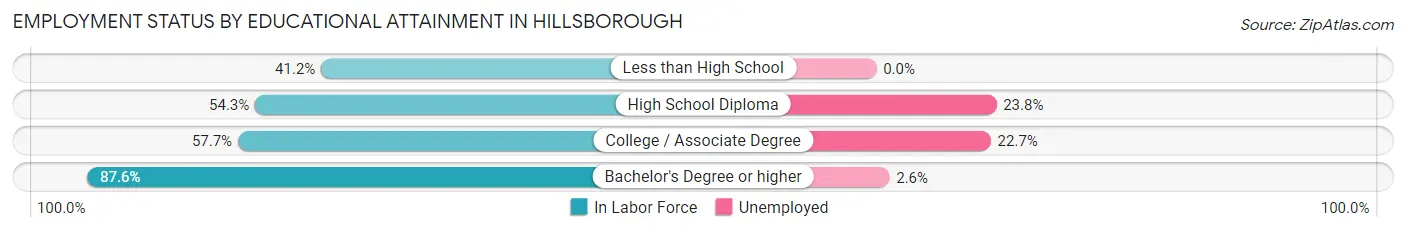
| Educational Attainment | In Labor Force | Unemployed |
| Less than High School | 121 (41.2%) | 0 (0.0%) |
| High School Diploma | 462 (54.3%) | 203 (23.8%) |
| College / Associate Degree | 607 (57.7%) | 239 (22.7%) |
| Bachelor's Degree or higher | 2,984 (87.6%) | 89 (2.6%) |
| Total | 4,174 (74.5%) | 437 (7.8%) |
Employment Occupations by Sex in Hillsborough
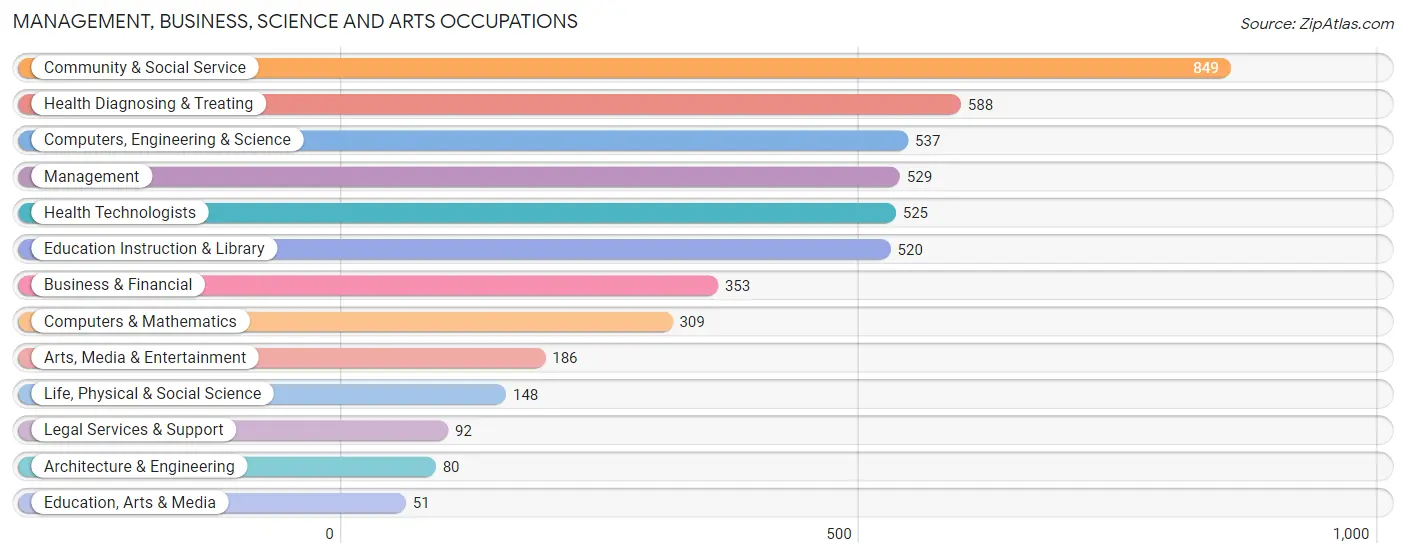
Management, Business, Science and Arts Occupations
The most common Management, Business, Science and Arts occupations in Hillsborough are Community & Social Service (849 | 18.5%), Health Diagnosing & Treating (588 | 12.8%), Computers, Engineering & Science (537 | 11.7%), Management (529 | 11.6%), and Health Technologists (525 | 11.5%).
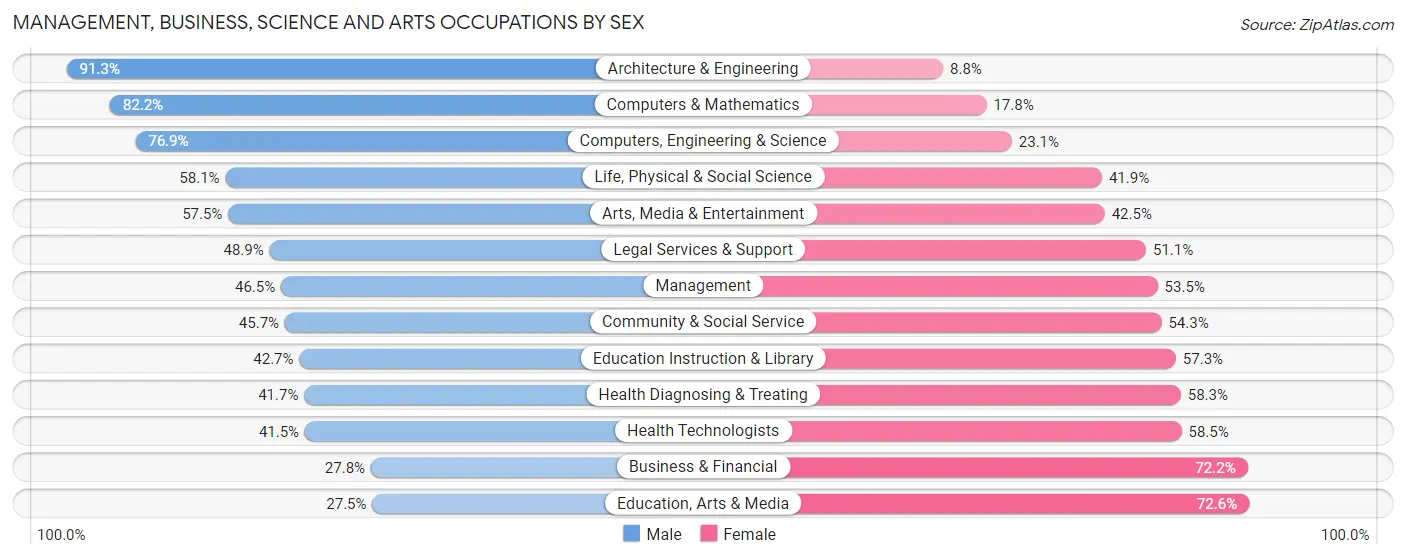
Management, Business, Science and Arts Occupations by Sex
Within the Management, Business, Science and Arts occupations in Hillsborough, the most male-oriented occupations are Architecture & Engineering (91.2%), Computers & Mathematics (82.2%), and Computers, Engineering & Science (76.9%), while the most female-oriented occupations are Education, Arts & Media (72.6%), Business & Financial (72.2%), and Health Technologists (58.5%).
| Occupation | Male | Female |
| Management | 246 (46.5%) | 283 (53.5%) |
| Business & Financial | 98 (27.8%) | 255 (72.2%) |
| Computers, Engineering & Science | 413 (76.9%) | 124 (23.1%) |
| Computers & Mathematics | 254 (82.2%) | 55 (17.8%) |
| Architecture & Engineering | 73 (91.2%) | 7 (8.7%) |
| Life, Physical & Social Science | 86 (58.1%) | 62 (41.9%) |
| Community & Social Service | 388 (45.7%) | 461 (54.3%) |
| Education, Arts & Media | 14 (27.5%) | 37 (72.6%) |
| Legal Services & Support | 45 (48.9%) | 47 (51.1%) |
| Education Instruction & Library | 222 (42.7%) | 298 (57.3%) |
| Arts, Media & Entertainment | 107 (57.5%) | 79 (42.5%) |
| Health Diagnosing & Treating | 245 (41.7%) | 343 (58.3%) |
| Health Technologists | 218 (41.5%) | 307 (58.5%) |
| Total (Category) | 1,390 (48.7%) | 1,466 (51.3%) |
| Total (Overall) | 2,204 (48.1%) | 2,378 (51.9%) |
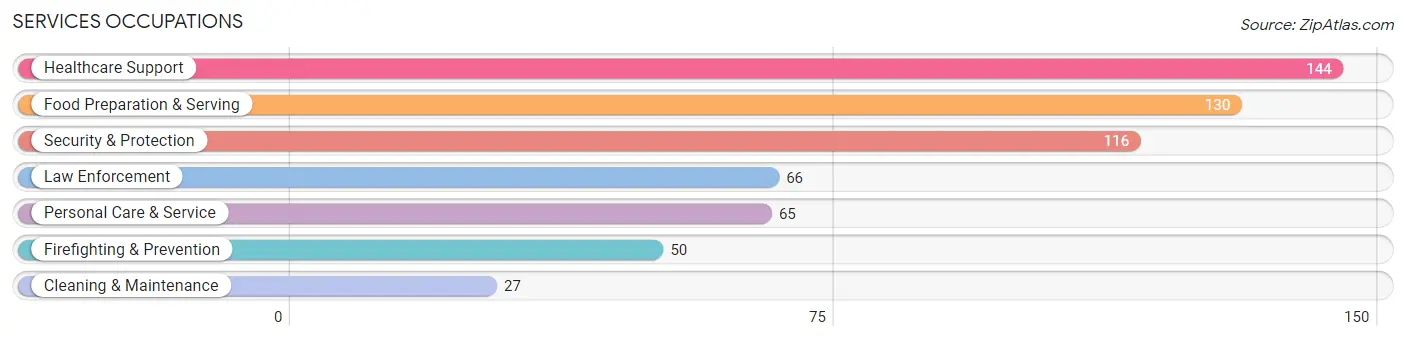
Services Occupations
The most common Services occupations in Hillsborough are Healthcare Support (144 | 3.1%), Food Preparation & Serving (130 | 2.8%), Security & Protection (116 | 2.5%), Law Enforcement (66 | 1.4%), and Personal Care & Service (65 | 1.4%).
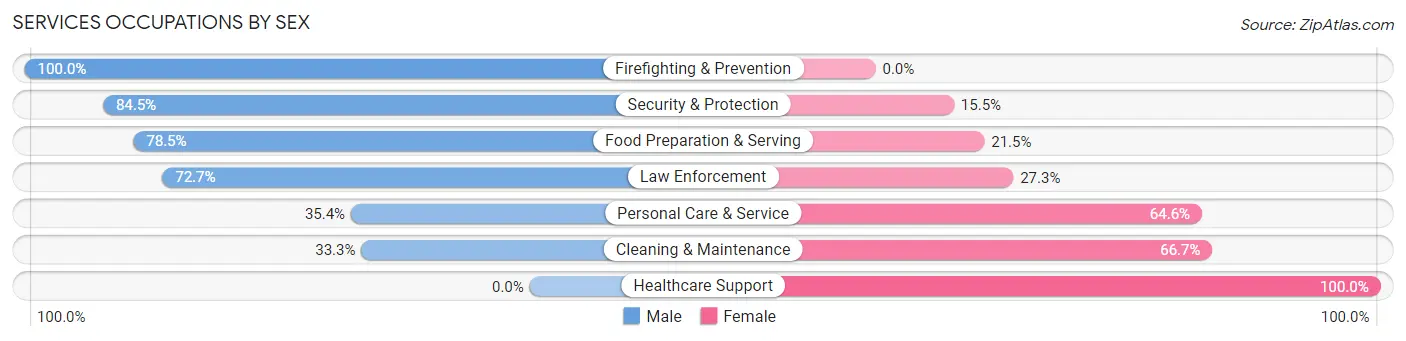
Services Occupations by Sex
Within the Services occupations in Hillsborough, the most male-oriented occupations are Firefighting & Prevention (100.0%), Security & Protection (84.5%), and Food Preparation & Serving (78.5%), while the most female-oriented occupations are Healthcare Support (100.0%), Cleaning & Maintenance (66.7%), and Personal Care & Service (64.6%).
| Occupation | Male | Female |
| Healthcare Support | 0 (0.0%) | 144 (100.0%) |
| Security & Protection | 98 (84.5%) | 18 (15.5%) |
| Firefighting & Prevention | 50 (100.0%) | 0 (0.0%) |
| Law Enforcement | 48 (72.7%) | 18 (27.3%) |
| Food Preparation & Serving | 102 (78.5%) | 28 (21.5%) |
| Cleaning & Maintenance | 9 (33.3%) | 18 (66.7%) |
| Personal Care & Service | 23 (35.4%) | 42 (64.6%) |
| Total (Category) | 232 (48.1%) | 250 (51.9%) |
| Total (Overall) | 2,204 (48.1%) | 2,378 (51.9%) |
Sales and Office Occupations
The most common Sales and Office occupations in Hillsborough are Sales & Related (574 | 12.5%), and Office & Administration (369 | 8.1%).
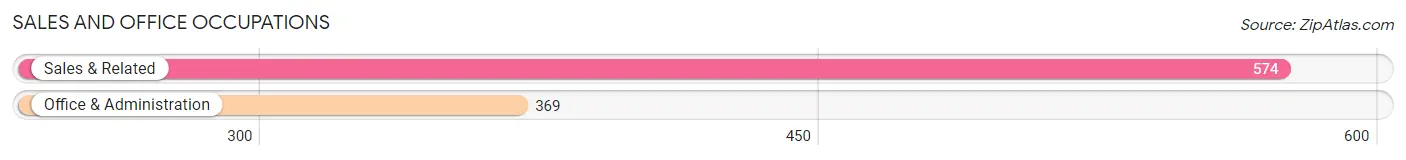
Sales and Office Occupations by Sex
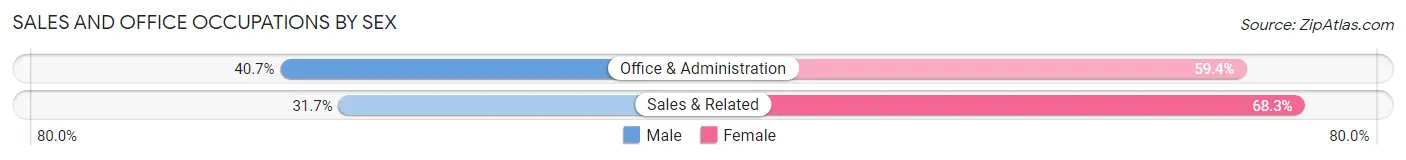
| Occupation | Male | Female |
| Sales & Related | 182 (31.7%) | 392 (68.3%) |
| Office & Administration | 150 (40.6%) | 219 (59.4%) |
| Total (Category) | 332 (35.2%) | 611 (64.8%) |
| Total (Overall) | 2,204 (48.1%) | 2,378 (51.9%) |
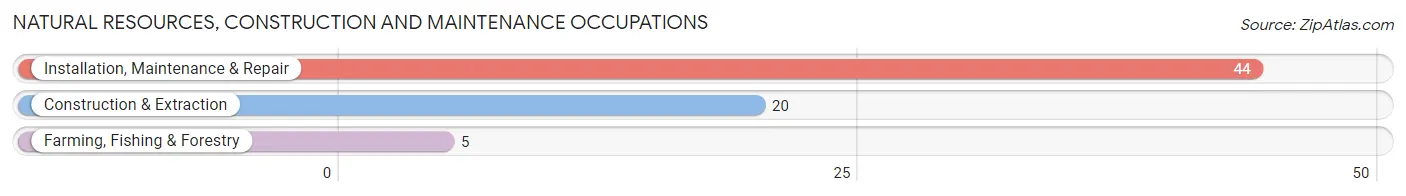
Natural Resources, Construction and Maintenance Occupations
The most common Natural Resources, Construction and Maintenance occupations in Hillsborough are Installation, Maintenance & Repair (44 | 1.0%), Construction & Extraction (20 | 0.4%), and Farming, Fishing & Forestry (5 | 0.1%).
Natural Resources, Construction and Maintenance Occupations by Sex
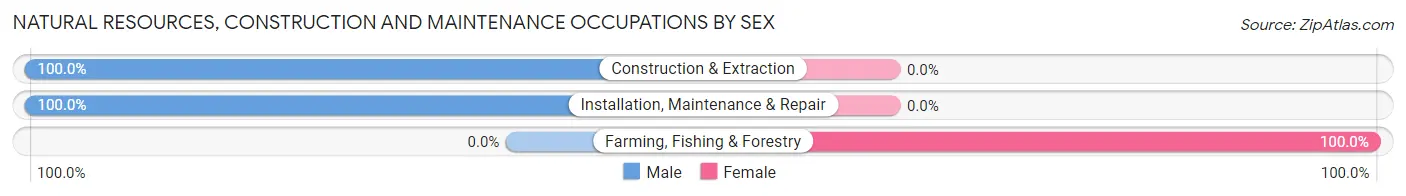
| Occupation | Male | Female |
| Farming, Fishing & Forestry | 0 (0.0%) | 5 (100.0%) |
| Construction & Extraction | 20 (100.0%) | 0 (0.0%) |
| Installation, Maintenance & Repair | 44 (100.0%) | 0 (0.0%) |
| Total (Category) | 64 (92.7%) | 5 (7.2%) |
| Total (Overall) | 2,204 (48.1%) | 2,378 (51.9%) |
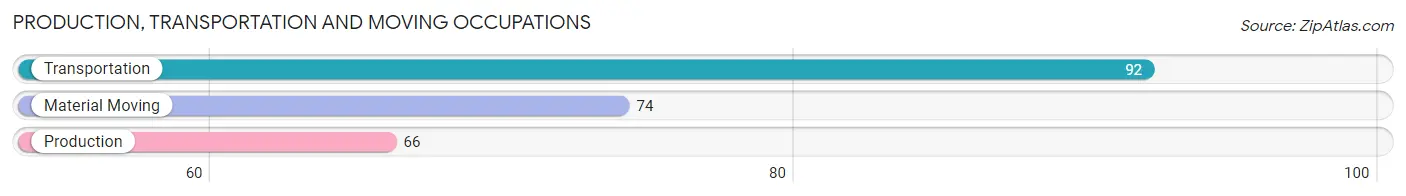
Production, Transportation and Moving Occupations
The most common Production, Transportation and Moving occupations in Hillsborough are Transportation (92 | 2.0%), Material Moving (74 | 1.6%), and Production (66 | 1.4%).
Production, Transportation and Moving Occupations by Sex
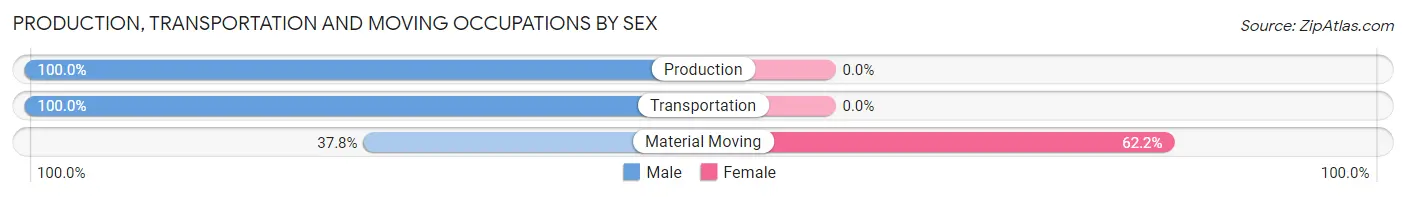
| Occupation | Male | Female |
| Production | 66 (100.0%) | 0 (0.0%) |
| Transportation | 92 (100.0%) | 0 (0.0%) |
| Material Moving | 28 (37.8%) | 46 (62.2%) |
| Total (Category) | 186 (80.2%) | 46 (19.8%) |
| Total (Overall) | 2,204 (48.1%) | 2,378 (51.9%) |
Employment Industries by Sex in Hillsborough
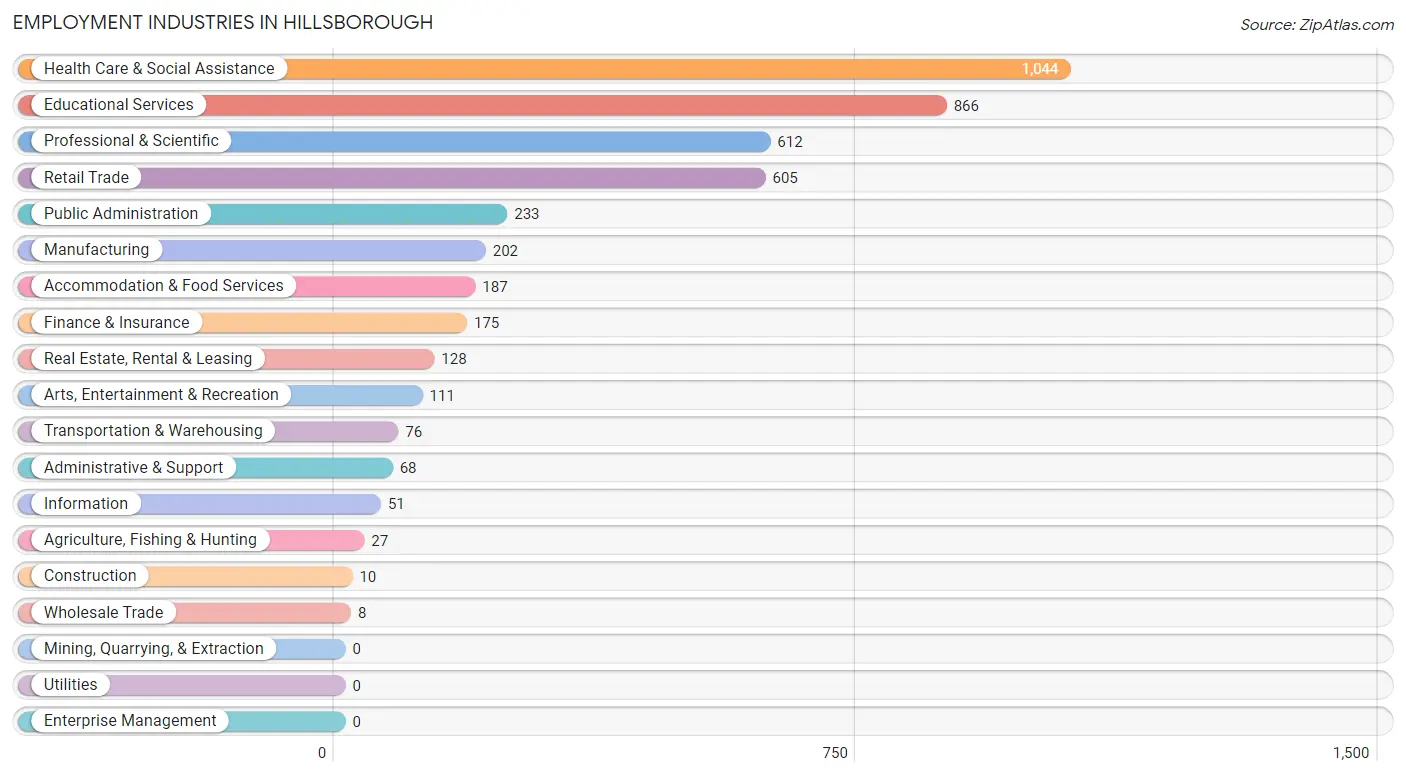
Employment Industries in Hillsborough
The major employment industries in Hillsborough include Health Care & Social Assistance (1,044 | 22.8%), Educational Services (866 | 18.9%), Professional & Scientific (612 | 13.4%), Retail Trade (605 | 13.2%), and Public Administration (233 | 5.1%).
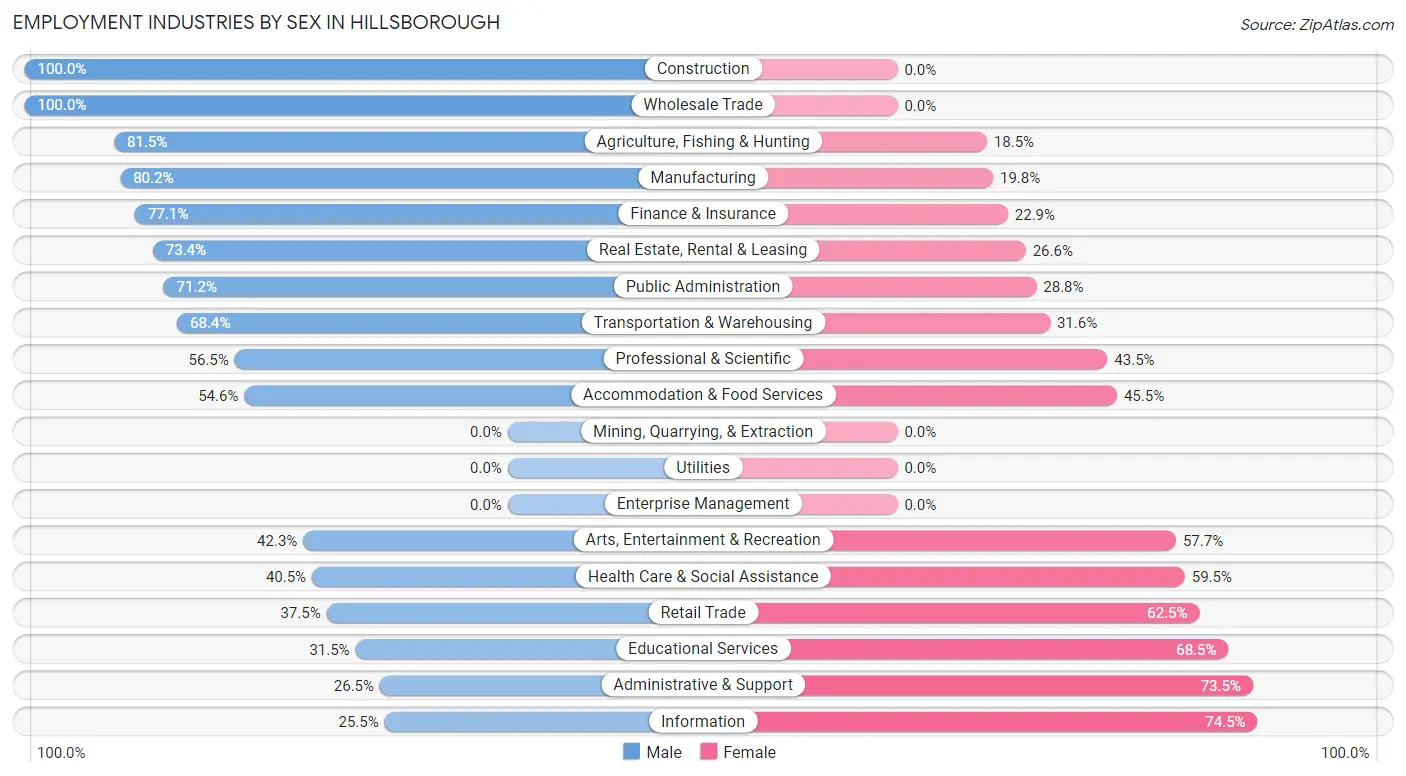
Employment Industries by Sex in Hillsborough
The Hillsborough industries that see more men than women are Construction (100.0%), Wholesale Trade (100.0%), and Agriculture, Fishing & Hunting (81.5%), whereas the industries that tend to have a higher number of women are Information (74.5%), Administrative & Support (73.5%), and Educational Services (68.5%).
| Industry | Male | Female |
| Agriculture, Fishing & Hunting | 22 (81.5%) | 5 (18.5%) |
| Mining, Quarrying, & Extraction | 0 (0.0%) | 0 (0.0%) |
| Construction | 10 (100.0%) | 0 (0.0%) |
| Manufacturing | 162 (80.2%) | 40 (19.8%) |
| Wholesale Trade | 8 (100.0%) | 0 (0.0%) |
| Retail Trade | 227 (37.5%) | 378 (62.5%) |
| Transportation & Warehousing | 52 (68.4%) | 24 (31.6%) |
| Utilities | 0 (0.0%) | 0 (0.0%) |
| Information | 13 (25.5%) | 38 (74.5%) |
| Finance & Insurance | 135 (77.1%) | 40 (22.9%) |
| Real Estate, Rental & Leasing | 94 (73.4%) | 34 (26.6%) |
| Professional & Scientific | 346 (56.5%) | 266 (43.5%) |
| Enterprise Management | 0 (0.0%) | 0 (0.0%) |
| Administrative & Support | 18 (26.5%) | 50 (73.5%) |
| Educational Services | 273 (31.5%) | 593 (68.5%) |
| Health Care & Social Assistance | 423 (40.5%) | 621 (59.5%) |
| Arts, Entertainment & Recreation | 47 (42.3%) | 64 (57.7%) |
| Accommodation & Food Services | 102 (54.5%) | 85 (45.5%) |
| Public Administration | 166 (71.2%) | 67 (28.8%) |
| Total | 2,204 (48.1%) | 2,378 (51.9%) |
Education in Hillsborough
School Enrollment in Hillsborough
The most common levels of schooling among the 2,230 students in Hillsborough are elementary school (606 | 27.2%), high school (389 | 17.4%), and college / undergraduate (319 | 14.3%).
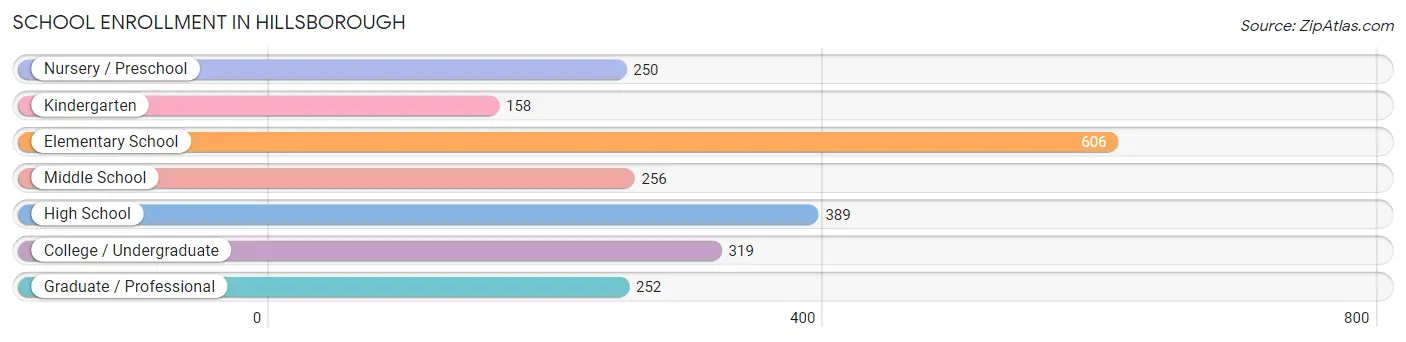
| School Level | # Students | % Students |
| Nursery / Preschool | 250 | 11.2% |
| Kindergarten | 158 | 7.1% |
| Elementary School | 606 | 27.2% |
| Middle School | 256 | 11.5% |
| High School | 389 | 17.4% |
| College / Undergraduate | 319 | 14.3% |
| Graduate / Professional | 252 | 11.3% |
| Total | 2,230 | 100.0% |
School Enrollment by Age by Funding Source in Hillsborough
Out of a total of 2,230 students who are enrolled in schools in Hillsborough, 415 (18.6%) attend a private institution, while the remaining 1,815 (81.4%) are enrolled in public schools. The age group of 3 to 4 year olds has the highest likelihood of being enrolled in private schools, with 133 (57.3% in the age bracket) enrolled. Conversely, the age group of 18 to 19 year olds has the lowest likelihood of being enrolled in a private school, with 36 (100.0% in the age bracket) attending a public institution.
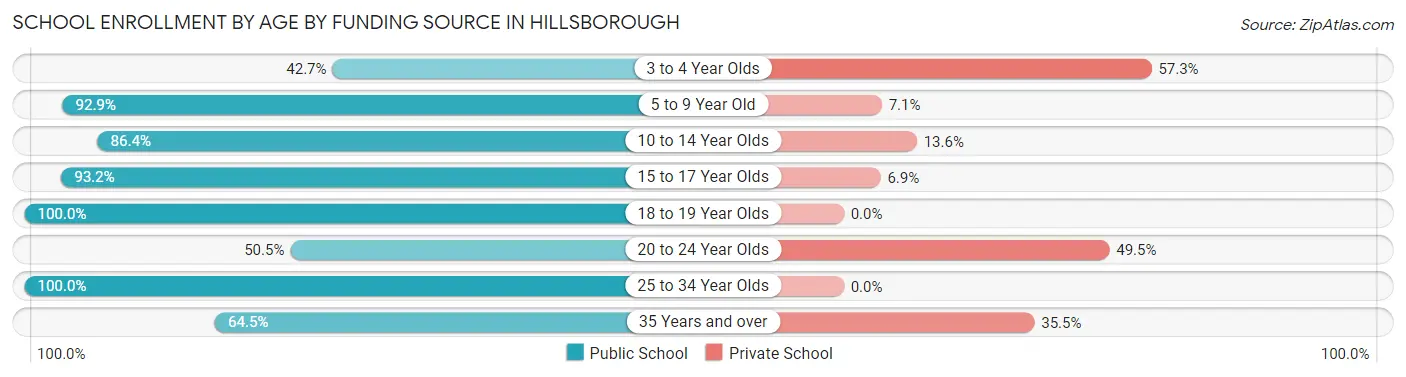
| Age Bracket | Public School | Private School |
| 3 to 4 Year Olds | 99 (42.7%) | 133 (57.3%) |
| 5 to 9 Year Old | 616 (92.9%) | 47 (7.1%) |
| 10 to 14 Year Olds | 330 (86.4%) | 52 (13.6%) |
| 15 to 17 Year Olds | 340 (93.1%) | 25 (6.9%) |
| 18 to 19 Year Olds | 36 (100.0%) | 0 (0.0%) |
| 20 to 24 Year Olds | 49 (50.5%) | 48 (49.5%) |
| 25 to 34 Year Olds | 148 (100.0%) | 0 (0.0%) |
| 35 Years and over | 198 (64.5%) | 109 (35.5%) |
| Total | 1,815 (81.4%) | 415 (18.6%) |
Educational Attainment by Field of Study in Hillsborough
Business (494 | 11.1%), bio, nature & agricultural (477 | 10.7%), science & technology (459 | 10.3%), social sciences (431 | 9.7%), and psychology (376 | 8.5%) are the most common fields of study among 4,440 individuals in Hillsborough who have obtained a bachelor's degree or higher.
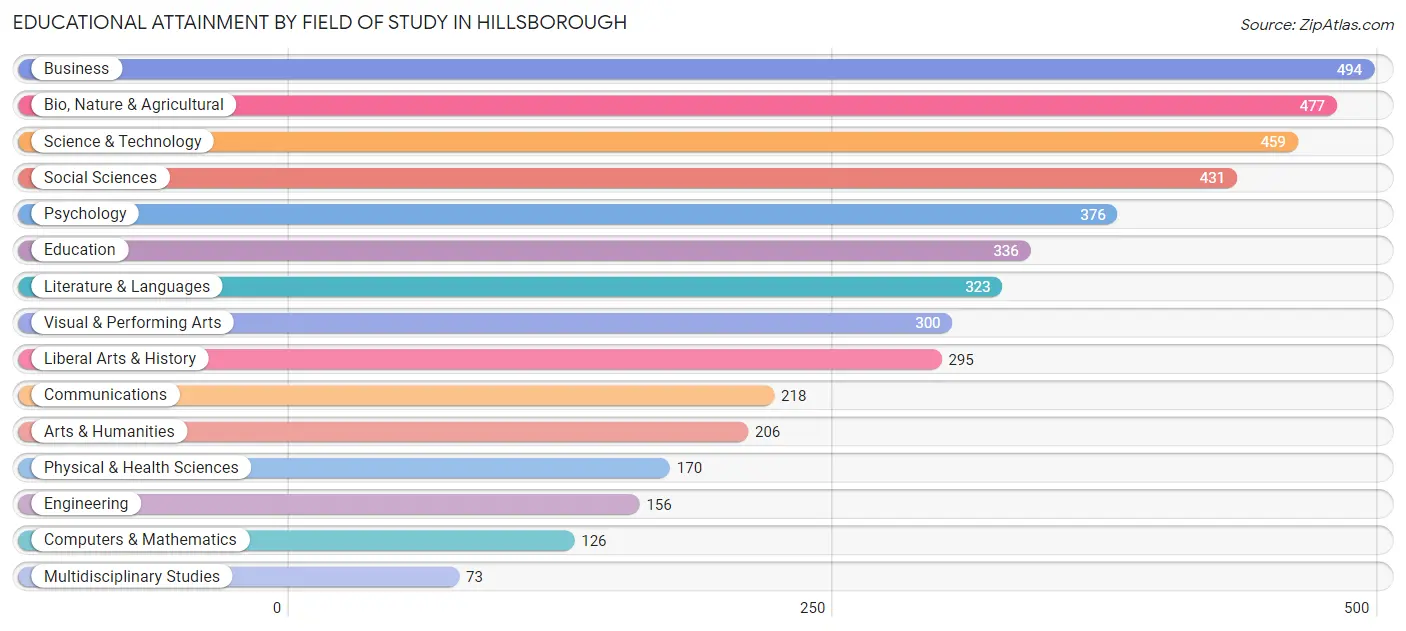
| Field of Study | # Graduates | % Graduates |
| Computers & Mathematics | 126 | 2.8% |
| Bio, Nature & Agricultural | 477 | 10.7% |
| Physical & Health Sciences | 170 | 3.8% |
| Psychology | 376 | 8.5% |
| Social Sciences | 431 | 9.7% |
| Engineering | 156 | 3.5% |
| Multidisciplinary Studies | 73 | 1.6% |
| Science & Technology | 459 | 10.3% |
| Business | 494 | 11.1% |
| Education | 336 | 7.6% |
| Literature & Languages | 323 | 7.3% |
| Liberal Arts & History | 295 | 6.6% |
| Visual & Performing Arts | 300 | 6.8% |
| Communications | 218 | 4.9% |
| Arts & Humanities | 206 | 4.6% |
| Total | 4,440 | 100.0% |
Transportation & Commute in Hillsborough
Vehicle Availability by Sex in Hillsborough
The most prevalent vehicle ownership categories in Hillsborough are males with 2 vehicles (1,046, accounting for 49.5%) and females with 2 vehicles (1,039, making up 44.9%).
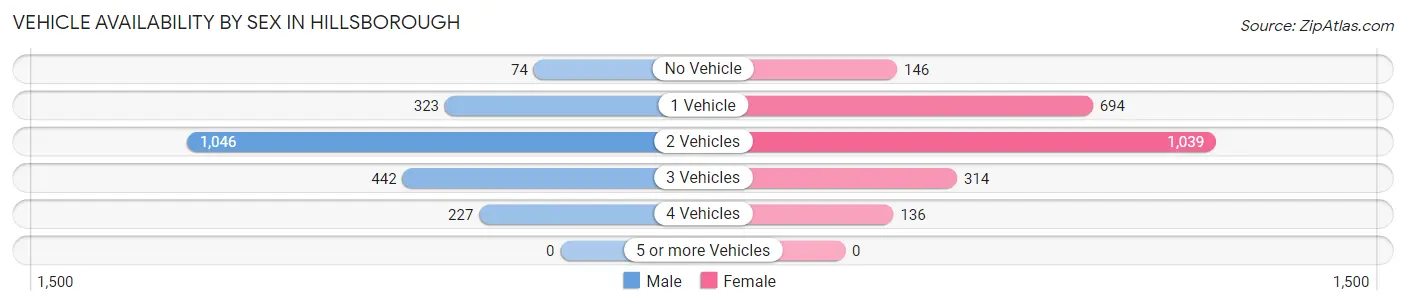
| Vehicles Available | Male | Female |
| No Vehicle | 74 (3.5%) | 146 (6.3%) |
| 1 Vehicle | 323 (15.3%) | 694 (29.8%) |
| 2 Vehicles | 1,046 (49.5%) | 1,039 (44.6%) |
| 3 Vehicles | 442 (20.9%) | 314 (13.5%) |
| 4 Vehicles | 227 (10.7%) | 136 (5.8%) |
| 5 or more Vehicles | 0 (0.0%) | 0 (0.0%) |
| Total | 2,112 (100.0%) | 2,329 (100.0%) |
Commute Time in Hillsborough
The most frequently occuring commute durations in Hillsborough are 20 to 24 minutes (673 commuters, 19.9%), 15 to 19 minutes (634 commuters, 18.7%), and 10 to 14 minutes (397 commuters, 11.7%).
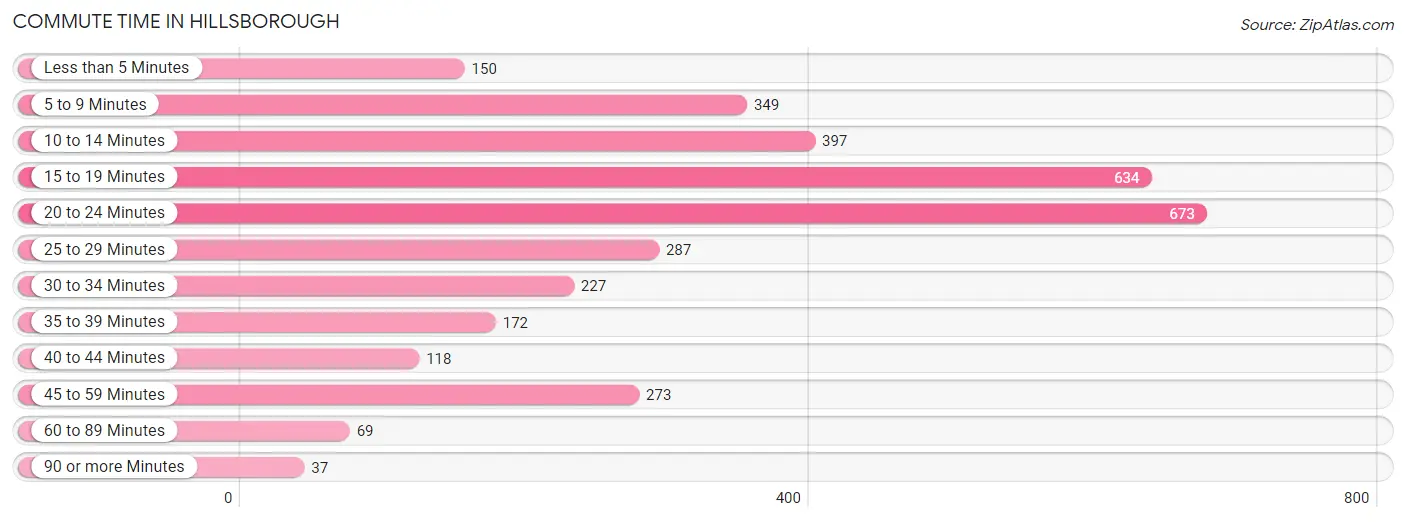
| Commute Time | # Commuters | % Commuters |
| Less than 5 Minutes | 150 | 4.4% |
| 5 to 9 Minutes | 349 | 10.3% |
| 10 to 14 Minutes | 397 | 11.7% |
| 15 to 19 Minutes | 634 | 18.7% |
| 20 to 24 Minutes | 673 | 19.9% |
| 25 to 29 Minutes | 287 | 8.5% |
| 30 to 34 Minutes | 227 | 6.7% |
| 35 to 39 Minutes | 172 | 5.1% |
| 40 to 44 Minutes | 118 | 3.5% |
| 45 to 59 Minutes | 273 | 8.1% |
| 60 to 89 Minutes | 69 | 2.0% |
| 90 or more Minutes | 37 | 1.1% |
Commute Time by Sex in Hillsborough
The most common commute times in Hillsborough are 20 to 24 minutes (419 commuters, 25.4%) for males and 15 to 19 minutes (311 commuters, 17.9%) for females.
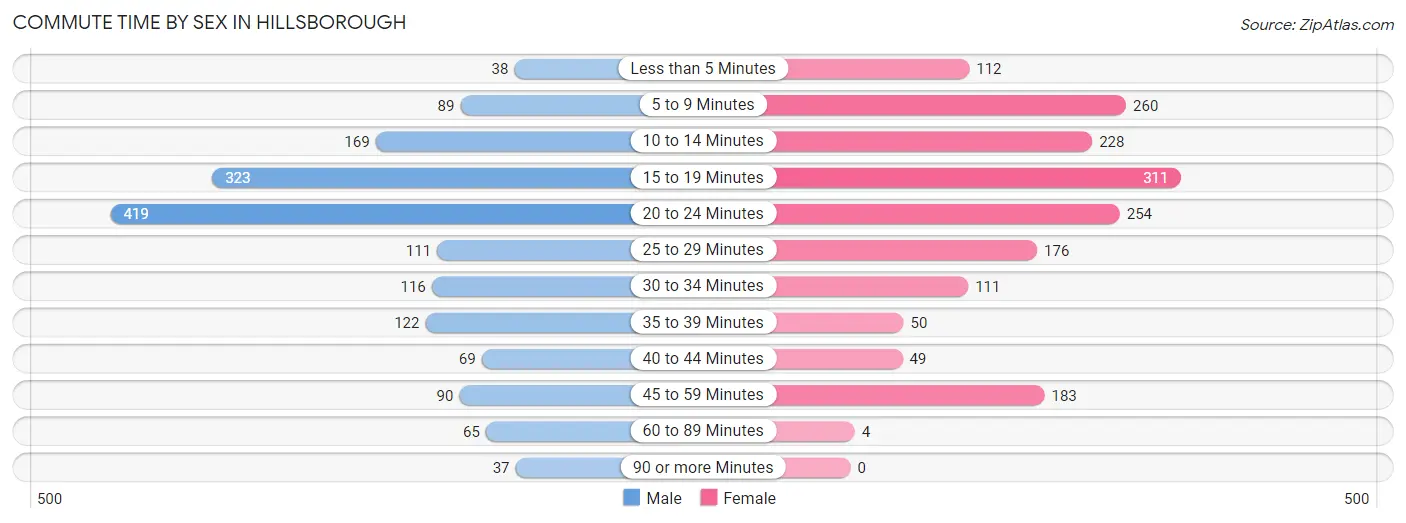
| Commute Time | Male | Female |
| Less than 5 Minutes | 38 (2.3%) | 112 (6.4%) |
| 5 to 9 Minutes | 89 (5.4%) | 260 (15.0%) |
| 10 to 14 Minutes | 169 (10.2%) | 228 (13.1%) |
| 15 to 19 Minutes | 323 (19.6%) | 311 (17.9%) |
| 20 to 24 Minutes | 419 (25.4%) | 254 (14.6%) |
| 25 to 29 Minutes | 111 (6.7%) | 176 (10.1%) |
| 30 to 34 Minutes | 116 (7.0%) | 111 (6.4%) |
| 35 to 39 Minutes | 122 (7.4%) | 50 (2.9%) |
| 40 to 44 Minutes | 69 (4.2%) | 49 (2.8%) |
| 45 to 59 Minutes | 90 (5.5%) | 183 (10.5%) |
| 60 to 89 Minutes | 65 (3.9%) | 4 (0.2%) |
| 90 or more Minutes | 37 (2.2%) | 0 (0.0%) |
Time of Departure to Work by Sex in Hillsborough
The most frequent times of departure to work in Hillsborough are 7:30 AM to 7:59 AM (343, 20.8%) for males and 6:30 AM to 6:59 AM (382, 22.0%) for females.
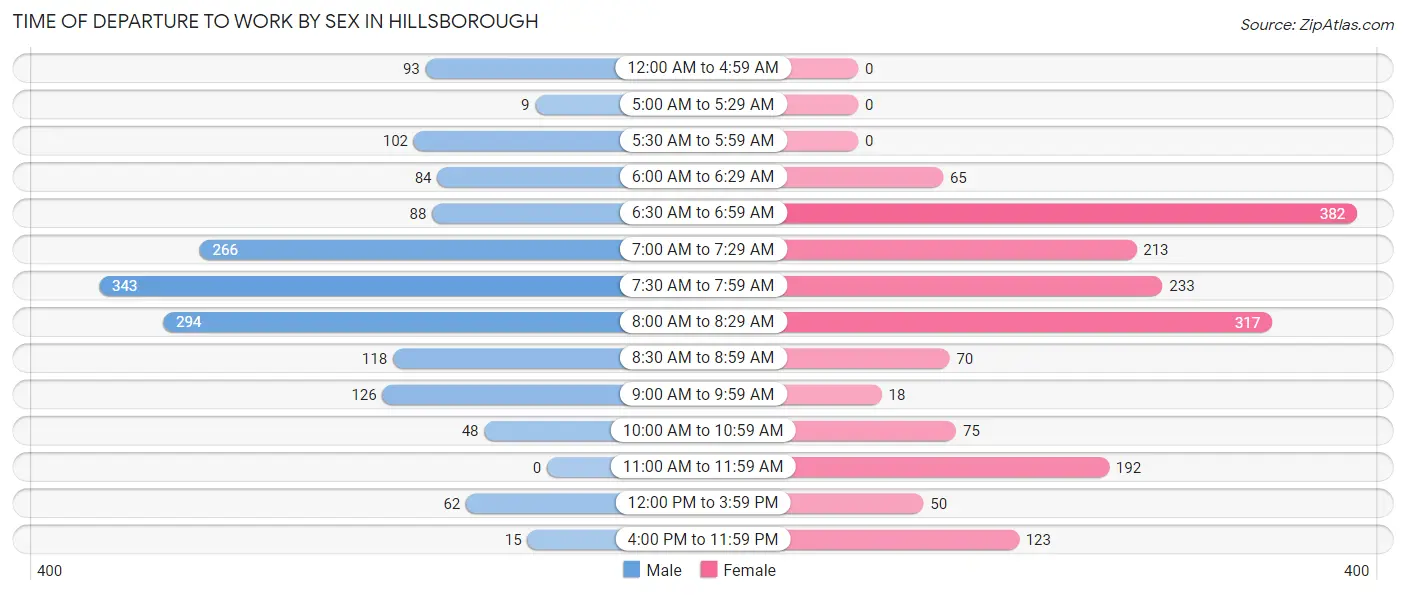
| Time of Departure | Male | Female |
| 12:00 AM to 4:59 AM | 93 (5.6%) | 0 (0.0%) |
| 5:00 AM to 5:29 AM | 9 (0.5%) | 0 (0.0%) |
| 5:30 AM to 5:59 AM | 102 (6.2%) | 0 (0.0%) |
| 6:00 AM to 6:29 AM | 84 (5.1%) | 65 (3.7%) |
| 6:30 AM to 6:59 AM | 88 (5.3%) | 382 (22.0%) |
| 7:00 AM to 7:29 AM | 266 (16.1%) | 213 (12.3%) |
| 7:30 AM to 7:59 AM | 343 (20.8%) | 233 (13.4%) |
| 8:00 AM to 8:29 AM | 294 (17.8%) | 317 (18.2%) |
| 8:30 AM to 8:59 AM | 118 (7.2%) | 70 (4.0%) |
| 9:00 AM to 9:59 AM | 126 (7.6%) | 18 (1.0%) |
| 10:00 AM to 10:59 AM | 48 (2.9%) | 75 (4.3%) |
| 11:00 AM to 11:59 AM | 0 (0.0%) | 192 (11.1%) |
| 12:00 PM to 3:59 PM | 62 (3.8%) | 50 (2.9%) |
| 4:00 PM to 11:59 PM | 15 (0.9%) | 123 (7.1%) |
| Total | 1,648 (100.0%) | 1,738 (100.0%) |
Housing Occupancy in Hillsborough
Occupancy by Ownership in Hillsborough
Of the total 3,988 dwellings in Hillsborough, owner-occupied units account for 2,550 (63.9%), while renter-occupied units make up 1,438 (36.1%).
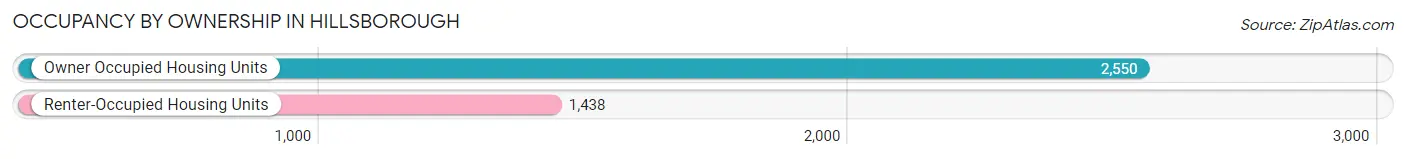
| Occupancy | # Housing Units | % Housing Units |
| Owner Occupied Housing Units | 2,550 | 63.9% |
| Renter-Occupied Housing Units | 1,438 | 36.1% |
| Total Occupied Housing Units | 3,988 | 100.0% |
Occupancy by Household Size in Hillsborough
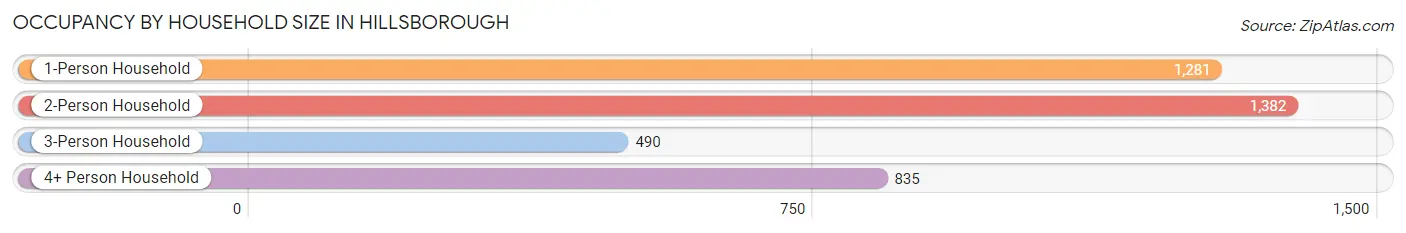
| Household Size | # Housing Units | % Housing Units |
| 1-Person Household | 1,281 | 32.1% |
| 2-Person Household | 1,382 | 34.6% |
| 3-Person Household | 490 | 12.3% |
| 4+ Person Household | 835 | 20.9% |
| Total Housing Units | 3,988 | 100.0% |
Occupancy by Ownership by Household Size in Hillsborough
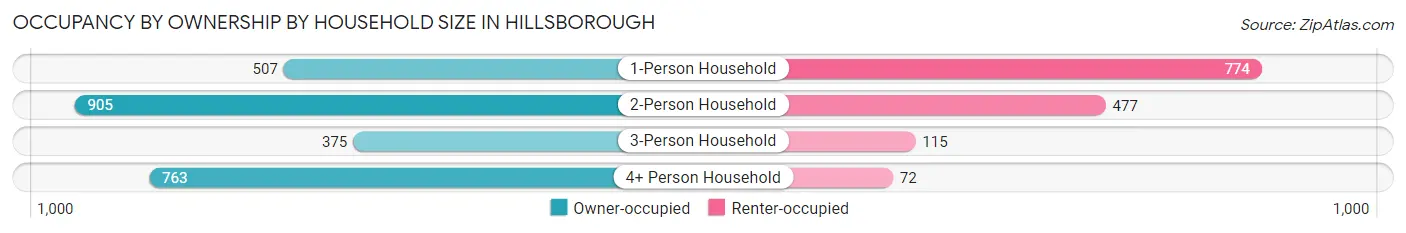
| Household Size | Owner-occupied | Renter-occupied |
| 1-Person Household | 507 (39.6%) | 774 (60.4%) |
| 2-Person Household | 905 (65.5%) | 477 (34.5%) |
| 3-Person Household | 375 (76.5%) | 115 (23.5%) |
| 4+ Person Household | 763 (91.4%) | 72 (8.6%) |
| Total Housing Units | 2,550 (63.9%) | 1,438 (36.1%) |
Occupancy by Educational Attainment in Hillsborough
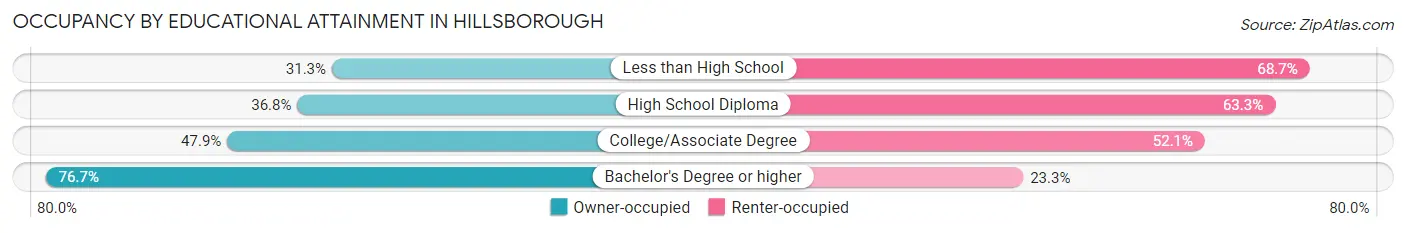
| Household Size | Owner-occupied | Renter-occupied |
| Less than High School | 86 (31.3%) | 189 (68.7%) |
| High School Diploma | 147 (36.7%) | 253 (63.2%) |
| College/Associate Degree | 371 (47.9%) | 404 (52.1%) |
| Bachelor's Degree or higher | 1,946 (76.7%) | 592 (23.3%) |
Occupancy by Age of Householder in Hillsborough
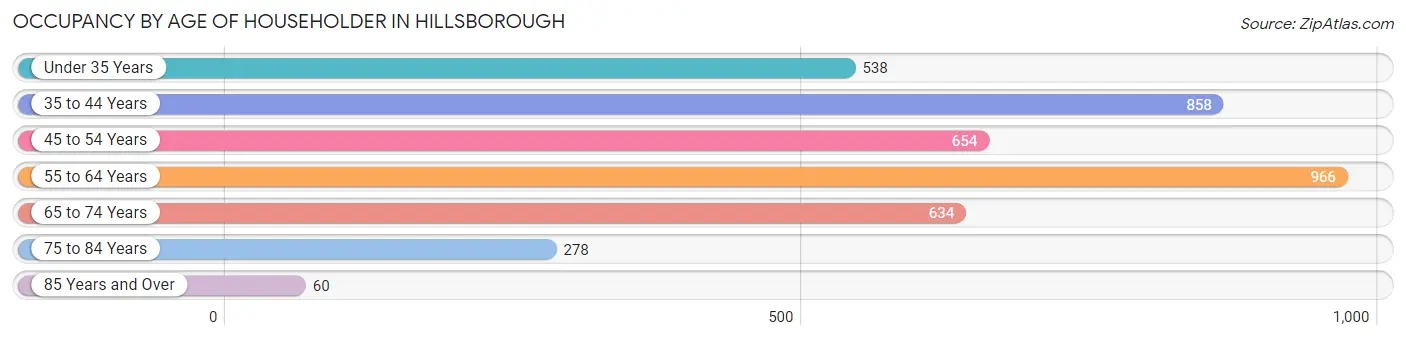
| Age Bracket | # Households | % Households |
| Under 35 Years | 538 | 13.5% |
| 35 to 44 Years | 858 | 21.5% |
| 45 to 54 Years | 654 | 16.4% |
| 55 to 64 Years | 966 | 24.2% |
| 65 to 74 Years | 634 | 15.9% |
| 75 to 84 Years | 278 | 7.0% |
| 85 Years and Over | 60 | 1.5% |
| Total | 3,988 | 100.0% |
Housing Finances in Hillsborough
Median Income by Occupancy in Hillsborough
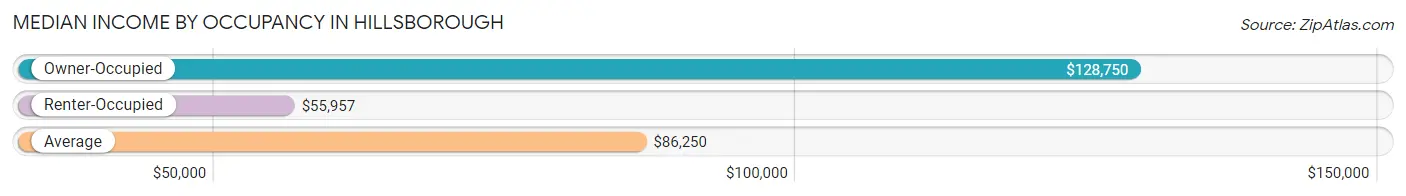
| Occupancy Type | # Households | Median Income |
| Owner-Occupied | 2,550 (63.9%) | $128,750 |
| Renter-Occupied | 1,438 (36.1%) | $55,957 |
| Average | 3,988 (100.0%) | $86,250 |
Occupancy by Householder Income Bracket in Hillsborough
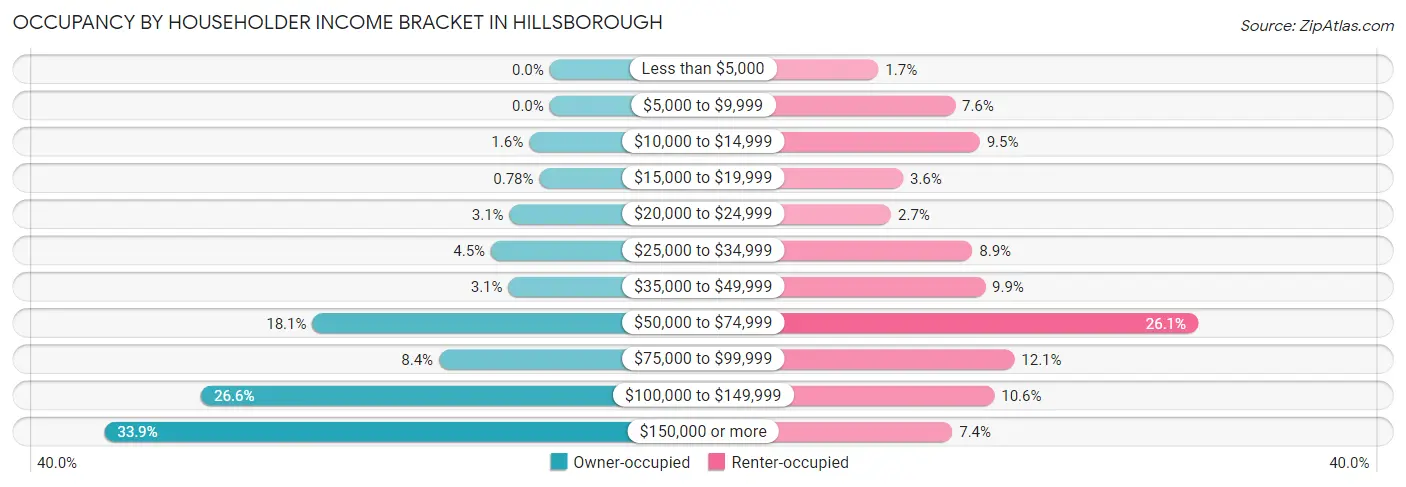
| Income Bracket | Owner-occupied | Renter-occupied |
| Less than $5,000 | 0 (0.0%) | 25 (1.7%) |
| $5,000 to $9,999 | 0 (0.0%) | 109 (7.6%) |
| $10,000 to $14,999 | 40 (1.6%) | 136 (9.5%) |
| $15,000 to $19,999 | 20 (0.8%) | 52 (3.6%) |
| $20,000 to $24,999 | 78 (3.1%) | 39 (2.7%) |
| $25,000 to $34,999 | 114 (4.5%) | 128 (8.9%) |
| $35,000 to $49,999 | 80 (3.1%) | 142 (9.9%) |
| $50,000 to $74,999 | 461 (18.1%) | 375 (26.1%) |
| $75,000 to $99,999 | 215 (8.4%) | 174 (12.1%) |
| $100,000 to $149,999 | 677 (26.6%) | 152 (10.6%) |
| $150,000 or more | 865 (33.9%) | 106 (7.4%) |
| Total | 2,550 (100.0%) | 1,438 (100.0%) |
Monthly Housing Cost Tiers in Hillsborough
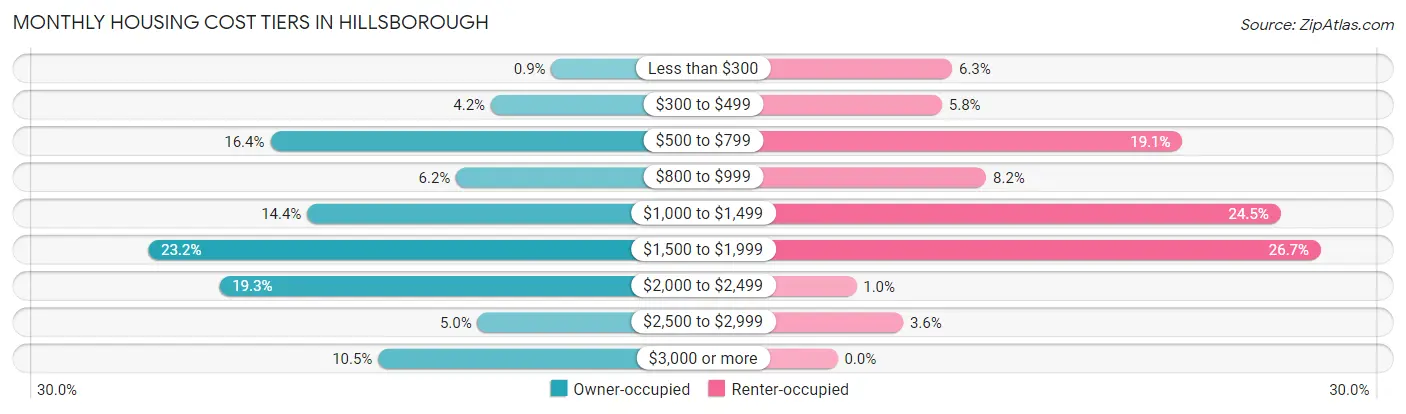
| Monthly Cost | Owner-occupied | Renter-occupied |
| Less than $300 | 23 (0.9%) | 91 (6.3%) |
| $300 to $499 | 108 (4.2%) | 83 (5.8%) |
| $500 to $799 | 419 (16.4%) | 274 (19.1%) |
| $800 to $999 | 157 (6.2%) | 118 (8.2%) |
| $1,000 to $1,499 | 367 (14.4%) | 352 (24.5%) |
| $1,500 to $1,999 | 591 (23.2%) | 384 (26.7%) |
| $2,000 to $2,499 | 491 (19.3%) | 15 (1.0%) |
| $2,500 to $2,999 | 127 (5.0%) | 52 (3.6%) |
| $3,000 or more | 267 (10.5%) | 0 (0.0%) |
| Total | 2,550 (100.0%) | 1,438 (100.0%) |
Physical Housing Characteristics in Hillsborough
Housing Structures in Hillsborough
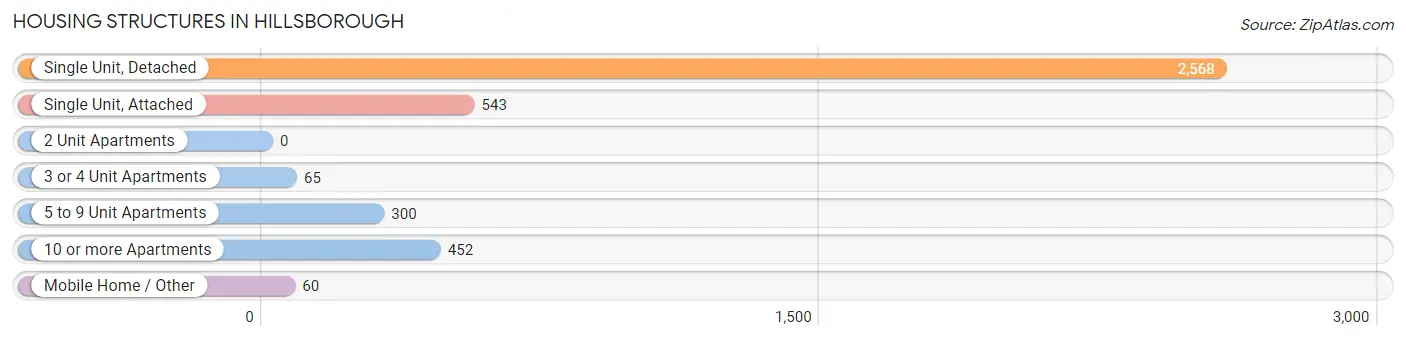
| Structure Type | # Housing Units | % Housing Units |
| Single Unit, Detached | 2,568 | 64.4% |
| Single Unit, Attached | 543 | 13.6% |
| 2 Unit Apartments | 0 | 0.0% |
| 3 or 4 Unit Apartments | 65 | 1.6% |
| 5 to 9 Unit Apartments | 300 | 7.5% |
| 10 or more Apartments | 452 | 11.3% |
| Mobile Home / Other | 60 | 1.5% |
| Total | 3,988 | 100.0% |
Housing Structures by Occupancy in Hillsborough
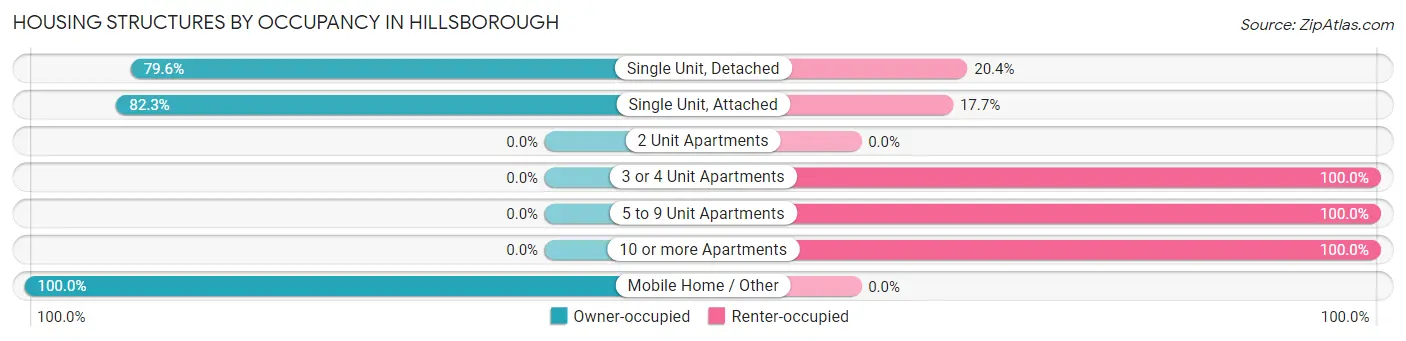
| Structure Type | Owner-occupied | Renter-occupied |
| Single Unit, Detached | 2,043 (79.6%) | 525 (20.4%) |
| Single Unit, Attached | 447 (82.3%) | 96 (17.7%) |
| 2 Unit Apartments | 0 (0.0%) | 0 (0.0%) |
| 3 or 4 Unit Apartments | 0 (0.0%) | 65 (100.0%) |
| 5 to 9 Unit Apartments | 0 (0.0%) | 300 (100.0%) |
| 10 or more Apartments | 0 (0.0%) | 452 (100.0%) |
| Mobile Home / Other | 60 (100.0%) | 0 (0.0%) |
| Total | 2,550 (63.9%) | 1,438 (36.1%) |
Housing Structures by Number of Rooms in Hillsborough
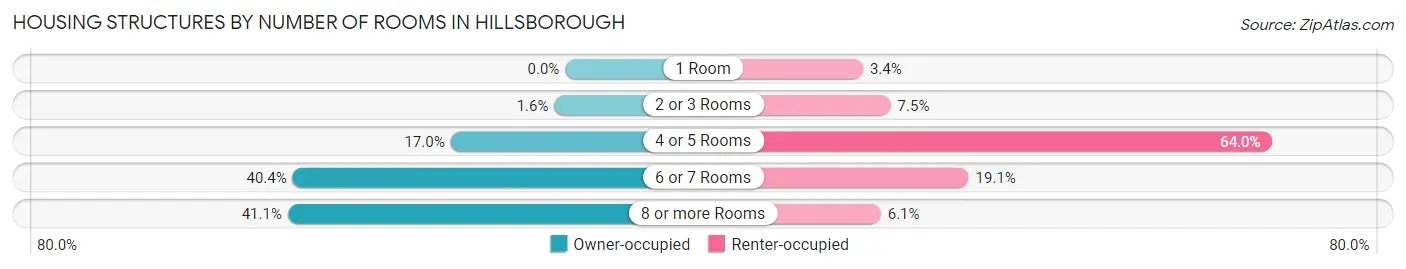
| Number of Rooms | Owner-occupied | Renter-occupied |
| 1 Room | 0 (0.0%) | 49 (3.4%) |
| 2 or 3 Rooms | 41 (1.6%) | 108 (7.5%) |
| 4 or 5 Rooms | 433 (17.0%) | 920 (64.0%) |
| 6 or 7 Rooms | 1,029 (40.4%) | 274 (19.1%) |
| 8 or more Rooms | 1,047 (41.1%) | 87 (6.0%) |
| Total | 2,550 (100.0%) | 1,438 (100.0%) |
Housing Structure by Heating Type in Hillsborough
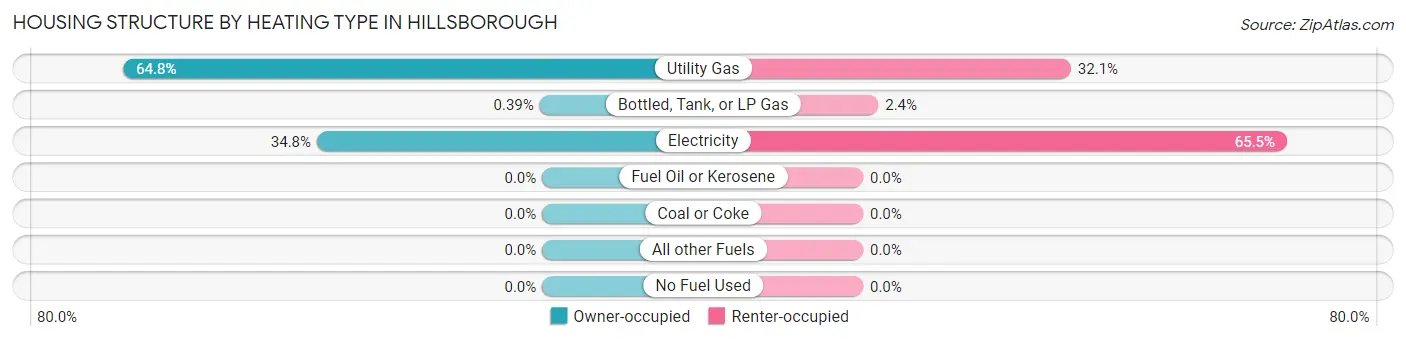
| Heating Type | Owner-occupied | Renter-occupied |
| Utility Gas | 1,652 (64.8%) | 462 (32.1%) |
| Bottled, Tank, or LP Gas | 10 (0.4%) | 34 (2.4%) |
| Electricity | 888 (34.8%) | 942 (65.5%) |
| Fuel Oil or Kerosene | 0 (0.0%) | 0 (0.0%) |
| Coal or Coke | 0 (0.0%) | 0 (0.0%) |
| All other Fuels | 0 (0.0%) | 0 (0.0%) |
| No Fuel Used | 0 (0.0%) | 0 (0.0%) |
| Total | 2,550 (100.0%) | 1,438 (100.0%) |
Household Vehicle Usage in Hillsborough
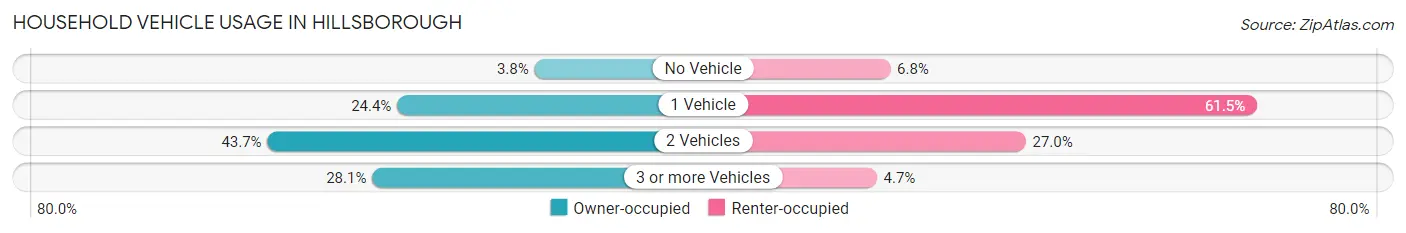
| Vehicles per Household | Owner-occupied | Renter-occupied |
| No Vehicle | 98 (3.8%) | 97 (6.8%) |
| 1 Vehicle | 621 (24.3%) | 885 (61.5%) |
| 2 Vehicles | 1,115 (43.7%) | 388 (27.0%) |
| 3 or more Vehicles | 716 (28.1%) | 68 (4.7%) |
| Total | 2,550 (100.0%) | 1,438 (100.0%) |
Real Estate & Mortgages in Hillsborough
Real Estate and Mortgage Overview in Hillsborough
| Characteristic | Without Mortgage | With Mortgage |
| Housing Units | 664 | 1,886 |
| Median Property Value | $349,500 | $386,000 |
| Median Household Income | $101,250 | $685 |
| Monthly Housing Costs | $653 | $256 |
| Real Estate Taxes | $4,163 | $0 |
Property Value by Mortgage Status in Hillsborough
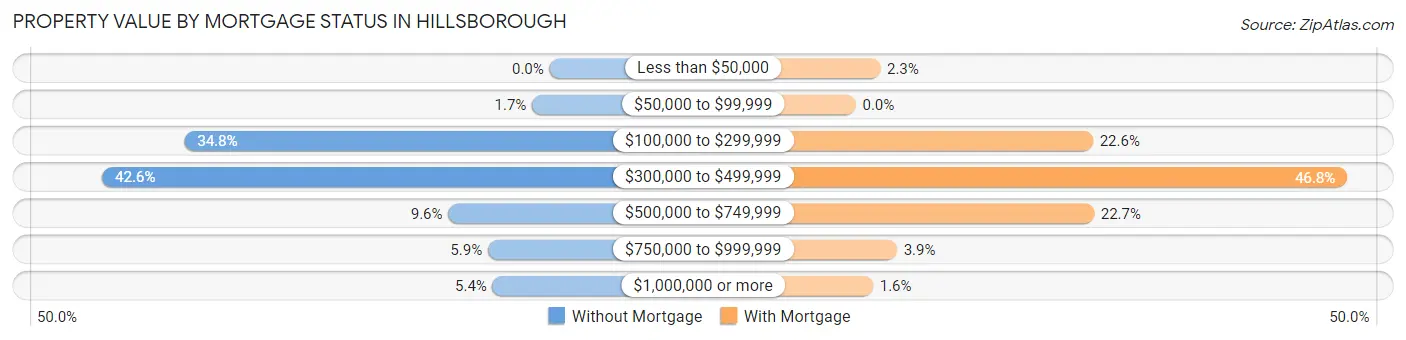
| Property Value | Without Mortgage | With Mortgage |
| Less than $50,000 | 0 (0.0%) | 44 (2.3%) |
| $50,000 to $99,999 | 11 (1.7%) | 0 (0.0%) |
| $100,000 to $299,999 | 231 (34.8%) | 426 (22.6%) |
| $300,000 to $499,999 | 283 (42.6%) | 883 (46.8%) |
| $500,000 to $749,999 | 64 (9.6%) | 428 (22.7%) |
| $750,000 to $999,999 | 39 (5.9%) | 74 (3.9%) |
| $1,000,000 or more | 36 (5.4%) | 31 (1.6%) |
| Total | 664 (100.0%) | 1,886 (100.0%) |
Household Income by Mortgage Status in Hillsborough
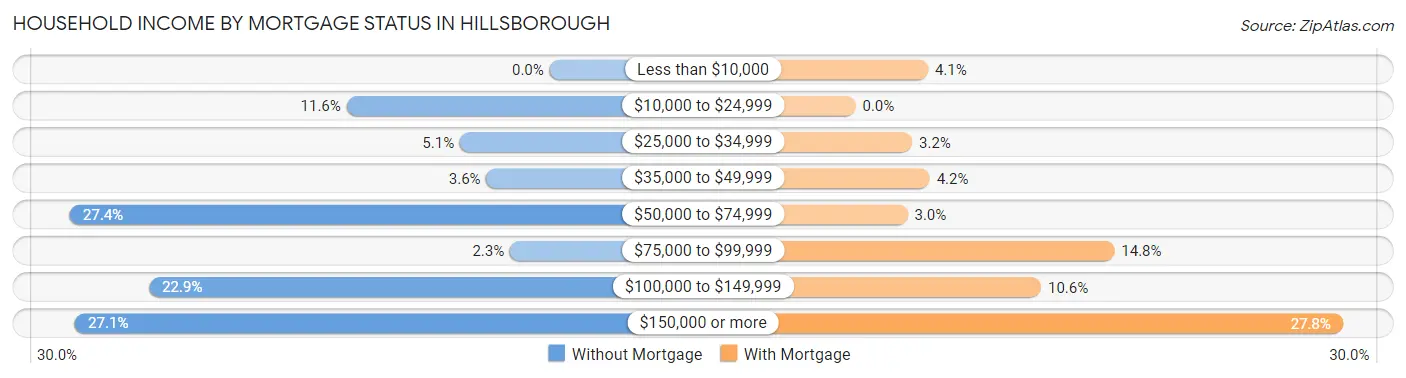
| Household Income | Without Mortgage | With Mortgage |
| Less than $10,000 | 0 (0.0%) | 78 (4.1%) |
| $10,000 to $24,999 | 77 (11.6%) | 0 (0.0%) |
| $25,000 to $34,999 | 34 (5.1%) | 61 (3.2%) |
| $35,000 to $49,999 | 24 (3.6%) | 80 (4.2%) |
| $50,000 to $74,999 | 182 (27.4%) | 56 (3.0%) |
| $75,000 to $99,999 | 15 (2.3%) | 279 (14.8%) |
| $100,000 to $149,999 | 152 (22.9%) | 200 (10.6%) |
| $150,000 or more | 180 (27.1%) | 525 (27.8%) |
| Total | 664 (100.0%) | 1,886 (100.0%) |
Property Value to Household Income Ratio in Hillsborough
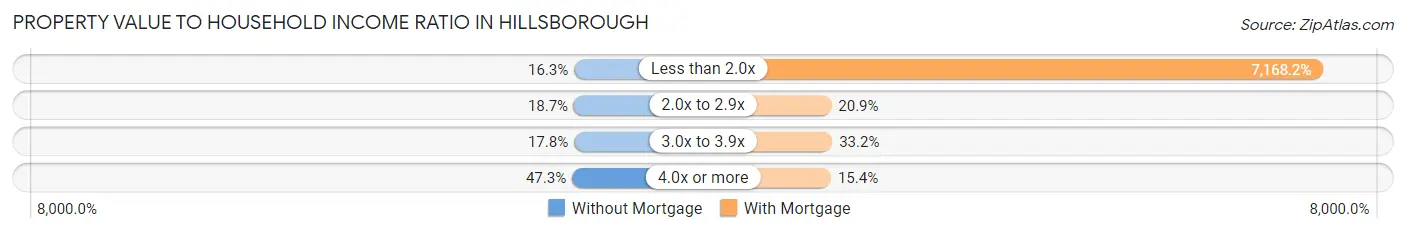
| Value-to-Income Ratio | Without Mortgage | With Mortgage |
| Less than 2.0x | 108 (16.3%) | 135,192 (7,168.2%) |
| 2.0x to 2.9x | 124 (18.7%) | 394 (20.9%) |
| 3.0x to 3.9x | 118 (17.8%) | 627 (33.2%) |
| 4.0x or more | 314 (47.3%) | 291 (15.4%) |
| Total | 664 (100.0%) | 1,886 (100.0%) |
Real Estate Taxes by Mortgage Status in Hillsborough
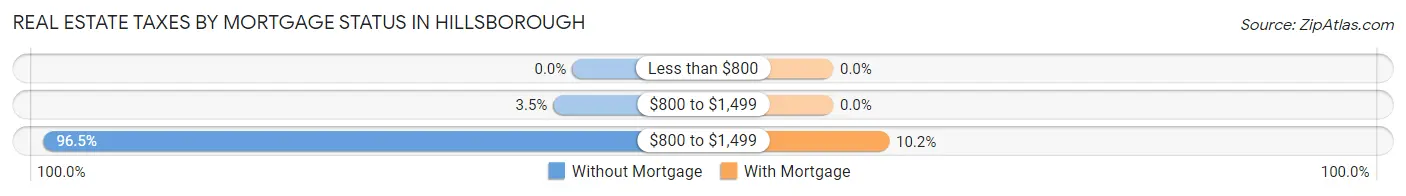
| Property Taxes | Without Mortgage | With Mortgage |
| Less than $800 | 0 (0.0%) | 0 (0.0%) |
| $800 to $1,499 | 23 (3.5%) | 0 (0.0%) |
| $800 to $1,499 | 641 (96.5%) | 193 (10.2%) |
| Total | 664 (100.0%) | 1,886 (100.0%) |
Health & Disability in Hillsborough
Health Insurance Coverage by Age in Hillsborough
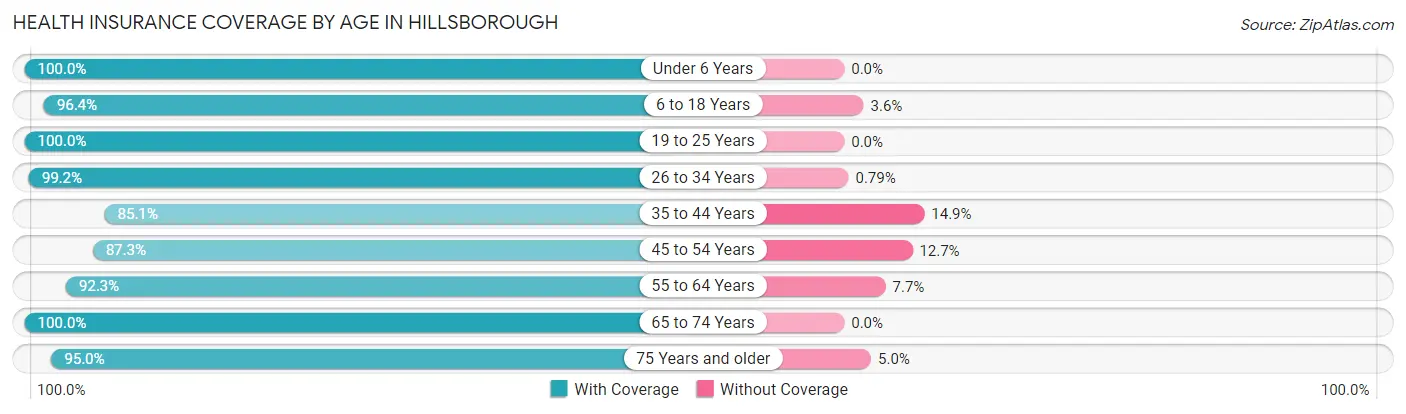
| Age Bracket | With Coverage | Without Coverage |
| Under 6 Years | 683 (100.0%) | 0 (0.0%) |
| 6 to 18 Years | 1,314 (96.4%) | 49 (3.6%) |
| 19 to 25 Years | 325 (100.0%) | 0 (0.0%) |
| 26 to 34 Years | 874 (99.2%) | 7 (0.8%) |
| 35 to 44 Years | 1,271 (85.1%) | 223 (14.9%) |
| 45 to 54 Years | 1,174 (87.3%) | 171 (12.7%) |
| 55 to 64 Years | 1,474 (92.3%) | 123 (7.7%) |
| 65 to 74 Years | 985 (100.0%) | 0 (0.0%) |
| 75 Years and older | 418 (95.0%) | 22 (5.0%) |
| Total | 8,518 (93.5%) | 595 (6.5%) |
Health Insurance Coverage by Citizenship Status in Hillsborough
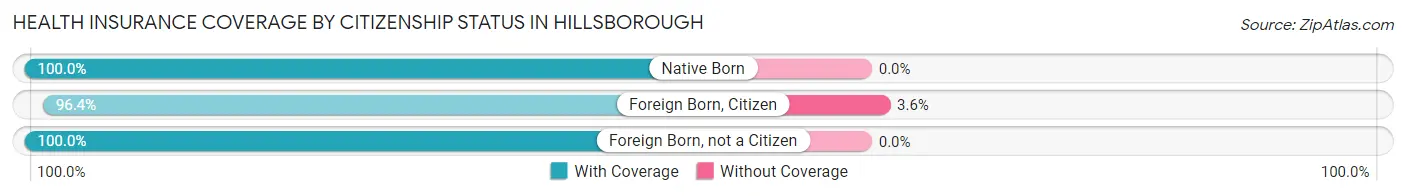
| Citizenship Status | With Coverage | Without Coverage |
| Native Born | 683 (100.0%) | 0 (0.0%) |
| Foreign Born, Citizen | 1,314 (96.4%) | 49 (3.6%) |
| Foreign Born, not a Citizen | 325 (100.0%) | 0 (0.0%) |
Health Insurance Coverage by Household Income in Hillsborough
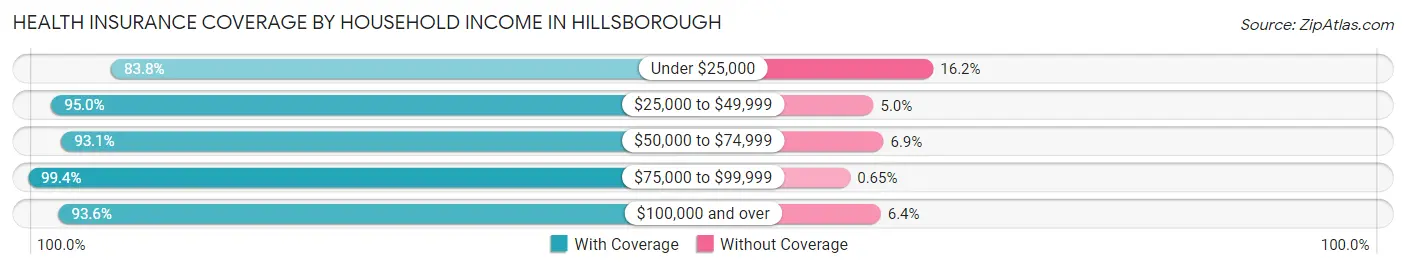
| Household Income | With Coverage | Without Coverage |
| Under $25,000 | 656 (83.8%) | 127 (16.2%) |
| $25,000 to $49,999 | 644 (95.0%) | 34 (5.0%) |
| $50,000 to $74,999 | 1,488 (93.1%) | 110 (6.9%) |
| $75,000 to $99,999 | 1,064 (99.4%) | 7 (0.6%) |
| $100,000 and over | 4,660 (93.6%) | 317 (6.4%) |
Public vs Private Health Insurance Coverage by Age in Hillsborough
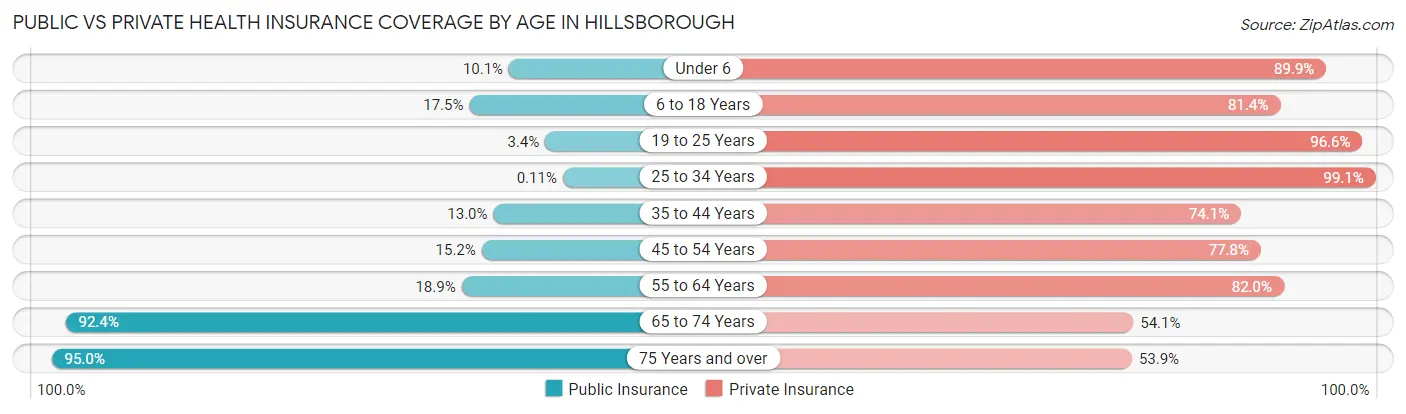
| Age Bracket | Public Insurance | Private Insurance |
| Under 6 | 69 (10.1%) | 614 (89.9%) |
| 6 to 18 Years | 238 (17.5%) | 1,109 (81.4%) |
| 19 to 25 Years | 11 (3.4%) | 314 (96.6%) |
| 25 to 34 Years | 1 (0.1%) | 873 (99.1%) |
| 35 to 44 Years | 194 (13.0%) | 1,107 (74.1%) |
| 45 to 54 Years | 204 (15.2%) | 1,046 (77.8%) |
| 55 to 64 Years | 302 (18.9%) | 1,310 (82.0%) |
| 65 to 74 Years | 910 (92.4%) | 533 (54.1%) |
| 75 Years and over | 418 (95.0%) | 237 (53.9%) |
| Total | 2,347 (25.8%) | 7,143 (78.4%) |
Disability Status by Sex by Age in Hillsborough
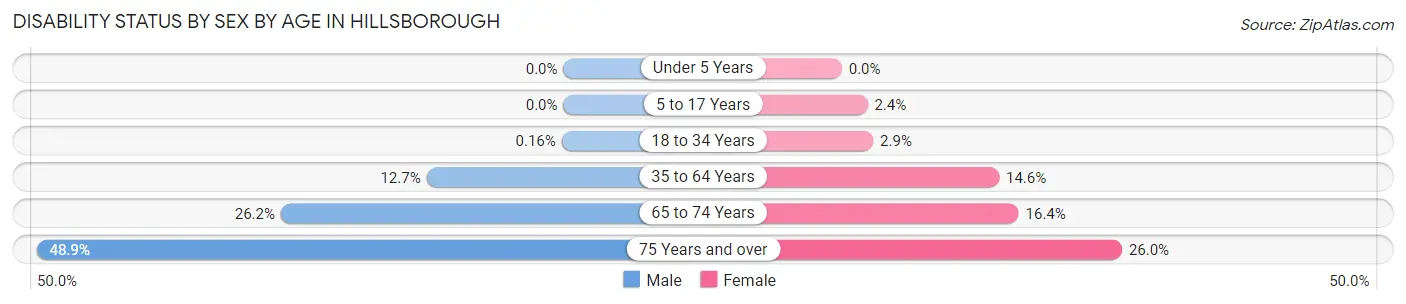
| Age Bracket | Male | Female |
| Under 5 Years | 0 (0.0%) | 0 (0.0%) |
| 5 to 17 Years | 0 (0.0%) | 19 (2.4%) |
| 18 to 34 Years | 1 (0.2%) | 18 (2.9%) |
| 35 to 64 Years | 263 (12.7%) | 345 (14.6%) |
| 65 to 74 Years | 124 (26.2%) | 84 (16.4%) |
| 75 Years and over | 44 (48.9%) | 91 (26.0%) |
Disability Class by Sex by Age in Hillsborough
Disability Class: Hearing Difficulty
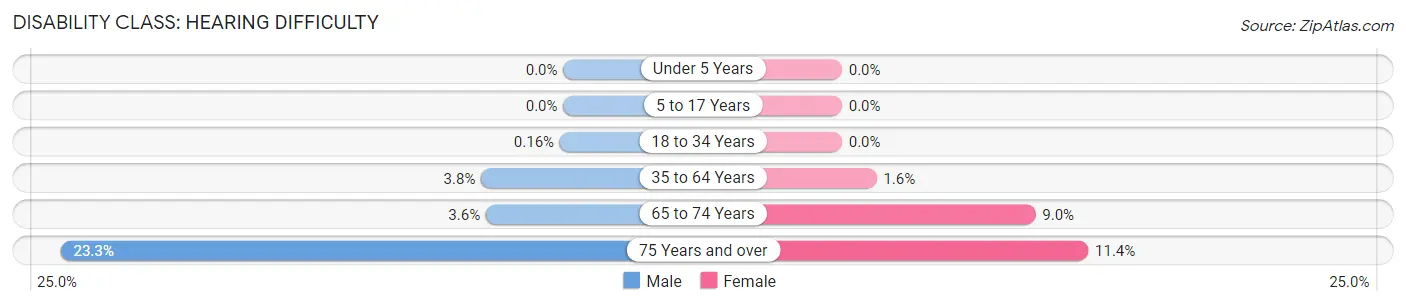
| Age Bracket | Male | Female |
| Under 5 Years | 0 (0.0%) | 0 (0.0%) |
| 5 to 17 Years | 0 (0.0%) | 0 (0.0%) |
| 18 to 34 Years | 1 (0.2%) | 0 (0.0%) |
| 35 to 64 Years | 79 (3.8%) | 38 (1.6%) |
| 65 to 74 Years | 17 (3.6%) | 46 (9.0%) |
| 75 Years and over | 21 (23.3%) | 40 (11.4%) |
Disability Class: Vision Difficulty
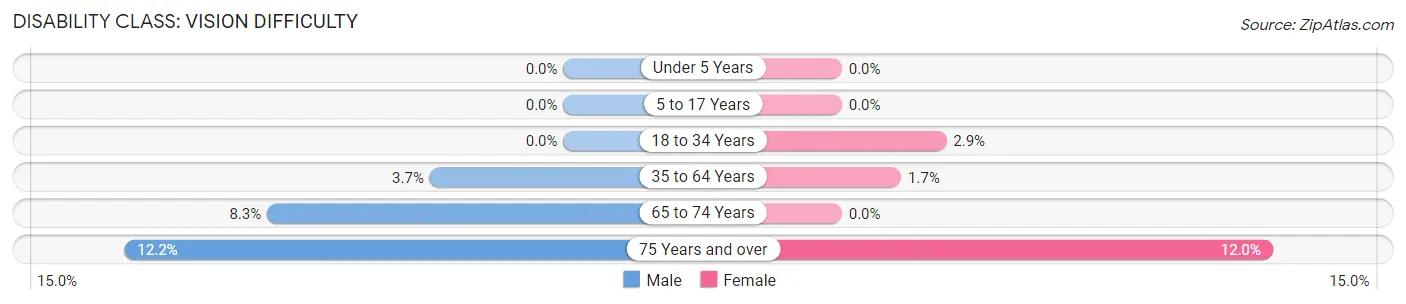
| Age Bracket | Male | Female |
| Under 5 Years | 0 (0.0%) | 0 (0.0%) |
| 5 to 17 Years | 0 (0.0%) | 0 (0.0%) |
| 18 to 34 Years | 0 (0.0%) | 18 (2.9%) |
| 35 to 64 Years | 77 (3.7%) | 39 (1.7%) |
| 65 to 74 Years | 39 (8.3%) | 0 (0.0%) |
| 75 Years and over | 11 (12.2%) | 42 (12.0%) |
Disability Class: Cognitive Difficulty
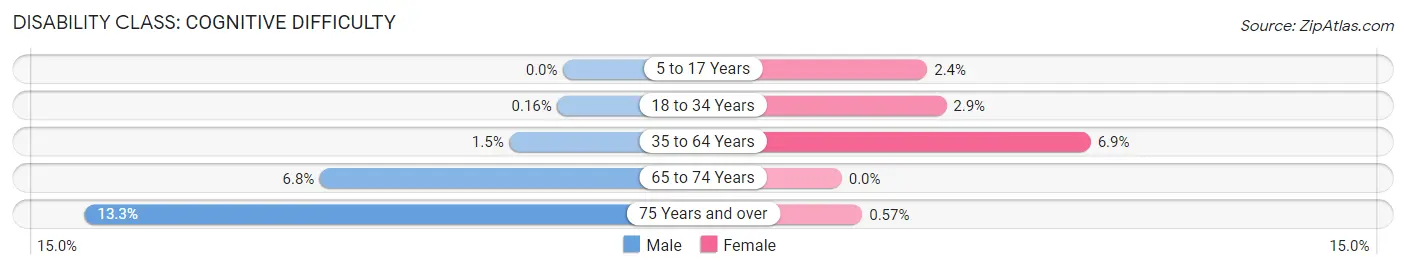
| Age Bracket | Male | Female |
| 5 to 17 Years | 0 (0.0%) | 19 (2.4%) |
| 18 to 34 Years | 1 (0.2%) | 18 (2.9%) |
| 35 to 64 Years | 31 (1.5%) | 164 (6.9%) |
| 65 to 74 Years | 32 (6.8%) | 0 (0.0%) |
| 75 Years and over | 12 (13.3%) | 2 (0.6%) |
Disability Class: Ambulatory Difficulty
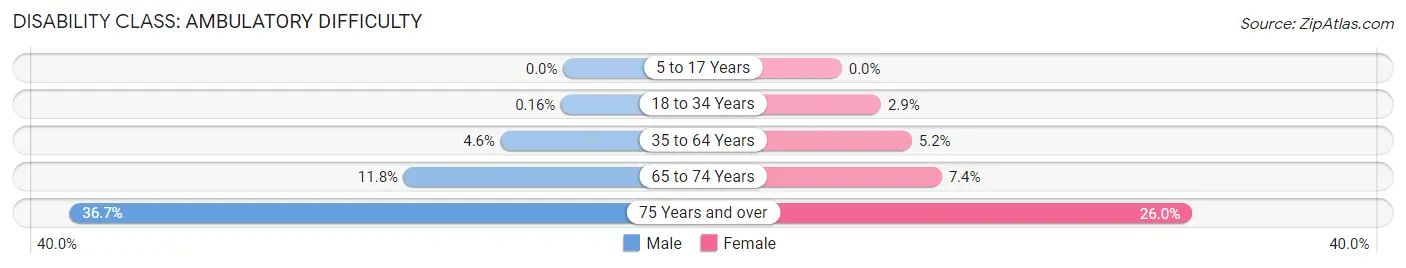
| Age Bracket | Male | Female |
| 5 to 17 Years | 0 (0.0%) | 0 (0.0%) |
| 18 to 34 Years | 1 (0.2%) | 18 (2.9%) |
| 35 to 64 Years | 96 (4.6%) | 123 (5.2%) |
| 65 to 74 Years | 56 (11.8%) | 38 (7.4%) |
| 75 Years and over | 33 (36.7%) | 91 (26.0%) |
Disability Class: Self-Care Difficulty
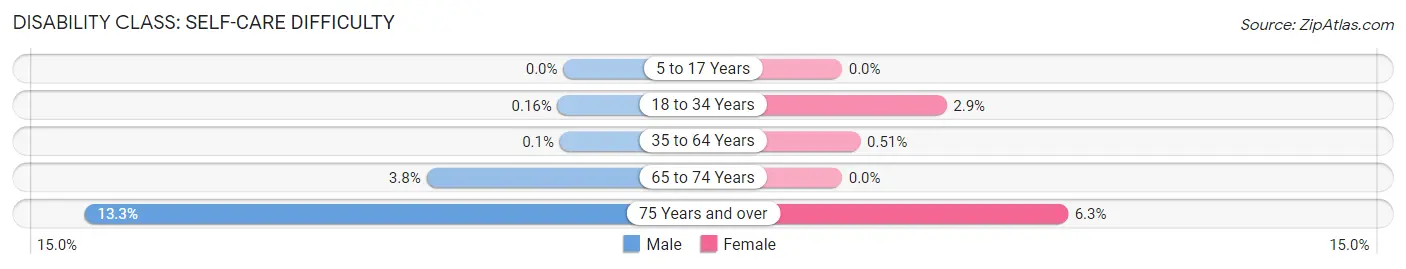
| Age Bracket | Male | Female |
| 5 to 17 Years | 0 (0.0%) | 0 (0.0%) |
| 18 to 34 Years | 1 (0.2%) | 18 (2.9%) |
| 35 to 64 Years | 2 (0.1%) | 12 (0.5%) |
| 65 to 74 Years | 18 (3.8%) | 0 (0.0%) |
| 75 Years and over | 12 (13.3%) | 22 (6.3%) |
Technology Access in Hillsborough
Computing Device Access in Hillsborough
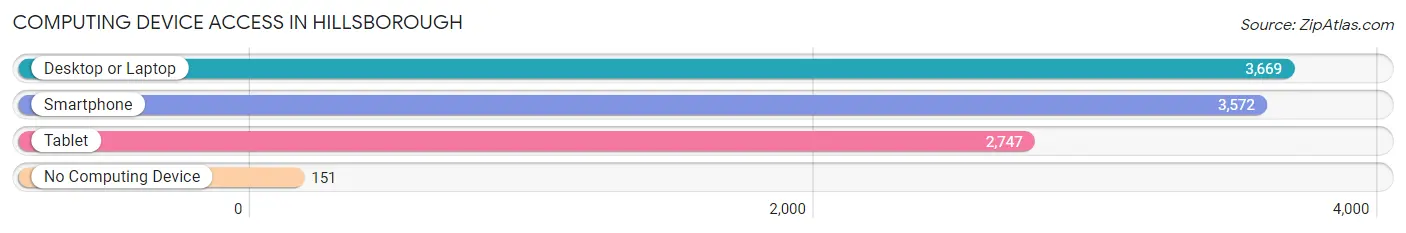
| Device Type | # Households | % Households |
| Desktop or Laptop | 3,669 | 92.0% |
| Smartphone | 3,572 | 89.6% |
| Tablet | 2,747 | 68.9% |
| No Computing Device | 151 | 3.8% |
| Total | 3,988 | 100.0% |
Internet Access in Hillsborough
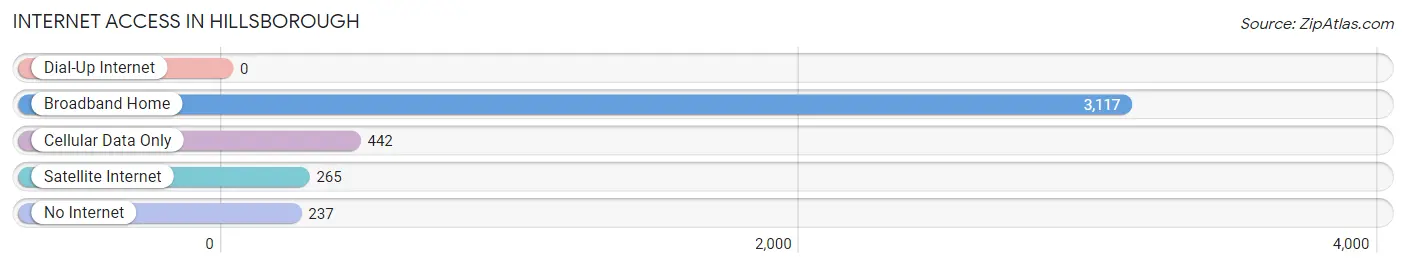
| Internet Type | # Households | % Households |
| Dial-Up Internet | 0 | 0.0% |
| Broadband Home | 3,117 | 78.2% |
| Cellular Data Only | 442 | 11.1% |
| Satellite Internet | 265 | 6.6% |
| No Internet | 237 | 5.9% |
| Total | 3,988 | 100.0% |
Hillsborough Summary
Hillsborough, North Carolina is a small town located in Orange County, North Carolina. It is situated in the Piedmont region of the state, about 25 miles northwest of Raleigh. The town has a population of 6,087 as of the 2010 census, and is the county seat of Orange County.
Geography
Hillsborough is located in the Piedmont region of North Carolina, about 25 miles northwest of Raleigh. The town is situated on the Eno River, which flows through the town and is a tributary of the Neuse River. The town is surrounded by rolling hills and is located in the foothills of the Blue Ridge Mountains. The town has a total area of 4.2 square miles, all of which is land.
History
Hillsborough was founded in 1754 by William Churton, a surveyor from England. The town was named after the Earl of Hillsborough, who was the British Secretary of State for the Colonies at the time. The town was originally a trading post and was the site of the first Orange County Courthouse. During the Revolutionary War, Hillsborough was the site of several battles, including the Battle of Hillsborough in 1781.
In the 19th century, Hillsborough became an important center for the textile industry. The town was also the site of the first public school in Orange County, which was established in 1845. In the late 19th century, the town became a popular tourist destination, and many of the town's historic buildings were built during this period.
Economy
Hillsborough's economy is largely based on tourism and the service industry. The town is home to several historic sites, including the Ayr Mount Plantation, the Occoneechee Speedway, and the Orange County Historical Museum. The town is also home to several wineries, breweries, and distilleries, as well as several restaurants and shops.
The town is also home to several manufacturing companies, including Hillsborough Furniture, which produces furniture for the hospitality industry, and Hillsborough Plastics, which produces plastic products. The town is also home to several technology companies, including the software company, Red Hat.
Demographics
As of the 2010 census, Hillsborough had a population of 6,087. The racial makeup of the town was 79.2% White, 14.2% African American, 0.4% Native American, 1.7% Asian, 0.1% Pacific Islander, and 4.4% from other races. Hispanic or Latino of any race were 8.2% of the population.
The median household income in Hillsborough was $45,945, and the median family income was $54,945. The per capita income for the town was $25,945. About 11.2% of families and 14.2% of the population were below the poverty line, including 19.2% of those under age 18 and 8.2% of those age 65 or over.
Conclusion
Hillsborough, North Carolina is a small town located in Orange County, North Carolina. It is situated in the Piedmont region of the state, about 25 miles northwest of Raleigh. The town has a population of 6,087 as of the 2010 census, and is the county seat of Orange County. The town's economy is largely based on tourism and the service industry, and it is home to several historic sites, wineries, breweries, and distilleries. The town also has several manufacturing companies, and technology companies, such as Red Hat. The racial makeup of the town is 79.2% White, 14.2% African American, 0.4% Native American, 1.7% Asian, 0.1% Pacific Islander, and 4.4% from other races. The median household income in Hillsborough was $45,945, and the median family income was $54,945. About 11.2% of families and 14.2% of the population were below the poverty line.
Common Questions
What is Per Capita Income in Hillsborough?
Per Capita income in Hillsborough is $50,500.
What is the Median Family Income in Hillsborough?
Median Family Income in Hillsborough is $127,625.
What is the Median Household income in Hillsborough?
Median Household Income in Hillsborough is $86,250.
What is Income or Wage Gap in Hillsborough?
Income or Wage Gap in Hillsborough is 14.8%.
Women in Hillsborough earn 85.2 cents for every dollar earned by a man.
What is Inequality or Gini Index in Hillsborough?
Inequality or Gini Index in Hillsborough is 0.46.
What is the Total Population of Hillsborough?
Total Population of Hillsborough is 9,534.
What is the Total Male Population of Hillsborough?
Total Male Population of Hillsborough is 4,617.
What is the Total Female Population of Hillsborough?
Total Female Population of Hillsborough is 4,917.
What is the Ratio of Males per 100 Females in Hillsborough?
There are 93.90 Males per 100 Females in Hillsborough.
What is the Ratio of Females per 100 Males in Hillsborough?
There are 106.50 Females per 100 Males in Hillsborough.
What is the Median Population Age in Hillsborough?
Median Population Age in Hillsborough is 44.1 Years.
What is the Average Family Size in Hillsborough
Average Family Size in Hillsborough is 2.9 People.
What is the Average Household Size in Hillsborough
Average Household Size in Hillsborough is 2.3 People.
How Large is the Labor Force in Hillsborough?
There are 4,950 People in the Labor Forcein in Hillsborough.
What is the Percentage of People in the Labor Force in Hillsborough?
63.7% of People are in the Labor Force in Hillsborough.
What is the Unemployment Rate in Hillsborough?
Unemployment Rate in Hillsborough is 7.2%.