Frazier Park, CA Map & Demographics
Frazier Park Map
Frazier Park Overview
$27,942
PER CAPITA INCOME
$52,736
AVG FAMILY INCOME
$39,211
AVG HOUSEHOLD INCOME
0.59
INEQUALITY / GINI INDEX
2,719
TOTAL POPULATION
1,416
MALE POPULATION
1,303
FEMALE POPULATION
108.67
MALES / 100 FEMALES
92.02
FEMALES / 100 MALES
45.6
MEDIAN AGE
2.8
AVG FAMILY SIZE
2.3
AVG HOUSEHOLD SIZE
1,439
LABOR FORCE [ PEOPLE ]
58.5%
PERCENT IN LABOR FORCE
9.9%
UNEMPLOYMENT RATE
Frazier Park Zip Codes
Income in Frazier Park
Income Overview in Frazier Park
Per Capita Income in Frazier Park is $27,942, while median incomes of families and households are $52,736 and $39,211 respectively.
| Characteristic | Number | Measure |
| Per Capita Income | 2,719 | $27,942 |
| Median Family Income | 669 | $52,736 |
| Mean Family Income | 669 | $79,483 |
| Median Household Income | 1,168 | $39,211 |
| Mean Household Income | 1,168 | $67,291 |
| Income Deficit | 669 | $0 |
| Wage / Income Gap (%) | 2,719 | 0.00% |
| Wage / Income Gap ($) | 2,719 | 100.00¢ per $1 |
| Gini / Inequality Index | 2,719 | 0.59 |
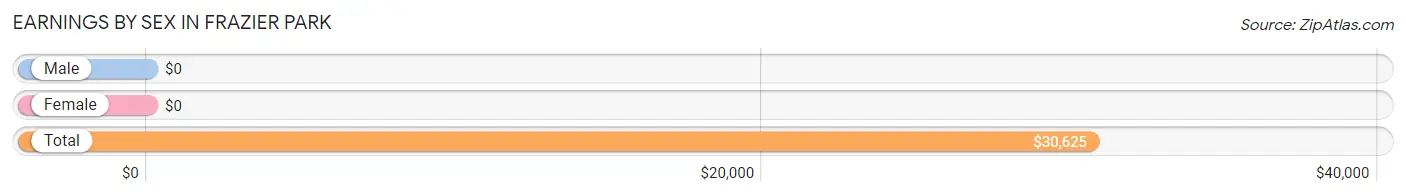
Earnings by Sex in Frazier Park
| Sex | Number | Average Earnings |
| Male | 766 (49.7%) | $0 |
| Female | 775 (50.3%) | $0 |
| Total | 1,541 (100.0%) | $30,625 |
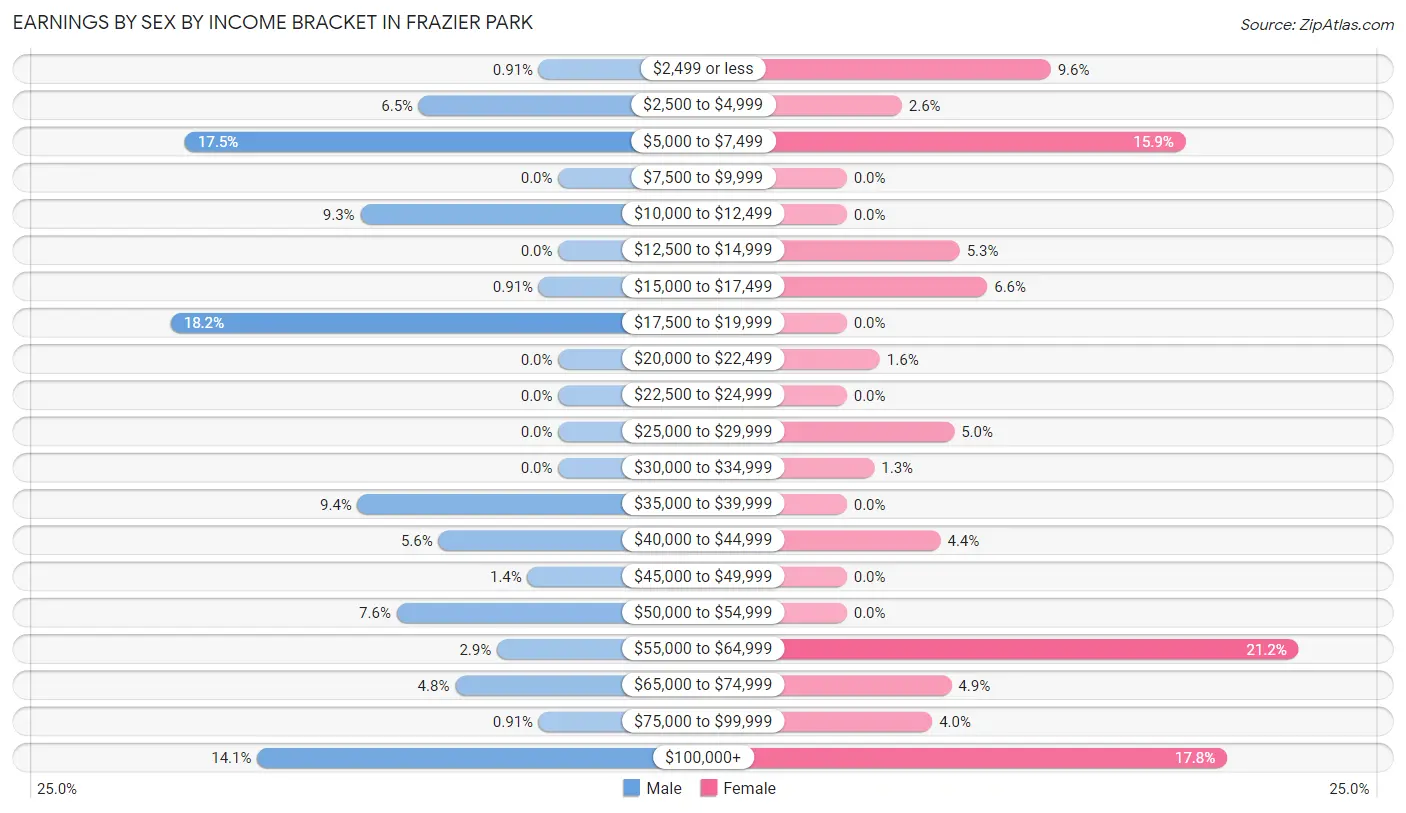
Earnings by Sex by Income Bracket in Frazier Park
The most common earnings brackets in Frazier Park are $17,500 to $19,999 for men (139 | 18.1%) and $55,000 to $64,999 for women (164 | 21.2%).
| Income | Male | Female |
| $2,499 or less | 7 (0.9%) | 74 (9.6%) |
| $2,500 to $4,999 | 50 (6.5%) | 20 (2.6%) |
| $5,000 to $7,499 | 134 (17.5%) | 123 (15.9%) |
| $7,500 to $9,999 | 0 (0.0%) | 0 (0.0%) |
| $10,000 to $12,499 | 71 (9.3%) | 0 (0.0%) |
| $12,500 to $14,999 | 0 (0.0%) | 41 (5.3%) |
| $15,000 to $17,499 | 7 (0.9%) | 51 (6.6%) |
| $17,500 to $19,999 | 139 (18.1%) | 0 (0.0%) |
| $20,000 to $22,499 | 0 (0.0%) | 12 (1.5%) |
| $22,500 to $24,999 | 0 (0.0%) | 0 (0.0%) |
| $25,000 to $29,999 | 0 (0.0%) | 39 (5.0%) |
| $30,000 to $34,999 | 0 (0.0%) | 10 (1.3%) |
| $35,000 to $39,999 | 72 (9.4%) | 0 (0.0%) |
| $40,000 to $44,999 | 43 (5.6%) | 34 (4.4%) |
| $45,000 to $49,999 | 11 (1.4%) | 0 (0.0%) |
| $50,000 to $54,999 | 58 (7.6%) | 0 (0.0%) |
| $55,000 to $64,999 | 22 (2.9%) | 164 (21.2%) |
| $65,000 to $74,999 | 37 (4.8%) | 38 (4.9%) |
| $75,000 to $99,999 | 7 (0.9%) | 31 (4.0%) |
| $100,000+ | 108 (14.1%) | 138 (17.8%) |
| Total | 766 (100.0%) | 775 (100.0%) |
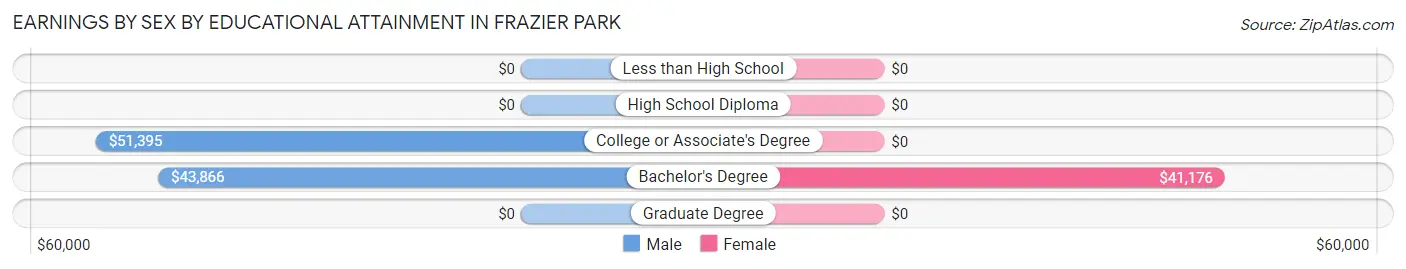
Earnings by Sex by Educational Attainment in Frazier Park
Average earnings in Frazier Park are $46,023 for men and $59,043 for women, a difference of 22.1%. Men with an educational attainment of college or associate's degree enjoy the highest average annual earnings of $51,395, while those with bachelor's degree education earn the least with $43,866. Women with an educational attainment of bachelor's degree earn the most with the average annual earnings of $41,176, while those with bachelor's degree education have the smallest earnings of $41,176.
| Educational Attainment | Male Income | Female Income |
| Less than High School | - | - |
| High School Diploma | - | - |
| College or Associate's Degree | $51,395 | $0 |
| Bachelor's Degree | $43,866 | $41,176 |
| Graduate Degree | - | - |
| Total | $46,023 | $59,043 |
Family Income in Frazier Park
Family Income Brackets in Frazier Park
According to the Frazier Park family income data, there are 124 families falling into the $50,000 to $74,999 income range, which is the most common income bracket and makes up 18.5% of all families. Conversely, the $10,000 to $14,999 income bracket is the least frequent group with only 18 families (2.7%) belonging to this category.
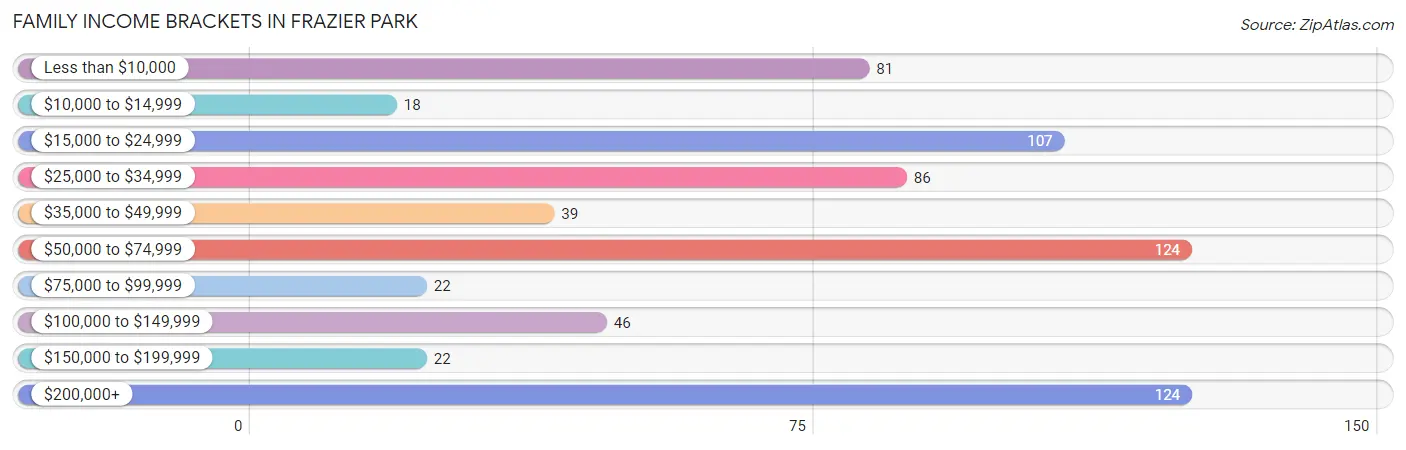
| Income Bracket | # Families | % Families |
| Less than $10,000 | 81 | 12.1% |
| $10,000 to $14,999 | 18 | 2.7% |
| $15,000 to $24,999 | 107 | 16.0% |
| $25,000 to $34,999 | 86 | 12.9% |
| $35,000 to $49,999 | 39 | 5.8% |
| $50,000 to $74,999 | 124 | 18.5% |
| $75,000 to $99,999 | 22 | 3.3% |
| $100,000 to $149,999 | 46 | 6.9% |
| $150,000 to $199,999 | 22 | 3.3% |
| $200,000+ | 124 | 18.5% |
Family Income by Famaliy Size in Frazier Park
3-person families (189 | 28.2%) account for the highest median family income in Frazier Park with $228,095 per family, while 3-person families (189 | 28.2%) have the highest median income of $76,032 per family member.
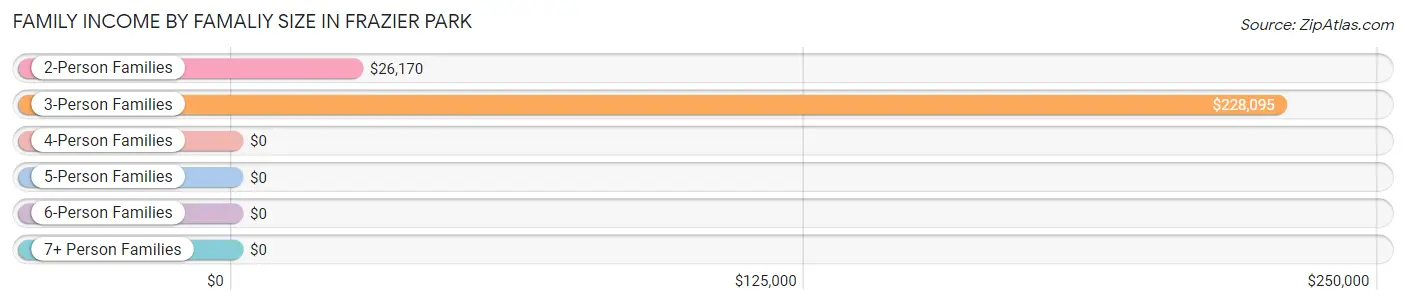
| Income Bracket | # Families | Median Income |
| 2-Person Families | 354 (52.9%) | $26,170 |
| 3-Person Families | 189 (28.2%) | $228,095 |
| 4-Person Families | 87 (13.0%) | $0 |
| 5-Person Families | 39 (5.8%) | $0 |
| 6-Person Families | 0 (0.0%) | $0 |
| 7+ Person Families | 0 (0.0%) | $0 |
| Total | 669 (100.0%) | $52,736 |
Family Income by Number of Earners in Frazier Park
The median family income in Frazier Park is $52,736, with families comprising 3+ earners (146) having the highest median family income of $228,528, while families with no earners (209) have the lowest median family income of $15,362, accounting for 21.8% and 31.2% of families, respectively.
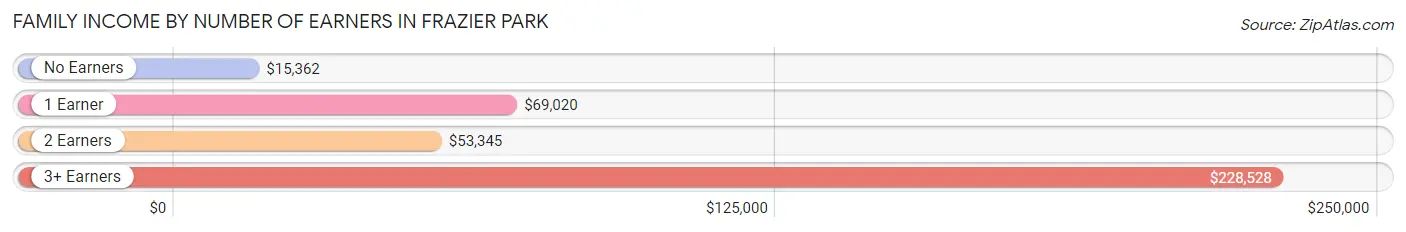
| Number of Earners | # Families | Median Income |
| No Earners | 209 (31.2%) | $15,362 |
| 1 Earner | 113 (16.9%) | $69,020 |
| 2 Earners | 201 (30.0%) | $53,345 |
| 3+ Earners | 146 (21.8%) | $228,528 |
| Total | 669 (100.0%) | $52,736 |
Household Income in Frazier Park
Household Income Brackets in Frazier Park
With 193 households falling in the category, the less than $10,000 income range is the most frequent in Frazier Park, accounting for 16.5% of all households. In contrast, only 8 households (0.7%) fall into the $150,000 to $199,999 income bracket, making it the least populous group.
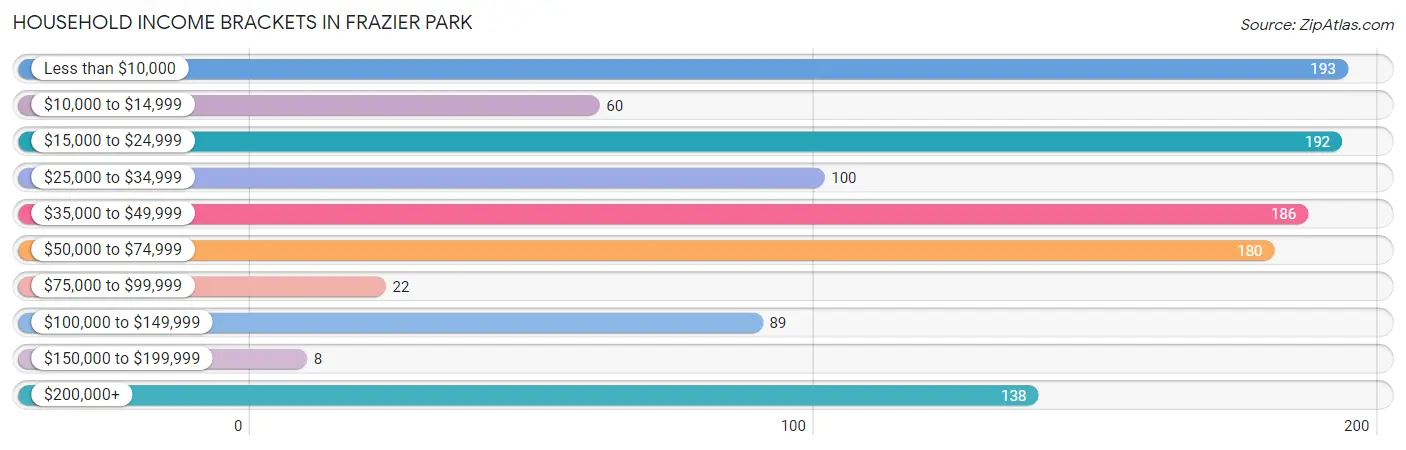
| Income Bracket | # Households | % Households |
| Less than $10,000 | 193 | 16.5% |
| $10,000 to $14,999 | 60 | 5.1% |
| $15,000 to $24,999 | 192 | 16.4% |
| $25,000 to $34,999 | 100 | 8.6% |
| $35,000 to $49,999 | 186 | 15.9% |
| $50,000 to $74,999 | 180 | 15.4% |
| $75,000 to $99,999 | 22 | 1.9% |
| $100,000 to $149,999 | 89 | 7.6% |
| $150,000 to $199,999 | 8 | 0.7% |
| $200,000+ | 138 | 11.8% |
Household Income by Householder Age in Frazier Park
The median household income in Frazier Park is $39,211, with the highest median household income of $60,096 found in the 45 to 64 years age bracket for the primary householder. A total of 665 households (56.9%) fall into this category. Meanwhile, the 15 to 24 years age bracket for the primary householder has the lowest median household income of $0, with 74 households (6.3%) in this group.
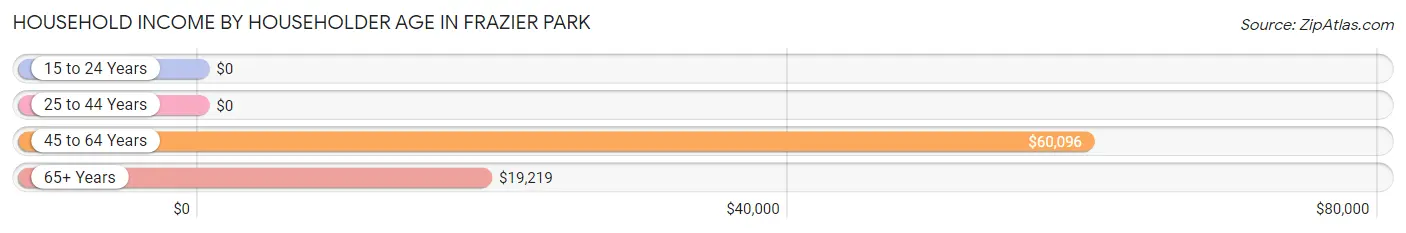
| Income Bracket | # Households | Median Income |
| 15 to 24 Years | 74 (6.3%) | $0 |
| 25 to 44 Years | 157 (13.4%) | $0 |
| 45 to 64 Years | 665 (56.9%) | $60,096 |
| 65+ Years | 272 (23.3%) | $19,219 |
| Total | 1,168 (100.0%) | $39,211 |
Poverty in Frazier Park
Income Below Poverty by Sex and Age in Frazier Park
With 37.9% poverty level for males and 33.5% for females among the residents of Frazier Park, under 5 year old males and 65 to 74 year old females are the most vulnerable to poverty, with 50 males (100.0%) and 70 females (64.2%) in their respective age groups living below the poverty level.

| Age Bracket | Male | Female |
| Under 5 Years | 50 (100.0%) | 0 (0.0%) |
| 5 Years | 0 (0.0%) | 0 (0.0%) |
| 6 to 11 Years | 0 (0.0%) | 0 (0.0%) |
| 12 to 14 Years | 98 (100.0%) | 47 (42.0%) |
| 15 Years | 0 (0.0%) | 0 (0.0%) |
| 16 and 17 Years | 0 (0.0%) | 36 (50.7%) |
| 18 to 24 Years | 52 (17.5%) | 78 (63.4%) |
| 25 to 34 Years | 134 (100.0%) | 32 (43.8%) |
| 35 to 44 Years | 45 (26.0%) | 9 (7.4%) |
| 45 to 54 Years | 42 (30.7%) | 147 (33.8%) |
| 55 to 64 Years | 0 (0.0%) | 18 (8.0%) |
| 65 to 74 Years | 115 (56.1%) | 70 (64.2%) |
| 75 Years and over | 0 (0.0%) | 0 (0.0%) |
| Total | 536 (37.9%) | 437 (33.5%) |
Income Above Poverty by Sex and Age in Frazier Park
According to the poverty statistics in Frazier Park, males aged 16 and 17 years and females aged 75 years and over are the age groups that are most secure financially, with 100.0% of males and 100.0% of females in these age groups living above the poverty line.
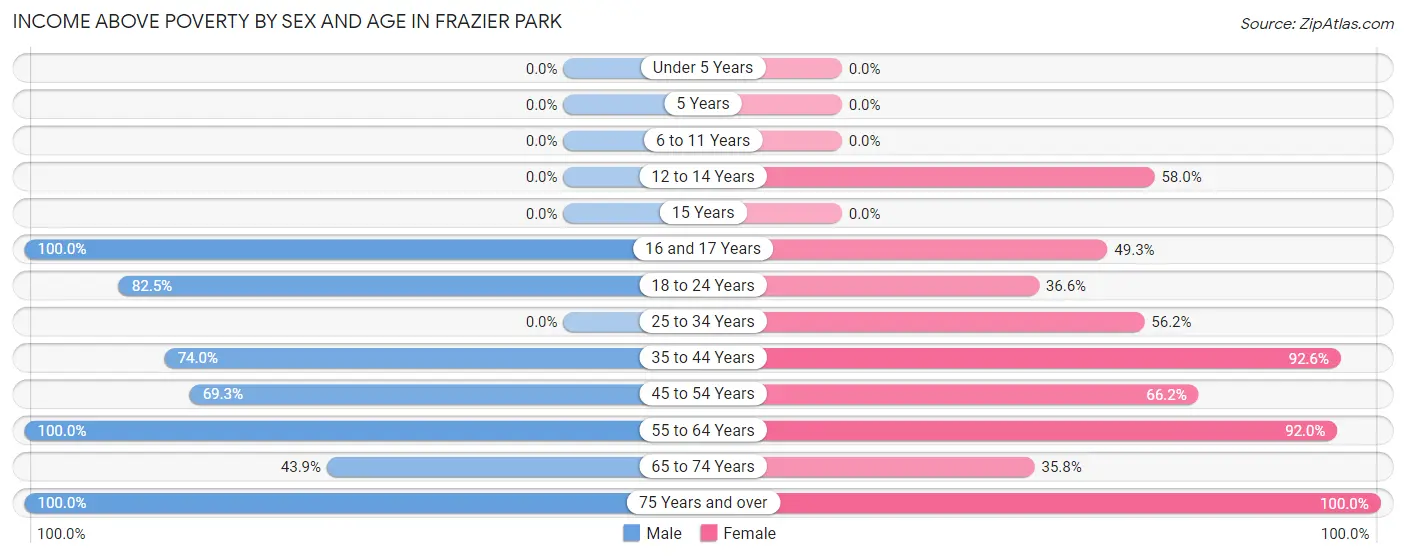
| Age Bracket | Male | Female |
| Under 5 Years | 0 (0.0%) | 0 (0.0%) |
| 5 Years | 0 (0.0%) | 0 (0.0%) |
| 6 to 11 Years | 0 (0.0%) | 0 (0.0%) |
| 12 to 14 Years | 0 (0.0%) | 65 (58.0%) |
| 15 Years | 0 (0.0%) | 0 (0.0%) |
| 16 and 17 Years | 44 (100.0%) | 35 (49.3%) |
| 18 to 24 Years | 245 (82.5%) | 45 (36.6%) |
| 25 to 34 Years | 0 (0.0%) | 41 (56.2%) |
| 35 to 44 Years | 128 (74.0%) | 113 (92.6%) |
| 45 to 54 Years | 95 (69.3%) | 288 (66.2%) |
| 55 to 64 Years | 211 (100.0%) | 206 (92.0%) |
| 65 to 74 Years | 90 (43.9%) | 39 (35.8%) |
| 75 Years and over | 67 (100.0%) | 34 (100.0%) |
| Total | 880 (62.2%) | 866 (66.5%) |
Income Below Poverty Among Married-Couple Families in Frazier Park
The poverty statistics for married-couple families in Frazier Park show that 16.1% or 71 of the total 442 families live below the poverty line. Families with no children have the highest poverty rate of 18.4%, comprising of 71 families. On the other hand, families with 1 or 2 children have the lowest poverty rate of 0.0%, which includes 0 families.
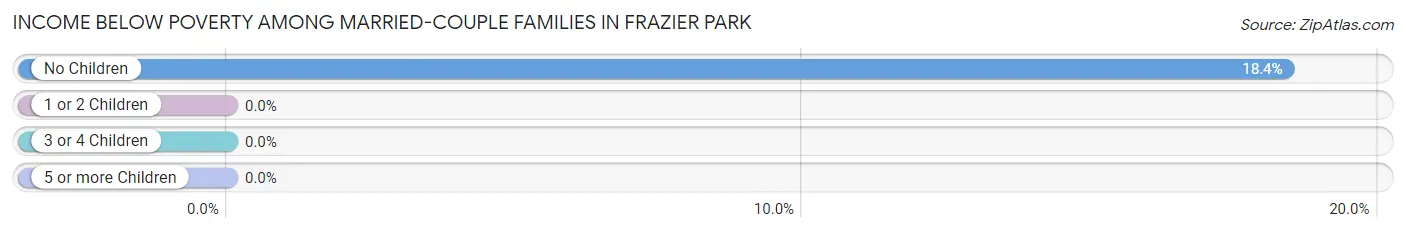
| Children | Above Poverty | Below Poverty |
| No Children | 315 (81.6%) | 71 (18.4%) |
| 1 or 2 Children | 56 (100.0%) | 0 (0.0%) |
| 3 or 4 Children | 0 (0.0%) | 0 (0.0%) |
| 5 or more Children | 0 (0.0%) | 0 (0.0%) |
| Total | 371 (83.9%) | 71 (16.1%) |
Income Below Poverty Among Single-Parent Households in Frazier Park
According to the poverty data in Frazier Park, 100.0% or 42 single-father households and 51.9% or 96 single-mother households are living below the poverty line. Among single-father households, those with 1 or 2 children have the highest poverty rate, with 42 households (100.0%) experiencing poverty. Likewise, among single-mother households, those with 3 or 4 children have the highest poverty rate, with 39 households (100.0%) falling below the poverty line.
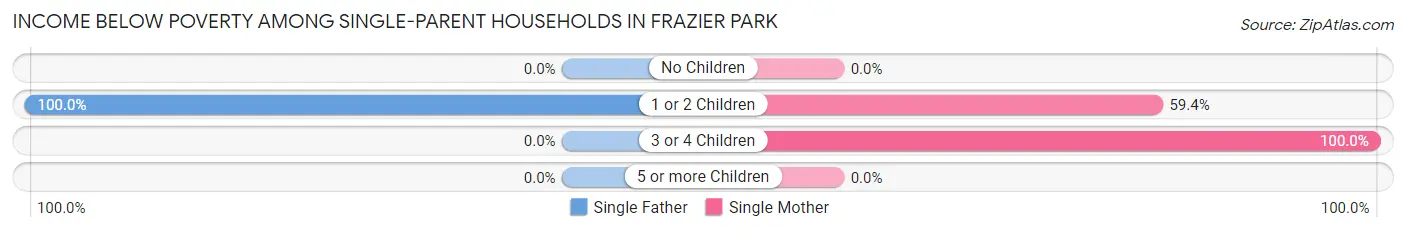
| Children | Single Father | Single Mother |
| No Children | 0 (0.0%) | 0 (0.0%) |
| 1 or 2 Children | 42 (100.0%) | 57 (59.4%) |
| 3 or 4 Children | 0 (0.0%) | 39 (100.0%) |
| 5 or more Children | 0 (0.0%) | 0 (0.0%) |
| Total | 42 (100.0%) | 96 (51.9%) |
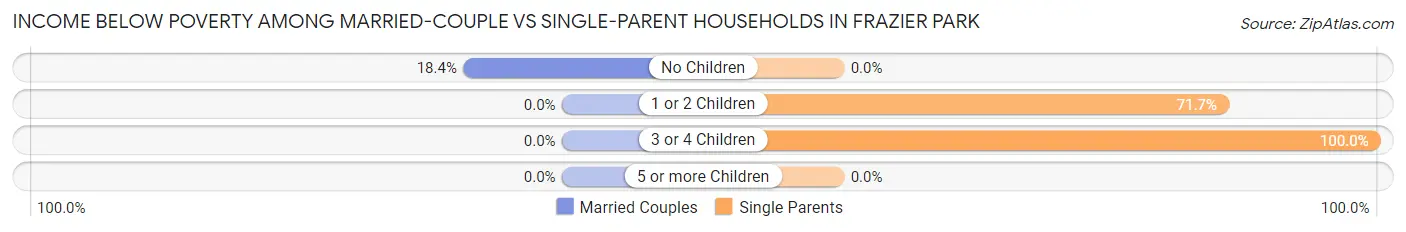
Income Below Poverty Among Married-Couple vs Single-Parent Households in Frazier Park
The poverty data for Frazier Park shows that 71 of the married-couple family households (16.1%) and 138 of the single-parent households (60.8%) are living below the poverty level. Within the married-couple family households, those with no children have the highest poverty rate, with 71 households (18.4%) falling below the poverty line. Among the single-parent households, those with 3 or 4 children have the highest poverty rate, with 39 household (100.0%) living below poverty.
| Children | Married-Couple Families | Single-Parent Households |
| No Children | 71 (18.4%) | 0 (0.0%) |
| 1 or 2 Children | 0 (0.0%) | 99 (71.7%) |
| 3 or 4 Children | 0 (0.0%) | 39 (100.0%) |
| 5 or more Children | 0 (0.0%) | 0 (0.0%) |
| Total | 71 (16.1%) | 138 (60.8%) |
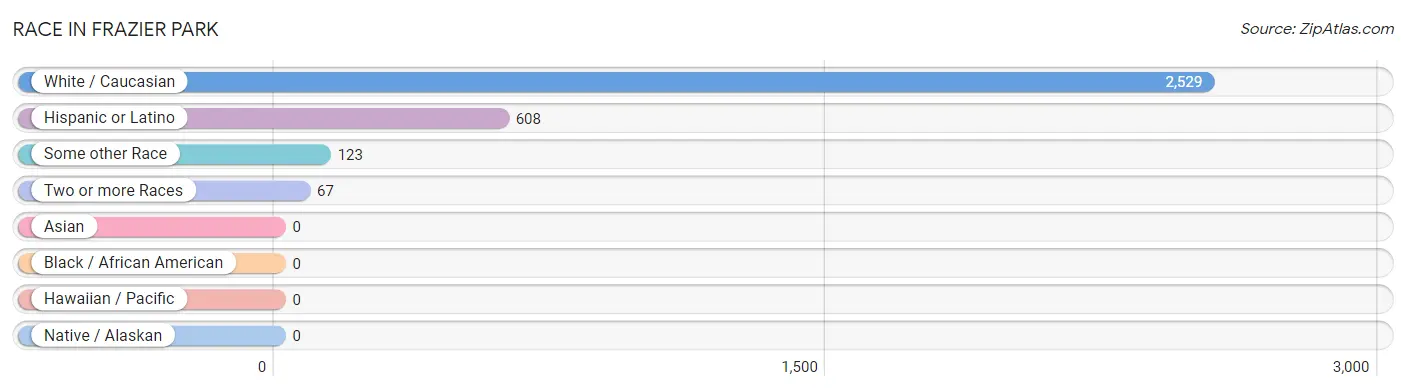
Race in Frazier Park
The most populous races in Frazier Park are White / Caucasian (2,529 | 93.0%), Hispanic or Latino (608 | 22.4%), and Some other Race (123 | 4.5%).
| Race | # Population | % Population |
| Asian | 0 | 0.0% |
| Black / African American | 0 | 0.0% |
| Hawaiian / Pacific | 0 | 0.0% |
| Hispanic or Latino | 608 | 22.4% |
| Native / Alaskan | 0 | 0.0% |
| White / Caucasian | 2,529 | 93.0% |
| Two or more Races | 67 | 2.5% |
| Some other Race | 123 | 4.5% |
| Total | 2,719 | 100.0% |
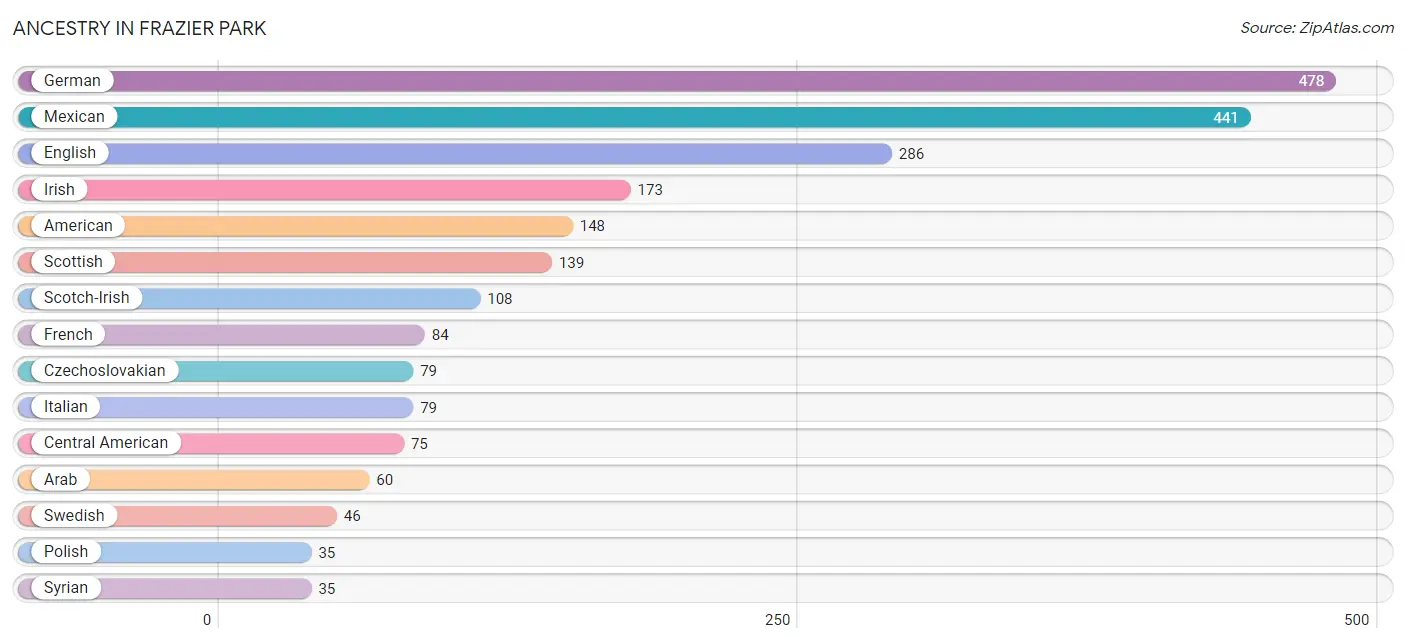
Ancestry in Frazier Park
The most populous ancestries reported in Frazier Park are German (478 | 17.6%), Mexican (441 | 16.2%), English (286 | 10.5%), Irish (173 | 6.4%), and American (148 | 5.4%), together accounting for 56.1% of all Frazier Park residents.
| Ancestry | # Population | % Population |
| American | 148 | 5.4% |
| Arab | 60 | 2.2% |
| Central American | 75 | 2.8% |
| Croatian | 11 | 0.4% |
| Czechoslovakian | 79 | 2.9% |
| Dutch | 11 | 0.4% |
| English | 286 | 10.5% |
| French | 84 | 3.1% |
| German | 478 | 17.6% |
| Irish | 173 | 6.4% |
| Italian | 79 | 2.9% |
| Lebanese | 25 | 0.9% |
| Mexican | 441 | 16.2% |
| Northern European | 11 | 0.4% |
| Norwegian | 21 | 0.8% |
| Peruvian | 14 | 0.5% |
| Polish | 35 | 1.3% |
| Salvadoran | 32 | 1.2% |
| Scandinavian | 11 | 0.4% |
| Scotch-Irish | 108 | 4.0% |
| Scottish | 139 | 5.1% |
| South American | 14 | 0.5% |
| Spaniard | 17 | 0.6% |
| Spanish | 7 | 0.3% |
| Swedish | 46 | 1.7% |
| Syrian | 35 | 1.3% |
| Ukrainian | 7 | 0.3% |
| Welsh | 34 | 1.3% | View All 28 Rows |
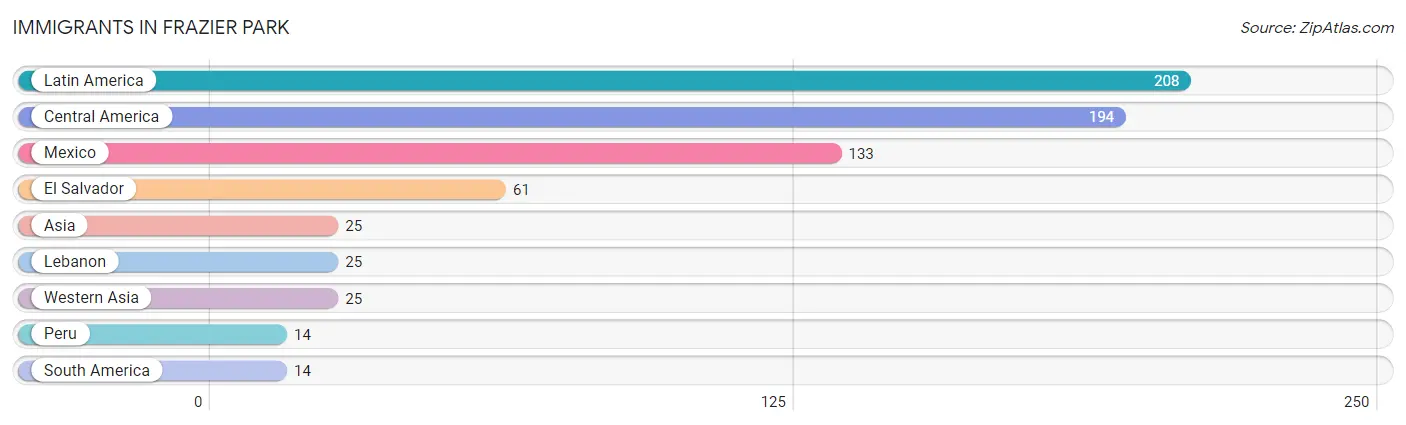
Immigrants in Frazier Park
The most numerous immigrant groups reported in Frazier Park came from Latin America (208 | 7.6%), Central America (194 | 7.1%), Mexico (133 | 4.9%), El Salvador (61 | 2.2%), and Asia (25 | 0.9%), together accounting for 22.8% of all Frazier Park residents.
| Immigration Origin | # Population | % Population |
| Asia | 25 | 0.9% |
| Central America | 194 | 7.1% |
| El Salvador | 61 | 2.2% |
| Latin America | 208 | 7.6% |
| Lebanon | 25 | 0.9% |
| Mexico | 133 | 4.9% |
| Peru | 14 | 0.5% |
| South America | 14 | 0.5% |
| Western Asia | 25 | 0.9% | View All 9 Rows |
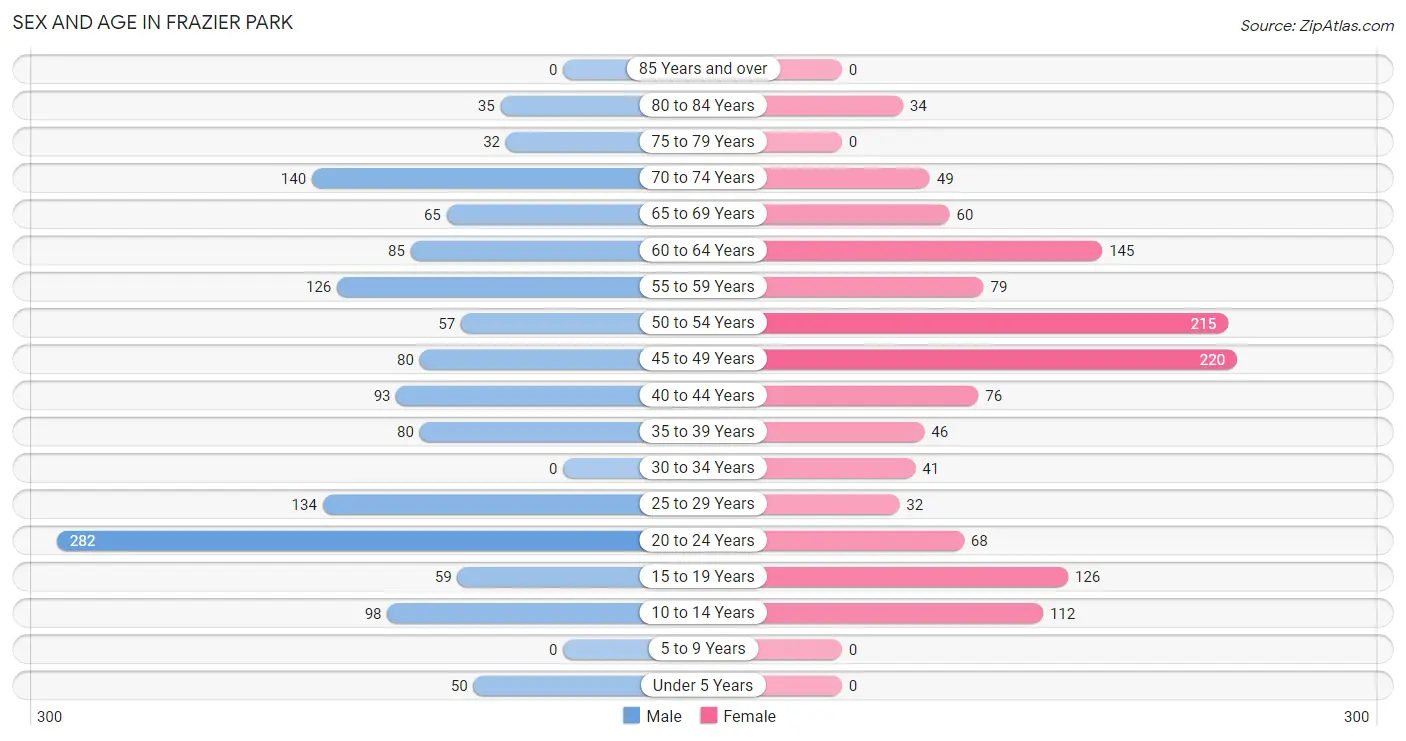
Sex and Age in Frazier Park
Sex and Age in Frazier Park
The most populous age groups in Frazier Park are 20 to 24 Years (282 | 19.9%) for men and 45 to 49 Years (220 | 16.9%) for women.
| Age Bracket | Male | Female |
| Under 5 Years | 50 (3.5%) | 0 (0.0%) |
| 5 to 9 Years | 0 (0.0%) | 0 (0.0%) |
| 10 to 14 Years | 98 (6.9%) | 112 (8.6%) |
| 15 to 19 Years | 59 (4.2%) | 126 (9.7%) |
| 20 to 24 Years | 282 (19.9%) | 68 (5.2%) |
| 25 to 29 Years | 134 (9.5%) | 32 (2.5%) |
| 30 to 34 Years | 0 (0.0%) | 41 (3.2%) |
| 35 to 39 Years | 80 (5.7%) | 46 (3.5%) |
| 40 to 44 Years | 93 (6.6%) | 76 (5.8%) |
| 45 to 49 Years | 80 (5.7%) | 220 (16.9%) |
| 50 to 54 Years | 57 (4.0%) | 215 (16.5%) |
| 55 to 59 Years | 126 (8.9%) | 79 (6.1%) |
| 60 to 64 Years | 85 (6.0%) | 145 (11.1%) |
| 65 to 69 Years | 65 (4.6%) | 60 (4.6%) |
| 70 to 74 Years | 140 (9.9%) | 49 (3.8%) |
| 75 to 79 Years | 32 (2.3%) | 0 (0.0%) |
| 80 to 84 Years | 35 (2.5%) | 34 (2.6%) |
| 85 Years and over | 0 (0.0%) | 0 (0.0%) |
| Total | 1,416 (100.0%) | 1,303 (100.0%) |
Families and Households in Frazier Park
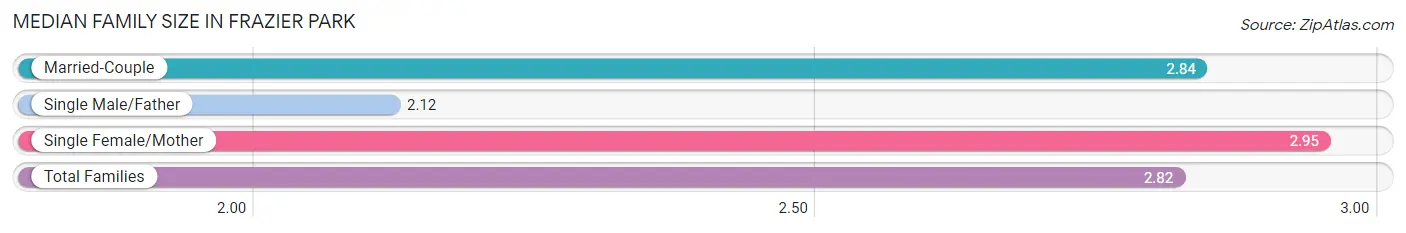
Median Family Size in Frazier Park
The median family size in Frazier Park is 2.82 persons per family, with single female/mother families (185 | 27.7%) accounting for the largest median family size of 2.95 persons per family. On the other hand, single male/father families (42 | 6.3%) represent the smallest median family size with 2.12 persons per family.
| Family Type | # Families | Family Size |
| Married-Couple | 442 (66.1%) | 2.84 |
| Single Male/Father | 42 (6.3%) | 2.12 |
| Single Female/Mother | 185 (27.7%) | 2.95 |
| Total Families | 669 (100.0%) | 2.82 |
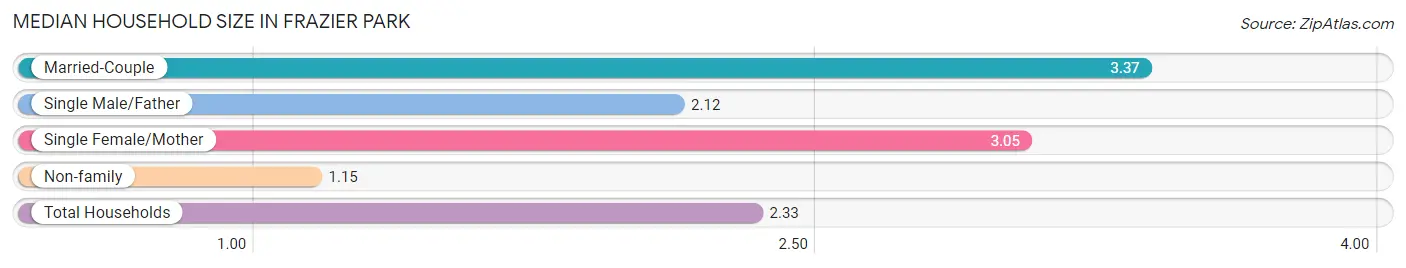
Median Household Size in Frazier Park
The median household size in Frazier Park is 2.33 persons per household, with married-couple households (442 | 37.8%) accounting for the largest median household size of 3.37 persons per household. non-family households (499 | 42.7%) represent the smallest median household size with 1.15 persons per household.
| Household Type | # Households | Household Size |
| Married-Couple | 442 (37.8%) | 3.37 |
| Single Male/Father | 42 (3.6%) | 2.12 |
| Single Female/Mother | 185 (15.8%) | 3.05 |
| Non-family | 499 (42.7%) | 1.15 |
| Total Households | 1,168 (100.0%) | 2.33 |
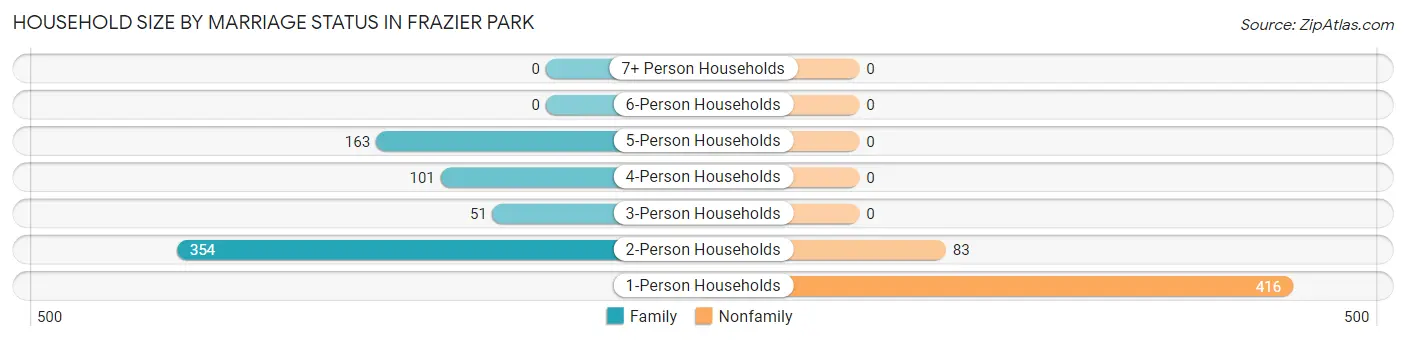
Household Size by Marriage Status in Frazier Park
Out of a total of 1,168 households in Frazier Park, 669 (57.3%) are family households, while 499 (42.7%) are nonfamily households. The most numerous type of family households are 2-person households, comprising 354, and the most common type of nonfamily households are 1-person households, comprising 416.
| Household Size | Family Households | Nonfamily Households |
| 1-Person Households | - | 416 (35.6%) |
| 2-Person Households | 354 (30.3%) | 83 (7.1%) |
| 3-Person Households | 51 (4.4%) | 0 (0.0%) |
| 4-Person Households | 101 (8.6%) | 0 (0.0%) |
| 5-Person Households | 163 (14.0%) | 0 (0.0%) |
| 6-Person Households | 0 (0.0%) | 0 (0.0%) |
| 7+ Person Households | 0 (0.0%) | 0 (0.0%) |
| Total | 669 (57.3%) | 499 (42.7%) |
Female Fertility in Frazier Park
Fertility by Age in Frazier Park
| Age Bracket | Women with Births | Births / 1,000 Women |
| 15 to 19 years | 0 (0.0%) | 0.0 |
| 20 to 34 years | 0 (0.0%) | 0.0 |
| 35 to 50 years | 0 (0.0%) | 0.0 |
| Total | 0 (0.0%) | 0.0 |
Fertility by Age by Marriage Status in Frazier Park
| Age Bracket | Married | Unmarried |
| 15 to 19 years | 0 (0.0%) | 0 (0.0%) |
| 20 to 34 years | 0 (0.0%) | 0 (0.0%) |
| 35 to 50 years | 0 (0.0%) | 0 (0.0%) |
| Total | 0 (0.0%) | 0 (0.0%) |
Fertility by Education in Frazier Park
| Educational Attainment | Women with Births | Births / 1,000 Women |
| Less than High School | 0 (0.0%) | 0.0 |
| High School Diploma | 0 (0.0%) | 0.0 |
| College or Associate's Degree | 0 (0.0%) | 0.0 |
| Bachelor's Degree | 0 (0.0%) | 0.0 |
| Graduate Degree | 0 (0.0%) | 0.0 |
| Total | 0 (0.0%) | 0.0 |
Fertility by Education by Marriage Status in Frazier Park
| Educational Attainment | Married | Unmarried |
| Less than High School | 0 (0.0%) | 0 (0.0%) |
| High School Diploma | 0 (0.0%) | 0 (0.0%) |
| College or Associate's Degree | 0 (0.0%) | 0 (0.0%) |
| Bachelor's Degree | 0 (0.0%) | 0 (0.0%) |
| Graduate Degree | 0 (0.0%) | 0 (0.0%) |
| Total | 0 (0.0%) | 0 (0.0%) |
Employment Characteristics in Frazier Park
Employment by Class of Employer in Frazier Park
Among the 1,244 employed individuals in Frazier Park, private company employees (804 | 64.6%), local government employees (251 | 20.2%), and self-employed (not incorporated) (54 | 4.3%) make up the most common classes of employment.
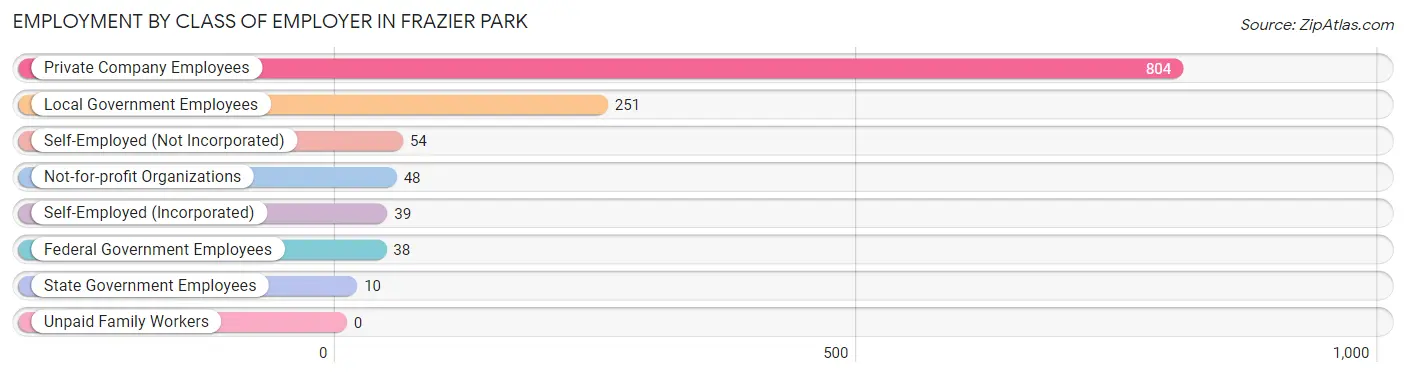
| Employer Class | # Employees | % Employees |
| Private Company Employees | 804 | 64.6% |
| Self-Employed (Incorporated) | 39 | 3.1% |
| Self-Employed (Not Incorporated) | 54 | 4.3% |
| Not-for-profit Organizations | 48 | 3.9% |
| Local Government Employees | 251 | 20.2% |
| State Government Employees | 10 | 0.8% |
| Federal Government Employees | 38 | 3.0% |
| Unpaid Family Workers | 0 | 0.0% |
| Total | 1,244 | 100.0% |
Employment Status by Age in Frazier Park
According to the labor force statistics for Frazier Park, out of the total population over 16 years of age (2,459), 58.5% or 1,439 individuals are in the labor force, with 9.9% or 142 of them unemployed. The age group with the highest labor force participation rate is 25 to 29 years, with 100.0% or 166 individuals in the labor force. Within the labor force, the 35 to 44 years age range has the highest percentage of unemployed individuals, with 27.6% or 43 of them being unemployed.
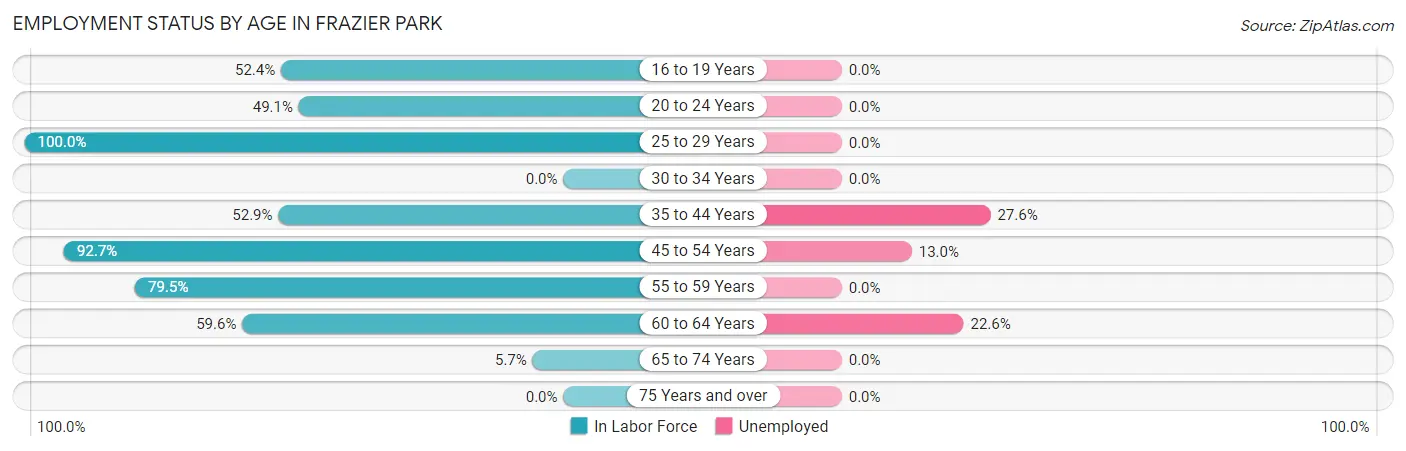
| Age Bracket | In Labor Force | Unemployed |
| 16 to 19 Years | 97 (52.4%) | 0 (0.0%) |
| 20 to 24 Years | 172 (49.1%) | 0 (0.0%) |
| 25 to 29 Years | 166 (100.0%) | 0 (0.0%) |
| 30 to 34 Years | 0 (0.0%) | 0 (0.0%) |
| 35 to 44 Years | 156 (52.9%) | 43 (27.6%) |
| 45 to 54 Years | 530 (92.7%) | 69 (13.0%) |
| 55 to 59 Years | 163 (79.5%) | 0 (0.0%) |
| 60 to 64 Years | 137 (59.6%) | 31 (22.6%) |
| 65 to 74 Years | 18 (5.7%) | 0 (0.0%) |
| 75 Years and over | 0 (0.0%) | 0 (0.0%) |
| Total | 1,439 (58.5%) | 142 (9.9%) |
Employment Status by Educational Attainment in Frazier Park
According to labor force statistics for Frazier Park, 76.3% of individuals (1,151) out of the total population between 25 and 64 years of age (1,509) are in the labor force, with 12.4% or 143 of them being unemployed. The group with the highest labor force participation rate are those with the educational attainment of bachelor's degree or higher, with 95.1% or 352 individuals in the labor force. Within the labor force, individuals with college / associate degree education have the highest percentage of unemployment, with 28.3% or 100 of them being unemployed.
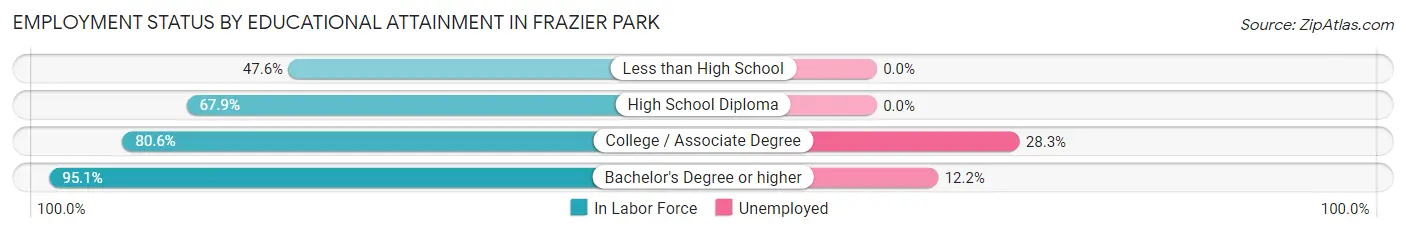
| Educational Attainment | In Labor Force | Unemployed |
| Less than High School | 68 (47.6%) | 0 (0.0%) |
| High School Diploma | 379 (67.9%) | 0 (0.0%) |
| College / Associate Degree | 353 (80.6%) | 124 (28.3%) |
| Bachelor's Degree or higher | 352 (95.1%) | 45 (12.2%) |
| Total | 1,151 (76.3%) | 187 (12.4%) |
Employment Occupations by Sex in Frazier Park
Management, Business, Science and Arts Occupations
The most common Management, Business, Science and Arts occupations in Frazier Park are Community & Social Service (257 | 19.8%), Education Instruction & Library (250 | 19.3%), Management (166 | 12.8%), Health Diagnosing & Treating (53 | 4.1%), and Business & Financial (45 | 3.5%).
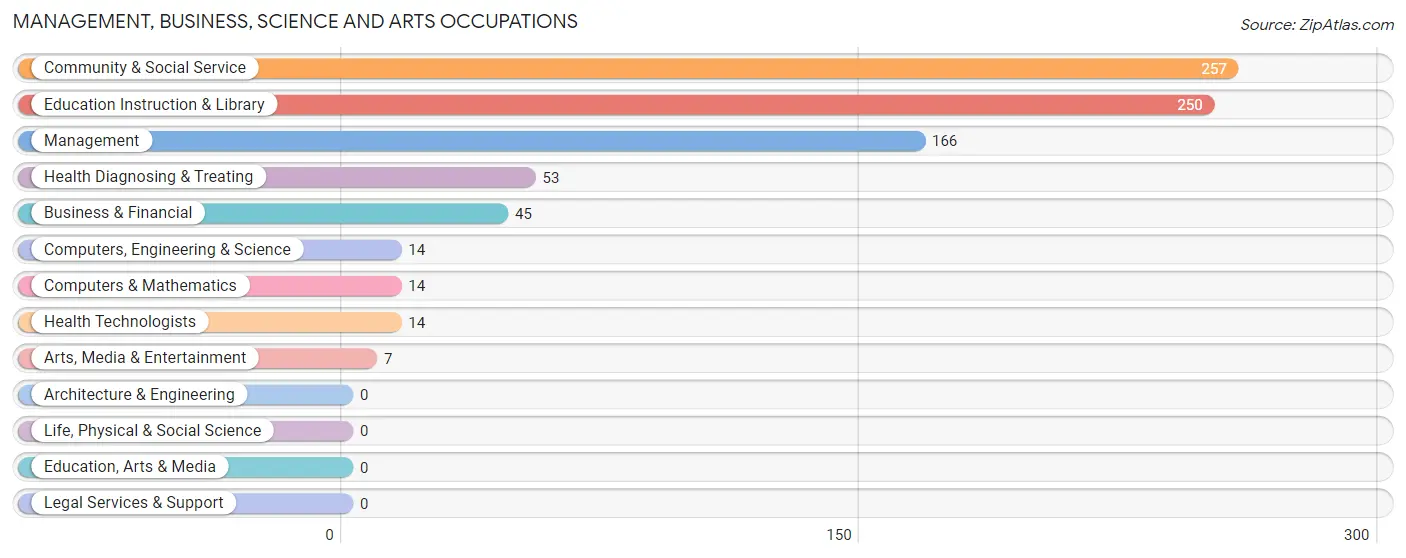
Management, Business, Science and Arts Occupations by Sex
Within the Management, Business, Science and Arts occupations in Frazier Park, the most male-oriented occupations are Arts, Media & Entertainment (100.0%), Management (80.7%), and Community & Social Service (44.8%), while the most female-oriented occupations are Computers, Engineering & Science (100.0%), Computers & Mathematics (100.0%), and Health Diagnosing & Treating (100.0%).
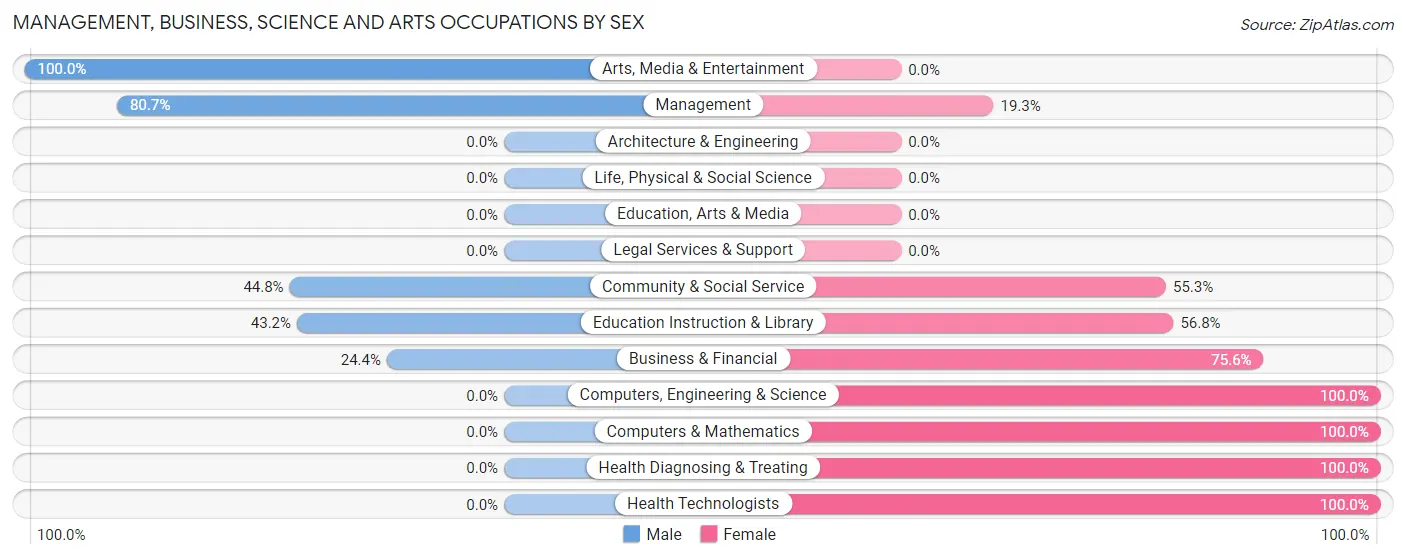
| Occupation | Male | Female |
| Management | 134 (80.7%) | 32 (19.3%) |
| Business & Financial | 11 (24.4%) | 34 (75.6%) |
| Computers, Engineering & Science | 0 (0.0%) | 14 (100.0%) |
| Computers & Mathematics | 0 (0.0%) | 14 (100.0%) |
| Architecture & Engineering | 0 (0.0%) | 0 (0.0%) |
| Life, Physical & Social Science | 0 (0.0%) | 0 (0.0%) |
| Community & Social Service | 115 (44.8%) | 142 (55.2%) |
| Education, Arts & Media | 0 (0.0%) | 0 (0.0%) |
| Legal Services & Support | 0 (0.0%) | 0 (0.0%) |
| Education Instruction & Library | 108 (43.2%) | 142 (56.8%) |
| Arts, Media & Entertainment | 7 (100.0%) | 0 (0.0%) |
| Health Diagnosing & Treating | 0 (0.0%) | 53 (100.0%) |
| Health Technologists | 0 (0.0%) | 14 (100.0%) |
| Total (Category) | 260 (48.6%) | 275 (51.4%) |
| Total (Overall) | 584 (45.1%) | 712 (54.9%) |
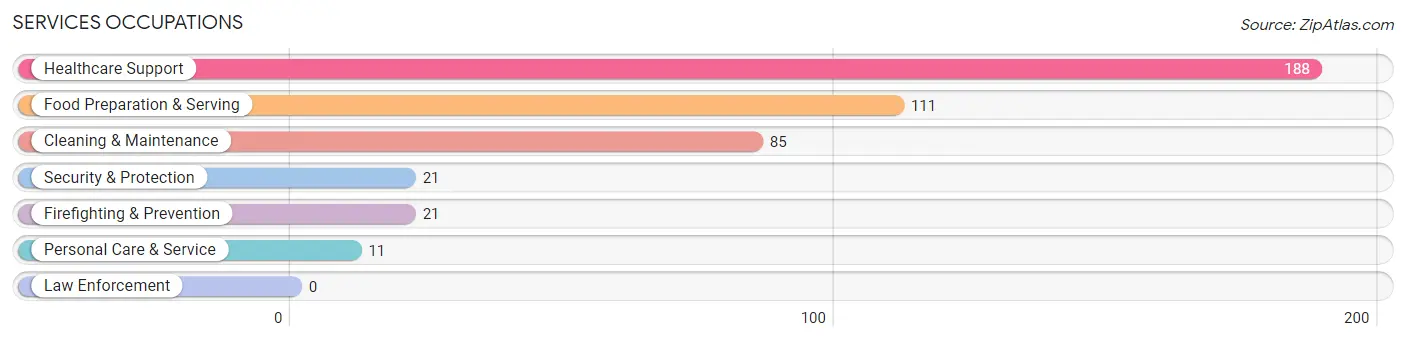
Services Occupations
The most common Services occupations in Frazier Park are Healthcare Support (188 | 14.5%), Food Preparation & Serving (111 | 8.6%), Cleaning & Maintenance (85 | 6.6%), Security & Protection (21 | 1.6%), and Firefighting & Prevention (21 | 1.6%).
Services Occupations by Sex
Within the Services occupations in Frazier Park, the most male-oriented occupations are Security & Protection (100.0%), Firefighting & Prevention (100.0%), and Cleaning & Maintenance (63.5%), while the most female-oriented occupations are Personal Care & Service (100.0%), Healthcare Support (80.3%), and Food Preparation & Serving (66.7%).
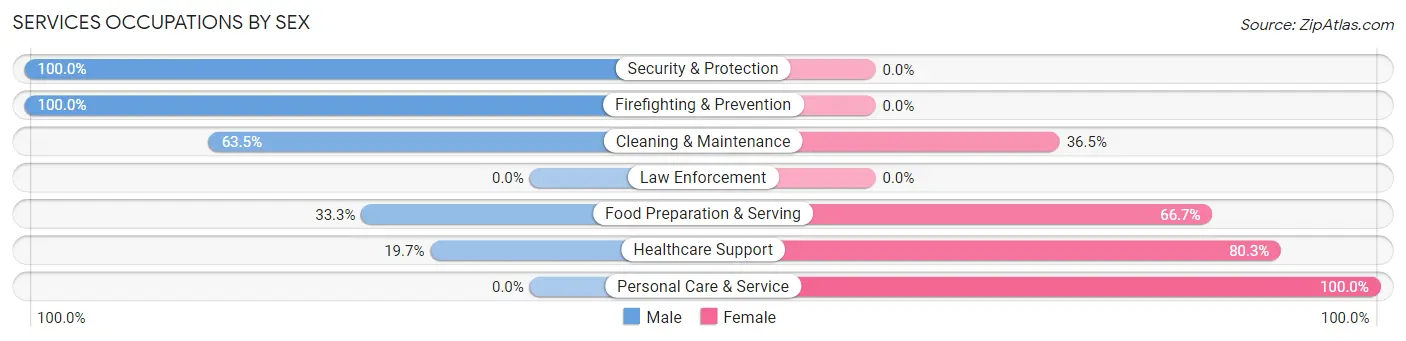
| Occupation | Male | Female |
| Healthcare Support | 37 (19.7%) | 151 (80.3%) |
| Security & Protection | 21 (100.0%) | 0 (0.0%) |
| Firefighting & Prevention | 21 (100.0%) | 0 (0.0%) |
| Law Enforcement | 0 (0.0%) | 0 (0.0%) |
| Food Preparation & Serving | 37 (33.3%) | 74 (66.7%) |
| Cleaning & Maintenance | 54 (63.5%) | 31 (36.5%) |
| Personal Care & Service | 0 (0.0%) | 11 (100.0%) |
| Total (Category) | 149 (35.8%) | 267 (64.2%) |
| Total (Overall) | 584 (45.1%) | 712 (54.9%) |
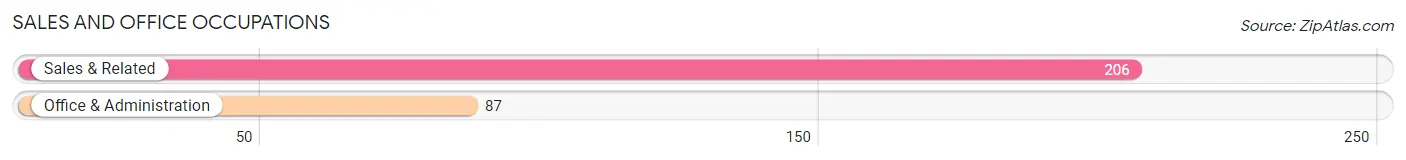
Sales and Office Occupations
The most common Sales and Office occupations in Frazier Park are Sales & Related (206 | 15.9%), and Office & Administration (87 | 6.7%).
Sales and Office Occupations by Sex
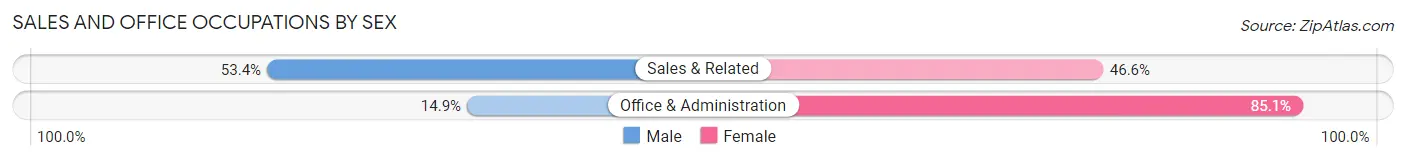
| Occupation | Male | Female |
| Sales & Related | 110 (53.4%) | 96 (46.6%) |
| Office & Administration | 13 (14.9%) | 74 (85.1%) |
| Total (Category) | 123 (42.0%) | 170 (58.0%) |
| Total (Overall) | 584 (45.1%) | 712 (54.9%) |
Natural Resources, Construction and Maintenance Occupations
Natural Resources, Construction and Maintenance Occupations by Sex
| Occupation | Male | Female |
| Farming, Fishing & Forestry | 0 (0.0%) | 0 (0.0%) |
| Construction & Extraction | 0 (0.0%) | 0 (0.0%) |
| Installation, Maintenance & Repair | 0 (0.0%) | 0 (0.0%) |
| Total (Category) | 0 (0.0%) | 0 (0.0%) |
| Total (Overall) | 584 (45.1%) | 712 (54.9%) |
Production, Transportation and Moving Occupations
The most common Production, Transportation and Moving occupations in Frazier Park are Production (37 | 2.9%), and Material Moving (15 | 1.2%).
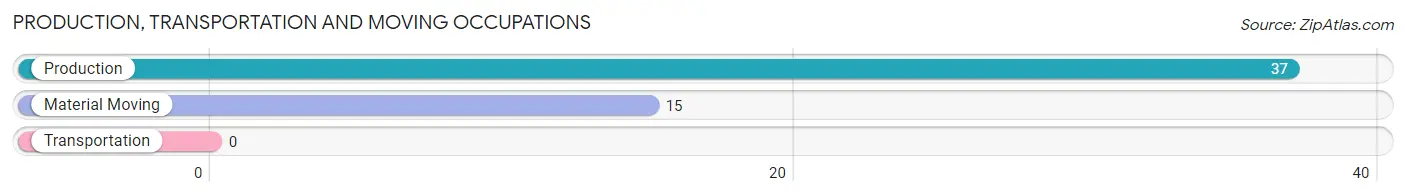
Production, Transportation and Moving Occupations by Sex
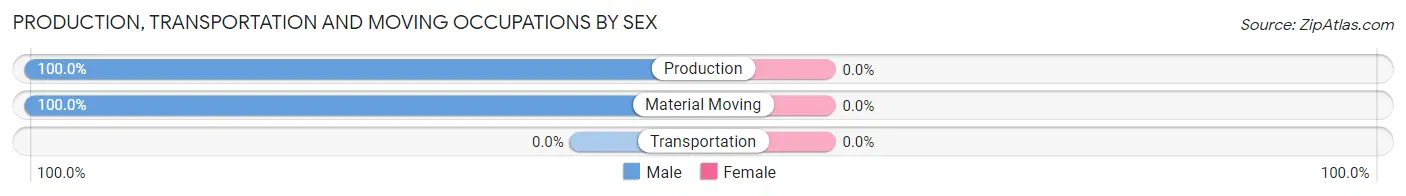
| Occupation | Male | Female |
| Production | 37 (100.0%) | 0 (0.0%) |
| Transportation | 0 (0.0%) | 0 (0.0%) |
| Material Moving | 15 (100.0%) | 0 (0.0%) |
| Total (Category) | 52 (100.0%) | 0 (0.0%) |
| Total (Overall) | 584 (45.1%) | 712 (54.9%) |
Employment Industries by Sex in Frazier Park
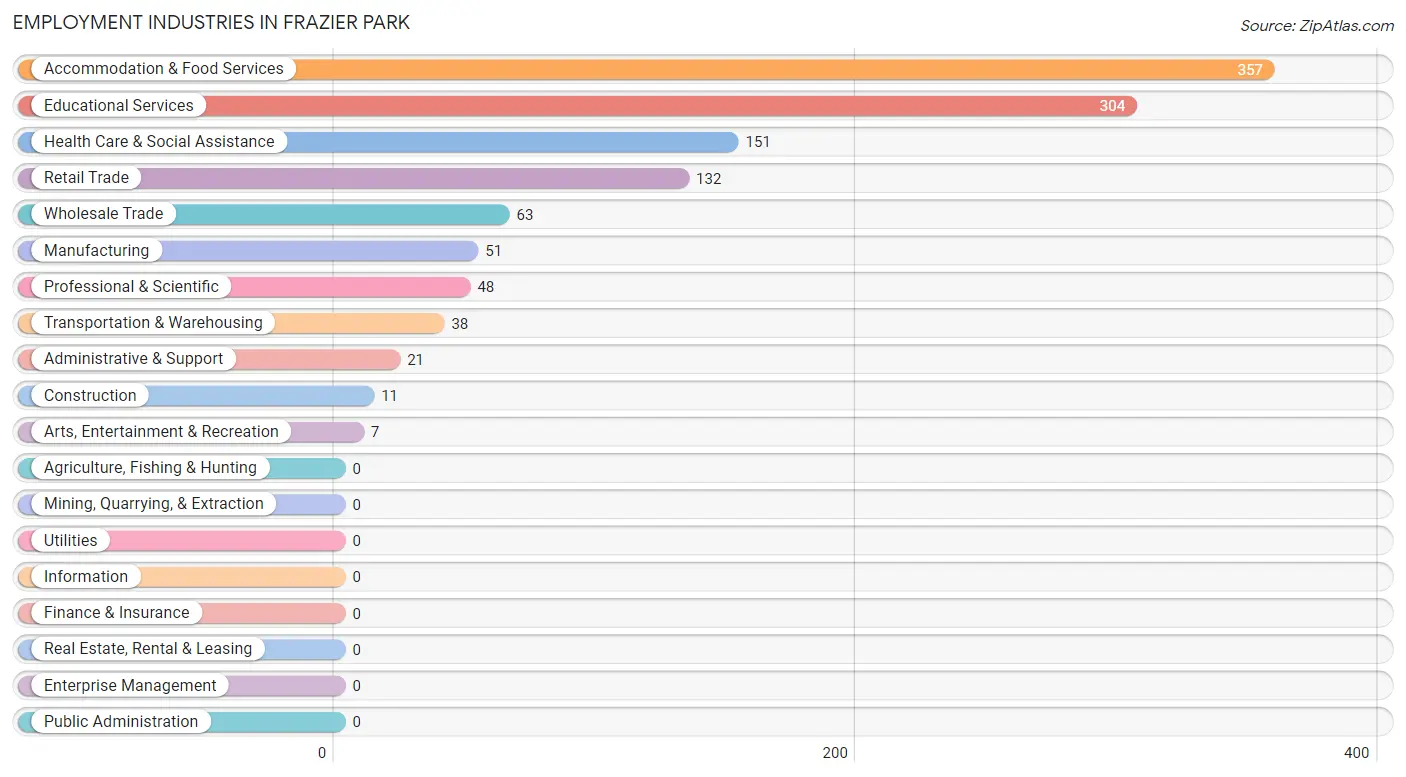
Employment Industries in Frazier Park
The major employment industries in Frazier Park include Accommodation & Food Services (357 | 27.6%), Educational Services (304 | 23.5%), Health Care & Social Assistance (151 | 11.7%), Retail Trade (132 | 10.2%), and Wholesale Trade (63 | 4.9%).
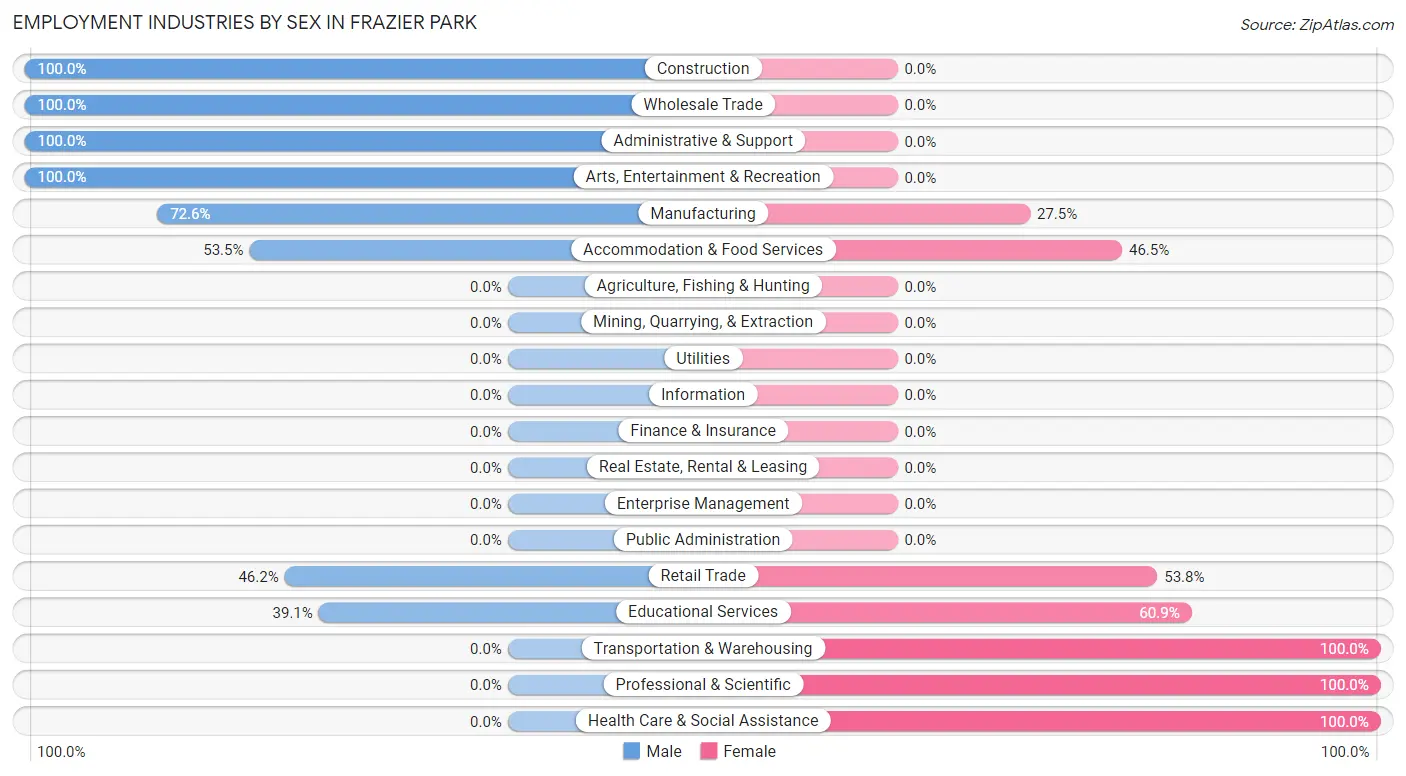
Employment Industries by Sex in Frazier Park
The Frazier Park industries that see more men than women are Construction (100.0%), Wholesale Trade (100.0%), and Administrative & Support (100.0%), whereas the industries that tend to have a higher number of women are Transportation & Warehousing (100.0%), Professional & Scientific (100.0%), and Health Care & Social Assistance (100.0%).
| Industry | Male | Female |
| Agriculture, Fishing & Hunting | 0 (0.0%) | 0 (0.0%) |
| Mining, Quarrying, & Extraction | 0 (0.0%) | 0 (0.0%) |
| Construction | 11 (100.0%) | 0 (0.0%) |
| Manufacturing | 37 (72.6%) | 14 (27.5%) |
| Wholesale Trade | 63 (100.0%) | 0 (0.0%) |
| Retail Trade | 61 (46.2%) | 71 (53.8%) |
| Transportation & Warehousing | 0 (0.0%) | 38 (100.0%) |
| Utilities | 0 (0.0%) | 0 (0.0%) |
| Information | 0 (0.0%) | 0 (0.0%) |
| Finance & Insurance | 0 (0.0%) | 0 (0.0%) |
| Real Estate, Rental & Leasing | 0 (0.0%) | 0 (0.0%) |
| Professional & Scientific | 0 (0.0%) | 48 (100.0%) |
| Enterprise Management | 0 (0.0%) | 0 (0.0%) |
| Administrative & Support | 21 (100.0%) | 0 (0.0%) |
| Educational Services | 119 (39.1%) | 185 (60.9%) |
| Health Care & Social Assistance | 0 (0.0%) | 151 (100.0%) |
| Arts, Entertainment & Recreation | 7 (100.0%) | 0 (0.0%) |
| Accommodation & Food Services | 191 (53.5%) | 166 (46.5%) |
| Public Administration | 0 (0.0%) | 0 (0.0%) |
| Total | 584 (45.1%) | 712 (54.9%) |
Education in Frazier Park
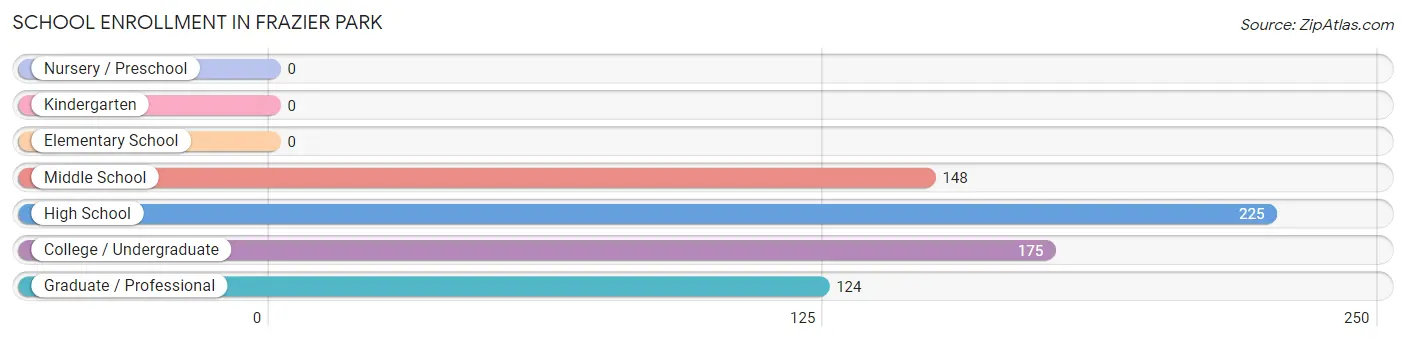
School Enrollment in Frazier Park
The most common levels of schooling among the 672 students in Frazier Park are high school (225 | 33.5%), college / undergraduate (175 | 26.0%), and middle school (148 | 22.0%).
| School Level | # Students | % Students |
| Nursery / Preschool | 0 | 0.0% |
| Kindergarten | 0 | 0.0% |
| Elementary School | 0 | 0.0% |
| Middle School | 148 | 22.0% |
| High School | 225 | 33.5% |
| College / Undergraduate | 175 | 26.0% |
| Graduate / Professional | 124 | 18.4% |
| Total | 672 | 100.0% |
School Enrollment by Age by Funding Source in Frazier Park
Out of a total of 672 students who are enrolled in schools in Frazier Park, 124 (18.5%) attend a private institution, while the remaining 548 (81.5%) are enrolled in public schools. The age group of 35 years and over has the highest likelihood of being enrolled in private schools, with 124 (100.0% in the age bracket) enrolled. Conversely, the age group of 10 to 14 year olds has the lowest likelihood of being enrolled in a private school, with 210 (100.0% in the age bracket) attending a public institution.
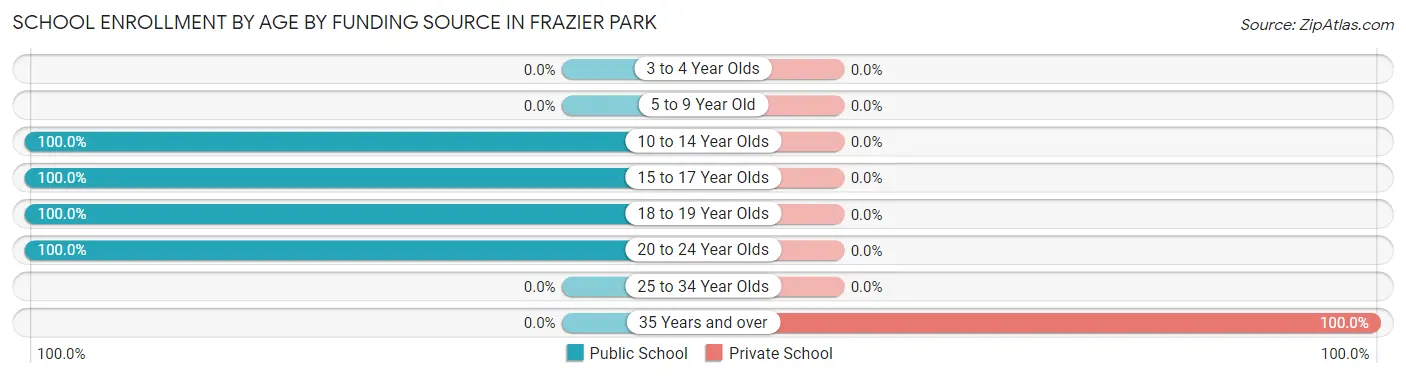
| Age Bracket | Public School | Private School |
| 3 to 4 Year Olds | 0 (0.0%) | 0 (0.0%) |
| 5 to 9 Year Old | 0 (0.0%) | 0 (0.0%) |
| 10 to 14 Year Olds | 210 (100.0%) | 0 (0.0%) |
| 15 to 17 Year Olds | 108 (100.0%) | 0 (0.0%) |
| 18 to 19 Year Olds | 70 (100.0%) | 0 (0.0%) |
| 20 to 24 Year Olds | 160 (100.0%) | 0 (0.0%) |
| 25 to 34 Year Olds | 0 (0.0%) | 0 (0.0%) |
| 35 Years and over | 0 (0.0%) | 124 (100.0%) |
| Total | 548 (81.5%) | 124 (18.5%) |
Educational Attainment by Field of Study in Frazier Park
Psychology (124 | 29.0%), literature & languages (108 | 25.3%), business (55 | 12.9%), bio, nature & agricultural (54 | 12.7%), and engineering (43 | 10.1%) are the most common fields of study among 427 individuals in Frazier Park who have obtained a bachelor's degree or higher.
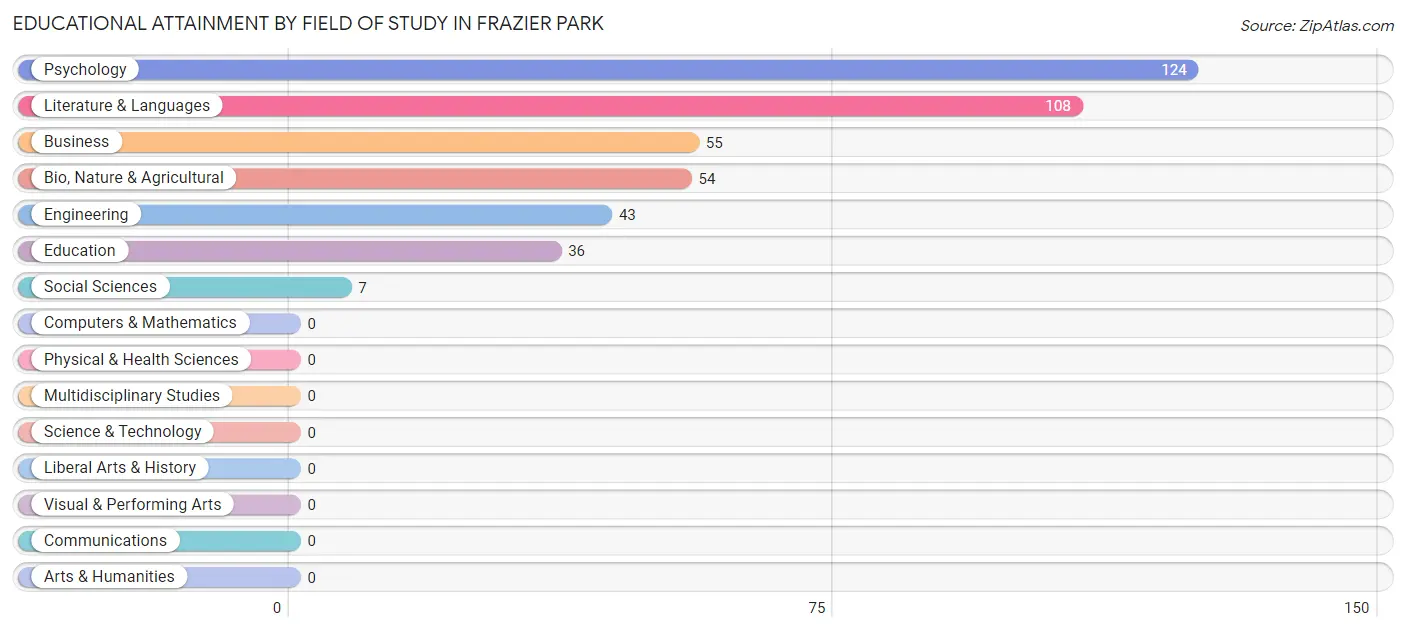
| Field of Study | # Graduates | % Graduates |
| Computers & Mathematics | 0 | 0.0% |
| Bio, Nature & Agricultural | 54 | 12.7% |
| Physical & Health Sciences | 0 | 0.0% |
| Psychology | 124 | 29.0% |
| Social Sciences | 7 | 1.6% |
| Engineering | 43 | 10.1% |
| Multidisciplinary Studies | 0 | 0.0% |
| Science & Technology | 0 | 0.0% |
| Business | 55 | 12.9% |
| Education | 36 | 8.4% |
| Literature & Languages | 108 | 25.3% |
| Liberal Arts & History | 0 | 0.0% |
| Visual & Performing Arts | 0 | 0.0% |
| Communications | 0 | 0.0% |
| Arts & Humanities | 0 | 0.0% |
| Total | 427 | 100.0% |
Transportation & Commute in Frazier Park
Vehicle Availability by Sex in Frazier Park
The most prevalent vehicle ownership categories in Frazier Park are males with 4 vehicles (253, accounting for 46.8%) and females with 4 vehicles (238, making up 36.0%).
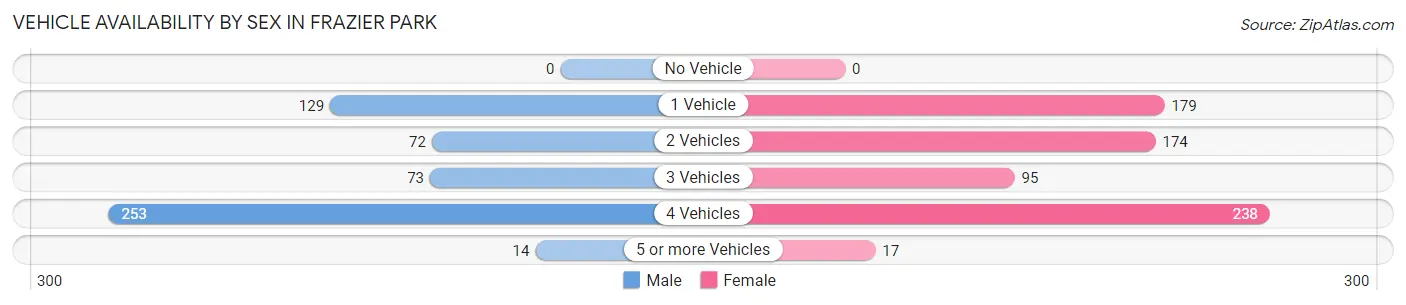
| Vehicles Available | Male | Female |
| No Vehicle | 0 (0.0%) | 0 (0.0%) |
| 1 Vehicle | 129 (23.8%) | 179 (25.5%) |
| 2 Vehicles | 72 (13.3%) | 174 (24.7%) |
| 3 Vehicles | 73 (13.5%) | 95 (13.5%) |
| 4 Vehicles | 253 (46.8%) | 238 (33.9%) |
| 5 or more Vehicles | 14 (2.6%) | 17 (2.4%) |
| Total | 541 (100.0%) | 703 (100.0%) |
Commute Time in Frazier Park
The most frequently occuring commute durations in Frazier Park are 5 to 9 minutes (342 commuters, 34.8%), 45 to 59 minutes (153 commuters, 15.6%), and 20 to 24 minutes (122 commuters, 12.4%).
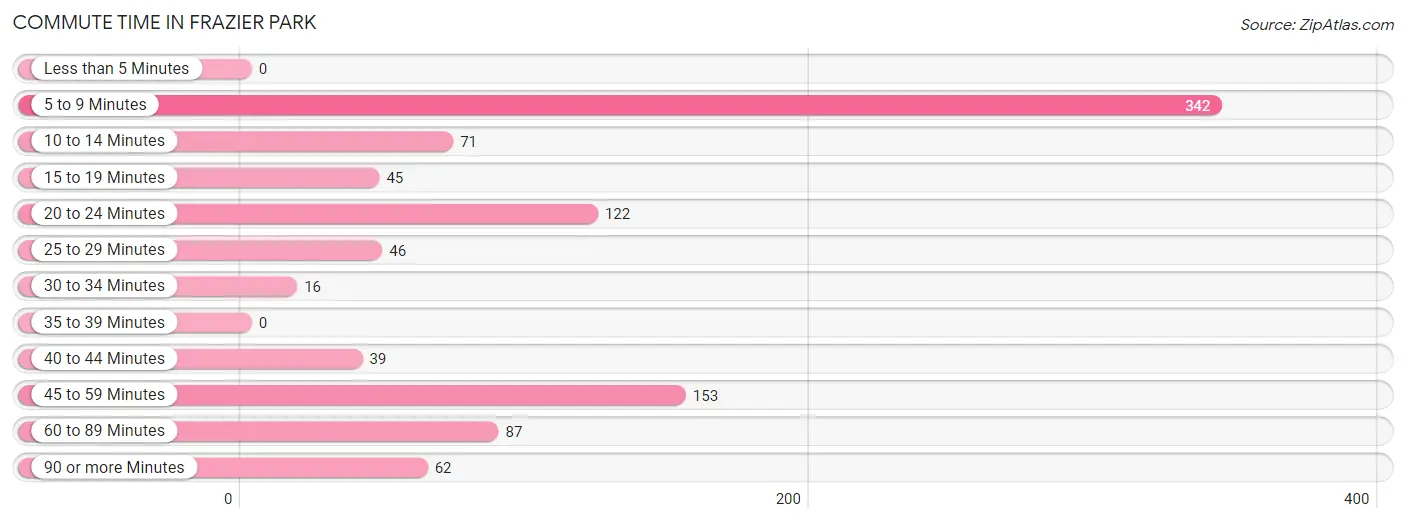
| Commute Time | # Commuters | % Commuters |
| Less than 5 Minutes | 0 | 0.0% |
| 5 to 9 Minutes | 342 | 34.8% |
| 10 to 14 Minutes | 71 | 7.2% |
| 15 to 19 Minutes | 45 | 4.6% |
| 20 to 24 Minutes | 122 | 12.4% |
| 25 to 29 Minutes | 46 | 4.7% |
| 30 to 34 Minutes | 16 | 1.6% |
| 35 to 39 Minutes | 0 | 0.0% |
| 40 to 44 Minutes | 39 | 4.0% |
| 45 to 59 Minutes | 153 | 15.6% |
| 60 to 89 Minutes | 87 | 8.8% |
| 90 or more Minutes | 62 | 6.3% |
Commute Time by Sex in Frazier Park
The most common commute times in Frazier Park are 5 to 9 minutes (226 commuters, 53.0%) for males and 45 to 59 minutes (138 commuters, 24.8%) for females.
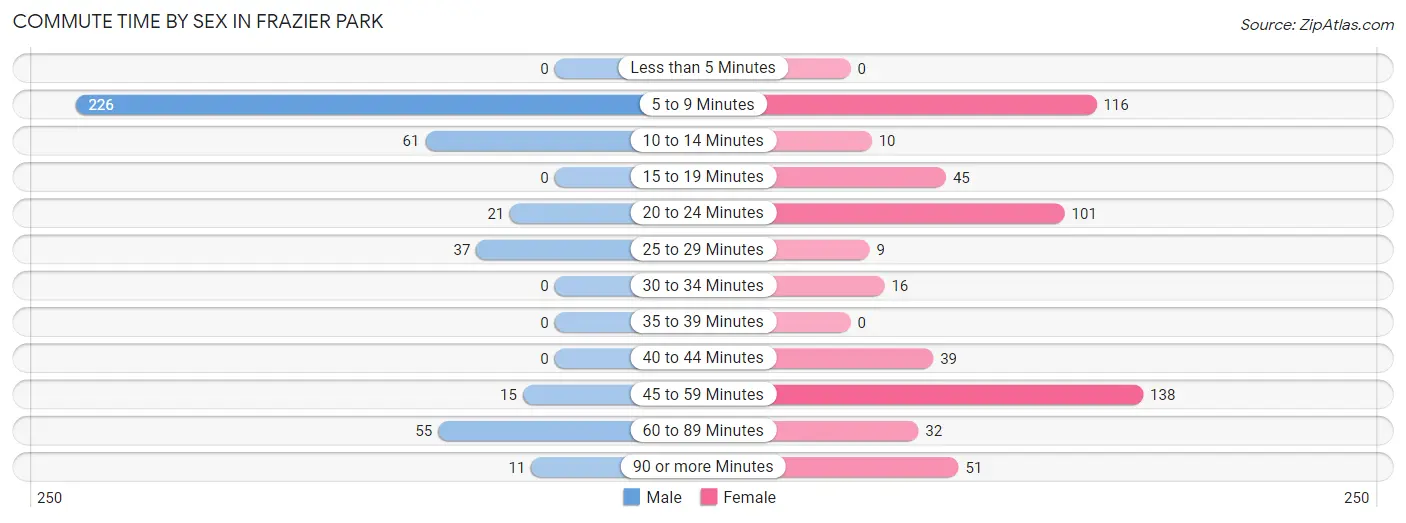
| Commute Time | Male | Female |
| Less than 5 Minutes | 0 (0.0%) | 0 (0.0%) |
| 5 to 9 Minutes | 226 (53.0%) | 116 (20.8%) |
| 10 to 14 Minutes | 61 (14.3%) | 10 (1.8%) |
| 15 to 19 Minutes | 0 (0.0%) | 45 (8.1%) |
| 20 to 24 Minutes | 21 (4.9%) | 101 (18.1%) |
| 25 to 29 Minutes | 37 (8.7%) | 9 (1.6%) |
| 30 to 34 Minutes | 0 (0.0%) | 16 (2.9%) |
| 35 to 39 Minutes | 0 (0.0%) | 0 (0.0%) |
| 40 to 44 Minutes | 0 (0.0%) | 39 (7.0%) |
| 45 to 59 Minutes | 15 (3.5%) | 138 (24.8%) |
| 60 to 89 Minutes | 55 (12.9%) | 32 (5.8%) |
| 90 or more Minutes | 11 (2.6%) | 51 (9.2%) |
Time of Departure to Work by Sex in Frazier Park
The most frequent times of departure to work in Frazier Park are 5:30 AM to 5:59 AM (195, 45.8%) for males and 4:00 PM to 11:59 PM (151, 27.1%) for females.
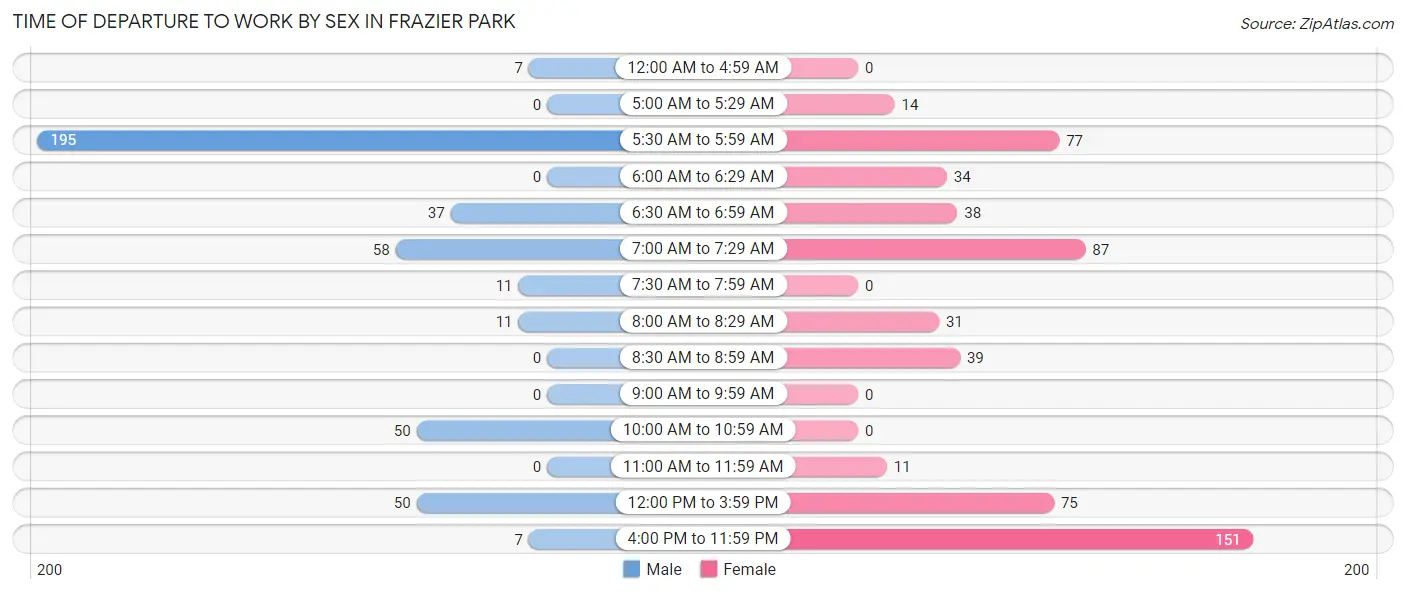
| Time of Departure | Male | Female |
| 12:00 AM to 4:59 AM | 7 (1.6%) | 0 (0.0%) |
| 5:00 AM to 5:29 AM | 0 (0.0%) | 14 (2.5%) |
| 5:30 AM to 5:59 AM | 195 (45.8%) | 77 (13.8%) |
| 6:00 AM to 6:29 AM | 0 (0.0%) | 34 (6.1%) |
| 6:30 AM to 6:59 AM | 37 (8.7%) | 38 (6.8%) |
| 7:00 AM to 7:29 AM | 58 (13.6%) | 87 (15.6%) |
| 7:30 AM to 7:59 AM | 11 (2.6%) | 0 (0.0%) |
| 8:00 AM to 8:29 AM | 11 (2.6%) | 31 (5.6%) |
| 8:30 AM to 8:59 AM | 0 (0.0%) | 39 (7.0%) |
| 9:00 AM to 9:59 AM | 0 (0.0%) | 0 (0.0%) |
| 10:00 AM to 10:59 AM | 50 (11.7%) | 0 (0.0%) |
| 11:00 AM to 11:59 AM | 0 (0.0%) | 11 (2.0%) |
| 12:00 PM to 3:59 PM | 50 (11.7%) | 75 (13.5%) |
| 4:00 PM to 11:59 PM | 7 (1.6%) | 151 (27.1%) |
| Total | 426 (100.0%) | 557 (100.0%) |
Housing Occupancy in Frazier Park
Occupancy by Ownership in Frazier Park
Of the total 1,168 dwellings in Frazier Park, owner-occupied units account for 787 (67.4%), while renter-occupied units make up 381 (32.6%).
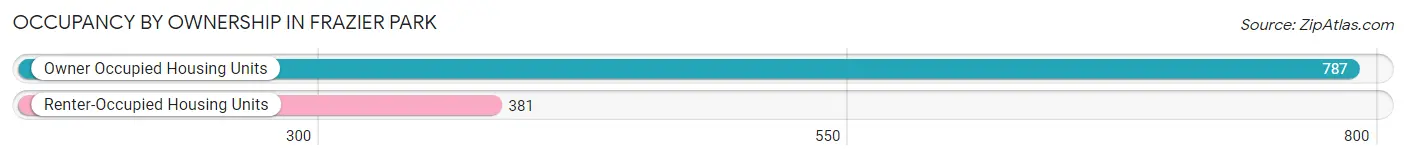
| Occupancy | # Housing Units | % Housing Units |
| Owner Occupied Housing Units | 787 | 67.4% |
| Renter-Occupied Housing Units | 381 | 32.6% |
| Total Occupied Housing Units | 1,168 | 100.0% |
Occupancy by Household Size in Frazier Park
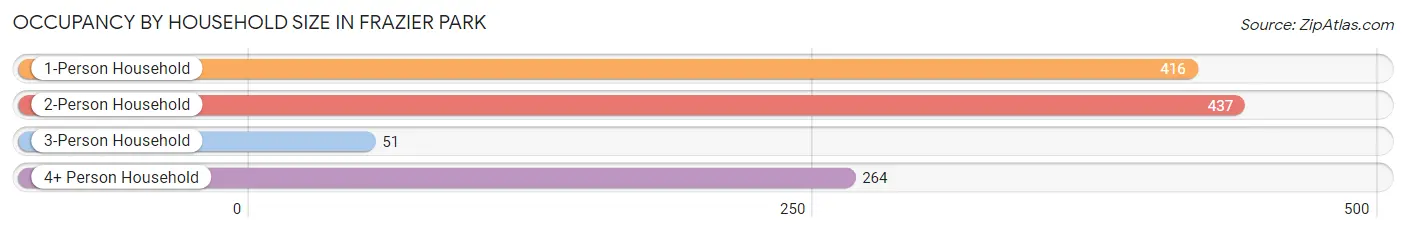
| Household Size | # Housing Units | % Housing Units |
| 1-Person Household | 416 | 35.6% |
| 2-Person Household | 437 | 37.4% |
| 3-Person Household | 51 | 4.4% |
| 4+ Person Household | 264 | 22.6% |
| Total Housing Units | 1,168 | 100.0% |
Occupancy by Ownership by Household Size in Frazier Park
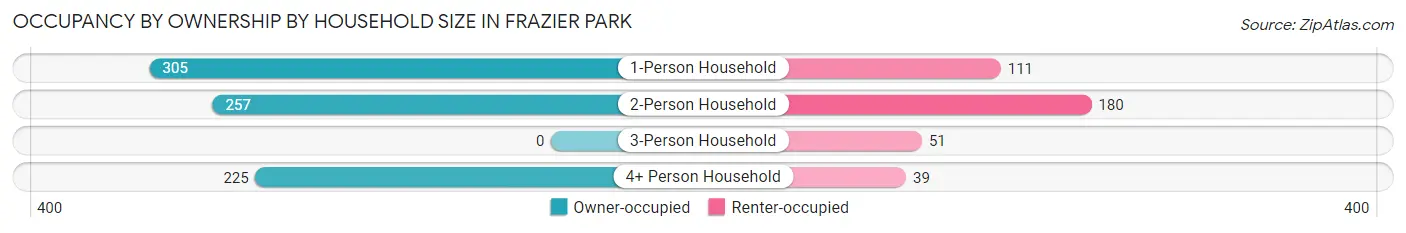
| Household Size | Owner-occupied | Renter-occupied |
| 1-Person Household | 305 (73.3%) | 111 (26.7%) |
| 2-Person Household | 257 (58.8%) | 180 (41.2%) |
| 3-Person Household | 0 (0.0%) | 51 (100.0%) |
| 4+ Person Household | 225 (85.2%) | 39 (14.8%) |
| Total Housing Units | 787 (67.4%) | 381 (32.6%) |
Occupancy by Educational Attainment in Frazier Park
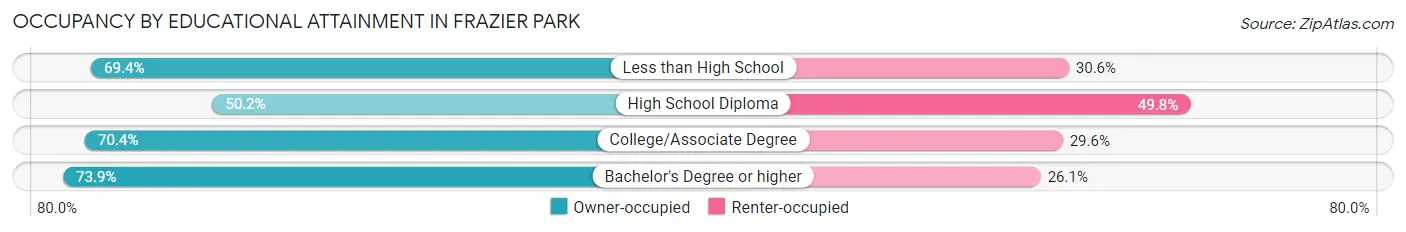
| Household Size | Owner-occupied | Renter-occupied |
| Less than High School | 75 (69.4%) | 33 (30.6%) |
| High School Diploma | 115 (50.2%) | 114 (49.8%) |
| College/Associate Degree | 345 (70.4%) | 145 (29.6%) |
| Bachelor's Degree or higher | 252 (73.9%) | 89 (26.1%) |
Occupancy by Age of Householder in Frazier Park
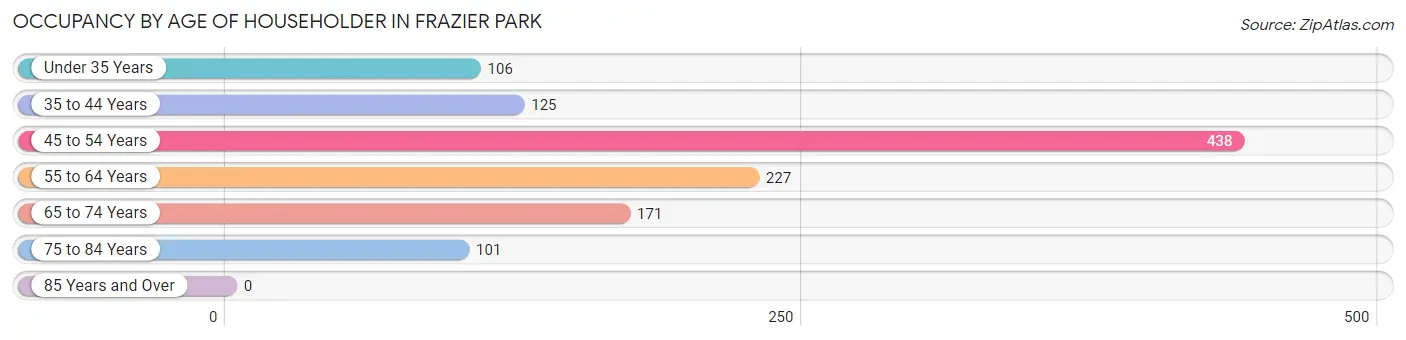
| Age Bracket | # Households | % Households |
| Under 35 Years | 106 | 9.1% |
| 35 to 44 Years | 125 | 10.7% |
| 45 to 54 Years | 438 | 37.5% |
| 55 to 64 Years | 227 | 19.4% |
| 65 to 74 Years | 171 | 14.6% |
| 75 to 84 Years | 101 | 8.6% |
| 85 Years and Over | 0 | 0.0% |
| Total | 1,168 | 100.0% |
Housing Finances in Frazier Park
Median Income by Occupancy in Frazier Park
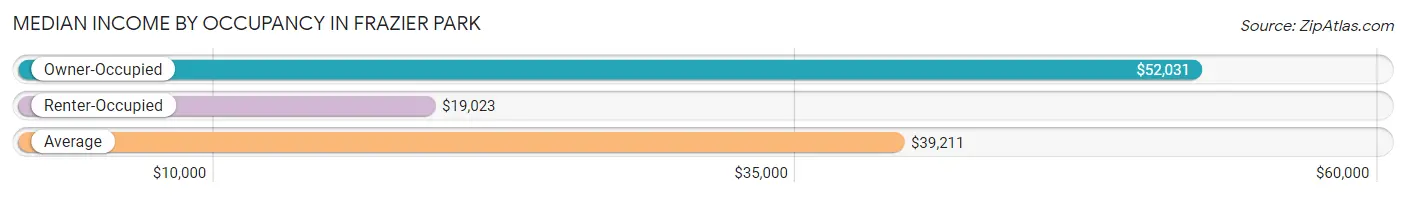
| Occupancy Type | # Households | Median Income |
| Owner-Occupied | 787 (67.4%) | $52,031 |
| Renter-Occupied | 381 (32.6%) | $19,023 |
| Average | 1,168 (100.0%) | $39,211 |
Occupancy by Householder Income Bracket in Frazier Park
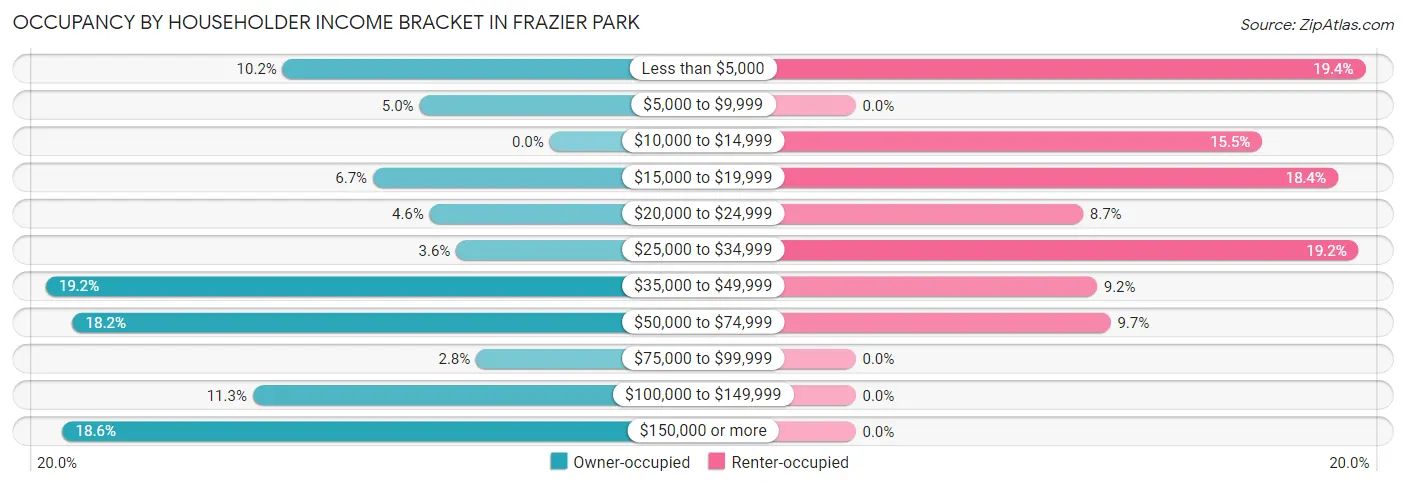
| Income Bracket | Owner-occupied | Renter-occupied |
| Less than $5,000 | 80 (10.2%) | 74 (19.4%) |
| $5,000 to $9,999 | 39 (5.0%) | 0 (0.0%) |
| $10,000 to $14,999 | 0 (0.0%) | 59 (15.5%) |
| $15,000 to $19,999 | 53 (6.7%) | 70 (18.4%) |
| $20,000 to $24,999 | 36 (4.6%) | 33 (8.7%) |
| $25,000 to $34,999 | 28 (3.6%) | 73 (19.2%) |
| $35,000 to $49,999 | 151 (19.2%) | 35 (9.2%) |
| $50,000 to $74,999 | 143 (18.2%) | 37 (9.7%) |
| $75,000 to $99,999 | 22 (2.8%) | 0 (0.0%) |
| $100,000 to $149,999 | 89 (11.3%) | 0 (0.0%) |
| $150,000 or more | 146 (18.5%) | 0 (0.0%) |
| Total | 787 (100.0%) | 381 (100.0%) |
Monthly Housing Cost Tiers in Frazier Park
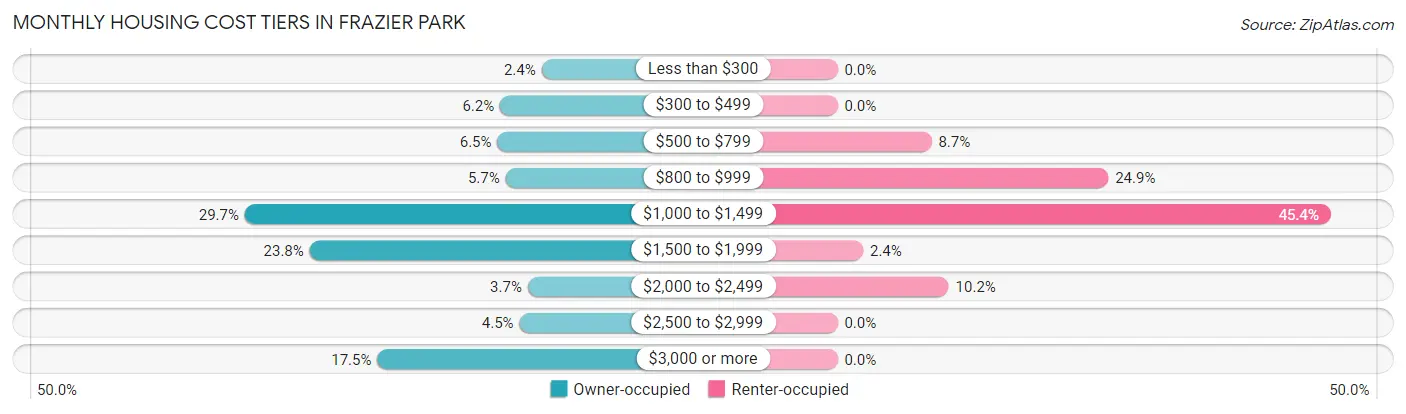
| Monthly Cost | Owner-occupied | Renter-occupied |
| Less than $300 | 19 (2.4%) | 0 (0.0%) |
| $300 to $499 | 49 (6.2%) | 0 (0.0%) |
| $500 to $799 | 51 (6.5%) | 33 (8.7%) |
| $800 to $999 | 45 (5.7%) | 95 (24.9%) |
| $1,000 to $1,499 | 234 (29.7%) | 173 (45.4%) |
| $1,500 to $1,999 | 187 (23.8%) | 9 (2.4%) |
| $2,000 to $2,499 | 29 (3.7%) | 39 (10.2%) |
| $2,500 to $2,999 | 35 (4.4%) | 0 (0.0%) |
| $3,000 or more | 138 (17.5%) | 0 (0.0%) |
| Total | 787 (100.0%) | 381 (100.0%) |
Physical Housing Characteristics in Frazier Park
Housing Structures in Frazier Park
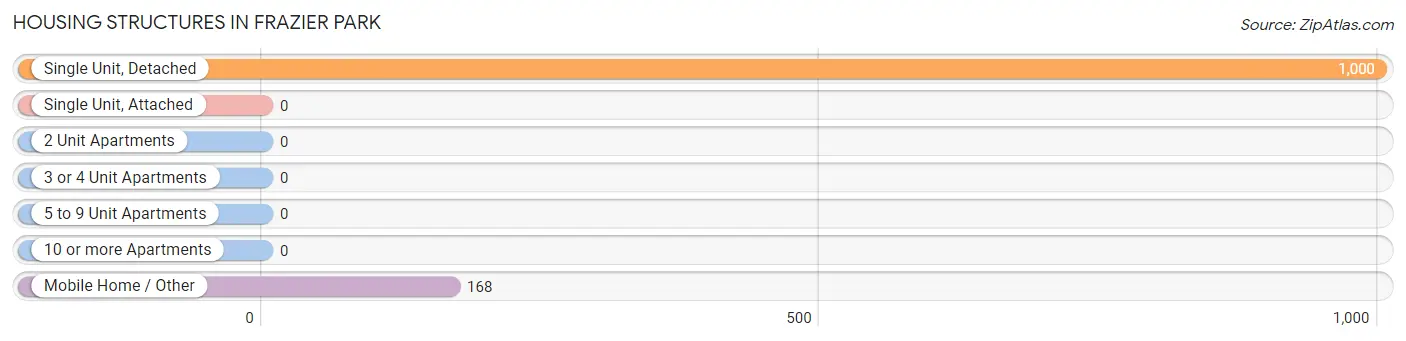
| Structure Type | # Housing Units | % Housing Units |
| Single Unit, Detached | 1,000 | 85.6% |
| Single Unit, Attached | 0 | 0.0% |
| 2 Unit Apartments | 0 | 0.0% |
| 3 or 4 Unit Apartments | 0 | 0.0% |
| 5 to 9 Unit Apartments | 0 | 0.0% |
| 10 or more Apartments | 0 | 0.0% |
| Mobile Home / Other | 168 | 14.4% |
| Total | 1,168 | 100.0% |
Housing Structures by Occupancy in Frazier Park
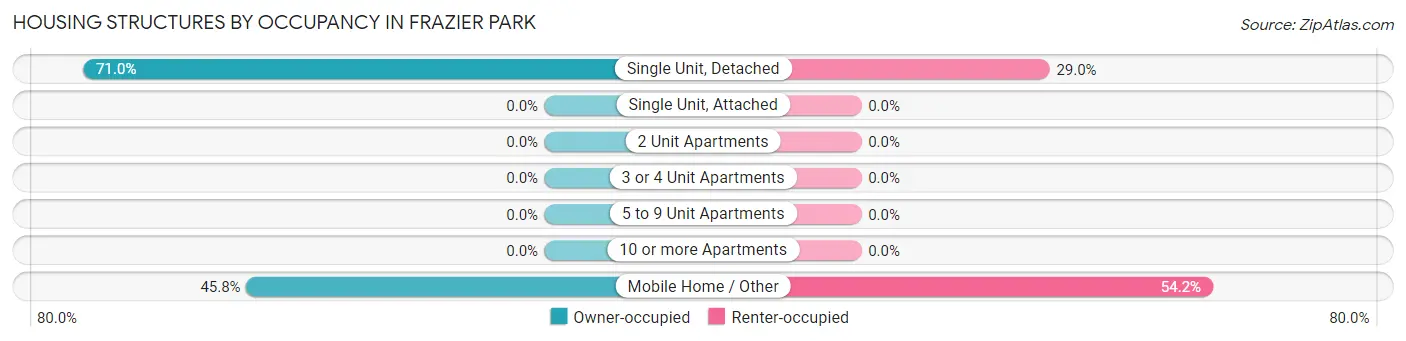
| Structure Type | Owner-occupied | Renter-occupied |
| Single Unit, Detached | 710 (71.0%) | 290 (29.0%) |
| Single Unit, Attached | 0 (0.0%) | 0 (0.0%) |
| 2 Unit Apartments | 0 (0.0%) | 0 (0.0%) |
| 3 or 4 Unit Apartments | 0 (0.0%) | 0 (0.0%) |
| 5 to 9 Unit Apartments | 0 (0.0%) | 0 (0.0%) |
| 10 or more Apartments | 0 (0.0%) | 0 (0.0%) |
| Mobile Home / Other | 77 (45.8%) | 91 (54.2%) |
| Total | 787 (67.4%) | 381 (32.6%) |
Housing Structures by Number of Rooms in Frazier Park
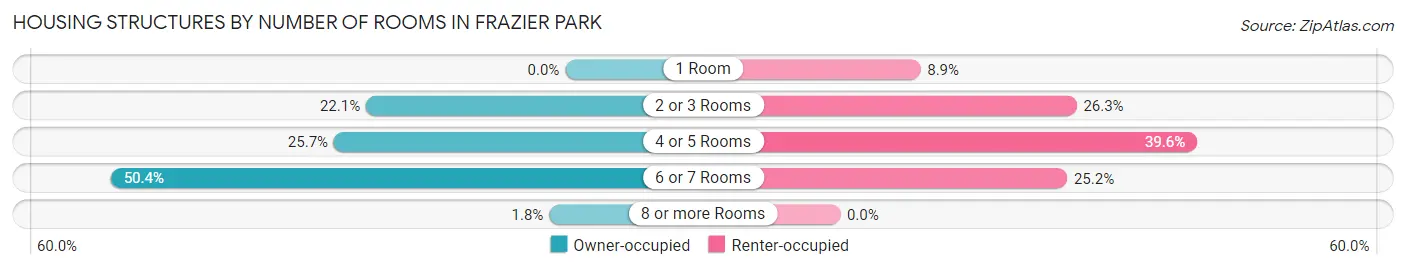
| Number of Rooms | Owner-occupied | Renter-occupied |
| 1 Room | 0 (0.0%) | 34 (8.9%) |
| 2 or 3 Rooms | 174 (22.1%) | 100 (26.3%) |
| 4 or 5 Rooms | 202 (25.7%) | 151 (39.6%) |
| 6 or 7 Rooms | 397 (50.4%) | 96 (25.2%) |
| 8 or more Rooms | 14 (1.8%) | 0 (0.0%) |
| Total | 787 (100.0%) | 381 (100.0%) |
Housing Structure by Heating Type in Frazier Park
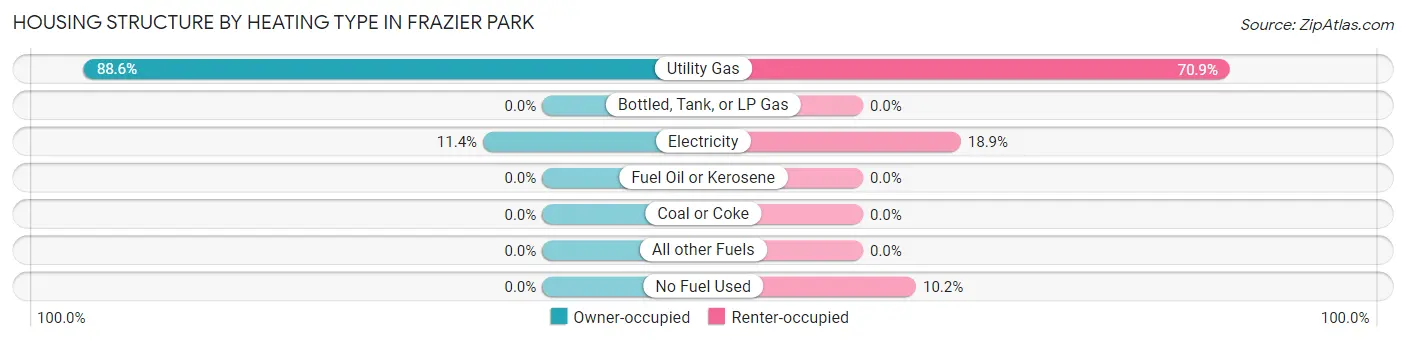
| Heating Type | Owner-occupied | Renter-occupied |
| Utility Gas | 697 (88.6%) | 270 (70.9%) |
| Bottled, Tank, or LP Gas | 0 (0.0%) | 0 (0.0%) |
| Electricity | 90 (11.4%) | 72 (18.9%) |
| Fuel Oil or Kerosene | 0 (0.0%) | 0 (0.0%) |
| Coal or Coke | 0 (0.0%) | 0 (0.0%) |
| All other Fuels | 0 (0.0%) | 0 (0.0%) |
| No Fuel Used | 0 (0.0%) | 39 (10.2%) |
| Total | 787 (100.0%) | 381 (100.0%) |
Household Vehicle Usage in Frazier Park
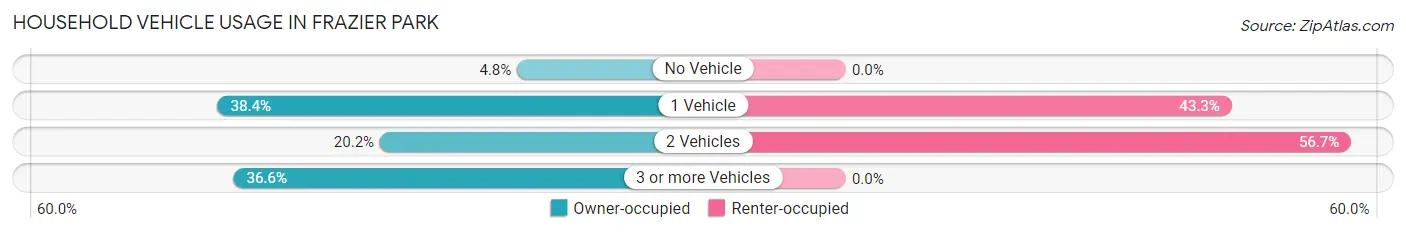
| Vehicles per Household | Owner-occupied | Renter-occupied |
| No Vehicle | 38 (4.8%) | 0 (0.0%) |
| 1 Vehicle | 302 (38.4%) | 165 (43.3%) |
| 2 Vehicles | 159 (20.2%) | 216 (56.7%) |
| 3 or more Vehicles | 288 (36.6%) | 0 (0.0%) |
| Total | 787 (100.0%) | 381 (100.0%) |
Real Estate & Mortgages in Frazier Park
Real Estate and Mortgage Overview in Frazier Park
| Characteristic | Without Mortgage | With Mortgage |
| Housing Units | 92 | 695 |
| Median Property Value | - | - |
| Median Household Income | $15,515 | $146 |
| Monthly Housing Costs | $979 | $138 |
| Real Estate Taxes | - | - |
Property Value by Mortgage Status in Frazier Park
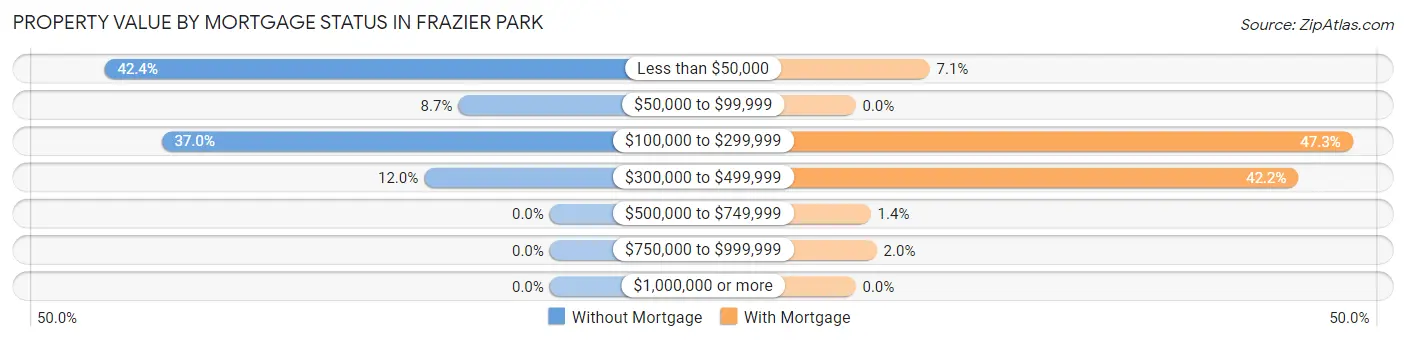
| Property Value | Without Mortgage | With Mortgage |
| Less than $50,000 | 39 (42.4%) | 49 (7.0%) |
| $50,000 to $99,999 | 8 (8.7%) | 0 (0.0%) |
| $100,000 to $299,999 | 34 (37.0%) | 329 (47.3%) |
| $300,000 to $499,999 | 11 (12.0%) | 293 (42.2%) |
| $500,000 to $749,999 | 0 (0.0%) | 10 (1.4%) |
| $750,000 to $999,999 | 0 (0.0%) | 14 (2.0%) |
| $1,000,000 or more | 0 (0.0%) | 0 (0.0%) |
| Total | 92 (100.0%) | 695 (100.0%) |
Household Income by Mortgage Status in Frazier Park
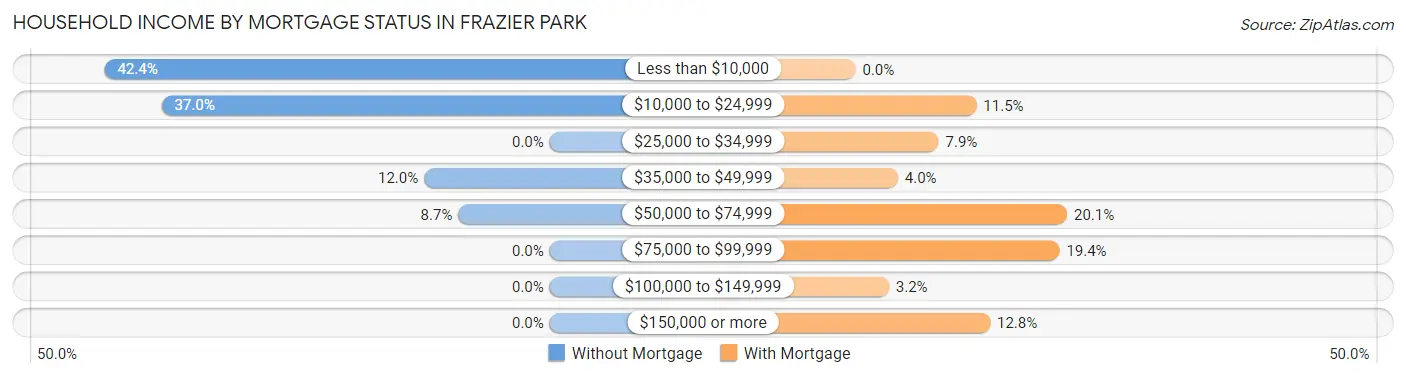
| Household Income | Without Mortgage | With Mortgage |
| Less than $10,000 | 39 (42.4%) | 0 (0.0%) |
| $10,000 to $24,999 | 34 (37.0%) | 80 (11.5%) |
| $25,000 to $34,999 | 0 (0.0%) | 55 (7.9%) |
| $35,000 to $49,999 | 11 (12.0%) | 28 (4.0%) |
| $50,000 to $74,999 | 8 (8.7%) | 140 (20.1%) |
| $75,000 to $99,999 | 0 (0.0%) | 135 (19.4%) |
| $100,000 to $149,999 | 0 (0.0%) | 22 (3.2%) |
| $150,000 or more | 0 (0.0%) | 89 (12.8%) |
| Total | 92 (100.0%) | 695 (100.0%) |
Property Value to Household Income Ratio in Frazier Park
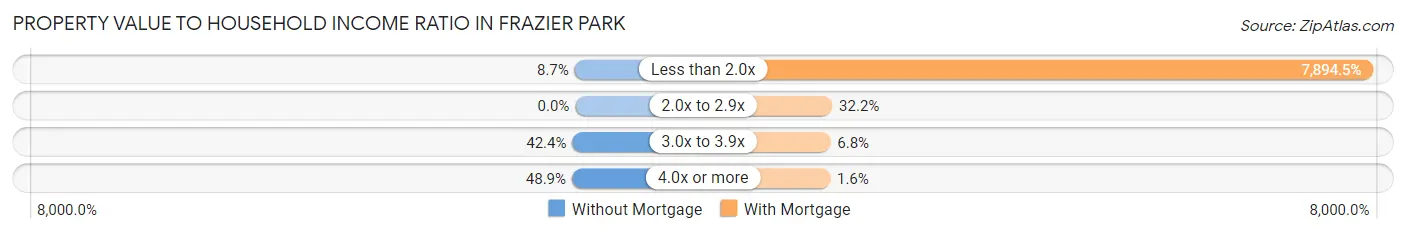
| Value-to-Income Ratio | Without Mortgage | With Mortgage |
| Less than 2.0x | 8 (8.7%) | 54,867 (7,894.5%) |
| 2.0x to 2.9x | 0 (0.0%) | 224 (32.2%) |
| 3.0x to 3.9x | 39 (42.4%) | 47 (6.8%) |
| 4.0x or more | 45 (48.9%) | 11 (1.6%) |
| Total | 92 (100.0%) | 695 (100.0%) |
Real Estate Taxes by Mortgage Status in Frazier Park
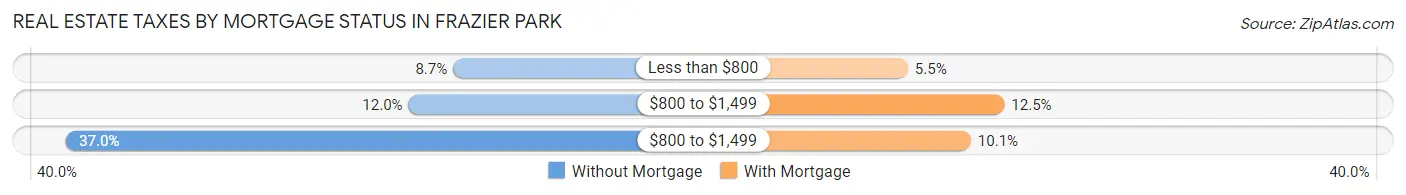
| Property Taxes | Without Mortgage | With Mortgage |
| Less than $800 | 8 (8.7%) | 38 (5.5%) |
| $800 to $1,499 | 11 (12.0%) | 87 (12.5%) |
| $800 to $1,499 | 34 (37.0%) | 70 (10.1%) |
| Total | 92 (100.0%) | 695 (100.0%) |
Health & Disability in Frazier Park
Health Insurance Coverage by Age in Frazier Park
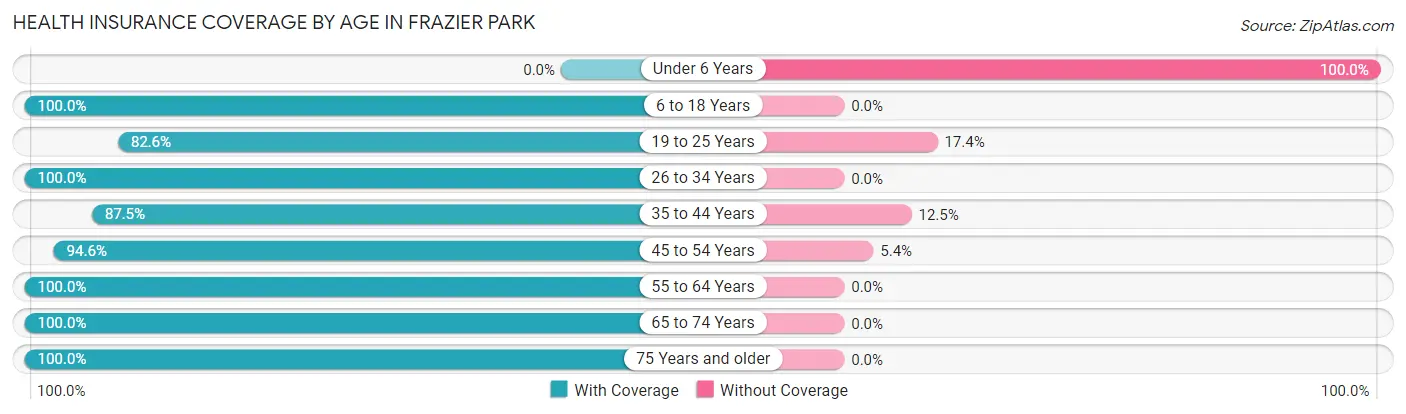
| Age Bracket | With Coverage | Without Coverage |
| Under 6 Years | 0 (0.0%) | 50 (100.0%) |
| 6 to 18 Years | 380 (100.0%) | 0 (0.0%) |
| 19 to 25 Years | 328 (82.6%) | 69 (17.4%) |
| 26 to 34 Years | 175 (100.0%) | 0 (0.0%) |
| 35 to 44 Years | 258 (87.5%) | 37 (12.5%) |
| 45 to 54 Years | 541 (94.6%) | 31 (5.4%) |
| 55 to 64 Years | 435 (100.0%) | 0 (0.0%) |
| 65 to 74 Years | 314 (100.0%) | 0 (0.0%) |
| 75 Years and older | 101 (100.0%) | 0 (0.0%) |
| Total | 2,532 (93.1%) | 187 (6.9%) |
Health Insurance Coverage by Citizenship Status in Frazier Park
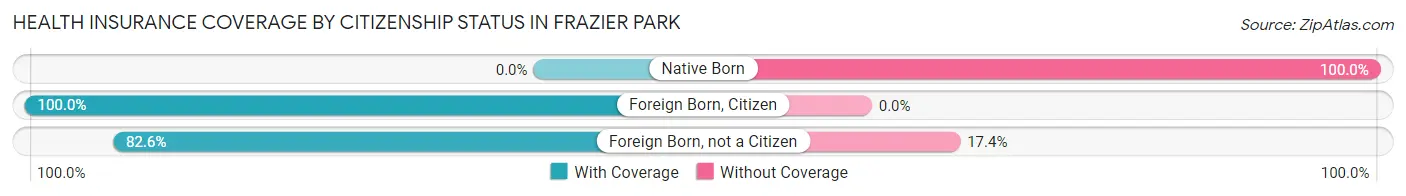
| Citizenship Status | With Coverage | Without Coverage |
| Native Born | 0 (0.0%) | 50 (100.0%) |
| Foreign Born, Citizen | 380 (100.0%) | 0 (0.0%) |
| Foreign Born, not a Citizen | 328 (82.6%) | 69 (17.4%) |
Health Insurance Coverage by Household Income in Frazier Park
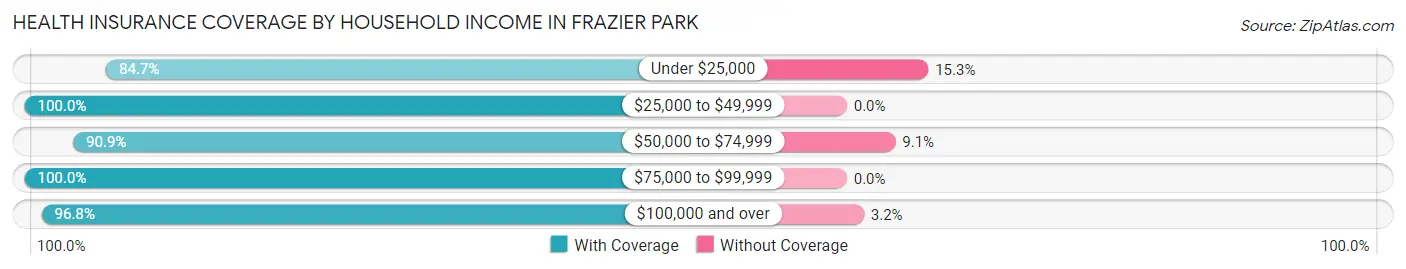
| Household Income | With Coverage | Without Coverage |
| Under $25,000 | 661 (84.7%) | 119 (15.3%) |
| $25,000 to $49,999 | 519 (100.0%) | 0 (0.0%) |
| $50,000 to $74,999 | 370 (90.9%) | 37 (9.1%) |
| $75,000 to $99,999 | 42 (100.0%) | 0 (0.0%) |
| $100,000 and over | 940 (96.8%) | 31 (3.2%) |
Public vs Private Health Insurance Coverage by Age in Frazier Park
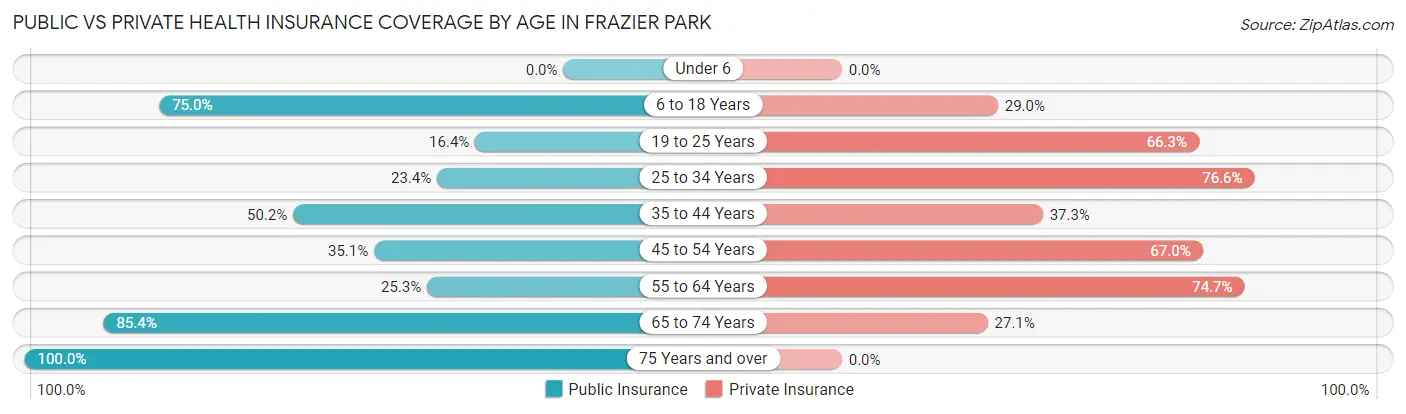
| Age Bracket | Public Insurance | Private Insurance |
| Under 6 | 0 (0.0%) | 0 (0.0%) |
| 6 to 18 Years | 285 (75.0%) | 110 (28.9%) |
| 19 to 25 Years | 65 (16.4%) | 263 (66.2%) |
| 25 to 34 Years | 41 (23.4%) | 134 (76.6%) |
| 35 to 44 Years | 148 (50.2%) | 110 (37.3%) |
| 45 to 54 Years | 201 (35.1%) | 383 (67.0%) |
| 55 to 64 Years | 110 (25.3%) | 325 (74.7%) |
| 65 to 74 Years | 268 (85.4%) | 85 (27.1%) |
| 75 Years and over | 101 (100.0%) | 0 (0.0%) |
| Total | 1,219 (44.8%) | 1,410 (51.9%) |
Disability Status by Sex by Age in Frazier Park
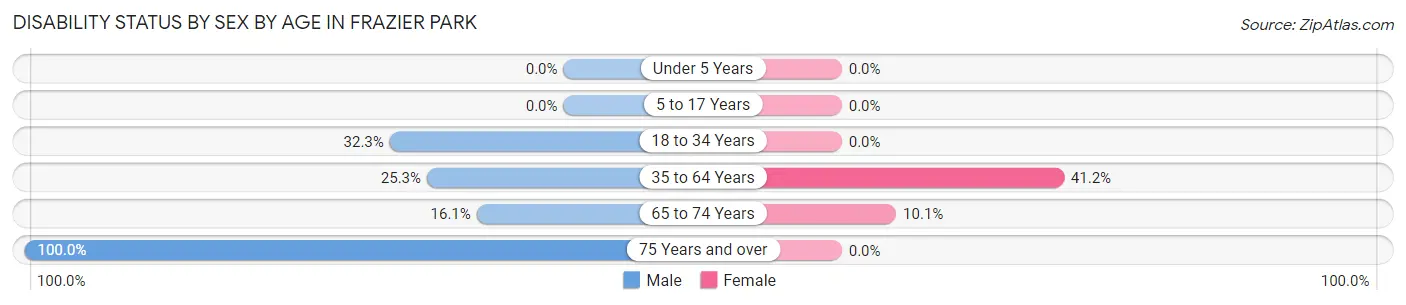
| Age Bracket | Male | Female |
| Under 5 Years | 0 (0.0%) | 0 (0.0%) |
| 5 to 17 Years | 0 (0.0%) | 0 (0.0%) |
| 18 to 34 Years | 139 (32.3%) | 0 (0.0%) |
| 35 to 64 Years | 132 (25.3%) | 322 (41.2%) |
| 65 to 74 Years | 33 (16.1%) | 11 (10.1%) |
| 75 Years and over | 67 (100.0%) | 0 (0.0%) |
Disability Class by Sex by Age in Frazier Park
Disability Class: Hearing Difficulty
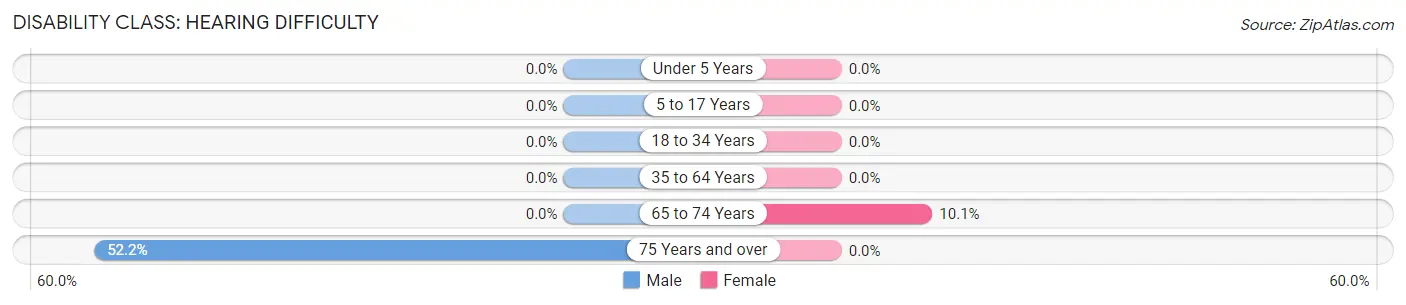
| Age Bracket | Male | Female |
| Under 5 Years | 0 (0.0%) | 0 (0.0%) |
| 5 to 17 Years | 0 (0.0%) | 0 (0.0%) |
| 18 to 34 Years | 0 (0.0%) | 0 (0.0%) |
| 35 to 64 Years | 0 (0.0%) | 0 (0.0%) |
| 65 to 74 Years | 0 (0.0%) | 11 (10.1%) |
| 75 Years and over | 35 (52.2%) | 0 (0.0%) |
Disability Class: Vision Difficulty
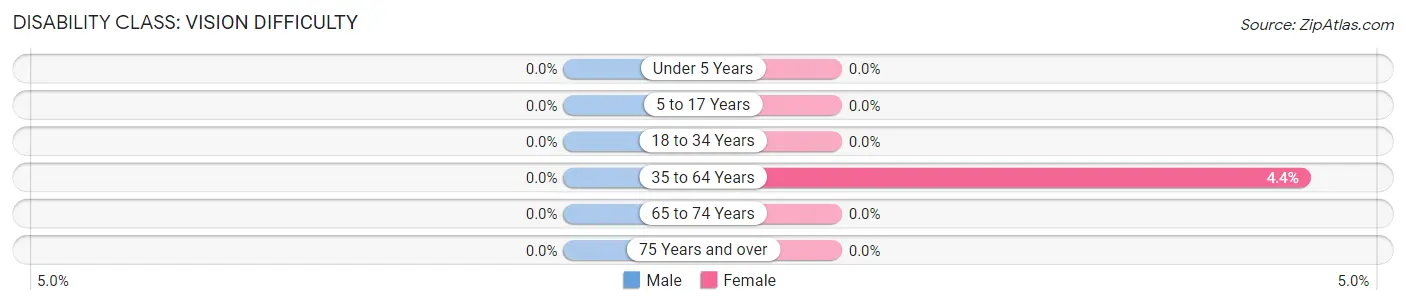
| Age Bracket | Male | Female |
| Under 5 Years | 0 (0.0%) | 0 (0.0%) |
| 5 to 17 Years | 0 (0.0%) | 0 (0.0%) |
| 18 to 34 Years | 0 (0.0%) | 0 (0.0%) |
| 35 to 64 Years | 0 (0.0%) | 34 (4.3%) |
| 65 to 74 Years | 0 (0.0%) | 0 (0.0%) |
| 75 Years and over | 0 (0.0%) | 0 (0.0%) |
Disability Class: Cognitive Difficulty
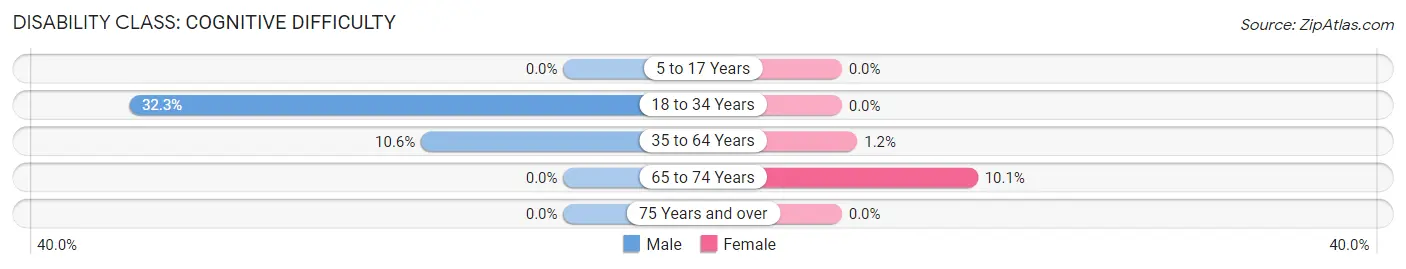
| Age Bracket | Male | Female |
| 5 to 17 Years | 0 (0.0%) | 0 (0.0%) |
| 18 to 34 Years | 139 (32.3%) | 0 (0.0%) |
| 35 to 64 Years | 55 (10.6%) | 9 (1.1%) |
| 65 to 74 Years | 0 (0.0%) | 11 (10.1%) |
| 75 Years and over | 0 (0.0%) | 0 (0.0%) |
Disability Class: Ambulatory Difficulty
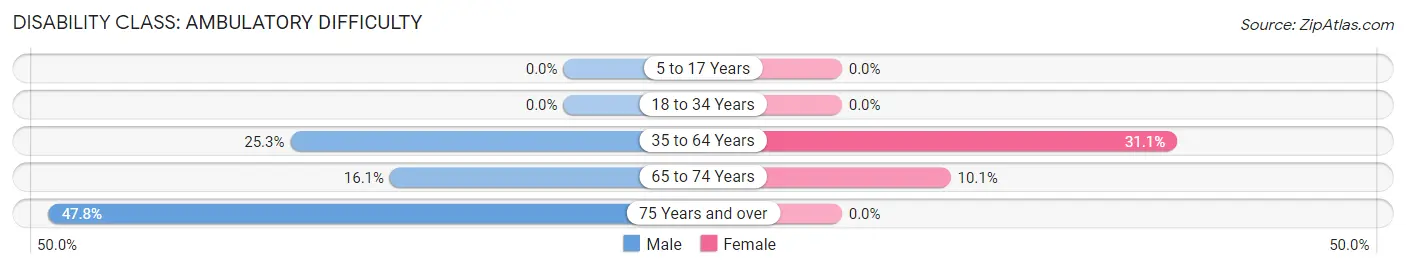
| Age Bracket | Male | Female |
| 5 to 17 Years | 0 (0.0%) | 0 (0.0%) |
| 18 to 34 Years | 0 (0.0%) | 0 (0.0%) |
| 35 to 64 Years | 132 (25.3%) | 243 (31.1%) |
| 65 to 74 Years | 33 (16.1%) | 11 (10.1%) |
| 75 Years and over | 32 (47.8%) | 0 (0.0%) |
Disability Class: Self-Care Difficulty
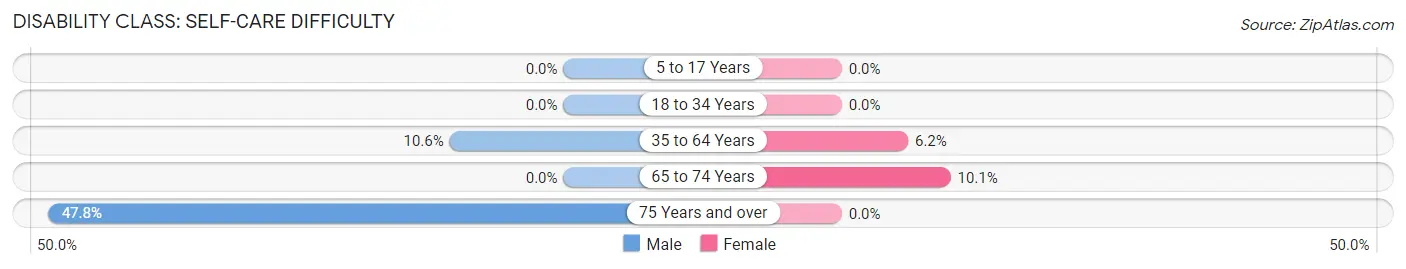
| Age Bracket | Male | Female |
| 5 to 17 Years | 0 (0.0%) | 0 (0.0%) |
| 18 to 34 Years | 0 (0.0%) | 0 (0.0%) |
| 35 to 64 Years | 55 (10.6%) | 48 (6.1%) |
| 65 to 74 Years | 0 (0.0%) | 11 (10.1%) |
| 75 Years and over | 32 (47.8%) | 0 (0.0%) |
Technology Access in Frazier Park
Computing Device Access in Frazier Park
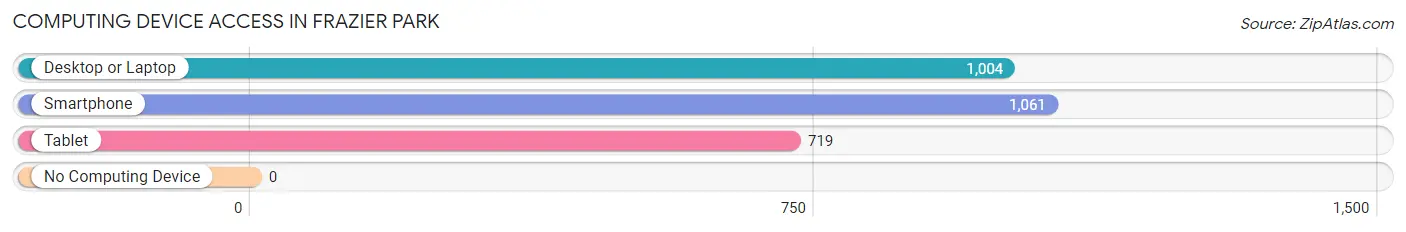
| Device Type | # Households | % Households |
| Desktop or Laptop | 1,004 | 86.0% |
| Smartphone | 1,061 | 90.8% |
| Tablet | 719 | 61.6% |
| No Computing Device | 0 | 0.0% |
| Total | 1,168 | 100.0% |
Internet Access in Frazier Park
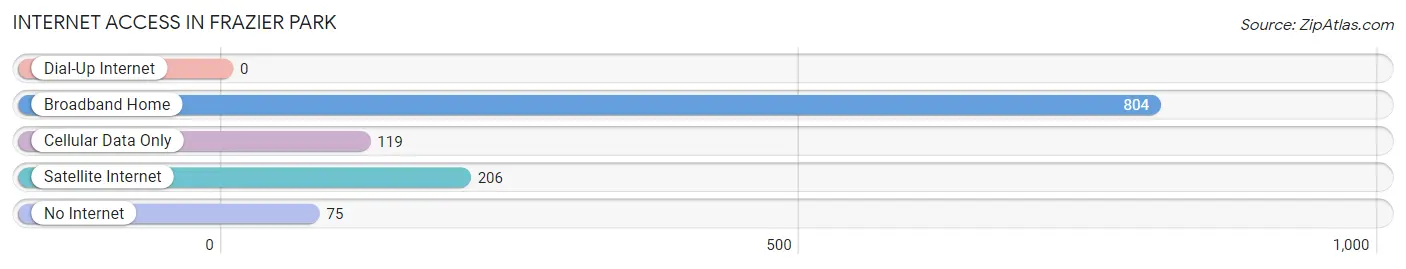
| Internet Type | # Households | % Households |
| Dial-Up Internet | 0 | 0.0% |
| Broadband Home | 804 | 68.8% |
| Cellular Data Only | 119 | 10.2% |
| Satellite Internet | 206 | 17.6% |
| No Internet | 75 | 6.4% |
| Total | 1,168 | 100.0% |
Frazier Park Summary
Frazier Park is a small unincorporated community located in the mountains of the Tejon Pass in Kern County, California. It is situated at an elevation of 4,639 feet (1,414 m) above sea level, and is located about 40 miles (64 km) north of Los Angeles. The community is part of the Mountain Communities of the Tejon Pass, which includes the nearby towns of Lebec, Lake of the Woods, and Pine Mountain Club.
History
Frazier Park was founded in 1927 by George Frazier, a former mayor of Los Angeles. He purchased the land from the Southern Pacific Railroad and named it after himself. The town was originally intended to be a resort community, but it never quite achieved that goal. Instead, it became a small, rural community with a population of about 2,000 people.
The town was incorporated in 1947, but it was disincorporated in 1964 due to financial difficulties. Since then, it has remained an unincorporated community.
Geography
Frazier Park is located in the Tehachapi Mountains, which are part of the Transverse Ranges. The town is situated at an elevation of 4,639 feet (1,414 m) above sea level. It is located about 40 miles (64 km) north of Los Angeles.
The town is surrounded by the Los Padres National Forest, which covers an area of 1.75 million acres (7,100 km2). The forest is home to a variety of wildlife, including black bears, mountain lions, and bald eagles.
The climate in Frazier Park is semi-arid, with hot summers and cold winters. The average annual temperature is 57 °F (14 °C). The average annual precipitation is 12.5 inches (318 mm).
Economy
Frazier Park is a small, rural community with a population of about 2,000 people. The town is home to a variety of businesses, including restaurants, gas stations, and convenience stores. The town also has a small airport, which is used for private planes.
The town is also home to a variety of outdoor recreation activities, including camping, hiking, fishing, and hunting. The nearby Los Padres National Forest offers a variety of activities, including camping, hiking, and horseback riding.
Demographics
As of the 2010 census, the population of Frazier Park was 2,691. The racial makeup of the town was 81.3% White, 0.7% African American, 0.7% Native American, 0.7% Asian, 0.1% Pacific Islander, 11.7% from other races, and 4.6% from two or more races. Hispanic or Latino of any race were 24.3% of the population.
The median household income in Frazier Park was $41,250, and the median family income was $45,000. The per capita income was $19,945. About 15.2% of families and 18.2% of the population were below the poverty line, including 25.2% of those under age 18 and 8.3% of those age 65 or over.
Common Questions
What is Per Capita Income in Frazier Park?
Per Capita income in Frazier Park is $27,942.
What is the Median Family Income in Frazier Park?
Median Family Income in Frazier Park is $52,736.
What is the Median Household income in Frazier Park?
Median Household Income in Frazier Park is $39,211.
What is Inequality or Gini Index in Frazier Park?
Inequality or Gini Index in Frazier Park is 0.59.
What is the Total Population of Frazier Park?
Total Population of Frazier Park is 2,719.
What is the Total Male Population of Frazier Park?
Total Male Population of Frazier Park is 1,416.
What is the Total Female Population of Frazier Park?
Total Female Population of Frazier Park is 1,303.
What is the Ratio of Males per 100 Females in Frazier Park?
There are 108.67 Males per 100 Females in Frazier Park.
What is the Ratio of Females per 100 Males in Frazier Park?
There are 92.02 Females per 100 Males in Frazier Park.
What is the Median Population Age in Frazier Park?
Median Population Age in Frazier Park is 45.6 Years.
What is the Average Family Size in Frazier Park
Average Family Size in Frazier Park is 2.8 People.
What is the Average Household Size in Frazier Park
Average Household Size in Frazier Park is 2.3 People.
How Large is the Labor Force in Frazier Park?
There are 1,439 People in the Labor Forcein in Frazier Park.
What is the Percentage of People in the Labor Force in Frazier Park?
58.5% of People are in the Labor Force in Frazier Park.
What is the Unemployment Rate in Frazier Park?
Unemployment Rate in Frazier Park is 9.9%.