Piney Point Village, TX Map & Demographics
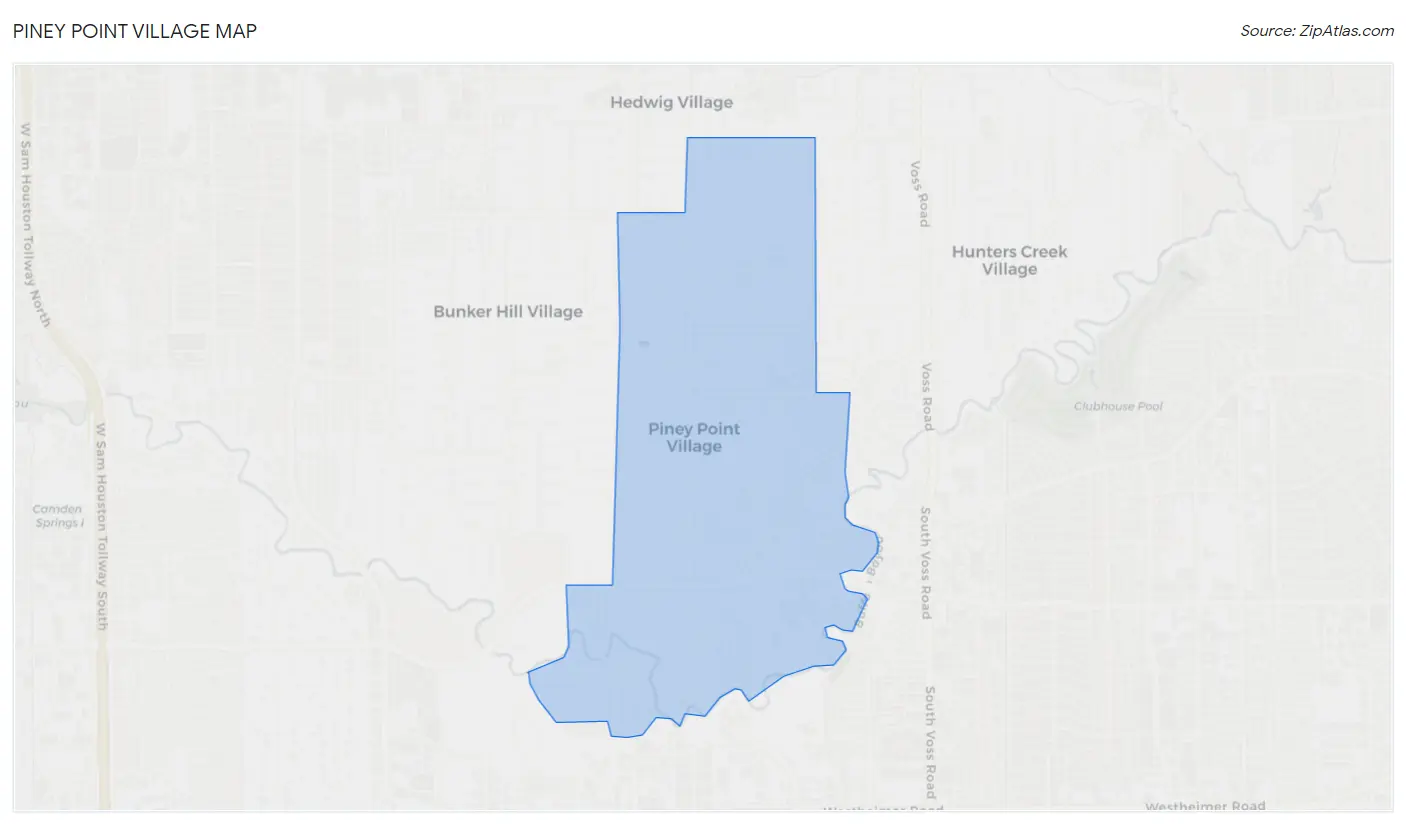
Piney Point Village Map
Piney Point Village Overview
$187,796
PER CAPITA INCOME
$250,001
AVG FAMILY INCOME
$250,001
AVG HOUSEHOLD INCOME
43.0%
WAGE / INCOME GAP [ % ]
57.0¢/ $1
WAGE / INCOME GAP [ $ ]
0.46
INEQUALITY / GINI INDEX
3,114
TOTAL POPULATION
1,652
MALE POPULATION
1,462
FEMALE POPULATION
113.00
MALES / 100 FEMALES
88.50
FEMALES / 100 MALES
51.8
MEDIAN AGE
3.0
AVG FAMILY SIZE
2.7
AVG HOUSEHOLD SIZE
1,579
LABOR FORCE [ PEOPLE ]
59.6%
PERCENT IN LABOR FORCE
9.4%
UNEMPLOYMENT RATE
Income in Piney Point Village
Income Overview in Piney Point Village
Per Capita Income in Piney Point Village is $187,796, while median incomes of families and households are $250,001 and $250,001 respectively.
| Characteristic | Number | Measure |
| Per Capita Income | 3,114 | $187,796 |
| Median Family Income | 988 | $250,001 |
| Mean Family Income | 988 | $556,773 |
| Median Household Income | 1,146 | $250,001 |
| Mean Household Income | 1,146 | $501,062 |
| Income Deficit | 988 | $0 |
| Wage / Income Gap (%) | 3,114 | 42.95% |
| Wage / Income Gap ($) | 3,114 | 57.05¢ per $1 |
| Gini / Inequality Index | 3,114 | 0.46 |
Earnings by Sex in Piney Point Village
Average Earnings in Piney Point Village are $130,461, $143,153 for men and $81,667 for women, a difference of 42.9%.
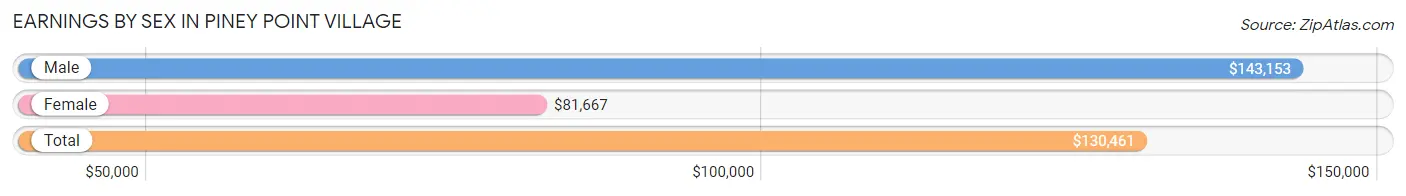
| Sex | Number | Average Earnings |
| Male | 1,031 (64.2%) | $143,153 |
| Female | 574 (35.8%) | $81,667 |
| Total | 1,605 (100.0%) | $130,461 |
Earnings by Sex by Income Bracket in Piney Point Village
The most common earnings brackets in Piney Point Village are $100,000+ for men (592 | 57.4%) and $100,000+ for women (269 | 46.9%).
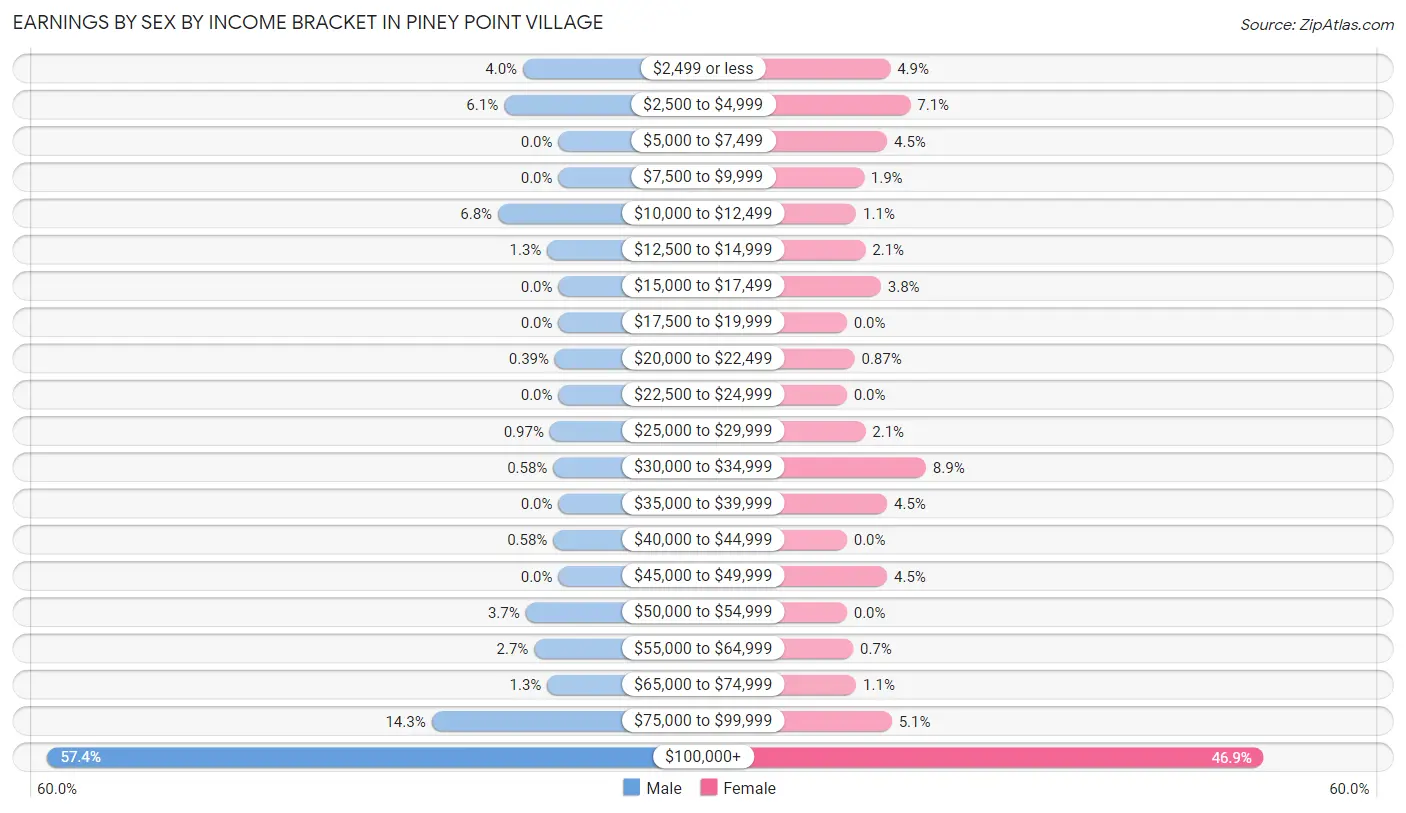
| Income | Male | Female |
| $2,499 or less | 41 (4.0%) | 28 (4.9%) |
| $2,500 to $4,999 | 63 (6.1%) | 41 (7.1%) |
| $5,000 to $7,499 | 0 (0.0%) | 26 (4.5%) |
| $7,500 to $9,999 | 0 (0.0%) | 11 (1.9%) |
| $10,000 to $12,499 | 70 (6.8%) | 6 (1.1%) |
| $12,500 to $14,999 | 13 (1.3%) | 12 (2.1%) |
| $15,000 to $17,499 | 0 (0.0%) | 22 (3.8%) |
| $17,500 to $19,999 | 0 (0.0%) | 0 (0.0%) |
| $20,000 to $22,499 | 4 (0.4%) | 5 (0.9%) |
| $22,500 to $24,999 | 0 (0.0%) | 0 (0.0%) |
| $25,000 to $29,999 | 10 (1.0%) | 12 (2.1%) |
| $30,000 to $34,999 | 6 (0.6%) | 51 (8.9%) |
| $35,000 to $39,999 | 0 (0.0%) | 26 (4.5%) |
| $40,000 to $44,999 | 6 (0.6%) | 0 (0.0%) |
| $45,000 to $49,999 | 0 (0.0%) | 26 (4.5%) |
| $50,000 to $54,999 | 38 (3.7%) | 0 (0.0%) |
| $55,000 to $64,999 | 28 (2.7%) | 4 (0.7%) |
| $65,000 to $74,999 | 13 (1.3%) | 6 (1.1%) |
| $75,000 to $99,999 | 147 (14.3%) | 29 (5.1%) |
| $100,000+ | 592 (57.4%) | 269 (46.9%) |
| Total | 1,031 (100.0%) | 574 (100.0%) |
Earnings by Sex by Educational Attainment in Piney Point Village
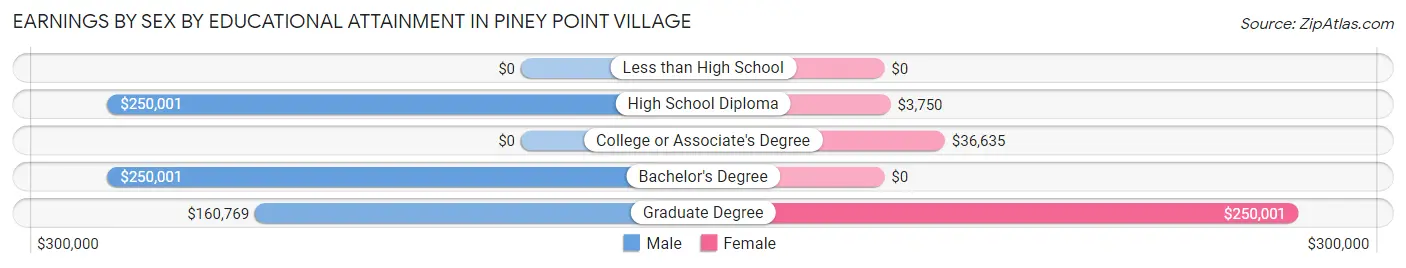
| Educational Attainment | Male Income | Female Income |
| Less than High School | - | - |
| High School Diploma | $250,001 | $3,750 |
| College or Associate's Degree | - | - |
| Bachelor's Degree | $250,001 | $0 |
| Graduate Degree | $160,769 | $250,001 |
| Total | $156,875 | $0 |
Family Income in Piney Point Village
Family Income Brackets in Piney Point Village
According to the Piney Point Village family income data, there are 747 families falling into the $200,000+ income range, which is the most common income bracket and makes up 75.6% of all families.
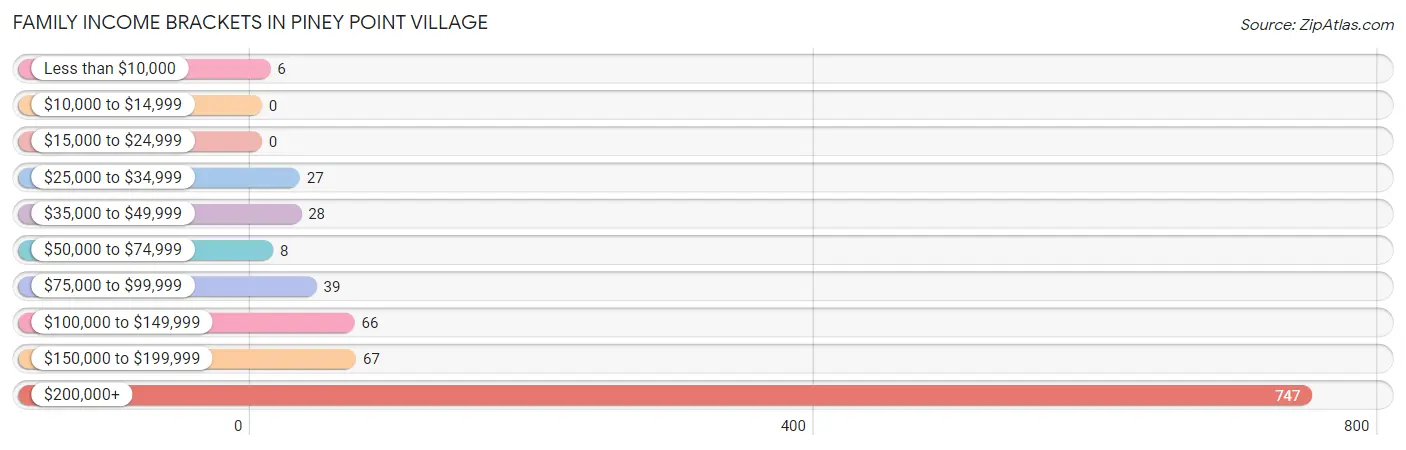
| Income Bracket | # Families | % Families |
| Less than $10,000 | 6 | 0.6% |
| $10,000 to $14,999 | 0 | 0.0% |
| $15,000 to $24,999 | 0 | 0.0% |
| $25,000 to $34,999 | 27 | 2.7% |
| $35,000 to $49,999 | 28 | 2.8% |
| $50,000 to $74,999 | 8 | 0.8% |
| $75,000 to $99,999 | 39 | 3.9% |
| $100,000 to $149,999 | 66 | 6.7% |
| $150,000 to $199,999 | 67 | 6.8% |
| $200,000+ | 747 | 75.6% |
Family Income by Famaliy Size in Piney Point Village
2-person families (482 | 48.8%) account for the highest median family income in Piney Point Village with $250,001 per family, while 2-person families (482 | 48.8%) have the highest median income of $125,000 per family member.
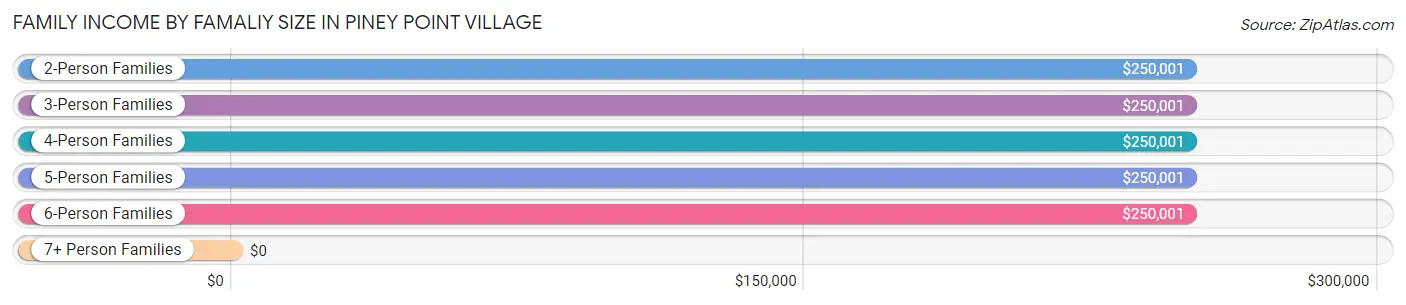
| Income Bracket | # Families | Median Income |
| 2-Person Families | 482 (48.8%) | $250,001 |
| 3-Person Families | 204 (20.6%) | $250,001 |
| 4-Person Families | 247 (25.0%) | $250,001 |
| 5-Person Families | 28 (2.8%) | $250,001 |
| 6-Person Families | 22 (2.2%) | $250,001 |
| 7+ Person Families | 5 (0.5%) | $0 |
| Total | 988 (100.0%) | $250,001 |
Family Income by Number of Earners in Piney Point Village
The median family income in Piney Point Village is $250,001, with families comprising 1 earner (306) having the highest median family income of $250,001, while families with no earners (182) have the lowest median family income of $188,750, accounting for 31.0% and 18.4% of families, respectively.
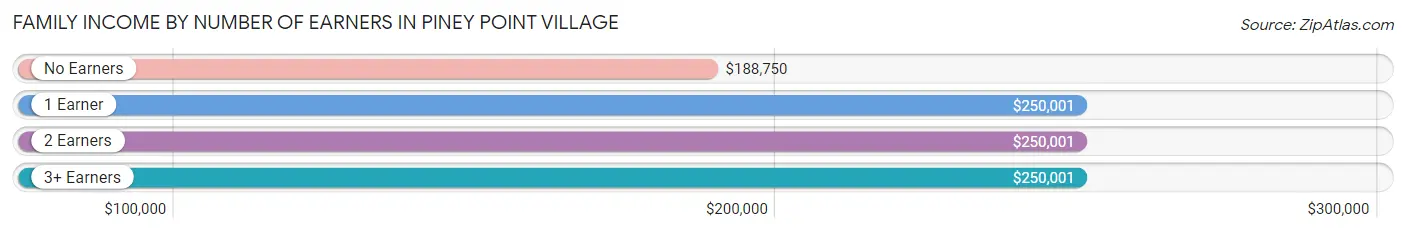
| Number of Earners | # Families | Median Income |
| No Earners | 182 (18.4%) | $188,750 |
| 1 Earner | 306 (31.0%) | $250,001 |
| 2 Earners | 332 (33.6%) | $250,001 |
| 3+ Earners | 168 (17.0%) | $250,001 |
| Total | 988 (100.0%) | $250,001 |
Household Income in Piney Point Village
Household Income Brackets in Piney Point Village
With 788 households falling in the category, the $200,000+ income range is the most frequent in Piney Point Village, accounting for 68.8% of all households.
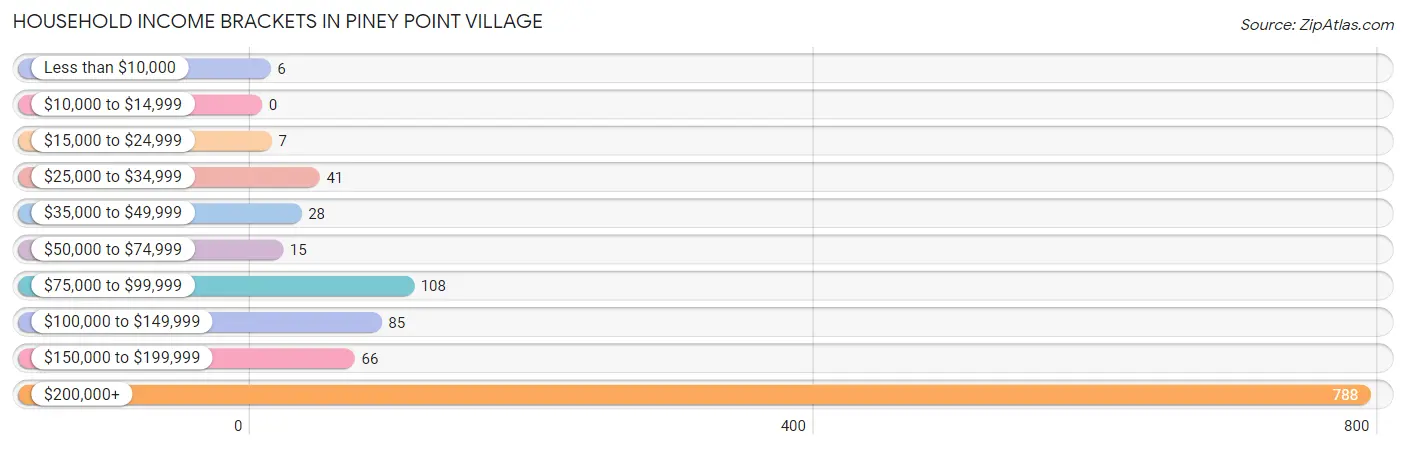
| Income Bracket | # Households | % Households |
| Less than $10,000 | 6 | 0.5% |
| $10,000 to $14,999 | 0 | 0.0% |
| $15,000 to $24,999 | 7 | 0.6% |
| $25,000 to $34,999 | 41 | 3.6% |
| $35,000 to $49,999 | 28 | 2.4% |
| $50,000 to $74,999 | 15 | 1.3% |
| $75,000 to $99,999 | 108 | 9.4% |
| $100,000 to $149,999 | 85 | 7.4% |
| $150,000 to $199,999 | 66 | 5.8% |
| $200,000+ | 788 | 68.8% |
Household Income by Householder Age in Piney Point Village
The median household income in Piney Point Village is $250,001, with the highest median household income of $250,001 found in the 25 to 44 years age bracket for the primary householder. A total of 97 households (8.5%) fall into this category.
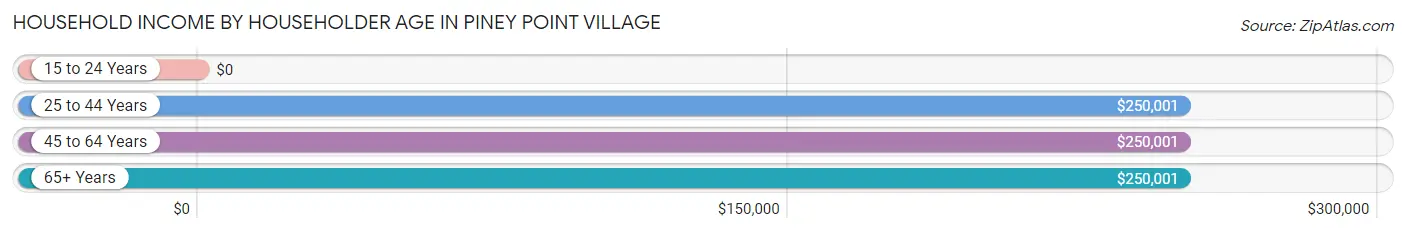
| Income Bracket | # Households | Median Income |
| 15 to 24 Years | 0 (0.0%) | $0 |
| 25 to 44 Years | 97 (8.5%) | $250,001 |
| 45 to 64 Years | 626 (54.6%) | $250,001 |
| 65+ Years | 423 (36.9%) | $250,001 |
| Total | 1,146 (100.0%) | $250,001 |
Poverty in Piney Point Village
Income Below Poverty by Sex and Age in Piney Point Village
With 0.7% poverty level for males and 0.7% for females among the residents of Piney Point Village, 55 to 64 year old males and 65 to 74 year old females are the most vulnerable to poverty, with 12 males (3.5%) and 5 females (2.6%) in their respective age groups living below the poverty level.
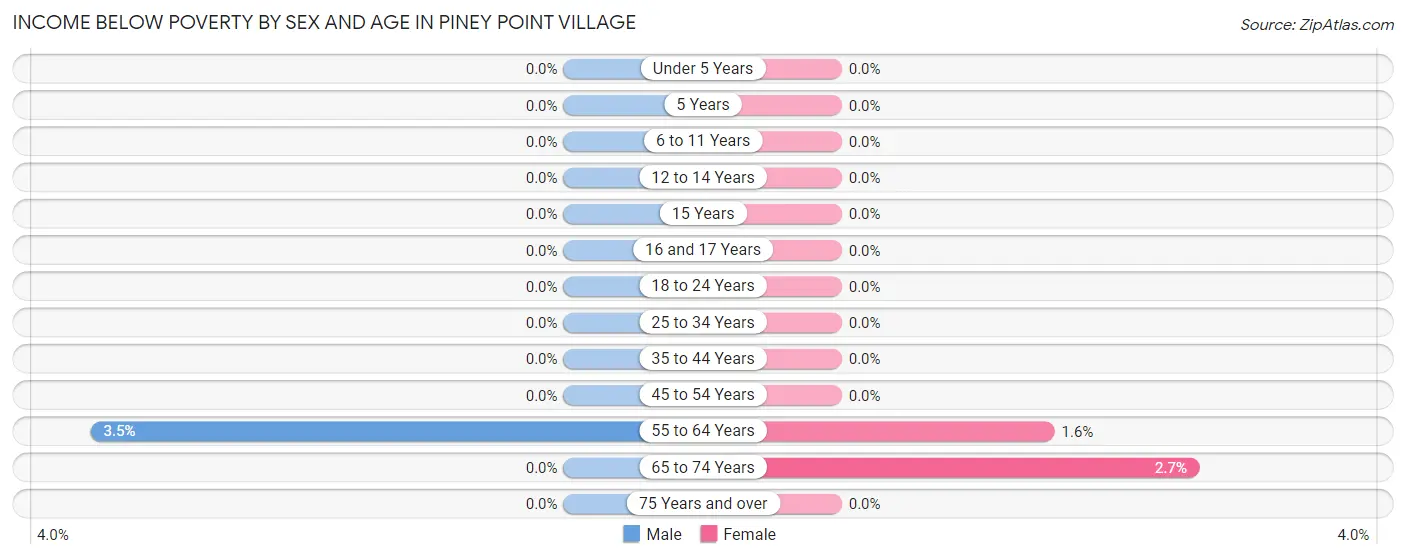
| Age Bracket | Male | Female |
| Under 5 Years | 0 (0.0%) | 0 (0.0%) |
| 5 Years | 0 (0.0%) | 0 (0.0%) |
| 6 to 11 Years | 0 (0.0%) | 0 (0.0%) |
| 12 to 14 Years | 0 (0.0%) | 0 (0.0%) |
| 15 Years | 0 (0.0%) | 0 (0.0%) |
| 16 and 17 Years | 0 (0.0%) | 0 (0.0%) |
| 18 to 24 Years | 0 (0.0%) | 0 (0.0%) |
| 25 to 34 Years | 0 (0.0%) | 0 (0.0%) |
| 35 to 44 Years | 0 (0.0%) | 0 (0.0%) |
| 45 to 54 Years | 0 (0.0%) | 0 (0.0%) |
| 55 to 64 Years | 12 (3.5%) | 5 (1.6%) |
| 65 to 74 Years | 0 (0.0%) | 5 (2.6%) |
| 75 Years and over | 0 (0.0%) | 0 (0.0%) |
| Total | 12 (0.7%) | 10 (0.7%) |
Income Above Poverty by Sex and Age in Piney Point Village
According to the poverty statistics in Piney Point Village, males aged under 5 years and females aged under 5 years are the age groups that are most secure financially, with 100.0% of males and 100.0% of females in these age groups living above the poverty line.
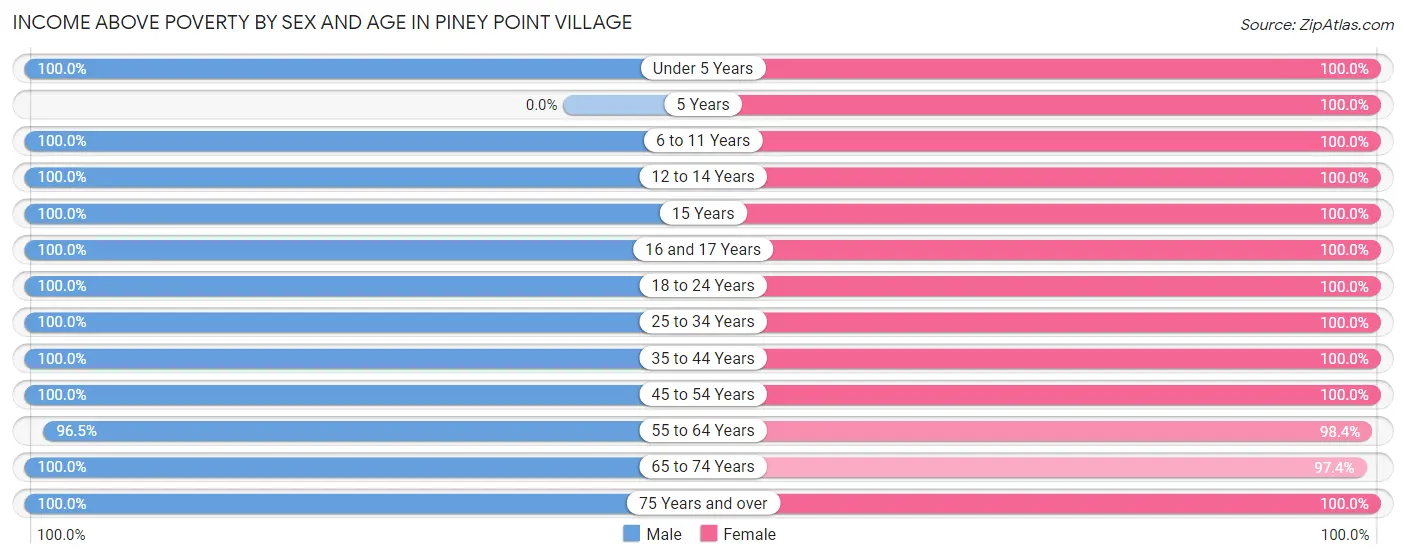
| Age Bracket | Male | Female |
| Under 5 Years | 27 (100.0%) | 9 (100.0%) |
| 5 Years | 0 (0.0%) | 17 (100.0%) |
| 6 to 11 Years | 168 (100.0%) | 86 (100.0%) |
| 12 to 14 Years | 28 (100.0%) | 73 (100.0%) |
| 15 Years | 27 (100.0%) | 29 (100.0%) |
| 16 and 17 Years | 35 (100.0%) | 57 (100.0%) |
| 18 to 24 Years | 166 (100.0%) | 56 (100.0%) |
| 25 to 34 Years | 93 (100.0%) | 37 (100.0%) |
| 35 to 44 Years | 127 (100.0%) | 123 (100.0%) |
| 45 to 54 Years | 286 (100.0%) | 312 (100.0%) |
| 55 to 64 Years | 330 (96.5%) | 312 (98.4%) |
| 65 to 74 Years | 189 (100.0%) | 184 (97.4%) |
| 75 Years and over | 164 (100.0%) | 157 (100.0%) |
| Total | 1,640 (99.3%) | 1,452 (99.3%) |
Income Below Poverty Among Married-Couple Families in Piney Point Village
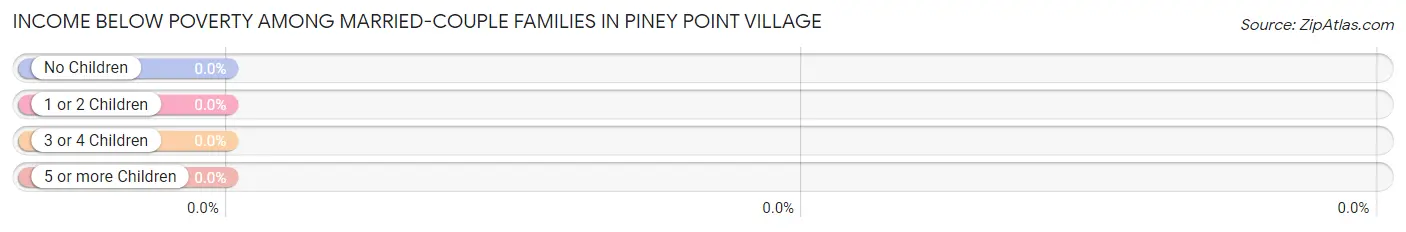
| Children | Above Poverty | Below Poverty |
| No Children | 616 (100.0%) | 0 (0.0%) |
| 1 or 2 Children | 262 (100.0%) | 0 (0.0%) |
| 3 or 4 Children | 38 (100.0%) | 0 (0.0%) |
| 5 or more Children | 0 (0.0%) | 0 (0.0%) |
| Total | 916 (100.0%) | 0 (0.0%) |
Income Below Poverty Among Single-Parent Households in Piney Point Village
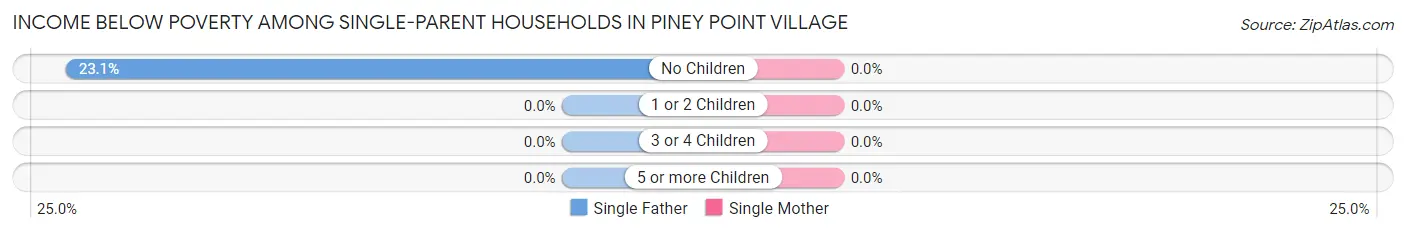
| Children | Single Father | Single Mother |
| No Children | 6 (23.1%) | 0 (0.0%) |
| 1 or 2 Children | 0 (0.0%) | 0 (0.0%) |
| 3 or 4 Children | 0 (0.0%) | 0 (0.0%) |
| 5 or more Children | 0 (0.0%) | 0 (0.0%) |
| Total | 6 (20.0%) | 0 (0.0%) |
Income Below Poverty Among Married-Couple vs Single-Parent Households in Piney Point Village
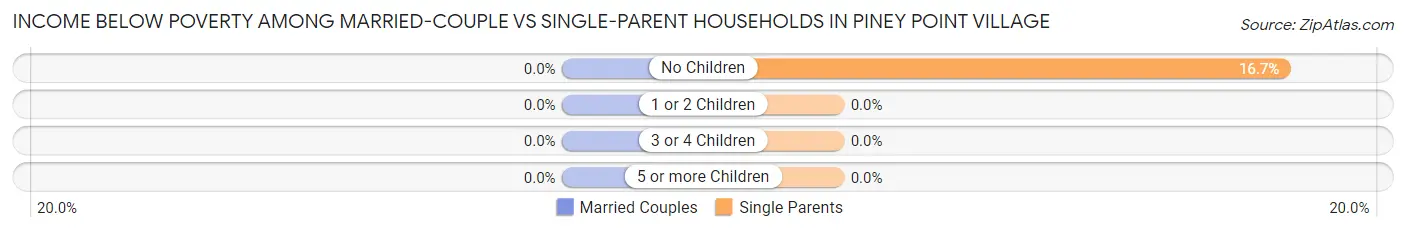
| Children | Married-Couple Families | Single-Parent Households |
| No Children | 0 (0.0%) | 6 (16.7%) |
| 1 or 2 Children | 0 (0.0%) | 0 (0.0%) |
| 3 or 4 Children | 0 (0.0%) | 0 (0.0%) |
| 5 or more Children | 0 (0.0%) | 0 (0.0%) |
| Total | 0 (0.0%) | 6 (8.3%) |
Race in Piney Point Village
The most populous races in Piney Point Village are White / Caucasian (2,616 | 84.0%), Asian (389 | 12.5%), and Hispanic or Latino (88 | 2.8%).
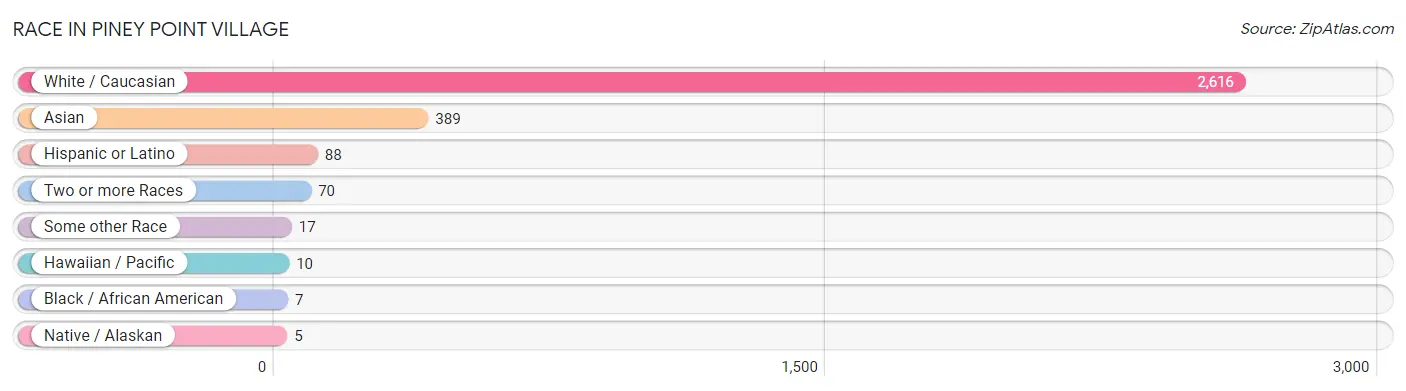
| Race | # Population | % Population |
| Asian | 389 | 12.5% |
| Black / African American | 7 | 0.2% |
| Hawaiian / Pacific | 10 | 0.3% |
| Hispanic or Latino | 88 | 2.8% |
| Native / Alaskan | 5 | 0.2% |
| White / Caucasian | 2,616 | 84.0% |
| Two or more Races | 70 | 2.2% |
| Some other Race | 17 | 0.5% |
| Total | 3,114 | 100.0% |
Ancestry in Piney Point Village
The most populous ancestries reported in Piney Point Village are English (439 | 14.1%), Irish (326 | 10.5%), German (318 | 10.2%), Russian (233 | 7.5%), and American (191 | 6.1%), together accounting for 48.4% of all Piney Point Village residents.
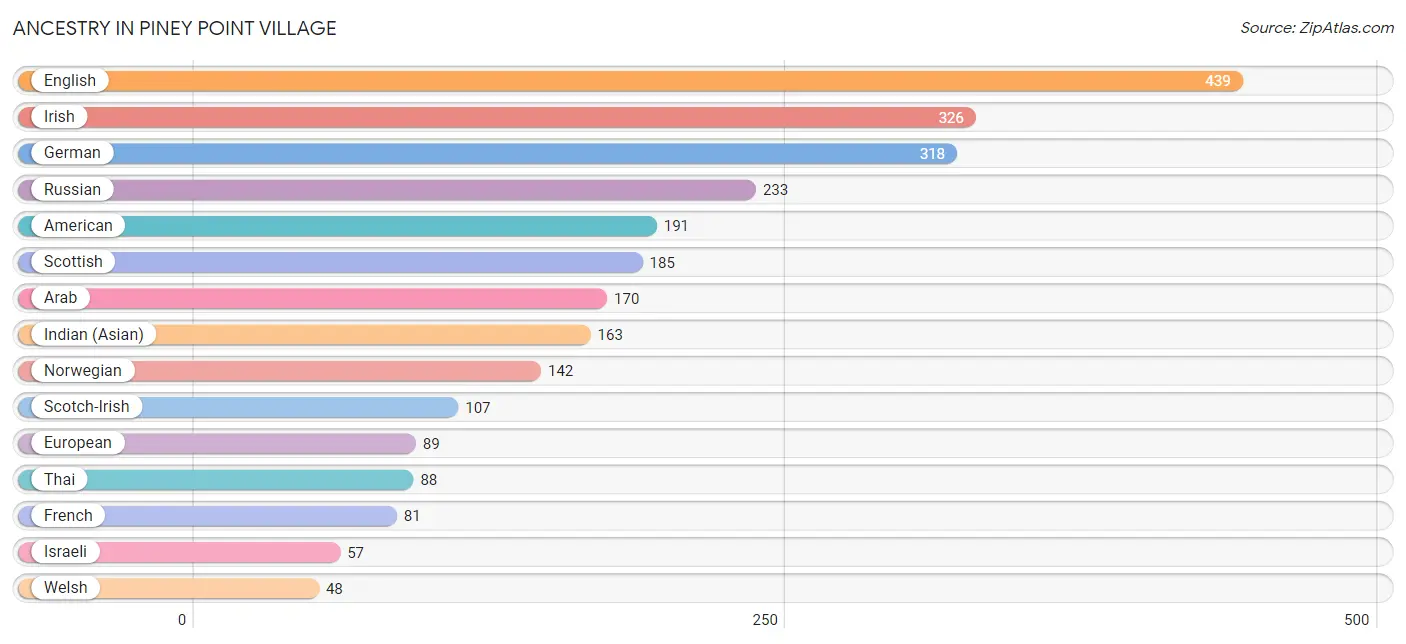
| Ancestry | # Population | % Population |
| American | 191 | 6.1% |
| Arab | 170 | 5.5% |
| Austrian | 9 | 0.3% |
| Bhutanese | 26 | 0.8% |
| British | 25 | 0.8% |
| Burmese | 28 | 0.9% |
| Canadian | 10 | 0.3% |
| Central American | 25 | 0.8% |
| Cherokee | 5 | 0.2% |
| Colombian | 6 | 0.2% |
| Czech | 4 | 0.1% |
| Danish | 33 | 1.1% |
| Dutch | 11 | 0.4% |
| Eastern European | 16 | 0.5% |
| English | 439 | 14.1% |
| European | 89 | 2.9% |
| Finnish | 14 | 0.4% |
| French | 81 | 2.6% |
| German | 318 | 10.2% |
| Greek | 11 | 0.4% |
| Guatemalan | 25 | 0.8% |
| Indian (Asian) | 163 | 5.2% |
| Iranian | 28 | 0.9% |
| Irish | 326 | 10.5% |
| Israeli | 57 | 1.8% |
| Korean | 5 | 0.2% |
| Lebanese | 44 | 1.4% |
| Mexican | 29 | 0.9% |
| Northern European | 42 | 1.3% |
| Norwegian | 142 | 4.6% |
| Puerto Rican | 4 | 0.1% |
| Russian | 233 | 7.5% |
| Scotch-Irish | 107 | 3.4% |
| Scottish | 185 | 5.9% |
| Serbian | 6 | 0.2% |
| South American | 11 | 0.4% |
| Spaniard | 13 | 0.4% |
| Spanish | 6 | 0.2% |
| Sri Lankan | 41 | 1.3% |
| Swedish | 9 | 0.3% |
| Swiss | 5 | 0.2% |
| Syrian | 47 | 1.5% |
| Thai | 88 | 2.8% |
| Ukrainian | 7 | 0.2% |
| Welsh | 48 | 1.5% | View All 45 Rows |
Immigrants in Piney Point Village
The most numerous immigrant groups reported in Piney Point Village came from Asia (416 | 13.4%), Eastern Asia (164 | 5.3%), South Central Asia (136 | 4.4%), Europe (126 | 4.1%), and China (110 | 3.5%), together accounting for 30.6% of all Piney Point Village residents.
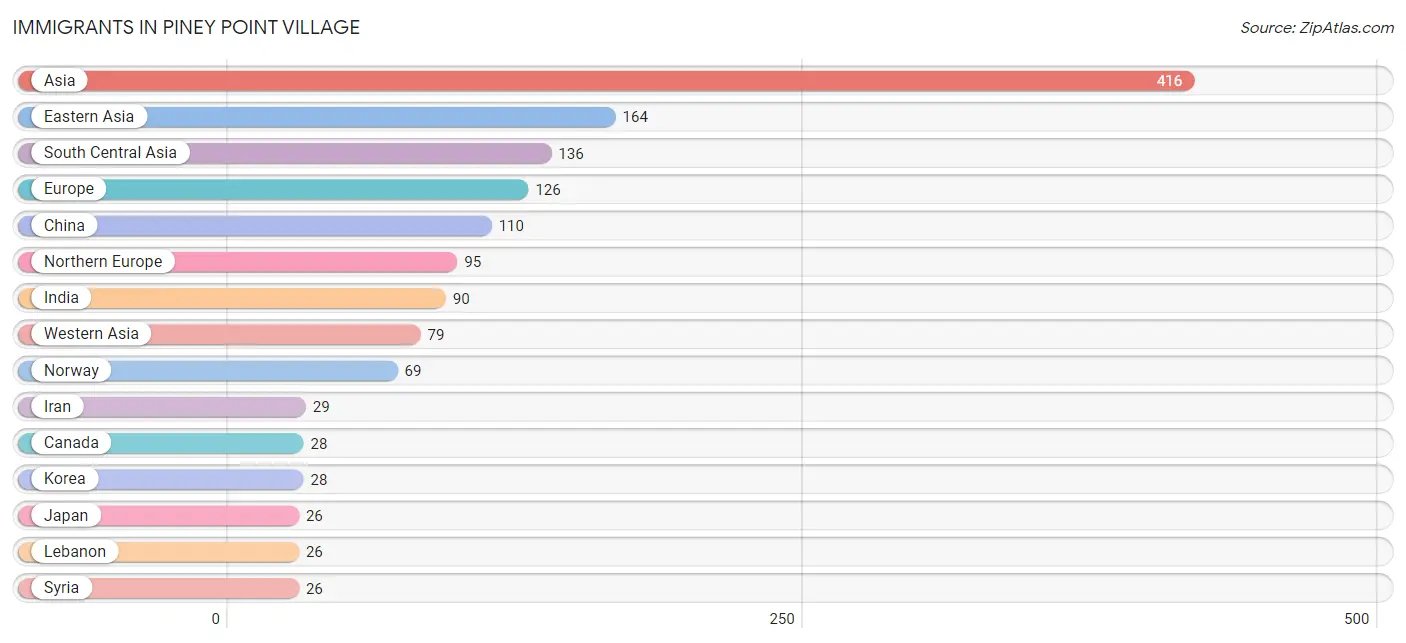
| Immigration Origin | # Population | % Population |
| Africa | 10 | 0.3% |
| Asia | 416 | 13.4% |
| Canada | 28 | 0.9% |
| Central America | 12 | 0.4% |
| China | 110 | 3.5% |
| Eastern Asia | 164 | 5.3% |
| England | 10 | 0.3% |
| Europe | 126 | 4.1% |
| Germany | 19 | 0.6% |
| India | 90 | 2.9% |
| Iran | 29 | 0.9% |
| Ireland | 5 | 0.2% |
| Israel | 15 | 0.5% |
| Japan | 26 | 0.8% |
| Korea | 28 | 0.9% |
| Latin America | 12 | 0.4% |
| Lebanon | 26 | 0.8% |
| Mexico | 12 | 0.4% |
| Northern Europe | 95 | 3.0% |
| Norway | 69 | 2.2% |
| Pakistan | 12 | 0.4% |
| Philippines | 5 | 0.2% |
| South Africa | 10 | 0.3% |
| South Central Asia | 136 | 4.4% |
| South Eastern Asia | 22 | 0.7% |
| Southern Europe | 7 | 0.2% |
| Spain | 7 | 0.2% |
| Sri Lanka | 5 | 0.2% |
| Switzerland | 5 | 0.2% |
| Syria | 26 | 0.8% |
| Taiwan | 6 | 0.2% |
| Vietnam | 17 | 0.5% |
| Western Asia | 79 | 2.5% |
| Western Europe | 24 | 0.8% | View All 34 Rows |
Sex and Age in Piney Point Village
Sex and Age in Piney Point Village
The most populous age groups in Piney Point Village are 50 to 54 Years (215 | 13.0%) for men and 55 to 59 Years (166 | 11.4%) for women.
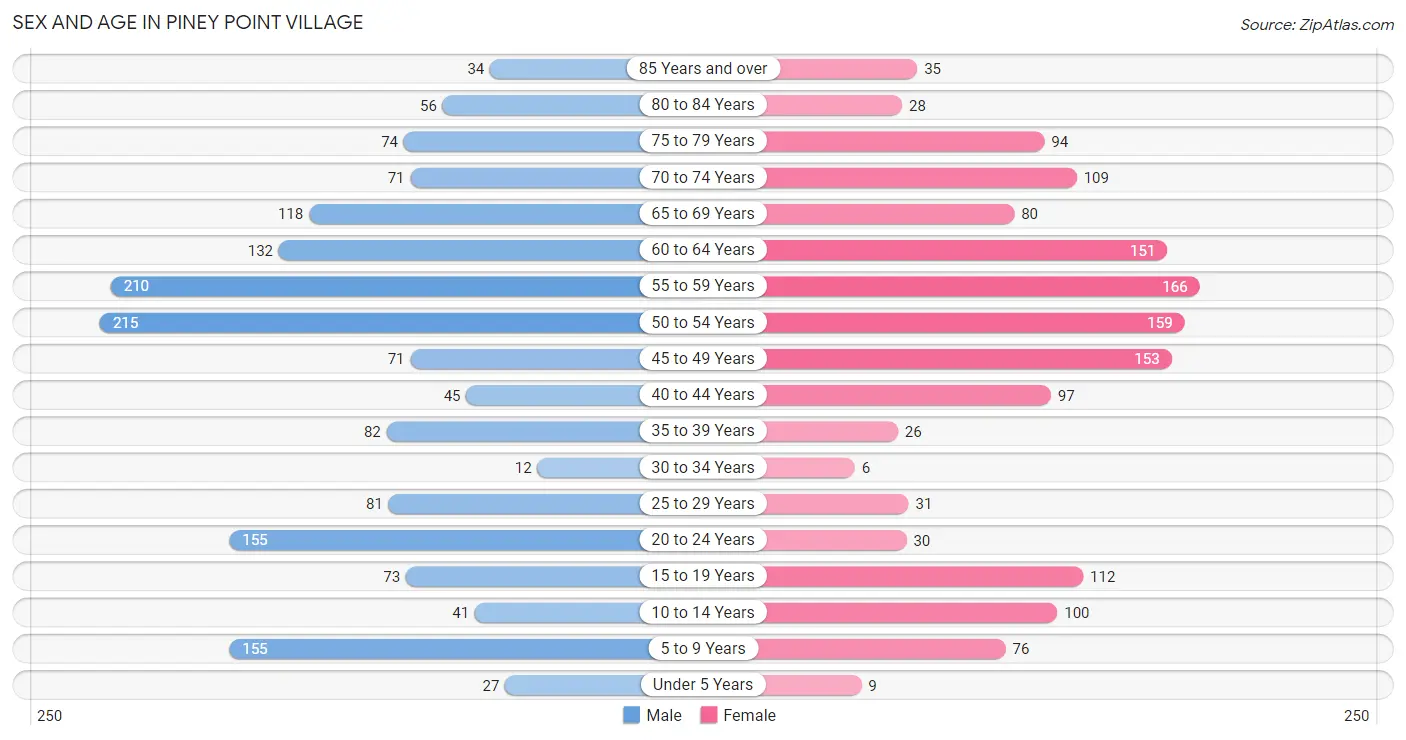
| Age Bracket | Male | Female |
| Under 5 Years | 27 (1.6%) | 9 (0.6%) |
| 5 to 9 Years | 155 (9.4%) | 76 (5.2%) |
| 10 to 14 Years | 41 (2.5%) | 100 (6.8%) |
| 15 to 19 Years | 73 (4.4%) | 112 (7.7%) |
| 20 to 24 Years | 155 (9.4%) | 30 (2.1%) |
| 25 to 29 Years | 81 (4.9%) | 31 (2.1%) |
| 30 to 34 Years | 12 (0.7%) | 6 (0.4%) |
| 35 to 39 Years | 82 (5.0%) | 26 (1.8%) |
| 40 to 44 Years | 45 (2.7%) | 97 (6.6%) |
| 45 to 49 Years | 71 (4.3%) | 153 (10.5%) |
| 50 to 54 Years | 215 (13.0%) | 159 (10.9%) |
| 55 to 59 Years | 210 (12.7%) | 166 (11.4%) |
| 60 to 64 Years | 132 (8.0%) | 151 (10.3%) |
| 65 to 69 Years | 118 (7.1%) | 80 (5.5%) |
| 70 to 74 Years | 71 (4.3%) | 109 (7.5%) |
| 75 to 79 Years | 74 (4.5%) | 94 (6.4%) |
| 80 to 84 Years | 56 (3.4%) | 28 (1.9%) |
| 85 Years and over | 34 (2.1%) | 35 (2.4%) |
| Total | 1,652 (100.0%) | 1,462 (100.0%) |
Families and Households in Piney Point Village
Median Family Size in Piney Point Village
The median family size in Piney Point Village is 2.98 persons per family, with single female/mother families (42 | 4.3%) accounting for the largest median family size of 3.19 persons per family. On the other hand, single male/father families (30 | 3.0%) represent the smallest median family size with 2.33 persons per family.
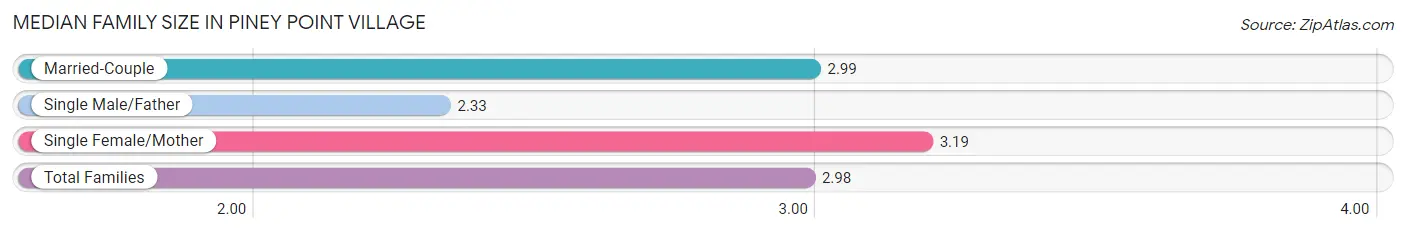
| Family Type | # Families | Family Size |
| Married-Couple | 916 (92.7%) | 2.99 |
| Single Male/Father | 30 (3.0%) | 2.33 |
| Single Female/Mother | 42 (4.3%) | 3.19 |
| Total Families | 988 (100.0%) | 2.98 |
Median Household Size in Piney Point Village
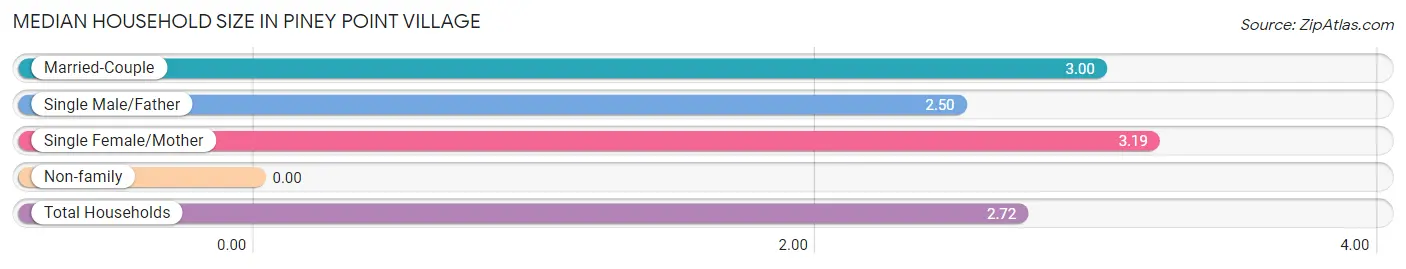
| Household Type | # Households | Household Size |
| Married-Couple | 916 (79.9%) | 3.00 |
| Single Male/Father | 30 (2.6%) | 2.50 |
| Single Female/Mother | 42 (3.7%) | 3.19 |
| Non-family | 158 (13.8%) | - |
| Total Households | 1,146 (100.0%) | 2.72 |
Household Size by Marriage Status in Piney Point Village
Out of a total of 1,146 households in Piney Point Village, 988 (86.2%) are family households, while 158 (13.8%) are nonfamily households. The most numerous type of family households are 2-person households, comprising 470, and the most common type of nonfamily households are 1-person households, comprising 158.
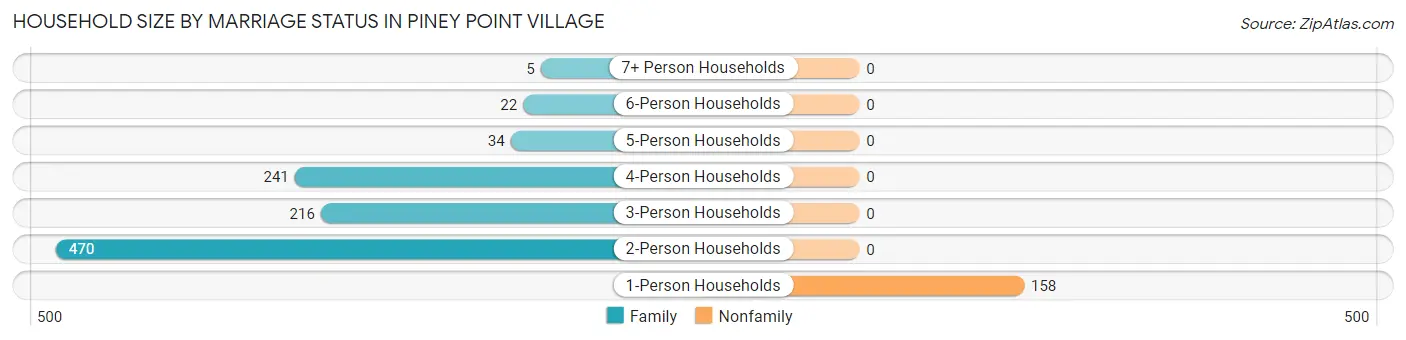
| Household Size | Family Households | Nonfamily Households |
| 1-Person Households | - | 158 (13.8%) |
| 2-Person Households | 470 (41.0%) | 0 (0.0%) |
| 3-Person Households | 216 (18.9%) | 0 (0.0%) |
| 4-Person Households | 241 (21.0%) | 0 (0.0%) |
| 5-Person Households | 34 (3.0%) | 0 (0.0%) |
| 6-Person Households | 22 (1.9%) | 0 (0.0%) |
| 7+ Person Households | 5 (0.4%) | 0 (0.0%) |
| Total | 988 (86.2%) | 158 (13.8%) |
Female Fertility in Piney Point Village
Fertility by Age in Piney Point Village
Average fertility rate in Piney Point Village is 11.0 births per 1,000 women. Women in the age bracket of 35 to 50 years have the highest fertility rate with 18.0 births per 1,000 women. Women in the age bracket of 35 to 50 years acount for 100.0% of all women with births.
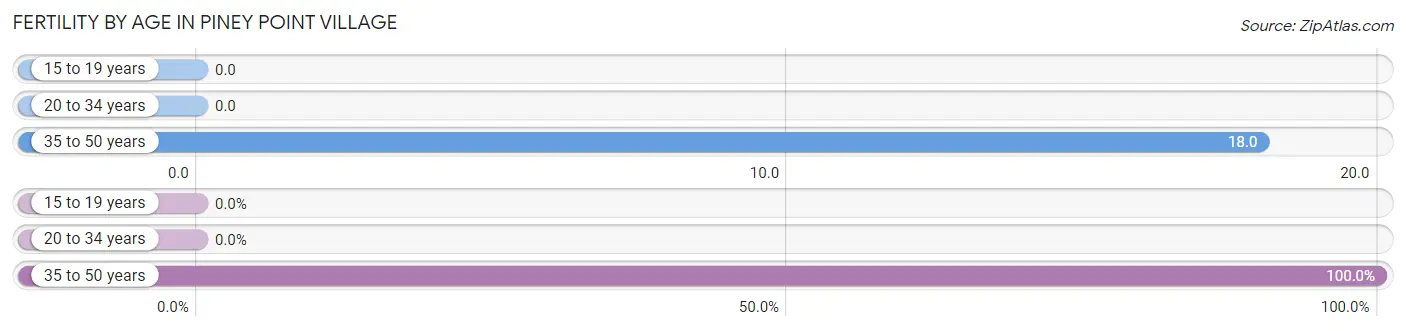
| Age Bracket | Women with Births | Births / 1,000 Women |
| 15 to 19 years | 0 (0.0%) | 0.0 |
| 20 to 34 years | 0 (0.0%) | 0.0 |
| 35 to 50 years | 5 (100.0%) | 18.0 |
| Total | 5 (100.0%) | 11.0 |
Fertility by Age by Marriage Status in Piney Point Village
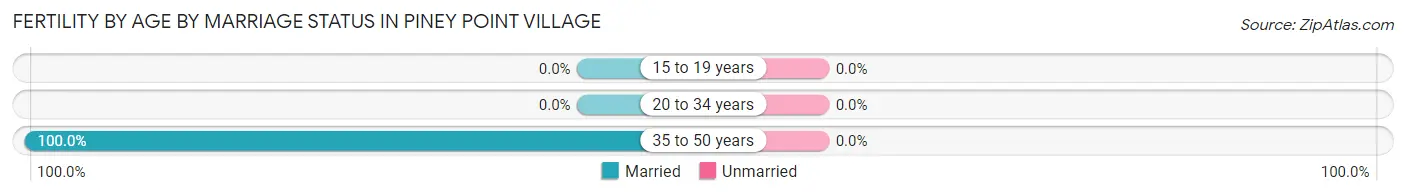
| Age Bracket | Married | Unmarried |
| 15 to 19 years | 0 (0.0%) | 0 (0.0%) |
| 20 to 34 years | 0 (0.0%) | 0 (0.0%) |
| 35 to 50 years | 5 (100.0%) | 0 (0.0%) |
| Total | 5 (100.0%) | 0 (0.0%) |
Fertility by Education in Piney Point Village
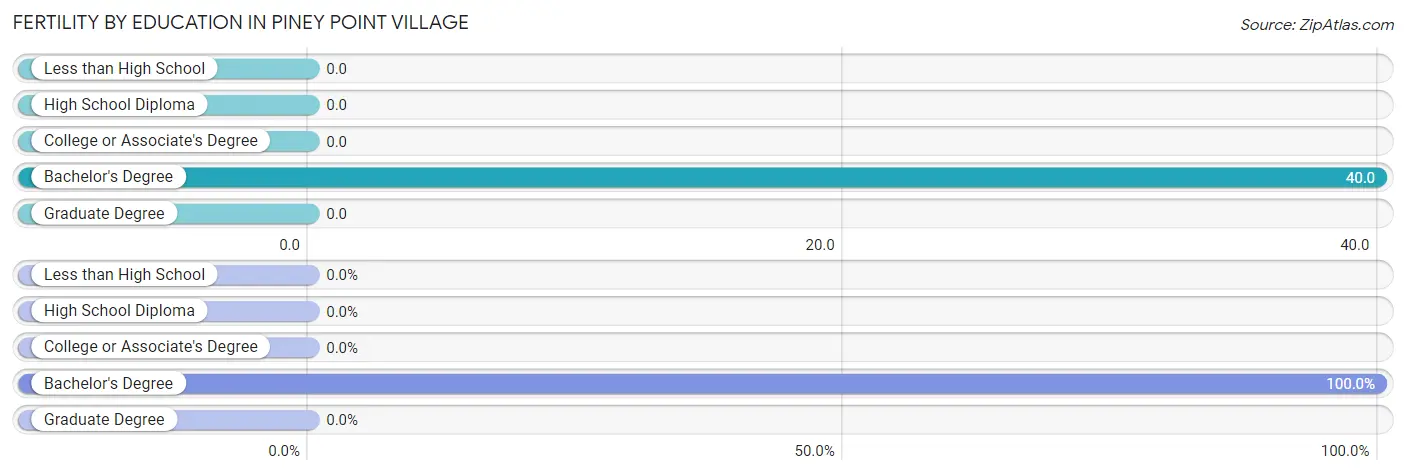
| Educational Attainment | Women with Births | Births / 1,000 Women |
| Less than High School | 0 (0.0%) | 0.0 |
| High School Diploma | 0 (0.0%) | 0.0 |
| College or Associate's Degree | 0 (0.0%) | 0.0 |
| Bachelor's Degree | 5 (100.0%) | 40.0 |
| Graduate Degree | 0 (0.0%) | 0.0 |
| Total | 5 (100.0%) | 11.0 |
Fertility by Education by Marriage Status in Piney Point Village
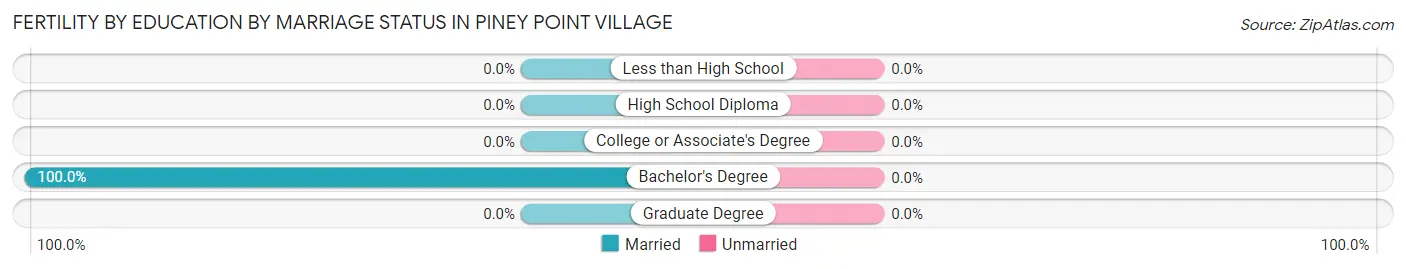
| Educational Attainment | Married | Unmarried |
| Less than High School | 0 (0.0%) | 0 (0.0%) |
| High School Diploma | 0 (0.0%) | 0 (0.0%) |
| College or Associate's Degree | 0 (0.0%) | 0 (0.0%) |
| Bachelor's Degree | 5 (100.0%) | 0 (0.0%) |
| Graduate Degree | 0 (0.0%) | 0 (0.0%) |
| Total | 5 (100.0%) | 0 (0.0%) |
Employment Characteristics in Piney Point Village
Employment by Class of Employer in Piney Point Village
Among the 1,397 employed individuals in Piney Point Village, private company employees (848 | 60.7%), self-employed (incorporated) (301 | 21.5%), and self-employed (not incorporated) (175 | 12.5%) make up the most common classes of employment.
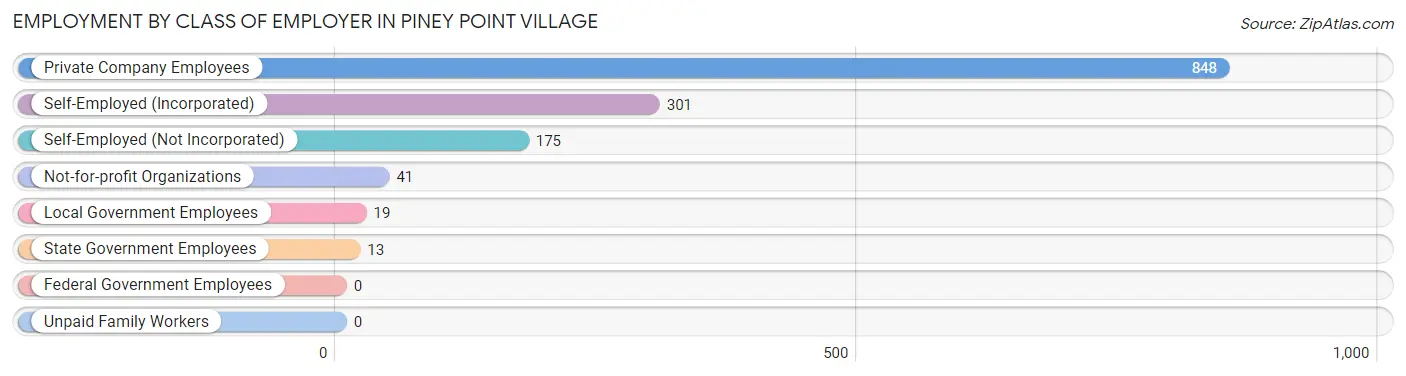
| Employer Class | # Employees | % Employees |
| Private Company Employees | 848 | 60.7% |
| Self-Employed (Incorporated) | 301 | 21.5% |
| Self-Employed (Not Incorporated) | 175 | 12.5% |
| Not-for-profit Organizations | 41 | 2.9% |
| Local Government Employees | 19 | 1.4% |
| State Government Employees | 13 | 0.9% |
| Federal Government Employees | 0 | 0.0% |
| Unpaid Family Workers | 0 | 0.0% |
| Total | 1,397 | 100.0% |
Employment Status by Age in Piney Point Village
According to the labor force statistics for Piney Point Village, out of the total population over 16 years of age (2,650), 59.6% or 1,579 individuals are in the labor force, with 9.4% or 148 of them unemployed. The age group with the highest labor force participation rate is 30 to 34 years, with 100.0% or 18 individuals in the labor force. Within the labor force, the 20 to 24 years age range has the highest percentage of unemployed individuals, with 43.8% or 57 of them being unemployed.
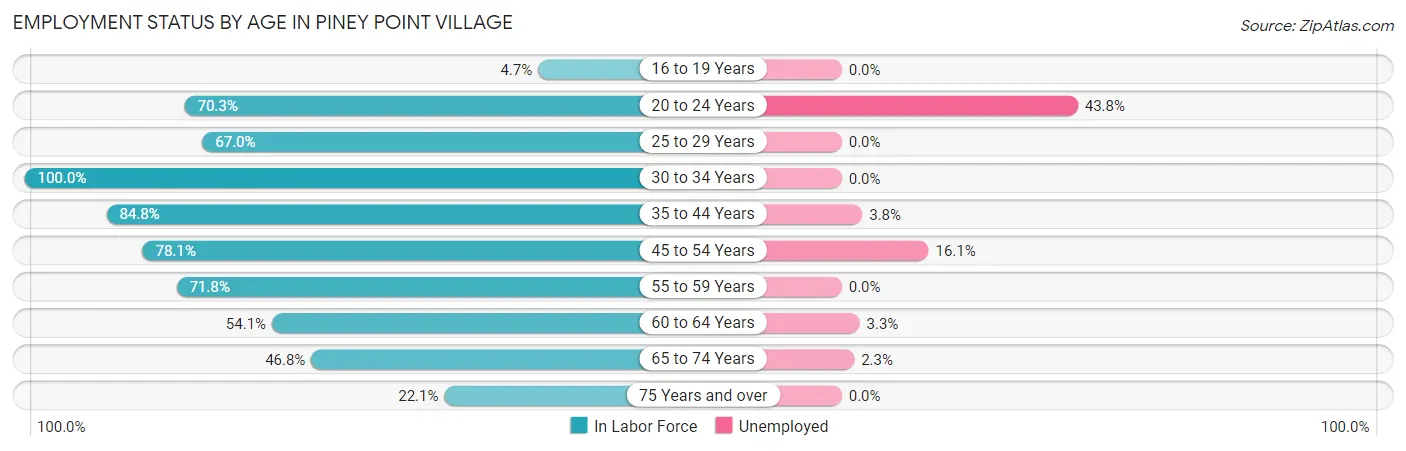
| Age Bracket | In Labor Force | Unemployed |
| 16 to 19 Years | 6 (4.7%) | 0 (0.0%) |
| 20 to 24 Years | 130 (70.3%) | 57 (43.8%) |
| 25 to 29 Years | 75 (67.0%) | 0 (0.0%) |
| 30 to 34 Years | 18 (100.0%) | 0 (0.0%) |
| 35 to 44 Years | 212 (84.8%) | 8 (3.8%) |
| 45 to 54 Years | 467 (78.1%) | 75 (16.1%) |
| 55 to 59 Years | 270 (71.8%) | 0 (0.0%) |
| 60 to 64 Years | 153 (54.1%) | 5 (3.3%) |
| 65 to 74 Years | 177 (46.8%) | 4 (2.3%) |
| 75 Years and over | 71 (22.1%) | 0 (0.0%) |
| Total | 1,579 (59.6%) | 148 (9.4%) |
Employment Status by Educational Attainment in Piney Point Village
According to labor force statistics for Piney Point Village, 73.0% of individuals (1,195) out of the total population between 25 and 64 years of age (1,637) are in the labor force, with 7.4% or 88 of them being unemployed. The group with the highest labor force participation rate are those with the educational attainment of high school diploma, with 75.0% or 69 individuals in the labor force. Within the labor force, individuals with college / associate degree education have the highest percentage of unemployment, with 41.1% or 65 of them being unemployed.

| Educational Attainment | In Labor Force | Unemployed |
| Less than High School | 6 (54.5%) | 0 (0.0%) |
| High School Diploma | 69 (75.0%) | 0 (0.0%) |
| College / Associate Degree | 158 (72.8%) | 89 (41.1%) |
| Bachelor's Degree or higher | 961 (73.0%) | 32 (2.4%) |
| Total | 1,195 (73.0%) | 121 (7.4%) |
Employment Occupations by Sex in Piney Point Village
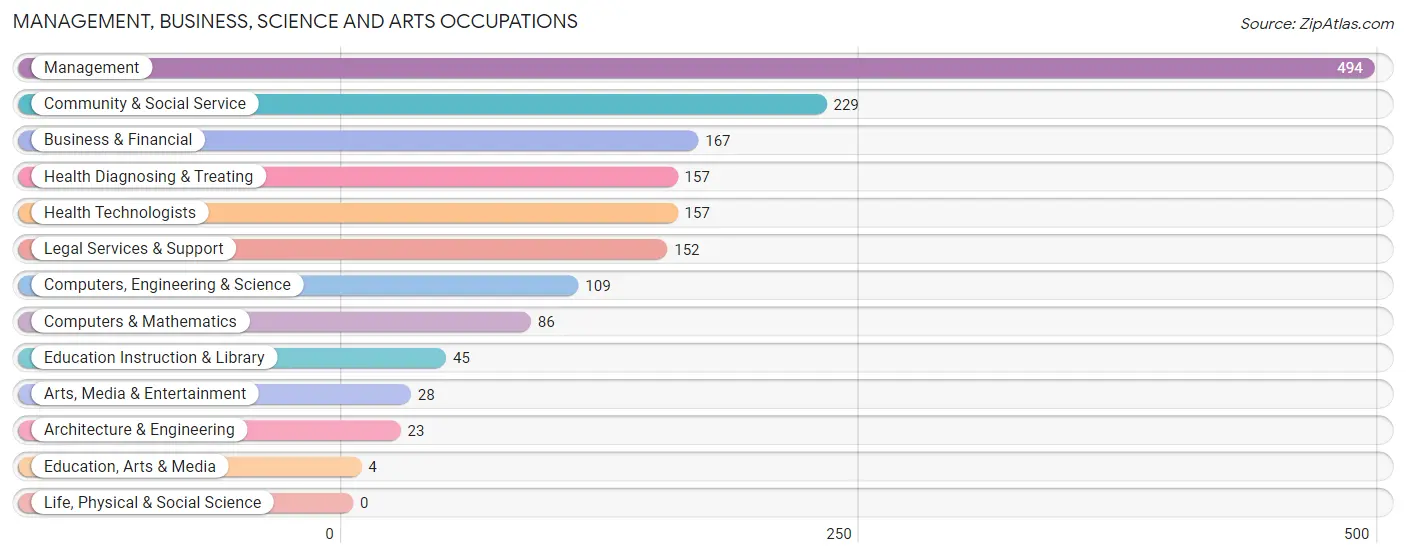
Management, Business, Science and Arts Occupations
The most common Management, Business, Science and Arts occupations in Piney Point Village are Management (494 | 34.5%), Community & Social Service (229 | 16.0%), Business & Financial (167 | 11.7%), Health Diagnosing & Treating (157 | 11.0%), and Health Technologists (157 | 11.0%).
Management, Business, Science and Arts Occupations by Sex
Within the Management, Business, Science and Arts occupations in Piney Point Village, the most male-oriented occupations are Computers, Engineering & Science (100.0%), Computers & Mathematics (100.0%), and Architecture & Engineering (100.0%), while the most female-oriented occupations are Arts, Media & Entertainment (100.0%), Education Instruction & Library (66.7%), and Community & Social Service (54.6%).
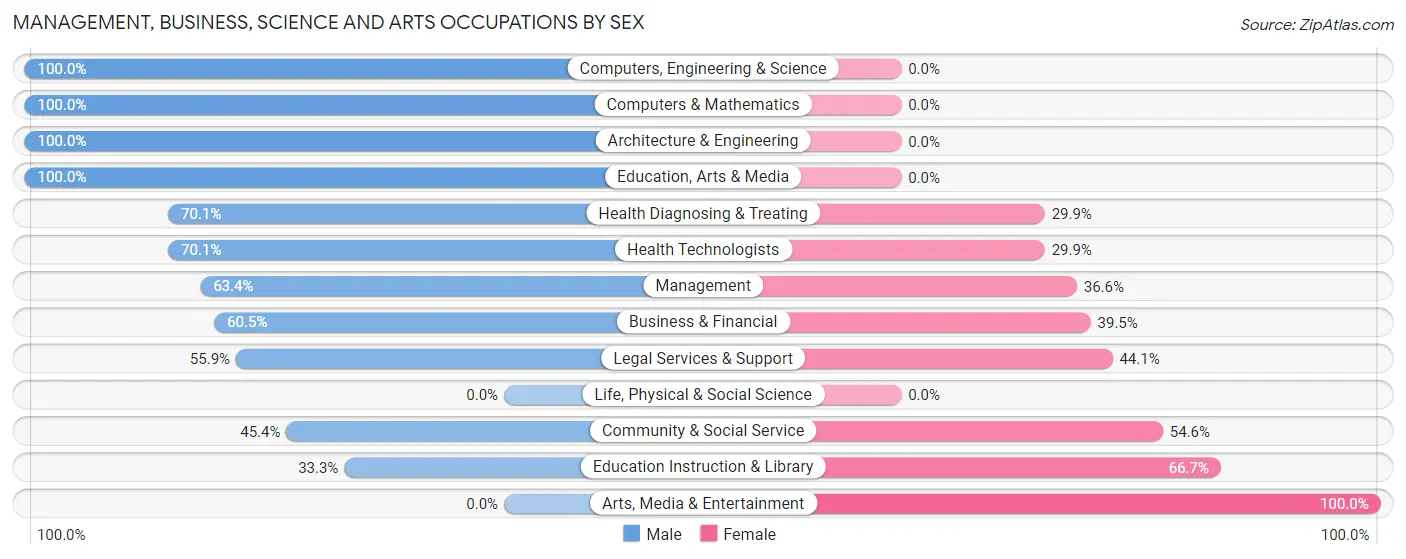
| Occupation | Male | Female |
| Management | 313 (63.4%) | 181 (36.6%) |
| Business & Financial | 101 (60.5%) | 66 (39.5%) |
| Computers, Engineering & Science | 109 (100.0%) | 0 (0.0%) |
| Computers & Mathematics | 86 (100.0%) | 0 (0.0%) |
| Architecture & Engineering | 23 (100.0%) | 0 (0.0%) |
| Life, Physical & Social Science | 0 (0.0%) | 0 (0.0%) |
| Community & Social Service | 104 (45.4%) | 125 (54.6%) |
| Education, Arts & Media | 4 (100.0%) | 0 (0.0%) |
| Legal Services & Support | 85 (55.9%) | 67 (44.1%) |
| Education Instruction & Library | 15 (33.3%) | 30 (66.7%) |
| Arts, Media & Entertainment | 0 (0.0%) | 28 (100.0%) |
| Health Diagnosing & Treating | 110 (70.1%) | 47 (29.9%) |
| Health Technologists | 110 (70.1%) | 47 (29.9%) |
| Total (Category) | 737 (63.7%) | 419 (36.2%) |
| Total (Overall) | 906 (63.4%) | 524 (36.6%) |
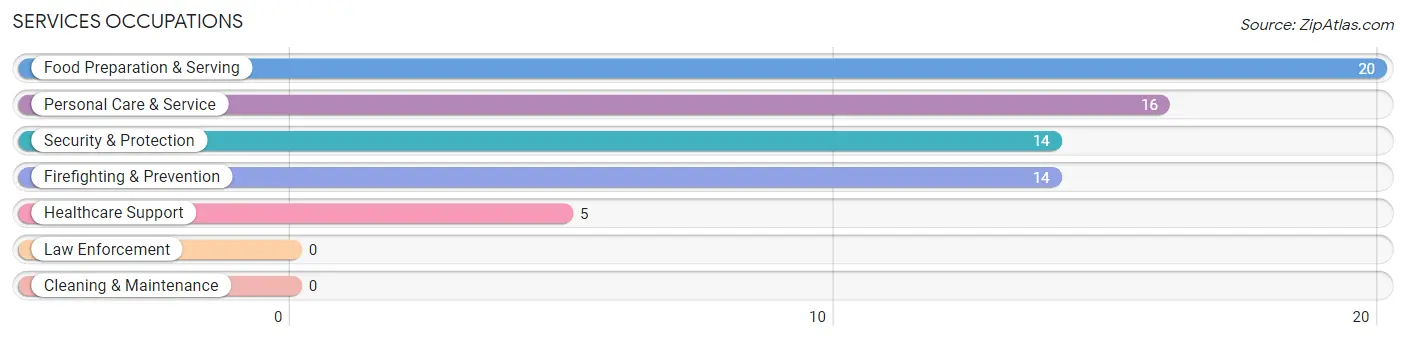
Services Occupations
The most common Services occupations in Piney Point Village are Food Preparation & Serving (20 | 1.4%), Personal Care & Service (16 | 1.1%), Security & Protection (14 | 1.0%), Firefighting & Prevention (14 | 1.0%), and Healthcare Support (5 | 0.4%).
Services Occupations by Sex
Within the Services occupations in Piney Point Village, the most male-oriented occupations are Food Preparation & Serving (100.0%), and Personal Care & Service (100.0%), while the most female-oriented occupations are Healthcare Support (100.0%), Security & Protection (100.0%), and Firefighting & Prevention (100.0%).
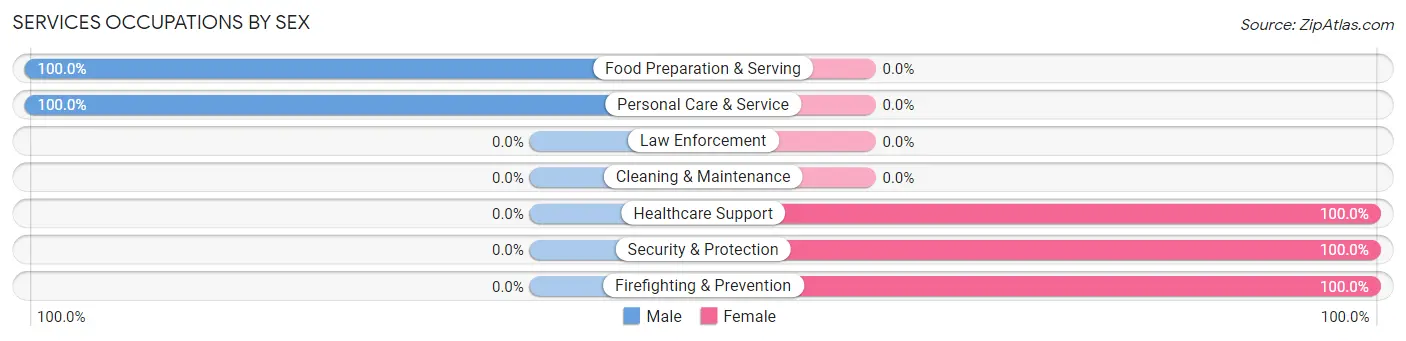
| Occupation | Male | Female |
| Healthcare Support | 0 (0.0%) | 5 (100.0%) |
| Security & Protection | 0 (0.0%) | 14 (100.0%) |
| Firefighting & Prevention | 0 (0.0%) | 14 (100.0%) |
| Law Enforcement | 0 (0.0%) | 0 (0.0%) |
| Food Preparation & Serving | 20 (100.0%) | 0 (0.0%) |
| Cleaning & Maintenance | 0 (0.0%) | 0 (0.0%) |
| Personal Care & Service | 16 (100.0%) | 0 (0.0%) |
| Total (Category) | 36 (65.4%) | 19 (34.5%) |
| Total (Overall) | 906 (63.4%) | 524 (36.6%) |
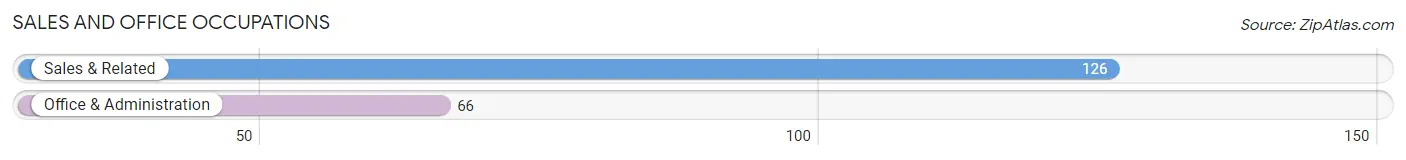
Sales and Office Occupations
The most common Sales and Office occupations in Piney Point Village are Sales & Related (126 | 8.8%), and Office & Administration (66 | 4.6%).
Sales and Office Occupations by Sex

| Occupation | Male | Female |
| Sales & Related | 83 (65.9%) | 43 (34.1%) |
| Office & Administration | 23 (34.8%) | 43 (65.1%) |
| Total (Category) | 106 (55.2%) | 86 (44.8%) |
| Total (Overall) | 906 (63.4%) | 524 (36.6%) |
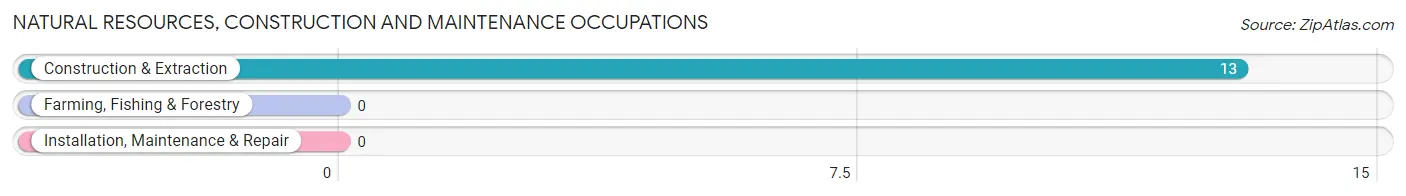
Natural Resources, Construction and Maintenance Occupations
The most common Natural Resources, Construction and Maintenance occupations in Piney Point Village are , and Construction & Extraction (13 | 0.9%).
Natural Resources, Construction and Maintenance Occupations by Sex
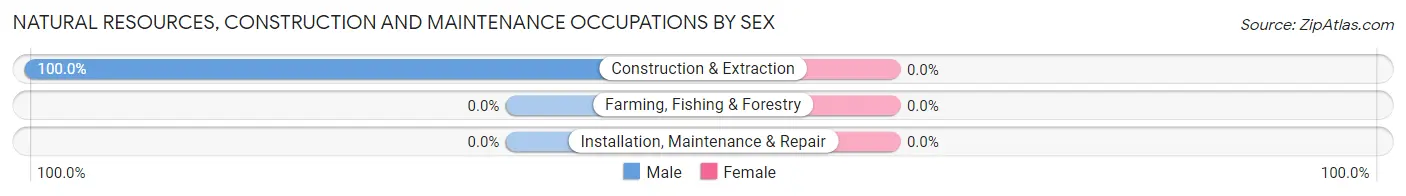
| Occupation | Male | Female |
| Farming, Fishing & Forestry | 0 (0.0%) | 0 (0.0%) |
| Construction & Extraction | 13 (100.0%) | 0 (0.0%) |
| Installation, Maintenance & Repair | 0 (0.0%) | 0 (0.0%) |
| Total (Category) | 13 (100.0%) | 0 (0.0%) |
| Total (Overall) | 906 (63.4%) | 524 (36.6%) |
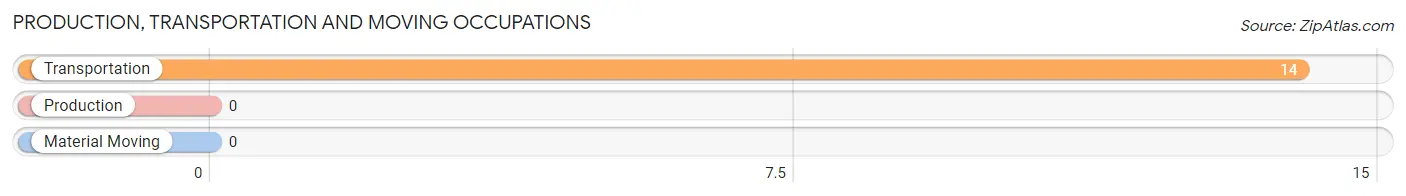
Production, Transportation and Moving Occupations
The most common Production, Transportation and Moving occupations in Piney Point Village are , and Transportation (14 | 1.0%).
Production, Transportation and Moving Occupations by Sex
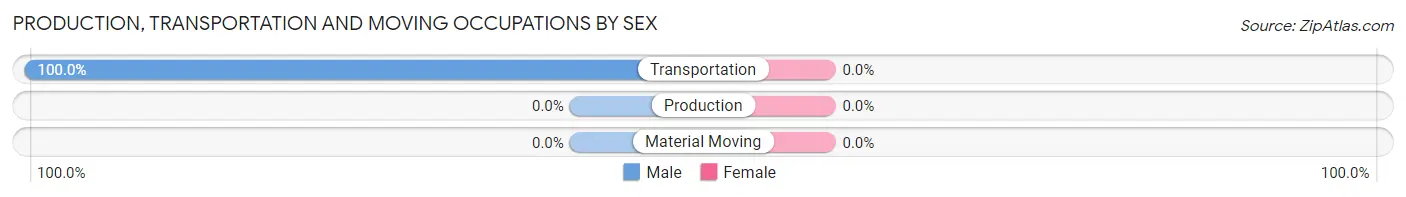
| Occupation | Male | Female |
| Production | 0 (0.0%) | 0 (0.0%) |
| Transportation | 14 (100.0%) | 0 (0.0%) |
| Material Moving | 0 (0.0%) | 0 (0.0%) |
| Total (Category) | 14 (100.0%) | 0 (0.0%) |
| Total (Overall) | 906 (63.4%) | 524 (36.6%) |
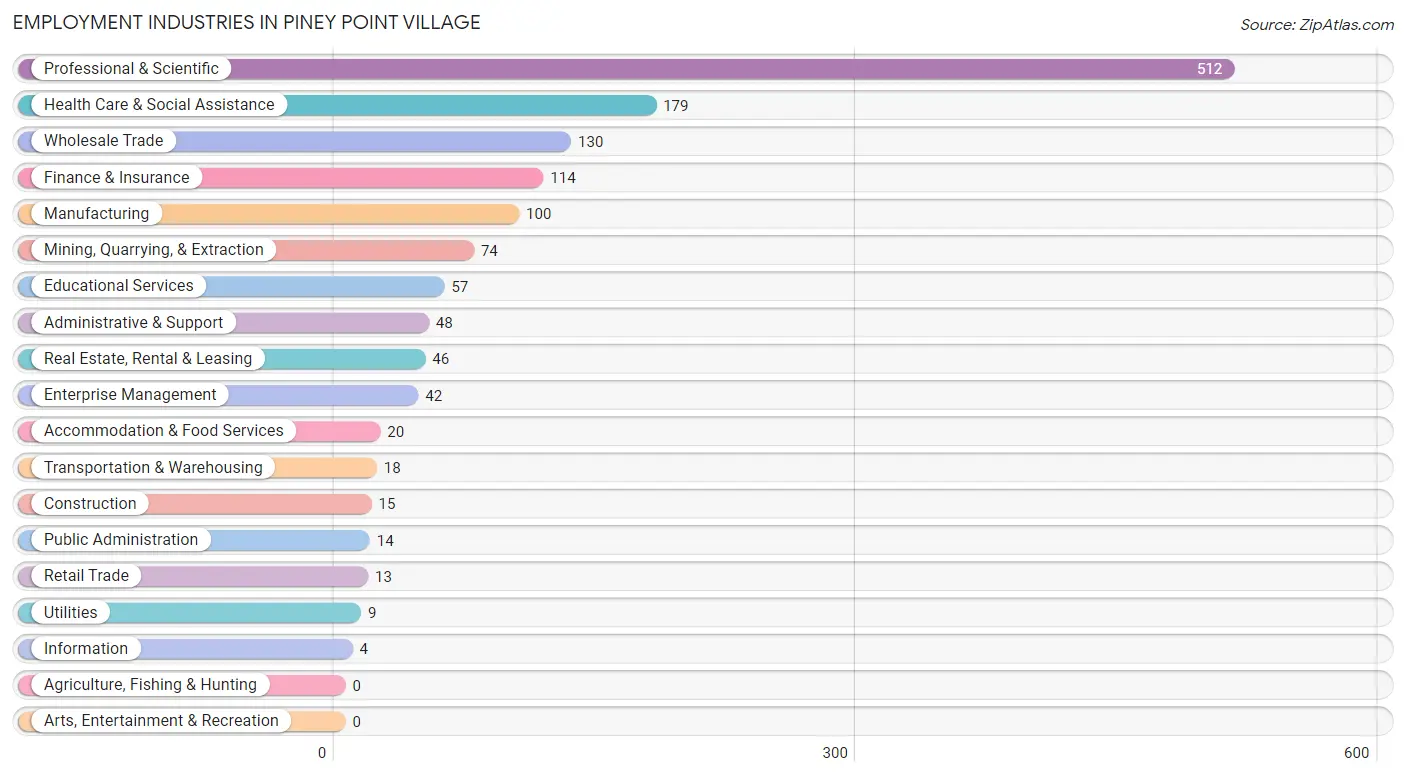
Employment Industries by Sex in Piney Point Village
Employment Industries in Piney Point Village
The major employment industries in Piney Point Village include Professional & Scientific (512 | 35.8%), Health Care & Social Assistance (179 | 12.5%), Wholesale Trade (130 | 9.1%), Finance & Insurance (114 | 8.0%), and Manufacturing (100 | 7.0%).
Employment Industries by Sex in Piney Point Village
The Piney Point Village industries that see more men than women are Transportation & Warehousing (100.0%), Utilities (100.0%), and Information (100.0%), whereas the industries that tend to have a higher number of women are Public Administration (100.0%), Educational Services (66.7%), and Administrative & Support (64.6%).
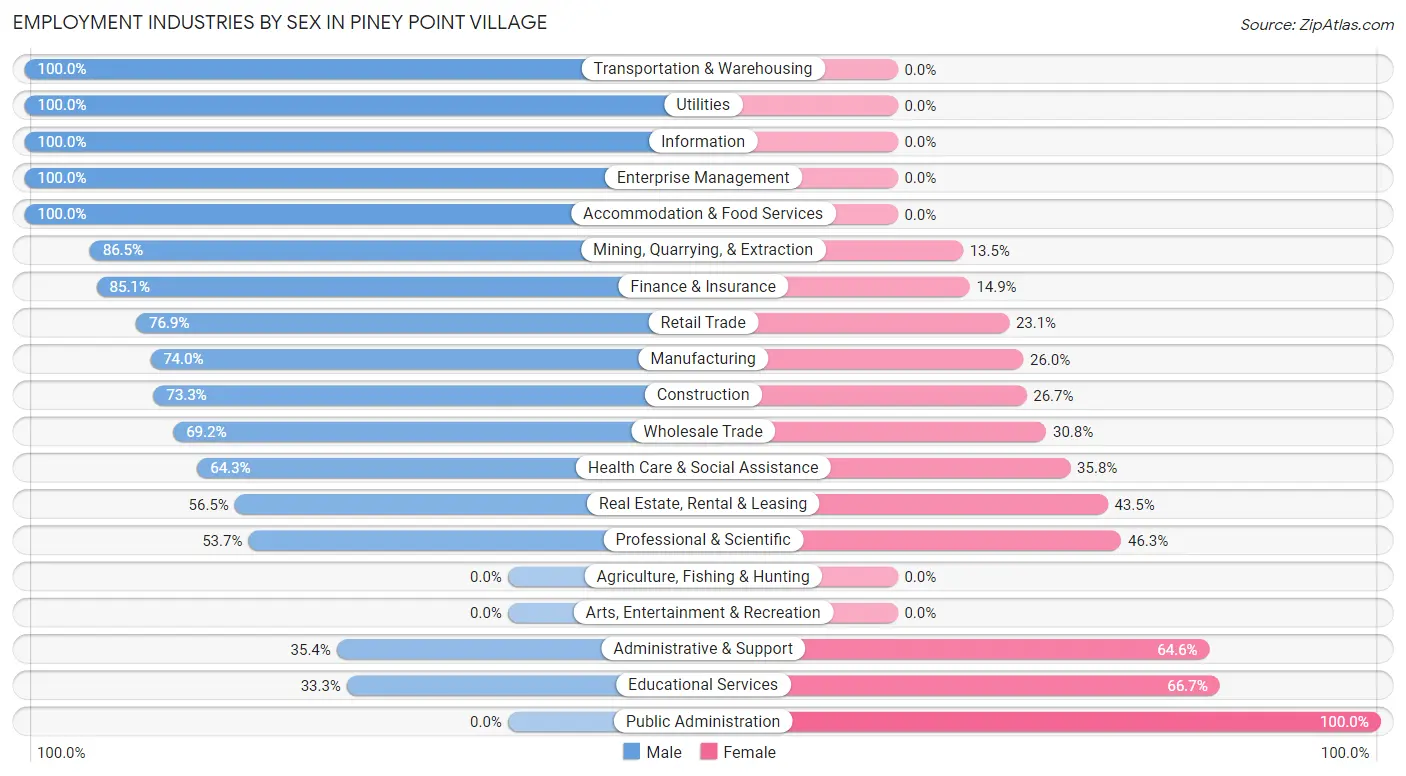
| Industry | Male | Female |
| Agriculture, Fishing & Hunting | 0 (0.0%) | 0 (0.0%) |
| Mining, Quarrying, & Extraction | 64 (86.5%) | 10 (13.5%) |
| Construction | 11 (73.3%) | 4 (26.7%) |
| Manufacturing | 74 (74.0%) | 26 (26.0%) |
| Wholesale Trade | 90 (69.2%) | 40 (30.8%) |
| Retail Trade | 10 (76.9%) | 3 (23.1%) |
| Transportation & Warehousing | 18 (100.0%) | 0 (0.0%) |
| Utilities | 9 (100.0%) | 0 (0.0%) |
| Information | 4 (100.0%) | 0 (0.0%) |
| Finance & Insurance | 97 (85.1%) | 17 (14.9%) |
| Real Estate, Rental & Leasing | 26 (56.5%) | 20 (43.5%) |
| Professional & Scientific | 275 (53.7%) | 237 (46.3%) |
| Enterprise Management | 42 (100.0%) | 0 (0.0%) |
| Administrative & Support | 17 (35.4%) | 31 (64.6%) |
| Educational Services | 19 (33.3%) | 38 (66.7%) |
| Health Care & Social Assistance | 115 (64.2%) | 64 (35.7%) |
| Arts, Entertainment & Recreation | 0 (0.0%) | 0 (0.0%) |
| Accommodation & Food Services | 20 (100.0%) | 0 (0.0%) |
| Public Administration | 0 (0.0%) | 14 (100.0%) |
| Total | 906 (63.4%) | 524 (36.6%) |
Education in Piney Point Village
School Enrollment in Piney Point Village
The most common levels of schooling among the 702 students in Piney Point Village are elementary school (219 | 31.2%), high school (184 | 26.2%), and middle school (123 | 17.5%).
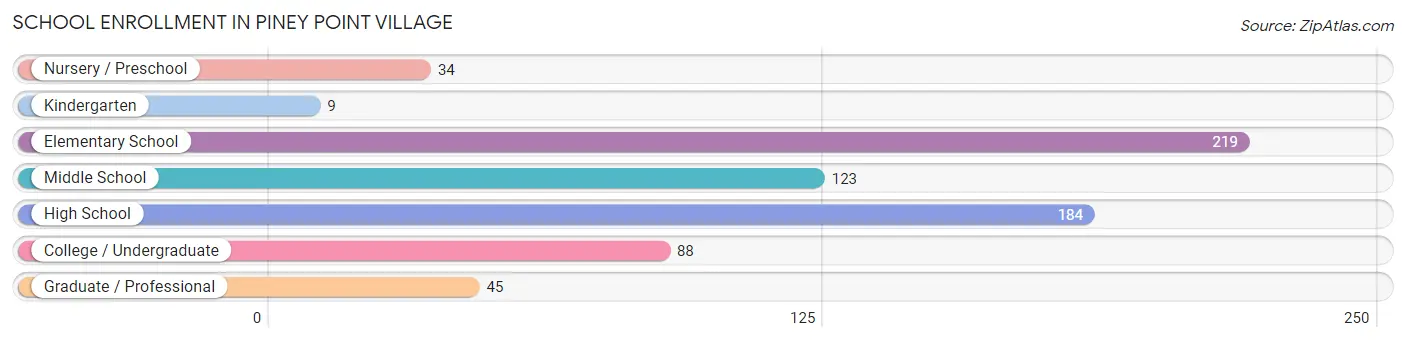
| School Level | # Students | % Students |
| Nursery / Preschool | 34 | 4.8% |
| Kindergarten | 9 | 1.3% |
| Elementary School | 219 | 31.2% |
| Middle School | 123 | 17.5% |
| High School | 184 | 26.2% |
| College / Undergraduate | 88 | 12.5% |
| Graduate / Professional | 45 | 6.4% |
| Total | 702 | 100.0% |
School Enrollment by Age by Funding Source in Piney Point Village
Out of a total of 702 students who are enrolled in schools in Piney Point Village, 384 (54.7%) attend a private institution, while the remaining 318 (45.3%) are enrolled in public schools. The age group of 3 to 4 year olds has the highest likelihood of being enrolled in private schools, with 17 (100.0% in the age bracket) enrolled. Conversely, the age group of 20 to 24 year olds has the lowest likelihood of being enrolled in a private school, with 72 (91.1% in the age bracket) attending a public institution.
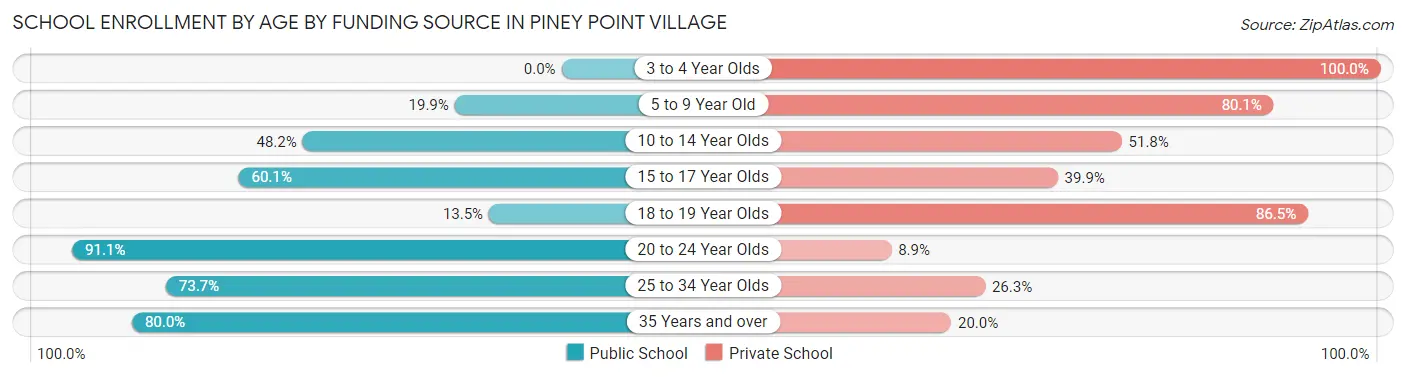
| Age Bracket | Public School | Private School |
| 3 to 4 Year Olds | 0 (0.0%) | 17 (100.0%) |
| 5 to 9 Year Old | 46 (19.9%) | 185 (80.1%) |
| 10 to 14 Year Olds | 68 (48.2%) | 73 (51.8%) |
| 15 to 17 Year Olds | 89 (60.1%) | 59 (39.9%) |
| 18 to 19 Year Olds | 5 (13.5%) | 32 (86.5%) |
| 20 to 24 Year Olds | 72 (91.1%) | 7 (8.9%) |
| 25 to 34 Year Olds | 14 (73.7%) | 5 (26.3%) |
| 35 Years and over | 24 (80.0%) | 6 (20.0%) |
| Total | 318 (45.3%) | 384 (54.7%) |
Educational Attainment by Field of Study in Piney Point Village
Business (514 | 25.5%), engineering (374 | 18.5%), social sciences (259 | 12.8%), education (184 | 9.1%), and bio, nature & agricultural (161 | 8.0%) are the most common fields of study among 2,017 individuals in Piney Point Village who have obtained a bachelor's degree or higher.
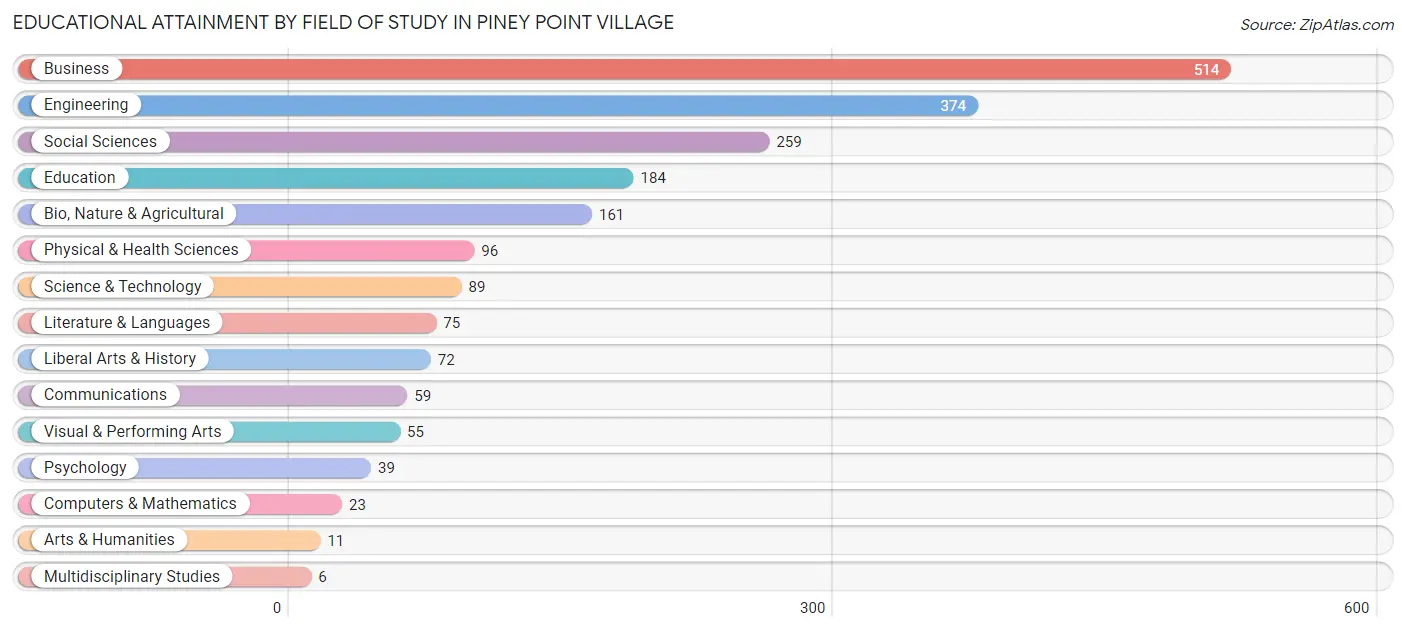
| Field of Study | # Graduates | % Graduates |
| Computers & Mathematics | 23 | 1.1% |
| Bio, Nature & Agricultural | 161 | 8.0% |
| Physical & Health Sciences | 96 | 4.8% |
| Psychology | 39 | 1.9% |
| Social Sciences | 259 | 12.8% |
| Engineering | 374 | 18.5% |
| Multidisciplinary Studies | 6 | 0.3% |
| Science & Technology | 89 | 4.4% |
| Business | 514 | 25.5% |
| Education | 184 | 9.1% |
| Literature & Languages | 75 | 3.7% |
| Liberal Arts & History | 72 | 3.6% |
| Visual & Performing Arts | 55 | 2.7% |
| Communications | 59 | 2.9% |
| Arts & Humanities | 11 | 0.5% |
| Total | 2,017 | 100.0% |
Transportation & Commute in Piney Point Village
Vehicle Availability by Sex in Piney Point Village
The most prevalent vehicle ownership categories in Piney Point Village are males with 3 vehicles (321, accounting for 35.6%) and females with 3 vehicles (120, making up 64.7%).
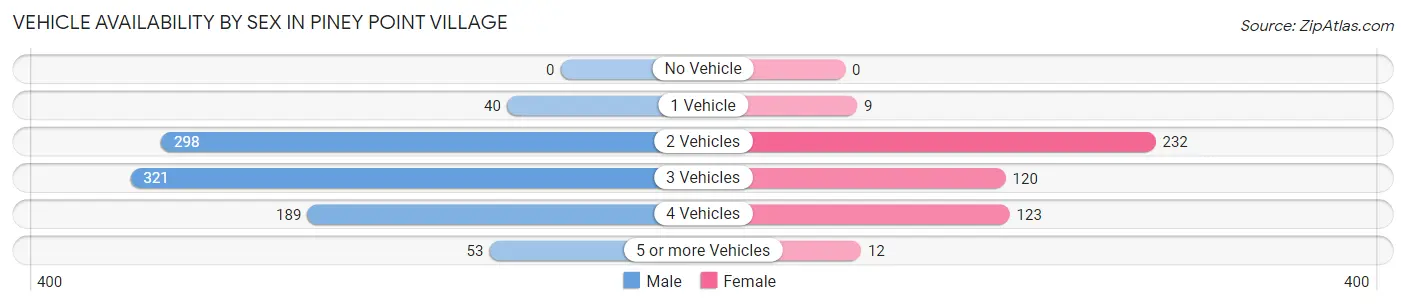
| Vehicles Available | Male | Female |
| No Vehicle | 0 (0.0%) | 0 (0.0%) |
| 1 Vehicle | 40 (4.4%) | 9 (1.8%) |
| 2 Vehicles | 298 (33.1%) | 232 (46.8%) |
| 3 Vehicles | 321 (35.6%) | 120 (24.2%) |
| 4 Vehicles | 189 (21.0%) | 123 (24.8%) |
| 5 or more Vehicles | 53 (5.9%) | 12 (2.4%) |
| Total | 901 (100.0%) | 496 (100.0%) |
Commute Time in Piney Point Village
The most frequently occuring commute durations in Piney Point Village are 15 to 19 minutes (194 commuters, 18.5%), 20 to 24 minutes (176 commuters, 16.8%), and 5 to 9 minutes (168 commuters, 16.0%).
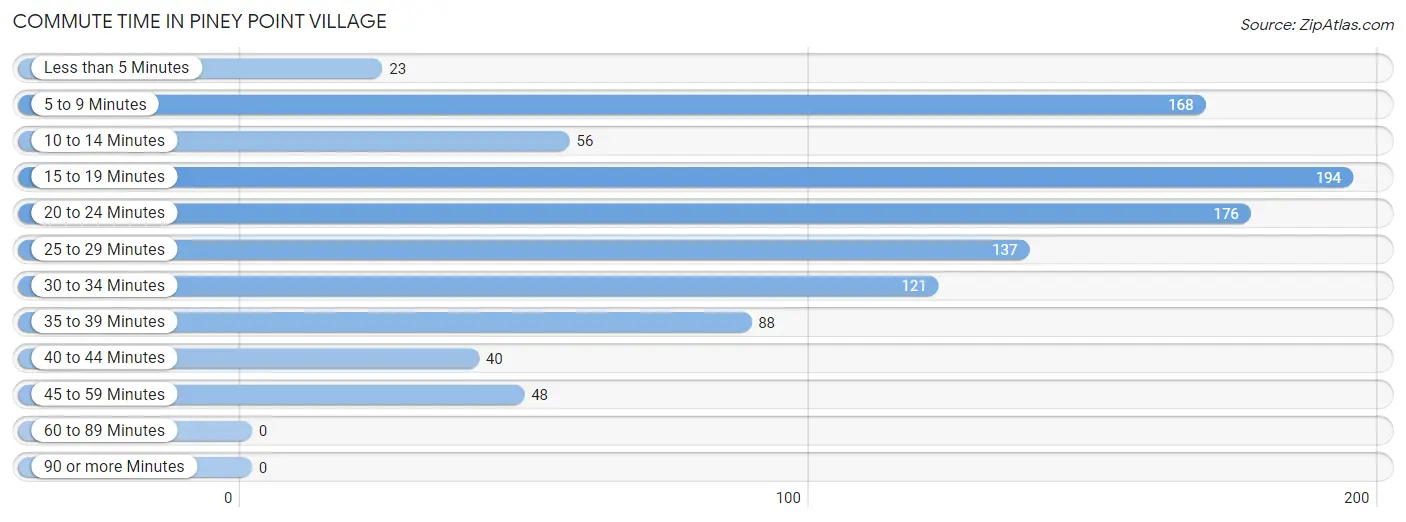
| Commute Time | # Commuters | % Commuters |
| Less than 5 Minutes | 23 | 2.2% |
| 5 to 9 Minutes | 168 | 16.0% |
| 10 to 14 Minutes | 56 | 5.3% |
| 15 to 19 Minutes | 194 | 18.5% |
| 20 to 24 Minutes | 176 | 16.8% |
| 25 to 29 Minutes | 137 | 13.0% |
| 30 to 34 Minutes | 121 | 11.5% |
| 35 to 39 Minutes | 88 | 8.4% |
| 40 to 44 Minutes | 40 | 3.8% |
| 45 to 59 Minutes | 48 | 4.6% |
| 60 to 89 Minutes | 0 | 0.0% |
| 90 or more Minutes | 0 | 0.0% |
Commute Time by Sex in Piney Point Village
The most common commute times in Piney Point Village are 15 to 19 minutes (158 commuters, 23.0%) for males and 5 to 9 minutes (92 commuters, 25.3%) for females.
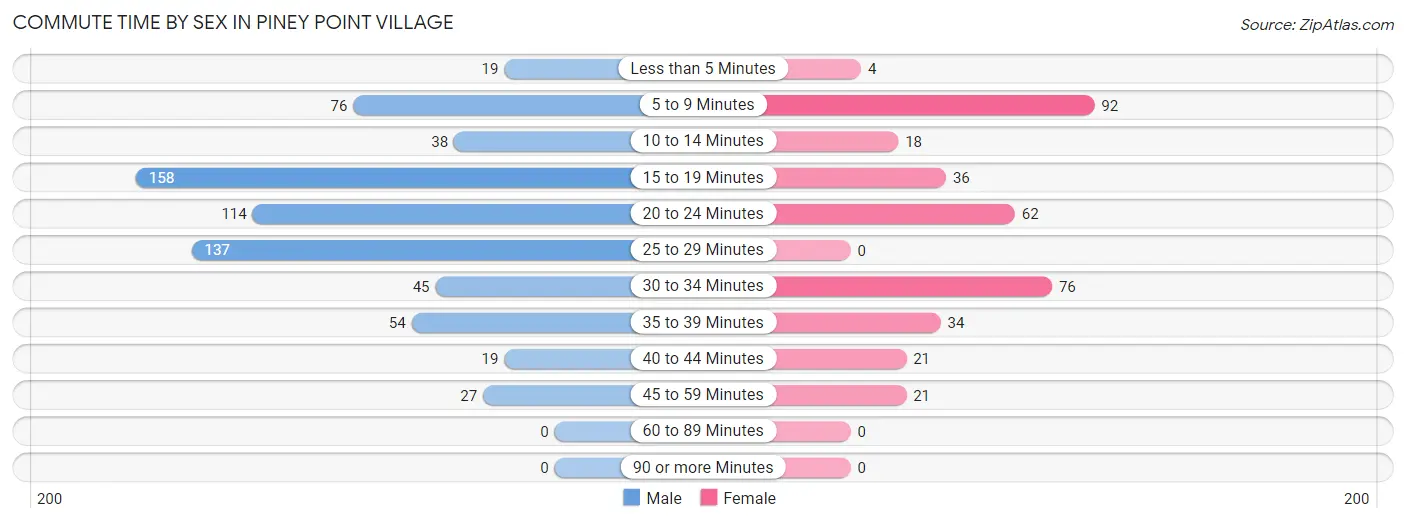
| Commute Time | Male | Female |
| Less than 5 Minutes | 19 (2.8%) | 4 (1.1%) |
| 5 to 9 Minutes | 76 (11.1%) | 92 (25.3%) |
| 10 to 14 Minutes | 38 (5.5%) | 18 (5.0%) |
| 15 to 19 Minutes | 158 (23.0%) | 36 (9.9%) |
| 20 to 24 Minutes | 114 (16.6%) | 62 (17.0%) |
| 25 to 29 Minutes | 137 (19.9%) | 0 (0.0%) |
| 30 to 34 Minutes | 45 (6.6%) | 76 (20.9%) |
| 35 to 39 Minutes | 54 (7.9%) | 34 (9.3%) |
| 40 to 44 Minutes | 19 (2.8%) | 21 (5.8%) |
| 45 to 59 Minutes | 27 (3.9%) | 21 (5.8%) |
| 60 to 89 Minutes | 0 (0.0%) | 0 (0.0%) |
| 90 or more Minutes | 0 (0.0%) | 0 (0.0%) |
Time of Departure to Work by Sex in Piney Point Village
The most frequent times of departure to work in Piney Point Village are 9:00 AM to 9:59 AM (183, 26.6%) for males and 8:00 AM to 8:29 AM (161, 44.2%) for females.
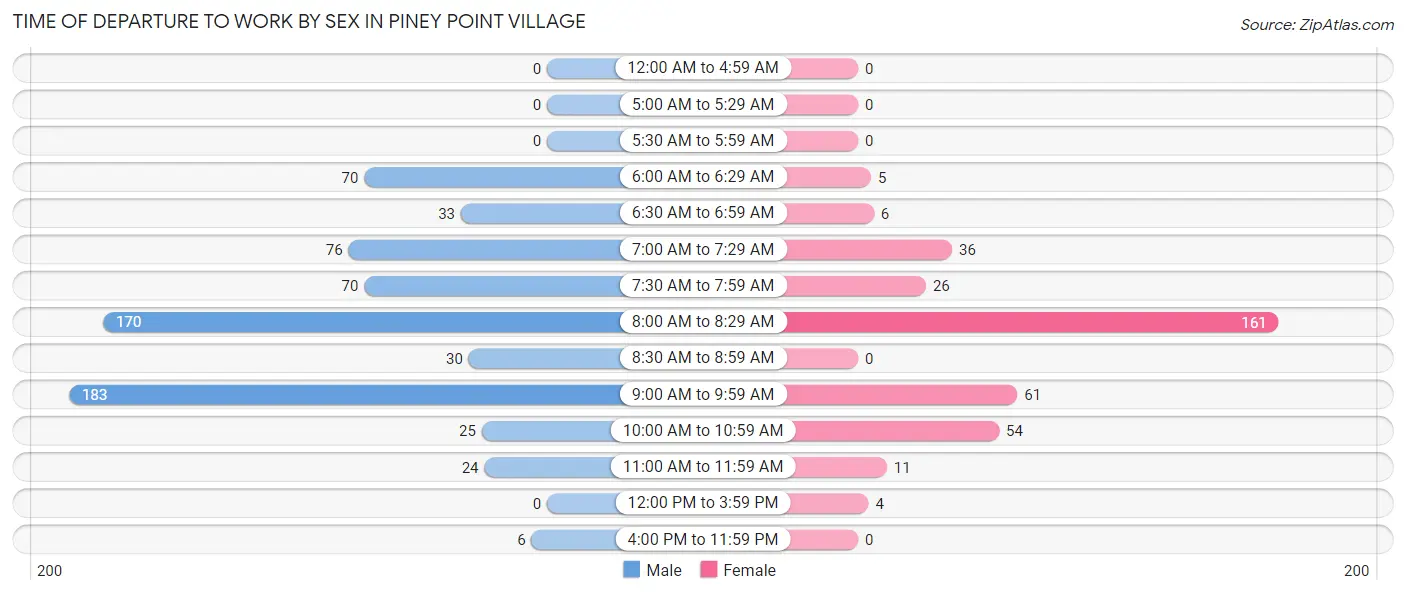
| Time of Departure | Male | Female |
| 12:00 AM to 4:59 AM | 0 (0.0%) | 0 (0.0%) |
| 5:00 AM to 5:29 AM | 0 (0.0%) | 0 (0.0%) |
| 5:30 AM to 5:59 AM | 0 (0.0%) | 0 (0.0%) |
| 6:00 AM to 6:29 AM | 70 (10.2%) | 5 (1.4%) |
| 6:30 AM to 6:59 AM | 33 (4.8%) | 6 (1.7%) |
| 7:00 AM to 7:29 AM | 76 (11.1%) | 36 (9.9%) |
| 7:30 AM to 7:59 AM | 70 (10.2%) | 26 (7.1%) |
| 8:00 AM to 8:29 AM | 170 (24.7%) | 161 (44.2%) |
| 8:30 AM to 8:59 AM | 30 (4.4%) | 0 (0.0%) |
| 9:00 AM to 9:59 AM | 183 (26.6%) | 61 (16.8%) |
| 10:00 AM to 10:59 AM | 25 (3.6%) | 54 (14.8%) |
| 11:00 AM to 11:59 AM | 24 (3.5%) | 11 (3.0%) |
| 12:00 PM to 3:59 PM | 0 (0.0%) | 4 (1.1%) |
| 4:00 PM to 11:59 PM | 6 (0.9%) | 0 (0.0%) |
| Total | 687 (100.0%) | 364 (100.0%) |
Housing Occupancy in Piney Point Village
Occupancy by Ownership in Piney Point Village
Of the total 1,146 dwellings in Piney Point Village, owner-occupied units account for 1,134 (99.0%), while renter-occupied units make up 12 (1.1%).
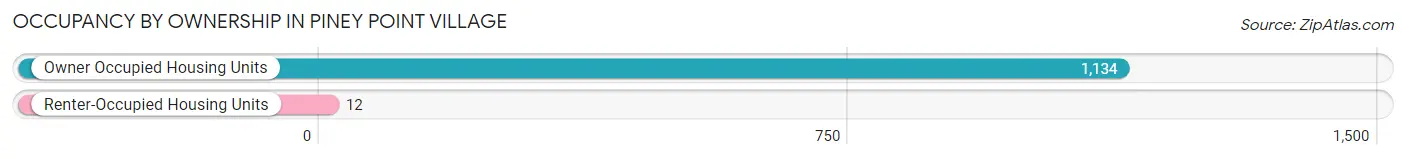
| Occupancy | # Housing Units | % Housing Units |
| Owner Occupied Housing Units | 1,134 | 99.0% |
| Renter-Occupied Housing Units | 12 | 1.1% |
| Total Occupied Housing Units | 1,146 | 100.0% |
Occupancy by Household Size in Piney Point Village
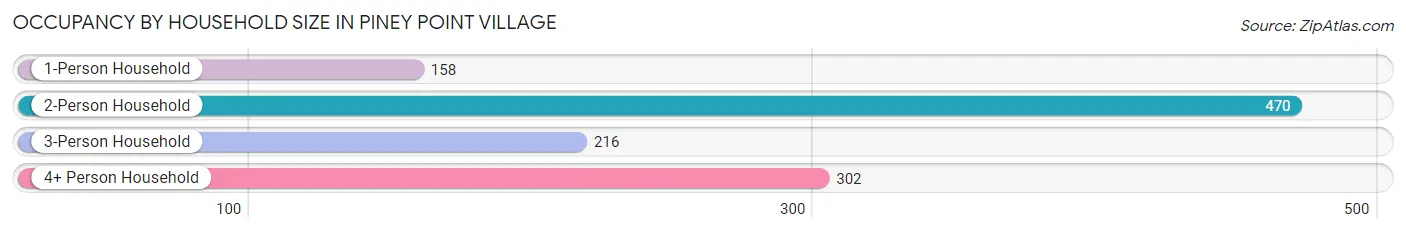
| Household Size | # Housing Units | % Housing Units |
| 1-Person Household | 158 | 13.8% |
| 2-Person Household | 470 | 41.0% |
| 3-Person Household | 216 | 18.9% |
| 4+ Person Household | 302 | 26.4% |
| Total Housing Units | 1,146 | 100.0% |
Occupancy by Ownership by Household Size in Piney Point Village
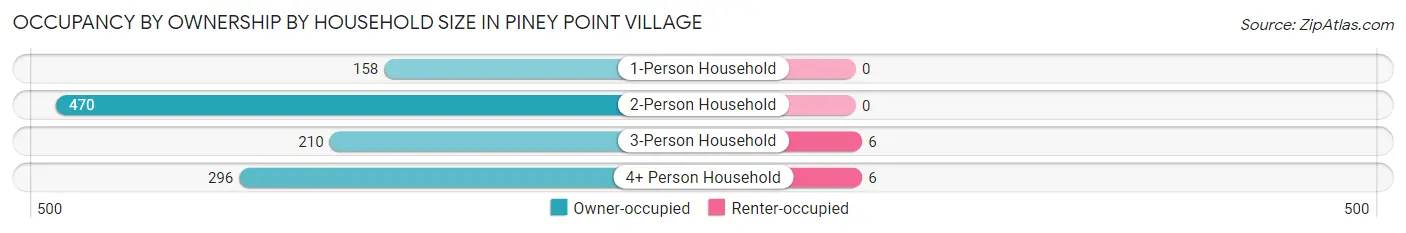
| Household Size | Owner-occupied | Renter-occupied |
| 1-Person Household | 158 (100.0%) | 0 (0.0%) |
| 2-Person Household | 470 (100.0%) | 0 (0.0%) |
| 3-Person Household | 210 (97.2%) | 6 (2.8%) |
| 4+ Person Household | 296 (98.0%) | 6 (2.0%) |
| Total Housing Units | 1,134 (99.0%) | 12 (1.1%) |
Occupancy by Educational Attainment in Piney Point Village
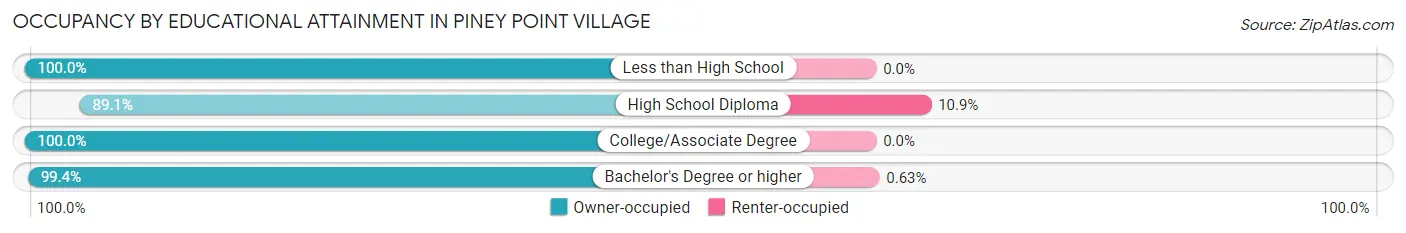
| Household Size | Owner-occupied | Renter-occupied |
| Less than High School | 6 (100.0%) | 0 (0.0%) |
| High School Diploma | 49 (89.1%) | 6 (10.9%) |
| College/Associate Degree | 131 (100.0%) | 0 (0.0%) |
| Bachelor's Degree or higher | 948 (99.4%) | 6 (0.6%) |
Occupancy by Age of Householder in Piney Point Village
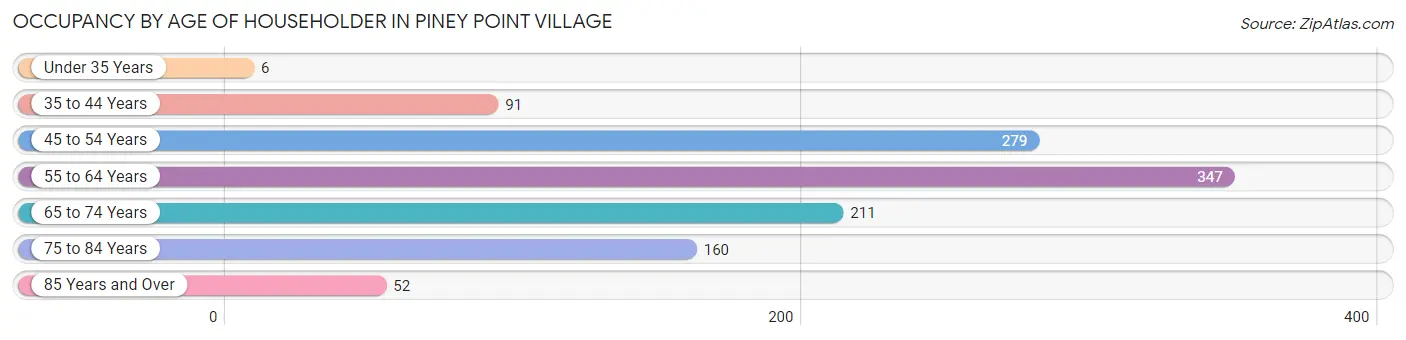
| Age Bracket | # Households | % Households |
| Under 35 Years | 6 | 0.5% |
| 35 to 44 Years | 91 | 7.9% |
| 45 to 54 Years | 279 | 24.3% |
| 55 to 64 Years | 347 | 30.3% |
| 65 to 74 Years | 211 | 18.4% |
| 75 to 84 Years | 160 | 14.0% |
| 85 Years and Over | 52 | 4.5% |
| Total | 1,146 | 100.0% |
Housing Finances in Piney Point Village
Median Income by Occupancy in Piney Point Village
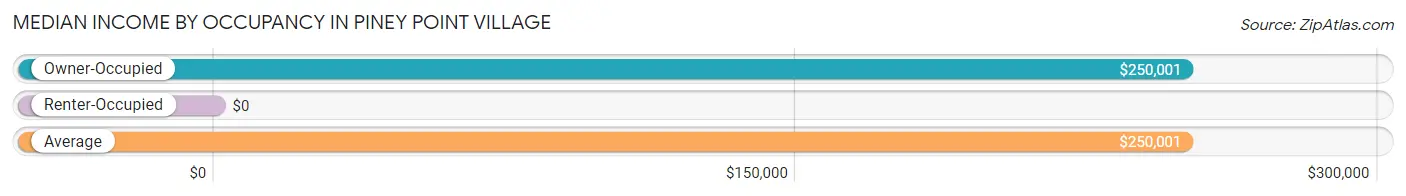
| Occupancy Type | # Households | Median Income |
| Owner-Occupied | 1,134 (99.0%) | $250,001 |
| Renter-Occupied | 12 (1.1%) | $0 |
| Average | 1,146 (100.0%) | $250,001 |
Occupancy by Householder Income Bracket in Piney Point Village
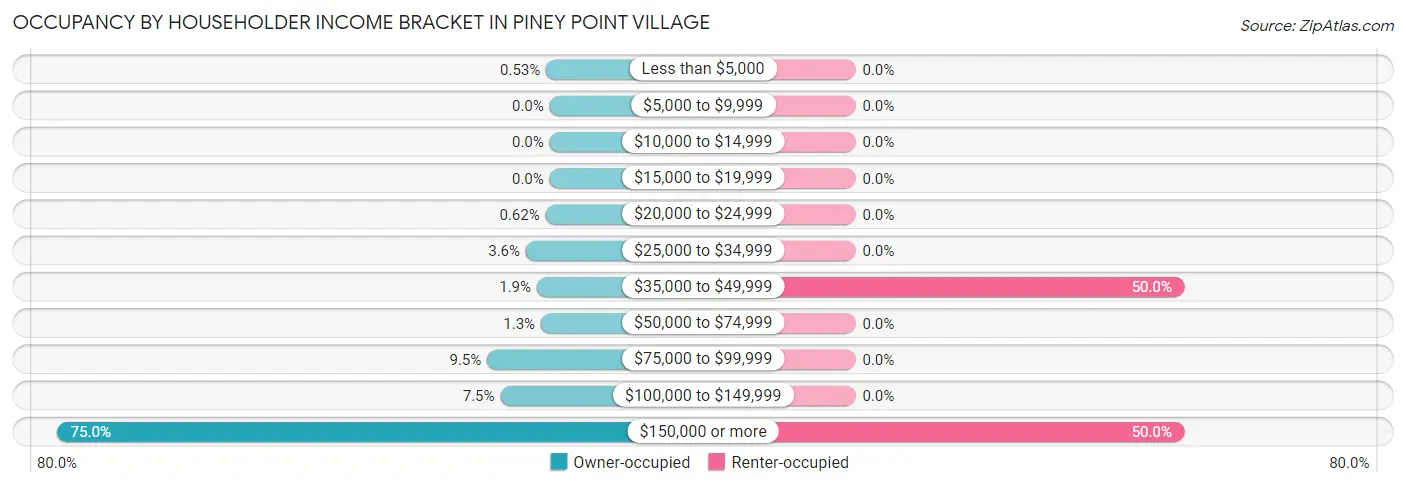
| Income Bracket | Owner-occupied | Renter-occupied |
| Less than $5,000 | 6 (0.5%) | 0 (0.0%) |
| $5,000 to $9,999 | 0 (0.0%) | 0 (0.0%) |
| $10,000 to $14,999 | 0 (0.0%) | 0 (0.0%) |
| $15,000 to $19,999 | 0 (0.0%) | 0 (0.0%) |
| $20,000 to $24,999 | 7 (0.6%) | 0 (0.0%) |
| $25,000 to $34,999 | 41 (3.6%) | 0 (0.0%) |
| $35,000 to $49,999 | 22 (1.9%) | 6 (50.0%) |
| $50,000 to $74,999 | 15 (1.3%) | 0 (0.0%) |
| $75,000 to $99,999 | 108 (9.5%) | 0 (0.0%) |
| $100,000 to $149,999 | 85 (7.5%) | 0 (0.0%) |
| $150,000 or more | 850 (75.0%) | 6 (50.0%) |
| Total | 1,134 (100.0%) | 12 (100.0%) |
Monthly Housing Cost Tiers in Piney Point Village
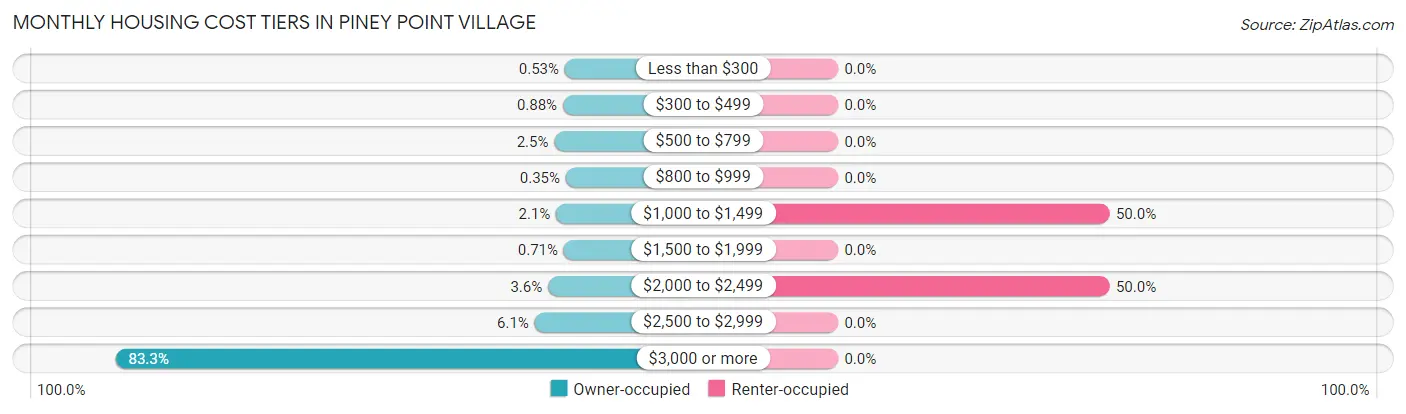
| Monthly Cost | Owner-occupied | Renter-occupied |
| Less than $300 | 6 (0.5%) | 0 (0.0%) |
| $300 to $499 | 10 (0.9%) | 0 (0.0%) |
| $500 to $799 | 28 (2.5%) | 0 (0.0%) |
| $800 to $999 | 4 (0.4%) | 0 (0.0%) |
| $1,000 to $1,499 | 24 (2.1%) | 6 (50.0%) |
| $1,500 to $1,999 | 8 (0.7%) | 0 (0.0%) |
| $2,000 to $2,499 | 41 (3.6%) | 6 (50.0%) |
| $2,500 to $2,999 | 69 (6.1%) | 0 (0.0%) |
| $3,000 or more | 944 (83.3%) | 0 (0.0%) |
| Total | 1,134 (100.0%) | 12 (100.0%) |
Physical Housing Characteristics in Piney Point Village
Housing Structures in Piney Point Village
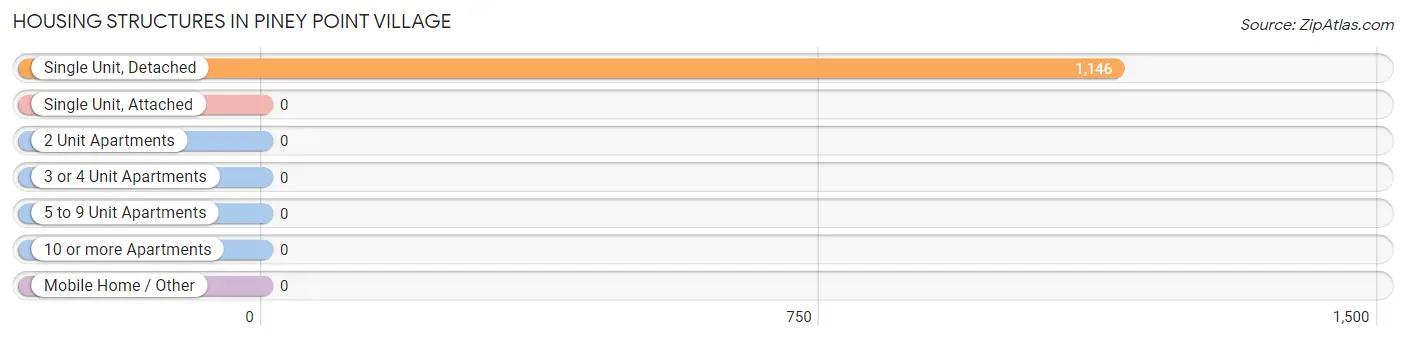
| Structure Type | # Housing Units | % Housing Units |
| Single Unit, Detached | 1,146 | 100.0% |
| Single Unit, Attached | 0 | 0.0% |
| 2 Unit Apartments | 0 | 0.0% |
| 3 or 4 Unit Apartments | 0 | 0.0% |
| 5 to 9 Unit Apartments | 0 | 0.0% |
| 10 or more Apartments | 0 | 0.0% |
| Mobile Home / Other | 0 | 0.0% |
| Total | 1,146 | 100.0% |
Housing Structures by Occupancy in Piney Point Village
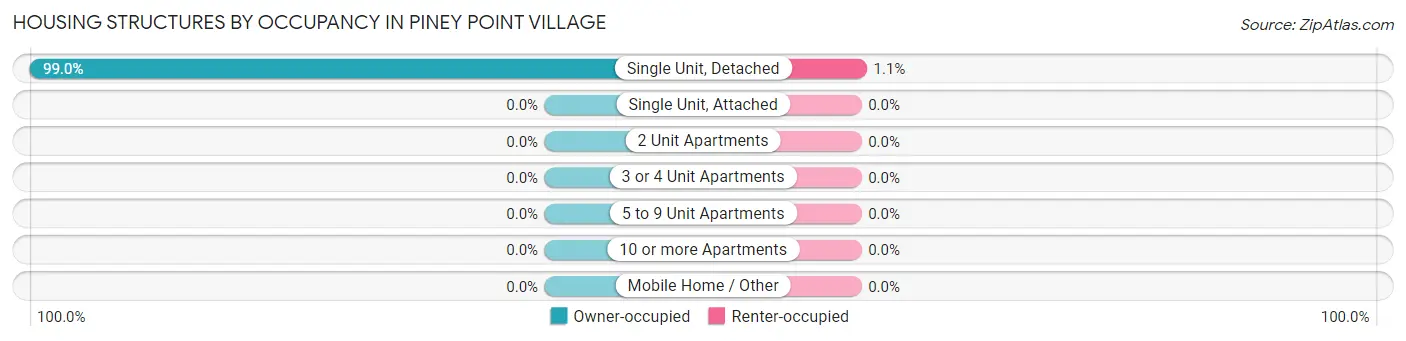
| Structure Type | Owner-occupied | Renter-occupied |
| Single Unit, Detached | 1,134 (99.0%) | 12 (1.1%) |
| Single Unit, Attached | 0 (0.0%) | 0 (0.0%) |
| 2 Unit Apartments | 0 (0.0%) | 0 (0.0%) |
| 3 or 4 Unit Apartments | 0 (0.0%) | 0 (0.0%) |
| 5 to 9 Unit Apartments | 0 (0.0%) | 0 (0.0%) |
| 10 or more Apartments | 0 (0.0%) | 0 (0.0%) |
| Mobile Home / Other | 0 (0.0%) | 0 (0.0%) |
| Total | 1,134 (99.0%) | 12 (1.1%) |
Housing Structures by Number of Rooms in Piney Point Village
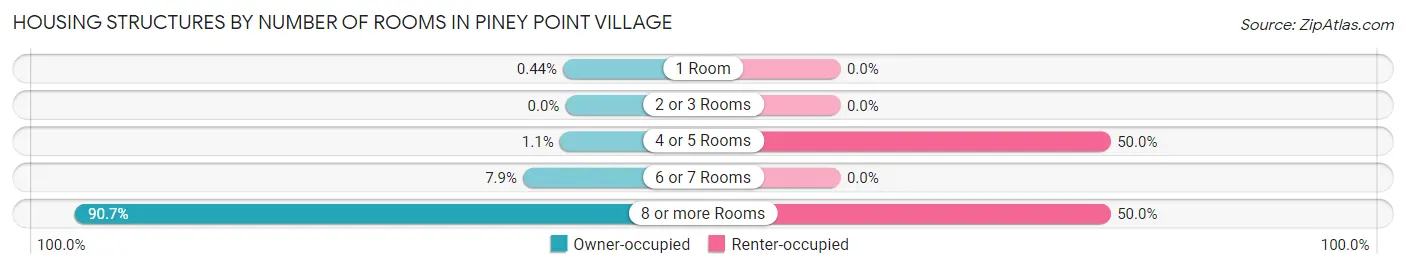
| Number of Rooms | Owner-occupied | Renter-occupied |
| 1 Room | 5 (0.4%) | 0 (0.0%) |
| 2 or 3 Rooms | 0 (0.0%) | 0 (0.0%) |
| 4 or 5 Rooms | 12 (1.1%) | 6 (50.0%) |
| 6 or 7 Rooms | 89 (7.9%) | 0 (0.0%) |
| 8 or more Rooms | 1,028 (90.6%) | 6 (50.0%) |
| Total | 1,134 (100.0%) | 12 (100.0%) |
Housing Structure by Heating Type in Piney Point Village
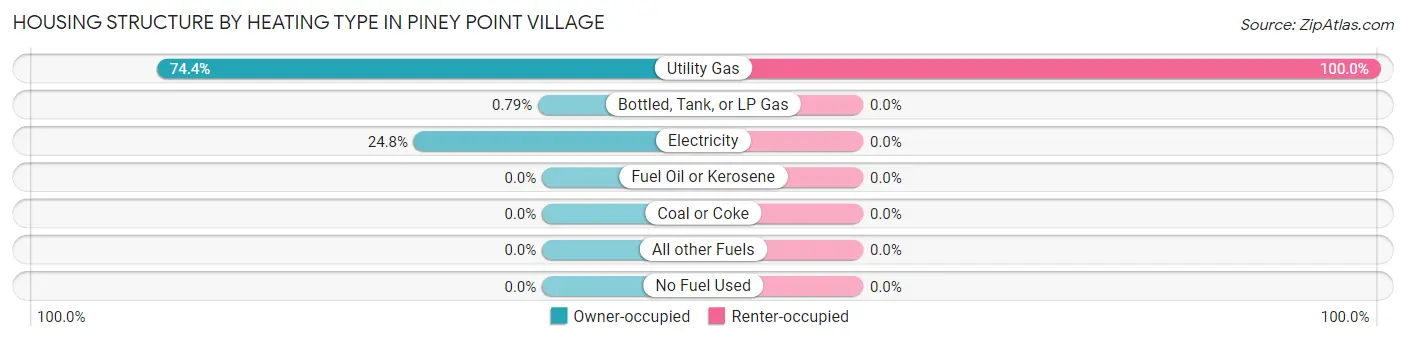
| Heating Type | Owner-occupied | Renter-occupied |
| Utility Gas | 844 (74.4%) | 12 (100.0%) |
| Bottled, Tank, or LP Gas | 9 (0.8%) | 0 (0.0%) |
| Electricity | 281 (24.8%) | 0 (0.0%) |
| Fuel Oil or Kerosene | 0 (0.0%) | 0 (0.0%) |
| Coal or Coke | 0 (0.0%) | 0 (0.0%) |
| All other Fuels | 0 (0.0%) | 0 (0.0%) |
| No Fuel Used | 0 (0.0%) | 0 (0.0%) |
| Total | 1,134 (100.0%) | 12 (100.0%) |
Household Vehicle Usage in Piney Point Village
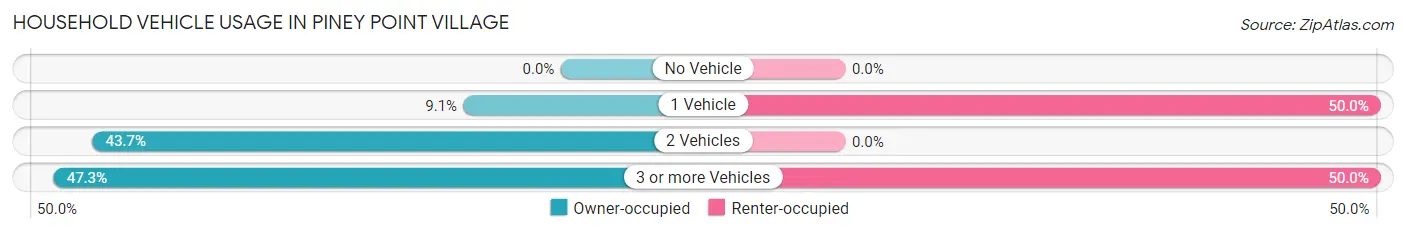
| Vehicles per Household | Owner-occupied | Renter-occupied |
| No Vehicle | 0 (0.0%) | 0 (0.0%) |
| 1 Vehicle | 103 (9.1%) | 6 (50.0%) |
| 2 Vehicles | 495 (43.6%) | 0 (0.0%) |
| 3 or more Vehicles | 536 (47.3%) | 6 (50.0%) |
| Total | 1,134 (100.0%) | 12 (100.0%) |
Real Estate & Mortgages in Piney Point Village
Real Estate and Mortgage Overview in Piney Point Village
| Characteristic | Without Mortgage | With Mortgage |
| Housing Units | 662 | 472 |
| Median Property Value | $2,000,001 | $2,000,001 |
| Median Household Income | $250,001 | $367 |
| Monthly Housing Costs | $1,501 | $466 |
| Real Estate Taxes | $10,001 | $48 |
Property Value by Mortgage Status in Piney Point Village
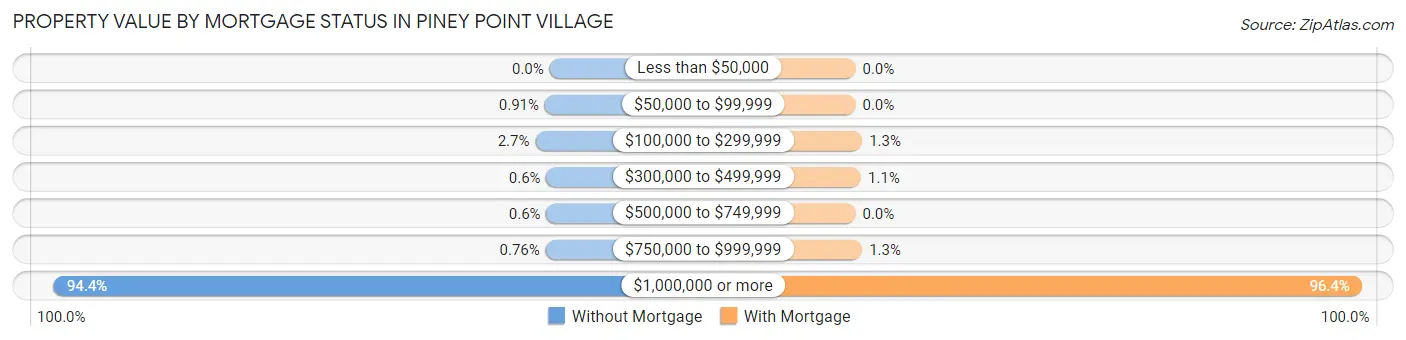
| Property Value | Without Mortgage | With Mortgage |
| Less than $50,000 | 0 (0.0%) | 0 (0.0%) |
| $50,000 to $99,999 | 6 (0.9%) | 0 (0.0%) |
| $100,000 to $299,999 | 18 (2.7%) | 6 (1.3%) |
| $300,000 to $499,999 | 4 (0.6%) | 5 (1.1%) |
| $500,000 to $749,999 | 4 (0.6%) | 0 (0.0%) |
| $750,000 to $999,999 | 5 (0.8%) | 6 (1.3%) |
| $1,000,000 or more | 625 (94.4%) | 455 (96.4%) |
| Total | 662 (100.0%) | 472 (100.0%) |
Household Income by Mortgage Status in Piney Point Village
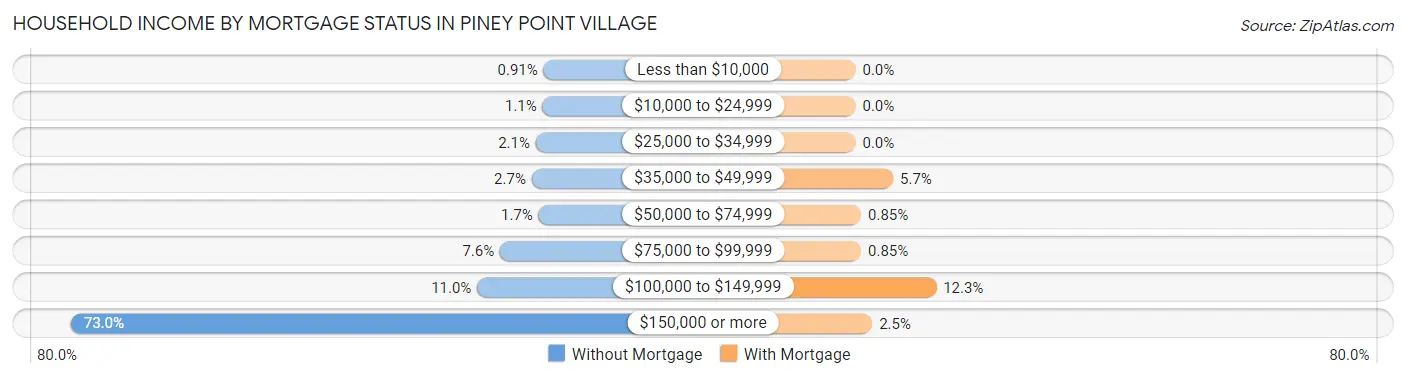
| Household Income | Without Mortgage | With Mortgage |
| Less than $10,000 | 6 (0.9%) | 0 (0.0%) |
| $10,000 to $24,999 | 7 (1.1%) | 0 (0.0%) |
| $25,000 to $34,999 | 14 (2.1%) | 0 (0.0%) |
| $35,000 to $49,999 | 18 (2.7%) | 27 (5.7%) |
| $50,000 to $74,999 | 11 (1.7%) | 4 (0.9%) |
| $75,000 to $99,999 | 50 (7.5%) | 4 (0.9%) |
| $100,000 to $149,999 | 73 (11.0%) | 58 (12.3%) |
| $150,000 or more | 483 (73.0%) | 12 (2.5%) |
| Total | 662 (100.0%) | 472 (100.0%) |
Property Value to Household Income Ratio in Piney Point Village
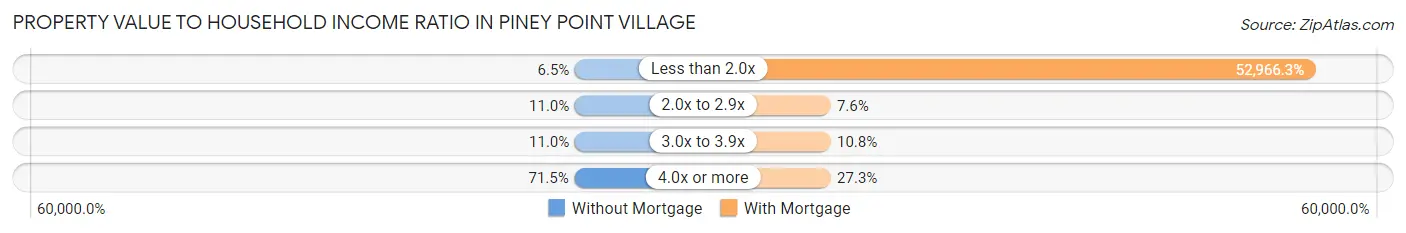
| Value-to-Income Ratio | Without Mortgage | With Mortgage |
| Less than 2.0x | 43 (6.5%) | 250,001 (52,966.3%) |
| 2.0x to 2.9x | 73 (11.0%) | 36 (7.6%) |
| 3.0x to 3.9x | 73 (11.0%) | 51 (10.8%) |
| 4.0x or more | 473 (71.5%) | 129 (27.3%) |
| Total | 662 (100.0%) | 472 (100.0%) |
Real Estate Taxes by Mortgage Status in Piney Point Village
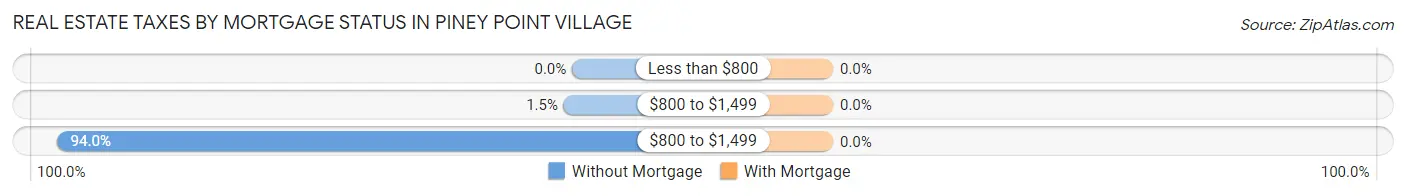
| Property Taxes | Without Mortgage | With Mortgage |
| Less than $800 | 0 (0.0%) | 0 (0.0%) |
| $800 to $1,499 | 10 (1.5%) | 0 (0.0%) |
| $800 to $1,499 | 622 (94.0%) | 0 (0.0%) |
| Total | 662 (100.0%) | 472 (100.0%) |
Health & Disability in Piney Point Village
Health Insurance Coverage by Age in Piney Point Village
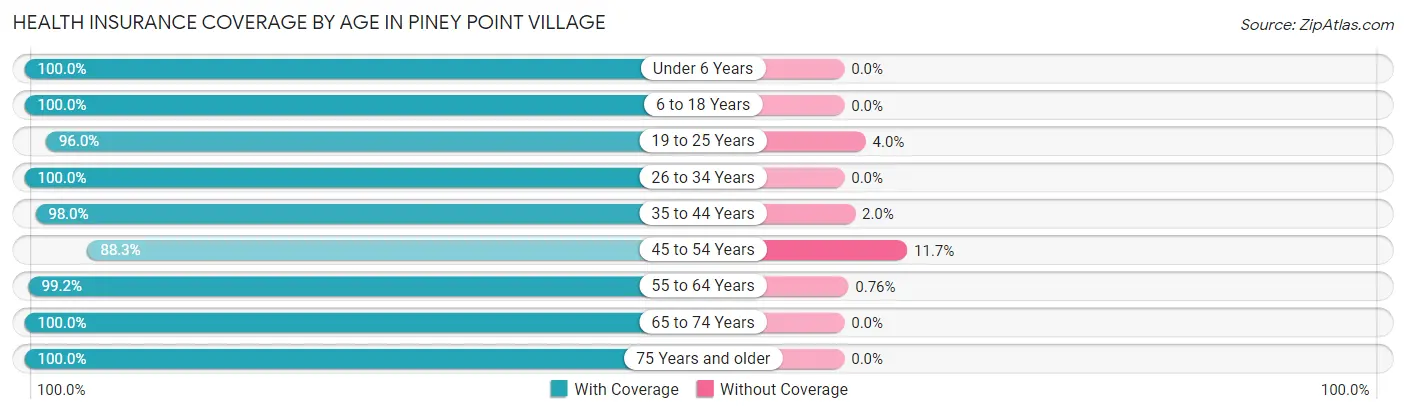
| Age Bracket | With Coverage | Without Coverage |
| Under 6 Years | 53 (100.0%) | 0 (0.0%) |
| 6 to 18 Years | 532 (100.0%) | 0 (0.0%) |
| 19 to 25 Years | 193 (96.0%) | 8 (4.0%) |
| 26 to 34 Years | 122 (100.0%) | 0 (0.0%) |
| 35 to 44 Years | 245 (98.0%) | 5 (2.0%) |
| 45 to 54 Years | 528 (88.3%) | 70 (11.7%) |
| 55 to 64 Years | 654 (99.2%) | 5 (0.8%) |
| 65 to 74 Years | 378 (100.0%) | 0 (0.0%) |
| 75 Years and older | 321 (100.0%) | 0 (0.0%) |
| Total | 3,026 (97.2%) | 88 (2.8%) |
Health Insurance Coverage by Citizenship Status in Piney Point Village
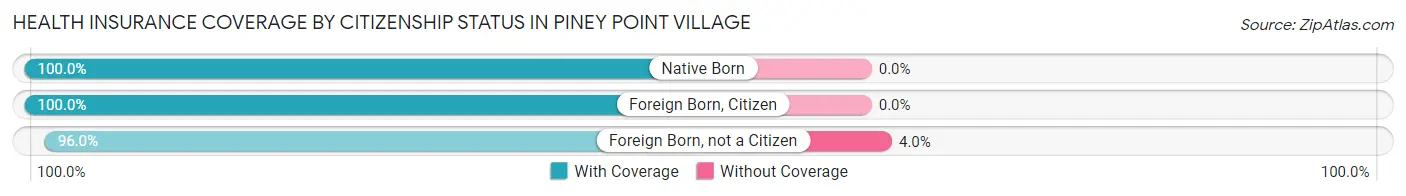
| Citizenship Status | With Coverage | Without Coverage |
| Native Born | 53 (100.0%) | 0 (0.0%) |
| Foreign Born, Citizen | 532 (100.0%) | 0 (0.0%) |
| Foreign Born, not a Citizen | 193 (96.0%) | 8 (4.0%) |
Health Insurance Coverage by Household Income in Piney Point Village
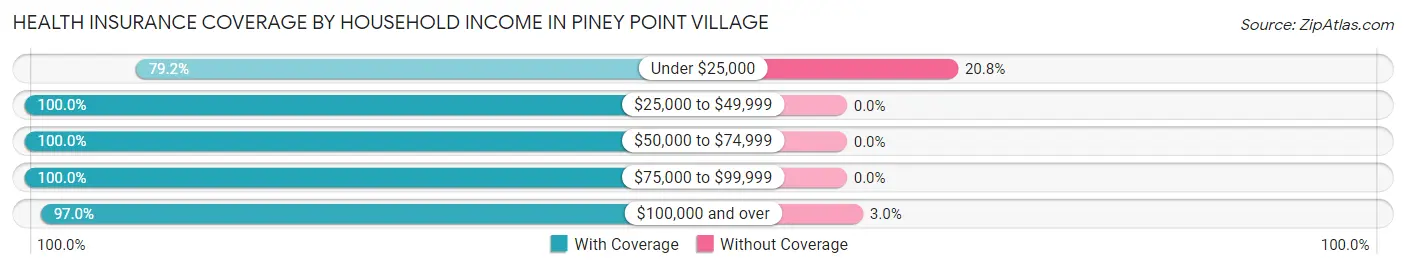
| Household Income | With Coverage | Without Coverage |
| Under $25,000 | 19 (79.2%) | 5 (20.8%) |
| $25,000 to $49,999 | 161 (100.0%) | 0 (0.0%) |
| $50,000 to $74,999 | 23 (100.0%) | 0 (0.0%) |
| $75,000 to $99,999 | 156 (100.0%) | 0 (0.0%) |
| $100,000 and over | 2,667 (97.0%) | 83 (3.0%) |
Public vs Private Health Insurance Coverage by Age in Piney Point Village
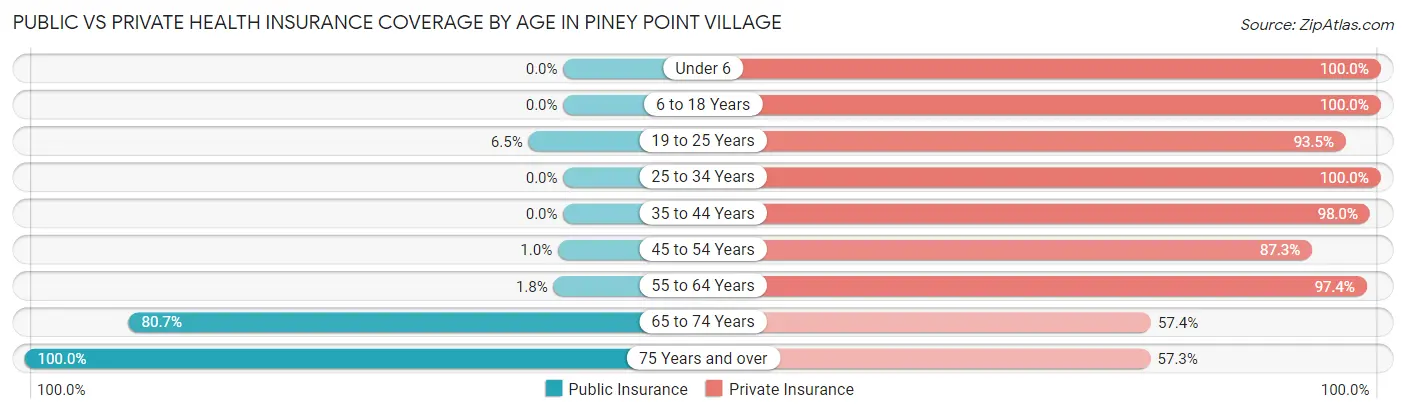
| Age Bracket | Public Insurance | Private Insurance |
| Under 6 | 0 (0.0%) | 53 (100.0%) |
| 6 to 18 Years | 0 (0.0%) | 532 (100.0%) |
| 19 to 25 Years | 13 (6.5%) | 188 (93.5%) |
| 25 to 34 Years | 0 (0.0%) | 122 (100.0%) |
| 35 to 44 Years | 0 (0.0%) | 245 (98.0%) |
| 45 to 54 Years | 6 (1.0%) | 522 (87.3%) |
| 55 to 64 Years | 12 (1.8%) | 642 (97.4%) |
| 65 to 74 Years | 305 (80.7%) | 217 (57.4%) |
| 75 Years and over | 321 (100.0%) | 184 (57.3%) |
| Total | 657 (21.1%) | 2,705 (86.9%) |
Disability Status by Sex by Age in Piney Point Village
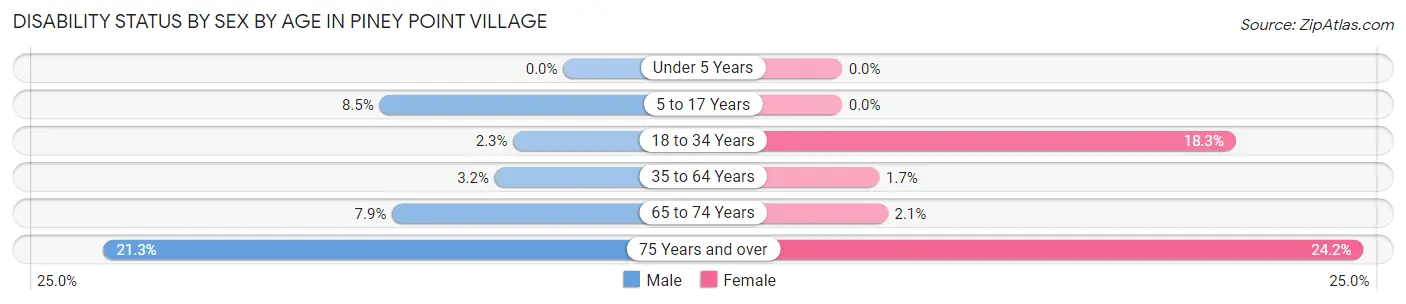
| Age Bracket | Male | Female |
| Under 5 Years | 0 (0.0%) | 0 (0.0%) |
| 5 to 17 Years | 22 (8.5%) | 0 (0.0%) |
| 18 to 34 Years | 6 (2.3%) | 17 (18.3%) |
| 35 to 64 Years | 24 (3.2%) | 13 (1.7%) |
| 65 to 74 Years | 15 (7.9%) | 4 (2.1%) |
| 75 Years and over | 35 (21.3%) | 38 (24.2%) |
Disability Class by Sex by Age in Piney Point Village
Disability Class: Hearing Difficulty
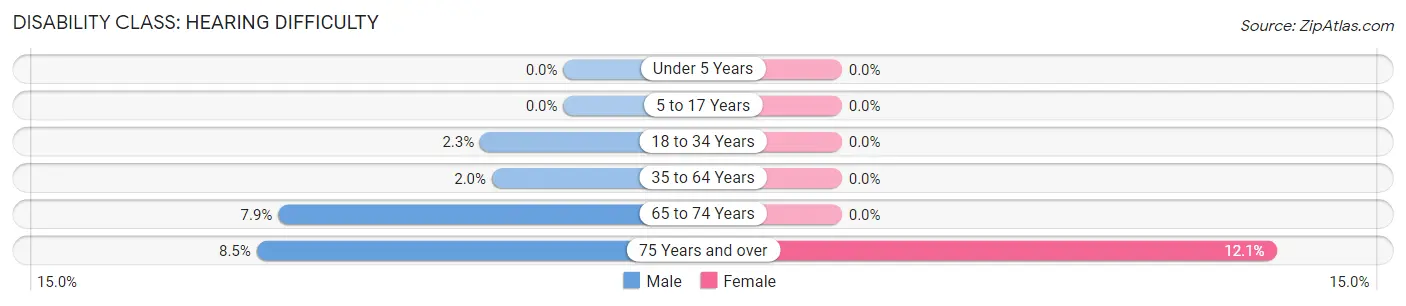
| Age Bracket | Male | Female |
| Under 5 Years | 0 (0.0%) | 0 (0.0%) |
| 5 to 17 Years | 0 (0.0%) | 0 (0.0%) |
| 18 to 34 Years | 6 (2.3%) | 0 (0.0%) |
| 35 to 64 Years | 15 (2.0%) | 0 (0.0%) |
| 65 to 74 Years | 15 (7.9%) | 0 (0.0%) |
| 75 Years and over | 14 (8.5%) | 19 (12.1%) |
Disability Class: Vision Difficulty
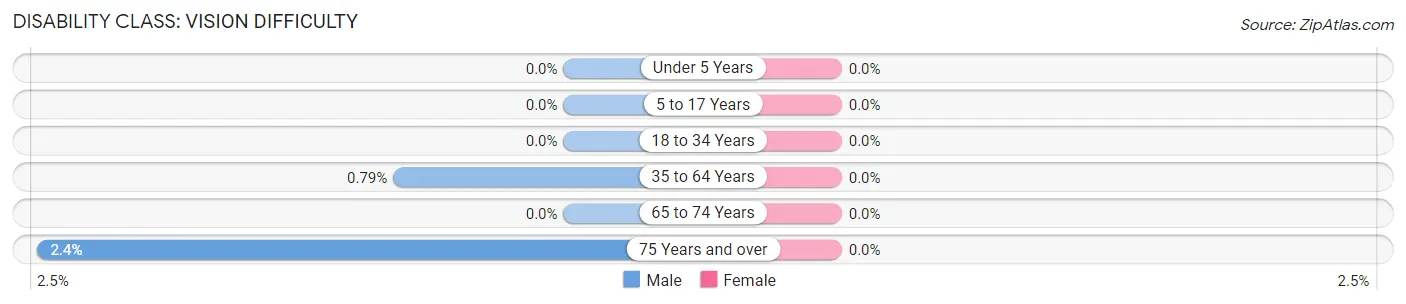
| Age Bracket | Male | Female |
| Under 5 Years | 0 (0.0%) | 0 (0.0%) |
| 5 to 17 Years | 0 (0.0%) | 0 (0.0%) |
| 18 to 34 Years | 0 (0.0%) | 0 (0.0%) |
| 35 to 64 Years | 6 (0.8%) | 0 (0.0%) |
| 65 to 74 Years | 0 (0.0%) | 0 (0.0%) |
| 75 Years and over | 4 (2.4%) | 0 (0.0%) |
Disability Class: Cognitive Difficulty
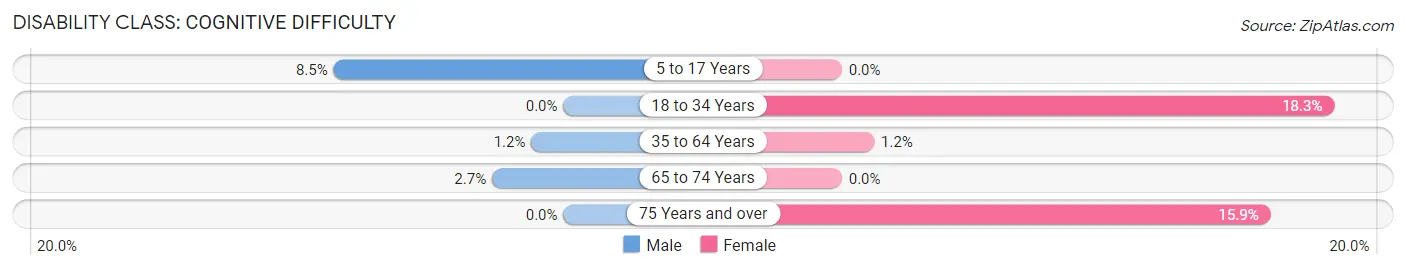
| Age Bracket | Male | Female |
| 5 to 17 Years | 22 (8.5%) | 0 (0.0%) |
| 18 to 34 Years | 0 (0.0%) | 17 (18.3%) |
| 35 to 64 Years | 9 (1.2%) | 9 (1.2%) |
| 65 to 74 Years | 5 (2.6%) | 0 (0.0%) |
| 75 Years and over | 0 (0.0%) | 25 (15.9%) |
Disability Class: Ambulatory Difficulty
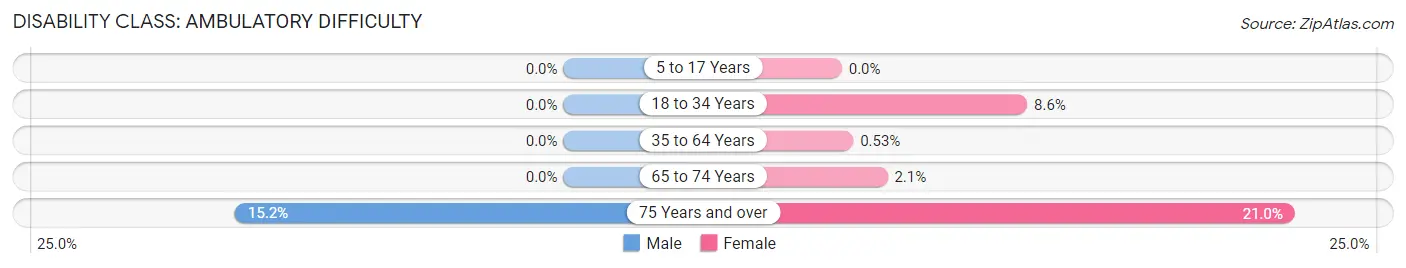
| Age Bracket | Male | Female |
| 5 to 17 Years | 0 (0.0%) | 0 (0.0%) |
| 18 to 34 Years | 0 (0.0%) | 8 (8.6%) |
| 35 to 64 Years | 0 (0.0%) | 4 (0.5%) |
| 65 to 74 Years | 0 (0.0%) | 4 (2.1%) |
| 75 Years and over | 25 (15.2%) | 33 (21.0%) |
Disability Class: Self-Care Difficulty
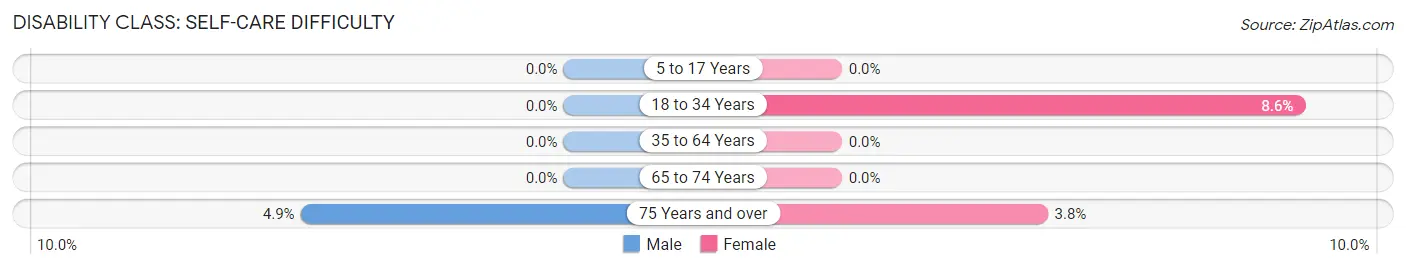
| Age Bracket | Male | Female |
| 5 to 17 Years | 0 (0.0%) | 0 (0.0%) |
| 18 to 34 Years | 0 (0.0%) | 8 (8.6%) |
| 35 to 64 Years | 0 (0.0%) | 0 (0.0%) |
| 65 to 74 Years | 0 (0.0%) | 0 (0.0%) |
| 75 Years and over | 8 (4.9%) | 6 (3.8%) |
Technology Access in Piney Point Village
Computing Device Access in Piney Point Village
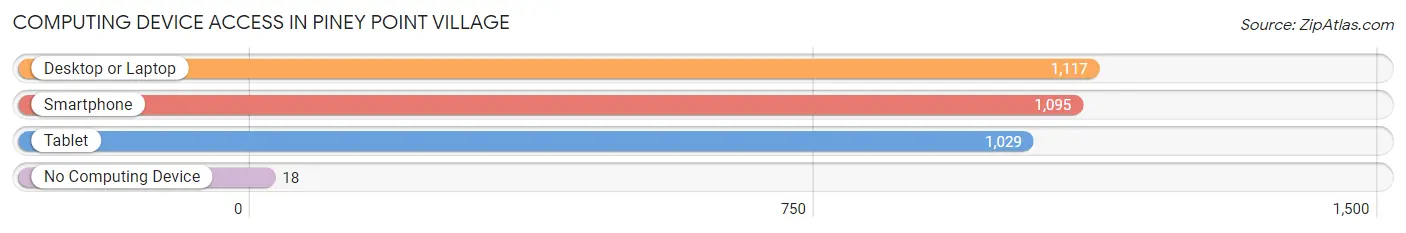
| Device Type | # Households | % Households |
| Desktop or Laptop | 1,117 | 97.5% |
| Smartphone | 1,095 | 95.6% |
| Tablet | 1,029 | 89.8% |
| No Computing Device | 18 | 1.6% |
| Total | 1,146 | 100.0% |
Internet Access in Piney Point Village
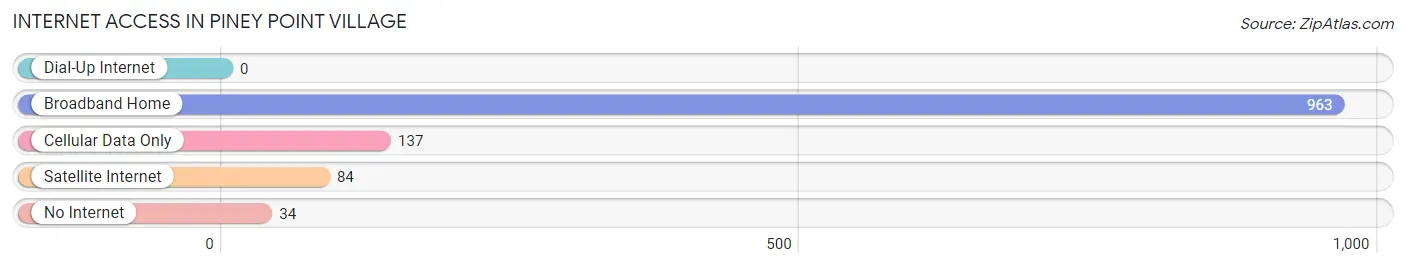
| Internet Type | # Households | % Households |
| Dial-Up Internet | 0 | 0.0% |
| Broadband Home | 963 | 84.0% |
| Cellular Data Only | 137 | 11.9% |
| Satellite Internet | 84 | 7.3% |
| No Internet | 34 | 3.0% |
| Total | 1,146 | 100.0% |
Piney Point Village Summary
Piney Point Village is a small city located in Harris County, Texas, United States. It is an enclave of the City of Houston and is surrounded by the cities of Bunker Hill Village, Hunters Creek Village, and Hedwig Village. The population of Piney Point Village was 3,125 at the 2010 census.
Geography
Piney Point Village is located at 29°45'25" North, 95°30'17" West (29.756944, -95.504722). It is situated in the Memorial Villages, a group of affluent residential communities located in the Memorial area of Houston, Texas. The city is located approximately 20 miles west of downtown Houston and is bordered by the cities of Bunker Hill Village, Hunters Creek Village, and Hedwig Village.
The city has a total area of 0.7 square miles, all of which is land. The terrain is mostly flat, with some rolling hills. The city is located in the Houston-Sugar Land-Baytown metropolitan area.
History
Piney Point Village was founded in 1954 by oilman and real estate developer William G. Farrington. Farrington purchased the land from the estate of William Marsh Rice, who had owned the land since the late 19th century. Farrington developed the land into a residential community and named it after the nearby Piney Point Creek.
The city was incorporated in 1955 and has remained an independent municipality since then. The city has a mayor-council form of government, with a mayor and five council members elected at-large.
Economy
Piney Point Village is a primarily residential community, with no major industries or businesses located within its borders. The city's economy is largely based on the incomes of its residents. The median household income in Piney Point Village was $202,917 in 2019, making it one of the wealthiest cities in the United States.
Demographics
As of the 2010 census, there were 3,125 people, 1,093 households, and 945 families residing in the city. The population density was 4,521.3 people per square mile. The racial makeup of the city was 92.2% White, 2.2% African American, 0.2% Native American, 4.2% Asian, 0.1% Pacific Islander, 0.3% from other races, and 0.9% from two or more races. Hispanic or Latino of any race were 4.2% of the population.
There were 1,093 households, out of which 41.2% had children under the age of 18 living with them, 79.2% were married couples living together, 4.2% had a female householder with no husband present, and 14.2% were non-families. 11.2% of all households were made up of individuals, and 5.2% had someone living alone who was 65 years of age or older. The average household size was 2.86 and the average family size was 3.09.
In the city, the population was spread out, with 28.2% under the age of 18, 4.2% from 18 to 24, 19.2% from 25 to 44, 33.2% from 45 to 64, and 15.2% who were 65 years of age or older. The median age was 44 years. For every 100 females, there were 97.2 males. For every 100 females age 18 and over, there were 94.2 males.
The median income for a household in the city was $202,917, and the median income for a family was $219,917. Males had a median income of $100,000+ versus $50,000+ for females. The per capita income for the city was $90,917. About 2.2% of families and 3.2% of the population were below the poverty line, including 3.2% of those under age 18 and none of those age 65 or over.
Common Questions
What is Per Capita Income in Piney Point Village?
Per Capita income in Piney Point Village is $187,796.
What is the Median Family Income in Piney Point Village?
Median Family Income in Piney Point Village is $250,001.
What is the Median Household income in Piney Point Village?
Median Household Income in Piney Point Village is $250,001.
What is Income or Wage Gap in Piney Point Village?
Income or Wage Gap in Piney Point Village is 43.0%.
Women in Piney Point Village earn 57.0 cents for every dollar earned by a man.
What is Inequality or Gini Index in Piney Point Village?
Inequality or Gini Index in Piney Point Village is 0.46.
What is the Total Population of Piney Point Village?
Total Population of Piney Point Village is 3,114.
What is the Total Male Population of Piney Point Village?
Total Male Population of Piney Point Village is 1,652.
What is the Total Female Population of Piney Point Village?
Total Female Population of Piney Point Village is 1,462.
What is the Ratio of Males per 100 Females in Piney Point Village?
There are 113.00 Males per 100 Females in Piney Point Village.
What is the Ratio of Females per 100 Males in Piney Point Village?
There are 88.50 Females per 100 Males in Piney Point Village.
What is the Median Population Age in Piney Point Village?
Median Population Age in Piney Point Village is 51.8 Years.
What is the Average Family Size in Piney Point Village
Average Family Size in Piney Point Village is 3.0 People.
What is the Average Household Size in Piney Point Village
Average Household Size in Piney Point Village is 2.7 People.
How Large is the Labor Force in Piney Point Village?
There are 1,579 People in the Labor Forcein in Piney Point Village.
What is the Percentage of People in the Labor Force in Piney Point Village?
59.6% of People are in the Labor Force in Piney Point Village.
What is the Unemployment Rate in Piney Point Village?
Unemployment Rate in Piney Point Village is 9.4%.