Melvindale, MI Map & Demographics
Melvindale Map
Melvindale Overview
$20,981
PER CAPITA INCOME
$49,760
AVG FAMILY INCOME
$38,918
AVG HOUSEHOLD INCOME
21.2%
WAGE / INCOME GAP [ % ]
78.8¢/ $1
WAGE / INCOME GAP [ $ ]
0.47
INEQUALITY / GINI INDEX
12,639
TOTAL POPULATION
6,919
MALE POPULATION
5,720
FEMALE POPULATION
120.96
MALES / 100 FEMALES
82.67
FEMALES / 100 MALES
33.6
MEDIAN AGE
4.1
AVG FAMILY SIZE
2.9
AVG HOUSEHOLD SIZE
5,371
LABOR FORCE [ PEOPLE ]
57.3%
PERCENT IN LABOR FORCE
11.2%
UNEMPLOYMENT RATE
Melvindale Zip Codes
Melvindale Area Codes
Income in Melvindale
Income Overview in Melvindale
Per Capita Income in Melvindale is $20,981, while median incomes of families and households are $49,760 and $38,918 respectively.
| Characteristic | Number | Measure |
| Per Capita Income | 12,639 | $20,981 |
| Median Family Income | 2,456 | $49,760 |
| Mean Family Income | 2,456 | $65,776 |
| Median Household Income | 4,407 | $38,918 |
| Mean Household Income | 4,407 | $58,089 |
| Income Deficit | 2,456 | $0 |
| Wage / Income Gap (%) | 12,639 | 21.18% |
| Wage / Income Gap ($) | 12,639 | 78.82¢ per $1 |
| Gini / Inequality Index | 12,639 | 0.47 |
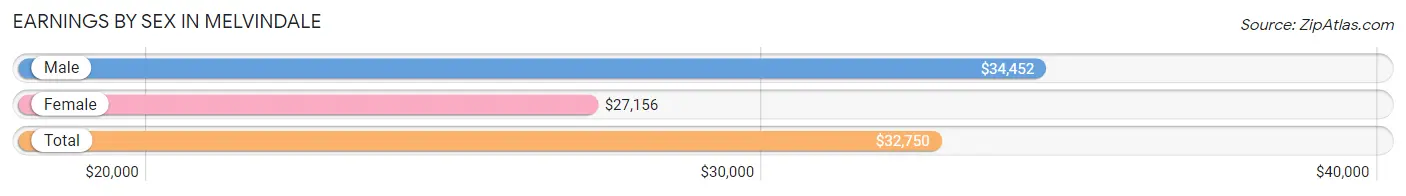
Earnings by Sex in Melvindale
Average Earnings in Melvindale are $32,750, $34,452 for men and $27,156 for women, a difference of 21.2%.
| Sex | Number | Average Earnings |
| Male | 3,173 (59.2%) | $34,452 |
| Female | 2,189 (40.8%) | $27,156 |
| Total | 5,362 (100.0%) | $32,750 |
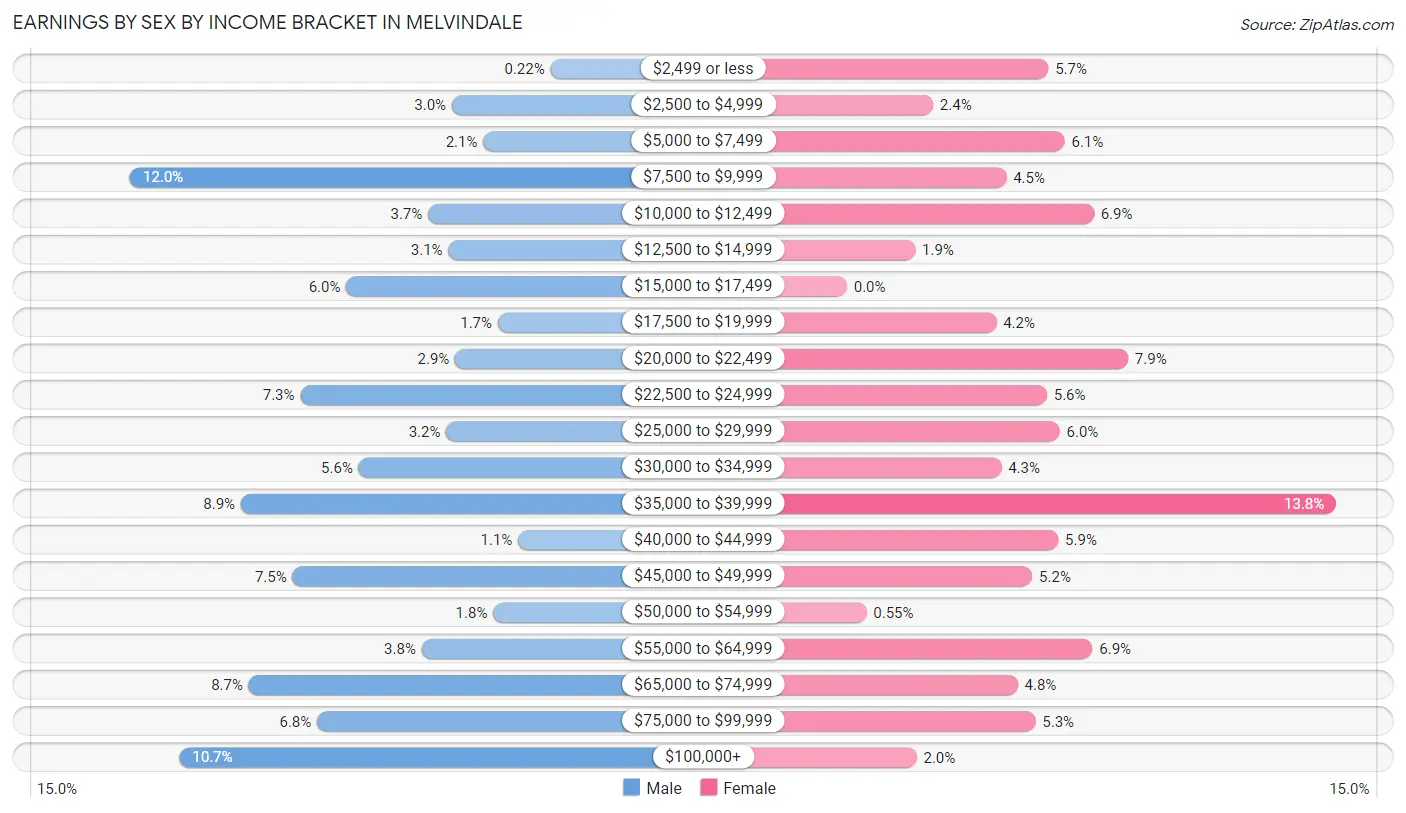
Earnings by Sex by Income Bracket in Melvindale
The most common earnings brackets in Melvindale are $7,500 to $9,999 for men (382 | 12.0%) and $35,000 to $39,999 for women (301 | 13.8%).
| Income | Male | Female |
| $2,499 or less | 7 (0.2%) | 124 (5.7%) |
| $2,500 to $4,999 | 95 (3.0%) | 53 (2.4%) |
| $5,000 to $7,499 | 67 (2.1%) | 134 (6.1%) |
| $7,500 to $9,999 | 382 (12.0%) | 98 (4.5%) |
| $10,000 to $12,499 | 116 (3.7%) | 152 (6.9%) |
| $12,500 to $14,999 | 98 (3.1%) | 42 (1.9%) |
| $15,000 to $17,499 | 189 (6.0%) | 0 (0.0%) |
| $17,500 to $19,999 | 54 (1.7%) | 92 (4.2%) |
| $20,000 to $22,499 | 92 (2.9%) | 173 (7.9%) |
| $22,500 to $24,999 | 230 (7.2%) | 123 (5.6%) |
| $25,000 to $29,999 | 100 (3.2%) | 131 (6.0%) |
| $30,000 to $34,999 | 178 (5.6%) | 95 (4.3%) |
| $35,000 to $39,999 | 283 (8.9%) | 301 (13.8%) |
| $40,000 to $44,999 | 36 (1.1%) | 130 (5.9%) |
| $45,000 to $49,999 | 237 (7.5%) | 114 (5.2%) |
| $50,000 to $54,999 | 58 (1.8%) | 12 (0.5%) |
| $55,000 to $64,999 | 122 (3.8%) | 151 (6.9%) |
| $65,000 to $74,999 | 276 (8.7%) | 105 (4.8%) |
| $75,000 to $99,999 | 215 (6.8%) | 116 (5.3%) |
| $100,000+ | 338 (10.6%) | 43 (2.0%) |
| Total | 3,173 (100.0%) | 2,189 (100.0%) |
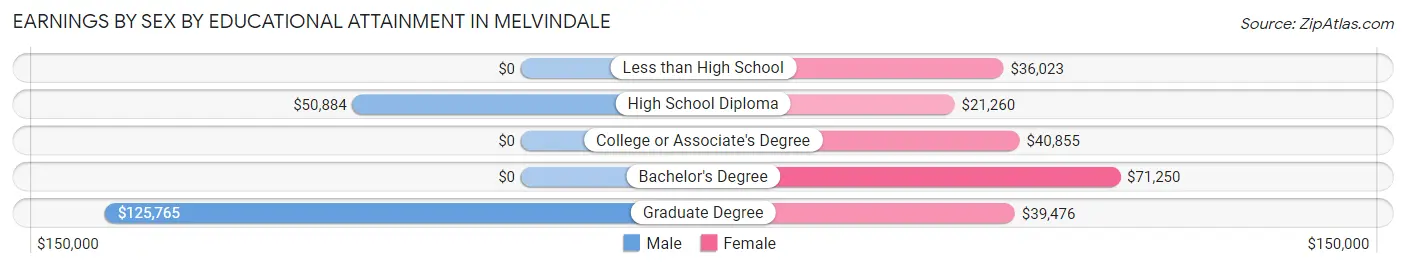
Earnings by Sex by Educational Attainment in Melvindale
Average earnings in Melvindale are $38,244 for men and $35,467 for women, a difference of 7.3%. Men with an educational attainment of graduate degree enjoy the highest average annual earnings of $125,765, while those with high school diploma education earn the least with $50,884. Women with an educational attainment of bachelor's degree earn the most with the average annual earnings of $71,250, while those with high school diploma education have the smallest earnings of $21,260.
| Educational Attainment | Male Income | Female Income |
| Less than High School | - | - |
| High School Diploma | $50,884 | $21,260 |
| College or Associate's Degree | - | - |
| Bachelor's Degree | - | - |
| Graduate Degree | $125,765 | $39,476 |
| Total | $38,244 | $35,467 |
Family Income in Melvindale
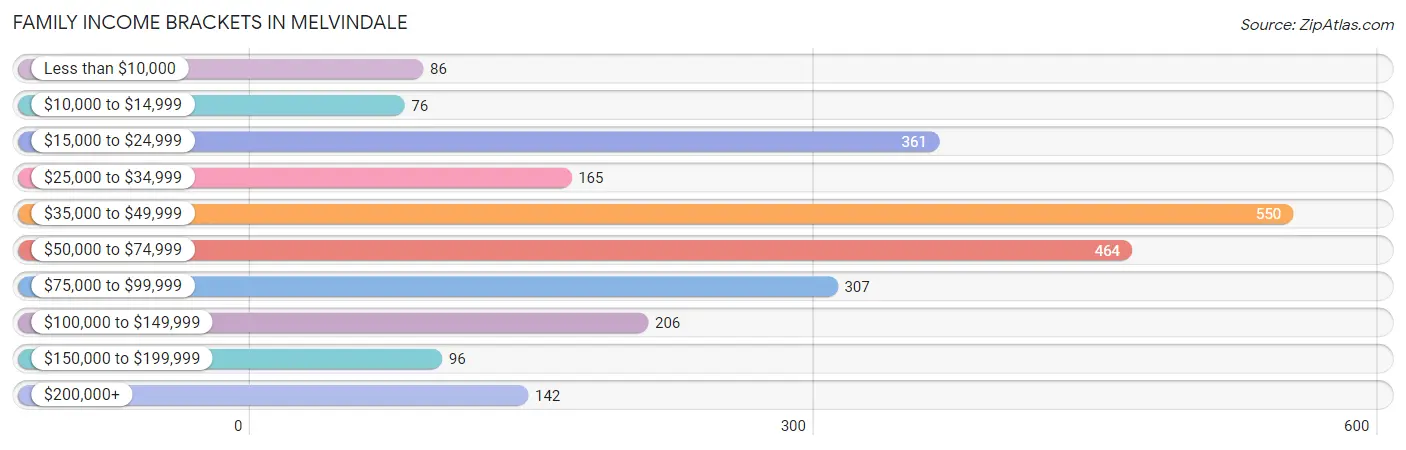
Family Income Brackets in Melvindale
According to the Melvindale family income data, there are 550 families falling into the $35,000 to $49,999 income range, which is the most common income bracket and makes up 22.4% of all families. Conversely, the $10,000 to $14,999 income bracket is the least frequent group with only 76 families (3.1%) belonging to this category.
| Income Bracket | # Families | % Families |
| Less than $10,000 | 86 | 3.5% |
| $10,000 to $14,999 | 76 | 3.1% |
| $15,000 to $24,999 | 361 | 14.7% |
| $25,000 to $34,999 | 165 | 6.7% |
| $35,000 to $49,999 | 550 | 22.4% |
| $50,000 to $74,999 | 464 | 18.9% |
| $75,000 to $99,999 | 307 | 12.5% |
| $100,000 to $149,999 | 206 | 8.4% |
| $150,000 to $199,999 | 96 | 3.9% |
| $200,000+ | 142 | 5.8% |
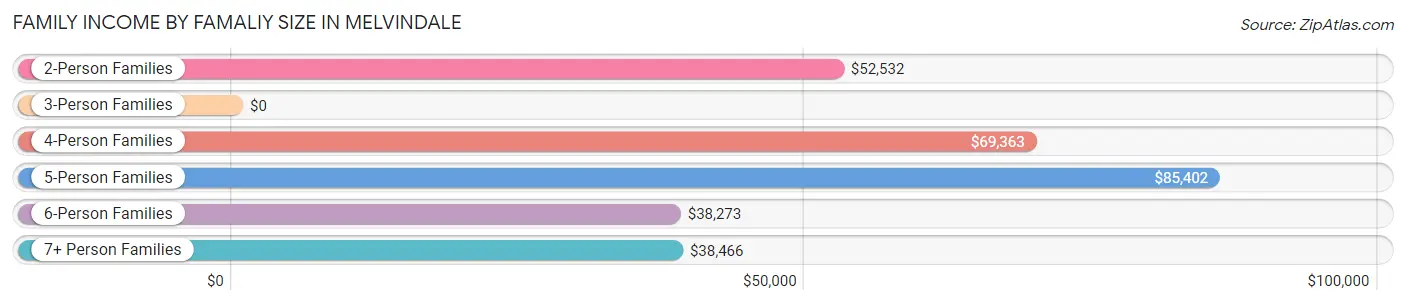
Family Income by Famaliy Size in Melvindale
5-person families (335 | 13.6%) account for the highest median family income in Melvindale with $85,402 per family, while 2-person families (711 | 28.9%) have the highest median income of $26,266 per family member.
| Income Bracket | # Families | Median Income |
| 2-Person Families | 711 (28.9%) | $52,532 |
| 3-Person Families | 595 (24.2%) | $0 |
| 4-Person Families | 445 (18.1%) | $69,363 |
| 5-Person Families | 335 (13.6%) | $85,402 |
| 6-Person Families | 129 (5.2%) | $38,273 |
| 7+ Person Families | 241 (9.8%) | $38,466 |
| Total | 2,456 (100.0%) | $49,760 |
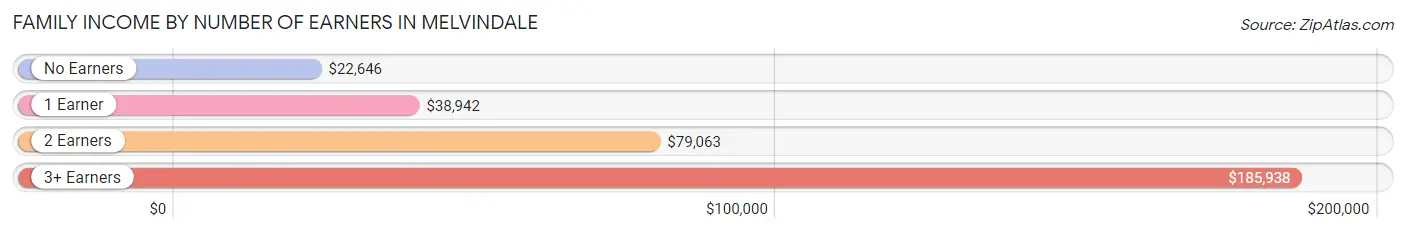
Family Income by Number of Earners in Melvindale
The median family income in Melvindale is $49,760, with families comprising 3+ earners (261) having the highest median family income of $185,938, while families with no earners (454) have the lowest median family income of $22,646, accounting for 10.6% and 18.5% of families, respectively.
| Number of Earners | # Families | Median Income |
| No Earners | 454 (18.5%) | $22,646 |
| 1 Earner | 1,010 (41.1%) | $38,942 |
| 2 Earners | 731 (29.8%) | $79,063 |
| 3+ Earners | 261 (10.6%) | $185,938 |
| Total | 2,456 (100.0%) | $49,760 |
Household Income in Melvindale
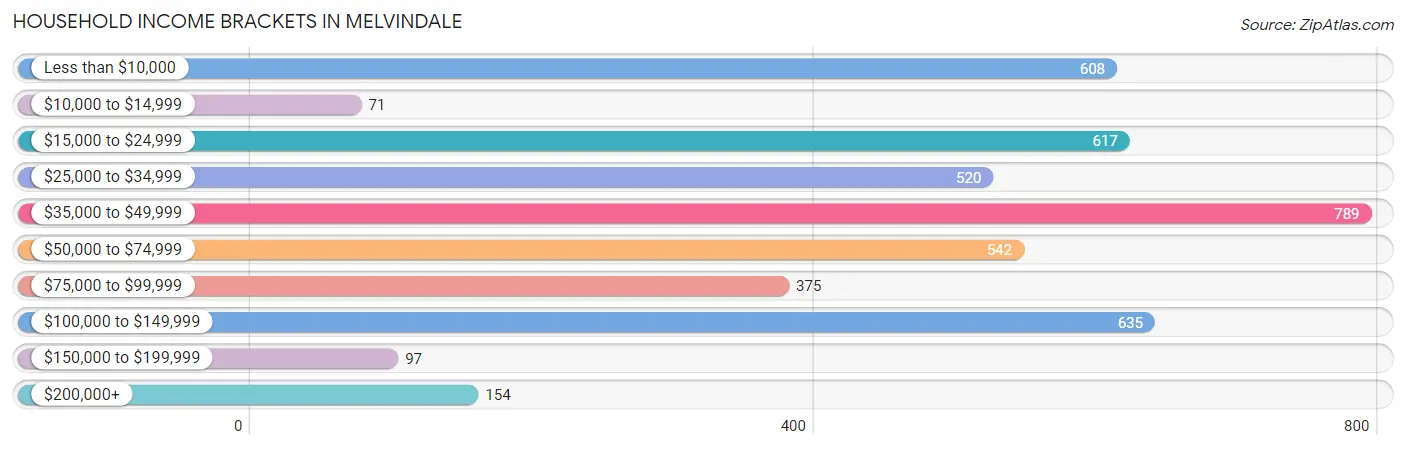
Household Income Brackets in Melvindale
With 789 households falling in the category, the $35,000 to $49,999 income range is the most frequent in Melvindale, accounting for 17.9% of all households. In contrast, only 71 households (1.6%) fall into the $10,000 to $14,999 income bracket, making it the least populous group.
| Income Bracket | # Households | % Households |
| Less than $10,000 | 608 | 13.8% |
| $10,000 to $14,999 | 71 | 1.6% |
| $15,000 to $24,999 | 617 | 14.0% |
| $25,000 to $34,999 | 520 | 11.8% |
| $35,000 to $49,999 | 789 | 17.9% |
| $50,000 to $74,999 | 542 | 12.3% |
| $75,000 to $99,999 | 375 | 8.5% |
| $100,000 to $149,999 | 635 | 14.4% |
| $150,000 to $199,999 | 97 | 2.2% |
| $200,000+ | 154 | 3.5% |
Household Income by Householder Age in Melvindale
The median household income in Melvindale is $38,918, with the highest median household income of $60,813 found in the 45 to 64 years age bracket for the primary householder. A total of 1,829 households (41.5%) fall into this category. Meanwhile, the 15 to 24 years age bracket for the primary householder has the lowest median household income of $2,499, with 157 households (3.6%) in this group.
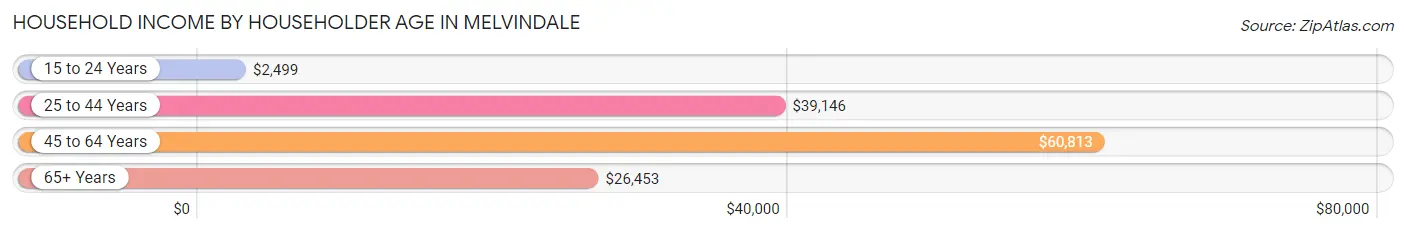
| Income Bracket | # Households | Median Income |
| 15 to 24 Years | 157 (3.6%) | $2,499 |
| 25 to 44 Years | 1,523 (34.6%) | $39,146 |
| 45 to 64 Years | 1,829 (41.5%) | $60,813 |
| 65+ Years | 898 (20.4%) | $26,453 |
| Total | 4,407 (100.0%) | $38,918 |
Poverty in Melvindale
Income Below Poverty by Sex and Age in Melvindale
With 33.3% poverty level for males and 33.0% for females among the residents of Melvindale, 5 year old males and 5 year old females are the most vulnerable to poverty, with 75 males (75.8%) and 102 females (100.0%) in their respective age groups living below the poverty level.
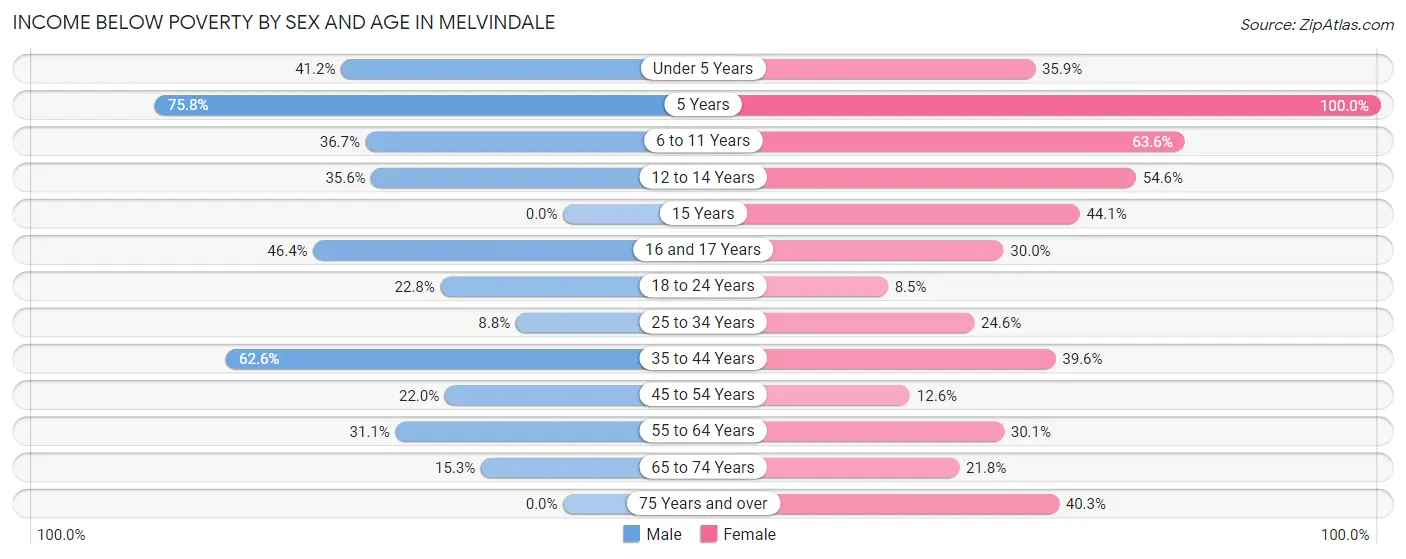
| Age Bracket | Male | Female |
| Under 5 Years | 228 (41.2%) | 199 (35.9%) |
| 5 Years | 75 (75.8%) | 102 (100.0%) |
| 6 to 11 Years | 216 (36.7%) | 353 (63.6%) |
| 12 to 14 Years | 166 (35.6%) | 131 (54.6%) |
| 15 Years | 0 (0.0%) | 15 (44.1%) |
| 16 and 17 Years | 122 (46.4%) | 54 (30.0%) |
| 18 to 24 Years | 189 (22.8%) | 41 (8.5%) |
| 25 to 34 Years | 58 (8.8%) | 204 (24.5%) |
| 35 to 44 Years | 714 (62.6%) | 289 (39.6%) |
| 45 to 54 Years | 141 (22.0%) | 77 (12.6%) |
| 55 to 64 Years | 349 (31.1%) | 184 (30.1%) |
| 65 to 74 Years | 46 (15.3%) | 93 (21.8%) |
| 75 Years and over | 0 (0.0%) | 147 (40.3%) |
| Total | 2,304 (33.3%) | 1,889 (33.0%) |
Income Above Poverty by Sex and Age in Melvindale
According to the poverty statistics in Melvindale, males aged 15 years and females aged 18 to 24 years are the age groups that are most secure financially, with 100.0% of males and 91.5% of females in these age groups living above the poverty line.
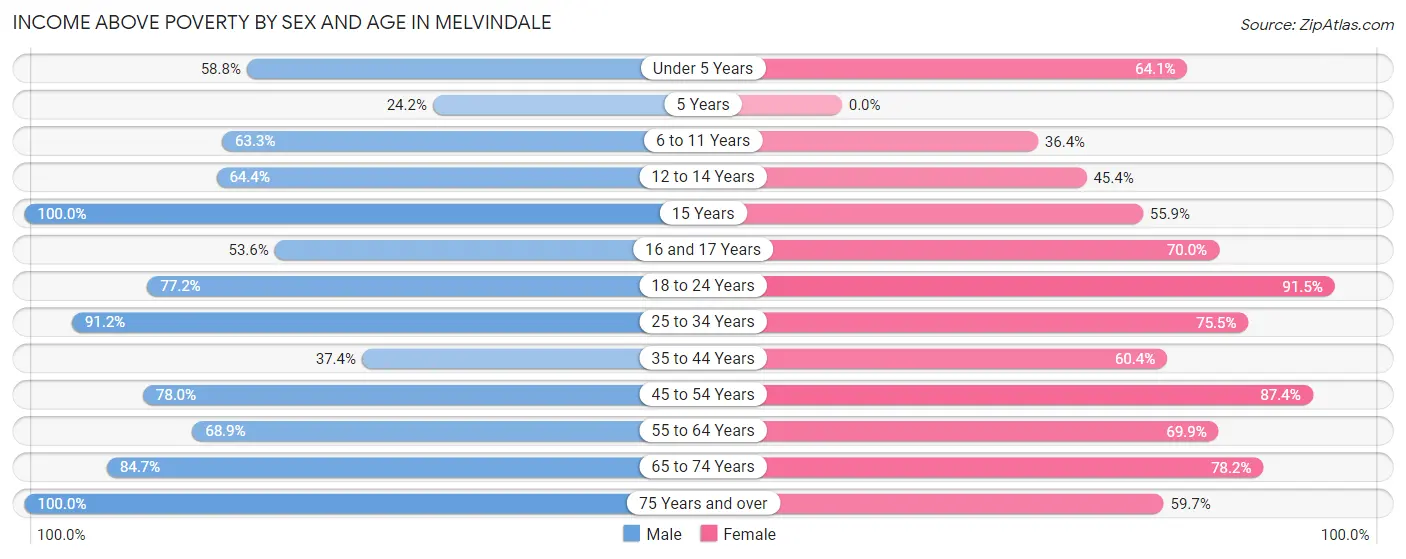
| Age Bracket | Male | Female |
| Under 5 Years | 325 (58.8%) | 356 (64.1%) |
| 5 Years | 24 (24.2%) | 0 (0.0%) |
| 6 to 11 Years | 373 (63.3%) | 202 (36.4%) |
| 12 to 14 Years | 300 (64.4%) | 109 (45.4%) |
| 15 Years | 72 (100.0%) | 19 (55.9%) |
| 16 and 17 Years | 141 (53.6%) | 126 (70.0%) |
| 18 to 24 Years | 640 (77.2%) | 440 (91.5%) |
| 25 to 34 Years | 602 (91.2%) | 627 (75.4%) |
| 35 to 44 Years | 427 (37.4%) | 440 (60.4%) |
| 45 to 54 Years | 501 (78.0%) | 532 (87.4%) |
| 55 to 64 Years | 772 (68.9%) | 428 (69.9%) |
| 65 to 74 Years | 255 (84.7%) | 334 (78.2%) |
| 75 Years and over | 183 (100.0%) | 218 (59.7%) |
| Total | 4,615 (66.7%) | 3,831 (67.0%) |
Income Below Poverty Among Married-Couple Families in Melvindale
The poverty statistics for married-couple families in Melvindale show that 18.1% or 292 of the total 1,614 families live below the poverty line. Families with 3 or 4 children have the highest poverty rate of 58.7%, comprising of 183 families. On the other hand, families with no children have the lowest poverty rate of 0.0%, which includes 0 families.
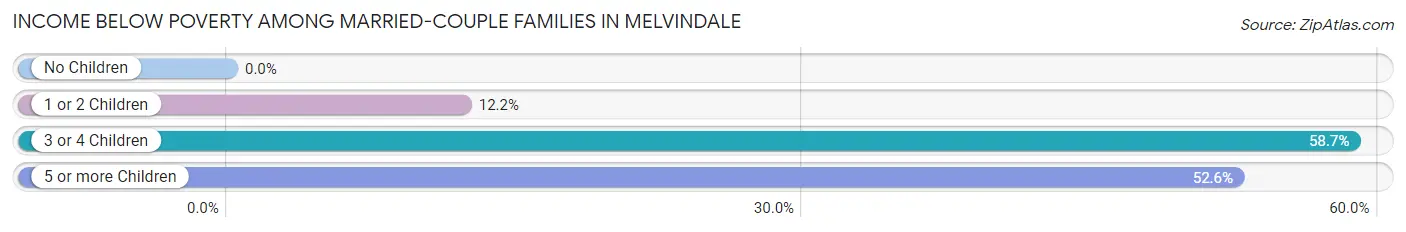
| Children | Above Poverty | Below Poverty |
| No Children | 730 (100.0%) | 0 (0.0%) |
| 1 or 2 Children | 417 (87.8%) | 58 (12.2%) |
| 3 or 4 Children | 129 (41.3%) | 183 (58.7%) |
| 5 or more Children | 46 (47.4%) | 51 (52.6%) |
| Total | 1,322 (81.9%) | 292 (18.1%) |
Income Below Poverty Among Single-Parent Households in Melvindale
According to the poverty data in Melvindale, 31.2% or 35 single-father households and 39.2% or 286 single-mother households are living below the poverty line. Among single-father households, those with no children have the highest poverty rate, with 35 households (31.2%) experiencing poverty. Likewise, among single-mother households, those with 5 or more children have the highest poverty rate, with 44 households (100.0%) falling below the poverty line.
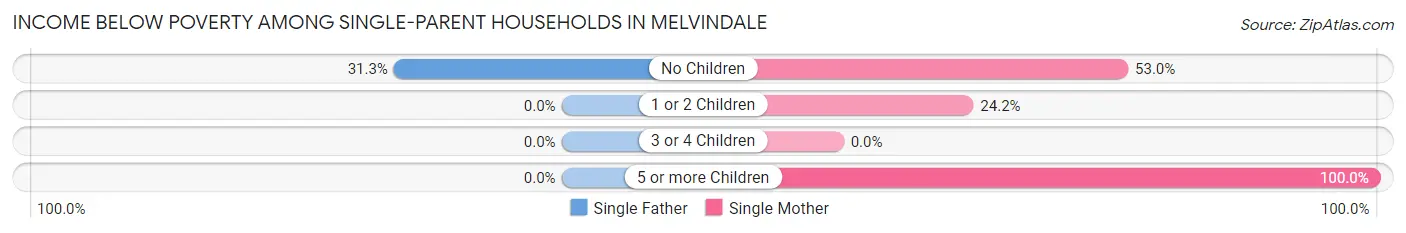
| Children | Single Father | Single Mother |
| No Children | 35 (31.2%) | 169 (53.0%) |
| 1 or 2 Children | 0 (0.0%) | 73 (24.2%) |
| 3 or 4 Children | 0 (0.0%) | 0 (0.0%) |
| 5 or more Children | 0 (0.0%) | 44 (100.0%) |
| Total | 35 (31.2%) | 286 (39.2%) |
Income Below Poverty Among Married-Couple vs Single-Parent Households in Melvindale
The poverty data for Melvindale shows that 292 of the married-couple family households (18.1%) and 321 of the single-parent households (38.1%) are living below the poverty level. Within the married-couple family households, those with 3 or 4 children have the highest poverty rate, with 183 households (58.7%) falling below the poverty line. Among the single-parent households, those with 5 or more children have the highest poverty rate, with 44 household (100.0%) living below poverty.
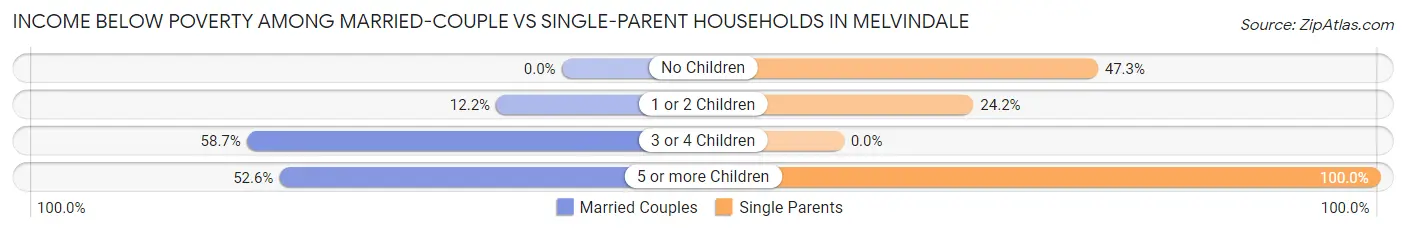
| Children | Married-Couple Families | Single-Parent Households |
| No Children | 0 (0.0%) | 204 (47.3%) |
| 1 or 2 Children | 58 (12.2%) | 73 (24.2%) |
| 3 or 4 Children | 183 (58.7%) | 0 (0.0%) |
| 5 or more Children | 51 (52.6%) | 44 (100.0%) |
| Total | 292 (18.1%) | 321 (38.1%) |
Race in Melvindale
The most populous races in Melvindale are White / Caucasian (9,336 | 73.9%), Hispanic or Latino (2,880 | 22.8%), and Black / African American (1,793 | 14.2%).
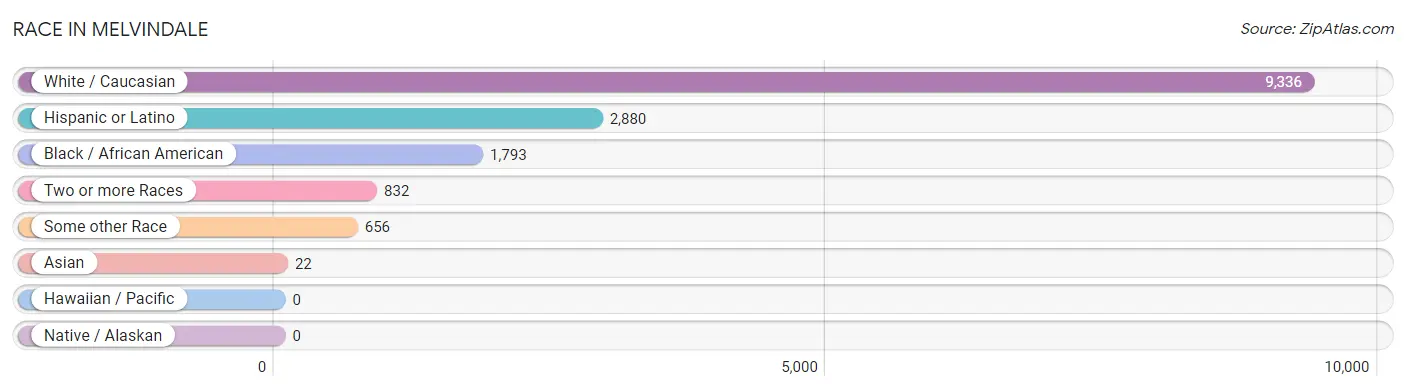
| Race | # Population | % Population |
| Asian | 22 | 0.2% |
| Black / African American | 1,793 | 14.2% |
| Hawaiian / Pacific | 0 | 0.0% |
| Hispanic or Latino | 2,880 | 22.8% |
| Native / Alaskan | 0 | 0.0% |
| White / Caucasian | 9,336 | 73.9% |
| Two or more Races | 832 | 6.6% |
| Some other Race | 656 | 5.2% |
| Total | 12,639 | 100.0% |
Ancestry in Melvindale
The most populous ancestries reported in Melvindale are Arab (2,177 | 17.2%), Mexican (1,827 | 14.5%), Irish (691 | 5.5%), German (544 | 4.3%), and Polish (445 | 3.5%), together accounting for 45.0% of all Melvindale residents.
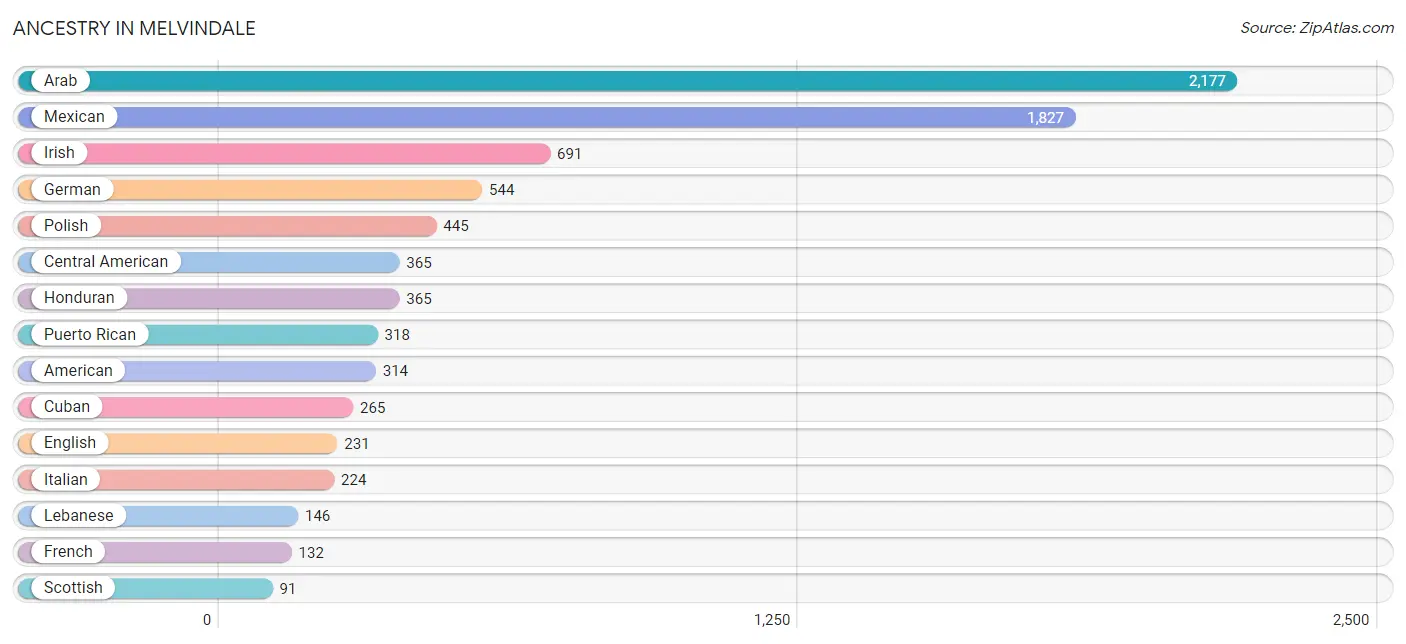
| Ancestry | # Population | % Population |
| African | 5 | 0.0% |
| Alaskan Athabascan | 5 | 0.0% |
| American | 314 | 2.5% |
| Arab | 2,177 | 17.2% |
| Austrian | 44 | 0.4% |
| Canadian | 57 | 0.4% |
| Central American | 365 | 2.9% |
| Cherokee | 1 | 0.0% |
| Chippewa | 62 | 0.5% |
| Cuban | 265 | 2.1% |
| Czech | 11 | 0.1% |
| Dutch | 17 | 0.1% |
| Eastern European | 53 | 0.4% |
| English | 231 | 1.8% |
| Ethiopian | 21 | 0.2% |
| European | 76 | 0.6% |
| Finnish | 7 | 0.1% |
| French | 132 | 1.0% |
| French Canadian | 71 | 0.6% |
| German | 544 | 4.3% |
| Greek | 46 | 0.4% |
| Honduran | 365 | 2.9% |
| Hungarian | 68 | 0.5% |
| Irish | 691 | 5.5% |
| Israeli | 34 | 0.3% |
| Italian | 224 | 1.8% |
| Jordanian | 30 | 0.2% |
| Korean | 22 | 0.2% |
| Lebanese | 146 | 1.2% |
| Lithuanian | 53 | 0.4% |
| Macedonian | 46 | 0.4% |
| Maltese | 13 | 0.1% |
| Mexican | 1,827 | 14.5% |
| Polish | 445 | 3.5% |
| Puerto Rican | 318 | 2.5% |
| Russian | 17 | 0.1% |
| Scandinavian | 20 | 0.2% |
| Scotch-Irish | 34 | 0.3% |
| Scottish | 91 | 0.7% |
| Slovak | 28 | 0.2% |
| South American | 72 | 0.6% |
| Subsaharan African | 26 | 0.2% |
| Swedish | 41 | 0.3% |
| Ukrainian | 26 | 0.2% |
| Venezuelan | 72 | 0.6% | View All 45 Rows |
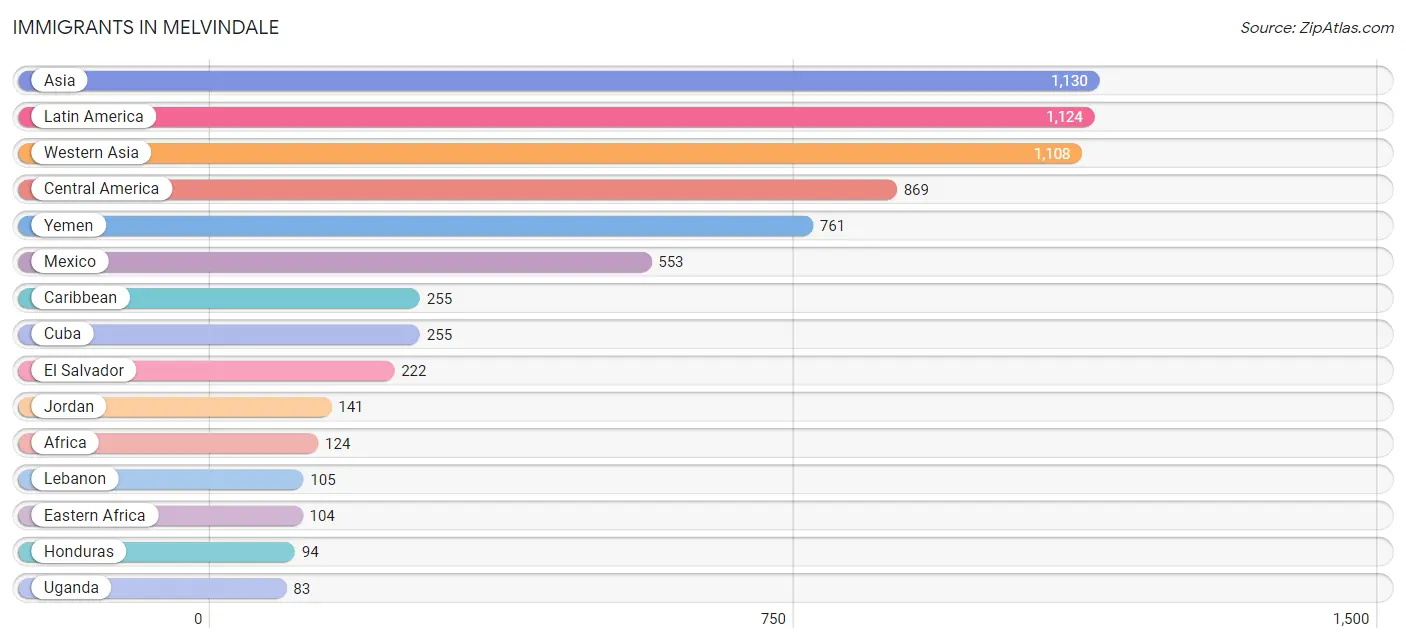
Immigrants in Melvindale
The most numerous immigrant groups reported in Melvindale came from Asia (1,130 | 8.9%), Latin America (1,124 | 8.9%), Western Asia (1,108 | 8.8%), Central America (869 | 6.9%), and Yemen (761 | 6.0%), together accounting for 39.5% of all Melvindale residents.
| Immigration Origin | # Population | % Population |
| Africa | 124 | 1.0% |
| Asia | 1,130 | 8.9% |
| Canada | 8 | 0.1% |
| Caribbean | 255 | 2.0% |
| Central America | 869 | 6.9% |
| Cuba | 255 | 2.0% |
| Eastern Africa | 104 | 0.8% |
| El Salvador | 222 | 1.8% |
| England | 7 | 0.1% |
| Ethiopia | 21 | 0.2% |
| Europe | 30 | 0.2% |
| Honduras | 94 | 0.7% |
| Italy | 16 | 0.1% |
| Jordan | 141 | 1.1% |
| Latin America | 1,124 | 8.9% |
| Lebanon | 105 | 0.8% |
| Mexico | 553 | 4.4% |
| Morocco | 20 | 0.2% |
| Northern Africa | 20 | 0.2% |
| Northern Europe | 7 | 0.1% |
| Philippines | 22 | 0.2% |
| South Eastern Asia | 22 | 0.2% |
| Southern Europe | 23 | 0.2% |
| Uganda | 83 | 0.7% |
| Western Asia | 1,108 | 8.8% |
| Yemen | 761 | 6.0% | View All 26 Rows |
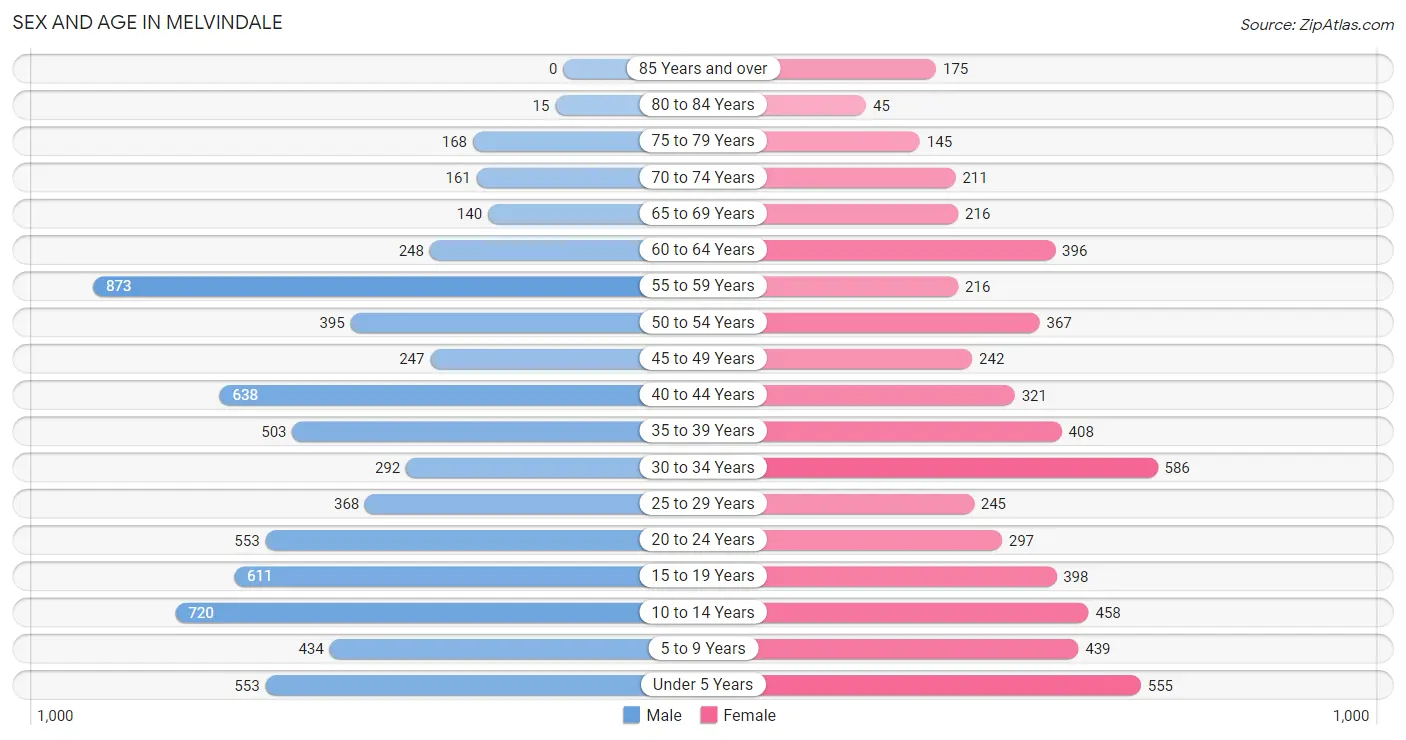
Sex and Age in Melvindale
Sex and Age in Melvindale
The most populous age groups in Melvindale are 55 to 59 Years (873 | 12.6%) for men and 30 to 34 Years (586 | 10.2%) for women.
| Age Bracket | Male | Female |
| Under 5 Years | 553 (8.0%) | 555 (9.7%) |
| 5 to 9 Years | 434 (6.3%) | 439 (7.7%) |
| 10 to 14 Years | 720 (10.4%) | 458 (8.0%) |
| 15 to 19 Years | 611 (8.8%) | 398 (7.0%) |
| 20 to 24 Years | 553 (8.0%) | 297 (5.2%) |
| 25 to 29 Years | 368 (5.3%) | 245 (4.3%) |
| 30 to 34 Years | 292 (4.2%) | 586 (10.2%) |
| 35 to 39 Years | 503 (7.3%) | 408 (7.1%) |
| 40 to 44 Years | 638 (9.2%) | 321 (5.6%) |
| 45 to 49 Years | 247 (3.6%) | 242 (4.2%) |
| 50 to 54 Years | 395 (5.7%) | 367 (6.4%) |
| 55 to 59 Years | 873 (12.6%) | 216 (3.8%) |
| 60 to 64 Years | 248 (3.6%) | 396 (6.9%) |
| 65 to 69 Years | 140 (2.0%) | 216 (3.8%) |
| 70 to 74 Years | 161 (2.3%) | 211 (3.7%) |
| 75 to 79 Years | 168 (2.4%) | 145 (2.5%) |
| 80 to 84 Years | 15 (0.2%) | 45 (0.8%) |
| 85 Years and over | 0 (0.0%) | 175 (3.1%) |
| Total | 6,919 (100.0%) | 5,720 (100.0%) |
Families and Households in Melvindale
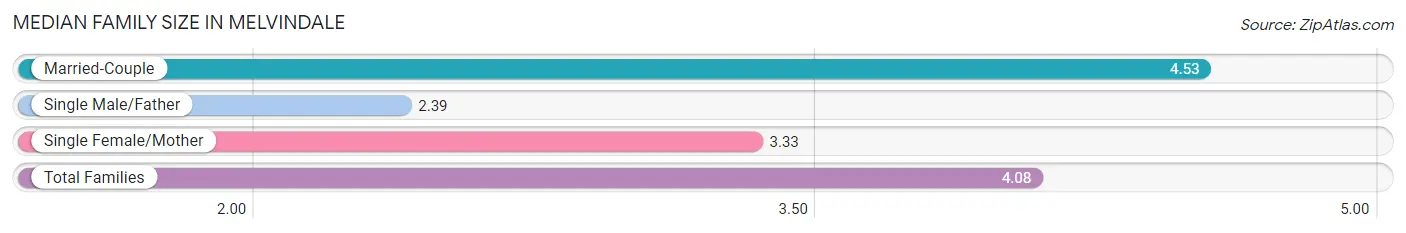
Median Family Size in Melvindale
The median family size in Melvindale is 4.08 persons per family, with married-couple families (1,614 | 65.7%) accounting for the largest median family size of 4.53 persons per family. On the other hand, single male/father families (112 | 4.6%) represent the smallest median family size with 2.39 persons per family.
| Family Type | # Families | Family Size |
| Married-Couple | 1,614 (65.7%) | 4.53 |
| Single Male/Father | 112 (4.6%) | 2.39 |
| Single Female/Mother | 730 (29.7%) | 3.33 |
| Total Families | 2,456 (100.0%) | 4.08 |
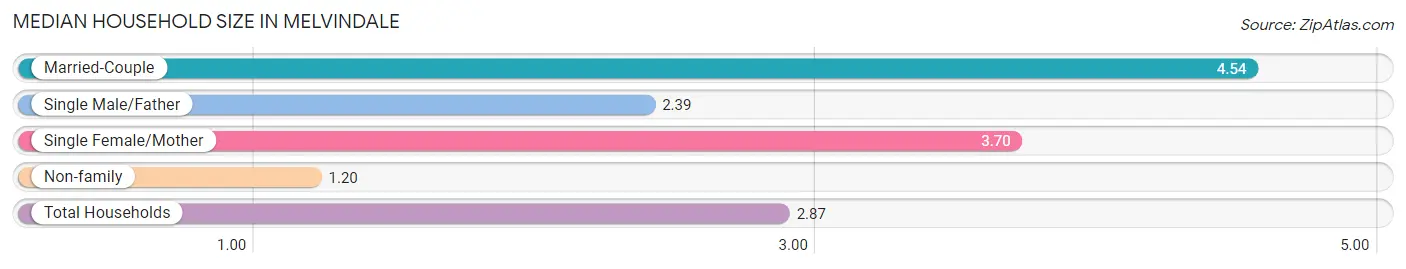
Median Household Size in Melvindale
The median household size in Melvindale is 2.87 persons per household, with married-couple households (1,614 | 36.6%) accounting for the largest median household size of 4.54 persons per household. non-family households (1,951 | 44.3%) represent the smallest median household size with 1.20 persons per household.
| Household Type | # Households | Household Size |
| Married-Couple | 1,614 (36.6%) | 4.54 |
| Single Male/Father | 112 (2.5%) | 2.39 |
| Single Female/Mother | 730 (16.6%) | 3.70 |
| Non-family | 1,951 (44.3%) | 1.20 |
| Total Households | 4,407 (100.0%) | 2.87 |
Household Size by Marriage Status in Melvindale
Out of a total of 4,407 households in Melvindale, 2,456 (55.7%) are family households, while 1,951 (44.3%) are nonfamily households. The most numerous type of family households are 2-person households, comprising 711, and the most common type of nonfamily households are 1-person households, comprising 1,584.
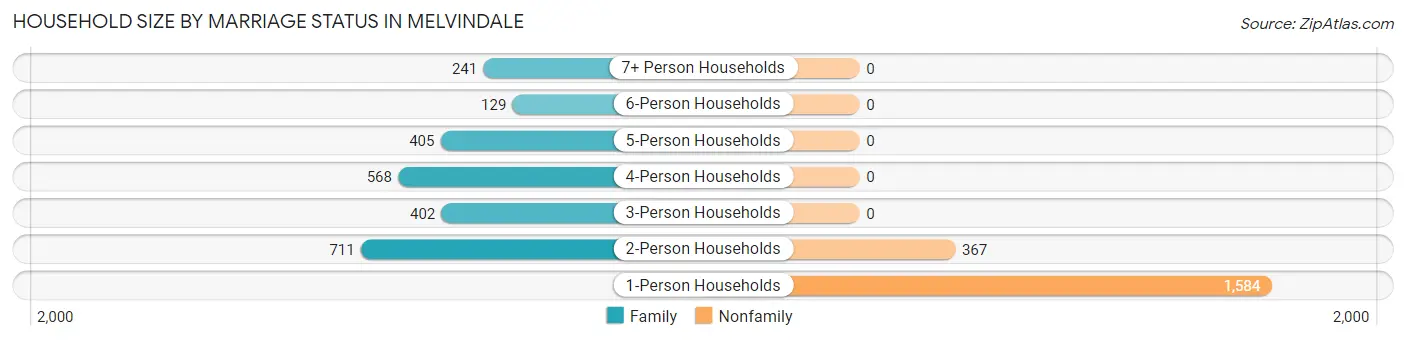
| Household Size | Family Households | Nonfamily Households |
| 1-Person Households | - | 1,584 (35.9%) |
| 2-Person Households | 711 (16.1%) | 367 (8.3%) |
| 3-Person Households | 402 (9.1%) | 0 (0.0%) |
| 4-Person Households | 568 (12.9%) | 0 (0.0%) |
| 5-Person Households | 405 (9.2%) | 0 (0.0%) |
| 6-Person Households | 129 (2.9%) | 0 (0.0%) |
| 7+ Person Households | 241 (5.5%) | 0 (0.0%) |
| Total | 2,456 (55.7%) | 1,951 (44.3%) |
Female Fertility in Melvindale
Fertility by Age in Melvindale
Average fertility rate in Melvindale is 192.0 births per 1,000 women. Women in the age bracket of 20 to 34 years have the highest fertility rate with 340.0 births per 1,000 women. Women in the age bracket of 20 to 34 years acount for 76.9% of all women with births.
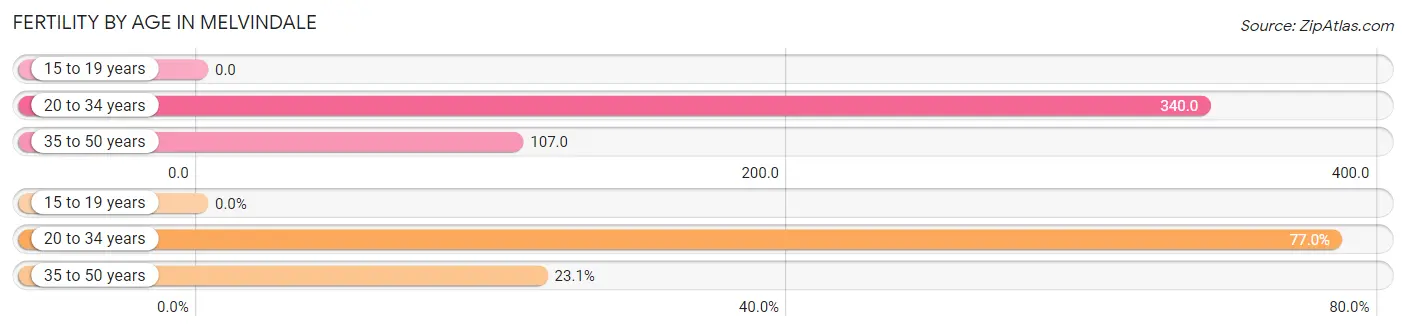
| Age Bracket | Women with Births | Births / 1,000 Women |
| 15 to 19 years | 0 (0.0%) | 0.0 |
| 20 to 34 years | 384 (76.9%) | 340.0 |
| 35 to 50 years | 115 (23.1%) | 107.0 |
| Total | 499 (100.0%) | 192.0 |
Fertility by Age by Marriage Status in Melvindale
63.9% of women with births (499) in Melvindale are married. The highest percentage of unmarried women with births falls into 20 to 34 years age bracket with 46.9% of them unmarried at the time of birth, while the lowest percentage of unmarried women with births belong to 35 to 50 years age bracket with 0.0% of them unmarried.
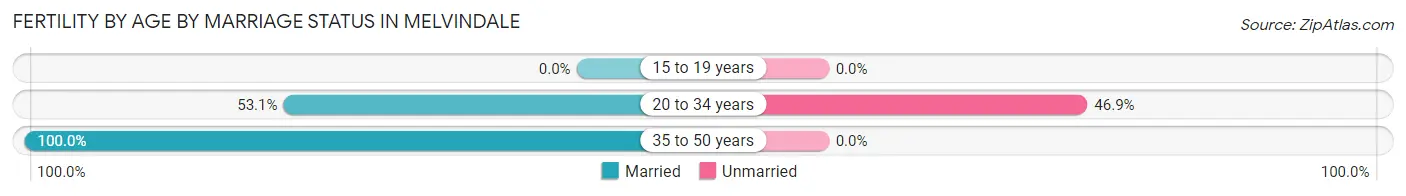
| Age Bracket | Married | Unmarried |
| 15 to 19 years | 0 (0.0%) | 0 (0.0%) |
| 20 to 34 years | 204 (53.1%) | 180 (46.9%) |
| 35 to 50 years | 115 (100.0%) | 0 (0.0%) |
| Total | 319 (63.9%) | 180 (36.1%) |
Fertility by Education in Melvindale
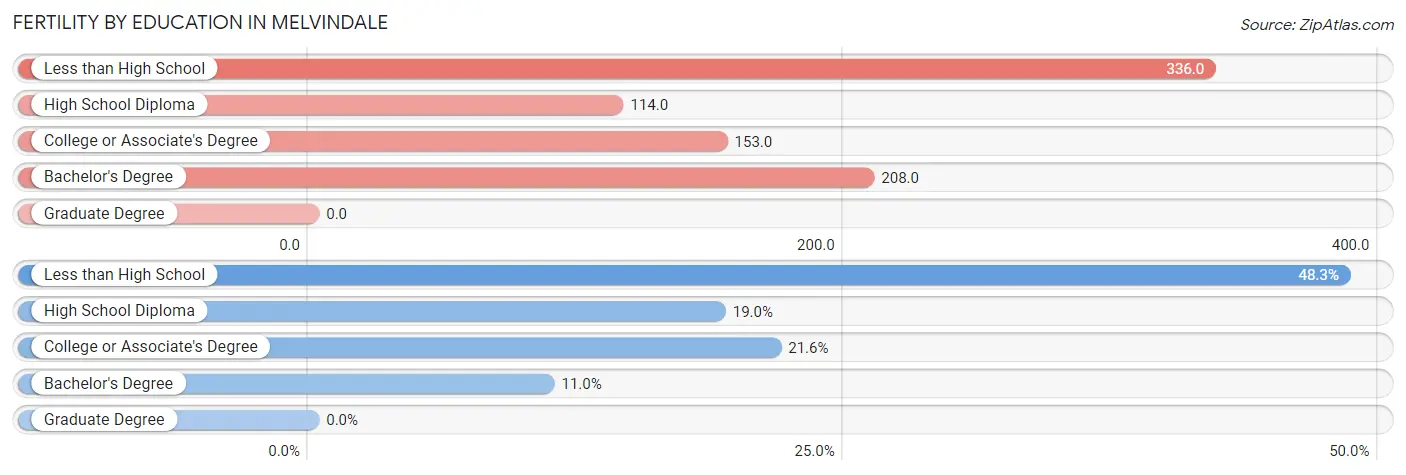
| Educational Attainment | Women with Births | Births / 1,000 Women |
| Less than High School | 241 (48.3%) | 336.0 |
| High School Diploma | 95 (19.0%) | 114.0 |
| College or Associate's Degree | 108 (21.6%) | 153.0 |
| Bachelor's Degree | 55 (11.0%) | 208.0 |
| Graduate Degree | 0 (0.0%) | 0.0 |
| Total | 499 (100.0%) | 192.0 |
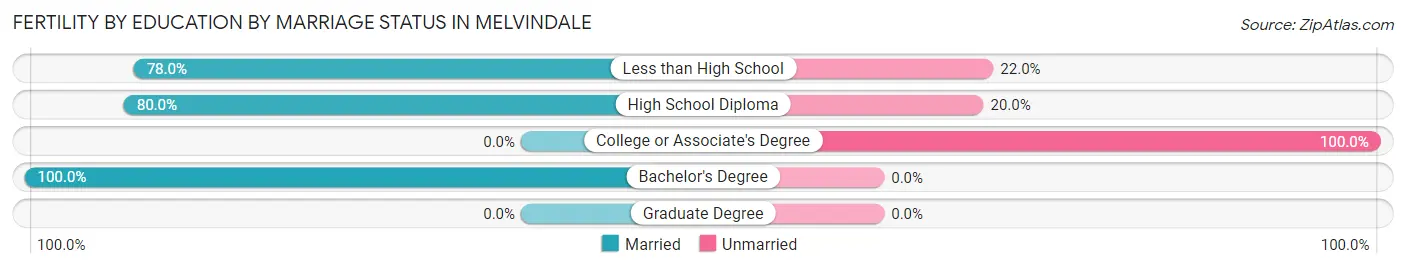
Fertility by Education by Marriage Status in Melvindale
36.1% of women with births in Melvindale are unmarried. Women with the educational attainment of bachelor's degree are most likely to be married with 100.0% of them married at childbirth, while women with the educational attainment of college or associate's degree are least likely to be married with 100.0% of them unmarried at childbirth.
| Educational Attainment | Married | Unmarried |
| Less than High School | 188 (78.0%) | 53 (22.0%) |
| High School Diploma | 76 (80.0%) | 19 (20.0%) |
| College or Associate's Degree | 0 (0.0%) | 108 (100.0%) |
| Bachelor's Degree | 55 (100.0%) | 0 (0.0%) |
| Graduate Degree | 0 (0.0%) | 0 (0.0%) |
| Total | 319 (63.9%) | 180 (36.1%) |
Employment Characteristics in Melvindale
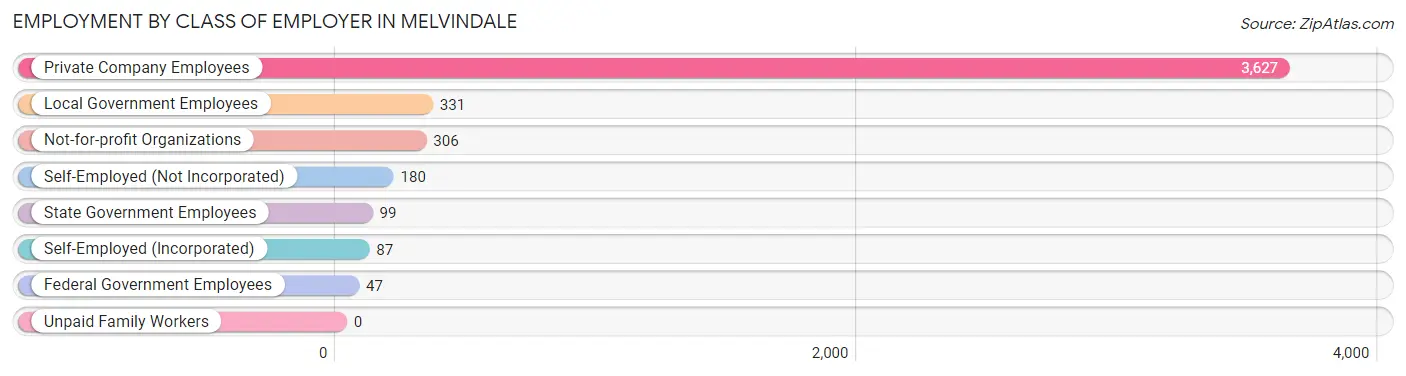
Employment by Class of Employer in Melvindale
Among the 4,677 employed individuals in Melvindale, private company employees (3,627 | 77.5%), local government employees (331 | 7.1%), and not-for-profit organizations (306 | 6.5%) make up the most common classes of employment.
| Employer Class | # Employees | % Employees |
| Private Company Employees | 3,627 | 77.5% |
| Self-Employed (Incorporated) | 87 | 1.9% |
| Self-Employed (Not Incorporated) | 180 | 3.8% |
| Not-for-profit Organizations | 306 | 6.5% |
| Local Government Employees | 331 | 7.1% |
| State Government Employees | 99 | 2.1% |
| Federal Government Employees | 47 | 1.0% |
| Unpaid Family Workers | 0 | 0.0% |
| Total | 4,677 | 100.0% |
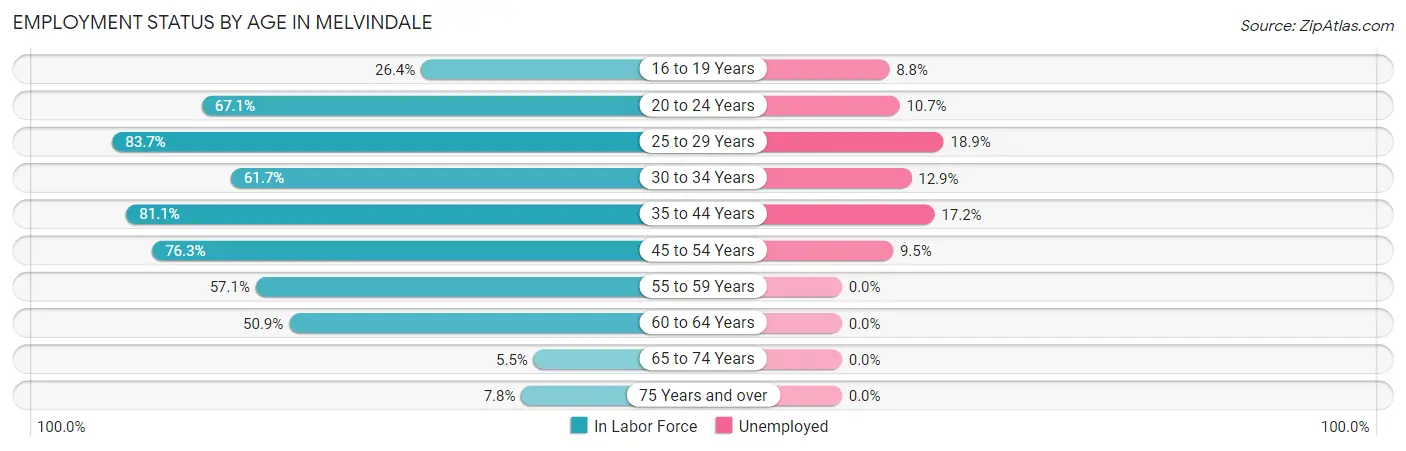
Employment Status by Age in Melvindale
According to the labor force statistics for Melvindale, out of the total population over 16 years of age (9,374), 57.3% or 5,371 individuals are in the labor force, with 11.2% or 602 of them unemployed. The age group with the highest labor force participation rate is 25 to 29 years, with 83.7% or 513 individuals in the labor force. Within the labor force, the 25 to 29 years age range has the highest percentage of unemployed individuals, with 18.9% or 97 of them being unemployed.
| Age Bracket | In Labor Force | Unemployed |
| 16 to 19 Years | 238 (26.4%) | 21 (8.8%) |
| 20 to 24 Years | 570 (67.1%) | 61 (10.7%) |
| 25 to 29 Years | 513 (83.7%) | 97 (18.9%) |
| 30 to 34 Years | 542 (61.7%) | 70 (12.9%) |
| 35 to 44 Years | 1,517 (81.1%) | 261 (17.2%) |
| 45 to 54 Years | 955 (76.3%) | 91 (9.5%) |
| 55 to 59 Years | 622 (57.1%) | 0 (0.0%) |
| 60 to 64 Years | 328 (50.9%) | 0 (0.0%) |
| 65 to 74 Years | 40 (5.5%) | 0 (0.0%) |
| 75 Years and over | 43 (7.8%) | 0 (0.0%) |
| Total | 5,371 (57.3%) | 602 (11.2%) |
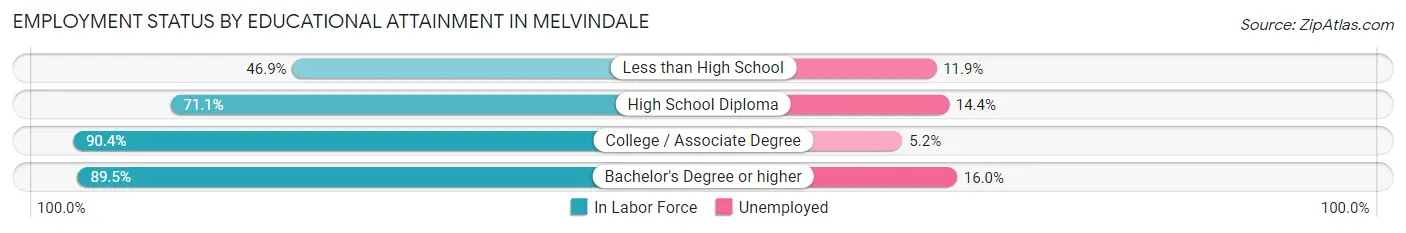
Employment Status by Educational Attainment in Melvindale
According to labor force statistics for Melvindale, 70.5% of individuals (4,473) out of the total population between 25 and 64 years of age (6,345) are in the labor force, with 11.6% or 519 of them being unemployed. The group with the highest labor force participation rate are those with the educational attainment of college / associate degree, with 90.4% or 1,258 individuals in the labor force. Within the labor force, individuals with bachelor's degree or higher education have the highest percentage of unemployment, with 16.0% or 137 of them being unemployed.
| Educational Attainment | In Labor Force | Unemployed |
| Less than High School | 931 (46.9%) | 236 (11.9%) |
| High School Diploma | 1,431 (71.1%) | 290 (14.4%) |
| College / Associate Degree | 1,258 (90.4%) | 72 (5.2%) |
| Bachelor's Degree or higher | 856 (89.5%) | 153 (16.0%) |
| Total | 4,473 (70.5%) | 736 (11.6%) |
Employment Occupations by Sex in Melvindale
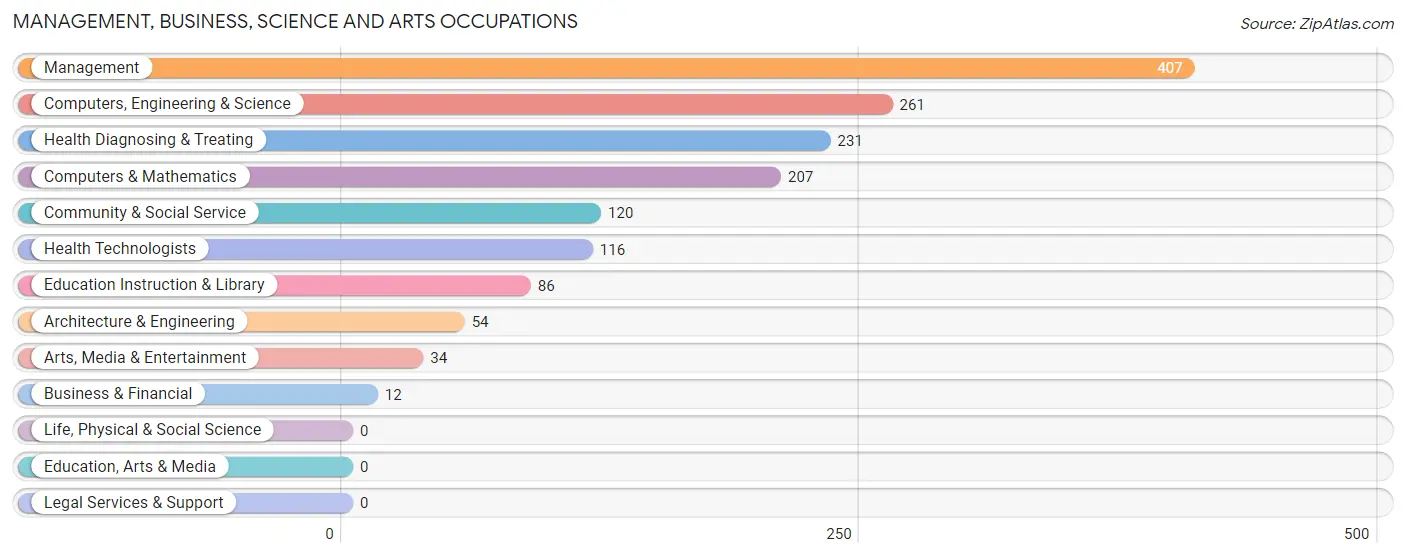
Management, Business, Science and Arts Occupations
The most common Management, Business, Science and Arts occupations in Melvindale are Management (407 | 8.5%), Computers, Engineering & Science (261 | 5.5%), Health Diagnosing & Treating (231 | 4.9%), Computers & Mathematics (207 | 4.3%), and Community & Social Service (120 | 2.5%).
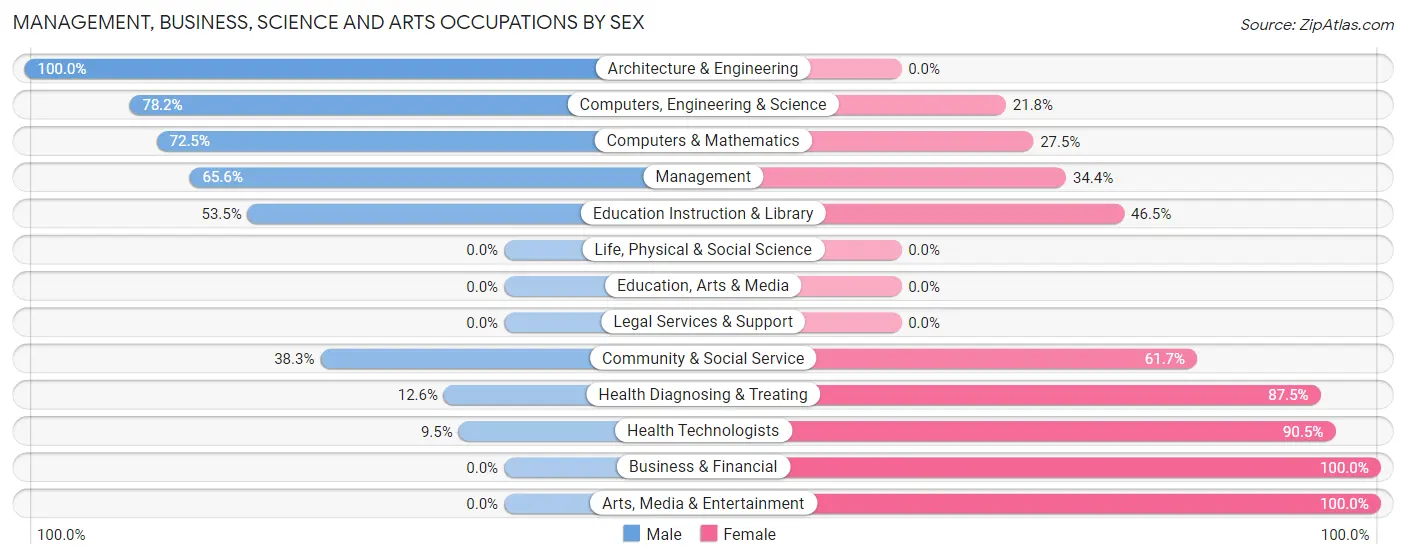
Management, Business, Science and Arts Occupations by Sex
Within the Management, Business, Science and Arts occupations in Melvindale, the most male-oriented occupations are Architecture & Engineering (100.0%), Computers, Engineering & Science (78.2%), and Computers & Mathematics (72.5%), while the most female-oriented occupations are Business & Financial (100.0%), Arts, Media & Entertainment (100.0%), and Health Technologists (90.5%).
| Occupation | Male | Female |
| Management | 267 (65.6%) | 140 (34.4%) |
| Business & Financial | 0 (0.0%) | 12 (100.0%) |
| Computers, Engineering & Science | 204 (78.2%) | 57 (21.8%) |
| Computers & Mathematics | 150 (72.5%) | 57 (27.5%) |
| Architecture & Engineering | 54 (100.0%) | 0 (0.0%) |
| Life, Physical & Social Science | 0 (0.0%) | 0 (0.0%) |
| Community & Social Service | 46 (38.3%) | 74 (61.7%) |
| Education, Arts & Media | 0 (0.0%) | 0 (0.0%) |
| Legal Services & Support | 0 (0.0%) | 0 (0.0%) |
| Education Instruction & Library | 46 (53.5%) | 40 (46.5%) |
| Arts, Media & Entertainment | 0 (0.0%) | 34 (100.0%) |
| Health Diagnosing & Treating | 29 (12.6%) | 202 (87.5%) |
| Health Technologists | 11 (9.5%) | 105 (90.5%) |
| Total (Category) | 546 (53.0%) | 485 (47.0%) |
| Total (Overall) | 2,760 (57.9%) | 2,006 (42.1%) |
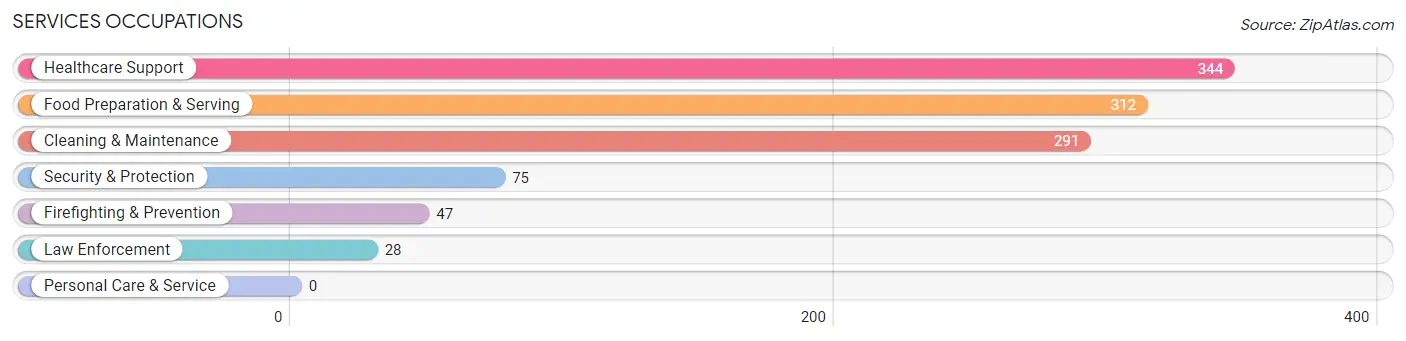
Services Occupations
The most common Services occupations in Melvindale are Healthcare Support (344 | 7.2%), Food Preparation & Serving (312 | 6.6%), Cleaning & Maintenance (291 | 6.1%), Security & Protection (75 | 1.6%), and Firefighting & Prevention (47 | 1.0%).
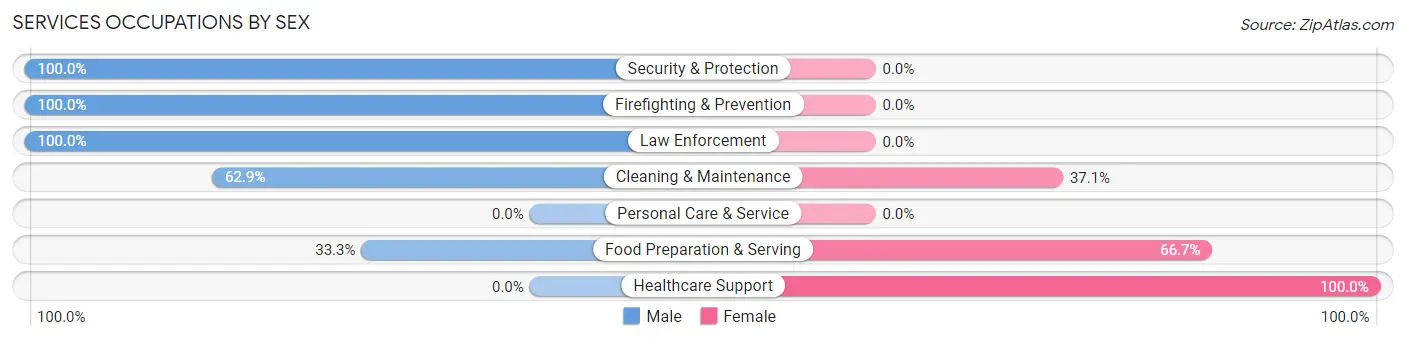
Services Occupations by Sex
Within the Services occupations in Melvindale, the most male-oriented occupations are Security & Protection (100.0%), Firefighting & Prevention (100.0%), and Law Enforcement (100.0%), while the most female-oriented occupations are Healthcare Support (100.0%), Food Preparation & Serving (66.7%), and Cleaning & Maintenance (37.1%).
| Occupation | Male | Female |
| Healthcare Support | 0 (0.0%) | 344 (100.0%) |
| Security & Protection | 75 (100.0%) | 0 (0.0%) |
| Firefighting & Prevention | 47 (100.0%) | 0 (0.0%) |
| Law Enforcement | 28 (100.0%) | 0 (0.0%) |
| Food Preparation & Serving | 104 (33.3%) | 208 (66.7%) |
| Cleaning & Maintenance | 183 (62.9%) | 108 (37.1%) |
| Personal Care & Service | 0 (0.0%) | 0 (0.0%) |
| Total (Category) | 362 (35.4%) | 660 (64.6%) |
| Total (Overall) | 2,760 (57.9%) | 2,006 (42.1%) |
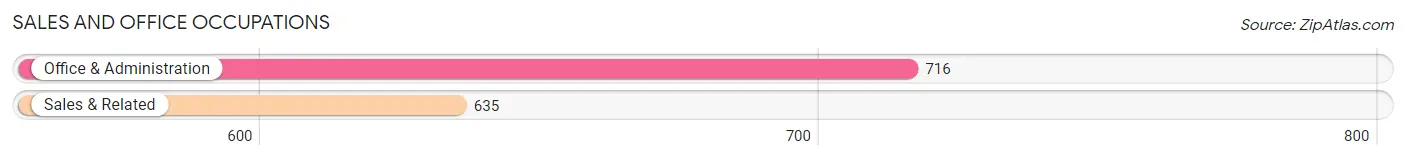
Sales and Office Occupations
The most common Sales and Office occupations in Melvindale are Office & Administration (716 | 15.0%), and Sales & Related (635 | 13.3%).
Sales and Office Occupations by Sex
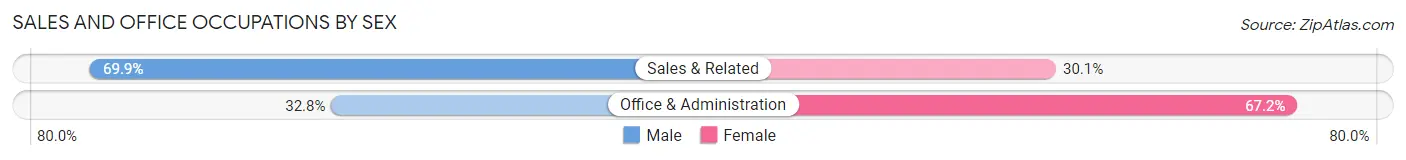
| Occupation | Male | Female |
| Sales & Related | 444 (69.9%) | 191 (30.1%) |
| Office & Administration | 235 (32.8%) | 481 (67.2%) |
| Total (Category) | 679 (50.3%) | 672 (49.7%) |
| Total (Overall) | 2,760 (57.9%) | 2,006 (42.1%) |
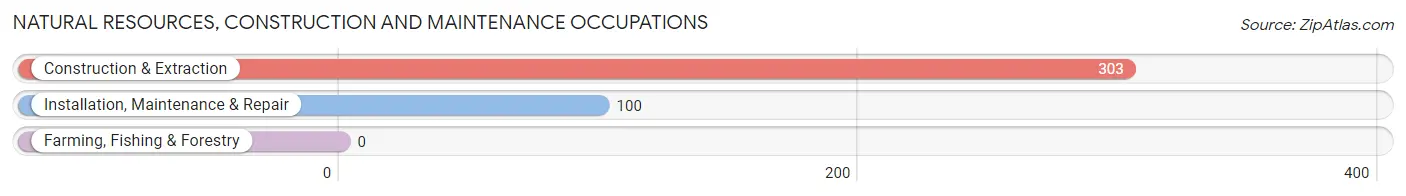
Natural Resources, Construction and Maintenance Occupations
The most common Natural Resources, Construction and Maintenance occupations in Melvindale are Construction & Extraction (303 | 6.4%), and Installation, Maintenance & Repair (100 | 2.1%).
Natural Resources, Construction and Maintenance Occupations by Sex
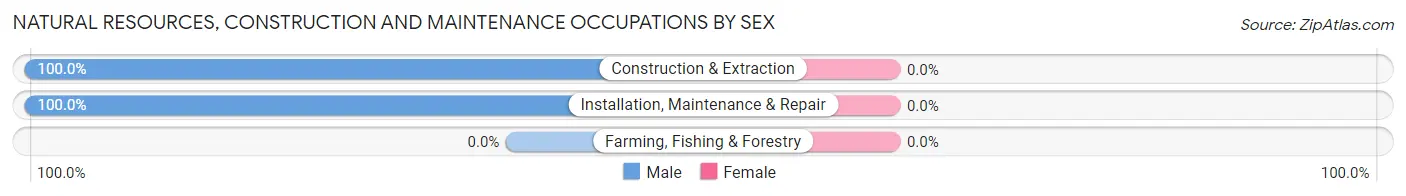
| Occupation | Male | Female |
| Farming, Fishing & Forestry | 0 (0.0%) | 0 (0.0%) |
| Construction & Extraction | 303 (100.0%) | 0 (0.0%) |
| Installation, Maintenance & Repair | 100 (100.0%) | 0 (0.0%) |
| Total (Category) | 403 (100.0%) | 0 (0.0%) |
| Total (Overall) | 2,760 (57.9%) | 2,006 (42.1%) |
Production, Transportation and Moving Occupations
The most common Production, Transportation and Moving occupations in Melvindale are Transportation (506 | 10.6%), Production (307 | 6.4%), and Material Moving (146 | 3.1%).
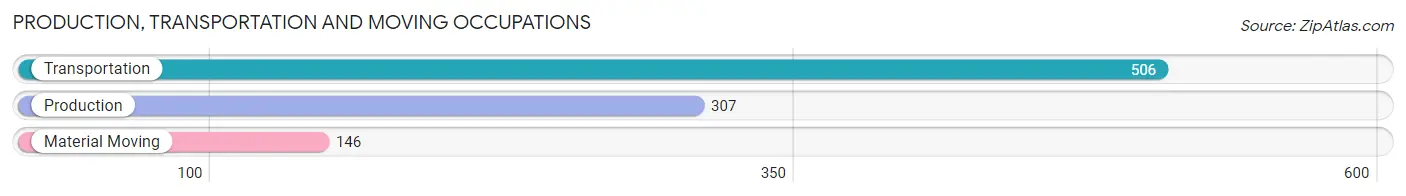
Production, Transportation and Moving Occupations by Sex
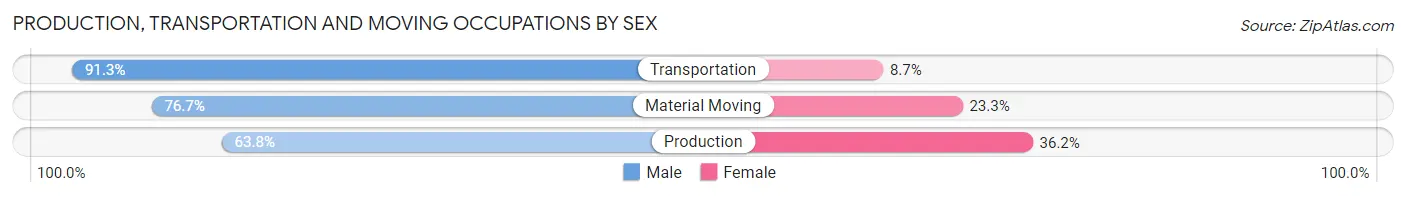
| Occupation | Male | Female |
| Production | 196 (63.8%) | 111 (36.2%) |
| Transportation | 462 (91.3%) | 44 (8.7%) |
| Material Moving | 112 (76.7%) | 34 (23.3%) |
| Total (Category) | 770 (80.3%) | 189 (19.7%) |
| Total (Overall) | 2,760 (57.9%) | 2,006 (42.1%) |
Employment Industries by Sex in Melvindale
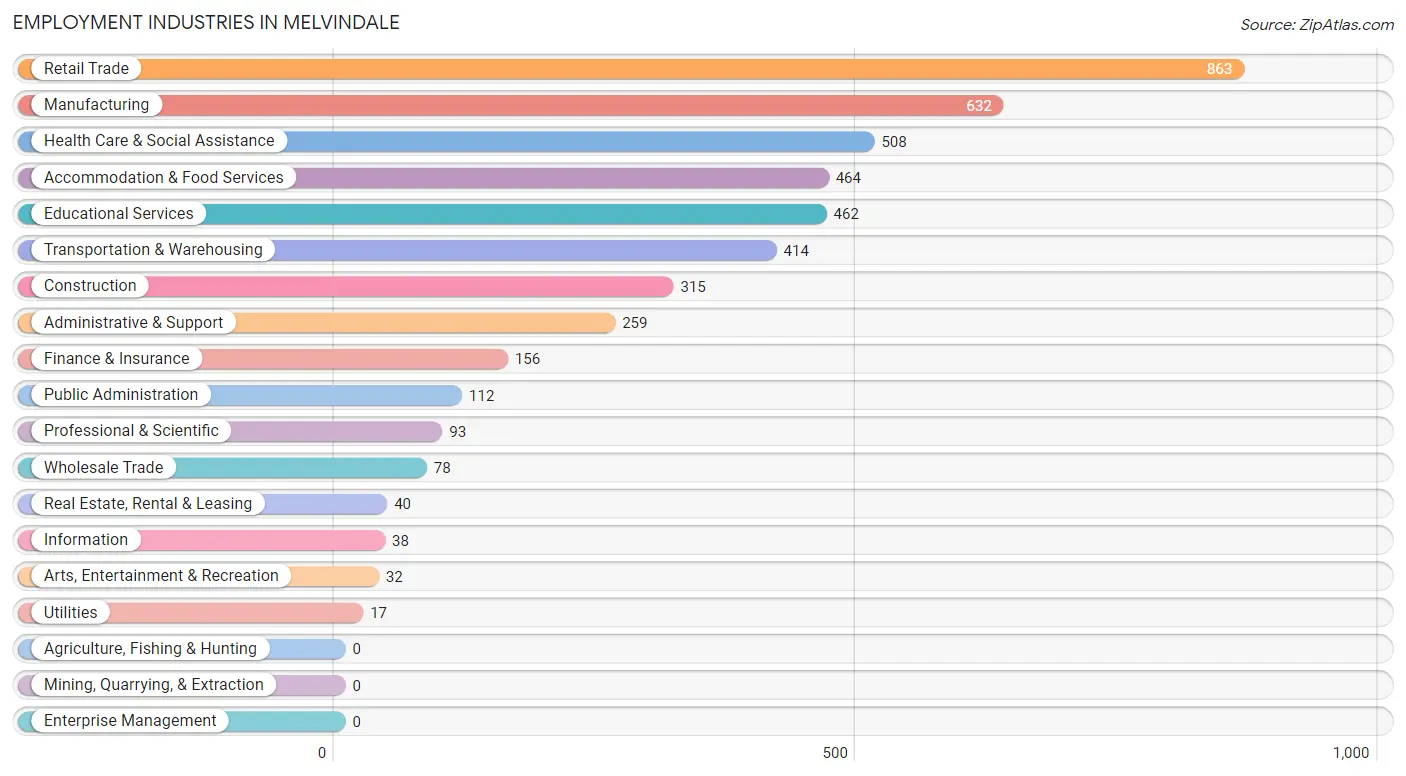
Employment Industries in Melvindale
The major employment industries in Melvindale include Retail Trade (863 | 18.1%), Manufacturing (632 | 13.3%), Health Care & Social Assistance (508 | 10.7%), Accommodation & Food Services (464 | 9.7%), and Educational Services (462 | 9.7%).
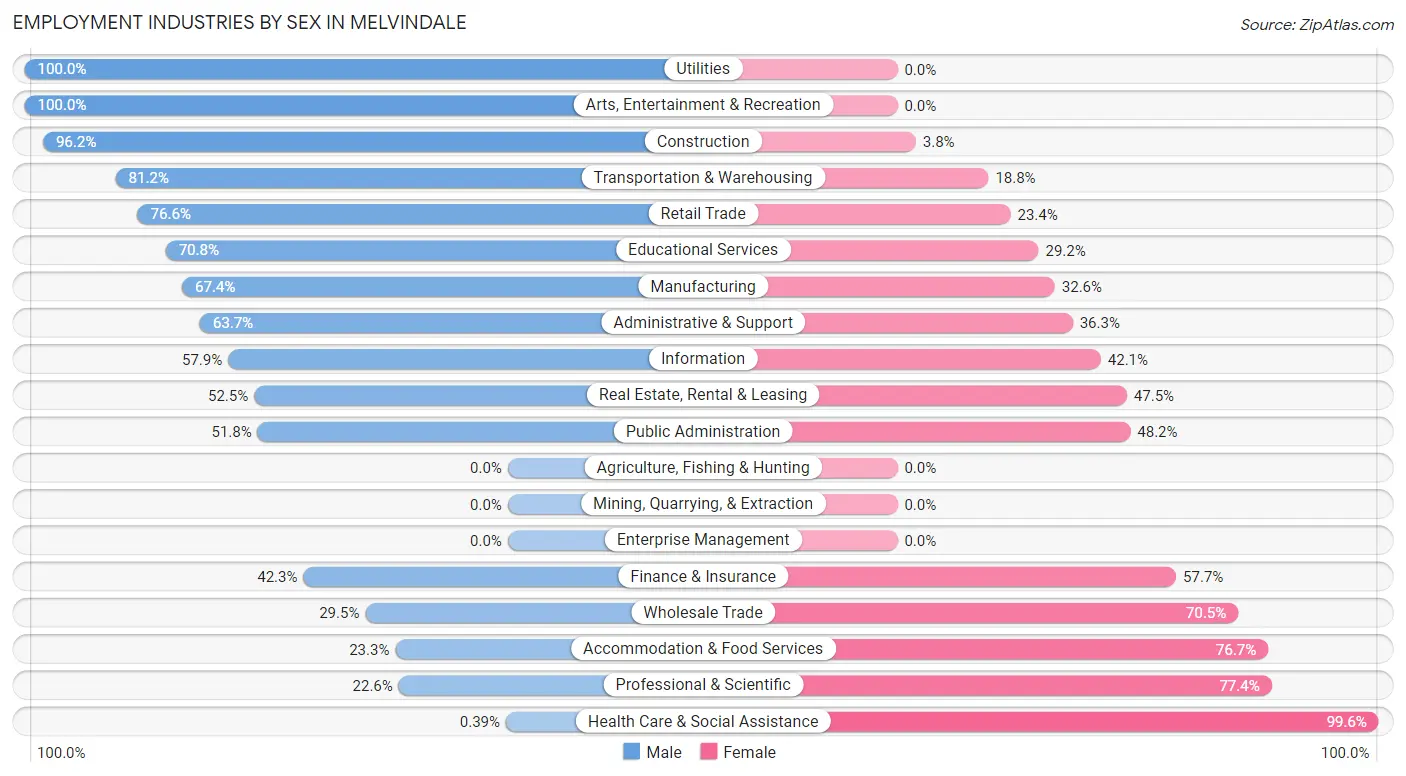
Employment Industries by Sex in Melvindale
The Melvindale industries that see more men than women are Utilities (100.0%), Arts, Entertainment & Recreation (100.0%), and Construction (96.2%), whereas the industries that tend to have a higher number of women are Health Care & Social Assistance (99.6%), Professional & Scientific (77.4%), and Accommodation & Food Services (76.7%).
| Industry | Male | Female |
| Agriculture, Fishing & Hunting | 0 (0.0%) | 0 (0.0%) |
| Mining, Quarrying, & Extraction | 0 (0.0%) | 0 (0.0%) |
| Construction | 303 (96.2%) | 12 (3.8%) |
| Manufacturing | 426 (67.4%) | 206 (32.6%) |
| Wholesale Trade | 23 (29.5%) | 55 (70.5%) |
| Retail Trade | 661 (76.6%) | 202 (23.4%) |
| Transportation & Warehousing | 336 (81.2%) | 78 (18.8%) |
| Utilities | 17 (100.0%) | 0 (0.0%) |
| Information | 22 (57.9%) | 16 (42.1%) |
| Finance & Insurance | 66 (42.3%) | 90 (57.7%) |
| Real Estate, Rental & Leasing | 21 (52.5%) | 19 (47.5%) |
| Professional & Scientific | 21 (22.6%) | 72 (77.4%) |
| Enterprise Management | 0 (0.0%) | 0 (0.0%) |
| Administrative & Support | 165 (63.7%) | 94 (36.3%) |
| Educational Services | 327 (70.8%) | 135 (29.2%) |
| Health Care & Social Assistance | 2 (0.4%) | 506 (99.6%) |
| Arts, Entertainment & Recreation | 32 (100.0%) | 0 (0.0%) |
| Accommodation & Food Services | 108 (23.3%) | 356 (76.7%) |
| Public Administration | 58 (51.8%) | 54 (48.2%) |
| Total | 2,760 (57.9%) | 2,006 (42.1%) |
Education in Melvindale
School Enrollment in Melvindale
The most common levels of schooling among the 3,481 students in Melvindale are middle school (894 | 25.7%), high school (797 | 22.9%), and elementary school (728 | 20.9%).
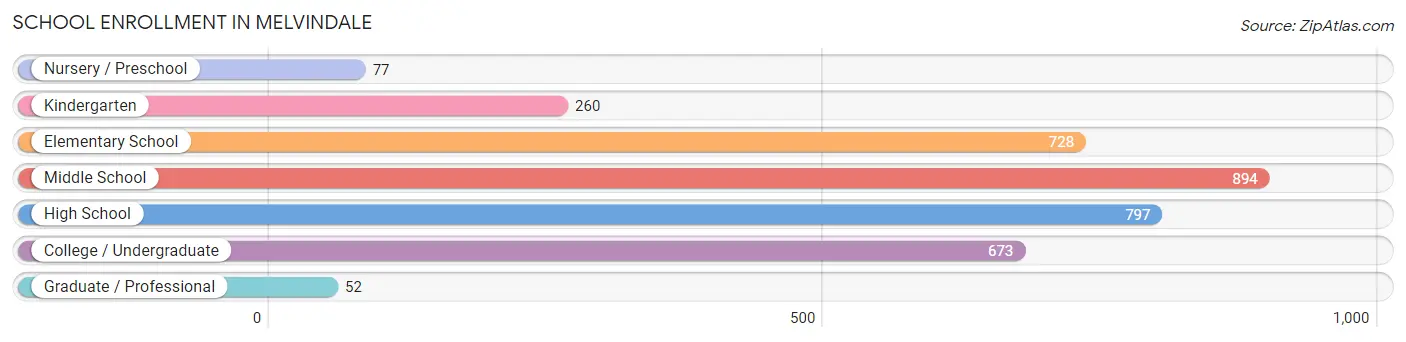
| School Level | # Students | % Students |
| Nursery / Preschool | 77 | 2.2% |
| Kindergarten | 260 | 7.5% |
| Elementary School | 728 | 20.9% |
| Middle School | 894 | 25.7% |
| High School | 797 | 22.9% |
| College / Undergraduate | 673 | 19.3% |
| Graduate / Professional | 52 | 1.5% |
| Total | 3,481 | 100.0% |
School Enrollment by Age by Funding Source in Melvindale
Out of a total of 3,481 students who are enrolled in schools in Melvindale, 272 (7.8%) attend a private institution, while the remaining 3,209 (92.2%) are enrolled in public schools. The age group of 3 to 4 year olds has the highest likelihood of being enrolled in private schools, with 20 (20.6% in the age bracket) enrolled. Conversely, the age group of 18 to 19 year olds has the lowest likelihood of being enrolled in a private school, with 350 (100.0% in the age bracket) attending a public institution.
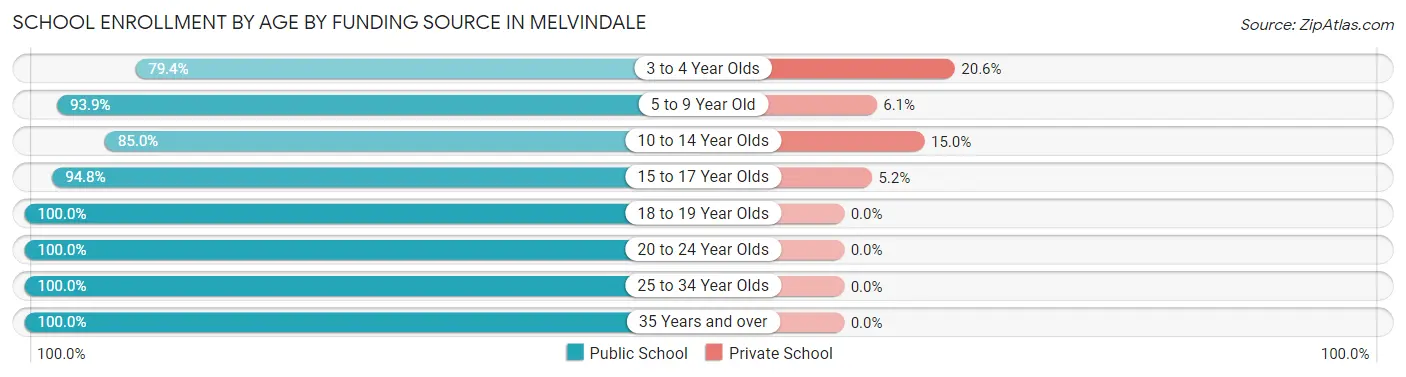
| Age Bracket | Public School | Private School |
| 3 to 4 Year Olds | 77 (79.4%) | 20 (20.6%) |
| 5 to 9 Year Old | 820 (93.9%) | 53 (6.1%) |
| 10 to 14 Year Olds | 971 (85.0%) | 171 (15.0%) |
| 15 to 17 Year Olds | 495 (94.8%) | 27 (5.2%) |
| 18 to 19 Year Olds | 350 (100.0%) | 0 (0.0%) |
| 20 to 24 Year Olds | 151 (100.0%) | 0 (0.0%) |
| 25 to 34 Year Olds | 95 (100.0%) | 0 (0.0%) |
| 35 Years and over | 251 (100.0%) | 0 (0.0%) |
| Total | 3,209 (92.2%) | 272 (7.8%) |
Educational Attainment by Field of Study in Melvindale
Education (320 | 24.5%), psychology (311 | 23.8%), business (276 | 21.1%), science & technology (155 | 11.9%), and arts & humanities (53 | 4.1%) are the most common fields of study among 1,306 individuals in Melvindale who have obtained a bachelor's degree or higher.
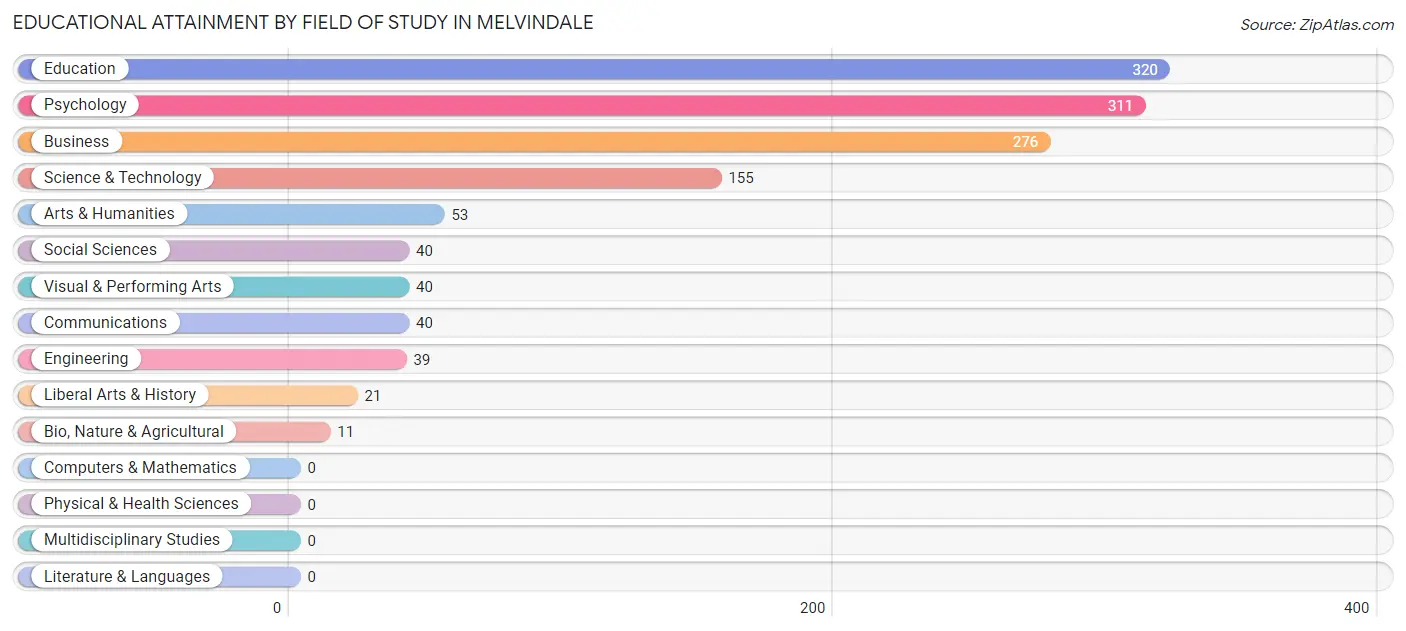
| Field of Study | # Graduates | % Graduates |
| Computers & Mathematics | 0 | 0.0% |
| Bio, Nature & Agricultural | 11 | 0.8% |
| Physical & Health Sciences | 0 | 0.0% |
| Psychology | 311 | 23.8% |
| Social Sciences | 40 | 3.1% |
| Engineering | 39 | 3.0% |
| Multidisciplinary Studies | 0 | 0.0% |
| Science & Technology | 155 | 11.9% |
| Business | 276 | 21.1% |
| Education | 320 | 24.5% |
| Literature & Languages | 0 | 0.0% |
| Liberal Arts & History | 21 | 1.6% |
| Visual & Performing Arts | 40 | 3.1% |
| Communications | 40 | 3.1% |
| Arts & Humanities | 53 | 4.1% |
| Total | 1,306 | 100.0% |
Transportation & Commute in Melvindale
Vehicle Availability by Sex in Melvindale
The most prevalent vehicle ownership categories in Melvindale are males with 2 vehicles (1,449, accounting for 53.6%) and females with 2 vehicles (760, making up 73.4%).
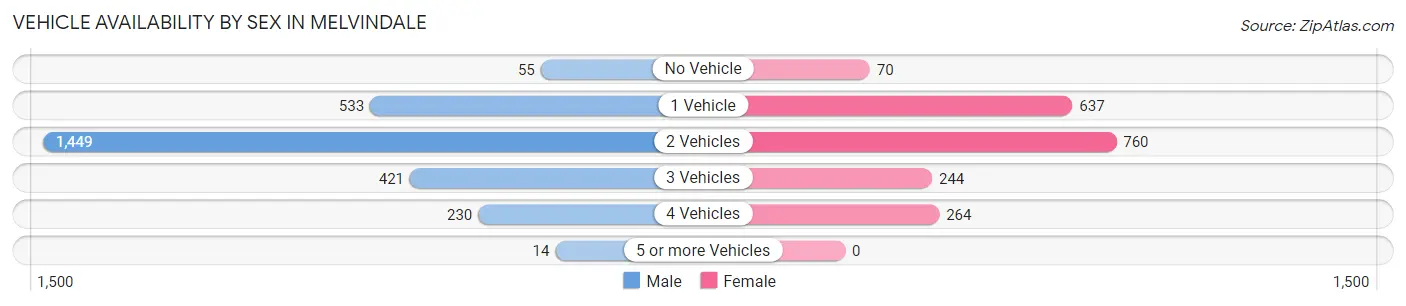
| Vehicles Available | Male | Female |
| No Vehicle | 55 (2.0%) | 70 (3.5%) |
| 1 Vehicle | 533 (19.7%) | 637 (32.3%) |
| 2 Vehicles | 1,449 (53.6%) | 760 (38.5%) |
| 3 Vehicles | 421 (15.6%) | 244 (12.3%) |
| 4 Vehicles | 230 (8.5%) | 264 (13.4%) |
| 5 or more Vehicles | 14 (0.5%) | 0 (0.0%) |
| Total | 2,702 (100.0%) | 1,975 (100.0%) |
Commute Time in Melvindale
The most frequently occuring commute durations in Melvindale are 30 to 34 minutes (969 commuters, 22.1%), 15 to 19 minutes (772 commuters, 17.6%), and 20 to 24 minutes (632 commuters, 14.4%).
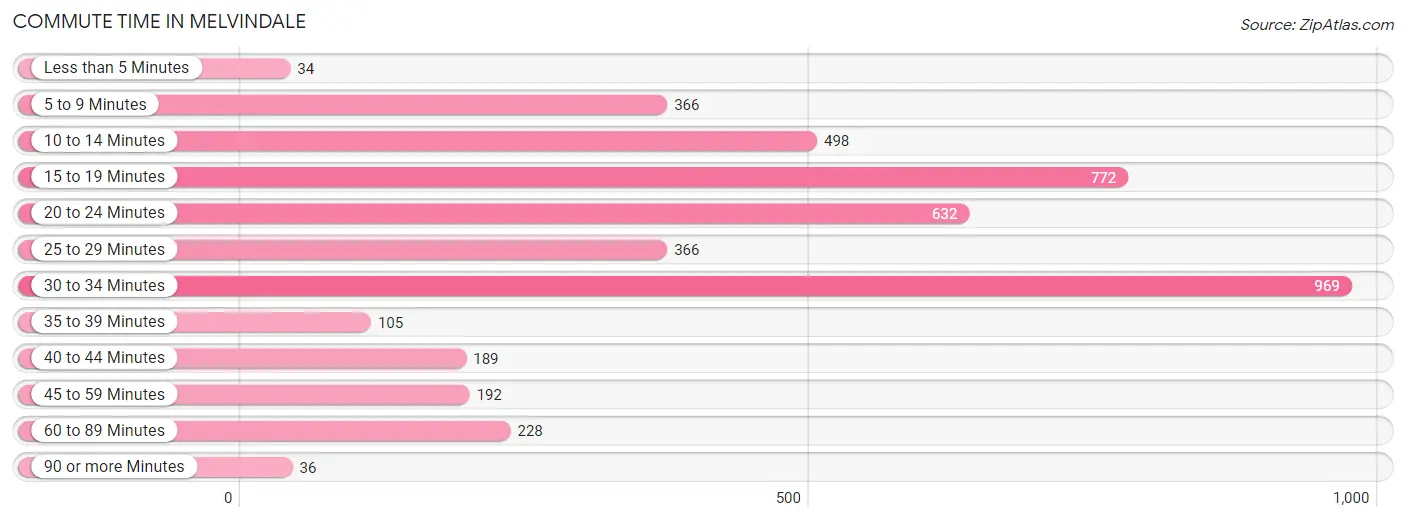
| Commute Time | # Commuters | % Commuters |
| Less than 5 Minutes | 34 | 0.8% |
| 5 to 9 Minutes | 366 | 8.3% |
| 10 to 14 Minutes | 498 | 11.4% |
| 15 to 19 Minutes | 772 | 17.6% |
| 20 to 24 Minutes | 632 | 14.4% |
| 25 to 29 Minutes | 366 | 8.3% |
| 30 to 34 Minutes | 969 | 22.1% |
| 35 to 39 Minutes | 105 | 2.4% |
| 40 to 44 Minutes | 189 | 4.3% |
| 45 to 59 Minutes | 192 | 4.4% |
| 60 to 89 Minutes | 228 | 5.2% |
| 90 or more Minutes | 36 | 0.8% |
Commute Time by Sex in Melvindale
The most common commute times in Melvindale are 30 to 34 minutes (705 commuters, 27.1%) for males and 15 to 19 minutes (506 commuters, 28.4%) for females.
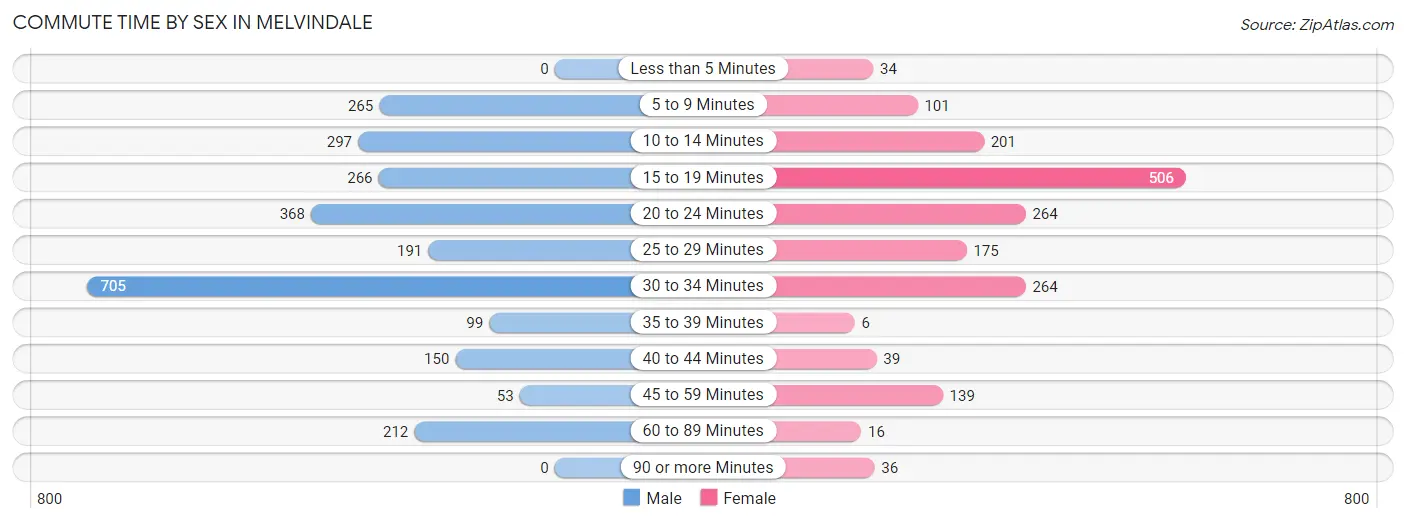
| Commute Time | Male | Female |
| Less than 5 Minutes | 0 (0.0%) | 34 (1.9%) |
| 5 to 9 Minutes | 265 (10.2%) | 101 (5.7%) |
| 10 to 14 Minutes | 297 (11.4%) | 201 (11.3%) |
| 15 to 19 Minutes | 266 (10.2%) | 506 (28.4%) |
| 20 to 24 Minutes | 368 (14.1%) | 264 (14.8%) |
| 25 to 29 Minutes | 191 (7.3%) | 175 (9.8%) |
| 30 to 34 Minutes | 705 (27.1%) | 264 (14.8%) |
| 35 to 39 Minutes | 99 (3.8%) | 6 (0.3%) |
| 40 to 44 Minutes | 150 (5.8%) | 39 (2.2%) |
| 45 to 59 Minutes | 53 (2.0%) | 139 (7.8%) |
| 60 to 89 Minutes | 212 (8.1%) | 16 (0.9%) |
| 90 or more Minutes | 0 (0.0%) | 36 (2.0%) |
Time of Departure to Work by Sex in Melvindale
The most frequent times of departure to work in Melvindale are 6:30 AM to 6:59 AM (708, 27.2%) for males and 8:00 AM to 8:29 AM (346, 19.4%) for females.
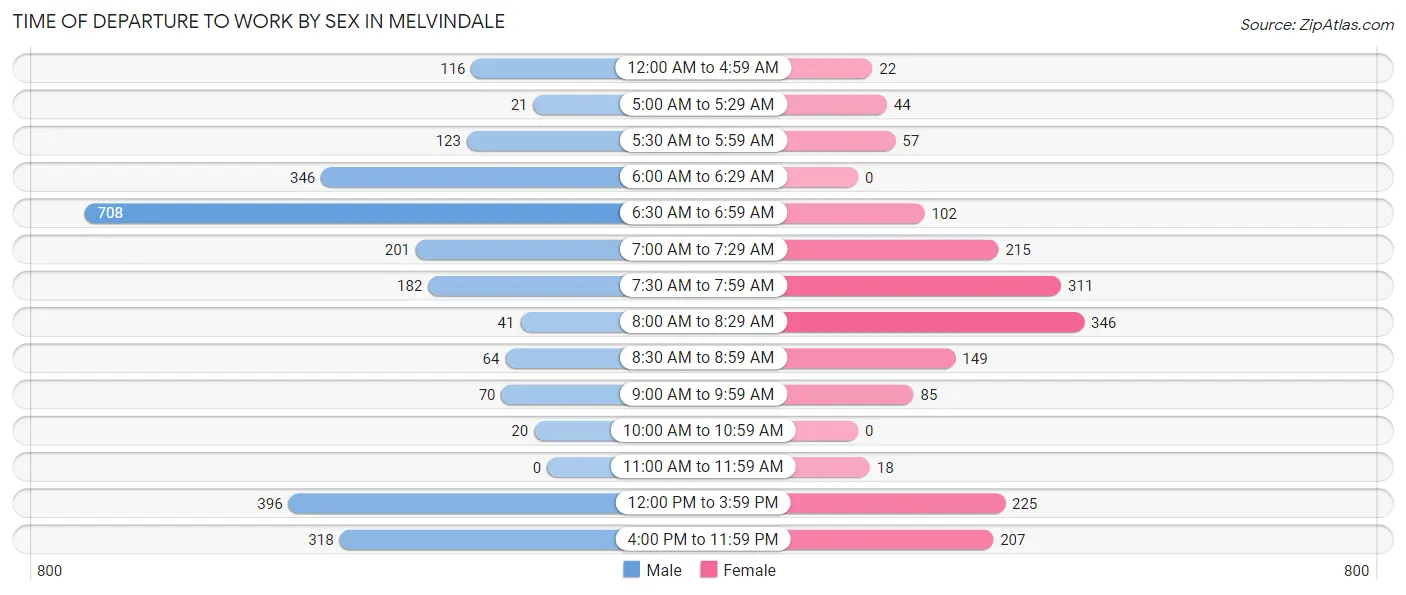
| Time of Departure | Male | Female |
| 12:00 AM to 4:59 AM | 116 (4.4%) | 22 (1.2%) |
| 5:00 AM to 5:29 AM | 21 (0.8%) | 44 (2.5%) |
| 5:30 AM to 5:59 AM | 123 (4.7%) | 57 (3.2%) |
| 6:00 AM to 6:29 AM | 346 (13.3%) | 0 (0.0%) |
| 6:30 AM to 6:59 AM | 708 (27.2%) | 102 (5.7%) |
| 7:00 AM to 7:29 AM | 201 (7.7%) | 215 (12.1%) |
| 7:30 AM to 7:59 AM | 182 (7.0%) | 311 (17.5%) |
| 8:00 AM to 8:29 AM | 41 (1.6%) | 346 (19.4%) |
| 8:30 AM to 8:59 AM | 64 (2.5%) | 149 (8.4%) |
| 9:00 AM to 9:59 AM | 70 (2.7%) | 85 (4.8%) |
| 10:00 AM to 10:59 AM | 20 (0.8%) | 0 (0.0%) |
| 11:00 AM to 11:59 AM | 0 (0.0%) | 18 (1.0%) |
| 12:00 PM to 3:59 PM | 396 (15.2%) | 225 (12.6%) |
| 4:00 PM to 11:59 PM | 318 (12.2%) | 207 (11.6%) |
| Total | 2,606 (100.0%) | 1,781 (100.0%) |
Housing Occupancy in Melvindale
Occupancy by Ownership in Melvindale
Of the total 4,407 dwellings in Melvindale, owner-occupied units account for 2,636 (59.8%), while renter-occupied units make up 1,771 (40.2%).
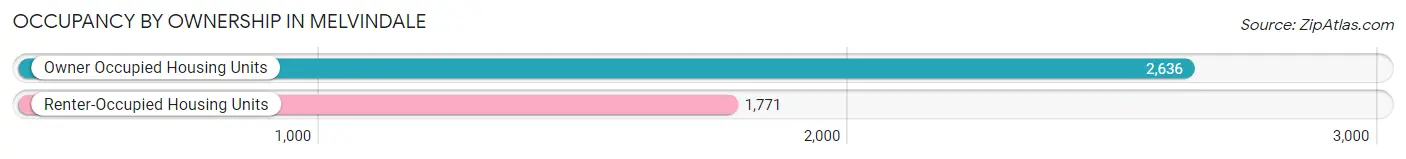
| Occupancy | # Housing Units | % Housing Units |
| Owner Occupied Housing Units | 2,636 | 59.8% |
| Renter-Occupied Housing Units | 1,771 | 40.2% |
| Total Occupied Housing Units | 4,407 | 100.0% |
Occupancy by Household Size in Melvindale
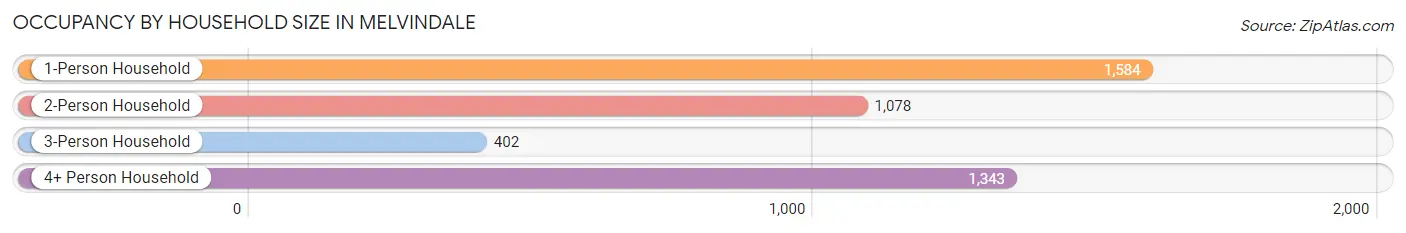
| Household Size | # Housing Units | % Housing Units |
| 1-Person Household | 1,584 | 35.9% |
| 2-Person Household | 1,078 | 24.5% |
| 3-Person Household | 402 | 9.1% |
| 4+ Person Household | 1,343 | 30.5% |
| Total Housing Units | 4,407 | 100.0% |
Occupancy by Ownership by Household Size in Melvindale
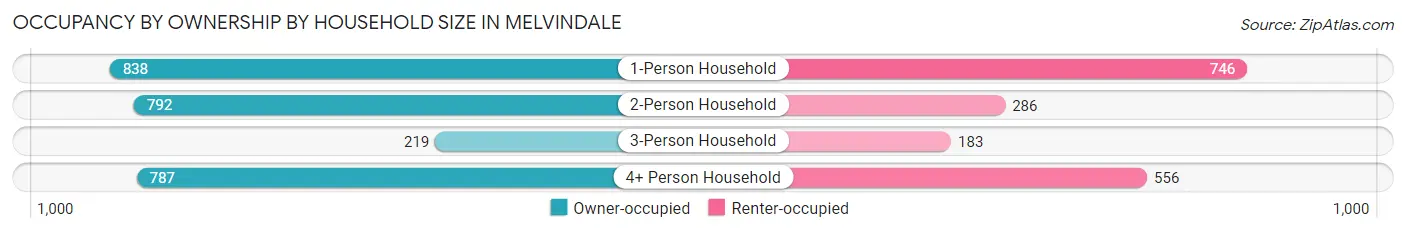
| Household Size | Owner-occupied | Renter-occupied |
| 1-Person Household | 838 (52.9%) | 746 (47.1%) |
| 2-Person Household | 792 (73.5%) | 286 (26.5%) |
| 3-Person Household | 219 (54.5%) | 183 (45.5%) |
| 4+ Person Household | 787 (58.6%) | 556 (41.4%) |
| Total Housing Units | 2,636 (59.8%) | 1,771 (40.2%) |
Occupancy by Educational Attainment in Melvindale
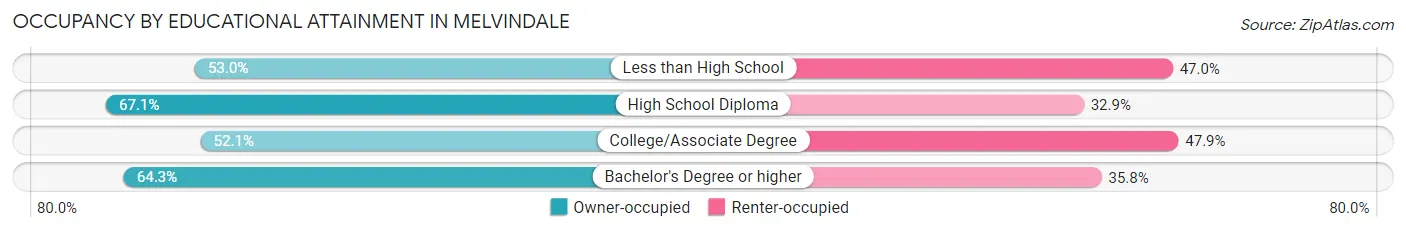
| Household Size | Owner-occupied | Renter-occupied |
| Less than High School | 562 (53.0%) | 499 (47.0%) |
| High School Diploma | 1,129 (67.1%) | 554 (32.9%) |
| College/Associate Degree | 528 (52.1%) | 486 (47.9%) |
| Bachelor's Degree or higher | 417 (64.2%) | 232 (35.7%) |
Occupancy by Age of Householder in Melvindale
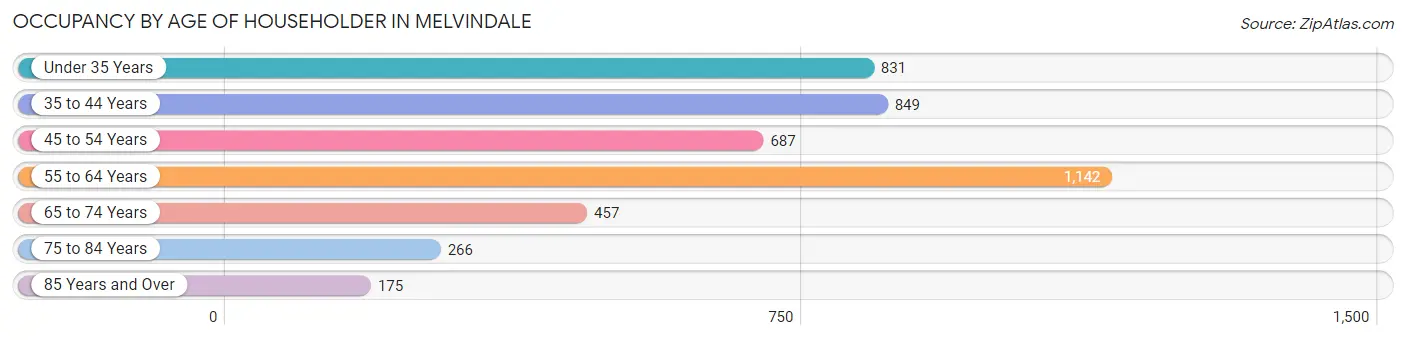
| Age Bracket | # Households | % Households |
| Under 35 Years | 831 | 18.9% |
| 35 to 44 Years | 849 | 19.3% |
| 45 to 54 Years | 687 | 15.6% |
| 55 to 64 Years | 1,142 | 25.9% |
| 65 to 74 Years | 457 | 10.4% |
| 75 to 84 Years | 266 | 6.0% |
| 85 Years and Over | 175 | 4.0% |
| Total | 4,407 | 100.0% |
Housing Finances in Melvindale
Median Income by Occupancy in Melvindale
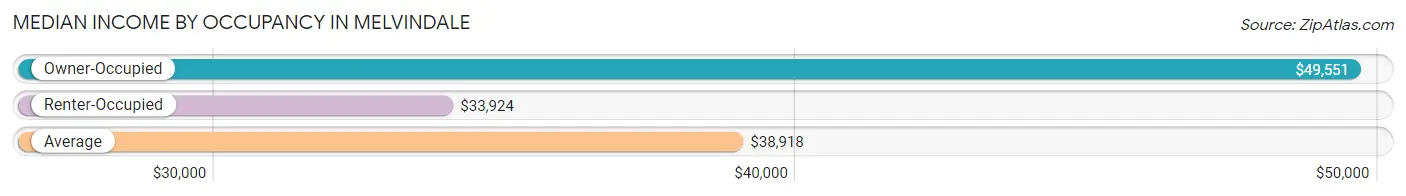
| Occupancy Type | # Households | Median Income |
| Owner-Occupied | 2,636 (59.8%) | $49,551 |
| Renter-Occupied | 1,771 (40.2%) | $33,924 |
| Average | 4,407 (100.0%) | $38,918 |
Occupancy by Householder Income Bracket in Melvindale
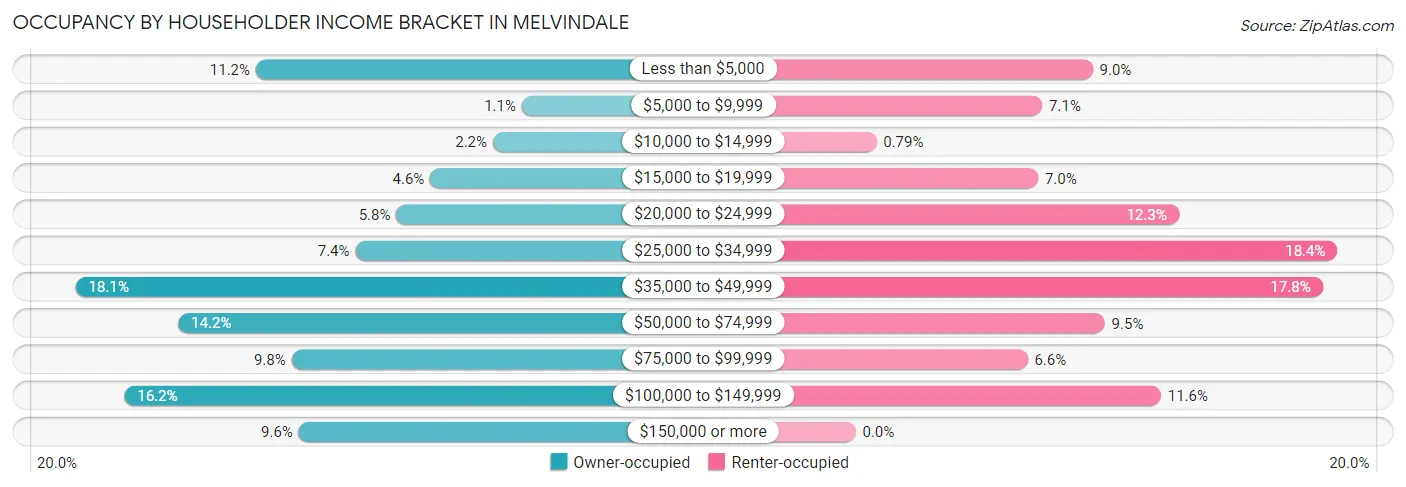
| Income Bracket | Owner-occupied | Renter-occupied |
| Less than $5,000 | 295 (11.2%) | 160 (9.0%) |
| $5,000 to $9,999 | 28 (1.1%) | 126 (7.1%) |
| $10,000 to $14,999 | 57 (2.2%) | 14 (0.8%) |
| $15,000 to $19,999 | 120 (4.5%) | 123 (7.0%) |
| $20,000 to $24,999 | 154 (5.8%) | 218 (12.3%) |
| $25,000 to $34,999 | 195 (7.4%) | 325 (18.3%) |
| $35,000 to $49,999 | 476 (18.1%) | 315 (17.8%) |
| $50,000 to $74,999 | 373 (14.1%) | 168 (9.5%) |
| $75,000 to $99,999 | 259 (9.8%) | 116 (6.6%) |
| $100,000 to $149,999 | 427 (16.2%) | 206 (11.6%) |
| $150,000 or more | 252 (9.6%) | 0 (0.0%) |
| Total | 2,636 (100.0%) | 1,771 (100.0%) |
Monthly Housing Cost Tiers in Melvindale
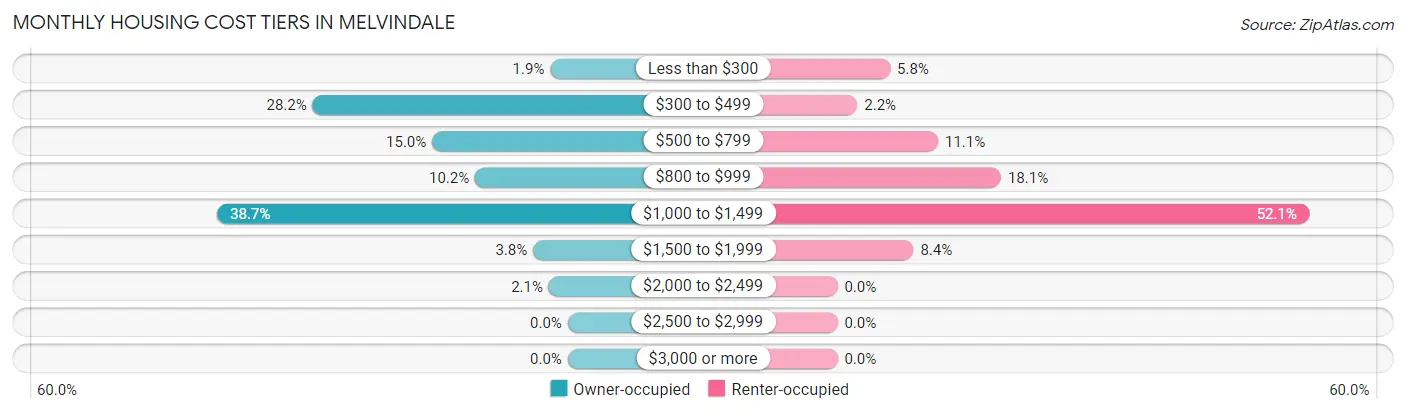
| Monthly Cost | Owner-occupied | Renter-occupied |
| Less than $300 | 51 (1.9%) | 103 (5.8%) |
| $300 to $499 | 743 (28.2%) | 39 (2.2%) |
| $500 to $799 | 395 (15.0%) | 197 (11.1%) |
| $800 to $999 | 270 (10.2%) | 320 (18.1%) |
| $1,000 to $1,499 | 1,021 (38.7%) | 922 (52.1%) |
| $1,500 to $1,999 | 101 (3.8%) | 149 (8.4%) |
| $2,000 to $2,499 | 55 (2.1%) | 0 (0.0%) |
| $2,500 to $2,999 | 0 (0.0%) | 0 (0.0%) |
| $3,000 or more | 0 (0.0%) | 0 (0.0%) |
| Total | 2,636 (100.0%) | 1,771 (100.0%) |
Physical Housing Characteristics in Melvindale
Housing Structures in Melvindale
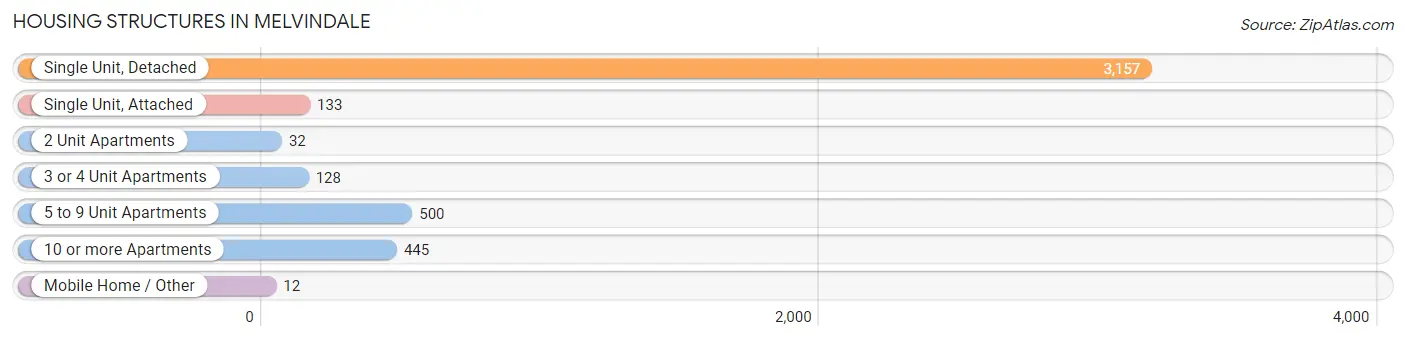
| Structure Type | # Housing Units | % Housing Units |
| Single Unit, Detached | 3,157 | 71.6% |
| Single Unit, Attached | 133 | 3.0% |
| 2 Unit Apartments | 32 | 0.7% |
| 3 or 4 Unit Apartments | 128 | 2.9% |
| 5 to 9 Unit Apartments | 500 | 11.4% |
| 10 or more Apartments | 445 | 10.1% |
| Mobile Home / Other | 12 | 0.3% |
| Total | 4,407 | 100.0% |
Housing Structures by Occupancy in Melvindale
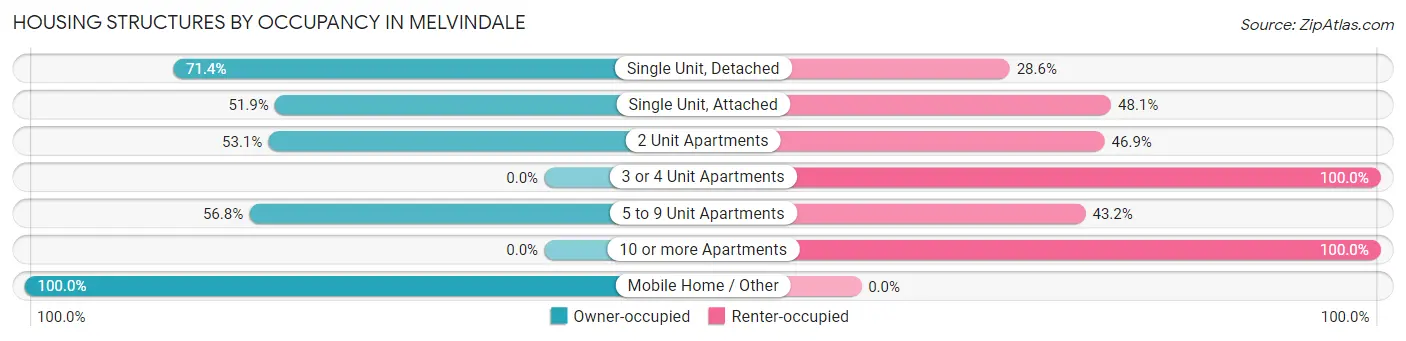
| Structure Type | Owner-occupied | Renter-occupied |
| Single Unit, Detached | 2,254 (71.4%) | 903 (28.6%) |
| Single Unit, Attached | 69 (51.9%) | 64 (48.1%) |
| 2 Unit Apartments | 17 (53.1%) | 15 (46.9%) |
| 3 or 4 Unit Apartments | 0 (0.0%) | 128 (100.0%) |
| 5 to 9 Unit Apartments | 284 (56.8%) | 216 (43.2%) |
| 10 or more Apartments | 0 (0.0%) | 445 (100.0%) |
| Mobile Home / Other | 12 (100.0%) | 0 (0.0%) |
| Total | 2,636 (59.8%) | 1,771 (40.2%) |
Housing Structures by Number of Rooms in Melvindale
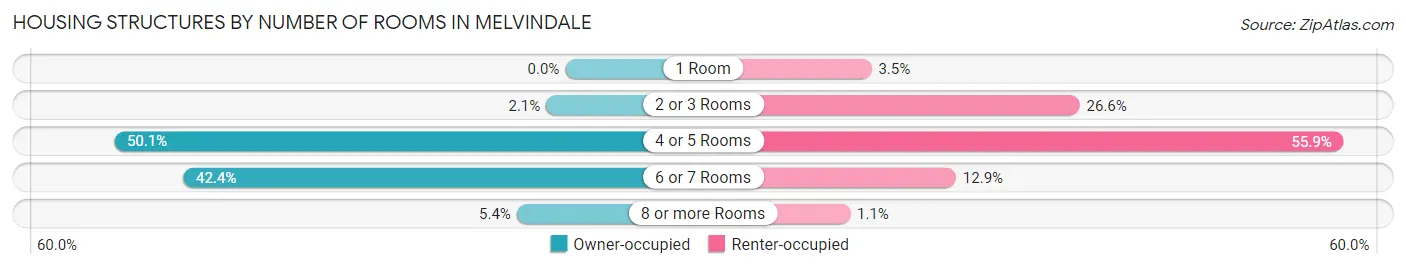
| Number of Rooms | Owner-occupied | Renter-occupied |
| 1 Room | 0 (0.0%) | 62 (3.5%) |
| 2 or 3 Rooms | 56 (2.1%) | 471 (26.6%) |
| 4 or 5 Rooms | 1,320 (50.1%) | 990 (55.9%) |
| 6 or 7 Rooms | 1,118 (42.4%) | 228 (12.9%) |
| 8 or more Rooms | 142 (5.4%) | 20 (1.1%) |
| Total | 2,636 (100.0%) | 1,771 (100.0%) |
Housing Structure by Heating Type in Melvindale
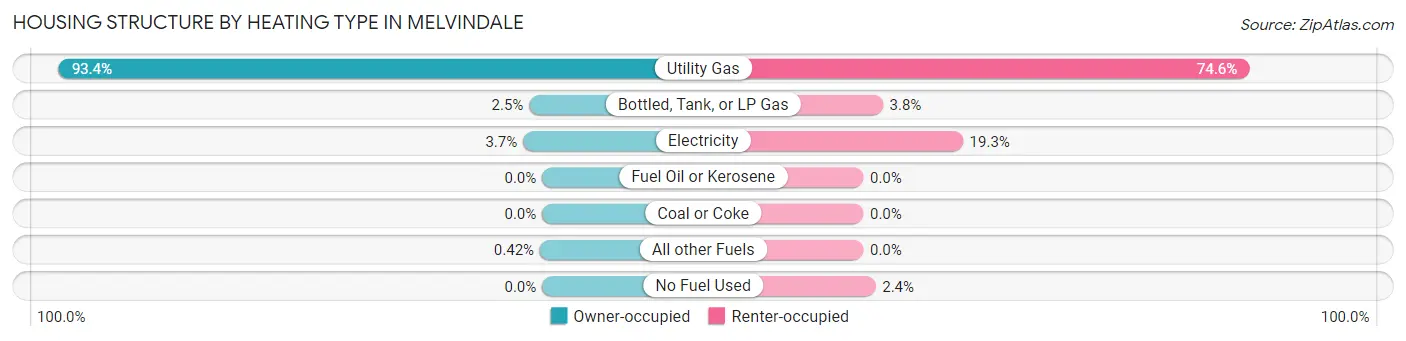
| Heating Type | Owner-occupied | Renter-occupied |
| Utility Gas | 2,462 (93.4%) | 1,321 (74.6%) |
| Bottled, Tank, or LP Gas | 66 (2.5%) | 67 (3.8%) |
| Electricity | 97 (3.7%) | 341 (19.3%) |
| Fuel Oil or Kerosene | 0 (0.0%) | 0 (0.0%) |
| Coal or Coke | 0 (0.0%) | 0 (0.0%) |
| All other Fuels | 11 (0.4%) | 0 (0.0%) |
| No Fuel Used | 0 (0.0%) | 42 (2.4%) |
| Total | 2,636 (100.0%) | 1,771 (100.0%) |
Household Vehicle Usage in Melvindale
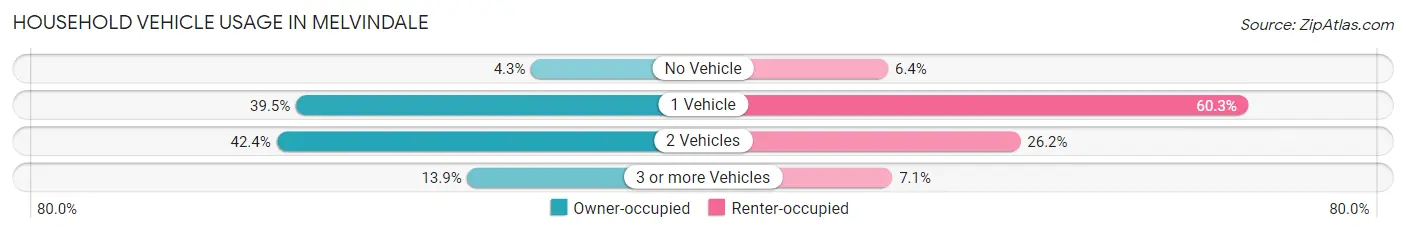
| Vehicles per Household | Owner-occupied | Renter-occupied |
| No Vehicle | 114 (4.3%) | 114 (6.4%) |
| 1 Vehicle | 1,040 (39.5%) | 1,068 (60.3%) |
| 2 Vehicles | 1,117 (42.4%) | 464 (26.2%) |
| 3 or more Vehicles | 365 (13.9%) | 125 (7.1%) |
| Total | 2,636 (100.0%) | 1,771 (100.0%) |
Real Estate & Mortgages in Melvindale
Real Estate and Mortgage Overview in Melvindale
| Characteristic | Without Mortgage | With Mortgage |
| Housing Units | 1,467 | 1,169 |
| Median Property Value | $97,200 | $95,100 |
| Median Household Income | $47,121 | $179 |
| Monthly Housing Costs | $493 | $0 |
| Real Estate Taxes | $1,965 | $194 |
Property Value by Mortgage Status in Melvindale
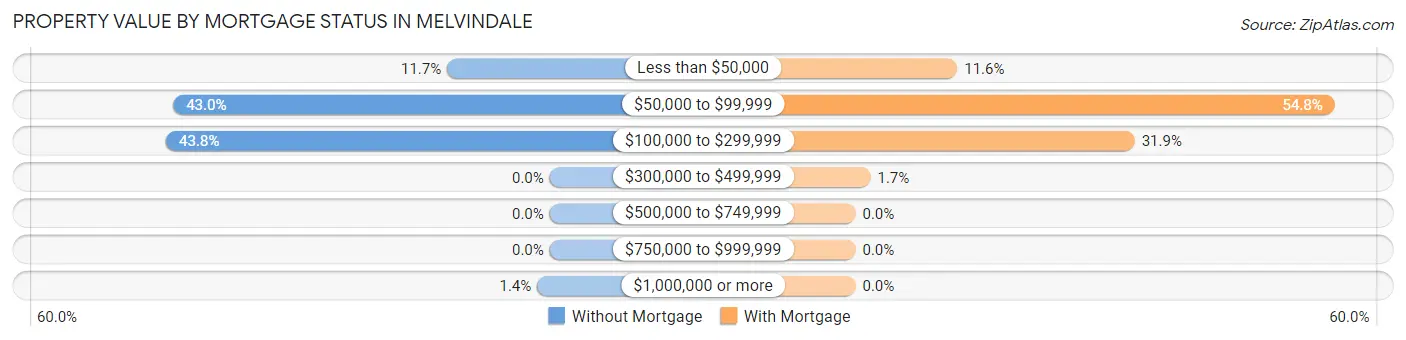
| Property Value | Without Mortgage | With Mortgage |
| Less than $50,000 | 172 (11.7%) | 136 (11.6%) |
| $50,000 to $99,999 | 631 (43.0%) | 640 (54.7%) |
| $100,000 to $299,999 | 643 (43.8%) | 373 (31.9%) |
| $300,000 to $499,999 | 0 (0.0%) | 20 (1.7%) |
| $500,000 to $749,999 | 0 (0.0%) | 0 (0.0%) |
| $750,000 to $999,999 | 0 (0.0%) | 0 (0.0%) |
| $1,000,000 or more | 21 (1.4%) | 0 (0.0%) |
| Total | 1,467 (100.0%) | 1,169 (100.0%) |
Household Income by Mortgage Status in Melvindale
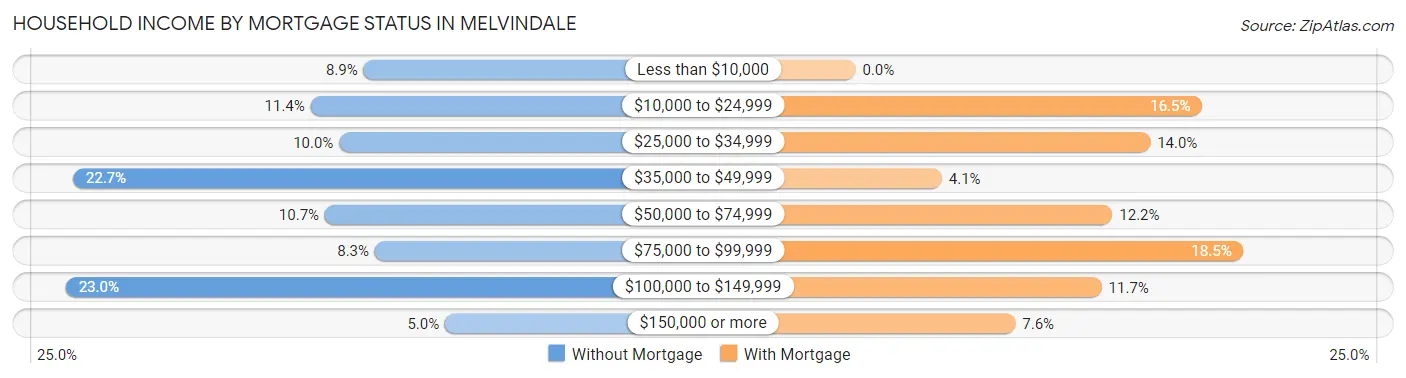
| Household Income | Without Mortgage | With Mortgage |
| Less than $10,000 | 130 (8.9%) | 0 (0.0%) |
| $10,000 to $24,999 | 167 (11.4%) | 193 (16.5%) |
| $25,000 to $34,999 | 147 (10.0%) | 164 (14.0%) |
| $35,000 to $49,999 | 333 (22.7%) | 48 (4.1%) |
| $50,000 to $74,999 | 157 (10.7%) | 143 (12.2%) |
| $75,000 to $99,999 | 122 (8.3%) | 216 (18.5%) |
| $100,000 to $149,999 | 338 (23.0%) | 137 (11.7%) |
| $150,000 or more | 73 (5.0%) | 89 (7.6%) |
| Total | 1,467 (100.0%) | 1,169 (100.0%) |
Property Value to Household Income Ratio in Melvindale
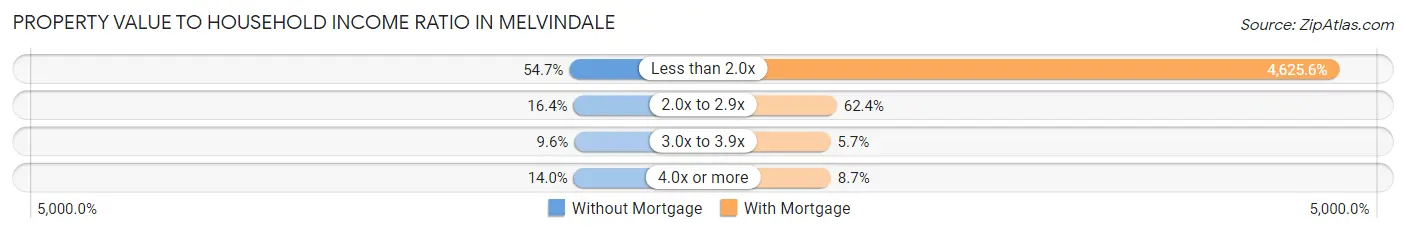
| Value-to-Income Ratio | Without Mortgage | With Mortgage |
| Less than 2.0x | 803 (54.7%) | 54,073 (4,625.6%) |
| 2.0x to 2.9x | 241 (16.4%) | 729 (62.4%) |
| 3.0x to 3.9x | 141 (9.6%) | 66 (5.7%) |
| 4.0x or more | 205 (14.0%) | 102 (8.7%) |
| Total | 1,467 (100.0%) | 1,169 (100.0%) |
Real Estate Taxes by Mortgage Status in Melvindale
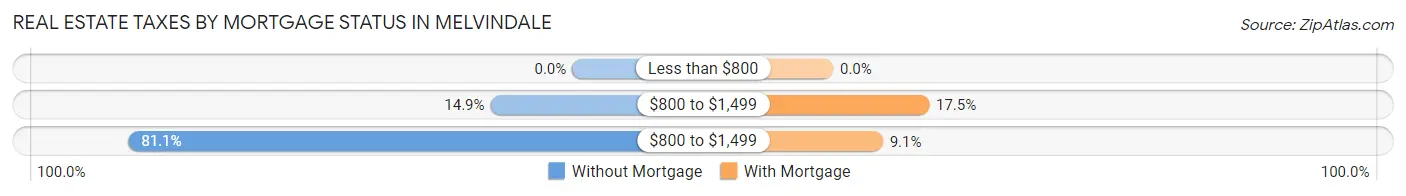
| Property Taxes | Without Mortgage | With Mortgage |
| Less than $800 | 0 (0.0%) | 0 (0.0%) |
| $800 to $1,499 | 219 (14.9%) | 205 (17.5%) |
| $800 to $1,499 | 1,189 (81.0%) | 106 (9.1%) |
| Total | 1,467 (100.0%) | 1,169 (100.0%) |
Health & Disability in Melvindale
Health Insurance Coverage by Age in Melvindale
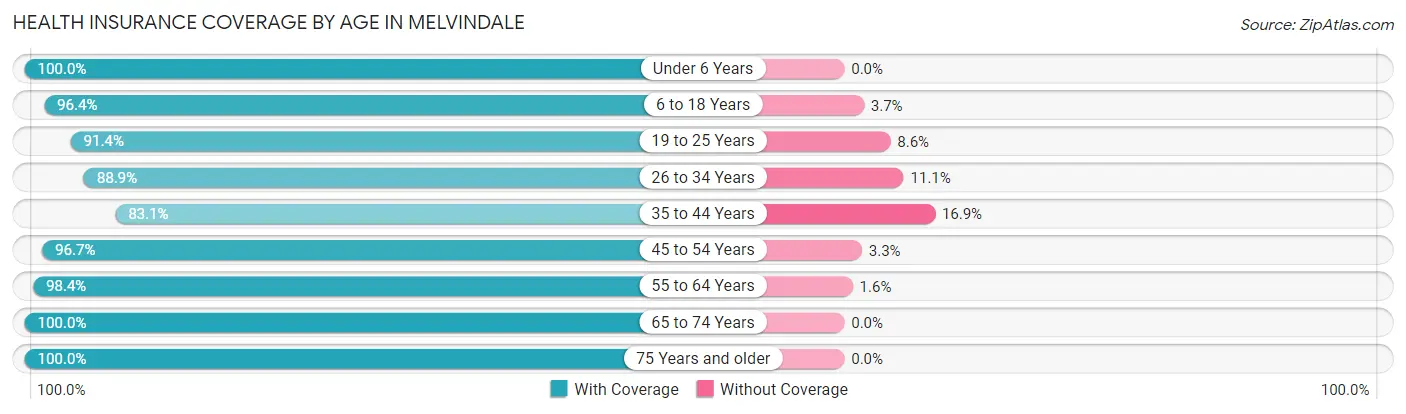
| Age Bracket | With Coverage | Without Coverage |
| Under 6 Years | 1,309 (100.0%) | 0 (0.0%) |
| 6 to 18 Years | 2,561 (96.4%) | 97 (3.6%) |
| 19 to 25 Years | 1,117 (91.4%) | 105 (8.6%) |
| 26 to 34 Years | 1,174 (88.9%) | 146 (11.1%) |
| 35 to 44 Years | 1,554 (83.1%) | 316 (16.9%) |
| 45 to 54 Years | 1,210 (96.7%) | 41 (3.3%) |
| 55 to 64 Years | 1,706 (98.4%) | 27 (1.6%) |
| 65 to 74 Years | 728 (100.0%) | 0 (0.0%) |
| 75 Years and older | 548 (100.0%) | 0 (0.0%) |
| Total | 11,907 (94.2%) | 732 (5.8%) |
Health Insurance Coverage by Citizenship Status in Melvindale
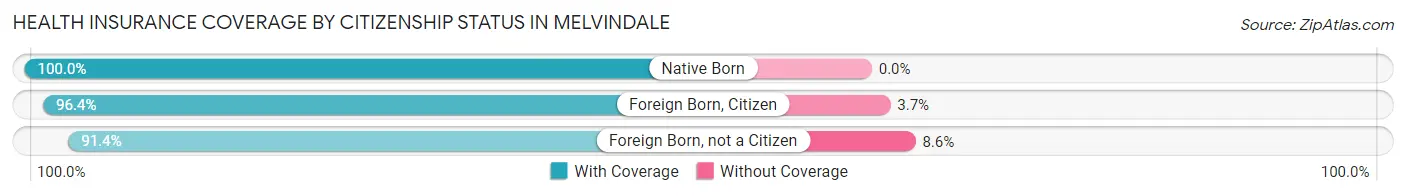
| Citizenship Status | With Coverage | Without Coverage |
| Native Born | 1,309 (100.0%) | 0 (0.0%) |
| Foreign Born, Citizen | 2,561 (96.4%) | 97 (3.6%) |
| Foreign Born, not a Citizen | 1,117 (91.4%) | 105 (8.6%) |
Health Insurance Coverage by Household Income in Melvindale
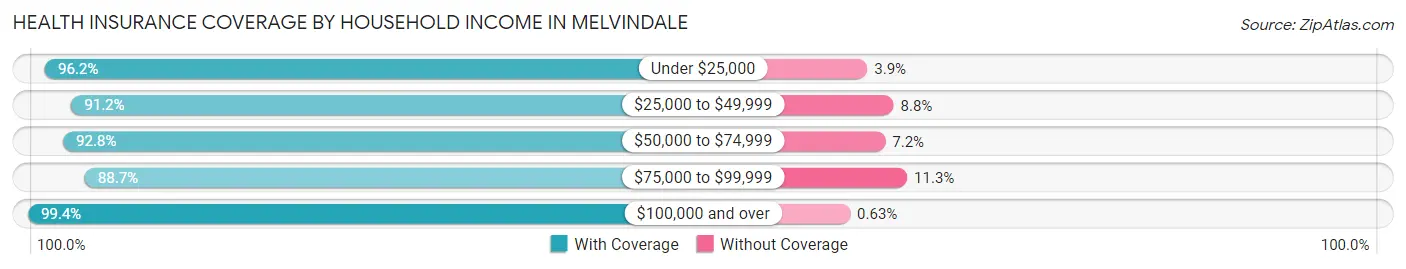
| Household Income | With Coverage | Without Coverage |
| Under $25,000 | 2,672 (96.2%) | 107 (3.8%) |
| $25,000 to $49,999 | 3,296 (91.2%) | 317 (8.8%) |
| $50,000 to $74,999 | 1,735 (92.8%) | 135 (7.2%) |
| $75,000 to $99,999 | 1,208 (88.7%) | 154 (11.3%) |
| $100,000 and over | 2,996 (99.4%) | 19 (0.6%) |
Public vs Private Health Insurance Coverage by Age in Melvindale
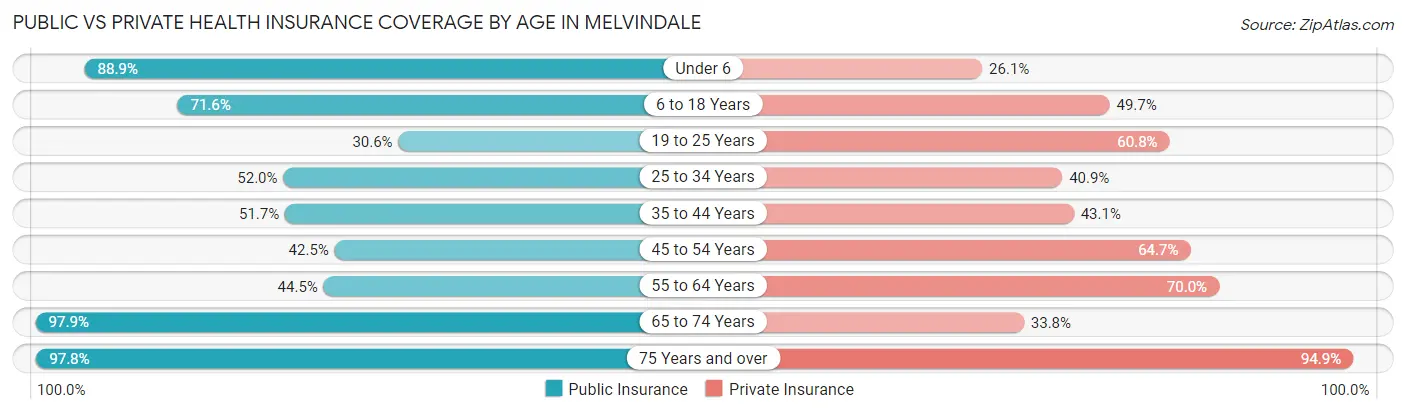
| Age Bracket | Public Insurance | Private Insurance |
| Under 6 | 1,163 (88.8%) | 341 (26.1%) |
| 6 to 18 Years | 1,903 (71.6%) | 1,321 (49.7%) |
| 19 to 25 Years | 374 (30.6%) | 743 (60.8%) |
| 25 to 34 Years | 686 (52.0%) | 540 (40.9%) |
| 35 to 44 Years | 966 (51.7%) | 805 (43.0%) |
| 45 to 54 Years | 531 (42.4%) | 809 (64.7%) |
| 55 to 64 Years | 771 (44.5%) | 1,213 (70.0%) |
| 65 to 74 Years | 713 (97.9%) | 246 (33.8%) |
| 75 Years and over | 536 (97.8%) | 520 (94.9%) |
| Total | 7,643 (60.5%) | 6,538 (51.7%) |
Disability Status by Sex by Age in Melvindale
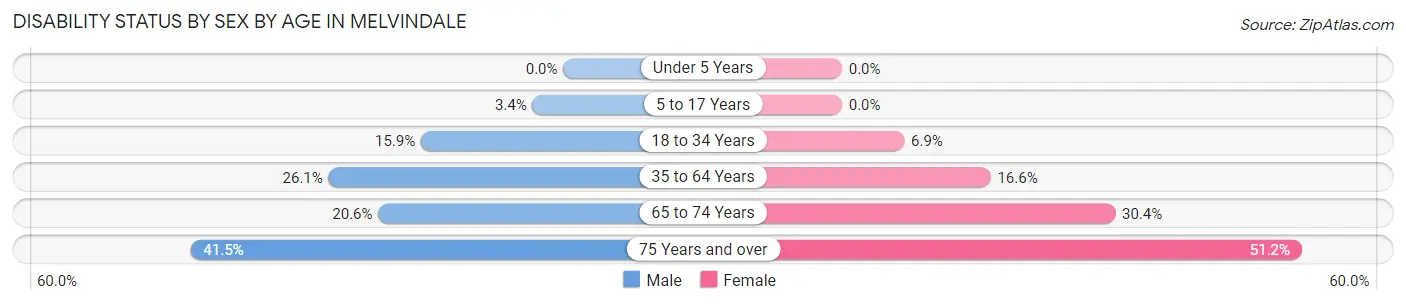
| Age Bracket | Male | Female |
| Under 5 Years | 0 (0.0%) | 0 (0.0%) |
| 5 to 17 Years | 51 (3.4%) | 0 (0.0%) |
| 18 to 34 Years | 236 (15.9%) | 91 (6.9%) |
| 35 to 64 Years | 759 (26.1%) | 323 (16.6%) |
| 65 to 74 Years | 62 (20.6%) | 130 (30.4%) |
| 75 Years and over | 76 (41.5%) | 187 (51.2%) |
Disability Class by Sex by Age in Melvindale
Disability Class: Hearing Difficulty
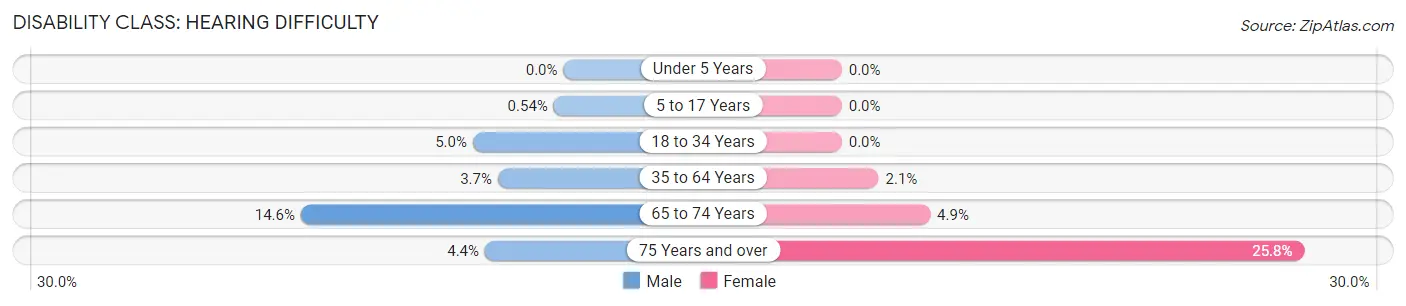
| Age Bracket | Male | Female |
| Under 5 Years | 0 (0.0%) | 0 (0.0%) |
| 5 to 17 Years | 8 (0.5%) | 0 (0.0%) |
| 18 to 34 Years | 75 (5.0%) | 0 (0.0%) |
| 35 to 64 Years | 106 (3.6%) | 40 (2.1%) |
| 65 to 74 Years | 44 (14.6%) | 21 (4.9%) |
| 75 Years and over | 8 (4.4%) | 94 (25.8%) |
Disability Class: Vision Difficulty
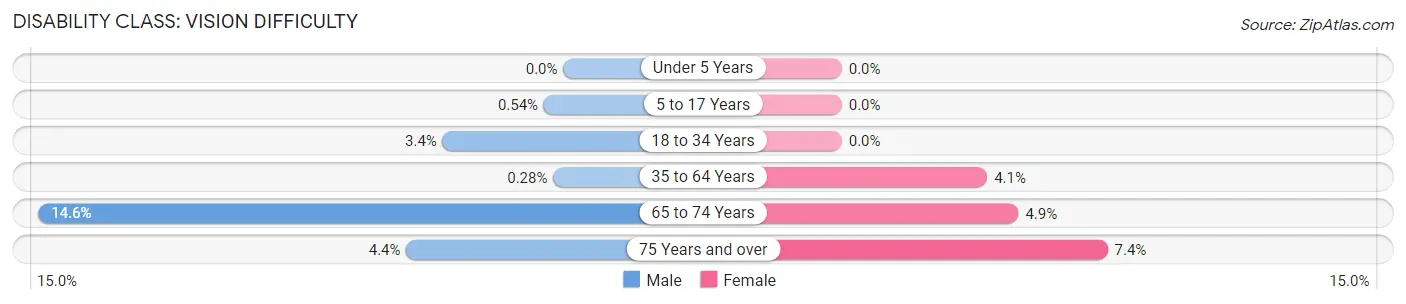
| Age Bracket | Male | Female |
| Under 5 Years | 0 (0.0%) | 0 (0.0%) |
| 5 to 17 Years | 8 (0.5%) | 0 (0.0%) |
| 18 to 34 Years | 50 (3.4%) | 0 (0.0%) |
| 35 to 64 Years | 8 (0.3%) | 79 (4.1%) |
| 65 to 74 Years | 44 (14.6%) | 21 (4.9%) |
| 75 Years and over | 8 (4.4%) | 27 (7.4%) |
Disability Class: Cognitive Difficulty
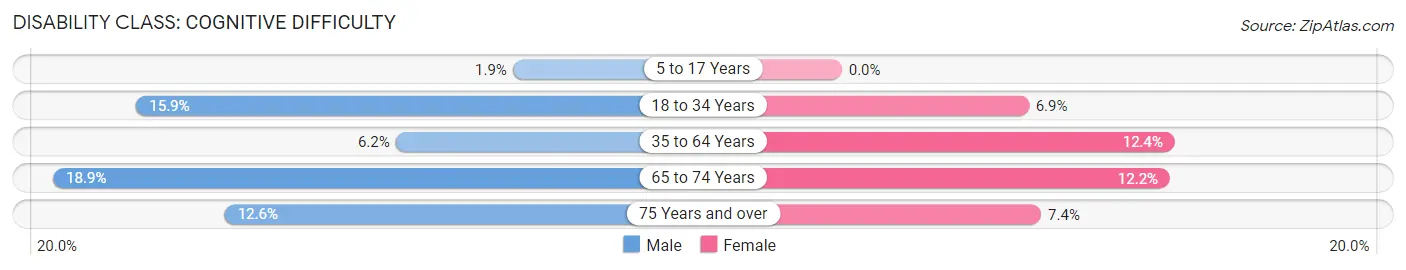
| Age Bracket | Male | Female |
| 5 to 17 Years | 28 (1.9%) | 0 (0.0%) |
| 18 to 34 Years | 236 (15.9%) | 91 (6.9%) |
| 35 to 64 Years | 181 (6.2%) | 241 (12.4%) |
| 65 to 74 Years | 57 (18.9%) | 52 (12.2%) |
| 75 Years and over | 23 (12.6%) | 27 (7.4%) |
Disability Class: Ambulatory Difficulty
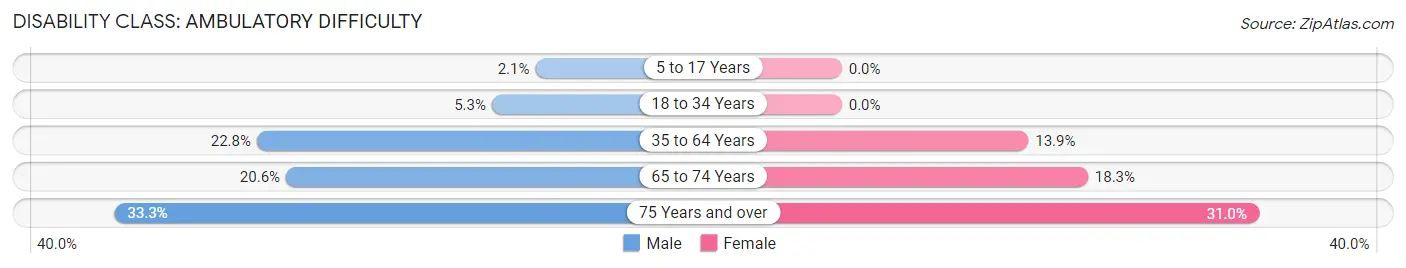
| Age Bracket | Male | Female |
| 5 to 17 Years | 31 (2.1%) | 0 (0.0%) |
| 18 to 34 Years | 79 (5.3%) | 0 (0.0%) |
| 35 to 64 Years | 661 (22.8%) | 270 (13.9%) |
| 65 to 74 Years | 62 (20.6%) | 78 (18.3%) |
| 75 Years and over | 61 (33.3%) | 113 (31.0%) |
Disability Class: Self-Care Difficulty
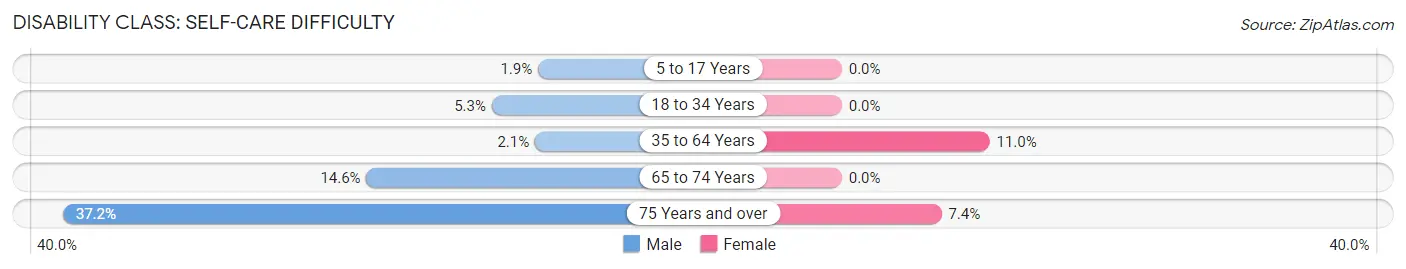
| Age Bracket | Male | Female |
| 5 to 17 Years | 28 (1.9%) | 0 (0.0%) |
| 18 to 34 Years | 79 (5.3%) | 0 (0.0%) |
| 35 to 64 Years | 61 (2.1%) | 214 (11.0%) |
| 65 to 74 Years | 44 (14.6%) | 0 (0.0%) |
| 75 Years and over | 68 (37.2%) | 27 (7.4%) |
Technology Access in Melvindale
Computing Device Access in Melvindale
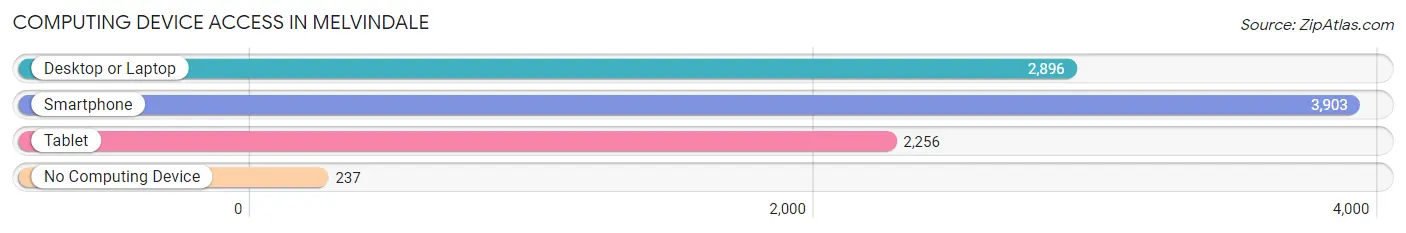
| Device Type | # Households | % Households |
| Desktop or Laptop | 2,896 | 65.7% |
| Smartphone | 3,903 | 88.6% |
| Tablet | 2,256 | 51.2% |
| No Computing Device | 237 | 5.4% |
| Total | 4,407 | 100.0% |
Internet Access in Melvindale
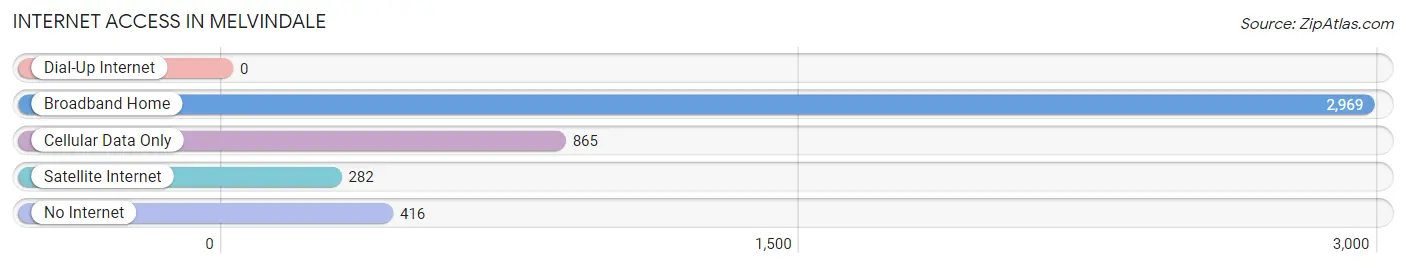
| Internet Type | # Households | % Households |
| Dial-Up Internet | 0 | 0.0% |
| Broadband Home | 2,969 | 67.4% |
| Cellular Data Only | 865 | 19.6% |
| Satellite Internet | 282 | 6.4% |
| No Internet | 416 | 9.4% |
| Total | 4,407 | 100.0% |
Melvindale Summary
Melvindale, Michigan is a small city located in Wayne County, Michigan, just south of Detroit. The city is home to approximately 8,000 people and is part of the Downriver area of Wayne County. The city is known for its strong sense of community and its diverse population.
History
The area that is now Melvindale was first settled in the early 1800s by French-Canadian fur traders. The area was known as “Moulin Rouge”, or “Red Mill”, due to the red clay soil in the area. In 1837, the area was officially incorporated as the village of Melvindale. The name was derived from the first two letters of the names of the two original settlers, Melville and D’Aigle.
In the late 1800s, the area began to experience rapid growth due to the industrialization of Detroit. The city was home to several factories, including the Ford Motor Company, which opened a plant in Melvindale in 1915. The city also became home to many immigrants from Europe, particularly from Poland and Italy.
In the 1950s, the city experienced a population boom as many people moved to the area from Detroit. The city was officially incorporated as a city in 1957.
Geography
Melvindale is located in Wayne County, Michigan, just south of Detroit. The city is bordered by Allen Park to the north, Dearborn Heights to the east, Lincoln Park to the south, and Detroit to the west. The city covers an area of approximately 3.5 square miles and is located at an elevation of 602 feet.
The city is located on the banks of the Ecorse River, which flows through the city and into the Detroit River. The city is also home to several parks, including the Melvindale Community Park, which features a playground, picnic area, and walking trails.
Economy
The economy of Melvindale is largely based on manufacturing and retail. The city is home to several factories, including the Ford Motor Company, which opened a plant in Melvindale in 1915. The city is also home to several retail stores, including a Walmart Supercenter, a Target, and a Meijer.
The city is also home to several small businesses, including restaurants, bars, and other retail stores. The city is also home to several medical facilities, including the Melvindale Medical Center and the Melvindale Dental Center.
Demographics
As of the 2010 census, the population of Melvindale was 8,074. The racial makeup of the city was 79.2% White, 14.2% African American, 0.4% Native American, 1.2% Asian, and 4.9% from other races. Hispanic or Latino of any race were 6.3% of the population.
The median household income in Melvindale was $37,917, and the median family income was $45,917. The per capita income for the city was $19,917. About 16.2% of families and 19.2% of the population were below the poverty line, including 28.2% of those under age 18 and 8.2% of those age 65 or over.
Melvindale is a diverse city with a strong sense of community. The city is home to a variety of businesses and industries, and is a great place to live and work. The city is also home to several parks and recreational facilities, making it a great place to raise a family.
Common Questions
What is Per Capita Income in Melvindale?
Per Capita income in Melvindale is $20,981.
What is the Median Family Income in Melvindale?
Median Family Income in Melvindale is $49,760.
What is the Median Household income in Melvindale?
Median Household Income in Melvindale is $38,918.
What is Income or Wage Gap in Melvindale?
Income or Wage Gap in Melvindale is 21.2%.
Women in Melvindale earn 78.8 cents for every dollar earned by a man.
What is Inequality or Gini Index in Melvindale?
Inequality or Gini Index in Melvindale is 0.47.
What is the Total Population of Melvindale?
Total Population of Melvindale is 12,639.
What is the Total Male Population of Melvindale?
Total Male Population of Melvindale is 6,919.
What is the Total Female Population of Melvindale?
Total Female Population of Melvindale is 5,720.
What is the Ratio of Males per 100 Females in Melvindale?
There are 120.96 Males per 100 Females in Melvindale.
What is the Ratio of Females per 100 Males in Melvindale?
There are 82.67 Females per 100 Males in Melvindale.
What is the Median Population Age in Melvindale?
Median Population Age in Melvindale is 33.6 Years.
What is the Average Family Size in Melvindale
Average Family Size in Melvindale is 4.1 People.
What is the Average Household Size in Melvindale
Average Household Size in Melvindale is 2.9 People.
How Large is the Labor Force in Melvindale?
There are 5,371 People in the Labor Forcein in Melvindale.
What is the Percentage of People in the Labor Force in Melvindale?
57.3% of People are in the Labor Force in Melvindale.
What is the Unemployment Rate in Melvindale?
Unemployment Rate in Melvindale is 11.2%.