Windermere, FL Map & Demographics
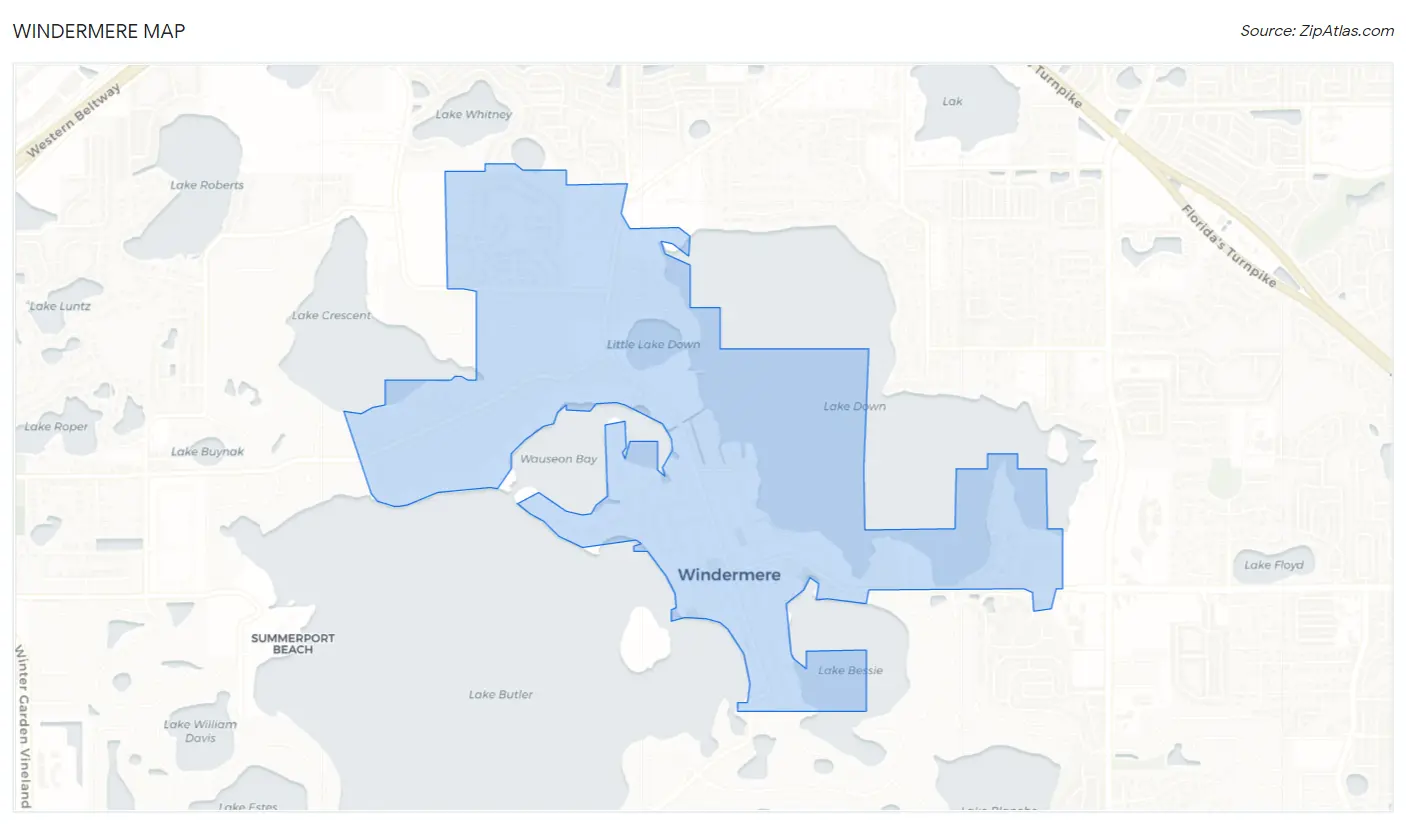
Windermere Map
Windermere Overview
$94,687
PER CAPITA INCOME
$177,500
AVG FAMILY INCOME
$143,988
AVG HOUSEHOLD INCOME
48.5%
WAGE / INCOME GAP [ % ]
51.5¢/ $1
WAGE / INCOME GAP [ $ ]
$14,071
FAMILY INCOME DEFICIT
0.53
INEQUALITY / GINI INDEX
3,043
TOTAL POPULATION
1,555
MALE POPULATION
1,488
FEMALE POPULATION
104.50
MALES / 100 FEMALES
95.69
FEMALES / 100 MALES
52.7
MEDIAN AGE
2.9
AVG FAMILY SIZE
2.5
AVG HOUSEHOLD SIZE
1,494
LABOR FORCE [ PEOPLE ]
57.4%
PERCENT IN LABOR FORCE
2.1%
UNEMPLOYMENT RATE
Windermere Zip Codes
Windermere Area Codes
Income in Windermere
Income Overview in Windermere
Per Capita Income in Windermere is $94,687, while median incomes of families and households are $177,500 and $143,988 respectively.
| Characteristic | Number | Measure |
| Per Capita Income | 3,043 | $94,687 |
| Median Family Income | 914 | $177,500 |
| Mean Family Income | 914 | $297,523 |
| Median Household Income | 1,217 | $143,988 |
| Mean Household Income | 1,217 | $254,712 |
| Income Deficit | 914 | $14,071 |
| Wage / Income Gap (%) | 3,043 | 48.53% |
| Wage / Income Gap ($) | 3,043 | 51.47¢ per $1 |
| Gini / Inequality Index | 3,043 | 0.53 |
Earnings by Sex in Windermere
Average Earnings in Windermere are $75,714, $98,188 for men and $50,536 for women, a difference of 48.5%.
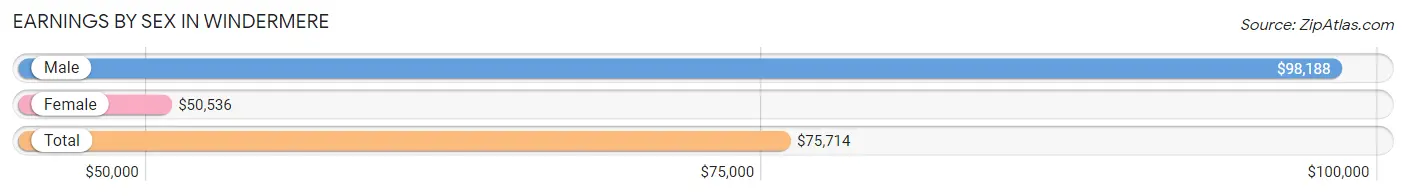
| Sex | Number | Average Earnings |
| Male | 976 (61.4%) | $98,188 |
| Female | 614 (38.6%) | $50,536 |
| Total | 1,590 (100.0%) | $75,714 |
Earnings by Sex by Income Bracket in Windermere
The most common earnings brackets in Windermere are $100,000+ for men (459 | 47.0%) and $100,000+ for women (216 | 35.2%).
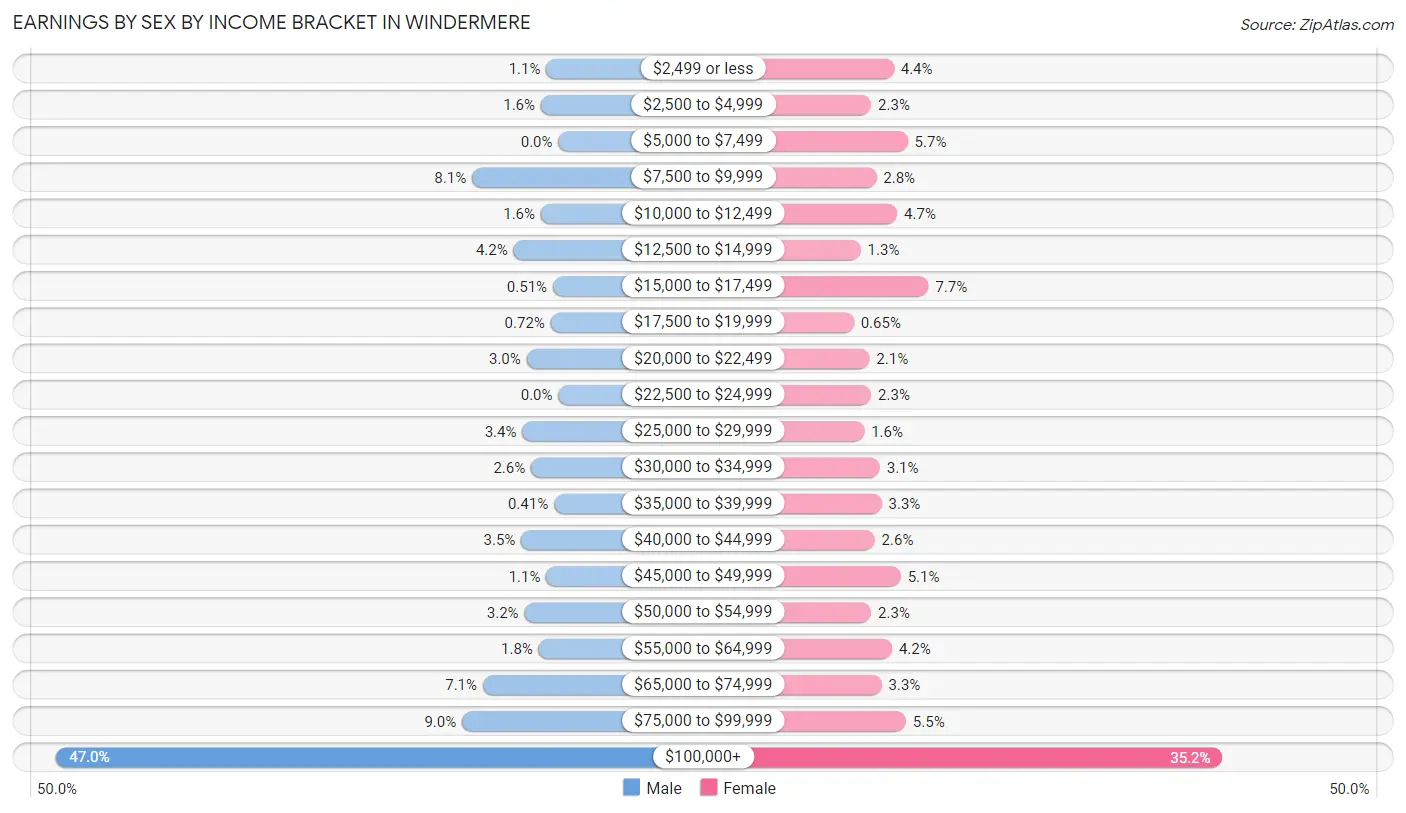
| Income | Male | Female |
| $2,499 or less | 11 (1.1%) | 27 (4.4%) |
| $2,500 to $4,999 | 16 (1.6%) | 14 (2.3%) |
| $5,000 to $7,499 | 0 (0.0%) | 35 (5.7%) |
| $7,500 to $9,999 | 79 (8.1%) | 17 (2.8%) |
| $10,000 to $12,499 | 16 (1.6%) | 29 (4.7%) |
| $12,500 to $14,999 | 41 (4.2%) | 8 (1.3%) |
| $15,000 to $17,499 | 5 (0.5%) | 47 (7.6%) |
| $17,500 to $19,999 | 7 (0.7%) | 4 (0.6%) |
| $20,000 to $22,499 | 29 (3.0%) | 13 (2.1%) |
| $22,500 to $24,999 | 0 (0.0%) | 14 (2.3%) |
| $25,000 to $29,999 | 33 (3.4%) | 10 (1.6%) |
| $30,000 to $34,999 | 25 (2.6%) | 19 (3.1%) |
| $35,000 to $39,999 | 4 (0.4%) | 20 (3.3%) |
| $40,000 to $44,999 | 34 (3.5%) | 16 (2.6%) |
| $45,000 to $49,999 | 11 (1.1%) | 31 (5.1%) |
| $50,000 to $54,999 | 31 (3.2%) | 14 (2.3%) |
| $55,000 to $64,999 | 18 (1.8%) | 26 (4.2%) |
| $65,000 to $74,999 | 69 (7.1%) | 20 (3.3%) |
| $75,000 to $99,999 | 88 (9.0%) | 34 (5.5%) |
| $100,000+ | 459 (47.0%) | 216 (35.2%) |
| Total | 976 (100.0%) | 614 (100.0%) |
Earnings by Sex by Educational Attainment in Windermere
Average earnings in Windermere are $105,350 for men and $71,406 for women, a difference of 32.2%. Men with an educational attainment of graduate degree enjoy the highest average annual earnings of $163,452, while those with college or associate's degree education earn the least with $88,472. Women with an educational attainment of graduate degree earn the most with the average annual earnings of $123,611, while those with college or associate's degree education have the smallest earnings of $28,036.
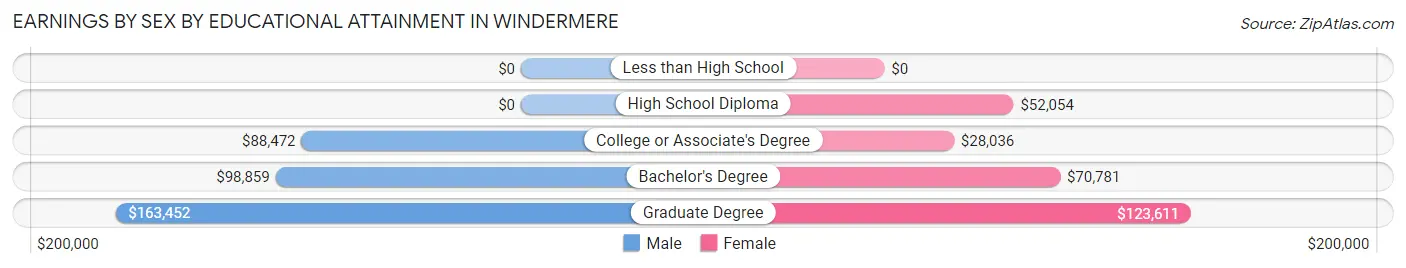
| Educational Attainment | Male Income | Female Income |
| Less than High School | - | - |
| High School Diploma | - | - |
| College or Associate's Degree | $88,472 | $28,036 |
| Bachelor's Degree | $98,859 | $70,781 |
| Graduate Degree | $163,452 | $123,611 |
| Total | $105,350 | $71,406 |
Family Income in Windermere
Family Income Brackets in Windermere
According to the Windermere family income data, there are 417 families falling into the $200,000+ income range, which is the most common income bracket and makes up 45.6% of all families.
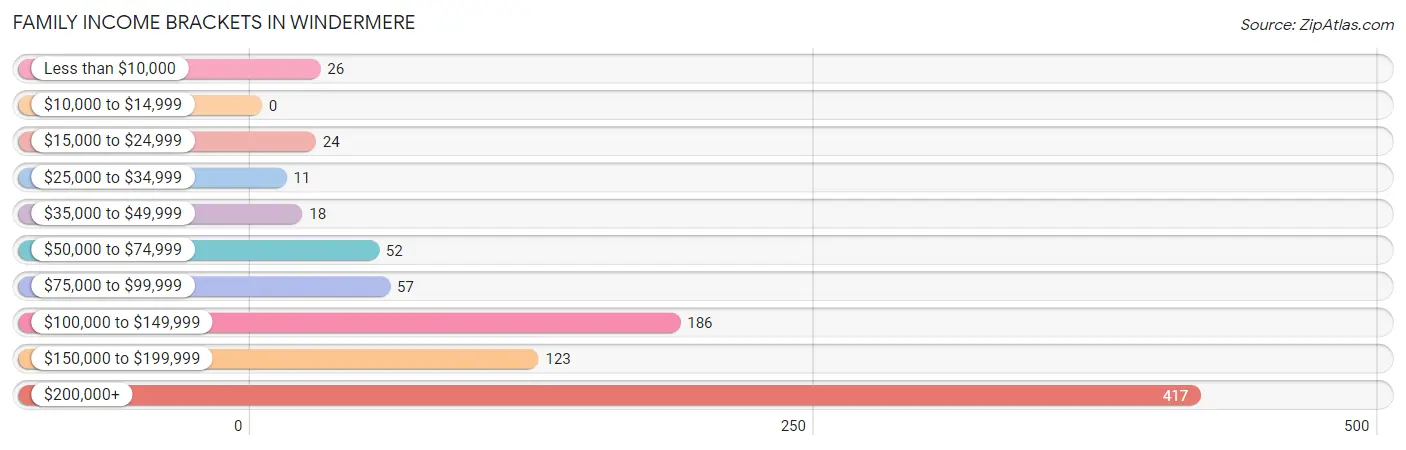
| Income Bracket | # Families | % Families |
| Less than $10,000 | 26 | 2.8% |
| $10,000 to $14,999 | 0 | 0.0% |
| $15,000 to $24,999 | 24 | 2.6% |
| $25,000 to $34,999 | 11 | 1.2% |
| $35,000 to $49,999 | 18 | 2.0% |
| $50,000 to $74,999 | 52 | 5.7% |
| $75,000 to $99,999 | 57 | 6.2% |
| $100,000 to $149,999 | 186 | 20.4% |
| $150,000 to $199,999 | 123 | 13.5% |
| $200,000+ | 417 | 45.6% |
Family Income by Famaliy Size in Windermere
5-person families (105 | 11.5%) account for the highest median family income in Windermere with $250,001 per family, while 2-person families (400 | 43.8%) have the highest median income of $68,173 per family member.
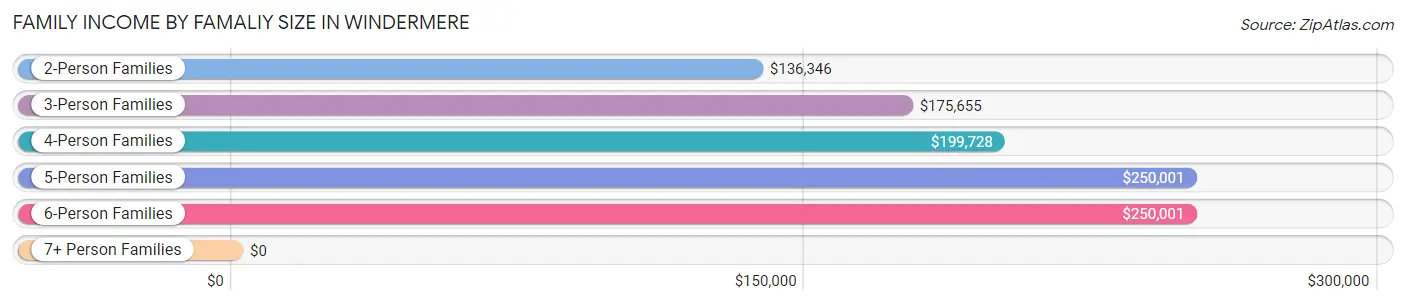
| Income Bracket | # Families | Median Income |
| 2-Person Families | 400 (43.8%) | $136,346 |
| 3-Person Families | 267 (29.2%) | $175,655 |
| 4-Person Families | 123 (13.5%) | $199,728 |
| 5-Person Families | 105 (11.5%) | $250,001 |
| 6-Person Families | 19 (2.1%) | $250,001 |
| 7+ Person Families | 0 (0.0%) | $0 |
| Total | 914 (100.0%) | $177,500 |
Family Income by Number of Earners in Windermere
The median family income in Windermere is $177,500, with families comprising 2 earners (310) having the highest median family income of $250,001, while families with no earners (153) have the lowest median family income of $112,750, accounting for 33.9% and 16.7% of families, respectively.
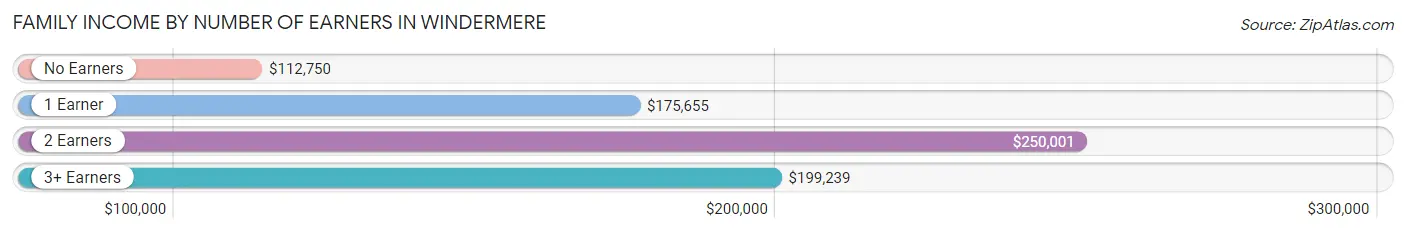
| Number of Earners | # Families | Median Income |
| No Earners | 153 (16.7%) | $112,750 |
| 1 Earner | 291 (31.8%) | $175,655 |
| 2 Earners | 310 (33.9%) | $250,001 |
| 3+ Earners | 160 (17.5%) | $199,239 |
| Total | 914 (100.0%) | $177,500 |
Household Income in Windermere
Household Income Brackets in Windermere
With 465 households falling in the category, the $200,000+ income range is the most frequent in Windermere, accounting for 38.2% of all households.
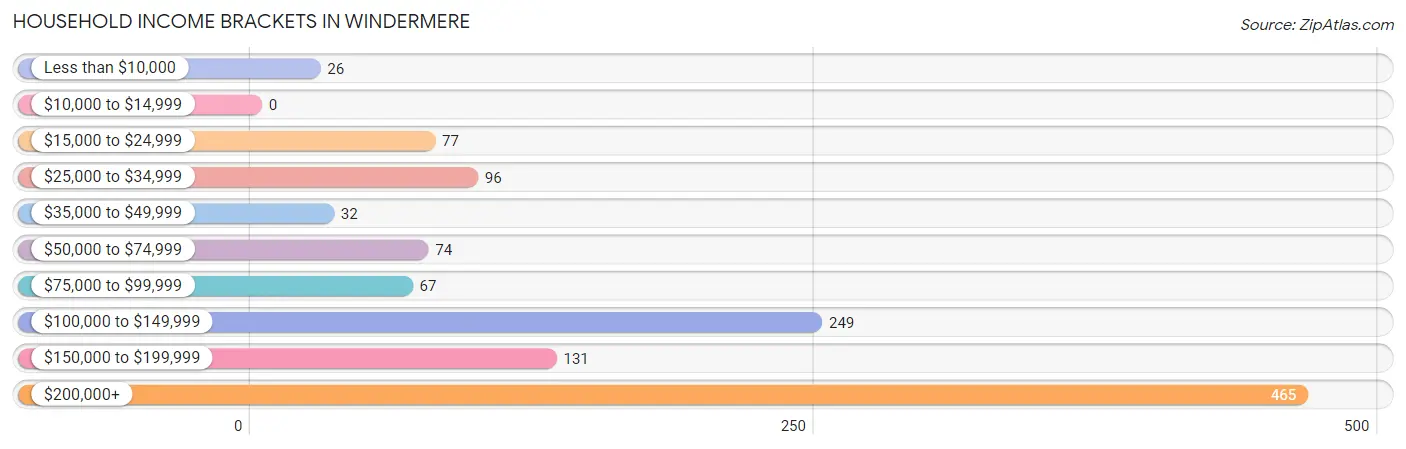
| Income Bracket | # Households | % Households |
| Less than $10,000 | 26 | 2.1% |
| $10,000 to $14,999 | 0 | 0.0% |
| $15,000 to $24,999 | 77 | 6.3% |
| $25,000 to $34,999 | 96 | 7.9% |
| $35,000 to $49,999 | 32 | 2.6% |
| $50,000 to $74,999 | 74 | 6.1% |
| $75,000 to $99,999 | 67 | 5.5% |
| $100,000 to $149,999 | 249 | 20.5% |
| $150,000 to $199,999 | 131 | 10.8% |
| $200,000+ | 465 | 38.2% |
Household Income by Householder Age in Windermere
The median household income in Windermere is $143,988, with the highest median household income of $250,001 found in the 25 to 44 years age bracket for the primary householder. A total of 177 households (14.5%) fall into this category. Meanwhile, the 15 to 24 years age bracket for the primary householder has the lowest median household income of $0, with 10 households (0.8%) in this group.
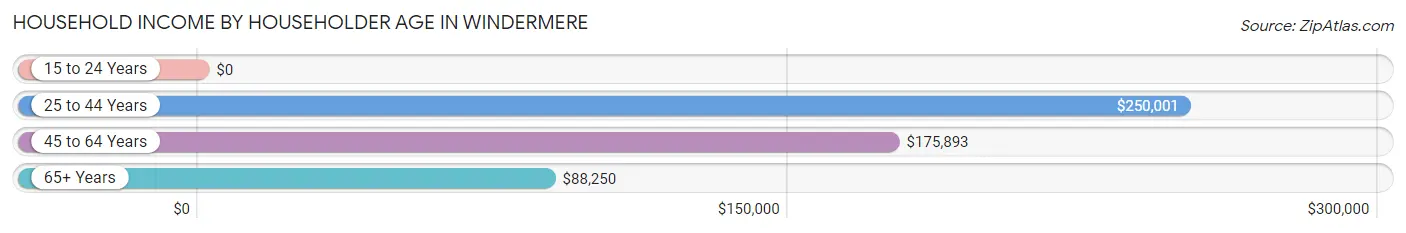
| Income Bracket | # Households | Median Income |
| 15 to 24 Years | 10 (0.8%) | $0 |
| 25 to 44 Years | 177 (14.5%) | $250,001 |
| 45 to 64 Years | 575 (47.2%) | $175,893 |
| 65+ Years | 455 (37.4%) | $88,250 |
| Total | 1,217 (100.0%) | $143,988 |
Poverty in Windermere
Income Below Poverty by Sex and Age in Windermere
With 3.5% poverty level for males and 3.2% for females among the residents of Windermere, 25 to 34 year old males and 18 to 24 year old females are the most vulnerable to poverty, with 11 males (11.5%) and 13 females (11.7%) in their respective age groups living below the poverty level.
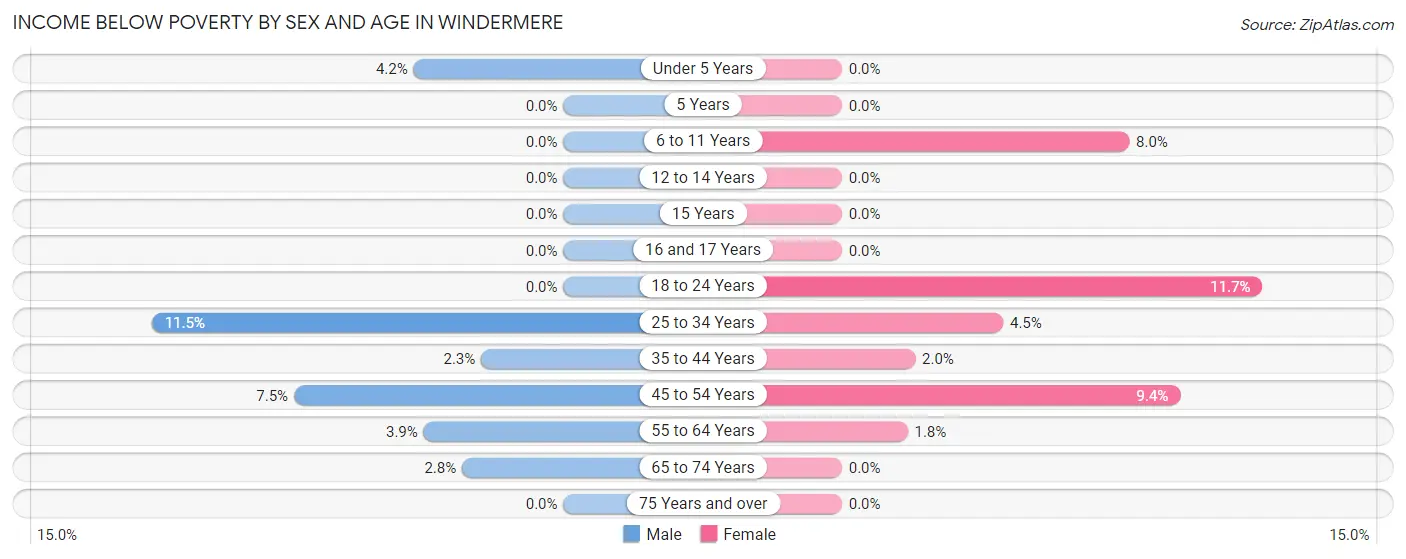
| Age Bracket | Male | Female |
| Under 5 Years | 4 (4.2%) | 0 (0.0%) |
| 5 Years | 0 (0.0%) | 0 (0.0%) |
| 6 to 11 Years | 0 (0.0%) | 4 (8.0%) |
| 12 to 14 Years | 0 (0.0%) | 0 (0.0%) |
| 15 Years | 0 (0.0%) | 0 (0.0%) |
| 16 and 17 Years | 0 (0.0%) | 0 (0.0%) |
| 18 to 24 Years | 0 (0.0%) | 13 (11.7%) |
| 25 to 34 Years | 11 (11.5%) | 4 (4.5%) |
| 35 to 44 Years | 3 (2.3%) | 3 (2.0%) |
| 45 to 54 Years | 18 (7.5%) | 18 (9.4%) |
| 55 to 64 Years | 13 (3.9%) | 5 (1.8%) |
| 65 to 74 Years | 5 (2.8%) | 0 (0.0%) |
| 75 Years and over | 0 (0.0%) | 0 (0.0%) |
| Total | 54 (3.5%) | 47 (3.2%) |
Income Above Poverty by Sex and Age in Windermere
According to the poverty statistics in Windermere, males aged 5 years and females aged under 5 years are the age groups that are most secure financially, with 100.0% of males and 100.0% of females in these age groups living above the poverty line.
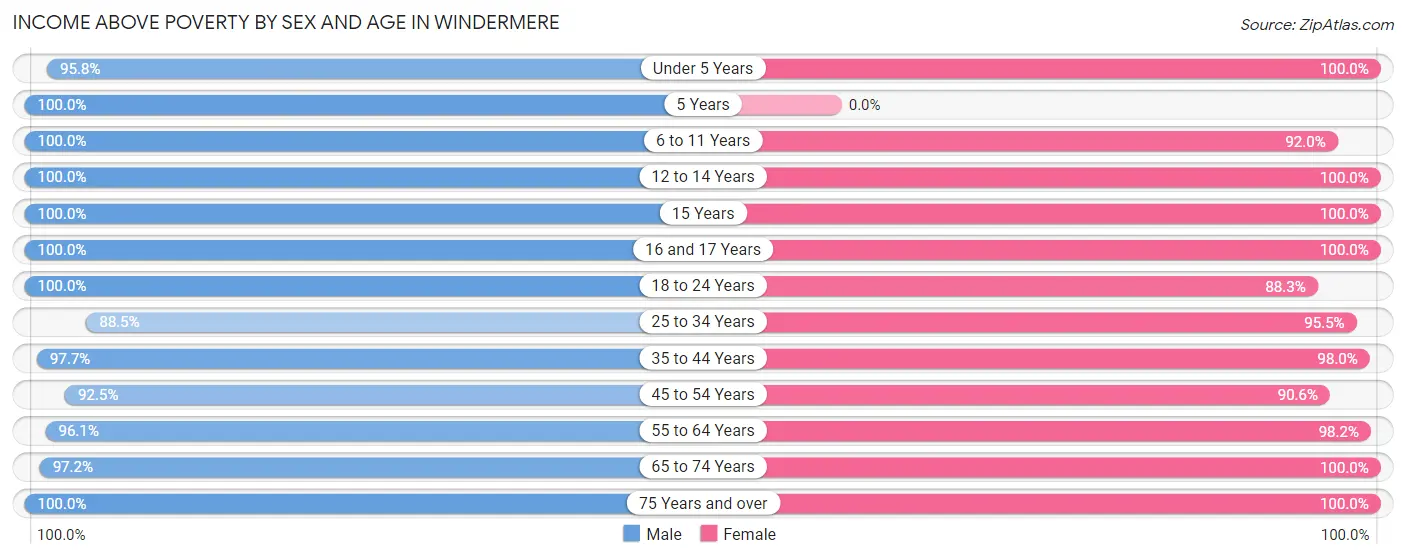
| Age Bracket | Male | Female |
| Under 5 Years | 92 (95.8%) | 43 (100.0%) |
| 5 Years | 15 (100.0%) | 0 (0.0%) |
| 6 to 11 Years | 66 (100.0%) | 46 (92.0%) |
| 12 to 14 Years | 44 (100.0%) | 76 (100.0%) |
| 15 Years | 25 (100.0%) | 26 (100.0%) |
| 16 and 17 Years | 19 (100.0%) | 25 (100.0%) |
| 18 to 24 Years | 180 (100.0%) | 98 (88.3%) |
| 25 to 34 Years | 85 (88.5%) | 85 (95.5%) |
| 35 to 44 Years | 128 (97.7%) | 144 (98.0%) |
| 45 to 54 Years | 222 (92.5%) | 173 (90.6%) |
| 55 to 64 Years | 321 (96.1%) | 268 (98.2%) |
| 65 to 74 Years | 172 (97.2%) | 300 (100.0%) |
| 75 Years and over | 132 (100.0%) | 157 (100.0%) |
| Total | 1,501 (96.5%) | 1,441 (96.8%) |
Income Below Poverty Among Married-Couple Families in Windermere
The poverty statistics for married-couple families in Windermere show that 3.6% or 31 of the total 851 families live below the poverty line. Families with no children have the highest poverty rate of 5.1%, comprising of 28 families. On the other hand, families with 3 or 4 children have the lowest poverty rate of 0.0%, which includes 0 families.
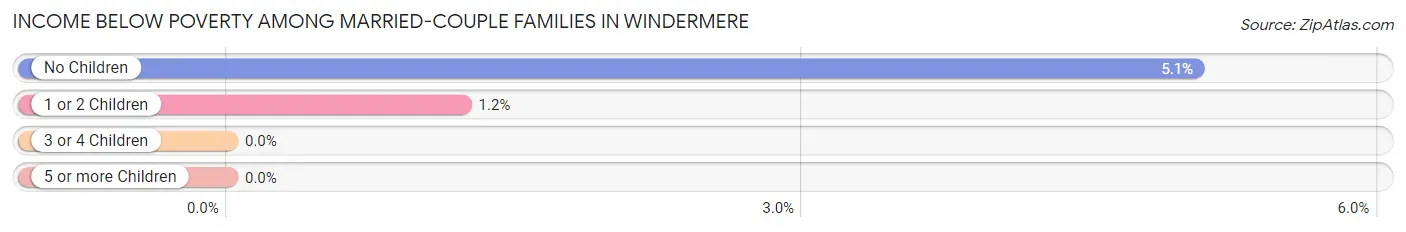
| Children | Above Poverty | Below Poverty |
| No Children | 526 (95.0%) | 28 (5.1%) |
| 1 or 2 Children | 243 (98.8%) | 3 (1.2%) |
| 3 or 4 Children | 51 (100.0%) | 0 (0.0%) |
| 5 or more Children | 0 (0.0%) | 0 (0.0%) |
| Total | 820 (96.4%) | 31 (3.6%) |
Income Below Poverty Among Single-Parent Households in Windermere
| Children | Single Father | Single Mother |
| No Children | 0 (0.0%) | 0 (0.0%) |
| 1 or 2 Children | 0 (0.0%) | 0 (0.0%) |
| 3 or 4 Children | 0 (0.0%) | 0 (0.0%) |
| 5 or more Children | 0 (0.0%) | 0 (0.0%) |
| Total | 0 (0.0%) | 0 (0.0%) |
Income Below Poverty Among Married-Couple vs Single-Parent Households in Windermere
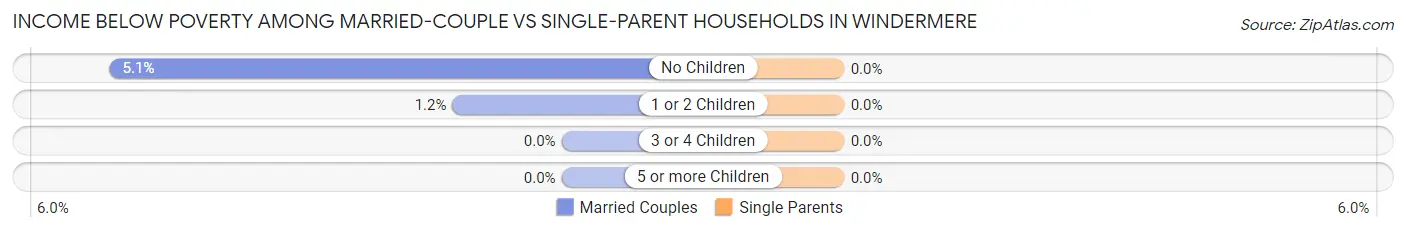
| Children | Married-Couple Families | Single-Parent Households |
| No Children | 28 (5.1%) | 0 (0.0%) |
| 1 or 2 Children | 3 (1.2%) | 0 (0.0%) |
| 3 or 4 Children | 0 (0.0%) | 0 (0.0%) |
| 5 or more Children | 0 (0.0%) | 0 (0.0%) |
| Total | 31 (3.6%) | 0 (0.0%) |
Race in Windermere
The most populous races in Windermere are White / Caucasian (2,552 | 83.9%), Hispanic or Latino (189 | 6.2%), and Two or more Races (183 | 6.0%).
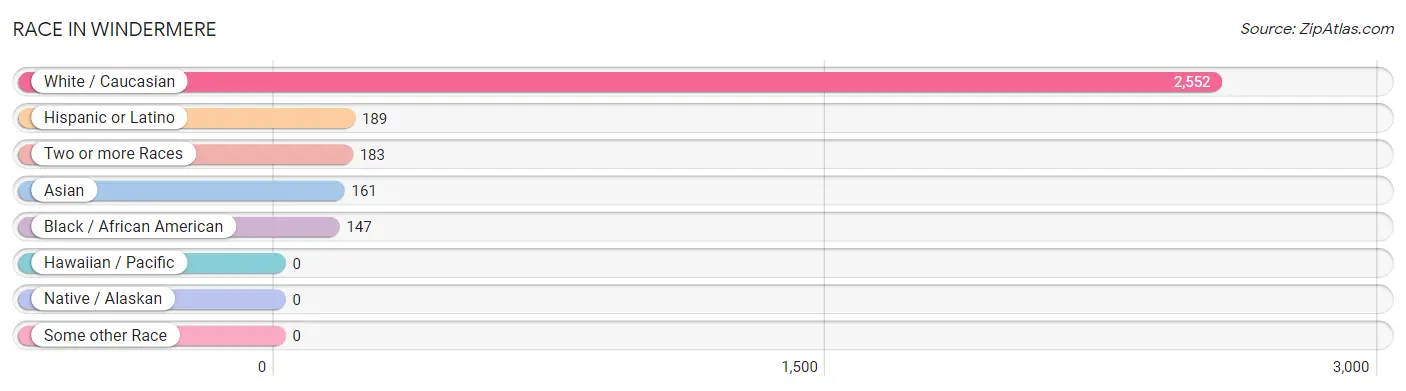
| Race | # Population | % Population |
| Asian | 161 | 5.3% |
| Black / African American | 147 | 4.8% |
| Hawaiian / Pacific | 0 | 0.0% |
| Hispanic or Latino | 189 | 6.2% |
| Native / Alaskan | 0 | 0.0% |
| White / Caucasian | 2,552 | 83.9% |
| Two or more Races | 183 | 6.0% |
| Some other Race | 0 | 0.0% |
| Total | 3,043 | 100.0% |
Ancestry in Windermere
The most populous ancestries reported in Windermere are English (613 | 20.1%), American (489 | 16.1%), German (488 | 16.0%), Irish (347 | 11.4%), and Italian (168 | 5.5%), together accounting for 69.2% of all Windermere residents.
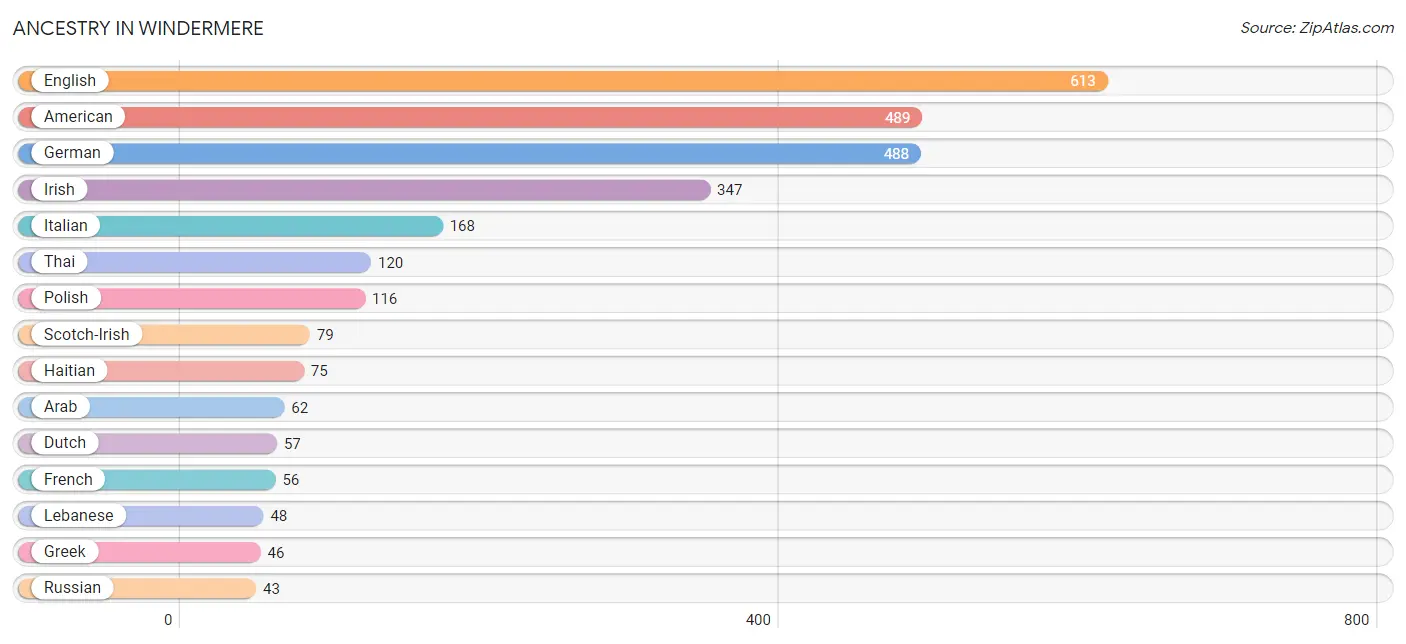
| Ancestry | # Population | % Population |
| American | 489 | 16.1% |
| Arab | 62 | 2.0% |
| Austrian | 15 | 0.5% |
| Brazilian | 3 | 0.1% |
| British | 23 | 0.8% |
| Burmese | 22 | 0.7% |
| Canadian | 13 | 0.4% |
| Central American | 7 | 0.2% |
| Cherokee | 9 | 0.3% |
| Chickasaw | 9 | 0.3% |
| Chilean | 9 | 0.3% |
| Colombian | 22 | 0.7% |
| Cuban | 3 | 0.1% |
| Czech | 7 | 0.2% |
| Danish | 7 | 0.2% |
| Dominican | 8 | 0.3% |
| Dutch | 57 | 1.9% |
| Eastern European | 24 | 0.8% |
| Egyptian | 2 | 0.1% |
| English | 613 | 20.1% |
| Estonian | 11 | 0.4% |
| European | 23 | 0.8% |
| Finnish | 7 | 0.2% |
| French | 56 | 1.8% |
| French Canadian | 11 | 0.4% |
| German | 488 | 16.0% |
| Greek | 46 | 1.5% |
| Haitian | 75 | 2.5% |
| Honduran | 7 | 0.2% |
| Hungarian | 25 | 0.8% |
| Indian (Asian) | 25 | 0.8% |
| Iranian | 16 | 0.5% |
| Irish | 347 | 11.4% |
| Italian | 168 | 5.5% |
| Lebanese | 48 | 1.6% |
| Maltese | 5 | 0.2% |
| Mexican | 36 | 1.2% |
| Northern European | 15 | 0.5% |
| Norwegian | 5 | 0.2% |
| Osage | 19 | 0.6% |
| Polish | 116 | 3.8% |
| Portuguese | 24 | 0.8% |
| Puerto Rican | 22 | 0.7% |
| Romanian | 7 | 0.2% |
| Russian | 43 | 1.4% |
| Scotch-Irish | 79 | 2.6% |
| Scottish | 41 | 1.3% |
| Slovak | 13 | 0.4% |
| South African | 15 | 0.5% |
| South American | 31 | 1.0% |
| Spaniard | 24 | 0.8% |
| Spanish | 43 | 1.4% |
| Spanish American | 5 | 0.2% |
| Subsaharan African | 15 | 0.5% |
| Swedish | 21 | 0.7% |
| Swiss | 4 | 0.1% |
| Thai | 120 | 3.9% |
| Ukrainian | 8 | 0.3% |
| Welsh | 33 | 1.1% | View All 59 Rows |
Immigrants in Windermere
The most numerous immigrant groups reported in Windermere came from Latin America (142 | 4.7%), Europe (137 | 4.5%), Asia (110 | 3.6%), Caribbean (95 | 3.1%), and Africa (83 | 2.7%), together accounting for 18.6% of all Windermere residents.
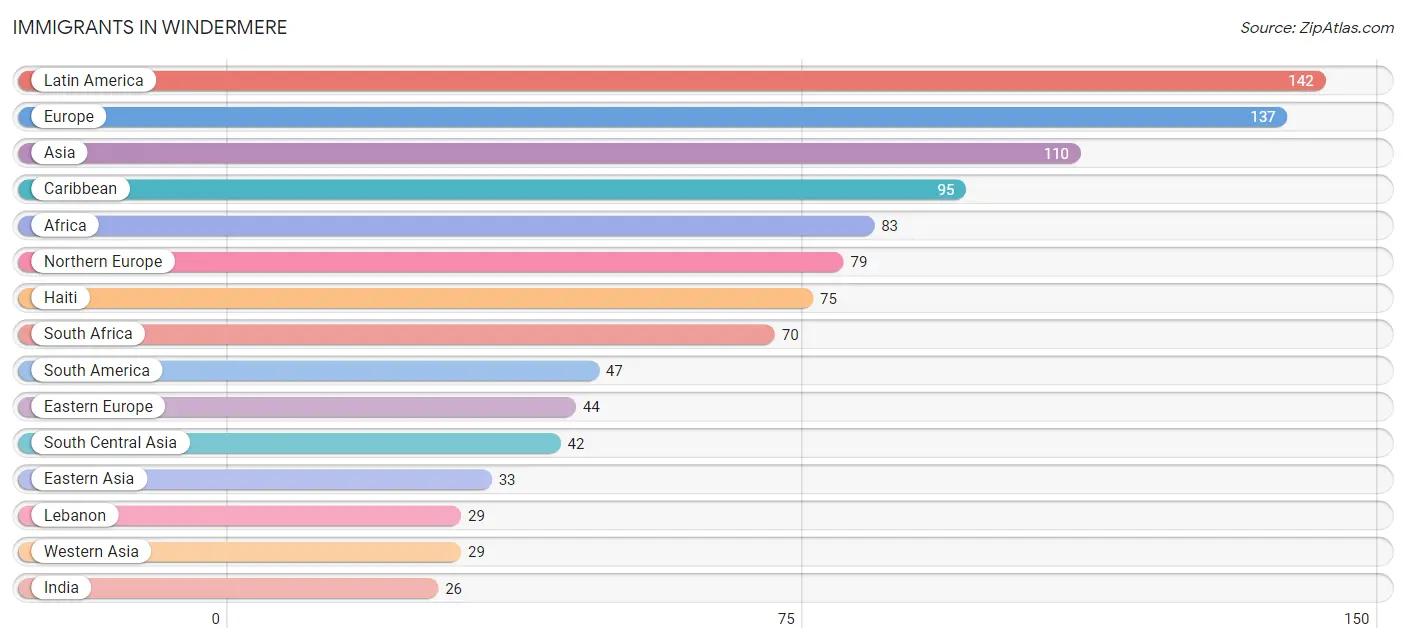
| Immigration Origin | # Population | % Population |
| Africa | 83 | 2.7% |
| Asia | 110 | 3.6% |
| Brazil | 25 | 0.8% |
| Canada | 17 | 0.6% |
| Caribbean | 95 | 3.1% |
| China | 25 | 0.8% |
| Colombia | 22 | 0.7% |
| Czechoslovakia | 4 | 0.1% |
| Denmark | 6 | 0.2% |
| Dominican Republic | 8 | 0.3% |
| Eastern Africa | 4 | 0.1% |
| Eastern Asia | 33 | 1.1% |
| Eastern Europe | 44 | 1.5% |
| England | 18 | 0.6% |
| Europe | 137 | 4.5% |
| France | 6 | 0.2% |
| Haiti | 75 | 2.5% |
| Hungary | 19 | 0.6% |
| India | 26 | 0.9% |
| Iran | 8 | 0.3% |
| Ireland | 21 | 0.7% |
| Jamaica | 12 | 0.4% |
| Korea | 8 | 0.3% |
| Latin America | 142 | 4.7% |
| Lebanon | 29 | 0.9% |
| Northern Africa | 9 | 0.3% |
| Northern Europe | 79 | 2.6% |
| Pakistan | 8 | 0.3% |
| Russia | 7 | 0.2% |
| South Africa | 70 | 2.3% |
| South America | 47 | 1.5% |
| South Central Asia | 42 | 1.4% |
| South Eastern Asia | 6 | 0.2% |
| Southern Europe | 8 | 0.3% |
| Spain | 8 | 0.3% |
| Ukraine | 3 | 0.1% |
| Vietnam | 6 | 0.2% |
| Western Asia | 29 | 0.9% |
| Western Europe | 6 | 0.2% |
| Zimbabwe | 4 | 0.1% | View All 40 Rows |
Sex and Age in Windermere
Sex and Age in Windermere
The most populous age groups in Windermere are 55 to 59 Years (175 | 11.3%) for men and 65 to 69 Years (180 | 12.1%) for women.
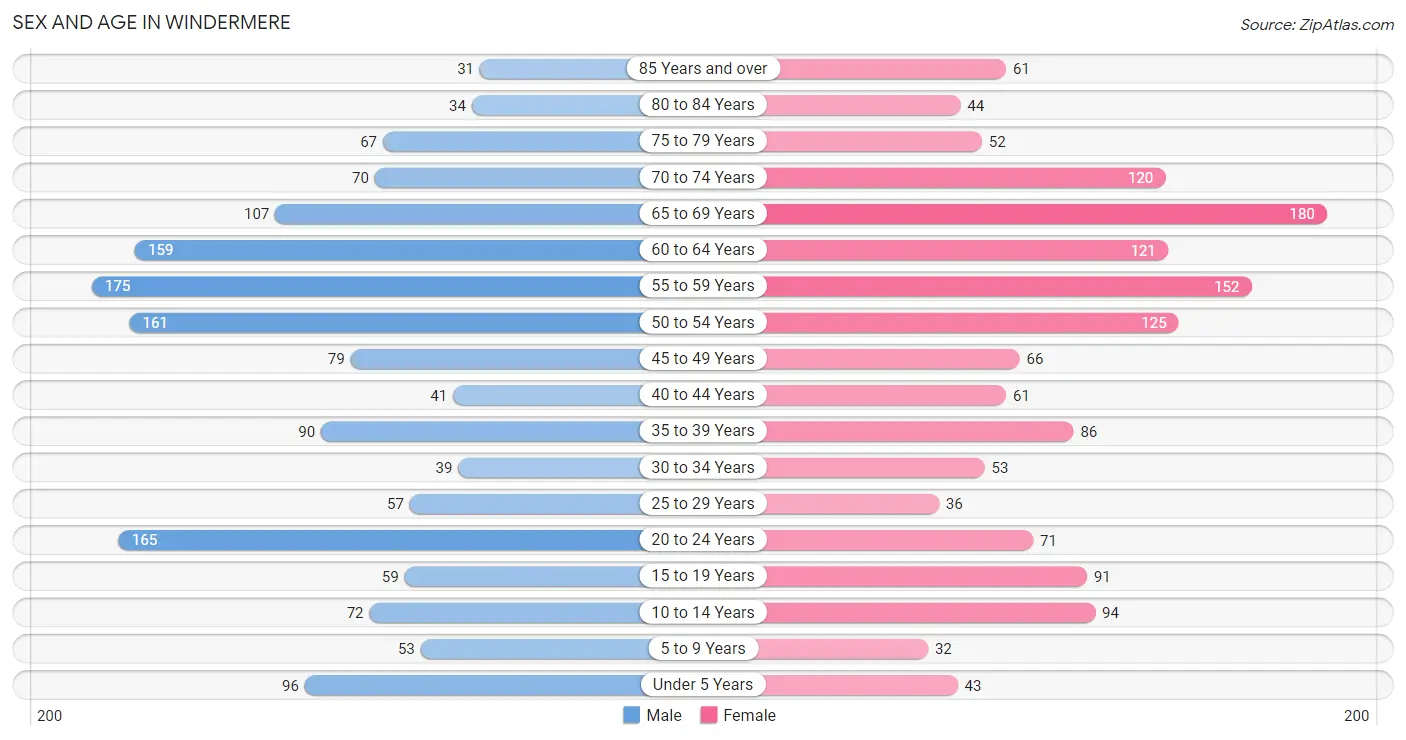
| Age Bracket | Male | Female |
| Under 5 Years | 96 (6.2%) | 43 (2.9%) |
| 5 to 9 Years | 53 (3.4%) | 32 (2.1%) |
| 10 to 14 Years | 72 (4.6%) | 94 (6.3%) |
| 15 to 19 Years | 59 (3.8%) | 91 (6.1%) |
| 20 to 24 Years | 165 (10.6%) | 71 (4.8%) |
| 25 to 29 Years | 57 (3.7%) | 36 (2.4%) |
| 30 to 34 Years | 39 (2.5%) | 53 (3.6%) |
| 35 to 39 Years | 90 (5.8%) | 86 (5.8%) |
| 40 to 44 Years | 41 (2.6%) | 61 (4.1%) |
| 45 to 49 Years | 79 (5.1%) | 66 (4.4%) |
| 50 to 54 Years | 161 (10.3%) | 125 (8.4%) |
| 55 to 59 Years | 175 (11.3%) | 152 (10.2%) |
| 60 to 64 Years | 159 (10.2%) | 121 (8.1%) |
| 65 to 69 Years | 107 (6.9%) | 180 (12.1%) |
| 70 to 74 Years | 70 (4.5%) | 120 (8.1%) |
| 75 to 79 Years | 67 (4.3%) | 52 (3.5%) |
| 80 to 84 Years | 34 (2.2%) | 44 (3.0%) |
| 85 Years and over | 31 (2.0%) | 61 (4.1%) |
| Total | 1,555 (100.0%) | 1,488 (100.0%) |
Families and Households in Windermere
Median Family Size in Windermere
The median family size in Windermere is 2.93 persons per family, with married-couple families (851 | 93.1%) accounting for the largest median family size of 2.97 persons per family. On the other hand, single female/mother families (38 | 4.2%) represent the smallest median family size with 2.34 persons per family.
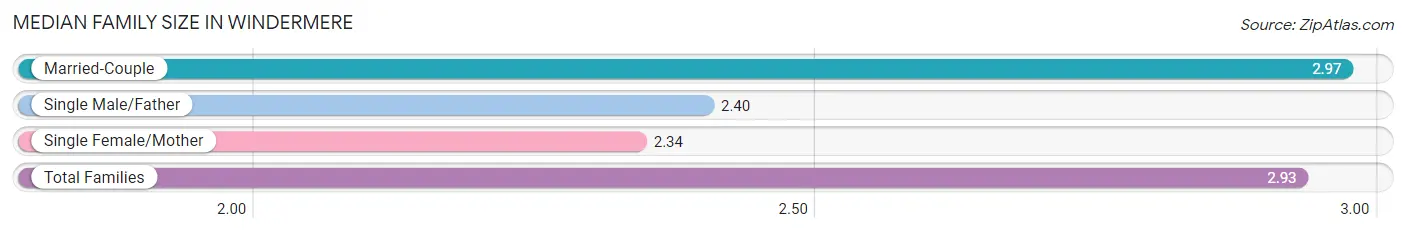
| Family Type | # Families | Family Size |
| Married-Couple | 851 (93.1%) | 2.97 |
| Single Male/Father | 25 (2.7%) | 2.40 |
| Single Female/Mother | 38 (4.2%) | 2.34 |
| Total Families | 914 (100.0%) | 2.93 |
Median Household Size in Windermere
The median household size in Windermere is 2.50 persons per household, with married-couple households (851 | 69.9%) accounting for the largest median household size of 2.98 persons per household. non-family households (303 | 24.9%) represent the smallest median household size with 1.13 persons per household.
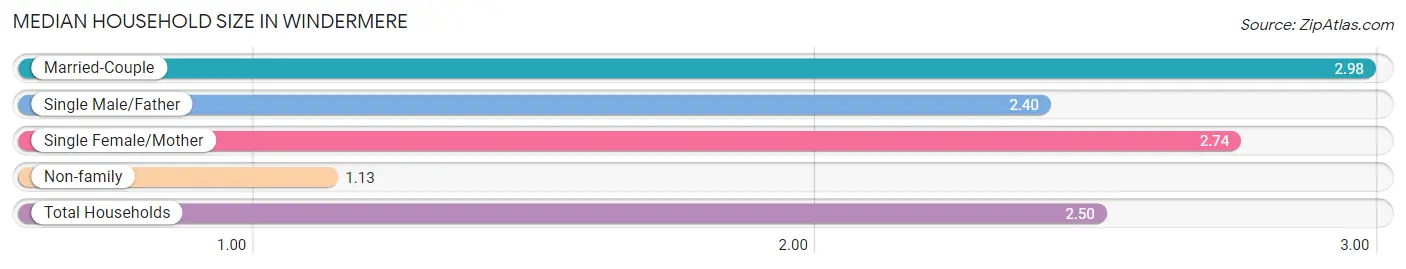
| Household Type | # Households | Household Size |
| Married-Couple | 851 (69.9%) | 2.98 |
| Single Male/Father | 25 (2.1%) | 2.40 |
| Single Female/Mother | 38 (3.1%) | 2.74 |
| Non-family | 303 (24.9%) | 1.13 |
| Total Households | 1,217 (100.0%) | 2.50 |
Household Size by Marriage Status in Windermere
Out of a total of 1,217 households in Windermere, 914 (75.1%) are family households, while 303 (24.9%) are nonfamily households. The most numerous type of family households are 2-person households, comprising 385, and the most common type of nonfamily households are 1-person households, comprising 264.
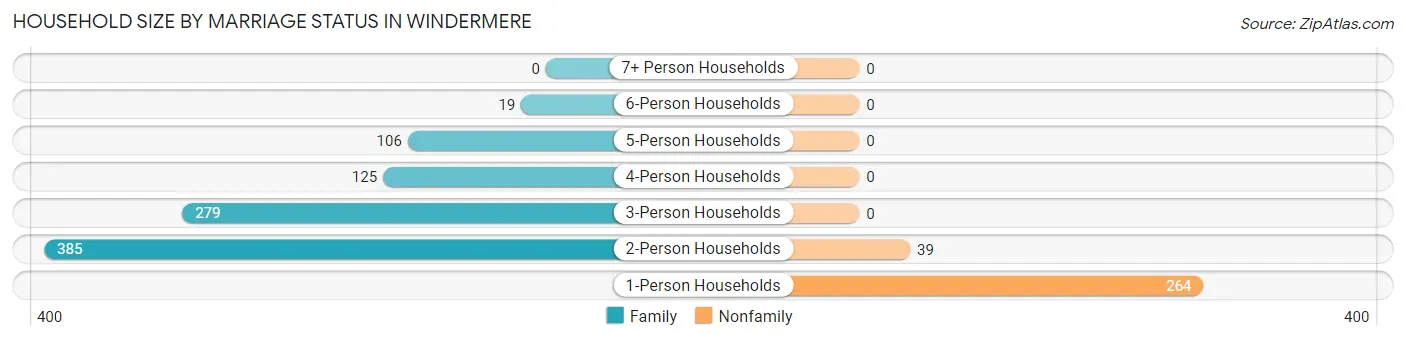
| Household Size | Family Households | Nonfamily Households |
| 1-Person Households | - | 264 (21.7%) |
| 2-Person Households | 385 (31.6%) | 39 (3.2%) |
| 3-Person Households | 279 (22.9%) | 0 (0.0%) |
| 4-Person Households | 125 (10.3%) | 0 (0.0%) |
| 5-Person Households | 106 (8.7%) | 0 (0.0%) |
| 6-Person Households | 19 (1.6%) | 0 (0.0%) |
| 7+ Person Households | 0 (0.0%) | 0 (0.0%) |
| Total | 914 (75.1%) | 303 (24.9%) |
Female Fertility in Windermere
Fertility by Age in Windermere
Average fertility rate in Windermere is 95.0 births per 1,000 women. Women in the age bracket of 35 to 50 years have the highest fertility rate with 128.0 births per 1,000 women. Women in the age bracket of 35 to 50 years acount for 65.2% of all women with births.
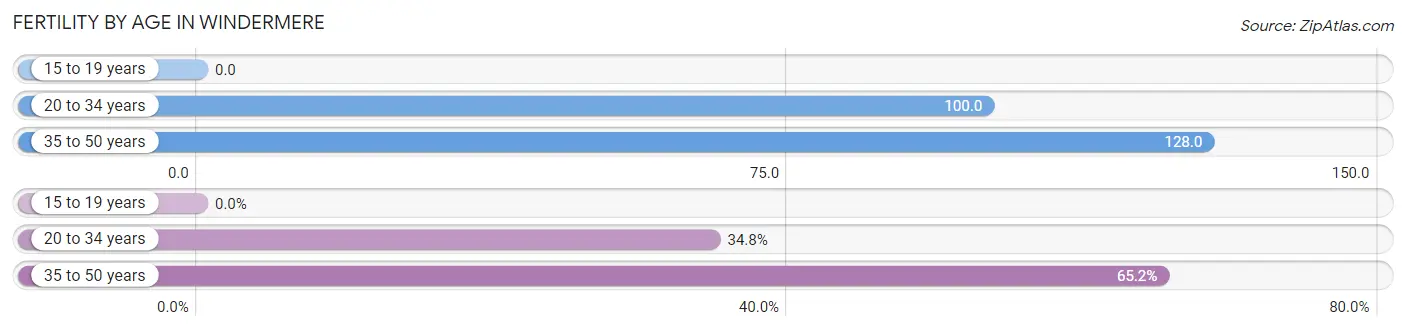
| Age Bracket | Women with Births | Births / 1,000 Women |
| 15 to 19 years | 0 (0.0%) | 0.0 |
| 20 to 34 years | 16 (34.8%) | 100.0 |
| 35 to 50 years | 30 (65.2%) | 128.0 |
| Total | 46 (100.0%) | 95.0 |
Fertility by Age by Marriage Status in Windermere
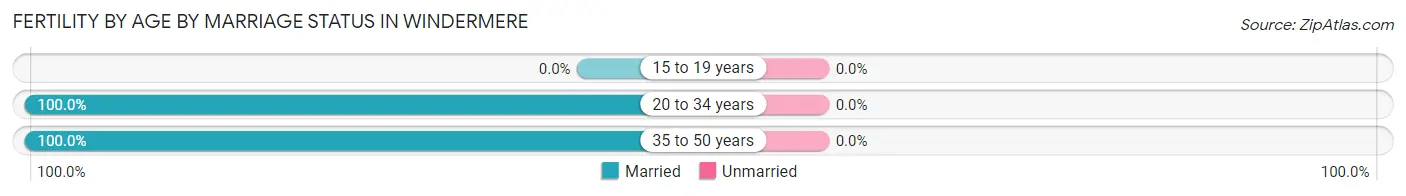
| Age Bracket | Married | Unmarried |
| 15 to 19 years | 0 (0.0%) | 0 (0.0%) |
| 20 to 34 years | 16 (100.0%) | 0 (0.0%) |
| 35 to 50 years | 30 (100.0%) | 0 (0.0%) |
| Total | 46 (100.0%) | 0 (0.0%) |
Fertility by Education in Windermere
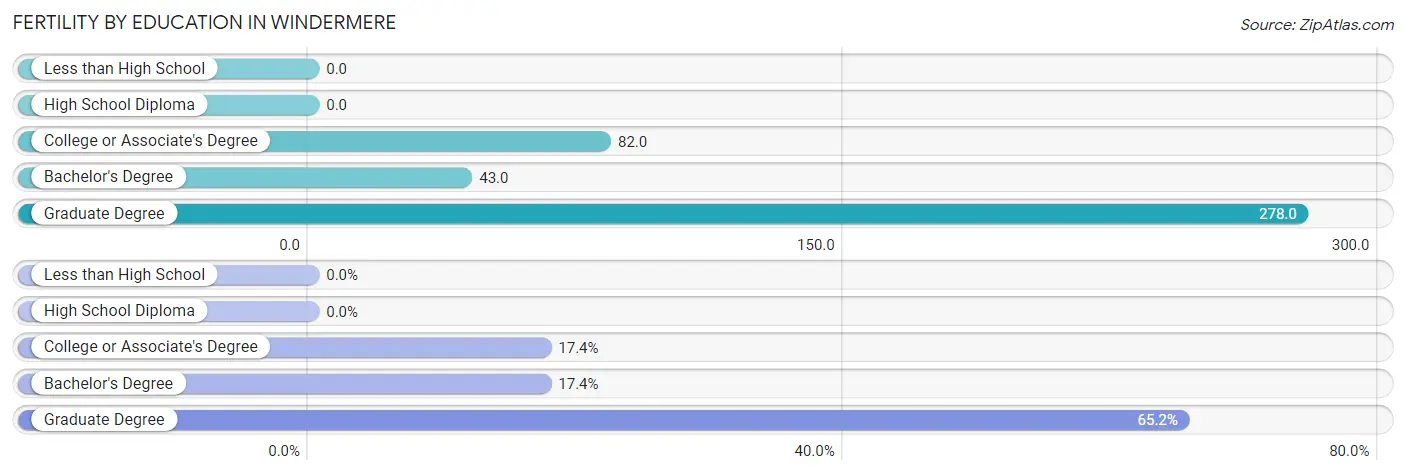
| Educational Attainment | Women with Births | Births / 1,000 Women |
| Less than High School | 0 (0.0%) | 0.0 |
| High School Diploma | 0 (0.0%) | 0.0 |
| College or Associate's Degree | 8 (17.4%) | 82.0 |
| Bachelor's Degree | 8 (17.4%) | 43.0 |
| Graduate Degree | 30 (65.2%) | 278.0 |
| Total | 46 (100.0%) | 95.0 |
Fertility by Education by Marriage Status in Windermere
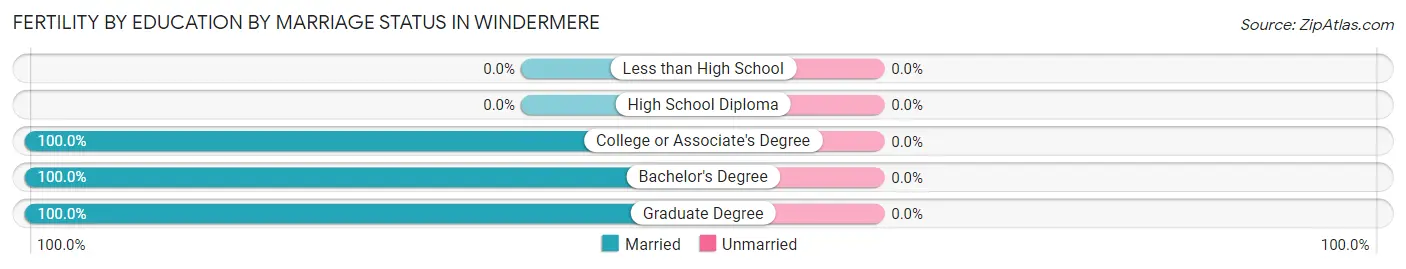
| Educational Attainment | Married | Unmarried |
| Less than High School | 0 (0.0%) | 0 (0.0%) |
| High School Diploma | 0 (0.0%) | 0 (0.0%) |
| College or Associate's Degree | 8 (100.0%) | 0 (0.0%) |
| Bachelor's Degree | 8 (100.0%) | 0 (0.0%) |
| Graduate Degree | 30 (100.0%) | 0 (0.0%) |
| Total | 46 (100.0%) | 0 (0.0%) |
Employment Characteristics in Windermere
Employment by Class of Employer in Windermere
Among the 1,425 employed individuals in Windermere, private company employees (964 | 67.6%), self-employed (incorporated) (231 | 16.2%), and not-for-profit organizations (95 | 6.7%) make up the most common classes of employment.
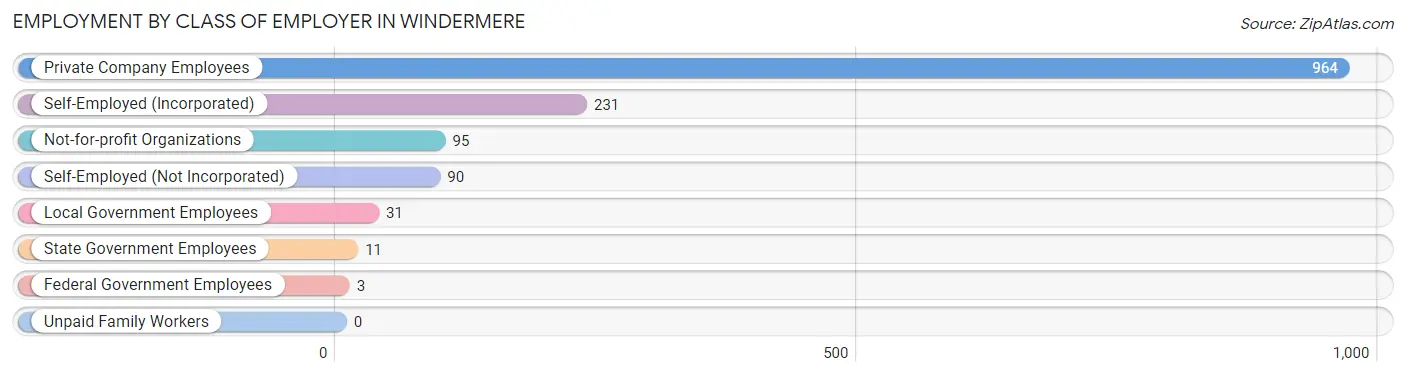
| Employer Class | # Employees | % Employees |
| Private Company Employees | 964 | 67.6% |
| Self-Employed (Incorporated) | 231 | 16.2% |
| Self-Employed (Not Incorporated) | 90 | 6.3% |
| Not-for-profit Organizations | 95 | 6.7% |
| Local Government Employees | 31 | 2.2% |
| State Government Employees | 11 | 0.8% |
| Federal Government Employees | 3 | 0.2% |
| Unpaid Family Workers | 0 | 0.0% |
| Total | 1,425 | 100.0% |
Employment Status by Age in Windermere
According to the labor force statistics for Windermere, out of the total population over 16 years of age (2,602), 57.4% or 1,494 individuals are in the labor force, with 2.1% or 31 of them unemployed. The age group with the highest labor force participation rate is 30 to 34 years, with 91.3% or 84 individuals in the labor force. Within the labor force, the 25 to 29 years age range has the highest percentage of unemployed individuals, with 10.8% or 8 of them being unemployed.
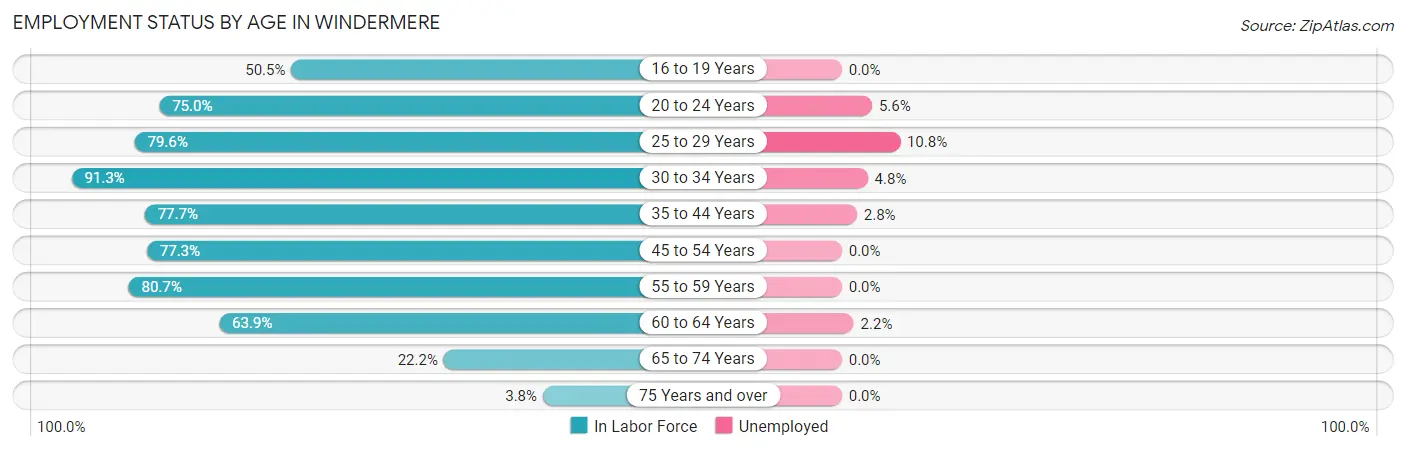
| Age Bracket | In Labor Force | Unemployed |
| 16 to 19 Years | 50 (50.5%) | 0 (0.0%) |
| 20 to 24 Years | 177 (75.0%) | 10 (5.6%) |
| 25 to 29 Years | 74 (79.6%) | 8 (10.8%) |
| 30 to 34 Years | 84 (91.3%) | 4 (4.8%) |
| 35 to 44 Years | 216 (77.7%) | 6 (2.8%) |
| 45 to 54 Years | 333 (77.3%) | 0 (0.0%) |
| 55 to 59 Years | 264 (80.7%) | 0 (0.0%) |
| 60 to 64 Years | 179 (63.9%) | 4 (2.2%) |
| 65 to 74 Years | 106 (22.2%) | 0 (0.0%) |
| 75 Years and over | 11 (3.8%) | 0 (0.0%) |
| Total | 1,494 (57.4%) | 31 (2.1%) |
Employment Status by Educational Attainment in Windermere
According to labor force statistics for Windermere, 76.6% of individuals (1,150) out of the total population between 25 and 64 years of age (1,501) are in the labor force, with 1.9% or 22 of them being unemployed. The group with the highest labor force participation rate are those with the educational attainment of bachelor's degree or higher, with 80.0% or 921 individuals in the labor force. Within the labor force, individuals with high school diploma education have the highest percentage of unemployment, with 8.3% or 4 of them being unemployed.
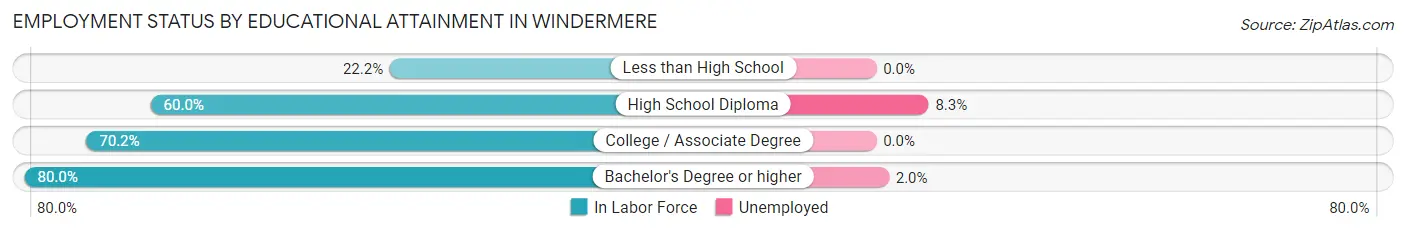
| Educational Attainment | In Labor Force | Unemployed |
| Less than High School | 4 (22.2%) | 0 (0.0%) |
| High School Diploma | 48 (60.0%) | 7 (8.3%) |
| College / Associate Degree | 177 (70.2%) | 0 (0.0%) |
| Bachelor's Degree or higher | 921 (80.0%) | 23 (2.0%) |
| Total | 1,150 (76.6%) | 29 (1.9%) |
Employment Occupations by Sex in Windermere
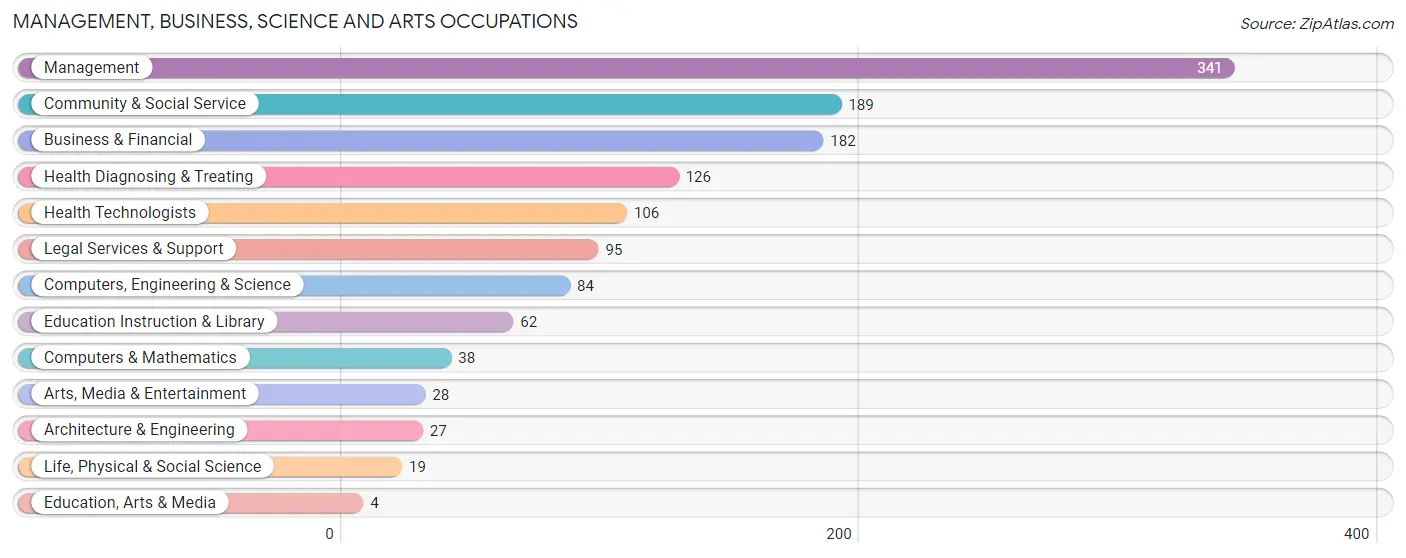
Management, Business, Science and Arts Occupations
The most common Management, Business, Science and Arts occupations in Windermere are Management (341 | 23.3%), Community & Social Service (189 | 12.9%), Business & Financial (182 | 12.4%), Health Diagnosing & Treating (126 | 8.6%), and Health Technologists (106 | 7.2%).
Management, Business, Science and Arts Occupations by Sex
Within the Management, Business, Science and Arts occupations in Windermere, the most male-oriented occupations are Life, Physical & Social Science (100.0%), Computers & Mathematics (89.5%), and Computers, Engineering & Science (88.1%), while the most female-oriented occupations are Education, Arts & Media (100.0%), Arts, Media & Entertainment (64.3%), and Education Instruction & Library (56.5%).
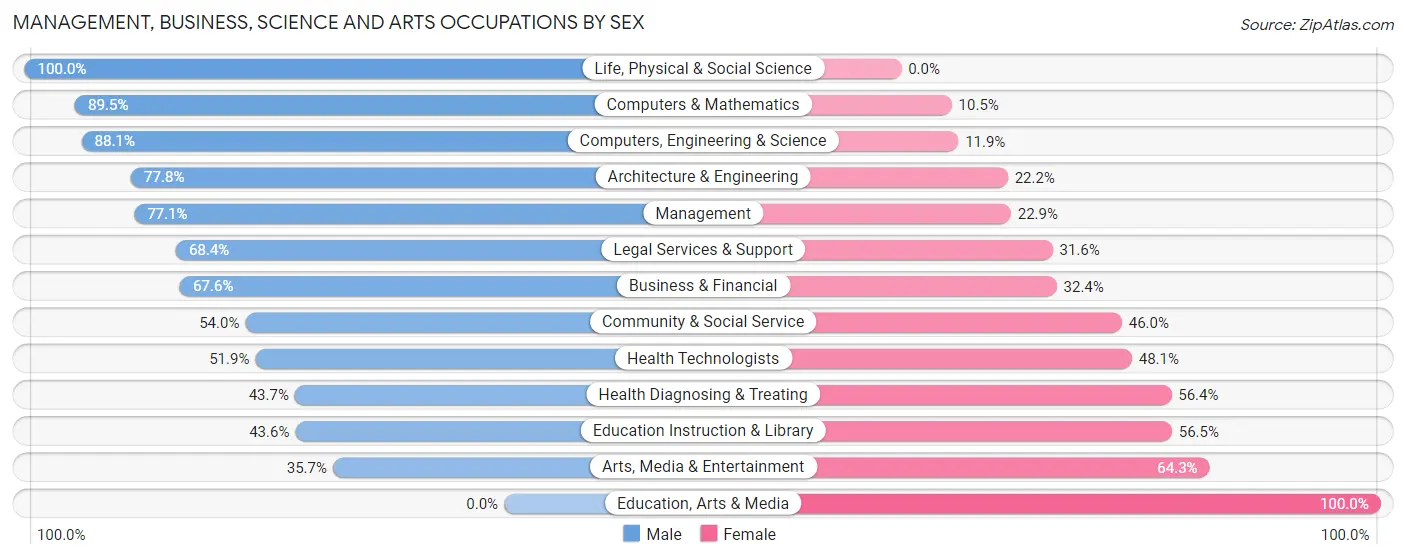
| Occupation | Male | Female |
| Management | 263 (77.1%) | 78 (22.9%) |
| Business & Financial | 123 (67.6%) | 59 (32.4%) |
| Computers, Engineering & Science | 74 (88.1%) | 10 (11.9%) |
| Computers & Mathematics | 34 (89.5%) | 4 (10.5%) |
| Architecture & Engineering | 21 (77.8%) | 6 (22.2%) |
| Life, Physical & Social Science | 19 (100.0%) | 0 (0.0%) |
| Community & Social Service | 102 (54.0%) | 87 (46.0%) |
| Education, Arts & Media | 0 (0.0%) | 4 (100.0%) |
| Legal Services & Support | 65 (68.4%) | 30 (31.6%) |
| Education Instruction & Library | 27 (43.5%) | 35 (56.5%) |
| Arts, Media & Entertainment | 10 (35.7%) | 18 (64.3%) |
| Health Diagnosing & Treating | 55 (43.6%) | 71 (56.4%) |
| Health Technologists | 55 (51.9%) | 51 (48.1%) |
| Total (Category) | 617 (66.9%) | 305 (33.1%) |
| Total (Overall) | 919 (62.9%) | 543 (37.1%) |
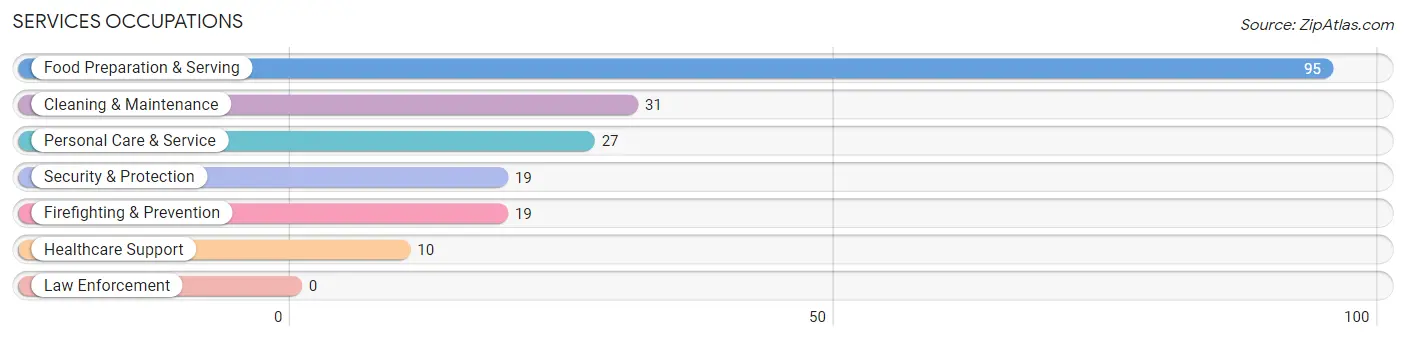
Services Occupations
The most common Services occupations in Windermere are Food Preparation & Serving (95 | 6.5%), Cleaning & Maintenance (31 | 2.1%), Personal Care & Service (27 | 1.8%), Security & Protection (19 | 1.3%), and Firefighting & Prevention (19 | 1.3%).
Services Occupations by Sex
Within the Services occupations in Windermere, the most male-oriented occupations are Cleaning & Maintenance (100.0%), Personal Care & Service (74.1%), and Healthcare Support (70.0%), while the most female-oriented occupations are Food Preparation & Serving (78.9%), Security & Protection (42.1%), and Firefighting & Prevention (42.1%).
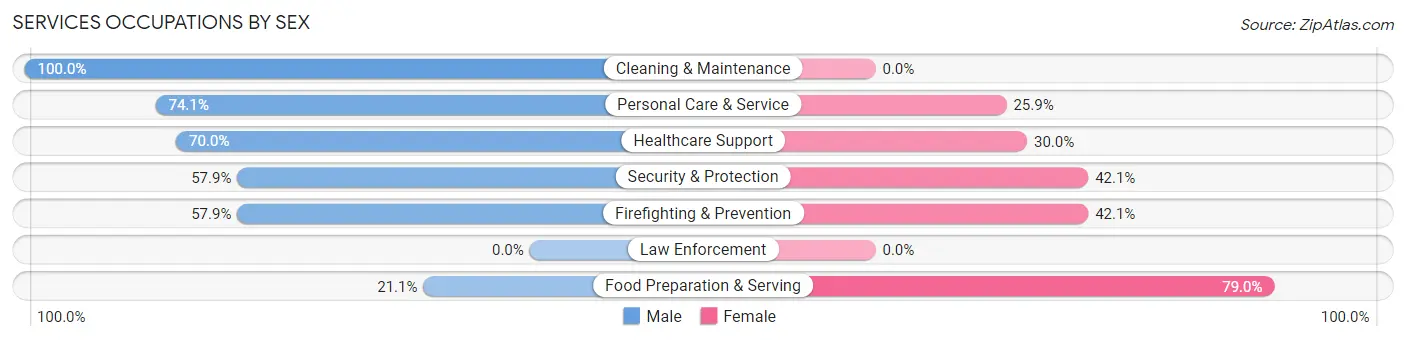
| Occupation | Male | Female |
| Healthcare Support | 7 (70.0%) | 3 (30.0%) |
| Security & Protection | 11 (57.9%) | 8 (42.1%) |
| Firefighting & Prevention | 11 (57.9%) | 8 (42.1%) |
| Law Enforcement | 0 (0.0%) | 0 (0.0%) |
| Food Preparation & Serving | 20 (21.0%) | 75 (78.9%) |
| Cleaning & Maintenance | 31 (100.0%) | 0 (0.0%) |
| Personal Care & Service | 20 (74.1%) | 7 (25.9%) |
| Total (Category) | 89 (48.9%) | 93 (51.1%) |
| Total (Overall) | 919 (62.9%) | 543 (37.1%) |
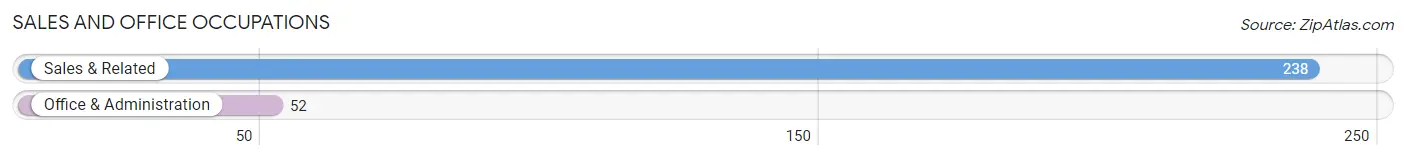
Sales and Office Occupations
The most common Sales and Office occupations in Windermere are Sales & Related (238 | 16.3%), and Office & Administration (52 | 3.6%).
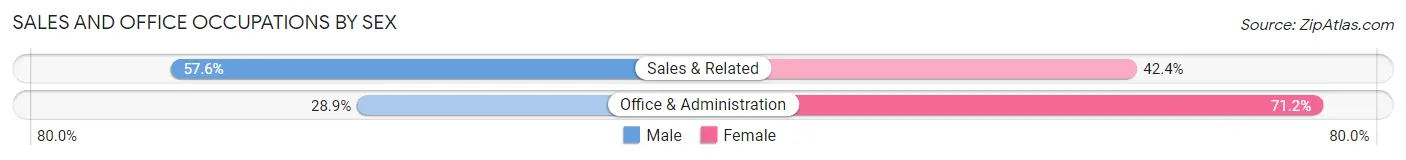
Sales and Office Occupations by Sex
| Occupation | Male | Female |
| Sales & Related | 137 (57.6%) | 101 (42.4%) |
| Office & Administration | 15 (28.8%) | 37 (71.2%) |
| Total (Category) | 152 (52.4%) | 138 (47.6%) |
| Total (Overall) | 919 (62.9%) | 543 (37.1%) |
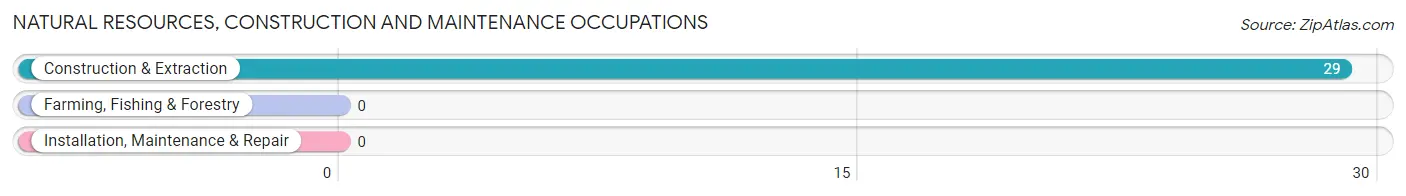
Natural Resources, Construction and Maintenance Occupations
The most common Natural Resources, Construction and Maintenance occupations in Windermere are , and Construction & Extraction (29 | 2.0%).
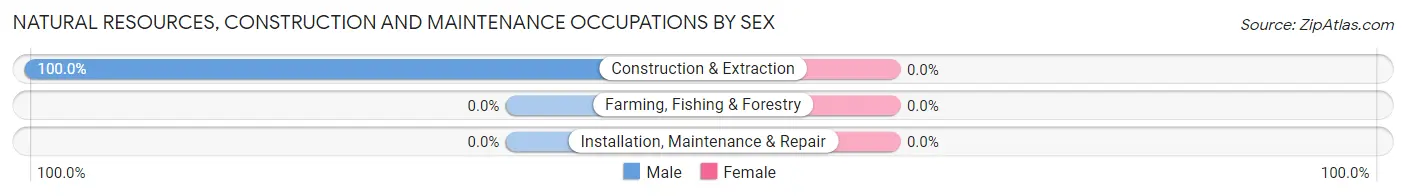
Natural Resources, Construction and Maintenance Occupations by Sex
| Occupation | Male | Female |
| Farming, Fishing & Forestry | 0 (0.0%) | 0 (0.0%) |
| Construction & Extraction | 29 (100.0%) | 0 (0.0%) |
| Installation, Maintenance & Repair | 0 (0.0%) | 0 (0.0%) |
| Total (Category) | 29 (100.0%) | 0 (0.0%) |
| Total (Overall) | 919 (62.9%) | 543 (37.1%) |
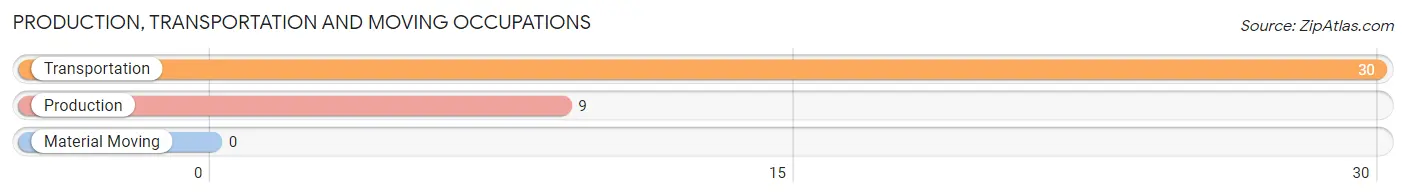
Production, Transportation and Moving Occupations
The most common Production, Transportation and Moving occupations in Windermere are Transportation (30 | 2.1%), and Production (9 | 0.6%).
Production, Transportation and Moving Occupations by Sex
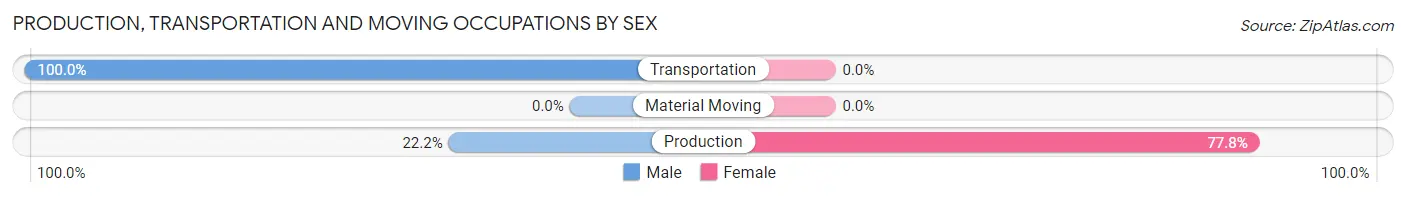
| Occupation | Male | Female |
| Production | 2 (22.2%) | 7 (77.8%) |
| Transportation | 30 (100.0%) | 0 (0.0%) |
| Material Moving | 0 (0.0%) | 0 (0.0%) |
| Total (Category) | 32 (82.1%) | 7 (17.9%) |
| Total (Overall) | 919 (62.9%) | 543 (37.1%) |
Employment Industries by Sex in Windermere
Employment Industries in Windermere
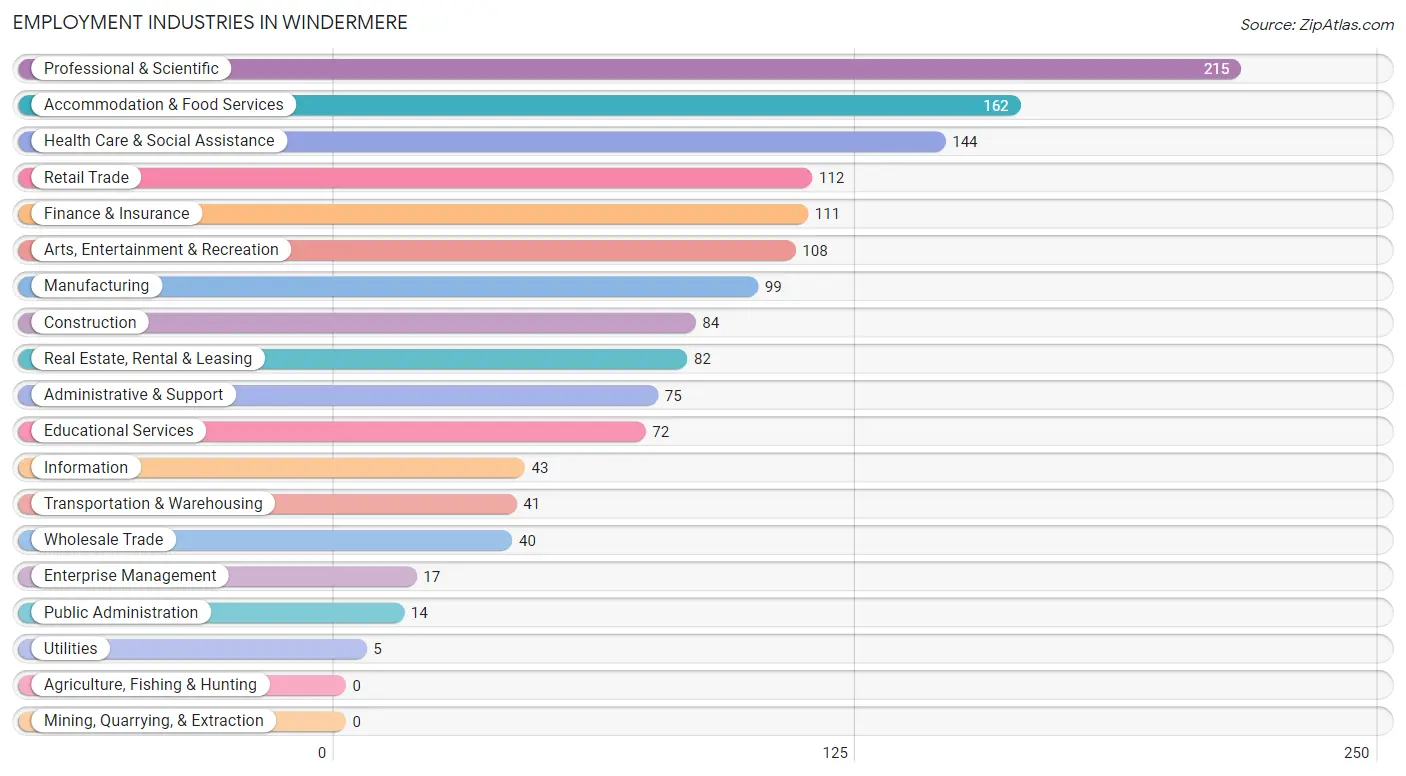
The major employment industries in Windermere include Professional & Scientific (215 | 14.7%), Accommodation & Food Services (162 | 11.1%), Health Care & Social Assistance (144 | 9.9%), Retail Trade (112 | 7.7%), and Finance & Insurance (111 | 7.6%).
Employment Industries by Sex in Windermere
The Windermere industries that see more men than women are Utilities (100.0%), Information (86.1%), and Construction (83.3%), whereas the industries that tend to have a higher number of women are Health Care & Social Assistance (61.8%), Public Administration (57.1%), and Educational Services (55.6%).
| Industry | Male | Female |
| Agriculture, Fishing & Hunting | 0 (0.0%) | 0 (0.0%) |
| Mining, Quarrying, & Extraction | 0 (0.0%) | 0 (0.0%) |
| Construction | 70 (83.3%) | 14 (16.7%) |
| Manufacturing | 73 (73.7%) | 26 (26.3%) |
| Wholesale Trade | 18 (45.0%) | 22 (55.0%) |
| Retail Trade | 85 (75.9%) | 27 (24.1%) |
| Transportation & Warehousing | 33 (80.5%) | 8 (19.5%) |
| Utilities | 5 (100.0%) | 0 (0.0%) |
| Information | 37 (86.1%) | 6 (14.0%) |
| Finance & Insurance | 76 (68.5%) | 35 (31.5%) |
| Real Estate, Rental & Leasing | 37 (45.1%) | 45 (54.9%) |
| Professional & Scientific | 159 (74.0%) | 56 (26.1%) |
| Enterprise Management | 8 (47.1%) | 9 (52.9%) |
| Administrative & Support | 49 (65.3%) | 26 (34.7%) |
| Educational Services | 32 (44.4%) | 40 (55.6%) |
| Health Care & Social Assistance | 55 (38.2%) | 89 (61.8%) |
| Arts, Entertainment & Recreation | 69 (63.9%) | 39 (36.1%) |
| Accommodation & Food Services | 86 (53.1%) | 76 (46.9%) |
| Public Administration | 6 (42.9%) | 8 (57.1%) |
| Total | 919 (62.9%) | 543 (37.1%) |
Education in Windermere
School Enrollment in Windermere
The most common levels of schooling among the 584 students in Windermere are college / undergraduate (150 | 25.7%), middle school (139 | 23.8%), and high school (110 | 18.8%).
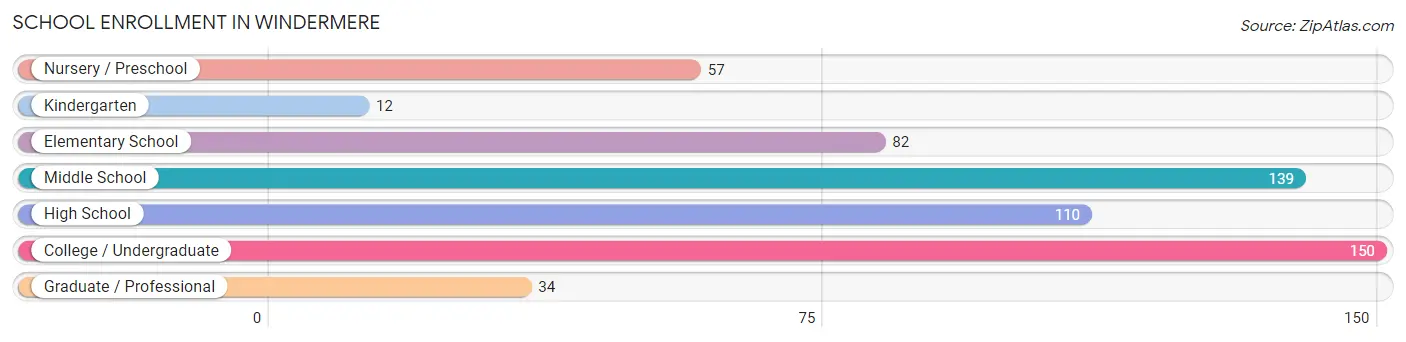
| School Level | # Students | % Students |
| Nursery / Preschool | 57 | 9.8% |
| Kindergarten | 12 | 2.1% |
| Elementary School | 82 | 14.0% |
| Middle School | 139 | 23.8% |
| High School | 110 | 18.8% |
| College / Undergraduate | 150 | 25.7% |
| Graduate / Professional | 34 | 5.8% |
| Total | 584 | 100.0% |
School Enrollment by Age by Funding Source in Windermere
Out of a total of 584 students who are enrolled in schools in Windermere, 188 (32.2%) attend a private institution, while the remaining 396 (67.8%) are enrolled in public schools. The age group of 3 to 4 year olds has the highest likelihood of being enrolled in private schools, with 52 (100.0% in the age bracket) enrolled. Conversely, the age group of 18 to 19 year olds has the lowest likelihood of being enrolled in a private school, with 53 (98.2% in the age bracket) attending a public institution.
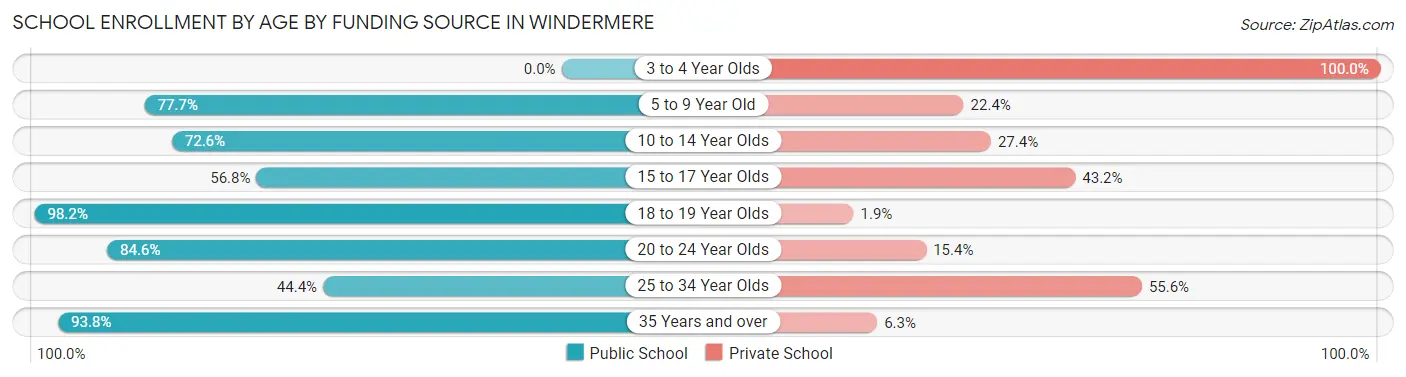
| Age Bracket | Public School | Private School |
| 3 to 4 Year Olds | 0 (0.0%) | 52 (100.0%) |
| 5 to 9 Year Old | 66 (77.6%) | 19 (22.4%) |
| 10 to 14 Year Olds | 119 (72.6%) | 45 (27.4%) |
| 15 to 17 Year Olds | 54 (56.8%) | 41 (43.2%) |
| 18 to 19 Year Olds | 53 (98.2%) | 1 (1.8%) |
| 20 to 24 Year Olds | 77 (84.6%) | 14 (15.4%) |
| 25 to 34 Year Olds | 12 (44.4%) | 15 (55.6%) |
| 35 Years and over | 15 (93.8%) | 1 (6.2%) |
| Total | 396 (67.8%) | 188 (32.2%) |
Educational Attainment by Field of Study in Windermere
Business (446 | 27.1%), engineering (221 | 13.4%), education (155 | 9.4%), bio, nature & agricultural (154 | 9.3%), and physical & health sciences (100 | 6.1%) are the most common fields of study among 1,647 individuals in Windermere who have obtained a bachelor's degree or higher.
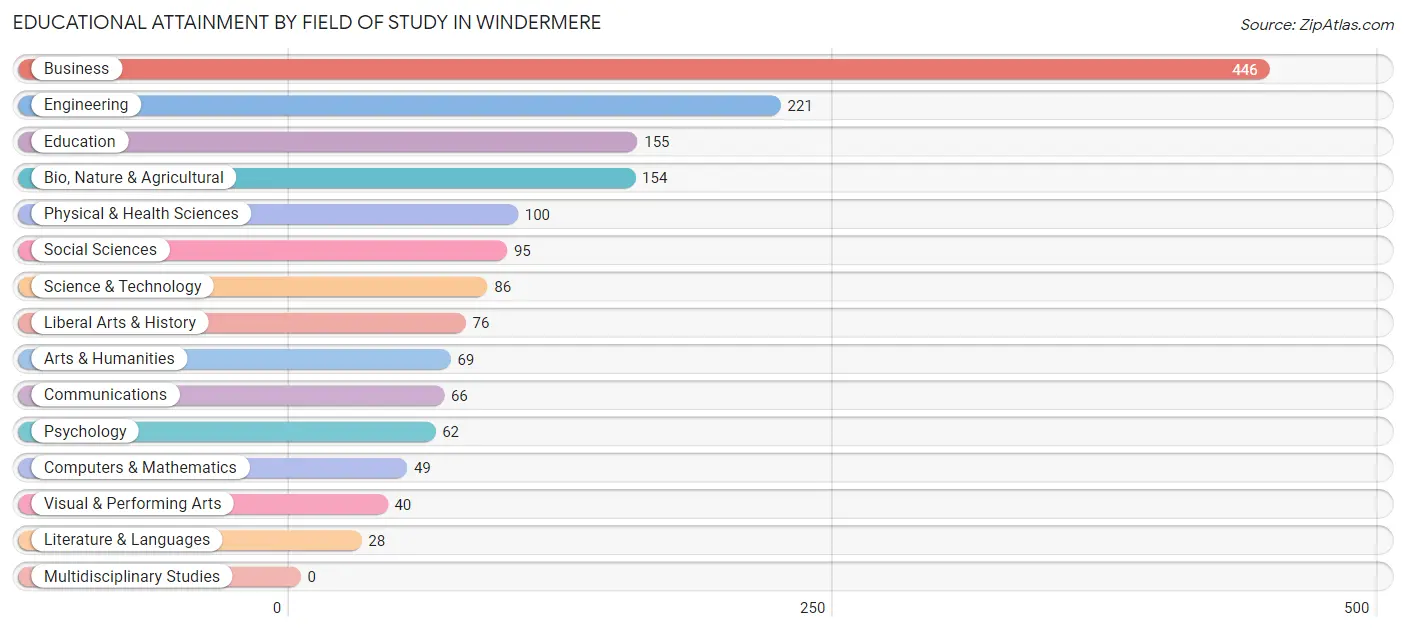
| Field of Study | # Graduates | % Graduates |
| Computers & Mathematics | 49 | 3.0% |
| Bio, Nature & Agricultural | 154 | 9.3% |
| Physical & Health Sciences | 100 | 6.1% |
| Psychology | 62 | 3.8% |
| Social Sciences | 95 | 5.8% |
| Engineering | 221 | 13.4% |
| Multidisciplinary Studies | 0 | 0.0% |
| Science & Technology | 86 | 5.2% |
| Business | 446 | 27.1% |
| Education | 155 | 9.4% |
| Literature & Languages | 28 | 1.7% |
| Liberal Arts & History | 76 | 4.6% |
| Visual & Performing Arts | 40 | 2.4% |
| Communications | 66 | 4.0% |
| Arts & Humanities | 69 | 4.2% |
| Total | 1,647 | 100.0% |
Transportation & Commute in Windermere
Vehicle Availability by Sex in Windermere
The most prevalent vehicle ownership categories in Windermere are males with 2 vehicles (470, accounting for 51.8%) and females with 2 vehicles (284, making up 90.9%).
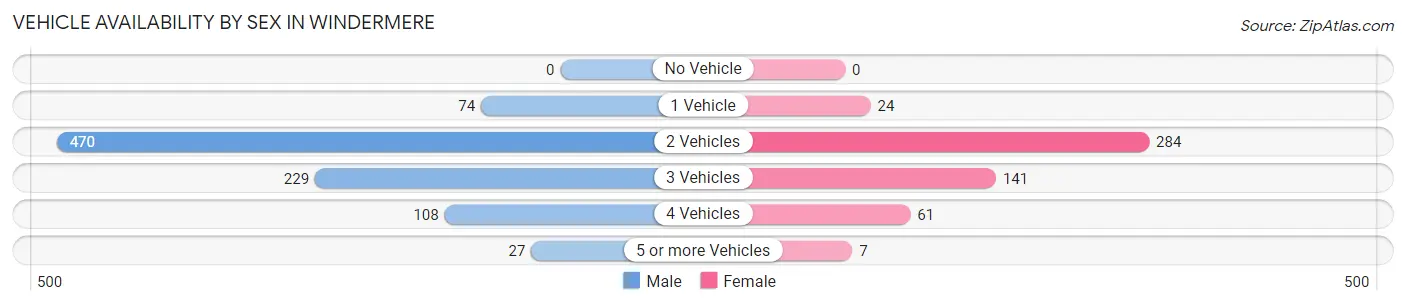
| Vehicles Available | Male | Female |
| No Vehicle | 0 (0.0%) | 0 (0.0%) |
| 1 Vehicle | 74 (8.2%) | 24 (4.6%) |
| 2 Vehicles | 470 (51.8%) | 284 (54.9%) |
| 3 Vehicles | 229 (25.2%) | 141 (27.3%) |
| 4 Vehicles | 108 (11.9%) | 61 (11.8%) |
| 5 or more Vehicles | 27 (3.0%) | 7 (1.3%) |
| Total | 908 (100.0%) | 517 (100.0%) |
Commute Time in Windermere
The most frequently occuring commute durations in Windermere are 30 to 34 minutes (266 commuters, 24.4%), 20 to 24 minutes (169 commuters, 15.5%), and 15 to 19 minutes (128 commuters, 11.7%).
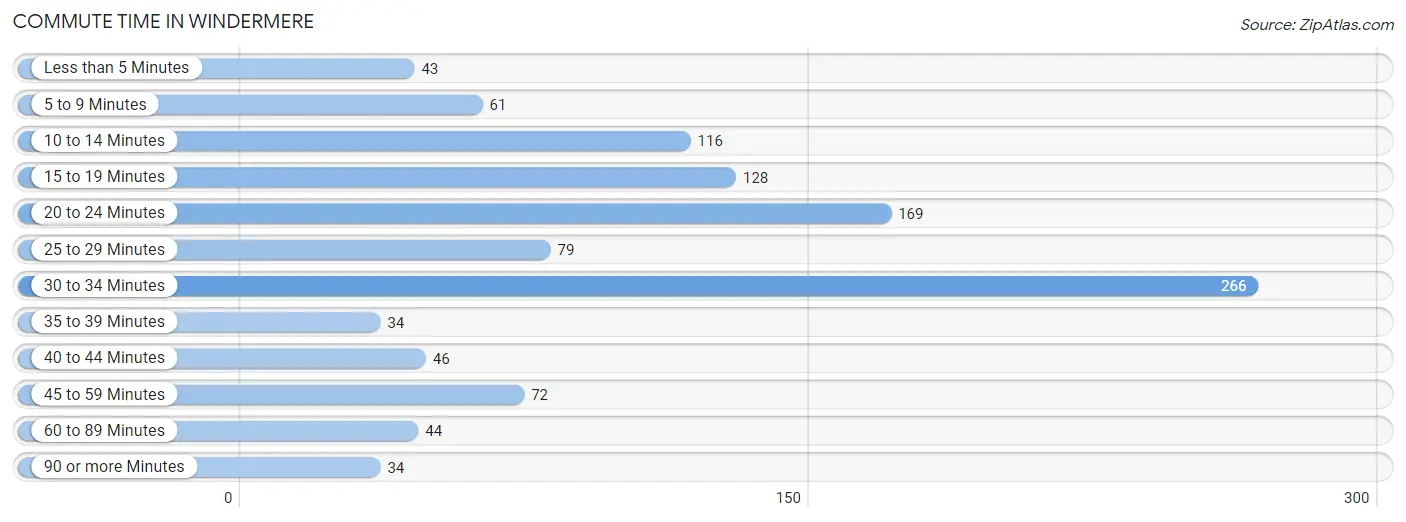
| Commute Time | # Commuters | % Commuters |
| Less than 5 Minutes | 43 | 3.9% |
| 5 to 9 Minutes | 61 | 5.6% |
| 10 to 14 Minutes | 116 | 10.6% |
| 15 to 19 Minutes | 128 | 11.7% |
| 20 to 24 Minutes | 169 | 15.5% |
| 25 to 29 Minutes | 79 | 7.2% |
| 30 to 34 Minutes | 266 | 24.4% |
| 35 to 39 Minutes | 34 | 3.1% |
| 40 to 44 Minutes | 46 | 4.2% |
| 45 to 59 Minutes | 72 | 6.6% |
| 60 to 89 Minutes | 44 | 4.0% |
| 90 or more Minutes | 34 | 3.1% |
Commute Time by Sex in Windermere
The most common commute times in Windermere are 30 to 34 minutes (174 commuters, 27.4%) for males and 30 to 34 minutes (92 commuters, 20.1%) for females.
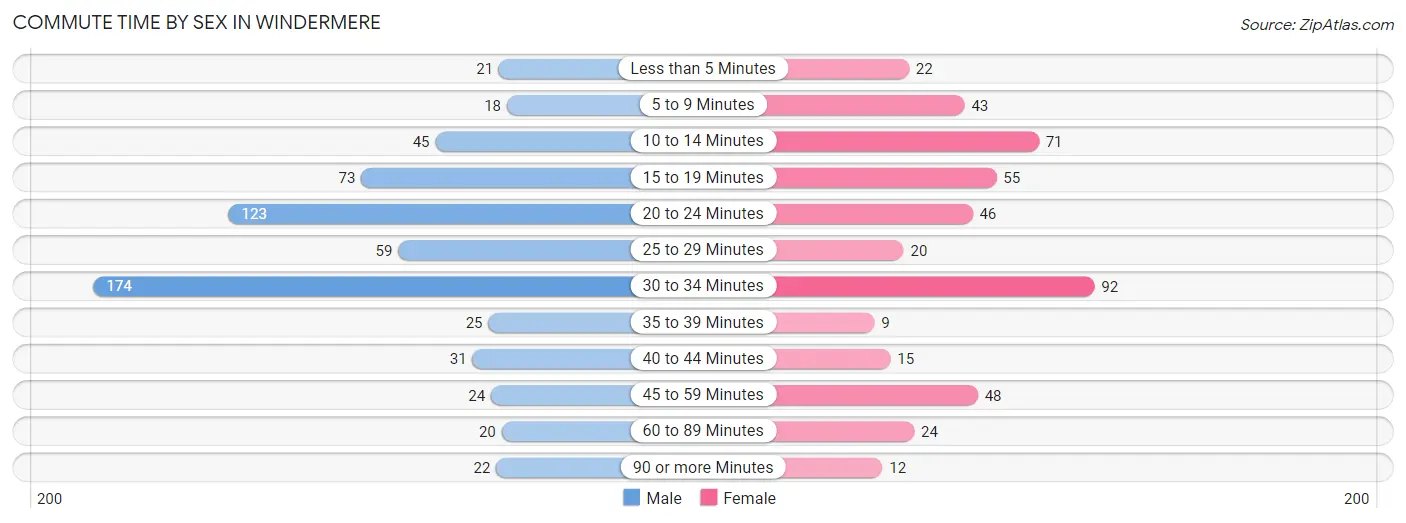
| Commute Time | Male | Female |
| Less than 5 Minutes | 21 (3.3%) | 22 (4.8%) |
| 5 to 9 Minutes | 18 (2.8%) | 43 (9.4%) |
| 10 to 14 Minutes | 45 (7.1%) | 71 (15.5%) |
| 15 to 19 Minutes | 73 (11.5%) | 55 (12.0%) |
| 20 to 24 Minutes | 123 (19.4%) | 46 (10.1%) |
| 25 to 29 Minutes | 59 (9.3%) | 20 (4.4%) |
| 30 to 34 Minutes | 174 (27.4%) | 92 (20.1%) |
| 35 to 39 Minutes | 25 (3.9%) | 9 (2.0%) |
| 40 to 44 Minutes | 31 (4.9%) | 15 (3.3%) |
| 45 to 59 Minutes | 24 (3.8%) | 48 (10.5%) |
| 60 to 89 Minutes | 20 (3.2%) | 24 (5.2%) |
| 90 or more Minutes | 22 (3.5%) | 12 (2.6%) |
Time of Departure to Work by Sex in Windermere
The most frequent times of departure to work in Windermere are 8:00 AM to 8:29 AM (160, 25.2%) for males and 7:00 AM to 7:29 AM (92, 20.1%) for females.
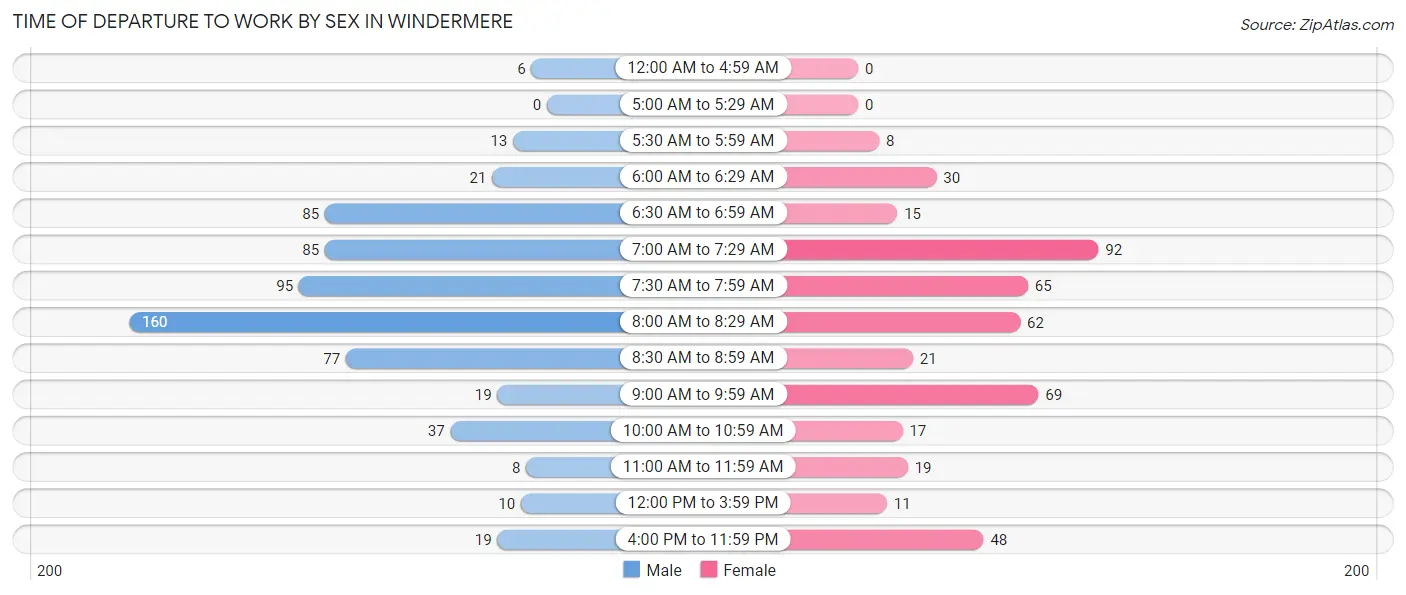
| Time of Departure | Male | Female |
| 12:00 AM to 4:59 AM | 6 (0.9%) | 0 (0.0%) |
| 5:00 AM to 5:29 AM | 0 (0.0%) | 0 (0.0%) |
| 5:30 AM to 5:59 AM | 13 (2.1%) | 8 (1.8%) |
| 6:00 AM to 6:29 AM | 21 (3.3%) | 30 (6.6%) |
| 6:30 AM to 6:59 AM | 85 (13.4%) | 15 (3.3%) |
| 7:00 AM to 7:29 AM | 85 (13.4%) | 92 (20.1%) |
| 7:30 AM to 7:59 AM | 95 (15.0%) | 65 (14.2%) |
| 8:00 AM to 8:29 AM | 160 (25.2%) | 62 (13.6%) |
| 8:30 AM to 8:59 AM | 77 (12.1%) | 21 (4.6%) |
| 9:00 AM to 9:59 AM | 19 (3.0%) | 69 (15.1%) |
| 10:00 AM to 10:59 AM | 37 (5.8%) | 17 (3.7%) |
| 11:00 AM to 11:59 AM | 8 (1.3%) | 19 (4.2%) |
| 12:00 PM to 3:59 PM | 10 (1.6%) | 11 (2.4%) |
| 4:00 PM to 11:59 PM | 19 (3.0%) | 48 (10.5%) |
| Total | 635 (100.0%) | 457 (100.0%) |
Housing Occupancy in Windermere
Occupancy by Ownership in Windermere
Of the total 1,217 dwellings in Windermere, owner-occupied units account for 1,140 (93.7%), while renter-occupied units make up 77 (6.3%).
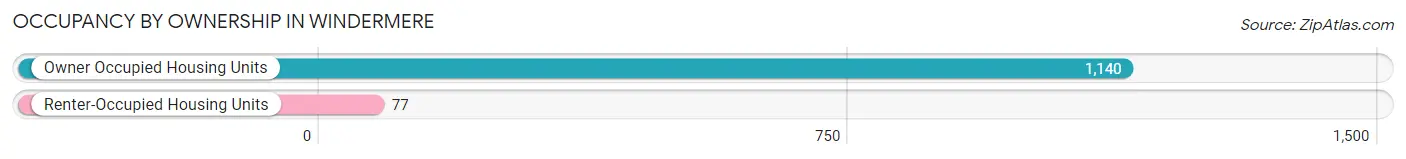
| Occupancy | # Housing Units | % Housing Units |
| Owner Occupied Housing Units | 1,140 | 93.7% |
| Renter-Occupied Housing Units | 77 | 6.3% |
| Total Occupied Housing Units | 1,217 | 100.0% |
Occupancy by Household Size in Windermere
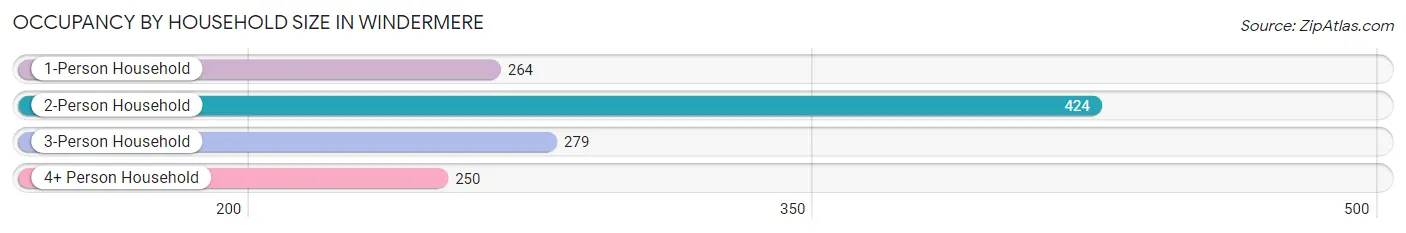
| Household Size | # Housing Units | % Housing Units |
| 1-Person Household | 264 | 21.7% |
| 2-Person Household | 424 | 34.8% |
| 3-Person Household | 279 | 22.9% |
| 4+ Person Household | 250 | 20.5% |
| Total Housing Units | 1,217 | 100.0% |
Occupancy by Ownership by Household Size in Windermere
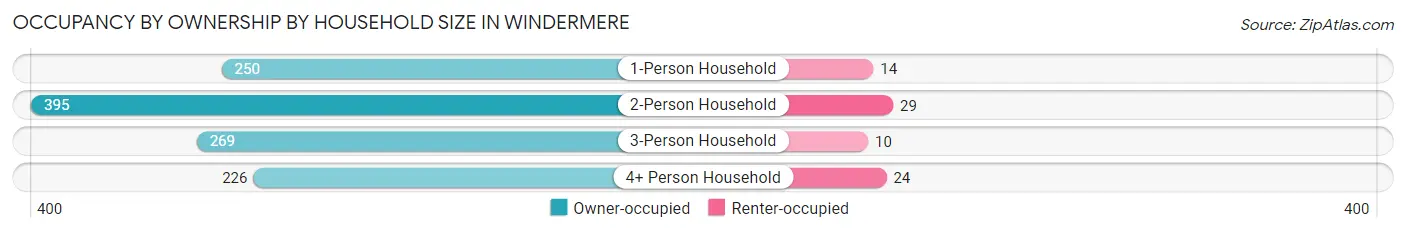
| Household Size | Owner-occupied | Renter-occupied |
| 1-Person Household | 250 (94.7%) | 14 (5.3%) |
| 2-Person Household | 395 (93.2%) | 29 (6.8%) |
| 3-Person Household | 269 (96.4%) | 10 (3.6%) |
| 4+ Person Household | 226 (90.4%) | 24 (9.6%) |
| Total Housing Units | 1,140 (93.7%) | 77 (6.3%) |
Occupancy by Educational Attainment in Windermere
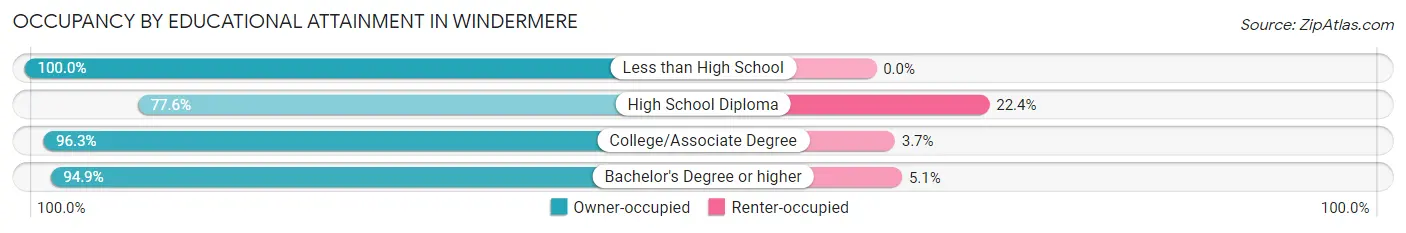
| Household Size | Owner-occupied | Renter-occupied |
| Less than High School | 13 (100.0%) | 0 (0.0%) |
| High School Diploma | 83 (77.6%) | 24 (22.4%) |
| College/Associate Degree | 209 (96.3%) | 8 (3.7%) |
| Bachelor's Degree or higher | 835 (94.9%) | 45 (5.1%) |
Occupancy by Age of Householder in Windermere
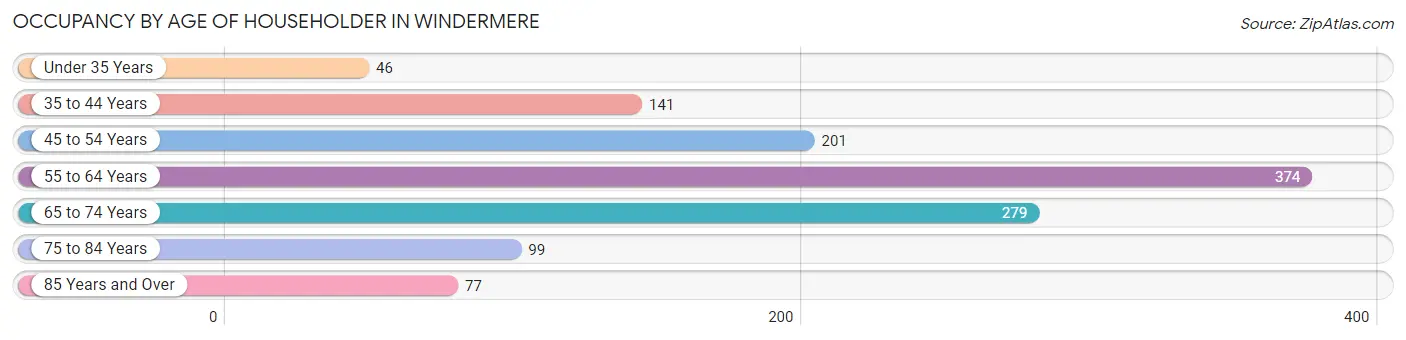
| Age Bracket | # Households | % Households |
| Under 35 Years | 46 | 3.8% |
| 35 to 44 Years | 141 | 11.6% |
| 45 to 54 Years | 201 | 16.5% |
| 55 to 64 Years | 374 | 30.7% |
| 65 to 74 Years | 279 | 22.9% |
| 75 to 84 Years | 99 | 8.1% |
| 85 Years and Over | 77 | 6.3% |
| Total | 1,217 | 100.0% |
Housing Finances in Windermere
Median Income by Occupancy in Windermere
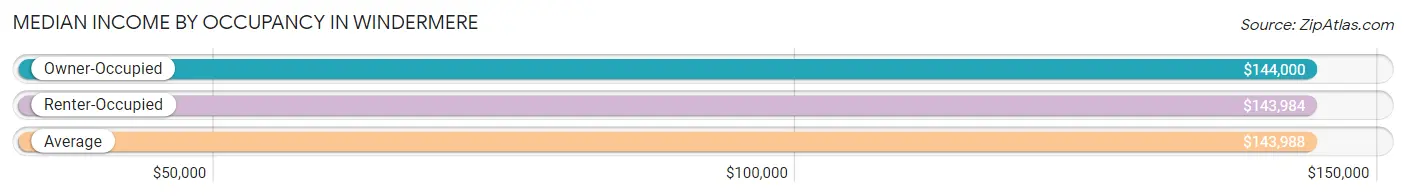
| Occupancy Type | # Households | Median Income |
| Owner-Occupied | 1,140 (93.7%) | $144,000 |
| Renter-Occupied | 77 (6.3%) | $143,984 |
| Average | 1,217 (100.0%) | $143,988 |
Occupancy by Householder Income Bracket in Windermere
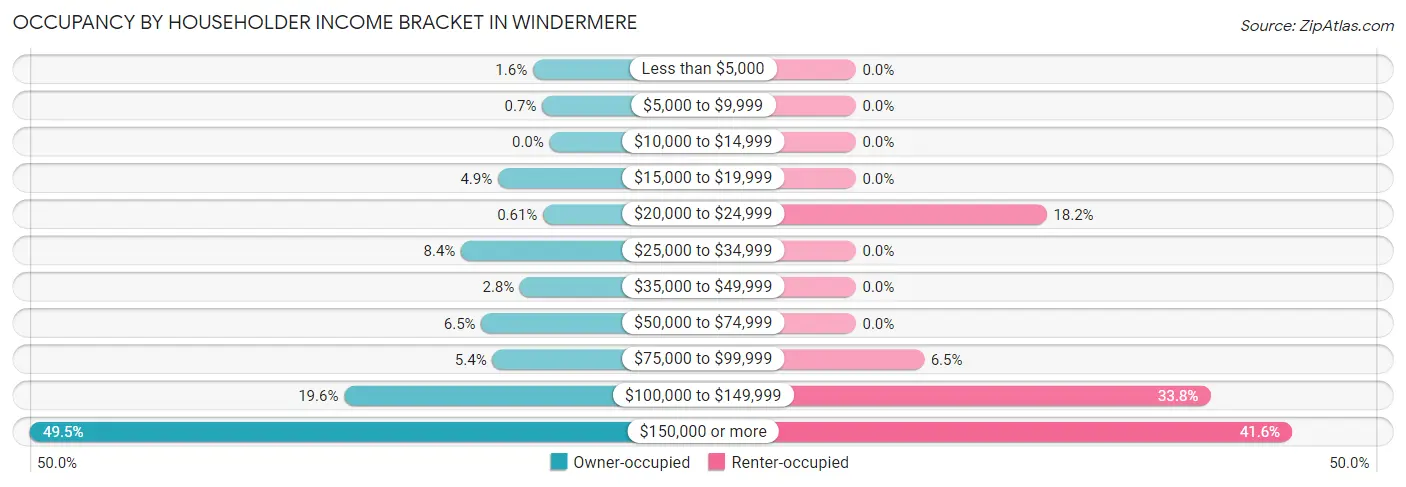
| Income Bracket | Owner-occupied | Renter-occupied |
| Less than $5,000 | 18 (1.6%) | 0 (0.0%) |
| $5,000 to $9,999 | 8 (0.7%) | 0 (0.0%) |
| $10,000 to $14,999 | 0 (0.0%) | 0 (0.0%) |
| $15,000 to $19,999 | 56 (4.9%) | 0 (0.0%) |
| $20,000 to $24,999 | 7 (0.6%) | 14 (18.2%) |
| $25,000 to $34,999 | 96 (8.4%) | 0 (0.0%) |
| $35,000 to $49,999 | 32 (2.8%) | 0 (0.0%) |
| $50,000 to $74,999 | 74 (6.5%) | 0 (0.0%) |
| $75,000 to $99,999 | 62 (5.4%) | 5 (6.5%) |
| $100,000 to $149,999 | 223 (19.6%) | 26 (33.8%) |
| $150,000 or more | 564 (49.5%) | 32 (41.6%) |
| Total | 1,140 (100.0%) | 77 (100.0%) |
Monthly Housing Cost Tiers in Windermere
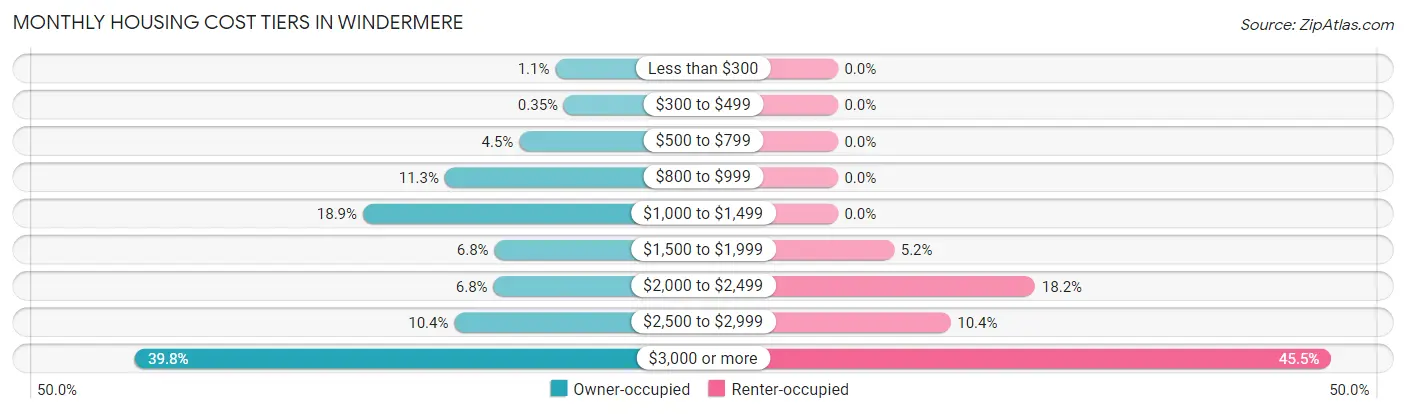
| Monthly Cost | Owner-occupied | Renter-occupied |
| Less than $300 | 13 (1.1%) | 0 (0.0%) |
| $300 to $499 | 4 (0.4%) | 0 (0.0%) |
| $500 to $799 | 51 (4.5%) | 0 (0.0%) |
| $800 to $999 | 129 (11.3%) | 0 (0.0%) |
| $1,000 to $1,499 | 215 (18.9%) | 0 (0.0%) |
| $1,500 to $1,999 | 77 (6.8%) | 4 (5.2%) |
| $2,000 to $2,499 | 78 (6.8%) | 14 (18.2%) |
| $2,500 to $2,999 | 119 (10.4%) | 8 (10.4%) |
| $3,000 or more | 454 (39.8%) | 35 (45.5%) |
| Total | 1,140 (100.0%) | 77 (100.0%) |
Physical Housing Characteristics in Windermere
Housing Structures in Windermere
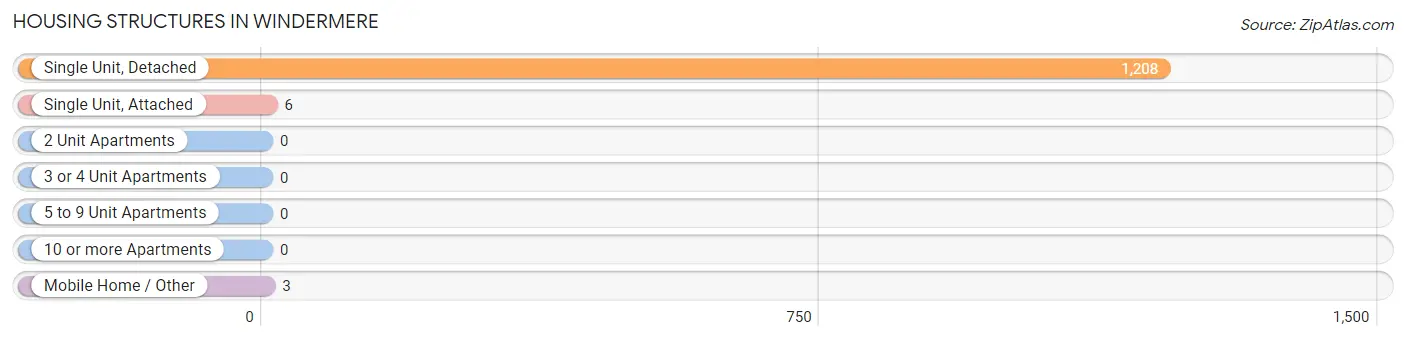
| Structure Type | # Housing Units | % Housing Units |
| Single Unit, Detached | 1,208 | 99.3% |
| Single Unit, Attached | 6 | 0.5% |
| 2 Unit Apartments | 0 | 0.0% |
| 3 or 4 Unit Apartments | 0 | 0.0% |
| 5 to 9 Unit Apartments | 0 | 0.0% |
| 10 or more Apartments | 0 | 0.0% |
| Mobile Home / Other | 3 | 0.3% |
| Total | 1,217 | 100.0% |
Housing Structures by Occupancy in Windermere
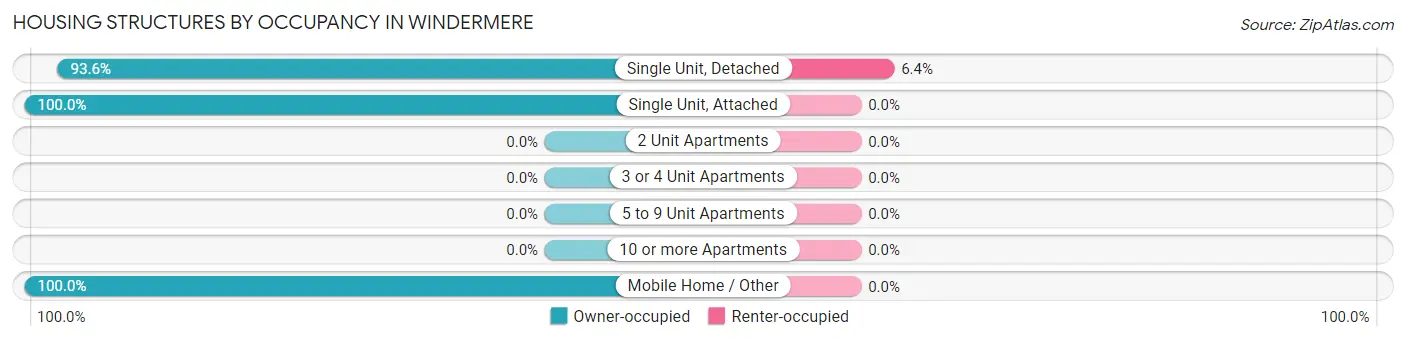
| Structure Type | Owner-occupied | Renter-occupied |
| Single Unit, Detached | 1,131 (93.6%) | 77 (6.4%) |
| Single Unit, Attached | 6 (100.0%) | 0 (0.0%) |
| 2 Unit Apartments | 0 (0.0%) | 0 (0.0%) |
| 3 or 4 Unit Apartments | 0 (0.0%) | 0 (0.0%) |
| 5 to 9 Unit Apartments | 0 (0.0%) | 0 (0.0%) |
| 10 or more Apartments | 0 (0.0%) | 0 (0.0%) |
| Mobile Home / Other | 3 (100.0%) | 0 (0.0%) |
| Total | 1,140 (93.7%) | 77 (6.3%) |
Housing Structures by Number of Rooms in Windermere
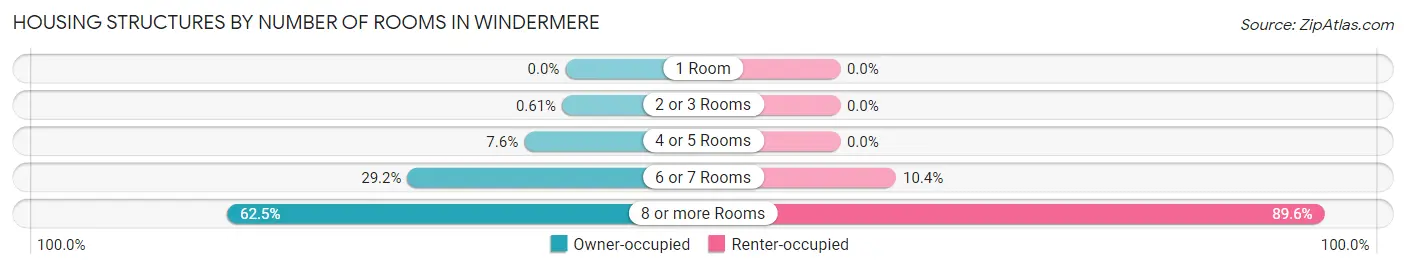
| Number of Rooms | Owner-occupied | Renter-occupied |
| 1 Room | 0 (0.0%) | 0 (0.0%) |
| 2 or 3 Rooms | 7 (0.6%) | 0 (0.0%) |
| 4 or 5 Rooms | 87 (7.6%) | 0 (0.0%) |
| 6 or 7 Rooms | 333 (29.2%) | 8 (10.4%) |
| 8 or more Rooms | 713 (62.5%) | 69 (89.6%) |
| Total | 1,140 (100.0%) | 77 (100.0%) |
Housing Structure by Heating Type in Windermere
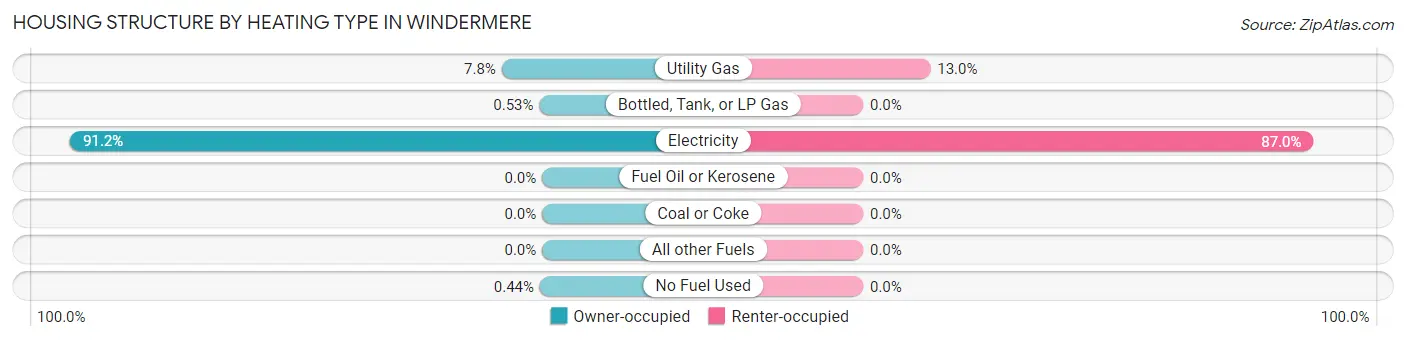
| Heating Type | Owner-occupied | Renter-occupied |
| Utility Gas | 89 (7.8%) | 10 (13.0%) |
| Bottled, Tank, or LP Gas | 6 (0.5%) | 0 (0.0%) |
| Electricity | 1,040 (91.2%) | 67 (87.0%) |
| Fuel Oil or Kerosene | 0 (0.0%) | 0 (0.0%) |
| Coal or Coke | 0 (0.0%) | 0 (0.0%) |
| All other Fuels | 0 (0.0%) | 0 (0.0%) |
| No Fuel Used | 5 (0.4%) | 0 (0.0%) |
| Total | 1,140 (100.0%) | 77 (100.0%) |
Household Vehicle Usage in Windermere
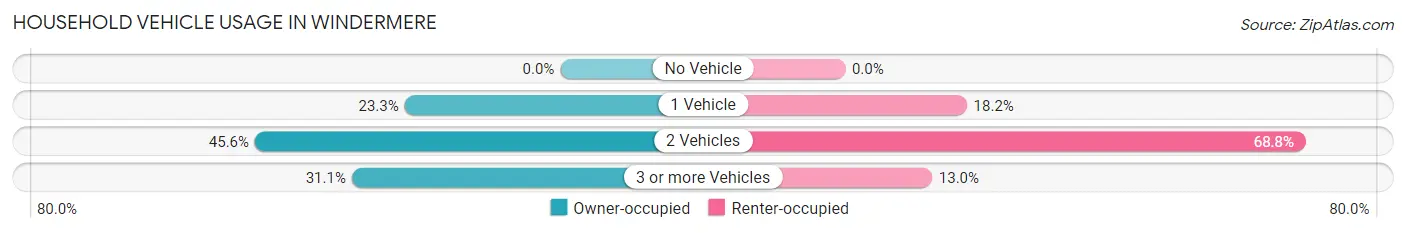
| Vehicles per Household | Owner-occupied | Renter-occupied |
| No Vehicle | 0 (0.0%) | 0 (0.0%) |
| 1 Vehicle | 265 (23.3%) | 14 (18.2%) |
| 2 Vehicles | 520 (45.6%) | 53 (68.8%) |
| 3 or more Vehicles | 355 (31.1%) | 10 (13.0%) |
| Total | 1,140 (100.0%) | 77 (100.0%) |
Real Estate & Mortgages in Windermere
Real Estate and Mortgage Overview in Windermere
| Characteristic | Without Mortgage | With Mortgage |
| Housing Units | 510 | 630 |
| Median Property Value | $711,100 | $785,500 |
| Median Household Income | $123,750 | $378 |
| Monthly Housing Costs | $1,054 | $397 |
| Real Estate Taxes | $6,156 | $0 |
Property Value by Mortgage Status in Windermere
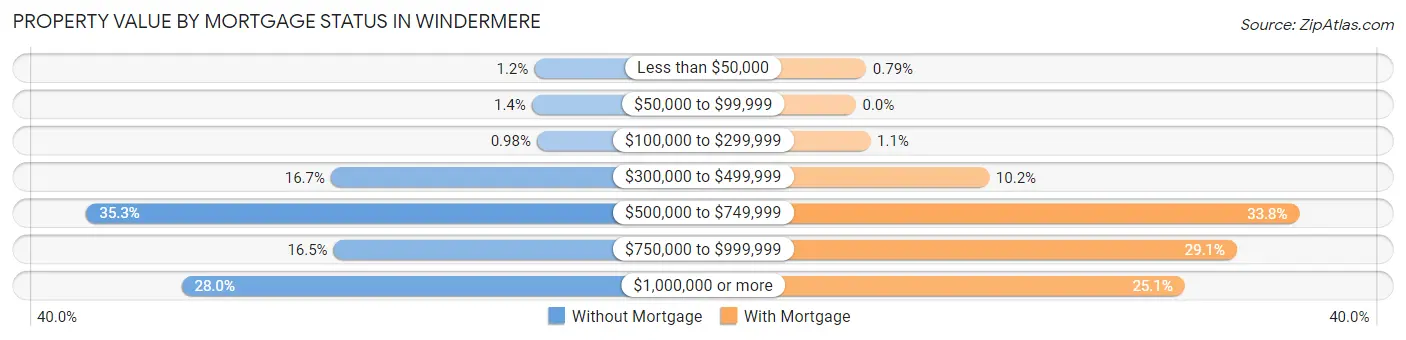
| Property Value | Without Mortgage | With Mortgage |
| Less than $50,000 | 6 (1.2%) | 5 (0.8%) |
| $50,000 to $99,999 | 7 (1.4%) | 0 (0.0%) |
| $100,000 to $299,999 | 5 (1.0%) | 7 (1.1%) |
| $300,000 to $499,999 | 85 (16.7%) | 64 (10.2%) |
| $500,000 to $749,999 | 180 (35.3%) | 213 (33.8%) |
| $750,000 to $999,999 | 84 (16.5%) | 183 (29.0%) |
| $1,000,000 or more | 143 (28.0%) | 158 (25.1%) |
| Total | 510 (100.0%) | 630 (100.0%) |
Household Income by Mortgage Status in Windermere
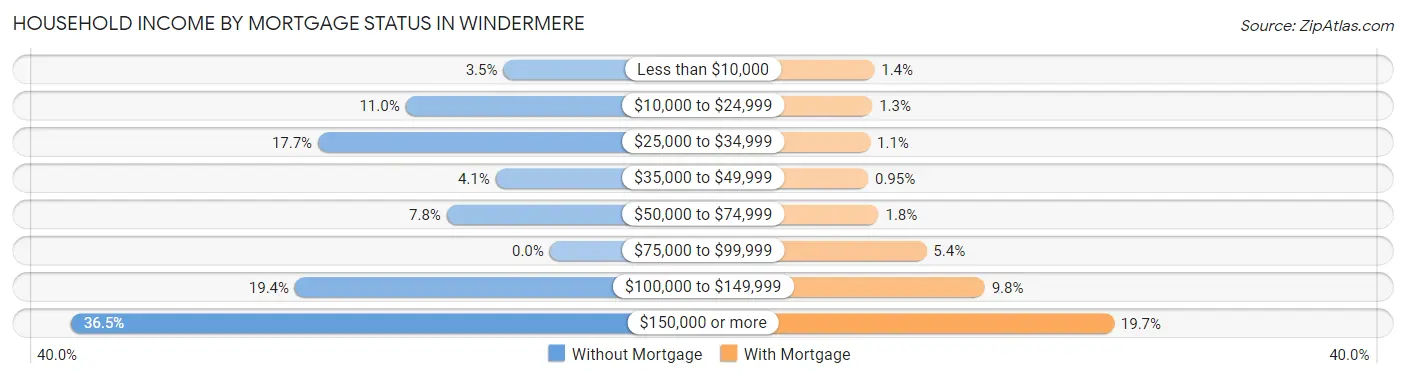
| Household Income | Without Mortgage | With Mortgage |
| Less than $10,000 | 18 (3.5%) | 9 (1.4%) |
| $10,000 to $24,999 | 56 (11.0%) | 8 (1.3%) |
| $25,000 to $34,999 | 90 (17.6%) | 7 (1.1%) |
| $35,000 to $49,999 | 21 (4.1%) | 6 (0.9%) |
| $50,000 to $74,999 | 40 (7.8%) | 11 (1.8%) |
| $75,000 to $99,999 | 0 (0.0%) | 34 (5.4%) |
| $100,000 to $149,999 | 99 (19.4%) | 62 (9.8%) |
| $150,000 or more | 186 (36.5%) | 124 (19.7%) |
| Total | 510 (100.0%) | 630 (100.0%) |
Property Value to Household Income Ratio in Windermere
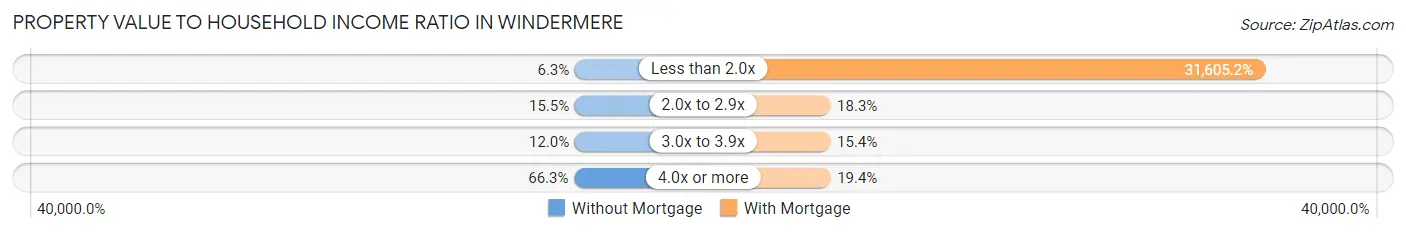
| Value-to-Income Ratio | Without Mortgage | With Mortgage |
| Less than 2.0x | 32 (6.3%) | 199,113 (31,605.2%) |
| 2.0x to 2.9x | 79 (15.5%) | 115 (18.2%) |
| 3.0x to 3.9x | 61 (12.0%) | 97 (15.4%) |
| 4.0x or more | 338 (66.3%) | 122 (19.4%) |
| Total | 510 (100.0%) | 630 (100.0%) |
Real Estate Taxes by Mortgage Status in Windermere
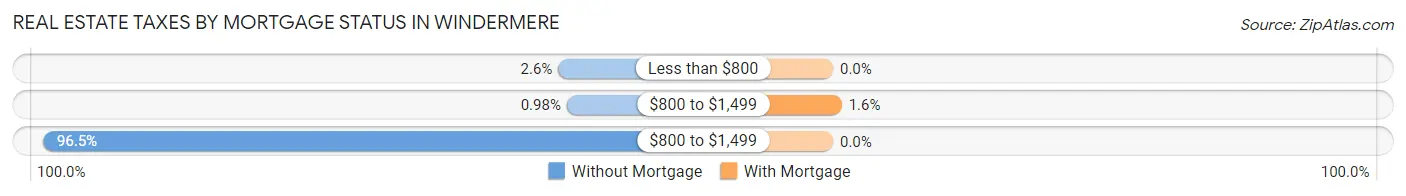
| Property Taxes | Without Mortgage | With Mortgage |
| Less than $800 | 13 (2.5%) | 0 (0.0%) |
| $800 to $1,499 | 5 (1.0%) | 10 (1.6%) |
| $800 to $1,499 | 492 (96.5%) | 0 (0.0%) |
| Total | 510 (100.0%) | 630 (100.0%) |
Health & Disability in Windermere
Health Insurance Coverage by Age in Windermere
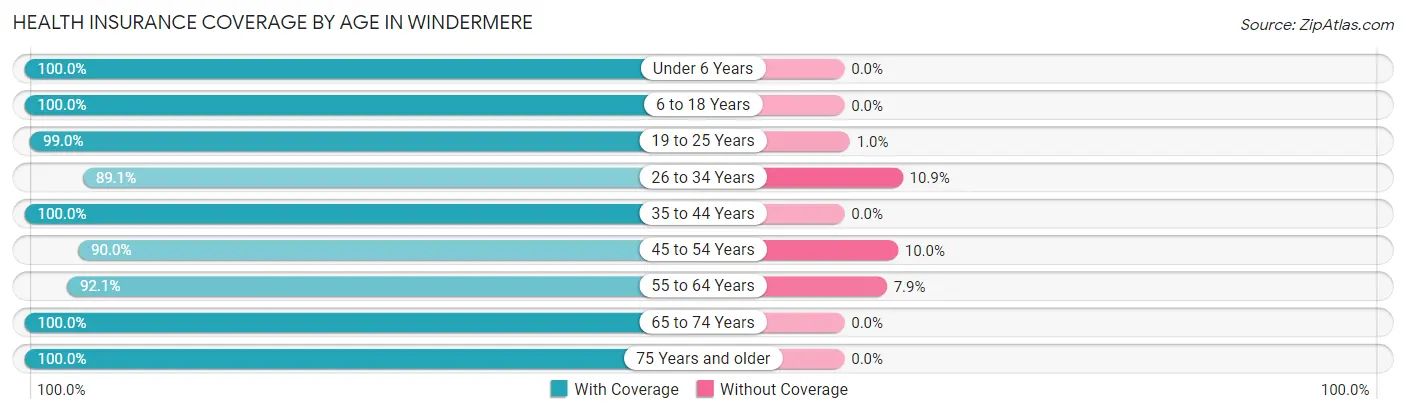
| Age Bracket | With Coverage | Without Coverage |
| Under 6 Years | 154 (100.0%) | 0 (0.0%) |
| 6 to 18 Years | 337 (100.0%) | 0 (0.0%) |
| 19 to 25 Years | 292 (99.0%) | 3 (1.0%) |
| 26 to 34 Years | 156 (89.1%) | 19 (10.9%) |
| 35 to 44 Years | 278 (100.0%) | 0 (0.0%) |
| 45 to 54 Years | 388 (90.0%) | 43 (10.0%) |
| 55 to 64 Years | 559 (92.1%) | 48 (7.9%) |
| 65 to 74 Years | 477 (100.0%) | 0 (0.0%) |
| 75 Years and older | 289 (100.0%) | 0 (0.0%) |
| Total | 2,930 (96.3%) | 113 (3.7%) |
Health Insurance Coverage by Citizenship Status in Windermere
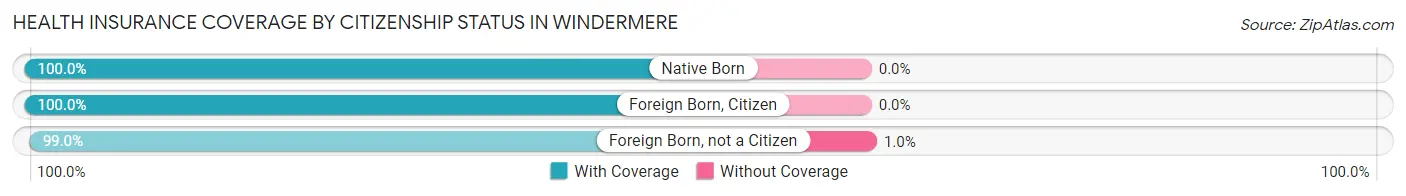
| Citizenship Status | With Coverage | Without Coverage |
| Native Born | 154 (100.0%) | 0 (0.0%) |
| Foreign Born, Citizen | 337 (100.0%) | 0 (0.0%) |
| Foreign Born, not a Citizen | 292 (99.0%) | 3 (1.0%) |
Health Insurance Coverage by Household Income in Windermere
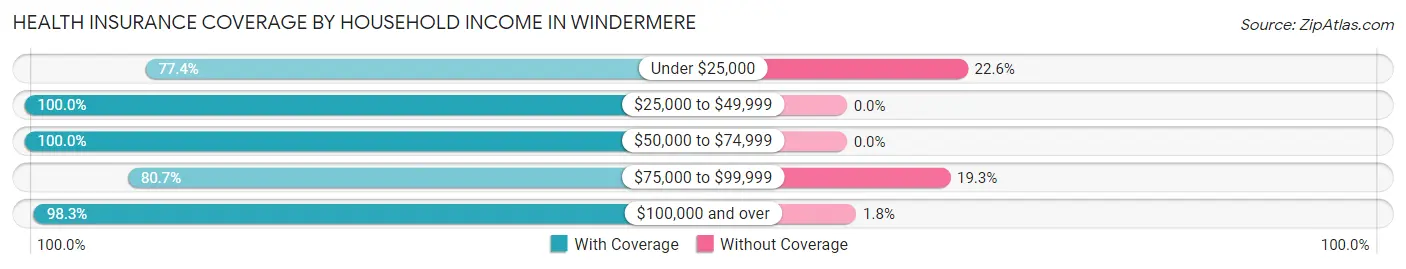
| Household Income | With Coverage | Without Coverage |
| Under $25,000 | 123 (77.4%) | 36 (22.6%) |
| $25,000 to $49,999 | 163 (100.0%) | 0 (0.0%) |
| $50,000 to $74,999 | 145 (100.0%) | 0 (0.0%) |
| $75,000 to $99,999 | 146 (80.7%) | 35 (19.3%) |
| $100,000 and over | 2,353 (98.3%) | 42 (1.8%) |
Public vs Private Health Insurance Coverage by Age in Windermere
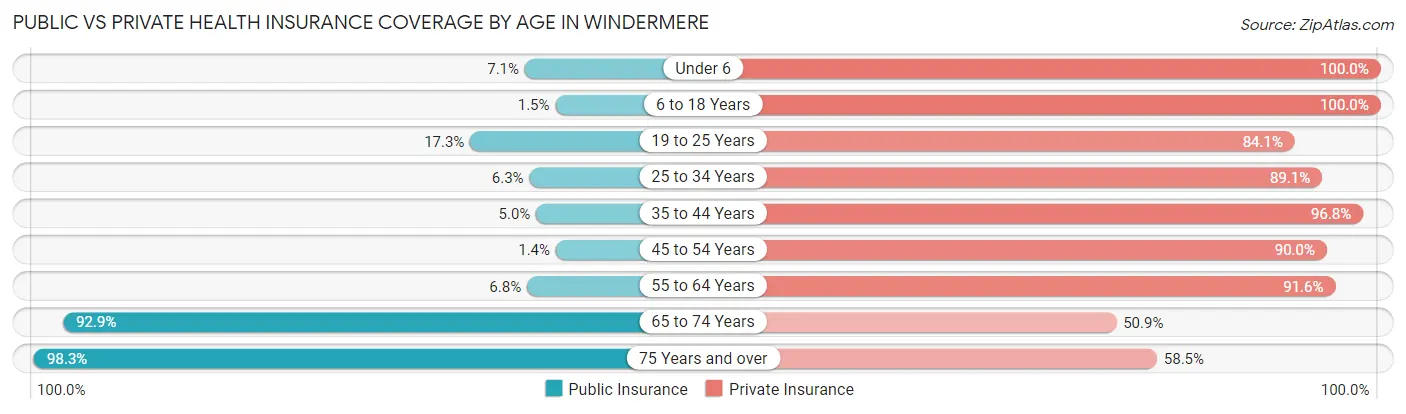
| Age Bracket | Public Insurance | Private Insurance |
| Under 6 | 11 (7.1%) | 154 (100.0%) |
| 6 to 18 Years | 5 (1.5%) | 337 (100.0%) |
| 19 to 25 Years | 51 (17.3%) | 248 (84.1%) |
| 25 to 34 Years | 11 (6.3%) | 156 (89.1%) |
| 35 to 44 Years | 14 (5.0%) | 269 (96.8%) |
| 45 to 54 Years | 6 (1.4%) | 388 (90.0%) |
| 55 to 64 Years | 41 (6.8%) | 556 (91.6%) |
| 65 to 74 Years | 443 (92.9%) | 243 (50.9%) |
| 75 Years and over | 284 (98.3%) | 169 (58.5%) |
| Total | 866 (28.5%) | 2,520 (82.8%) |
Disability Status by Sex by Age in Windermere
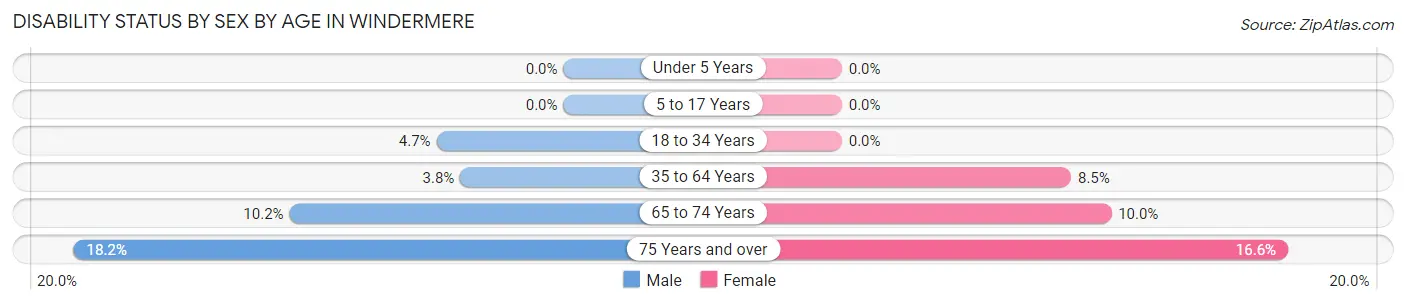
| Age Bracket | Male | Female |
| Under 5 Years | 0 (0.0%) | 0 (0.0%) |
| 5 to 17 Years | 0 (0.0%) | 0 (0.0%) |
| 18 to 34 Years | 13 (4.7%) | 0 (0.0%) |
| 35 to 64 Years | 27 (3.8%) | 52 (8.5%) |
| 65 to 74 Years | 18 (10.2%) | 30 (10.0%) |
| 75 Years and over | 24 (18.2%) | 26 (16.6%) |
Disability Class by Sex by Age in Windermere
Disability Class: Hearing Difficulty
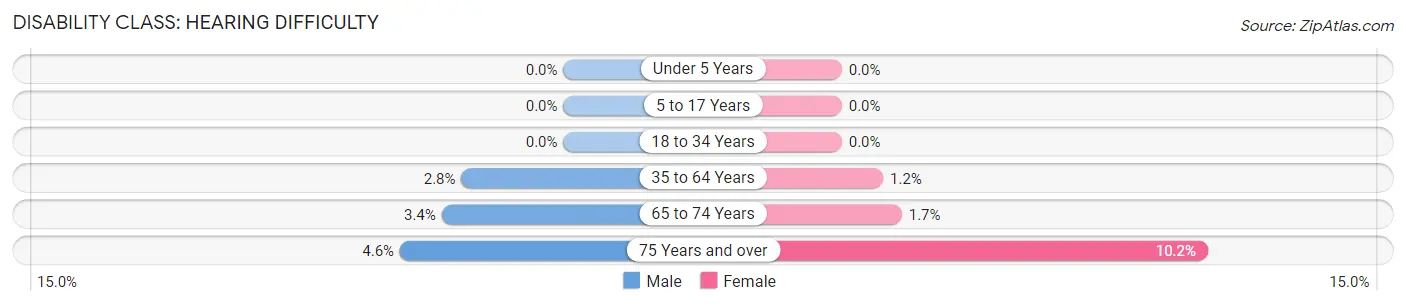
| Age Bracket | Male | Female |
| Under 5 Years | 0 (0.0%) | 0 (0.0%) |
| 5 to 17 Years | 0 (0.0%) | 0 (0.0%) |
| 18 to 34 Years | 0 (0.0%) | 0 (0.0%) |
| 35 to 64 Years | 20 (2.8%) | 7 (1.1%) |
| 65 to 74 Years | 6 (3.4%) | 5 (1.7%) |
| 75 Years and over | 6 (4.5%) | 16 (10.2%) |
Disability Class: Vision Difficulty
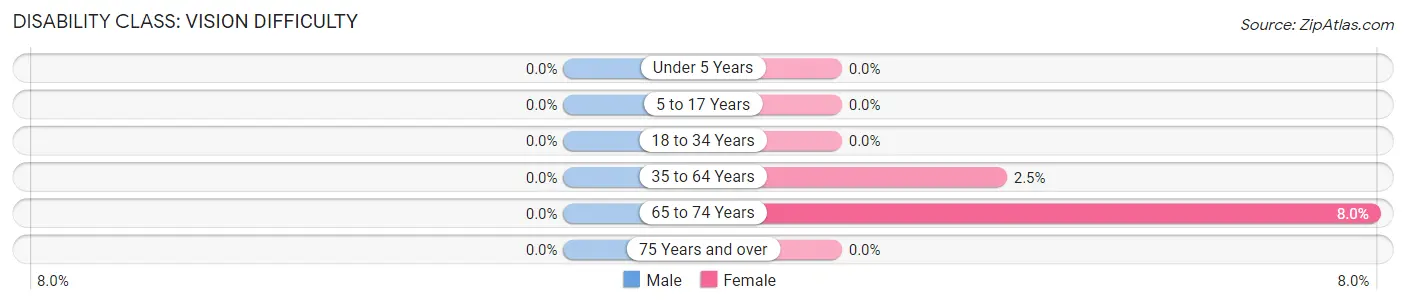
| Age Bracket | Male | Female |
| Under 5 Years | 0 (0.0%) | 0 (0.0%) |
| 5 to 17 Years | 0 (0.0%) | 0 (0.0%) |
| 18 to 34 Years | 0 (0.0%) | 0 (0.0%) |
| 35 to 64 Years | 0 (0.0%) | 15 (2.5%) |
| 65 to 74 Years | 0 (0.0%) | 24 (8.0%) |
| 75 Years and over | 0 (0.0%) | 0 (0.0%) |
Disability Class: Cognitive Difficulty
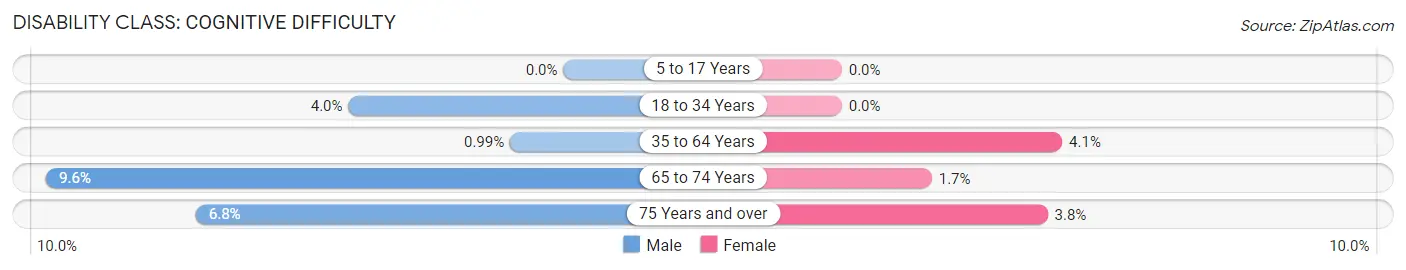
| Age Bracket | Male | Female |
| 5 to 17 Years | 0 (0.0%) | 0 (0.0%) |
| 18 to 34 Years | 11 (4.0%) | 0 (0.0%) |
| 35 to 64 Years | 7 (1.0%) | 25 (4.1%) |
| 65 to 74 Years | 17 (9.6%) | 5 (1.7%) |
| 75 Years and over | 9 (6.8%) | 6 (3.8%) |
Disability Class: Ambulatory Difficulty
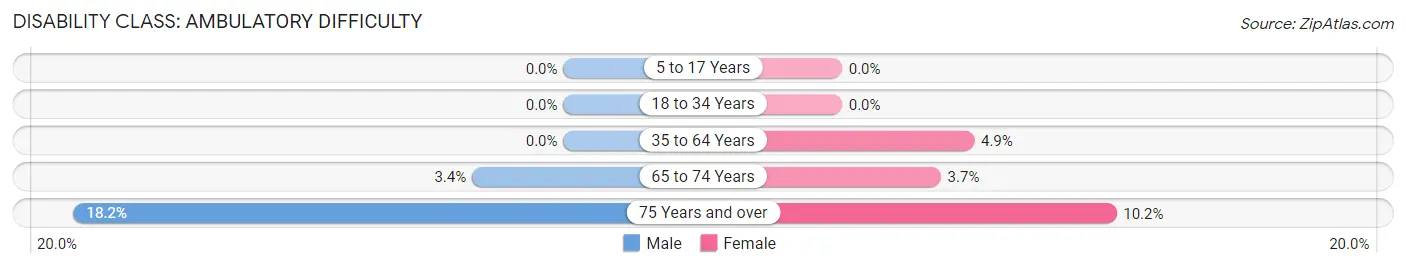
| Age Bracket | Male | Female |
| 5 to 17 Years | 0 (0.0%) | 0 (0.0%) |
| 18 to 34 Years | 0 (0.0%) | 0 (0.0%) |
| 35 to 64 Years | 0 (0.0%) | 30 (4.9%) |
| 65 to 74 Years | 6 (3.4%) | 11 (3.7%) |
| 75 Years and over | 24 (18.2%) | 16 (10.2%) |
Disability Class: Self-Care Difficulty
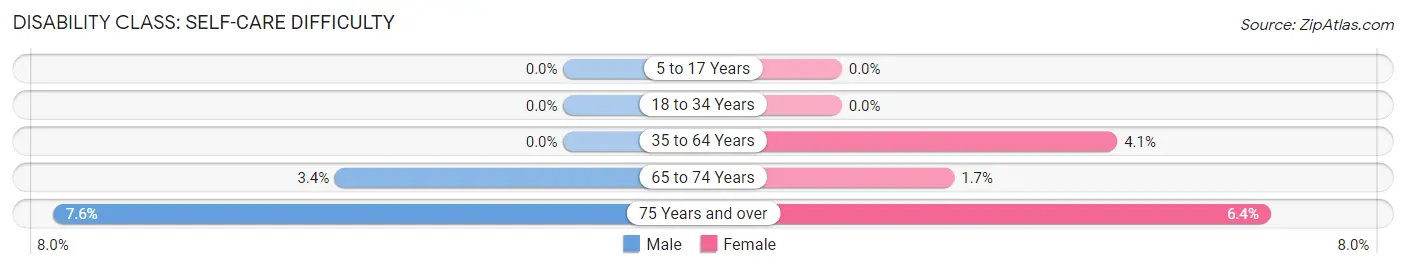
| Age Bracket | Male | Female |
| 5 to 17 Years | 0 (0.0%) | 0 (0.0%) |
| 18 to 34 Years | 0 (0.0%) | 0 (0.0%) |
| 35 to 64 Years | 0 (0.0%) | 25 (4.1%) |
| 65 to 74 Years | 6 (3.4%) | 5 (1.7%) |
| 75 Years and over | 10 (7.6%) | 10 (6.4%) |
Technology Access in Windermere
Computing Device Access in Windermere
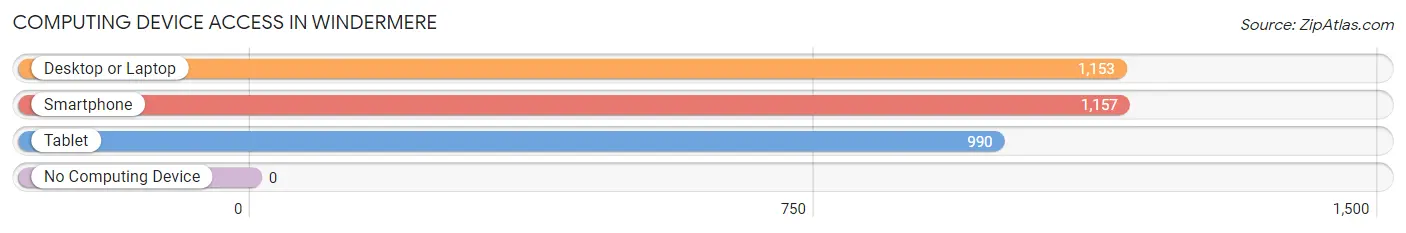
| Device Type | # Households | % Households |
| Desktop or Laptop | 1,153 | 94.7% |
| Smartphone | 1,157 | 95.1% |
| Tablet | 990 | 81.4% |
| No Computing Device | 0 | 0.0% |
| Total | 1,217 | 100.0% |
Internet Access in Windermere
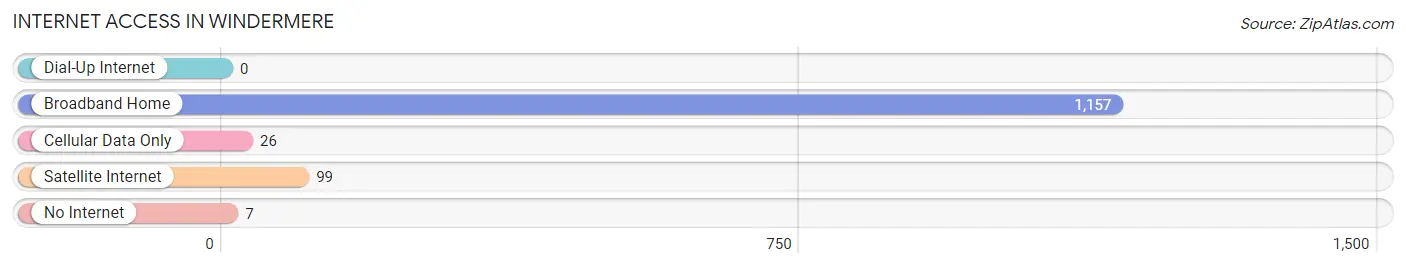
| Internet Type | # Households | % Households |
| Dial-Up Internet | 0 | 0.0% |
| Broadband Home | 1,157 | 95.1% |
| Cellular Data Only | 26 | 2.1% |
| Satellite Internet | 99 | 8.1% |
| No Internet | 7 | 0.6% |
| Total | 1,217 | 100.0% |
Windermere Summary
Windermere is a small town located in Orange County, Florida. It is situated on the western shore of Lake Butler, a large lake in the Orlando metropolitan area. The town has a population of 2,462 as of the 2010 census.
History
Windermere was founded in 1889 by a group of settlers from England. The town was named after Windermere, a lake in the English Lake District. The settlers built a small dock on the lake and began to fish and farm the land. The town grew slowly over the years, and by the early 1900s, it had become a popular tourist destination.
In the 1920s, the town was incorporated and began to attract more visitors. The town was known for its beautiful scenery and its proximity to Orlando. In the 1950s, the town began to experience a population boom as more people moved to the area.
Geography
Windermere is located in Orange County, Florida. It is situated on the western shore of Lake Butler, a large lake in the Orlando metropolitan area. The town has a total area of 1.2 square miles, all of which is land. The town is bordered by the cities of Ocoee and Winter Garden to the north, and by the city of Orlando to the south.
Economy
Windermere’s economy is largely based on tourism and real estate. The town is home to several luxury resorts and golf courses, as well as a number of upscale restaurants and shops. The town also has a thriving real estate market, with many homes and businesses located in the area.
Demographics
As of the 2010 census, Windermere had a population of 2,462. The racial makeup of the town was 87.3% White, 5.2% African American, 0.3% Native American, 2.2% Asian, 0.1% Pacific Islander, 2.2% from other races, and 2.9% from two or more races. Hispanic or Latino of any race were 8.2% of the population.
The median income for a household in the town was $76,944, and the median income for a family was $90,944. The per capita income for the town was $37,944. About 4.2% of families and 5.3% of the population were below the poverty line, including 6.2% of those under age 18 and 4.2% of those age 65 or over.
Common Questions
What is Per Capita Income in Windermere?
Per Capita income in Windermere is $94,687.
What is the Median Family Income in Windermere?
Median Family Income in Windermere is $177,500.
What is the Median Household income in Windermere?
Median Household Income in Windermere is $143,988.
What is Income or Wage Gap in Windermere?
Income or Wage Gap in Windermere is 48.5%.
Women in Windermere earn 51.5 cents for every dollar earned by a man.
What is Family Income Deficit in Windermere?
Family Income Deficit in Windermere is $14,071.
Families that are below poverty line in Windermere earn $14,071 less on average than the poverty threshold level.
What is Inequality or Gini Index in Windermere?
Inequality or Gini Index in Windermere is 0.53.
What is the Total Population of Windermere?
Total Population of Windermere is 3,043.
What is the Total Male Population of Windermere?
Total Male Population of Windermere is 1,555.
What is the Total Female Population of Windermere?
Total Female Population of Windermere is 1,488.
What is the Ratio of Males per 100 Females in Windermere?
There are 104.50 Males per 100 Females in Windermere.
What is the Ratio of Females per 100 Males in Windermere?
There are 95.69 Females per 100 Males in Windermere.
What is the Median Population Age in Windermere?
Median Population Age in Windermere is 52.7 Years.
What is the Average Family Size in Windermere
Average Family Size in Windermere is 2.9 People.
What is the Average Household Size in Windermere
Average Household Size in Windermere is 2.5 People.
How Large is the Labor Force in Windermere?
There are 1,494 People in the Labor Forcein in Windermere.
What is the Percentage of People in the Labor Force in Windermere?
57.4% of People are in the Labor Force in Windermere.
What is the Unemployment Rate in Windermere?
Unemployment Rate in Windermere is 2.1%.