Medicine Lake, MT Map & Demographics
Medicine Lake Map
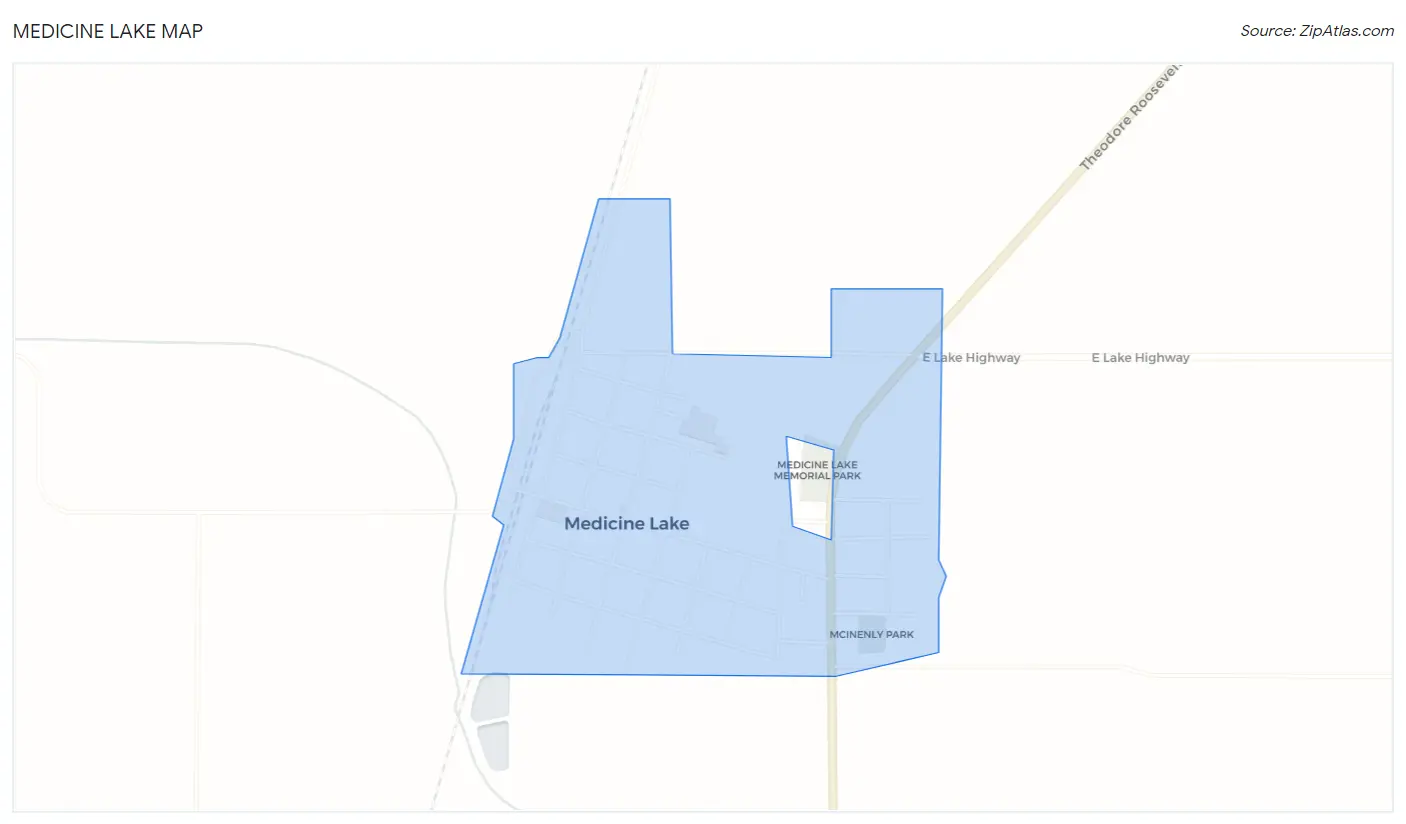
Medicine Lake Overview
$35,856
PER CAPITA INCOME
$84,375
AVG FAMILY INCOME
$41,875
AVG HOUSEHOLD INCOME
48.4%
WAGE / INCOME GAP [ % ]
51.6¢/ $1
WAGE / INCOME GAP [ $ ]
0.40
INEQUALITY / GINI INDEX
206
TOTAL POPULATION
129
MALE POPULATION
77
FEMALE POPULATION
167.53
MALES / 100 FEMALES
59.69
FEMALES / 100 MALES
46.0
MEDIAN AGE
2.7
AVG FAMILY SIZE
1.8
AVG HOUSEHOLD SIZE
122
LABOR FORCE [ PEOPLE ]
68.9%
PERCENT IN LABOR FORCE
3.3%
UNEMPLOYMENT RATE
Medicine Lake Zip Codes
Medicine Lake Area Codes
Income in Medicine Lake
Income Overview in Medicine Lake
Per Capita Income in Medicine Lake is $35,856, while median incomes of families and households are $84,375 and $41,875 respectively.
| Characteristic | Number | Measure |
| Per Capita Income | 206 | $35,856 |
| Median Family Income | 41 | $84,375 |
| Mean Family Income | 41 | $83,868 |
| Median Household Income | 116 | $41,875 |
| Mean Household Income | 116 | $59,122 |
| Income Deficit | 41 | $0 |
| Wage / Income Gap (%) | 206 | 48.41% |
| Wage / Income Gap ($) | 206 | 51.59¢ per $1 |
| Gini / Inequality Index | 206 | 0.40 |
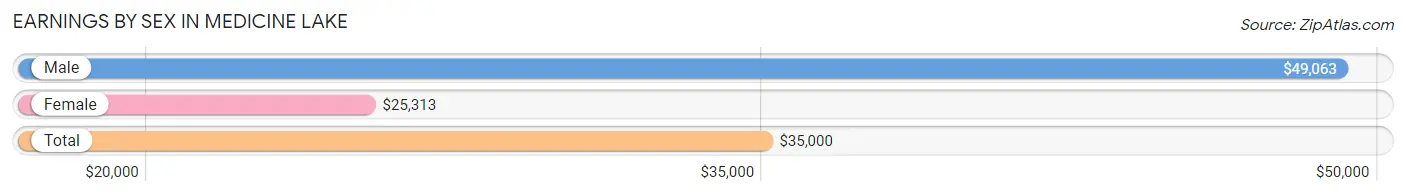
Earnings by Sex in Medicine Lake
Average Earnings in Medicine Lake are $35,000, $49,063 for men and $25,313 for women, a difference of 48.4%.
| Sex | Number | Average Earnings |
| Male | 85 (64.4%) | $49,063 |
| Female | 47 (35.6%) | $25,313 |
| Total | 132 (100.0%) | $35,000 |
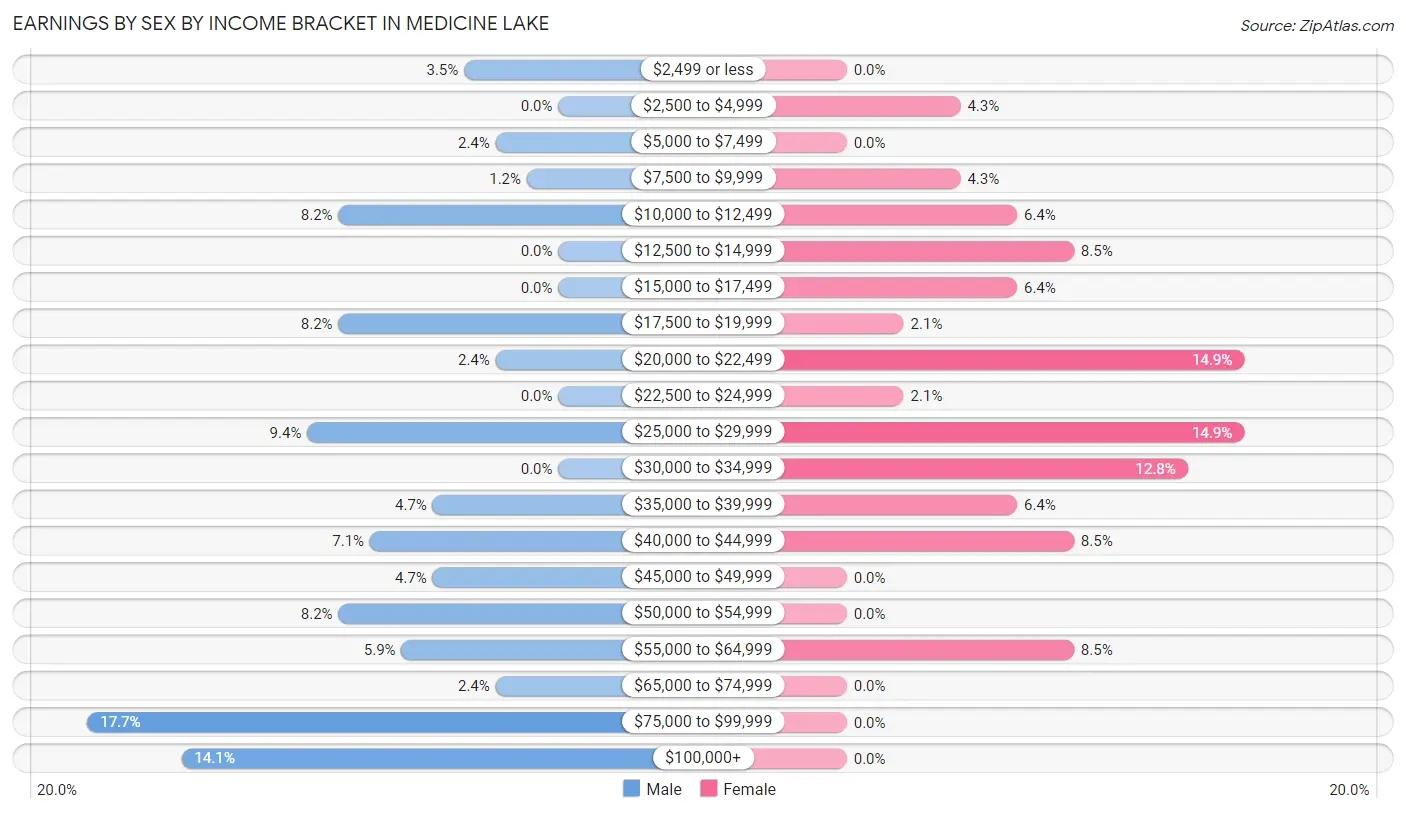
Earnings by Sex by Income Bracket in Medicine Lake
The most common earnings brackets in Medicine Lake are $75,000 to $99,999 for men (15 | 17.6%) and $20,000 to $22,499 for women (7 | 14.9%).
| Income | Male | Female |
| $2,499 or less | 3 (3.5%) | 0 (0.0%) |
| $2,500 to $4,999 | 0 (0.0%) | 2 (4.3%) |
| $5,000 to $7,499 | 2 (2.4%) | 0 (0.0%) |
| $7,500 to $9,999 | 1 (1.2%) | 2 (4.3%) |
| $10,000 to $12,499 | 7 (8.2%) | 3 (6.4%) |
| $12,500 to $14,999 | 0 (0.0%) | 4 (8.5%) |
| $15,000 to $17,499 | 0 (0.0%) | 3 (6.4%) |
| $17,500 to $19,999 | 7 (8.2%) | 1 (2.1%) |
| $20,000 to $22,499 | 2 (2.4%) | 7 (14.9%) |
| $22,500 to $24,999 | 0 (0.0%) | 1 (2.1%) |
| $25,000 to $29,999 | 8 (9.4%) | 7 (14.9%) |
| $30,000 to $34,999 | 0 (0.0%) | 6 (12.8%) |
| $35,000 to $39,999 | 4 (4.7%) | 3 (6.4%) |
| $40,000 to $44,999 | 6 (7.1%) | 4 (8.5%) |
| $45,000 to $49,999 | 4 (4.7%) | 0 (0.0%) |
| $50,000 to $54,999 | 7 (8.2%) | 0 (0.0%) |
| $55,000 to $64,999 | 5 (5.9%) | 4 (8.5%) |
| $65,000 to $74,999 | 2 (2.4%) | 0 (0.0%) |
| $75,000 to $99,999 | 15 (17.6%) | 0 (0.0%) |
| $100,000+ | 12 (14.1%) | 0 (0.0%) |
| Total | 85 (100.0%) | 47 (100.0%) |
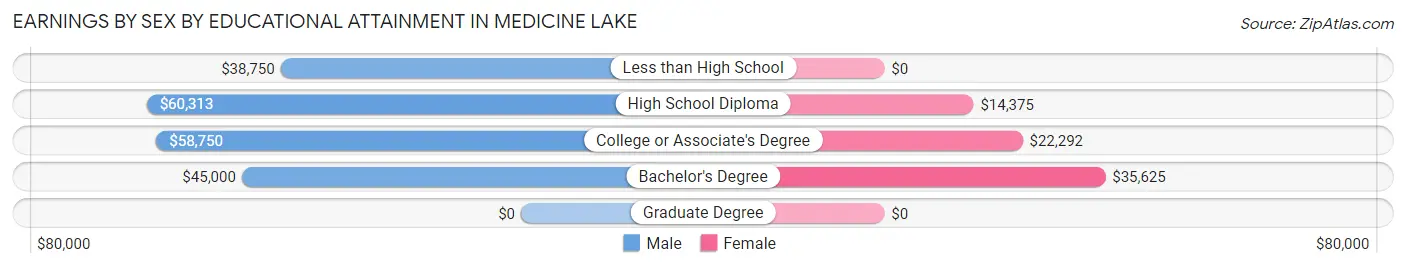
Earnings by Sex by Educational Attainment in Medicine Lake
Average earnings in Medicine Lake are $51,071 for men and $25,000 for women, a difference of 51.0%. Men with an educational attainment of high school diploma enjoy the highest average annual earnings of $60,313, while those with less than high school education earn the least with $38,750. Women with an educational attainment of bachelor's degree earn the most with the average annual earnings of $35,625, while those with high school diploma education have the smallest earnings of $14,375.
| Educational Attainment | Male Income | Female Income |
| Less than High School | $38,750 | $0 |
| High School Diploma | $60,313 | $14,375 |
| College or Associate's Degree | $58,750 | $22,292 |
| Bachelor's Degree | $45,000 | $35,625 |
| Graduate Degree | - | - |
| Total | $51,071 | $25,000 |
Family Income in Medicine Lake
Family Income Brackets in Medicine Lake
According to the Medicine Lake family income data, there are 10 families falling into the $75,000 to $99,999 income range, which is the most common income bracket and makes up 24.4% of all families.
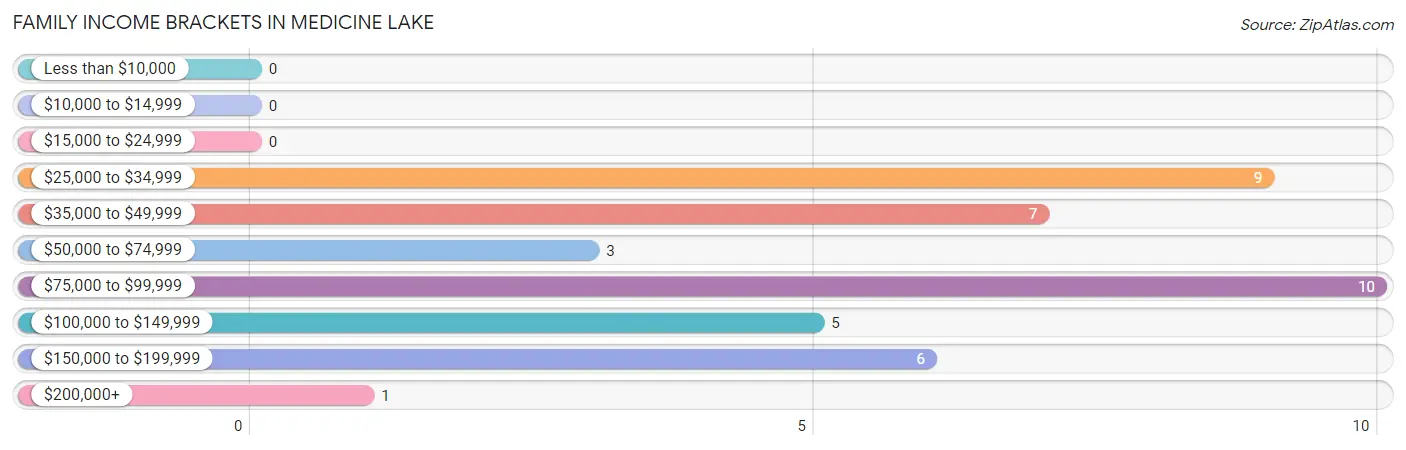
| Income Bracket | # Families | % Families |
| Less than $10,000 | 0 | 0.0% |
| $10,000 to $14,999 | 0 | 0.0% |
| $15,000 to $24,999 | 0 | 0.0% |
| $25,000 to $34,999 | 9 | 22.0% |
| $35,000 to $49,999 | 7 | 17.1% |
| $50,000 to $74,999 | 3 | 7.3% |
| $75,000 to $99,999 | 10 | 24.4% |
| $100,000 to $149,999 | 5 | 12.2% |
| $150,000 to $199,999 | 6 | 14.6% |
| $200,000+ | 1 | 2.4% |
Family Income by Famaliy Size in Medicine Lake
2-person families (34 | 82.9%) account for the highest median family income in Medicine Lake with $85,000 per family, while 2-person families (34 | 82.9%) have the highest median income of $42,500 per family member.
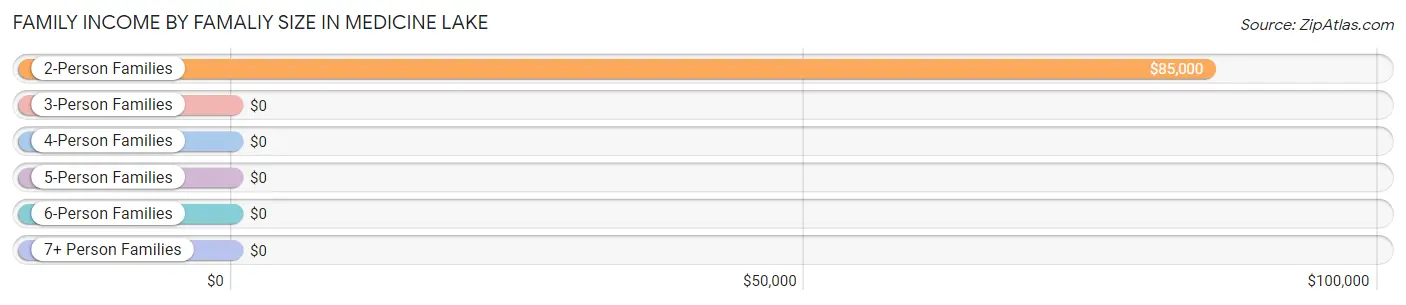
| Income Bracket | # Families | Median Income |
| 2-Person Families | 34 (82.9%) | $85,000 |
| 3-Person Families | 0 (0.0%) | $0 |
| 4-Person Families | 5 (12.2%) | $0 |
| 5-Person Families | 2 (4.9%) | $0 |
| 6-Person Families | 0 (0.0%) | $0 |
| 7+ Person Families | 0 (0.0%) | $0 |
| Total | 41 (100.0%) | $84,375 |
Family Income by Number of Earners in Medicine Lake
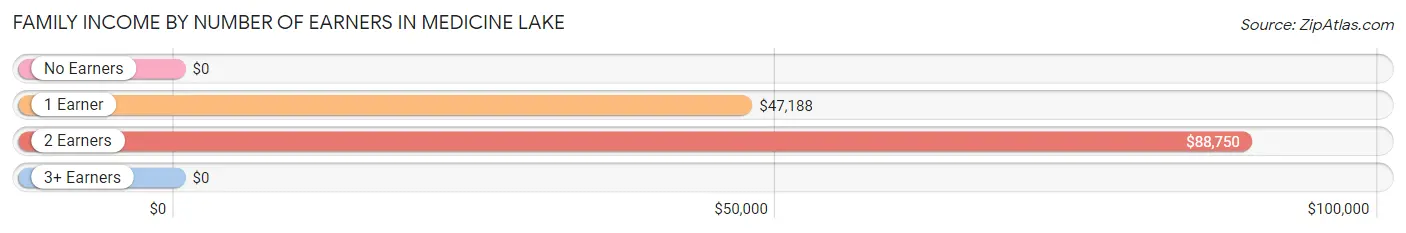
| Number of Earners | # Families | Median Income |
| No Earners | 2 (4.9%) | $0 |
| 1 Earner | 13 (31.7%) | $47,188 |
| 2 Earners | 24 (58.5%) | $88,750 |
| 3+ Earners | 2 (4.9%) | $0 |
| Total | 41 (100.0%) | $84,375 |
Household Income in Medicine Lake
Household Income Brackets in Medicine Lake
With 21 households falling in the category, the $75,000 to $99,999 income range is the most frequent in Medicine Lake, accounting for 18.1% of all households. In contrast, only 1 households (0.9%) fall into the $200,000+ income bracket, making it the least populous group.
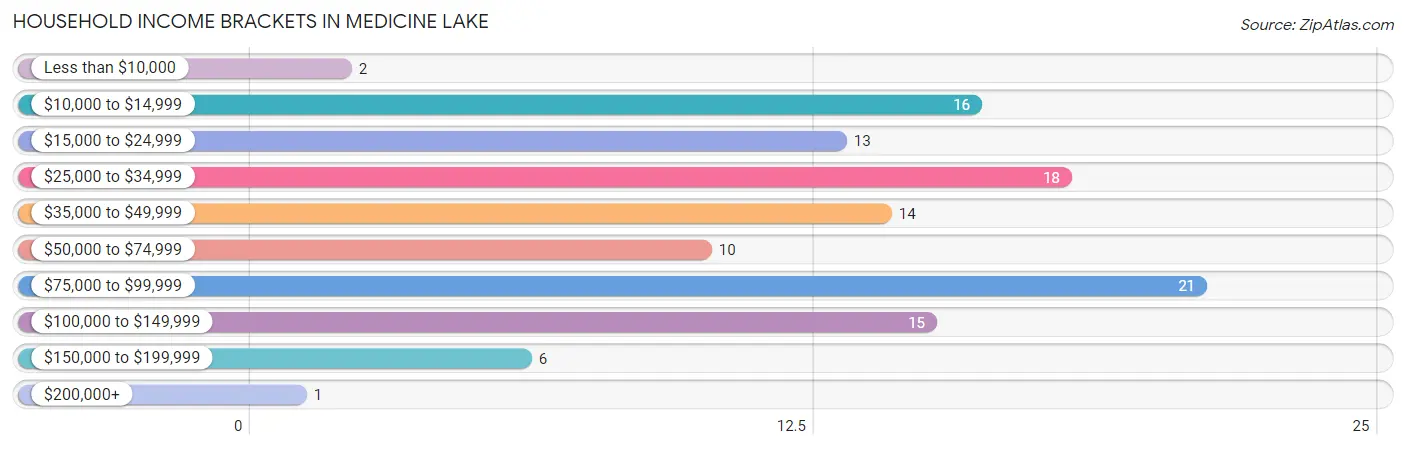
| Income Bracket | # Households | % Households |
| Less than $10,000 | 2 | 1.7% |
| $10,000 to $14,999 | 16 | 13.8% |
| $15,000 to $24,999 | 13 | 11.2% |
| $25,000 to $34,999 | 18 | 15.5% |
| $35,000 to $49,999 | 14 | 12.1% |
| $50,000 to $74,999 | 10 | 8.6% |
| $75,000 to $99,999 | 21 | 18.1% |
| $100,000 to $149,999 | 15 | 12.9% |
| $150,000 to $199,999 | 6 | 5.2% |
| $200,000+ | 1 | 0.9% |
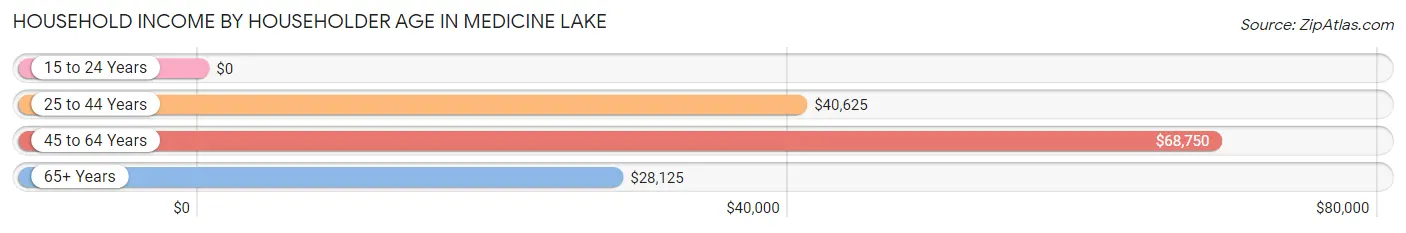
Household Income by Householder Age in Medicine Lake
The median household income in Medicine Lake is $41,875, with the highest median household income of $68,750 found in the 45 to 64 years age bracket for the primary householder. A total of 35 households (30.2%) fall into this category. Meanwhile, the 15 to 24 years age bracket for the primary householder has the lowest median household income of $0, with 5 households (4.3%) in this group.
| Income Bracket | # Households | Median Income |
| 15 to 24 Years | 5 (4.3%) | $0 |
| 25 to 44 Years | 35 (30.2%) | $40,625 |
| 45 to 64 Years | 35 (30.2%) | $68,750 |
| 65+ Years | 41 (35.3%) | $28,125 |
| Total | 116 (100.0%) | $41,875 |
Poverty in Medicine Lake
Income Below Poverty by Sex and Age in Medicine Lake
With 13.3% poverty level for males and 9.2% for females among the residents of Medicine Lake, 15 year old males and 65 to 74 year old females are the most vulnerable to poverty, with 3 males (100.0%) and 2 females (28.6%) in their respective age groups living below the poverty level.
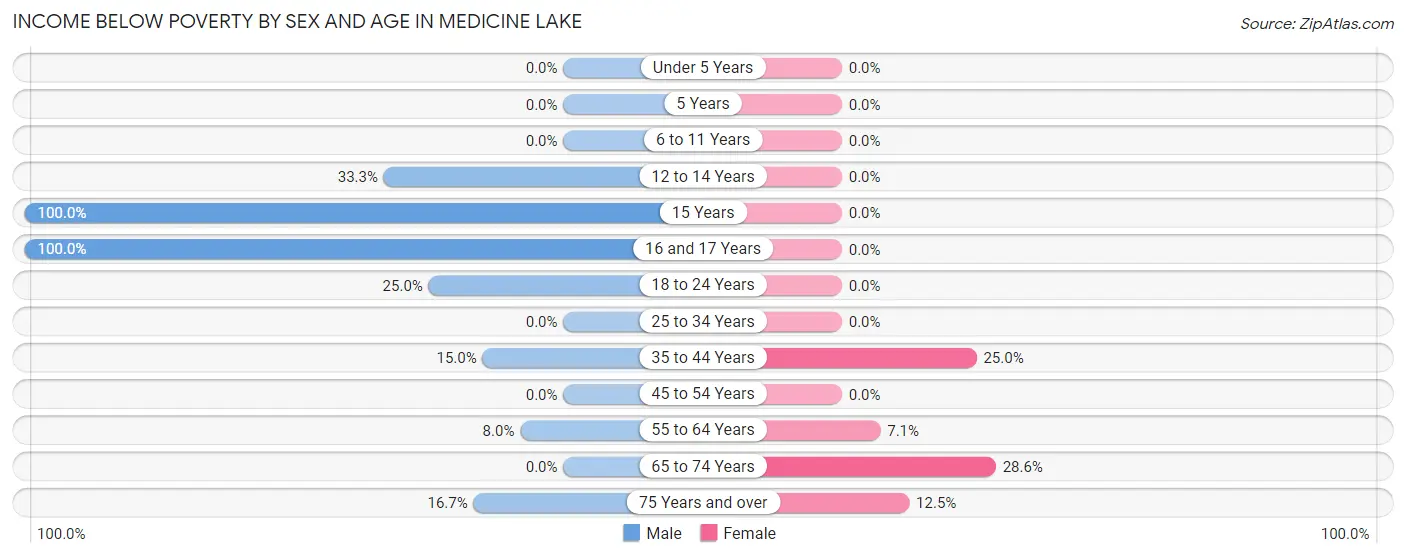
| Age Bracket | Male | Female |
| Under 5 Years | 0 (0.0%) | 0 (0.0%) |
| 5 Years | 0 (0.0%) | 0 (0.0%) |
| 6 to 11 Years | 0 (0.0%) | 0 (0.0%) |
| 12 to 14 Years | 3 (33.3%) | 0 (0.0%) |
| 15 Years | 3 (100.0%) | 0 (0.0%) |
| 16 and 17 Years | 3 (100.0%) | 0 (0.0%) |
| 18 to 24 Years | 2 (25.0%) | 0 (0.0%) |
| 25 to 34 Years | 0 (0.0%) | 0 (0.0%) |
| 35 to 44 Years | 3 (15.0%) | 2 (25.0%) |
| 45 to 54 Years | 0 (0.0%) | 0 (0.0%) |
| 55 to 64 Years | 2 (8.0%) | 1 (7.1%) |
| 65 to 74 Years | 0 (0.0%) | 2 (28.6%) |
| 75 Years and over | 1 (16.7%) | 2 (12.5%) |
| Total | 17 (13.3%) | 7 (9.2%) |
Income Above Poverty by Sex and Age in Medicine Lake
According to the poverty statistics in Medicine Lake, males aged under 5 years and females aged 6 to 11 years are the age groups that are most secure financially, with 100.0% of males and 100.0% of females in these age groups living above the poverty line.
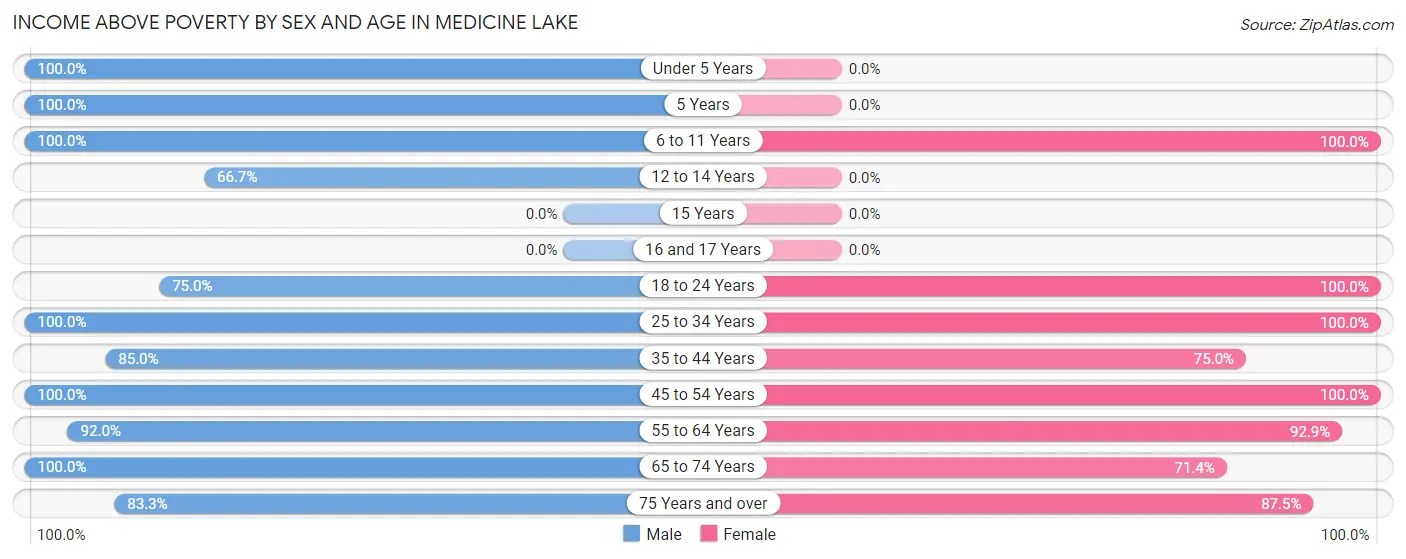
| Age Bracket | Male | Female |
| Under 5 Years | 4 (100.0%) | 0 (0.0%) |
| 5 Years | 5 (100.0%) | 0 (0.0%) |
| 6 to 11 Years | 4 (100.0%) | 2 (100.0%) |
| 12 to 14 Years | 6 (66.7%) | 0 (0.0%) |
| 15 Years | 0 (0.0%) | 0 (0.0%) |
| 16 and 17 Years | 0 (0.0%) | 0 (0.0%) |
| 18 to 24 Years | 6 (75.0%) | 3 (100.0%) |
| 25 to 34 Years | 12 (100.0%) | 15 (100.0%) |
| 35 to 44 Years | 17 (85.0%) | 6 (75.0%) |
| 45 to 54 Years | 11 (100.0%) | 11 (100.0%) |
| 55 to 64 Years | 23 (92.0%) | 13 (92.9%) |
| 65 to 74 Years | 18 (100.0%) | 5 (71.4%) |
| 75 Years and over | 5 (83.3%) | 14 (87.5%) |
| Total | 111 (86.7%) | 69 (90.8%) |
Income Below Poverty Among Married-Couple Families in Medicine Lake
The poverty statistics for married-couple families in Medicine Lake show that 5.6% or 2 of the total 36 families live below the poverty line. Families with 3 or 4 children have the highest poverty rate of 100.0%, comprising of 2 families. On the other hand, families with no children have the lowest poverty rate of 0.0%, which includes 0 families.
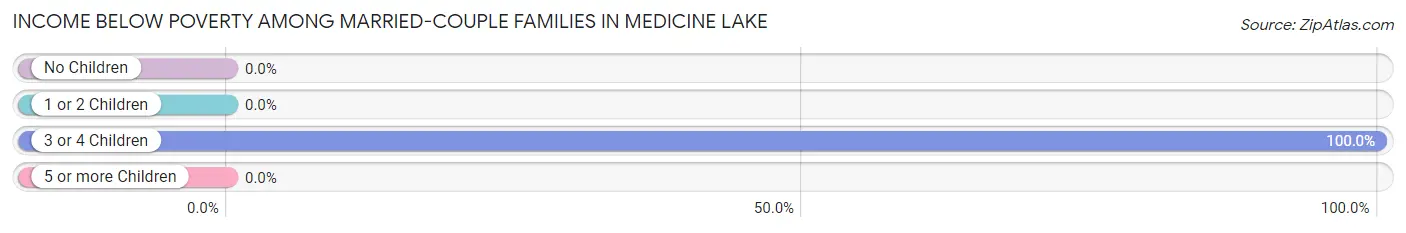
| Children | Above Poverty | Below Poverty |
| No Children | 29 (100.0%) | 0 (0.0%) |
| 1 or 2 Children | 5 (100.0%) | 0 (0.0%) |
| 3 or 4 Children | 0 (0.0%) | 2 (100.0%) |
| 5 or more Children | 0 (0.0%) | 0 (0.0%) |
| Total | 34 (94.4%) | 2 (5.6%) |
Income Below Poverty Among Single-Parent Households in Medicine Lake
| Children | Single Father | Single Mother |
| No Children | 0 (0.0%) | 0 (0.0%) |
| 1 or 2 Children | 0 (0.0%) | 0 (0.0%) |
| 3 or 4 Children | 0 (0.0%) | 0 (0.0%) |
| 5 or more Children | 0 (0.0%) | 0 (0.0%) |
| Total | 0 (0.0%) | 0 (0.0%) |
Income Below Poverty Among Married-Couple vs Single-Parent Households in Medicine Lake
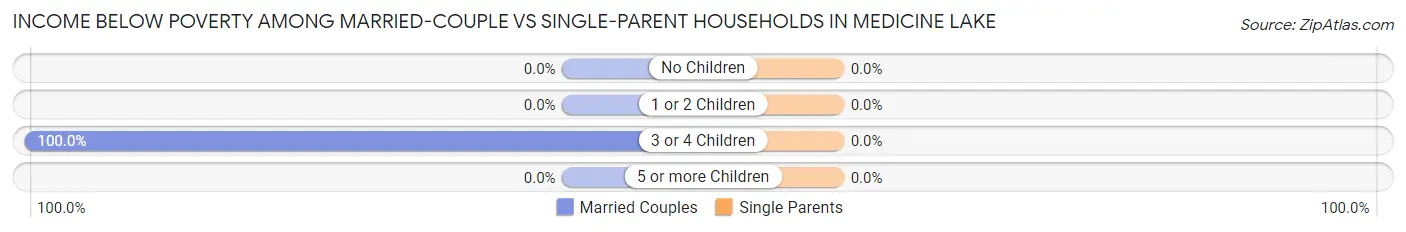
| Children | Married-Couple Families | Single-Parent Households |
| No Children | 0 (0.0%) | 0 (0.0%) |
| 1 or 2 Children | 0 (0.0%) | 0 (0.0%) |
| 3 or 4 Children | 2 (100.0%) | 0 (0.0%) |
| 5 or more Children | 0 (0.0%) | 0 (0.0%) |
| Total | 2 (5.6%) | 0 (0.0%) |
Race in Medicine Lake
The most populous races in Medicine Lake are White / Caucasian (188 | 91.3%), Hispanic or Latino (13 | 6.3%), and Native / Alaskan (12 | 5.8%).
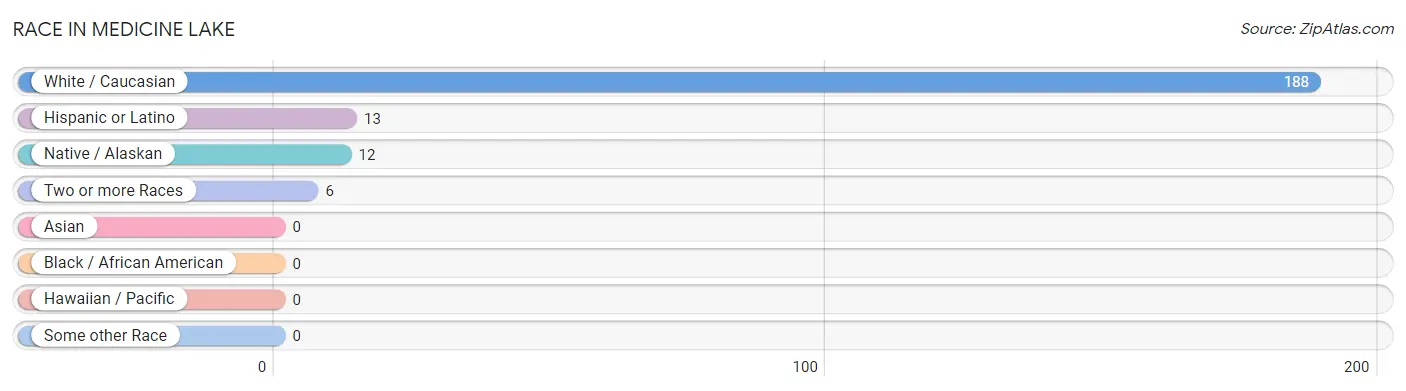
| Race | # Population | % Population |
| Asian | 0 | 0.0% |
| Black / African American | 0 | 0.0% |
| Hawaiian / Pacific | 0 | 0.0% |
| Hispanic or Latino | 13 | 6.3% |
| Native / Alaskan | 12 | 5.8% |
| White / Caucasian | 188 | 91.3% |
| Two or more Races | 6 | 2.9% |
| Some other Race | 0 | 0.0% |
| Total | 206 | 100.0% |
Ancestry in Medicine Lake
The most populous ancestries reported in Medicine Lake are Norwegian (43 | 20.9%), German (42 | 20.4%), Irish (39 | 18.9%), European (20 | 9.7%), and English (17 | 8.3%), together accounting for 78.1% of all Medicine Lake residents.
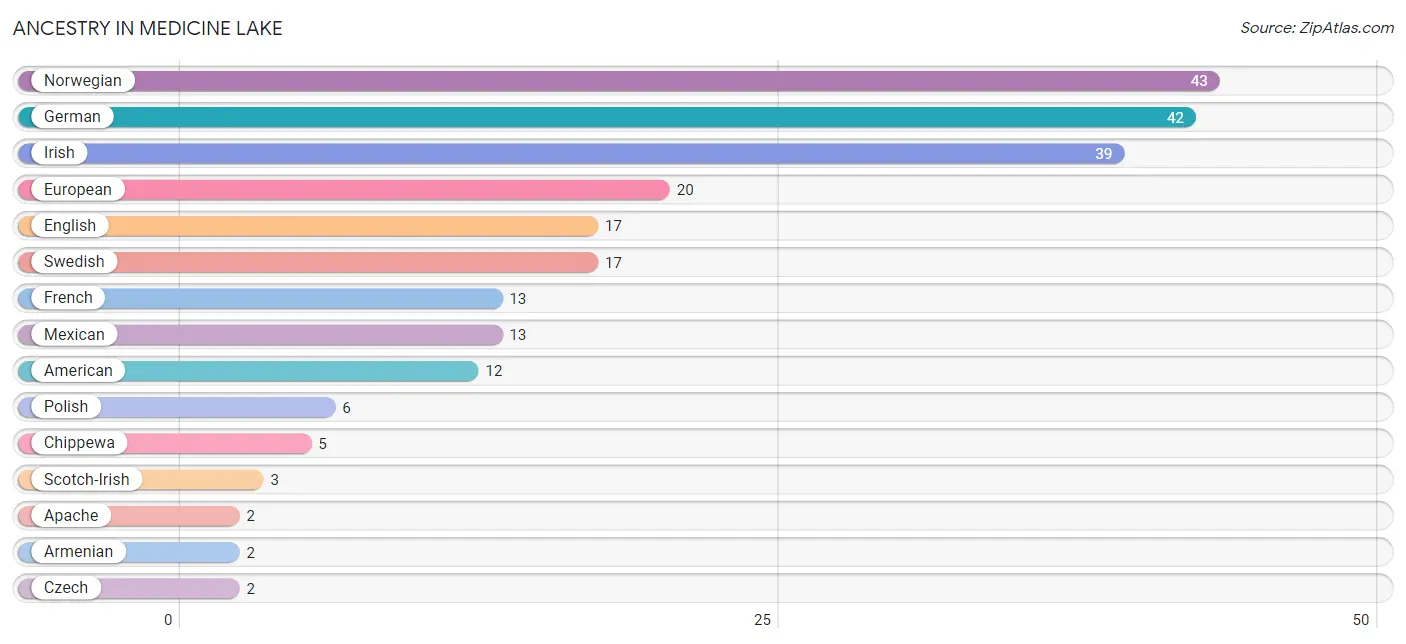
| Ancestry | # Population | % Population |
| American | 12 | 5.8% |
| Apache | 2 | 1.0% |
| Armenian | 2 | 1.0% |
| Chippewa | 5 | 2.4% |
| Czech | 2 | 1.0% |
| English | 17 | 8.3% |
| European | 20 | 9.7% |
| French | 13 | 6.3% |
| French Canadian | 2 | 1.0% |
| German | 42 | 20.4% |
| Irish | 39 | 18.9% |
| Jamaican | 2 | 1.0% |
| Mexican | 13 | 6.3% |
| Norwegian | 43 | 20.9% |
| Pennsylvania German | 1 | 0.5% |
| Polish | 6 | 2.9% |
| Russian | 2 | 1.0% |
| Scotch-Irish | 3 | 1.5% |
| Scottish | 2 | 1.0% |
| Sioux | 2 | 1.0% |
| Swedish | 17 | 8.3% | View All 21 Rows |
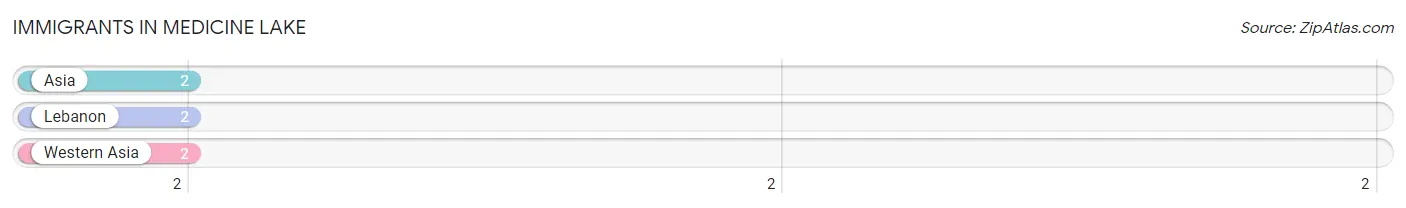
Immigrants in Medicine Lake
The most numerous immigrant groups reported in Medicine Lake came from Asia (2 | 1.0%), Lebanon (2 | 1.0%), and Western Asia (2 | 1.0%), together accounting for 2.9% of all Medicine Lake residents.
| Immigration Origin | # Population | % Population |
| Asia | 2 | 1.0% |
| Lebanon | 2 | 1.0% |
| Western Asia | 2 | 1.0% | View All 3 Rows |
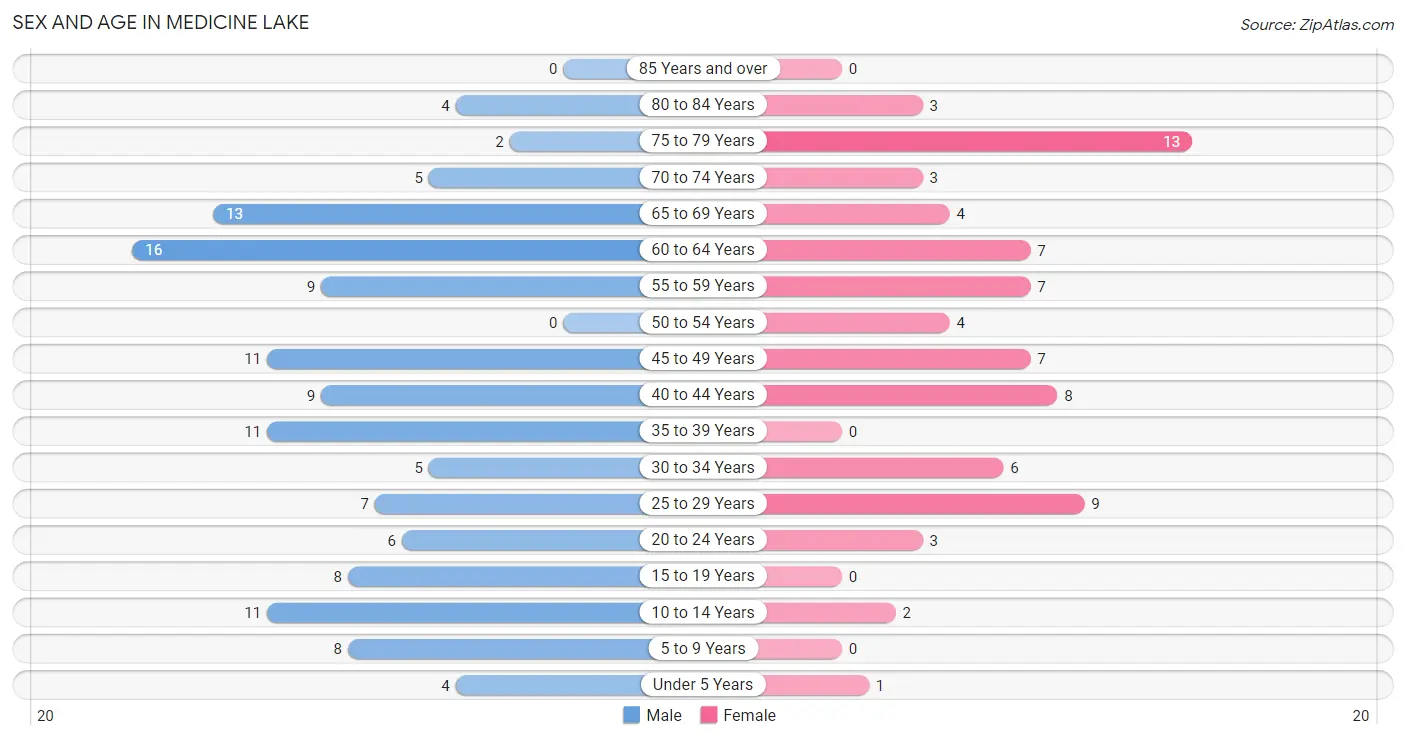
Sex and Age in Medicine Lake
Sex and Age in Medicine Lake
The most populous age groups in Medicine Lake are 60 to 64 Years (16 | 12.4%) for men and 75 to 79 Years (13 | 16.9%) for women.
| Age Bracket | Male | Female |
| Under 5 Years | 4 (3.1%) | 1 (1.3%) |
| 5 to 9 Years | 8 (6.2%) | 0 (0.0%) |
| 10 to 14 Years | 11 (8.5%) | 2 (2.6%) |
| 15 to 19 Years | 8 (6.2%) | 0 (0.0%) |
| 20 to 24 Years | 6 (4.6%) | 3 (3.9%) |
| 25 to 29 Years | 7 (5.4%) | 9 (11.7%) |
| 30 to 34 Years | 5 (3.9%) | 6 (7.8%) |
| 35 to 39 Years | 11 (8.5%) | 0 (0.0%) |
| 40 to 44 Years | 9 (7.0%) | 8 (10.4%) |
| 45 to 49 Years | 11 (8.5%) | 7 (9.1%) |
| 50 to 54 Years | 0 (0.0%) | 4 (5.2%) |
| 55 to 59 Years | 9 (7.0%) | 7 (9.1%) |
| 60 to 64 Years | 16 (12.4%) | 7 (9.1%) |
| 65 to 69 Years | 13 (10.1%) | 4 (5.2%) |
| 70 to 74 Years | 5 (3.9%) | 3 (3.9%) |
| 75 to 79 Years | 2 (1.5%) | 13 (16.9%) |
| 80 to 84 Years | 4 (3.1%) | 3 (3.9%) |
| 85 Years and over | 0 (0.0%) | 0 (0.0%) |
| Total | 129 (100.0%) | 77 (100.0%) |
Families and Households in Medicine Lake
Median Family Size in Medicine Lake
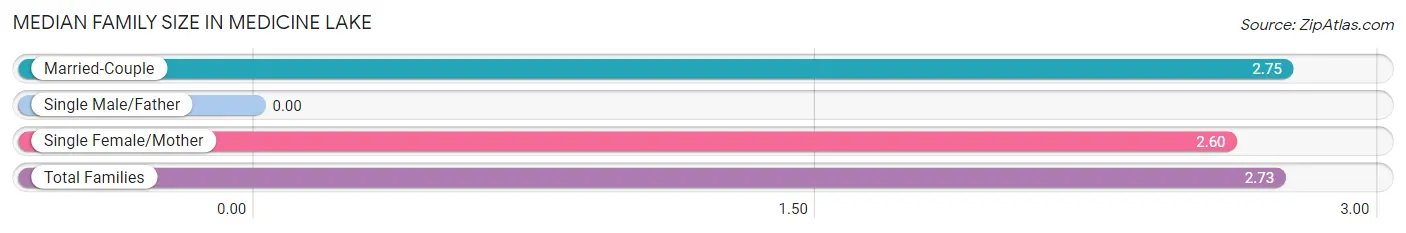
| Family Type | # Families | Family Size |
| Married-Couple | 36 (87.8%) | 2.75 |
| Single Male/Father | 0 (0.0%) | - |
| Single Female/Mother | 5 (12.2%) | 2.60 |
| Total Families | 41 (100.0%) | 2.73 |
Median Household Size in Medicine Lake
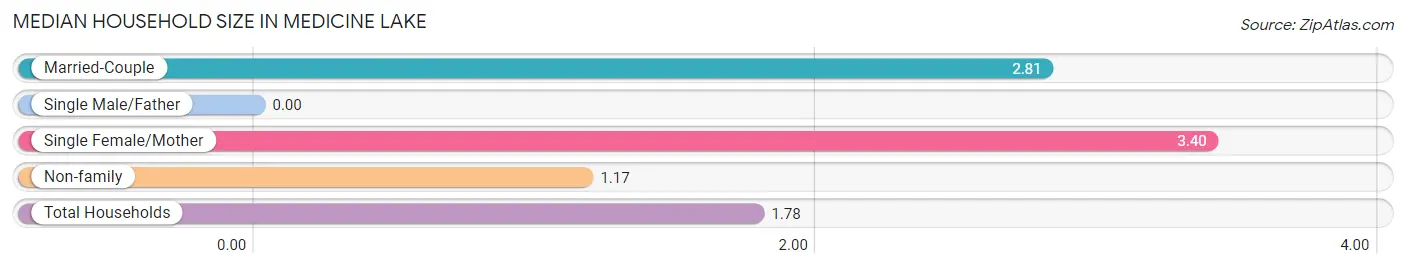
| Household Type | # Households | Household Size |
| Married-Couple | 36 (31.0%) | 2.81 |
| Single Male/Father | 0 (0.0%) | - |
| Single Female/Mother | 5 (4.3%) | 3.40 |
| Non-family | 75 (64.7%) | 1.17 |
| Total Households | 116 (100.0%) | 1.78 |
Household Size by Marriage Status in Medicine Lake
Out of a total of 116 households in Medicine Lake, 41 (35.3%) are family households, while 75 (64.7%) are nonfamily households. The most numerous type of family households are 2-person households, comprising 30, and the most common type of nonfamily households are 1-person households, comprising 67.
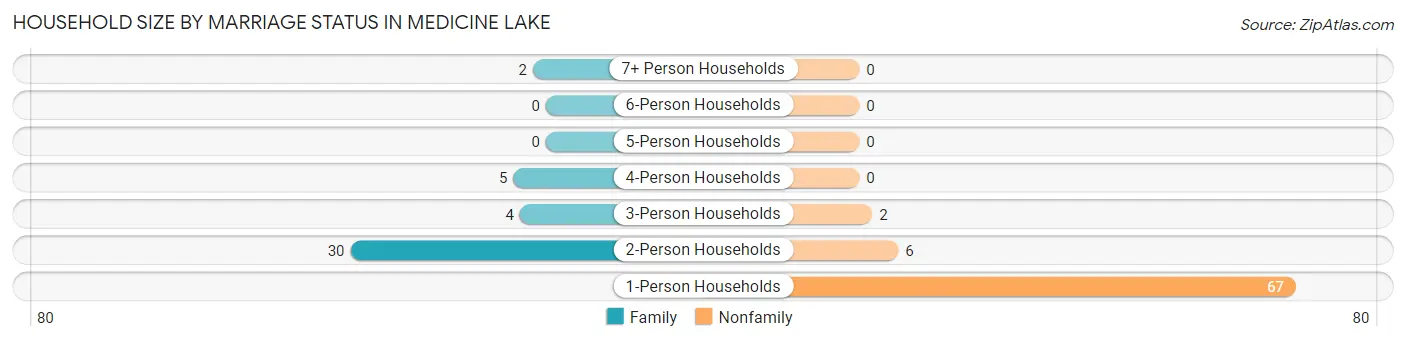
| Household Size | Family Households | Nonfamily Households |
| 1-Person Households | - | 67 (57.8%) |
| 2-Person Households | 30 (25.9%) | 6 (5.2%) |
| 3-Person Households | 4 (3.5%) | 2 (1.7%) |
| 4-Person Households | 5 (4.3%) | 0 (0.0%) |
| 5-Person Households | 0 (0.0%) | 0 (0.0%) |
| 6-Person Households | 0 (0.0%) | 0 (0.0%) |
| 7+ Person Households | 2 (1.7%) | 0 (0.0%) |
| Total | 41 (35.3%) | 75 (64.7%) |
Female Fertility in Medicine Lake
Fertility by Age in Medicine Lake
| Age Bracket | Women with Births | Births / 1,000 Women |
| 15 to 19 years | 0 (0.0%) | 0.0 |
| 20 to 34 years | 0 (0.0%) | 0.0 |
| 35 to 50 years | 0 (0.0%) | 0.0 |
| Total | 0 (0.0%) | 0.0 |
Fertility by Age by Marriage Status in Medicine Lake
| Age Bracket | Married | Unmarried |
| 15 to 19 years | 0 (0.0%) | 0 (0.0%) |
| 20 to 34 years | 0 (0.0%) | 0 (0.0%) |
| 35 to 50 years | 0 (0.0%) | 0 (0.0%) |
| Total | 0 (0.0%) | 0 (0.0%) |
Fertility by Education in Medicine Lake
| Educational Attainment | Women with Births | Births / 1,000 Women |
| Less than High School | 0 (0.0%) | 0.0 |
| High School Diploma | 0 (0.0%) | 0.0 |
| College or Associate's Degree | 0 (0.0%) | 0.0 |
| Bachelor's Degree | 0 (0.0%) | 0.0 |
| Graduate Degree | 0 (0.0%) | 0.0 |
| Total | 0 (0.0%) | 0.0 |
Fertility by Education by Marriage Status in Medicine Lake
| Educational Attainment | Married | Unmarried |
| Less than High School | 0 (0.0%) | 0 (0.0%) |
| High School Diploma | 0 (0.0%) | 0 (0.0%) |
| College or Associate's Degree | 0 (0.0%) | 0 (0.0%) |
| Bachelor's Degree | 0 (0.0%) | 0 (0.0%) |
| Graduate Degree | 0 (0.0%) | 0 (0.0%) |
| Total | 0 (0.0%) | 0 (0.0%) |
Employment Characteristics in Medicine Lake
Employment by Class of Employer in Medicine Lake
Among the 114 employed individuals in Medicine Lake, private company employees (38 | 33.3%), local government employees (18 | 15.8%), and self-employed (not incorporated) (15 | 13.2%) make up the most common classes of employment.
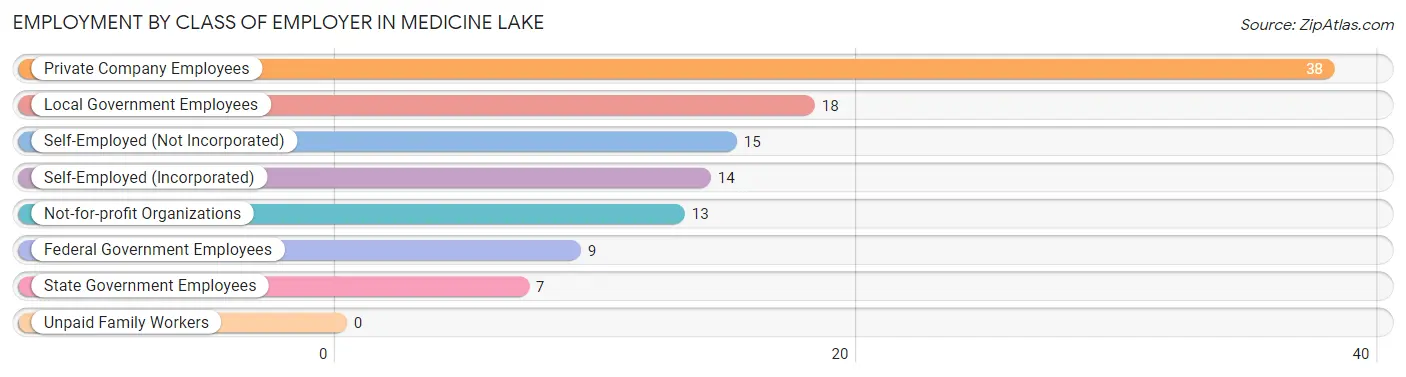
| Employer Class | # Employees | % Employees |
| Private Company Employees | 38 | 33.3% |
| Self-Employed (Incorporated) | 14 | 12.3% |
| Self-Employed (Not Incorporated) | 15 | 13.2% |
| Not-for-profit Organizations | 13 | 11.4% |
| Local Government Employees | 18 | 15.8% |
| State Government Employees | 7 | 6.1% |
| Federal Government Employees | 9 | 7.9% |
| Unpaid Family Workers | 0 | 0.0% |
| Total | 114 | 100.0% |
Employment Status by Age in Medicine Lake
According to the labor force statistics for Medicine Lake, out of the total population over 16 years of age (177), 68.9% or 122 individuals are in the labor force, with 3.3% or 4 of them unemployed. The age group with the highest labor force participation rate is 20 to 24 years, with 100.0% or 9 individuals in the labor force. Within the labor force, the 25 to 29 years age range has the highest percentage of unemployed individuals, with 25.0% or 4 of them being unemployed.
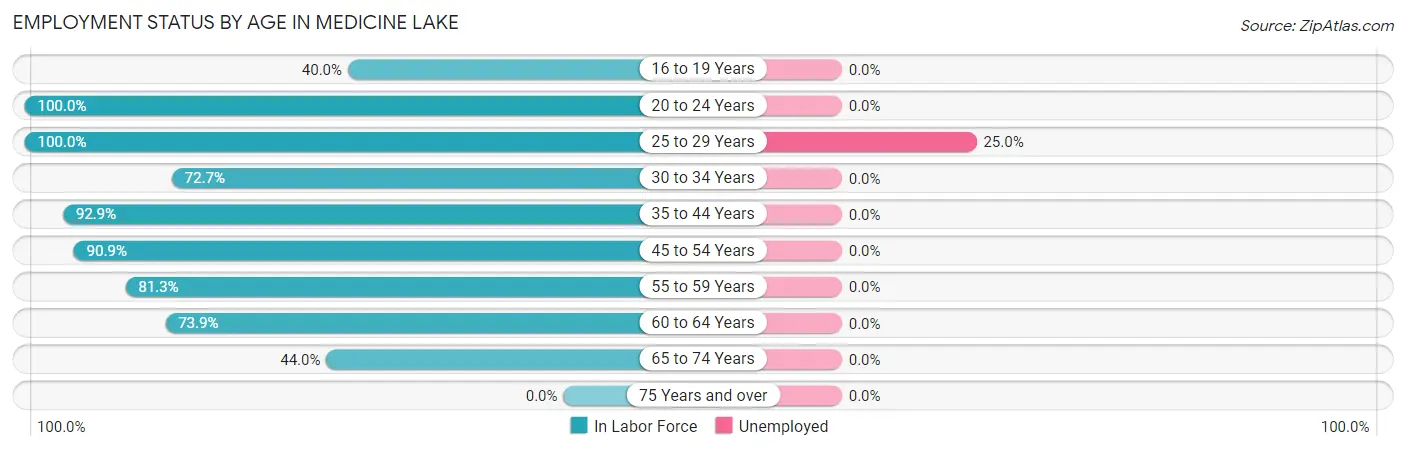
| Age Bracket | In Labor Force | Unemployed |
| 16 to 19 Years | 2 (40.0%) | 0 (0.0%) |
| 20 to 24 Years | 9 (100.0%) | 0 (0.0%) |
| 25 to 29 Years | 16 (100.0%) | 4 (25.0%) |
| 30 to 34 Years | 8 (72.7%) | 0 (0.0%) |
| 35 to 44 Years | 26 (92.9%) | 0 (0.0%) |
| 45 to 54 Years | 20 (90.9%) | 0 (0.0%) |
| 55 to 59 Years | 13 (81.3%) | 0 (0.0%) |
| 60 to 64 Years | 17 (73.9%) | 0 (0.0%) |
| 65 to 74 Years | 11 (44.0%) | 0 (0.0%) |
| 75 Years and over | 0 (0.0%) | 0 (0.0%) |
| Total | 122 (68.9%) | 4 (3.3%) |
Employment Status by Educational Attainment in Medicine Lake
According to labor force statistics for Medicine Lake, 86.2% of individuals (100) out of the total population between 25 and 64 years of age (116) are in the labor force, with 4.0% or 4 of them being unemployed. The group with the highest labor force participation rate are those with the educational attainment of less than high school, with 100.0% or 6 individuals in the labor force. Within the labor force, individuals with high school diploma education have the highest percentage of unemployment, with 14.3% or 4 of them being unemployed.
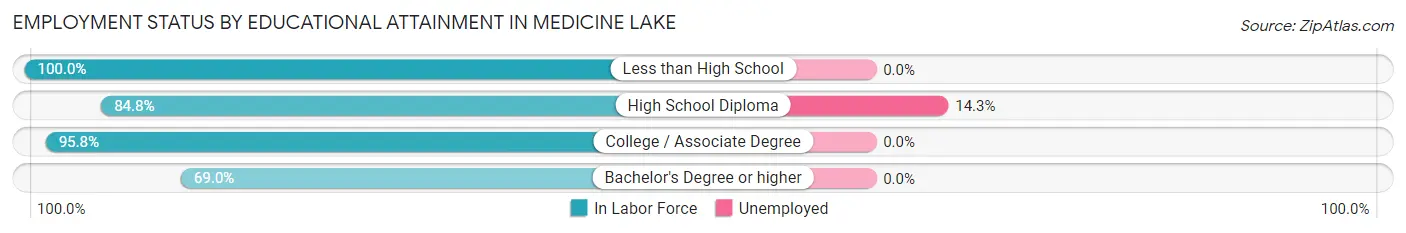
| Educational Attainment | In Labor Force | Unemployed |
| Less than High School | 6 (100.0%) | 0 (0.0%) |
| High School Diploma | 28 (84.8%) | 5 (14.3%) |
| College / Associate Degree | 46 (95.8%) | 0 (0.0%) |
| Bachelor's Degree or higher | 20 (69.0%) | 0 (0.0%) |
| Total | 100 (86.2%) | 5 (4.0%) |
Employment Occupations by Sex in Medicine Lake
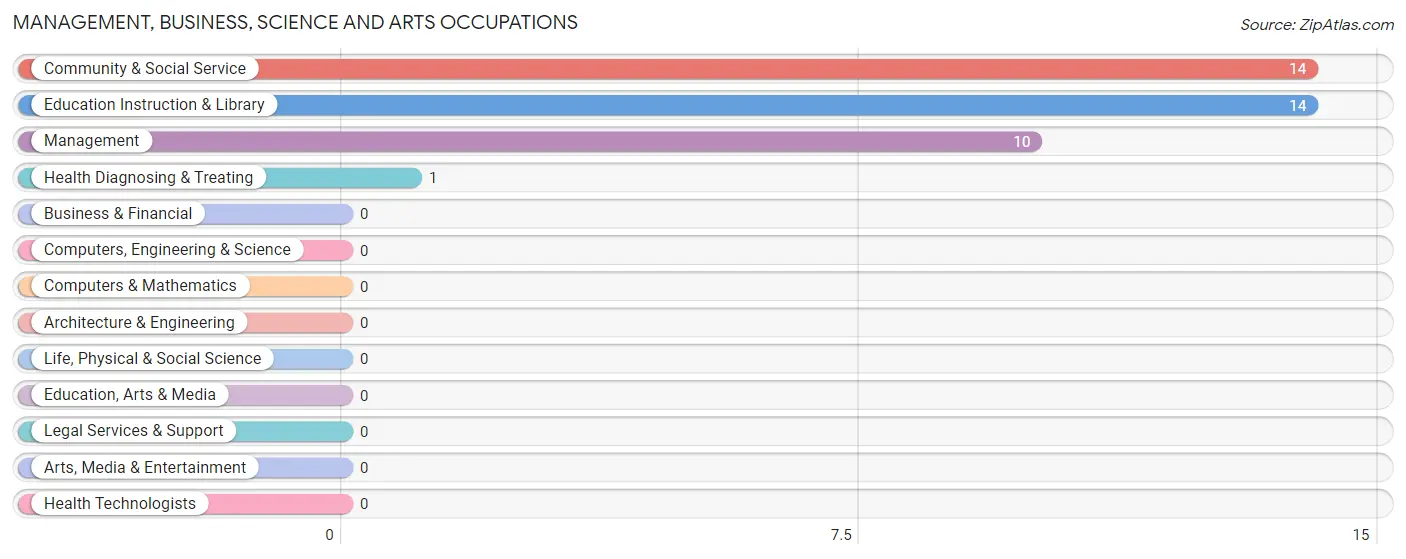
Management, Business, Science and Arts Occupations
The most common Management, Business, Science and Arts occupations in Medicine Lake are Community & Social Service (14 | 11.9%), Education Instruction & Library (14 | 11.9%), Management (10 | 8.5%), and Health Diagnosing & Treating (1 | 0.9%).
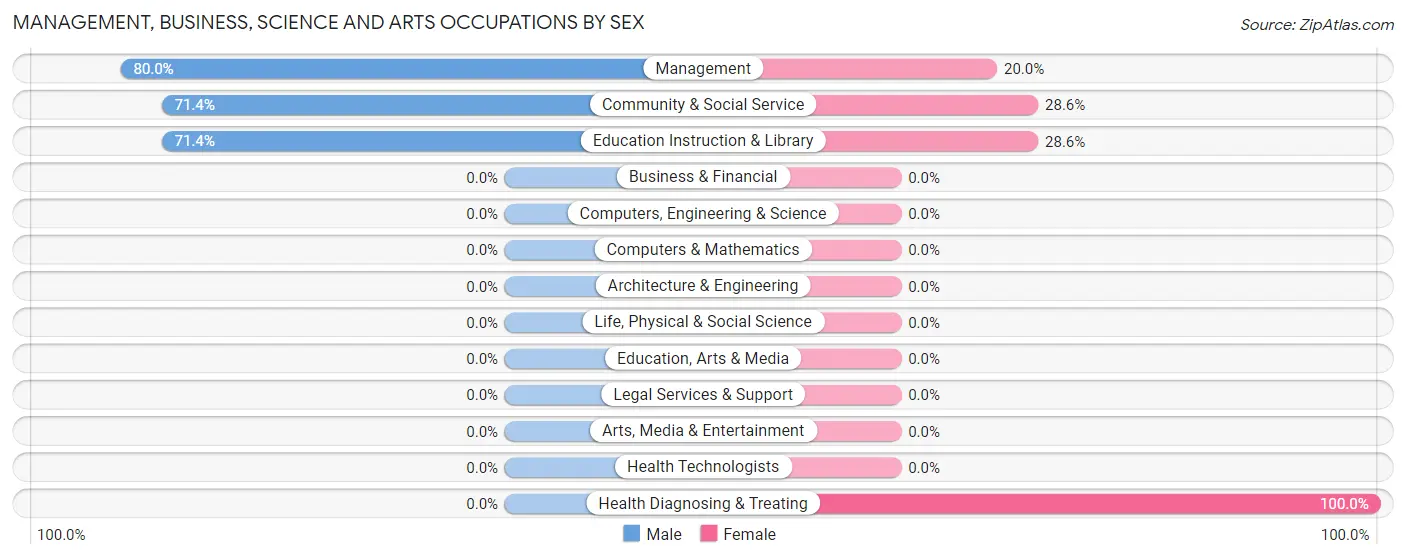
Management, Business, Science and Arts Occupations by Sex
Within the Management, Business, Science and Arts occupations in Medicine Lake, the most male-oriented occupations are Management (80.0%), Community & Social Service (71.4%), and Education Instruction & Library (71.4%), while the most female-oriented occupations are Health Diagnosing & Treating (100.0%), Community & Social Service (28.6%), and Education Instruction & Library (28.6%).
| Occupation | Male | Female |
| Management | 8 (80.0%) | 2 (20.0%) |
| Business & Financial | 0 (0.0%) | 0 (0.0%) |
| Computers, Engineering & Science | 0 (0.0%) | 0 (0.0%) |
| Computers & Mathematics | 0 (0.0%) | 0 (0.0%) |
| Architecture & Engineering | 0 (0.0%) | 0 (0.0%) |
| Life, Physical & Social Science | 0 (0.0%) | 0 (0.0%) |
| Community & Social Service | 10 (71.4%) | 4 (28.6%) |
| Education, Arts & Media | 0 (0.0%) | 0 (0.0%) |
| Legal Services & Support | 0 (0.0%) | 0 (0.0%) |
| Education Instruction & Library | 10 (71.4%) | 4 (28.6%) |
| Arts, Media & Entertainment | 0 (0.0%) | 0 (0.0%) |
| Health Diagnosing & Treating | 0 (0.0%) | 1 (100.0%) |
| Health Technologists | 0 (0.0%) | 0 (0.0%) |
| Total (Category) | 18 (72.0%) | 7 (28.0%) |
| Total (Overall) | 75 (63.6%) | 43 (36.4%) |
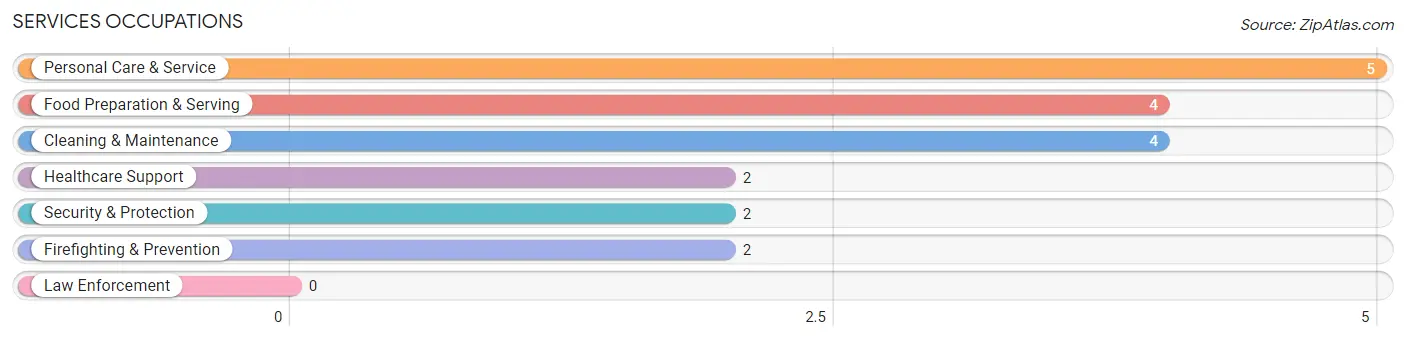
Services Occupations
The most common Services occupations in Medicine Lake are Personal Care & Service (5 | 4.2%), Food Preparation & Serving (4 | 3.4%), Cleaning & Maintenance (4 | 3.4%), Healthcare Support (2 | 1.7%), and Security & Protection (2 | 1.7%).
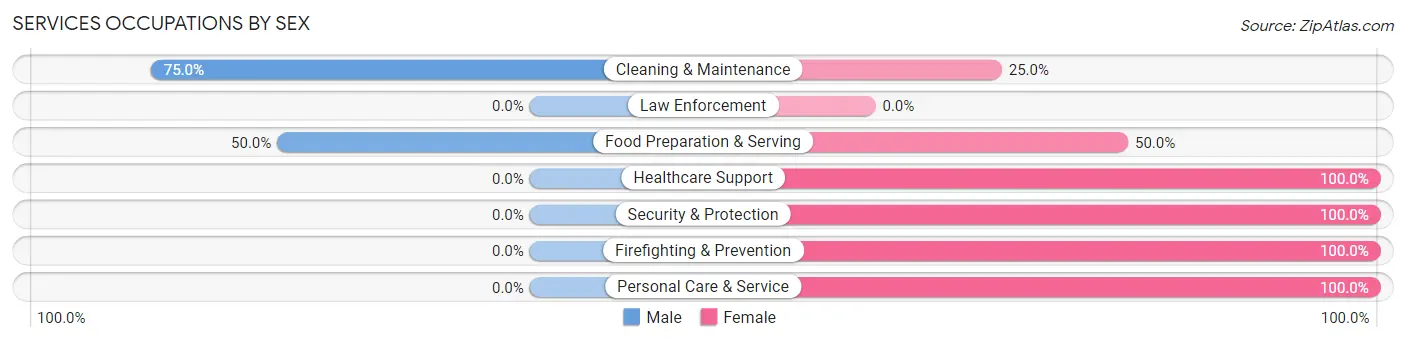
Services Occupations by Sex
Within the Services occupations in Medicine Lake, the most male-oriented occupations are Cleaning & Maintenance (75.0%), and Food Preparation & Serving (50.0%), while the most female-oriented occupations are Healthcare Support (100.0%), Security & Protection (100.0%), and Firefighting & Prevention (100.0%).
| Occupation | Male | Female |
| Healthcare Support | 0 (0.0%) | 2 (100.0%) |
| Security & Protection | 0 (0.0%) | 2 (100.0%) |
| Firefighting & Prevention | 0 (0.0%) | 2 (100.0%) |
| Law Enforcement | 0 (0.0%) | 0 (0.0%) |
| Food Preparation & Serving | 2 (50.0%) | 2 (50.0%) |
| Cleaning & Maintenance | 3 (75.0%) | 1 (25.0%) |
| Personal Care & Service | 0 (0.0%) | 5 (100.0%) |
| Total (Category) | 5 (29.4%) | 12 (70.6%) |
| Total (Overall) | 75 (63.6%) | 43 (36.4%) |
Sales and Office Occupations
The most common Sales and Office occupations in Medicine Lake are Office & Administration (29 | 24.6%), and Sales & Related (9 | 7.6%).
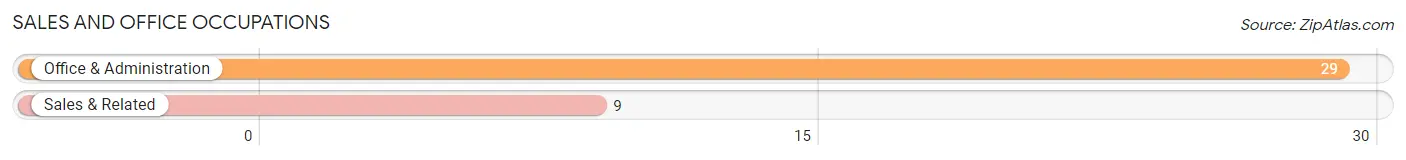
Sales and Office Occupations by Sex
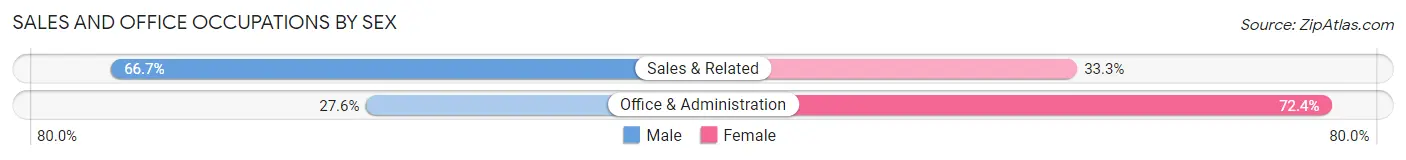
| Occupation | Male | Female |
| Sales & Related | 6 (66.7%) | 3 (33.3%) |
| Office & Administration | 8 (27.6%) | 21 (72.4%) |
| Total (Category) | 14 (36.8%) | 24 (63.2%) |
| Total (Overall) | 75 (63.6%) | 43 (36.4%) |
Natural Resources, Construction and Maintenance Occupations
The most common Natural Resources, Construction and Maintenance occupations in Medicine Lake are Construction & Extraction (10 | 8.5%), Installation, Maintenance & Repair (7 | 5.9%), and Farming, Fishing & Forestry (5 | 4.2%).
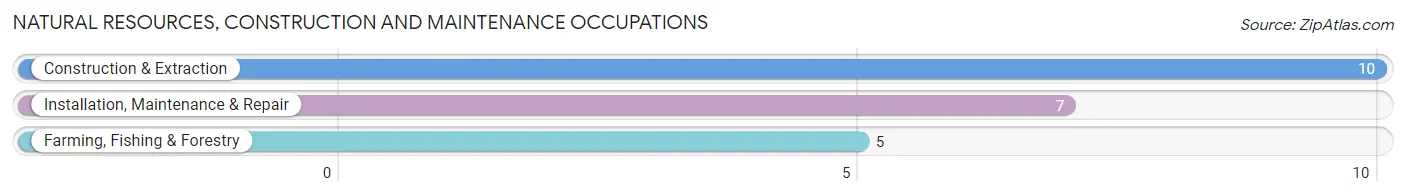
Natural Resources, Construction and Maintenance Occupations by Sex
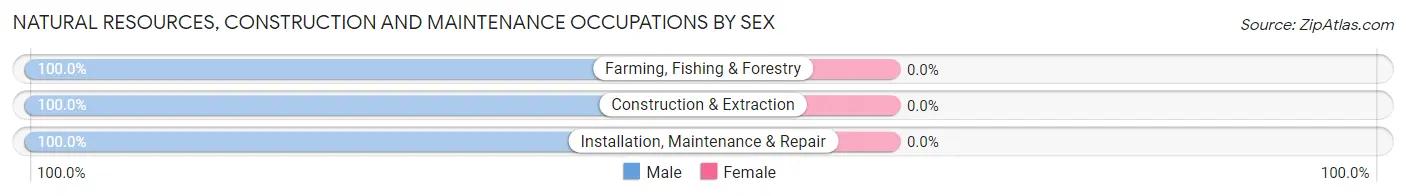
| Occupation | Male | Female |
| Farming, Fishing & Forestry | 5 (100.0%) | 0 (0.0%) |
| Construction & Extraction | 10 (100.0%) | 0 (0.0%) |
| Installation, Maintenance & Repair | 7 (100.0%) | 0 (0.0%) |
| Total (Category) | 22 (100.0%) | 0 (0.0%) |
| Total (Overall) | 75 (63.6%) | 43 (36.4%) |
Production, Transportation and Moving Occupations
The most common Production, Transportation and Moving occupations in Medicine Lake are Transportation (13 | 11.0%), and Material Moving (3 | 2.5%).
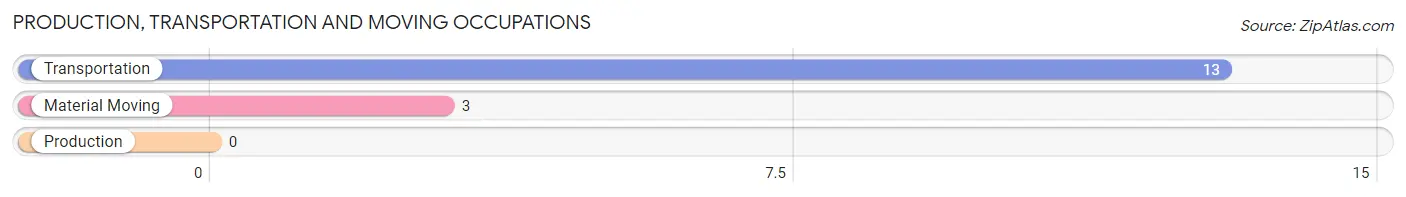
Production, Transportation and Moving Occupations by Sex
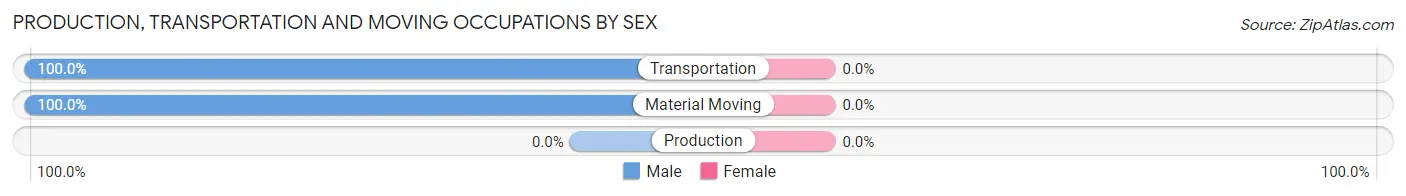
| Occupation | Male | Female |
| Production | 0 (0.0%) | 0 (0.0%) |
| Transportation | 13 (100.0%) | 0 (0.0%) |
| Material Moving | 3 (100.0%) | 0 (0.0%) |
| Total (Category) | 16 (100.0%) | 0 (0.0%) |
| Total (Overall) | 75 (63.6%) | 43 (36.4%) |
Employment Industries by Sex in Medicine Lake
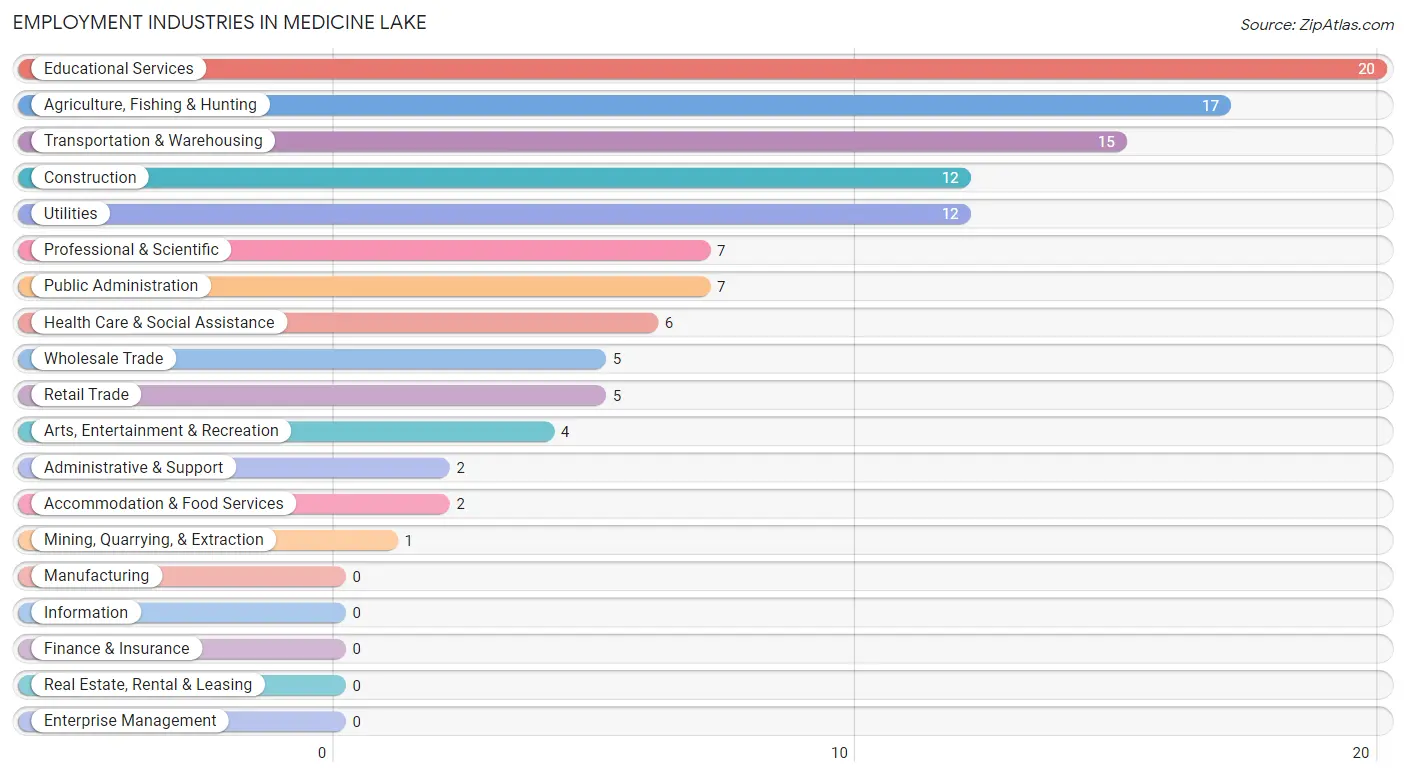
Employment Industries in Medicine Lake
The major employment industries in Medicine Lake include Educational Services (20 | 17.0%), Agriculture, Fishing & Hunting (17 | 14.4%), Transportation & Warehousing (15 | 12.7%), Construction (12 | 10.2%), and Utilities (12 | 10.2%).
Employment Industries by Sex in Medicine Lake
The Medicine Lake industries that see more men than women are Mining, Quarrying, & Extraction (100.0%), Construction (100.0%), and Wholesale Trade (100.0%), whereas the industries that tend to have a higher number of women are Professional & Scientific (100.0%), Administrative & Support (100.0%), and Health Care & Social Assistance (100.0%).
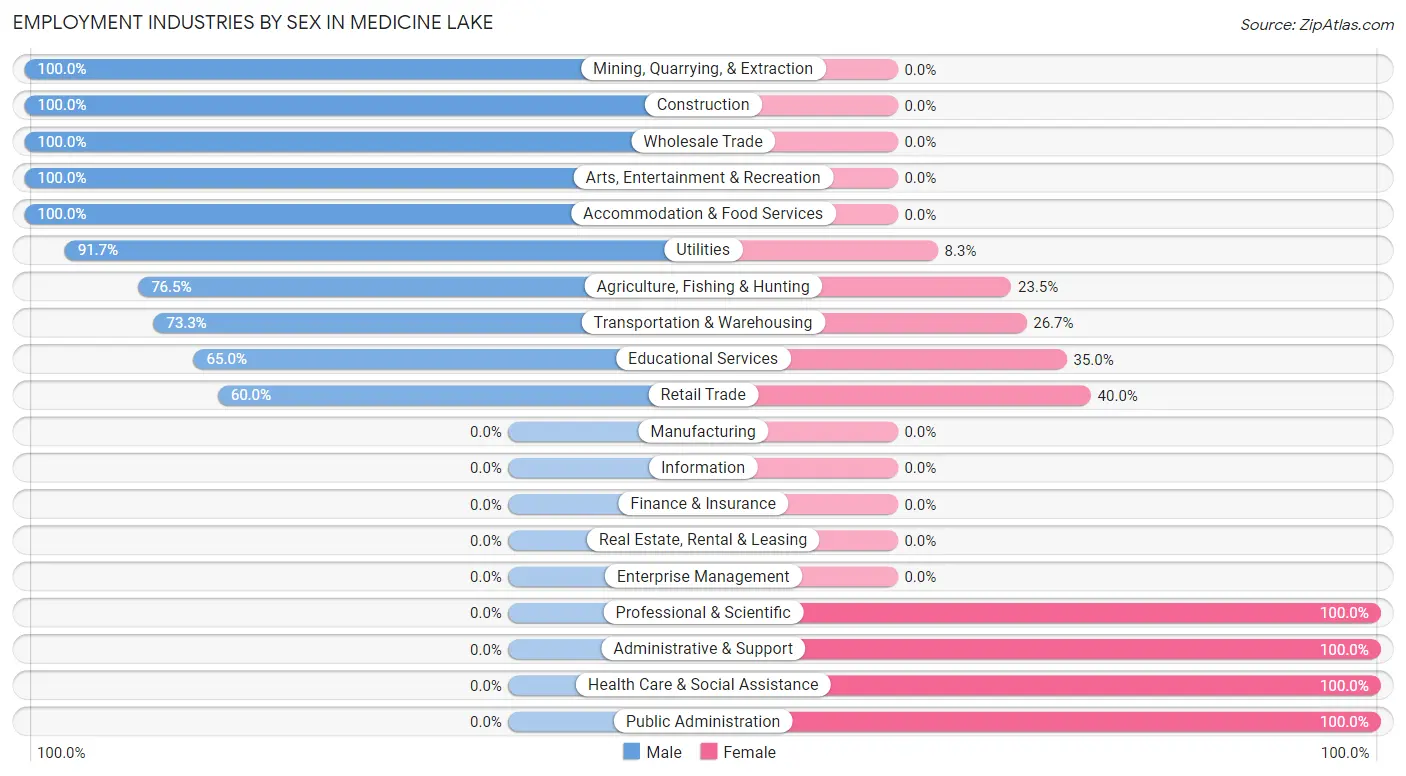
| Industry | Male | Female |
| Agriculture, Fishing & Hunting | 13 (76.5%) | 4 (23.5%) |
| Mining, Quarrying, & Extraction | 1 (100.0%) | 0 (0.0%) |
| Construction | 12 (100.0%) | 0 (0.0%) |
| Manufacturing | 0 (0.0%) | 0 (0.0%) |
| Wholesale Trade | 5 (100.0%) | 0 (0.0%) |
| Retail Trade | 3 (60.0%) | 2 (40.0%) |
| Transportation & Warehousing | 11 (73.3%) | 4 (26.7%) |
| Utilities | 11 (91.7%) | 1 (8.3%) |
| Information | 0 (0.0%) | 0 (0.0%) |
| Finance & Insurance | 0 (0.0%) | 0 (0.0%) |
| Real Estate, Rental & Leasing | 0 (0.0%) | 0 (0.0%) |
| Professional & Scientific | 0 (0.0%) | 7 (100.0%) |
| Enterprise Management | 0 (0.0%) | 0 (0.0%) |
| Administrative & Support | 0 (0.0%) | 2 (100.0%) |
| Educational Services | 13 (65.0%) | 7 (35.0%) |
| Health Care & Social Assistance | 0 (0.0%) | 6 (100.0%) |
| Arts, Entertainment & Recreation | 4 (100.0%) | 0 (0.0%) |
| Accommodation & Food Services | 2 (100.0%) | 0 (0.0%) |
| Public Administration | 0 (0.0%) | 7 (100.0%) |
| Total | 75 (63.6%) | 43 (36.4%) |
Education in Medicine Lake
School Enrollment in Medicine Lake
The most common levels of schooling among the 32 students in Medicine Lake are middle school (12 | 37.5%), college / undergraduate (10 | 31.2%), and high school (7 | 21.9%).
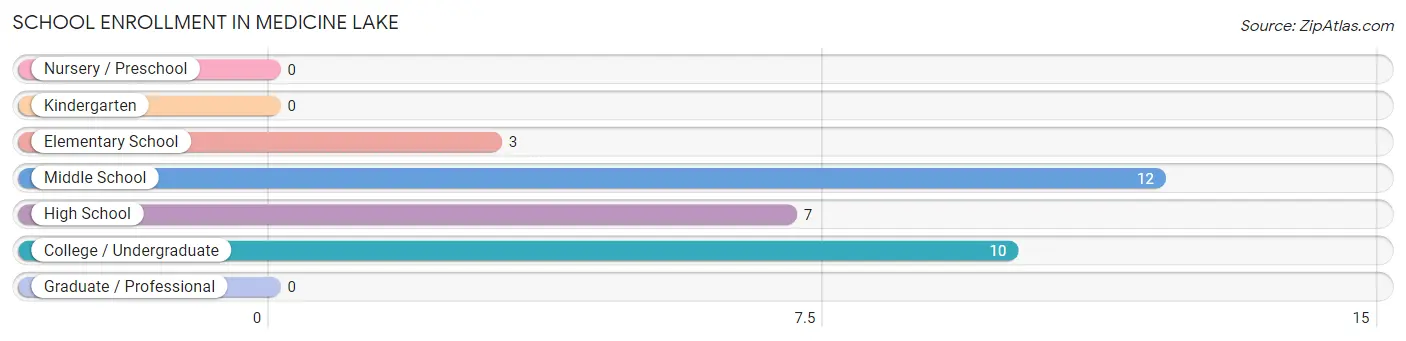
| School Level | # Students | % Students |
| Nursery / Preschool | 0 | 0.0% |
| Kindergarten | 0 | 0.0% |
| Elementary School | 3 | 9.4% |
| Middle School | 12 | 37.5% |
| High School | 7 | 21.9% |
| College / Undergraduate | 10 | 31.2% |
| Graduate / Professional | 0 | 0.0% |
| Total | 32 | 100.0% |
School Enrollment by Age by Funding Source in Medicine Lake
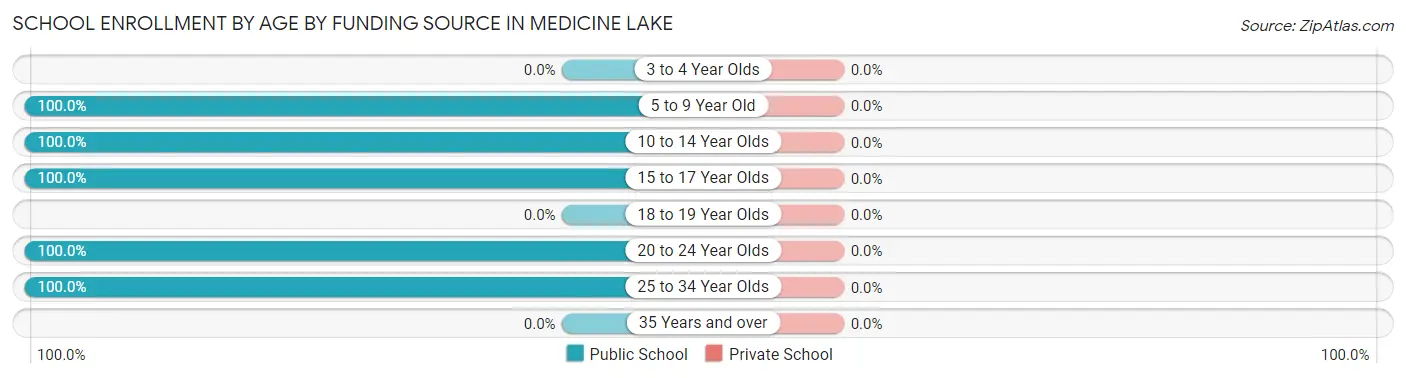
| Age Bracket | Public School | Private School |
| 3 to 4 Year Olds | 0 (0.0%) | 0 (0.0%) |
| 5 to 9 Year Old | 3 (100.0%) | 0 (0.0%) |
| 10 to 14 Year Olds | 13 (100.0%) | 0 (0.0%) |
| 15 to 17 Year Olds | 6 (100.0%) | 0 (0.0%) |
| 18 to 19 Year Olds | 0 (0.0%) | 0 (0.0%) |
| 20 to 24 Year Olds | 4 (100.0%) | 0 (0.0%) |
| 25 to 34 Year Olds | 6 (100.0%) | 0 (0.0%) |
| 35 Years and over | 0 (0.0%) | 0 (0.0%) |
| Total | 32 (100.0%) | 0 (0.0%) |
Educational Attainment by Field of Study in Medicine Lake
Education (23 | 51.1%), bio, nature & agricultural (7 | 15.6%), science & technology (4 | 8.9%), business (4 | 8.9%), and liberal arts & history (3 | 6.7%) are the most common fields of study among 45 individuals in Medicine Lake who have obtained a bachelor's degree or higher.
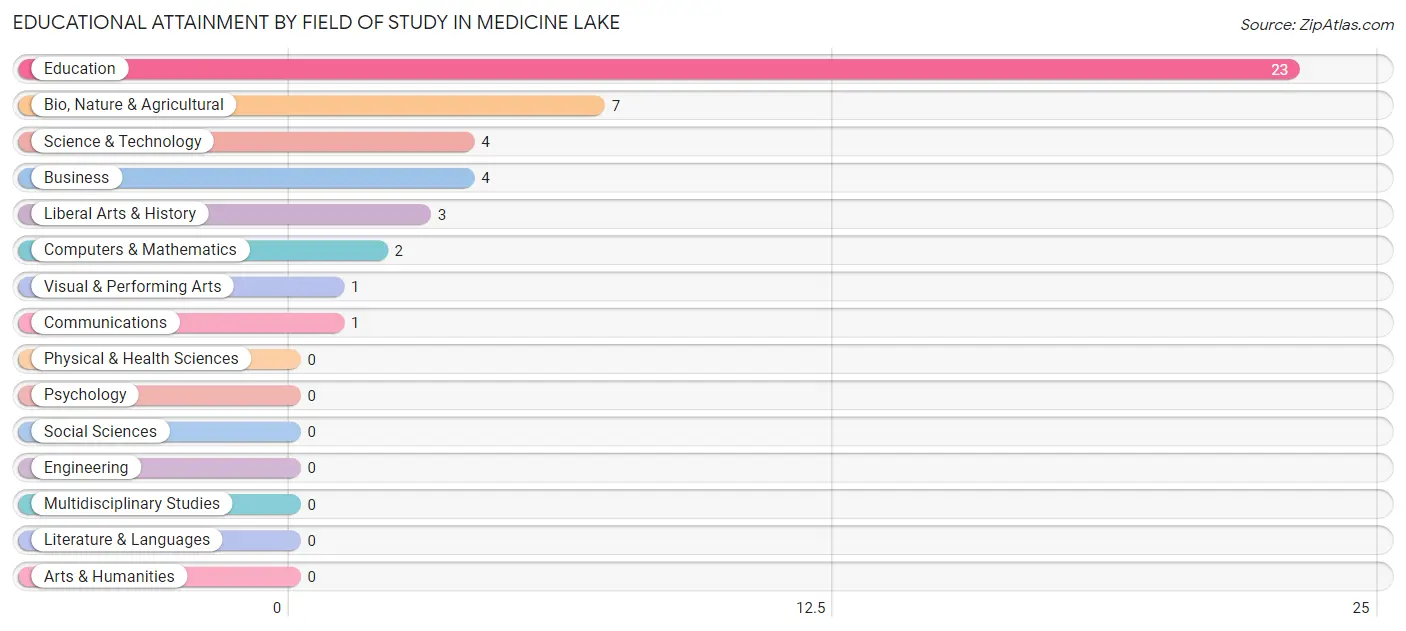
| Field of Study | # Graduates | % Graduates |
| Computers & Mathematics | 2 | 4.4% |
| Bio, Nature & Agricultural | 7 | 15.6% |
| Physical & Health Sciences | 0 | 0.0% |
| Psychology | 0 | 0.0% |
| Social Sciences | 0 | 0.0% |
| Engineering | 0 | 0.0% |
| Multidisciplinary Studies | 0 | 0.0% |
| Science & Technology | 4 | 8.9% |
| Business | 4 | 8.9% |
| Education | 23 | 51.1% |
| Literature & Languages | 0 | 0.0% |
| Liberal Arts & History | 3 | 6.7% |
| Visual & Performing Arts | 1 | 2.2% |
| Communications | 1 | 2.2% |
| Arts & Humanities | 0 | 0.0% |
| Total | 45 | 100.0% |
Transportation & Commute in Medicine Lake
Vehicle Availability by Sex in Medicine Lake
The most prevalent vehicle ownership categories in Medicine Lake are males with 2 vehicles (25, accounting for 35.2%) and females with 2 vehicles (20, making up 58.1%).
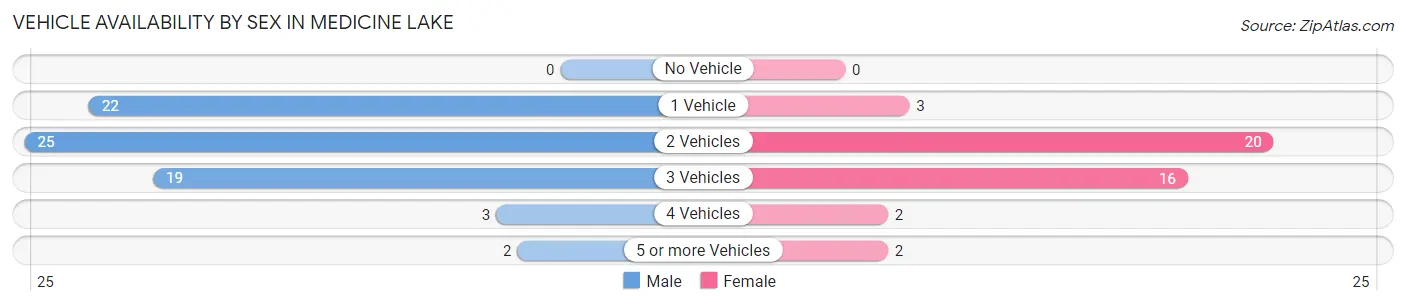
| Vehicles Available | Male | Female |
| No Vehicle | 0 (0.0%) | 0 (0.0%) |
| 1 Vehicle | 22 (31.0%) | 3 (7.0%) |
| 2 Vehicles | 25 (35.2%) | 20 (46.5%) |
| 3 Vehicles | 19 (26.8%) | 16 (37.2%) |
| 4 Vehicles | 3 (4.2%) | 2 (4.6%) |
| 5 or more Vehicles | 2 (2.8%) | 2 (4.6%) |
| Total | 71 (100.0%) | 43 (100.0%) |
Commute Time in Medicine Lake
The most frequently occuring commute durations in Medicine Lake are 5 to 9 minutes (33 commuters, 30.6%), less than 5 minutes (22 commuters, 20.4%), and 20 to 24 minutes (13 commuters, 12.0%).
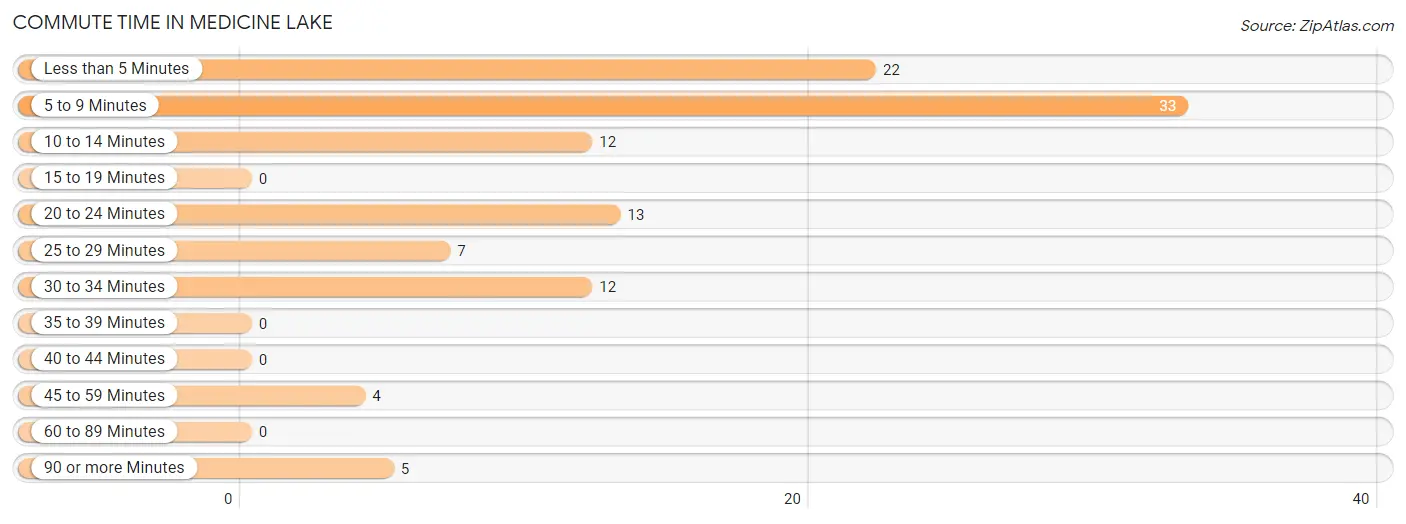
| Commute Time | # Commuters | % Commuters |
| Less than 5 Minutes | 22 | 20.4% |
| 5 to 9 Minutes | 33 | 30.6% |
| 10 to 14 Minutes | 12 | 11.1% |
| 15 to 19 Minutes | 0 | 0.0% |
| 20 to 24 Minutes | 13 | 12.0% |
| 25 to 29 Minutes | 7 | 6.5% |
| 30 to 34 Minutes | 12 | 11.1% |
| 35 to 39 Minutes | 0 | 0.0% |
| 40 to 44 Minutes | 0 | 0.0% |
| 45 to 59 Minutes | 4 | 3.7% |
| 60 to 89 Minutes | 0 | 0.0% |
| 90 or more Minutes | 5 | 4.6% |
Commute Time by Sex in Medicine Lake
The most common commute times in Medicine Lake are 5 to 9 minutes (23 commuters, 32.4%) for males and 5 to 9 minutes (10 commuters, 27.0%) for females.
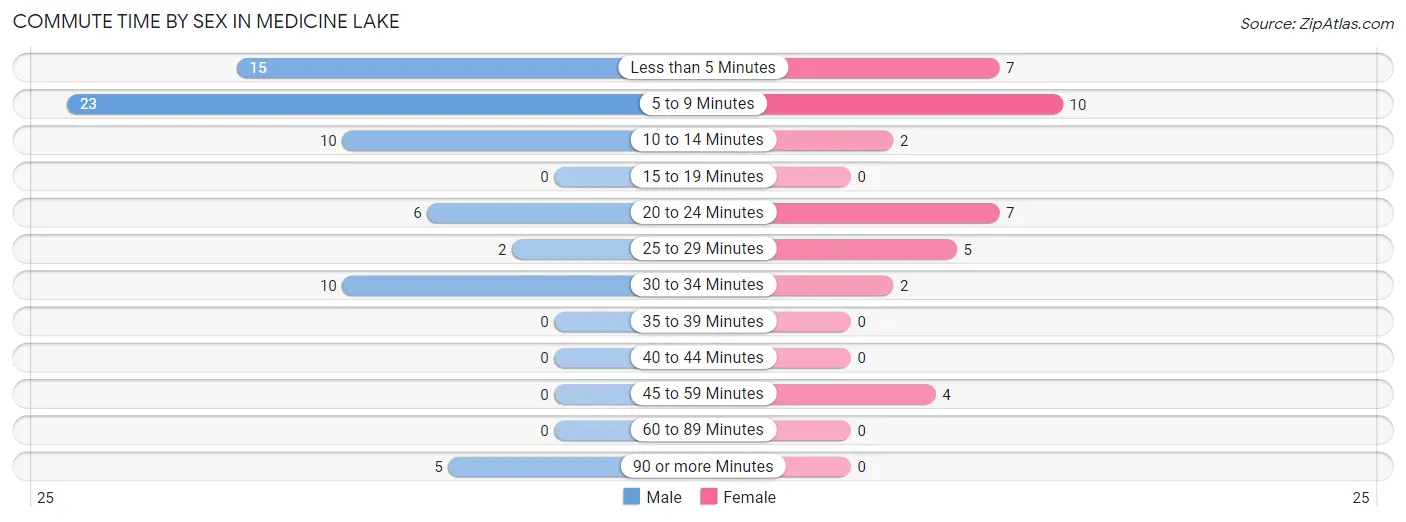
| Commute Time | Male | Female |
| Less than 5 Minutes | 15 (21.1%) | 7 (18.9%) |
| 5 to 9 Minutes | 23 (32.4%) | 10 (27.0%) |
| 10 to 14 Minutes | 10 (14.1%) | 2 (5.4%) |
| 15 to 19 Minutes | 0 (0.0%) | 0 (0.0%) |
| 20 to 24 Minutes | 6 (8.5%) | 7 (18.9%) |
| 25 to 29 Minutes | 2 (2.8%) | 5 (13.5%) |
| 30 to 34 Minutes | 10 (14.1%) | 2 (5.4%) |
| 35 to 39 Minutes | 0 (0.0%) | 0 (0.0%) |
| 40 to 44 Minutes | 0 (0.0%) | 0 (0.0%) |
| 45 to 59 Minutes | 0 (0.0%) | 4 (10.8%) |
| 60 to 89 Minutes | 0 (0.0%) | 0 (0.0%) |
| 90 or more Minutes | 5 (7.0%) | 0 (0.0%) |
Time of Departure to Work by Sex in Medicine Lake
The most frequent times of departure to work in Medicine Lake are 6:30 AM to 6:59 AM (17, 23.9%) for males and 7:30 AM to 7:59 AM (8, 21.6%) for females.
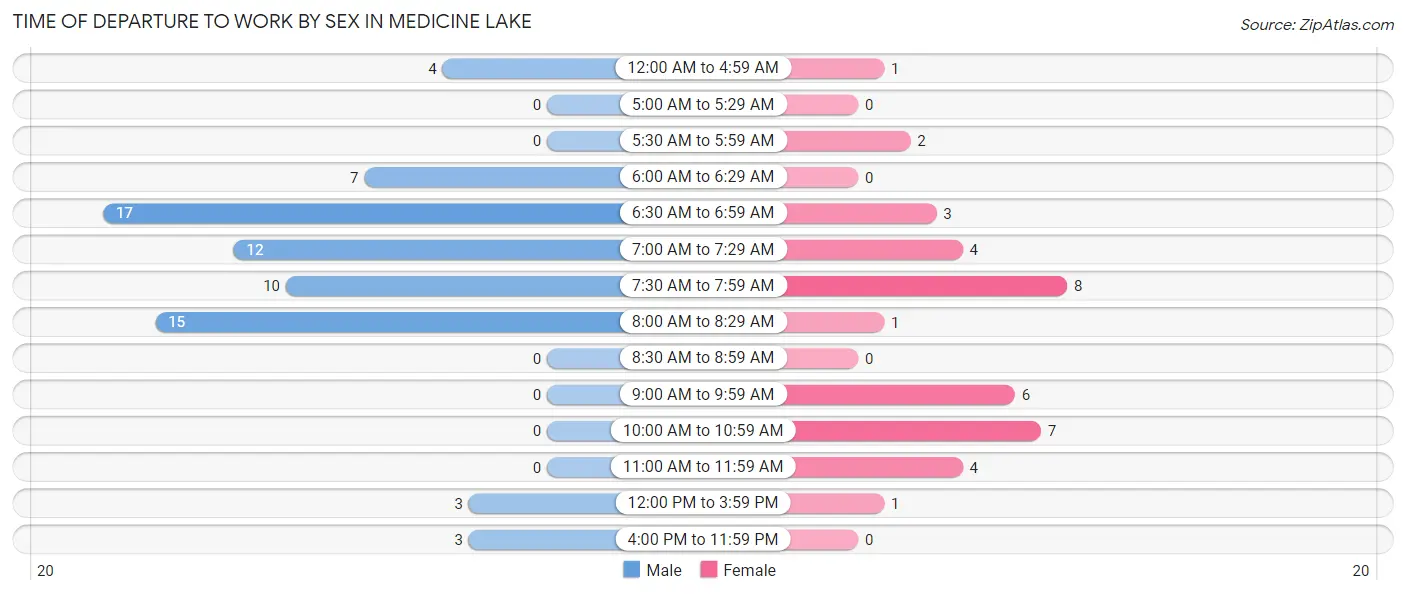
| Time of Departure | Male | Female |
| 12:00 AM to 4:59 AM | 4 (5.6%) | 1 (2.7%) |
| 5:00 AM to 5:29 AM | 0 (0.0%) | 0 (0.0%) |
| 5:30 AM to 5:59 AM | 0 (0.0%) | 2 (5.4%) |
| 6:00 AM to 6:29 AM | 7 (9.9%) | 0 (0.0%) |
| 6:30 AM to 6:59 AM | 17 (23.9%) | 3 (8.1%) |
| 7:00 AM to 7:29 AM | 12 (16.9%) | 4 (10.8%) |
| 7:30 AM to 7:59 AM | 10 (14.1%) | 8 (21.6%) |
| 8:00 AM to 8:29 AM | 15 (21.1%) | 1 (2.7%) |
| 8:30 AM to 8:59 AM | 0 (0.0%) | 0 (0.0%) |
| 9:00 AM to 9:59 AM | 0 (0.0%) | 6 (16.2%) |
| 10:00 AM to 10:59 AM | 0 (0.0%) | 7 (18.9%) |
| 11:00 AM to 11:59 AM | 0 (0.0%) | 4 (10.8%) |
| 12:00 PM to 3:59 PM | 3 (4.2%) | 1 (2.7%) |
| 4:00 PM to 11:59 PM | 3 (4.2%) | 0 (0.0%) |
| Total | 71 (100.0%) | 37 (100.0%) |
Housing Occupancy in Medicine Lake
Occupancy by Ownership in Medicine Lake
Of the total 116 dwellings in Medicine Lake, owner-occupied units account for 79 (68.1%), while renter-occupied units make up 37 (31.9%).
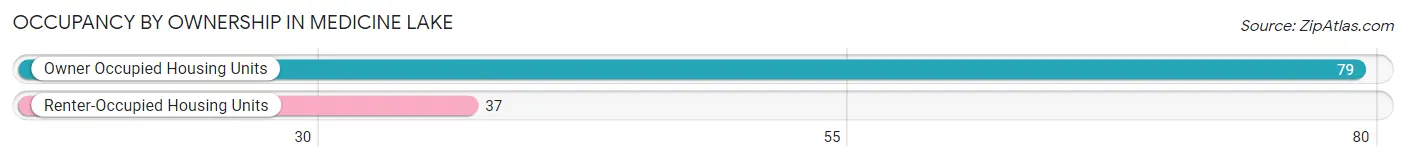
| Occupancy | # Housing Units | % Housing Units |
| Owner Occupied Housing Units | 79 | 68.1% |
| Renter-Occupied Housing Units | 37 | 31.9% |
| Total Occupied Housing Units | 116 | 100.0% |
Occupancy by Household Size in Medicine Lake
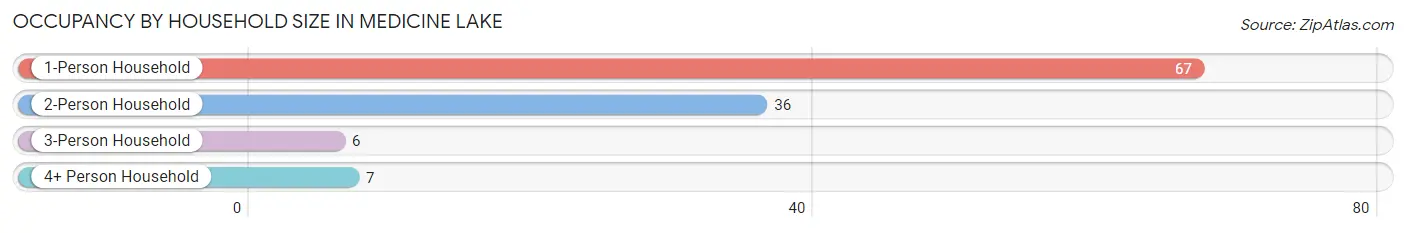
| Household Size | # Housing Units | % Housing Units |
| 1-Person Household | 67 | 57.8% |
| 2-Person Household | 36 | 31.0% |
| 3-Person Household | 6 | 5.2% |
| 4+ Person Household | 7 | 6.0% |
| Total Housing Units | 116 | 100.0% |
Occupancy by Ownership by Household Size in Medicine Lake
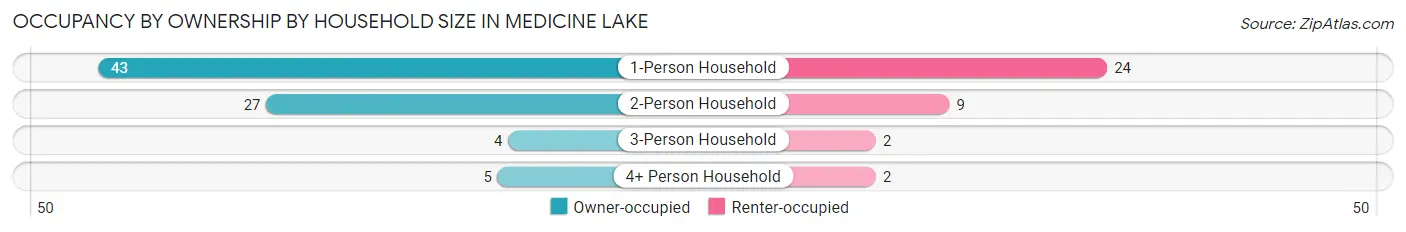
| Household Size | Owner-occupied | Renter-occupied |
| 1-Person Household | 43 (64.2%) | 24 (35.8%) |
| 2-Person Household | 27 (75.0%) | 9 (25.0%) |
| 3-Person Household | 4 (66.7%) | 2 (33.3%) |
| 4+ Person Household | 5 (71.4%) | 2 (28.6%) |
| Total Housing Units | 79 (68.1%) | 37 (31.9%) |
Occupancy by Educational Attainment in Medicine Lake
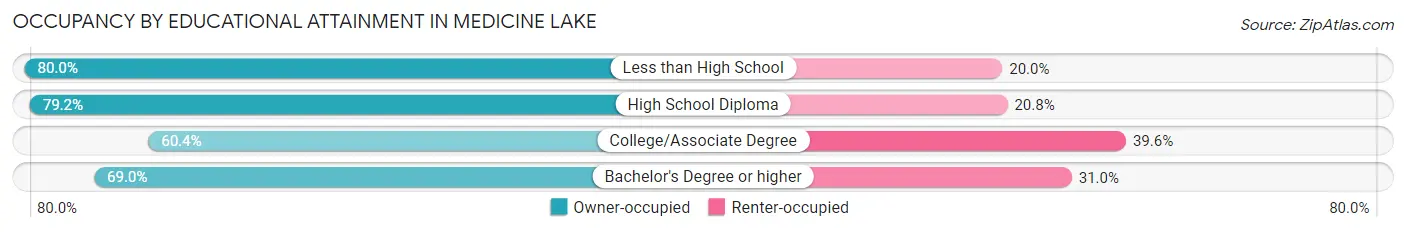
| Household Size | Owner-occupied | Renter-occupied |
| Less than High School | 8 (80.0%) | 2 (20.0%) |
| High School Diploma | 19 (79.2%) | 5 (20.8%) |
| College/Associate Degree | 32 (60.4%) | 21 (39.6%) |
| Bachelor's Degree or higher | 20 (69.0%) | 9 (31.0%) |
Occupancy by Age of Householder in Medicine Lake
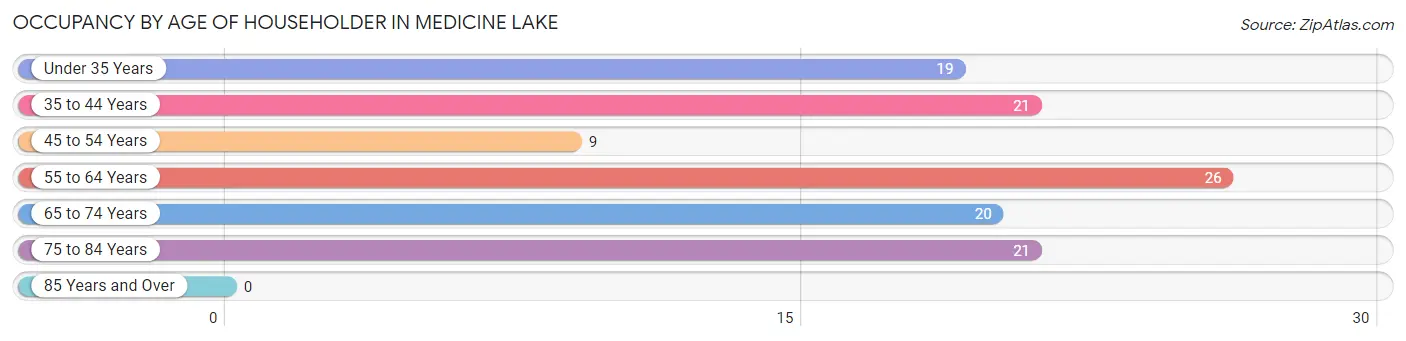
| Age Bracket | # Households | % Households |
| Under 35 Years | 19 | 16.4% |
| 35 to 44 Years | 21 | 18.1% |
| 45 to 54 Years | 9 | 7.8% |
| 55 to 64 Years | 26 | 22.4% |
| 65 to 74 Years | 20 | 17.2% |
| 75 to 84 Years | 21 | 18.1% |
| 85 Years and Over | 0 | 0.0% |
| Total | 116 | 100.0% |
Housing Finances in Medicine Lake
Median Income by Occupancy in Medicine Lake
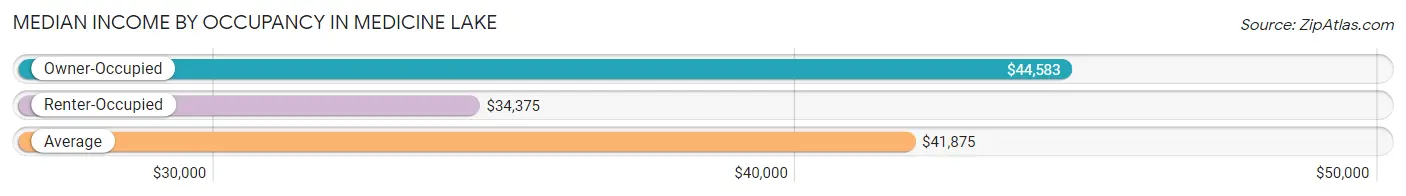
| Occupancy Type | # Households | Median Income |
| Owner-Occupied | 79 (68.1%) | $44,583 |
| Renter-Occupied | 37 (31.9%) | $34,375 |
| Average | 116 (100.0%) | $41,875 |
Occupancy by Householder Income Bracket in Medicine Lake
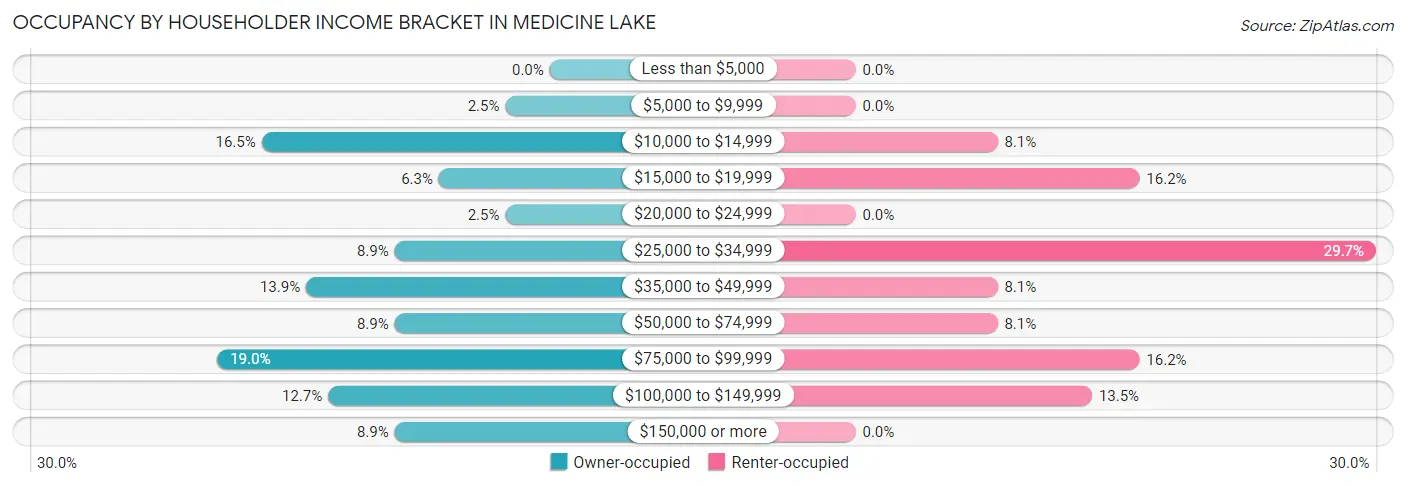
| Income Bracket | Owner-occupied | Renter-occupied |
| Less than $5,000 | 0 (0.0%) | 0 (0.0%) |
| $5,000 to $9,999 | 2 (2.5%) | 0 (0.0%) |
| $10,000 to $14,999 | 13 (16.5%) | 3 (8.1%) |
| $15,000 to $19,999 | 5 (6.3%) | 6 (16.2%) |
| $20,000 to $24,999 | 2 (2.5%) | 0 (0.0%) |
| $25,000 to $34,999 | 7 (8.9%) | 11 (29.7%) |
| $35,000 to $49,999 | 11 (13.9%) | 3 (8.1%) |
| $50,000 to $74,999 | 7 (8.9%) | 3 (8.1%) |
| $75,000 to $99,999 | 15 (19.0%) | 6 (16.2%) |
| $100,000 to $149,999 | 10 (12.7%) | 5 (13.5%) |
| $150,000 or more | 7 (8.9%) | 0 (0.0%) |
| Total | 79 (100.0%) | 37 (100.0%) |
Monthly Housing Cost Tiers in Medicine Lake
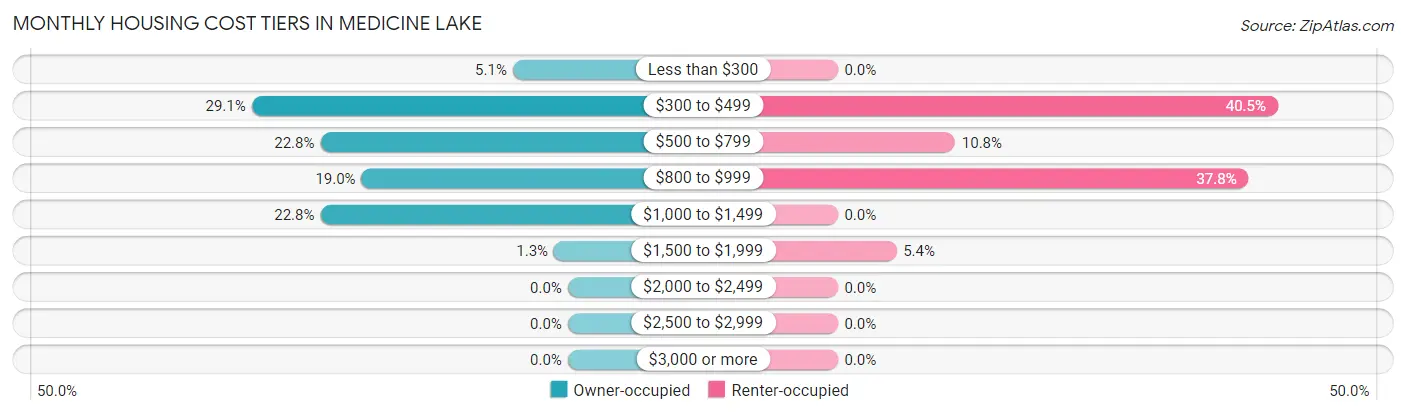
| Monthly Cost | Owner-occupied | Renter-occupied |
| Less than $300 | 4 (5.1%) | 0 (0.0%) |
| $300 to $499 | 23 (29.1%) | 15 (40.5%) |
| $500 to $799 | 18 (22.8%) | 4 (10.8%) |
| $800 to $999 | 15 (19.0%) | 14 (37.8%) |
| $1,000 to $1,499 | 18 (22.8%) | 0 (0.0%) |
| $1,500 to $1,999 | 1 (1.3%) | 2 (5.4%) |
| $2,000 to $2,499 | 0 (0.0%) | 0 (0.0%) |
| $2,500 to $2,999 | 0 (0.0%) | 0 (0.0%) |
| $3,000 or more | 0 (0.0%) | 0 (0.0%) |
| Total | 79 (100.0%) | 37 (100.0%) |
Physical Housing Characteristics in Medicine Lake
Housing Structures in Medicine Lake
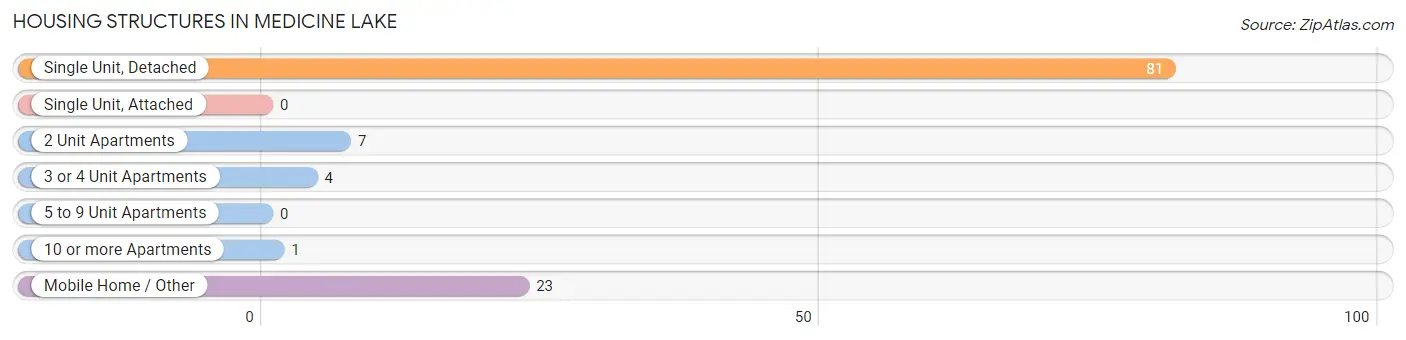
| Structure Type | # Housing Units | % Housing Units |
| Single Unit, Detached | 81 | 69.8% |
| Single Unit, Attached | 0 | 0.0% |
| 2 Unit Apartments | 7 | 6.0% |
| 3 or 4 Unit Apartments | 4 | 3.5% |
| 5 to 9 Unit Apartments | 0 | 0.0% |
| 10 or more Apartments | 1 | 0.9% |
| Mobile Home / Other | 23 | 19.8% |
| Total | 116 | 100.0% |
Housing Structures by Occupancy in Medicine Lake
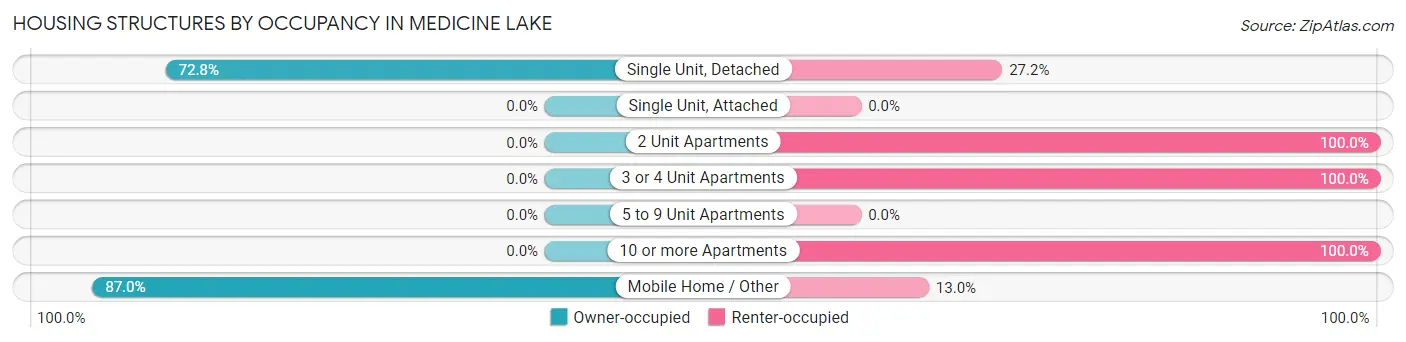
| Structure Type | Owner-occupied | Renter-occupied |
| Single Unit, Detached | 59 (72.8%) | 22 (27.2%) |
| Single Unit, Attached | 0 (0.0%) | 0 (0.0%) |
| 2 Unit Apartments | 0 (0.0%) | 7 (100.0%) |
| 3 or 4 Unit Apartments | 0 (0.0%) | 4 (100.0%) |
| 5 to 9 Unit Apartments | 0 (0.0%) | 0 (0.0%) |
| 10 or more Apartments | 0 (0.0%) | 1 (100.0%) |
| Mobile Home / Other | 20 (87.0%) | 3 (13.0%) |
| Total | 79 (68.1%) | 37 (31.9%) |
Housing Structures by Number of Rooms in Medicine Lake
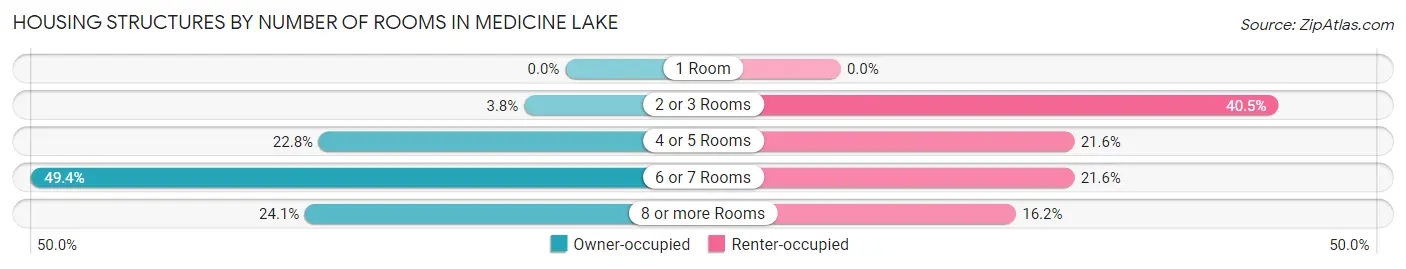
| Number of Rooms | Owner-occupied | Renter-occupied |
| 1 Room | 0 (0.0%) | 0 (0.0%) |
| 2 or 3 Rooms | 3 (3.8%) | 15 (40.5%) |
| 4 or 5 Rooms | 18 (22.8%) | 8 (21.6%) |
| 6 or 7 Rooms | 39 (49.4%) | 8 (21.6%) |
| 8 or more Rooms | 19 (24.0%) | 6 (16.2%) |
| Total | 79 (100.0%) | 37 (100.0%) |
Housing Structure by Heating Type in Medicine Lake
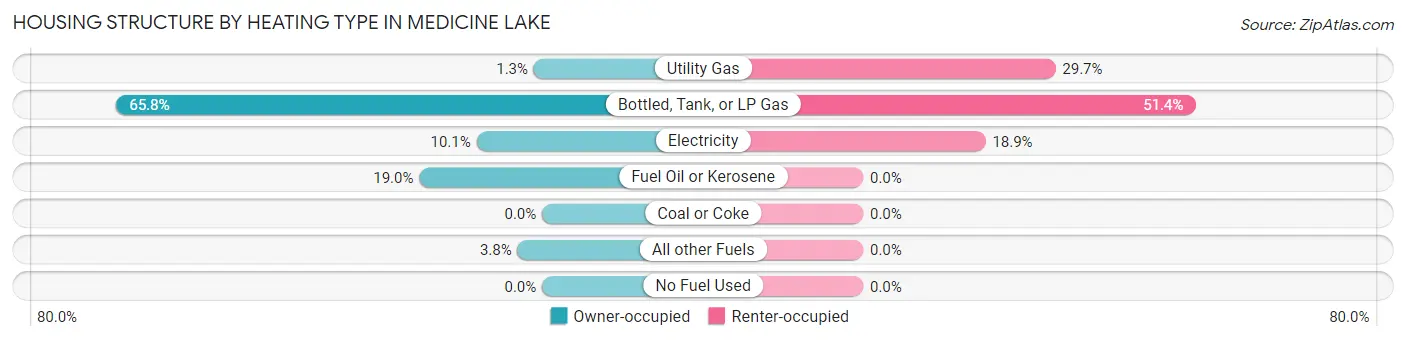
| Heating Type | Owner-occupied | Renter-occupied |
| Utility Gas | 1 (1.3%) | 11 (29.7%) |
| Bottled, Tank, or LP Gas | 52 (65.8%) | 19 (51.3%) |
| Electricity | 8 (10.1%) | 7 (18.9%) |
| Fuel Oil or Kerosene | 15 (19.0%) | 0 (0.0%) |
| Coal or Coke | 0 (0.0%) | 0 (0.0%) |
| All other Fuels | 3 (3.8%) | 0 (0.0%) |
| No Fuel Used | 0 (0.0%) | 0 (0.0%) |
| Total | 79 (100.0%) | 37 (100.0%) |
Household Vehicle Usage in Medicine Lake
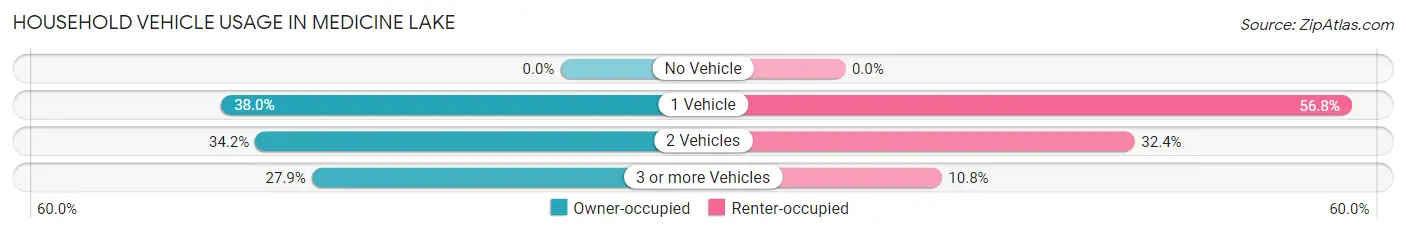
| Vehicles per Household | Owner-occupied | Renter-occupied |
| No Vehicle | 0 (0.0%) | 0 (0.0%) |
| 1 Vehicle | 30 (38.0%) | 21 (56.8%) |
| 2 Vehicles | 27 (34.2%) | 12 (32.4%) |
| 3 or more Vehicles | 22 (27.9%) | 4 (10.8%) |
| Total | 79 (100.0%) | 37 (100.0%) |
Real Estate & Mortgages in Medicine Lake
Real Estate and Mortgage Overview in Medicine Lake
| Characteristic | Without Mortgage | With Mortgage |
| Housing Units | 55 | 24 |
| Median Property Value | $87,500 | $108,300 |
| Median Household Income | $40,625 | $2 |
| Monthly Housing Costs | $506 | $0 |
| Real Estate Taxes | $1,096 | $2 |
Property Value by Mortgage Status in Medicine Lake
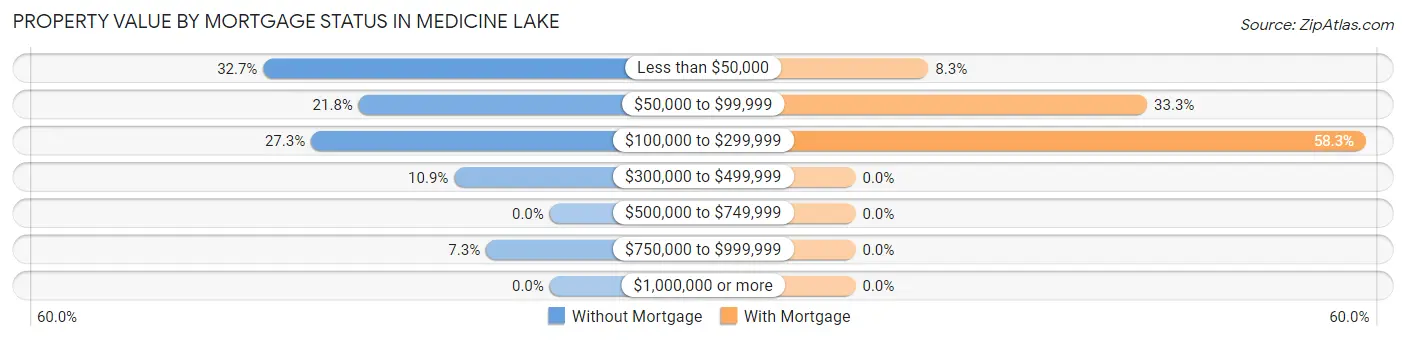
| Property Value | Without Mortgage | With Mortgage |
| Less than $50,000 | 18 (32.7%) | 2 (8.3%) |
| $50,000 to $99,999 | 12 (21.8%) | 8 (33.3%) |
| $100,000 to $299,999 | 15 (27.3%) | 14 (58.3%) |
| $300,000 to $499,999 | 6 (10.9%) | 0 (0.0%) |
| $500,000 to $749,999 | 0 (0.0%) | 0 (0.0%) |
| $750,000 to $999,999 | 4 (7.3%) | 0 (0.0%) |
| $1,000,000 or more | 0 (0.0%) | 0 (0.0%) |
| Total | 55 (100.0%) | 24 (100.0%) |
Household Income by Mortgage Status in Medicine Lake
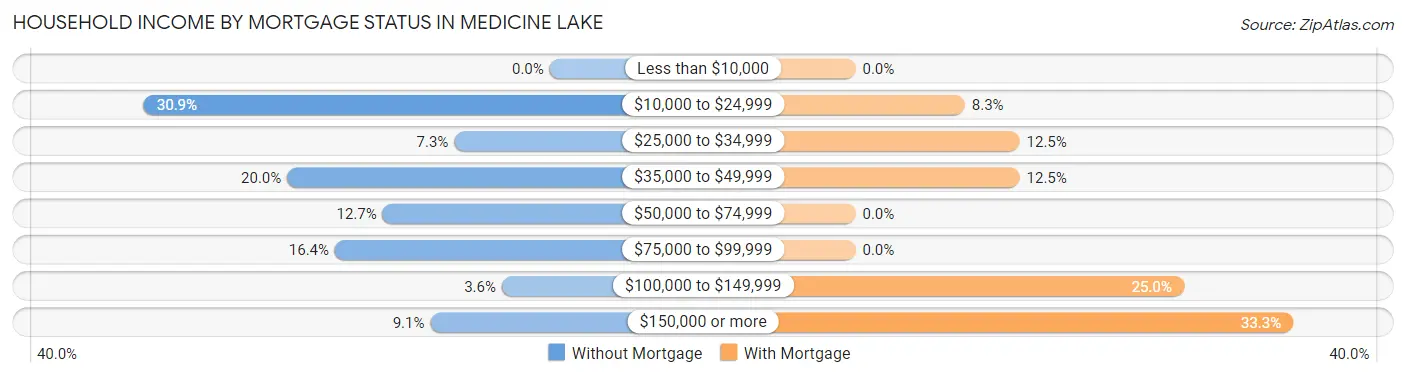
| Household Income | Without Mortgage | With Mortgage |
| Less than $10,000 | 0 (0.0%) | 0 (0.0%) |
| $10,000 to $24,999 | 17 (30.9%) | 2 (8.3%) |
| $25,000 to $34,999 | 4 (7.3%) | 3 (12.5%) |
| $35,000 to $49,999 | 11 (20.0%) | 3 (12.5%) |
| $50,000 to $74,999 | 7 (12.7%) | 0 (0.0%) |
| $75,000 to $99,999 | 9 (16.4%) | 0 (0.0%) |
| $100,000 to $149,999 | 2 (3.6%) | 6 (25.0%) |
| $150,000 or more | 5 (9.1%) | 8 (33.3%) |
| Total | 55 (100.0%) | 24 (100.0%) |
Property Value to Household Income Ratio in Medicine Lake
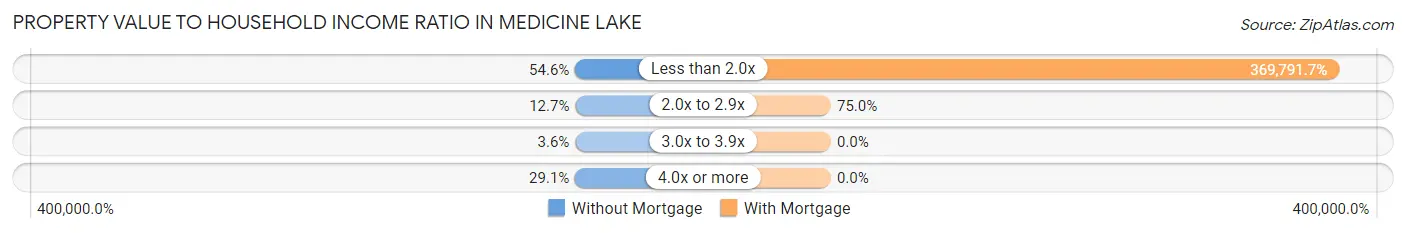
| Value-to-Income Ratio | Without Mortgage | With Mortgage |
| Less than 2.0x | 30 (54.5%) | 88,750 (369,791.7%) |
| 2.0x to 2.9x | 7 (12.7%) | 18 (75.0%) |
| 3.0x to 3.9x | 2 (3.6%) | 0 (0.0%) |
| 4.0x or more | 16 (29.1%) | 0 (0.0%) |
| Total | 55 (100.0%) | 24 (100.0%) |
Real Estate Taxes by Mortgage Status in Medicine Lake
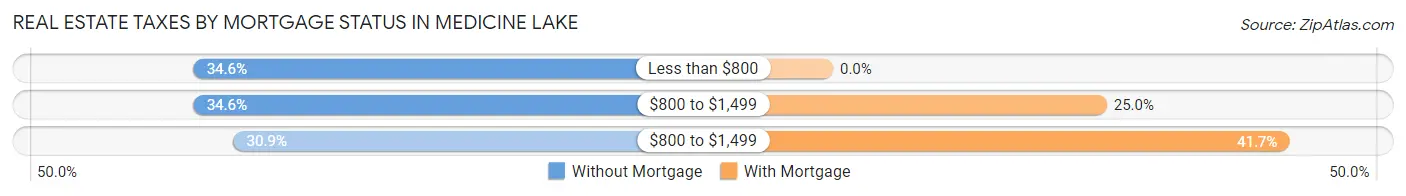
| Property Taxes | Without Mortgage | With Mortgage |
| Less than $800 | 19 (34.5%) | 0 (0.0%) |
| $800 to $1,499 | 19 (34.5%) | 6 (25.0%) |
| $800 to $1,499 | 17 (30.9%) | 10 (41.7%) |
| Total | 55 (100.0%) | 24 (100.0%) |
Health & Disability in Medicine Lake
Health Insurance Coverage by Age in Medicine Lake
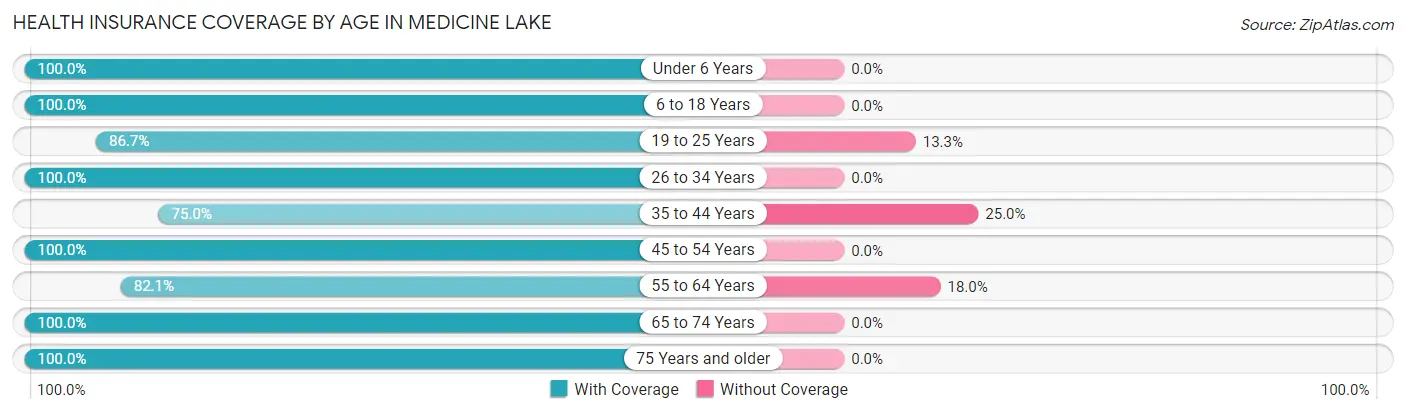
| Age Bracket | With Coverage | Without Coverage |
| Under 6 Years | 10 (100.0%) | 0 (0.0%) |
| 6 to 18 Years | 22 (100.0%) | 0 (0.0%) |
| 19 to 25 Years | 13 (86.7%) | 2 (13.3%) |
| 26 to 34 Years | 23 (100.0%) | 0 (0.0%) |
| 35 to 44 Years | 21 (75.0%) | 7 (25.0%) |
| 45 to 54 Years | 22 (100.0%) | 0 (0.0%) |
| 55 to 64 Years | 32 (82.1%) | 7 (17.9%) |
| 65 to 74 Years | 25 (100.0%) | 0 (0.0%) |
| 75 Years and older | 22 (100.0%) | 0 (0.0%) |
| Total | 190 (92.2%) | 16 (7.8%) |
Health Insurance Coverage by Citizenship Status in Medicine Lake
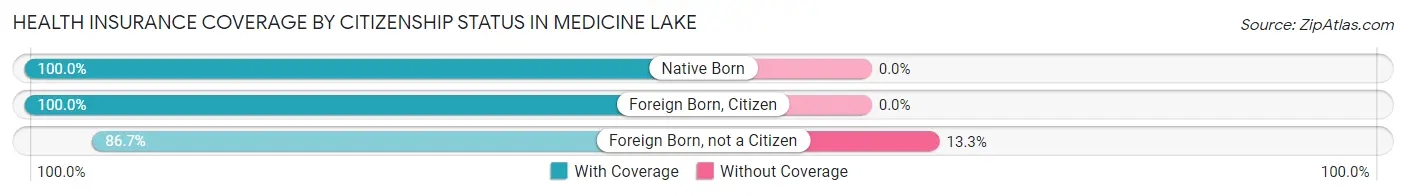
| Citizenship Status | With Coverage | Without Coverage |
| Native Born | 10 (100.0%) | 0 (0.0%) |
| Foreign Born, Citizen | 22 (100.0%) | 0 (0.0%) |
| Foreign Born, not a Citizen | 13 (86.7%) | 2 (13.3%) |
Health Insurance Coverage by Household Income in Medicine Lake
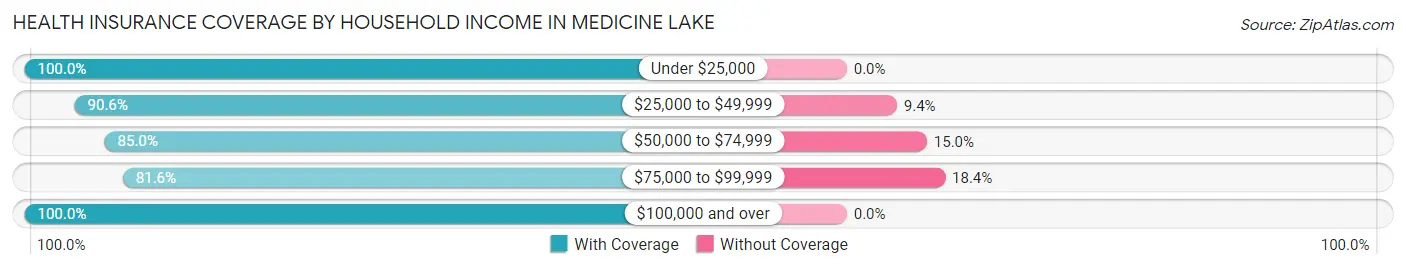
| Household Income | With Coverage | Without Coverage |
| Under $25,000 | 31 (100.0%) | 0 (0.0%) |
| $25,000 to $49,999 | 58 (90.6%) | 6 (9.4%) |
| $50,000 to $74,999 | 17 (85.0%) | 3 (15.0%) |
| $75,000 to $99,999 | 31 (81.6%) | 7 (18.4%) |
| $100,000 and over | 53 (100.0%) | 0 (0.0%) |
Public vs Private Health Insurance Coverage by Age in Medicine Lake
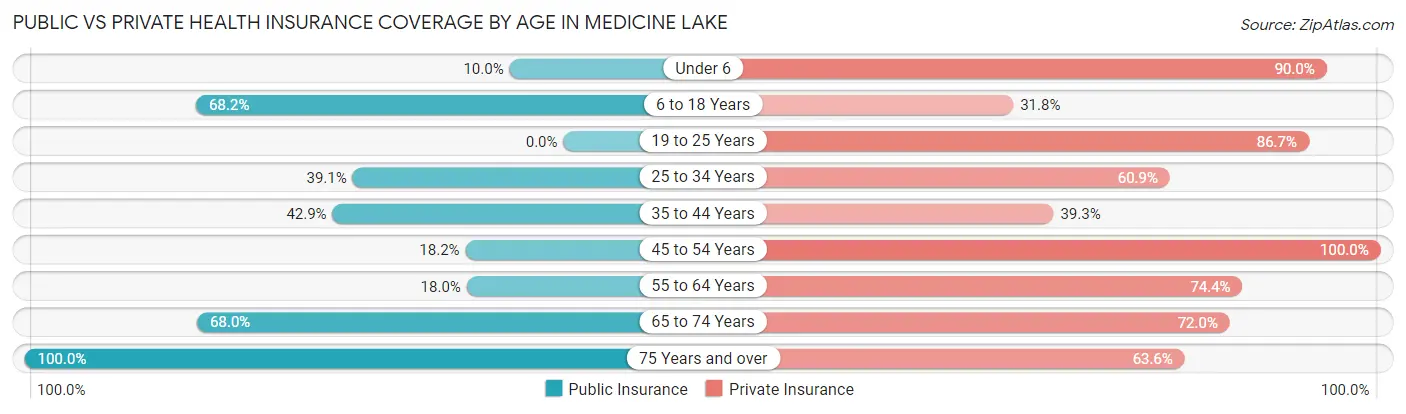
| Age Bracket | Public Insurance | Private Insurance |
| Under 6 | 1 (10.0%) | 9 (90.0%) |
| 6 to 18 Years | 15 (68.2%) | 7 (31.8%) |
| 19 to 25 Years | 0 (0.0%) | 13 (86.7%) |
| 25 to 34 Years | 9 (39.1%) | 14 (60.9%) |
| 35 to 44 Years | 12 (42.9%) | 11 (39.3%) |
| 45 to 54 Years | 4 (18.2%) | 22 (100.0%) |
| 55 to 64 Years | 7 (17.9%) | 29 (74.4%) |
| 65 to 74 Years | 17 (68.0%) | 18 (72.0%) |
| 75 Years and over | 22 (100.0%) | 14 (63.6%) |
| Total | 87 (42.2%) | 137 (66.5%) |
Disability Status by Sex by Age in Medicine Lake
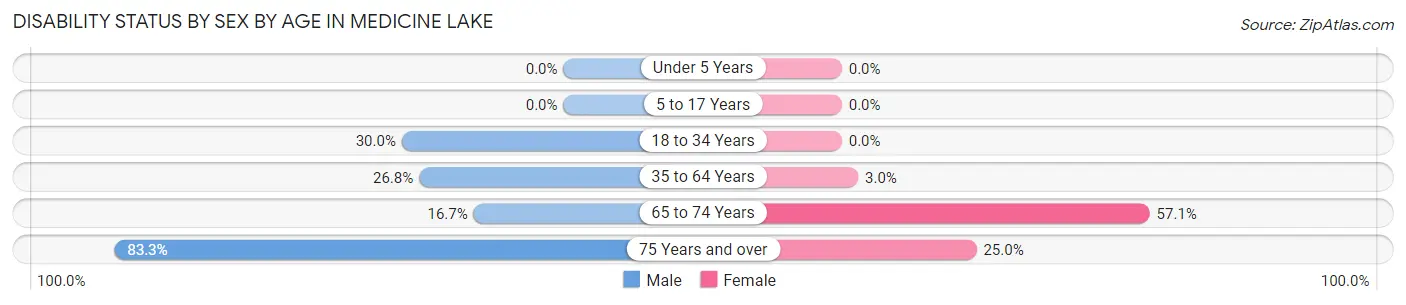
| Age Bracket | Male | Female |
| Under 5 Years | 0 (0.0%) | 0 (0.0%) |
| 5 to 17 Years | 0 (0.0%) | 0 (0.0%) |
| 18 to 34 Years | 6 (30.0%) | 0 (0.0%) |
| 35 to 64 Years | 15 (26.8%) | 1 (3.0%) |
| 65 to 74 Years | 3 (16.7%) | 4 (57.1%) |
| 75 Years and over | 5 (83.3%) | 4 (25.0%) |
Disability Class by Sex by Age in Medicine Lake
Disability Class: Hearing Difficulty
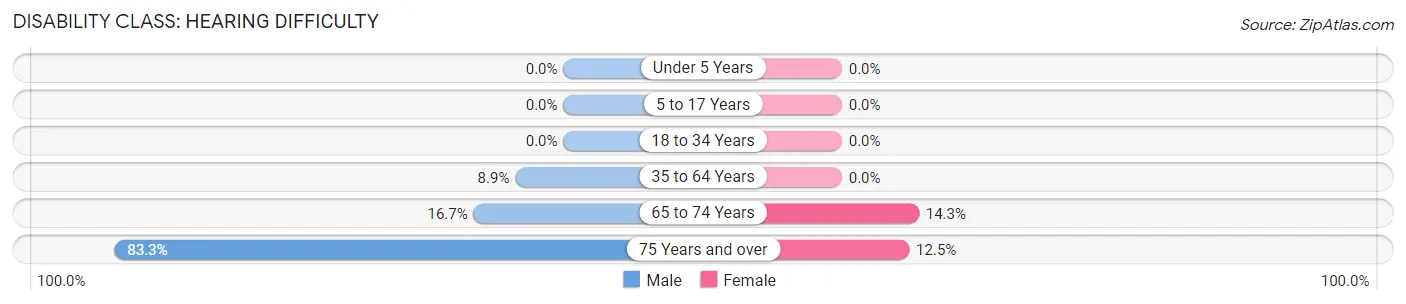
| Age Bracket | Male | Female |
| Under 5 Years | 0 (0.0%) | 0 (0.0%) |
| 5 to 17 Years | 0 (0.0%) | 0 (0.0%) |
| 18 to 34 Years | 0 (0.0%) | 0 (0.0%) |
| 35 to 64 Years | 5 (8.9%) | 0 (0.0%) |
| 65 to 74 Years | 3 (16.7%) | 1 (14.3%) |
| 75 Years and over | 5 (83.3%) | 2 (12.5%) |
Disability Class: Vision Difficulty
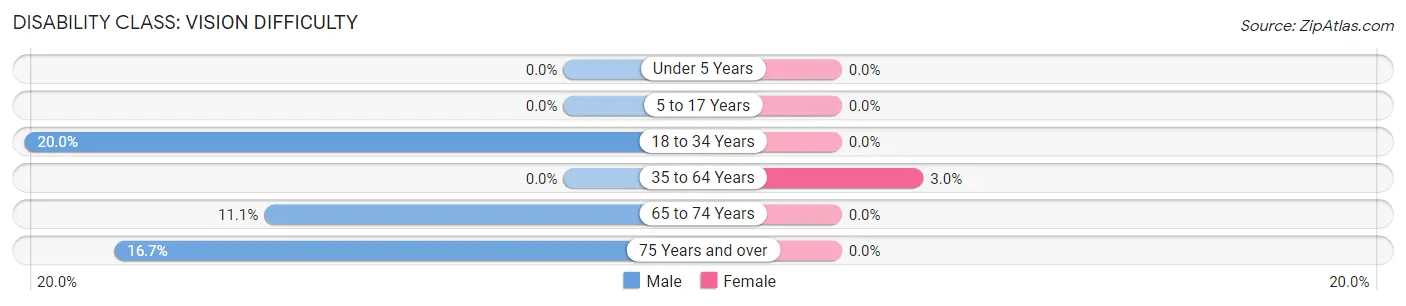
| Age Bracket | Male | Female |
| Under 5 Years | 0 (0.0%) | 0 (0.0%) |
| 5 to 17 Years | 0 (0.0%) | 0 (0.0%) |
| 18 to 34 Years | 4 (20.0%) | 0 (0.0%) |
| 35 to 64 Years | 0 (0.0%) | 1 (3.0%) |
| 65 to 74 Years | 2 (11.1%) | 0 (0.0%) |
| 75 Years and over | 1 (16.7%) | 0 (0.0%) |
Disability Class: Cognitive Difficulty
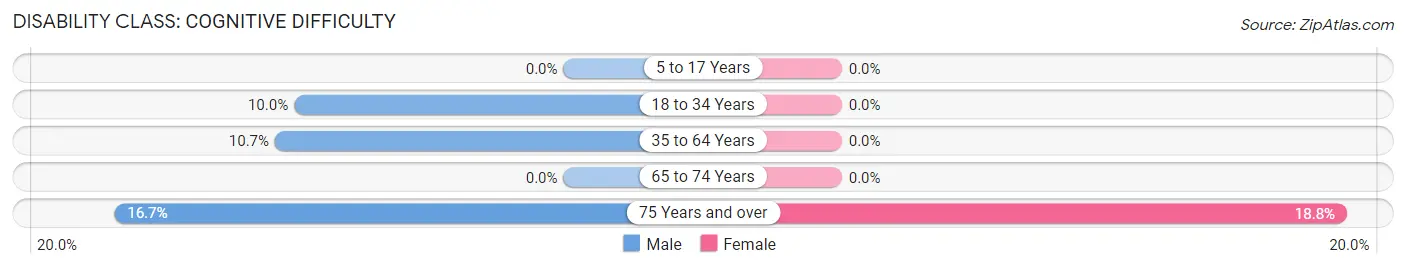
| Age Bracket | Male | Female |
| 5 to 17 Years | 0 (0.0%) | 0 (0.0%) |
| 18 to 34 Years | 2 (10.0%) | 0 (0.0%) |
| 35 to 64 Years | 6 (10.7%) | 0 (0.0%) |
| 65 to 74 Years | 0 (0.0%) | 0 (0.0%) |
| 75 Years and over | 1 (16.7%) | 3 (18.8%) |
Disability Class: Ambulatory Difficulty
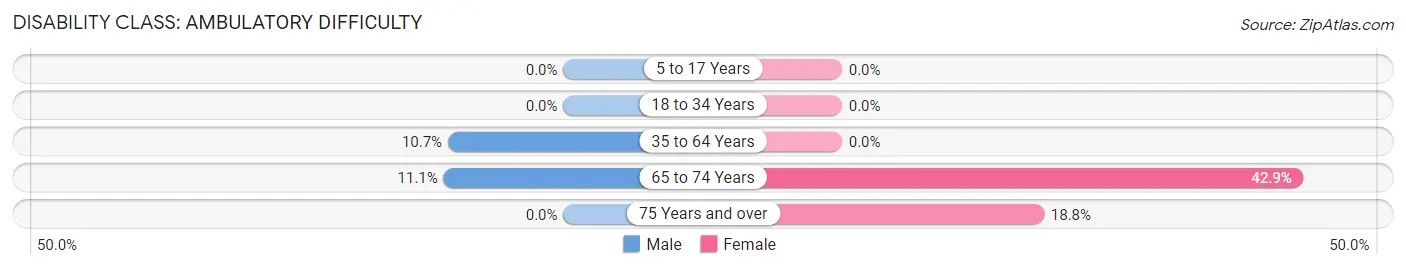
| Age Bracket | Male | Female |
| 5 to 17 Years | 0 (0.0%) | 0 (0.0%) |
| 18 to 34 Years | 0 (0.0%) | 0 (0.0%) |
| 35 to 64 Years | 6 (10.7%) | 0 (0.0%) |
| 65 to 74 Years | 2 (11.1%) | 3 (42.9%) |
| 75 Years and over | 0 (0.0%) | 3 (18.8%) |
Disability Class: Self-Care Difficulty
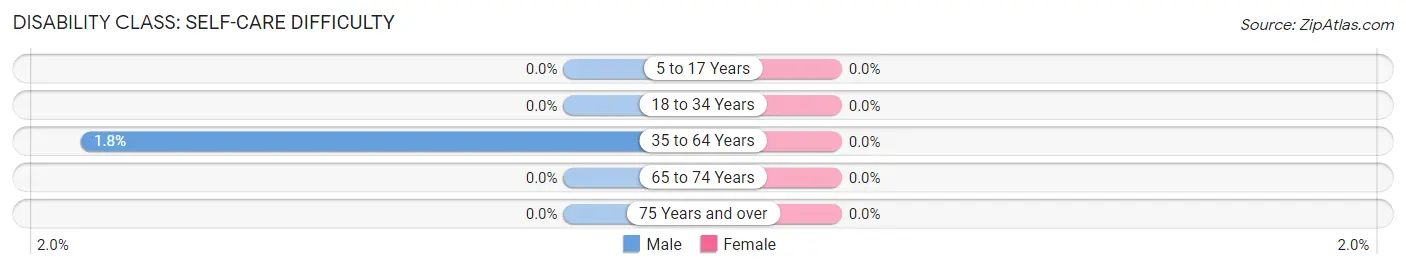
| Age Bracket | Male | Female |
| 5 to 17 Years | 0 (0.0%) | 0 (0.0%) |
| 18 to 34 Years | 0 (0.0%) | 0 (0.0%) |
| 35 to 64 Years | 1 (1.8%) | 0 (0.0%) |
| 65 to 74 Years | 0 (0.0%) | 0 (0.0%) |
| 75 Years and over | 0 (0.0%) | 0 (0.0%) |
Technology Access in Medicine Lake
Computing Device Access in Medicine Lake
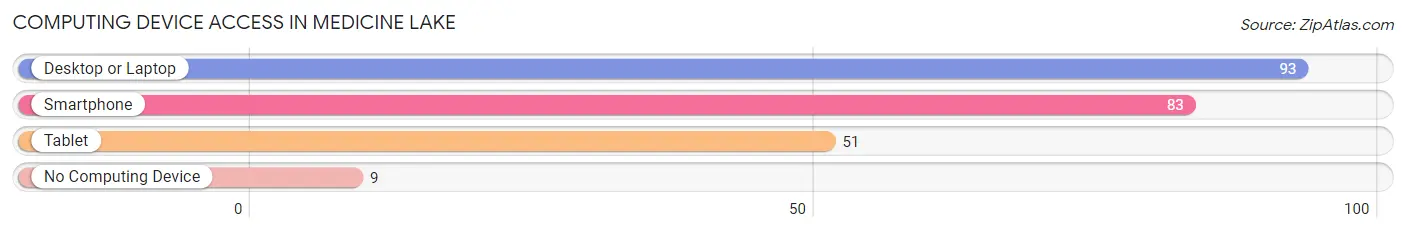
| Device Type | # Households | % Households |
| Desktop or Laptop | 93 | 80.2% |
| Smartphone | 83 | 71.6% |
| Tablet | 51 | 44.0% |
| No Computing Device | 9 | 7.8% |
| Total | 116 | 100.0% |
Internet Access in Medicine Lake
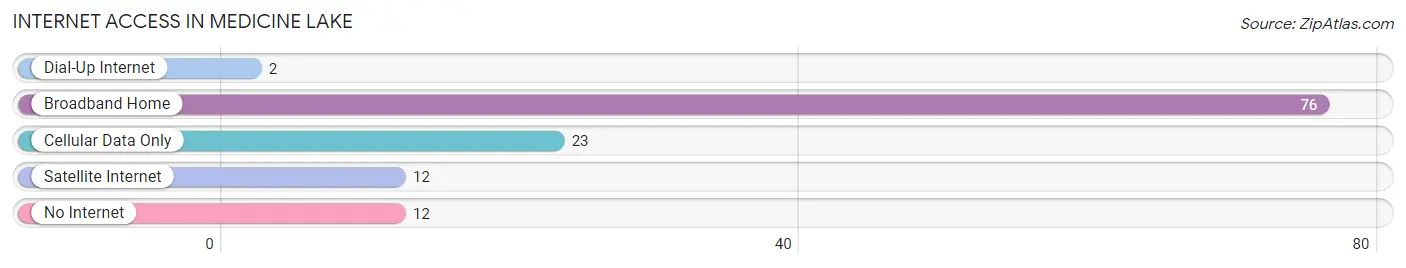
| Internet Type | # Households | % Households |
| Dial-Up Internet | 2 | 1.7% |
| Broadband Home | 76 | 65.5% |
| Cellular Data Only | 23 | 19.8% |
| Satellite Internet | 12 | 10.3% |
| No Internet | 12 | 10.3% |
| Total | 116 | 100.0% |
Medicine Lake Summary
Medicine Lake is a small town located in northeastern Montana, in the United States. It is situated in the foothills of the Rocky Mountains, and is surrounded by the vast prairies of the Great Plains. The town is located in Sheridan County, and is home to a population of just over 200 people.
History
The area around Medicine Lake has been inhabited for thousands of years, with evidence of human activity dating back to the Paleo-Indian period. The first recorded inhabitants of the area were the Assiniboine and Sioux tribes, who used the area for hunting and gathering. The first European settlers arrived in the area in the late 1800s, and the town of Medicine Lake was officially established in 1887.
The town was named after the nearby Medicine Lake, which was named by the Assiniboine and Sioux tribes. The lake was believed to have healing properties, and was used by the tribes for medicinal purposes.
Geography
Medicine Lake is located in northeastern Montana, in the foothills of the Rocky Mountains. The town is situated at an elevation of 3,400 feet, and is surrounded by the vast prairies of the Great Plains. The town is located in Sheridan County, and is home to a population of just over 200 people.
The town is located near the confluence of the Yellowstone and Missouri Rivers, and is situated in a region of rolling hills and grasslands. The area is known for its wide open spaces and stunning views of the surrounding mountains.
Economy
The economy of Medicine Lake is largely based on agriculture and ranching. The town is home to several farms and ranches, which produce a variety of crops and livestock. The town is also home to a number of small businesses, including a grocery store, a hardware store, and a restaurant.
The town is also home to a number of tourist attractions, including the Medicine Lake National Wildlife Refuge, which is home to a variety of wildlife, including bison, elk, and antelope. The town is also home to the Medicine Lake State Park, which offers camping, fishing, and hiking opportunities.
Demographics
As of the 2010 census, the population of Medicine Lake was 203. The town is predominantly white, with a small minority population. The median household income in the town is $37,500, and the median age is 44. The town is home to a number of churches, including the Church of Jesus Christ of Latter-day Saints, the United Methodist Church, and the Catholic Church.
Conclusion
Medicine Lake is a small town located in northeastern Montana, in the United States. It is situated in the foothills of the Rocky Mountains, and is surrounded by the vast prairies of the Great Plains. The town is home to a population of just over 200 people, and is largely based on agriculture and ranching. The town is also home to a number of tourist attractions, including the Medicine Lake National Wildlife Refuge and the Medicine Lake State Park.
Common Questions
What is Per Capita Income in Medicine Lake?
Per Capita income in Medicine Lake is $35,856.
What is the Median Family Income in Medicine Lake?
Median Family Income in Medicine Lake is $84,375.
What is the Median Household income in Medicine Lake?
Median Household Income in Medicine Lake is $41,875.
What is Income or Wage Gap in Medicine Lake?
Income or Wage Gap in Medicine Lake is 48.4%.
Women in Medicine Lake earn 51.6 cents for every dollar earned by a man.
What is Inequality or Gini Index in Medicine Lake?
Inequality or Gini Index in Medicine Lake is 0.40.
What is the Total Population of Medicine Lake?
Total Population of Medicine Lake is 206.
What is the Total Male Population of Medicine Lake?
Total Male Population of Medicine Lake is 129.
What is the Total Female Population of Medicine Lake?
Total Female Population of Medicine Lake is 77.
What is the Ratio of Males per 100 Females in Medicine Lake?
There are 167.53 Males per 100 Females in Medicine Lake.
What is the Ratio of Females per 100 Males in Medicine Lake?
There are 59.69 Females per 100 Males in Medicine Lake.
What is the Median Population Age in Medicine Lake?
Median Population Age in Medicine Lake is 46.0 Years.
What is the Average Family Size in Medicine Lake
Average Family Size in Medicine Lake is 2.7 People.
What is the Average Household Size in Medicine Lake
Average Household Size in Medicine Lake is 1.8 People.
How Large is the Labor Force in Medicine Lake?
There are 122 People in the Labor Forcein in Medicine Lake.
What is the Percentage of People in the Labor Force in Medicine Lake?
68.9% of People are in the Labor Force in Medicine Lake.
What is the Unemployment Rate in Medicine Lake?
Unemployment Rate in Medicine Lake is 3.3%.