Harper Woods, MI Map & Demographics
Harper Woods Map
Harper Woods Overview
$28,334
PER CAPITA INCOME
$72,799
AVG FAMILY INCOME
$60,030
AVG HOUSEHOLD INCOME
7.4%
WAGE / INCOME GAP [ % ]
92.6¢/ $1
WAGE / INCOME GAP [ $ ]
0.42
INEQUALITY / GINI INDEX
15,296
TOTAL POPULATION
7,095
MALE POPULATION
8,201
FEMALE POPULATION
86.51
MALES / 100 FEMALES
115.59
FEMALES / 100 MALES
37.4
MEDIAN AGE
3.6
AVG FAMILY SIZE
2.7
AVG HOUSEHOLD SIZE
7,704
LABOR FORCE [ PEOPLE ]
66.0%
PERCENT IN LABOR FORCE
7.6%
UNEMPLOYMENT RATE
Harper Woods Zip Codes
Income in Harper Woods
Income Overview in Harper Woods
Per Capita Income in Harper Woods is $28,334, while median incomes of families and households are $72,799 and $60,030 respectively.
| Characteristic | Number | Measure |
| Per Capita Income | 15,296 | $28,334 |
| Median Family Income | 3,260 | $72,799 |
| Mean Family Income | 3,260 | $83,460 |
| Median Household Income | 5,515 | $60,030 |
| Mean Household Income | 5,515 | $72,193 |
| Income Deficit | 3,260 | $0 |
| Wage / Income Gap (%) | 15,296 | 7.38% |
| Wage / Income Gap ($) | 15,296 | 92.62¢ per $1 |
| Gini / Inequality Index | 15,296 | 0.42 |
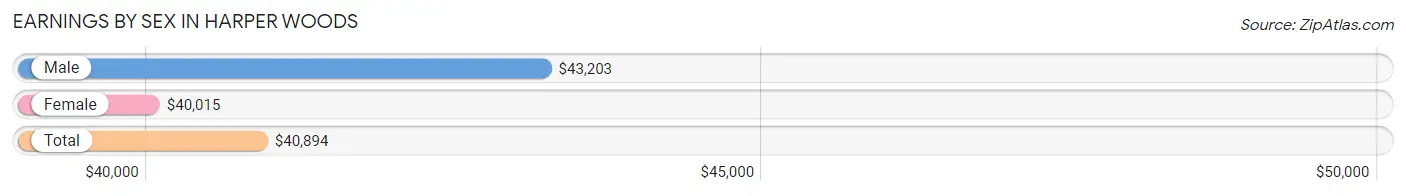
Earnings by Sex in Harper Woods
Average Earnings in Harper Woods are $40,894, $43,203 for men and $40,015 for women, a difference of 7.4%.
| Sex | Number | Average Earnings |
| Male | 3,626 (46.9%) | $43,203 |
| Female | 4,110 (53.1%) | $40,015 |
| Total | 7,736 (100.0%) | $40,894 |
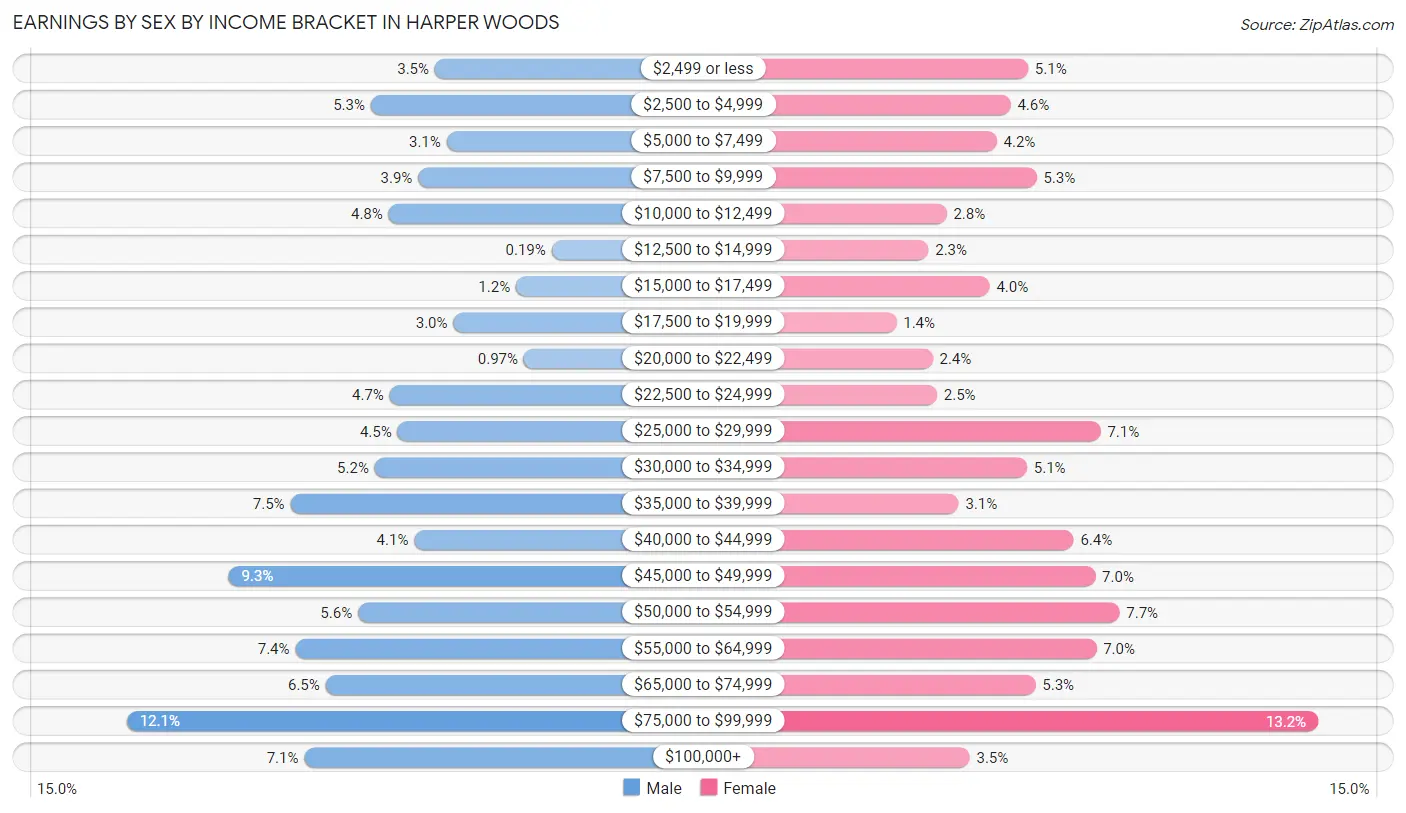
Earnings by Sex by Income Bracket in Harper Woods
The most common earnings brackets in Harper Woods are $75,000 to $99,999 for men (440 | 12.1%) and $75,000 to $99,999 for women (544 | 13.2%).
| Income | Male | Female |
| $2,499 or less | 126 (3.5%) | 209 (5.1%) |
| $2,500 to $4,999 | 191 (5.3%) | 189 (4.6%) |
| $5,000 to $7,499 | 114 (3.1%) | 173 (4.2%) |
| $7,500 to $9,999 | 143 (3.9%) | 219 (5.3%) |
| $10,000 to $12,499 | 173 (4.8%) | 115 (2.8%) |
| $12,500 to $14,999 | 7 (0.2%) | 94 (2.3%) |
| $15,000 to $17,499 | 43 (1.2%) | 165 (4.0%) |
| $17,500 to $19,999 | 107 (2.9%) | 57 (1.4%) |
| $20,000 to $22,499 | 35 (1.0%) | 99 (2.4%) |
| $22,500 to $24,999 | 172 (4.7%) | 104 (2.5%) |
| $25,000 to $29,999 | 164 (4.5%) | 293 (7.1%) |
| $30,000 to $34,999 | 187 (5.2%) | 208 (5.1%) |
| $35,000 to $39,999 | 273 (7.5%) | 129 (3.1%) |
| $40,000 to $44,999 | 147 (4.1%) | 262 (6.4%) |
| $45,000 to $49,999 | 336 (9.3%) | 287 (7.0%) |
| $50,000 to $54,999 | 204 (5.6%) | 315 (7.7%) |
| $55,000 to $64,999 | 268 (7.4%) | 288 (7.0%) |
| $65,000 to $74,999 | 237 (6.5%) | 218 (5.3%) |
| $75,000 to $99,999 | 440 (12.1%) | 544 (13.2%) |
| $100,000+ | 259 (7.1%) | 142 (3.5%) |
| Total | 3,626 (100.0%) | 4,110 (100.0%) |
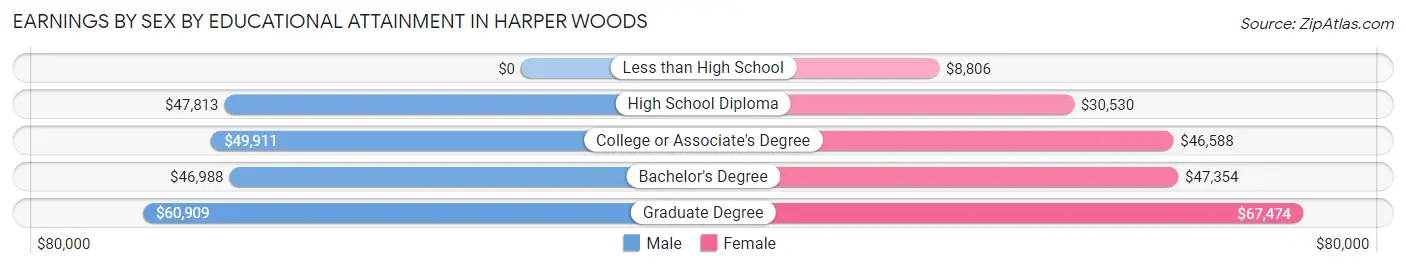
Earnings by Sex by Educational Attainment in Harper Woods
Average earnings in Harper Woods are $48,703 for men and $45,271 for women, a difference of 7.0%. Men with an educational attainment of graduate degree enjoy the highest average annual earnings of $60,909, while those with bachelor's degree education earn the least with $46,988. Women with an educational attainment of graduate degree earn the most with the average annual earnings of $67,474, while those with less than high school education have the smallest earnings of $8,806.
| Educational Attainment | Male Income | Female Income |
| Less than High School | - | - |
| High School Diploma | $47,813 | $30,530 |
| College or Associate's Degree | $49,911 | $46,588 |
| Bachelor's Degree | $46,988 | $47,354 |
| Graduate Degree | $60,909 | $67,474 |
| Total | $48,703 | $45,271 |
Family Income in Harper Woods
Family Income Brackets in Harper Woods
According to the Harper Woods family income data, there are 737 families falling into the $50,000 to $74,999 income range, which is the most common income bracket and makes up 22.6% of all families. Conversely, the less than $10,000 income bracket is the least frequent group with only 101 families (3.1%) belonging to this category.
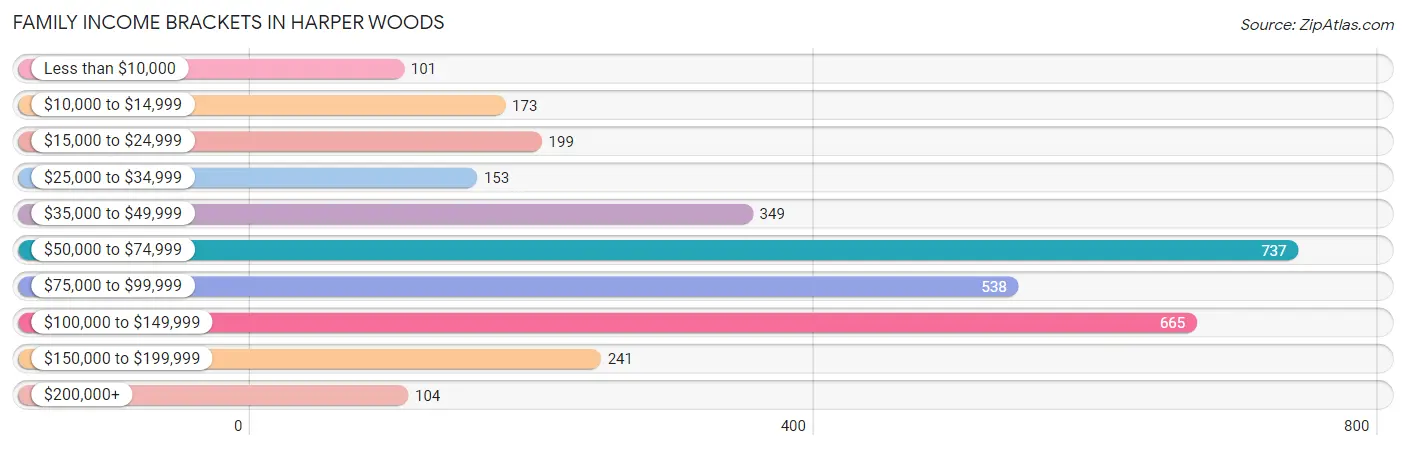
| Income Bracket | # Families | % Families |
| Less than $10,000 | 101 | 3.1% |
| $10,000 to $14,999 | 173 | 5.3% |
| $15,000 to $24,999 | 199 | 6.1% |
| $25,000 to $34,999 | 153 | 4.7% |
| $35,000 to $49,999 | 349 | 10.7% |
| $50,000 to $74,999 | 737 | 22.6% |
| $75,000 to $99,999 | 538 | 16.5% |
| $100,000 to $149,999 | 665 | 20.4% |
| $150,000 to $199,999 | 241 | 7.4% |
| $200,000+ | 104 | 3.2% |
Family Income by Famaliy Size in Harper Woods
6-person families (129 | 4.0%) account for the highest median family income in Harper Woods with $106,393 per family, while 2-person families (1,402 | 43.0%) have the highest median income of $30,430 per family member.
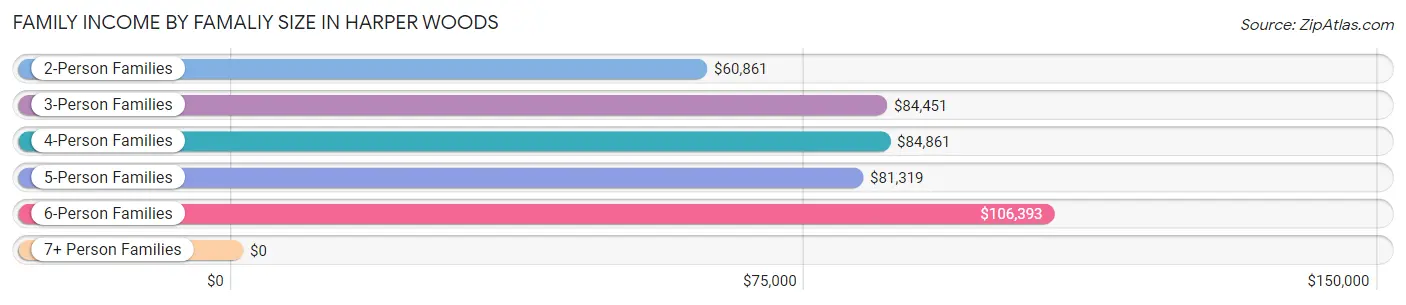
| Income Bracket | # Families | Median Income |
| 2-Person Families | 1,402 (43.0%) | $60,861 |
| 3-Person Families | 855 (26.2%) | $84,451 |
| 4-Person Families | 408 (12.5%) | $84,861 |
| 5-Person Families | 307 (9.4%) | $81,319 |
| 6-Person Families | 129 (4.0%) | $106,393 |
| 7+ Person Families | 159 (4.9%) | $0 |
| Total | 3,260 (100.0%) | $72,799 |
Family Income by Number of Earners in Harper Woods
The median family income in Harper Woods is $72,799, with families comprising 3+ earners (484) having the highest median family income of $112,500, while families with no earners (363) have the lowest median family income of $33,405, accounting for 14.8% and 11.1% of families, respectively.
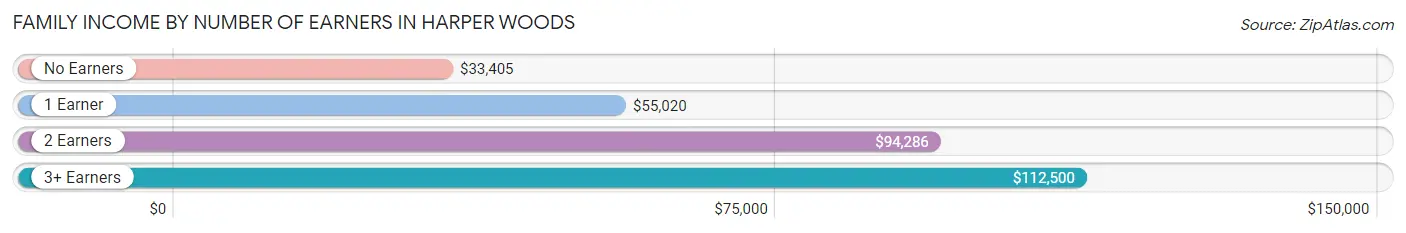
| Number of Earners | # Families | Median Income |
| No Earners | 363 (11.1%) | $33,405 |
| 1 Earner | 1,289 (39.5%) | $55,020 |
| 2 Earners | 1,124 (34.5%) | $94,286 |
| 3+ Earners | 484 (14.8%) | $112,500 |
| Total | 3,260 (100.0%) | $72,799 |
Household Income in Harper Woods
Household Income Brackets in Harper Woods
With 1,279 households falling in the category, the $50,000 to $74,999 income range is the most frequent in Harper Woods, accounting for 23.2% of all households. In contrast, only 132 households (2.4%) fall into the $200,000+ income bracket, making it the least populous group.
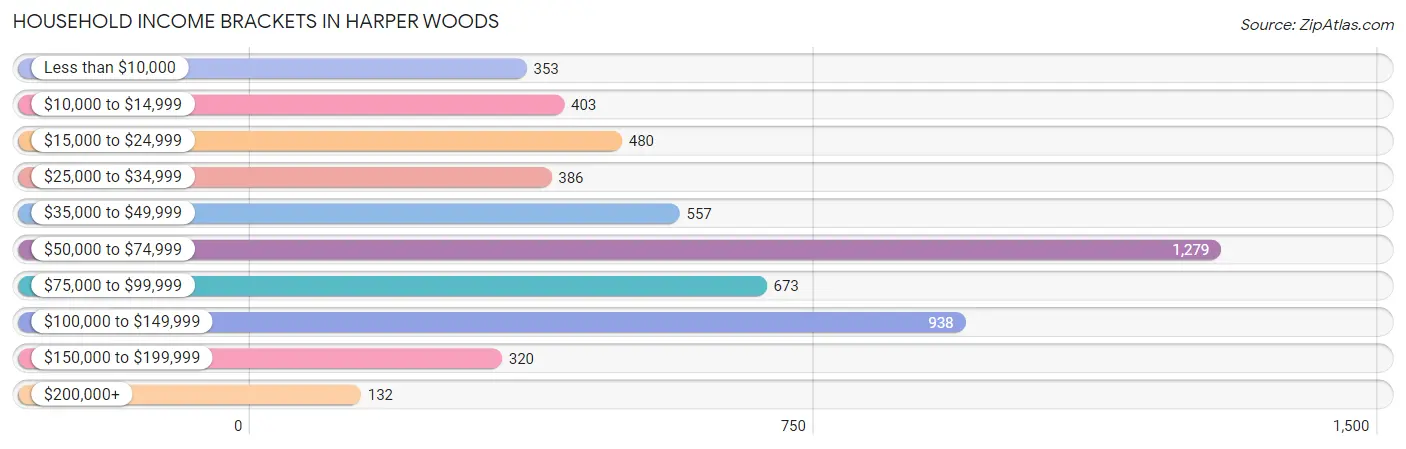
| Income Bracket | # Households | % Households |
| Less than $10,000 | 353 | 6.4% |
| $10,000 to $14,999 | 403 | 7.3% |
| $15,000 to $24,999 | 480 | 8.7% |
| $25,000 to $34,999 | 386 | 7.0% |
| $35,000 to $49,999 | 557 | 10.1% |
| $50,000 to $74,999 | 1,279 | 23.2% |
| $75,000 to $99,999 | 673 | 12.2% |
| $100,000 to $149,999 | 938 | 17.0% |
| $150,000 to $199,999 | 320 | 5.8% |
| $200,000+ | 132 | 2.4% |
Household Income by Householder Age in Harper Woods
The median household income in Harper Woods is $60,030, with the highest median household income of $73,000 found in the 45 to 64 years age bracket for the primary householder. A total of 2,094 households (38.0%) fall into this category. Meanwhile, the 15 to 24 years age bracket for the primary householder has the lowest median household income of $0, with 30 households (0.5%) in this group.
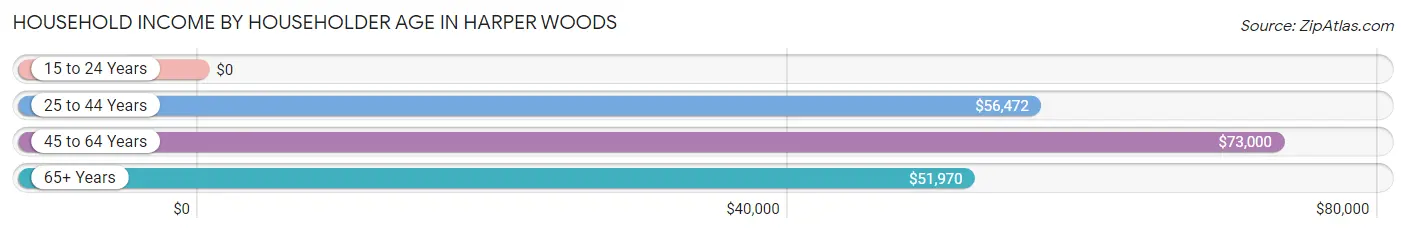
| Income Bracket | # Households | Median Income |
| 15 to 24 Years | 30 (0.5%) | $0 |
| 25 to 44 Years | 1,949 (35.3%) | $56,472 |
| 45 to 64 Years | 2,094 (38.0%) | $73,000 |
| 65+ Years | 1,442 (26.2%) | $51,970 |
| Total | 5,515 (100.0%) | $60,030 |
Poverty in Harper Woods
Income Below Poverty by Sex and Age in Harper Woods
With 15.2% poverty level for males and 24.3% for females among the residents of Harper Woods, under 5 year old males and 6 to 11 year old females are the most vulnerable to poverty, with 206 males (42.4%) and 496 females (58.4%) in their respective age groups living below the poverty level.
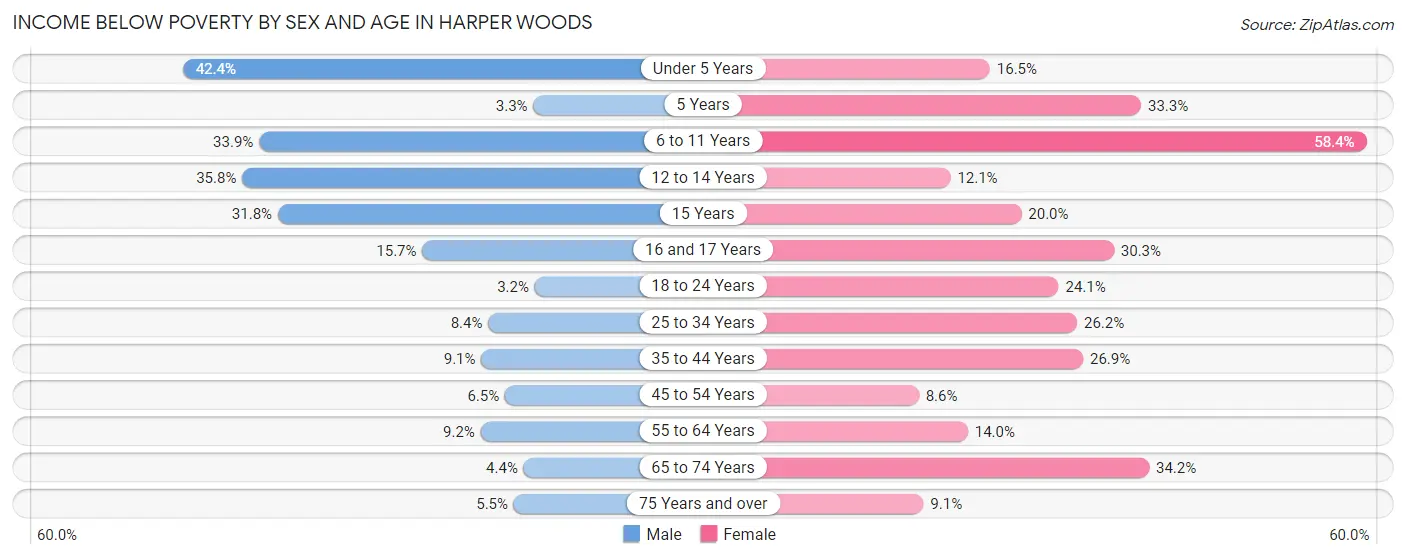
| Age Bracket | Male | Female |
| Under 5 Years | 206 (42.4%) | 61 (16.5%) |
| 5 Years | 2 (3.3%) | 17 (33.3%) |
| 6 to 11 Years | 268 (33.9%) | 496 (58.4%) |
| 12 to 14 Years | 167 (35.8%) | 30 (12.1%) |
| 15 Years | 55 (31.8%) | 21 (20.0%) |
| 16 and 17 Years | 38 (15.7%) | 50 (30.3%) |
| 18 to 24 Years | 23 (3.2%) | 154 (24.1%) |
| 25 to 34 Years | 83 (8.4%) | 257 (26.2%) |
| 35 to 44 Years | 63 (9.1%) | 316 (26.9%) |
| 45 to 54 Years | 62 (6.5%) | 114 (8.6%) |
| 55 to 64 Years | 63 (9.2%) | 131 (14.0%) |
| 65 to 74 Years | 23 (4.4%) | 282 (34.2%) |
| 75 Years and over | 13 (5.5%) | 41 (9.1%) |
| Total | 1,066 (15.2%) | 1,970 (24.3%) |
Income Above Poverty by Sex and Age in Harper Woods
According to the poverty statistics in Harper Woods, males aged 18 to 24 years and females aged 45 to 54 years are the age groups that are most secure financially, with 96.8% of males and 91.4% of females in these age groups living above the poverty line.
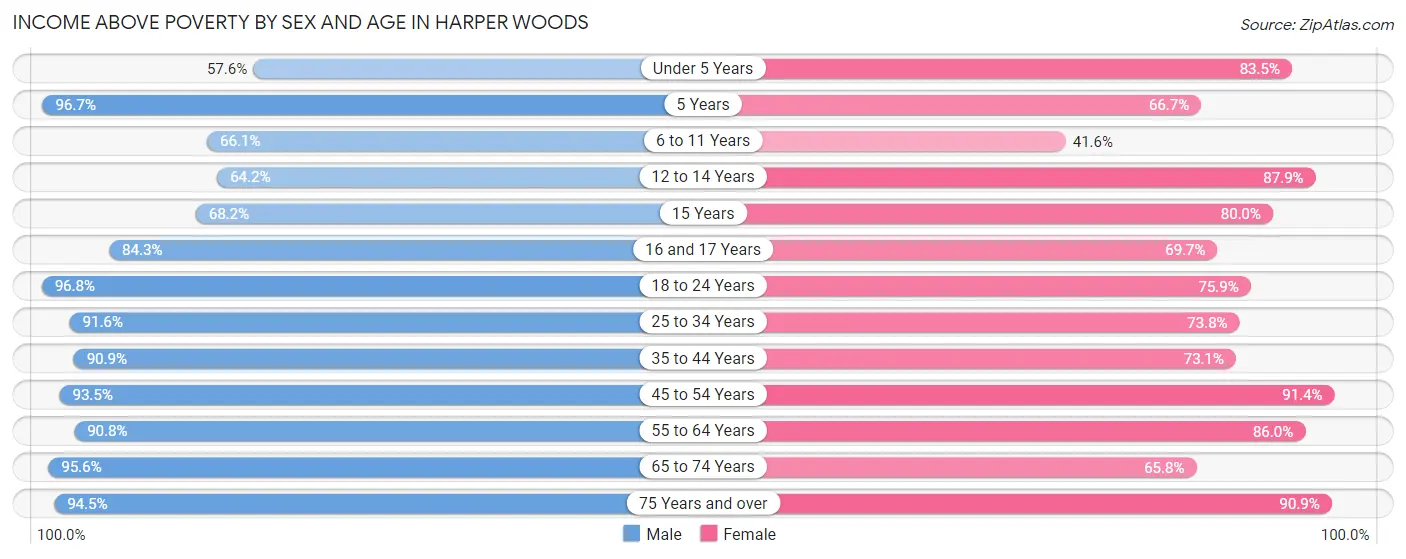
| Age Bracket | Male | Female |
| Under 5 Years | 280 (57.6%) | 309 (83.5%) |
| 5 Years | 58 (96.7%) | 34 (66.7%) |
| 6 to 11 Years | 523 (66.1%) | 353 (41.6%) |
| 12 to 14 Years | 300 (64.2%) | 218 (87.9%) |
| 15 Years | 118 (68.2%) | 84 (80.0%) |
| 16 and 17 Years | 204 (84.3%) | 115 (69.7%) |
| 18 to 24 Years | 701 (96.8%) | 484 (75.9%) |
| 25 to 34 Years | 910 (91.6%) | 724 (73.8%) |
| 35 to 44 Years | 627 (90.9%) | 860 (73.1%) |
| 45 to 54 Years | 893 (93.5%) | 1,216 (91.4%) |
| 55 to 64 Years | 621 (90.8%) | 803 (86.0%) |
| 65 to 74 Years | 498 (95.6%) | 542 (65.8%) |
| 75 Years and over | 223 (94.5%) | 410 (90.9%) |
| Total | 5,956 (84.8%) | 6,152 (75.7%) |
Income Below Poverty Among Married-Couple Families in Harper Woods
The poverty statistics for married-couple families in Harper Woods show that 3.6% or 50 of the total 1,404 families live below the poverty line. Families with 3 or 4 children have the highest poverty rate of 9.4%, comprising of 16 families. On the other hand, families with no children have the lowest poverty rate of 1.8%, which includes 14 families.
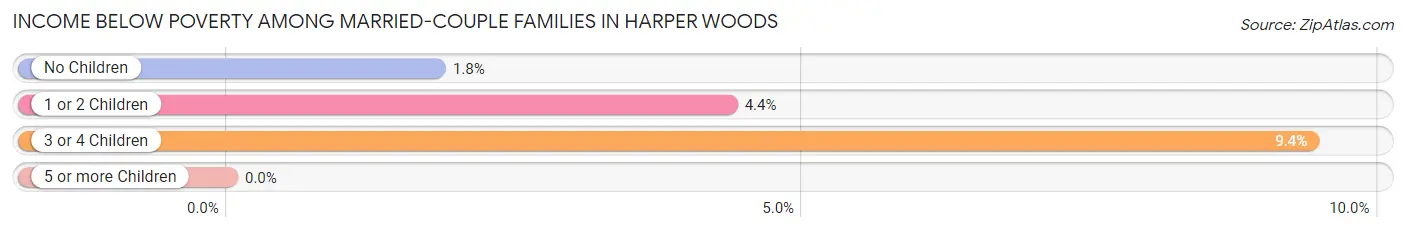
| Children | Above Poverty | Below Poverty |
| No Children | 760 (98.2%) | 14 (1.8%) |
| 1 or 2 Children | 440 (95.7%) | 20 (4.3%) |
| 3 or 4 Children | 154 (90.6%) | 16 (9.4%) |
| 5 or more Children | 0 (0.0%) | 0 (0.0%) |
| Total | 1,354 (96.4%) | 50 (3.6%) |
Income Below Poverty Among Single-Parent Households in Harper Woods
According to the poverty data in Harper Woods, 4.0% or 12 single-father households and 25.2% or 393 single-mother households are living below the poverty line. Among single-father households, those with 1 or 2 children have the highest poverty rate, with 12 households (8.6%) experiencing poverty. Likewise, among single-mother households, those with 5 or more children have the highest poverty rate, with 68 households (100.0%) falling below the poverty line.
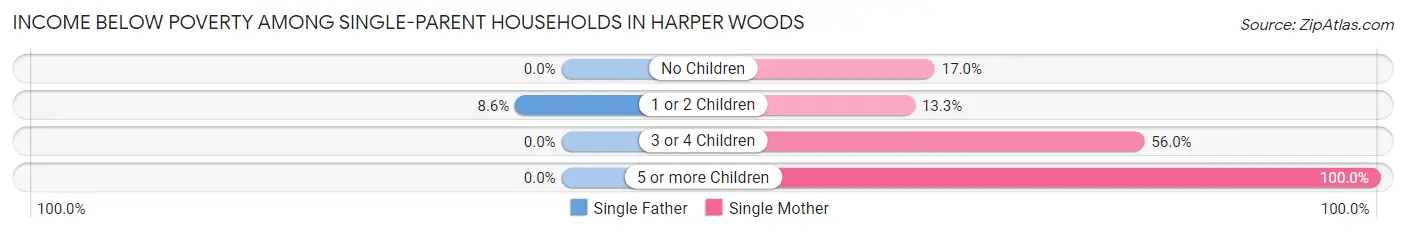
| Children | Single Father | Single Mother |
| No Children | 0 (0.0%) | 111 (17.0%) |
| 1 or 2 Children | 12 (8.6%) | 79 (13.3%) |
| 3 or 4 Children | 0 (0.0%) | 135 (56.0%) |
| 5 or more Children | 0 (0.0%) | 68 (100.0%) |
| Total | 12 (4.0%) | 393 (25.2%) |
Income Below Poverty Among Married-Couple vs Single-Parent Households in Harper Woods
The poverty data for Harper Woods shows that 50 of the married-couple family households (3.6%) and 405 of the single-parent households (21.8%) are living below the poverty level. Within the married-couple family households, those with 3 or 4 children have the highest poverty rate, with 16 households (9.4%) falling below the poverty line. Among the single-parent households, those with 5 or more children have the highest poverty rate, with 68 household (100.0%) living below poverty.
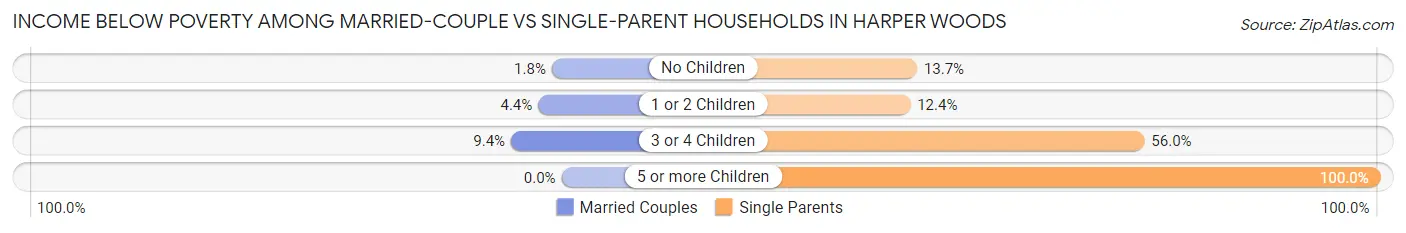
| Children | Married-Couple Families | Single-Parent Households |
| No Children | 14 (1.8%) | 111 (13.7%) |
| 1 or 2 Children | 20 (4.3%) | 91 (12.4%) |
| 3 or 4 Children | 16 (9.4%) | 135 (56.0%) |
| 5 or more Children | 0 (0.0%) | 68 (100.0%) |
| Total | 50 (3.6%) | 405 (21.8%) |
Race in Harper Woods
The most populous races in Harper Woods are Black / African American (9,770 | 63.9%), White / Caucasian (4,614 | 30.2%), and Two or more Races (744 | 4.9%).
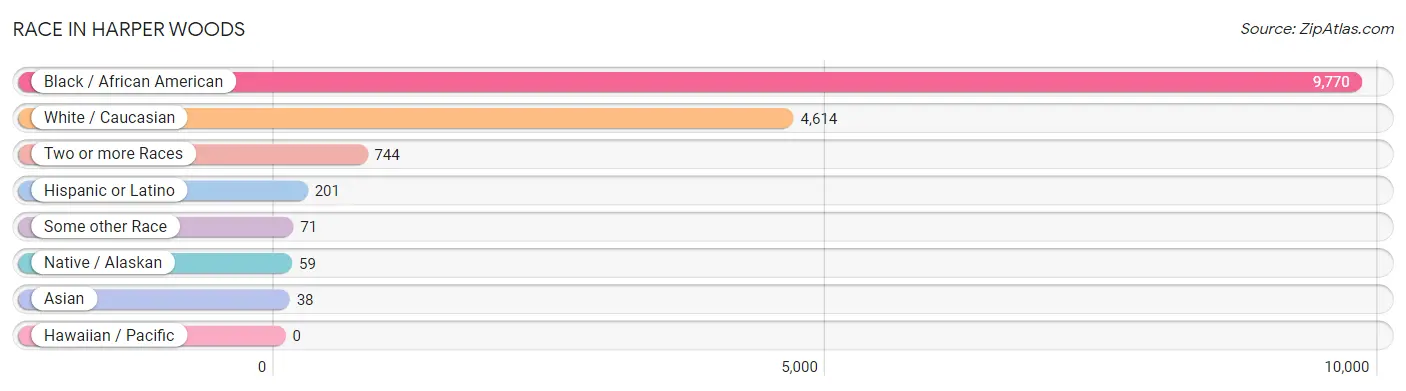
| Race | # Population | % Population |
| Asian | 38 | 0.3% |
| Black / African American | 9,770 | 63.9% |
| Hawaiian / Pacific | 0 | 0.0% |
| Hispanic or Latino | 201 | 1.3% |
| Native / Alaskan | 59 | 0.4% |
| White / Caucasian | 4,614 | 30.2% |
| Two or more Races | 744 | 4.9% |
| Some other Race | 71 | 0.5% |
| Total | 15,296 | 100.0% |
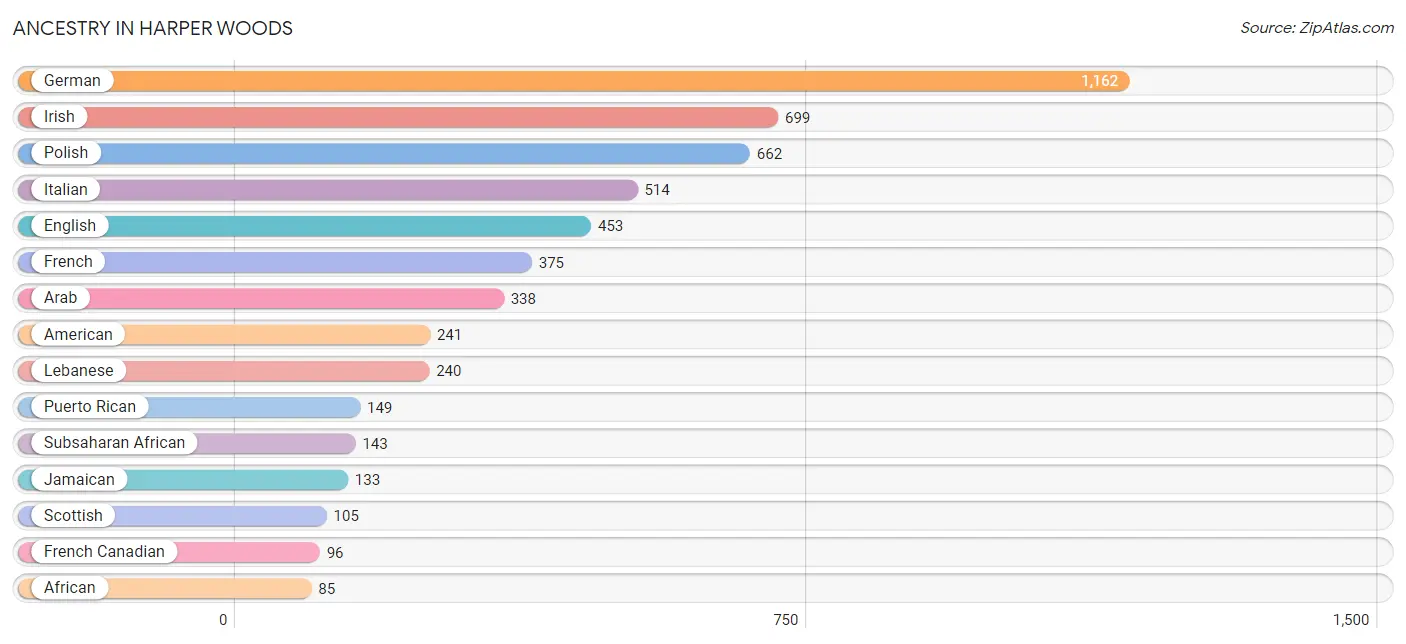
Ancestry in Harper Woods
The most populous ancestries reported in Harper Woods are German (1,162 | 7.6%), Irish (699 | 4.6%), Polish (662 | 4.3%), Italian (514 | 3.4%), and English (453 | 3.0%), together accounting for 22.8% of all Harper Woods residents.
| Ancestry | # Population | % Population |
| African | 85 | 0.6% |
| American | 241 | 1.6% |
| Apache | 3 | 0.0% |
| Arab | 338 | 2.2% |
| Argentinean | 16 | 0.1% |
| Armenian | 5 | 0.0% |
| Austrian | 12 | 0.1% |
| Belgian | 60 | 0.4% |
| British | 14 | 0.1% |
| Burmese | 5 | 0.0% |
| Canadian | 63 | 0.4% |
| Cherokee | 69 | 0.4% |
| Chilean | 10 | 0.1% |
| Chippewa | 24 | 0.2% |
| Croatian | 11 | 0.1% |
| Czechoslovakian | 41 | 0.3% |
| Danish | 9 | 0.1% |
| Dutch | 71 | 0.5% |
| Eastern European | 7 | 0.1% |
| Egyptian | 20 | 0.1% |
| English | 453 | 3.0% |
| European | 27 | 0.2% |
| Finnish | 14 | 0.1% |
| French | 375 | 2.5% |
| French Canadian | 96 | 0.6% |
| German | 1,162 | 7.6% |
| Greek | 34 | 0.2% |
| Hungarian | 17 | 0.1% |
| Iraqi | 14 | 0.1% |
| Irish | 699 | 4.6% |
| Iroquois | 5 | 0.0% |
| Italian | 514 | 3.4% |
| Jamaican | 133 | 0.9% |
| Korean | 53 | 0.4% |
| Lebanese | 240 | 1.6% |
| Lithuanian | 9 | 0.1% |
| Maltese | 73 | 0.5% |
| Mexican | 26 | 0.2% |
| Native Hawaiian | 28 | 0.2% |
| Nigerian | 58 | 0.4% |
| Northern European | 32 | 0.2% |
| Norwegian | 6 | 0.0% |
| Polish | 662 | 4.3% |
| Puerto Rican | 149 | 1.0% |
| Romanian | 3 | 0.0% |
| Russian | 14 | 0.1% |
| Scandinavian | 11 | 0.1% |
| Scotch-Irish | 24 | 0.2% |
| Scottish | 105 | 0.7% |
| Serbian | 6 | 0.0% |
| Slovak | 19 | 0.1% |
| South American | 26 | 0.2% |
| Sri Lankan | 17 | 0.1% |
| Subsaharan African | 143 | 0.9% |
| Swedish | 23 | 0.2% |
| Swiss | 25 | 0.2% |
| Thai | 9 | 0.1% |
| Ukrainian | 34 | 0.2% |
| Welsh | 16 | 0.1% | View All 59 Rows |
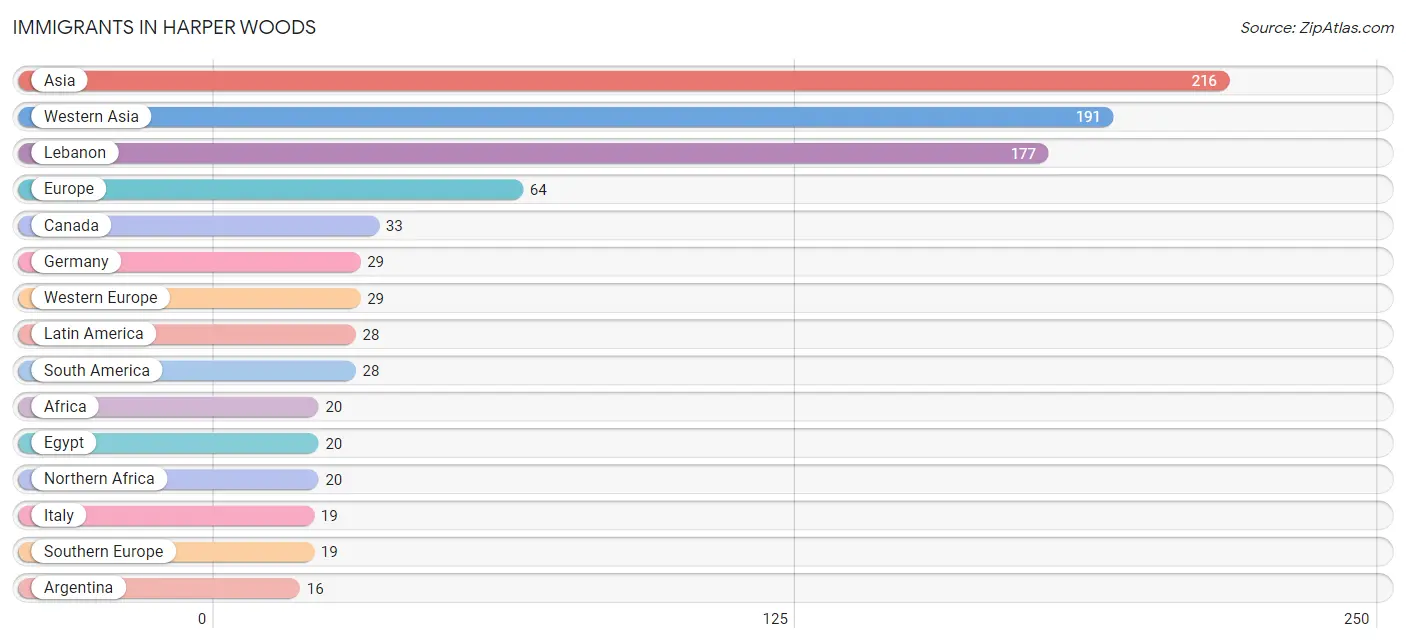
Immigrants in Harper Woods
The most numerous immigrant groups reported in Harper Woods came from Asia (216 | 1.4%), Western Asia (191 | 1.3%), Lebanon (177 | 1.2%), Europe (64 | 0.4%), and Canada (33 | 0.2%), together accounting for 4.5% of all Harper Woods residents.
| Immigration Origin | # Population | % Population |
| Africa | 20 | 0.1% |
| Argentina | 16 | 0.1% |
| Asia | 216 | 1.4% |
| Canada | 33 | 0.2% |
| Chile | 10 | 0.1% |
| Eastern Asia | 5 | 0.0% |
| Eastern Europe | 16 | 0.1% |
| Egypt | 20 | 0.1% |
| Europe | 64 | 0.4% |
| Germany | 29 | 0.2% |
| Guyana | 2 | 0.0% |
| India | 4 | 0.0% |
| Iraq | 14 | 0.1% |
| Italy | 19 | 0.1% |
| Korea | 5 | 0.0% |
| Latin America | 28 | 0.2% |
| Lebanon | 177 | 1.2% |
| Northern Africa | 20 | 0.1% |
| Philippines | 16 | 0.1% |
| Poland | 16 | 0.1% |
| South America | 28 | 0.2% |
| South Central Asia | 4 | 0.0% |
| South Eastern Asia | 16 | 0.1% |
| Southern Europe | 19 | 0.1% |
| Western Asia | 191 | 1.3% |
| Western Europe | 29 | 0.2% | View All 26 Rows |
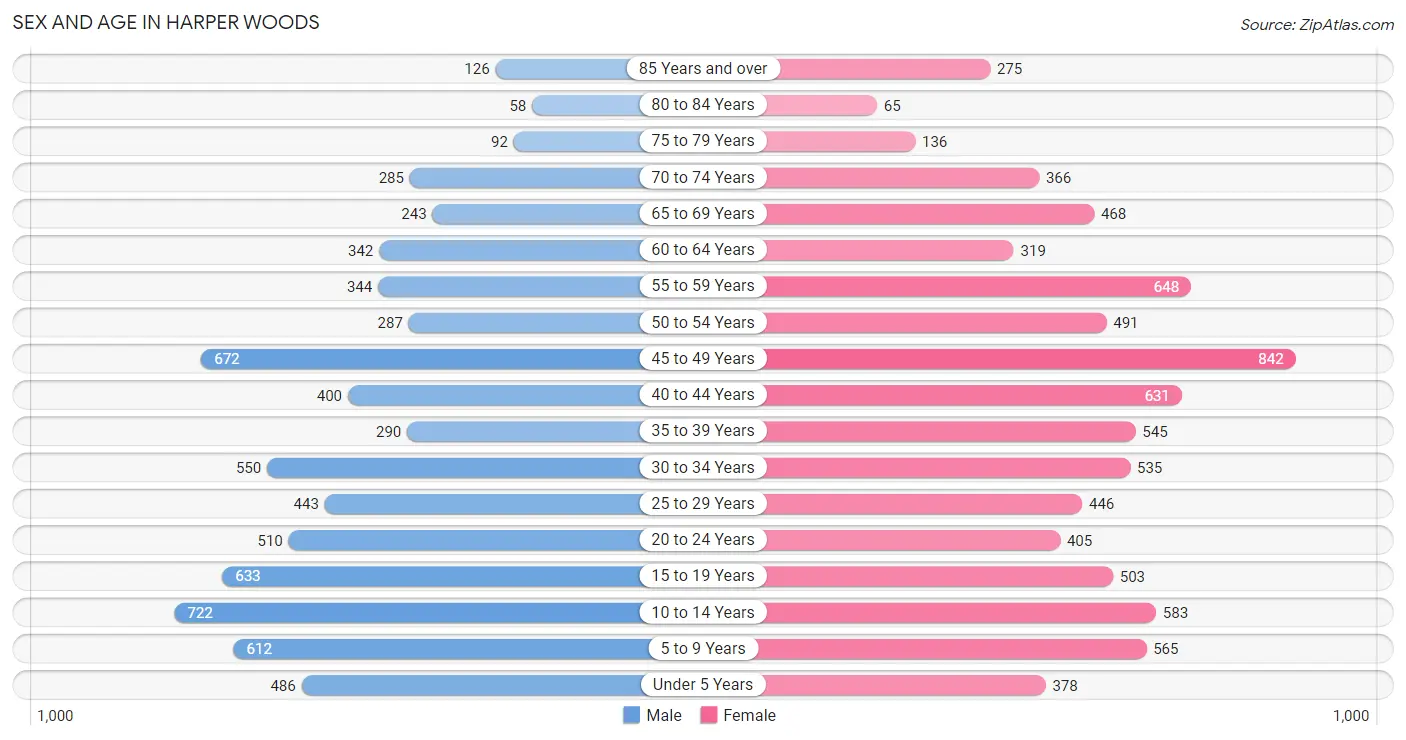
Sex and Age in Harper Woods
Sex and Age in Harper Woods
The most populous age groups in Harper Woods are 10 to 14 Years (722 | 10.2%) for men and 45 to 49 Years (842 | 10.3%) for women.
| Age Bracket | Male | Female |
| Under 5 Years | 486 (6.9%) | 378 (4.6%) |
| 5 to 9 Years | 612 (8.6%) | 565 (6.9%) |
| 10 to 14 Years | 722 (10.2%) | 583 (7.1%) |
| 15 to 19 Years | 633 (8.9%) | 503 (6.1%) |
| 20 to 24 Years | 510 (7.2%) | 405 (4.9%) |
| 25 to 29 Years | 443 (6.2%) | 446 (5.4%) |
| 30 to 34 Years | 550 (7.7%) | 535 (6.5%) |
| 35 to 39 Years | 290 (4.1%) | 545 (6.7%) |
| 40 to 44 Years | 400 (5.6%) | 631 (7.7%) |
| 45 to 49 Years | 672 (9.5%) | 842 (10.3%) |
| 50 to 54 Years | 287 (4.1%) | 491 (6.0%) |
| 55 to 59 Years | 344 (4.9%) | 648 (7.9%) |
| 60 to 64 Years | 342 (4.8%) | 319 (3.9%) |
| 65 to 69 Years | 243 (3.4%) | 468 (5.7%) |
| 70 to 74 Years | 285 (4.0%) | 366 (4.5%) |
| 75 to 79 Years | 92 (1.3%) | 136 (1.7%) |
| 80 to 84 Years | 58 (0.8%) | 65 (0.8%) |
| 85 Years and over | 126 (1.8%) | 275 (3.4%) |
| Total | 7,095 (100.0%) | 8,201 (100.0%) |
Families and Households in Harper Woods
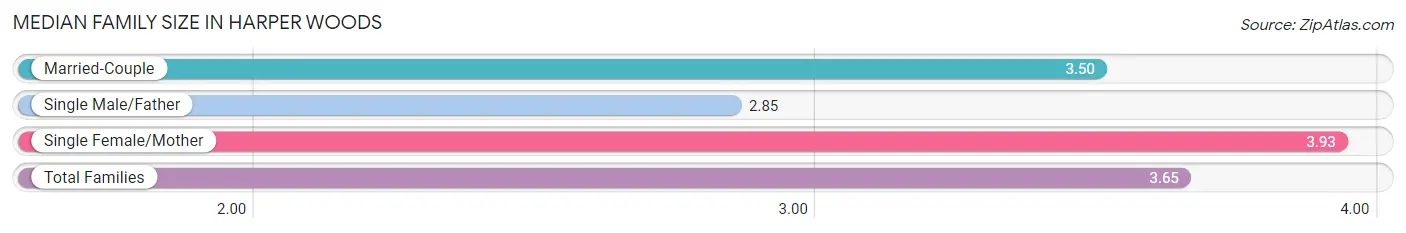
Median Family Size in Harper Woods
The median family size in Harper Woods is 3.65 persons per family, with single female/mother families (1,558 | 47.8%) accounting for the largest median family size of 3.93 persons per family. On the other hand, single male/father families (298 | 9.1%) represent the smallest median family size with 2.85 persons per family.
| Family Type | # Families | Family Size |
| Married-Couple | 1,404 (43.1%) | 3.50 |
| Single Male/Father | 298 (9.1%) | 2.85 |
| Single Female/Mother | 1,558 (47.8%) | 3.93 |
| Total Families | 3,260 (100.0%) | 3.65 |
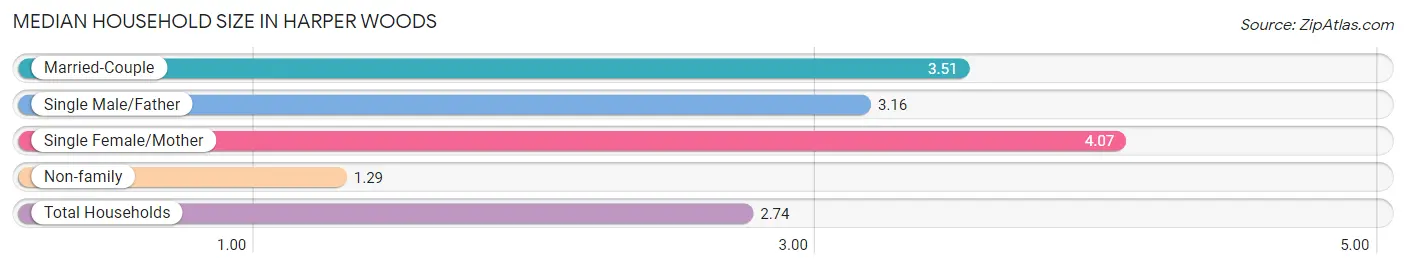
Median Household Size in Harper Woods
The median household size in Harper Woods is 2.74 persons per household, with single female/mother households (1,558 | 28.2%) accounting for the largest median household size of 4.07 persons per household. non-family households (2,255 | 40.9%) represent the smallest median household size with 1.29 persons per household.
| Household Type | # Households | Household Size |
| Married-Couple | 1,404 (25.5%) | 3.51 |
| Single Male/Father | 298 (5.4%) | 3.16 |
| Single Female/Mother | 1,558 (28.2%) | 4.07 |
| Non-family | 2,255 (40.9%) | 1.29 |
| Total Households | 5,515 (100.0%) | 2.74 |
Household Size by Marriage Status in Harper Woods
Out of a total of 5,515 households in Harper Woods, 3,260 (59.1%) are family households, while 2,255 (40.9%) are nonfamily households. The most numerous type of family households are 2-person households, comprising 1,325, and the most common type of nonfamily households are 1-person households, comprising 1,852.
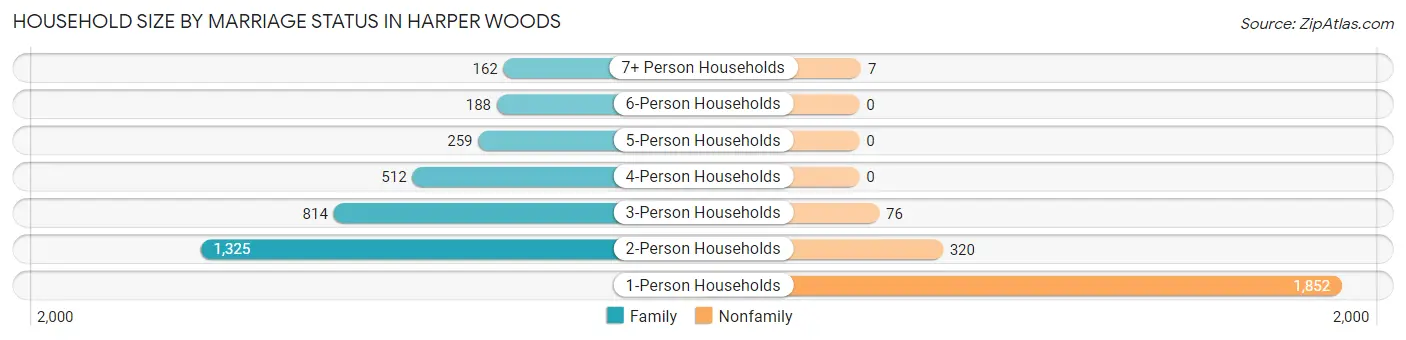
| Household Size | Family Households | Nonfamily Households |
| 1-Person Households | - | 1,852 (33.6%) |
| 2-Person Households | 1,325 (24.0%) | 320 (5.8%) |
| 3-Person Households | 814 (14.8%) | 76 (1.4%) |
| 4-Person Households | 512 (9.3%) | 0 (0.0%) |
| 5-Person Households | 259 (4.7%) | 0 (0.0%) |
| 6-Person Households | 188 (3.4%) | 0 (0.0%) |
| 7+ Person Households | 162 (2.9%) | 7 (0.1%) |
| Total | 3,260 (59.1%) | 2,255 (40.9%) |
Female Fertility in Harper Woods
Fertility by Age in Harper Woods
Average fertility rate in Harper Woods is 30.0 births per 1,000 women. Women in the age bracket of 20 to 34 years have the highest fertility rate with 68.0 births per 1,000 women. Women in the age bracket of 20 to 34 years acount for 78.3% of all women with births.
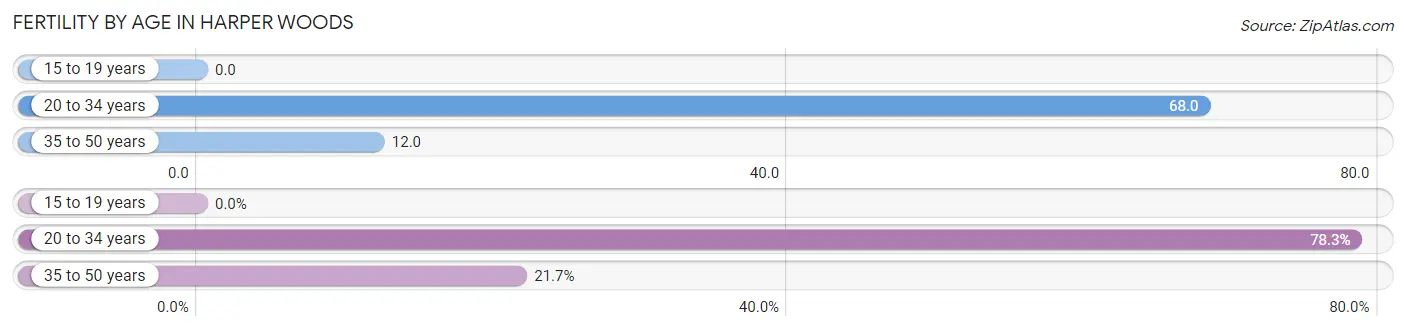
| Age Bracket | Women with Births | Births / 1,000 Women |
| 15 to 19 years | 0 (0.0%) | 0.0 |
| 20 to 34 years | 94 (78.3%) | 68.0 |
| 35 to 50 years | 26 (21.7%) | 12.0 |
| Total | 120 (100.0%) | 30.0 |
Fertility by Age by Marriage Status in Harper Woods
13.3% of women with births (120) in Harper Woods are married. The highest percentage of unmarried women with births falls into 20 to 34 years age bracket with 92.5% of them unmarried at the time of birth, while the lowest percentage of unmarried women with births belong to 35 to 50 years age bracket with 65.4% of them unmarried.
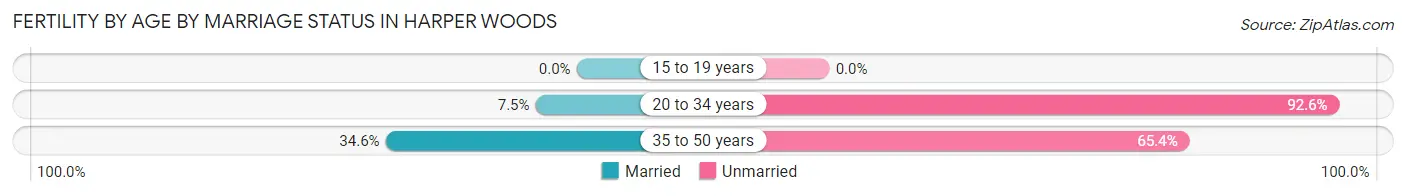
| Age Bracket | Married | Unmarried |
| 15 to 19 years | 0 (0.0%) | 0 (0.0%) |
| 20 to 34 years | 7 (7.4%) | 87 (92.5%) |
| 35 to 50 years | 9 (34.6%) | 17 (65.4%) |
| Total | 16 (13.3%) | 104 (86.7%) |
Fertility by Education in Harper Woods
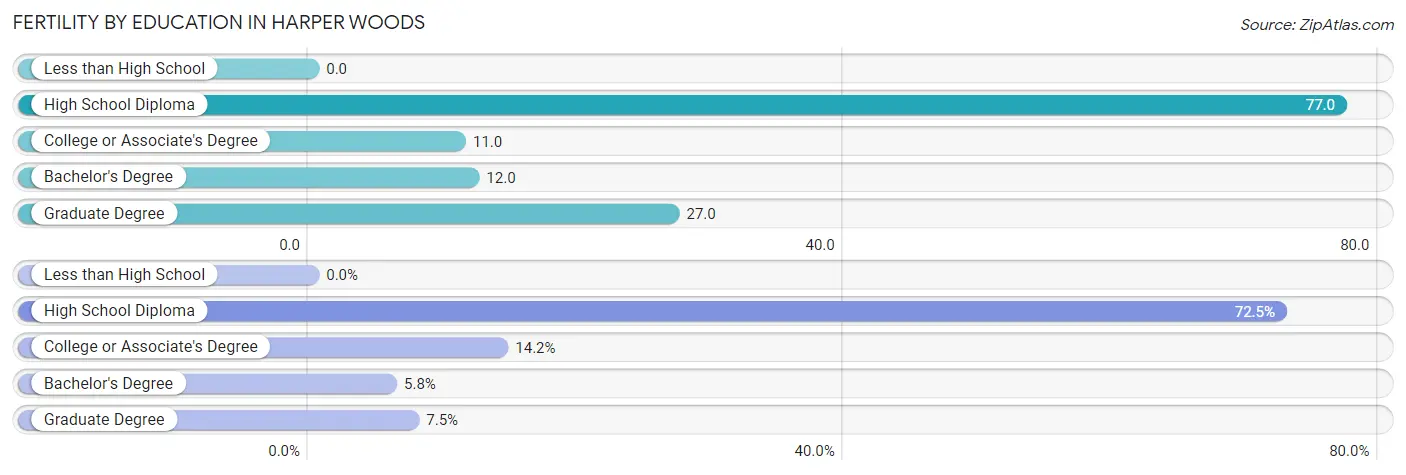
| Educational Attainment | Women with Births | Births / 1,000 Women |
| Less than High School | 0 (0.0%) | 0.0 |
| High School Diploma | 87 (72.5%) | 77.0 |
| College or Associate's Degree | 17 (14.2%) | 11.0 |
| Bachelor's Degree | 7 (5.8%) | 12.0 |
| Graduate Degree | 9 (7.5%) | 27.0 |
| Total | 120 (100.0%) | 30.0 |
Fertility by Education by Marriage Status in Harper Woods
86.7% of women with births in Harper Woods are unmarried. Women with the educational attainment of graduate degree are most likely to be married with 100.0% of them married at childbirth, while women with the educational attainment of college or associate's degree are least likely to be married with 100.0% of them unmarried at childbirth.
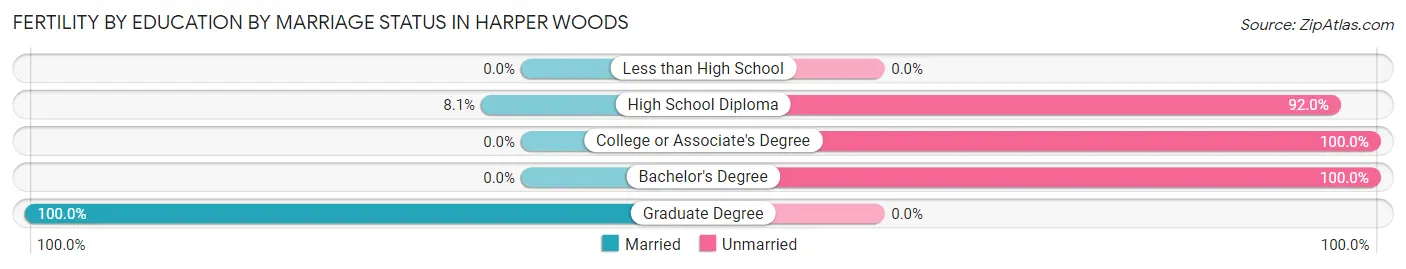
| Educational Attainment | Married | Unmarried |
| Less than High School | 0 (0.0%) | 0 (0.0%) |
| High School Diploma | 7 (8.1%) | 80 (91.9%) |
| College or Associate's Degree | 0 (0.0%) | 17 (100.0%) |
| Bachelor's Degree | 0 (0.0%) | 7 (100.0%) |
| Graduate Degree | 9 (100.0%) | 0 (0.0%) |
| Total | 16 (13.3%) | 104 (86.7%) |
Employment Characteristics in Harper Woods
Employment by Class of Employer in Harper Woods
Among the 6,966 employed individuals in Harper Woods, private company employees (4,895 | 70.3%), not-for-profit organizations (563 | 8.1%), and local government employees (471 | 6.8%) make up the most common classes of employment.
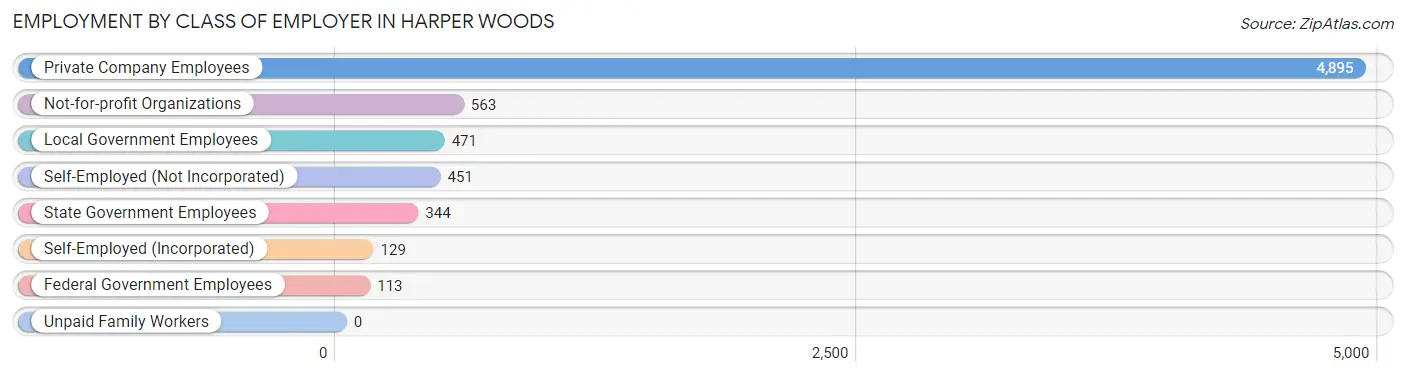
| Employer Class | # Employees | % Employees |
| Private Company Employees | 4,895 | 70.3% |
| Self-Employed (Incorporated) | 129 | 1.8% |
| Self-Employed (Not Incorporated) | 451 | 6.5% |
| Not-for-profit Organizations | 563 | 8.1% |
| Local Government Employees | 471 | 6.8% |
| State Government Employees | 344 | 4.9% |
| Federal Government Employees | 113 | 1.6% |
| Unpaid Family Workers | 0 | 0.0% |
| Total | 6,966 | 100.0% |
Employment Status by Age in Harper Woods
According to the labor force statistics for Harper Woods, out of the total population over 16 years of age (11,672), 66.0% or 7,704 individuals are in the labor force, with 7.6% or 586 of them unemployed. The age group with the highest labor force participation rate is 45 to 54 years, with 89.8% or 2,058 individuals in the labor force. Within the labor force, the 16 to 19 years age range has the highest percentage of unemployed individuals, with 12.7% or 52 of them being unemployed.
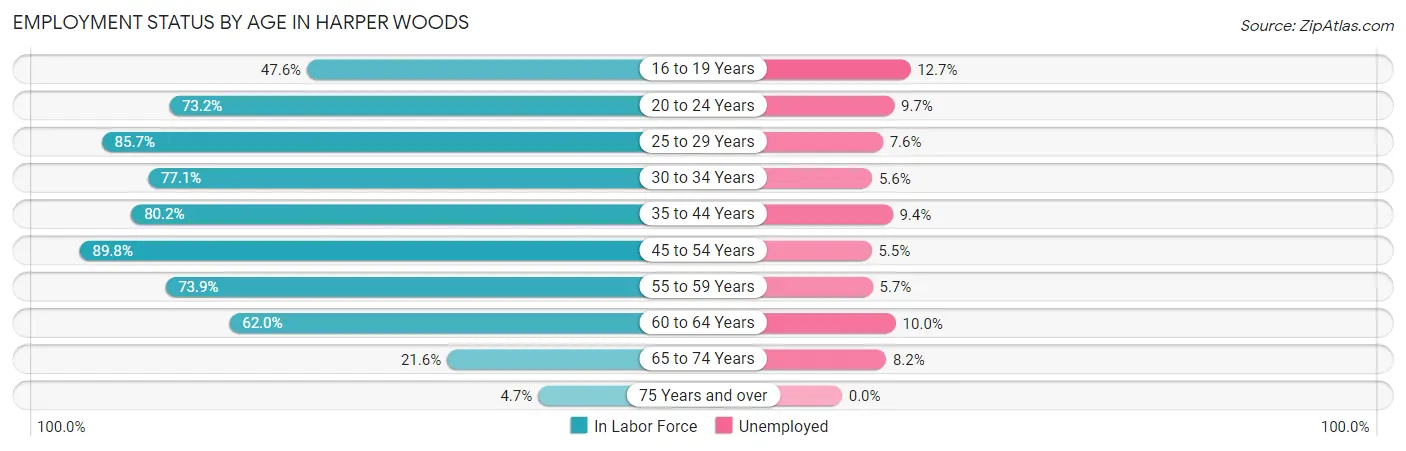
| Age Bracket | In Labor Force | Unemployed |
| 16 to 19 Years | 408 (47.6%) | 52 (12.7%) |
| 20 to 24 Years | 670 (73.2%) | 65 (9.7%) |
| 25 to 29 Years | 762 (85.7%) | 58 (7.6%) |
| 30 to 34 Years | 837 (77.1%) | 47 (5.6%) |
| 35 to 44 Years | 1,497 (80.2%) | 141 (9.4%) |
| 45 to 54 Years | 2,058 (89.8%) | 113 (5.5%) |
| 55 to 59 Years | 733 (73.9%) | 42 (5.7%) |
| 60 to 64 Years | 410 (62.0%) | 41 (10.0%) |
| 65 to 74 Years | 294 (21.6%) | 24 (8.2%) |
| 75 Years and over | 35 (4.7%) | 0 (0.0%) |
| Total | 7,704 (66.0%) | 586 (7.6%) |
Employment Status by Educational Attainment in Harper Woods
According to labor force statistics for Harper Woods, 80.9% of individuals (6,298) out of the total population between 25 and 64 years of age (7,785) are in the labor force, with 7.0% or 441 of them being unemployed. The group with the highest labor force participation rate are those with the educational attainment of bachelor's degree or higher, with 88.9% or 1,919 individuals in the labor force. Within the labor force, individuals with less than high school education have the highest percentage of unemployment, with 23.6% or 51 of them being unemployed.
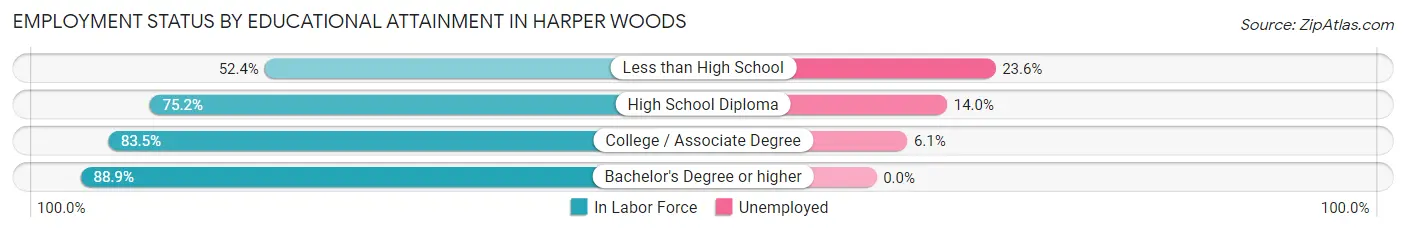
| Educational Attainment | In Labor Force | Unemployed |
| Less than High School | 216 (52.4%) | 97 (23.6%) |
| High School Diploma | 1,736 (75.2%) | 323 (14.0%) |
| College / Associate Degree | 2,426 (83.5%) | 177 (6.1%) |
| Bachelor's Degree or higher | 1,919 (88.9%) | 0 (0.0%) |
| Total | 6,298 (80.9%) | 545 (7.0%) |
Employment Occupations by Sex in Harper Woods
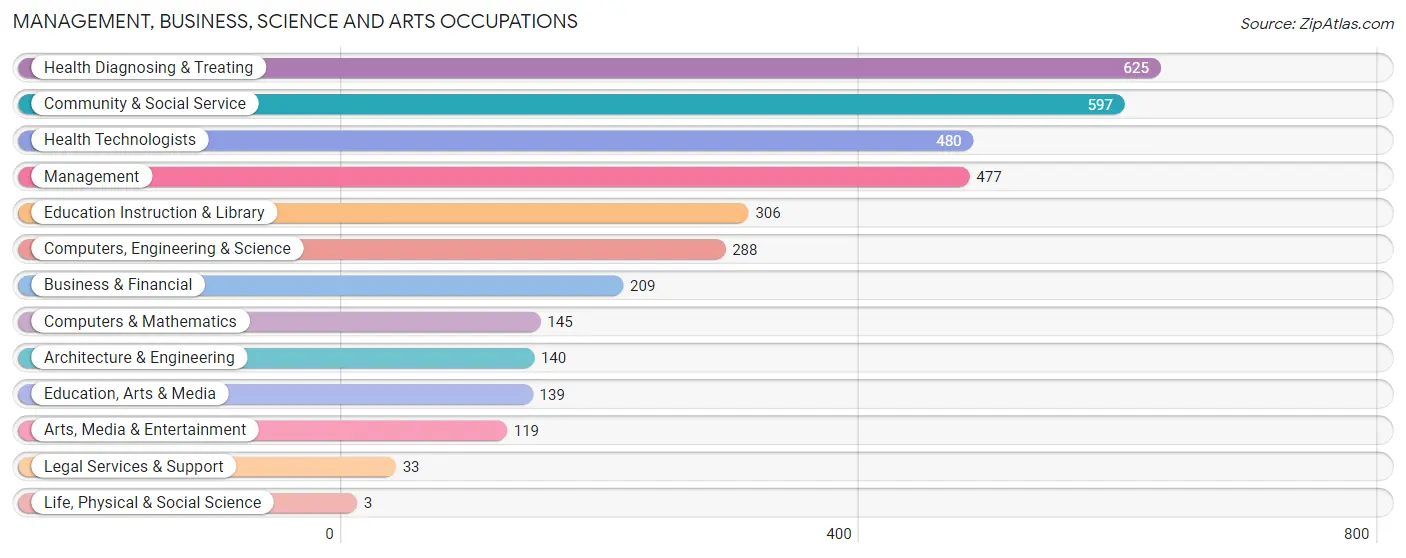
Management, Business, Science and Arts Occupations
The most common Management, Business, Science and Arts occupations in Harper Woods are Health Diagnosing & Treating (625 | 8.8%), Community & Social Service (597 | 8.4%), Health Technologists (480 | 6.7%), Management (477 | 6.7%), and Education Instruction & Library (306 | 4.3%).
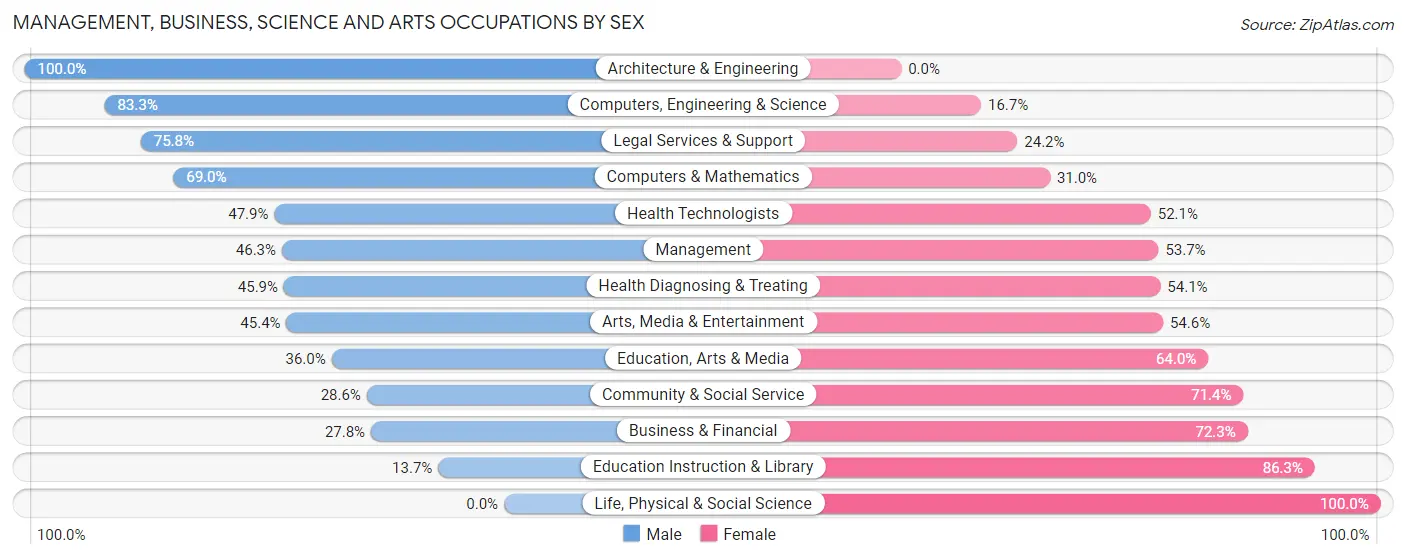
Management, Business, Science and Arts Occupations by Sex
Within the Management, Business, Science and Arts occupations in Harper Woods, the most male-oriented occupations are Architecture & Engineering (100.0%), Computers, Engineering & Science (83.3%), and Legal Services & Support (75.8%), while the most female-oriented occupations are Life, Physical & Social Science (100.0%), Education Instruction & Library (86.3%), and Business & Financial (72.3%).
| Occupation | Male | Female |
| Management | 221 (46.3%) | 256 (53.7%) |
| Business & Financial | 58 (27.8%) | 151 (72.3%) |
| Computers, Engineering & Science | 240 (83.3%) | 48 (16.7%) |
| Computers & Mathematics | 100 (69.0%) | 45 (31.0%) |
| Architecture & Engineering | 140 (100.0%) | 0 (0.0%) |
| Life, Physical & Social Science | 0 (0.0%) | 3 (100.0%) |
| Community & Social Service | 171 (28.6%) | 426 (71.4%) |
| Education, Arts & Media | 50 (36.0%) | 89 (64.0%) |
| Legal Services & Support | 25 (75.8%) | 8 (24.2%) |
| Education Instruction & Library | 42 (13.7%) | 264 (86.3%) |
| Arts, Media & Entertainment | 54 (45.4%) | 65 (54.6%) |
| Health Diagnosing & Treating | 287 (45.9%) | 338 (54.1%) |
| Health Technologists | 230 (47.9%) | 250 (52.1%) |
| Total (Category) | 977 (44.5%) | 1,219 (55.5%) |
| Total (Overall) | 3,319 (46.6%) | 3,802 (53.4%) |
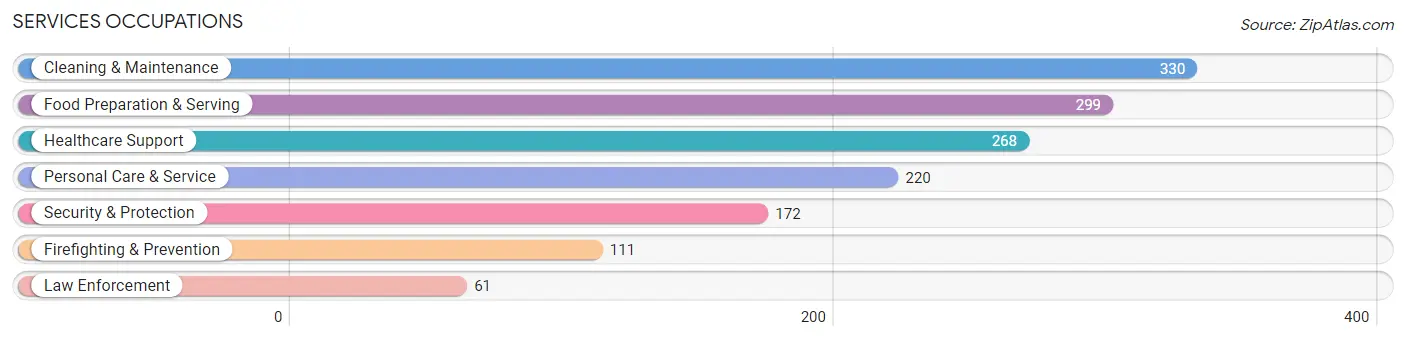
Services Occupations
The most common Services occupations in Harper Woods are Cleaning & Maintenance (330 | 4.6%), Food Preparation & Serving (299 | 4.2%), Healthcare Support (268 | 3.8%), Personal Care & Service (220 | 3.1%), and Security & Protection (172 | 2.4%).
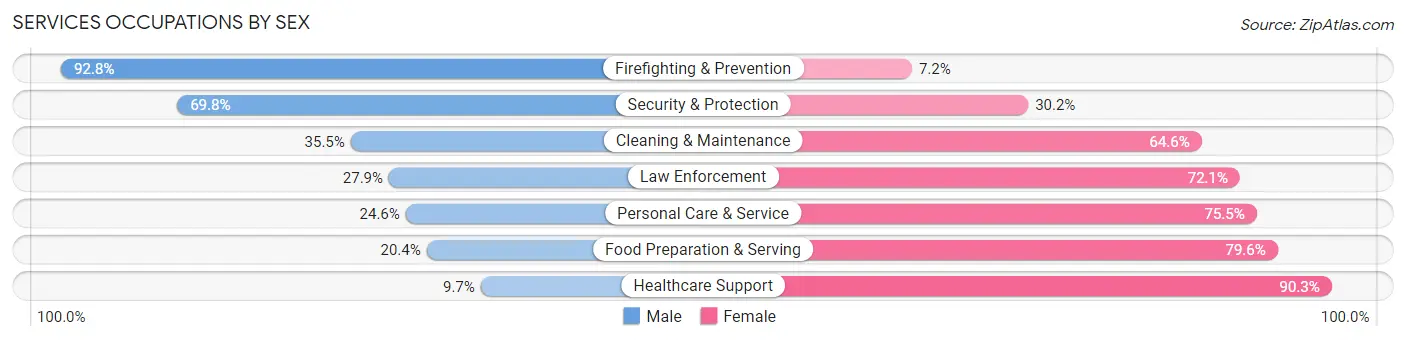
Services Occupations by Sex
Within the Services occupations in Harper Woods, the most male-oriented occupations are Firefighting & Prevention (92.8%), Security & Protection (69.8%), and Cleaning & Maintenance (35.4%), while the most female-oriented occupations are Healthcare Support (90.3%), Food Preparation & Serving (79.6%), and Personal Care & Service (75.4%).
| Occupation | Male | Female |
| Healthcare Support | 26 (9.7%) | 242 (90.3%) |
| Security & Protection | 120 (69.8%) | 52 (30.2%) |
| Firefighting & Prevention | 103 (92.8%) | 8 (7.2%) |
| Law Enforcement | 17 (27.9%) | 44 (72.1%) |
| Food Preparation & Serving | 61 (20.4%) | 238 (79.6%) |
| Cleaning & Maintenance | 117 (35.4%) | 213 (64.5%) |
| Personal Care & Service | 54 (24.5%) | 166 (75.4%) |
| Total (Category) | 378 (29.3%) | 911 (70.7%) |
| Total (Overall) | 3,319 (46.6%) | 3,802 (53.4%) |
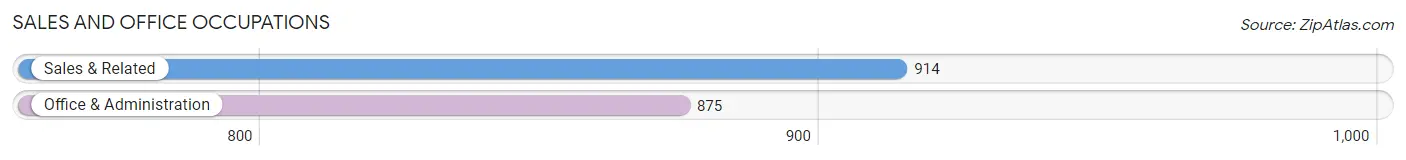
Sales and Office Occupations
The most common Sales and Office occupations in Harper Woods are Sales & Related (914 | 12.8%), and Office & Administration (875 | 12.3%).
Sales and Office Occupations by Sex
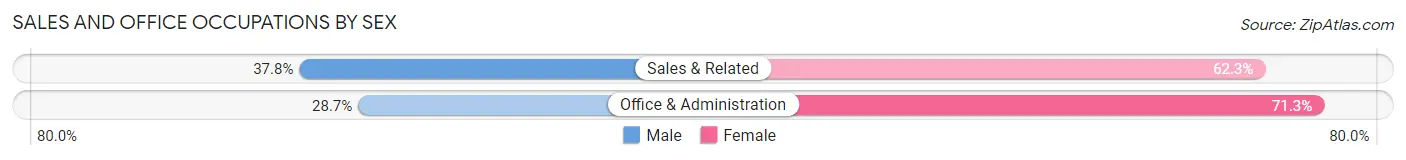
| Occupation | Male | Female |
| Sales & Related | 345 (37.8%) | 569 (62.3%) |
| Office & Administration | 251 (28.7%) | 624 (71.3%) |
| Total (Category) | 596 (33.3%) | 1,193 (66.7%) |
| Total (Overall) | 3,319 (46.6%) | 3,802 (53.4%) |
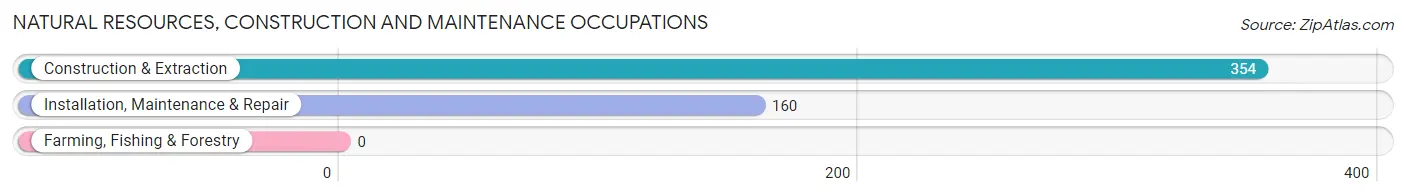
Natural Resources, Construction and Maintenance Occupations
The most common Natural Resources, Construction and Maintenance occupations in Harper Woods are Construction & Extraction (354 | 5.0%), and Installation, Maintenance & Repair (160 | 2.2%).
Natural Resources, Construction and Maintenance Occupations by Sex
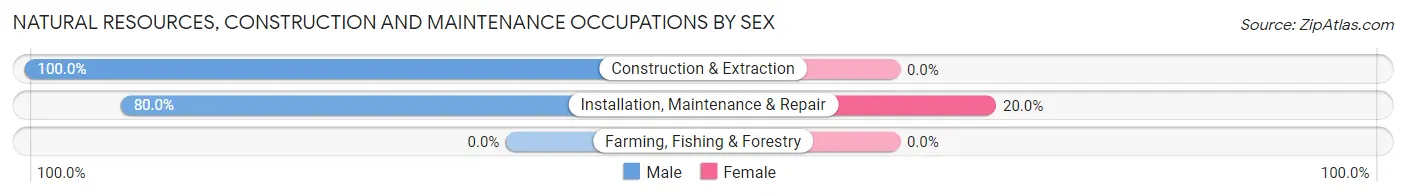
| Occupation | Male | Female |
| Farming, Fishing & Forestry | 0 (0.0%) | 0 (0.0%) |
| Construction & Extraction | 354 (100.0%) | 0 (0.0%) |
| Installation, Maintenance & Repair | 128 (80.0%) | 32 (20.0%) |
| Total (Category) | 482 (93.8%) | 32 (6.2%) |
| Total (Overall) | 3,319 (46.6%) | 3,802 (53.4%) |
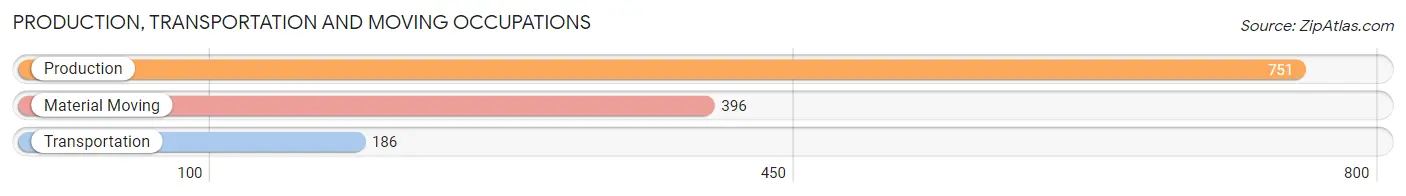
Production, Transportation and Moving Occupations
The most common Production, Transportation and Moving occupations in Harper Woods are Production (751 | 10.5%), Material Moving (396 | 5.6%), and Transportation (186 | 2.6%).
Production, Transportation and Moving Occupations by Sex
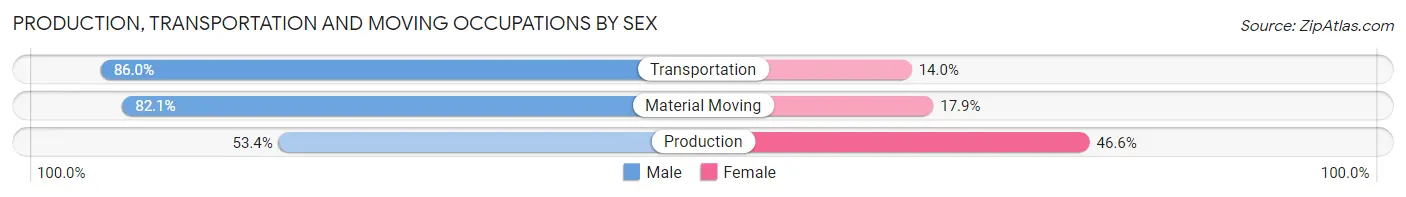
| Occupation | Male | Female |
| Production | 401 (53.4%) | 350 (46.6%) |
| Transportation | 160 (86.0%) | 26 (14.0%) |
| Material Moving | 325 (82.1%) | 71 (17.9%) |
| Total (Category) | 886 (66.5%) | 447 (33.5%) |
| Total (Overall) | 3,319 (46.6%) | 3,802 (53.4%) |
Employment Industries by Sex in Harper Woods
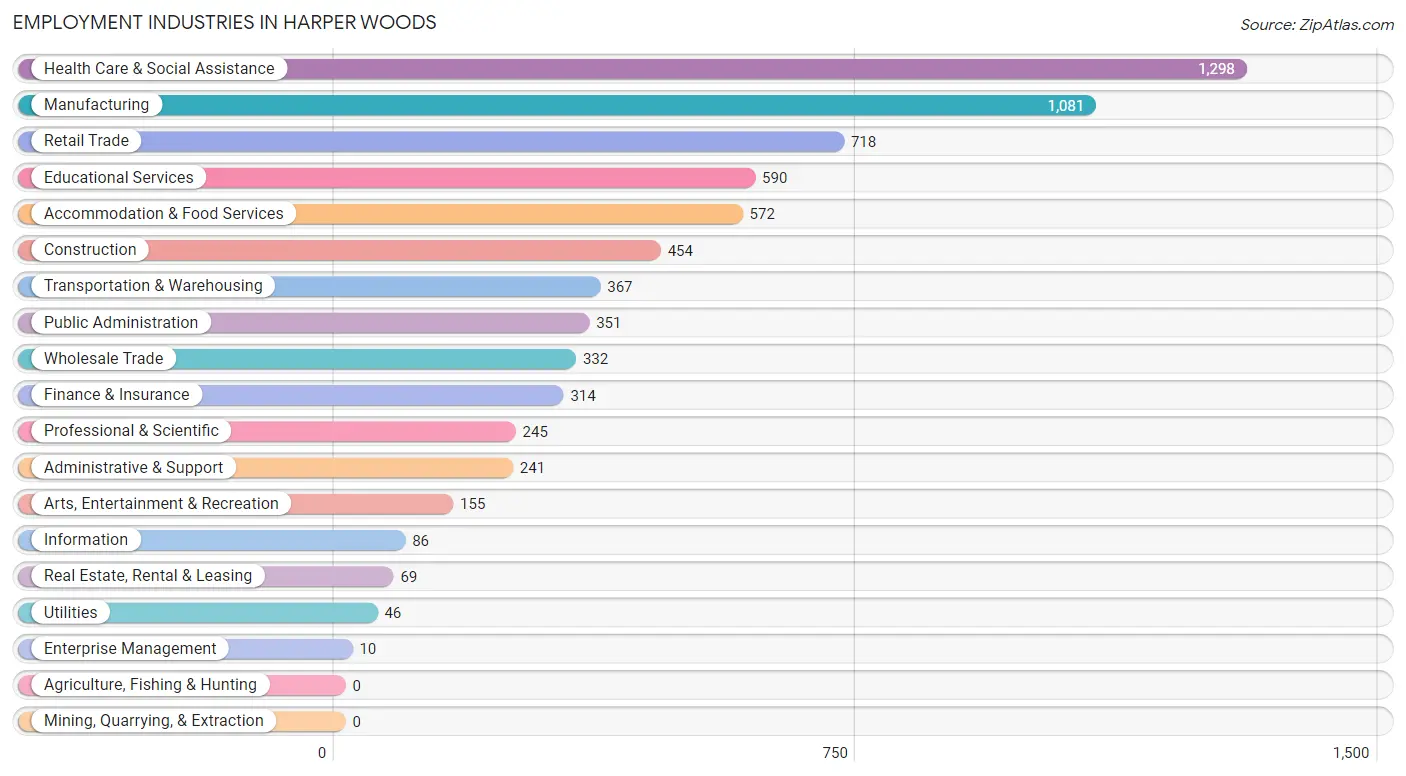
Employment Industries in Harper Woods
The major employment industries in Harper Woods include Health Care & Social Assistance (1,298 | 18.2%), Manufacturing (1,081 | 15.2%), Retail Trade (718 | 10.1%), Educational Services (590 | 8.3%), and Accommodation & Food Services (572 | 8.0%).
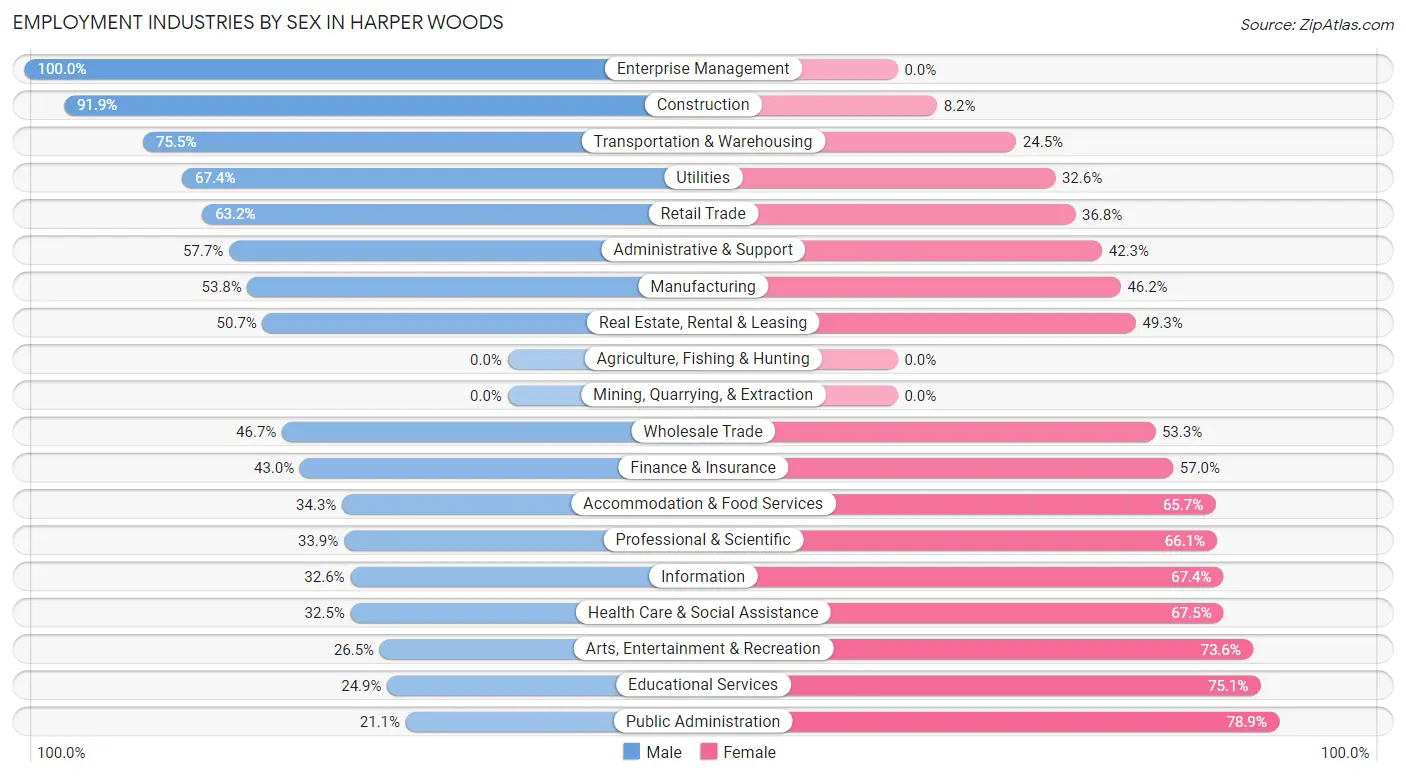
Employment Industries by Sex in Harper Woods
The Harper Woods industries that see more men than women are Enterprise Management (100.0%), Construction (91.8%), and Transportation & Warehousing (75.5%), whereas the industries that tend to have a higher number of women are Public Administration (78.9%), Educational Services (75.1%), and Arts, Entertainment & Recreation (73.6%).
| Industry | Male | Female |
| Agriculture, Fishing & Hunting | 0 (0.0%) | 0 (0.0%) |
| Mining, Quarrying, & Extraction | 0 (0.0%) | 0 (0.0%) |
| Construction | 417 (91.8%) | 37 (8.2%) |
| Manufacturing | 582 (53.8%) | 499 (46.2%) |
| Wholesale Trade | 155 (46.7%) | 177 (53.3%) |
| Retail Trade | 454 (63.2%) | 264 (36.8%) |
| Transportation & Warehousing | 277 (75.5%) | 90 (24.5%) |
| Utilities | 31 (67.4%) | 15 (32.6%) |
| Information | 28 (32.6%) | 58 (67.4%) |
| Finance & Insurance | 135 (43.0%) | 179 (57.0%) |
| Real Estate, Rental & Leasing | 35 (50.7%) | 34 (49.3%) |
| Professional & Scientific | 83 (33.9%) | 162 (66.1%) |
| Enterprise Management | 10 (100.0%) | 0 (0.0%) |
| Administrative & Support | 139 (57.7%) | 102 (42.3%) |
| Educational Services | 147 (24.9%) | 443 (75.1%) |
| Health Care & Social Assistance | 422 (32.5%) | 876 (67.5%) |
| Arts, Entertainment & Recreation | 41 (26.5%) | 114 (73.6%) |
| Accommodation & Food Services | 196 (34.3%) | 376 (65.7%) |
| Public Administration | 74 (21.1%) | 277 (78.9%) |
| Total | 3,319 (46.6%) | 3,802 (53.4%) |
Education in Harper Woods
School Enrollment in Harper Woods
The most common levels of schooling among the 4,227 students in Harper Woods are middle school (1,125 | 26.6%), high school (967 | 22.9%), and elementary school (948 | 22.4%).
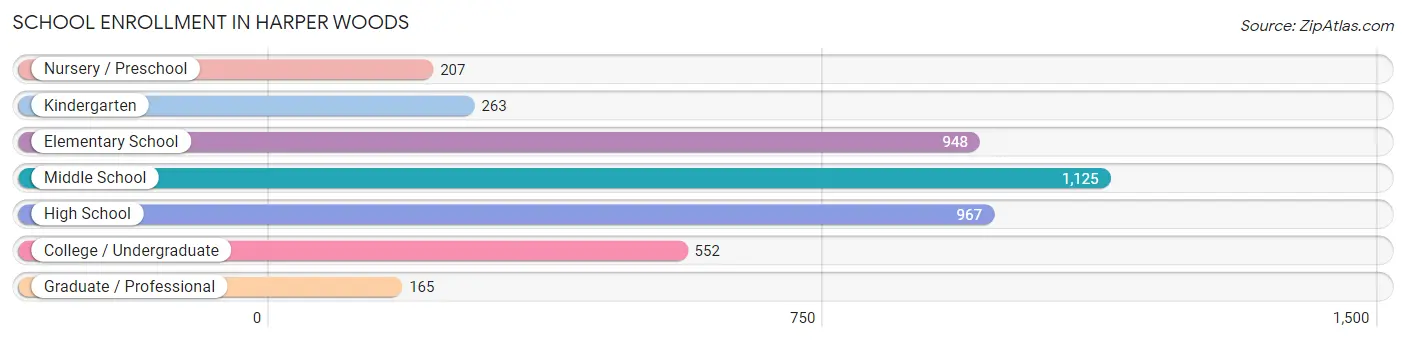
| School Level | # Students | % Students |
| Nursery / Preschool | 207 | 4.9% |
| Kindergarten | 263 | 6.2% |
| Elementary School | 948 | 22.4% |
| Middle School | 1,125 | 26.6% |
| High School | 967 | 22.9% |
| College / Undergraduate | 552 | 13.1% |
| Graduate / Professional | 165 | 3.9% |
| Total | 4,227 | 100.0% |
School Enrollment by Age by Funding Source in Harper Woods
Out of a total of 4,227 students who are enrolled in schools in Harper Woods, 448 (10.6%) attend a private institution, while the remaining 3,779 (89.4%) are enrolled in public schools. The age group of 3 to 4 year olds has the highest likelihood of being enrolled in private schools, with 129 (51.4% in the age bracket) enrolled. Conversely, the age group of 15 to 17 year olds has the lowest likelihood of being enrolled in a private school, with 657 (97.5% in the age bracket) attending a public institution.
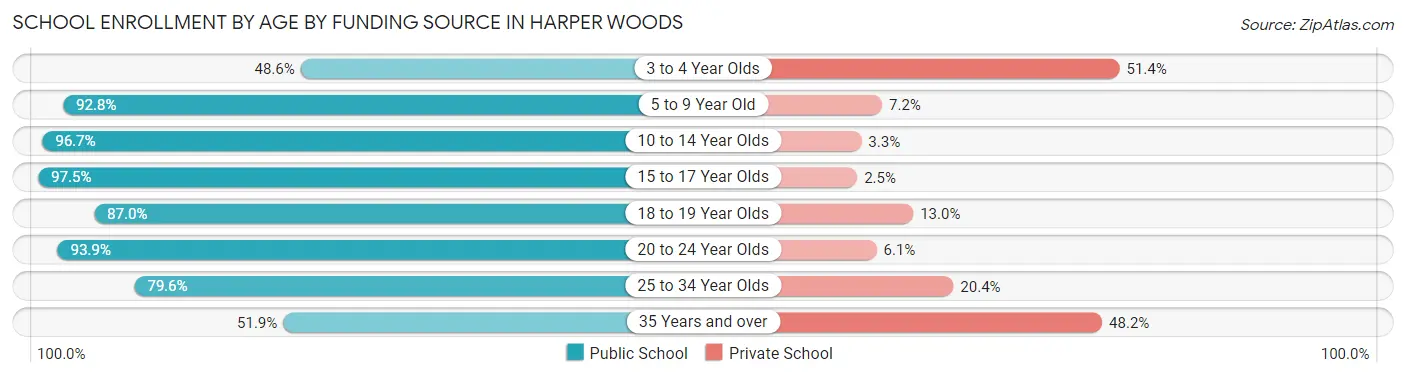
| Age Bracket | Public School | Private School |
| 3 to 4 Year Olds | 122 (48.6%) | 129 (51.4%) |
| 5 to 9 Year Old | 1,025 (92.8%) | 79 (7.2%) |
| 10 to 14 Year Olds | 1,262 (96.7%) | 43 (3.3%) |
| 15 to 17 Year Olds | 657 (97.5%) | 17 (2.5%) |
| 18 to 19 Year Olds | 215 (87.0%) | 32 (13.0%) |
| 20 to 24 Year Olds | 275 (93.9%) | 18 (6.1%) |
| 25 to 34 Year Olds | 109 (79.6%) | 28 (20.4%) |
| 35 Years and over | 112 (51.8%) | 104 (48.1%) |
| Total | 3,779 (89.4%) | 448 (10.6%) |
Educational Attainment by Field of Study in Harper Woods
Business (628 | 21.7%), education (353 | 12.2%), arts & humanities (287 | 9.9%), visual & performing arts (259 | 9.0%), and science & technology (210 | 7.3%) are the most common fields of study among 2,892 individuals in Harper Woods who have obtained a bachelor's degree or higher.
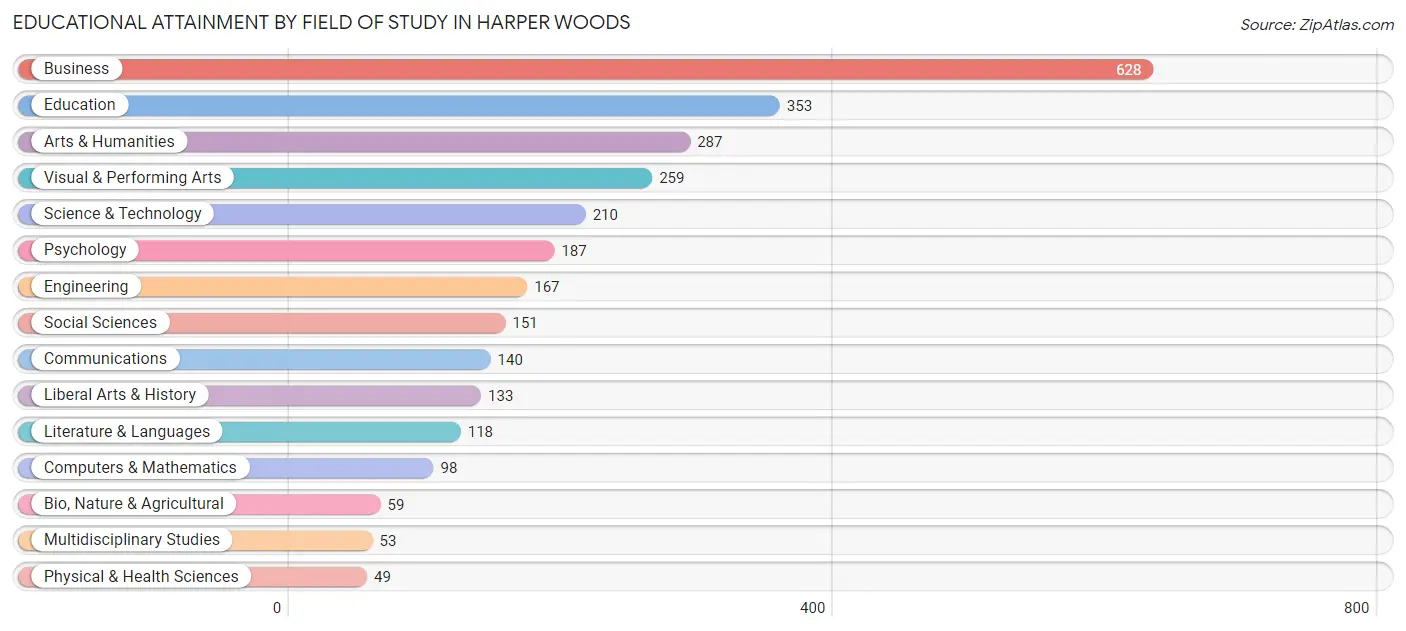
| Field of Study | # Graduates | % Graduates |
| Computers & Mathematics | 98 | 3.4% |
| Bio, Nature & Agricultural | 59 | 2.0% |
| Physical & Health Sciences | 49 | 1.7% |
| Psychology | 187 | 6.5% |
| Social Sciences | 151 | 5.2% |
| Engineering | 167 | 5.8% |
| Multidisciplinary Studies | 53 | 1.8% |
| Science & Technology | 210 | 7.3% |
| Business | 628 | 21.7% |
| Education | 353 | 12.2% |
| Literature & Languages | 118 | 4.1% |
| Liberal Arts & History | 133 | 4.6% |
| Visual & Performing Arts | 259 | 9.0% |
| Communications | 140 | 4.8% |
| Arts & Humanities | 287 | 9.9% |
| Total | 2,892 | 100.0% |
Transportation & Commute in Harper Woods
Vehicle Availability by Sex in Harper Woods
The most prevalent vehicle ownership categories in Harper Woods are males with 2 vehicles (1,160, accounting for 36.1%) and females with 2 vehicles (1,392, making up 30.9%).
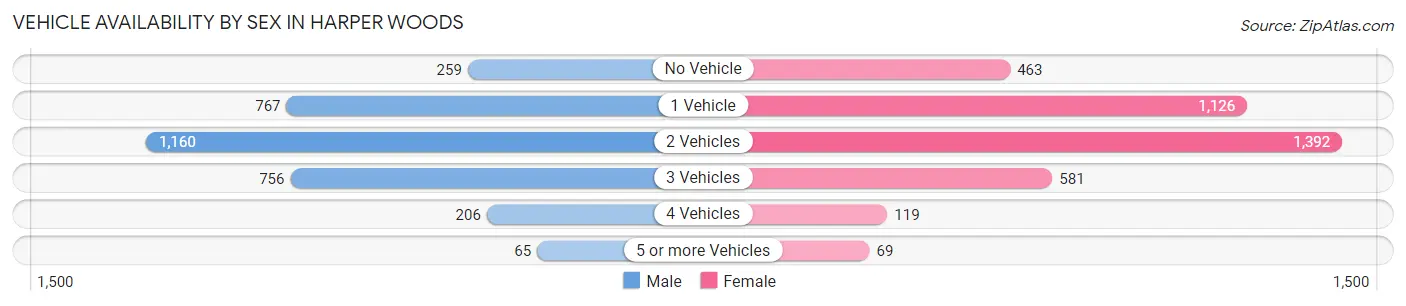
| Vehicles Available | Male | Female |
| No Vehicle | 259 (8.1%) | 463 (12.3%) |
| 1 Vehicle | 767 (23.9%) | 1,126 (30.0%) |
| 2 Vehicles | 1,160 (36.1%) | 1,392 (37.1%) |
| 3 Vehicles | 756 (23.5%) | 581 (15.5%) |
| 4 Vehicles | 206 (6.4%) | 119 (3.2%) |
| 5 or more Vehicles | 65 (2.0%) | 69 (1.8%) |
| Total | 3,213 (100.0%) | 3,750 (100.0%) |
Commute Time in Harper Woods
The most frequently occuring commute durations in Harper Woods are 15 to 19 minutes (1,114 commuters, 17.2%), 30 to 34 minutes (1,014 commuters, 15.7%), and 20 to 24 minutes (968 commuters, 14.9%).
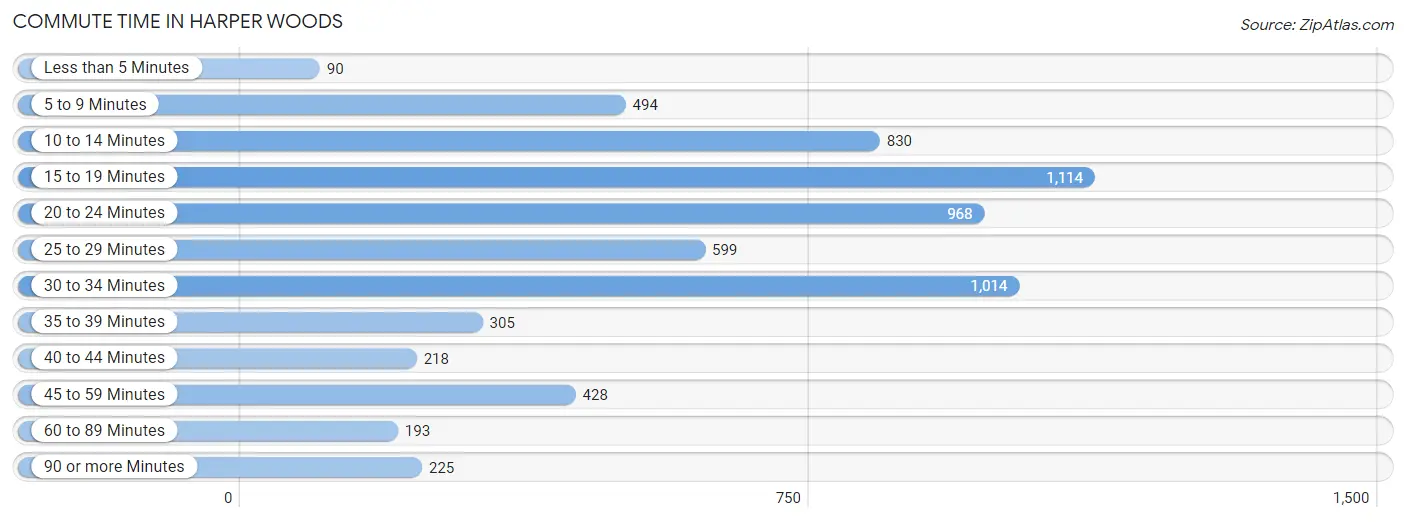
| Commute Time | # Commuters | % Commuters |
| Less than 5 Minutes | 90 | 1.4% |
| 5 to 9 Minutes | 494 | 7.6% |
| 10 to 14 Minutes | 830 | 12.8% |
| 15 to 19 Minutes | 1,114 | 17.2% |
| 20 to 24 Minutes | 968 | 14.9% |
| 25 to 29 Minutes | 599 | 9.2% |
| 30 to 34 Minutes | 1,014 | 15.7% |
| 35 to 39 Minutes | 305 | 4.7% |
| 40 to 44 Minutes | 218 | 3.4% |
| 45 to 59 Minutes | 428 | 6.6% |
| 60 to 89 Minutes | 193 | 3.0% |
| 90 or more Minutes | 225 | 3.5% |
Commute Time by Sex in Harper Woods
The most common commute times in Harper Woods are 15 to 19 minutes (539 commuters, 17.6%) for males and 10 to 14 minutes (609 commuters, 17.8%) for females.
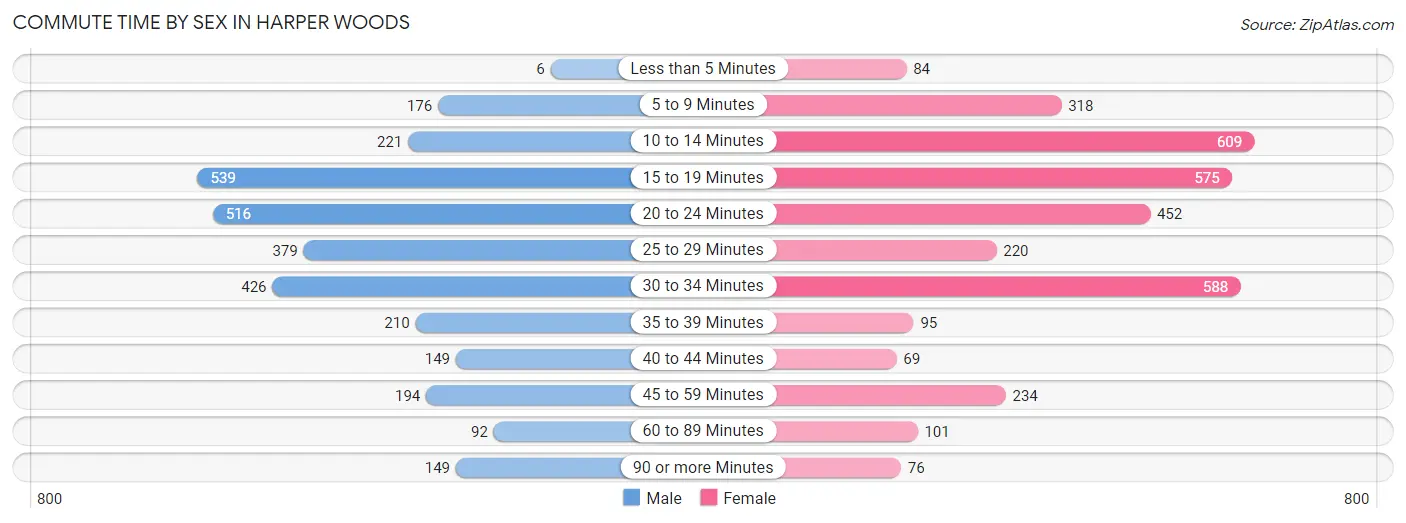
| Commute Time | Male | Female |
| Less than 5 Minutes | 6 (0.2%) | 84 (2.5%) |
| 5 to 9 Minutes | 176 (5.8%) | 318 (9.3%) |
| 10 to 14 Minutes | 221 (7.2%) | 609 (17.8%) |
| 15 to 19 Minutes | 539 (17.6%) | 575 (16.8%) |
| 20 to 24 Minutes | 516 (16.9%) | 452 (13.2%) |
| 25 to 29 Minutes | 379 (12.4%) | 220 (6.4%) |
| 30 to 34 Minutes | 426 (13.9%) | 588 (17.2%) |
| 35 to 39 Minutes | 210 (6.9%) | 95 (2.8%) |
| 40 to 44 Minutes | 149 (4.9%) | 69 (2.0%) |
| 45 to 59 Minutes | 194 (6.4%) | 234 (6.8%) |
| 60 to 89 Minutes | 92 (3.0%) | 101 (2.9%) |
| 90 or more Minutes | 149 (4.9%) | 76 (2.2%) |
Time of Departure to Work by Sex in Harper Woods
The most frequent times of departure to work in Harper Woods are 12:00 PM to 3:59 PM (604, 19.8%) for males and 4:00 PM to 11:59 PM (447, 13.1%) for females.
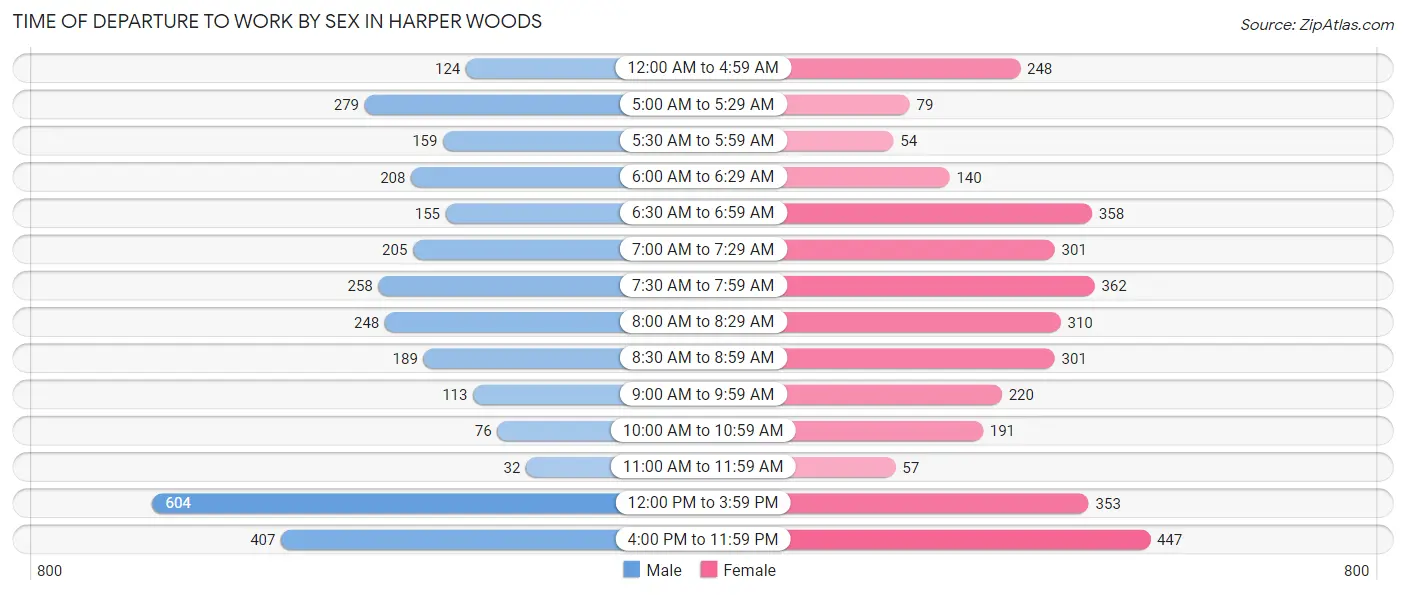
| Time of Departure | Male | Female |
| 12:00 AM to 4:59 AM | 124 (4.1%) | 248 (7.2%) |
| 5:00 AM to 5:29 AM | 279 (9.1%) | 79 (2.3%) |
| 5:30 AM to 5:59 AM | 159 (5.2%) | 54 (1.6%) |
| 6:00 AM to 6:29 AM | 208 (6.8%) | 140 (4.1%) |
| 6:30 AM to 6:59 AM | 155 (5.1%) | 358 (10.5%) |
| 7:00 AM to 7:29 AM | 205 (6.7%) | 301 (8.8%) |
| 7:30 AM to 7:59 AM | 258 (8.4%) | 362 (10.6%) |
| 8:00 AM to 8:29 AM | 248 (8.1%) | 310 (9.1%) |
| 8:30 AM to 8:59 AM | 189 (6.2%) | 301 (8.8%) |
| 9:00 AM to 9:59 AM | 113 (3.7%) | 220 (6.4%) |
| 10:00 AM to 10:59 AM | 76 (2.5%) | 191 (5.6%) |
| 11:00 AM to 11:59 AM | 32 (1.1%) | 57 (1.7%) |
| 12:00 PM to 3:59 PM | 604 (19.8%) | 353 (10.3%) |
| 4:00 PM to 11:59 PM | 407 (13.3%) | 447 (13.1%) |
| Total | 3,057 (100.0%) | 3,421 (100.0%) |
Housing Occupancy in Harper Woods
Occupancy by Ownership in Harper Woods
Of the total 5,515 dwellings in Harper Woods, owner-occupied units account for 3,295 (59.8%), while renter-occupied units make up 2,220 (40.3%).
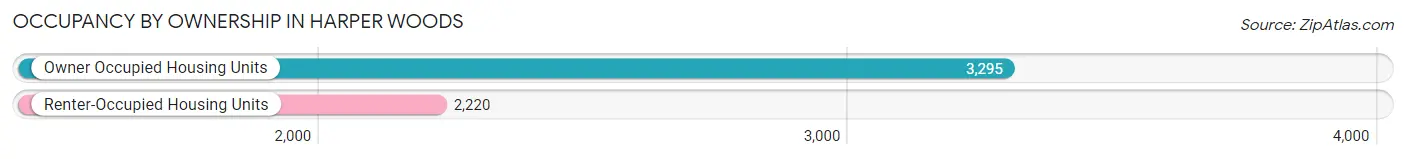
| Occupancy | # Housing Units | % Housing Units |
| Owner Occupied Housing Units | 3,295 | 59.8% |
| Renter-Occupied Housing Units | 2,220 | 40.3% |
| Total Occupied Housing Units | 5,515 | 100.0% |
Occupancy by Household Size in Harper Woods
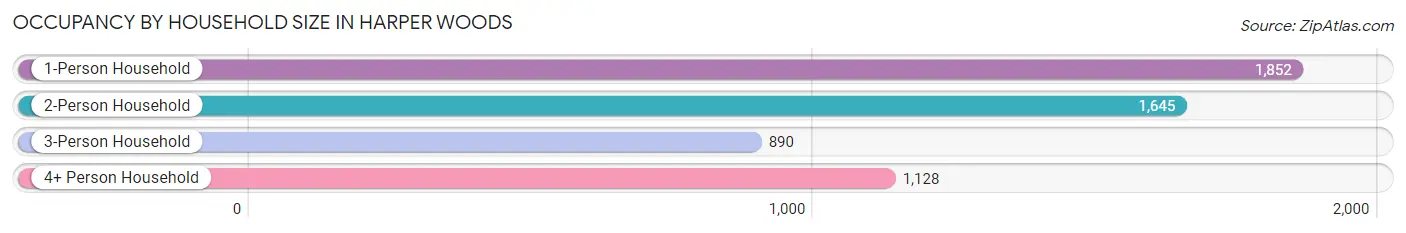
| Household Size | # Housing Units | % Housing Units |
| 1-Person Household | 1,852 | 33.6% |
| 2-Person Household | 1,645 | 29.8% |
| 3-Person Household | 890 | 16.1% |
| 4+ Person Household | 1,128 | 20.4% |
| Total Housing Units | 5,515 | 100.0% |
Occupancy by Ownership by Household Size in Harper Woods
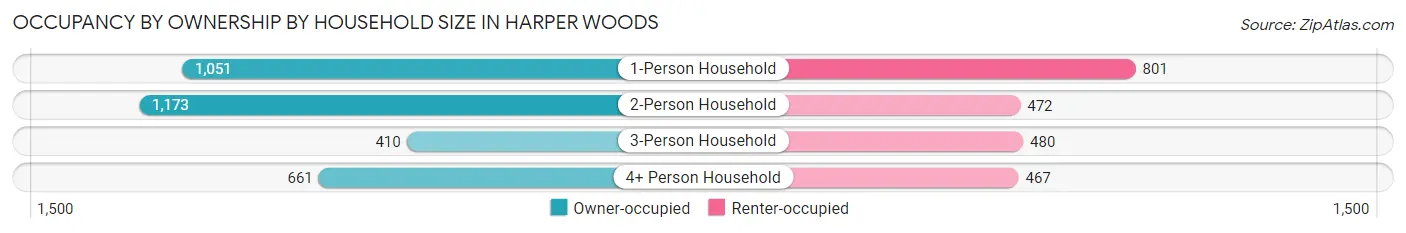
| Household Size | Owner-occupied | Renter-occupied |
| 1-Person Household | 1,051 (56.8%) | 801 (43.2%) |
| 2-Person Household | 1,173 (71.3%) | 472 (28.7%) |
| 3-Person Household | 410 (46.1%) | 480 (53.9%) |
| 4+ Person Household | 661 (58.6%) | 467 (41.4%) |
| Total Housing Units | 3,295 (59.8%) | 2,220 (40.3%) |
Occupancy by Educational Attainment in Harper Woods

| Household Size | Owner-occupied | Renter-occupied |
| Less than High School | 107 (44.6%) | 133 (55.4%) |
| High School Diploma | 726 (47.4%) | 807 (52.6%) |
| College/Associate Degree | 1,271 (53.5%) | 1,103 (46.5%) |
| Bachelor's Degree or higher | 1,191 (87.1%) | 177 (12.9%) |
Occupancy by Age of Householder in Harper Woods
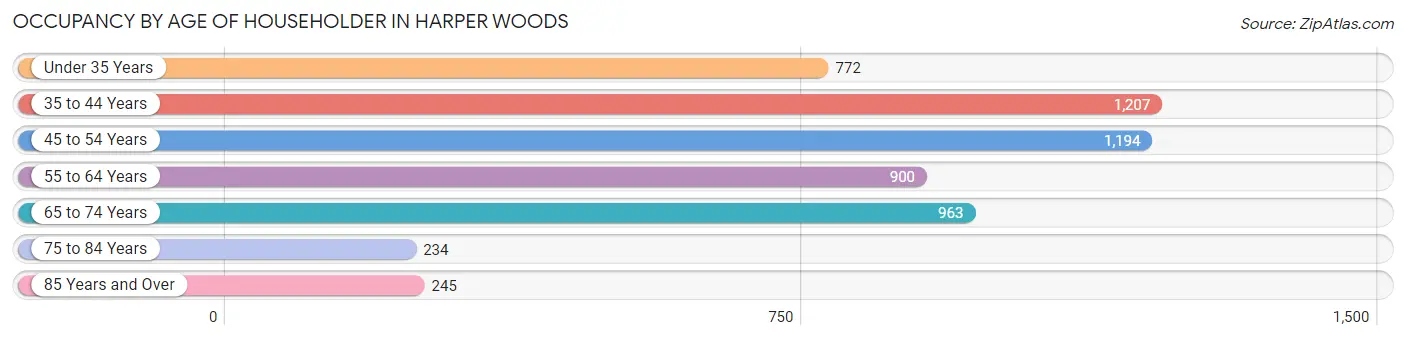
| Age Bracket | # Households | % Households |
| Under 35 Years | 772 | 14.0% |
| 35 to 44 Years | 1,207 | 21.9% |
| 45 to 54 Years | 1,194 | 21.6% |
| 55 to 64 Years | 900 | 16.3% |
| 65 to 74 Years | 963 | 17.5% |
| 75 to 84 Years | 234 | 4.2% |
| 85 Years and Over | 245 | 4.4% |
| Total | 5,515 | 100.0% |
Housing Finances in Harper Woods
Median Income by Occupancy in Harper Woods
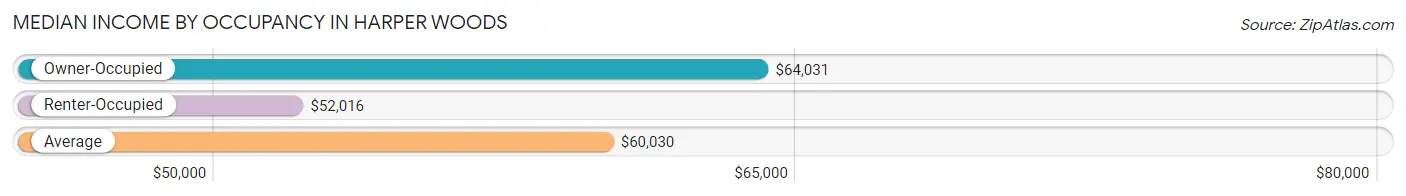
| Occupancy Type | # Households | Median Income |
| Owner-Occupied | 3,295 (59.8%) | $64,031 |
| Renter-Occupied | 2,220 (40.3%) | $52,016 |
| Average | 5,515 (100.0%) | $60,030 |
Occupancy by Householder Income Bracket in Harper Woods
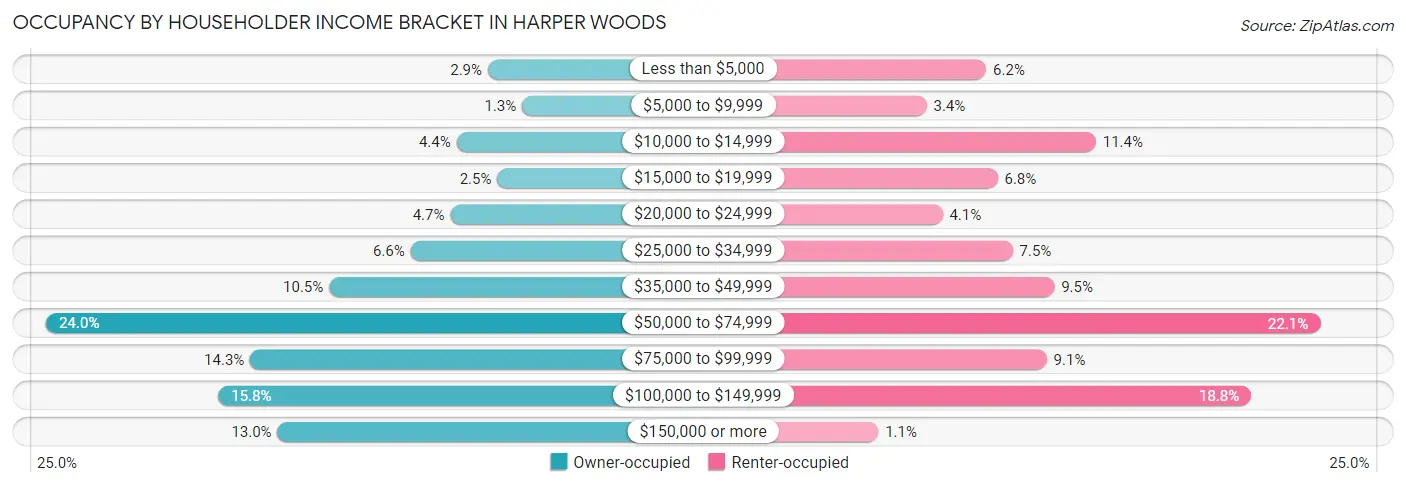
| Income Bracket | Owner-occupied | Renter-occupied |
| Less than $5,000 | 97 (2.9%) | 138 (6.2%) |
| $5,000 to $9,999 | 43 (1.3%) | 75 (3.4%) |
| $10,000 to $14,999 | 146 (4.4%) | 254 (11.4%) |
| $15,000 to $19,999 | 82 (2.5%) | 150 (6.8%) |
| $20,000 to $24,999 | 156 (4.7%) | 92 (4.1%) |
| $25,000 to $34,999 | 218 (6.6%) | 166 (7.5%) |
| $35,000 to $49,999 | 346 (10.5%) | 210 (9.5%) |
| $50,000 to $74,999 | 790 (24.0%) | 491 (22.1%) |
| $75,000 to $99,999 | 470 (14.3%) | 202 (9.1%) |
| $100,000 to $149,999 | 520 (15.8%) | 418 (18.8%) |
| $150,000 or more | 427 (13.0%) | 24 (1.1%) |
| Total | 3,295 (100.0%) | 2,220 (100.0%) |
Monthly Housing Cost Tiers in Harper Woods
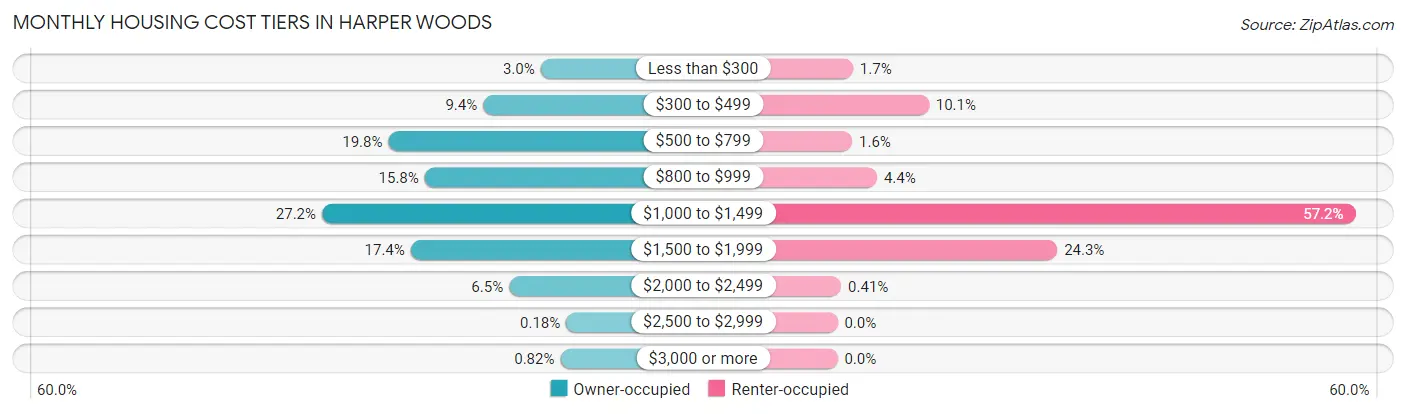
| Monthly Cost | Owner-occupied | Renter-occupied |
| Less than $300 | 99 (3.0%) | 38 (1.7%) |
| $300 to $499 | 308 (9.3%) | 224 (10.1%) |
| $500 to $799 | 653 (19.8%) | 36 (1.6%) |
| $800 to $999 | 521 (15.8%) | 97 (4.4%) |
| $1,000 to $1,499 | 895 (27.2%) | 1,270 (57.2%) |
| $1,500 to $1,999 | 572 (17.4%) | 539 (24.3%) |
| $2,000 to $2,499 | 214 (6.5%) | 9 (0.4%) |
| $2,500 to $2,999 | 6 (0.2%) | 0 (0.0%) |
| $3,000 or more | 27 (0.8%) | 0 (0.0%) |
| Total | 3,295 (100.0%) | 2,220 (100.0%) |
Physical Housing Characteristics in Harper Woods
Housing Structures in Harper Woods
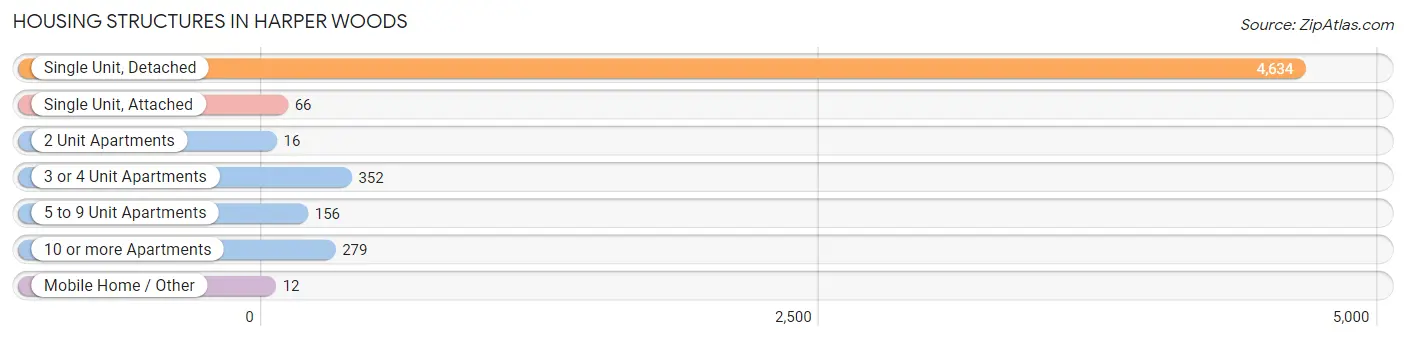
| Structure Type | # Housing Units | % Housing Units |
| Single Unit, Detached | 4,634 | 84.0% |
| Single Unit, Attached | 66 | 1.2% |
| 2 Unit Apartments | 16 | 0.3% |
| 3 or 4 Unit Apartments | 352 | 6.4% |
| 5 to 9 Unit Apartments | 156 | 2.8% |
| 10 or more Apartments | 279 | 5.1% |
| Mobile Home / Other | 12 | 0.2% |
| Total | 5,515 | 100.0% |
Housing Structures by Occupancy in Harper Woods
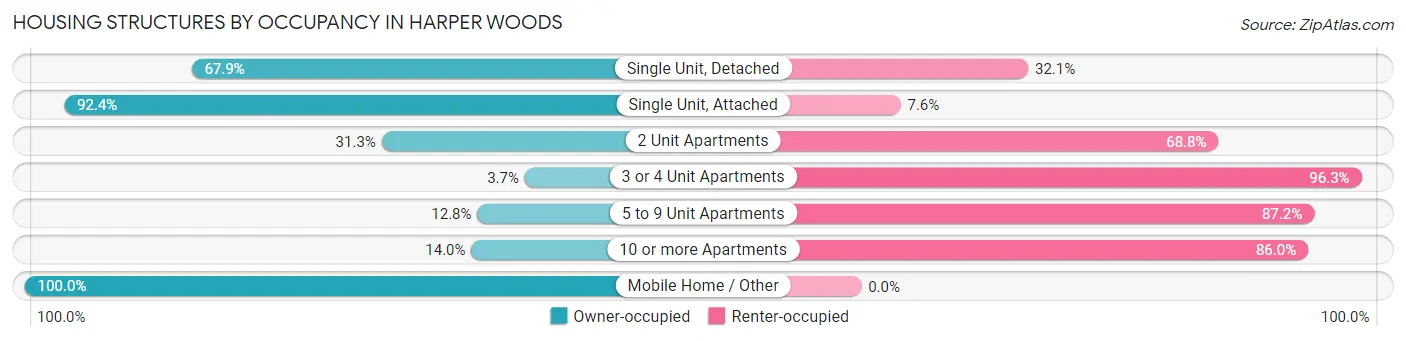
| Structure Type | Owner-occupied | Renter-occupied |
| Single Unit, Detached | 3,145 (67.9%) | 1,489 (32.1%) |
| Single Unit, Attached | 61 (92.4%) | 5 (7.6%) |
| 2 Unit Apartments | 5 (31.2%) | 11 (68.8%) |
| 3 or 4 Unit Apartments | 13 (3.7%) | 339 (96.3%) |
| 5 to 9 Unit Apartments | 20 (12.8%) | 136 (87.2%) |
| 10 or more Apartments | 39 (14.0%) | 240 (86.0%) |
| Mobile Home / Other | 12 (100.0%) | 0 (0.0%) |
| Total | 3,295 (59.8%) | 2,220 (40.3%) |
Housing Structures by Number of Rooms in Harper Woods
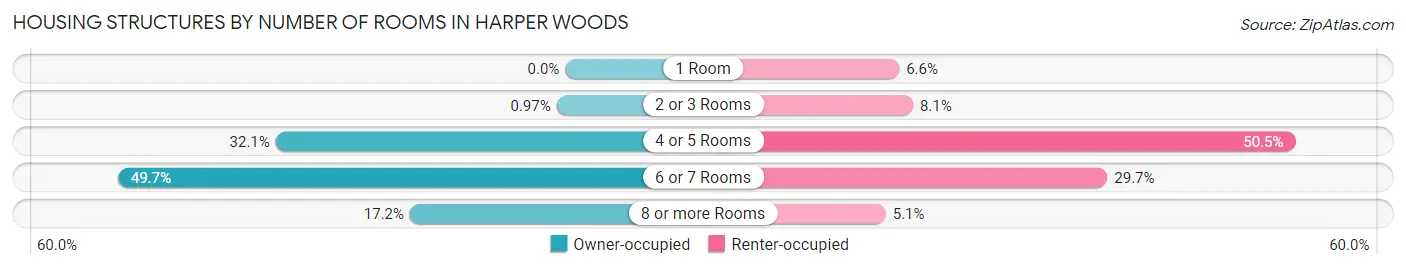
| Number of Rooms | Owner-occupied | Renter-occupied |
| 1 Room | 0 (0.0%) | 146 (6.6%) |
| 2 or 3 Rooms | 32 (1.0%) | 180 (8.1%) |
| 4 or 5 Rooms | 1,059 (32.1%) | 1,122 (50.5%) |
| 6 or 7 Rooms | 1,636 (49.6%) | 659 (29.7%) |
| 8 or more Rooms | 568 (17.2%) | 113 (5.1%) |
| Total | 3,295 (100.0%) | 2,220 (100.0%) |
Housing Structure by Heating Type in Harper Woods
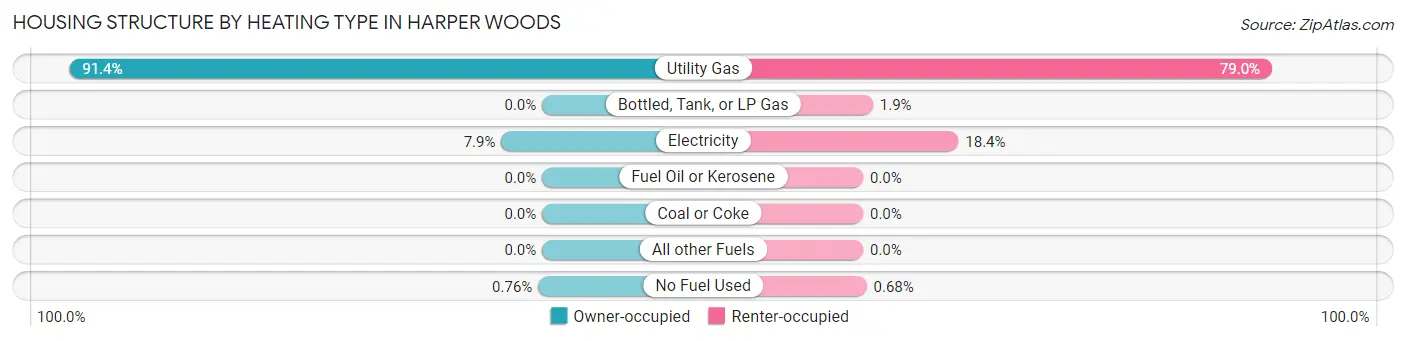
| Heating Type | Owner-occupied | Renter-occupied |
| Utility Gas | 3,010 (91.3%) | 1,754 (79.0%) |
| Bottled, Tank, or LP Gas | 0 (0.0%) | 42 (1.9%) |
| Electricity | 260 (7.9%) | 409 (18.4%) |
| Fuel Oil or Kerosene | 0 (0.0%) | 0 (0.0%) |
| Coal or Coke | 0 (0.0%) | 0 (0.0%) |
| All other Fuels | 0 (0.0%) | 0 (0.0%) |
| No Fuel Used | 25 (0.8%) | 15 (0.7%) |
| Total | 3,295 (100.0%) | 2,220 (100.0%) |
Household Vehicle Usage in Harper Woods
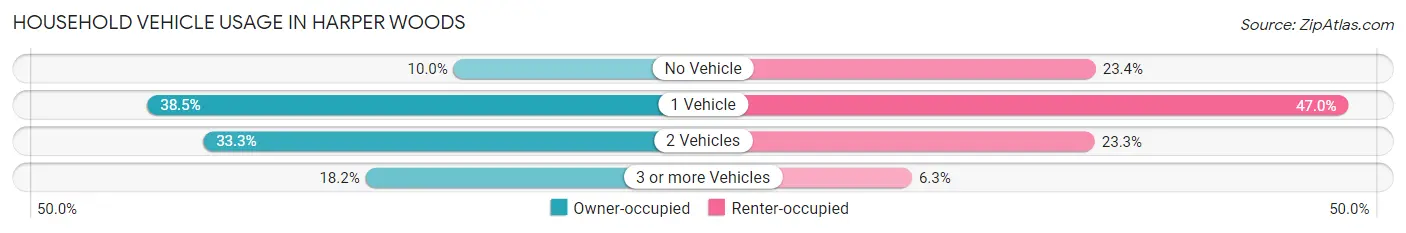
| Vehicles per Household | Owner-occupied | Renter-occupied |
| No Vehicle | 328 (10.0%) | 520 (23.4%) |
| 1 Vehicle | 1,270 (38.5%) | 1,043 (47.0%) |
| 2 Vehicles | 1,098 (33.3%) | 518 (23.3%) |
| 3 or more Vehicles | 599 (18.2%) | 139 (6.3%) |
| Total | 3,295 (100.0%) | 2,220 (100.0%) |
Real Estate & Mortgages in Harper Woods
Real Estate and Mortgage Overview in Harper Woods
| Characteristic | Without Mortgage | With Mortgage |
| Housing Units | 1,461 | 1,834 |
| Median Property Value | $123,200 | $145,600 |
| Median Household Income | $60,192 | $214 |
| Monthly Housing Costs | $647 | $27 |
| Real Estate Taxes | $2,940 | $68 |
Property Value by Mortgage Status in Harper Woods
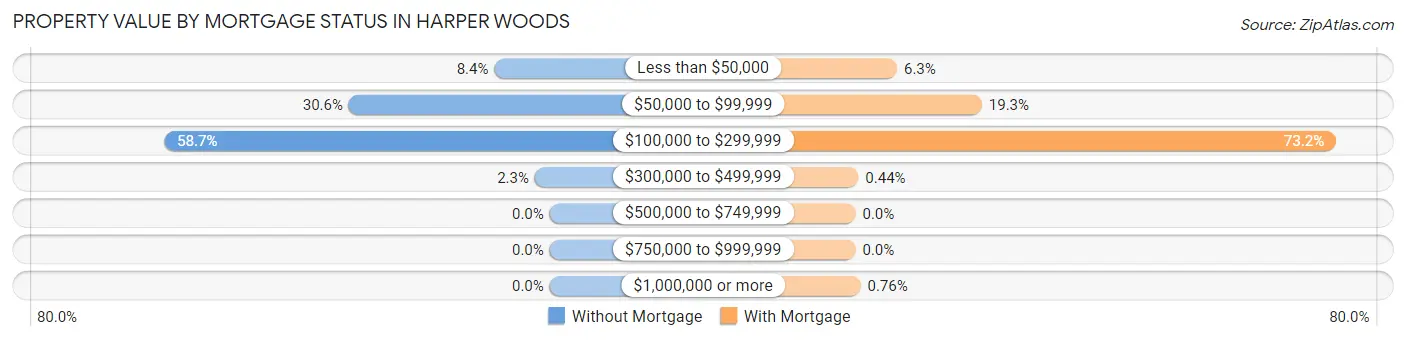
| Property Value | Without Mortgage | With Mortgage |
| Less than $50,000 | 123 (8.4%) | 116 (6.3%) |
| $50,000 to $99,999 | 447 (30.6%) | 353 (19.3%) |
| $100,000 to $299,999 | 858 (58.7%) | 1,343 (73.2%) |
| $300,000 to $499,999 | 33 (2.3%) | 8 (0.4%) |
| $500,000 to $749,999 | 0 (0.0%) | 0 (0.0%) |
| $750,000 to $999,999 | 0 (0.0%) | 0 (0.0%) |
| $1,000,000 or more | 0 (0.0%) | 14 (0.8%) |
| Total | 1,461 (100.0%) | 1,834 (100.0%) |
Household Income by Mortgage Status in Harper Woods
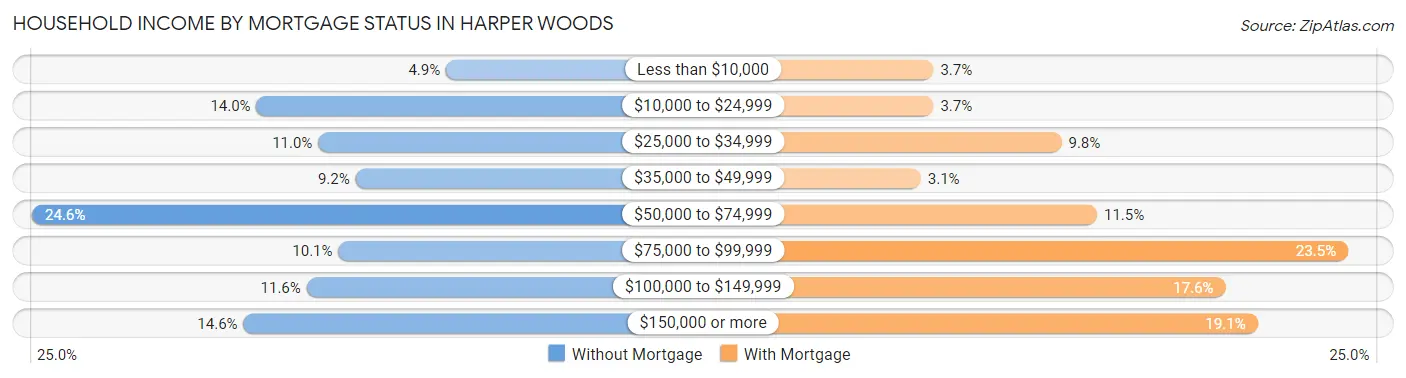
| Household Income | Without Mortgage | With Mortgage |
| Less than $10,000 | 72 (4.9%) | 68 (3.7%) |
| $10,000 to $24,999 | 204 (14.0%) | 68 (3.7%) |
| $25,000 to $34,999 | 161 (11.0%) | 180 (9.8%) |
| $35,000 to $49,999 | 135 (9.2%) | 57 (3.1%) |
| $50,000 to $74,999 | 360 (24.6%) | 211 (11.5%) |
| $75,000 to $99,999 | 147 (10.1%) | 430 (23.4%) |
| $100,000 to $149,999 | 169 (11.6%) | 323 (17.6%) |
| $150,000 or more | 213 (14.6%) | 351 (19.1%) |
| Total | 1,461 (100.0%) | 1,834 (100.0%) |
Property Value to Household Income Ratio in Harper Woods
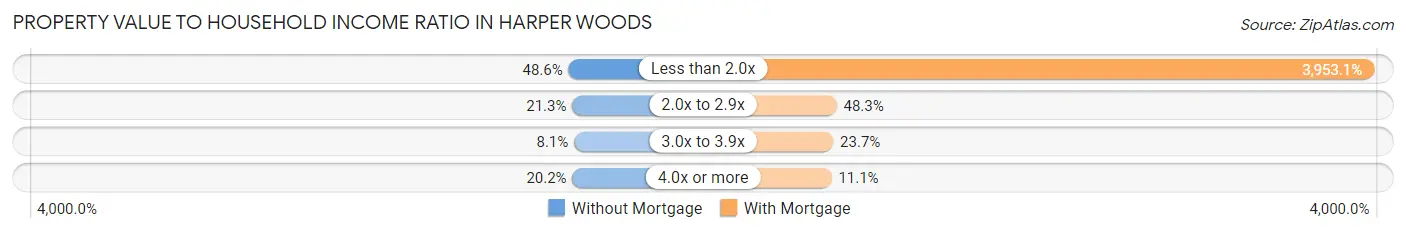
| Value-to-Income Ratio | Without Mortgage | With Mortgage |
| Less than 2.0x | 710 (48.6%) | 72,500 (3,953.1%) |
| 2.0x to 2.9x | 311 (21.3%) | 886 (48.3%) |
| 3.0x to 3.9x | 118 (8.1%) | 434 (23.7%) |
| 4.0x or more | 295 (20.2%) | 203 (11.1%) |
| Total | 1,461 (100.0%) | 1,834 (100.0%) |
Real Estate Taxes by Mortgage Status in Harper Woods
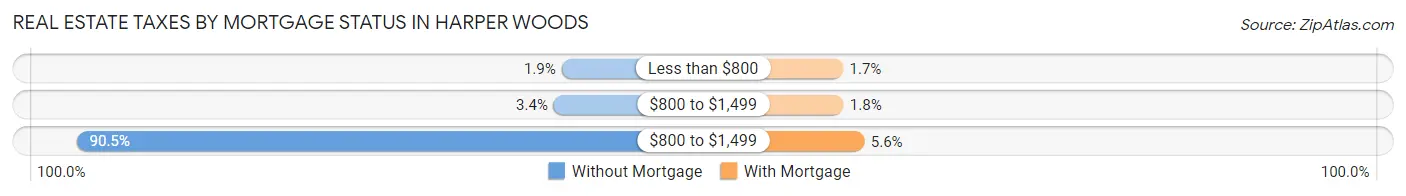
| Property Taxes | Without Mortgage | With Mortgage |
| Less than $800 | 28 (1.9%) | 32 (1.7%) |
| $800 to $1,499 | 49 (3.4%) | 33 (1.8%) |
| $800 to $1,499 | 1,322 (90.5%) | 103 (5.6%) |
| Total | 1,461 (100.0%) | 1,834 (100.0%) |
Health & Disability in Harper Woods
Health Insurance Coverage by Age in Harper Woods
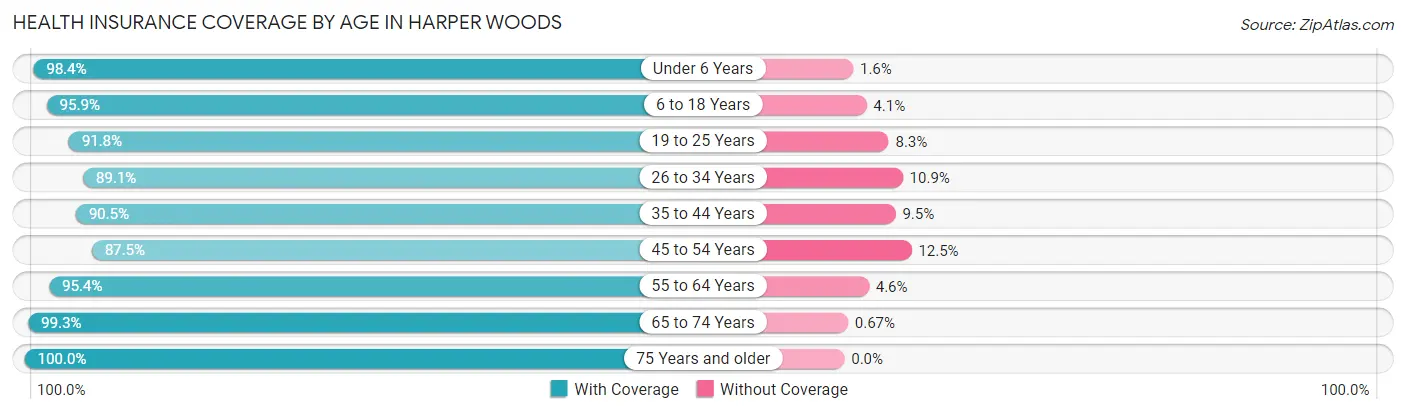
| Age Bracket | With Coverage | Without Coverage |
| Under 6 Years | 967 (98.4%) | 16 (1.6%) |
| 6 to 18 Years | 3,073 (95.9%) | 132 (4.1%) |
| 19 to 25 Years | 1,213 (91.7%) | 109 (8.3%) |
| 26 to 34 Years | 1,655 (89.1%) | 202 (10.9%) |
| 35 to 44 Years | 1,688 (90.5%) | 178 (9.5%) |
| 45 to 54 Years | 1,999 (87.5%) | 286 (12.5%) |
| 55 to 64 Years | 1,544 (95.4%) | 74 (4.6%) |
| 65 to 74 Years | 1,336 (99.3%) | 9 (0.7%) |
| 75 Years and older | 687 (100.0%) | 0 (0.0%) |
| Total | 14,162 (93.4%) | 1,006 (6.6%) |
Health Insurance Coverage by Citizenship Status in Harper Woods
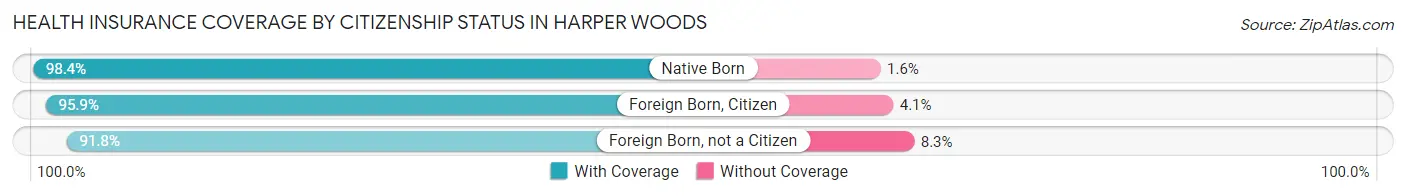
| Citizenship Status | With Coverage | Without Coverage |
| Native Born | 967 (98.4%) | 16 (1.6%) |
| Foreign Born, Citizen | 3,073 (95.9%) | 132 (4.1%) |
| Foreign Born, not a Citizen | 1,213 (91.7%) | 109 (8.3%) |
Health Insurance Coverage by Household Income in Harper Woods
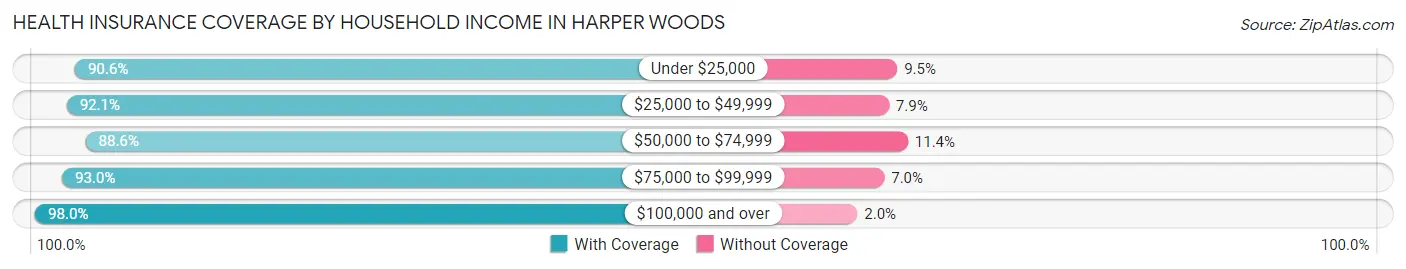
| Household Income | With Coverage | Without Coverage |
| Under $25,000 | 2,128 (90.5%) | 222 (9.5%) |
| $25,000 to $49,999 | 2,415 (92.1%) | 207 (7.9%) |
| $50,000 to $74,999 | 2,633 (88.6%) | 340 (11.4%) |
| $75,000 to $99,999 | 1,749 (93.0%) | 132 (7.0%) |
| $100,000 and over | 5,202 (98.0%) | 105 (2.0%) |
Public vs Private Health Insurance Coverage by Age in Harper Woods
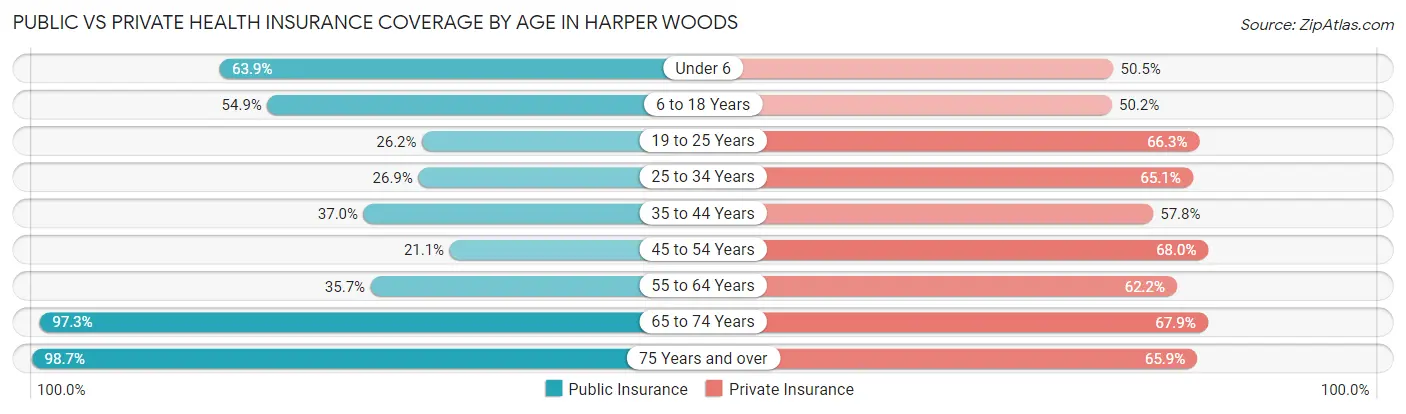
| Age Bracket | Public Insurance | Private Insurance |
| Under 6 | 628 (63.9%) | 496 (50.5%) |
| 6 to 18 Years | 1,759 (54.9%) | 1,608 (50.2%) |
| 19 to 25 Years | 346 (26.2%) | 877 (66.3%) |
| 25 to 34 Years | 499 (26.9%) | 1,209 (65.1%) |
| 35 to 44 Years | 691 (37.0%) | 1,079 (57.8%) |
| 45 to 54 Years | 481 (21.0%) | 1,554 (68.0%) |
| 55 to 64 Years | 578 (35.7%) | 1,006 (62.2%) |
| 65 to 74 Years | 1,308 (97.3%) | 913 (67.9%) |
| 75 Years and over | 678 (98.7%) | 453 (65.9%) |
| Total | 6,968 (45.9%) | 9,195 (60.6%) |
Disability Status by Sex by Age in Harper Woods
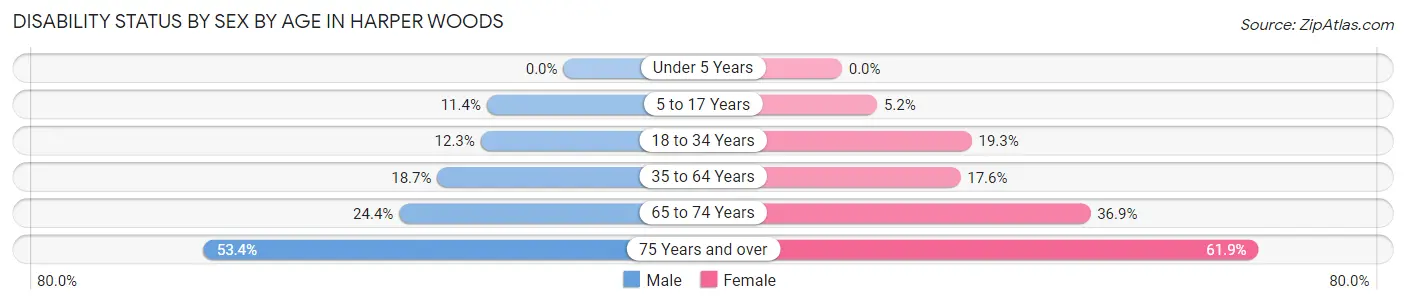
| Age Bracket | Male | Female |
| Under 5 Years | 0 (0.0%) | 0 (0.0%) |
| 5 to 17 Years | 199 (11.4%) | 74 (5.2%) |
| 18 to 34 Years | 211 (12.3%) | 312 (19.3%) |
| 35 to 64 Years | 436 (18.7%) | 605 (17.6%) |
| 65 to 74 Years | 127 (24.4%) | 304 (36.9%) |
| 75 Years and over | 126 (53.4%) | 279 (61.9%) |
Disability Class by Sex by Age in Harper Woods
Disability Class: Hearing Difficulty
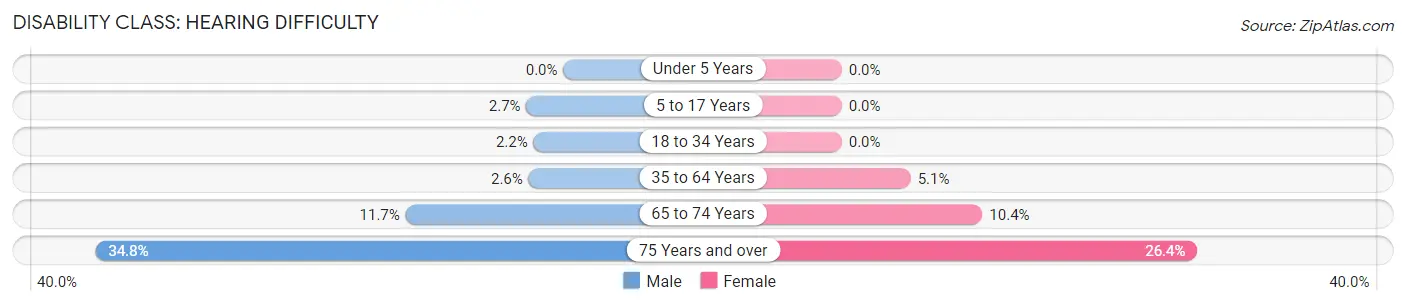
| Age Bracket | Male | Female |
| Under 5 Years | 0 (0.0%) | 0 (0.0%) |
| 5 to 17 Years | 48 (2.7%) | 0 (0.0%) |
| 18 to 34 Years | 38 (2.2%) | 0 (0.0%) |
| 35 to 64 Years | 60 (2.6%) | 176 (5.1%) |
| 65 to 74 Years | 61 (11.7%) | 86 (10.4%) |
| 75 Years and over | 82 (34.7%) | 119 (26.4%) |
Disability Class: Vision Difficulty
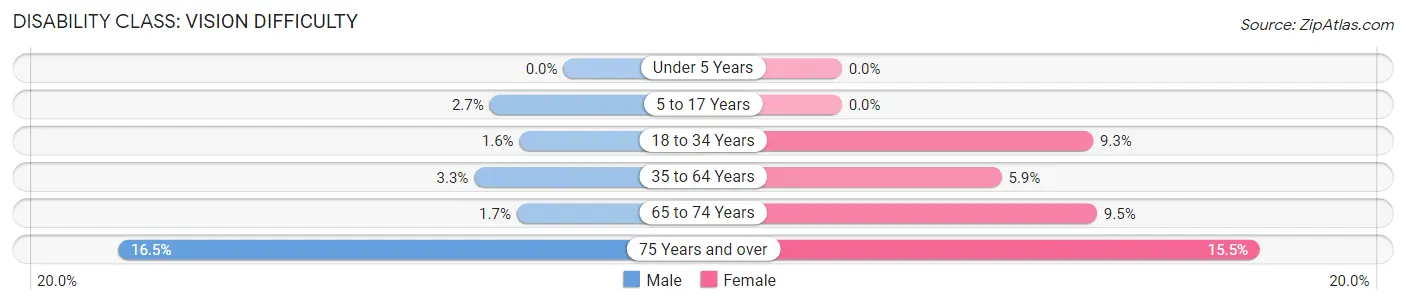
| Age Bracket | Male | Female |
| Under 5 Years | 0 (0.0%) | 0 (0.0%) |
| 5 to 17 Years | 48 (2.7%) | 0 (0.0%) |
| 18 to 34 Years | 28 (1.6%) | 151 (9.3%) |
| 35 to 64 Years | 77 (3.3%) | 204 (5.9%) |
| 65 to 74 Years | 9 (1.7%) | 78 (9.5%) |
| 75 Years and over | 39 (16.5%) | 70 (15.5%) |
Disability Class: Cognitive Difficulty
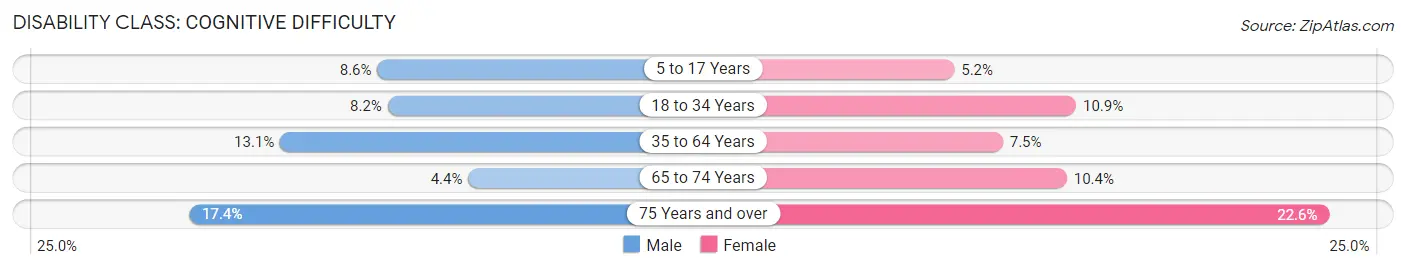
| Age Bracket | Male | Female |
| 5 to 17 Years | 151 (8.6%) | 74 (5.2%) |
| 18 to 34 Years | 140 (8.2%) | 176 (10.9%) |
| 35 to 64 Years | 306 (13.1%) | 257 (7.5%) |
| 65 to 74 Years | 23 (4.4%) | 86 (10.4%) |
| 75 Years and over | 41 (17.4%) | 102 (22.6%) |
Disability Class: Ambulatory Difficulty
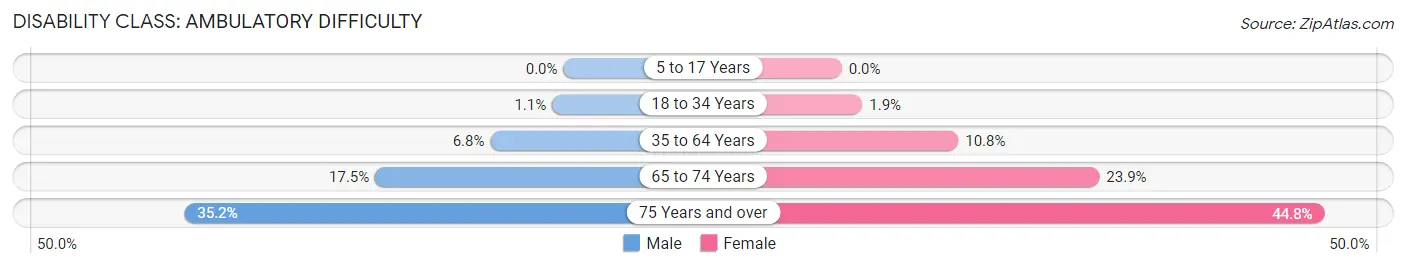
| Age Bracket | Male | Female |
| 5 to 17 Years | 0 (0.0%) | 0 (0.0%) |
| 18 to 34 Years | 18 (1.1%) | 31 (1.9%) |
| 35 to 64 Years | 158 (6.8%) | 372 (10.8%) |
| 65 to 74 Years | 91 (17.5%) | 197 (23.9%) |
| 75 Years and over | 83 (35.2%) | 202 (44.8%) |
Disability Class: Self-Care Difficulty
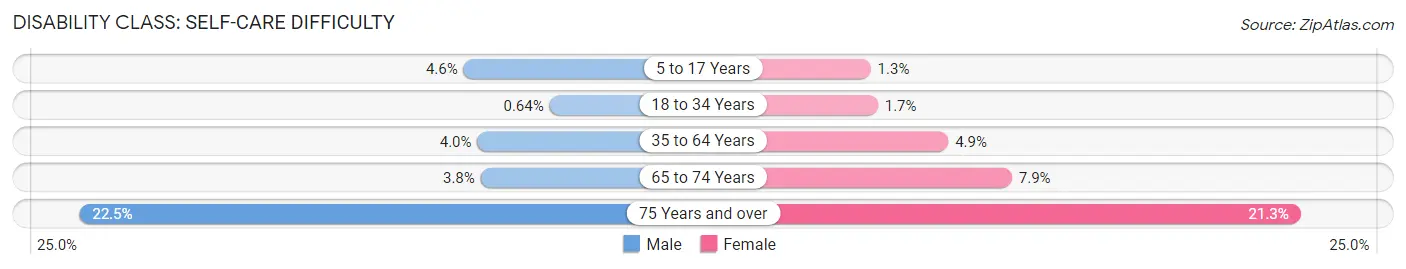
| Age Bracket | Male | Female |
| 5 to 17 Years | 81 (4.6%) | 19 (1.3%) |
| 18 to 34 Years | 11 (0.6%) | 27 (1.7%) |
| 35 to 64 Years | 93 (4.0%) | 170 (4.9%) |
| 65 to 74 Years | 20 (3.8%) | 65 (7.9%) |
| 75 Years and over | 53 (22.5%) | 96 (21.3%) |
Technology Access in Harper Woods
Computing Device Access in Harper Woods
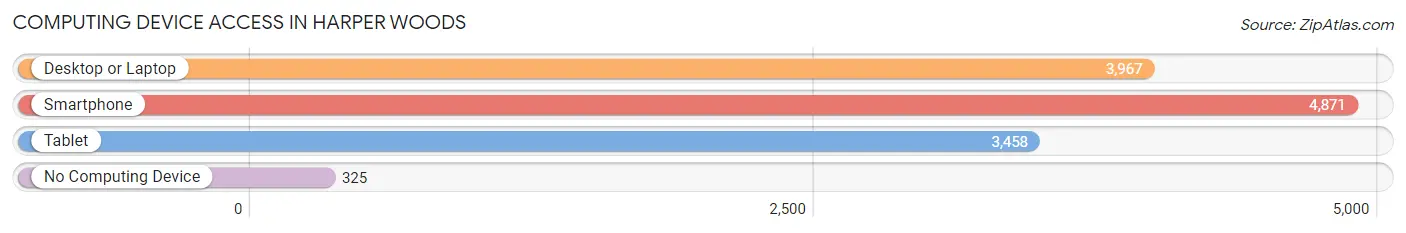
| Device Type | # Households | % Households |
| Desktop or Laptop | 3,967 | 71.9% |
| Smartphone | 4,871 | 88.3% |
| Tablet | 3,458 | 62.7% |
| No Computing Device | 325 | 5.9% |
| Total | 5,515 | 100.0% |
Internet Access in Harper Woods
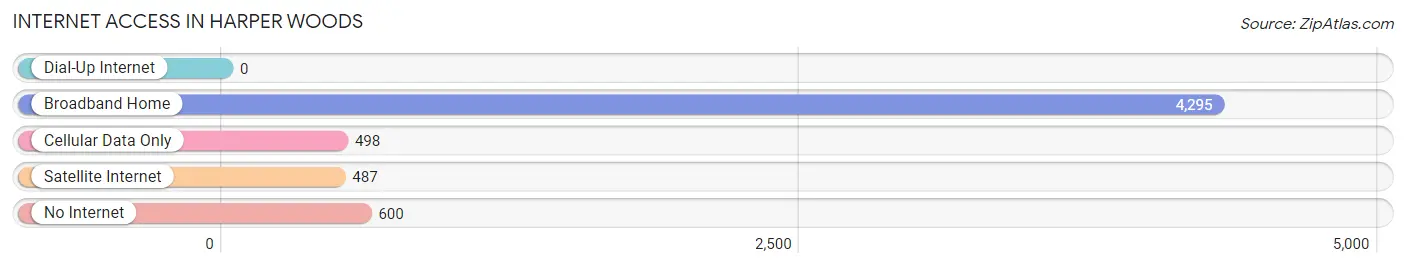
| Internet Type | # Households | % Households |
| Dial-Up Internet | 0 | 0.0% |
| Broadband Home | 4,295 | 77.9% |
| Cellular Data Only | 498 | 9.0% |
| Satellite Internet | 487 | 8.8% |
| No Internet | 600 | 10.9% |
| Total | 5,515 | 100.0% |
Harper Woods Summary
Harper Woods is a city located in Wayne County, Michigan, United States. The city is located in the Metro Detroit area and is a suburb of Detroit. As of the 2010 census, the city had a population of 14,236.
History
Harper Woods was first settled in the early 19th century by French-Canadian fur traders. The area was originally known as "Harper's Woods" after the first settler, John Harper. In the early 20th century, the area was developed as a residential suburb of Detroit. The city was incorporated in 1951.
Geography
Harper Woods is located in southeastern Michigan, about 8 miles northeast of Detroit. The city is situated on the east bank of the Detroit River, just south of Lake St. Clair. The city has a total area of 2.7 square miles, all of which is land.
Economy
Harper Woods is a primarily residential community, with a small commercial district along Harper Avenue. The city is home to several large employers, including the Detroit Medical Center, St. John Providence Health System, and the Detroit Public Schools. The city also has a number of small businesses, including restaurants, retail stores, and professional services.
Demographics
As of the 2010 census, there were 14,236 people, 5,845 households, and 3,717 families residing in the city. The population density was 5,269.2 people per square mile. The racial makeup of the city was 57.2% White, 37.2% African American, 0.4% Native American, 1.2% Asian, 0.1% Pacific Islander, 1.2% from other races, and 3.0% from two or more races. Hispanic or Latino of any race were 3.7% of the population.
The median income for a household in the city was $37,945, and the median income for a family was $48,945. The per capita income for the city was $20,845. About 16.2% of families and 19.2% of the population were below the poverty line, including 28.2% of those under age 18 and 11.2% of those age 65 or over.
Conclusion
Harper Woods is a small city located in Wayne County, Michigan, just northeast of Detroit. The city has a long history, dating back to the early 19th century, and has grown to become a primarily residential community. The city has a diverse population and a strong economy, with several large employers and a number of small businesses.
Common Questions
What is Per Capita Income in Harper Woods?
Per Capita income in Harper Woods is $28,334.
What is the Median Family Income in Harper Woods?
Median Family Income in Harper Woods is $72,799.
What is the Median Household income in Harper Woods?
Median Household Income in Harper Woods is $60,030.
What is Income or Wage Gap in Harper Woods?
Income or Wage Gap in Harper Woods is 7.4%.
Women in Harper Woods earn 92.6 cents for every dollar earned by a man.
What is Inequality or Gini Index in Harper Woods?
Inequality or Gini Index in Harper Woods is 0.42.
What is the Total Population of Harper Woods?
Total Population of Harper Woods is 15,296.
What is the Total Male Population of Harper Woods?
Total Male Population of Harper Woods is 7,095.
What is the Total Female Population of Harper Woods?
Total Female Population of Harper Woods is 8,201.
What is the Ratio of Males per 100 Females in Harper Woods?
There are 86.51 Males per 100 Females in Harper Woods.
What is the Ratio of Females per 100 Males in Harper Woods?
There are 115.59 Females per 100 Males in Harper Woods.
What is the Median Population Age in Harper Woods?
Median Population Age in Harper Woods is 37.4 Years.
What is the Average Family Size in Harper Woods
Average Family Size in Harper Woods is 3.6 People.
What is the Average Household Size in Harper Woods
Average Household Size in Harper Woods is 2.7 People.
How Large is the Labor Force in Harper Woods?
There are 7,704 People in the Labor Forcein in Harper Woods.
What is the Percentage of People in the Labor Force in Harper Woods?
66.0% of People are in the Labor Force in Harper Woods.
What is the Unemployment Rate in Harper Woods?
Unemployment Rate in Harper Woods is 7.6%.