Amador City, CA Map & Demographics
Amador City Map
Amador City Overview
$53,878
PER CAPITA INCOME
$104,688
AVG FAMILY INCOME
$63,487
AVG HOUSEHOLD INCOME
27.5%
WAGE / INCOME GAP [ % ]
72.5¢/ $1
WAGE / INCOME GAP [ $ ]
0.52
INEQUALITY / GINI INDEX
215
TOTAL POPULATION
124
MALE POPULATION
91
FEMALE POPULATION
136.26
MALES / 100 FEMALES
73.39
FEMALES / 100 MALES
37.5
MEDIAN AGE
2.4
AVG FAMILY SIZE
1.9
AVG HOUSEHOLD SIZE
141
LABOR FORCE [ PEOPLE ]
75.8%
PERCENT IN LABOR FORCE
7.8%
UNEMPLOYMENT RATE
Amador City Zip Codes
Amador City Area Codes
Income in Amador City
Income Overview in Amador City
Per Capita Income in Amador City is $53,878, while median incomes of families and households are $104,688 and $63,487 respectively.
| Characteristic | Number | Measure |
| Per Capita Income | 215 | $53,878 |
| Median Family Income | 49 | $104,688 |
| Mean Family Income | 49 | $127,278 |
| Median Household Income | 113 | $63,487 |
| Mean Household Income | 113 | $100,267 |
| Income Deficit | 49 | $0 |
| Wage / Income Gap (%) | 215 | 27.50% |
| Wage / Income Gap ($) | 215 | 72.50¢ per $1 |
| Gini / Inequality Index | 215 | 0.52 |
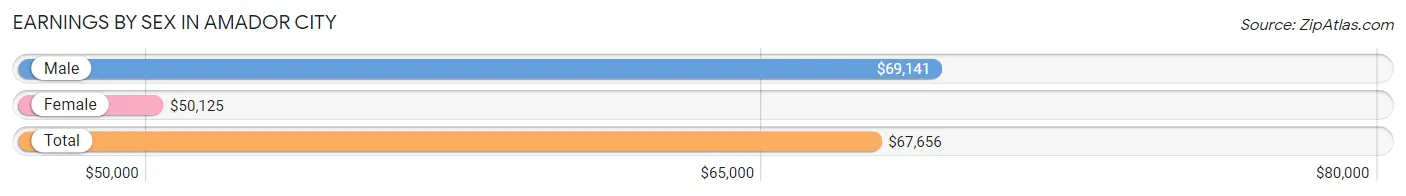
Earnings by Sex in Amador City
Average Earnings in Amador City are $67,656, $69,141 for men and $50,125 for women, a difference of 27.5%.
| Sex | Number | Average Earnings |
| Male | 77 (59.2%) | $69,141 |
| Female | 53 (40.8%) | $50,125 |
| Total | 130 (100.0%) | $67,656 |
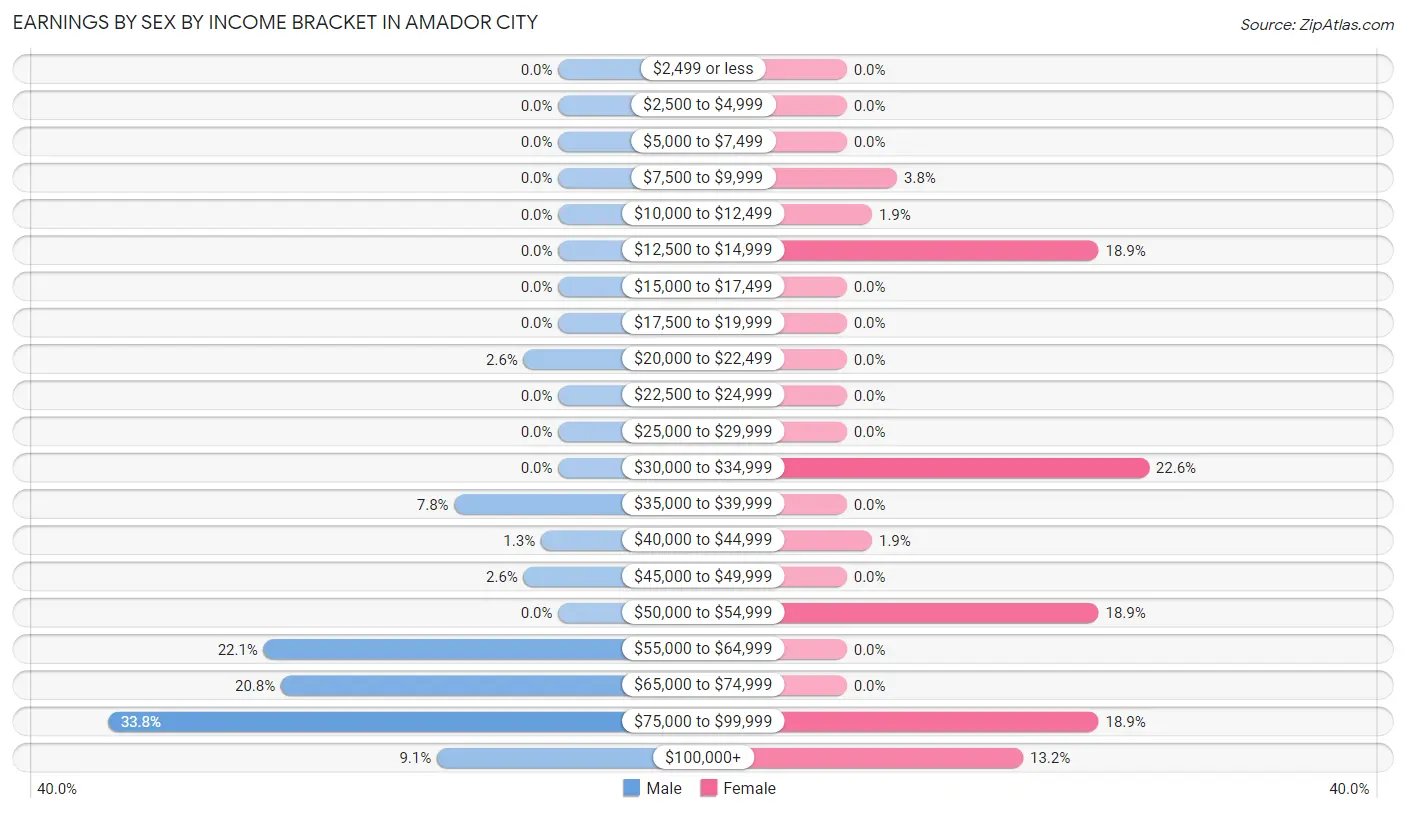
Earnings by Sex by Income Bracket in Amador City
The most common earnings brackets in Amador City are $75,000 to $99,999 for men (26 | 33.8%) and $30,000 to $34,999 for women (12 | 22.6%).
| Income | Male | Female |
| $2,499 or less | 0 (0.0%) | 0 (0.0%) |
| $2,500 to $4,999 | 0 (0.0%) | 0 (0.0%) |
| $5,000 to $7,499 | 0 (0.0%) | 0 (0.0%) |
| $7,500 to $9,999 | 0 (0.0%) | 2 (3.8%) |
| $10,000 to $12,499 | 0 (0.0%) | 1 (1.9%) |
| $12,500 to $14,999 | 0 (0.0%) | 10 (18.9%) |
| $15,000 to $17,499 | 0 (0.0%) | 0 (0.0%) |
| $17,500 to $19,999 | 0 (0.0%) | 0 (0.0%) |
| $20,000 to $22,499 | 2 (2.6%) | 0 (0.0%) |
| $22,500 to $24,999 | 0 (0.0%) | 0 (0.0%) |
| $25,000 to $29,999 | 0 (0.0%) | 0 (0.0%) |
| $30,000 to $34,999 | 0 (0.0%) | 12 (22.6%) |
| $35,000 to $39,999 | 6 (7.8%) | 0 (0.0%) |
| $40,000 to $44,999 | 1 (1.3%) | 1 (1.9%) |
| $45,000 to $49,999 | 2 (2.6%) | 0 (0.0%) |
| $50,000 to $54,999 | 0 (0.0%) | 10 (18.9%) |
| $55,000 to $64,999 | 17 (22.1%) | 0 (0.0%) |
| $65,000 to $74,999 | 16 (20.8%) | 0 (0.0%) |
| $75,000 to $99,999 | 26 (33.8%) | 10 (18.9%) |
| $100,000+ | 7 (9.1%) | 7 (13.2%) |
| Total | 77 (100.0%) | 53 (100.0%) |
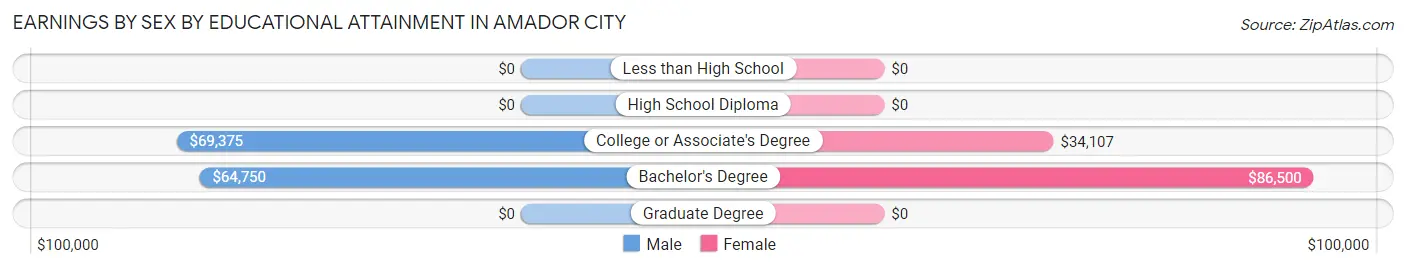
Earnings by Sex by Educational Attainment in Amador City
Average earnings in Amador City are $69,141 for men and $50,125 for women, a difference of 27.5%. Men with an educational attainment of college or associate's degree enjoy the highest average annual earnings of $69,375, while those with bachelor's degree education earn the least with $64,750. Women with an educational attainment of bachelor's degree earn the most with the average annual earnings of $86,500, while those with college or associate's degree education have the smallest earnings of $34,107.
| Educational Attainment | Male Income | Female Income |
| Less than High School | - | - |
| High School Diploma | - | - |
| College or Associate's Degree | $69,375 | $34,107 |
| Bachelor's Degree | $64,750 | $86,500 |
| Graduate Degree | - | - |
| Total | $69,141 | $50,125 |
Family Income in Amador City
Family Income Brackets in Amador City
According to the Amador City family income data, there are 18 families falling into the $100,000 to $149,999 income range, which is the most common income bracket and makes up 36.7% of all families.
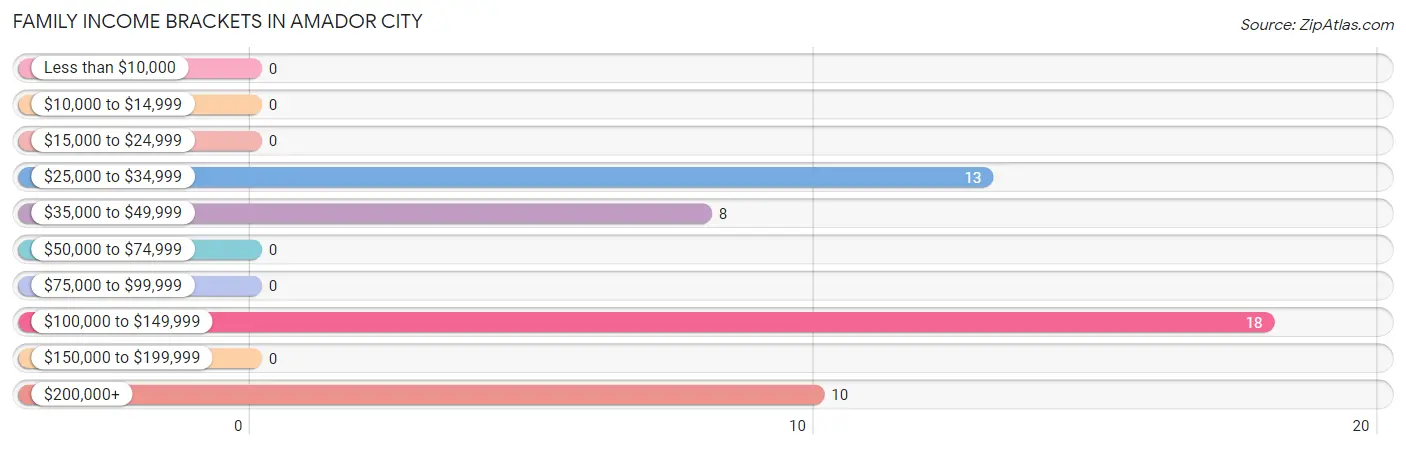
| Income Bracket | # Families | % Families |
| Less than $10,000 | 0 | 0.0% |
| $10,000 to $14,999 | 0 | 0.0% |
| $15,000 to $24,999 | 0 | 0.0% |
| $25,000 to $34,999 | 13 | 26.5% |
| $35,000 to $49,999 | 8 | 16.3% |
| $50,000 to $74,999 | 0 | 0.0% |
| $75,000 to $99,999 | 0 | 0.0% |
| $100,000 to $149,999 | 18 | 36.7% |
| $150,000 to $199,999 | 0 | 0.0% |
| $200,000+ | 10 | 20.4% |
Family Income by Famaliy Size in Amador City
3-person families (13 | 26.5%) account for the highest median family income in Amador City with $250,001 per family, while 3-person families (13 | 26.5%) have the highest median income of $83,334 per family member.
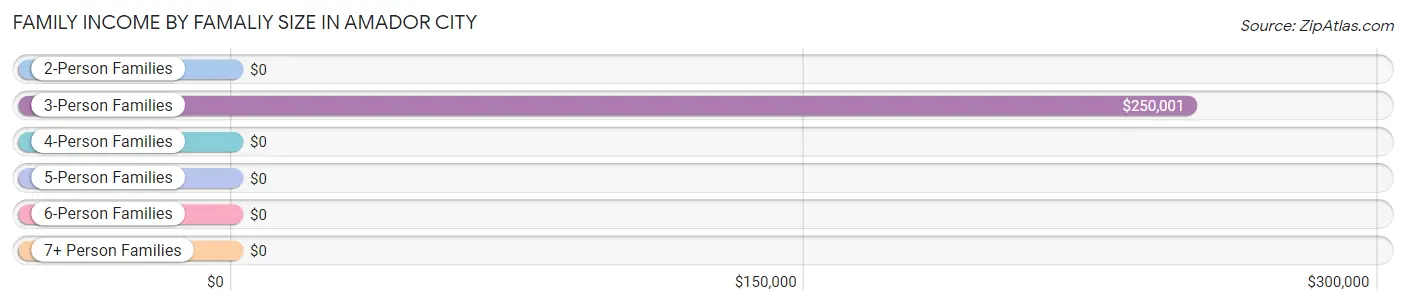
| Income Bracket | # Families | Median Income |
| 2-Person Families | 32 (65.3%) | $0 |
| 3-Person Families | 13 (26.5%) | $250,001 |
| 4-Person Families | 4 (8.2%) | $0 |
| 5-Person Families | 0 (0.0%) | $0 |
| 6-Person Families | 0 (0.0%) | $0 |
| 7+ Person Families | 0 (0.0%) | $0 |
| Total | 49 (100.0%) | $104,688 |
Family Income by Number of Earners in Amador City
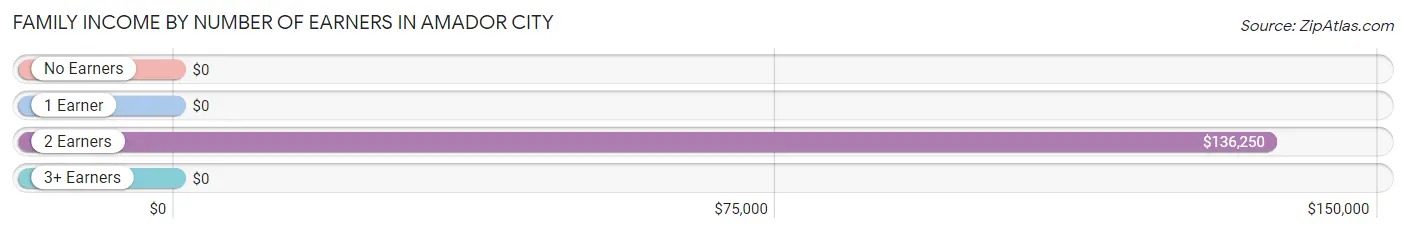
| Number of Earners | # Families | Median Income |
| No Earners | 4 (8.2%) | $0 |
| 1 Earner | 25 (51.0%) | $0 |
| 2 Earners | 20 (40.8%) | $136,250 |
| 3+ Earners | 0 (0.0%) | $0 |
| Total | 49 (100.0%) | $104,688 |
Household Income in Amador City
Household Income Brackets in Amador City
With 22 households falling in the category, the $200,000+ income range is the most frequent in Amador City, accounting for 19.5% of all households.
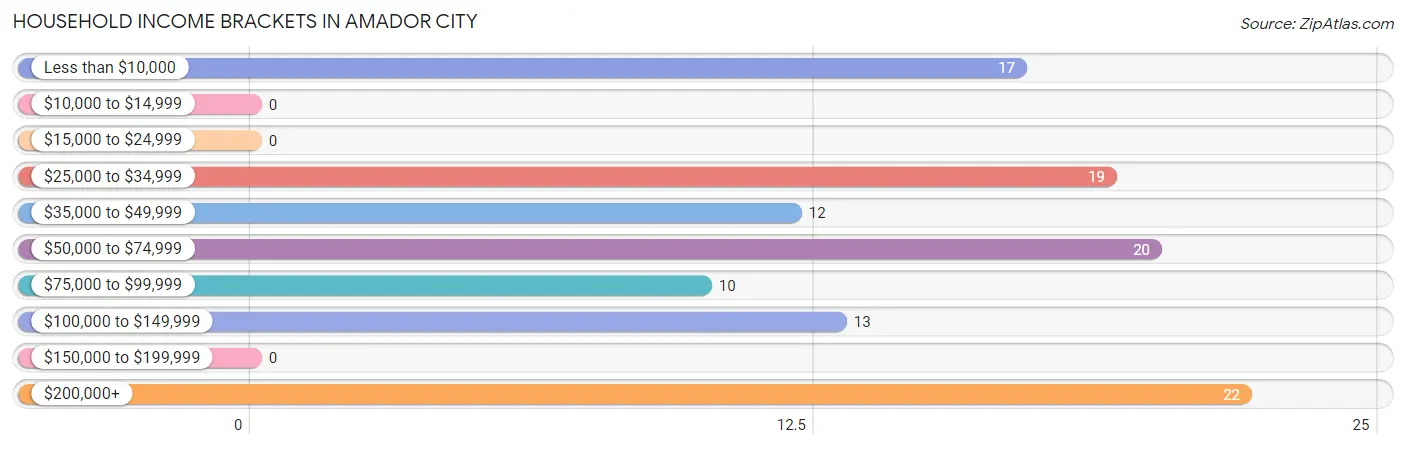
| Income Bracket | # Households | % Households |
| Less than $10,000 | 17 | 15.0% |
| $10,000 to $14,999 | 0 | 0.0% |
| $15,000 to $24,999 | 0 | 0.0% |
| $25,000 to $34,999 | 19 | 16.8% |
| $35,000 to $49,999 | 12 | 10.6% |
| $50,000 to $74,999 | 20 | 17.7% |
| $75,000 to $99,999 | 10 | 8.8% |
| $100,000 to $149,999 | 13 | 11.5% |
| $150,000 to $199,999 | 0 | 0.0% |
| $200,000+ | 22 | 19.5% |
Household Income by Householder Age in Amador City
The median household income in Amador City is $63,487, with the highest median household income of $63,971 found in the 25 to 44 years age bracket for the primary householder. A total of 62 households (54.9%) fall into this category.
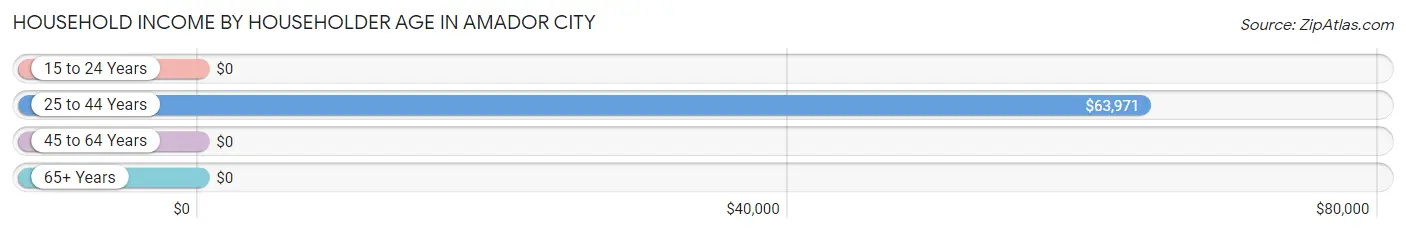
| Income Bracket | # Households | Median Income |
| 15 to 24 Years | 0 (0.0%) | $0 |
| 25 to 44 Years | 62 (54.9%) | $63,971 |
| 45 to 64 Years | 24 (21.2%) | $0 |
| 65+ Years | 27 (23.9%) | $0 |
| Total | 113 (100.0%) | $63,487 |
Poverty in Amador City
Income Below Poverty by Sex and Age in Amador City
With 13.7% poverty level for males and 3.3% for females among the residents of Amador City, 45 to 54 year old males and 65 to 74 year old females are the most vulnerable to poverty, with 8 males (34.8%) and 2 females (15.4%) in their respective age groups living below the poverty level.
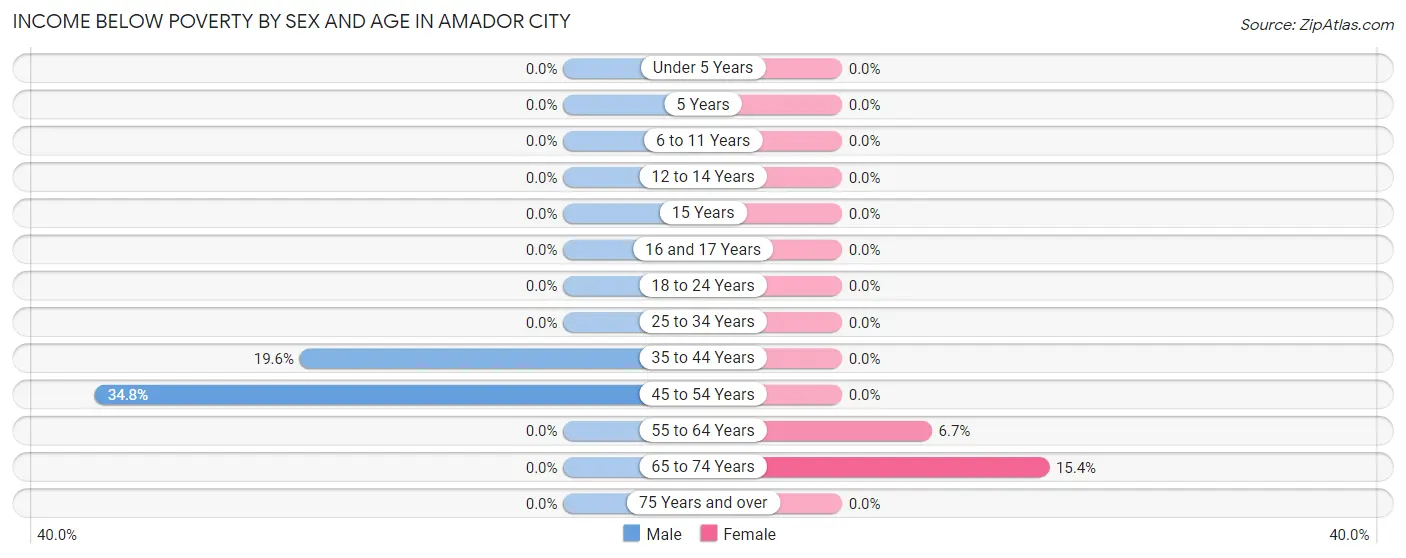
| Age Bracket | Male | Female |
| Under 5 Years | 0 (0.0%) | 0 (0.0%) |
| 5 Years | 0 (0.0%) | 0 (0.0%) |
| 6 to 11 Years | 0 (0.0%) | 0 (0.0%) |
| 12 to 14 Years | 0 (0.0%) | 0 (0.0%) |
| 15 Years | 0 (0.0%) | 0 (0.0%) |
| 16 and 17 Years | 0 (0.0%) | 0 (0.0%) |
| 18 to 24 Years | 0 (0.0%) | 0 (0.0%) |
| 25 to 34 Years | 0 (0.0%) | 0 (0.0%) |
| 35 to 44 Years | 9 (19.6%) | 0 (0.0%) |
| 45 to 54 Years | 8 (34.8%) | 0 (0.0%) |
| 55 to 64 Years | 0 (0.0%) | 1 (6.7%) |
| 65 to 74 Years | 0 (0.0%) | 2 (15.4%) |
| 75 Years and over | 0 (0.0%) | 0 (0.0%) |
| Total | 17 (13.7%) | 3 (3.3%) |
Income Above Poverty by Sex and Age in Amador City
According to the poverty statistics in Amador City, males aged 5 years and females aged under 5 years are the age groups that are most secure financially, with 100.0% of males and 100.0% of females in these age groups living above the poverty line.
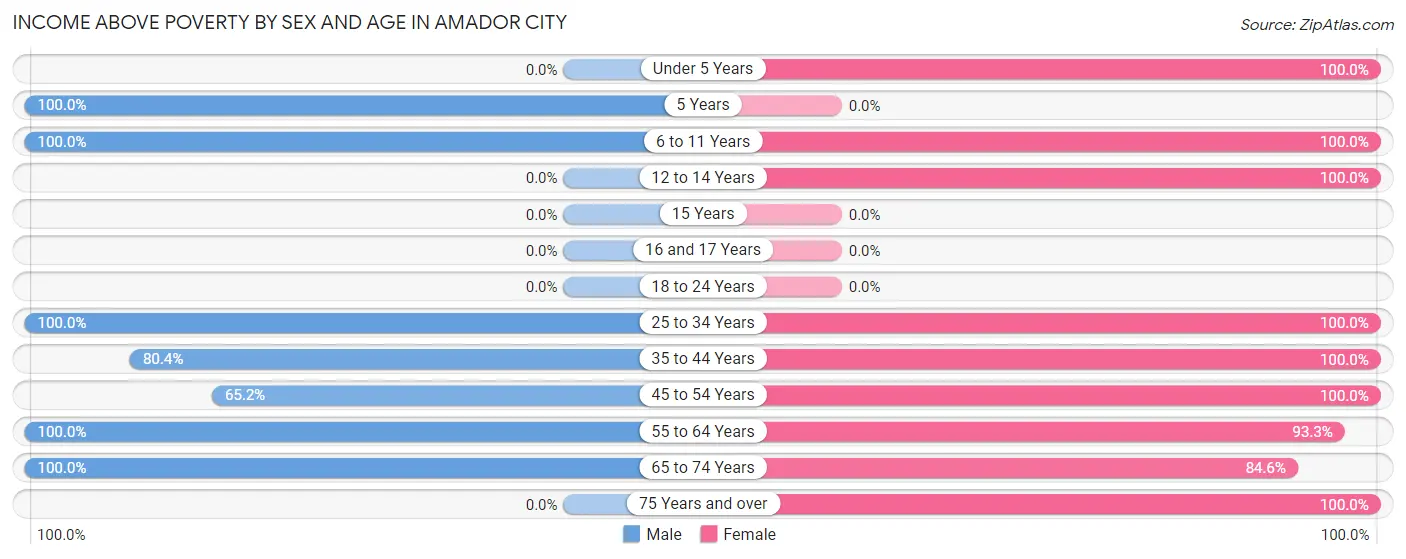
| Age Bracket | Male | Female |
| Under 5 Years | 0 (0.0%) | 4 (100.0%) |
| 5 Years | 7 (100.0%) | 0 (0.0%) |
| 6 to 11 Years | 7 (100.0%) | 7 (100.0%) |
| 12 to 14 Years | 0 (0.0%) | 4 (100.0%) |
| 15 Years | 0 (0.0%) | 0 (0.0%) |
| 16 and 17 Years | 0 (0.0%) | 0 (0.0%) |
| 18 to 24 Years | 0 (0.0%) | 0 (0.0%) |
| 25 to 34 Years | 16 (100.0%) | 29 (100.0%) |
| 35 to 44 Years | 37 (80.4%) | 13 (100.0%) |
| 45 to 54 Years | 15 (65.2%) | 4 (100.0%) |
| 55 to 64 Years | 11 (100.0%) | 14 (93.3%) |
| 65 to 74 Years | 14 (100.0%) | 11 (84.6%) |
| 75 Years and over | 0 (0.0%) | 2 (100.0%) |
| Total | 107 (86.3%) | 88 (96.7%) |
Income Below Poverty Among Married-Couple Families in Amador City
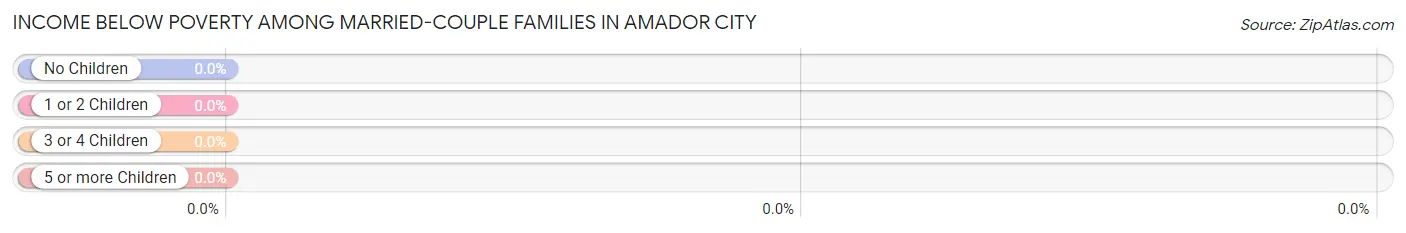
| Children | Above Poverty | Below Poverty |
| No Children | 25 (100.0%) | 0 (0.0%) |
| 1 or 2 Children | 17 (100.0%) | 0 (0.0%) |
| 3 or 4 Children | 0 (0.0%) | 0 (0.0%) |
| 5 or more Children | 0 (0.0%) | 0 (0.0%) |
| Total | 42 (100.0%) | 0 (0.0%) |
Income Below Poverty Among Single-Parent Households in Amador City
| Children | Single Father | Single Mother |
| No Children | 0 (0.0%) | 0 (0.0%) |
| 1 or 2 Children | 0 (0.0%) | 0 (0.0%) |
| 3 or 4 Children | 0 (0.0%) | 0 (0.0%) |
| 5 or more Children | 0 (0.0%) | 0 (0.0%) |
| Total | 0 (0.0%) | 0 (0.0%) |
Income Below Poverty Among Married-Couple vs Single-Parent Households in Amador City
| Children | Married-Couple Families | Single-Parent Households |
| No Children | 0 (0.0%) | 0 (0.0%) |
| 1 or 2 Children | 0 (0.0%) | 0 (0.0%) |
| 3 or 4 Children | 0 (0.0%) | 0 (0.0%) |
| 5 or more Children | 0 (0.0%) | 0 (0.0%) |
| Total | 0 (0.0%) | 0 (0.0%) |
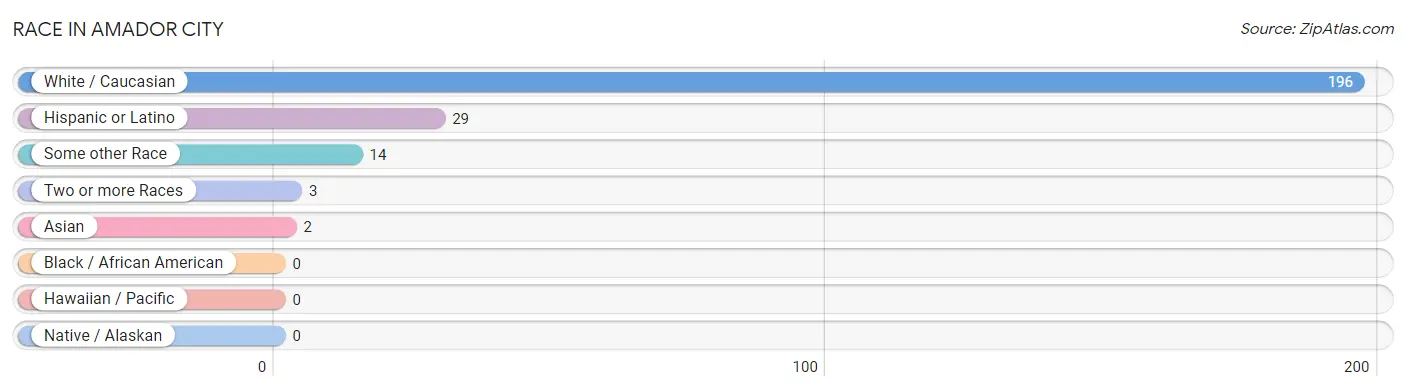
Race in Amador City
The most populous races in Amador City are White / Caucasian (196 | 91.2%), Hispanic or Latino (29 | 13.5%), and Some other Race (14 | 6.5%).
| Race | # Population | % Population |
| Asian | 2 | 0.9% |
| Black / African American | 0 | 0.0% |
| Hawaiian / Pacific | 0 | 0.0% |
| Hispanic or Latino | 29 | 13.5% |
| Native / Alaskan | 0 | 0.0% |
| White / Caucasian | 196 | 91.2% |
| Two or more Races | 3 | 1.4% |
| Some other Race | 14 | 6.5% |
| Total | 215 | 100.0% |
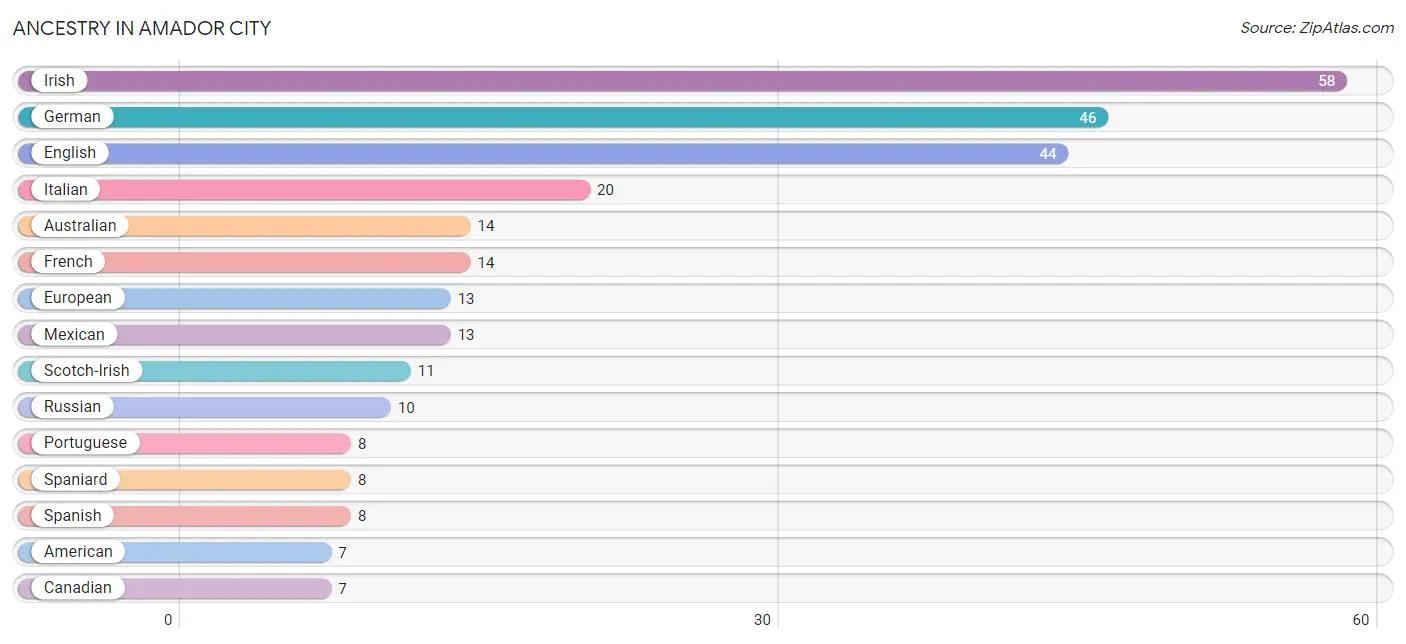
Ancestry in Amador City
The most populous ancestries reported in Amador City are Irish (58 | 27.0%), German (46 | 21.4%), English (44 | 20.5%), Italian (20 | 9.3%), and Australian (14 | 6.5%), together accounting for 84.7% of all Amador City residents.
| Ancestry | # Population | % Population |
| American | 7 | 3.3% |
| Australian | 14 | 6.5% |
| British | 2 | 0.9% |
| Canadian | 7 | 3.3% |
| Croatian | 2 | 0.9% |
| Czechoslovakian | 2 | 0.9% |
| English | 44 | 20.5% |
| European | 13 | 6.0% |
| French | 14 | 6.5% |
| French Canadian | 2 | 0.9% |
| German | 46 | 21.4% |
| Indian (Asian) | 2 | 0.9% |
| Irish | 58 | 27.0% |
| Italian | 20 | 9.3% |
| Mexican | 13 | 6.0% |
| Norwegian | 7 | 3.3% |
| Polish | 6 | 2.8% |
| Portuguese | 8 | 3.7% |
| Russian | 10 | 4.6% |
| Scandinavian | 5 | 2.3% |
| Scotch-Irish | 11 | 5.1% |
| Scottish | 1 | 0.5% |
| Spaniard | 8 | 3.7% |
| Spanish | 8 | 3.7% |
| Swedish | 2 | 0.9% | View All 25 Rows |
Immigrants in Amador City
The most numerous immigrant groups reported in Amador City came from Australia (7 | 3.3%), Oceania (7 | 3.3%), Asia (2 | 0.9%), Lebanon (2 | 0.9%), and Western Asia (2 | 0.9%), together accounting for 9.3% of all Amador City residents.
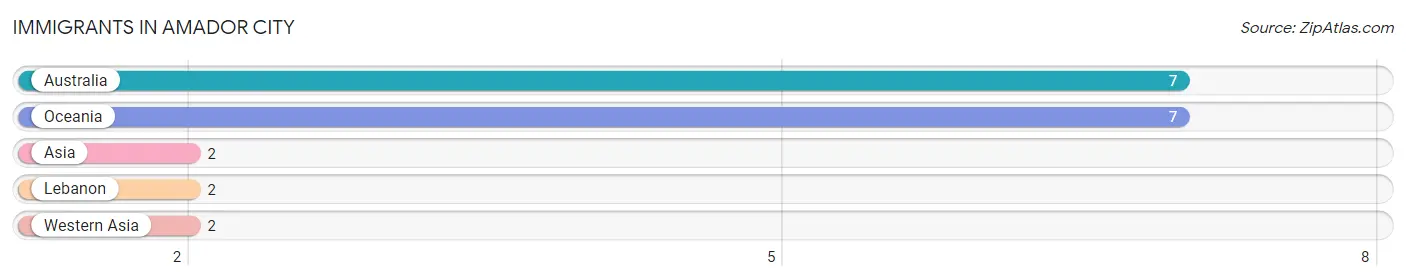
| Immigration Origin | # Population | % Population |
| Asia | 2 | 0.9% |
| Australia | 7 | 3.3% |
| Lebanon | 2 | 0.9% |
| Oceania | 7 | 3.3% |
| Western Asia | 2 | 0.9% | View All 5 Rows |
Sex and Age in Amador City
Sex and Age in Amador City
The most populous age groups in Amador City are 35 to 39 Years (36 | 29.0%) for men and 30 to 34 Years (19 | 20.9%) for women.
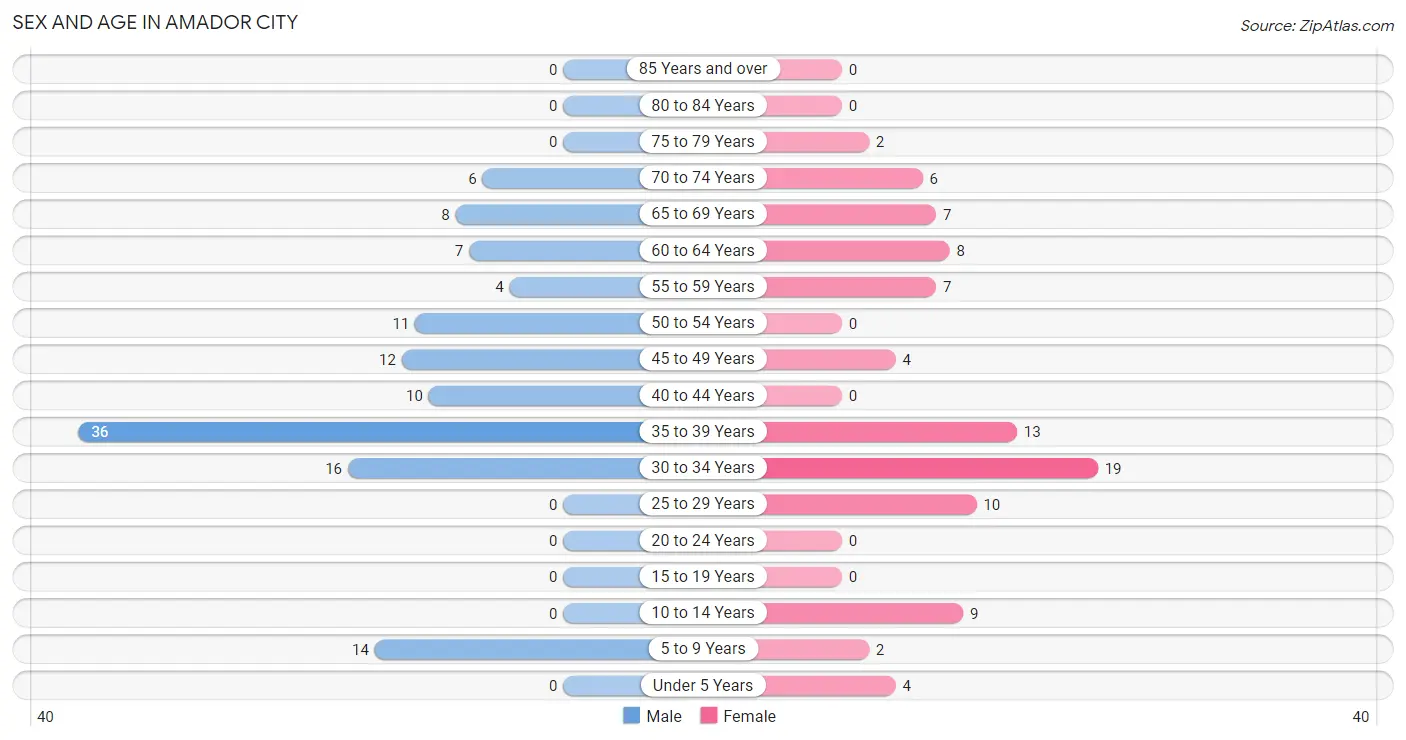
| Age Bracket | Male | Female |
| Under 5 Years | 0 (0.0%) | 4 (4.4%) |
| 5 to 9 Years | 14 (11.3%) | 2 (2.2%) |
| 10 to 14 Years | 0 (0.0%) | 9 (9.9%) |
| 15 to 19 Years | 0 (0.0%) | 0 (0.0%) |
| 20 to 24 Years | 0 (0.0%) | 0 (0.0%) |
| 25 to 29 Years | 0 (0.0%) | 10 (11.0%) |
| 30 to 34 Years | 16 (12.9%) | 19 (20.9%) |
| 35 to 39 Years | 36 (29.0%) | 13 (14.3%) |
| 40 to 44 Years | 10 (8.1%) | 0 (0.0%) |
| 45 to 49 Years | 12 (9.7%) | 4 (4.4%) |
| 50 to 54 Years | 11 (8.9%) | 0 (0.0%) |
| 55 to 59 Years | 4 (3.2%) | 7 (7.7%) |
| 60 to 64 Years | 7 (5.7%) | 8 (8.8%) |
| 65 to 69 Years | 8 (6.5%) | 7 (7.7%) |
| 70 to 74 Years | 6 (4.8%) | 6 (6.6%) |
| 75 to 79 Years | 0 (0.0%) | 2 (2.2%) |
| 80 to 84 Years | 0 (0.0%) | 0 (0.0%) |
| 85 Years and over | 0 (0.0%) | 0 (0.0%) |
| Total | 124 (100.0%) | 91 (100.0%) |
Families and Households in Amador City
Median Family Size in Amador City
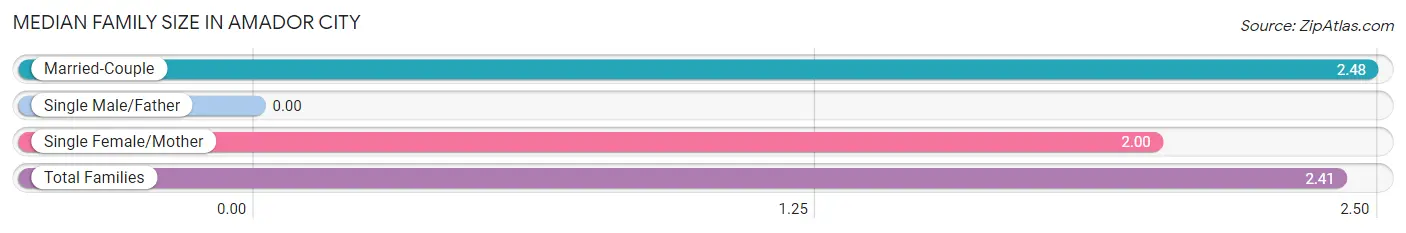
| Family Type | # Families | Family Size |
| Married-Couple | 42 (85.7%) | 2.48 |
| Single Male/Father | 0 (0.0%) | - |
| Single Female/Mother | 7 (14.3%) | 2.00 |
| Total Families | 49 (100.0%) | 2.41 |
Median Household Size in Amador City
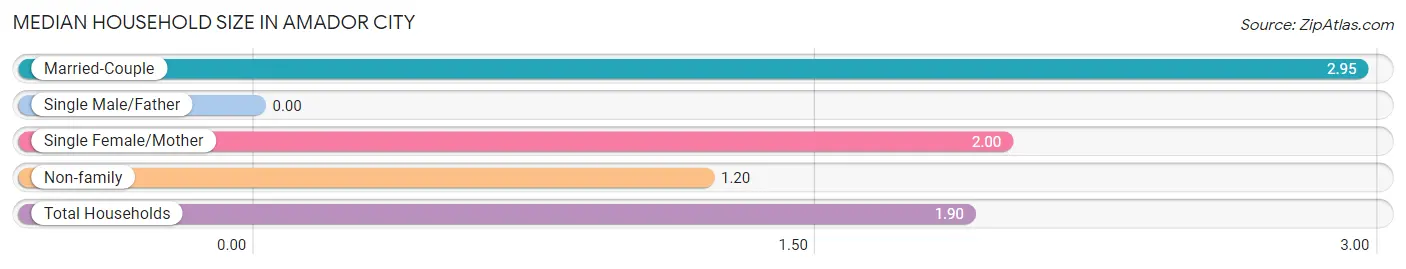
| Household Type | # Households | Household Size |
| Married-Couple | 42 (37.2%) | 2.95 |
| Single Male/Father | 0 (0.0%) | - |
| Single Female/Mother | 7 (6.2%) | 2.00 |
| Non-family | 64 (56.6%) | 1.20 |
| Total Households | 113 (100.0%) | 1.90 |
Household Size by Marriage Status in Amador City
Out of a total of 113 households in Amador City, 49 (43.4%) are family households, while 64 (56.6%) are nonfamily households. The most numerous type of family households are 2-person households, comprising 22, and the most common type of nonfamily households are 1-person households, comprising 59.
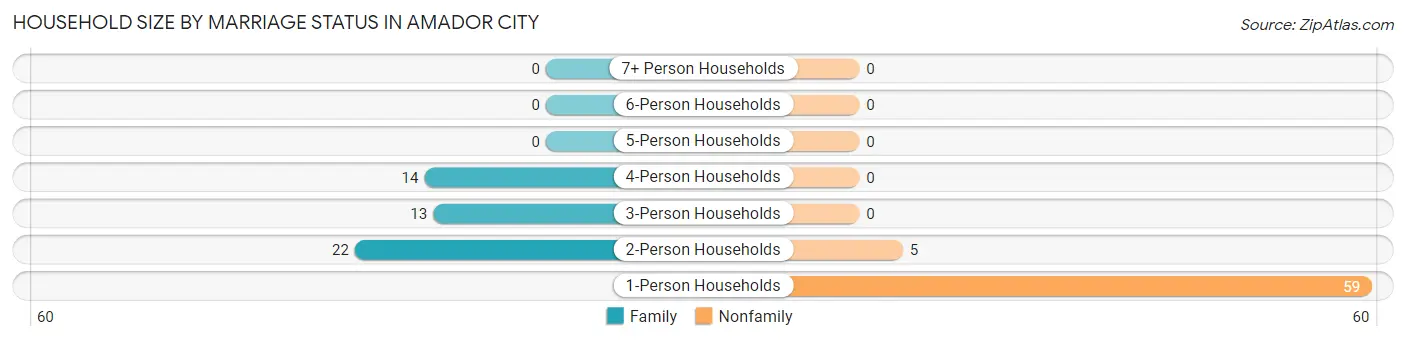
| Household Size | Family Households | Nonfamily Households |
| 1-Person Households | - | 59 (52.2%) |
| 2-Person Households | 22 (19.5%) | 5 (4.4%) |
| 3-Person Households | 13 (11.5%) | 0 (0.0%) |
| 4-Person Households | 14 (12.4%) | 0 (0.0%) |
| 5-Person Households | 0 (0.0%) | 0 (0.0%) |
| 6-Person Households | 0 (0.0%) | 0 (0.0%) |
| 7+ Person Households | 0 (0.0%) | 0 (0.0%) |
| Total | 49 (43.4%) | 64 (56.6%) |
Female Fertility in Amador City
Fertility by Age in Amador City

| Age Bracket | Women with Births | Births / 1,000 Women |
| 15 to 19 years | 0 (0.0%) | 0.0 |
| 20 to 34 years | 0 (0.0%) | 0.0 |
| 35 to 50 years | 0 (0.0%) | 0.0 |
| Total | 0 (0.0%) | 0.0 |
Fertility by Age by Marriage Status in Amador City
| Age Bracket | Married | Unmarried |
| 15 to 19 years | 0 (0.0%) | 0 (0.0%) |
| 20 to 34 years | 0 (0.0%) | 0 (0.0%) |
| 35 to 50 years | 0 (0.0%) | 0 (0.0%) |
| Total | 0 (0.0%) | 0 (0.0%) |
Fertility by Education in Amador City
| Educational Attainment | Women with Births | Births / 1,000 Women |
| Less than High School | 0 (0.0%) | 0.0 |
| High School Diploma | 0 (0.0%) | 0.0 |
| College or Associate's Degree | 0 (0.0%) | 0.0 |
| Bachelor's Degree | 0 (0.0%) | 0.0 |
| Graduate Degree | 0 (0.0%) | 0.0 |
| Total | 0 (0.0%) | 0.0 |
Fertility by Education by Marriage Status in Amador City
| Educational Attainment | Married | Unmarried |
| Less than High School | 0 (0.0%) | 0 (0.0%) |
| High School Diploma | 0 (0.0%) | 0 (0.0%) |
| College or Associate's Degree | 0 (0.0%) | 0 (0.0%) |
| Bachelor's Degree | 0 (0.0%) | 0 (0.0%) |
| Graduate Degree | 0 (0.0%) | 0 (0.0%) |
| Total | 0 (0.0%) | 0 (0.0%) |
Employment Characteristics in Amador City
Employment by Class of Employer in Amador City
Among the 130 employed individuals in Amador City, private company employees (90 | 69.2%), local government employees (15 | 11.5%), and self-employed (not incorporated) (14 | 10.8%) make up the most common classes of employment.
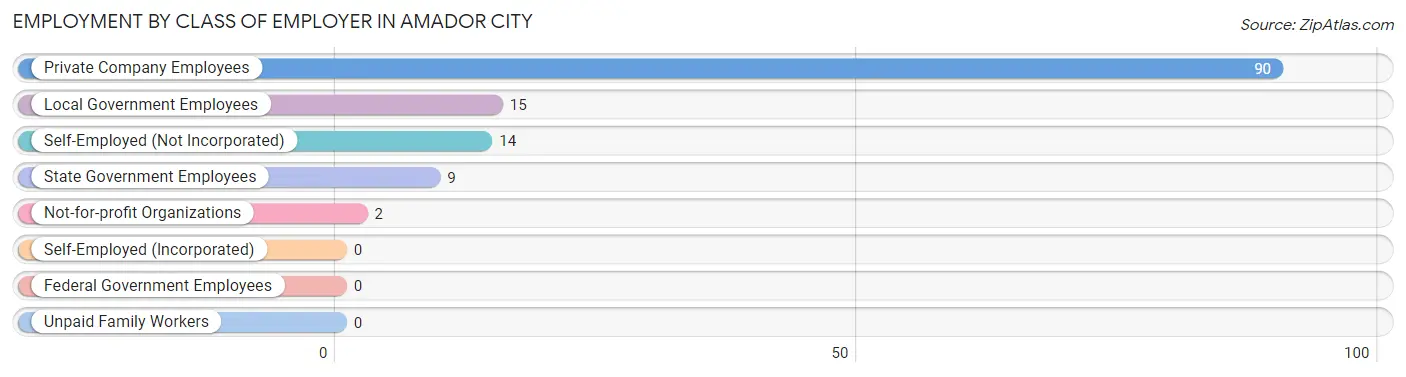
| Employer Class | # Employees | % Employees |
| Private Company Employees | 90 | 69.2% |
| Self-Employed (Incorporated) | 0 | 0.0% |
| Self-Employed (Not Incorporated) | 14 | 10.8% |
| Not-for-profit Organizations | 2 | 1.5% |
| Local Government Employees | 15 | 11.5% |
| State Government Employees | 9 | 6.9% |
| Federal Government Employees | 0 | 0.0% |
| Unpaid Family Workers | 0 | 0.0% |
| Total | 130 | 100.0% |
Employment Status by Age in Amador City
According to the labor force statistics for Amador City, out of the total population over 16 years of age (186), 75.8% or 141 individuals are in the labor force, with 7.8% or 11 of them unemployed. The age group with the highest labor force participation rate is 25 to 29 years, with 100.0% or 10 individuals in the labor force. Within the labor force, the 45 to 54 years age range has the highest percentage of unemployed individuals, with 29.6% or 8 of them being unemployed.
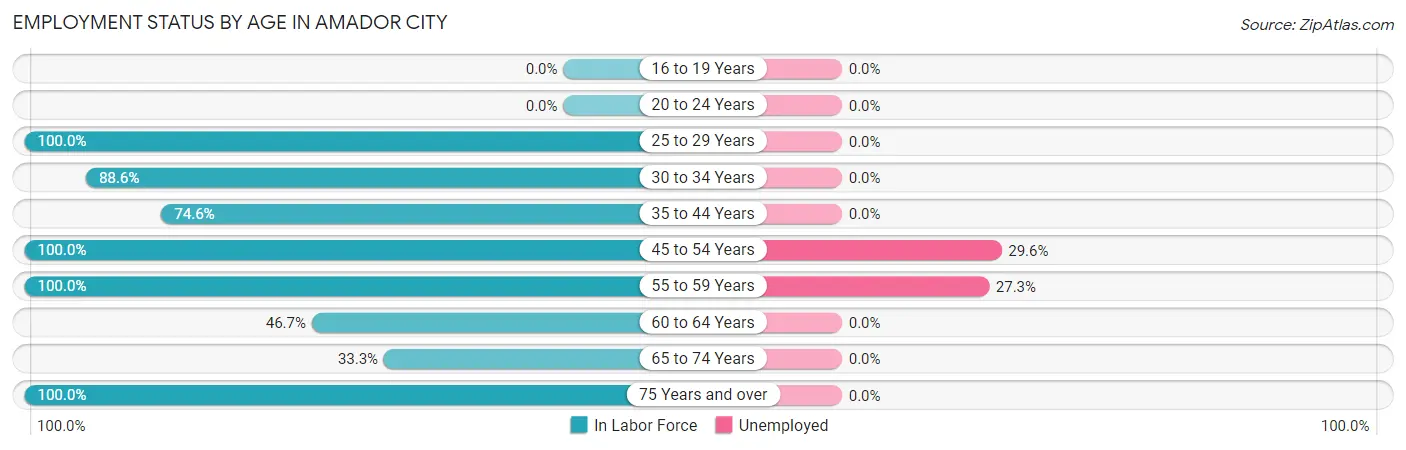
| Age Bracket | In Labor Force | Unemployed |
| 16 to 19 Years | 0 (0.0%) | 0 (0.0%) |
| 20 to 24 Years | 0 (0.0%) | 0 (0.0%) |
| 25 to 29 Years | 10 (100.0%) | 0 (0.0%) |
| 30 to 34 Years | 31 (88.6%) | 0 (0.0%) |
| 35 to 44 Years | 44 (74.6%) | 0 (0.0%) |
| 45 to 54 Years | 27 (100.0%) | 8 (29.6%) |
| 55 to 59 Years | 11 (100.0%) | 3 (27.3%) |
| 60 to 64 Years | 7 (46.7%) | 0 (0.0%) |
| 65 to 74 Years | 9 (33.3%) | 0 (0.0%) |
| 75 Years and over | 2 (100.0%) | 0 (0.0%) |
| Total | 141 (75.8%) | 11 (7.8%) |
Employment Status by Educational Attainment in Amador City
According to labor force statistics for Amador City, 82.8% of individuals (130) out of the total population between 25 and 64 years of age (157) are in the labor force, with 8.5% or 11 of them being unemployed. The group with the highest labor force participation rate are those with the educational attainment of college / associate degree, with 96.7% or 59 individuals in the labor force. Within the labor force, individuals with bachelor's degree or higher education have the highest percentage of unemployment, with 16.0% or 8 of them being unemployed.
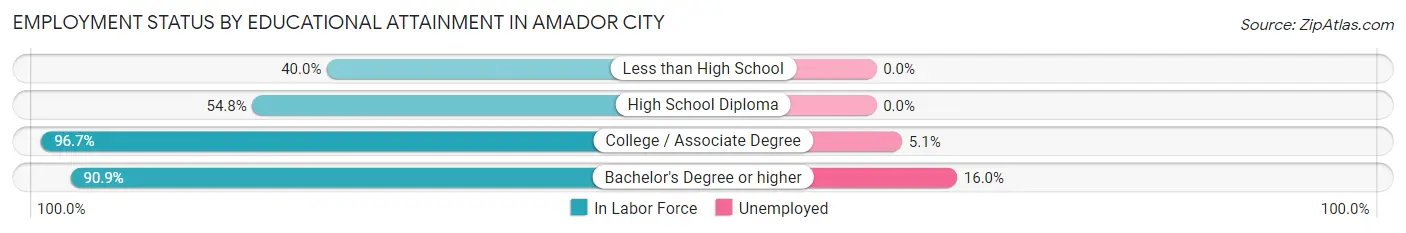
| Educational Attainment | In Labor Force | Unemployed |
| Less than High School | 4 (40.0%) | 0 (0.0%) |
| High School Diploma | 17 (54.8%) | 0 (0.0%) |
| College / Associate Degree | 59 (96.7%) | 3 (5.1%) |
| Bachelor's Degree or higher | 50 (90.9%) | 9 (16.0%) |
| Total | 130 (82.8%) | 13 (8.5%) |
Employment Occupations by Sex in Amador City
Management, Business, Science and Arts Occupations
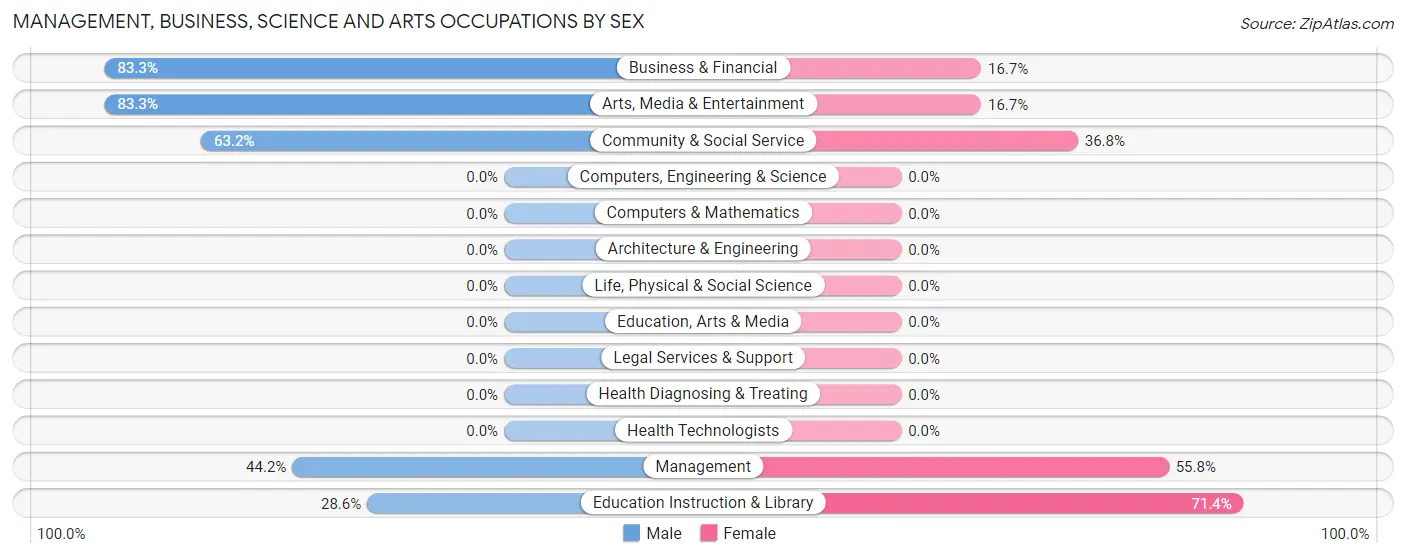
The most common Management, Business, Science and Arts occupations in Amador City are Management (43 | 33.1%), Community & Social Service (19 | 14.6%), Business & Financial (12 | 9.2%), Arts, Media & Entertainment (12 | 9.2%), and Education Instruction & Library (7 | 5.4%).
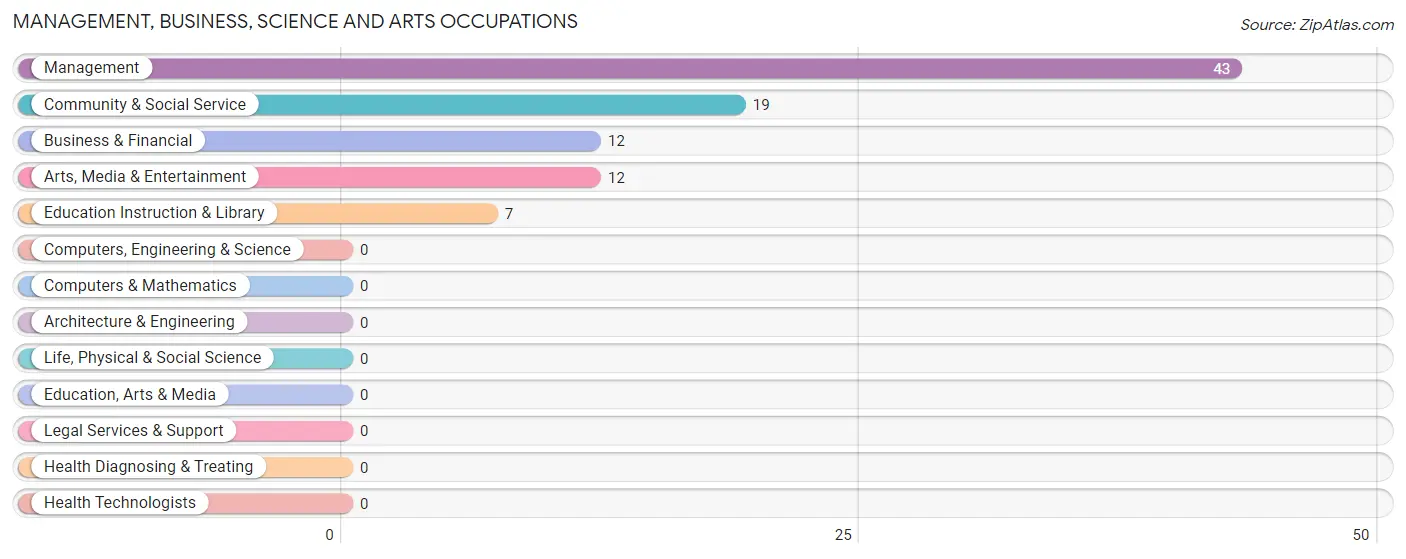
Management, Business, Science and Arts Occupations by Sex
Within the Management, Business, Science and Arts occupations in Amador City, the most male-oriented occupations are Business & Financial (83.3%), Arts, Media & Entertainment (83.3%), and Community & Social Service (63.2%), while the most female-oriented occupations are Education Instruction & Library (71.4%), Management (55.8%), and Community & Social Service (36.8%).
| Occupation | Male | Female |
| Management | 19 (44.2%) | 24 (55.8%) |
| Business & Financial | 10 (83.3%) | 2 (16.7%) |
| Computers, Engineering & Science | 0 (0.0%) | 0 (0.0%) |
| Computers & Mathematics | 0 (0.0%) | 0 (0.0%) |
| Architecture & Engineering | 0 (0.0%) | 0 (0.0%) |
| Life, Physical & Social Science | 0 (0.0%) | 0 (0.0%) |
| Community & Social Service | 12 (63.2%) | 7 (36.8%) |
| Education, Arts & Media | 0 (0.0%) | 0 (0.0%) |
| Legal Services & Support | 0 (0.0%) | 0 (0.0%) |
| Education Instruction & Library | 2 (28.6%) | 5 (71.4%) |
| Arts, Media & Entertainment | 10 (83.3%) | 2 (16.7%) |
| Health Diagnosing & Treating | 0 (0.0%) | 0 (0.0%) |
| Health Technologists | 0 (0.0%) | 0 (0.0%) |
| Total (Category) | 41 (55.4%) | 33 (44.6%) |
| Total (Overall) | 77 (59.2%) | 53 (40.8%) |
Services Occupations
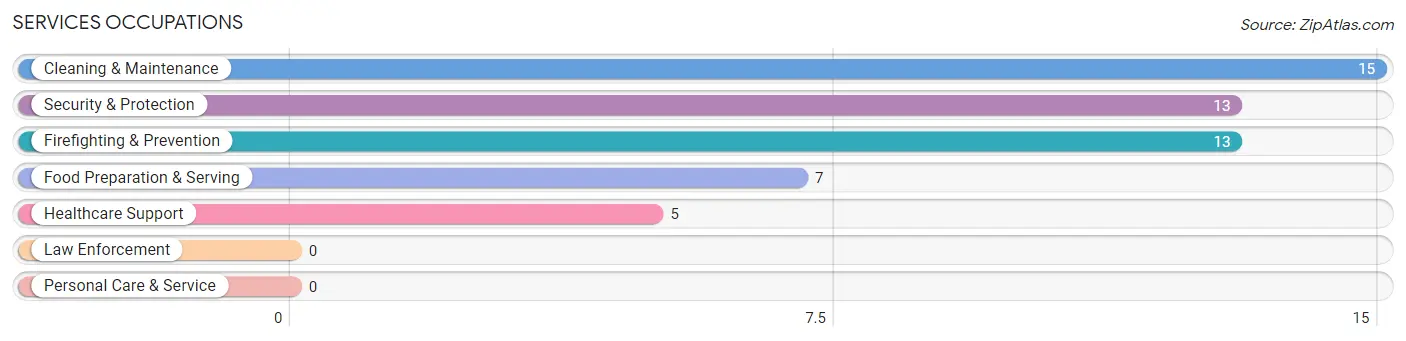
The most common Services occupations in Amador City are Cleaning & Maintenance (15 | 11.5%), Security & Protection (13 | 10.0%), Firefighting & Prevention (13 | 10.0%), Food Preparation & Serving (7 | 5.4%), and Healthcare Support (5 | 3.8%).
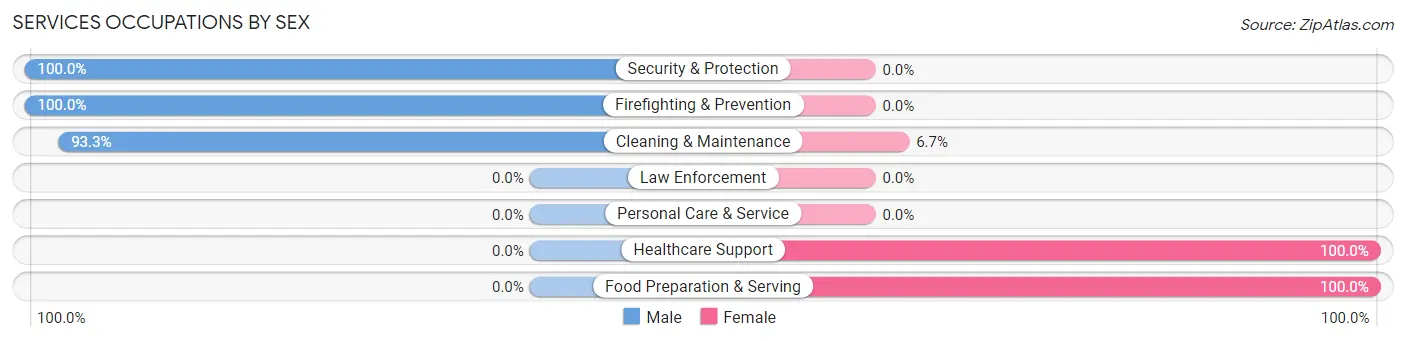
Services Occupations by Sex
Within the Services occupations in Amador City, the most male-oriented occupations are Security & Protection (100.0%), Firefighting & Prevention (100.0%), and Cleaning & Maintenance (93.3%), while the most female-oriented occupations are Healthcare Support (100.0%), Food Preparation & Serving (100.0%), and Cleaning & Maintenance (6.7%).
| Occupation | Male | Female |
| Healthcare Support | 0 (0.0%) | 5 (100.0%) |
| Security & Protection | 13 (100.0%) | 0 (0.0%) |
| Firefighting & Prevention | 13 (100.0%) | 0 (0.0%) |
| Law Enforcement | 0 (0.0%) | 0 (0.0%) |
| Food Preparation & Serving | 0 (0.0%) | 7 (100.0%) |
| Cleaning & Maintenance | 14 (93.3%) | 1 (6.7%) |
| Personal Care & Service | 0 (0.0%) | 0 (0.0%) |
| Total (Category) | 27 (67.5%) | 13 (32.5%) |
| Total (Overall) | 77 (59.2%) | 53 (40.8%) |
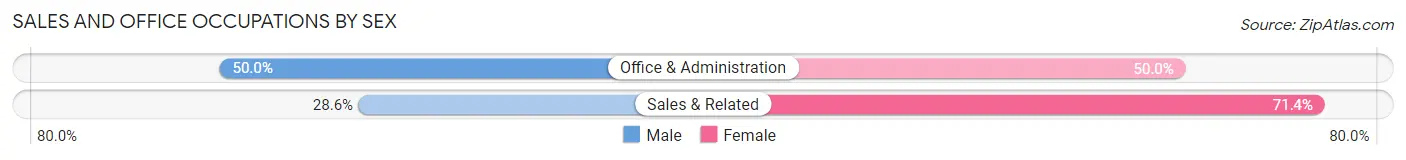
Sales and Office Occupations
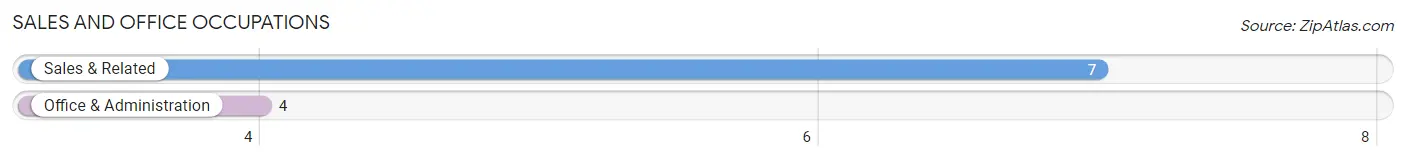
The most common Sales and Office occupations in Amador City are Sales & Related (7 | 5.4%), and Office & Administration (4 | 3.1%).
Sales and Office Occupations by Sex
| Occupation | Male | Female |
| Sales & Related | 2 (28.6%) | 5 (71.4%) |
| Office & Administration | 2 (50.0%) | 2 (50.0%) |
| Total (Category) | 4 (36.4%) | 7 (63.6%) |
| Total (Overall) | 77 (59.2%) | 53 (40.8%) |
Natural Resources, Construction and Maintenance Occupations
Natural Resources, Construction and Maintenance Occupations by Sex
| Occupation | Male | Female |
| Farming, Fishing & Forestry | 0 (0.0%) | 0 (0.0%) |
| Construction & Extraction | 0 (0.0%) | 0 (0.0%) |
| Installation, Maintenance & Repair | 0 (0.0%) | 0 (0.0%) |
| Total (Category) | 0 (0.0%) | 0 (0.0%) |
| Total (Overall) | 77 (59.2%) | 53 (40.8%) |
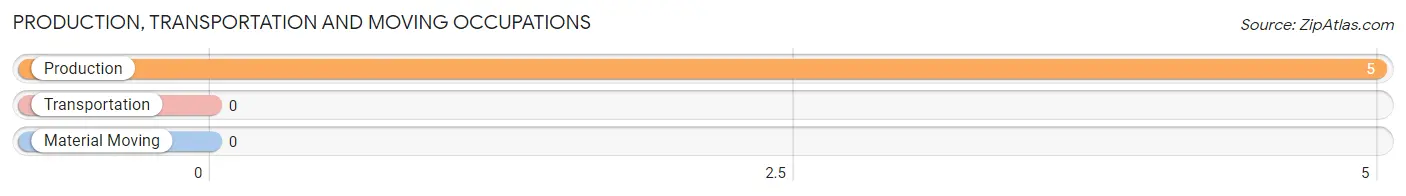
Production, Transportation and Moving Occupations
The most common Production, Transportation and Moving occupations in Amador City are , and Production (5 | 3.8%).
Production, Transportation and Moving Occupations by Sex
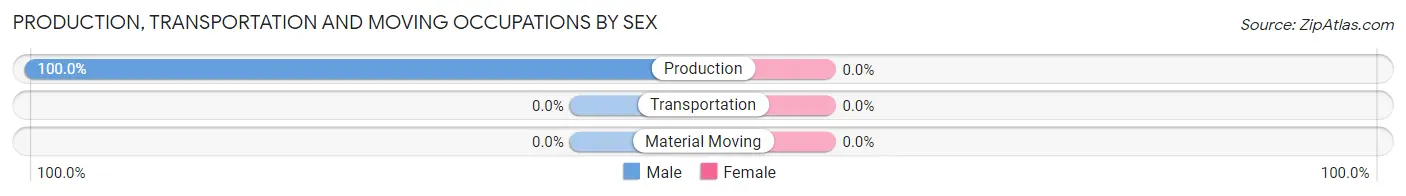
| Occupation | Male | Female |
| Production | 5 (100.0%) | 0 (0.0%) |
| Transportation | 0 (0.0%) | 0 (0.0%) |
| Material Moving | 0 (0.0%) | 0 (0.0%) |
| Total (Category) | 5 (100.0%) | 0 (0.0%) |
| Total (Overall) | 77 (59.2%) | 53 (40.8%) |
Employment Industries by Sex in Amador City
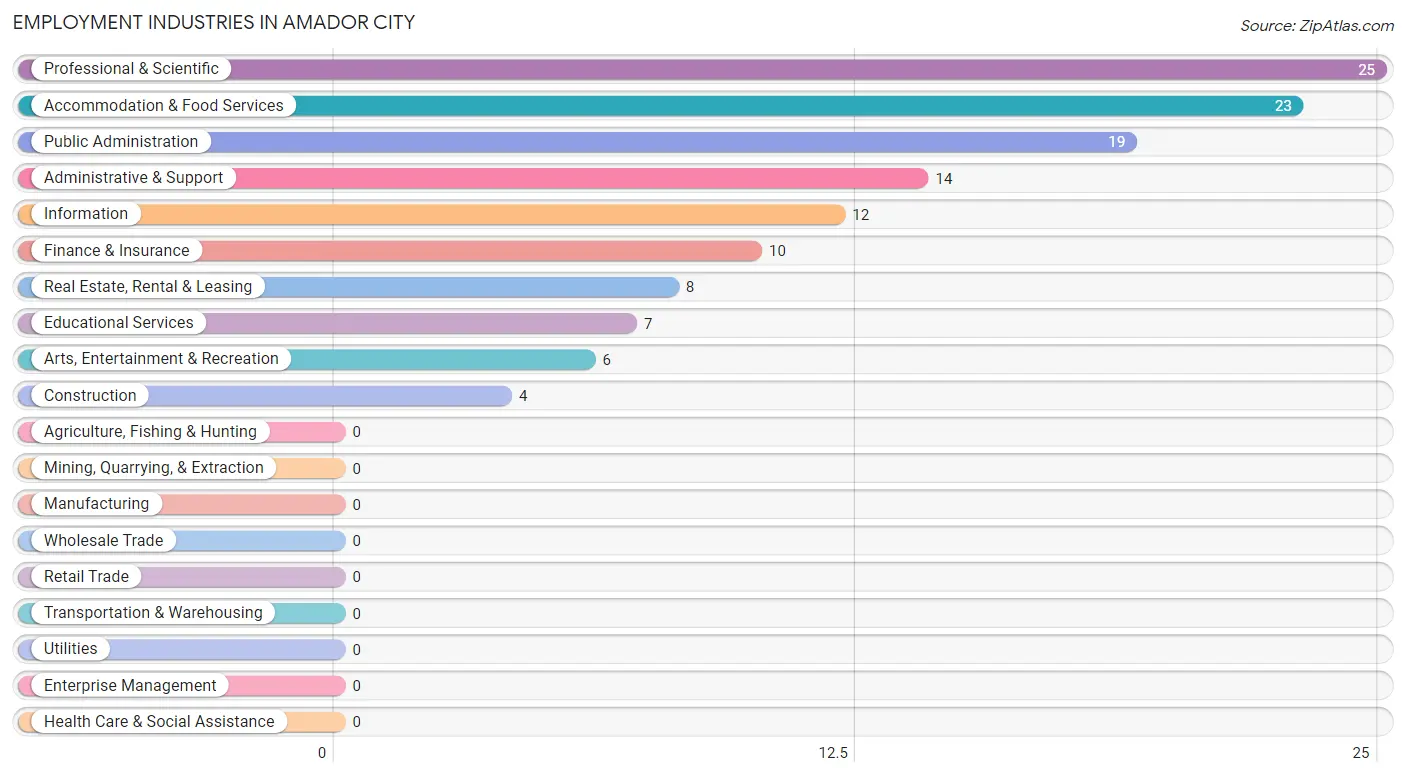
Employment Industries in Amador City
The major employment industries in Amador City include Professional & Scientific (25 | 19.2%), Accommodation & Food Services (23 | 17.7%), Public Administration (19 | 14.6%), Administrative & Support (14 | 10.8%), and Information (12 | 9.2%).
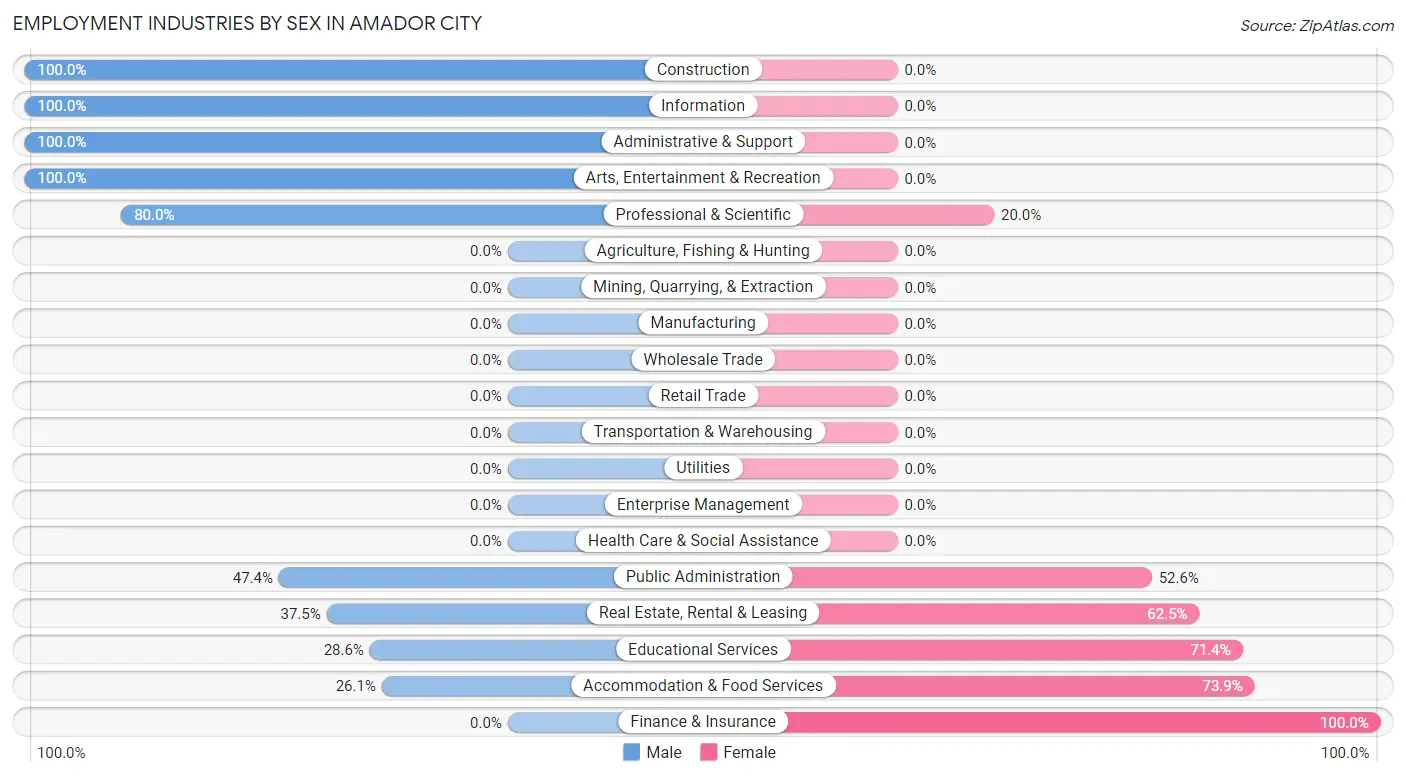
Employment Industries by Sex in Amador City
The Amador City industries that see more men than women are Construction (100.0%), Information (100.0%), and Administrative & Support (100.0%), whereas the industries that tend to have a higher number of women are Finance & Insurance (100.0%), Accommodation & Food Services (73.9%), and Educational Services (71.4%).
| Industry | Male | Female |
| Agriculture, Fishing & Hunting | 0 (0.0%) | 0 (0.0%) |
| Mining, Quarrying, & Extraction | 0 (0.0%) | 0 (0.0%) |
| Construction | 4 (100.0%) | 0 (0.0%) |
| Manufacturing | 0 (0.0%) | 0 (0.0%) |
| Wholesale Trade | 0 (0.0%) | 0 (0.0%) |
| Retail Trade | 0 (0.0%) | 0 (0.0%) |
| Transportation & Warehousing | 0 (0.0%) | 0 (0.0%) |
| Utilities | 0 (0.0%) | 0 (0.0%) |
| Information | 12 (100.0%) | 0 (0.0%) |
| Finance & Insurance | 0 (0.0%) | 10 (100.0%) |
| Real Estate, Rental & Leasing | 3 (37.5%) | 5 (62.5%) |
| Professional & Scientific | 20 (80.0%) | 5 (20.0%) |
| Enterprise Management | 0 (0.0%) | 0 (0.0%) |
| Administrative & Support | 14 (100.0%) | 0 (0.0%) |
| Educational Services | 2 (28.6%) | 5 (71.4%) |
| Health Care & Social Assistance | 0 (0.0%) | 0 (0.0%) |
| Arts, Entertainment & Recreation | 6 (100.0%) | 0 (0.0%) |
| Accommodation & Food Services | 6 (26.1%) | 17 (73.9%) |
| Public Administration | 9 (47.4%) | 10 (52.6%) |
| Total | 77 (59.2%) | 53 (40.8%) |
Education in Amador City
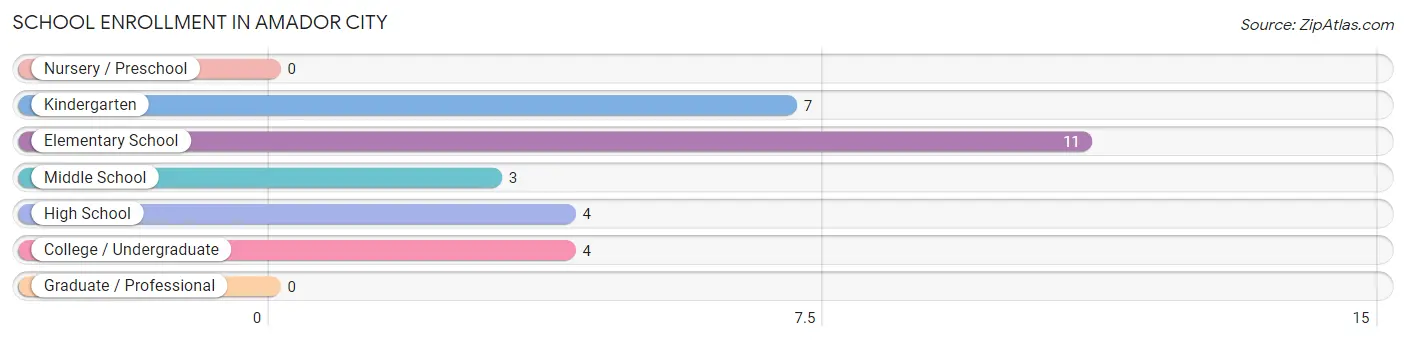
School Enrollment in Amador City
The most common levels of schooling among the 29 students in Amador City are elementary school (11 | 37.9%), kindergarten (7 | 24.1%), and high school (4 | 13.8%).
| School Level | # Students | % Students |
| Nursery / Preschool | 0 | 0.0% |
| Kindergarten | 7 | 24.1% |
| Elementary School | 11 | 37.9% |
| Middle School | 3 | 10.3% |
| High School | 4 | 13.8% |
| College / Undergraduate | 4 | 13.8% |
| Graduate / Professional | 0 | 0.0% |
| Total | 29 | 100.0% |
School Enrollment by Age by Funding Source in Amador City
Out of a total of 29 students who are enrolled in schools in Amador City, 4 (13.8%) attend a private institution, while the remaining 25 (86.2%) are enrolled in public schools. The age group of 35 years and over has the highest likelihood of being enrolled in private schools, with 4 (100.0% in the age bracket) enrolled. Conversely, the age group of 5 to 9 year old has the lowest likelihood of being enrolled in a private school, with 16 (100.0% in the age bracket) attending a public institution.
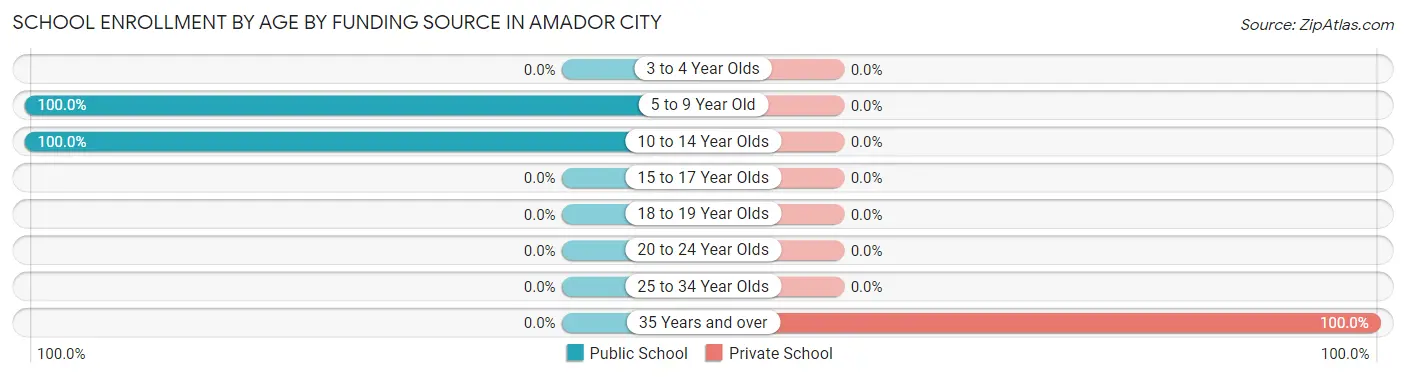
| Age Bracket | Public School | Private School |
| 3 to 4 Year Olds | 0 (0.0%) | 0 (0.0%) |
| 5 to 9 Year Old | 16 (100.0%) | 0 (0.0%) |
| 10 to 14 Year Olds | 9 (100.0%) | 0 (0.0%) |
| 15 to 17 Year Olds | 0 (0.0%) | 0 (0.0%) |
| 18 to 19 Year Olds | 0 (0.0%) | 0 (0.0%) |
| 20 to 24 Year Olds | 0 (0.0%) | 0 (0.0%) |
| 25 to 34 Year Olds | 0 (0.0%) | 0 (0.0%) |
| 35 Years and over | 0 (0.0%) | 4 (100.0%) |
| Total | 25 (86.2%) | 4 (13.8%) |
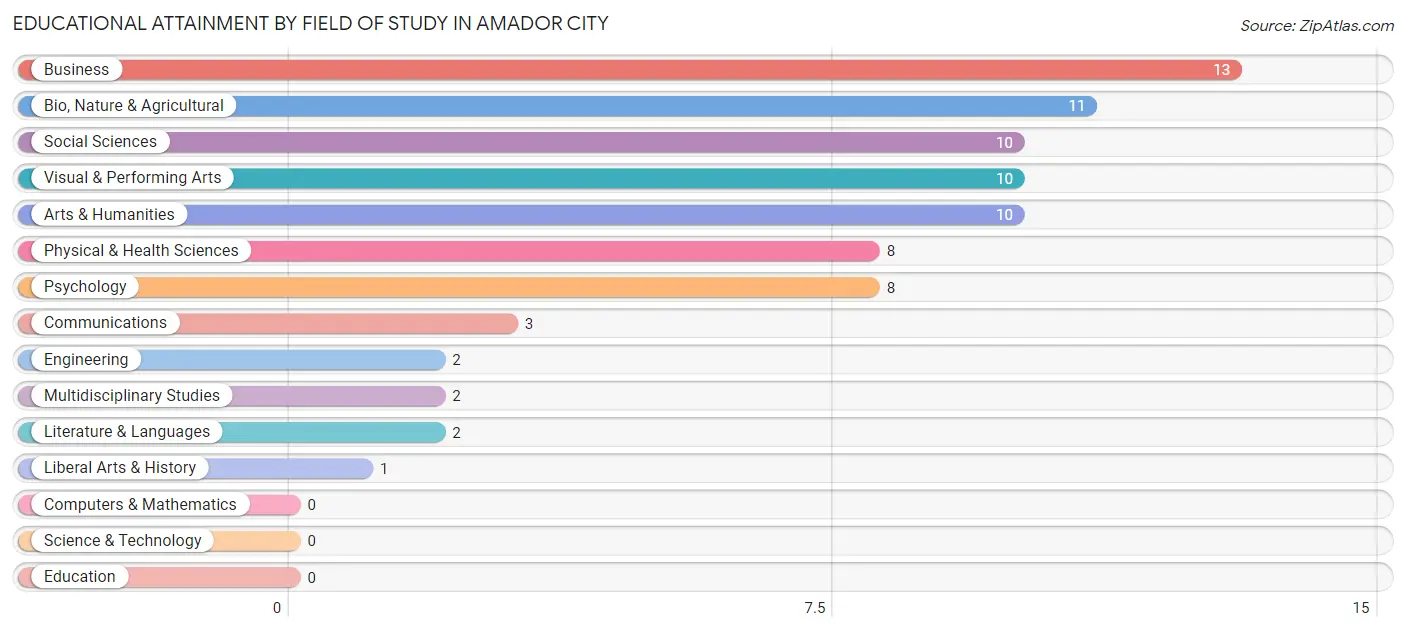
Educational Attainment by Field of Study in Amador City
Business (13 | 16.3%), bio, nature & agricultural (11 | 13.8%), social sciences (10 | 12.5%), visual & performing arts (10 | 12.5%), and arts & humanities (10 | 12.5%) are the most common fields of study among 80 individuals in Amador City who have obtained a bachelor's degree or higher.
| Field of Study | # Graduates | % Graduates |
| Computers & Mathematics | 0 | 0.0% |
| Bio, Nature & Agricultural | 11 | 13.8% |
| Physical & Health Sciences | 8 | 10.0% |
| Psychology | 8 | 10.0% |
| Social Sciences | 10 | 12.5% |
| Engineering | 2 | 2.5% |
| Multidisciplinary Studies | 2 | 2.5% |
| Science & Technology | 0 | 0.0% |
| Business | 13 | 16.3% |
| Education | 0 | 0.0% |
| Literature & Languages | 2 | 2.5% |
| Liberal Arts & History | 1 | 1.3% |
| Visual & Performing Arts | 10 | 12.5% |
| Communications | 3 | 3.7% |
| Arts & Humanities | 10 | 12.5% |
| Total | 80 | 100.0% |
Transportation & Commute in Amador City
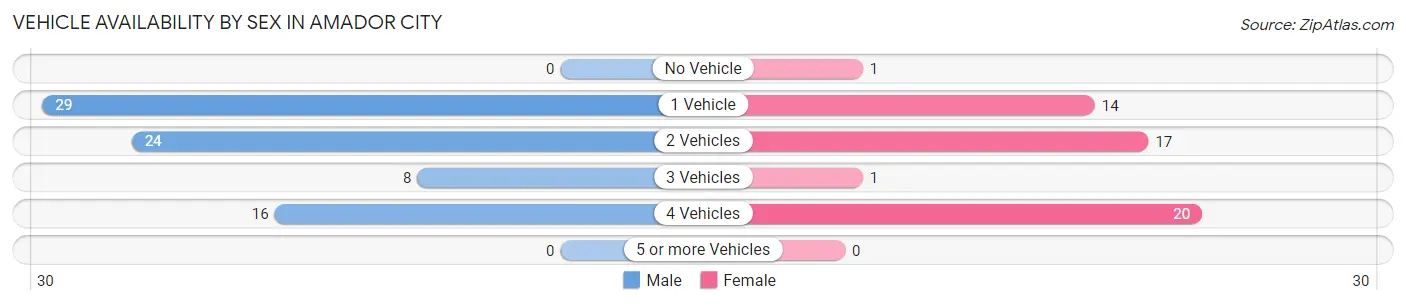
Vehicle Availability by Sex in Amador City
The most prevalent vehicle ownership categories in Amador City are males with 1 vehicle (29, accounting for 37.7%) and females with 1 vehicle (14, making up 54.7%).
| Vehicles Available | Male | Female |
| No Vehicle | 0 (0.0%) | 1 (1.9%) |
| 1 Vehicle | 29 (37.7%) | 14 (26.4%) |
| 2 Vehicles | 24 (31.2%) | 17 (32.1%) |
| 3 Vehicles | 8 (10.4%) | 1 (1.9%) |
| 4 Vehicles | 16 (20.8%) | 20 (37.7%) |
| 5 or more Vehicles | 0 (0.0%) | 0 (0.0%) |
| Total | 77 (100.0%) | 53 (100.0%) |
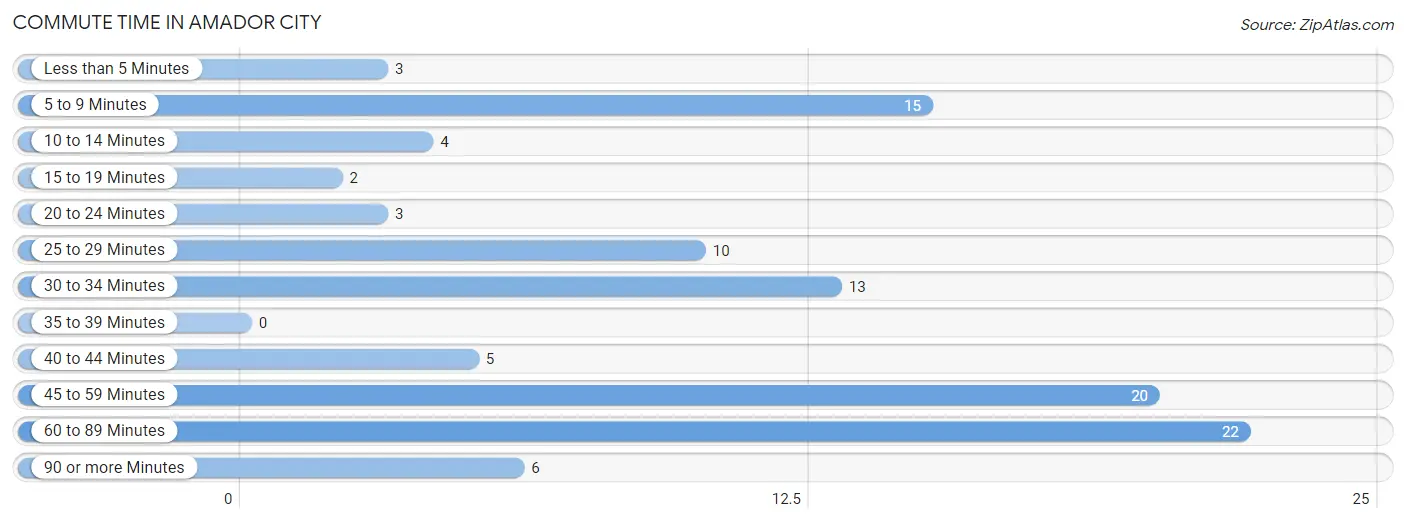
Commute Time in Amador City
The most frequently occuring commute durations in Amador City are 60 to 89 minutes (22 commuters, 21.4%), 45 to 59 minutes (20 commuters, 19.4%), and 5 to 9 minutes (15 commuters, 14.6%).
| Commute Time | # Commuters | % Commuters |
| Less than 5 Minutes | 3 | 2.9% |
| 5 to 9 Minutes | 15 | 14.6% |
| 10 to 14 Minutes | 4 | 3.9% |
| 15 to 19 Minutes | 2 | 1.9% |
| 20 to 24 Minutes | 3 | 2.9% |
| 25 to 29 Minutes | 10 | 9.7% |
| 30 to 34 Minutes | 13 | 12.6% |
| 35 to 39 Minutes | 0 | 0.0% |
| 40 to 44 Minutes | 5 | 4.9% |
| 45 to 59 Minutes | 20 | 19.4% |
| 60 to 89 Minutes | 22 | 21.4% |
| 90 or more Minutes | 6 | 5.8% |
Commute Time by Sex in Amador City
The most common commute times in Amador City are 60 to 89 minutes (20 commuters, 29.8%) for males and 25 to 29 minutes (10 commuters, 27.8%) for females.
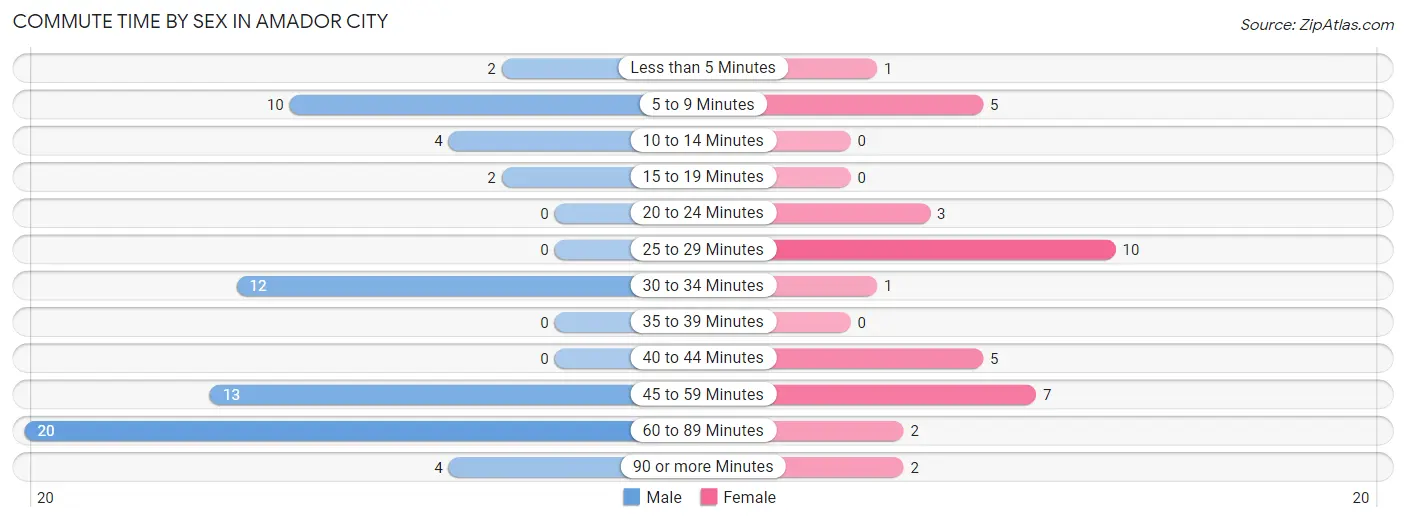
| Commute Time | Male | Female |
| Less than 5 Minutes | 2 (3.0%) | 1 (2.8%) |
| 5 to 9 Minutes | 10 (14.9%) | 5 (13.9%) |
| 10 to 14 Minutes | 4 (6.0%) | 0 (0.0%) |
| 15 to 19 Minutes | 2 (3.0%) | 0 (0.0%) |
| 20 to 24 Minutes | 0 (0.0%) | 3 (8.3%) |
| 25 to 29 Minutes | 0 (0.0%) | 10 (27.8%) |
| 30 to 34 Minutes | 12 (17.9%) | 1 (2.8%) |
| 35 to 39 Minutes | 0 (0.0%) | 0 (0.0%) |
| 40 to 44 Minutes | 0 (0.0%) | 5 (13.9%) |
| 45 to 59 Minutes | 13 (19.4%) | 7 (19.4%) |
| 60 to 89 Minutes | 20 (29.8%) | 2 (5.6%) |
| 90 or more Minutes | 4 (6.0%) | 2 (5.6%) |
Time of Departure to Work by Sex in Amador City
The most frequent times of departure to work in Amador City are 6:00 AM to 6:29 AM (25, 37.3%) for males and 7:30 AM to 7:59 AM (19, 52.8%) for females.
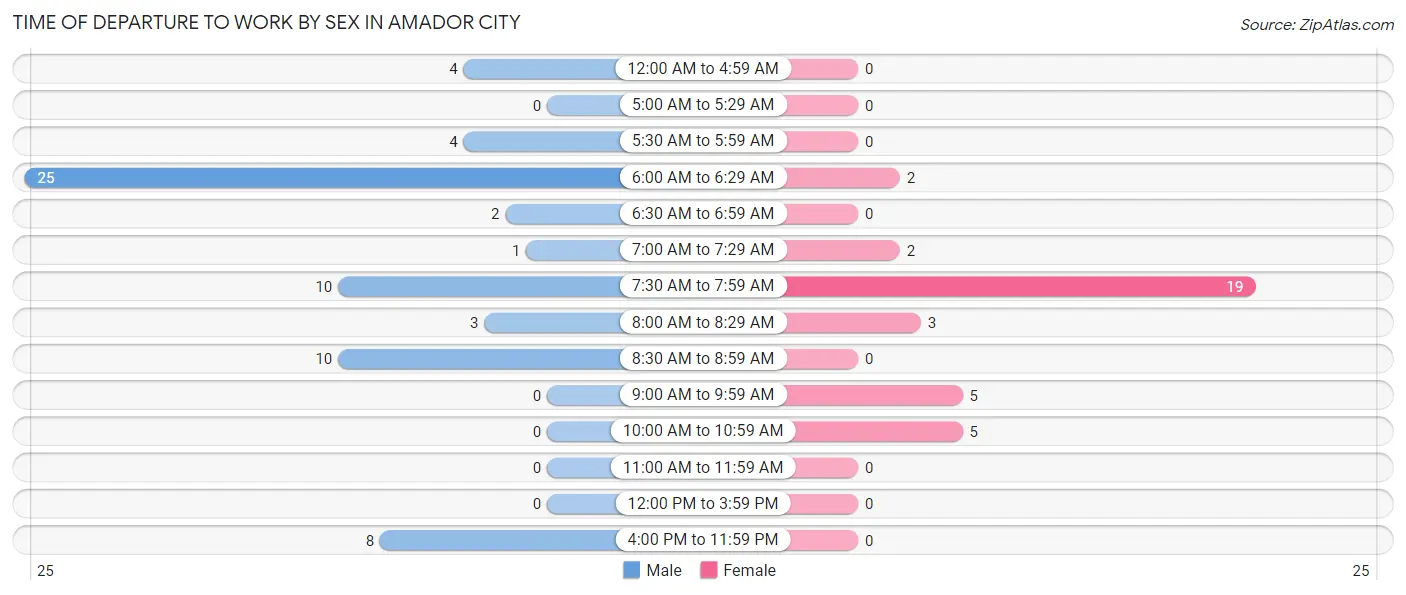
| Time of Departure | Male | Female |
| 12:00 AM to 4:59 AM | 4 (6.0%) | 0 (0.0%) |
| 5:00 AM to 5:29 AM | 0 (0.0%) | 0 (0.0%) |
| 5:30 AM to 5:59 AM | 4 (6.0%) | 0 (0.0%) |
| 6:00 AM to 6:29 AM | 25 (37.3%) | 2 (5.6%) |
| 6:30 AM to 6:59 AM | 2 (3.0%) | 0 (0.0%) |
| 7:00 AM to 7:29 AM | 1 (1.5%) | 2 (5.6%) |
| 7:30 AM to 7:59 AM | 10 (14.9%) | 19 (52.8%) |
| 8:00 AM to 8:29 AM | 3 (4.5%) | 3 (8.3%) |
| 8:30 AM to 8:59 AM | 10 (14.9%) | 0 (0.0%) |
| 9:00 AM to 9:59 AM | 0 (0.0%) | 5 (13.9%) |
| 10:00 AM to 10:59 AM | 0 (0.0%) | 5 (13.9%) |
| 11:00 AM to 11:59 AM | 0 (0.0%) | 0 (0.0%) |
| 12:00 PM to 3:59 PM | 0 (0.0%) | 0 (0.0%) |
| 4:00 PM to 11:59 PM | 8 (11.9%) | 0 (0.0%) |
| Total | 67 (100.0%) | 36 (100.0%) |
Housing Occupancy in Amador City
Occupancy by Ownership in Amador City
Of the total 113 dwellings in Amador City, owner-occupied units account for 46 (40.7%), while renter-occupied units make up 67 (59.3%).
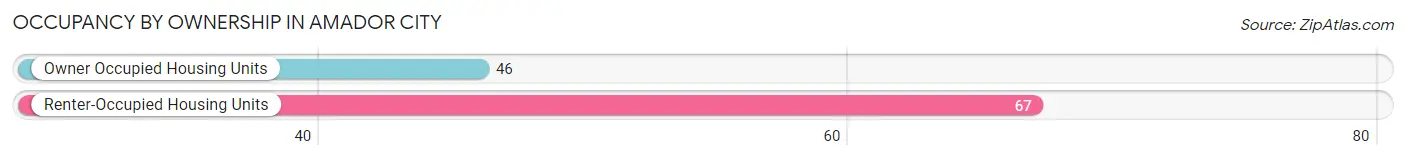
| Occupancy | # Housing Units | % Housing Units |
| Owner Occupied Housing Units | 46 | 40.7% |
| Renter-Occupied Housing Units | 67 | 59.3% |
| Total Occupied Housing Units | 113 | 100.0% |
Occupancy by Household Size in Amador City

| Household Size | # Housing Units | % Housing Units |
| 1-Person Household | 59 | 52.2% |
| 2-Person Household | 27 | 23.9% |
| 3-Person Household | 13 | 11.5% |
| 4+ Person Household | 14 | 12.4% |
| Total Housing Units | 113 | 100.0% |
Occupancy by Ownership by Household Size in Amador City
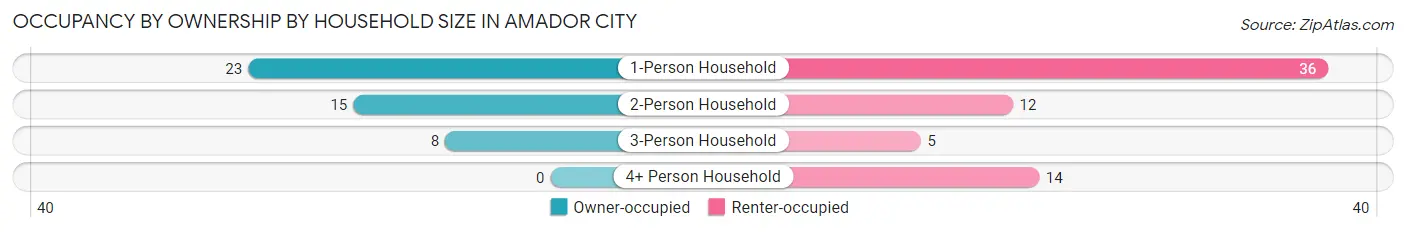
| Household Size | Owner-occupied | Renter-occupied |
| 1-Person Household | 23 (39.0%) | 36 (61.0%) |
| 2-Person Household | 15 (55.6%) | 12 (44.4%) |
| 3-Person Household | 8 (61.5%) | 5 (38.5%) |
| 4+ Person Household | 0 (0.0%) | 14 (100.0%) |
| Total Housing Units | 46 (40.7%) | 67 (59.3%) |
Occupancy by Educational Attainment in Amador City
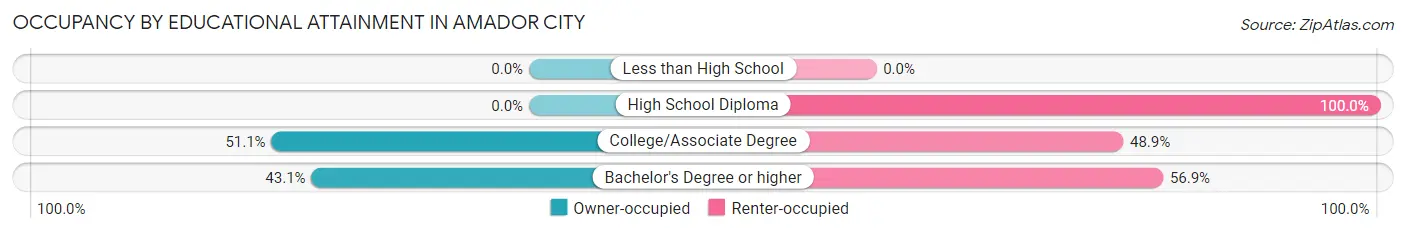
| Household Size | Owner-occupied | Renter-occupied |
| Less than High School | 0 (0.0%) | 0 (0.0%) |
| High School Diploma | 0 (0.0%) | 15 (100.0%) |
| College/Associate Degree | 24 (51.1%) | 23 (48.9%) |
| Bachelor's Degree or higher | 22 (43.1%) | 29 (56.9%) |
Occupancy by Age of Householder in Amador City
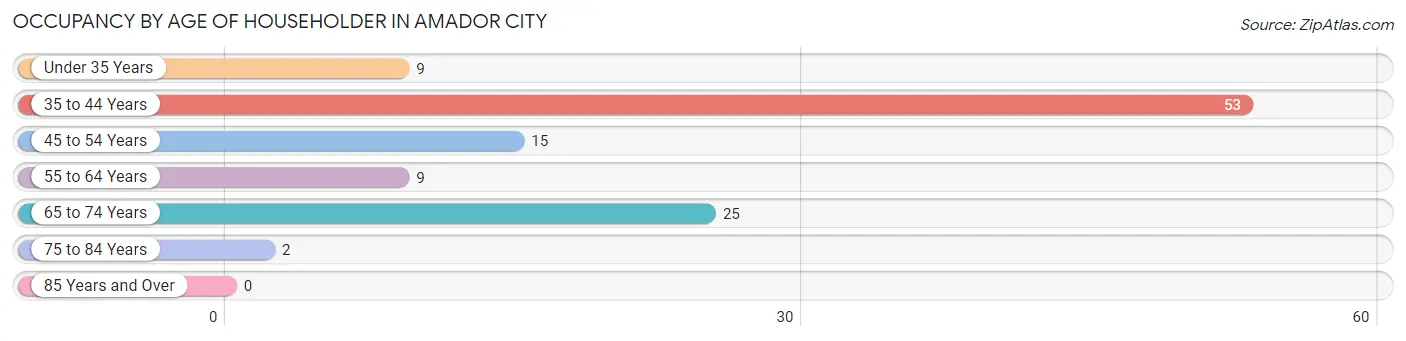
| Age Bracket | # Households | % Households |
| Under 35 Years | 9 | 8.0% |
| 35 to 44 Years | 53 | 46.9% |
| 45 to 54 Years | 15 | 13.3% |
| 55 to 64 Years | 9 | 8.0% |
| 65 to 74 Years | 25 | 22.1% |
| 75 to 84 Years | 2 | 1.8% |
| 85 Years and Over | 0 | 0.0% |
| Total | 113 | 100.0% |
Housing Finances in Amador City
Median Income by Occupancy in Amador City
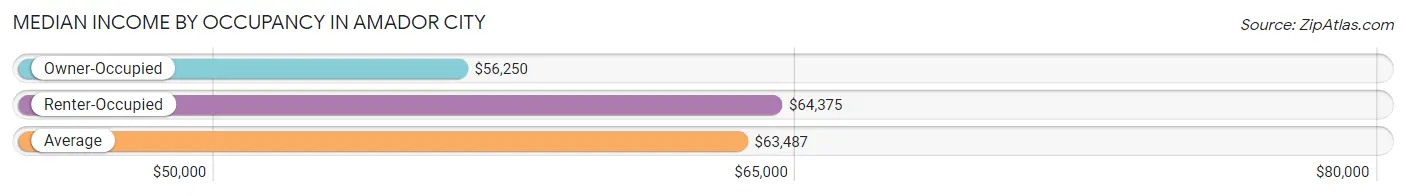
| Occupancy Type | # Households | Median Income |
| Owner-Occupied | 46 (40.7%) | $56,250 |
| Renter-Occupied | 67 (59.3%) | $64,375 |
| Average | 113 (100.0%) | $63,487 |
Occupancy by Householder Income Bracket in Amador City
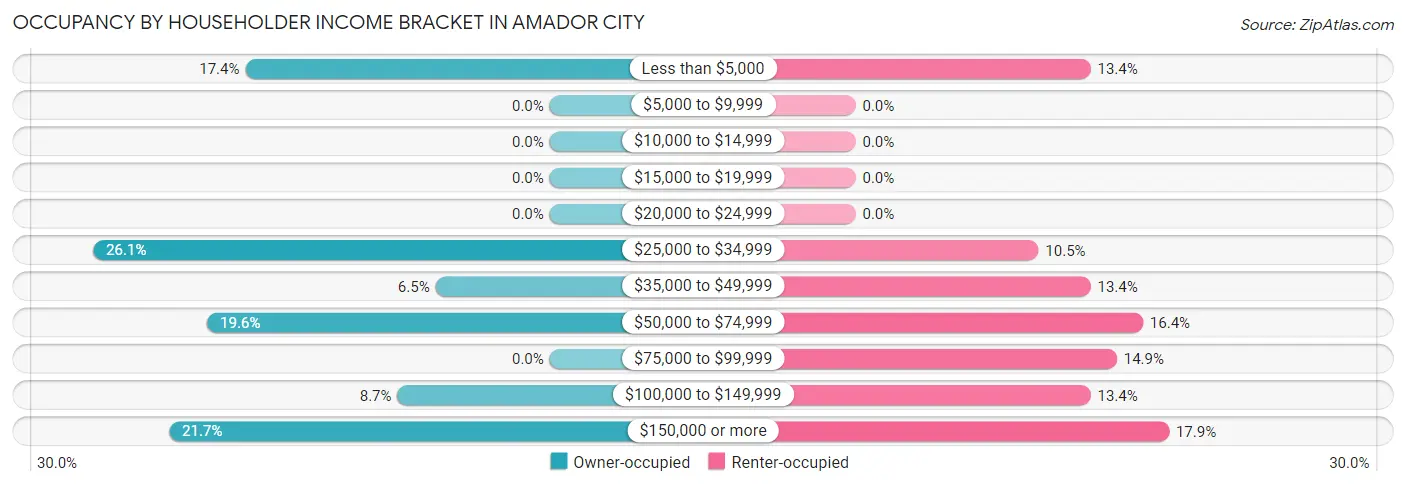
| Income Bracket | Owner-occupied | Renter-occupied |
| Less than $5,000 | 8 (17.4%) | 9 (13.4%) |
| $5,000 to $9,999 | 0 (0.0%) | 0 (0.0%) |
| $10,000 to $14,999 | 0 (0.0%) | 0 (0.0%) |
| $15,000 to $19,999 | 0 (0.0%) | 0 (0.0%) |
| $20,000 to $24,999 | 0 (0.0%) | 0 (0.0%) |
| $25,000 to $34,999 | 12 (26.1%) | 7 (10.4%) |
| $35,000 to $49,999 | 3 (6.5%) | 9 (13.4%) |
| $50,000 to $74,999 | 9 (19.6%) | 11 (16.4%) |
| $75,000 to $99,999 | 0 (0.0%) | 10 (14.9%) |
| $100,000 to $149,999 | 4 (8.7%) | 9 (13.4%) |
| $150,000 or more | 10 (21.7%) | 12 (17.9%) |
| Total | 46 (100.0%) | 67 (100.0%) |
Monthly Housing Cost Tiers in Amador City
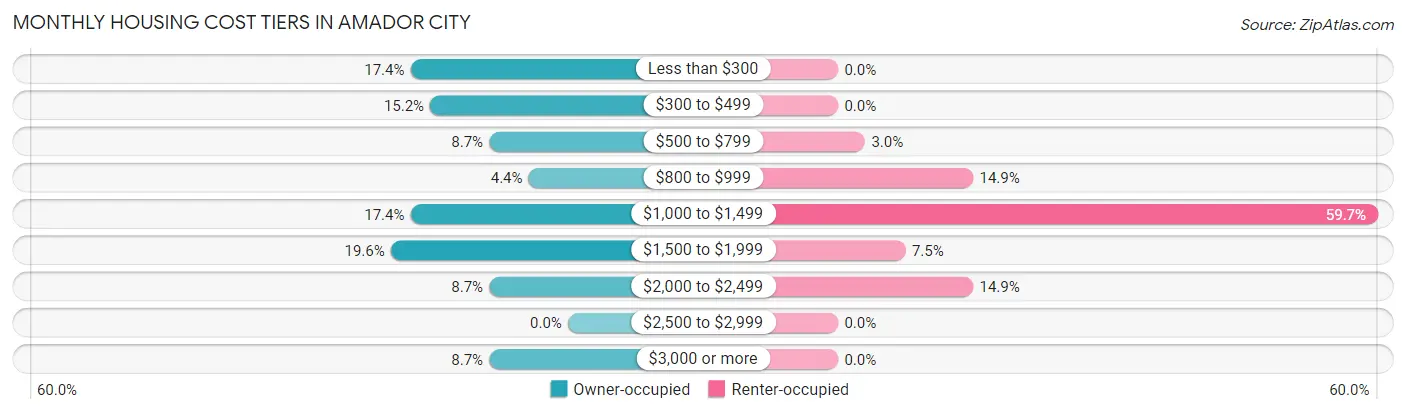
| Monthly Cost | Owner-occupied | Renter-occupied |
| Less than $300 | 8 (17.4%) | 0 (0.0%) |
| $300 to $499 | 7 (15.2%) | 0 (0.0%) |
| $500 to $799 | 4 (8.7%) | 2 (3.0%) |
| $800 to $999 | 2 (4.3%) | 10 (14.9%) |
| $1,000 to $1,499 | 8 (17.4%) | 40 (59.7%) |
| $1,500 to $1,999 | 9 (19.6%) | 5 (7.5%) |
| $2,000 to $2,499 | 4 (8.7%) | 10 (14.9%) |
| $2,500 to $2,999 | 0 (0.0%) | 0 (0.0%) |
| $3,000 or more | 4 (8.7%) | 0 (0.0%) |
| Total | 46 (100.0%) | 67 (100.0%) |
Physical Housing Characteristics in Amador City
Housing Structures in Amador City
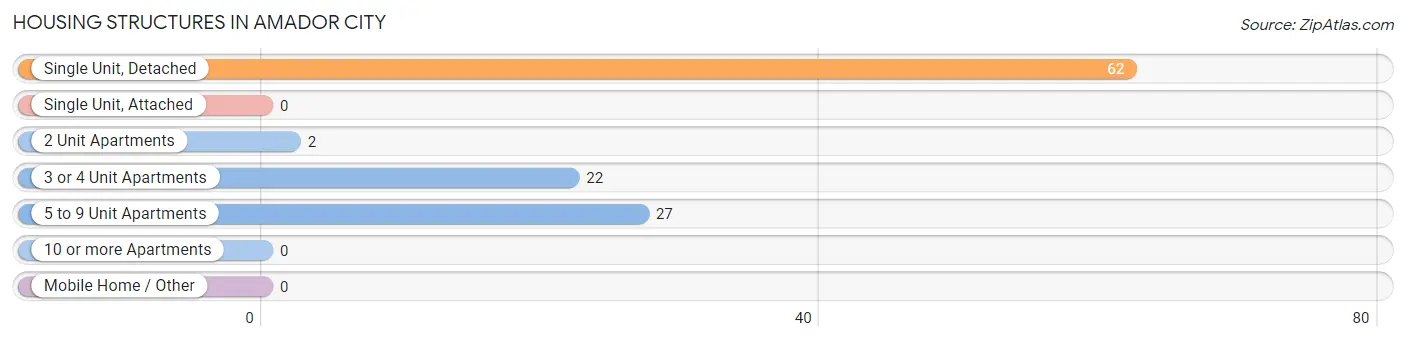
| Structure Type | # Housing Units | % Housing Units |
| Single Unit, Detached | 62 | 54.9% |
| Single Unit, Attached | 0 | 0.0% |
| 2 Unit Apartments | 2 | 1.8% |
| 3 or 4 Unit Apartments | 22 | 19.5% |
| 5 to 9 Unit Apartments | 27 | 23.9% |
| 10 or more Apartments | 0 | 0.0% |
| Mobile Home / Other | 0 | 0.0% |
| Total | 113 | 100.0% |
Housing Structures by Occupancy in Amador City
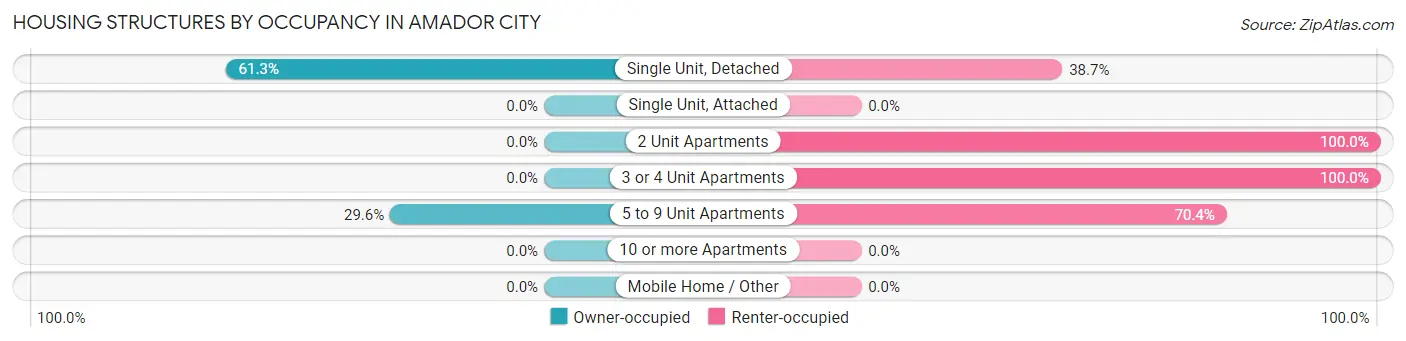
| Structure Type | Owner-occupied | Renter-occupied |
| Single Unit, Detached | 38 (61.3%) | 24 (38.7%) |
| Single Unit, Attached | 0 (0.0%) | 0 (0.0%) |
| 2 Unit Apartments | 0 (0.0%) | 2 (100.0%) |
| 3 or 4 Unit Apartments | 0 (0.0%) | 22 (100.0%) |
| 5 to 9 Unit Apartments | 8 (29.6%) | 19 (70.4%) |
| 10 or more Apartments | 0 (0.0%) | 0 (0.0%) |
| Mobile Home / Other | 0 (0.0%) | 0 (0.0%) |
| Total | 46 (40.7%) | 67 (59.3%) |
Housing Structures by Number of Rooms in Amador City
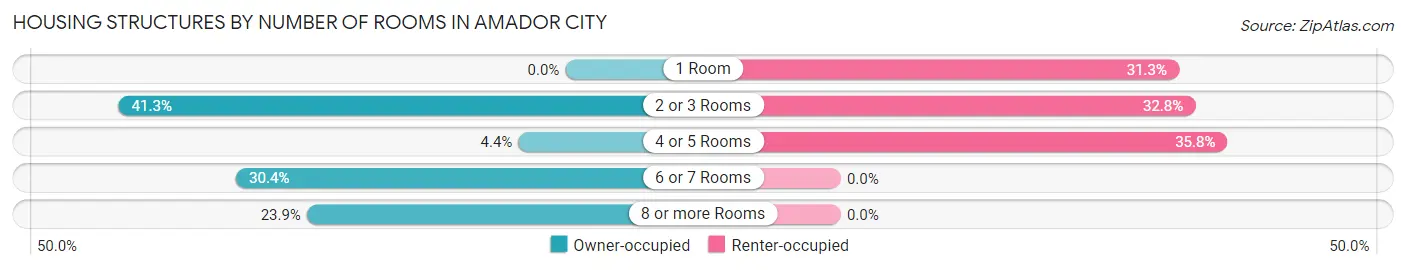
| Number of Rooms | Owner-occupied | Renter-occupied |
| 1 Room | 0 (0.0%) | 21 (31.3%) |
| 2 or 3 Rooms | 19 (41.3%) | 22 (32.8%) |
| 4 or 5 Rooms | 2 (4.3%) | 24 (35.8%) |
| 6 or 7 Rooms | 14 (30.4%) | 0 (0.0%) |
| 8 or more Rooms | 11 (23.9%) | 0 (0.0%) |
| Total | 46 (100.0%) | 67 (100.0%) |
Housing Structure by Heating Type in Amador City
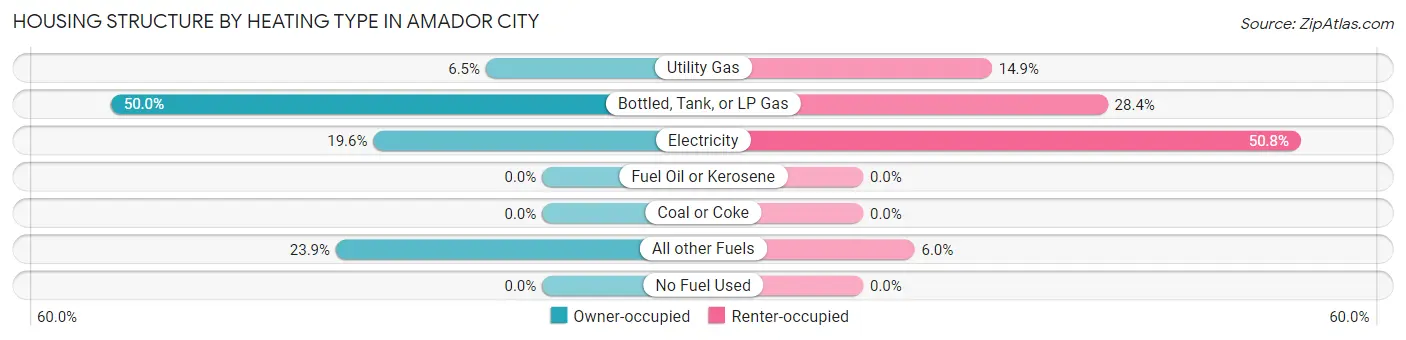
| Heating Type | Owner-occupied | Renter-occupied |
| Utility Gas | 3 (6.5%) | 10 (14.9%) |
| Bottled, Tank, or LP Gas | 23 (50.0%) | 19 (28.4%) |
| Electricity | 9 (19.6%) | 34 (50.7%) |
| Fuel Oil or Kerosene | 0 (0.0%) | 0 (0.0%) |
| Coal or Coke | 0 (0.0%) | 0 (0.0%) |
| All other Fuels | 11 (23.9%) | 4 (6.0%) |
| No Fuel Used | 0 (0.0%) | 0 (0.0%) |
| Total | 46 (100.0%) | 67 (100.0%) |
Household Vehicle Usage in Amador City
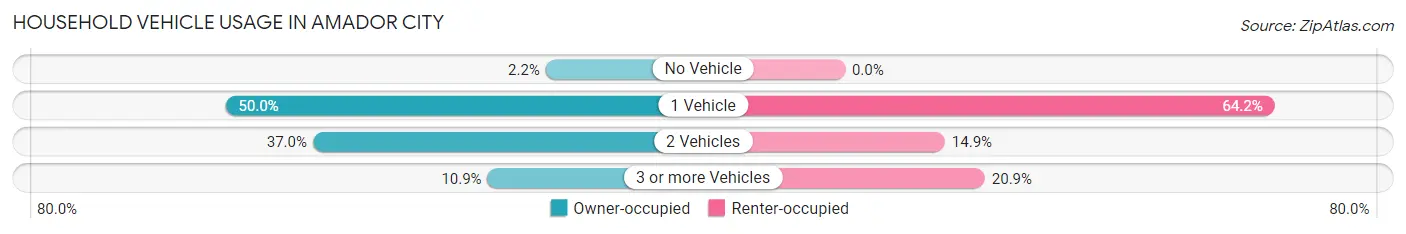
| Vehicles per Household | Owner-occupied | Renter-occupied |
| No Vehicle | 1 (2.2%) | 0 (0.0%) |
| 1 Vehicle | 23 (50.0%) | 43 (64.2%) |
| 2 Vehicles | 17 (37.0%) | 10 (14.9%) |
| 3 or more Vehicles | 5 (10.9%) | 14 (20.9%) |
| Total | 46 (100.0%) | 67 (100.0%) |
Real Estate & Mortgages in Amador City
Real Estate and Mortgage Overview in Amador City
| Characteristic | Without Mortgage | With Mortgage |
| Housing Units | 21 | 25 |
| Median Property Value | $335,700 | $406,300 |
| Median Household Income | - | - |
| Monthly Housing Costs | $368 | $4 |
| Real Estate Taxes | $1,795 | $0 |
Property Value by Mortgage Status in Amador City
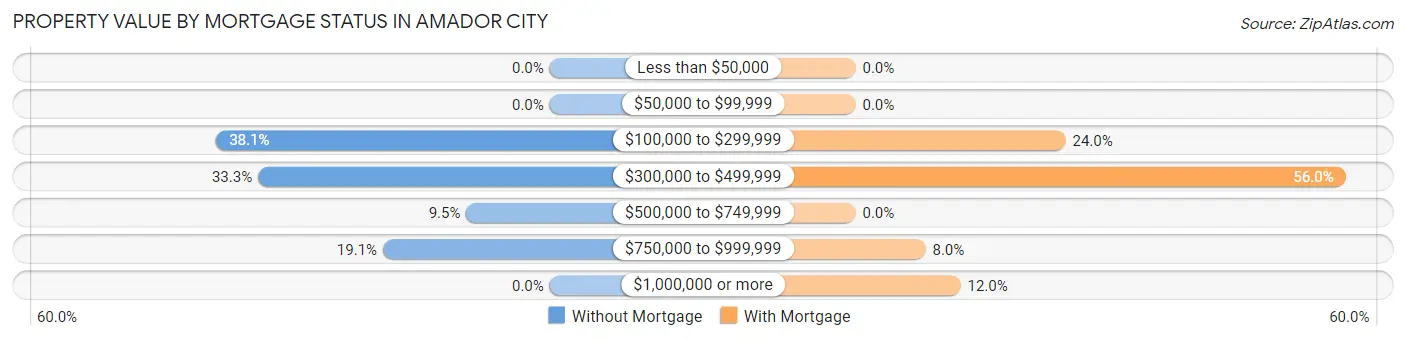
| Property Value | Without Mortgage | With Mortgage |
| Less than $50,000 | 0 (0.0%) | 0 (0.0%) |
| $50,000 to $99,999 | 0 (0.0%) | 0 (0.0%) |
| $100,000 to $299,999 | 8 (38.1%) | 6 (24.0%) |
| $300,000 to $499,999 | 7 (33.3%) | 14 (56.0%) |
| $500,000 to $749,999 | 2 (9.5%) | 0 (0.0%) |
| $750,000 to $999,999 | 4 (19.1%) | 2 (8.0%) |
| $1,000,000 or more | 0 (0.0%) | 3 (12.0%) |
| Total | 21 (100.0%) | 25 (100.0%) |
Household Income by Mortgage Status in Amador City
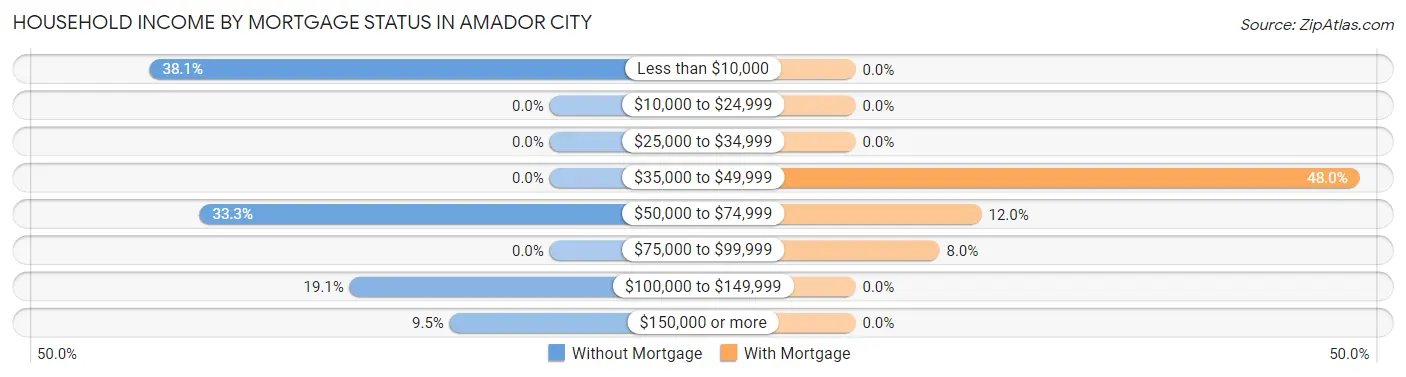
| Household Income | Without Mortgage | With Mortgage |
| Less than $10,000 | 8 (38.1%) | 0 (0.0%) |
| $10,000 to $24,999 | 0 (0.0%) | 0 (0.0%) |
| $25,000 to $34,999 | 0 (0.0%) | 0 (0.0%) |
| $35,000 to $49,999 | 0 (0.0%) | 12 (48.0%) |
| $50,000 to $74,999 | 7 (33.3%) | 3 (12.0%) |
| $75,000 to $99,999 | 0 (0.0%) | 2 (8.0%) |
| $100,000 to $149,999 | 4 (19.1%) | 0 (0.0%) |
| $150,000 or more | 2 (9.5%) | 0 (0.0%) |
| Total | 21 (100.0%) | 25 (100.0%) |
Property Value to Household Income Ratio in Amador City
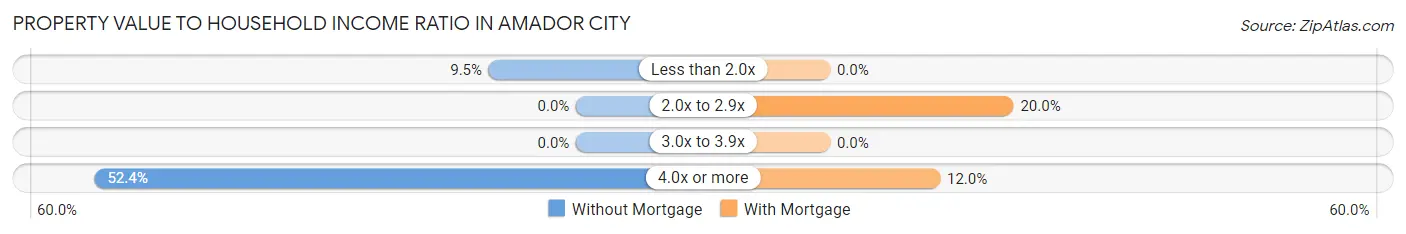
| Value-to-Income Ratio | Without Mortgage | With Mortgage |
| Less than 2.0x | 2 (9.5%) | 0 (0.0%) |
| 2.0x to 2.9x | 0 (0.0%) | 5 (20.0%) |
| 3.0x to 3.9x | 0 (0.0%) | 0 (0.0%) |
| 4.0x or more | 11 (52.4%) | 3 (12.0%) |
| Total | 21 (100.0%) | 25 (100.0%) |
Real Estate Taxes by Mortgage Status in Amador City
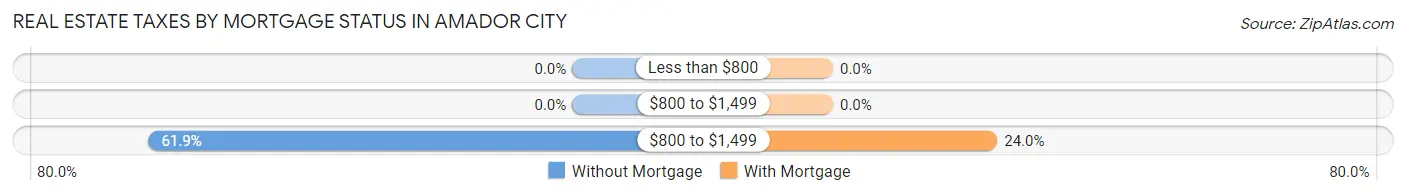
| Property Taxes | Without Mortgage | With Mortgage |
| Less than $800 | 0 (0.0%) | 0 (0.0%) |
| $800 to $1,499 | 0 (0.0%) | 0 (0.0%) |
| $800 to $1,499 | 13 (61.9%) | 6 (24.0%) |
| Total | 21 (100.0%) | 25 (100.0%) |
Health & Disability in Amador City
Health Insurance Coverage by Age in Amador City
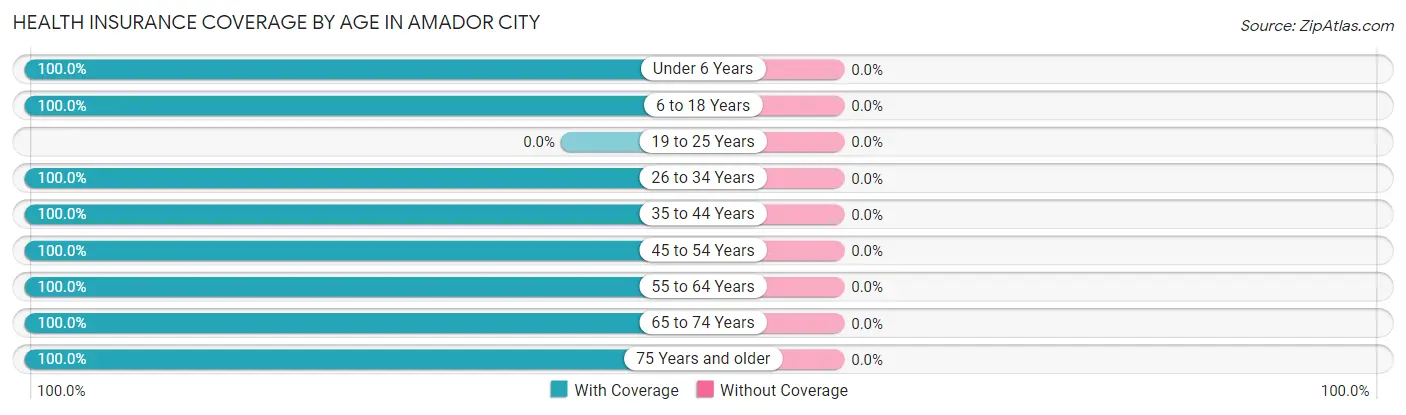
| Age Bracket | With Coverage | Without Coverage |
| Under 6 Years | 11 (100.0%) | 0 (0.0%) |
| 6 to 18 Years | 18 (100.0%) | 0 (0.0%) |
| 19 to 25 Years | 0 (0.0%) | 0 (0.0%) |
| 26 to 34 Years | 45 (100.0%) | 0 (0.0%) |
| 35 to 44 Years | 59 (100.0%) | 0 (0.0%) |
| 45 to 54 Years | 27 (100.0%) | 0 (0.0%) |
| 55 to 64 Years | 26 (100.0%) | 0 (0.0%) |
| 65 to 74 Years | 27 (100.0%) | 0 (0.0%) |
| 75 Years and older | 2 (100.0%) | 0 (0.0%) |
| Total | 215 (100.0%) | 0 (0.0%) |
Health Insurance Coverage by Citizenship Status in Amador City
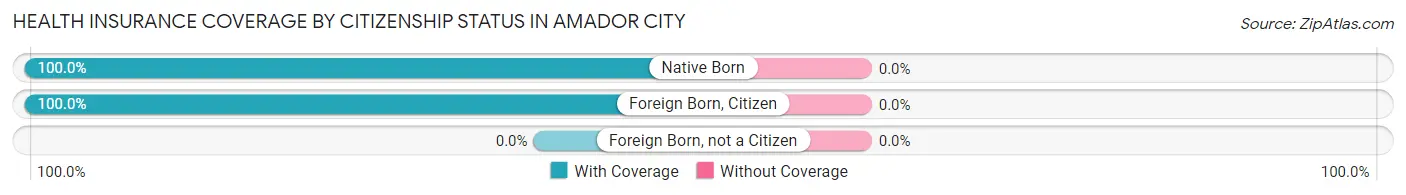
| Citizenship Status | With Coverage | Without Coverage |
| Native Born | 11 (100.0%) | 0 (0.0%) |
| Foreign Born, Citizen | 18 (100.0%) | 0 (0.0%) |
| Foreign Born, not a Citizen | 0 (0.0%) | 0 (0.0%) |
Health Insurance Coverage by Household Income in Amador City
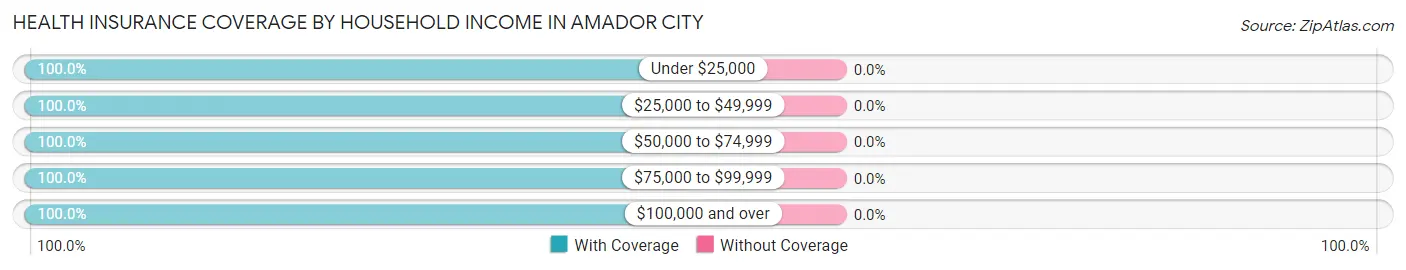
| Household Income | With Coverage | Without Coverage |
| Under $25,000 | 17 (100.0%) | 0 (0.0%) |
| $25,000 to $49,999 | 62 (100.0%) | 0 (0.0%) |
| $50,000 to $74,999 | 23 (100.0%) | 0 (0.0%) |
| $75,000 to $99,999 | 10 (100.0%) | 0 (0.0%) |
| $100,000 and over | 103 (100.0%) | 0 (0.0%) |
Public vs Private Health Insurance Coverage by Age in Amador City
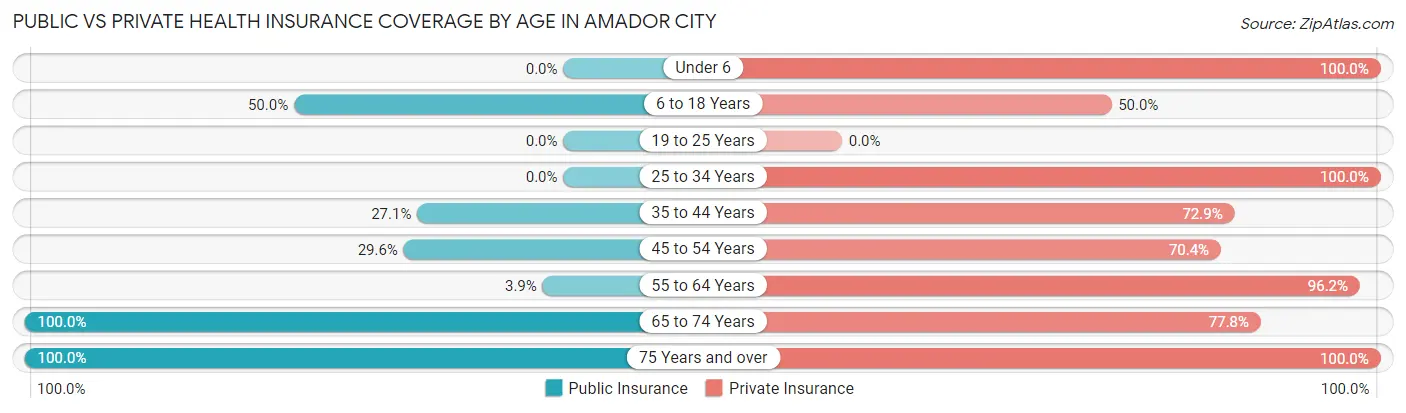
| Age Bracket | Public Insurance | Private Insurance |
| Under 6 | 0 (0.0%) | 11 (100.0%) |
| 6 to 18 Years | 9 (50.0%) | 9 (50.0%) |
| 19 to 25 Years | 0 (0.0%) | 0 (0.0%) |
| 25 to 34 Years | 0 (0.0%) | 45 (100.0%) |
| 35 to 44 Years | 16 (27.1%) | 43 (72.9%) |
| 45 to 54 Years | 8 (29.6%) | 19 (70.4%) |
| 55 to 64 Years | 1 (3.8%) | 25 (96.2%) |
| 65 to 74 Years | 27 (100.0%) | 21 (77.8%) |
| 75 Years and over | 2 (100.0%) | 2 (100.0%) |
| Total | 63 (29.3%) | 175 (81.4%) |
Disability Status by Sex by Age in Amador City
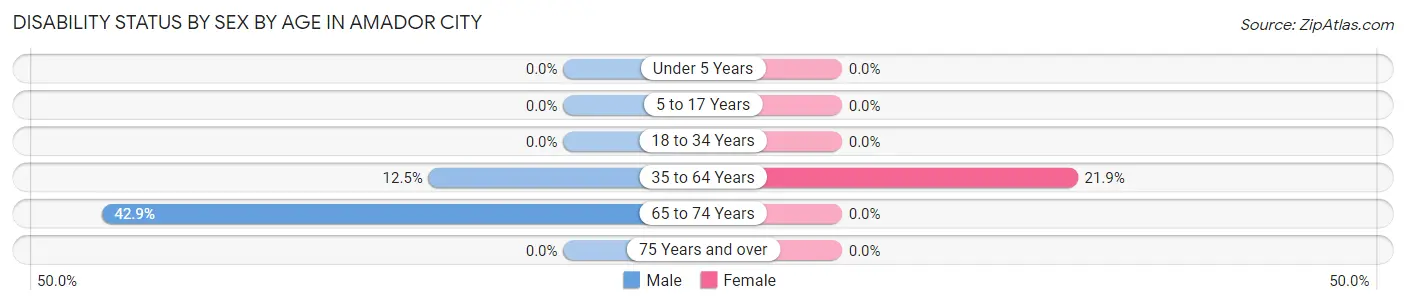
| Age Bracket | Male | Female |
| Under 5 Years | 0 (0.0%) | 0 (0.0%) |
| 5 to 17 Years | 0 (0.0%) | 0 (0.0%) |
| 18 to 34 Years | 0 (0.0%) | 0 (0.0%) |
| 35 to 64 Years | 10 (12.5%) | 7 (21.9%) |
| 65 to 74 Years | 6 (42.9%) | 0 (0.0%) |
| 75 Years and over | 0 (0.0%) | 0 (0.0%) |
Disability Class by Sex by Age in Amador City
Disability Class: Hearing Difficulty
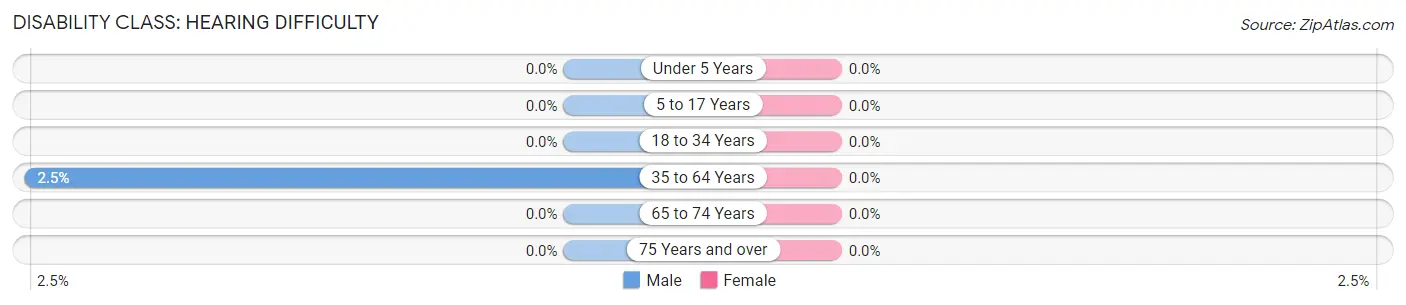
| Age Bracket | Male | Female |
| Under 5 Years | 0 (0.0%) | 0 (0.0%) |
| 5 to 17 Years | 0 (0.0%) | 0 (0.0%) |
| 18 to 34 Years | 0 (0.0%) | 0 (0.0%) |
| 35 to 64 Years | 2 (2.5%) | 0 (0.0%) |
| 65 to 74 Years | 0 (0.0%) | 0 (0.0%) |
| 75 Years and over | 0 (0.0%) | 0 (0.0%) |
Disability Class: Vision Difficulty
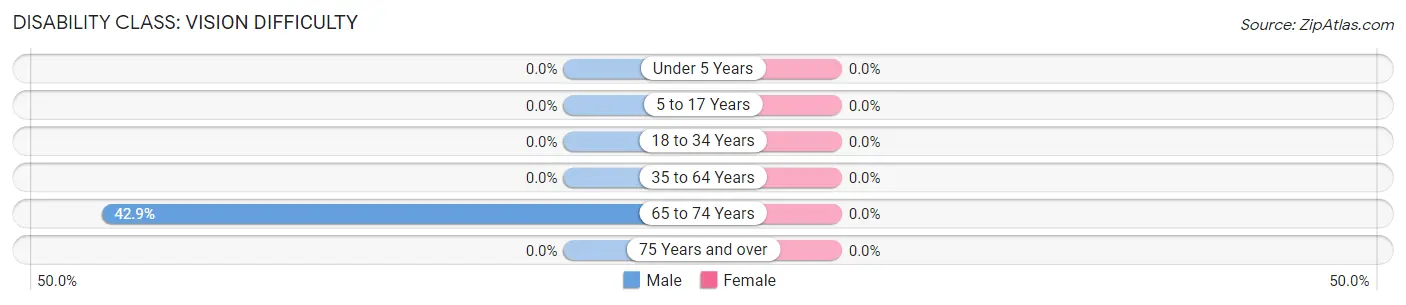
| Age Bracket | Male | Female |
| Under 5 Years | 0 (0.0%) | 0 (0.0%) |
| 5 to 17 Years | 0 (0.0%) | 0 (0.0%) |
| 18 to 34 Years | 0 (0.0%) | 0 (0.0%) |
| 35 to 64 Years | 0 (0.0%) | 0 (0.0%) |
| 65 to 74 Years | 6 (42.9%) | 0 (0.0%) |
| 75 Years and over | 0 (0.0%) | 0 (0.0%) |
Disability Class: Cognitive Difficulty
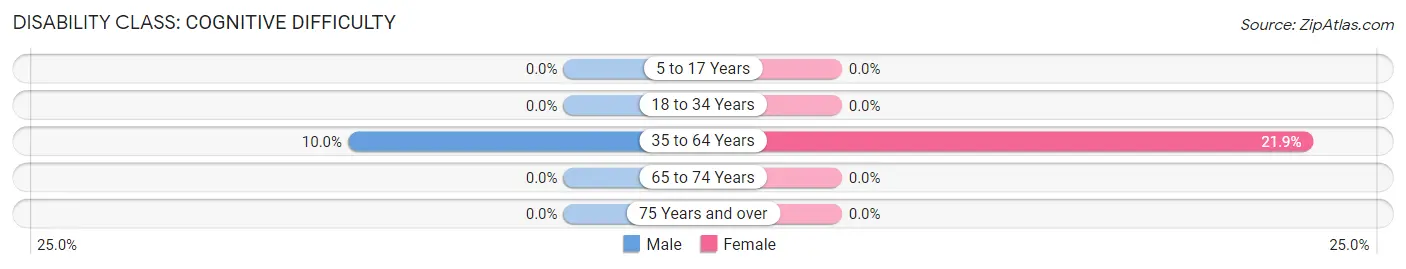
| Age Bracket | Male | Female |
| 5 to 17 Years | 0 (0.0%) | 0 (0.0%) |
| 18 to 34 Years | 0 (0.0%) | 0 (0.0%) |
| 35 to 64 Years | 8 (10.0%) | 7 (21.9%) |
| 65 to 74 Years | 0 (0.0%) | 0 (0.0%) |
| 75 Years and over | 0 (0.0%) | 0 (0.0%) |
Disability Class: Ambulatory Difficulty
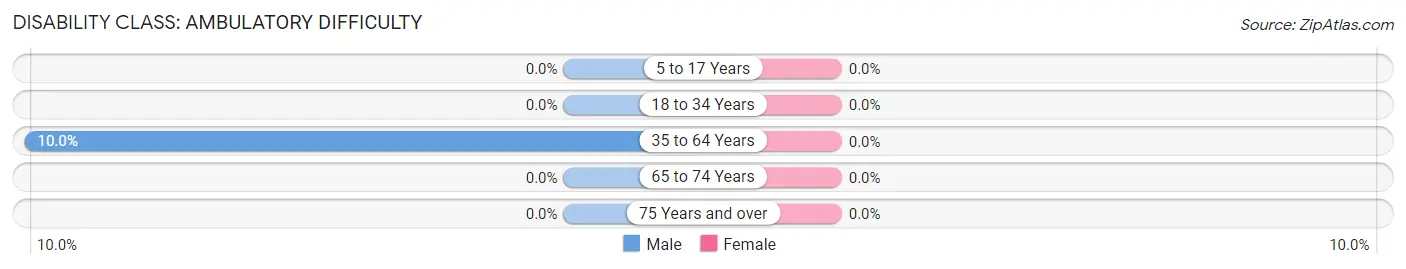
| Age Bracket | Male | Female |
| 5 to 17 Years | 0 (0.0%) | 0 (0.0%) |
| 18 to 34 Years | 0 (0.0%) | 0 (0.0%) |
| 35 to 64 Years | 8 (10.0%) | 0 (0.0%) |
| 65 to 74 Years | 0 (0.0%) | 0 (0.0%) |
| 75 Years and over | 0 (0.0%) | 0 (0.0%) |
Disability Class: Self-Care Difficulty
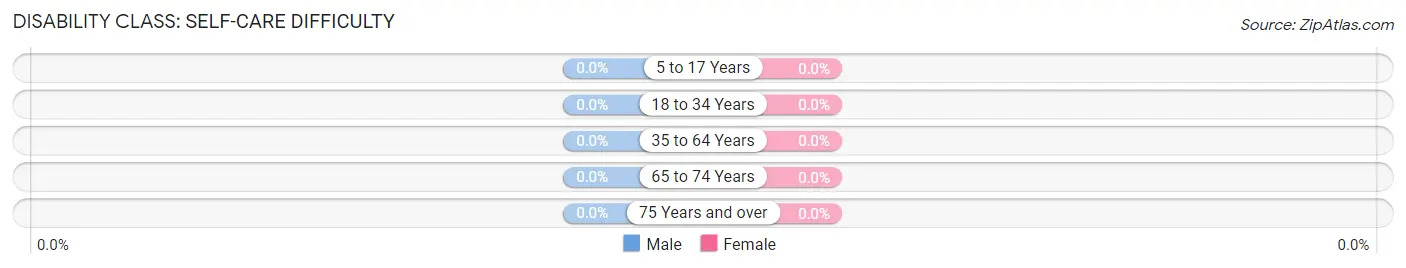
| Age Bracket | Male | Female |
| 5 to 17 Years | 0 (0.0%) | 0 (0.0%) |
| 18 to 34 Years | 0 (0.0%) | 0 (0.0%) |
| 35 to 64 Years | 0 (0.0%) | 0 (0.0%) |
| 65 to 74 Years | 0 (0.0%) | 0 (0.0%) |
| 75 Years and over | 0 (0.0%) | 0 (0.0%) |
Technology Access in Amador City
Computing Device Access in Amador City
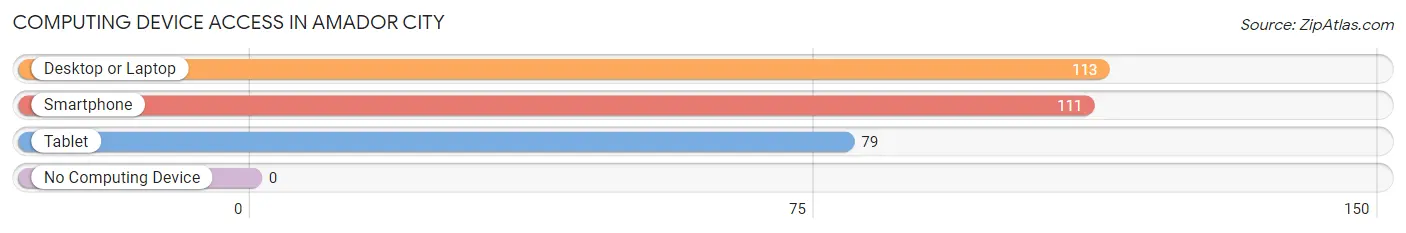
| Device Type | # Households | % Households |
| Desktop or Laptop | 113 | 100.0% |
| Smartphone | 111 | 98.2% |
| Tablet | 79 | 69.9% |
| No Computing Device | 0 | 0.0% |
| Total | 113 | 100.0% |
Internet Access in Amador City
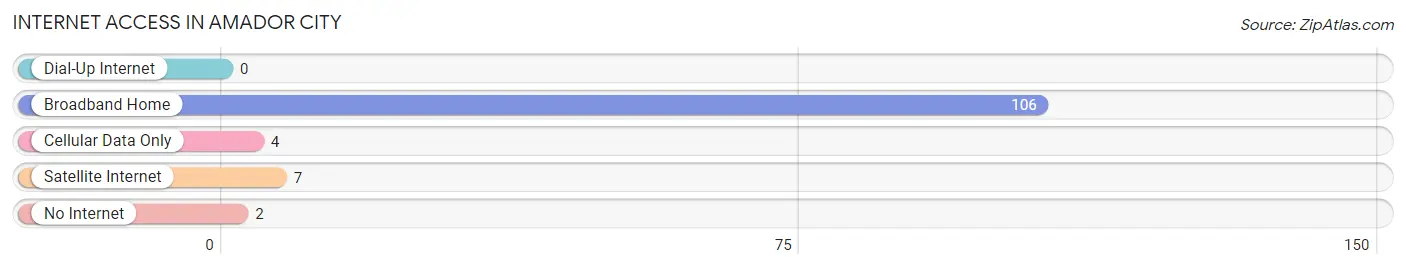
| Internet Type | # Households | % Households |
| Dial-Up Internet | 0 | 0.0% |
| Broadband Home | 106 | 93.8% |
| Cellular Data Only | 4 | 3.5% |
| Satellite Internet | 7 | 6.2% |
| No Internet | 2 | 1.8% |
| Total | 113 | 100.0% |
Amador City Summary
Amador City is a small city located in Amador County, California, United States. It is situated in the Sierra Nevada foothills, approximately 40 miles east of Sacramento. The city has a population of just over 200 people, making it one of the smallest incorporated cities in California.
History
Amador City was founded in 1879 by a group of miners who had been working in the nearby gold mines. The city was named after José María Amador, a Mexican soldier who had been granted a large land grant in the area in 1846. The city was incorporated in 1893 and quickly became a popular destination for miners and prospectors.
The city experienced a period of growth in the late 19th and early 20th centuries, with the construction of several hotels, saloons, and other businesses. However, the city's population began to decline in the mid-20th century as the gold mines were depleted and the local economy shifted away from mining.
Geography
Amador City is located in the Sierra Nevada foothills, approximately 40 miles east of Sacramento. The city is situated at an elevation of 1,845 feet and is surrounded by rolling hills and oak-studded valleys. The city is located near several recreational areas, including the Amador County Fairgrounds, the Amador County Wine Country, and the Amador County Historical Museum.
Economy
The economy of Amador City is largely based on tourism and agriculture. The city is home to several wineries, as well as a number of small businesses, including restaurants, antique stores, and art galleries. The city also hosts several annual events, including the Amador County Fair and the Amador County Wine Festival.
Demographics
As of the 2010 census, the population of Amador City was 203. The racial makeup of the city was 94.6% White, 0.5% African American, 0.5% Native American, 0.5% Asian, 0.5% Pacific Islander, and 3.4% from other races. The median household income was $45,000, and the median family income was $50,000.
Conclusion
Amador City is a small city located in Amador County, California, United States. It is situated in the Sierra Nevada foothills, approximately 40 miles east of Sacramento. The city has a population of just over 200 people, making it one of the smallest incorporated cities in California. The economy of Amador City is largely based on tourism and agriculture, and the city is home to several wineries, as well as a number of small businesses. The racial makeup of the city is predominantly White, with a small percentage of African American, Native American, Asian, and Pacific Islander residents.
Common Questions
What is Per Capita Income in Amador City?
Per Capita income in Amador City is $53,878.
What is the Median Family Income in Amador City?
Median Family Income in Amador City is $104,688.
What is the Median Household income in Amador City?
Median Household Income in Amador City is $63,487.
What is Income or Wage Gap in Amador City?
Income or Wage Gap in Amador City is 27.5%.
Women in Amador City earn 72.5 cents for every dollar earned by a man.
What is Inequality or Gini Index in Amador City?
Inequality or Gini Index in Amador City is 0.52.
What is the Total Population of Amador City?
Total Population of Amador City is 215.
What is the Total Male Population of Amador City?
Total Male Population of Amador City is 124.
What is the Total Female Population of Amador City?
Total Female Population of Amador City is 91.
What is the Ratio of Males per 100 Females in Amador City?
There are 136.26 Males per 100 Females in Amador City.
What is the Ratio of Females per 100 Males in Amador City?
There are 73.39 Females per 100 Males in Amador City.
What is the Median Population Age in Amador City?
Median Population Age in Amador City is 37.5 Years.
What is the Average Family Size in Amador City
Average Family Size in Amador City is 2.4 People.
What is the Average Household Size in Amador City
Average Household Size in Amador City is 1.9 People.
How Large is the Labor Force in Amador City?
There are 141 People in the Labor Forcein in Amador City.
What is the Percentage of People in the Labor Force in Amador City?
75.8% of People are in the Labor Force in Amador City.
What is the Unemployment Rate in Amador City?
Unemployment Rate in Amador City is 7.8%.