Monon, IN Map & Demographics
Monon Map
Monon Overview
$20,354
PER CAPITA INCOME
$55,469
AVG FAMILY INCOME
$52,596
AVG HOUSEHOLD INCOME
31.8%
WAGE / INCOME GAP [ % ]
68.2¢/ $1
WAGE / INCOME GAP [ $ ]
0.34
INEQUALITY / GINI INDEX
1,764
TOTAL POPULATION
917
MALE POPULATION
847
FEMALE POPULATION
108.26
MALES / 100 FEMALES
92.37
FEMALES / 100 MALES
27.3
MEDIAN AGE
3.5
AVG FAMILY SIZE
3.0
AVG HOUSEHOLD SIZE
847
LABOR FORCE [ PEOPLE ]
69.0%
PERCENT IN LABOR FORCE
9.9%
UNEMPLOYMENT RATE
Monon Zip Codes
Income in Monon
Income Overview in Monon
Per Capita Income in Monon is $20,354, while median incomes of families and households are $55,469 and $52,596 respectively.
| Characteristic | Number | Measure |
| Per Capita Income | 1,764 | $20,354 |
| Median Family Income | 389 | $55,469 |
| Mean Family Income | 389 | $64,560 |
| Median Household Income | 583 | $52,596 |
| Mean Household Income | 583 | $60,348 |
| Income Deficit | 389 | $0 |
| Wage / Income Gap (%) | 1,764 | 31.82% |
| Wage / Income Gap ($) | 1,764 | 68.18¢ per $1 |
| Gini / Inequality Index | 1,764 | 0.34 |
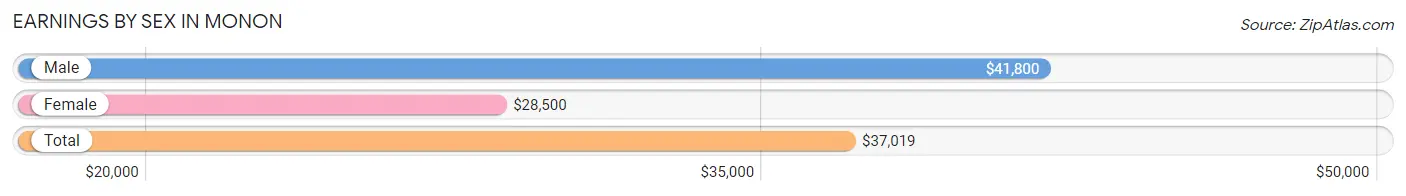
Earnings by Sex in Monon
Average Earnings in Monon are $37,019, $41,800 for men and $28,500 for women, a difference of 31.8%.
| Sex | Number | Average Earnings |
| Male | 526 (59.6%) | $41,800 |
| Female | 356 (40.4%) | $28,500 |
| Total | 882 (100.0%) | $37,019 |
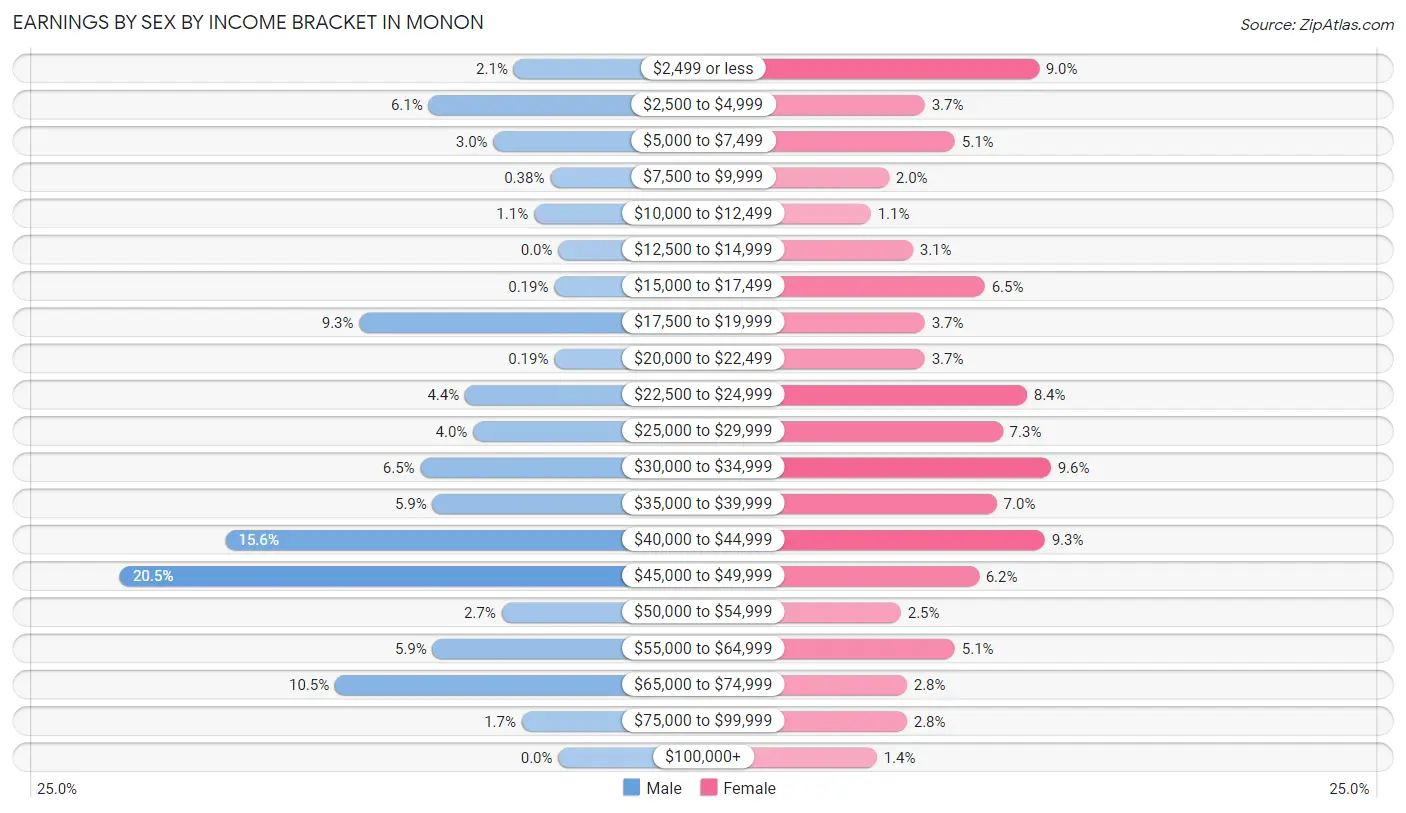
Earnings by Sex by Income Bracket in Monon
The most common earnings brackets in Monon are $45,000 to $49,999 for men (108 | 20.5%) and $30,000 to $34,999 for women (34 | 9.6%).
| Income | Male | Female |
| $2,499 or less | 11 (2.1%) | 32 (9.0%) |
| $2,500 to $4,999 | 32 (6.1%) | 13 (3.6%) |
| $5,000 to $7,499 | 16 (3.0%) | 18 (5.1%) |
| $7,500 to $9,999 | 2 (0.4%) | 7 (2.0%) |
| $10,000 to $12,499 | 6 (1.1%) | 4 (1.1%) |
| $12,500 to $14,999 | 0 (0.0%) | 11 (3.1%) |
| $15,000 to $17,499 | 1 (0.2%) | 23 (6.5%) |
| $17,500 to $19,999 | 49 (9.3%) | 13 (3.6%) |
| $20,000 to $22,499 | 1 (0.2%) | 13 (3.6%) |
| $22,500 to $24,999 | 23 (4.4%) | 30 (8.4%) |
| $25,000 to $29,999 | 21 (4.0%) | 26 (7.3%) |
| $30,000 to $34,999 | 34 (6.5%) | 34 (9.6%) |
| $35,000 to $39,999 | 31 (5.9%) | 25 (7.0%) |
| $40,000 to $44,999 | 82 (15.6%) | 33 (9.3%) |
| $45,000 to $49,999 | 108 (20.5%) | 22 (6.2%) |
| $50,000 to $54,999 | 14 (2.7%) | 9 (2.5%) |
| $55,000 to $64,999 | 31 (5.9%) | 18 (5.1%) |
| $65,000 to $74,999 | 55 (10.5%) | 10 (2.8%) |
| $75,000 to $99,999 | 9 (1.7%) | 10 (2.8%) |
| $100,000+ | 0 (0.0%) | 5 (1.4%) |
| Total | 526 (100.0%) | 356 (100.0%) |
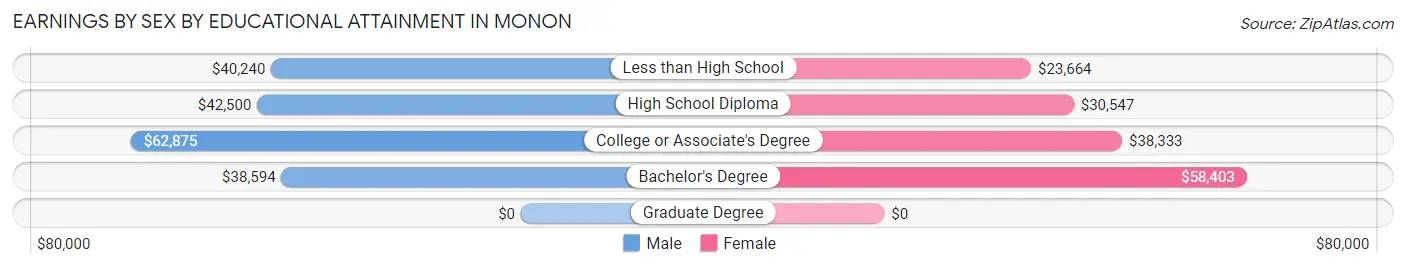
Earnings by Sex by Educational Attainment in Monon
Average earnings in Monon are $41,750 for men and $30,156 for women, a difference of 27.8%. Men with an educational attainment of college or associate's degree enjoy the highest average annual earnings of $62,875, while those with bachelor's degree education earn the least with $38,594. Women with an educational attainment of bachelor's degree earn the most with the average annual earnings of $58,403, while those with less than high school education have the smallest earnings of $23,664.
| Educational Attainment | Male Income | Female Income |
| Less than High School | $40,240 | $23,664 |
| High School Diploma | $42,500 | $30,547 |
| College or Associate's Degree | $62,875 | $38,333 |
| Bachelor's Degree | $38,594 | $58,403 |
| Graduate Degree | - | - |
| Total | $41,750 | $30,156 |
Family Income in Monon
Family Income Brackets in Monon
According to the Monon family income data, there are 95 families falling into the $50,000 to $74,999 income range, which is the most common income bracket and makes up 24.4% of all families.
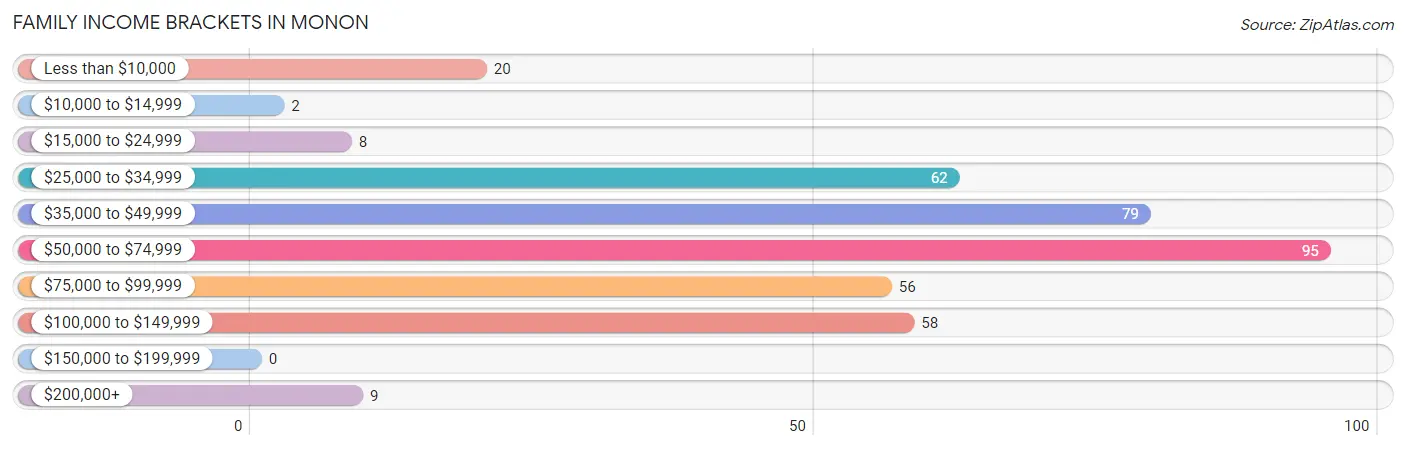
| Income Bracket | # Families | % Families |
| Less than $10,000 | 20 | 5.1% |
| $10,000 to $14,999 | 2 | 0.5% |
| $15,000 to $24,999 | 8 | 2.1% |
| $25,000 to $34,999 | 62 | 15.9% |
| $35,000 to $49,999 | 79 | 20.3% |
| $50,000 to $74,999 | 95 | 24.4% |
| $75,000 to $99,999 | 56 | 14.4% |
| $100,000 to $149,999 | 58 | 14.9% |
| $150,000 to $199,999 | 0 | 0.0% |
| $200,000+ | 9 | 2.3% |
Family Income by Famaliy Size in Monon
6-person families (18 | 4.6%) account for the highest median family income in Monon with $78,125 per family, while 2-person families (149 | 38.3%) have the highest median income of $26,719 per family member.
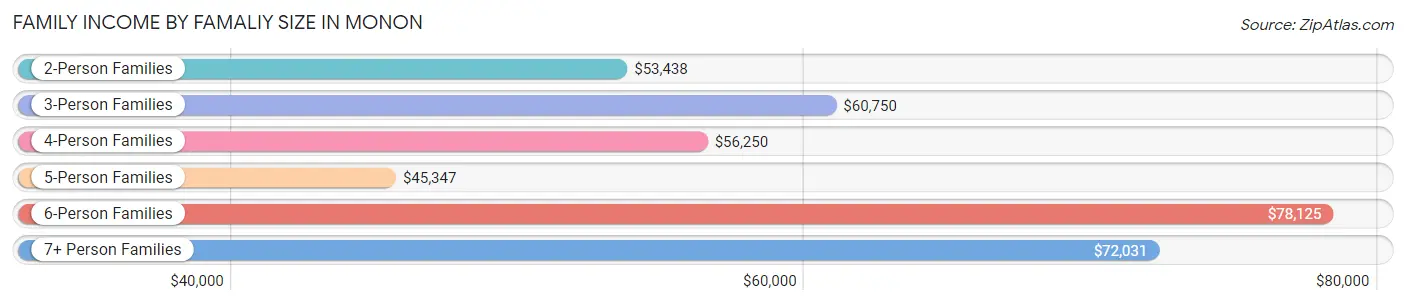
| Income Bracket | # Families | Median Income |
| 2-Person Families | 149 (38.3%) | $53,438 |
| 3-Person Families | 86 (22.1%) | $60,750 |
| 4-Person Families | 64 (16.5%) | $56,250 |
| 5-Person Families | 59 (15.2%) | $45,347 |
| 6-Person Families | 18 (4.6%) | $78,125 |
| 7+ Person Families | 13 (3.3%) | $72,031 |
| Total | 389 (100.0%) | $55,469 |
Family Income by Number of Earners in Monon
The median family income in Monon is $55,469, with families comprising no earners (22) having the highest median family income of $97,813, while families with 1 earner (174) have the lowest median family income of $45,086, accounting for 5.7% and 44.7% of families, respectively.
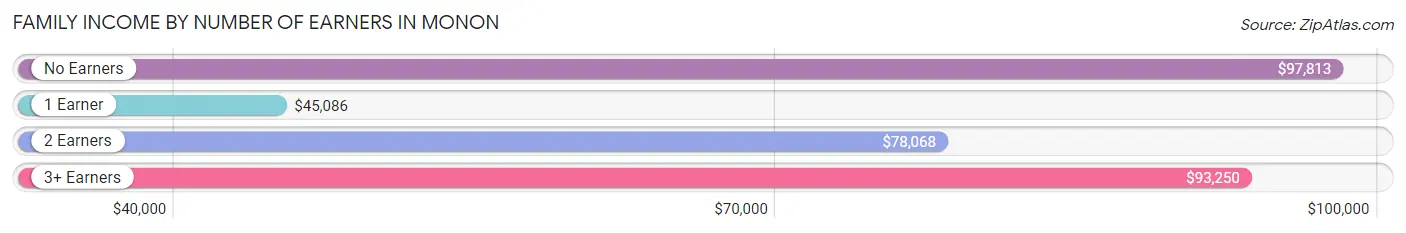
| Number of Earners | # Families | Median Income |
| No Earners | 22 (5.7%) | $97,813 |
| 1 Earner | 174 (44.7%) | $45,086 |
| 2 Earners | 130 (33.4%) | $78,068 |
| 3+ Earners | 63 (16.2%) | $93,250 |
| Total | 389 (100.0%) | $55,469 |
Household Income in Monon
Household Income Brackets in Monon
With 135 households falling in the category, the $50,000 to $74,999 income range is the most frequent in Monon, accounting for 23.2% of all households.
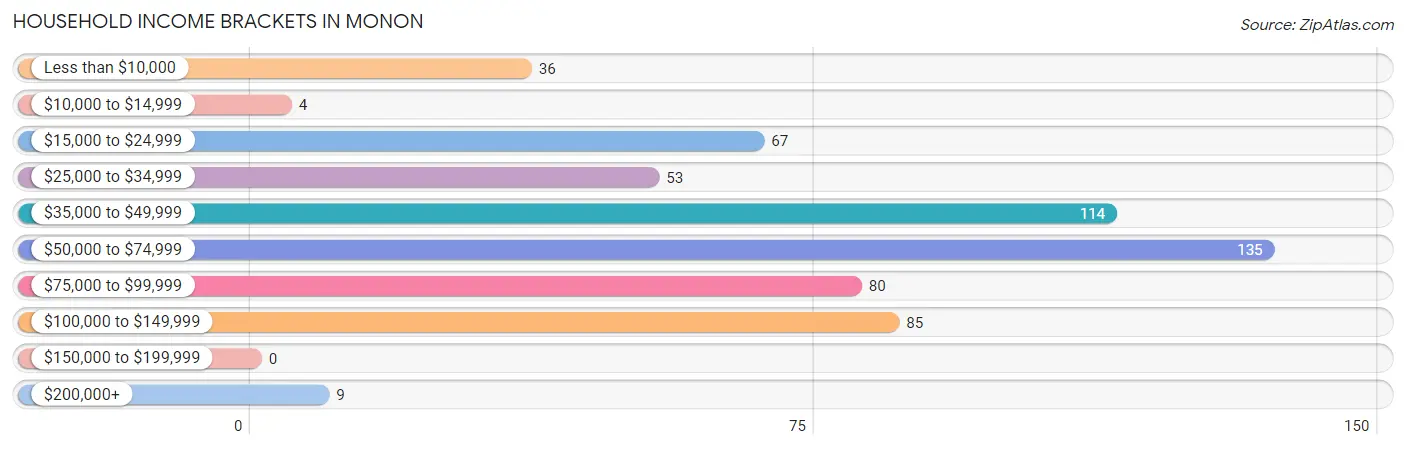
| Income Bracket | # Households | % Households |
| Less than $10,000 | 36 | 6.2% |
| $10,000 to $14,999 | 4 | 0.7% |
| $15,000 to $24,999 | 67 | 11.5% |
| $25,000 to $34,999 | 53 | 9.1% |
| $35,000 to $49,999 | 114 | 19.6% |
| $50,000 to $74,999 | 135 | 23.2% |
| $75,000 to $99,999 | 80 | 13.7% |
| $100,000 to $149,999 | 85 | 14.6% |
| $150,000 to $199,999 | 0 | 0.0% |
| $200,000+ | 9 | 1.5% |
Household Income by Householder Age in Monon
The median household income in Monon is $52,596, with the highest median household income of $59,167 found in the 45 to 64 years age bracket for the primary householder. A total of 180 households (30.9%) fall into this category. Meanwhile, the 15 to 24 years age bracket for the primary householder has the lowest median household income of $0, with 16 households (2.7%) in this group.
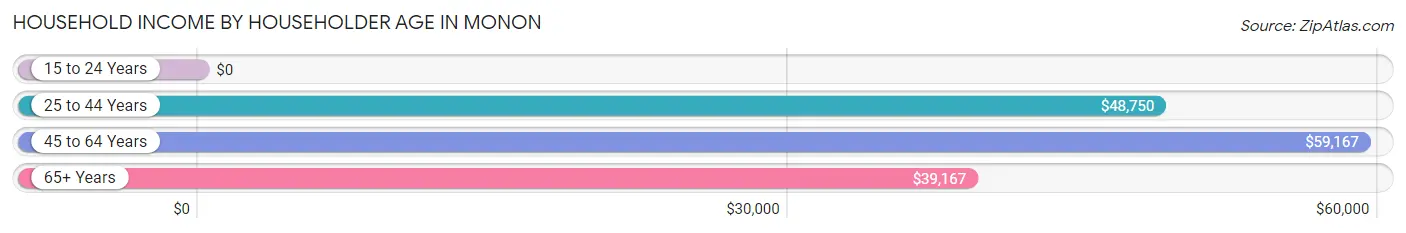
| Income Bracket | # Households | Median Income |
| 15 to 24 Years | 16 (2.7%) | $0 |
| 25 to 44 Years | 265 (45.5%) | $48,750 |
| 45 to 64 Years | 180 (30.9%) | $59,167 |
| 65+ Years | 122 (20.9%) | $39,167 |
| Total | 583 (100.0%) | $52,596 |
Poverty in Monon
Income Below Poverty by Sex and Age in Monon
With 17.3% poverty level for males and 18.9% for females among the residents of Monon, 45 to 54 year old males and 12 to 14 year old females are the most vulnerable to poverty, with 34 males (41.5%) and 16 females (40.0%) in their respective age groups living below the poverty level.
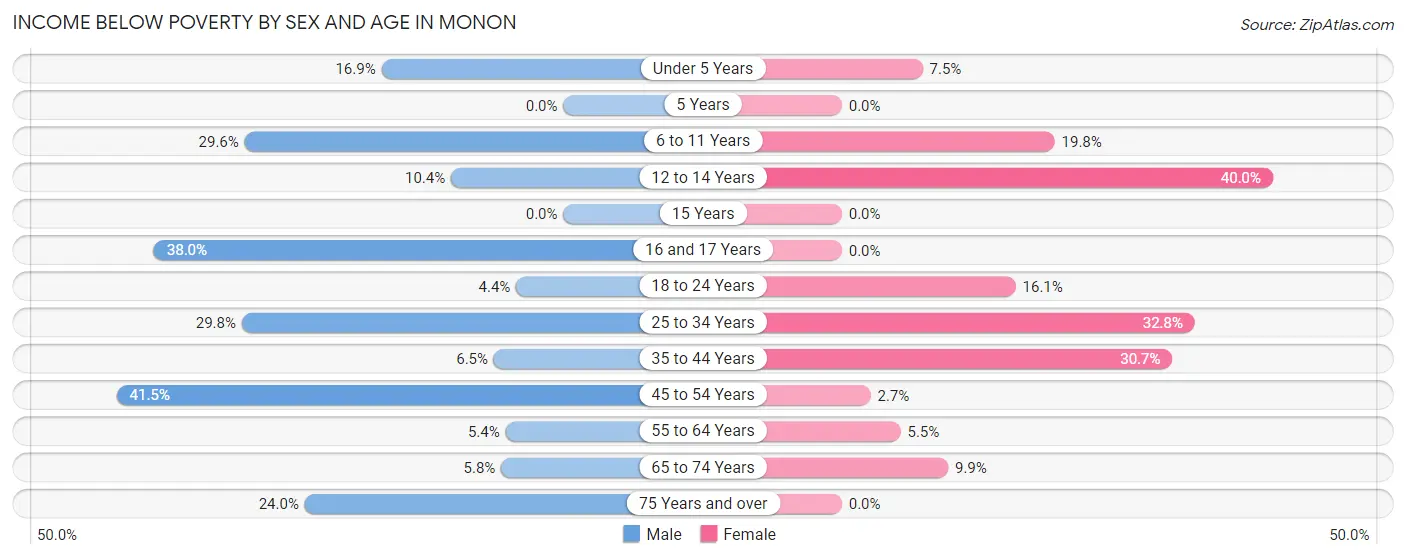
| Age Bracket | Male | Female |
| Under 5 Years | 13 (16.9%) | 6 (7.5%) |
| 5 Years | 0 (0.0%) | 0 (0.0%) |
| 6 to 11 Years | 21 (29.6%) | 31 (19.8%) |
| 12 to 14 Years | 5 (10.4%) | 16 (40.0%) |
| 15 Years | 0 (0.0%) | 0 (0.0%) |
| 16 and 17 Years | 19 (38.0%) | 0 (0.0%) |
| 18 to 24 Years | 7 (4.4%) | 10 (16.1%) |
| 25 to 34 Years | 37 (29.8%) | 38 (32.8%) |
| 35 to 44 Years | 8 (6.5%) | 46 (30.7%) |
| 45 to 54 Years | 34 (41.5%) | 2 (2.7%) |
| 55 to 64 Years | 3 (5.4%) | 3 (5.4%) |
| 65 to 74 Years | 3 (5.8%) | 7 (9.9%) |
| 75 Years and over | 6 (24.0%) | 0 (0.0%) |
| Total | 156 (17.3%) | 159 (18.9%) |
Income Above Poverty by Sex and Age in Monon
According to the poverty statistics in Monon, males aged 5 years and females aged 5 years are the age groups that are most secure financially, with 100.0% of males and 100.0% of females in these age groups living above the poverty line.
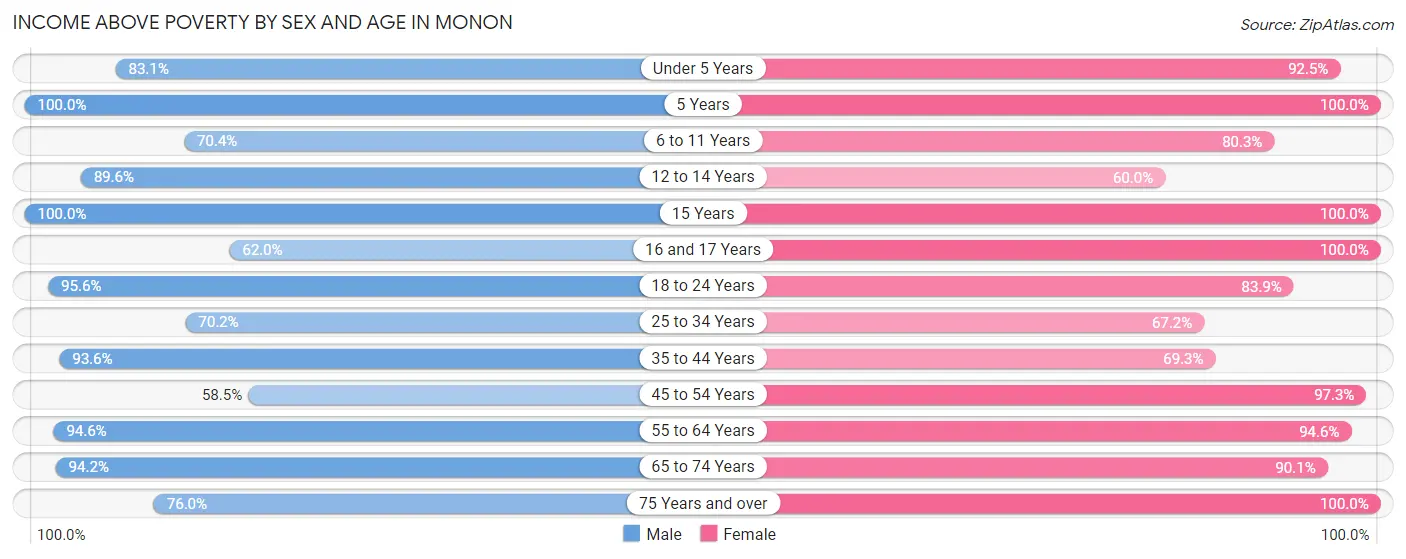
| Age Bracket | Male | Female |
| Under 5 Years | 64 (83.1%) | 74 (92.5%) |
| 5 Years | 19 (100.0%) | 3 (100.0%) |
| 6 to 11 Years | 50 (70.4%) | 126 (80.2%) |
| 12 to 14 Years | 43 (89.6%) | 24 (60.0%) |
| 15 Years | 14 (100.0%) | 5 (100.0%) |
| 16 and 17 Years | 31 (62.0%) | 14 (100.0%) |
| 18 to 24 Years | 153 (95.6%) | 52 (83.9%) |
| 25 to 34 Years | 87 (70.2%) | 78 (67.2%) |
| 35 to 44 Years | 116 (93.5%) | 104 (69.3%) |
| 45 to 54 Years | 48 (58.5%) | 73 (97.3%) |
| 55 to 64 Years | 53 (94.6%) | 52 (94.6%) |
| 65 to 74 Years | 49 (94.2%) | 64 (90.1%) |
| 75 Years and over | 19 (76.0%) | 12 (100.0%) |
| Total | 746 (82.7%) | 681 (81.1%) |
Income Below Poverty Among Married-Couple Families in Monon
The poverty statistics for married-couple families in Monon show that 18.5% or 38 of the total 205 families live below the poverty line. Families with 3 or 4 children have the highest poverty rate of 39.3%, comprising of 24 families. On the other hand, families with 5 or more children have the lowest poverty rate of 0.0%, which includes 0 families.
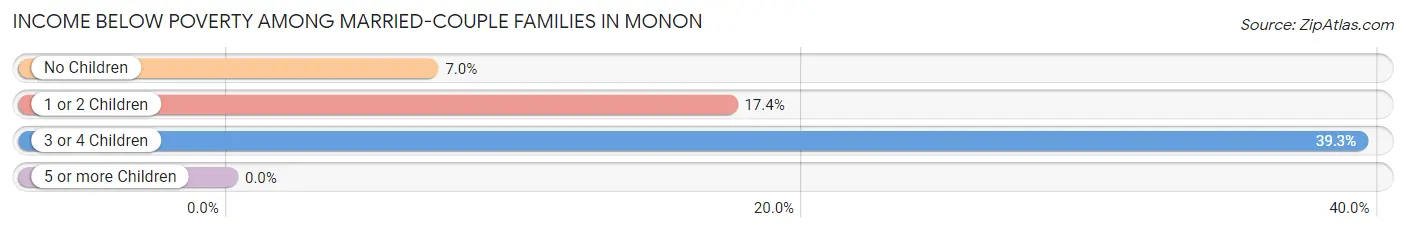
| Children | Above Poverty | Below Poverty |
| No Children | 80 (93.0%) | 6 (7.0%) |
| 1 or 2 Children | 38 (82.6%) | 8 (17.4%) |
| 3 or 4 Children | 37 (60.7%) | 24 (39.3%) |
| 5 or more Children | 12 (100.0%) | 0 (0.0%) |
| Total | 167 (81.5%) | 38 (18.5%) |
Income Below Poverty Among Single-Parent Households in Monon
According to the poverty data in Monon, 13.3% or 18 single-father households and 4.1% or 2 single-mother households are living below the poverty line. Among single-father households, those with 1 or 2 children have the highest poverty rate, with 18 households (20.2%) experiencing poverty. Likewise, among single-mother households, those with 1 or 2 children have the highest poverty rate, with 2 households (6.1%) falling below the poverty line.
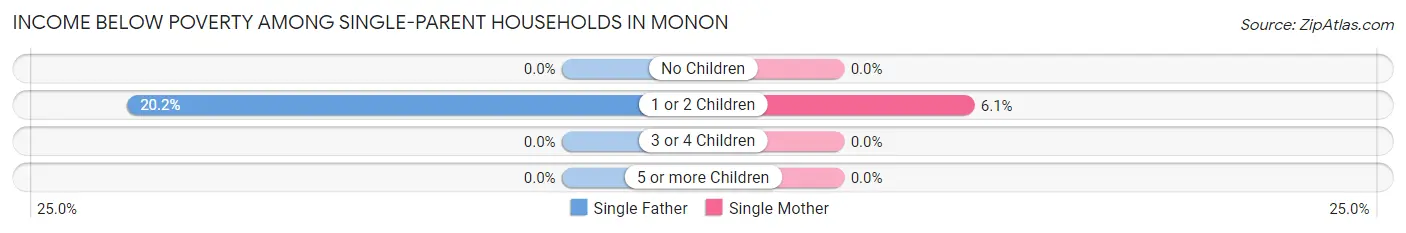
| Children | Single Father | Single Mother |
| No Children | 0 (0.0%) | 0 (0.0%) |
| 1 or 2 Children | 18 (20.2%) | 2 (6.1%) |
| 3 or 4 Children | 0 (0.0%) | 0 (0.0%) |
| 5 or more Children | 0 (0.0%) | 0 (0.0%) |
| Total | 18 (13.3%) | 2 (4.1%) |
Income Below Poverty Among Married-Couple vs Single-Parent Households in Monon
The poverty data for Monon shows that 38 of the married-couple family households (18.5%) and 20 of the single-parent households (10.9%) are living below the poverty level. Within the married-couple family households, those with 3 or 4 children have the highest poverty rate, with 24 households (39.3%) falling below the poverty line. Among the single-parent households, those with 1 or 2 children have the highest poverty rate, with 20 household (16.4%) living below poverty.
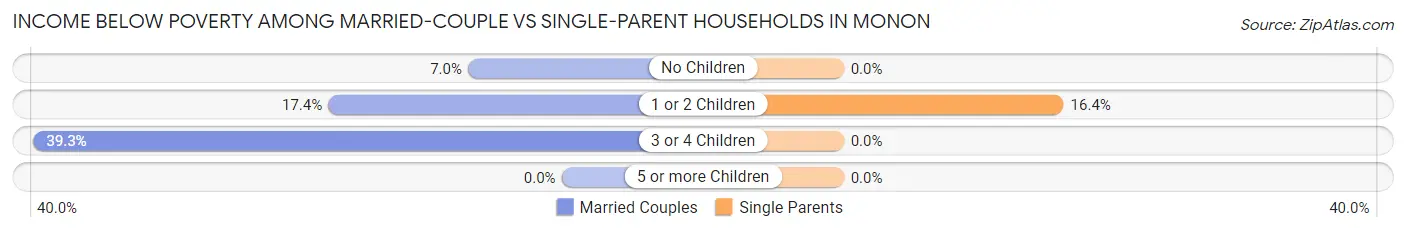
| Children | Married-Couple Families | Single-Parent Households |
| No Children | 6 (7.0%) | 0 (0.0%) |
| 1 or 2 Children | 8 (17.4%) | 20 (16.4%) |
| 3 or 4 Children | 24 (39.3%) | 0 (0.0%) |
| 5 or more Children | 0 (0.0%) | 0 (0.0%) |
| Total | 38 (18.5%) | 20 (10.9%) |
Race in Monon
The most populous races in Monon are Hispanic or Latino (968 | 54.9%), Some other Race (809 | 45.9%), and White / Caucasian (774 | 43.9%).
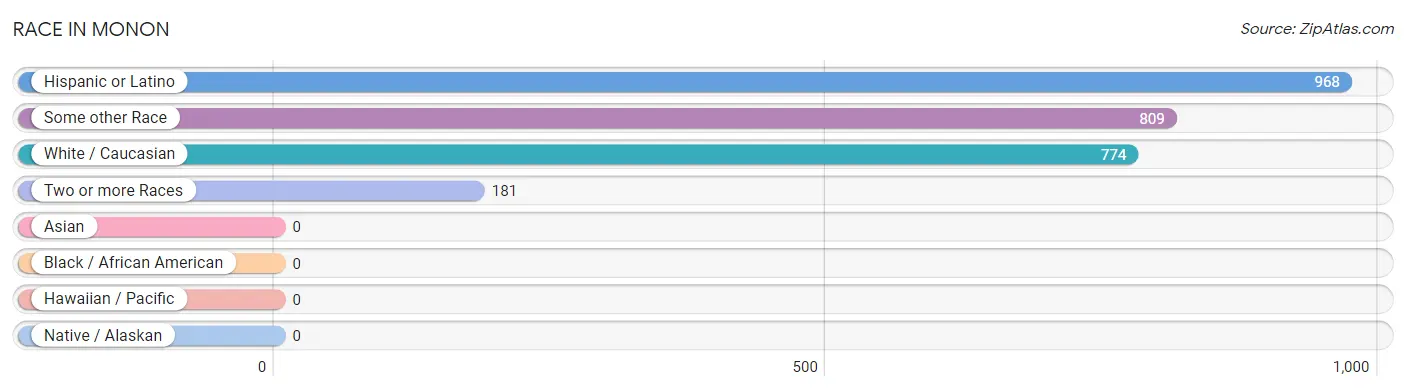
| Race | # Population | % Population |
| Asian | 0 | 0.0% |
| Black / African American | 0 | 0.0% |
| Hawaiian / Pacific | 0 | 0.0% |
| Hispanic or Latino | 968 | 54.9% |
| Native / Alaskan | 0 | 0.0% |
| White / Caucasian | 774 | 43.9% |
| Two or more Races | 181 | 10.3% |
| Some other Race | 809 | 45.9% |
| Total | 1,764 | 100.0% |
Ancestry in Monon
The most populous ancestries reported in Monon are Central American (737 | 41.8%), Salvadoran (695 | 39.4%), Mexican (193 | 10.9%), German (85 | 4.8%), and Irish (80 | 4.5%), together accounting for 101.5% of all Monon residents.
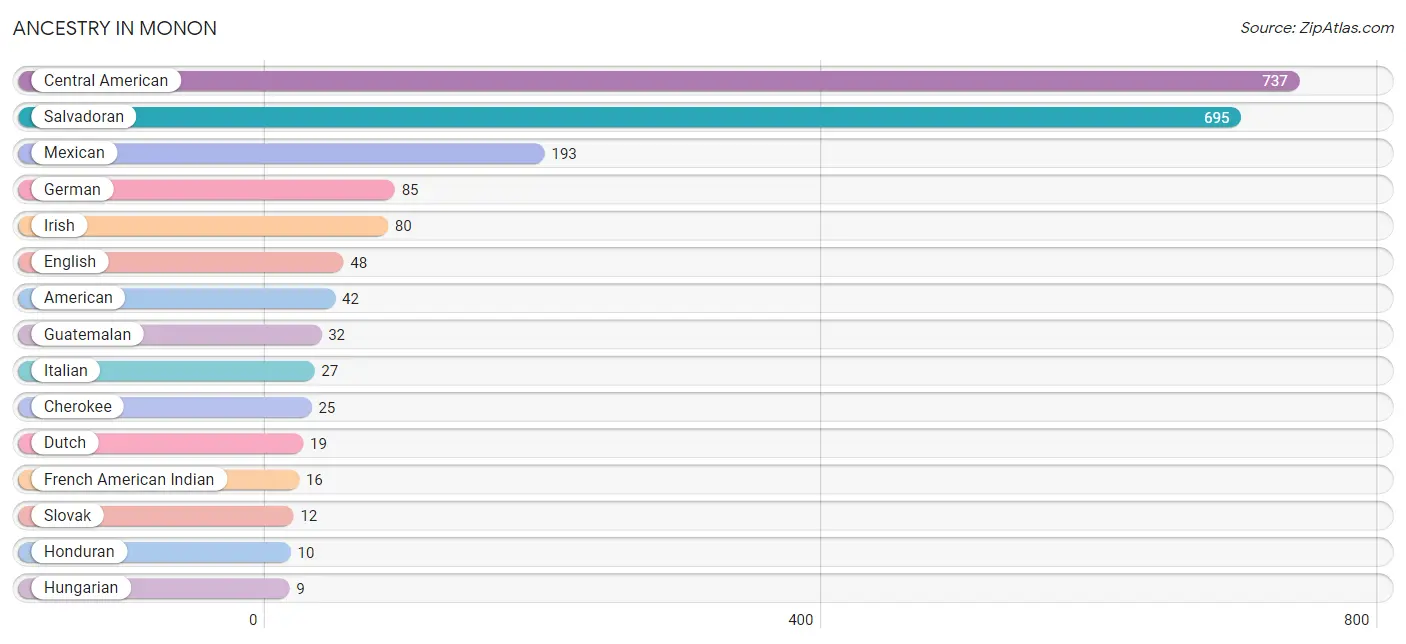
| Ancestry | # Population | % Population |
| American | 42 | 2.4% |
| British | 5 | 0.3% |
| Central American | 737 | 41.8% |
| Cherokee | 25 | 1.4% |
| Dutch | 19 | 1.1% |
| English | 48 | 2.7% |
| European | 5 | 0.3% |
| French | 3 | 0.2% |
| French American Indian | 16 | 0.9% |
| German | 85 | 4.8% |
| Guatemalan | 32 | 1.8% |
| Honduran | 10 | 0.6% |
| Hungarian | 9 | 0.5% |
| Irish | 80 | 4.5% |
| Italian | 27 | 1.5% |
| Mexican | 193 | 10.9% |
| Northern European | 4 | 0.2% |
| Salvadoran | 695 | 39.4% |
| Slovak | 12 | 0.7% |
| Swedish | 3 | 0.2% | View All 20 Rows |
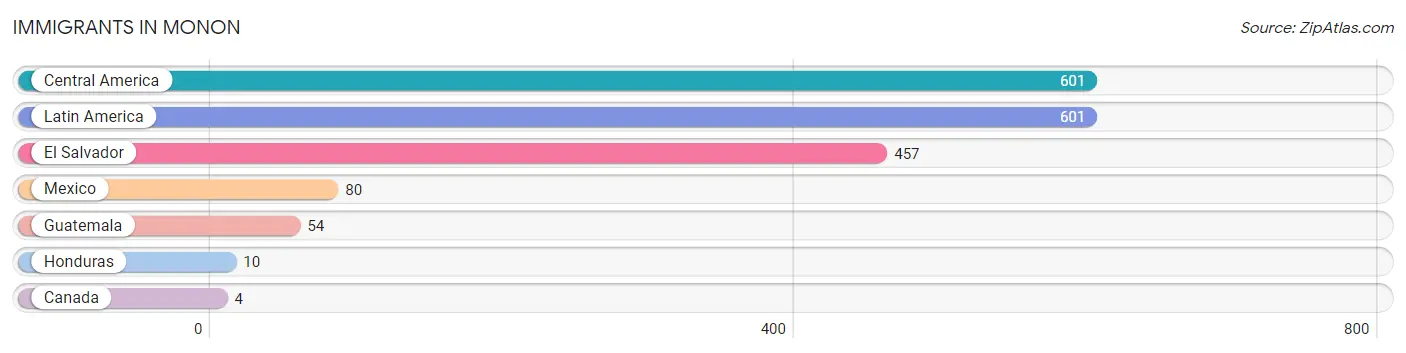
Immigrants in Monon
The most numerous immigrant groups reported in Monon came from Central America (601 | 34.1%), Latin America (601 | 34.1%), El Salvador (457 | 25.9%), Mexico (80 | 4.5%), and Guatemala (54 | 3.1%), together accounting for 101.6% of all Monon residents.
| Immigration Origin | # Population | % Population |
| Canada | 4 | 0.2% |
| Central America | 601 | 34.1% |
| El Salvador | 457 | 25.9% |
| Guatemala | 54 | 3.1% |
| Honduras | 10 | 0.6% |
| Latin America | 601 | 34.1% |
| Mexico | 80 | 4.5% | View All 7 Rows |
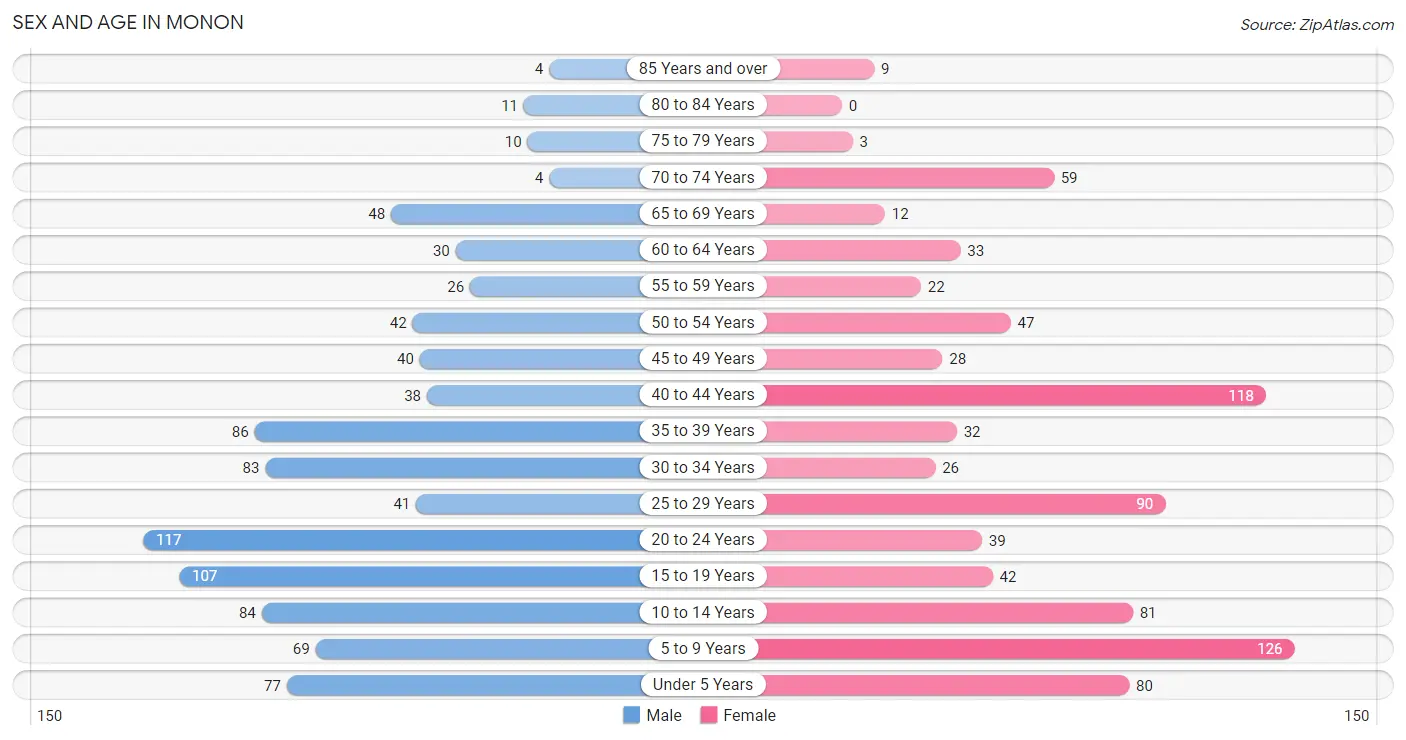
Sex and Age in Monon
Sex and Age in Monon
The most populous age groups in Monon are 20 to 24 Years (117 | 12.8%) for men and 5 to 9 Years (126 | 14.9%) for women.
| Age Bracket | Male | Female |
| Under 5 Years | 77 (8.4%) | 80 (9.5%) |
| 5 to 9 Years | 69 (7.5%) | 126 (14.9%) |
| 10 to 14 Years | 84 (9.2%) | 81 (9.6%) |
| 15 to 19 Years | 107 (11.7%) | 42 (5.0%) |
| 20 to 24 Years | 117 (12.8%) | 39 (4.6%) |
| 25 to 29 Years | 41 (4.5%) | 90 (10.6%) |
| 30 to 34 Years | 83 (9.0%) | 26 (3.1%) |
| 35 to 39 Years | 86 (9.4%) | 32 (3.8%) |
| 40 to 44 Years | 38 (4.1%) | 118 (13.9%) |
| 45 to 49 Years | 40 (4.4%) | 28 (3.3%) |
| 50 to 54 Years | 42 (4.6%) | 47 (5.6%) |
| 55 to 59 Years | 26 (2.8%) | 22 (2.6%) |
| 60 to 64 Years | 30 (3.3%) | 33 (3.9%) |
| 65 to 69 Years | 48 (5.2%) | 12 (1.4%) |
| 70 to 74 Years | 4 (0.4%) | 59 (7.0%) |
| 75 to 79 Years | 10 (1.1%) | 3 (0.4%) |
| 80 to 84 Years | 11 (1.2%) | 0 (0.0%) |
| 85 Years and over | 4 (0.4%) | 9 (1.1%) |
| Total | 917 (100.0%) | 847 (100.0%) |
Families and Households in Monon
Median Family Size in Monon
The median family size in Monon is 3.48 persons per family, with single female/mother families (49 | 12.6%) accounting for the largest median family size of 3.92 persons per family. On the other hand, single male/father families (135 | 34.7%) represent the smallest median family size with 2.84 persons per family.
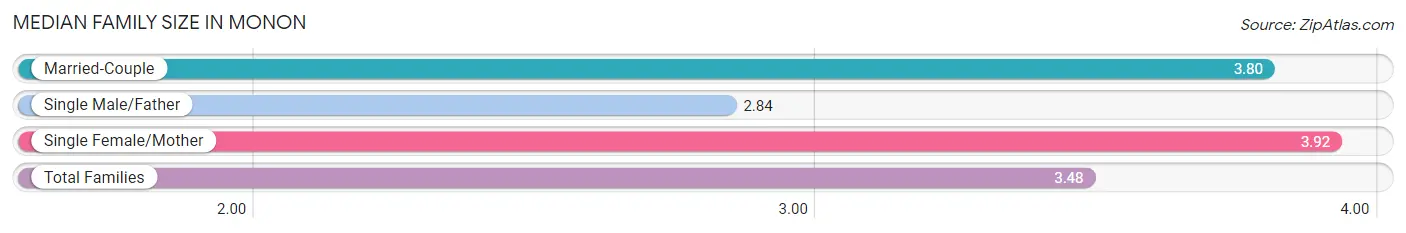
| Family Type | # Families | Family Size |
| Married-Couple | 205 (52.7%) | 3.80 |
| Single Male/Father | 135 (34.7%) | 2.84 |
| Single Female/Mother | 49 (12.6%) | 3.92 |
| Total Families | 389 (100.0%) | 3.48 |
Median Household Size in Monon
The median household size in Monon is 2.98 persons per household, with single female/mother households (49 | 8.4%) accounting for the largest median household size of 4.96 persons per household. non-family households (194 | 33.3%) represent the smallest median household size with 1.27 persons per household.
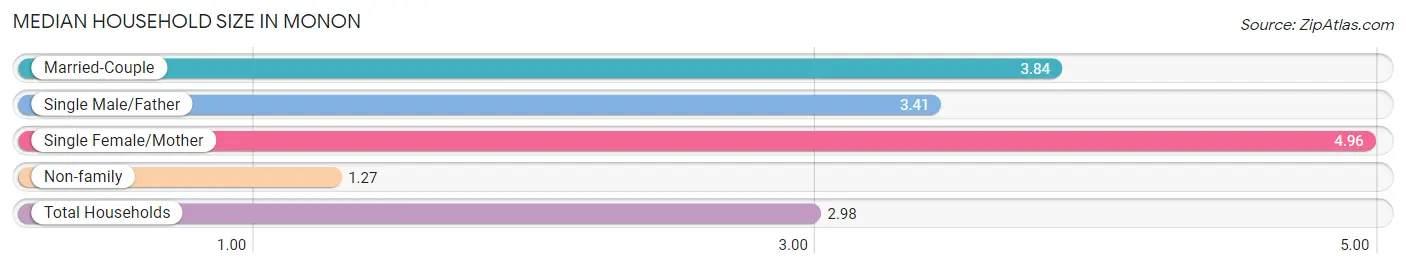
| Household Type | # Households | Household Size |
| Married-Couple | 205 (35.2%) | 3.84 |
| Single Male/Father | 135 (23.2%) | 3.41 |
| Single Female/Mother | 49 (8.4%) | 4.96 |
| Non-family | 194 (33.3%) | 1.27 |
| Total Households | 583 (100.0%) | 2.98 |
Household Size by Marriage Status in Monon
Out of a total of 583 households in Monon, 389 (66.7%) are family households, while 194 (33.3%) are nonfamily households. The most numerous type of family households are 4-person households, comprising 109, and the most common type of nonfamily households are 1-person households, comprising 150.
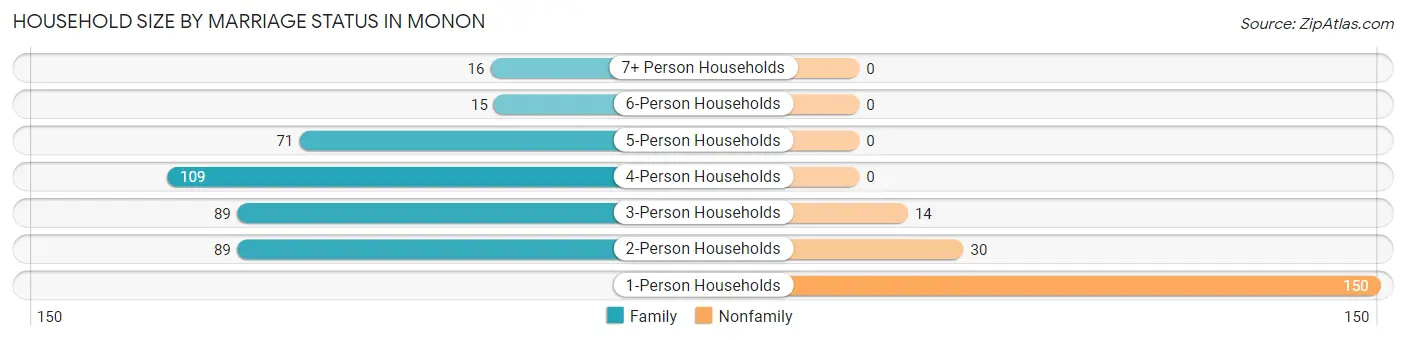
| Household Size | Family Households | Nonfamily Households |
| 1-Person Households | - | 150 (25.7%) |
| 2-Person Households | 89 (15.3%) | 30 (5.1%) |
| 3-Person Households | 89 (15.3%) | 14 (2.4%) |
| 4-Person Households | 109 (18.7%) | 0 (0.0%) |
| 5-Person Households | 71 (12.2%) | 0 (0.0%) |
| 6-Person Households | 15 (2.6%) | 0 (0.0%) |
| 7+ Person Households | 16 (2.7%) | 0 (0.0%) |
| Total | 389 (66.7%) | 194 (33.3%) |
Female Fertility in Monon
Fertility by Age in Monon
Average fertility rate in Monon is 99.0 births per 1,000 women. Women in the age bracket of 20 to 34 years have the highest fertility rate with 142.0 births per 1,000 women. Women in the age bracket of 20 to 34 years acount for 57.9% of all women with births.
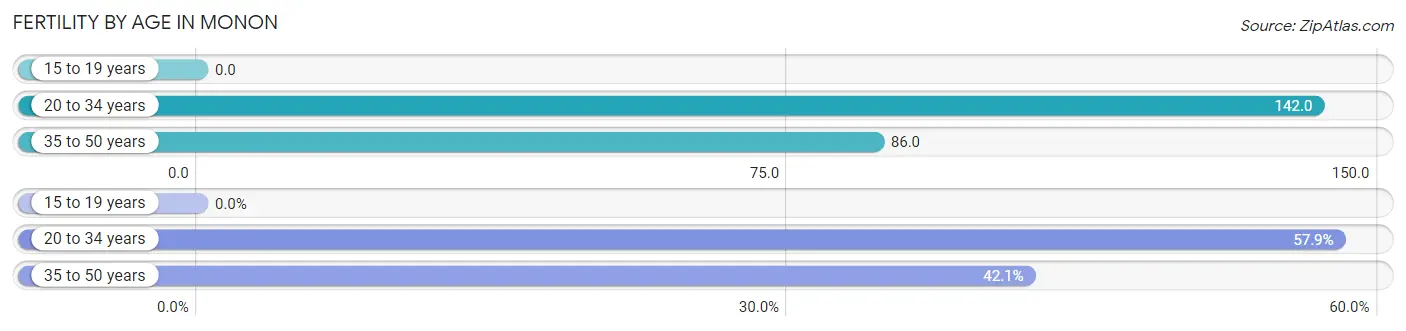
| Age Bracket | Women with Births | Births / 1,000 Women |
| 15 to 19 years | 0 (0.0%) | 0.0 |
| 20 to 34 years | 22 (57.9%) | 142.0 |
| 35 to 50 years | 16 (42.1%) | 86.0 |
| Total | 38 (100.0%) | 99.0 |
Fertility by Age by Marriage Status in Monon
71.1% of women with births (38) in Monon are married. The highest percentage of unmarried women with births falls into 35 to 50 years age bracket with 68.8% of them unmarried at the time of birth, while the lowest percentage of unmarried women with births belong to 20 to 34 years age bracket with 0.0% of them unmarried.
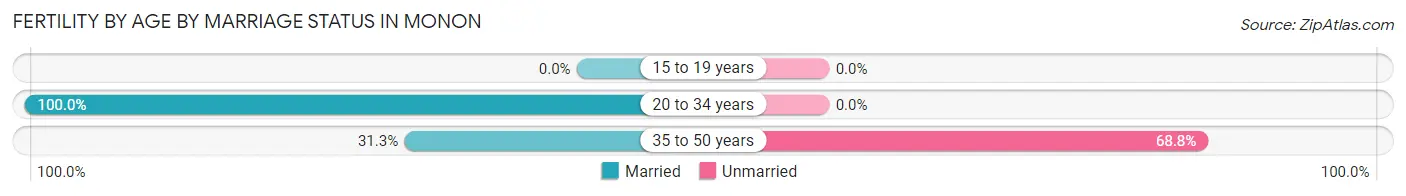
| Age Bracket | Married | Unmarried |
| 15 to 19 years | 0 (0.0%) | 0 (0.0%) |
| 20 to 34 years | 22 (100.0%) | 0 (0.0%) |
| 35 to 50 years | 5 (31.2%) | 11 (68.8%) |
| Total | 27 (71.1%) | 11 (28.9%) |
Fertility by Education in Monon
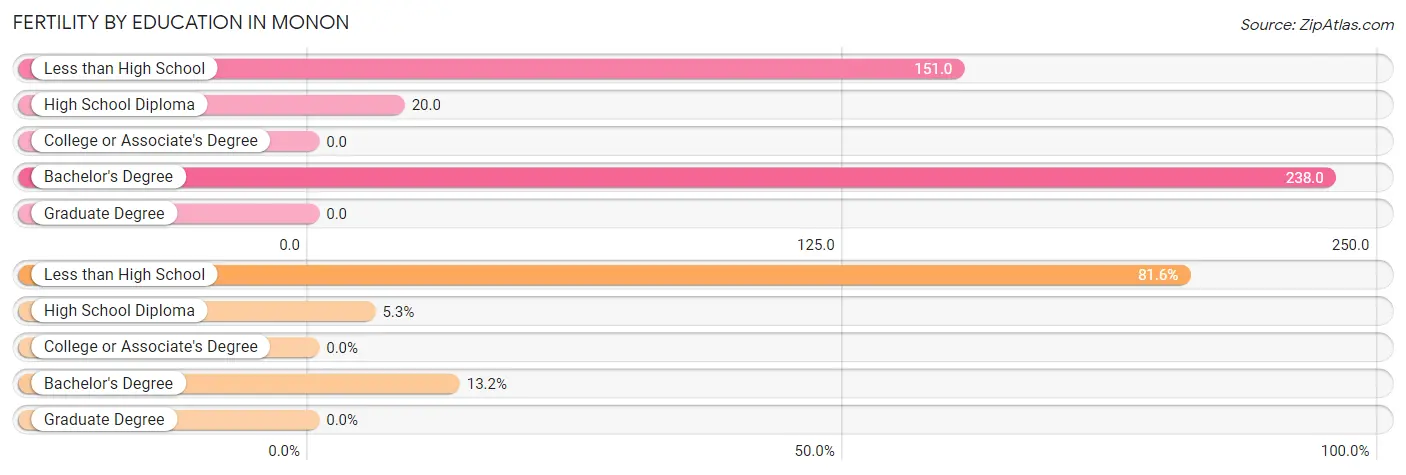
| Educational Attainment | Women with Births | Births / 1,000 Women |
| Less than High School | 31 (81.6%) | 151.0 |
| High School Diploma | 2 (5.3%) | 20.0 |
| College or Associate's Degree | 0 (0.0%) | 0.0 |
| Bachelor's Degree | 5 (13.2%) | 238.0 |
| Graduate Degree | 0 (0.0%) | 0.0 |
| Total | 38 (100.0%) | 99.0 |
Fertility by Education by Marriage Status in Monon
28.9% of women with births in Monon are unmarried. Women with the educational attainment of high school diploma are most likely to be married with 100.0% of them married at childbirth, while women with the educational attainment of less than high school are least likely to be married with 35.5% of them unmarried at childbirth.
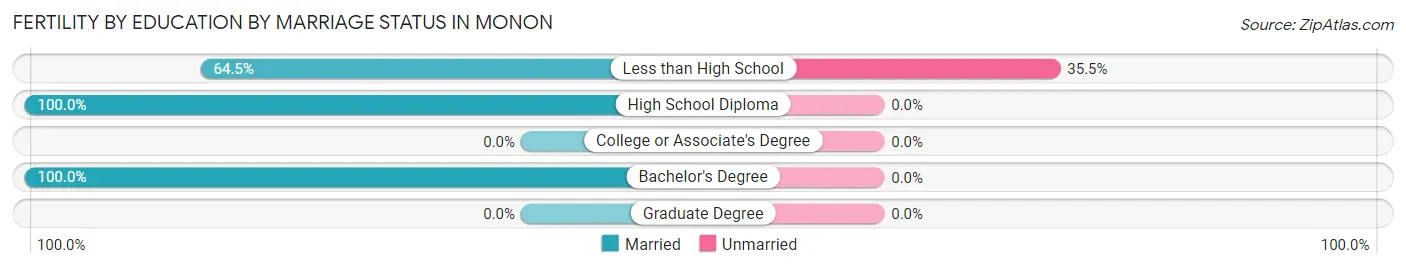
| Educational Attainment | Married | Unmarried |
| Less than High School | 20 (64.5%) | 11 (35.5%) |
| High School Diploma | 2 (100.0%) | 0 (0.0%) |
| College or Associate's Degree | 0 (0.0%) | 0 (0.0%) |
| Bachelor's Degree | 5 (100.0%) | 0 (0.0%) |
| Graduate Degree | 0 (0.0%) | 0 (0.0%) |
| Total | 27 (71.1%) | 11 (28.9%) |
Employment Characteristics in Monon
Employment by Class of Employer in Monon
Among the 741 employed individuals in Monon, private company employees (591 | 79.8%), local government employees (57 | 7.7%), and self-employed (not incorporated) (35 | 4.7%) make up the most common classes of employment.
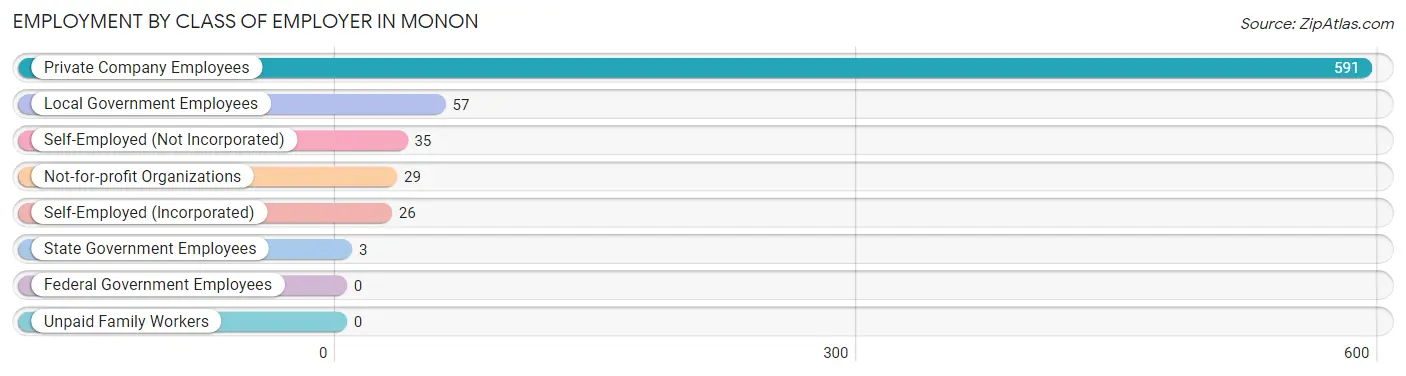
| Employer Class | # Employees | % Employees |
| Private Company Employees | 591 | 79.8% |
| Self-Employed (Incorporated) | 26 | 3.5% |
| Self-Employed (Not Incorporated) | 35 | 4.7% |
| Not-for-profit Organizations | 29 | 3.9% |
| Local Government Employees | 57 | 7.7% |
| State Government Employees | 3 | 0.4% |
| Federal Government Employees | 0 | 0.0% |
| Unpaid Family Workers | 0 | 0.0% |
| Total | 741 | 100.0% |
Employment Status by Age in Monon
According to the labor force statistics for Monon, out of the total population over 16 years of age (1,228), 69.0% or 847 individuals are in the labor force, with 9.9% or 84 of them unemployed. The age group with the highest labor force participation rate is 20 to 24 years, with 97.4% or 152 individuals in the labor force. Within the labor force, the 25 to 29 years age range has the highest percentage of unemployed individuals, with 28.6% or 24 of them being unemployed.
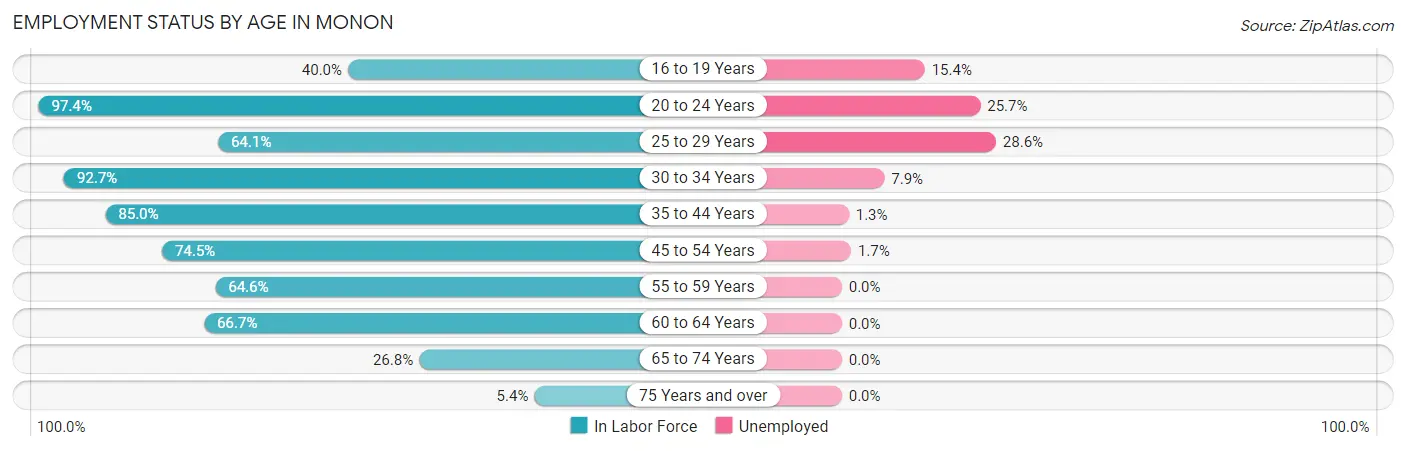
| Age Bracket | In Labor Force | Unemployed |
| 16 to 19 Years | 52 (40.0%) | 8 (15.4%) |
| 20 to 24 Years | 152 (97.4%) | 39 (25.7%) |
| 25 to 29 Years | 84 (64.1%) | 24 (28.6%) |
| 30 to 34 Years | 101 (92.7%) | 8 (7.9%) |
| 35 to 44 Years | 233 (85.0%) | 3 (1.3%) |
| 45 to 54 Years | 117 (74.5%) | 2 (1.7%) |
| 55 to 59 Years | 31 (64.6%) | 0 (0.0%) |
| 60 to 64 Years | 42 (66.7%) | 0 (0.0%) |
| 65 to 74 Years | 33 (26.8%) | 0 (0.0%) |
| 75 Years and over | 2 (5.4%) | 0 (0.0%) |
| Total | 847 (69.0%) | 84 (9.9%) |
Employment Status by Educational Attainment in Monon
According to labor force statistics for Monon, 77.7% of individuals (608) out of the total population between 25 and 64 years of age (782) are in the labor force, with 6.1% or 37 of them being unemployed. The group with the highest labor force participation rate are those with the educational attainment of high school diploma, with 92.5% or 185 individuals in the labor force. Within the labor force, individuals with less than high school education have the highest percentage of unemployment, with 11.3% or 28 of them being unemployed.
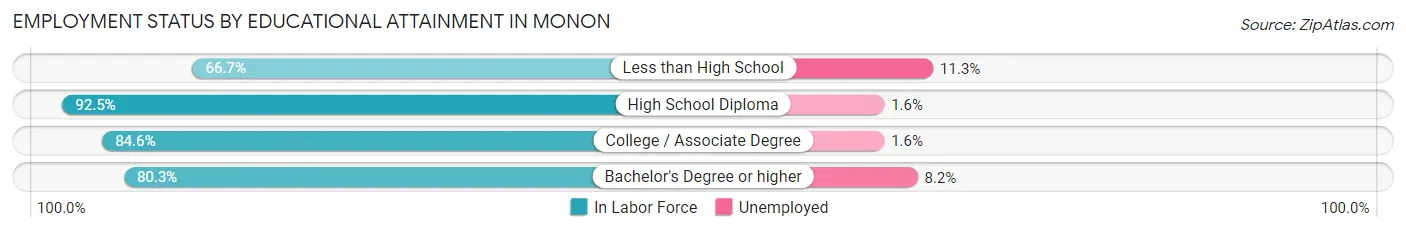
| Educational Attainment | In Labor Force | Unemployed |
| Less than High School | 248 (66.7%) | 42 (11.3%) |
| High School Diploma | 185 (92.5%) | 3 (1.6%) |
| College / Associate Degree | 126 (84.6%) | 2 (1.6%) |
| Bachelor's Degree or higher | 49 (80.3%) | 5 (8.2%) |
| Total | 608 (77.7%) | 48 (6.1%) |
Employment Occupations by Sex in Monon
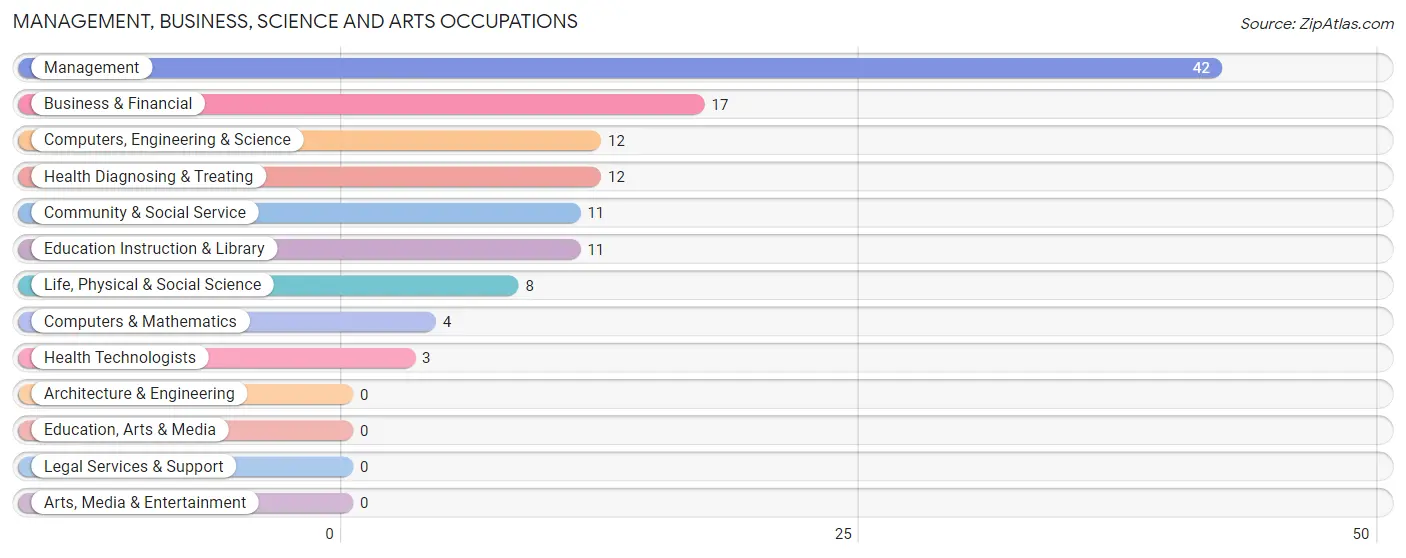
Management, Business, Science and Arts Occupations
The most common Management, Business, Science and Arts occupations in Monon are Management (42 | 5.5%), Business & Financial (17 | 2.2%), Computers, Engineering & Science (12 | 1.6%), Health Diagnosing & Treating (12 | 1.6%), and Community & Social Service (11 | 1.4%).
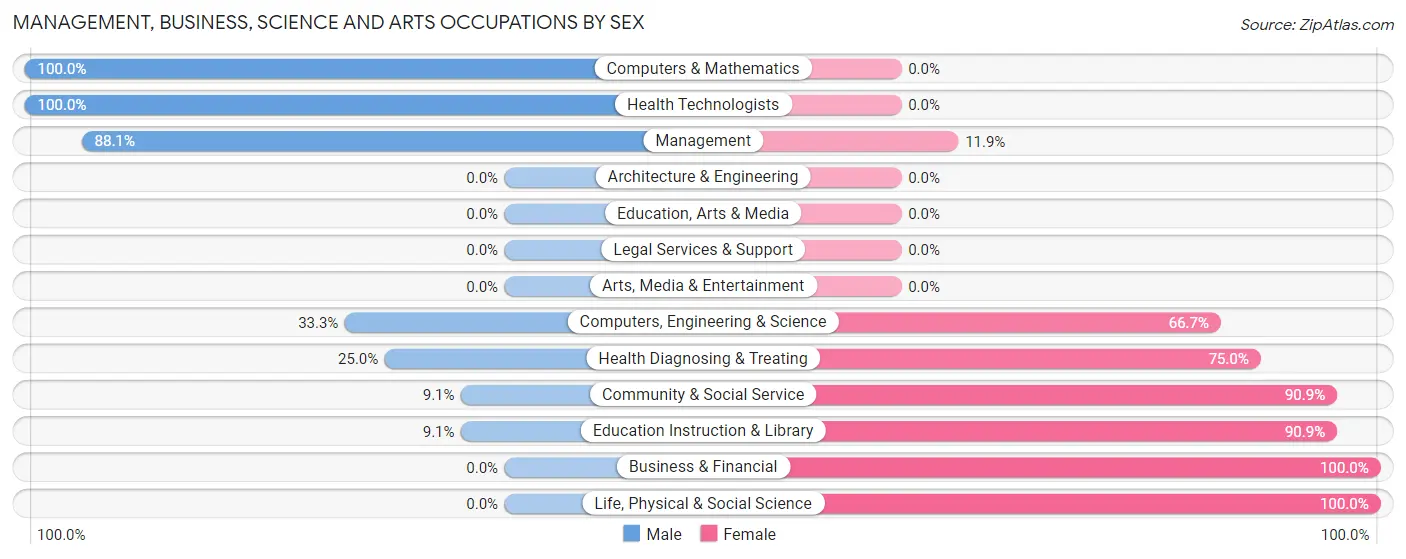
Management, Business, Science and Arts Occupations by Sex
Within the Management, Business, Science and Arts occupations in Monon, the most male-oriented occupations are Computers & Mathematics (100.0%), Health Technologists (100.0%), and Management (88.1%), while the most female-oriented occupations are Business & Financial (100.0%), Life, Physical & Social Science (100.0%), and Community & Social Service (90.9%).
| Occupation | Male | Female |
| Management | 37 (88.1%) | 5 (11.9%) |
| Business & Financial | 0 (0.0%) | 17 (100.0%) |
| Computers, Engineering & Science | 4 (33.3%) | 8 (66.7%) |
| Computers & Mathematics | 4 (100.0%) | 0 (0.0%) |
| Architecture & Engineering | 0 (0.0%) | 0 (0.0%) |
| Life, Physical & Social Science | 0 (0.0%) | 8 (100.0%) |
| Community & Social Service | 1 (9.1%) | 10 (90.9%) |
| Education, Arts & Media | 0 (0.0%) | 0 (0.0%) |
| Legal Services & Support | 0 (0.0%) | 0 (0.0%) |
| Education Instruction & Library | 1 (9.1%) | 10 (90.9%) |
| Arts, Media & Entertainment | 0 (0.0%) | 0 (0.0%) |
| Health Diagnosing & Treating | 3 (25.0%) | 9 (75.0%) |
| Health Technologists | 3 (100.0%) | 0 (0.0%) |
| Total (Category) | 45 (47.9%) | 49 (52.1%) |
| Total (Overall) | 462 (60.6%) | 301 (39.5%) |
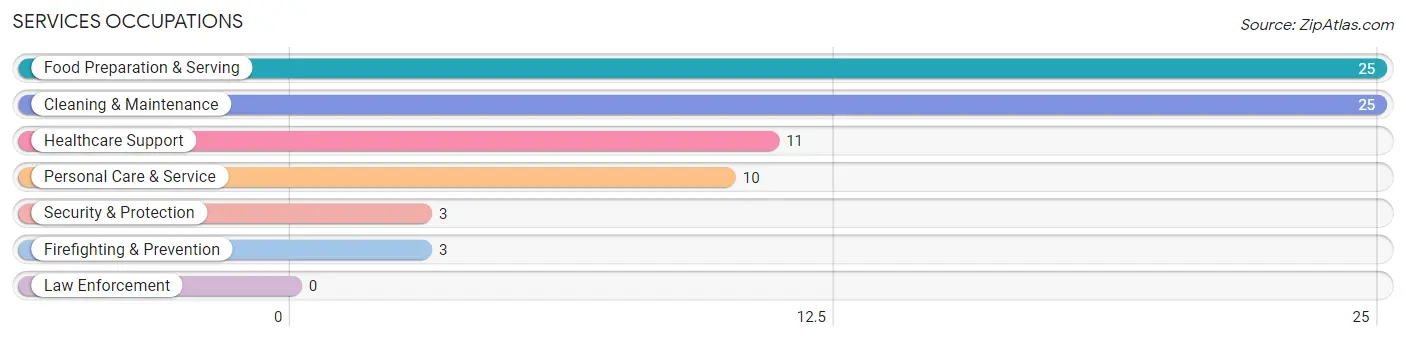
Services Occupations
The most common Services occupations in Monon are Food Preparation & Serving (25 | 3.3%), Cleaning & Maintenance (25 | 3.3%), Healthcare Support (11 | 1.4%), Personal Care & Service (10 | 1.3%), and Security & Protection (3 | 0.4%).
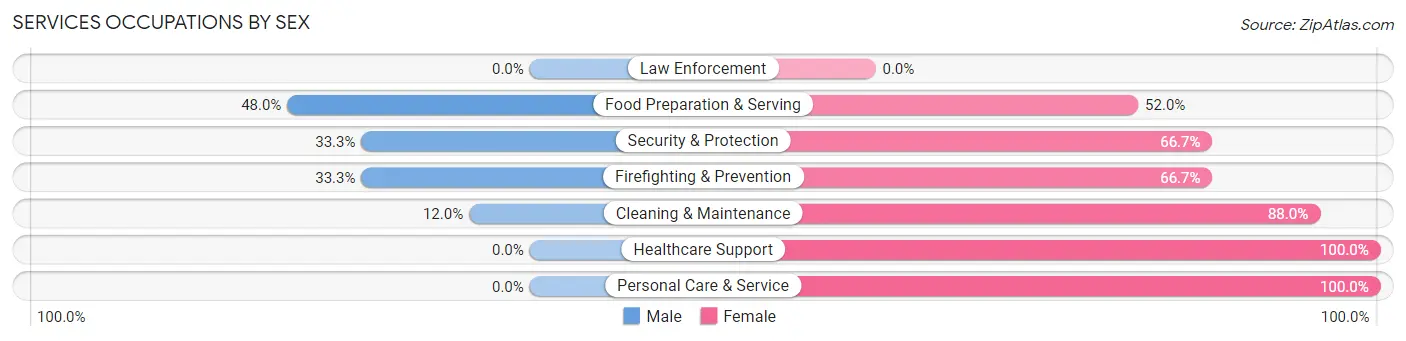
Services Occupations by Sex
Within the Services occupations in Monon, the most male-oriented occupations are Food Preparation & Serving (48.0%), Security & Protection (33.3%), and Firefighting & Prevention (33.3%), while the most female-oriented occupations are Healthcare Support (100.0%), Personal Care & Service (100.0%), and Cleaning & Maintenance (88.0%).
| Occupation | Male | Female |
| Healthcare Support | 0 (0.0%) | 11 (100.0%) |
| Security & Protection | 1 (33.3%) | 2 (66.7%) |
| Firefighting & Prevention | 1 (33.3%) | 2 (66.7%) |
| Law Enforcement | 0 (0.0%) | 0 (0.0%) |
| Food Preparation & Serving | 12 (48.0%) | 13 (52.0%) |
| Cleaning & Maintenance | 3 (12.0%) | 22 (88.0%) |
| Personal Care & Service | 0 (0.0%) | 10 (100.0%) |
| Total (Category) | 16 (21.6%) | 58 (78.4%) |
| Total (Overall) | 462 (60.6%) | 301 (39.5%) |
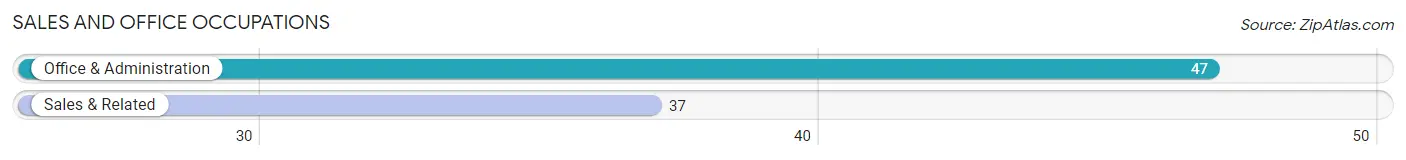
Sales and Office Occupations
The most common Sales and Office occupations in Monon are Office & Administration (47 | 6.2%), and Sales & Related (37 | 4.9%).
Sales and Office Occupations by Sex
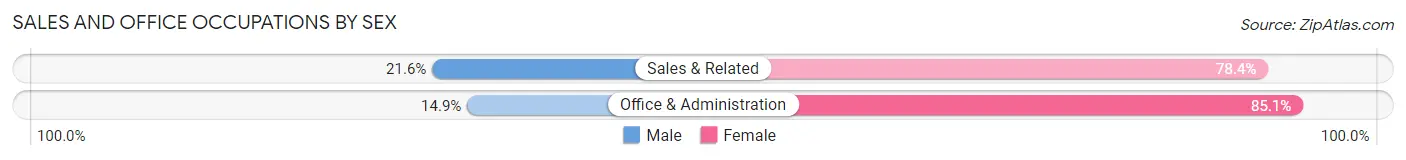
| Occupation | Male | Female |
| Sales & Related | 8 (21.6%) | 29 (78.4%) |
| Office & Administration | 7 (14.9%) | 40 (85.1%) |
| Total (Category) | 15 (17.9%) | 69 (82.1%) |
| Total (Overall) | 462 (60.6%) | 301 (39.5%) |
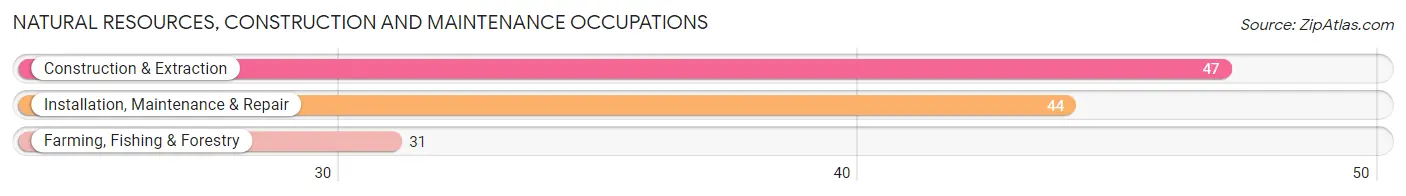
Natural Resources, Construction and Maintenance Occupations
The most common Natural Resources, Construction and Maintenance occupations in Monon are Construction & Extraction (47 | 6.2%), Installation, Maintenance & Repair (44 | 5.8%), and Farming, Fishing & Forestry (31 | 4.1%).
Natural Resources, Construction and Maintenance Occupations by Sex
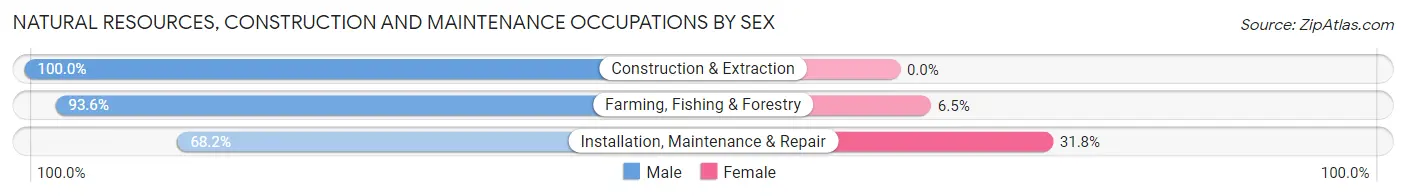
| Occupation | Male | Female |
| Farming, Fishing & Forestry | 29 (93.5%) | 2 (6.5%) |
| Construction & Extraction | 47 (100.0%) | 0 (0.0%) |
| Installation, Maintenance & Repair | 30 (68.2%) | 14 (31.8%) |
| Total (Category) | 106 (86.9%) | 16 (13.1%) |
| Total (Overall) | 462 (60.6%) | 301 (39.5%) |
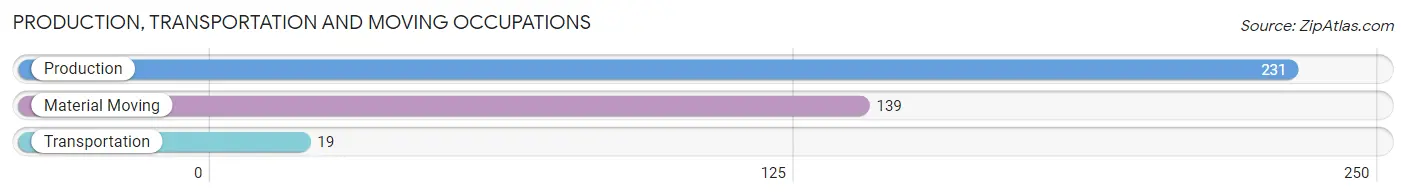
Production, Transportation and Moving Occupations
The most common Production, Transportation and Moving occupations in Monon are Production (231 | 30.3%), Material Moving (139 | 18.2%), and Transportation (19 | 2.5%).
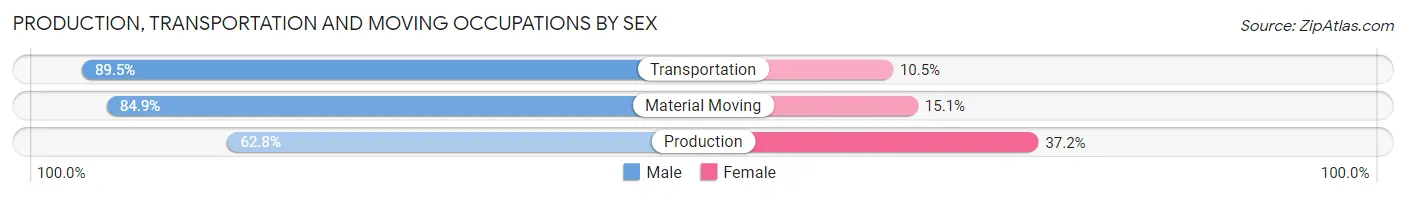
Production, Transportation and Moving Occupations by Sex
| Occupation | Male | Female |
| Production | 145 (62.8%) | 86 (37.2%) |
| Transportation | 17 (89.5%) | 2 (10.5%) |
| Material Moving | 118 (84.9%) | 21 (15.1%) |
| Total (Category) | 280 (72.0%) | 109 (28.0%) |
| Total (Overall) | 462 (60.6%) | 301 (39.5%) |
Employment Industries by Sex in Monon
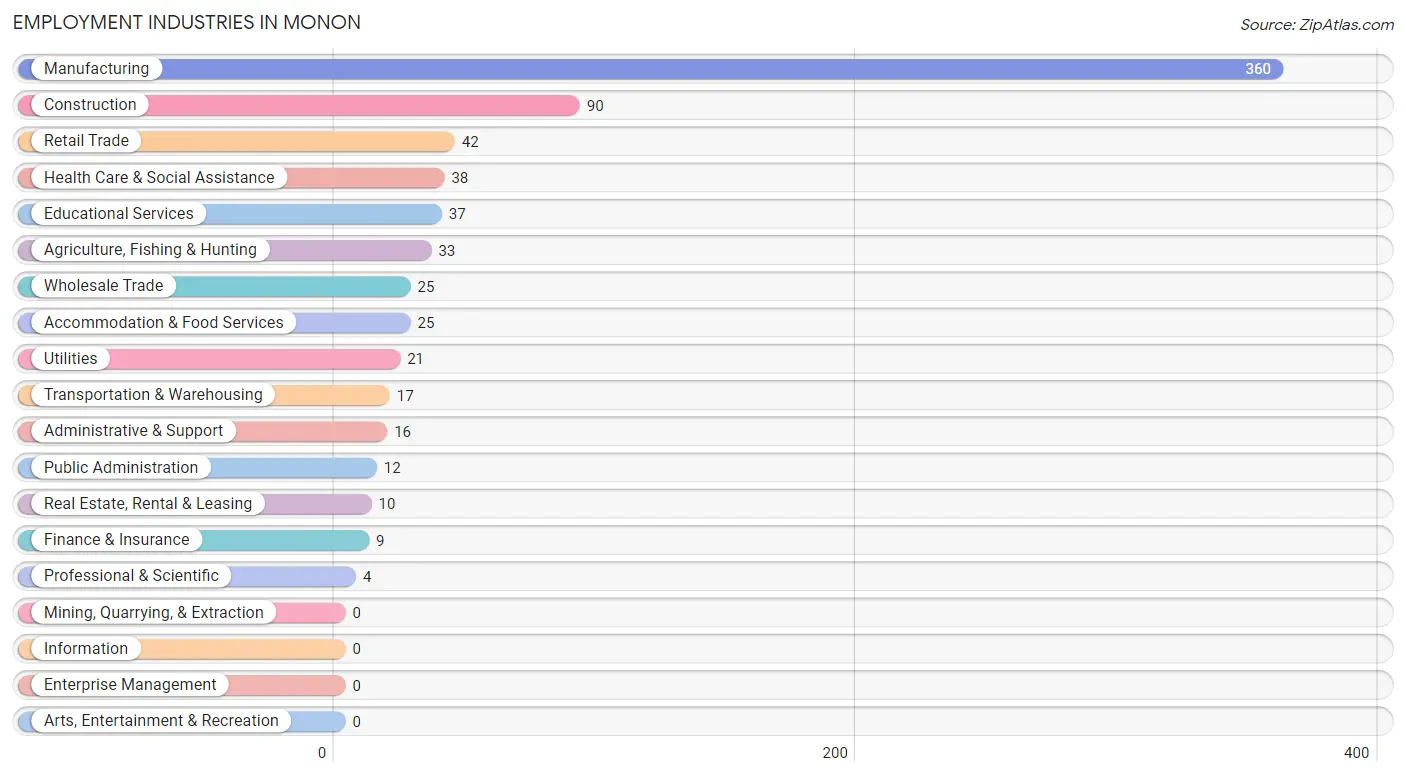
Employment Industries in Monon
The major employment industries in Monon include Manufacturing (360 | 47.2%), Construction (90 | 11.8%), Retail Trade (42 | 5.5%), Health Care & Social Assistance (38 | 5.0%), and Educational Services (37 | 4.9%).
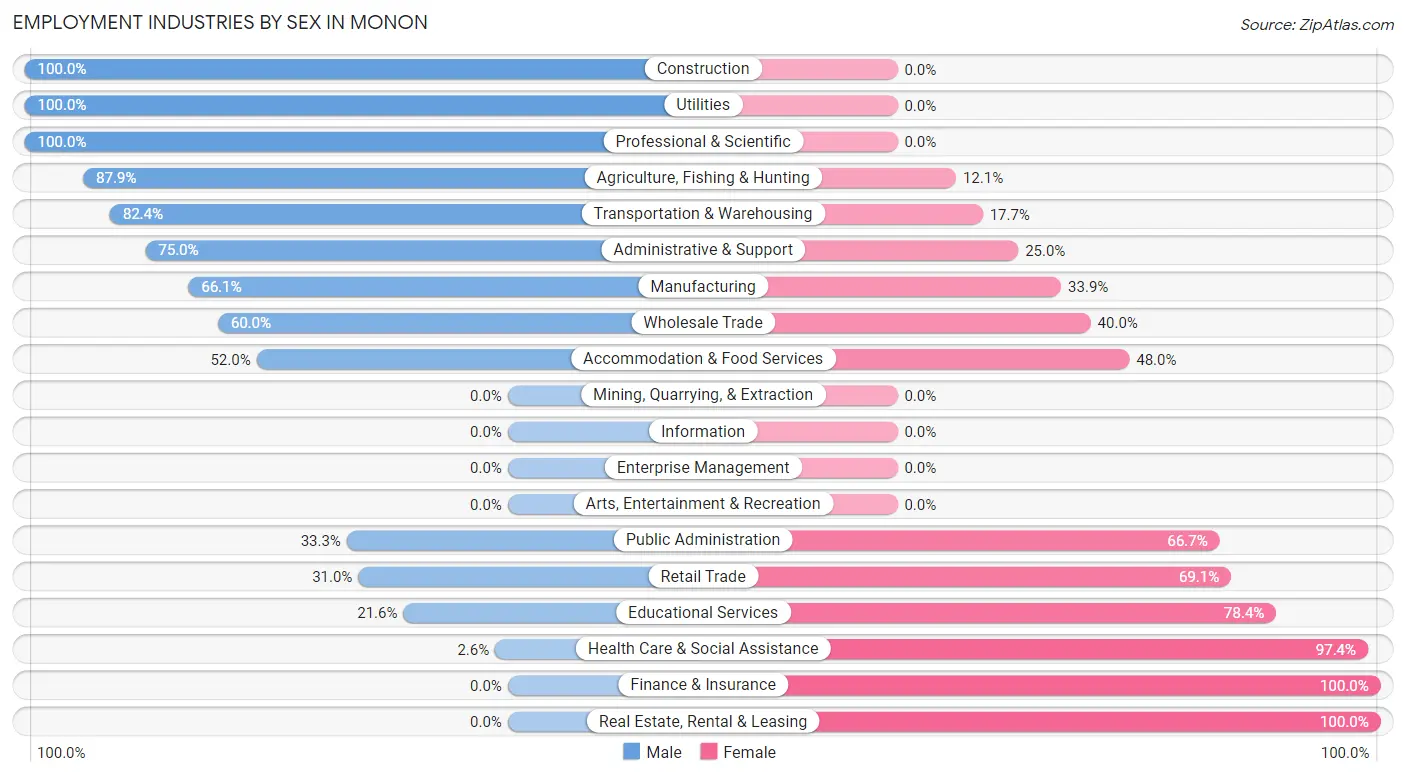
Employment Industries by Sex in Monon
The Monon industries that see more men than women are Construction (100.0%), Utilities (100.0%), and Professional & Scientific (100.0%), whereas the industries that tend to have a higher number of women are Finance & Insurance (100.0%), Real Estate, Rental & Leasing (100.0%), and Health Care & Social Assistance (97.4%).
| Industry | Male | Female |
| Agriculture, Fishing & Hunting | 29 (87.9%) | 4 (12.1%) |
| Mining, Quarrying, & Extraction | 0 (0.0%) | 0 (0.0%) |
| Construction | 90 (100.0%) | 0 (0.0%) |
| Manufacturing | 238 (66.1%) | 122 (33.9%) |
| Wholesale Trade | 15 (60.0%) | 10 (40.0%) |
| Retail Trade | 13 (30.9%) | 29 (69.1%) |
| Transportation & Warehousing | 14 (82.4%) | 3 (17.6%) |
| Utilities | 21 (100.0%) | 0 (0.0%) |
| Information | 0 (0.0%) | 0 (0.0%) |
| Finance & Insurance | 0 (0.0%) | 9 (100.0%) |
| Real Estate, Rental & Leasing | 0 (0.0%) | 10 (100.0%) |
| Professional & Scientific | 4 (100.0%) | 0 (0.0%) |
| Enterprise Management | 0 (0.0%) | 0 (0.0%) |
| Administrative & Support | 12 (75.0%) | 4 (25.0%) |
| Educational Services | 8 (21.6%) | 29 (78.4%) |
| Health Care & Social Assistance | 1 (2.6%) | 37 (97.4%) |
| Arts, Entertainment & Recreation | 0 (0.0%) | 0 (0.0%) |
| Accommodation & Food Services | 13 (52.0%) | 12 (48.0%) |
| Public Administration | 4 (33.3%) | 8 (66.7%) |
| Total | 462 (60.6%) | 301 (39.5%) |
Education in Monon
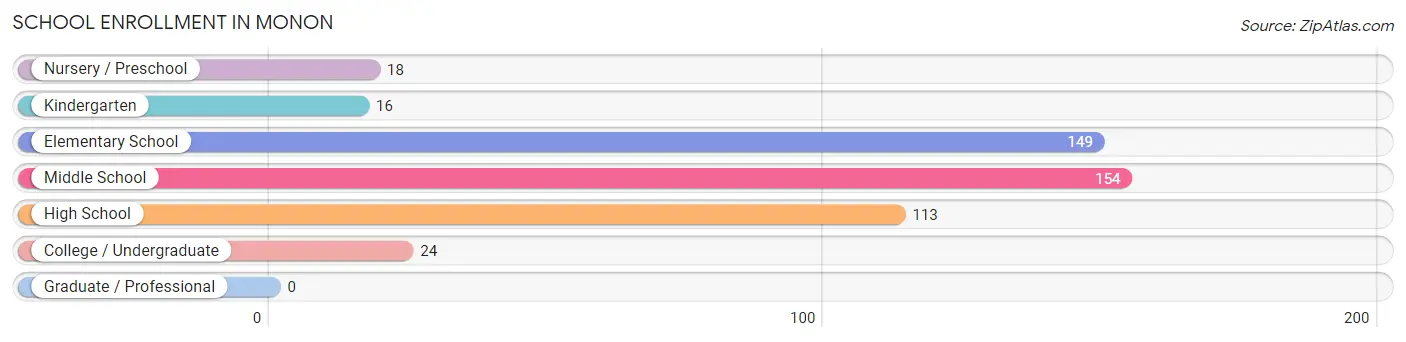
School Enrollment in Monon
The most common levels of schooling among the 474 students in Monon are middle school (154 | 32.5%), elementary school (149 | 31.4%), and high school (113 | 23.8%).
| School Level | # Students | % Students |
| Nursery / Preschool | 18 | 3.8% |
| Kindergarten | 16 | 3.4% |
| Elementary School | 149 | 31.4% |
| Middle School | 154 | 32.5% |
| High School | 113 | 23.8% |
| College / Undergraduate | 24 | 5.1% |
| Graduate / Professional | 0 | 0.0% |
| Total | 474 | 100.0% |
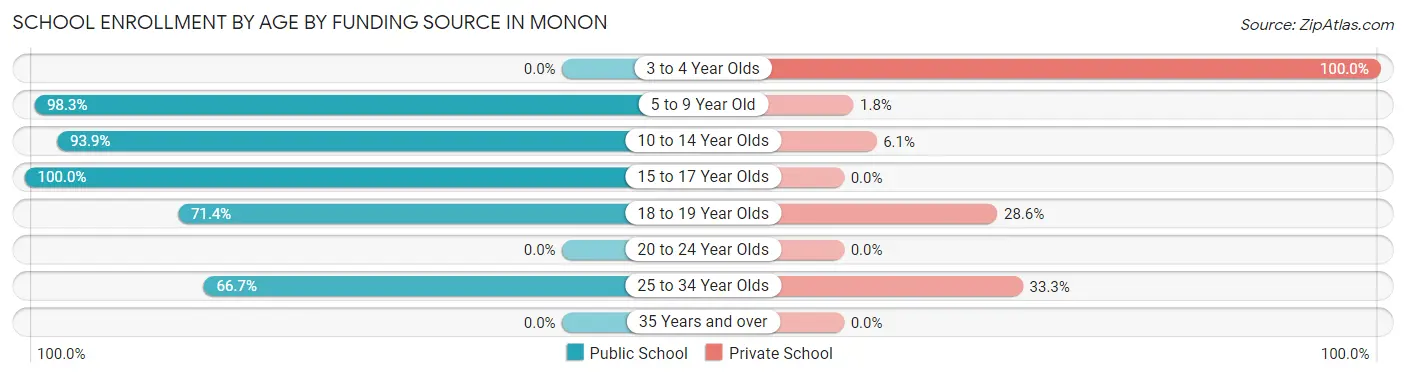
School Enrollment by Age by Funding Source in Monon
Out of a total of 474 students who are enrolled in schools in Monon, 30 (6.3%) attend a private institution, while the remaining 444 (93.7%) are enrolled in public schools. The age group of 3 to 4 year olds has the highest likelihood of being enrolled in private schools, with 1 (100.0% in the age bracket) enrolled. Conversely, the age group of 15 to 17 year olds has the lowest likelihood of being enrolled in a private school, with 83 (100.0% in the age bracket) attending a public institution.
| Age Bracket | Public School | Private School |
| 3 to 4 Year Olds | 0 (0.0%) | 1 (100.0%) |
| 5 to 9 Year Old | 168 (98.3%) | 3 (1.8%) |
| 10 to 14 Year Olds | 155 (93.9%) | 10 (6.1%) |
| 15 to 17 Year Olds | 83 (100.0%) | 0 (0.0%) |
| 18 to 19 Year Olds | 30 (71.4%) | 12 (28.6%) |
| 20 to 24 Year Olds | 0 (0.0%) | 0 (0.0%) |
| 25 to 34 Year Olds | 8 (66.7%) | 4 (33.3%) |
| 35 Years and over | 0 (0.0%) | 0 (0.0%) |
| Total | 444 (93.7%) | 30 (6.3%) |
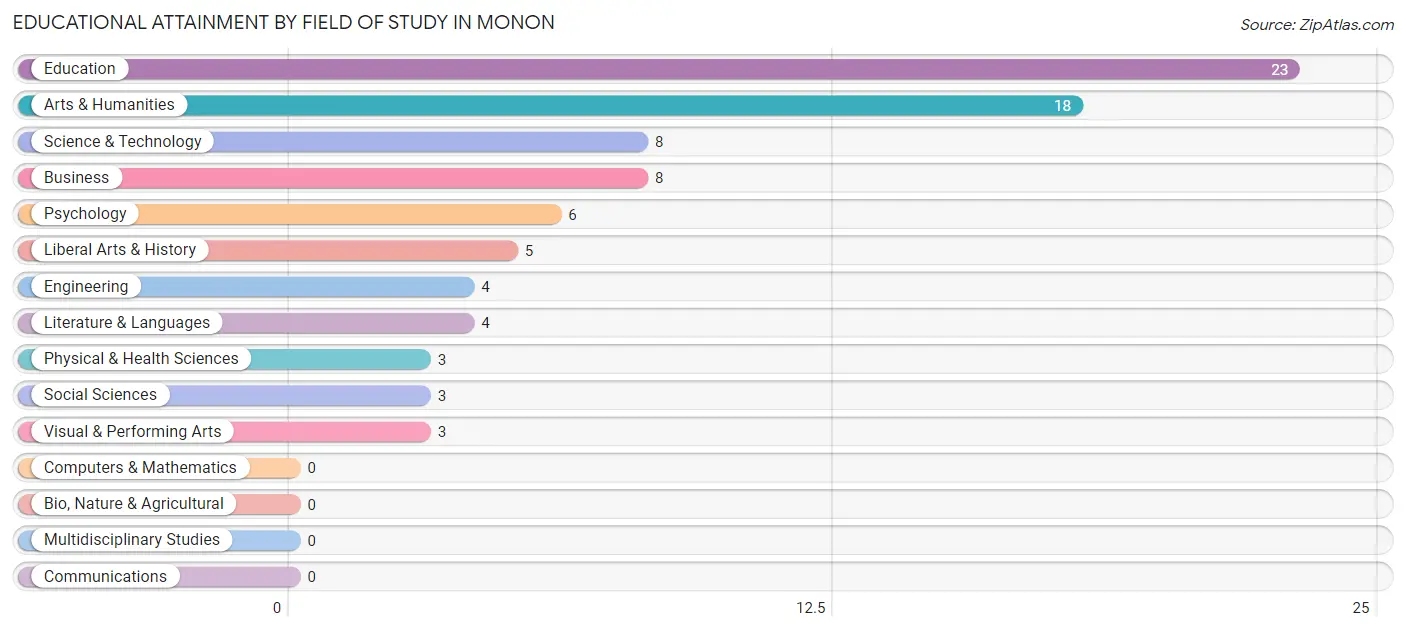
Educational Attainment by Field of Study in Monon
Education (23 | 27.1%), arts & humanities (18 | 21.2%), science & technology (8 | 9.4%), business (8 | 9.4%), and psychology (6 | 7.1%) are the most common fields of study among 85 individuals in Monon who have obtained a bachelor's degree or higher.
| Field of Study | # Graduates | % Graduates |
| Computers & Mathematics | 0 | 0.0% |
| Bio, Nature & Agricultural | 0 | 0.0% |
| Physical & Health Sciences | 3 | 3.5% |
| Psychology | 6 | 7.1% |
| Social Sciences | 3 | 3.5% |
| Engineering | 4 | 4.7% |
| Multidisciplinary Studies | 0 | 0.0% |
| Science & Technology | 8 | 9.4% |
| Business | 8 | 9.4% |
| Education | 23 | 27.1% |
| Literature & Languages | 4 | 4.7% |
| Liberal Arts & History | 5 | 5.9% |
| Visual & Performing Arts | 3 | 3.5% |
| Communications | 0 | 0.0% |
| Arts & Humanities | 18 | 21.2% |
| Total | 85 | 100.0% |
Transportation & Commute in Monon
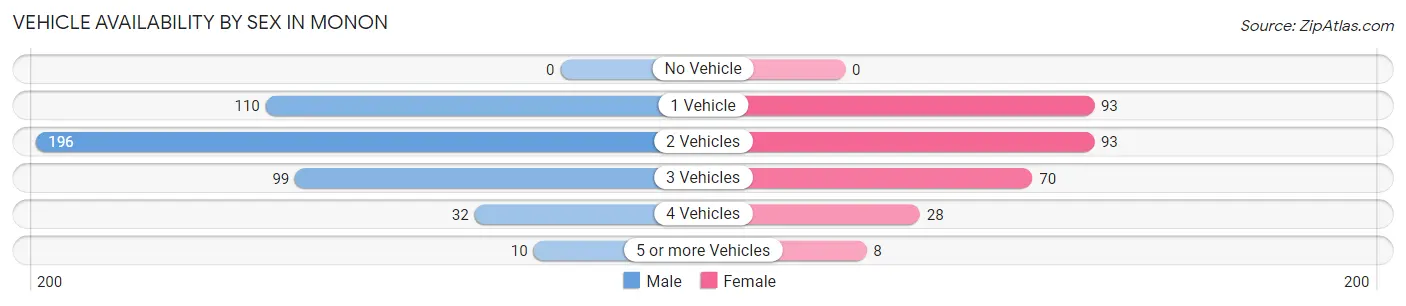
Vehicle Availability by Sex in Monon
The most prevalent vehicle ownership categories in Monon are males with 2 vehicles (196, accounting for 43.9%) and females with 2 vehicles (93, making up 67.1%).
| Vehicles Available | Male | Female |
| No Vehicle | 0 (0.0%) | 0 (0.0%) |
| 1 Vehicle | 110 (24.6%) | 93 (31.9%) |
| 2 Vehicles | 196 (43.9%) | 93 (31.9%) |
| 3 Vehicles | 99 (22.2%) | 70 (24.0%) |
| 4 Vehicles | 32 (7.2%) | 28 (9.6%) |
| 5 or more Vehicles | 10 (2.2%) | 8 (2.7%) |
| Total | 447 (100.0%) | 292 (100.0%) |
Commute Time in Monon
The most frequently occuring commute durations in Monon are 20 to 24 minutes (142 commuters, 19.3%), 5 to 9 minutes (130 commuters, 17.7%), and 15 to 19 minutes (104 commuters, 14.1%).
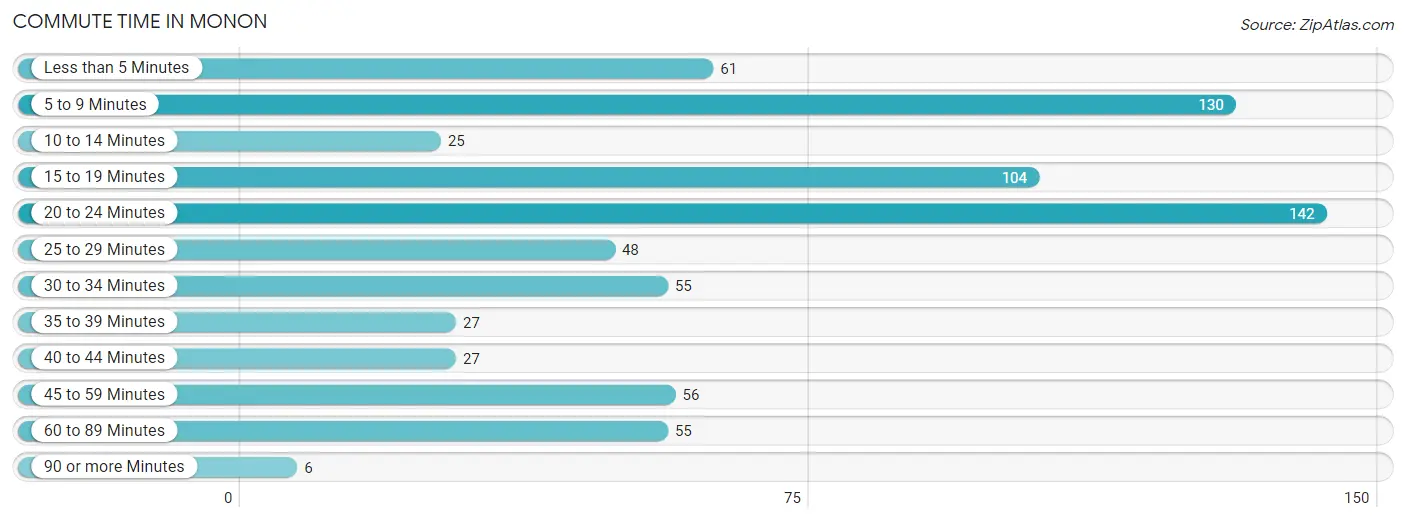
| Commute Time | # Commuters | % Commuters |
| Less than 5 Minutes | 61 | 8.3% |
| 5 to 9 Minutes | 130 | 17.7% |
| 10 to 14 Minutes | 25 | 3.4% |
| 15 to 19 Minutes | 104 | 14.1% |
| 20 to 24 Minutes | 142 | 19.3% |
| 25 to 29 Minutes | 48 | 6.5% |
| 30 to 34 Minutes | 55 | 7.5% |
| 35 to 39 Minutes | 27 | 3.7% |
| 40 to 44 Minutes | 27 | 3.7% |
| 45 to 59 Minutes | 56 | 7.6% |
| 60 to 89 Minutes | 55 | 7.5% |
| 90 or more Minutes | 6 | 0.8% |
Commute Time by Sex in Monon
The most common commute times in Monon are 5 to 9 minutes (90 commuters, 20.1%) for males and 20 to 24 minutes (60 commuters, 20.8%) for females.
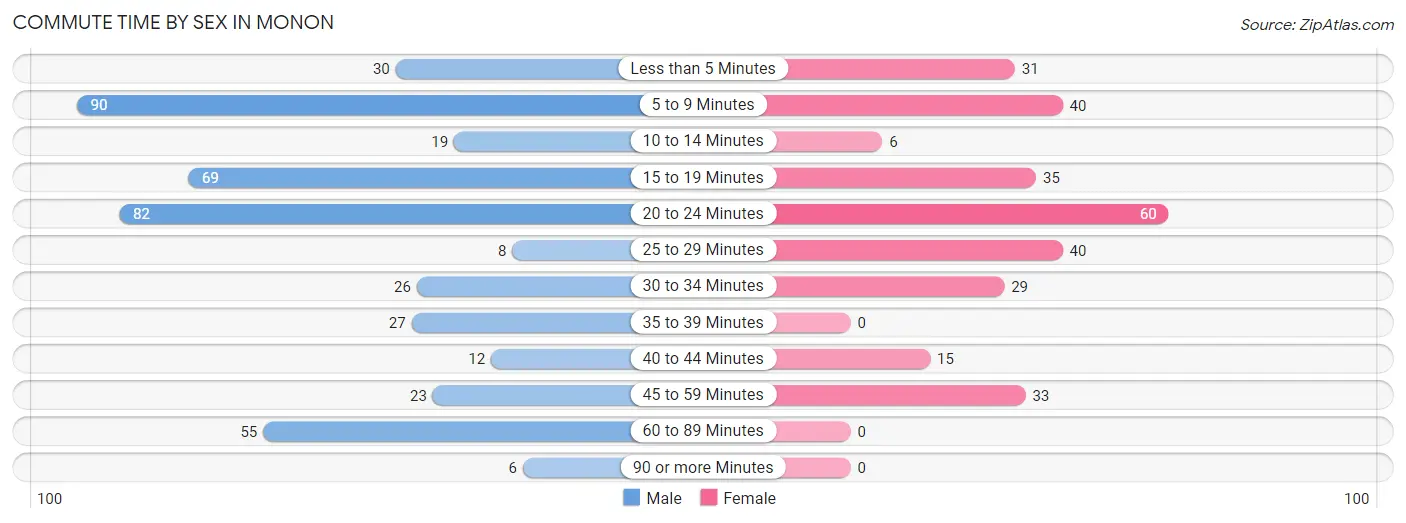
| Commute Time | Male | Female |
| Less than 5 Minutes | 30 (6.7%) | 31 (10.7%) |
| 5 to 9 Minutes | 90 (20.1%) | 40 (13.8%) |
| 10 to 14 Minutes | 19 (4.3%) | 6 (2.1%) |
| 15 to 19 Minutes | 69 (15.4%) | 35 (12.1%) |
| 20 to 24 Minutes | 82 (18.3%) | 60 (20.8%) |
| 25 to 29 Minutes | 8 (1.8%) | 40 (13.8%) |
| 30 to 34 Minutes | 26 (5.8%) | 29 (10.0%) |
| 35 to 39 Minutes | 27 (6.0%) | 0 (0.0%) |
| 40 to 44 Minutes | 12 (2.7%) | 15 (5.2%) |
| 45 to 59 Minutes | 23 (5.1%) | 33 (11.4%) |
| 60 to 89 Minutes | 55 (12.3%) | 0 (0.0%) |
| 90 or more Minutes | 6 (1.3%) | 0 (0.0%) |
Time of Departure to Work by Sex in Monon
The most frequent times of departure to work in Monon are 6:00 AM to 6:29 AM (139, 31.1%) for males and 7:00 AM to 7:29 AM (60, 20.8%) for females.
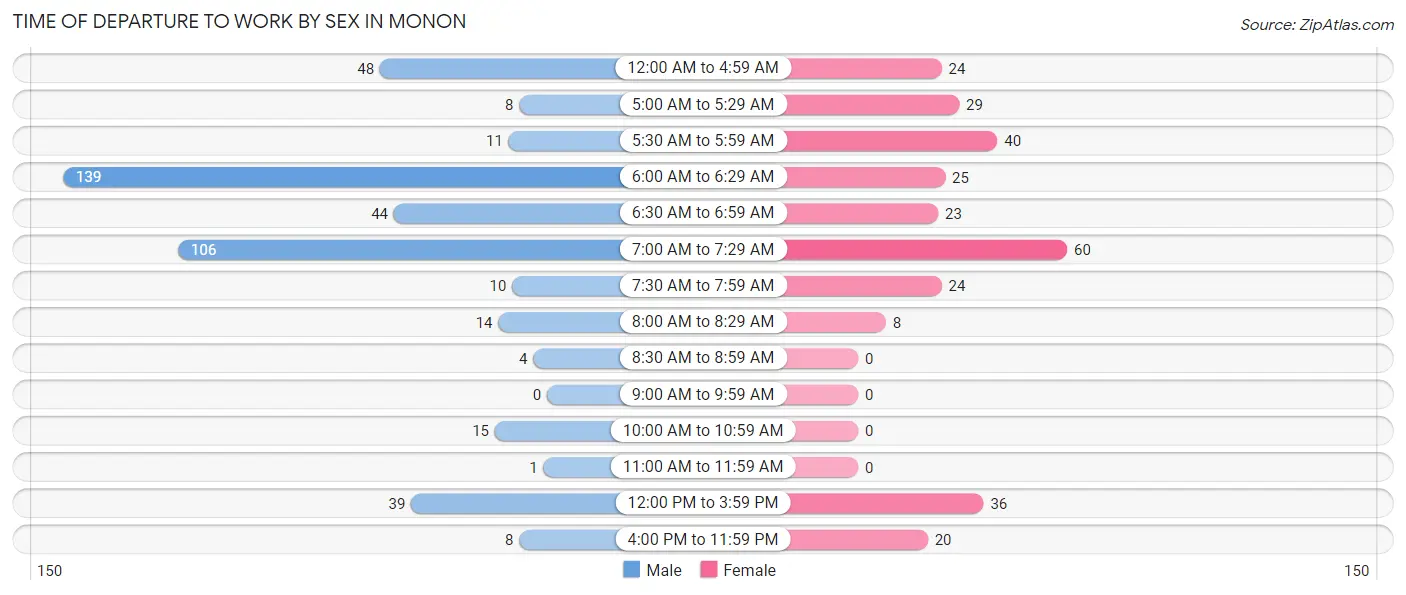
| Time of Departure | Male | Female |
| 12:00 AM to 4:59 AM | 48 (10.7%) | 24 (8.3%) |
| 5:00 AM to 5:29 AM | 8 (1.8%) | 29 (10.0%) |
| 5:30 AM to 5:59 AM | 11 (2.5%) | 40 (13.8%) |
| 6:00 AM to 6:29 AM | 139 (31.1%) | 25 (8.6%) |
| 6:30 AM to 6:59 AM | 44 (9.8%) | 23 (8.0%) |
| 7:00 AM to 7:29 AM | 106 (23.7%) | 60 (20.8%) |
| 7:30 AM to 7:59 AM | 10 (2.2%) | 24 (8.3%) |
| 8:00 AM to 8:29 AM | 14 (3.1%) | 8 (2.8%) |
| 8:30 AM to 8:59 AM | 4 (0.9%) | 0 (0.0%) |
| 9:00 AM to 9:59 AM | 0 (0.0%) | 0 (0.0%) |
| 10:00 AM to 10:59 AM | 15 (3.4%) | 0 (0.0%) |
| 11:00 AM to 11:59 AM | 1 (0.2%) | 0 (0.0%) |
| 12:00 PM to 3:59 PM | 39 (8.7%) | 36 (12.5%) |
| 4:00 PM to 11:59 PM | 8 (1.8%) | 20 (6.9%) |
| Total | 447 (100.0%) | 289 (100.0%) |
Housing Occupancy in Monon
Occupancy by Ownership in Monon
Of the total 583 dwellings in Monon, owner-occupied units account for 354 (60.7%), while renter-occupied units make up 229 (39.3%).
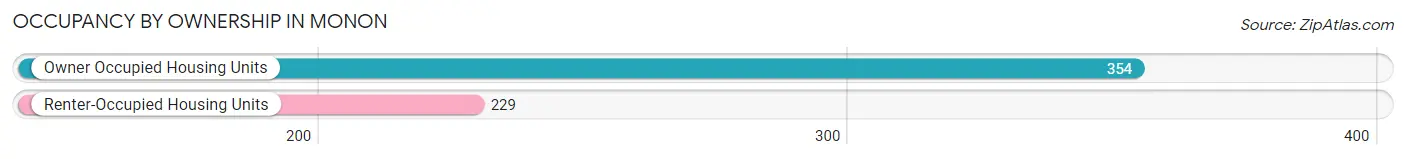
| Occupancy | # Housing Units | % Housing Units |
| Owner Occupied Housing Units | 354 | 60.7% |
| Renter-Occupied Housing Units | 229 | 39.3% |
| Total Occupied Housing Units | 583 | 100.0% |
Occupancy by Household Size in Monon
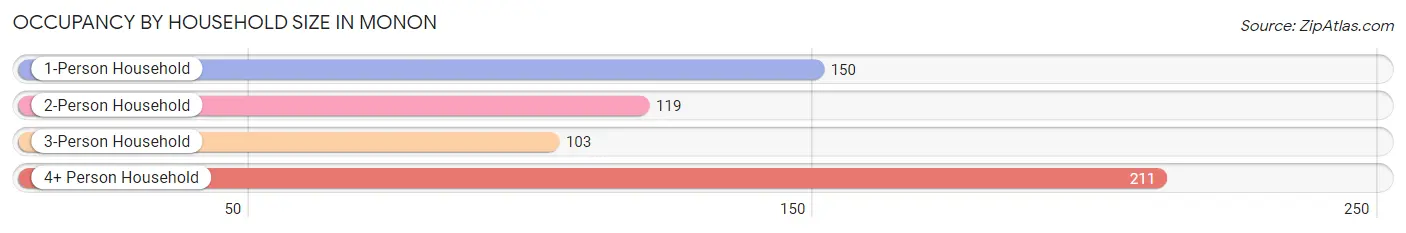
| Household Size | # Housing Units | % Housing Units |
| 1-Person Household | 150 | 25.7% |
| 2-Person Household | 119 | 20.4% |
| 3-Person Household | 103 | 17.7% |
| 4+ Person Household | 211 | 36.2% |
| Total Housing Units | 583 | 100.0% |
Occupancy by Ownership by Household Size in Monon
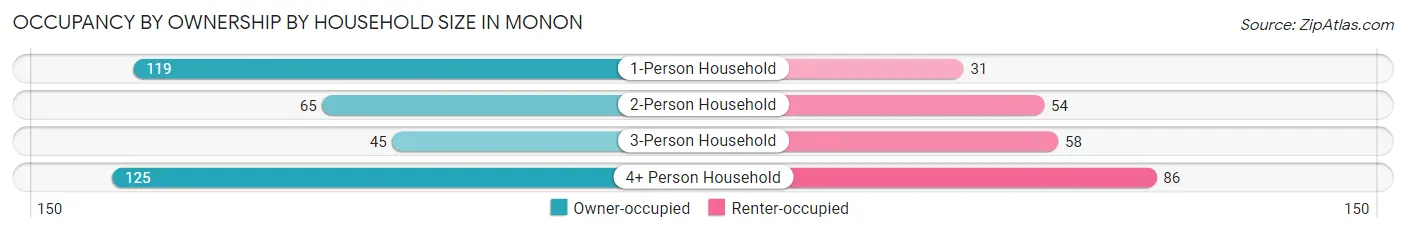
| Household Size | Owner-occupied | Renter-occupied |
| 1-Person Household | 119 (79.3%) | 31 (20.7%) |
| 2-Person Household | 65 (54.6%) | 54 (45.4%) |
| 3-Person Household | 45 (43.7%) | 58 (56.3%) |
| 4+ Person Household | 125 (59.2%) | 86 (40.8%) |
| Total Housing Units | 354 (60.7%) | 229 (39.3%) |
Occupancy by Educational Attainment in Monon
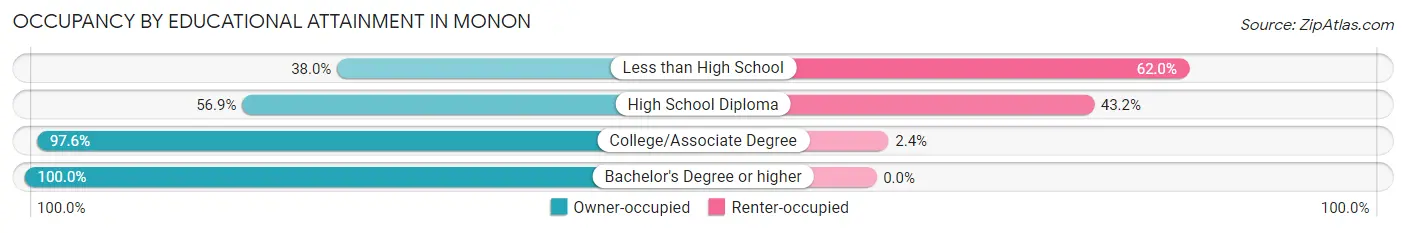
| Household Size | Owner-occupied | Renter-occupied |
| Less than High School | 100 (38.0%) | 163 (62.0%) |
| High School Diploma | 83 (56.9%) | 63 (43.1%) |
| College/Associate Degree | 121 (97.6%) | 3 (2.4%) |
| Bachelor's Degree or higher | 50 (100.0%) | 0 (0.0%) |
Occupancy by Age of Householder in Monon
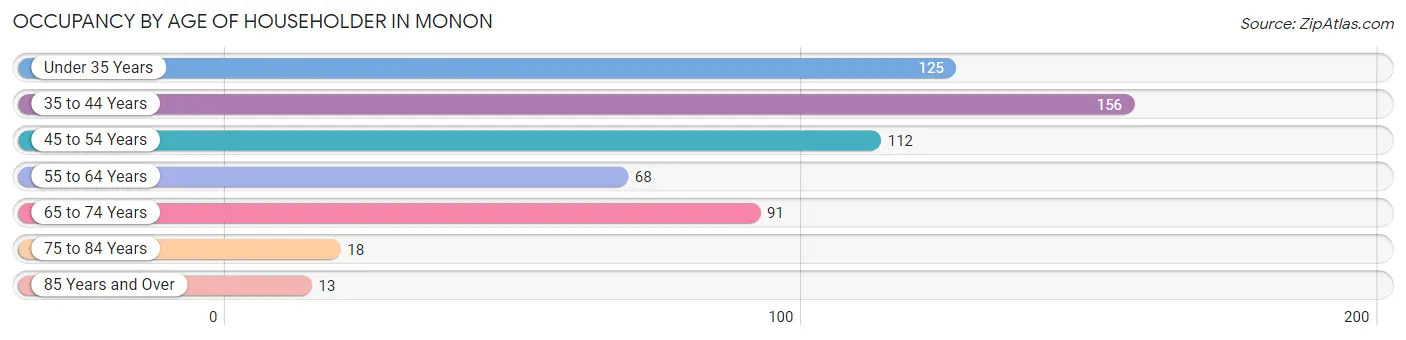
| Age Bracket | # Households | % Households |
| Under 35 Years | 125 | 21.4% |
| 35 to 44 Years | 156 | 26.8% |
| 45 to 54 Years | 112 | 19.2% |
| 55 to 64 Years | 68 | 11.7% |
| 65 to 74 Years | 91 | 15.6% |
| 75 to 84 Years | 18 | 3.1% |
| 85 Years and Over | 13 | 2.2% |
| Total | 583 | 100.0% |
Housing Finances in Monon
Median Income by Occupancy in Monon
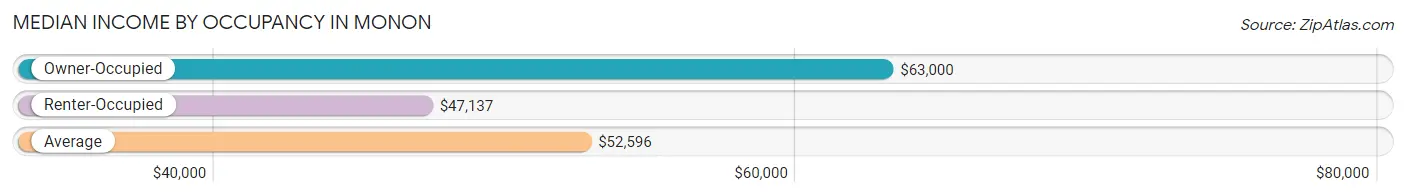
| Occupancy Type | # Households | Median Income |
| Owner-Occupied | 354 (60.7%) | $63,000 |
| Renter-Occupied | 229 (39.3%) | $47,137 |
| Average | 583 (100.0%) | $52,596 |
Occupancy by Householder Income Bracket in Monon
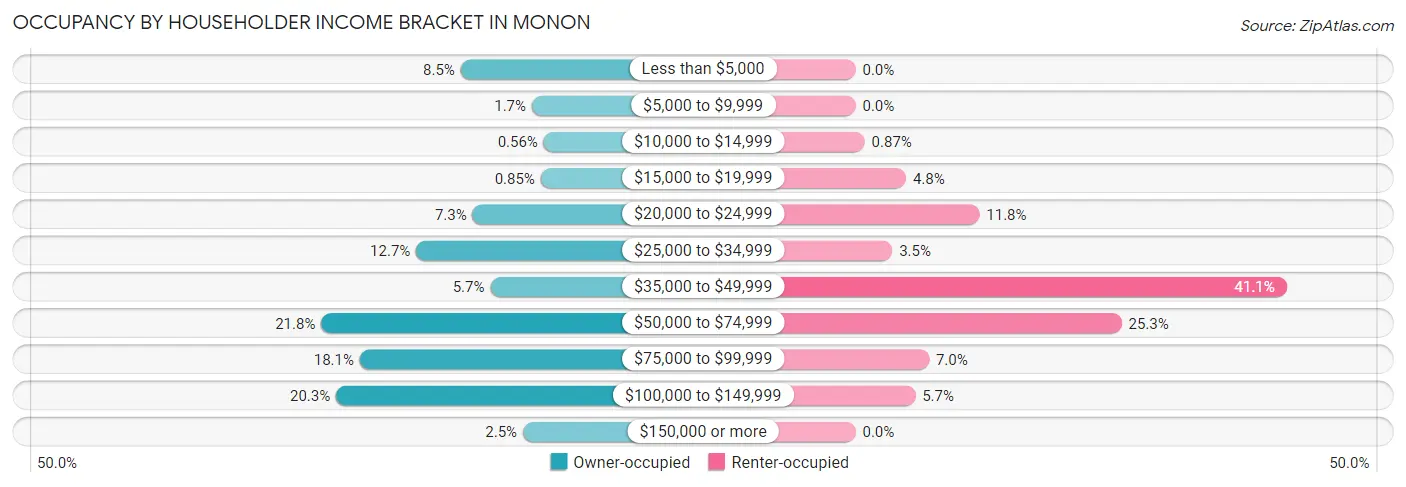
| Income Bracket | Owner-occupied | Renter-occupied |
| Less than $5,000 | 30 (8.5%) | 0 (0.0%) |
| $5,000 to $9,999 | 6 (1.7%) | 0 (0.0%) |
| $10,000 to $14,999 | 2 (0.6%) | 2 (0.9%) |
| $15,000 to $19,999 | 3 (0.9%) | 11 (4.8%) |
| $20,000 to $24,999 | 26 (7.3%) | 27 (11.8%) |
| $25,000 to $34,999 | 45 (12.7%) | 8 (3.5%) |
| $35,000 to $49,999 | 20 (5.7%) | 94 (41.0%) |
| $50,000 to $74,999 | 77 (21.7%) | 58 (25.3%) |
| $75,000 to $99,999 | 64 (18.1%) | 16 (7.0%) |
| $100,000 to $149,999 | 72 (20.3%) | 13 (5.7%) |
| $150,000 or more | 9 (2.5%) | 0 (0.0%) |
| Total | 354 (100.0%) | 229 (100.0%) |
Monthly Housing Cost Tiers in Monon
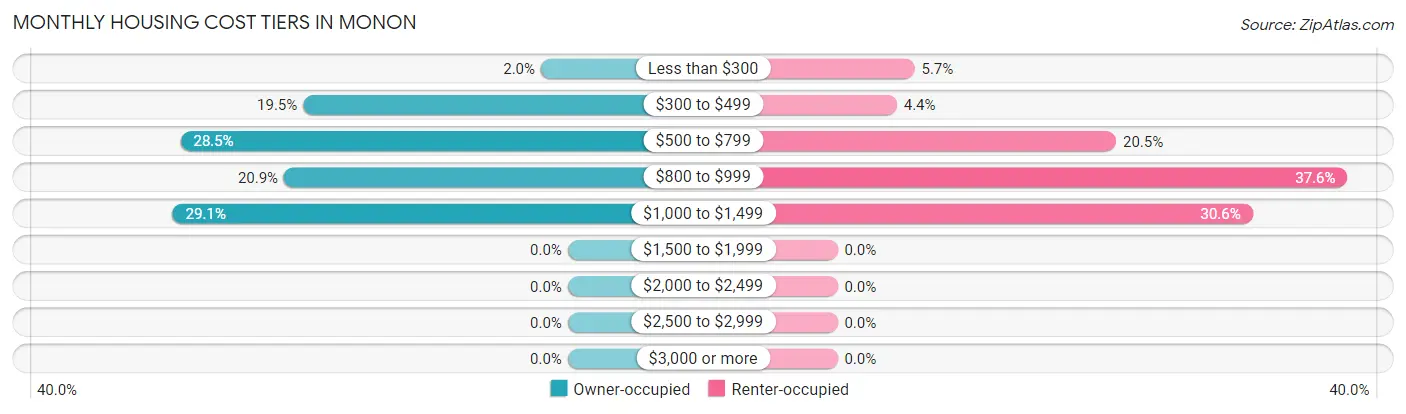
| Monthly Cost | Owner-occupied | Renter-occupied |
| Less than $300 | 7 (2.0%) | 13 (5.7%) |
| $300 to $499 | 69 (19.5%) | 10 (4.4%) |
| $500 to $799 | 101 (28.5%) | 47 (20.5%) |
| $800 to $999 | 74 (20.9%) | 86 (37.6%) |
| $1,000 to $1,499 | 103 (29.1%) | 70 (30.6%) |
| $1,500 to $1,999 | 0 (0.0%) | 0 (0.0%) |
| $2,000 to $2,499 | 0 (0.0%) | 0 (0.0%) |
| $2,500 to $2,999 | 0 (0.0%) | 0 (0.0%) |
| $3,000 or more | 0 (0.0%) | 0 (0.0%) |
| Total | 354 (100.0%) | 229 (100.0%) |
Physical Housing Characteristics in Monon
Housing Structures in Monon
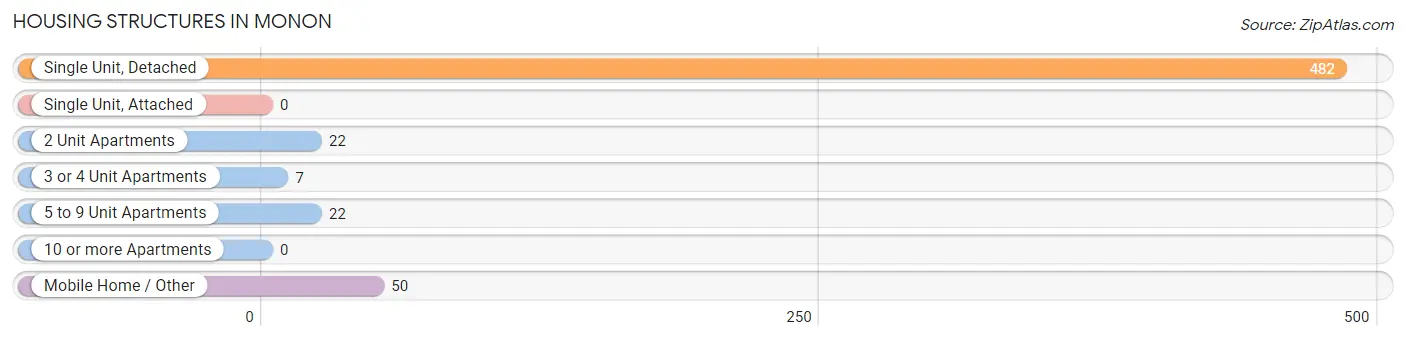
| Structure Type | # Housing Units | % Housing Units |
| Single Unit, Detached | 482 | 82.7% |
| Single Unit, Attached | 0 | 0.0% |
| 2 Unit Apartments | 22 | 3.8% |
| 3 or 4 Unit Apartments | 7 | 1.2% |
| 5 to 9 Unit Apartments | 22 | 3.8% |
| 10 or more Apartments | 0 | 0.0% |
| Mobile Home / Other | 50 | 8.6% |
| Total | 583 | 100.0% |
Housing Structures by Occupancy in Monon
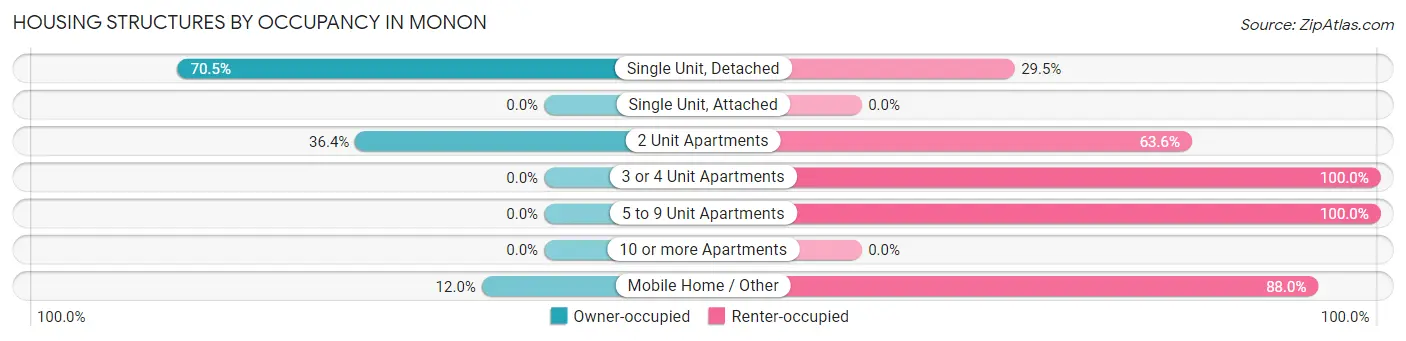
| Structure Type | Owner-occupied | Renter-occupied |
| Single Unit, Detached | 340 (70.5%) | 142 (29.5%) |
| Single Unit, Attached | 0 (0.0%) | 0 (0.0%) |
| 2 Unit Apartments | 8 (36.4%) | 14 (63.6%) |
| 3 or 4 Unit Apartments | 0 (0.0%) | 7 (100.0%) |
| 5 to 9 Unit Apartments | 0 (0.0%) | 22 (100.0%) |
| 10 or more Apartments | 0 (0.0%) | 0 (0.0%) |
| Mobile Home / Other | 6 (12.0%) | 44 (88.0%) |
| Total | 354 (60.7%) | 229 (39.3%) |
Housing Structures by Number of Rooms in Monon
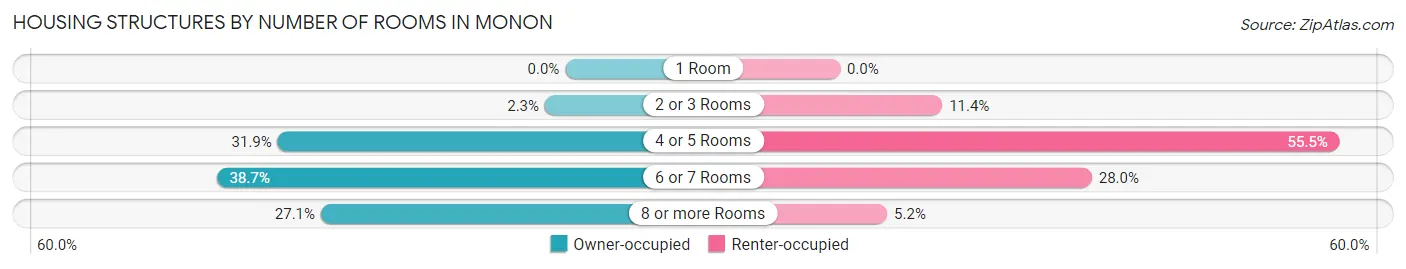
| Number of Rooms | Owner-occupied | Renter-occupied |
| 1 Room | 0 (0.0%) | 0 (0.0%) |
| 2 or 3 Rooms | 8 (2.3%) | 26 (11.4%) |
| 4 or 5 Rooms | 113 (31.9%) | 127 (55.5%) |
| 6 or 7 Rooms | 137 (38.7%) | 64 (28.0%) |
| 8 or more Rooms | 96 (27.1%) | 12 (5.2%) |
| Total | 354 (100.0%) | 229 (100.0%) |
Housing Structure by Heating Type in Monon
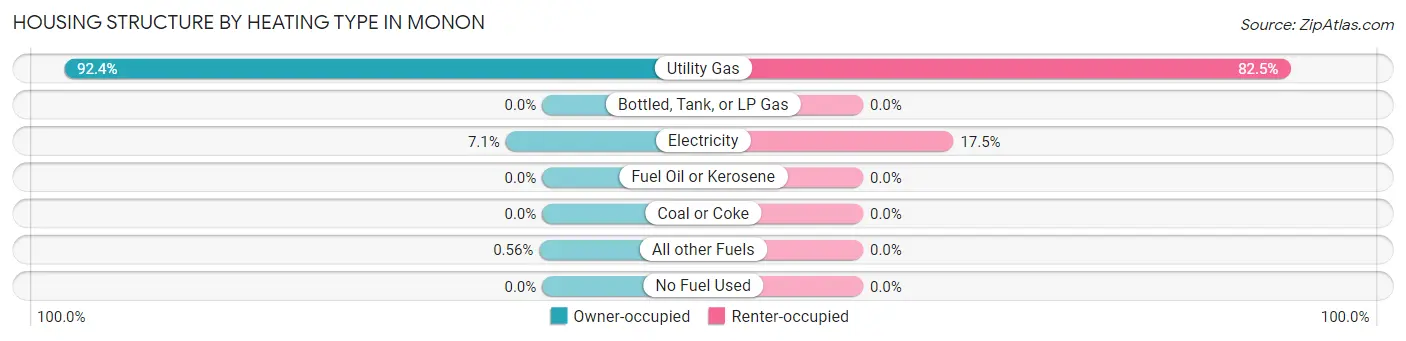
| Heating Type | Owner-occupied | Renter-occupied |
| Utility Gas | 327 (92.4%) | 189 (82.5%) |
| Bottled, Tank, or LP Gas | 0 (0.0%) | 0 (0.0%) |
| Electricity | 25 (7.1%) | 40 (17.5%) |
| Fuel Oil or Kerosene | 0 (0.0%) | 0 (0.0%) |
| Coal or Coke | 0 (0.0%) | 0 (0.0%) |
| All other Fuels | 2 (0.6%) | 0 (0.0%) |
| No Fuel Used | 0 (0.0%) | 0 (0.0%) |
| Total | 354 (100.0%) | 229 (100.0%) |
Household Vehicle Usage in Monon
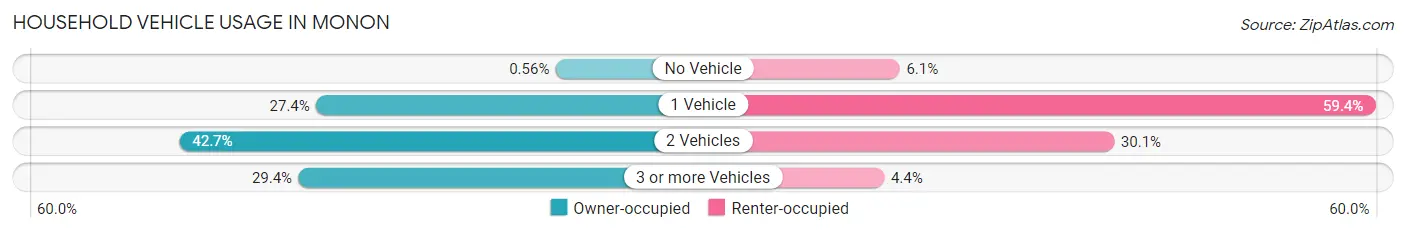
| Vehicles per Household | Owner-occupied | Renter-occupied |
| No Vehicle | 2 (0.6%) | 14 (6.1%) |
| 1 Vehicle | 97 (27.4%) | 136 (59.4%) |
| 2 Vehicles | 151 (42.7%) | 69 (30.1%) |
| 3 or more Vehicles | 104 (29.4%) | 10 (4.4%) |
| Total | 354 (100.0%) | 229 (100.0%) |
Real Estate & Mortgages in Monon
Real Estate and Mortgage Overview in Monon
| Characteristic | Without Mortgage | With Mortgage |
| Housing Units | 130 | 224 |
| Median Property Value | $81,200 | $80,600 |
| Median Household Income | $50,000 | $9 |
| Monthly Housing Costs | $476 | $0 |
| Real Estate Taxes | $576 | $7 |
Property Value by Mortgage Status in Monon
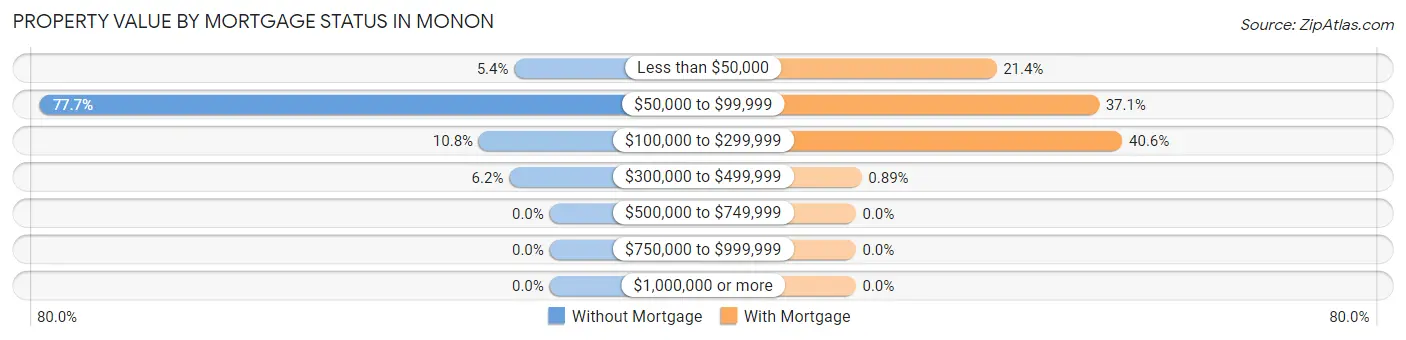
| Property Value | Without Mortgage | With Mortgage |
| Less than $50,000 | 7 (5.4%) | 48 (21.4%) |
| $50,000 to $99,999 | 101 (77.7%) | 83 (37.0%) |
| $100,000 to $299,999 | 14 (10.8%) | 91 (40.6%) |
| $300,000 to $499,999 | 8 (6.1%) | 2 (0.9%) |
| $500,000 to $749,999 | 0 (0.0%) | 0 (0.0%) |
| $750,000 to $999,999 | 0 (0.0%) | 0 (0.0%) |
| $1,000,000 or more | 0 (0.0%) | 0 (0.0%) |
| Total | 130 (100.0%) | 224 (100.0%) |
Household Income by Mortgage Status in Monon
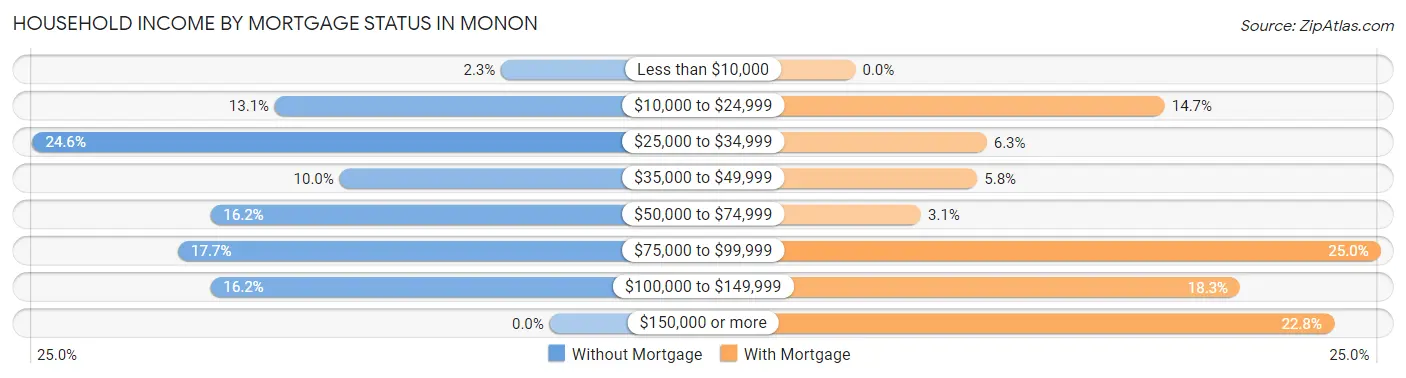
| Household Income | Without Mortgage | With Mortgage |
| Less than $10,000 | 3 (2.3%) | 0 (0.0%) |
| $10,000 to $24,999 | 17 (13.1%) | 33 (14.7%) |
| $25,000 to $34,999 | 32 (24.6%) | 14 (6.2%) |
| $35,000 to $49,999 | 13 (10.0%) | 13 (5.8%) |
| $50,000 to $74,999 | 21 (16.2%) | 7 (3.1%) |
| $75,000 to $99,999 | 23 (17.7%) | 56 (25.0%) |
| $100,000 to $149,999 | 21 (16.2%) | 41 (18.3%) |
| $150,000 or more | 0 (0.0%) | 51 (22.8%) |
| Total | 130 (100.0%) | 224 (100.0%) |
Property Value to Household Income Ratio in Monon
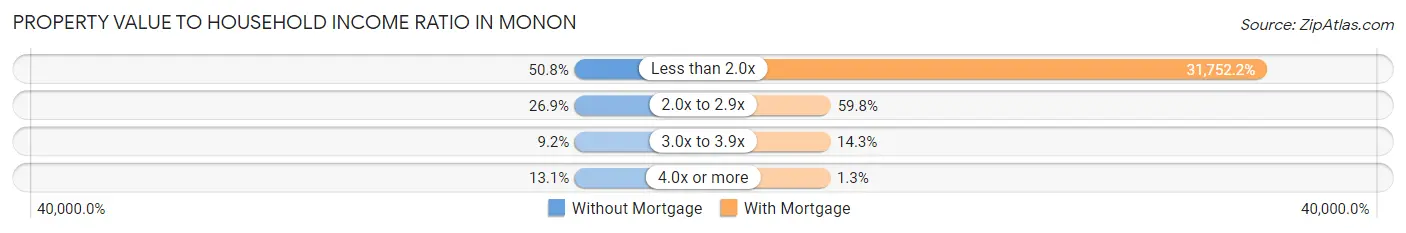
| Value-to-Income Ratio | Without Mortgage | With Mortgage |
| Less than 2.0x | 66 (50.8%) | 71,125 (31,752.2%) |
| 2.0x to 2.9x | 35 (26.9%) | 134 (59.8%) |
| 3.0x to 3.9x | 12 (9.2%) | 32 (14.3%) |
| 4.0x or more | 17 (13.1%) | 3 (1.3%) |
| Total | 130 (100.0%) | 224 (100.0%) |
Real Estate Taxes by Mortgage Status in Monon
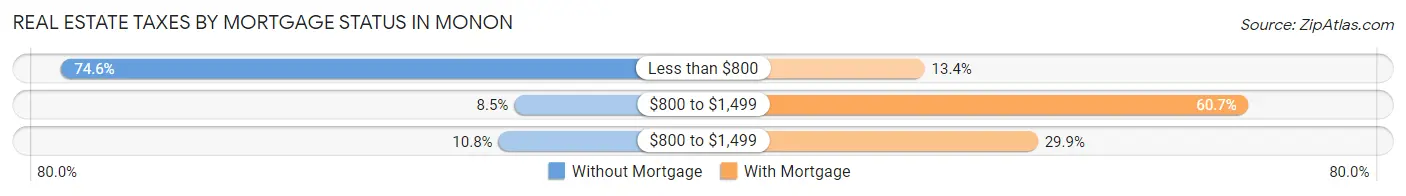
| Property Taxes | Without Mortgage | With Mortgage |
| Less than $800 | 97 (74.6%) | 30 (13.4%) |
| $800 to $1,499 | 11 (8.5%) | 136 (60.7%) |
| $800 to $1,499 | 14 (10.8%) | 67 (29.9%) |
| Total | 130 (100.0%) | 224 (100.0%) |
Health & Disability in Monon
Health Insurance Coverage by Age in Monon
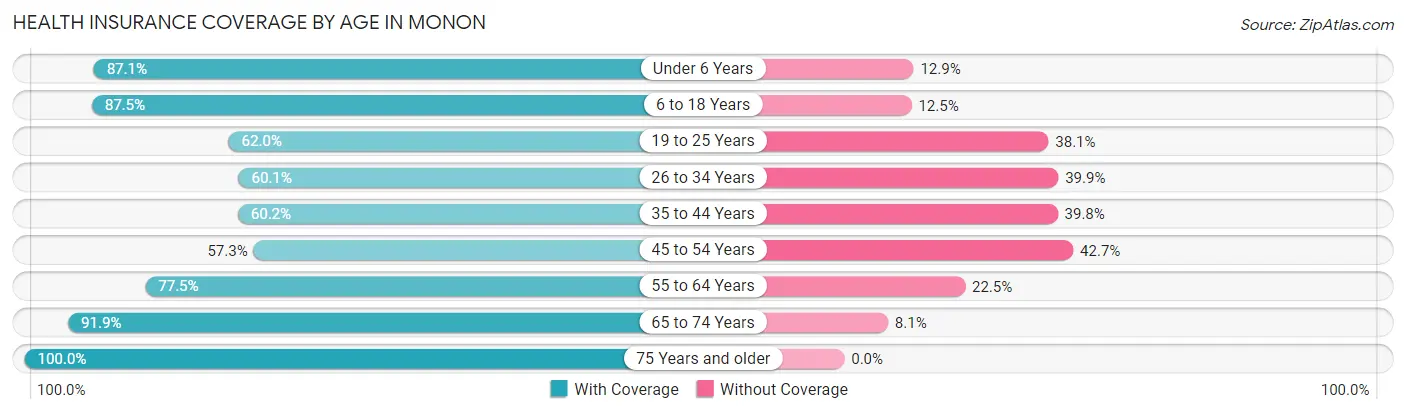
| Age Bracket | With Coverage | Without Coverage |
| Under 6 Years | 162 (87.1%) | 24 (12.9%) |
| 6 to 18 Years | 405 (87.5%) | 58 (12.5%) |
| 19 to 25 Years | 127 (62.0%) | 78 (38.1%) |
| 26 to 34 Years | 125 (60.1%) | 83 (39.9%) |
| 35 to 44 Years | 165 (60.2%) | 109 (39.8%) |
| 45 to 54 Years | 90 (57.3%) | 67 (42.7%) |
| 55 to 64 Years | 86 (77.5%) | 25 (22.5%) |
| 65 to 74 Years | 113 (91.9%) | 10 (8.1%) |
| 75 Years and older | 37 (100.0%) | 0 (0.0%) |
| Total | 1,310 (74.3%) | 454 (25.7%) |
Health Insurance Coverage by Citizenship Status in Monon
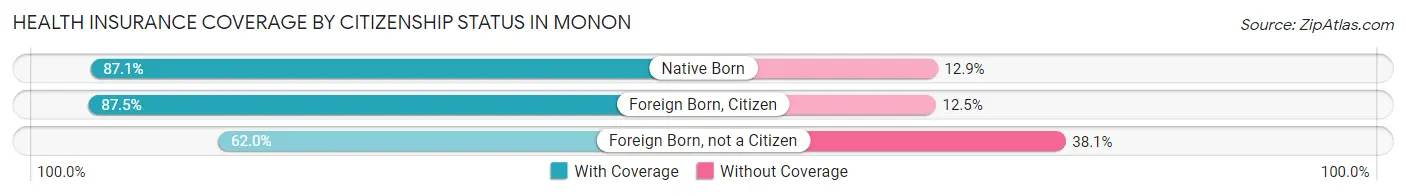
| Citizenship Status | With Coverage | Without Coverage |
| Native Born | 162 (87.1%) | 24 (12.9%) |
| Foreign Born, Citizen | 405 (87.5%) | 58 (12.5%) |
| Foreign Born, not a Citizen | 127 (62.0%) | 78 (38.1%) |
Health Insurance Coverage by Household Income in Monon
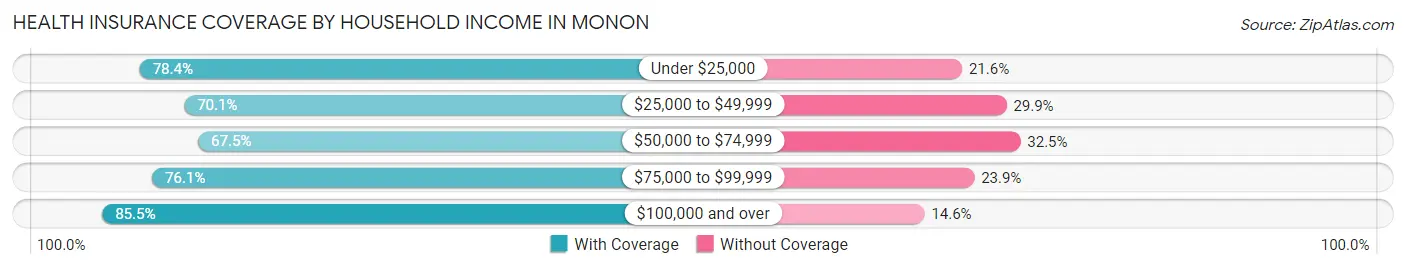
| Household Income | With Coverage | Without Coverage |
| Under $25,000 | 109 (78.4%) | 30 (21.6%) |
| $25,000 to $49,999 | 314 (70.1%) | 134 (29.9%) |
| $50,000 to $74,999 | 330 (67.5%) | 159 (32.5%) |
| $75,000 to $99,999 | 252 (76.1%) | 79 (23.9%) |
| $100,000 and over | 282 (85.5%) | 48 (14.5%) |
Public vs Private Health Insurance Coverage by Age in Monon
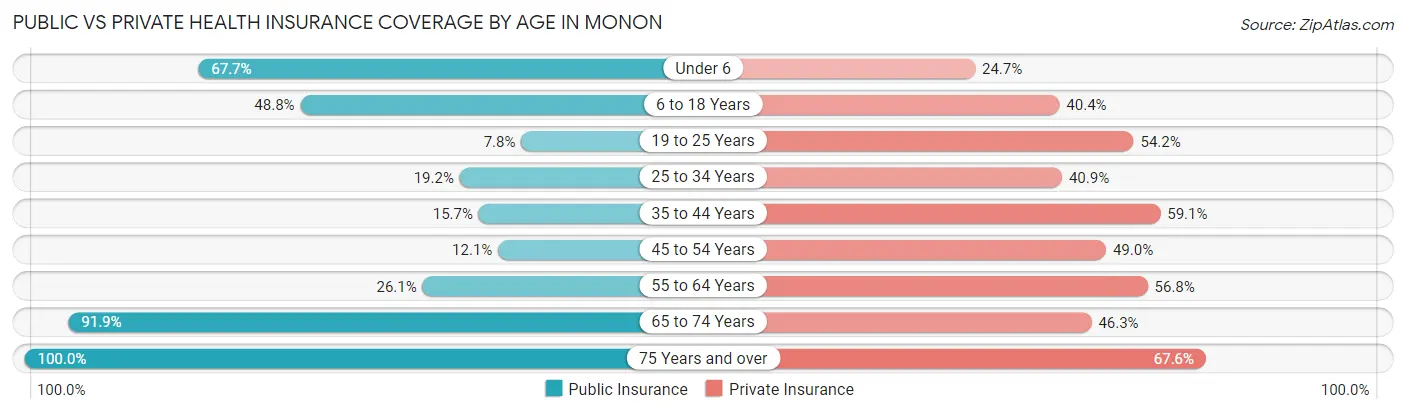
| Age Bracket | Public Insurance | Private Insurance |
| Under 6 | 126 (67.7%) | 46 (24.7%) |
| 6 to 18 Years | 226 (48.8%) | 187 (40.4%) |
| 19 to 25 Years | 16 (7.8%) | 111 (54.1%) |
| 25 to 34 Years | 40 (19.2%) | 85 (40.9%) |
| 35 to 44 Years | 43 (15.7%) | 162 (59.1%) |
| 45 to 54 Years | 19 (12.1%) | 77 (49.0%) |
| 55 to 64 Years | 29 (26.1%) | 63 (56.8%) |
| 65 to 74 Years | 113 (91.9%) | 57 (46.3%) |
| 75 Years and over | 37 (100.0%) | 25 (67.6%) |
| Total | 649 (36.8%) | 813 (46.1%) |
Disability Status by Sex by Age in Monon
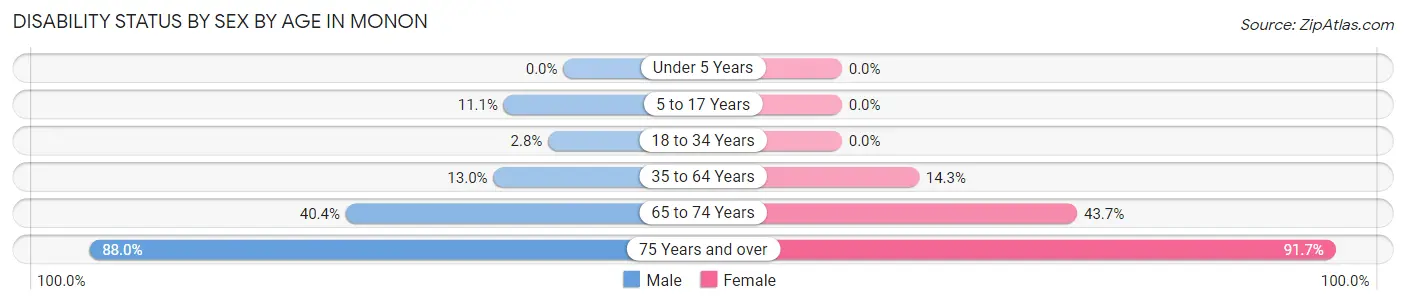
| Age Bracket | Male | Female |
| Under 5 Years | 0 (0.0%) | 0 (0.0%) |
| 5 to 17 Years | 24 (11.1%) | 0 (0.0%) |
| 18 to 34 Years | 8 (2.8%) | 0 (0.0%) |
| 35 to 64 Years | 34 (13.0%) | 40 (14.3%) |
| 65 to 74 Years | 21 (40.4%) | 31 (43.7%) |
| 75 Years and over | 22 (88.0%) | 11 (91.7%) |
Disability Class by Sex by Age in Monon
Disability Class: Hearing Difficulty
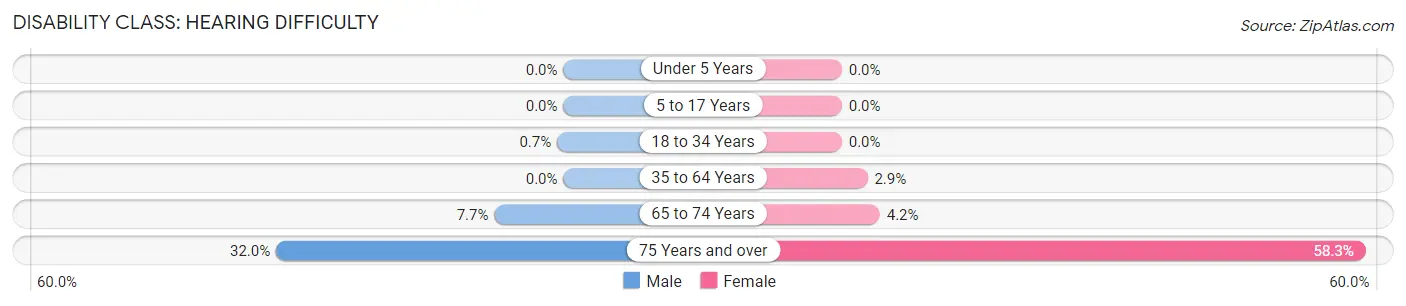
| Age Bracket | Male | Female |
| Under 5 Years | 0 (0.0%) | 0 (0.0%) |
| 5 to 17 Years | 0 (0.0%) | 0 (0.0%) |
| 18 to 34 Years | 2 (0.7%) | 0 (0.0%) |
| 35 to 64 Years | 0 (0.0%) | 8 (2.9%) |
| 65 to 74 Years | 4 (7.7%) | 3 (4.2%) |
| 75 Years and over | 8 (32.0%) | 7 (58.3%) |
Disability Class: Vision Difficulty
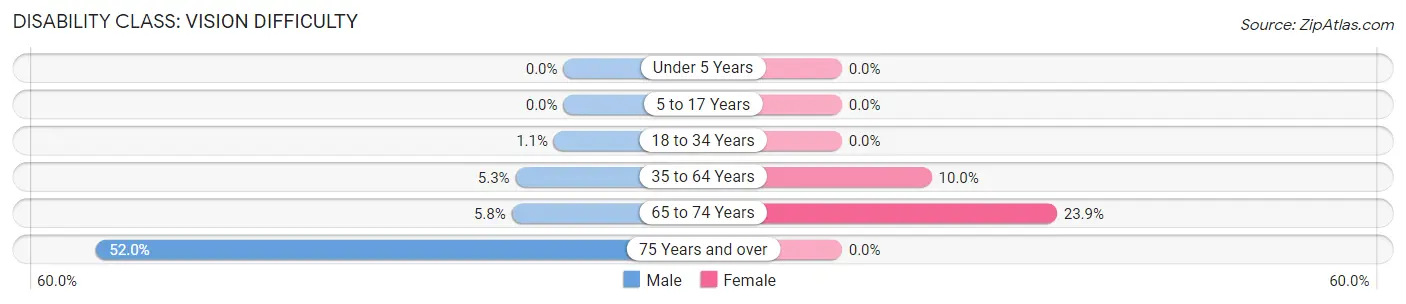
| Age Bracket | Male | Female |
| Under 5 Years | 0 (0.0%) | 0 (0.0%) |
| 5 to 17 Years | 0 (0.0%) | 0 (0.0%) |
| 18 to 34 Years | 3 (1.1%) | 0 (0.0%) |
| 35 to 64 Years | 14 (5.3%) | 28 (10.0%) |
| 65 to 74 Years | 3 (5.8%) | 17 (23.9%) |
| 75 Years and over | 13 (52.0%) | 0 (0.0%) |
Disability Class: Cognitive Difficulty
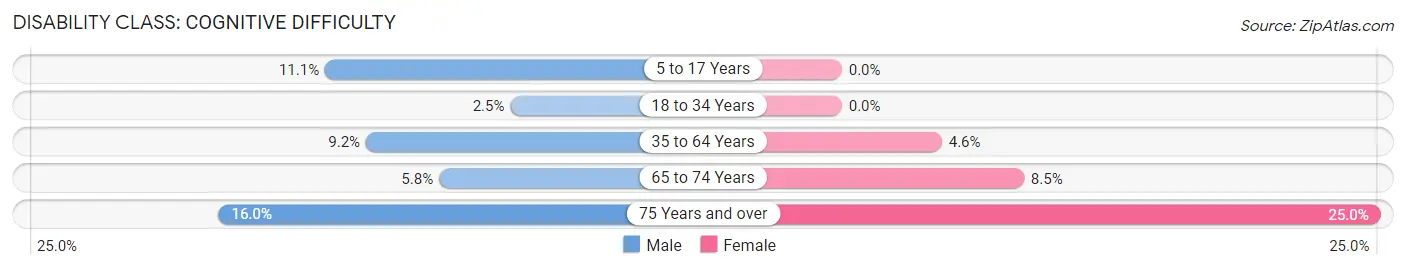
| Age Bracket | Male | Female |
| 5 to 17 Years | 24 (11.1%) | 0 (0.0%) |
| 18 to 34 Years | 7 (2.5%) | 0 (0.0%) |
| 35 to 64 Years | 24 (9.2%) | 13 (4.6%) |
| 65 to 74 Years | 3 (5.8%) | 6 (8.5%) |
| 75 Years and over | 4 (16.0%) | 3 (25.0%) |
Disability Class: Ambulatory Difficulty
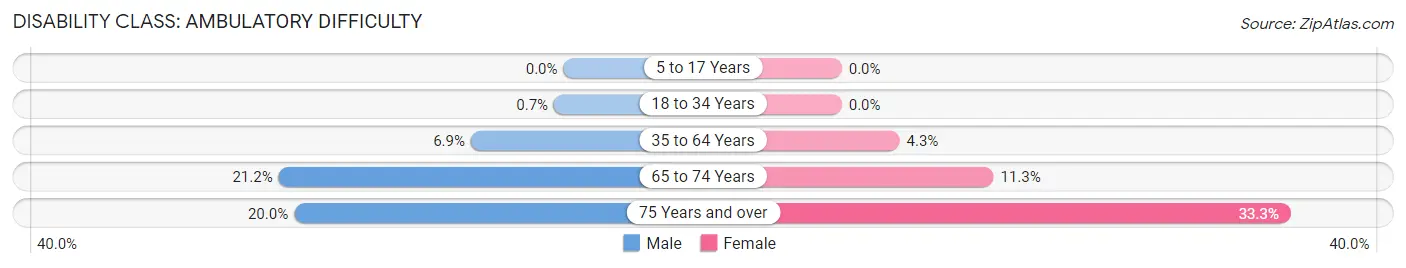
| Age Bracket | Male | Female |
| 5 to 17 Years | 0 (0.0%) | 0 (0.0%) |
| 18 to 34 Years | 2 (0.7%) | 0 (0.0%) |
| 35 to 64 Years | 18 (6.9%) | 12 (4.3%) |
| 65 to 74 Years | 11 (21.1%) | 8 (11.3%) |
| 75 Years and over | 5 (20.0%) | 4 (33.3%) |
Disability Class: Self-Care Difficulty
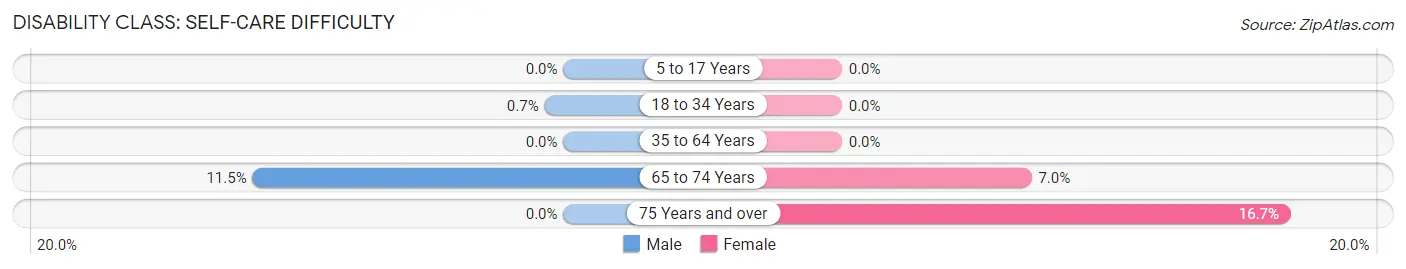
| Age Bracket | Male | Female |
| 5 to 17 Years | 0 (0.0%) | 0 (0.0%) |
| 18 to 34 Years | 2 (0.7%) | 0 (0.0%) |
| 35 to 64 Years | 0 (0.0%) | 0 (0.0%) |
| 65 to 74 Years | 6 (11.5%) | 5 (7.0%) |
| 75 Years and over | 0 (0.0%) | 2 (16.7%) |
Technology Access in Monon
Computing Device Access in Monon
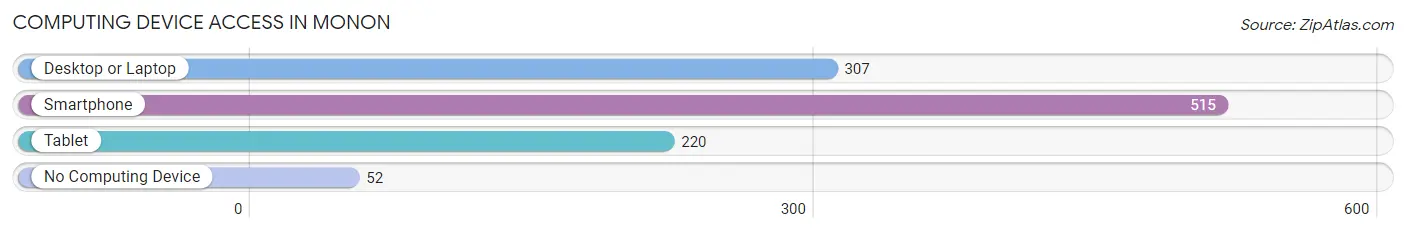
| Device Type | # Households | % Households |
| Desktop or Laptop | 307 | 52.7% |
| Smartphone | 515 | 88.3% |
| Tablet | 220 | 37.7% |
| No Computing Device | 52 | 8.9% |
| Total | 583 | 100.0% |
Internet Access in Monon
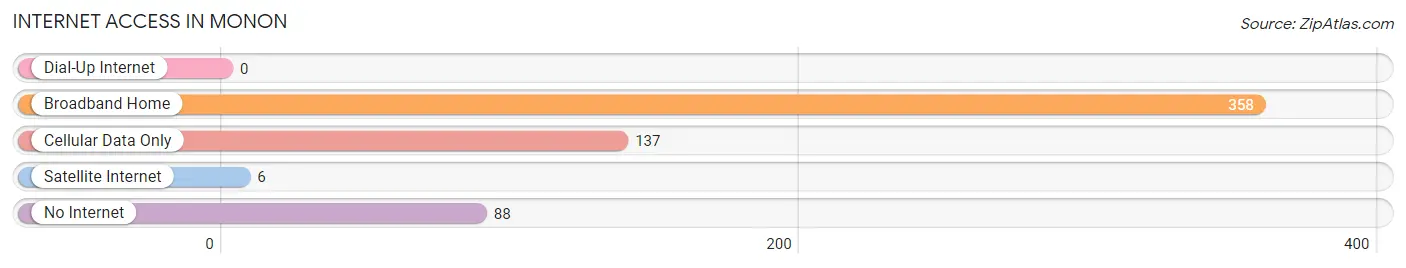
| Internet Type | # Households | % Households |
| Dial-Up Internet | 0 | 0.0% |
| Broadband Home | 358 | 61.4% |
| Cellular Data Only | 137 | 23.5% |
| Satellite Internet | 6 | 1.0% |
| No Internet | 88 | 15.1% |
| Total | 583 | 100.0% |
Monon Summary
Monon, Indiana is a small town located in White County, Indiana. It is situated in the northwest corner of the state, approximately 30 miles south of the Illinois border. The town was founded in 1851 and has a population of 1,845 as of the 2010 census.
Geography
Monon is located at 40°59'N, 86°45'W (40.983, -86.75). The town is situated in the Tippecanoe River Valley, which is part of the Wabash River watershed. The town is surrounded by rolling hills and farmland. The nearest major city is Lafayette, Indiana, which is approximately 25 miles to the south.
History
Monon was founded in 1851 by a group of settlers from Ohio. The town was named after the Monon Railroad, which ran through the area. The railroad was a major factor in the town's growth and development, as it provided a means of transportation for goods and people. The town was incorporated in 1871.
In the late 19th century, Monon was a thriving agricultural community. The town was home to several grain elevators, a flour mill, and a canning factory. The town also had a number of stores and businesses, including a hotel, a bank, and a newspaper.
In the early 20th century, the town's economy shifted from agriculture to manufacturing. The Monon Manufacturing Company was established in the town in 1910 and produced a variety of products, including furniture, tools, and farm implements. The company was a major employer in the town until it closed in the late 1970s.
Economy
Today, Monon's economy is largely based on agriculture and tourism. The town is home to several farms, which produce a variety of crops, including corn, soybeans, and wheat. The town is also home to several wineries, which attract visitors from all over the region.
The town is also home to several small businesses, including a hardware store, a grocery store, and a restaurant. The town also has a post office, a library, and a medical clinic.
Demographics
As of the 2010 census, Monon had a population of 1,845. The town is predominantly white (97.2%), with a small Hispanic population (1.2%). The median household income is $45,000, and the median home value is $90,000.
Monon is a small, rural town with a strong sense of community. The town is home to several churches, a volunteer fire department, and a community center. The town also hosts several annual events, including a Fourth of July parade and a fall festival.
Common Questions
What is Per Capita Income in Monon?
Per Capita income in Monon is $20,354.
What is the Median Family Income in Monon?
Median Family Income in Monon is $55,469.
What is the Median Household income in Monon?
Median Household Income in Monon is $52,596.
What is Income or Wage Gap in Monon?
Income or Wage Gap in Monon is 31.8%.
Women in Monon earn 68.2 cents for every dollar earned by a man.
What is Inequality or Gini Index in Monon?
Inequality or Gini Index in Monon is 0.34.
What is the Total Population of Monon?
Total Population of Monon is 1,764.
What is the Total Male Population of Monon?
Total Male Population of Monon is 917.
What is the Total Female Population of Monon?
Total Female Population of Monon is 847.
What is the Ratio of Males per 100 Females in Monon?
There are 108.26 Males per 100 Females in Monon.
What is the Ratio of Females per 100 Males in Monon?
There are 92.37 Females per 100 Males in Monon.
What is the Median Population Age in Monon?
Median Population Age in Monon is 27.3 Years.
What is the Average Family Size in Monon
Average Family Size in Monon is 3.5 People.
What is the Average Household Size in Monon
Average Household Size in Monon is 3.0 People.
How Large is the Labor Force in Monon?
There are 847 People in the Labor Forcein in Monon.
What is the Percentage of People in the Labor Force in Monon?
69.0% of People are in the Labor Force in Monon.
What is the Unemployment Rate in Monon?
Unemployment Rate in Monon is 9.9%.