Brook, IN Map & Demographics
Brook Map
Brook Overview
$24,490
PER CAPITA INCOME
$55,208
AVG FAMILY INCOME
$52,065
AVG HOUSEHOLD INCOME
27.7%
WAGE / INCOME GAP [ % ]
72.3¢/ $1
WAGE / INCOME GAP [ $ ]
0.39
INEQUALITY / GINI INDEX
960
TOTAL POPULATION
482
MALE POPULATION
478
FEMALE POPULATION
100.84
MALES / 100 FEMALES
99.17
FEMALES / 100 MALES
35.9
MEDIAN AGE
3.3
AVG FAMILY SIZE
2.8
AVG HOUSEHOLD SIZE
498
LABOR FORCE [ PEOPLE ]
64.5%
PERCENT IN LABOR FORCE
5.8%
UNEMPLOYMENT RATE
Brook Zip Codes
Brook Area Codes
Income in Brook
Income Overview in Brook
Per Capita Income in Brook is $24,490, while median incomes of families and households are $55,208 and $52,065 respectively.
| Characteristic | Number | Measure |
| Per Capita Income | 960 | $24,490 |
| Median Family Income | 238 | $55,208 |
| Mean Family Income | 238 | $74,106 |
| Median Household Income | 344 | $52,065 |
| Mean Household Income | 344 | $63,594 |
| Income Deficit | 238 | $0 |
| Wage / Income Gap (%) | 960 | 27.67% |
| Wage / Income Gap ($) | 960 | 72.33¢ per $1 |
| Gini / Inequality Index | 960 | 0.39 |
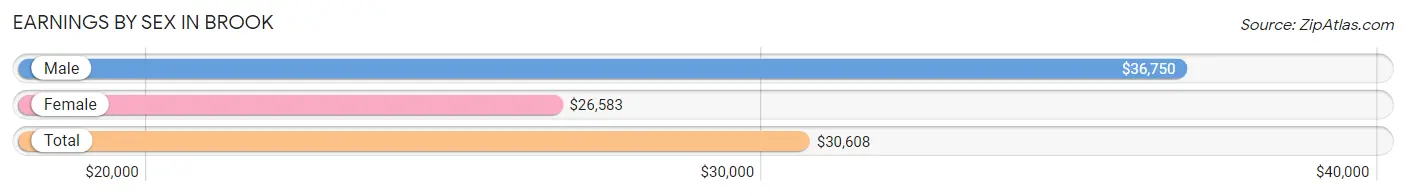
Earnings by Sex in Brook
Average Earnings in Brook are $30,608, $36,750 for men and $26,583 for women, a difference of 27.7%.
| Sex | Number | Average Earnings |
| Male | 279 (54.3%) | $36,750 |
| Female | 235 (45.7%) | $26,583 |
| Total | 514 (100.0%) | $30,608 |
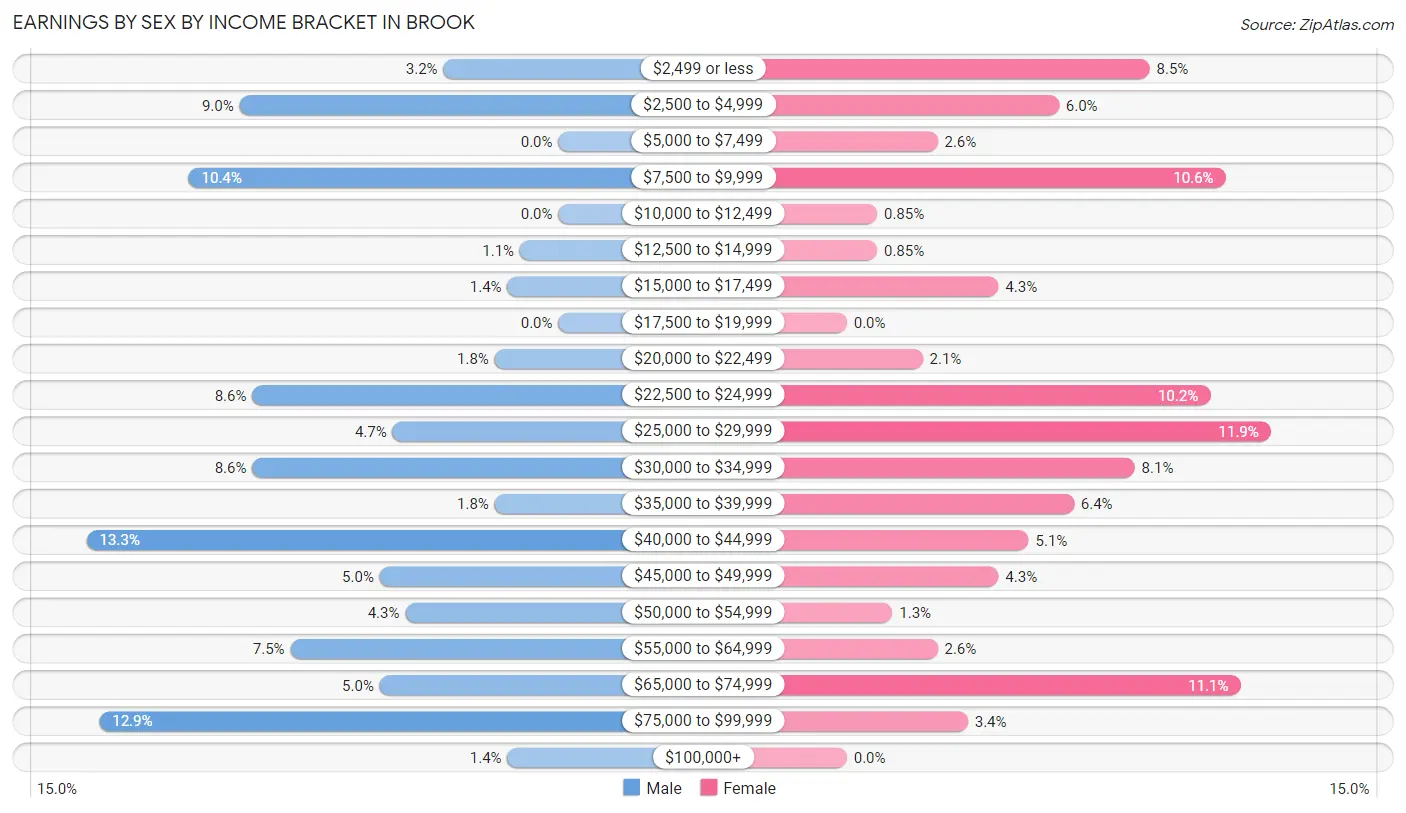
Earnings by Sex by Income Bracket in Brook
The most common earnings brackets in Brook are $40,000 to $44,999 for men (37 | 13.3%) and $25,000 to $29,999 for women (28 | 11.9%).
| Income | Male | Female |
| $2,499 or less | 9 (3.2%) | 20 (8.5%) |
| $2,500 to $4,999 | 25 (9.0%) | 14 (6.0%) |
| $5,000 to $7,499 | 0 (0.0%) | 6 (2.5%) |
| $7,500 to $9,999 | 29 (10.4%) | 25 (10.6%) |
| $10,000 to $12,499 | 0 (0.0%) | 2 (0.9%) |
| $12,500 to $14,999 | 3 (1.1%) | 2 (0.9%) |
| $15,000 to $17,499 | 4 (1.4%) | 10 (4.3%) |
| $17,500 to $19,999 | 0 (0.0%) | 0 (0.0%) |
| $20,000 to $22,499 | 5 (1.8%) | 5 (2.1%) |
| $22,500 to $24,999 | 24 (8.6%) | 24 (10.2%) |
| $25,000 to $29,999 | 13 (4.7%) | 28 (11.9%) |
| $30,000 to $34,999 | 24 (8.6%) | 19 (8.1%) |
| $35,000 to $39,999 | 5 (1.8%) | 15 (6.4%) |
| $40,000 to $44,999 | 37 (13.3%) | 12 (5.1%) |
| $45,000 to $49,999 | 14 (5.0%) | 10 (4.3%) |
| $50,000 to $54,999 | 12 (4.3%) | 3 (1.3%) |
| $55,000 to $64,999 | 21 (7.5%) | 6 (2.5%) |
| $65,000 to $74,999 | 14 (5.0%) | 26 (11.1%) |
| $75,000 to $99,999 | 36 (12.9%) | 8 (3.4%) |
| $100,000+ | 4 (1.4%) | 0 (0.0%) |
| Total | 279 (100.0%) | 235 (100.0%) |
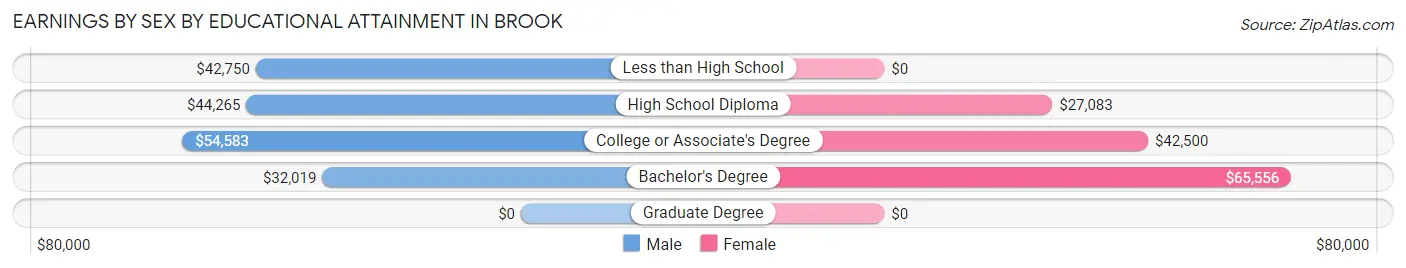
Earnings by Sex by Educational Attainment in Brook
Average earnings in Brook are $45,568 for men and $27,788 for women, a difference of 39.0%. Men with an educational attainment of college or associate's degree enjoy the highest average annual earnings of $54,583, while those with bachelor's degree education earn the least with $32,019. Women with an educational attainment of bachelor's degree earn the most with the average annual earnings of $65,556, while those with high school diploma education have the smallest earnings of $27,083.
| Educational Attainment | Male Income | Female Income |
| Less than High School | $42,750 | $0 |
| High School Diploma | $44,265 | $27,083 |
| College or Associate's Degree | $54,583 | $42,500 |
| Bachelor's Degree | $32,019 | $65,556 |
| Graduate Degree | - | - |
| Total | $45,568 | $27,788 |
Family Income in Brook
Family Income Brackets in Brook
According to the Brook family income data, there are 65 families falling into the $50,000 to $74,999 income range, which is the most common income bracket and makes up 27.3% of all families.
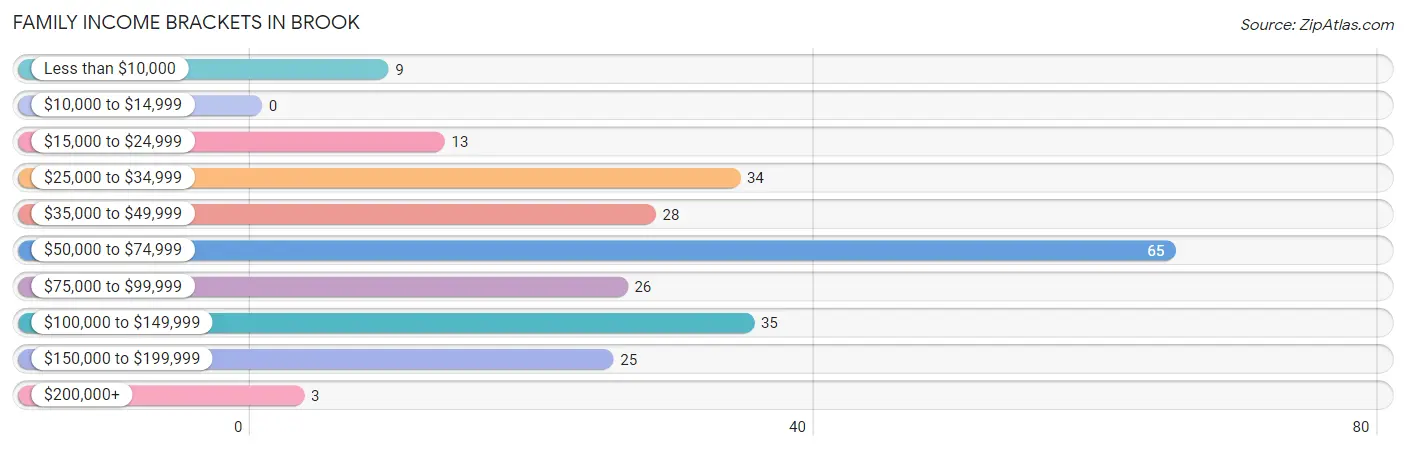
| Income Bracket | # Families | % Families |
| Less than $10,000 | 9 | 3.8% |
| $10,000 to $14,999 | 0 | 0.0% |
| $15,000 to $24,999 | 13 | 5.5% |
| $25,000 to $34,999 | 34 | 14.3% |
| $35,000 to $49,999 | 28 | 11.8% |
| $50,000 to $74,999 | 65 | 27.3% |
| $75,000 to $99,999 | 26 | 10.9% |
| $100,000 to $149,999 | 35 | 14.7% |
| $150,000 to $199,999 | 25 | 10.5% |
| $200,000+ | 3 | 1.3% |
Family Income by Famaliy Size in Brook
5-person families (23 | 9.7%) account for the highest median family income in Brook with $114,583 per family, while 2-person families (119 | 50.0%) have the highest median income of $27,188 per family member.
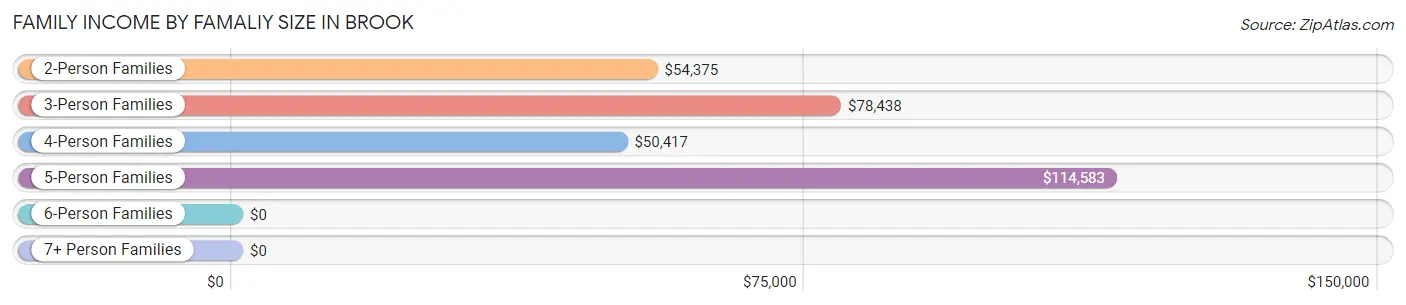
| Income Bracket | # Families | Median Income |
| 2-Person Families | 119 (50.0%) | $54,375 |
| 3-Person Families | 42 (17.6%) | $78,438 |
| 4-Person Families | 43 (18.1%) | $50,417 |
| 5-Person Families | 23 (9.7%) | $114,583 |
| 6-Person Families | 6 (2.5%) | $0 |
| 7+ Person Families | 5 (2.1%) | $0 |
| Total | 238 (100.0%) | $55,208 |
Family Income by Number of Earners in Brook
The median family income in Brook is $55,208, with families comprising 3+ earners (43) having the highest median family income of $119,688, while families with no earners (37) have the lowest median family income of $39,464, accounting for 18.1% and 15.5% of families, respectively.
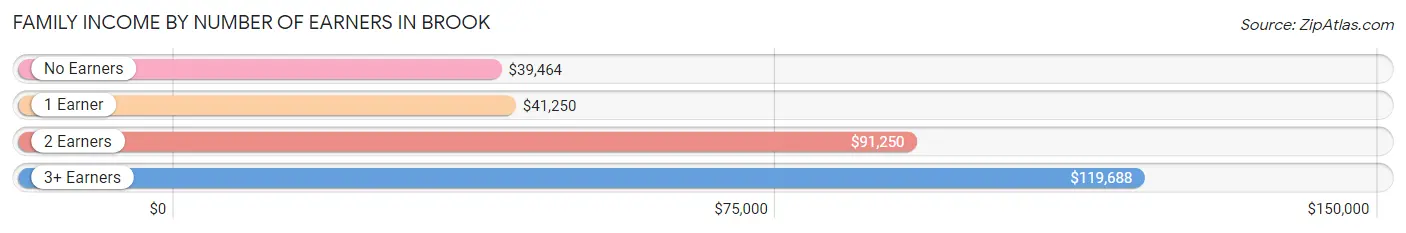
| Number of Earners | # Families | Median Income |
| No Earners | 37 (15.5%) | $39,464 |
| 1 Earner | 88 (37.0%) | $41,250 |
| 2 Earners | 70 (29.4%) | $91,250 |
| 3+ Earners | 43 (18.1%) | $119,688 |
| Total | 238 (100.0%) | $55,208 |
Household Income in Brook
Household Income Brackets in Brook
With 92 households falling in the category, the $50,000 to $74,999 income range is the most frequent in Brook, accounting for 26.7% of all households. In contrast, only 3 households (0.9%) fall into the $200,000+ income bracket, making it the least populous group.
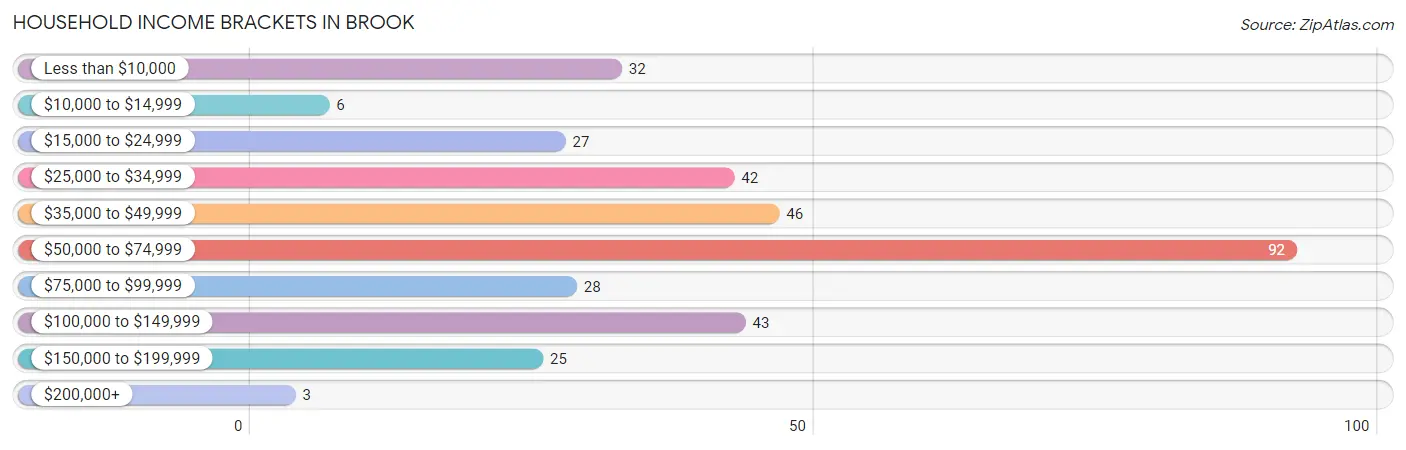
| Income Bracket | # Households | % Households |
| Less than $10,000 | 32 | 9.3% |
| $10,000 to $14,999 | 6 | 1.7% |
| $15,000 to $24,999 | 27 | 7.8% |
| $25,000 to $34,999 | 42 | 12.2% |
| $35,000 to $49,999 | 46 | 13.4% |
| $50,000 to $74,999 | 92 | 26.7% |
| $75,000 to $99,999 | 28 | 8.1% |
| $100,000 to $149,999 | 43 | 12.5% |
| $150,000 to $199,999 | 25 | 7.3% |
| $200,000+ | 3 | 0.9% |
Household Income by Householder Age in Brook
The median household income in Brook is $52,065, with the highest median household income of $67,500 found in the 25 to 44 years age bracket for the primary householder. A total of 112 households (32.6%) fall into this category. Meanwhile, the 65+ years age bracket for the primary householder has the lowest median household income of $39,286, with 116 households (33.7%) in this group.
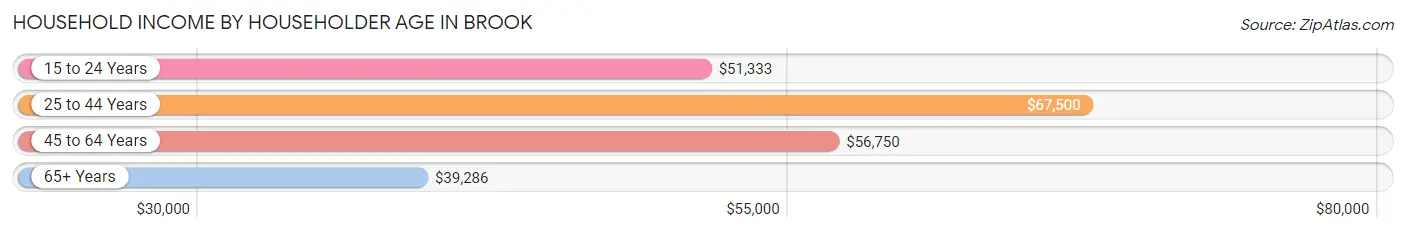
| Income Bracket | # Households | Median Income |
| 15 to 24 Years | 20 (5.8%) | $51,333 |
| 25 to 44 Years | 112 (32.6%) | $67,500 |
| 45 to 64 Years | 96 (27.9%) | $56,750 |
| 65+ Years | 116 (33.7%) | $39,286 |
| Total | 344 (100.0%) | $52,065 |
Poverty in Brook
Income Below Poverty by Sex and Age in Brook
With 5.7% poverty level for males and 13.0% for females among the residents of Brook, 16 and 17 year old males and 12 to 14 year old females are the most vulnerable to poverty, with 3 males (18.8%) and 3 females (75.0%) in their respective age groups living below the poverty level.
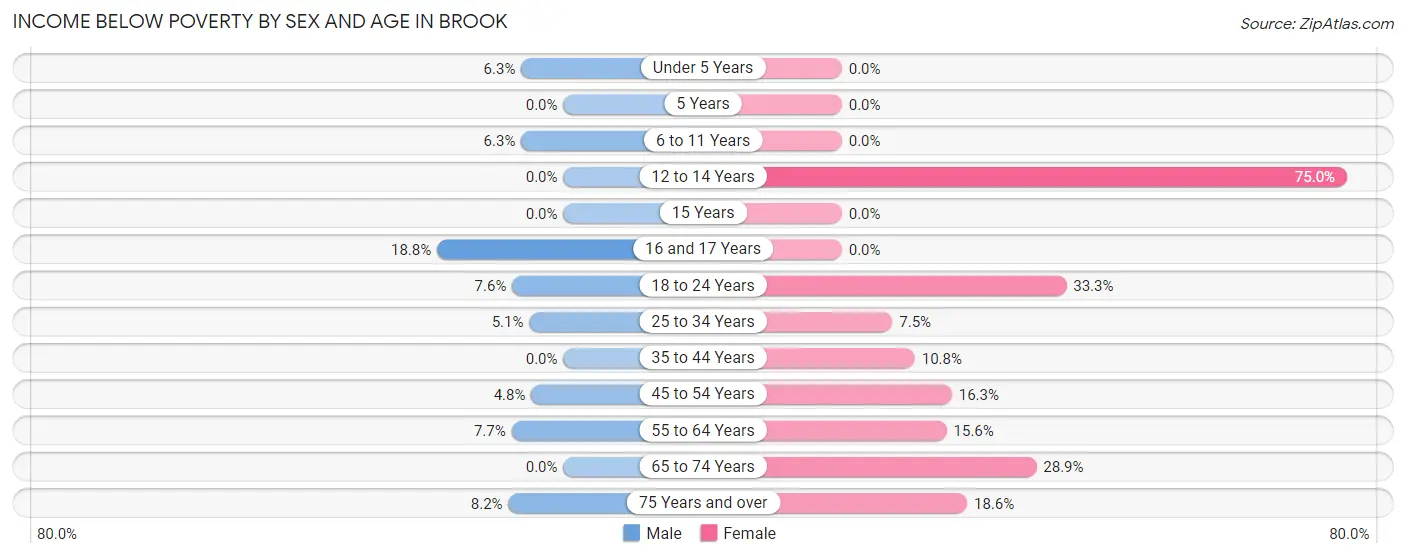
| Age Bracket | Male | Female |
| Under 5 Years | 3 (6.2%) | 0 (0.0%) |
| 5 Years | 0 (0.0%) | 0 (0.0%) |
| 6 to 11 Years | 1 (6.2%) | 0 (0.0%) |
| 12 to 14 Years | 0 (0.0%) | 3 (75.0%) |
| 15 Years | 0 (0.0%) | 0 (0.0%) |
| 16 and 17 Years | 3 (18.8%) | 0 (0.0%) |
| 18 to 24 Years | 6 (7.6%) | 7 (33.3%) |
| 25 to 34 Years | 4 (5.1%) | 6 (7.5%) |
| 35 to 44 Years | 0 (0.0%) | 9 (10.8%) |
| 45 to 54 Years | 2 (4.8%) | 8 (16.3%) |
| 55 to 64 Years | 4 (7.7%) | 7 (15.6%) |
| 65 to 74 Years | 0 (0.0%) | 13 (28.9%) |
| 75 Years and over | 4 (8.2%) | 8 (18.6%) |
| Total | 27 (5.7%) | 61 (13.0%) |
Income Above Poverty by Sex and Age in Brook
According to the poverty statistics in Brook, males aged 5 years and females aged under 5 years are the age groups that are most secure financially, with 100.0% of males and 100.0% of females in these age groups living above the poverty line.
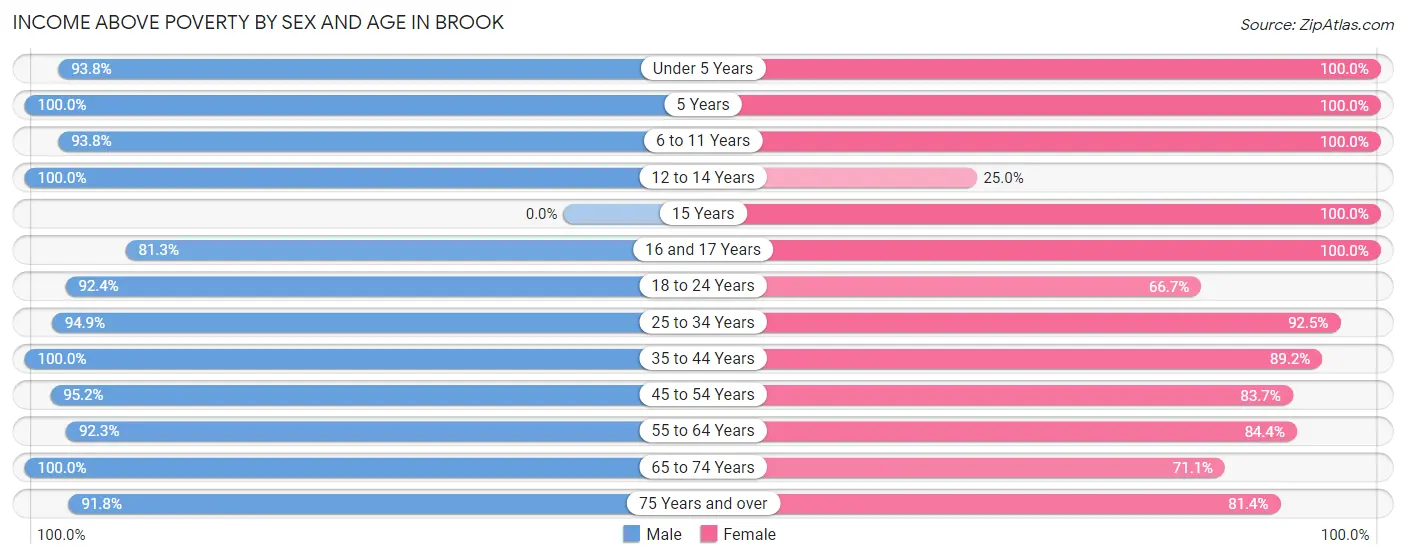
| Age Bracket | Male | Female |
| Under 5 Years | 45 (93.8%) | 33 (100.0%) |
| 5 Years | 4 (100.0%) | 20 (100.0%) |
| 6 to 11 Years | 15 (93.8%) | 42 (100.0%) |
| 12 to 14 Years | 5 (100.0%) | 1 (25.0%) |
| 15 Years | 0 (0.0%) | 2 (100.0%) |
| 16 and 17 Years | 13 (81.2%) | 4 (100.0%) |
| 18 to 24 Years | 73 (92.4%) | 14 (66.7%) |
| 25 to 34 Years | 75 (94.9%) | 74 (92.5%) |
| 35 to 44 Years | 64 (100.0%) | 74 (89.2%) |
| 45 to 54 Years | 40 (95.2%) | 41 (83.7%) |
| 55 to 64 Years | 48 (92.3%) | 38 (84.4%) |
| 65 to 74 Years | 21 (100.0%) | 32 (71.1%) |
| 75 Years and over | 45 (91.8%) | 35 (81.4%) |
| Total | 448 (94.3%) | 410 (87.1%) |
Income Below Poverty Among Married-Couple Families in Brook
The poverty statistics for married-couple families in Brook show that 1.2% or 2 of the total 165 families live below the poverty line. Families with 1 or 2 children have the highest poverty rate of 3.9%, comprising of 2 families. On the other hand, families with no children have the lowest poverty rate of 0.0%, which includes 0 families.
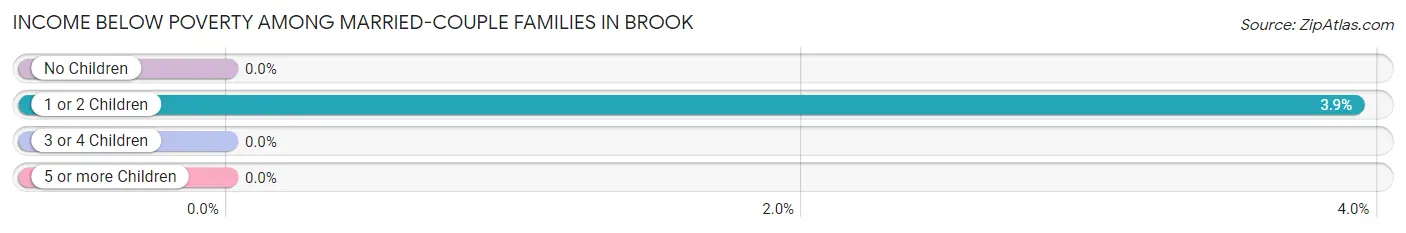
| Children | Above Poverty | Below Poverty |
| No Children | 92 (100.0%) | 0 (0.0%) |
| 1 or 2 Children | 49 (96.1%) | 2 (3.9%) |
| 3 or 4 Children | 17 (100.0%) | 0 (0.0%) |
| 5 or more Children | 5 (100.0%) | 0 (0.0%) |
| Total | 163 (98.8%) | 2 (1.2%) |
Income Below Poverty Among Single-Parent Households in Brook
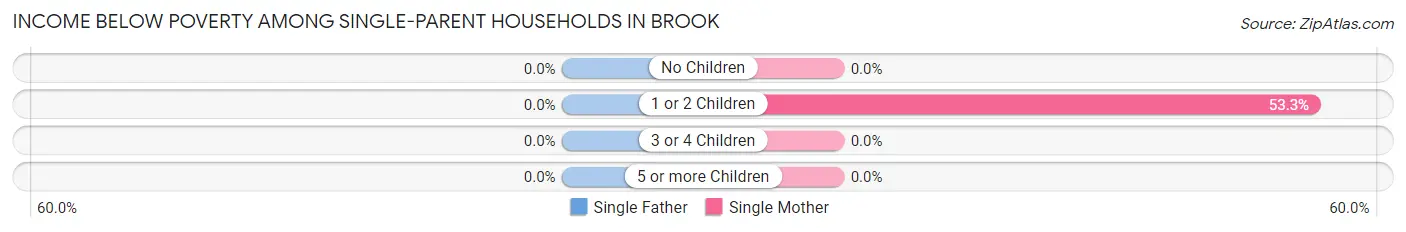
| Children | Single Father | Single Mother |
| No Children | 0 (0.0%) | 0 (0.0%) |
| 1 or 2 Children | 0 (0.0%) | 8 (53.3%) |
| 3 or 4 Children | 0 (0.0%) | 0 (0.0%) |
| 5 or more Children | 0 (0.0%) | 0 (0.0%) |
| Total | 0 (0.0%) | 8 (17.8%) |
Income Below Poverty Among Married-Couple vs Single-Parent Households in Brook
The poverty data for Brook shows that 2 of the married-couple family households (1.2%) and 8 of the single-parent households (11.0%) are living below the poverty level. Within the married-couple family households, those with 1 or 2 children have the highest poverty rate, with 2 households (3.9%) falling below the poverty line. Among the single-parent households, those with 1 or 2 children have the highest poverty rate, with 8 household (21.0%) living below poverty.
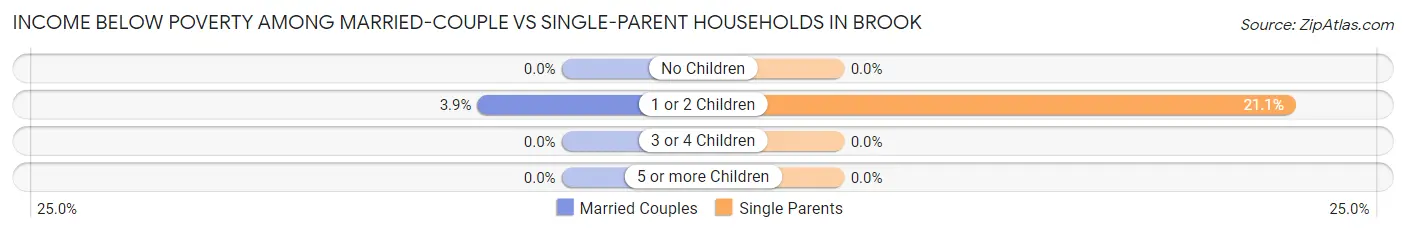
| Children | Married-Couple Families | Single-Parent Households |
| No Children | 0 (0.0%) | 0 (0.0%) |
| 1 or 2 Children | 2 (3.9%) | 8 (21.0%) |
| 3 or 4 Children | 0 (0.0%) | 0 (0.0%) |
| 5 or more Children | 0 (0.0%) | 0 (0.0%) |
| Total | 2 (1.2%) | 8 (11.0%) |
Race in Brook
The most populous races in Brook are White / Caucasian (868 | 90.4%), Hispanic or Latino (168 | 17.5%), and Two or more Races (50 | 5.2%).
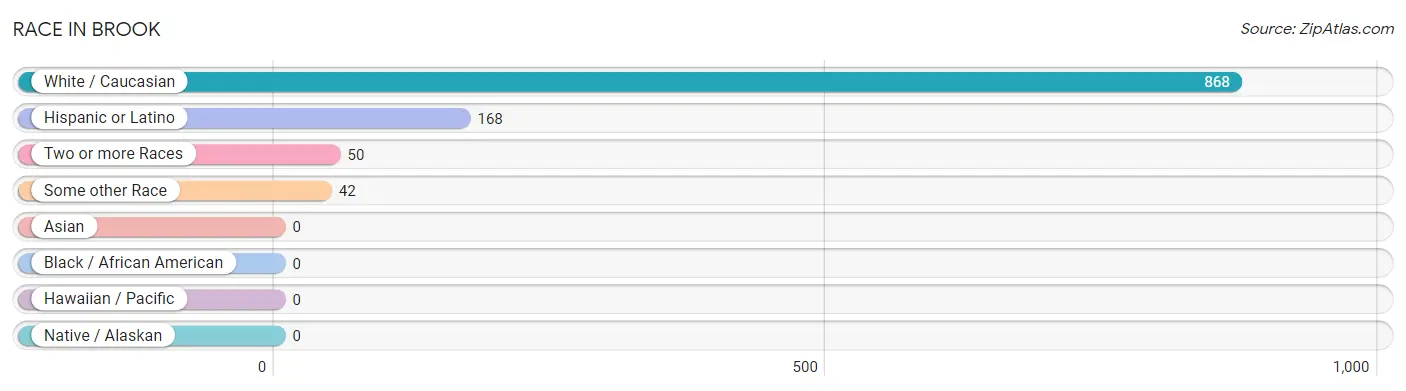
| Race | # Population | % Population |
| Asian | 0 | 0.0% |
| Black / African American | 0 | 0.0% |
| Hawaiian / Pacific | 0 | 0.0% |
| Hispanic or Latino | 168 | 17.5% |
| Native / Alaskan | 0 | 0.0% |
| White / Caucasian | 868 | 90.4% |
| Two or more Races | 50 | 5.2% |
| Some other Race | 42 | 4.4% |
| Total | 960 | 100.0% |
Ancestry in Brook
The most populous ancestries reported in Brook are Irish (190 | 19.8%), German (182 | 19.0%), Central American (108 | 11.3%), Salvadoran (106 | 11.0%), and English (68 | 7.1%), together accounting for 68.1% of all Brook residents.
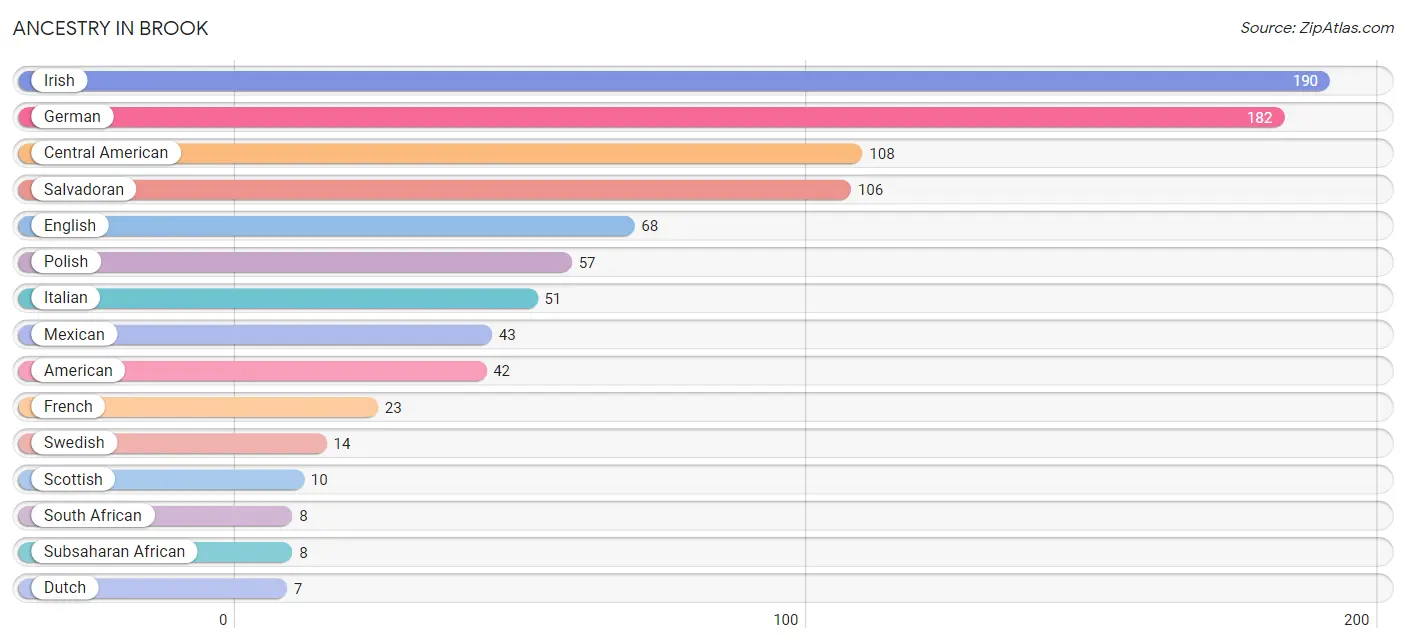
| Ancestry | # Population | % Population |
| American | 42 | 4.4% |
| Canadian | 2 | 0.2% |
| Central American | 108 | 11.3% |
| Central American Indian | 2 | 0.2% |
| Danish | 1 | 0.1% |
| Dutch | 7 | 0.7% |
| English | 68 | 7.1% |
| European | 2 | 0.2% |
| Finnish | 2 | 0.2% |
| French | 23 | 2.4% |
| French Canadian | 3 | 0.3% |
| German | 182 | 19.0% |
| Honduran | 2 | 0.2% |
| Indian (Asian) | 7 | 0.7% |
| Irish | 190 | 19.8% |
| Italian | 51 | 5.3% |
| Mexican | 43 | 4.5% |
| Mexican American Indian | 5 | 0.5% |
| Native Hawaiian | 7 | 0.7% |
| Norwegian | 3 | 0.3% |
| Polish | 57 | 5.9% |
| Salvadoran | 106 | 11.0% |
| Scotch-Irish | 2 | 0.2% |
| Scottish | 10 | 1.0% |
| South African | 8 | 0.8% |
| Spanish | 7 | 0.7% |
| Subsaharan African | 8 | 0.8% |
| Swedish | 14 | 1.5% |
| Welsh | 5 | 0.5% | View All 29 Rows |
Immigrants in Brook
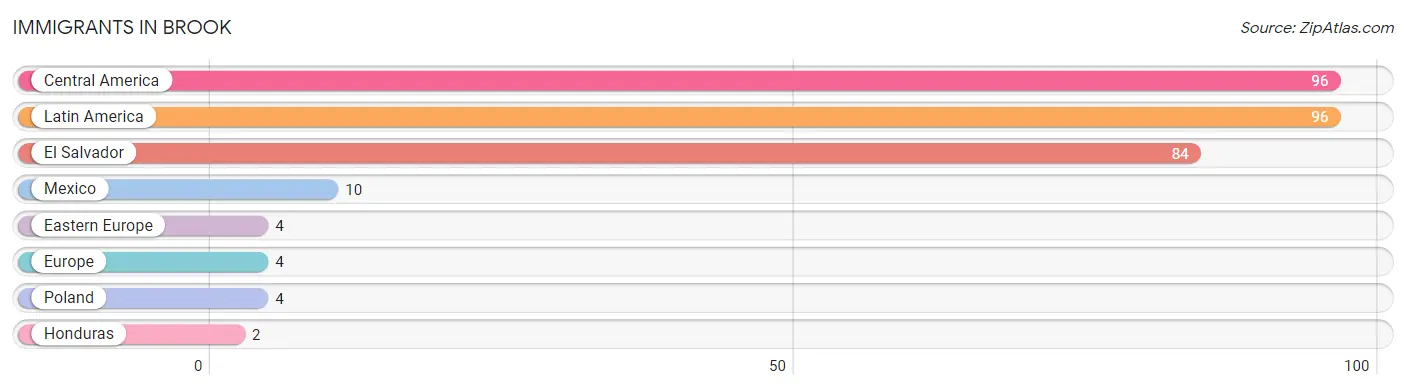
The most numerous immigrant groups reported in Brook came from Central America (96 | 10.0%), Latin America (96 | 10.0%), El Salvador (84 | 8.7%), Mexico (10 | 1.0%), and Eastern Europe (4 | 0.4%), together accounting for 30.2% of all Brook residents.
| Immigration Origin | # Population | % Population |
| Central America | 96 | 10.0% |
| Eastern Europe | 4 | 0.4% |
| El Salvador | 84 | 8.7% |
| Europe | 4 | 0.4% |
| Honduras | 2 | 0.2% |
| Latin America | 96 | 10.0% |
| Mexico | 10 | 1.0% |
| Poland | 4 | 0.4% | View All 8 Rows |
Sex and Age in Brook
Sex and Age in Brook
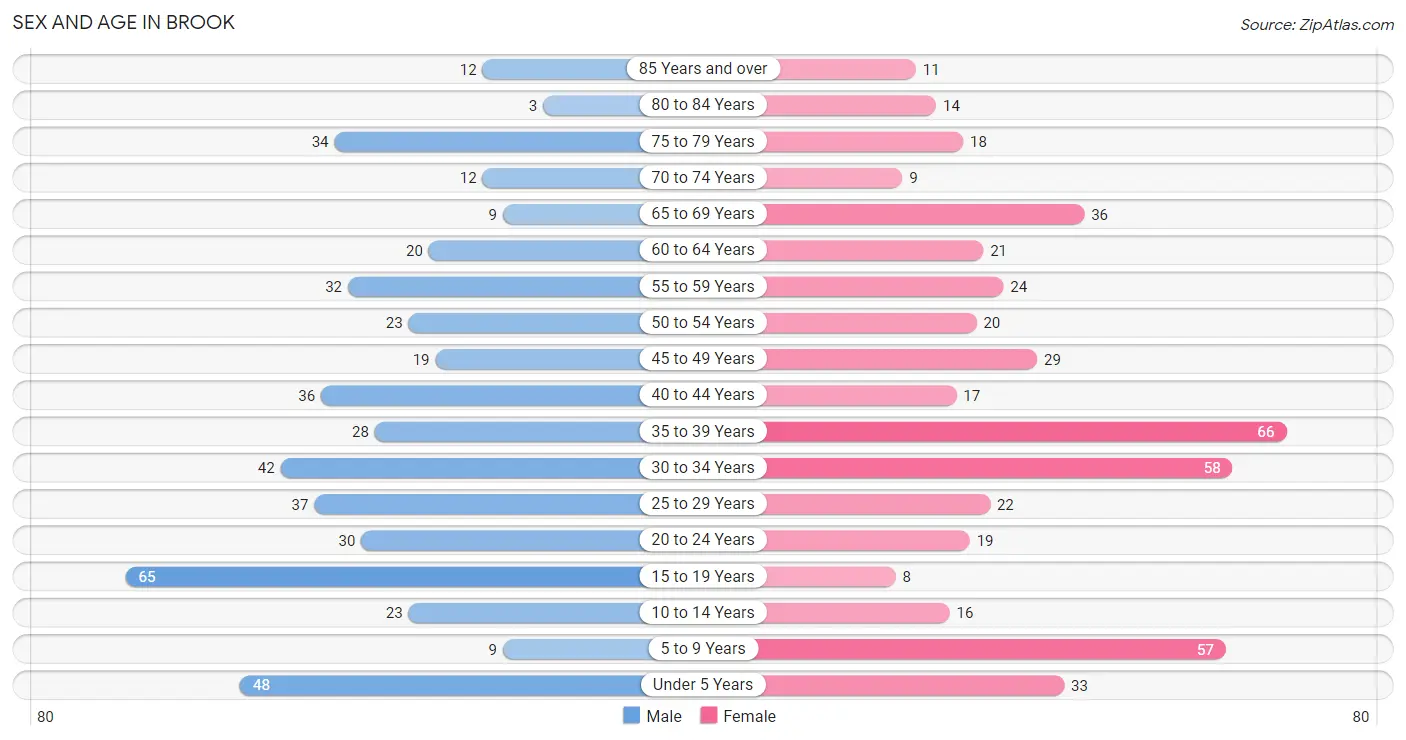
The most populous age groups in Brook are 15 to 19 Years (65 | 13.5%) for men and 35 to 39 Years (66 | 13.8%) for women.
| Age Bracket | Male | Female |
| Under 5 Years | 48 (10.0%) | 33 (6.9%) |
| 5 to 9 Years | 9 (1.9%) | 57 (11.9%) |
| 10 to 14 Years | 23 (4.8%) | 16 (3.4%) |
| 15 to 19 Years | 65 (13.5%) | 8 (1.7%) |
| 20 to 24 Years | 30 (6.2%) | 19 (4.0%) |
| 25 to 29 Years | 37 (7.7%) | 22 (4.6%) |
| 30 to 34 Years | 42 (8.7%) | 58 (12.1%) |
| 35 to 39 Years | 28 (5.8%) | 66 (13.8%) |
| 40 to 44 Years | 36 (7.5%) | 17 (3.6%) |
| 45 to 49 Years | 19 (3.9%) | 29 (6.1%) |
| 50 to 54 Years | 23 (4.8%) | 20 (4.2%) |
| 55 to 59 Years | 32 (6.6%) | 24 (5.0%) |
| 60 to 64 Years | 20 (4.2%) | 21 (4.4%) |
| 65 to 69 Years | 9 (1.9%) | 36 (7.5%) |
| 70 to 74 Years | 12 (2.5%) | 9 (1.9%) |
| 75 to 79 Years | 34 (7.0%) | 18 (3.8%) |
| 80 to 84 Years | 3 (0.6%) | 14 (2.9%) |
| 85 Years and over | 12 (2.5%) | 11 (2.3%) |
| Total | 482 (100.0%) | 478 (100.0%) |
Families and Households in Brook
Median Family Size in Brook
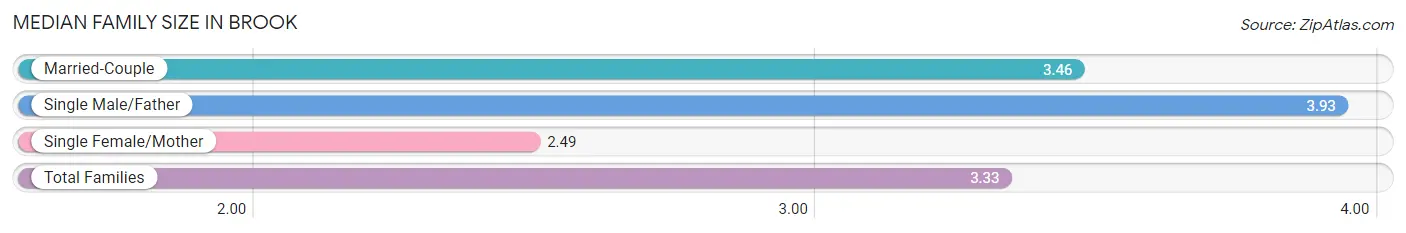
The median family size in Brook is 3.33 persons per family, with single male/father families (28 | 11.8%) accounting for the largest median family size of 3.93 persons per family. On the other hand, single female/mother families (45 | 18.9%) represent the smallest median family size with 2.49 persons per family.
| Family Type | # Families | Family Size |
| Married-Couple | 165 (69.3%) | 3.46 |
| Single Male/Father | 28 (11.8%) | 3.93 |
| Single Female/Mother | 45 (18.9%) | 2.49 |
| Total Families | 238 (100.0%) | 3.33 |
Median Household Size in Brook
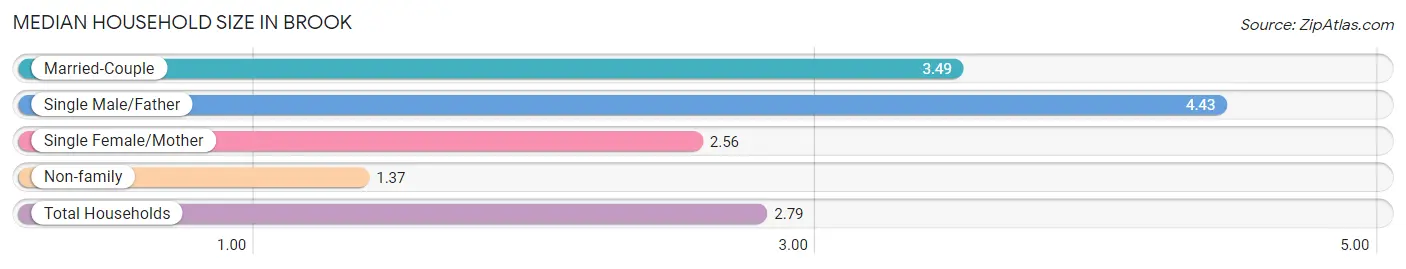
The median household size in Brook is 2.79 persons per household, with single male/father households (28 | 8.1%) accounting for the largest median household size of 4.43 persons per household. non-family households (106 | 30.8%) represent the smallest median household size with 1.37 persons per household.
| Household Type | # Households | Household Size |
| Married-Couple | 165 (48.0%) | 3.49 |
| Single Male/Father | 28 (8.1%) | 4.43 |
| Single Female/Mother | 45 (13.1%) | 2.56 |
| Non-family | 106 (30.8%) | 1.37 |
| Total Households | 344 (100.0%) | 2.79 |
Household Size by Marriage Status in Brook
Out of a total of 344 households in Brook, 238 (69.2%) are family households, while 106 (30.8%) are nonfamily households. The most numerous type of family households are 2-person households, comprising 112, and the most common type of nonfamily households are 1-person households, comprising 91.
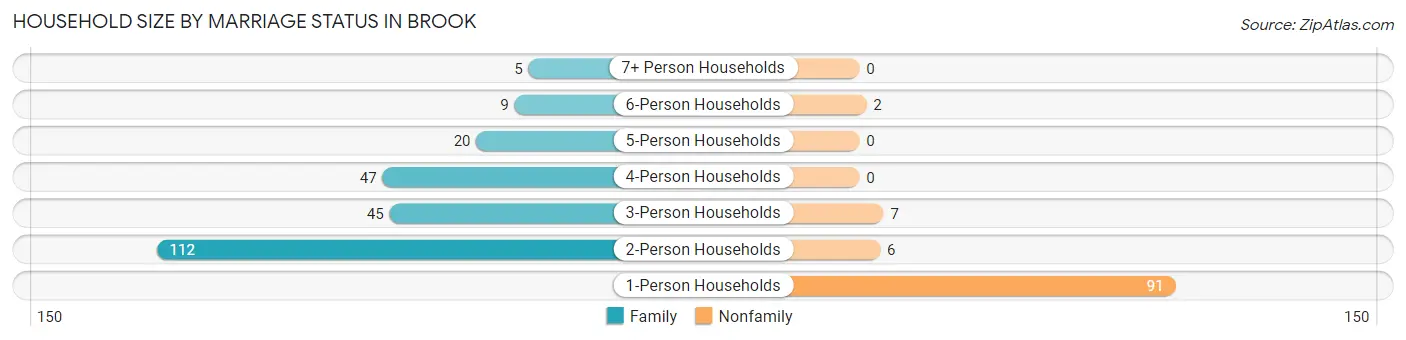
| Household Size | Family Households | Nonfamily Households |
| 1-Person Households | - | 91 (26.5%) |
| 2-Person Households | 112 (32.6%) | 6 (1.7%) |
| 3-Person Households | 45 (13.1%) | 7 (2.0%) |
| 4-Person Households | 47 (13.7%) | 0 (0.0%) |
| 5-Person Households | 20 (5.8%) | 0 (0.0%) |
| 6-Person Households | 9 (2.6%) | 2 (0.6%) |
| 7+ Person Households | 5 (1.5%) | 0 (0.0%) |
| Total | 238 (69.2%) | 106 (30.8%) |
Female Fertility in Brook
Fertility by Age in Brook
Average fertility rate in Brook is 66.0 births per 1,000 women. Women in the age bracket of 35 to 50 years have the highest fertility rate with 82.0 births per 1,000 women. Women in the age bracket of 35 to 50 years acount for 66.7% of all women with births.
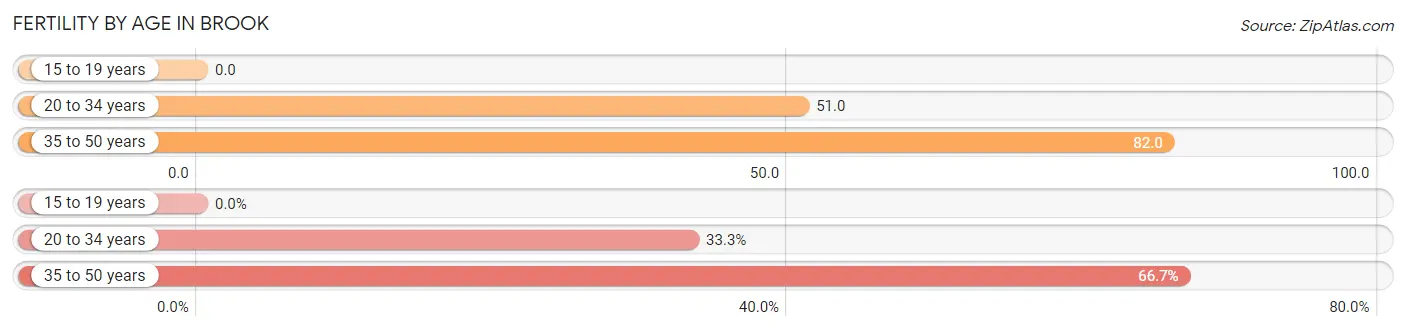
| Age Bracket | Women with Births | Births / 1,000 Women |
| 15 to 19 years | 0 (0.0%) | 0.0 |
| 20 to 34 years | 5 (33.3%) | 51.0 |
| 35 to 50 years | 10 (66.7%) | 82.0 |
| Total | 15 (100.0%) | 66.0 |
Fertility by Age by Marriage Status in Brook
66.7% of women with births (15) in Brook are married. The highest percentage of unmarried women with births falls into 20 to 34 years age bracket with 100.0% of them unmarried at the time of birth, while the lowest percentage of unmarried women with births belong to 35 to 50 years age bracket with 0.0% of them unmarried.
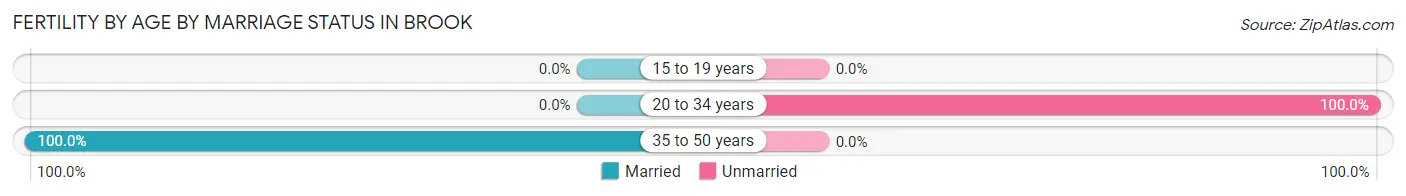
| Age Bracket | Married | Unmarried |
| 15 to 19 years | 0 (0.0%) | 0 (0.0%) |
| 20 to 34 years | 0 (0.0%) | 5 (100.0%) |
| 35 to 50 years | 10 (100.0%) | 0 (0.0%) |
| Total | 10 (66.7%) | 5 (33.3%) |
Fertility by Education in Brook
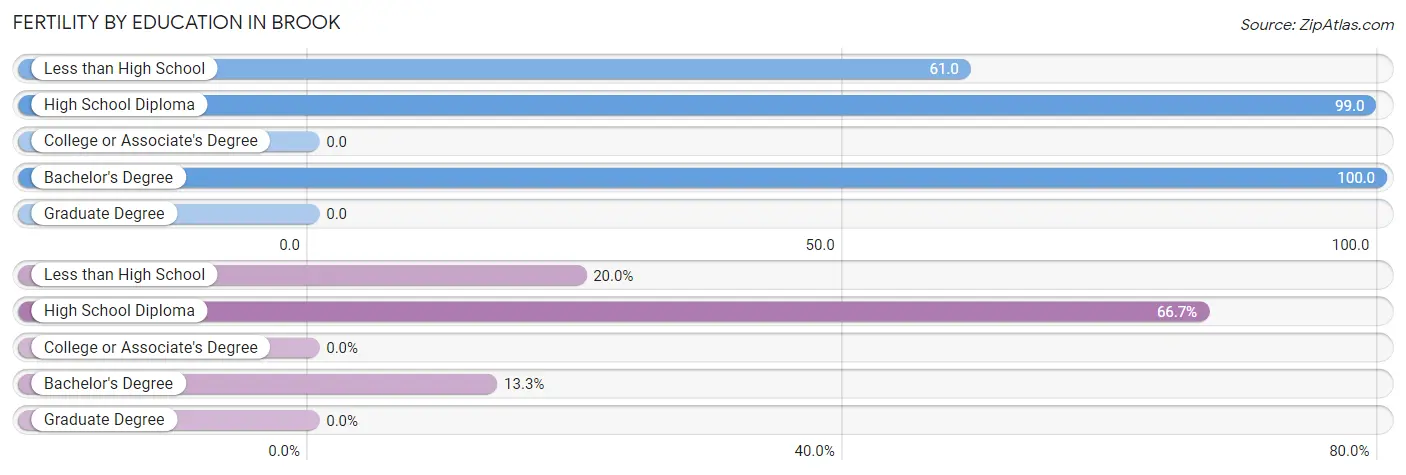
| Educational Attainment | Women with Births | Births / 1,000 Women |
| Less than High School | 3 (20.0%) | 61.0 |
| High School Diploma | 10 (66.7%) | 99.0 |
| College or Associate's Degree | 0 (0.0%) | 0.0 |
| Bachelor's Degree | 2 (13.3%) | 100.0 |
| Graduate Degree | 0 (0.0%) | 0.0 |
| Total | 15 (100.0%) | 66.0 |
Fertility by Education by Marriage Status in Brook
33.3% of women with births in Brook are unmarried. Women with the educational attainment of less than high school are most likely to be married with 100.0% of them married at childbirth, while women with the educational attainment of high school diploma are least likely to be married with 50.0% of them unmarried at childbirth.
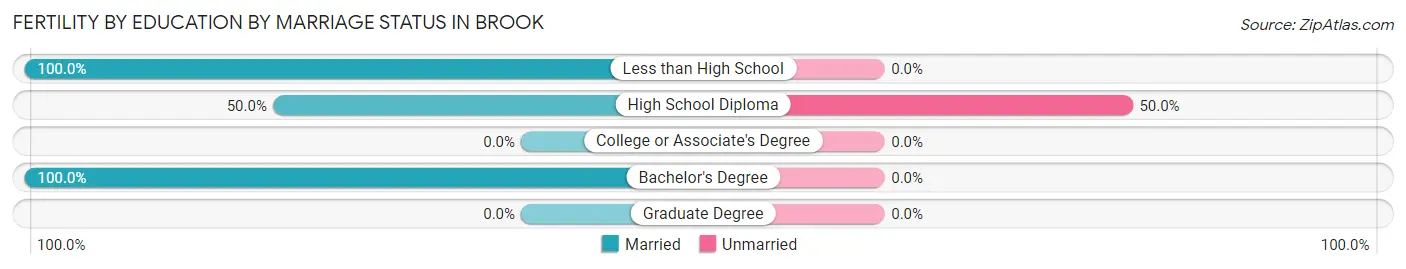
| Educational Attainment | Married | Unmarried |
| Less than High School | 3 (100.0%) | 0 (0.0%) |
| High School Diploma | 5 (50.0%) | 5 (50.0%) |
| College or Associate's Degree | 0 (0.0%) | 0 (0.0%) |
| Bachelor's Degree | 2 (100.0%) | 0 (0.0%) |
| Graduate Degree | 0 (0.0%) | 0 (0.0%) |
| Total | 10 (66.7%) | 5 (33.3%) |
Employment Characteristics in Brook
Employment by Class of Employer in Brook
Among the 412 employed individuals in Brook, private company employees (307 | 74.5%), self-employed (not incorporated) (24 | 5.8%), and local government employees (24 | 5.8%) make up the most common classes of employment.
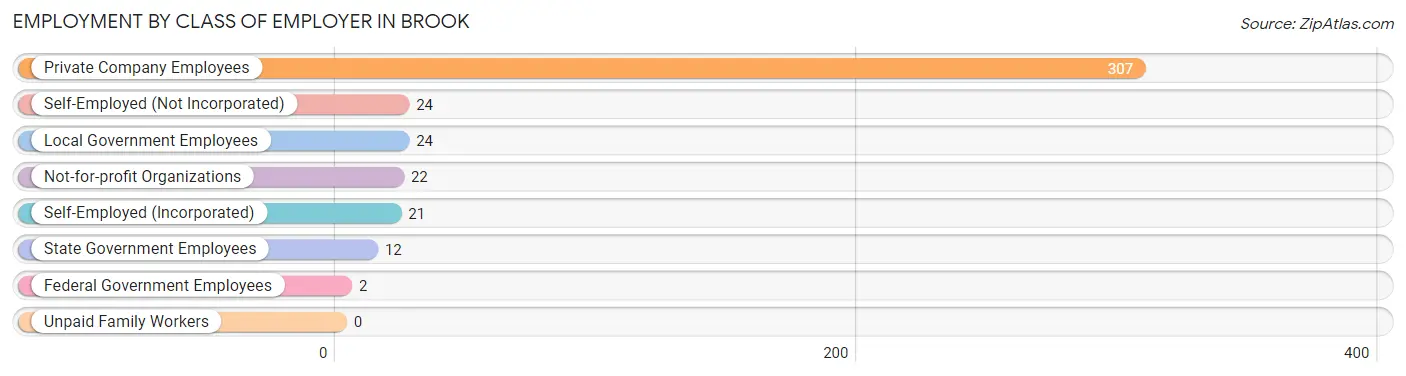
| Employer Class | # Employees | % Employees |
| Private Company Employees | 307 | 74.5% |
| Self-Employed (Incorporated) | 21 | 5.1% |
| Self-Employed (Not Incorporated) | 24 | 5.8% |
| Not-for-profit Organizations | 22 | 5.3% |
| Local Government Employees | 24 | 5.8% |
| State Government Employees | 12 | 2.9% |
| Federal Government Employees | 2 | 0.5% |
| Unpaid Family Workers | 0 | 0.0% |
| Total | 412 | 100.0% |
Employment Status by Age in Brook
According to the labor force statistics for Brook, out of the total population over 16 years of age (772), 64.5% or 498 individuals are in the labor force, with 5.8% or 29 of them unemployed. The age group with the highest labor force participation rate is 60 to 64 years, with 90.2% or 37 individuals in the labor force. Within the labor force, the 30 to 34 years age range has the highest percentage of unemployed individuals, with 17.8% or 13 of them being unemployed.
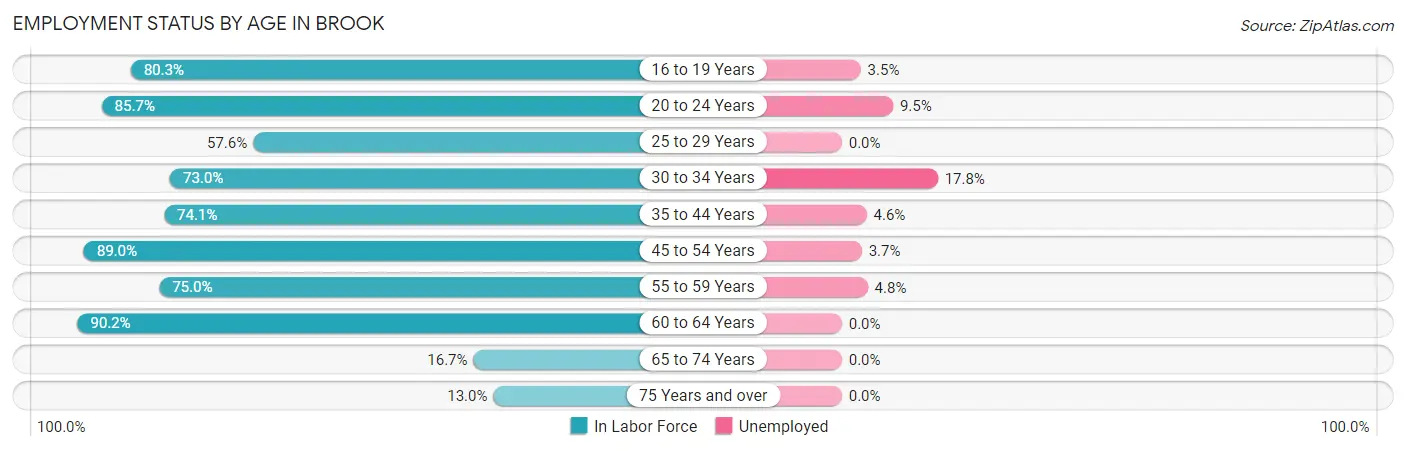
| Age Bracket | In Labor Force | Unemployed |
| 16 to 19 Years | 57 (80.3%) | 2 (3.5%) |
| 20 to 24 Years | 42 (85.7%) | 4 (9.5%) |
| 25 to 29 Years | 34 (57.6%) | 0 (0.0%) |
| 30 to 34 Years | 73 (73.0%) | 13 (17.8%) |
| 35 to 44 Years | 109 (74.1%) | 5 (4.6%) |
| 45 to 54 Years | 81 (89.0%) | 3 (3.7%) |
| 55 to 59 Years | 42 (75.0%) | 2 (4.8%) |
| 60 to 64 Years | 37 (90.2%) | 0 (0.0%) |
| 65 to 74 Years | 11 (16.7%) | 0 (0.0%) |
| 75 Years and over | 12 (13.0%) | 0 (0.0%) |
| Total | 498 (64.5%) | 29 (5.8%) |
Employment Status by Educational Attainment in Brook
According to labor force statistics for Brook, 76.1% of individuals (376) out of the total population between 25 and 64 years of age (494) are in the labor force, with 6.1% or 23 of them being unemployed. The group with the highest labor force participation rate are those with the educational attainment of bachelor's degree or higher, with 100.0% or 51 individuals in the labor force. Within the labor force, individuals with less than high school education have the highest percentage of unemployment, with 17.6% or 9 of them being unemployed.
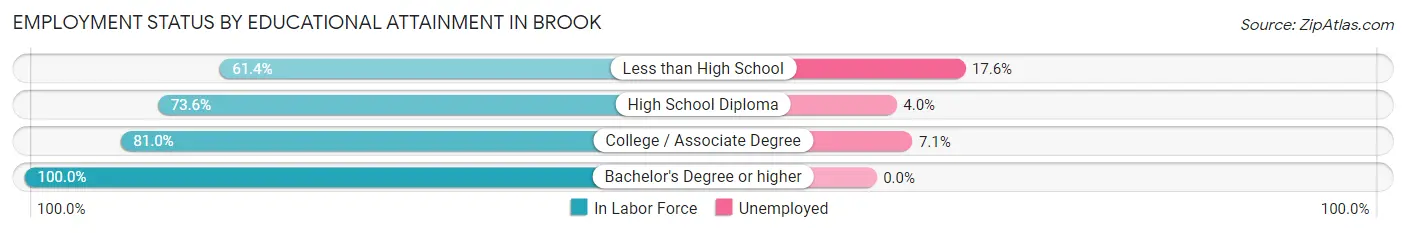
| Educational Attainment | In Labor Force | Unemployed |
| Less than High School | 51 (61.4%) | 15 (17.6%) |
| High School Diploma | 176 (73.6%) | 10 (4.0%) |
| College / Associate Degree | 98 (81.0%) | 9 (7.1%) |
| Bachelor's Degree or higher | 51 (100.0%) | 0 (0.0%) |
| Total | 376 (76.1%) | 30 (6.1%) |
Employment Occupations by Sex in Brook
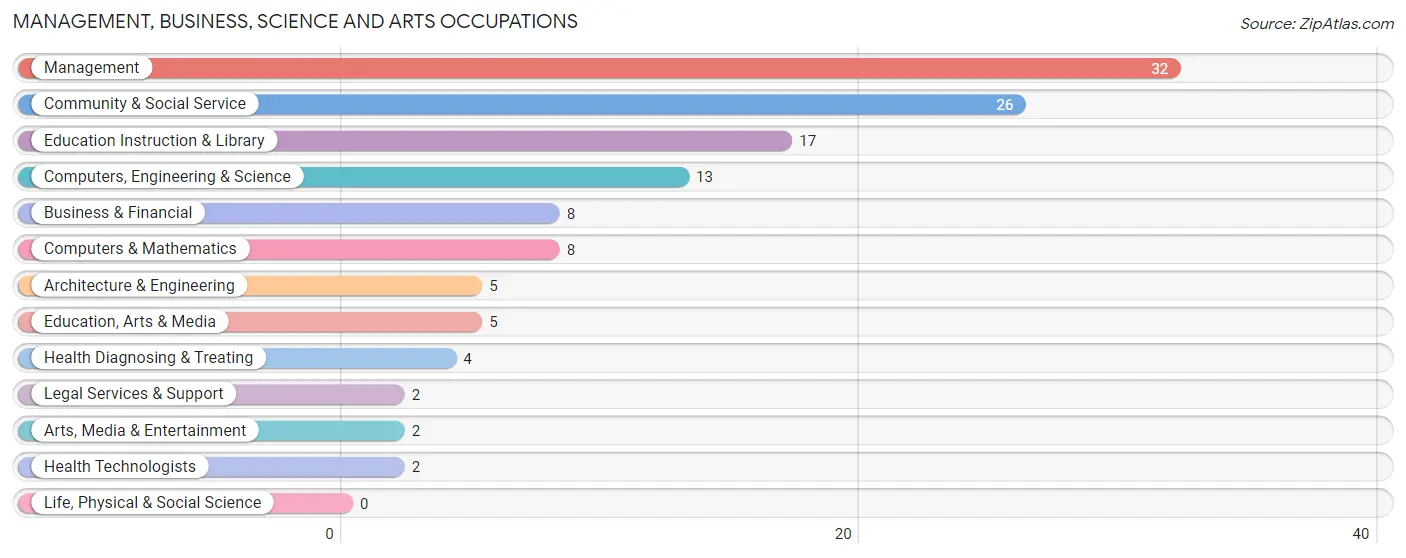
Management, Business, Science and Arts Occupations
The most common Management, Business, Science and Arts occupations in Brook are Management (32 | 6.8%), Community & Social Service (26 | 5.5%), Education Instruction & Library (17 | 3.6%), Computers, Engineering & Science (13 | 2.8%), and Business & Financial (8 | 1.7%).
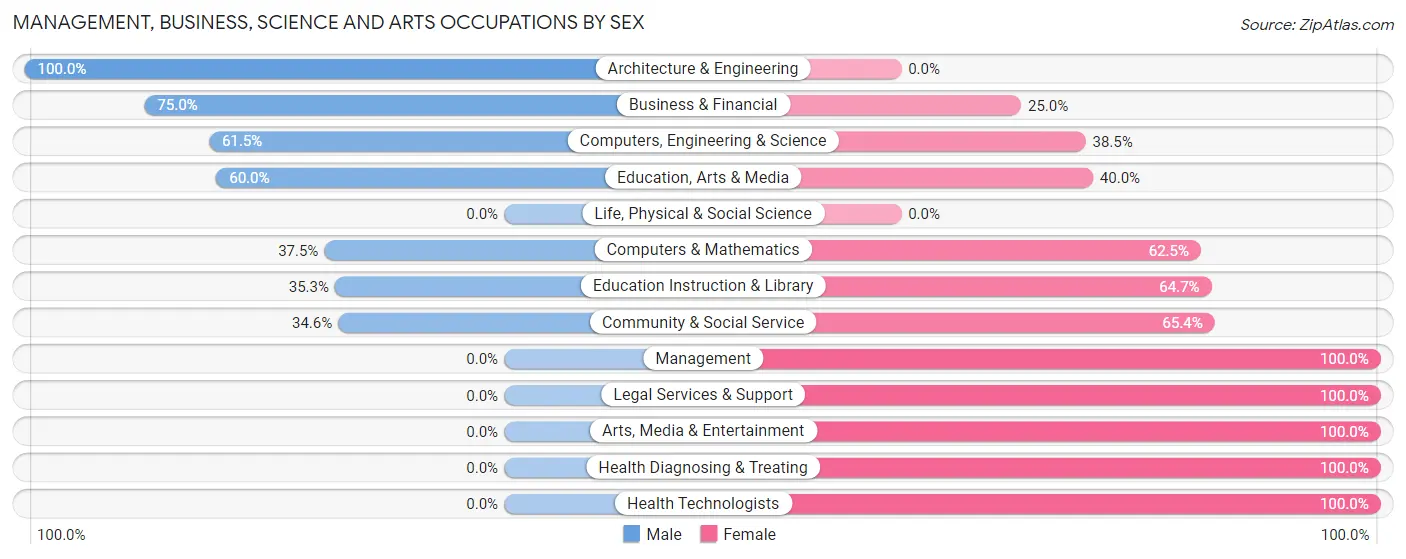
Management, Business, Science and Arts Occupations by Sex
Within the Management, Business, Science and Arts occupations in Brook, the most male-oriented occupations are Architecture & Engineering (100.0%), Business & Financial (75.0%), and Computers, Engineering & Science (61.5%), while the most female-oriented occupations are Management (100.0%), Legal Services & Support (100.0%), and Arts, Media & Entertainment (100.0%).
| Occupation | Male | Female |
| Management | 0 (0.0%) | 32 (100.0%) |
| Business & Financial | 6 (75.0%) | 2 (25.0%) |
| Computers, Engineering & Science | 8 (61.5%) | 5 (38.5%) |
| Computers & Mathematics | 3 (37.5%) | 5 (62.5%) |
| Architecture & Engineering | 5 (100.0%) | 0 (0.0%) |
| Life, Physical & Social Science | 0 (0.0%) | 0 (0.0%) |
| Community & Social Service | 9 (34.6%) | 17 (65.4%) |
| Education, Arts & Media | 3 (60.0%) | 2 (40.0%) |
| Legal Services & Support | 0 (0.0%) | 2 (100.0%) |
| Education Instruction & Library | 6 (35.3%) | 11 (64.7%) |
| Arts, Media & Entertainment | 0 (0.0%) | 2 (100.0%) |
| Health Diagnosing & Treating | 0 (0.0%) | 4 (100.0%) |
| Health Technologists | 0 (0.0%) | 2 (100.0%) |
| Total (Category) | 23 (27.7%) | 60 (72.3%) |
| Total (Overall) | 261 (55.6%) | 208 (44.4%) |
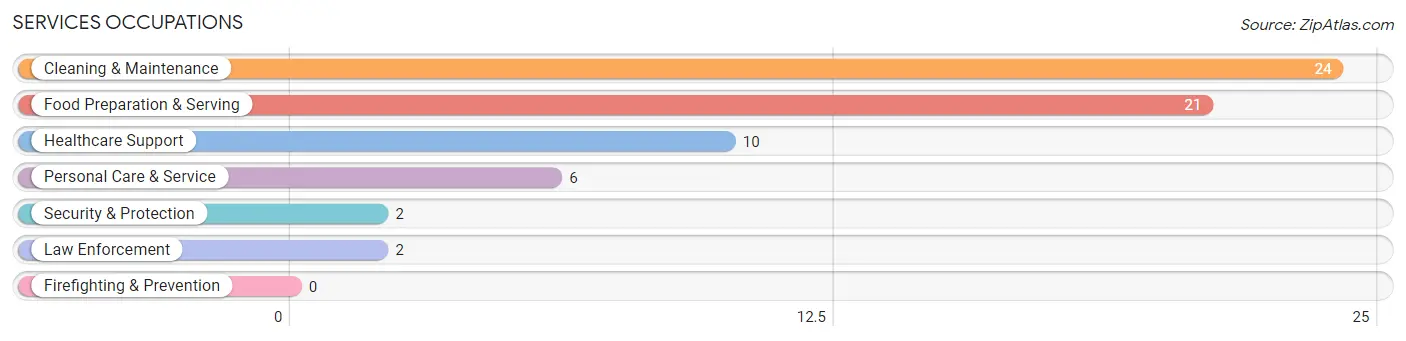
Services Occupations
The most common Services occupations in Brook are Cleaning & Maintenance (24 | 5.1%), Food Preparation & Serving (21 | 4.5%), Healthcare Support (10 | 2.1%), Personal Care & Service (6 | 1.3%), and Security & Protection (2 | 0.4%).
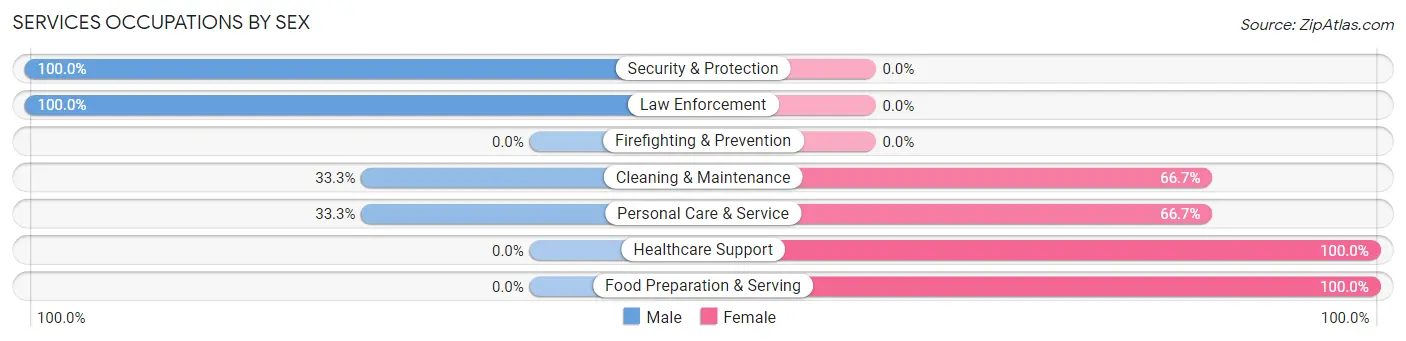
Services Occupations by Sex
Within the Services occupations in Brook, the most male-oriented occupations are Security & Protection (100.0%), Law Enforcement (100.0%), and Cleaning & Maintenance (33.3%), while the most female-oriented occupations are Healthcare Support (100.0%), Food Preparation & Serving (100.0%), and Cleaning & Maintenance (66.7%).
| Occupation | Male | Female |
| Healthcare Support | 0 (0.0%) | 10 (100.0%) |
| Security & Protection | 2 (100.0%) | 0 (0.0%) |
| Firefighting & Prevention | 0 (0.0%) | 0 (0.0%) |
| Law Enforcement | 2 (100.0%) | 0 (0.0%) |
| Food Preparation & Serving | 0 (0.0%) | 21 (100.0%) |
| Cleaning & Maintenance | 8 (33.3%) | 16 (66.7%) |
| Personal Care & Service | 2 (33.3%) | 4 (66.7%) |
| Total (Category) | 12 (19.1%) | 51 (80.9%) |
| Total (Overall) | 261 (55.6%) | 208 (44.4%) |
Sales and Office Occupations
The most common Sales and Office occupations in Brook are Office & Administration (35 | 7.5%), and Sales & Related (12 | 2.6%).
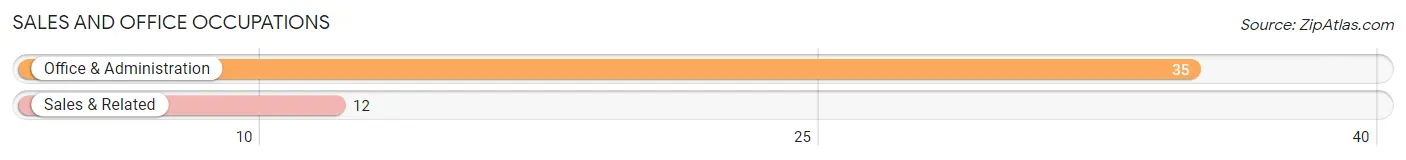
Sales and Office Occupations by Sex
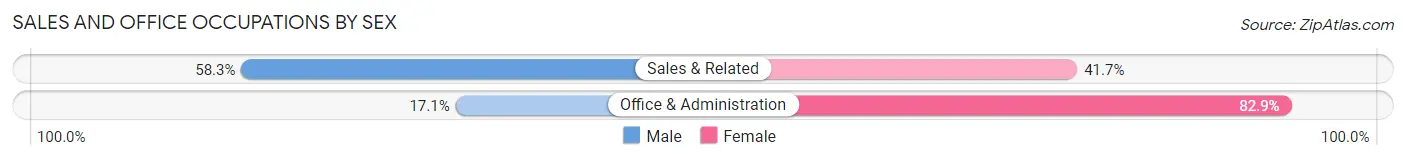
| Occupation | Male | Female |
| Sales & Related | 7 (58.3%) | 5 (41.7%) |
| Office & Administration | 6 (17.1%) | 29 (82.9%) |
| Total (Category) | 13 (27.7%) | 34 (72.3%) |
| Total (Overall) | 261 (55.6%) | 208 (44.4%) |
Natural Resources, Construction and Maintenance Occupations
The most common Natural Resources, Construction and Maintenance occupations in Brook are Construction & Extraction (49 | 10.4%), Installation, Maintenance & Repair (25 | 5.3%), and Farming, Fishing & Forestry (7 | 1.5%).
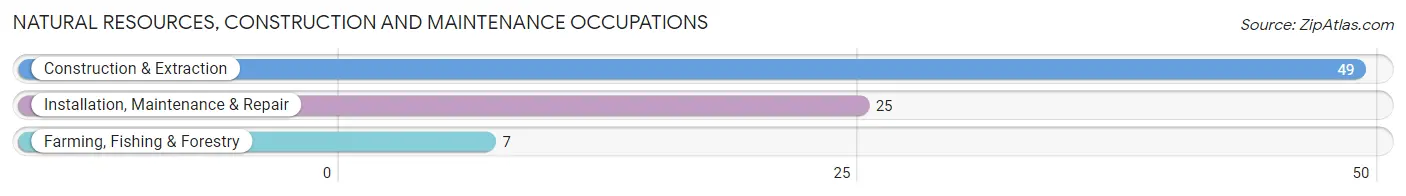
Natural Resources, Construction and Maintenance Occupations by Sex
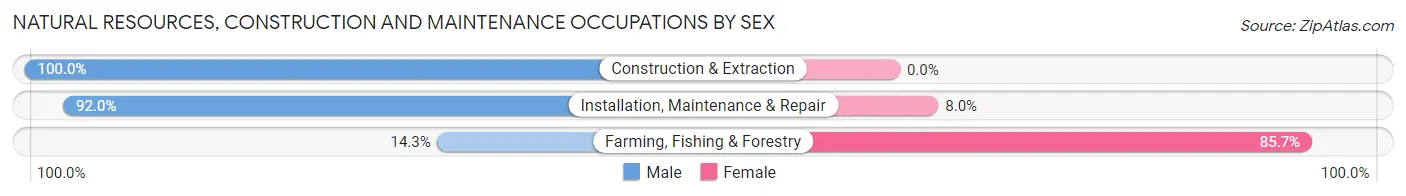
| Occupation | Male | Female |
| Farming, Fishing & Forestry | 1 (14.3%) | 6 (85.7%) |
| Construction & Extraction | 49 (100.0%) | 0 (0.0%) |
| Installation, Maintenance & Repair | 23 (92.0%) | 2 (8.0%) |
| Total (Category) | 73 (90.1%) | 8 (9.9%) |
| Total (Overall) | 261 (55.6%) | 208 (44.4%) |
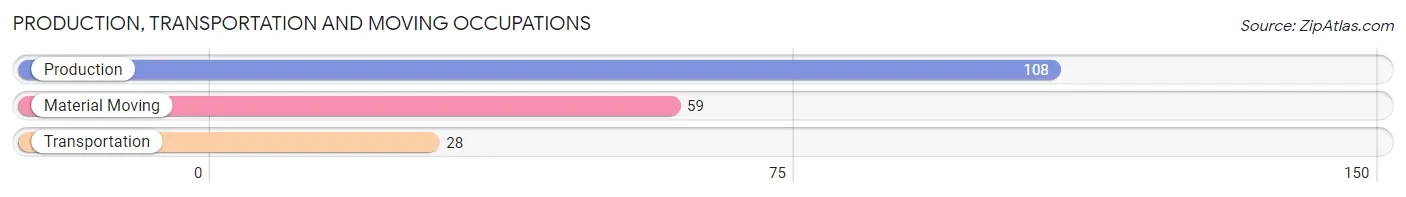
Production, Transportation and Moving Occupations
The most common Production, Transportation and Moving occupations in Brook are Production (108 | 23.0%), Material Moving (59 | 12.6%), and Transportation (28 | 6.0%).
Production, Transportation and Moving Occupations by Sex
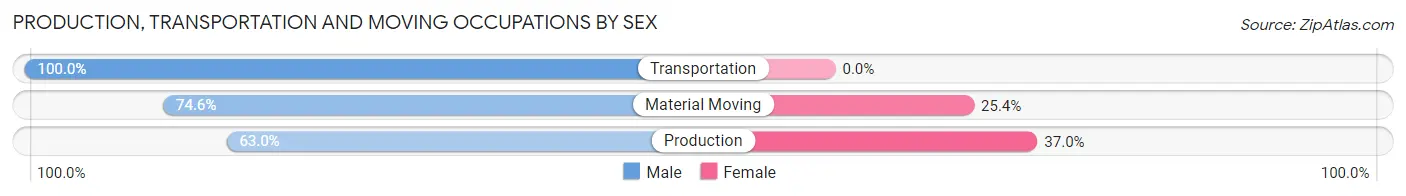
| Occupation | Male | Female |
| Production | 68 (63.0%) | 40 (37.0%) |
| Transportation | 28 (100.0%) | 0 (0.0%) |
| Material Moving | 44 (74.6%) | 15 (25.4%) |
| Total (Category) | 140 (71.8%) | 55 (28.2%) |
| Total (Overall) | 261 (55.6%) | 208 (44.4%) |
Employment Industries by Sex in Brook
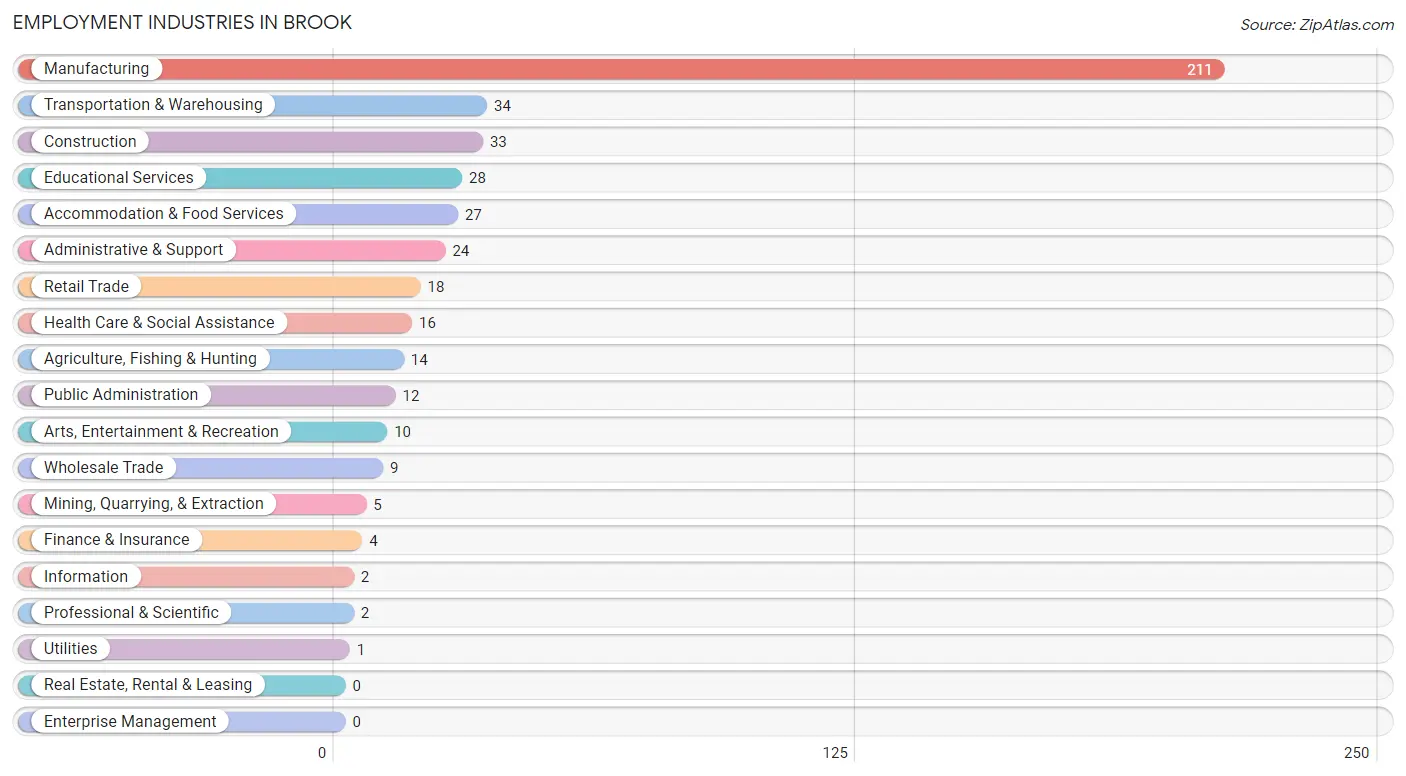
Employment Industries in Brook
The major employment industries in Brook include Manufacturing (211 | 45.0%), Transportation & Warehousing (34 | 7.2%), Construction (33 | 7.0%), Educational Services (28 | 6.0%), and Accommodation & Food Services (27 | 5.8%).
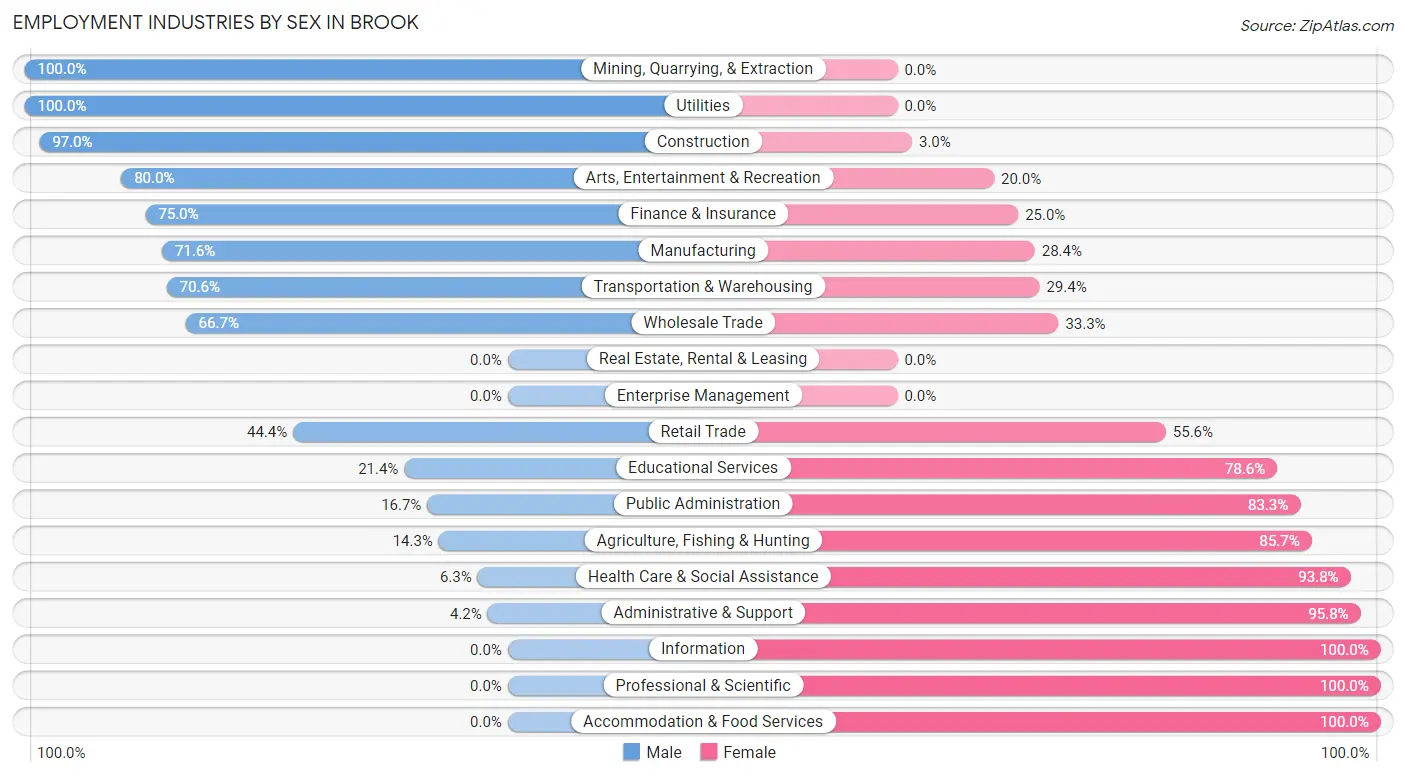
Employment Industries by Sex in Brook
The Brook industries that see more men than women are Mining, Quarrying, & Extraction (100.0%), Utilities (100.0%), and Construction (97.0%), whereas the industries that tend to have a higher number of women are Information (100.0%), Professional & Scientific (100.0%), and Accommodation & Food Services (100.0%).
| Industry | Male | Female |
| Agriculture, Fishing & Hunting | 2 (14.3%) | 12 (85.7%) |
| Mining, Quarrying, & Extraction | 5 (100.0%) | 0 (0.0%) |
| Construction | 32 (97.0%) | 1 (3.0%) |
| Manufacturing | 151 (71.6%) | 60 (28.4%) |
| Wholesale Trade | 6 (66.7%) | 3 (33.3%) |
| Retail Trade | 8 (44.4%) | 10 (55.6%) |
| Transportation & Warehousing | 24 (70.6%) | 10 (29.4%) |
| Utilities | 1 (100.0%) | 0 (0.0%) |
| Information | 0 (0.0%) | 2 (100.0%) |
| Finance & Insurance | 3 (75.0%) | 1 (25.0%) |
| Real Estate, Rental & Leasing | 0 (0.0%) | 0 (0.0%) |
| Professional & Scientific | 0 (0.0%) | 2 (100.0%) |
| Enterprise Management | 0 (0.0%) | 0 (0.0%) |
| Administrative & Support | 1 (4.2%) | 23 (95.8%) |
| Educational Services | 6 (21.4%) | 22 (78.6%) |
| Health Care & Social Assistance | 1 (6.2%) | 15 (93.8%) |
| Arts, Entertainment & Recreation | 8 (80.0%) | 2 (20.0%) |
| Accommodation & Food Services | 0 (0.0%) | 27 (100.0%) |
| Public Administration | 2 (16.7%) | 10 (83.3%) |
| Total | 261 (55.6%) | 208 (44.4%) |
Education in Brook
School Enrollment in Brook
The most common levels of schooling among the 196 students in Brook are high school (68 | 34.7%), elementary school (40 | 20.4%), and nursery / preschool (33 | 16.8%).
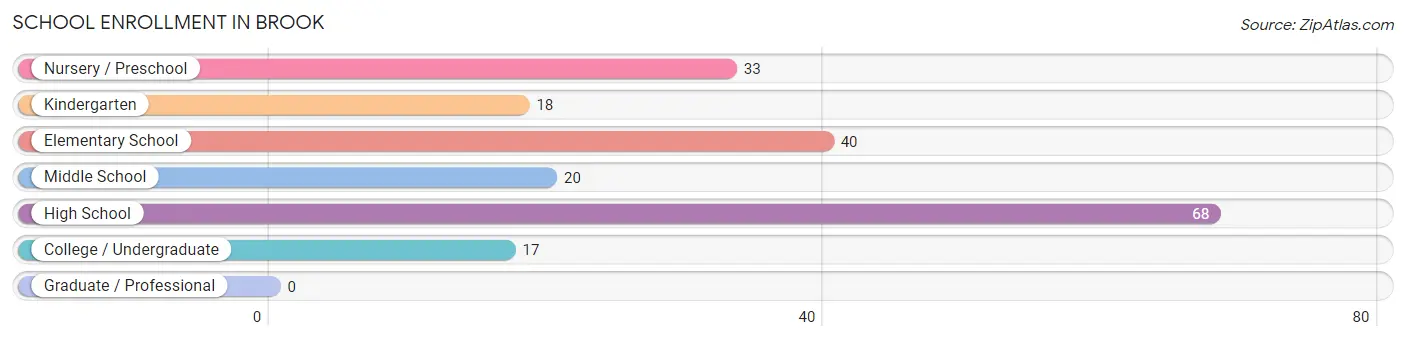
| School Level | # Students | % Students |
| Nursery / Preschool | 33 | 16.8% |
| Kindergarten | 18 | 9.2% |
| Elementary School | 40 | 20.4% |
| Middle School | 20 | 10.2% |
| High School | 68 | 34.7% |
| College / Undergraduate | 17 | 8.7% |
| Graduate / Professional | 0 | 0.0% |
| Total | 196 | 100.0% |
School Enrollment by Age by Funding Source in Brook
Out of a total of 196 students who are enrolled in schools in Brook, 5 (2.6%) attend a private institution, while the remaining 191 (97.4%) are enrolled in public schools. The age group of 10 to 14 year olds has the highest likelihood of being enrolled in private schools, with 4 (10.3% in the age bracket) enrolled. Conversely, the age group of 5 to 9 year old has the lowest likelihood of being enrolled in a private school, with 63 (100.0% in the age bracket) attending a public institution.
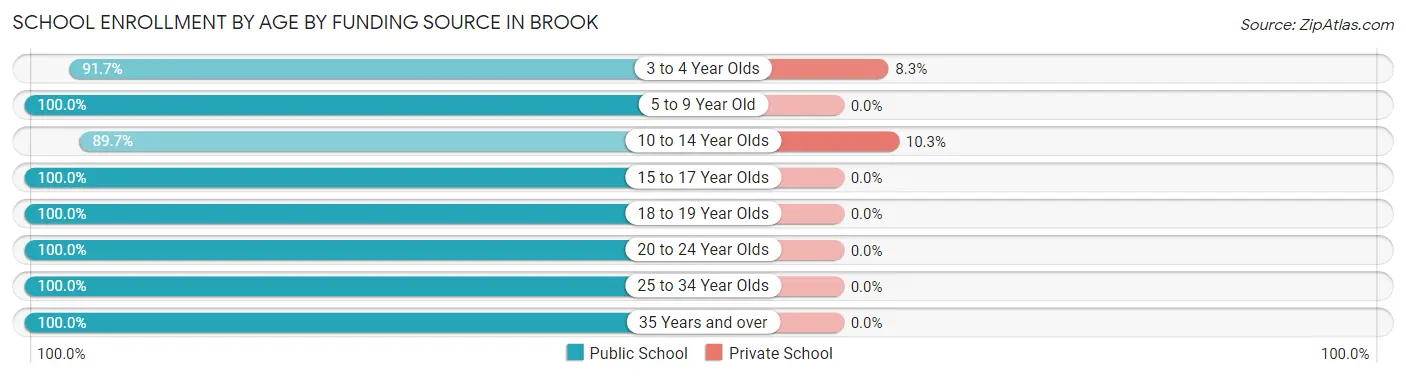
| Age Bracket | Public School | Private School |
| 3 to 4 Year Olds | 11 (91.7%) | 1 (8.3%) |
| 5 to 9 Year Old | 63 (100.0%) | 0 (0.0%) |
| 10 to 14 Year Olds | 35 (89.7%) | 4 (10.3%) |
| 15 to 17 Year Olds | 22 (100.0%) | 0 (0.0%) |
| 18 to 19 Year Olds | 43 (100.0%) | 0 (0.0%) |
| 20 to 24 Year Olds | 8 (100.0%) | 0 (0.0%) |
| 25 to 34 Year Olds | 2 (100.0%) | 0 (0.0%) |
| 35 Years and over | 7 (100.0%) | 0 (0.0%) |
| Total | 191 (97.4%) | 5 (2.6%) |
Educational Attainment by Field of Study in Brook
Education (21 | 29.2%), engineering (11 | 15.3%), science & technology (9 | 12.5%), business (7 | 9.7%), and computers & mathematics (6 | 8.3%) are the most common fields of study among 72 individuals in Brook who have obtained a bachelor's degree or higher.
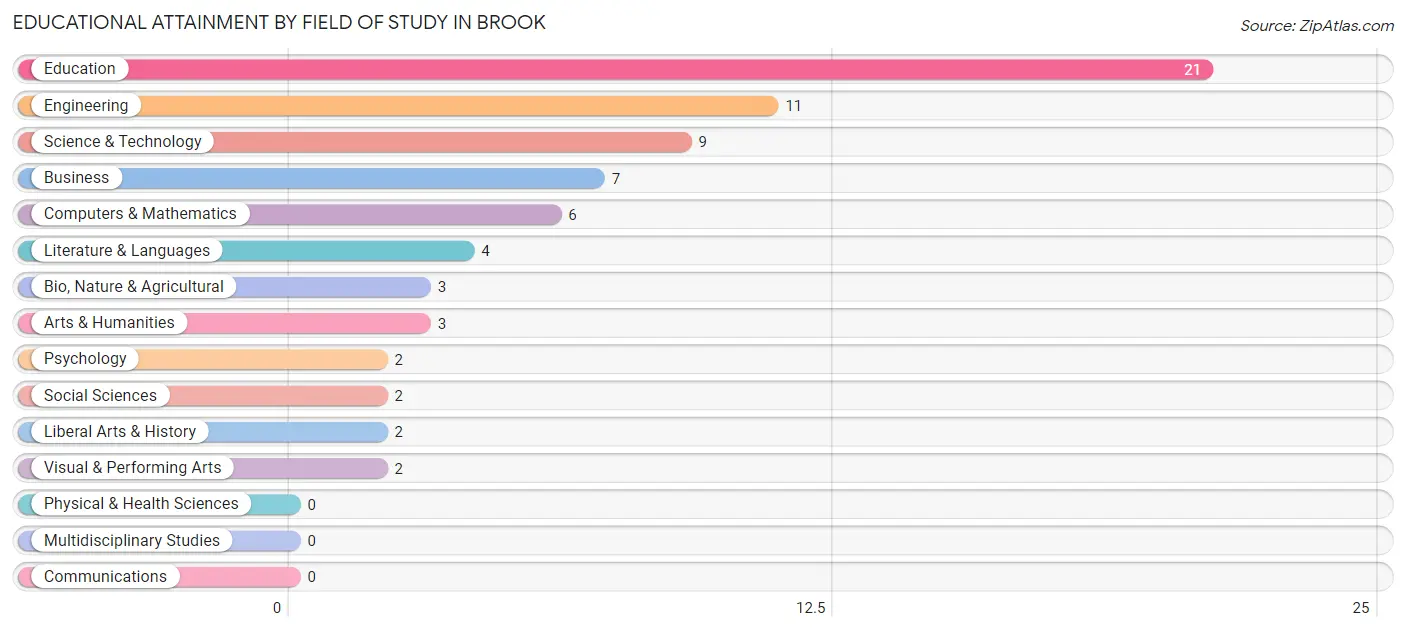
| Field of Study | # Graduates | % Graduates |
| Computers & Mathematics | 6 | 8.3% |
| Bio, Nature & Agricultural | 3 | 4.2% |
| Physical & Health Sciences | 0 | 0.0% |
| Psychology | 2 | 2.8% |
| Social Sciences | 2 | 2.8% |
| Engineering | 11 | 15.3% |
| Multidisciplinary Studies | 0 | 0.0% |
| Science & Technology | 9 | 12.5% |
| Business | 7 | 9.7% |
| Education | 21 | 29.2% |
| Literature & Languages | 4 | 5.6% |
| Liberal Arts & History | 2 | 2.8% |
| Visual & Performing Arts | 2 | 2.8% |
| Communications | 0 | 0.0% |
| Arts & Humanities | 3 | 4.2% |
| Total | 72 | 100.0% |
Transportation & Commute in Brook
Vehicle Availability by Sex in Brook
The most prevalent vehicle ownership categories in Brook are males with 2 vehicles (93, accounting for 42.3%) and females with 2 vehicles (66, making up 48.4%).
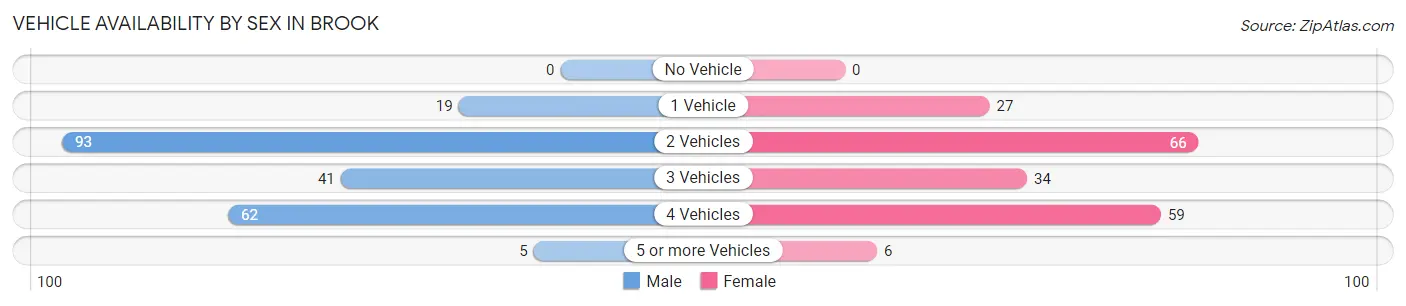
| Vehicles Available | Male | Female |
| No Vehicle | 0 (0.0%) | 0 (0.0%) |
| 1 Vehicle | 19 (8.6%) | 27 (14.1%) |
| 2 Vehicles | 93 (42.3%) | 66 (34.4%) |
| 3 Vehicles | 41 (18.6%) | 34 (17.7%) |
| 4 Vehicles | 62 (28.2%) | 59 (30.7%) |
| 5 or more Vehicles | 5 (2.3%) | 6 (3.1%) |
| Total | 220 (100.0%) | 192 (100.0%) |
Commute Time in Brook
The most frequently occuring commute durations in Brook are 15 to 19 minutes (84 commuters, 20.8%), less than 5 minutes (74 commuters, 18.3%), and 20 to 24 minutes (54 commuters, 13.4%).
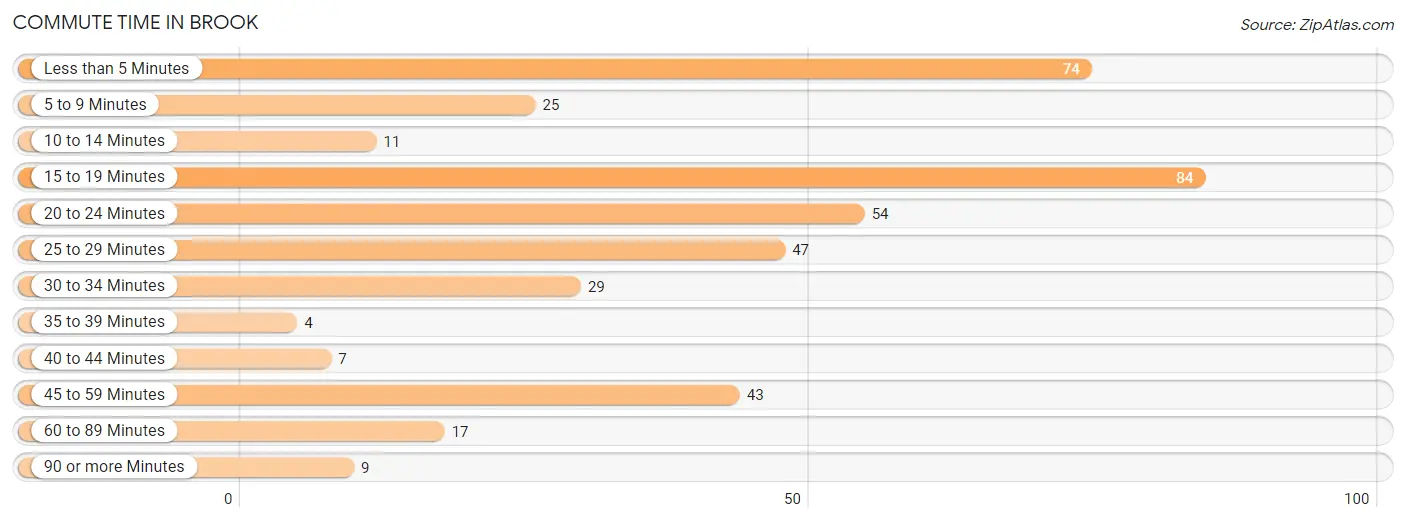
| Commute Time | # Commuters | % Commuters |
| Less than 5 Minutes | 74 | 18.3% |
| 5 to 9 Minutes | 25 | 6.2% |
| 10 to 14 Minutes | 11 | 2.7% |
| 15 to 19 Minutes | 84 | 20.8% |
| 20 to 24 Minutes | 54 | 13.4% |
| 25 to 29 Minutes | 47 | 11.6% |
| 30 to 34 Minutes | 29 | 7.2% |
| 35 to 39 Minutes | 4 | 1.0% |
| 40 to 44 Minutes | 7 | 1.7% |
| 45 to 59 Minutes | 43 | 10.6% |
| 60 to 89 Minutes | 17 | 4.2% |
| 90 or more Minutes | 9 | 2.2% |
Commute Time by Sex in Brook
The most common commute times in Brook are less than 5 minutes (49 commuters, 22.9%) for males and 15 to 19 minutes (49 commuters, 25.8%) for females.
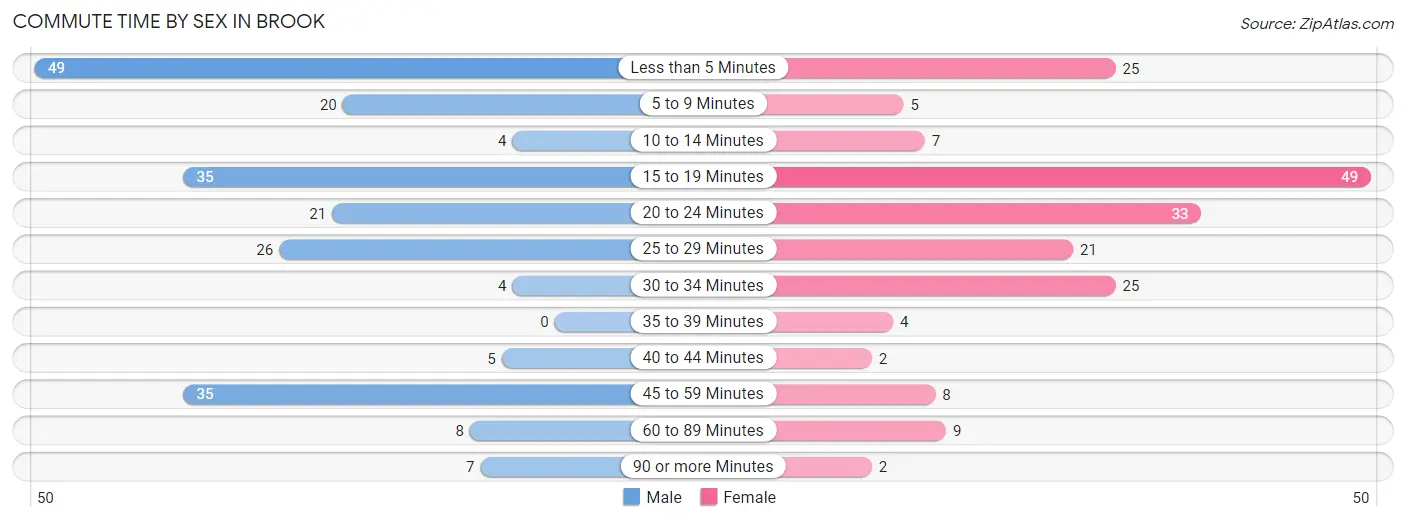
| Commute Time | Male | Female |
| Less than 5 Minutes | 49 (22.9%) | 25 (13.2%) |
| 5 to 9 Minutes | 20 (9.3%) | 5 (2.6%) |
| 10 to 14 Minutes | 4 (1.9%) | 7 (3.7%) |
| 15 to 19 Minutes | 35 (16.4%) | 49 (25.8%) |
| 20 to 24 Minutes | 21 (9.8%) | 33 (17.4%) |
| 25 to 29 Minutes | 26 (12.1%) | 21 (11.1%) |
| 30 to 34 Minutes | 4 (1.9%) | 25 (13.2%) |
| 35 to 39 Minutes | 0 (0.0%) | 4 (2.1%) |
| 40 to 44 Minutes | 5 (2.3%) | 2 (1.1%) |
| 45 to 59 Minutes | 35 (16.4%) | 8 (4.2%) |
| 60 to 89 Minutes | 8 (3.7%) | 9 (4.7%) |
| 90 or more Minutes | 7 (3.3%) | 2 (1.1%) |
Time of Departure to Work by Sex in Brook
The most frequent times of departure to work in Brook are 12:00 PM to 3:59 PM (45, 21.0%) for males and 12:00 PM to 3:59 PM (48, 25.3%) for females.
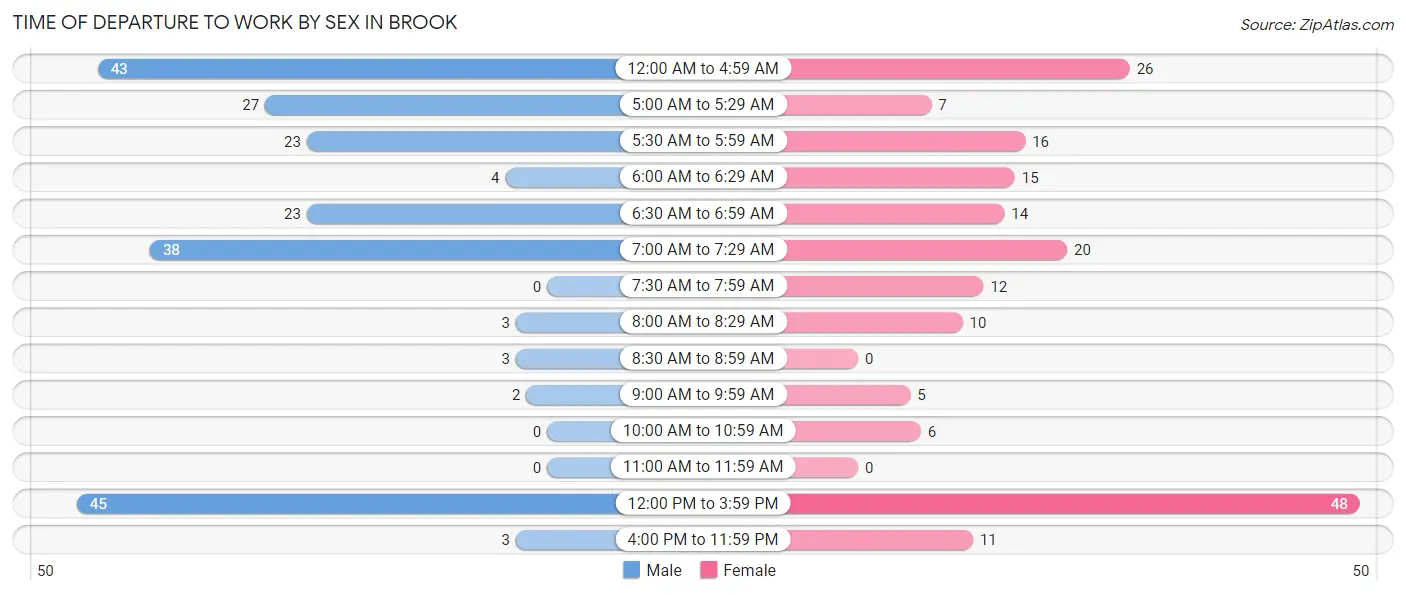
| Time of Departure | Male | Female |
| 12:00 AM to 4:59 AM | 43 (20.1%) | 26 (13.7%) |
| 5:00 AM to 5:29 AM | 27 (12.6%) | 7 (3.7%) |
| 5:30 AM to 5:59 AM | 23 (10.7%) | 16 (8.4%) |
| 6:00 AM to 6:29 AM | 4 (1.9%) | 15 (7.9%) |
| 6:30 AM to 6:59 AM | 23 (10.7%) | 14 (7.4%) |
| 7:00 AM to 7:29 AM | 38 (17.8%) | 20 (10.5%) |
| 7:30 AM to 7:59 AM | 0 (0.0%) | 12 (6.3%) |
| 8:00 AM to 8:29 AM | 3 (1.4%) | 10 (5.3%) |
| 8:30 AM to 8:59 AM | 3 (1.4%) | 0 (0.0%) |
| 9:00 AM to 9:59 AM | 2 (0.9%) | 5 (2.6%) |
| 10:00 AM to 10:59 AM | 0 (0.0%) | 6 (3.2%) |
| 11:00 AM to 11:59 AM | 0 (0.0%) | 0 (0.0%) |
| 12:00 PM to 3:59 PM | 45 (21.0%) | 48 (25.3%) |
| 4:00 PM to 11:59 PM | 3 (1.4%) | 11 (5.8%) |
| Total | 214 (100.0%) | 190 (100.0%) |
Housing Occupancy in Brook
Occupancy by Ownership in Brook
Of the total 344 dwellings in Brook, owner-occupied units account for 271 (78.8%), while renter-occupied units make up 73 (21.2%).
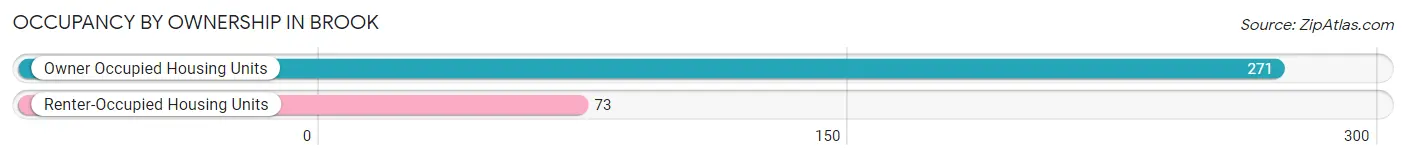
| Occupancy | # Housing Units | % Housing Units |
| Owner Occupied Housing Units | 271 | 78.8% |
| Renter-Occupied Housing Units | 73 | 21.2% |
| Total Occupied Housing Units | 344 | 100.0% |
Occupancy by Household Size in Brook
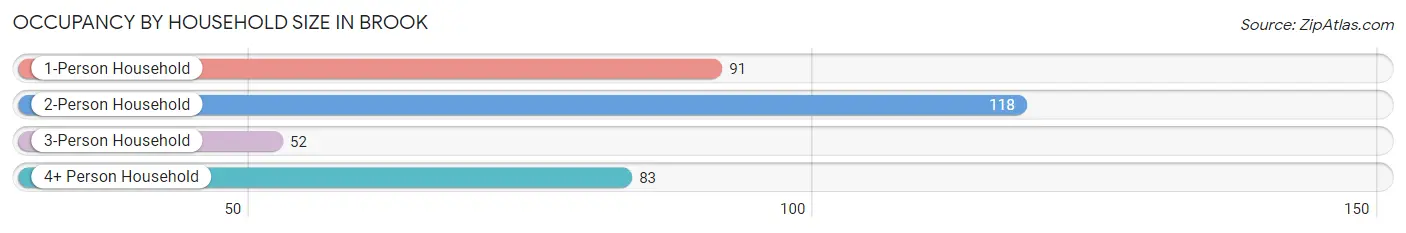
| Household Size | # Housing Units | % Housing Units |
| 1-Person Household | 91 | 26.5% |
| 2-Person Household | 118 | 34.3% |
| 3-Person Household | 52 | 15.1% |
| 4+ Person Household | 83 | 24.1% |
| Total Housing Units | 344 | 100.0% |
Occupancy by Ownership by Household Size in Brook
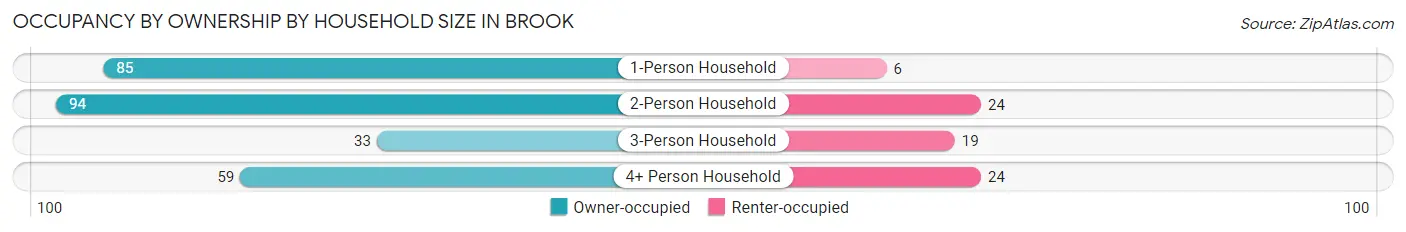
| Household Size | Owner-occupied | Renter-occupied |
| 1-Person Household | 85 (93.4%) | 6 (6.6%) |
| 2-Person Household | 94 (79.7%) | 24 (20.3%) |
| 3-Person Household | 33 (63.5%) | 19 (36.5%) |
| 4+ Person Household | 59 (71.1%) | 24 (28.9%) |
| Total Housing Units | 271 (78.8%) | 73 (21.2%) |
Occupancy by Educational Attainment in Brook
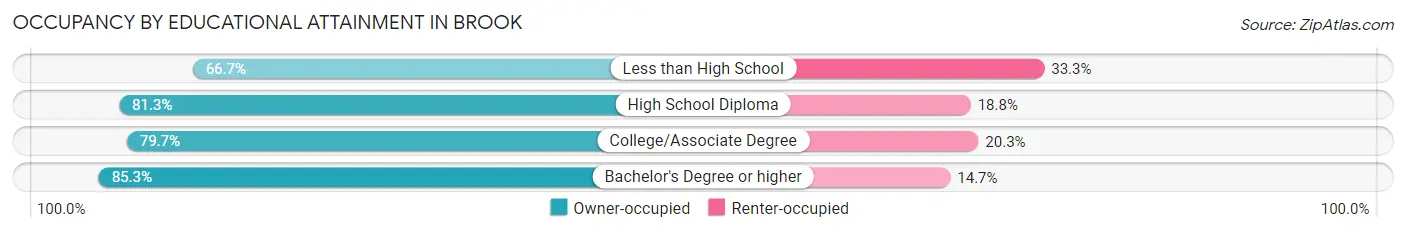
| Household Size | Owner-occupied | Renter-occupied |
| Less than High School | 40 (66.7%) | 20 (33.3%) |
| High School Diploma | 143 (81.2%) | 33 (18.8%) |
| College/Associate Degree | 59 (79.7%) | 15 (20.3%) |
| Bachelor's Degree or higher | 29 (85.3%) | 5 (14.7%) |
Occupancy by Age of Householder in Brook
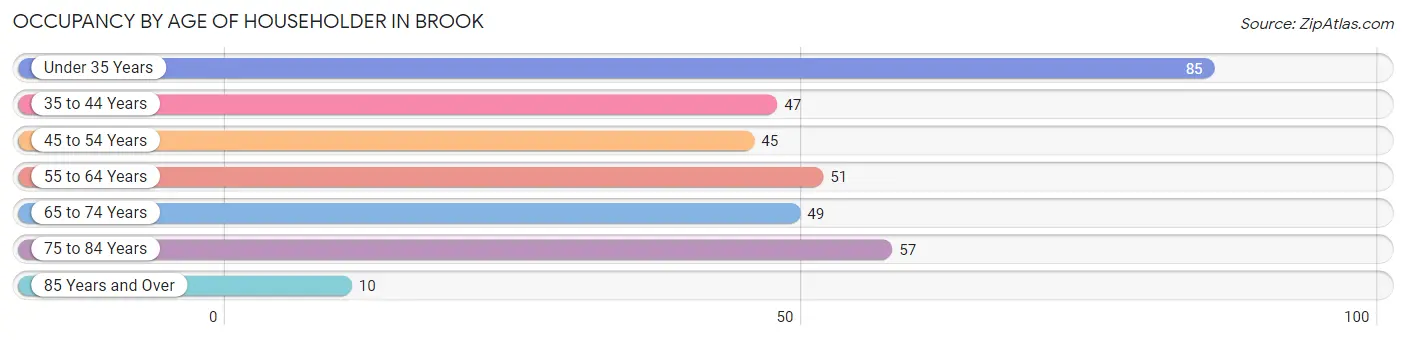
| Age Bracket | # Households | % Households |
| Under 35 Years | 85 | 24.7% |
| 35 to 44 Years | 47 | 13.7% |
| 45 to 54 Years | 45 | 13.1% |
| 55 to 64 Years | 51 | 14.8% |
| 65 to 74 Years | 49 | 14.2% |
| 75 to 84 Years | 57 | 16.6% |
| 85 Years and Over | 10 | 2.9% |
| Total | 344 | 100.0% |
Housing Finances in Brook
Median Income by Occupancy in Brook
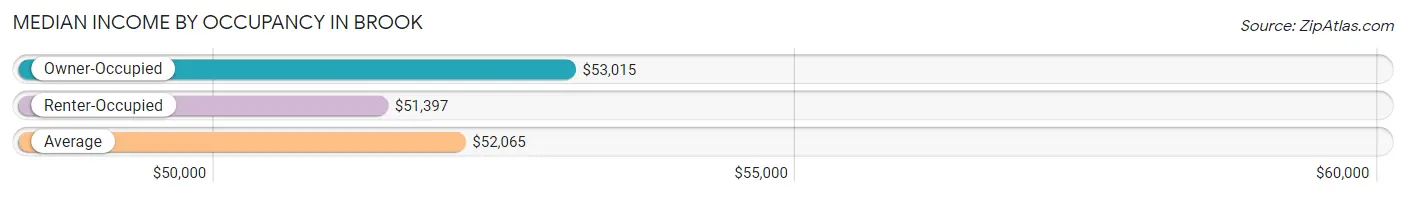
| Occupancy Type | # Households | Median Income |
| Owner-Occupied | 271 (78.8%) | $53,015 |
| Renter-Occupied | 73 (21.2%) | $51,397 |
| Average | 344 (100.0%) | $52,065 |
Occupancy by Householder Income Bracket in Brook
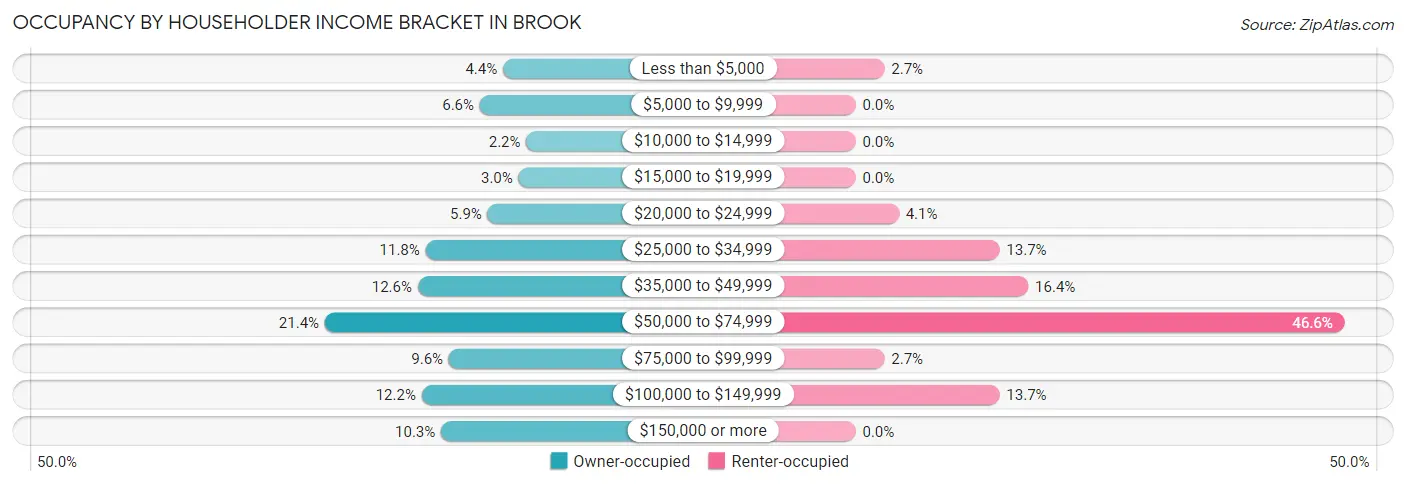
| Income Bracket | Owner-occupied | Renter-occupied |
| Less than $5,000 | 12 (4.4%) | 2 (2.7%) |
| $5,000 to $9,999 | 18 (6.6%) | 0 (0.0%) |
| $10,000 to $14,999 | 6 (2.2%) | 0 (0.0%) |
| $15,000 to $19,999 | 8 (2.9%) | 0 (0.0%) |
| $20,000 to $24,999 | 16 (5.9%) | 3 (4.1%) |
| $25,000 to $34,999 | 32 (11.8%) | 10 (13.7%) |
| $35,000 to $49,999 | 34 (12.6%) | 12 (16.4%) |
| $50,000 to $74,999 | 58 (21.4%) | 34 (46.6%) |
| $75,000 to $99,999 | 26 (9.6%) | 2 (2.7%) |
| $100,000 to $149,999 | 33 (12.2%) | 10 (13.7%) |
| $150,000 or more | 28 (10.3%) | 0 (0.0%) |
| Total | 271 (100.0%) | 73 (100.0%) |
Monthly Housing Cost Tiers in Brook
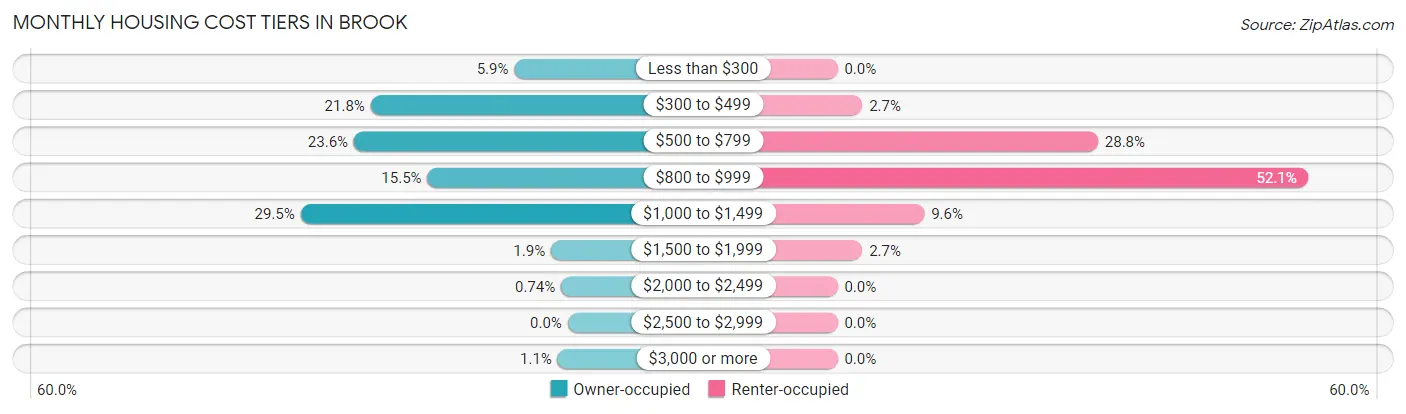
| Monthly Cost | Owner-occupied | Renter-occupied |
| Less than $300 | 16 (5.9%) | 0 (0.0%) |
| $300 to $499 | 59 (21.8%) | 2 (2.7%) |
| $500 to $799 | 64 (23.6%) | 21 (28.8%) |
| $800 to $999 | 42 (15.5%) | 38 (52.0%) |
| $1,000 to $1,499 | 80 (29.5%) | 7 (9.6%) |
| $1,500 to $1,999 | 5 (1.8%) | 2 (2.7%) |
| $2,000 to $2,499 | 2 (0.7%) | 0 (0.0%) |
| $2,500 to $2,999 | 0 (0.0%) | 0 (0.0%) |
| $3,000 or more | 3 (1.1%) | 0 (0.0%) |
| Total | 271 (100.0%) | 73 (100.0%) |
Physical Housing Characteristics in Brook
Housing Structures in Brook
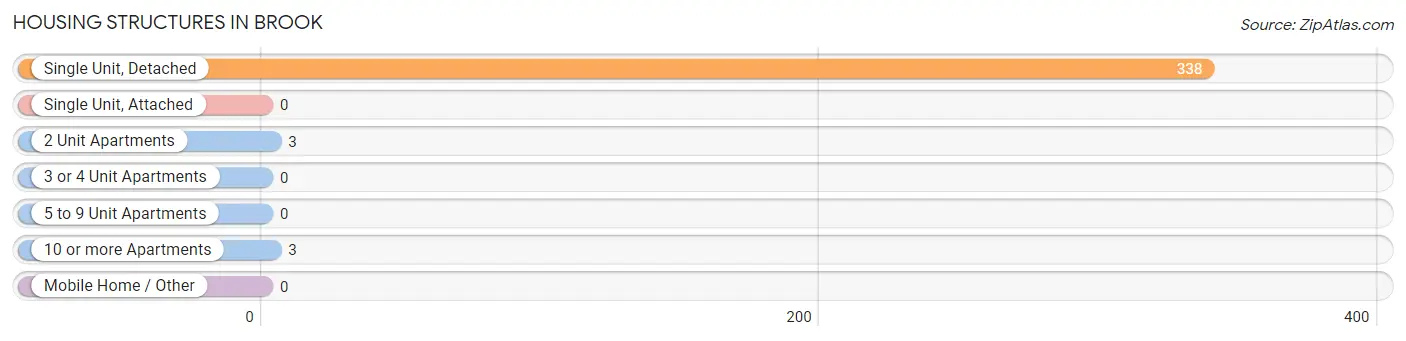
| Structure Type | # Housing Units | % Housing Units |
| Single Unit, Detached | 338 | 98.3% |
| Single Unit, Attached | 0 | 0.0% |
| 2 Unit Apartments | 3 | 0.9% |
| 3 or 4 Unit Apartments | 0 | 0.0% |
| 5 to 9 Unit Apartments | 0 | 0.0% |
| 10 or more Apartments | 3 | 0.9% |
| Mobile Home / Other | 0 | 0.0% |
| Total | 344 | 100.0% |
Housing Structures by Occupancy in Brook
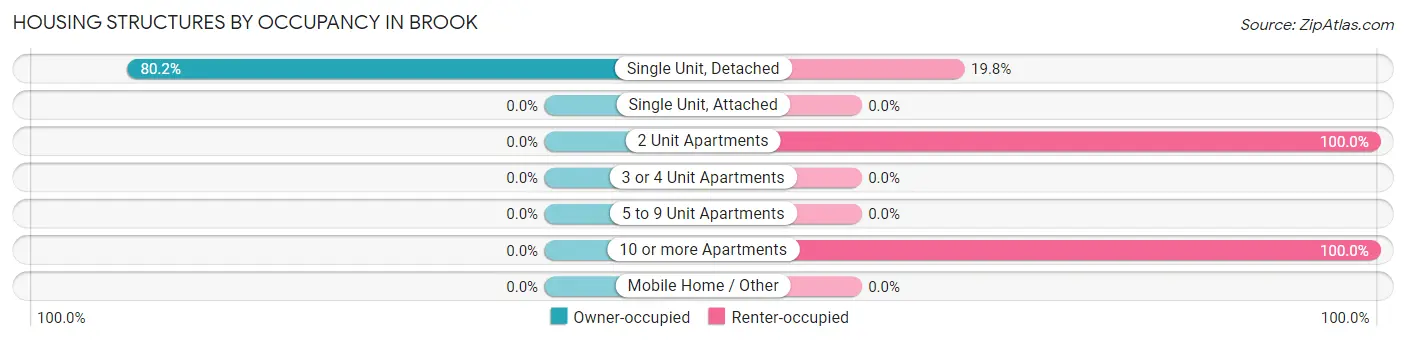
| Structure Type | Owner-occupied | Renter-occupied |
| Single Unit, Detached | 271 (80.2%) | 67 (19.8%) |
| Single Unit, Attached | 0 (0.0%) | 0 (0.0%) |
| 2 Unit Apartments | 0 (0.0%) | 3 (100.0%) |
| 3 or 4 Unit Apartments | 0 (0.0%) | 0 (0.0%) |
| 5 to 9 Unit Apartments | 0 (0.0%) | 0 (0.0%) |
| 10 or more Apartments | 0 (0.0%) | 3 (100.0%) |
| Mobile Home / Other | 0 (0.0%) | 0 (0.0%) |
| Total | 271 (78.8%) | 73 (21.2%) |
Housing Structures by Number of Rooms in Brook
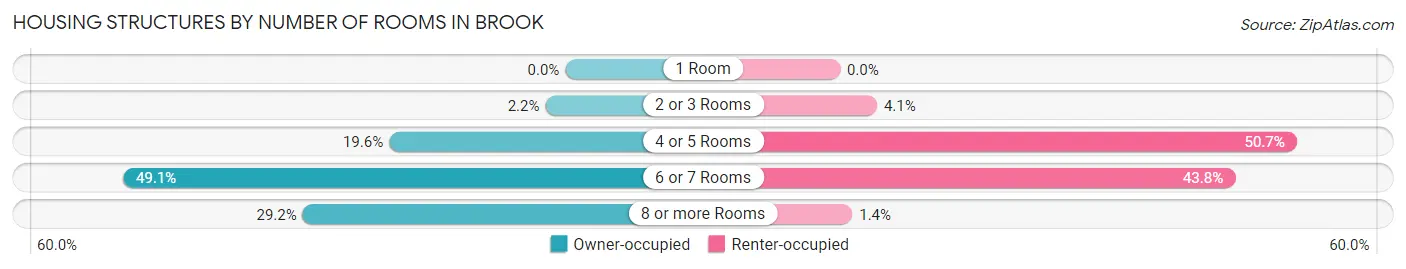
| Number of Rooms | Owner-occupied | Renter-occupied |
| 1 Room | 0 (0.0%) | 0 (0.0%) |
| 2 or 3 Rooms | 6 (2.2%) | 3 (4.1%) |
| 4 or 5 Rooms | 53 (19.6%) | 37 (50.7%) |
| 6 or 7 Rooms | 133 (49.1%) | 32 (43.8%) |
| 8 or more Rooms | 79 (29.1%) | 1 (1.4%) |
| Total | 271 (100.0%) | 73 (100.0%) |
Housing Structure by Heating Type in Brook
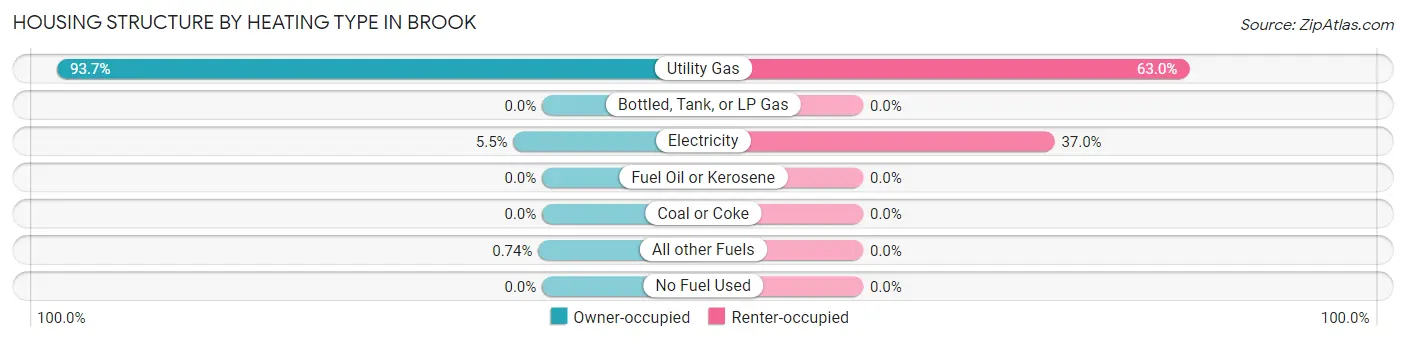
| Heating Type | Owner-occupied | Renter-occupied |
| Utility Gas | 254 (93.7%) | 46 (63.0%) |
| Bottled, Tank, or LP Gas | 0 (0.0%) | 0 (0.0%) |
| Electricity | 15 (5.5%) | 27 (37.0%) |
| Fuel Oil or Kerosene | 0 (0.0%) | 0 (0.0%) |
| Coal or Coke | 0 (0.0%) | 0 (0.0%) |
| All other Fuels | 2 (0.7%) | 0 (0.0%) |
| No Fuel Used | 0 (0.0%) | 0 (0.0%) |
| Total | 271 (100.0%) | 73 (100.0%) |
Household Vehicle Usage in Brook
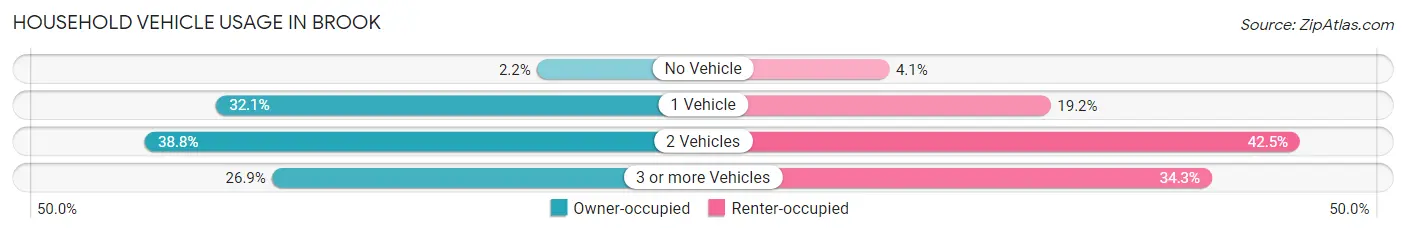
| Vehicles per Household | Owner-occupied | Renter-occupied |
| No Vehicle | 6 (2.2%) | 3 (4.1%) |
| 1 Vehicle | 87 (32.1%) | 14 (19.2%) |
| 2 Vehicles | 105 (38.8%) | 31 (42.5%) |
| 3 or more Vehicles | 73 (26.9%) | 25 (34.3%) |
| Total | 271 (100.0%) | 73 (100.0%) |
Real Estate & Mortgages in Brook
Real Estate and Mortgage Overview in Brook
| Characteristic | Without Mortgage | With Mortgage |
| Housing Units | 98 | 173 |
| Median Property Value | $95,500 | $94,900 |
| Median Household Income | $32,500 | $18 |
| Monthly Housing Costs | $375 | $3 |
| Real Estate Taxes | $800 | $13 |
Property Value by Mortgage Status in Brook
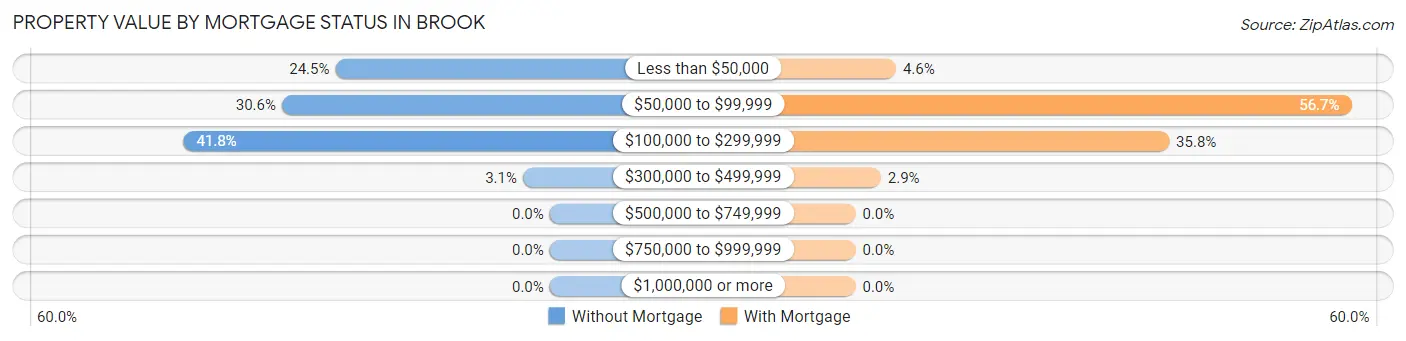
| Property Value | Without Mortgage | With Mortgage |
| Less than $50,000 | 24 (24.5%) | 8 (4.6%) |
| $50,000 to $99,999 | 30 (30.6%) | 98 (56.7%) |
| $100,000 to $299,999 | 41 (41.8%) | 62 (35.8%) |
| $300,000 to $499,999 | 3 (3.1%) | 5 (2.9%) |
| $500,000 to $749,999 | 0 (0.0%) | 0 (0.0%) |
| $750,000 to $999,999 | 0 (0.0%) | 0 (0.0%) |
| $1,000,000 or more | 0 (0.0%) | 0 (0.0%) |
| Total | 98 (100.0%) | 173 (100.0%) |
Household Income by Mortgage Status in Brook
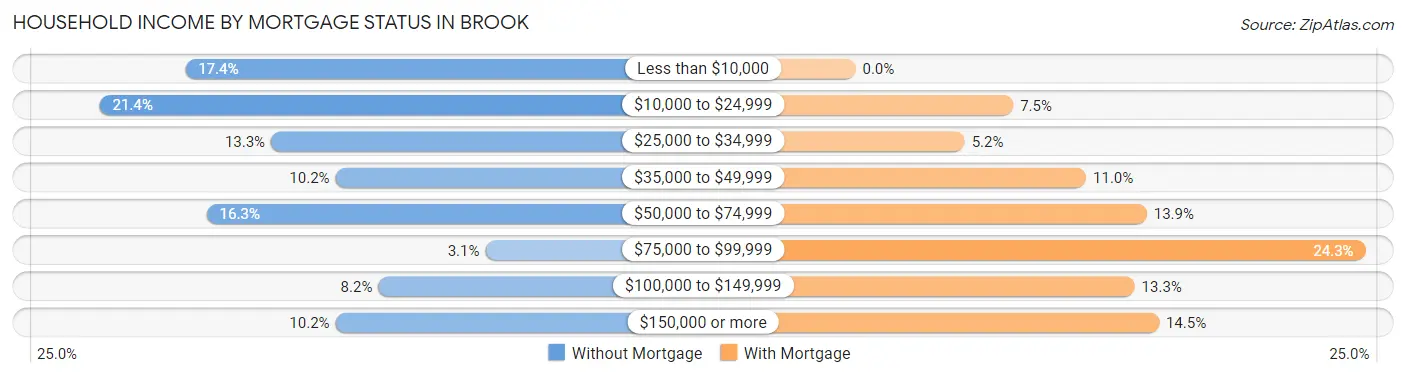
| Household Income | Without Mortgage | With Mortgage |
| Less than $10,000 | 17 (17.3%) | 0 (0.0%) |
| $10,000 to $24,999 | 21 (21.4%) | 13 (7.5%) |
| $25,000 to $34,999 | 13 (13.3%) | 9 (5.2%) |
| $35,000 to $49,999 | 10 (10.2%) | 19 (11.0%) |
| $50,000 to $74,999 | 16 (16.3%) | 24 (13.9%) |
| $75,000 to $99,999 | 3 (3.1%) | 42 (24.3%) |
| $100,000 to $149,999 | 8 (8.2%) | 23 (13.3%) |
| $150,000 or more | 10 (10.2%) | 25 (14.4%) |
| Total | 98 (100.0%) | 173 (100.0%) |
Property Value to Household Income Ratio in Brook
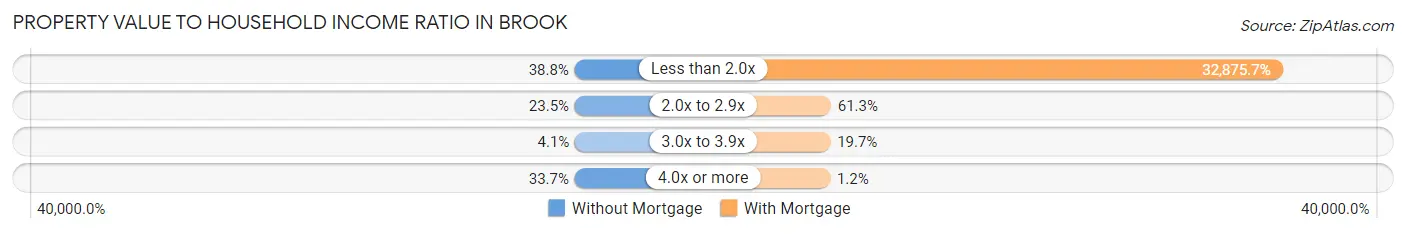
| Value-to-Income Ratio | Without Mortgage | With Mortgage |
| Less than 2.0x | 38 (38.8%) | 56,875 (32,875.7%) |
| 2.0x to 2.9x | 23 (23.5%) | 106 (61.3%) |
| 3.0x to 3.9x | 4 (4.1%) | 34 (19.7%) |
| 4.0x or more | 33 (33.7%) | 2 (1.2%) |
| Total | 98 (100.0%) | 173 (100.0%) |
Real Estate Taxes by Mortgage Status in Brook
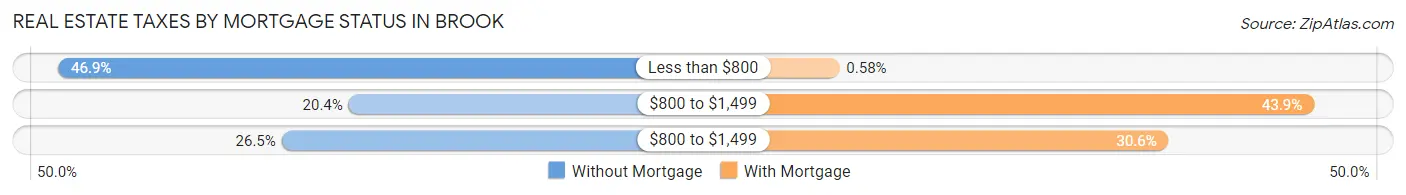
| Property Taxes | Without Mortgage | With Mortgage |
| Less than $800 | 46 (46.9%) | 1 (0.6%) |
| $800 to $1,499 | 20 (20.4%) | 76 (43.9%) |
| $800 to $1,499 | 26 (26.5%) | 53 (30.6%) |
| Total | 98 (100.0%) | 173 (100.0%) |
Health & Disability in Brook
Health Insurance Coverage by Age in Brook
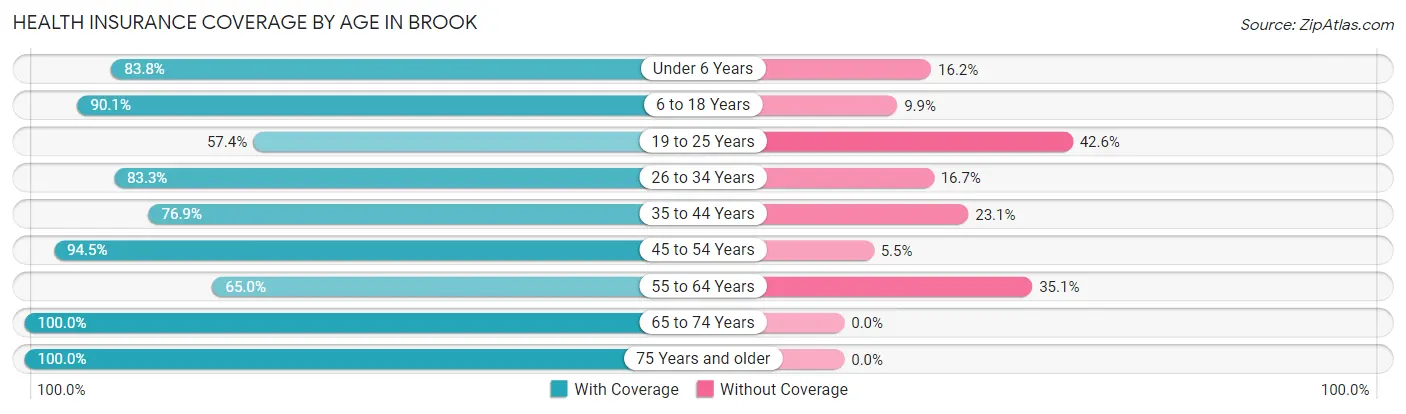
| Age Bracket | With Coverage | Without Coverage |
| Under 6 Years | 88 (83.8%) | 17 (16.2%) |
| 6 to 18 Years | 137 (90.1%) | 15 (9.9%) |
| 19 to 25 Years | 31 (57.4%) | 23 (42.6%) |
| 26 to 34 Years | 130 (83.3%) | 26 (16.7%) |
| 35 to 44 Years | 113 (76.9%) | 34 (23.1%) |
| 45 to 54 Years | 86 (94.5%) | 5 (5.5%) |
| 55 to 64 Years | 63 (64.9%) | 34 (35.0%) |
| 65 to 74 Years | 66 (100.0%) | 0 (0.0%) |
| 75 Years and older | 92 (100.0%) | 0 (0.0%) |
| Total | 806 (84.0%) | 154 (16.0%) |
Health Insurance Coverage by Citizenship Status in Brook
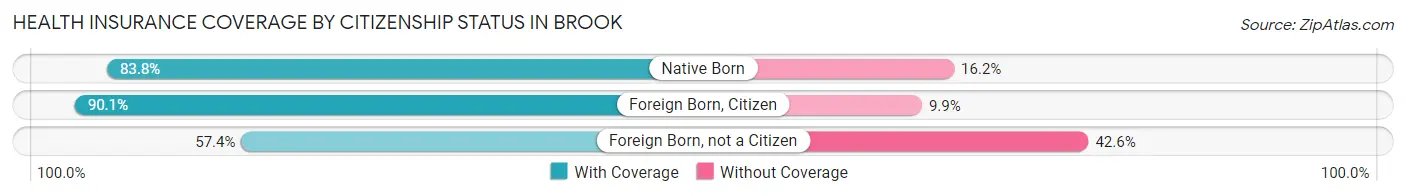
| Citizenship Status | With Coverage | Without Coverage |
| Native Born | 88 (83.8%) | 17 (16.2%) |
| Foreign Born, Citizen | 137 (90.1%) | 15 (9.9%) |
| Foreign Born, not a Citizen | 31 (57.4%) | 23 (42.6%) |
Health Insurance Coverage by Household Income in Brook
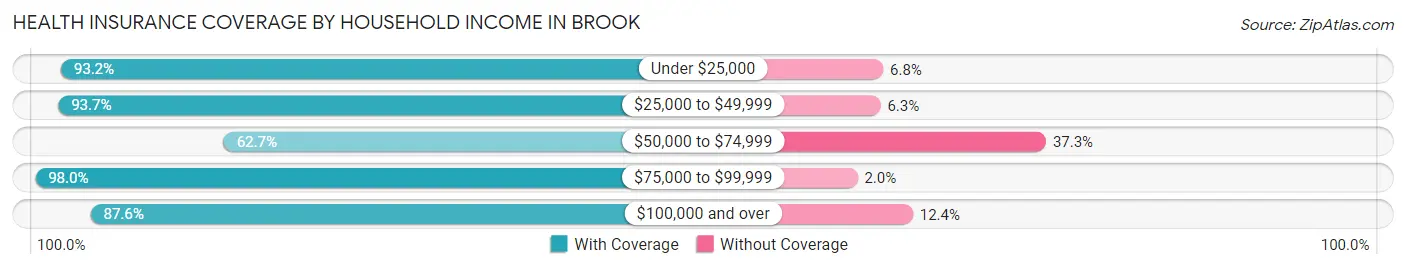
| Household Income | With Coverage | Without Coverage |
| Under $25,000 | 96 (93.2%) | 7 (6.8%) |
| $25,000 to $49,999 | 208 (93.7%) | 14 (6.3%) |
| $50,000 to $74,999 | 163 (62.7%) | 97 (37.3%) |
| $75,000 to $99,999 | 98 (98.0%) | 2 (2.0%) |
| $100,000 and over | 241 (87.6%) | 34 (12.4%) |
Public vs Private Health Insurance Coverage by Age in Brook
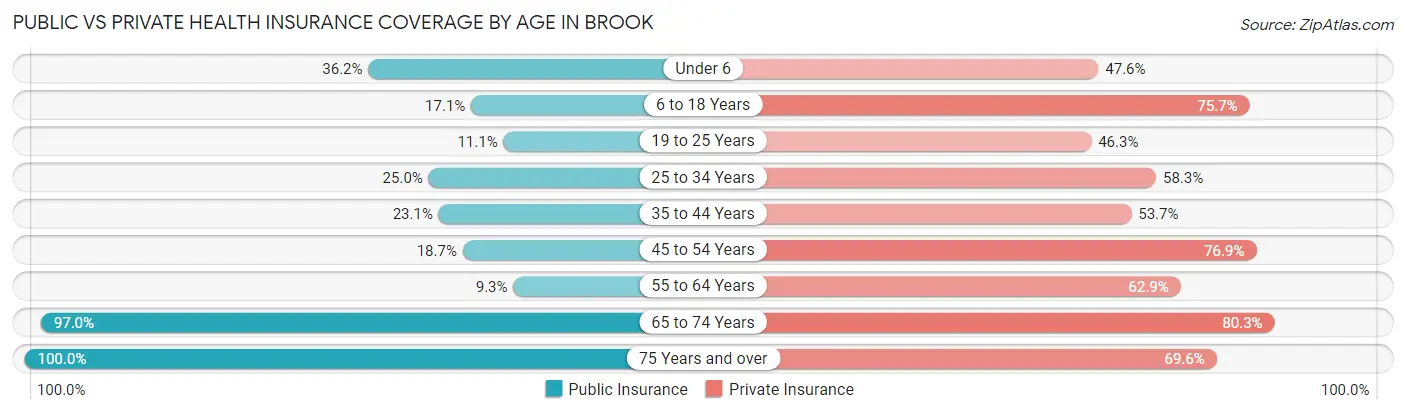
| Age Bracket | Public Insurance | Private Insurance |
| Under 6 | 38 (36.2%) | 50 (47.6%) |
| 6 to 18 Years | 26 (17.1%) | 115 (75.7%) |
| 19 to 25 Years | 6 (11.1%) | 25 (46.3%) |
| 25 to 34 Years | 39 (25.0%) | 91 (58.3%) |
| 35 to 44 Years | 34 (23.1%) | 79 (53.7%) |
| 45 to 54 Years | 17 (18.7%) | 70 (76.9%) |
| 55 to 64 Years | 9 (9.3%) | 61 (62.9%) |
| 65 to 74 Years | 64 (97.0%) | 53 (80.3%) |
| 75 Years and over | 92 (100.0%) | 64 (69.6%) |
| Total | 325 (33.9%) | 608 (63.3%) |
Disability Status by Sex by Age in Brook
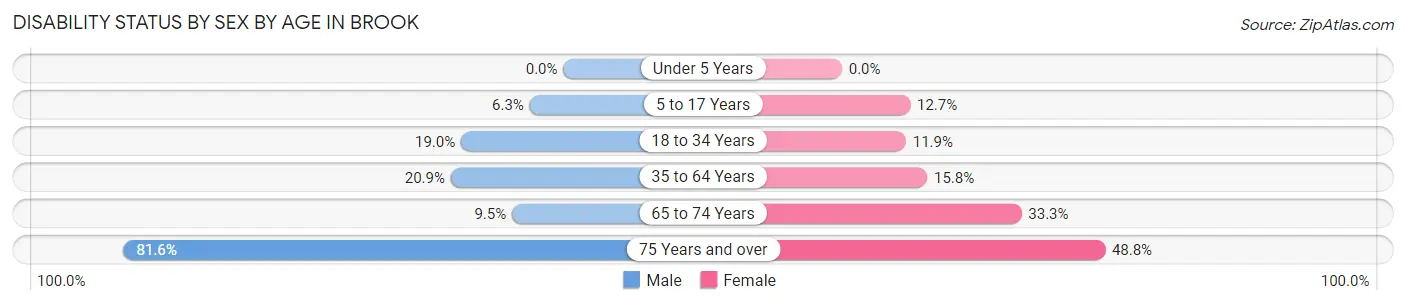
| Age Bracket | Male | Female |
| Under 5 Years | 0 (0.0%) | 0 (0.0%) |
| 5 to 17 Years | 3 (6.2%) | 10 (12.7%) |
| 18 to 34 Years | 30 (19.0%) | 12 (11.9%) |
| 35 to 64 Years | 33 (20.9%) | 28 (15.8%) |
| 65 to 74 Years | 2 (9.5%) | 15 (33.3%) |
| 75 Years and over | 40 (81.6%) | 21 (48.8%) |
Disability Class by Sex by Age in Brook
Disability Class: Hearing Difficulty
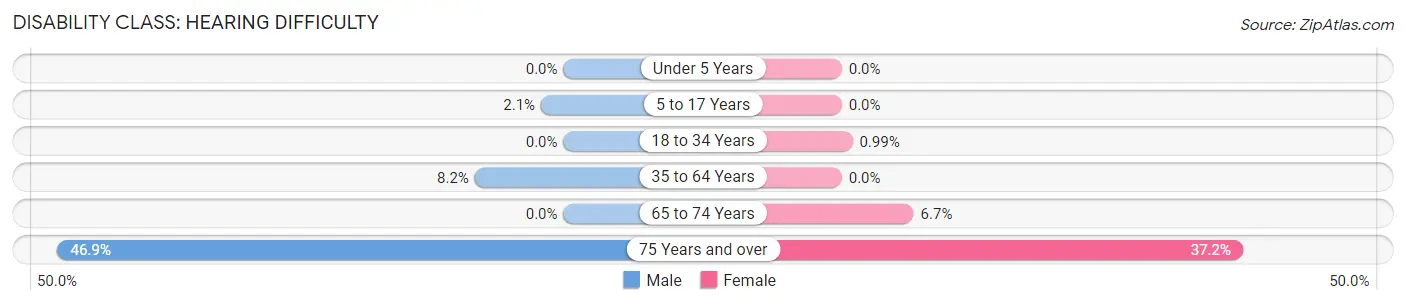
| Age Bracket | Male | Female |
| Under 5 Years | 0 (0.0%) | 0 (0.0%) |
| 5 to 17 Years | 1 (2.1%) | 0 (0.0%) |
| 18 to 34 Years | 0 (0.0%) | 1 (1.0%) |
| 35 to 64 Years | 13 (8.2%) | 0 (0.0%) |
| 65 to 74 Years | 0 (0.0%) | 3 (6.7%) |
| 75 Years and over | 23 (46.9%) | 16 (37.2%) |
Disability Class: Vision Difficulty
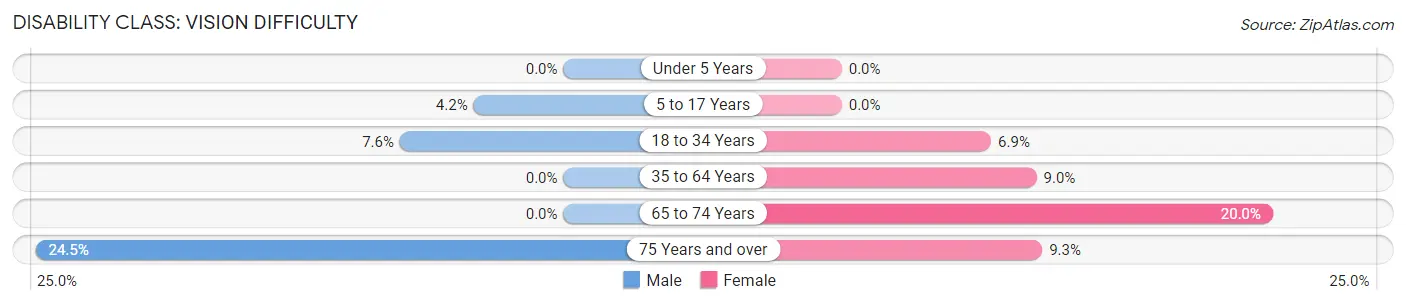
| Age Bracket | Male | Female |
| Under 5 Years | 0 (0.0%) | 0 (0.0%) |
| 5 to 17 Years | 2 (4.2%) | 0 (0.0%) |
| 18 to 34 Years | 12 (7.6%) | 7 (6.9%) |
| 35 to 64 Years | 0 (0.0%) | 16 (9.0%) |
| 65 to 74 Years | 0 (0.0%) | 9 (20.0%) |
| 75 Years and over | 12 (24.5%) | 4 (9.3%) |
Disability Class: Cognitive Difficulty
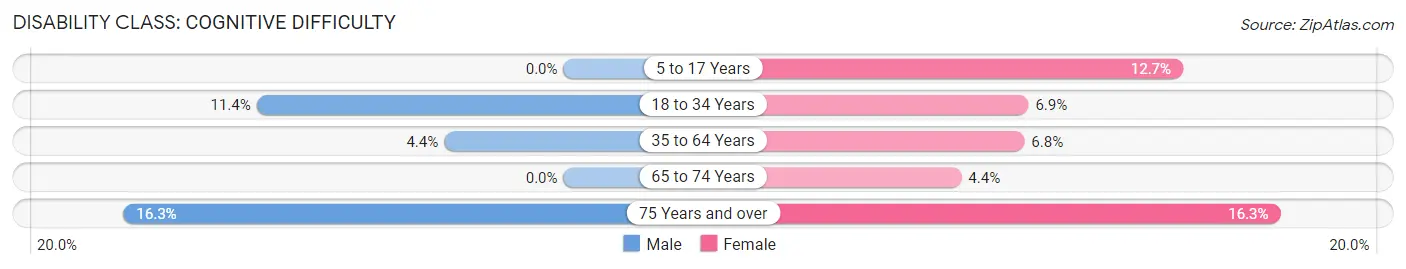
| Age Bracket | Male | Female |
| 5 to 17 Years | 0 (0.0%) | 10 (12.7%) |
| 18 to 34 Years | 18 (11.4%) | 7 (6.9%) |
| 35 to 64 Years | 7 (4.4%) | 12 (6.8%) |
| 65 to 74 Years | 0 (0.0%) | 2 (4.4%) |
| 75 Years and over | 8 (16.3%) | 7 (16.3%) |
Disability Class: Ambulatory Difficulty
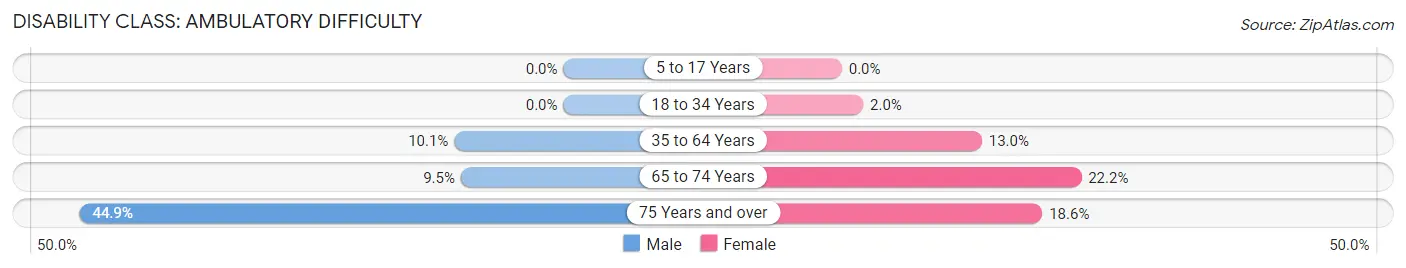
| Age Bracket | Male | Female |
| 5 to 17 Years | 0 (0.0%) | 0 (0.0%) |
| 18 to 34 Years | 0 (0.0%) | 2 (2.0%) |
| 35 to 64 Years | 16 (10.1%) | 23 (13.0%) |
| 65 to 74 Years | 2 (9.5%) | 10 (22.2%) |
| 75 Years and over | 22 (44.9%) | 8 (18.6%) |
Disability Class: Self-Care Difficulty
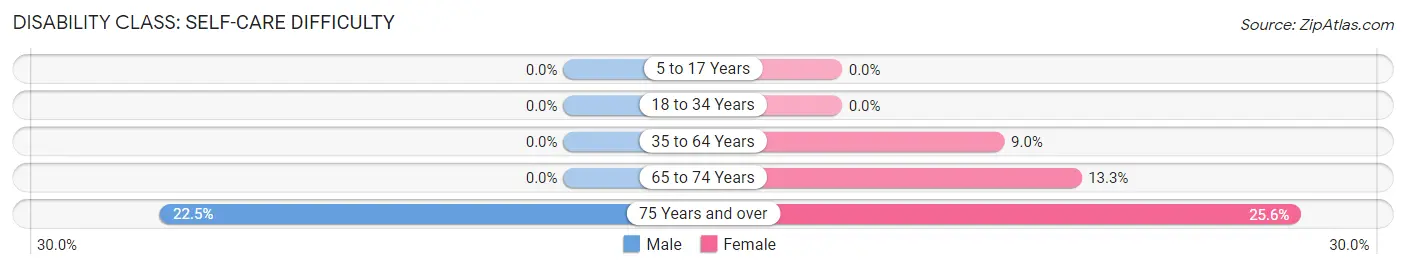
| Age Bracket | Male | Female |
| 5 to 17 Years | 0 (0.0%) | 0 (0.0%) |
| 18 to 34 Years | 0 (0.0%) | 0 (0.0%) |
| 35 to 64 Years | 0 (0.0%) | 16 (9.0%) |
| 65 to 74 Years | 0 (0.0%) | 6 (13.3%) |
| 75 Years and over | 11 (22.5%) | 11 (25.6%) |
Technology Access in Brook
Computing Device Access in Brook
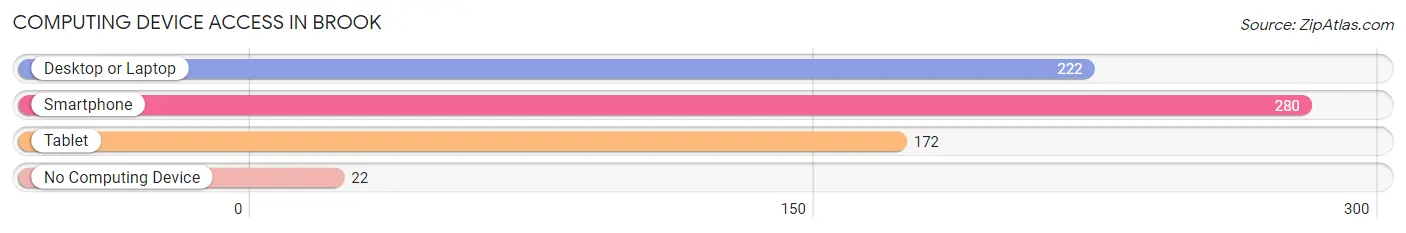
| Device Type | # Households | % Households |
| Desktop or Laptop | 222 | 64.5% |
| Smartphone | 280 | 81.4% |
| Tablet | 172 | 50.0% |
| No Computing Device | 22 | 6.4% |
| Total | 344 | 100.0% |
Internet Access in Brook
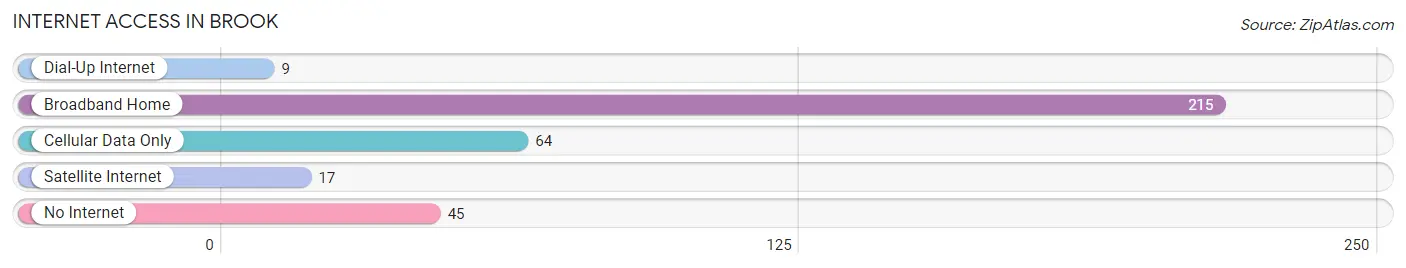
| Internet Type | # Households | % Households |
| Dial-Up Internet | 9 | 2.6% |
| Broadband Home | 215 | 62.5% |
| Cellular Data Only | 64 | 18.6% |
| Satellite Internet | 17 | 4.9% |
| No Internet | 45 | 13.1% |
| Total | 344 | 100.0% |
Brook Summary
Brook, Indiana is a small town located in the northwest corner of the state, in the county of Whitley. It is situated on the banks of the Little Wabash River, and is surrounded by rolling hills and farmland. The town has a population of just over 1,000 people, and is known for its small-town charm and friendly atmosphere.
History
The area that is now Brook was first settled in the early 1800s by a group of settlers from Pennsylvania. The town was originally known as “Brookville”, and was officially incorporated in 1837. The town was named after the nearby creek, which was named after a local settler, John Brook.
In the late 1800s, the town began to grow and prosper. The railroad came to town in 1882, and the town was connected to the rest of the state by the Wabash and Erie Canal. This allowed for the transportation of goods and services to and from the town, and helped to spur economic growth.
The town continued to grow throughout the early 1900s, and by the 1950s, the population had grown to over 1,000 people. The town was known for its strong agricultural economy, and was home to several small businesses.
Geography
Brook is located in the northwest corner of Indiana, in Whitley County. It is situated on the banks of the Little Wabash River, and is surrounded by rolling hills and farmland. The town is located about 25 miles south of Fort Wayne, and about 50 miles north of Indianapolis.
The town has a total area of 1.2 square miles, all of which is land. The town is located at an elevation of 845 feet above sea level. The climate in Brook is classified as humid continental, with hot summers and cold winters.
Economy
The economy of Brook is largely based on agriculture. The town is home to several small farms, and the surrounding area is known for its production of corn, soybeans, and wheat. The town is also home to several small businesses, including a grocery store, a hardware store, and a few restaurants.
The town is also home to a few manufacturing companies, including a plastics factory and a metal fabrication plant. The town is also home to a few small service businesses, such as a gas station and a few auto repair shops.
Demographics
As of the 2010 census, the population of Brook was 1,072. The racial makeup of the town was 97.3% White, 0.7% African American, 0.2% Native American, 0.2% Asian, 0.2% from other races, and 1.4% from two or more races. Hispanic or Latino of any race were 1.2% of the population.
The median income for a household in the town was $37,500, and the median income for a family was $45,000. The per capita income for the town was $18,000. About 11.2% of families and 14.2% of the population were below the poverty line, including 18.2% of those under age 18 and 8.3% of those age 65 or over.
Common Questions
What is Per Capita Income in Brook?
Per Capita income in Brook is $24,490.
What is the Median Family Income in Brook?
Median Family Income in Brook is $55,208.
What is the Median Household income in Brook?
Median Household Income in Brook is $52,065.
What is Income or Wage Gap in Brook?
Income or Wage Gap in Brook is 27.7%.
Women in Brook earn 72.3 cents for every dollar earned by a man.
What is Inequality or Gini Index in Brook?
Inequality or Gini Index in Brook is 0.39.
What is the Total Population of Brook?
Total Population of Brook is 960.
What is the Total Male Population of Brook?
Total Male Population of Brook is 482.
What is the Total Female Population of Brook?
Total Female Population of Brook is 478.
What is the Ratio of Males per 100 Females in Brook?
There are 100.84 Males per 100 Females in Brook.
What is the Ratio of Females per 100 Males in Brook?
There are 99.17 Females per 100 Males in Brook.
What is the Median Population Age in Brook?
Median Population Age in Brook is 35.9 Years.
What is the Average Family Size in Brook
Average Family Size in Brook is 3.3 People.
What is the Average Household Size in Brook
Average Household Size in Brook is 2.8 People.
How Large is the Labor Force in Brook?
There are 498 People in the Labor Forcein in Brook.
What is the Percentage of People in the Labor Force in Brook?
64.5% of People are in the Labor Force in Brook.
What is the Unemployment Rate in Brook?
Unemployment Rate in Brook is 5.8%.