Cities with the Highest Percentage of Immigrants from El Salvador in Kansas
RELATED REPORTS & OPTIONS
El Salvador
Kansas
Compare Cities
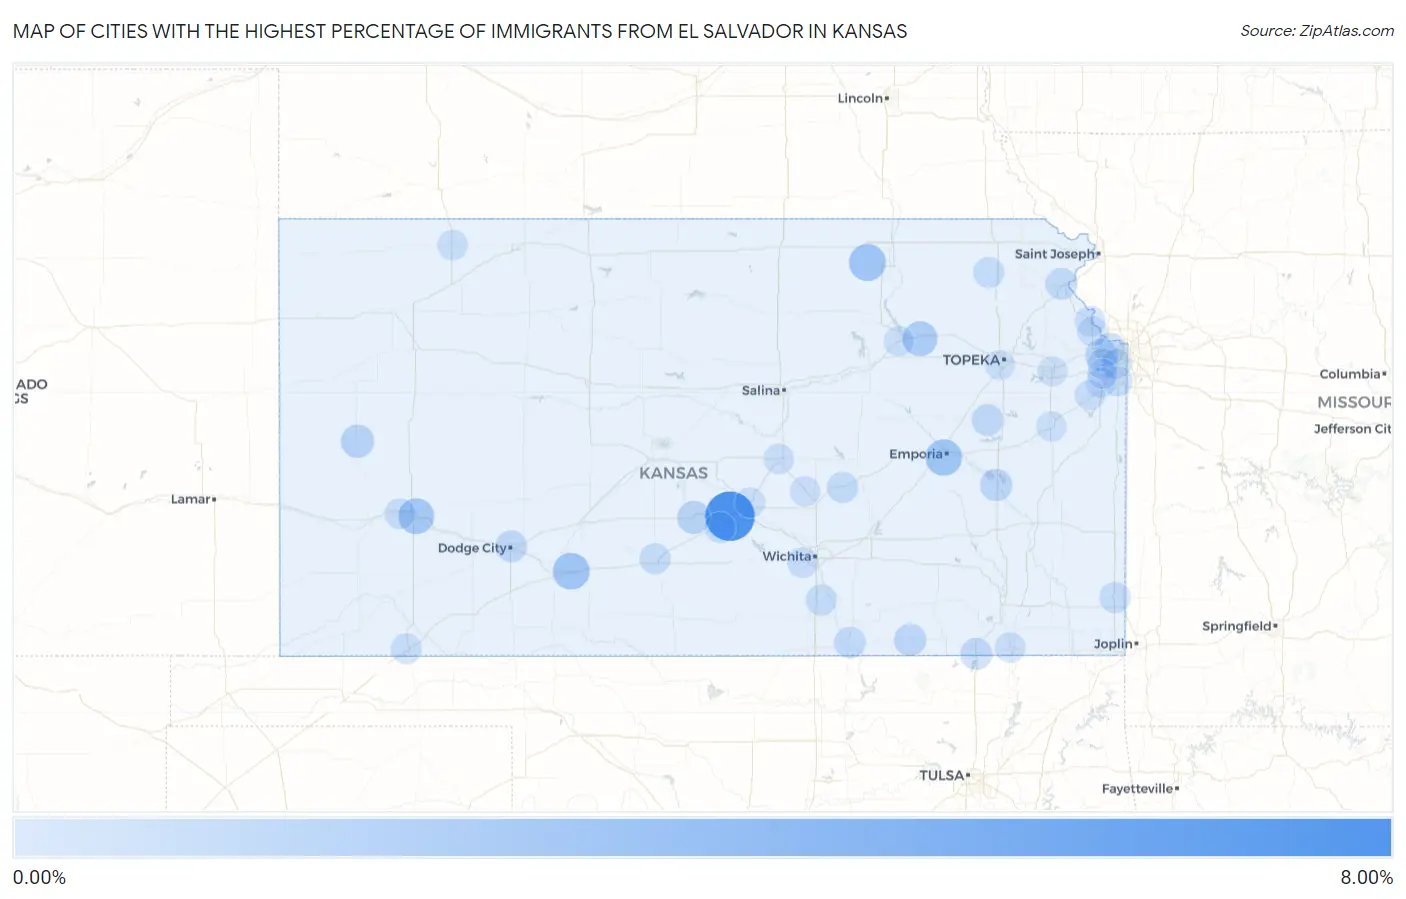
Map of Cities with the Highest Percentage of Immigrants from El Salvador in Kansas
0.00%
8.00%
Cities with the Highest Percentage of Immigrants from El Salvador in Kansas
| City | El Salvador | vs State | vs National | |
| 1. | Partridge | 7.95% | 0.15%(+7.80)#-1 | 0.43%(+7.53)#0 |
| 2. | Barnes | 2.67% | 0.15%(+2.51)#0 | 0.43%(+2.24)#1 |
| 3. | Mullinville | 2.60% | 0.15%(+2.44)#1 | 0.43%(+2.17)#2 |
| 4. | Emporia | 2.53% | 0.15%(+2.38)#2 | 0.43%(+2.10)#3 |
| 5. | Garden City | 2.25% | 0.15%(+2.10)#3 | 0.43%(+1.82)#288 |
| 6. | St George | 1.85% | 0.15%(+1.70)#4 | 0.43%(+1.42)#289 |
| 7. | Leoti | 1.24% | 0.15%(+1.08)#5 | 0.43%(+0.812)#290 |
| 8. | Sylvia | 1.18% | 0.15%(+1.03)#6 | 0.43%(+0.758)#291 |
| 9. | Burlington | 0.88% | 0.15%(+0.726)#7 | 0.43%(+0.454)#292 |
| 10. | Cedar Vale | 0.84% | 0.15%(+0.690)#8 | 0.43%(+0.418)#293 |
| 11. | Edwardsville | 0.82% | 0.15%(+0.669)#9 | 0.43%(+0.397)#294 |
| 12. | Dodge City | 0.67% | 0.15%(+0.518)#10 | 0.43%(+0.246)#295 |
| 13. | Osage City | 0.67% | 0.15%(+0.513)#11 | 0.43%(+0.240)#296 |
| 14. | Caney | 0.65% | 0.15%(+0.495)#12 | 0.43%(+0.223)#297 |
| 15. | Atchison | 0.63% | 0.15%(+0.475)#13 | 0.43%(+0.202)#298 |
| 16. | Arkansas City | 0.58% | 0.15%(+0.422)#14 | 0.43%(+0.150)#299 |
| 17. | Kansas City | 0.50% | 0.15%(+0.343)#15 | 0.43%(+0.071)#1,761 |
| 18. | Peabody | 0.48% | 0.15%(+0.324)#16 | 0.43%(+0.051)#1,762 |
| 19. | Arlington | 0.42% | 0.15%(+0.268)#17 | 0.43%(-0.004)#1,763 |
| 20. | Pittsburg | 0.42% | 0.15%(+0.264)#18 | 0.43%(-0.008)#1,764 |
| 21. | Belle Plaine | 0.42% | 0.15%(+0.262)#19 | 0.43%(-0.010)#1,765 |
| 22. | Pratt | 0.39% | 0.15%(+0.242)#20 | 0.43%(-0.031)#1,766 |
| 23. | Wetmore | 0.34% | 0.15%(+0.191)#21 | 0.43%(-0.082)#1,767 |
| 24. | Holcomb | 0.29% | 0.15%(+0.139)#22 | 0.43%(-0.133)#1,768 |
| 25. | Liberal | 0.24% | 0.15%(+0.088)#23 | 0.43%(-0.185)#1,769 |
| 26. | Shawnee | 0.21% | 0.15%(+0.057)#24 | 0.43%(-0.216)#1,770 |
| 27. | Wichita | 0.20% | 0.15%(+0.049)#25 | 0.43%(-0.223)#1,846 |
| 28. | Oberlin | 0.18% | 0.15%(+0.031)#26 | 0.43%(-0.241)#1,847 |
| 29. | Leavenworth | 0.18% | 0.15%(+0.025)#27 | 0.43%(-0.248)#1,848 |
| 30. | Coffeyville | 0.15% | 0.15%(-0.006)#28 | 0.43%(-0.278)#1,849 |
| 31. | Mcpherson | 0.14% | 0.15%(-0.010)#29 | 0.43%(-0.282)#1,850 |
| 32. | Overland Park | 0.14% | 0.15%(-0.011)#30 | 0.43%(-0.283)#1,851 |
| 33. | Hesston | 0.11% | 0.15%(-0.045)#31 | 0.43%(-0.317)#1,852 |
| 34. | Hutchinson | 0.11% | 0.15%(-0.045)#32 | 0.43%(-0.318)#1,853 |
| 35. | Lansing | 0.11% | 0.15%(-0.046)#33 | 0.43%(-0.319)#1,854 |
| 36. | Manhattan | 0.10% | 0.15%(-0.052)#34 | 0.43%(-0.324)#1,855 |
| 37. | Merriam | 0.099% | 0.15%(-0.053)#35 | 0.43%(-0.326)#1,856 |
| 38. | Olathe | 0.089% | 0.15%(-0.064)#36 | 0.43%(-0.336)#1,857 |
| 39. | Gardner | 0.077% | 0.15%(-0.076)#37 | 0.43%(-0.349)#1,858 |
| 40. | Lenexa | 0.059% | 0.15%(-0.094)#38 | 0.43%(-0.366)#1,859 |
| 41. | Ottawa | 0.055% | 0.15%(-0.097)#39 | 0.43%(-0.370)#1,860 |
| 42. | Lawrence | 0.027% | 0.15%(-0.126)#40 | 0.43%(-0.398)#1,861 |
| 43. | Topeka | 0.023% | 0.15%(-0.130)#41 | 0.43%(-0.402)#1,862 |
Common Questions
What are the Top 10 Cities with the Highest Percentage of Immigrants from El Salvador in Kansas?
Top 10 Cities with the Highest Percentage of Immigrants from El Salvador in Kansas are:
#1
7.95%
#2
2.67%
#3
2.60%
#4
2.53%
#5
2.25%
#6
1.85%
#7
1.24%
#8
1.18%
#9
0.88%
#10
0.84%
What city has the Highest Percentage of Immigrants from El Salvador in Kansas?
Partridge has the Highest Percentage of Immigrants from El Salvador in Kansas with 7.95%.
What is the Percentage of Immigrants from El Salvador in the State of Kansas?
Percentage of Immigrants from El Salvador in Kansas is 0.15%.
What is the Percentage of Immigrants from El Salvador in the United States?
Percentage of Immigrants from El Salvador in the United States is 0.43%.