Sultan, WA Map & Demographics
Sultan Map
Sultan Overview
$36,641
PER CAPITA INCOME
$89,208
AVG FAMILY INCOME
$79,084
AVG HOUSEHOLD INCOME
23.2%
WAGE / INCOME GAP [ % ]
76.8¢/ $1
WAGE / INCOME GAP [ $ ]
0.35
INEQUALITY / GINI INDEX
5,462
TOTAL POPULATION
2,892
MALE POPULATION
2,570
FEMALE POPULATION
112.53
MALES / 100 FEMALES
88.87
FEMALES / 100 MALES
36.8
MEDIAN AGE
3.3
AVG FAMILY SIZE
2.6
AVG HOUSEHOLD SIZE
3,083
LABOR FORCE [ PEOPLE ]
69.4%
PERCENT IN LABOR FORCE
5.4%
UNEMPLOYMENT RATE
Sultan Zip Codes
Sultan Area Codes
Income in Sultan
Income Overview in Sultan
Per Capita Income in Sultan is $36,641, while median incomes of families and households are $89,208 and $79,084 respectively.
| Characteristic | Number | Measure |
| Per Capita Income | 5,462 | $36,641 |
| Median Family Income | 1,295 | $89,208 |
| Mean Family Income | 1,295 | $100,099 |
| Median Household Income | 2,071 | $79,084 |
| Mean Household Income | 2,071 | $92,651 |
| Income Deficit | 1,295 | $0 |
| Wage / Income Gap (%) | 5,462 | 23.16% |
| Wage / Income Gap ($) | 5,462 | 76.84¢ per $1 |
| Gini / Inequality Index | 5,462 | 0.35 |
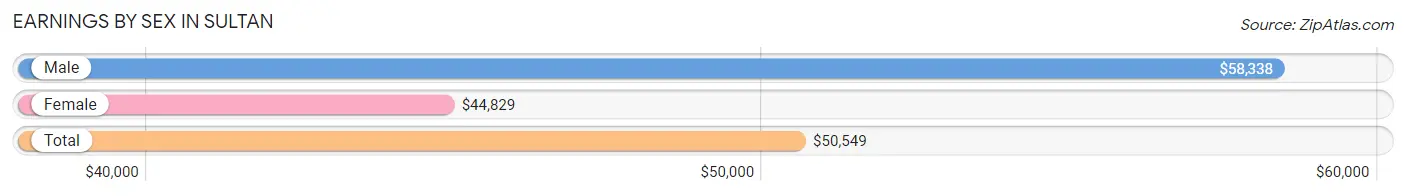
Earnings by Sex in Sultan
Average Earnings in Sultan are $50,549, $58,338 for men and $44,829 for women, a difference of 23.2%.
| Sex | Number | Average Earnings |
| Male | 1,611 (52.6%) | $58,338 |
| Female | 1,454 (47.4%) | $44,829 |
| Total | 3,065 (100.0%) | $50,549 |
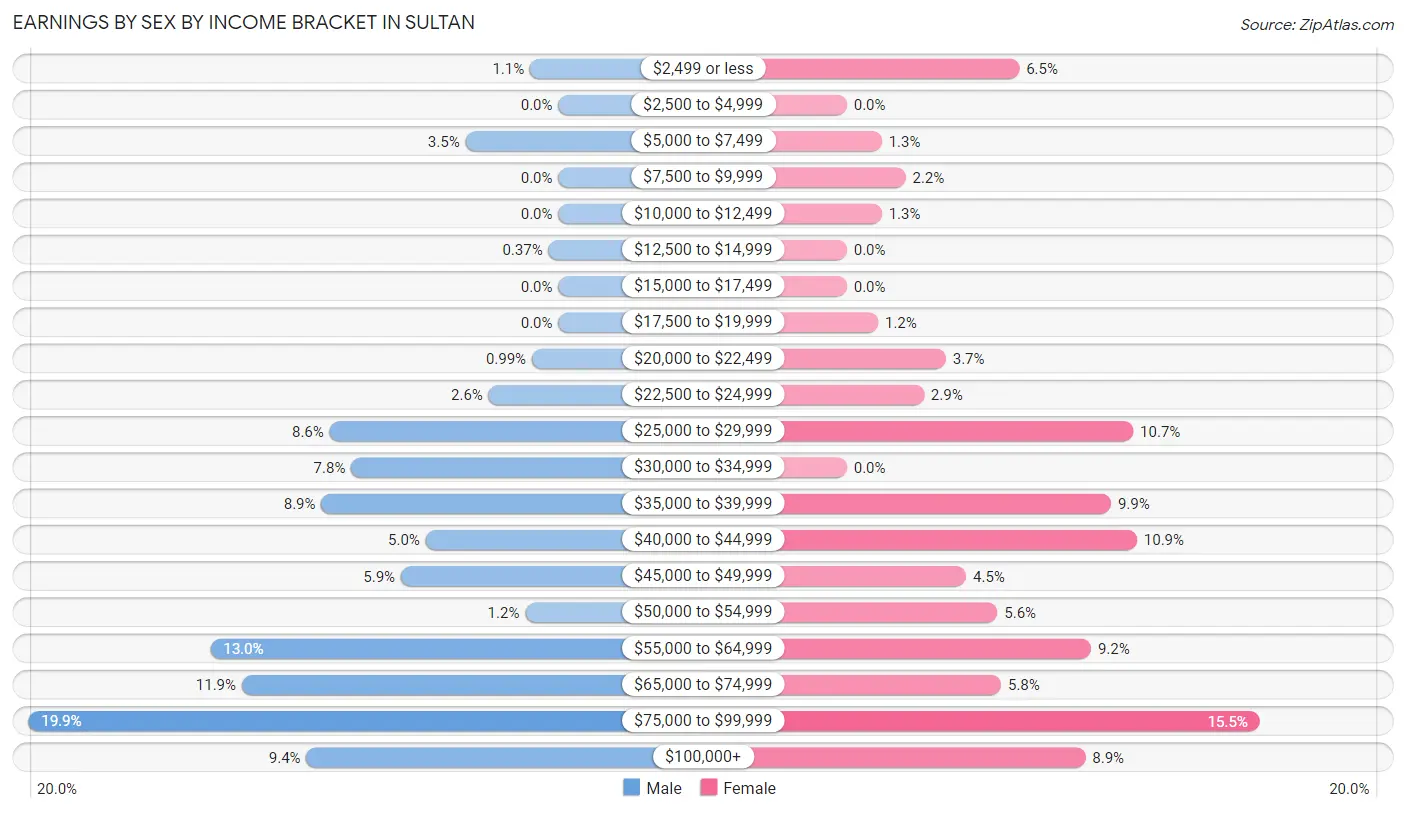
Earnings by Sex by Income Bracket in Sultan
The most common earnings brackets in Sultan are $75,000 to $99,999 for men (320 | 19.9%) and $75,000 to $99,999 for women (225 | 15.5%).
| Income | Male | Female |
| $2,499 or less | 17 (1.1%) | 94 (6.5%) |
| $2,500 to $4,999 | 0 (0.0%) | 0 (0.0%) |
| $5,000 to $7,499 | 56 (3.5%) | 19 (1.3%) |
| $7,500 to $9,999 | 0 (0.0%) | 32 (2.2%) |
| $10,000 to $12,499 | 0 (0.0%) | 19 (1.3%) |
| $12,500 to $14,999 | 6 (0.4%) | 0 (0.0%) |
| $15,000 to $17,499 | 0 (0.0%) | 0 (0.0%) |
| $17,500 to $19,999 | 0 (0.0%) | 17 (1.2%) |
| $20,000 to $22,499 | 16 (1.0%) | 54 (3.7%) |
| $22,500 to $24,999 | 42 (2.6%) | 42 (2.9%) |
| $25,000 to $29,999 | 138 (8.6%) | 156 (10.7%) |
| $30,000 to $34,999 | 125 (7.8%) | 0 (0.0%) |
| $35,000 to $39,999 | 143 (8.9%) | 144 (9.9%) |
| $40,000 to $44,999 | 80 (5.0%) | 158 (10.9%) |
| $45,000 to $49,999 | 95 (5.9%) | 65 (4.5%) |
| $50,000 to $54,999 | 20 (1.2%) | 82 (5.6%) |
| $55,000 to $64,999 | 210 (13.0%) | 133 (9.1%) |
| $65,000 to $74,999 | 191 (11.9%) | 84 (5.8%) |
| $75,000 to $99,999 | 320 (19.9%) | 225 (15.5%) |
| $100,000+ | 152 (9.4%) | 130 (8.9%) |
| Total | 1,611 (100.0%) | 1,454 (100.0%) |
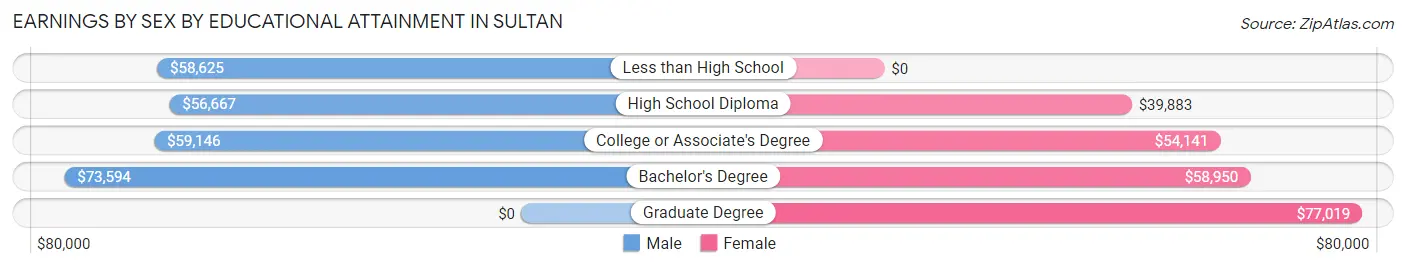
Earnings by Sex by Educational Attainment in Sultan
Average earnings in Sultan are $60,407 for men and $48,992 for women, a difference of 18.9%. Men with an educational attainment of bachelor's degree enjoy the highest average annual earnings of $73,594, while those with high school diploma education earn the least with $56,667. Women with an educational attainment of graduate degree earn the most with the average annual earnings of $77,019, while those with high school diploma education have the smallest earnings of $39,883.
| Educational Attainment | Male Income | Female Income |
| Less than High School | $58,625 | $0 |
| High School Diploma | $56,667 | $39,883 |
| College or Associate's Degree | $59,146 | $54,141 |
| Bachelor's Degree | $73,594 | $58,950 |
| Graduate Degree | - | - |
| Total | $60,407 | $48,992 |
Family Income in Sultan
Family Income Brackets in Sultan
According to the Sultan family income data, there are 376 families falling into the $100,000 to $149,999 income range, which is the most common income bracket and makes up 29.0% of all families.
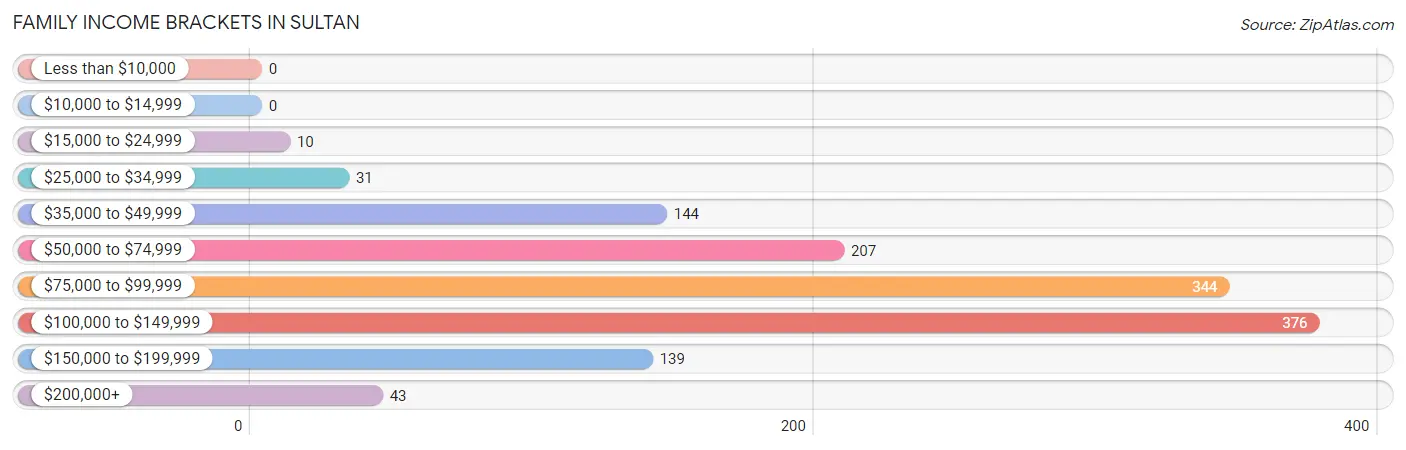
| Income Bracket | # Families | % Families |
| Less than $10,000 | 0 | 0.0% |
| $10,000 to $14,999 | 0 | 0.0% |
| $15,000 to $24,999 | 10 | 0.8% |
| $25,000 to $34,999 | 31 | 2.4% |
| $35,000 to $49,999 | 144 | 11.1% |
| $50,000 to $74,999 | 207 | 16.0% |
| $75,000 to $99,999 | 344 | 26.6% |
| $100,000 to $149,999 | 376 | 29.0% |
| $150,000 to $199,999 | 139 | 10.7% |
| $200,000+ | 43 | 3.3% |
Family Income by Famaliy Size in Sultan
6-person families (58 | 4.5%) account for the highest median family income in Sultan with $116,583 per family, while 2-person families (486 | 37.5%) have the highest median income of $47,708 per family member.
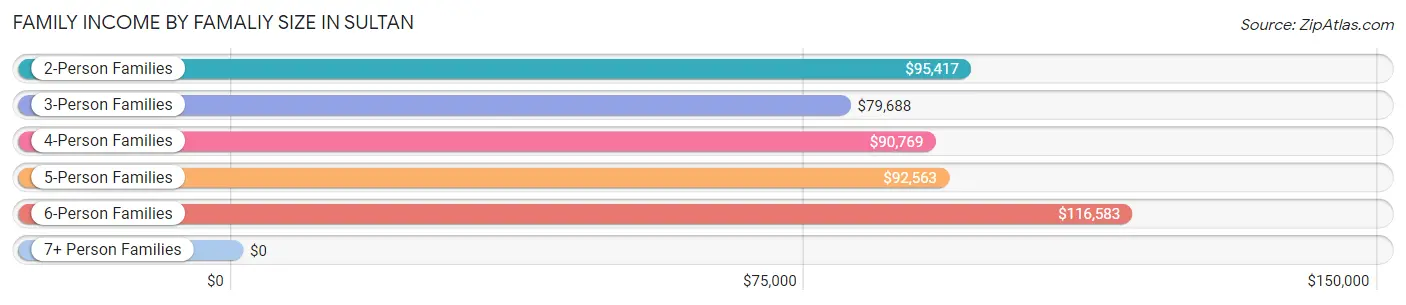
| Income Bracket | # Families | Median Income |
| 2-Person Families | 486 (37.5%) | $95,417 |
| 3-Person Families | 390 (30.1%) | $79,688 |
| 4-Person Families | 282 (21.8%) | $90,769 |
| 5-Person Families | 65 (5.0%) | $92,563 |
| 6-Person Families | 58 (4.5%) | $116,583 |
| 7+ Person Families | 14 (1.1%) | $0 |
| Total | 1,295 (100.0%) | $89,208 |
Family Income by Number of Earners in Sultan
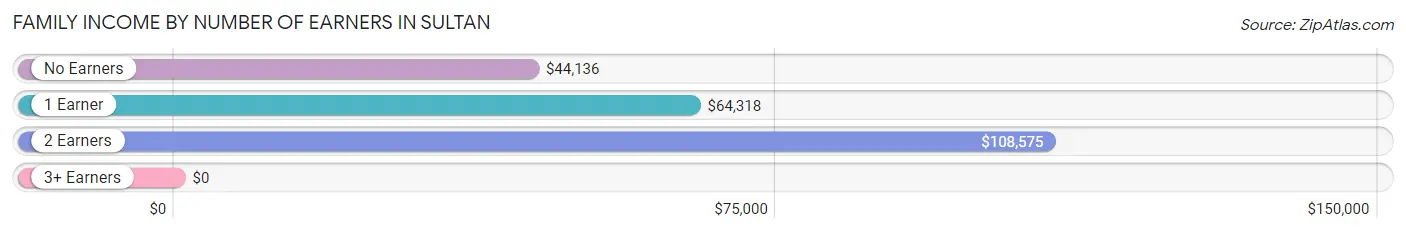
| Number of Earners | # Families | Median Income |
| No Earners | 120 (9.3%) | $44,136 |
| 1 Earner | 332 (25.6%) | $64,318 |
| 2 Earners | 793 (61.2%) | $108,575 |
| 3+ Earners | 50 (3.9%) | $0 |
| Total | 1,295 (100.0%) | $89,208 |
Household Income in Sultan
Household Income Brackets in Sultan
With 483 households falling in the category, the $100,000 to $149,999 income range is the most frequent in Sultan, accounting for 23.3% of all households.
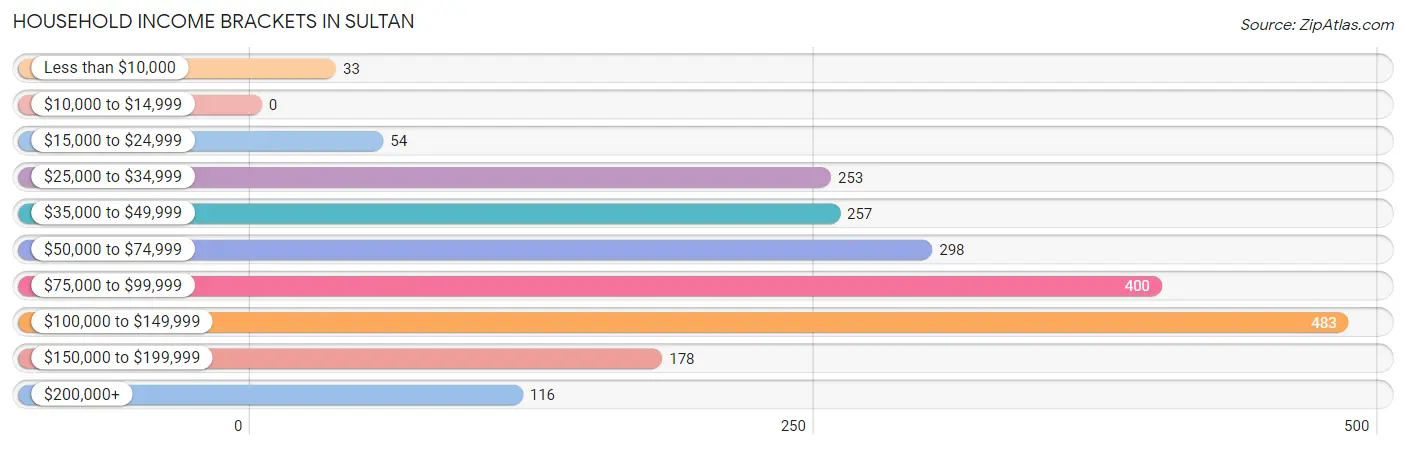
| Income Bracket | # Households | % Households |
| Less than $10,000 | 33 | 1.6% |
| $10,000 to $14,999 | 0 | 0.0% |
| $15,000 to $24,999 | 54 | 2.6% |
| $25,000 to $34,999 | 253 | 12.2% |
| $35,000 to $49,999 | 257 | 12.4% |
| $50,000 to $74,999 | 298 | 14.4% |
| $75,000 to $99,999 | 400 | 19.3% |
| $100,000 to $149,999 | 483 | 23.3% |
| $150,000 to $199,999 | 178 | 8.6% |
| $200,000+ | 116 | 5.6% |
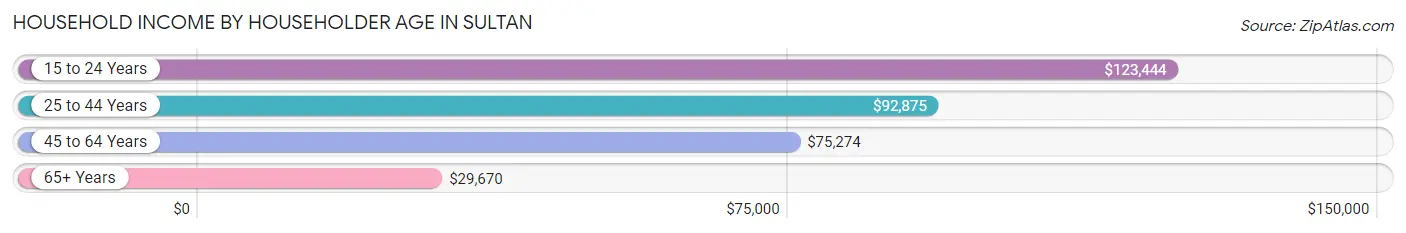
Household Income by Householder Age in Sultan
The median household income in Sultan is $79,084, with the highest median household income of $123,444 found in the 15 to 24 years age bracket for the primary householder. A total of 84 households (4.1%) fall into this category. Meanwhile, the 65+ years age bracket for the primary householder has the lowest median household income of $29,670, with 472 households (22.8%) in this group.
| Income Bracket | # Households | Median Income |
| 15 to 24 Years | 84 (4.1%) | $123,444 |
| 25 to 44 Years | 940 (45.4%) | $92,875 |
| 45 to 64 Years | 575 (27.8%) | $75,274 |
| 65+ Years | 472 (22.8%) | $29,670 |
| Total | 2,071 (100.0%) | $79,084 |
Poverty in Sultan
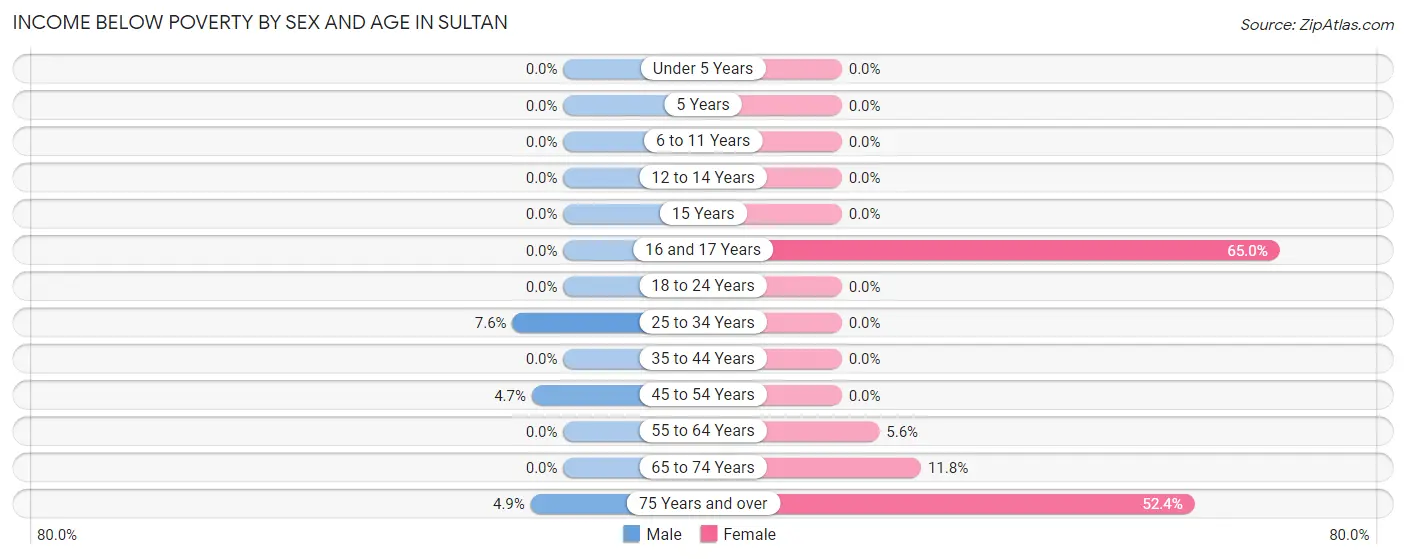
Income Below Poverty by Sex and Age in Sultan
With 1.8% poverty level for males and 2.4% for females among the residents of Sultan, 25 to 34 year old males and 16 and 17 year old females are the most vulnerable to poverty, with 27 males (7.6%) and 13 females (65.0%) in their respective age groups living below the poverty level.
| Age Bracket | Male | Female |
| Under 5 Years | 0 (0.0%) | 0 (0.0%) |
| 5 Years | 0 (0.0%) | 0 (0.0%) |
| 6 to 11 Years | 0 (0.0%) | 0 (0.0%) |
| 12 to 14 Years | 0 (0.0%) | 0 (0.0%) |
| 15 Years | 0 (0.0%) | 0 (0.0%) |
| 16 and 17 Years | 0 (0.0%) | 13 (65.0%) |
| 18 to 24 Years | 0 (0.0%) | 0 (0.0%) |
| 25 to 34 Years | 27 (7.6%) | 0 (0.0%) |
| 35 to 44 Years | 0 (0.0%) | 0 (0.0%) |
| 45 to 54 Years | 14 (4.7%) | 0 (0.0%) |
| 55 to 64 Years | 0 (0.0%) | 14 (5.6%) |
| 65 to 74 Years | 0 (0.0%) | 22 (11.8%) |
| 75 Years and over | 12 (4.9%) | 11 (52.4%) |
| Total | 53 (1.8%) | 60 (2.4%) |
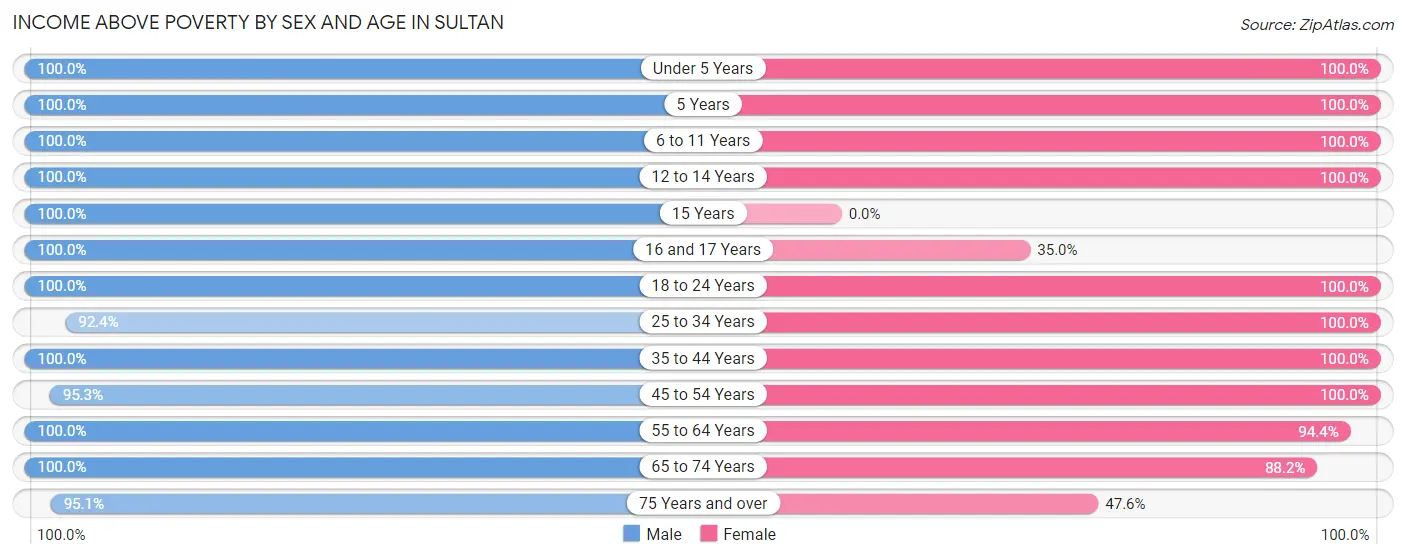
Income Above Poverty by Sex and Age in Sultan
According to the poverty statistics in Sultan, males aged under 5 years and females aged under 5 years are the age groups that are most secure financially, with 100.0% of males and 100.0% of females in these age groups living above the poverty line.
| Age Bracket | Male | Female |
| Under 5 Years | 79 (100.0%) | 205 (100.0%) |
| 5 Years | 76 (100.0%) | 19 (100.0%) |
| 6 to 11 Years | 134 (100.0%) | 156 (100.0%) |
| 12 to 14 Years | 77 (100.0%) | 240 (100.0%) |
| 15 Years | 18 (100.0%) | 0 (0.0%) |
| 16 and 17 Years | 235 (100.0%) | 7 (35.0%) |
| 18 to 24 Years | 296 (100.0%) | 146 (100.0%) |
| 25 to 34 Years | 330 (92.4%) | 403 (100.0%) |
| 35 to 44 Years | 630 (100.0%) | 610 (100.0%) |
| 45 to 54 Years | 285 (95.3%) | 300 (100.0%) |
| 55 to 64 Years | 256 (100.0%) | 237 (94.4%) |
| 65 to 74 Years | 185 (100.0%) | 165 (88.2%) |
| 75 Years and over | 235 (95.1%) | 10 (47.6%) |
| Total | 2,836 (98.2%) | 2,498 (97.7%) |
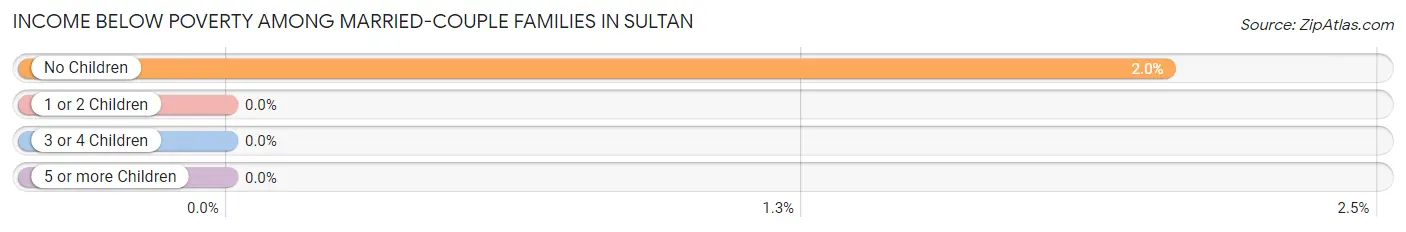
Income Below Poverty Among Married-Couple Families in Sultan
The poverty statistics for married-couple families in Sultan show that 1.2% or 11 of the total 939 families live below the poverty line. Families with no children have the highest poverty rate of 2.0%, comprising of 11 families. On the other hand, families with 1 or 2 children have the lowest poverty rate of 0.0%, which includes 0 families.
| Children | Above Poverty | Below Poverty |
| No Children | 527 (98.0%) | 11 (2.0%) |
| 1 or 2 Children | 316 (100.0%) | 0 (0.0%) |
| 3 or 4 Children | 85 (100.0%) | 0 (0.0%) |
| 5 or more Children | 0 (0.0%) | 0 (0.0%) |
| Total | 928 (98.8%) | 11 (1.2%) |
Income Below Poverty Among Single-Parent Households in Sultan
| Children | Single Father | Single Mother |
| No Children | 0 (0.0%) | 0 (0.0%) |
| 1 or 2 Children | 0 (0.0%) | 0 (0.0%) |
| 3 or 4 Children | 0 (0.0%) | 0 (0.0%) |
| 5 or more Children | 0 (0.0%) | 0 (0.0%) |
| Total | 0 (0.0%) | 0 (0.0%) |
Income Below Poverty Among Married-Couple vs Single-Parent Households in Sultan
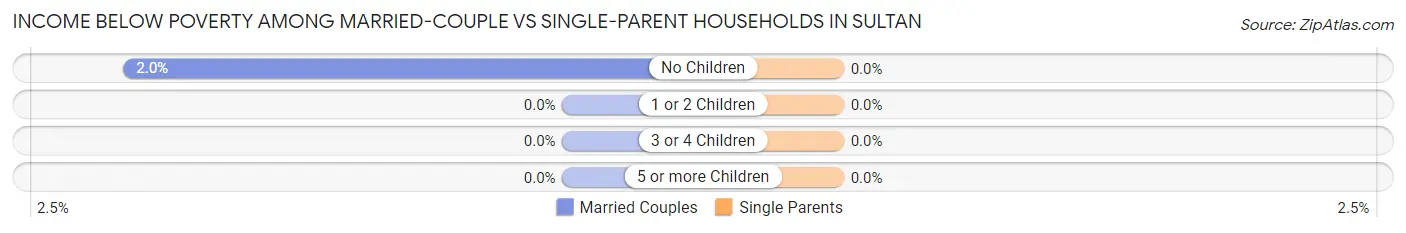
| Children | Married-Couple Families | Single-Parent Households |
| No Children | 11 (2.0%) | 0 (0.0%) |
| 1 or 2 Children | 0 (0.0%) | 0 (0.0%) |
| 3 or 4 Children | 0 (0.0%) | 0 (0.0%) |
| 5 or more Children | 0 (0.0%) | 0 (0.0%) |
| Total | 11 (1.2%) | 0 (0.0%) |
Race in Sultan
The most populous races in Sultan are White / Caucasian (4,219 | 77.2%), Hispanic or Latino (1,247 | 22.8%), and Two or more Races (827 | 15.1%).
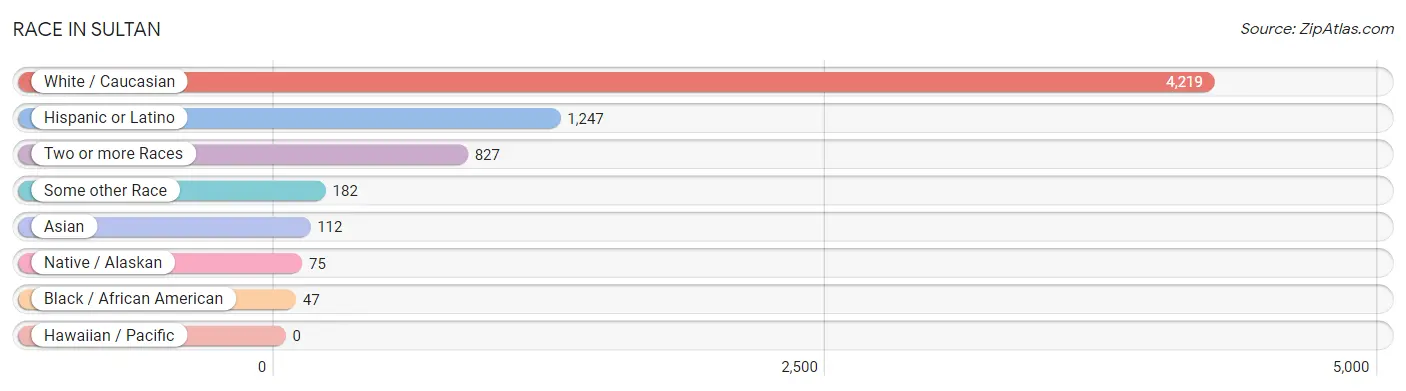
| Race | # Population | % Population |
| Asian | 112 | 2.1% |
| Black / African American | 47 | 0.9% |
| Hawaiian / Pacific | 0 | 0.0% |
| Hispanic or Latino | 1,247 | 22.8% |
| Native / Alaskan | 75 | 1.4% |
| White / Caucasian | 4,219 | 77.2% |
| Two or more Races | 827 | 15.1% |
| Some other Race | 182 | 3.3% |
| Total | 5,462 | 100.0% |
Ancestry in Sultan
The most populous ancestries reported in Sultan are German (902 | 16.5%), Mexican (766 | 14.0%), English (669 | 12.2%), Irish (635 | 11.6%), and Central American (464 | 8.5%), together accounting for 62.9% of all Sultan residents.
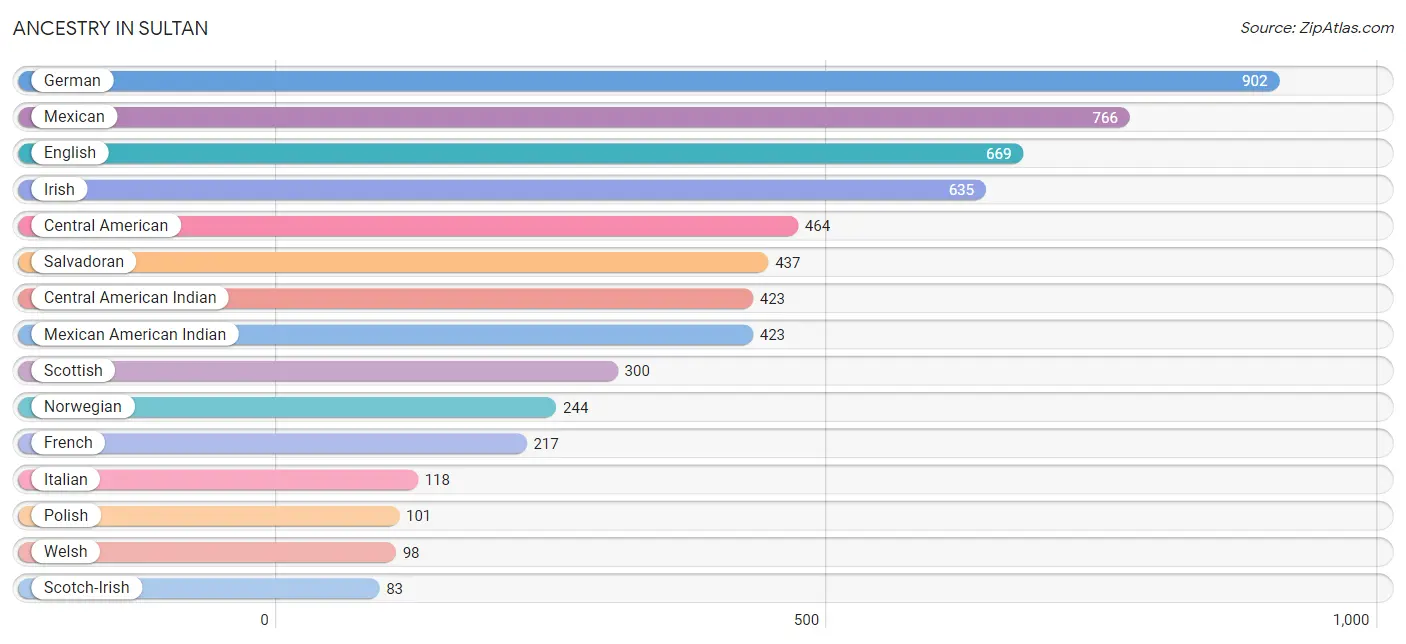
| Ancestry | # Population | % Population |
| American | 64 | 1.2% |
| Apache | 8 | 0.2% |
| British | 24 | 0.4% |
| Burmese | 49 | 0.9% |
| Canadian | 21 | 0.4% |
| Central American | 464 | 8.5% |
| Central American Indian | 423 | 7.7% |
| Cherokee | 28 | 0.5% |
| Chippewa | 78 | 1.4% |
| Colombian | 17 | 0.3% |
| Czech | 11 | 0.2% |
| Danish | 17 | 0.3% |
| Dutch | 78 | 1.4% |
| Eastern European | 6 | 0.1% |
| English | 669 | 12.2% |
| European | 37 | 0.7% |
| Finnish | 38 | 0.7% |
| French | 217 | 4.0% |
| French American Indian | 24 | 0.4% |
| German | 902 | 16.5% |
| Honduran | 27 | 0.5% |
| Hungarian | 13 | 0.2% |
| Indian (Asian) | 26 | 0.5% |
| Irish | 635 | 11.6% |
| Iroquois | 21 | 0.4% |
| Italian | 118 | 2.2% |
| Japanese | 51 | 0.9% |
| Korean | 38 | 0.7% |
| Mexican | 766 | 14.0% |
| Mexican American Indian | 423 | 7.7% |
| Native Hawaiian | 49 | 0.9% |
| Nigerian | 39 | 0.7% |
| Norwegian | 244 | 4.5% |
| Pakistani | 26 | 0.5% |
| Polish | 101 | 1.8% |
| Portuguese | 14 | 0.3% |
| Romanian | 68 | 1.2% |
| Russian | 22 | 0.4% |
| Salvadoran | 437 | 8.0% |
| Scandinavian | 75 | 1.4% |
| Scotch-Irish | 83 | 1.5% |
| Scottish | 300 | 5.5% |
| Sioux | 54 | 1.0% |
| South American | 17 | 0.3% |
| Subsaharan African | 39 | 0.7% |
| Swedish | 10 | 0.2% |
| Thai | 61 | 1.1% |
| Ukrainian | 10 | 0.2% |
| Welsh | 98 | 1.8% | View All 49 Rows |
Immigrants in Sultan
The most numerous immigrant groups reported in Sultan came from Latin America (848 | 15.5%), Central America (772 | 14.1%), El Salvador (437 | 8.0%), Mexico (308 | 5.6%), and Europe (129 | 2.4%), together accounting for 45.7% of all Sultan residents.
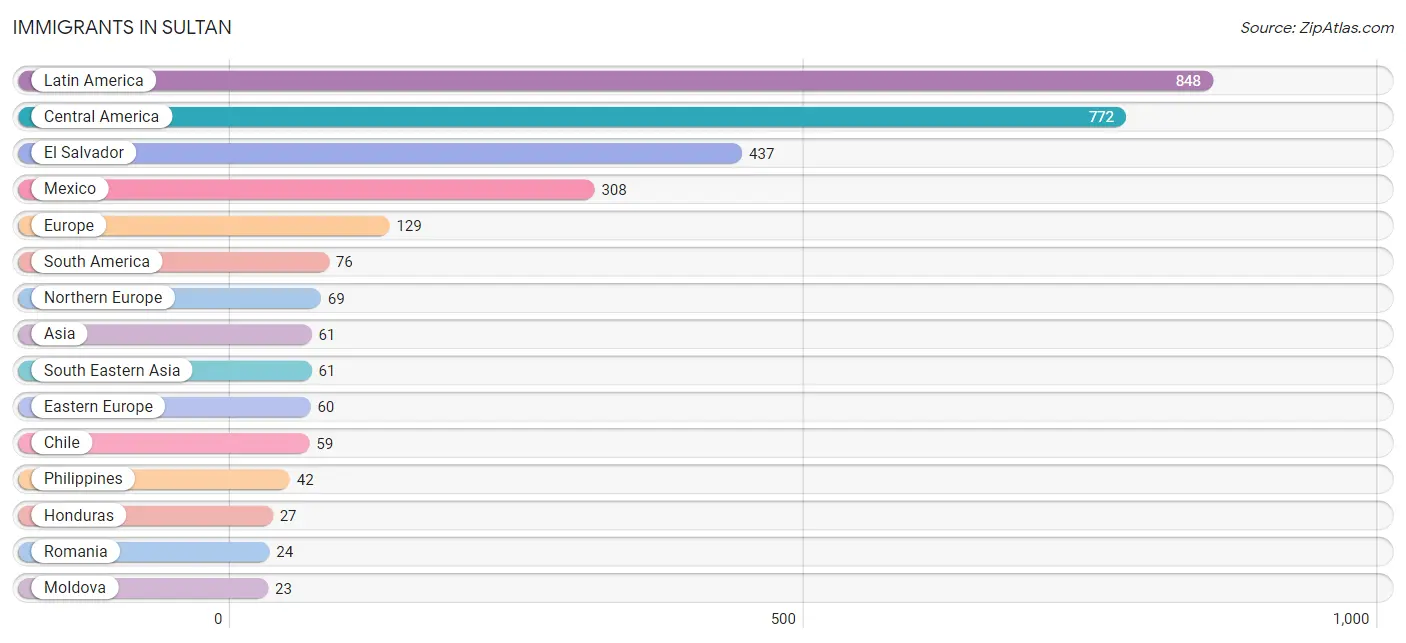
| Immigration Origin | # Population | % Population |
| Asia | 61 | 1.1% |
| Cambodia | 19 | 0.4% |
| Central America | 772 | 14.1% |
| Chile | 59 | 1.1% |
| Colombia | 17 | 0.3% |
| Eastern Europe | 60 | 1.1% |
| El Salvador | 437 | 8.0% |
| England | 14 | 0.3% |
| Europe | 129 | 2.4% |
| Honduras | 27 | 0.5% |
| Hungary | 13 | 0.2% |
| Latin America | 848 | 15.5% |
| Mexico | 308 | 5.6% |
| Moldova | 23 | 0.4% |
| Northern Europe | 69 | 1.3% |
| Philippines | 42 | 0.8% |
| Romania | 24 | 0.4% |
| South America | 76 | 1.4% |
| South Eastern Asia | 61 | 1.1% | View All 19 Rows |
Sex and Age in Sultan
Sex and Age in Sultan
The most populous age groups in Sultan are 15 to 19 Years (354 | 12.2%) for men and 35 to 39 Years (438 | 17.0%) for women.
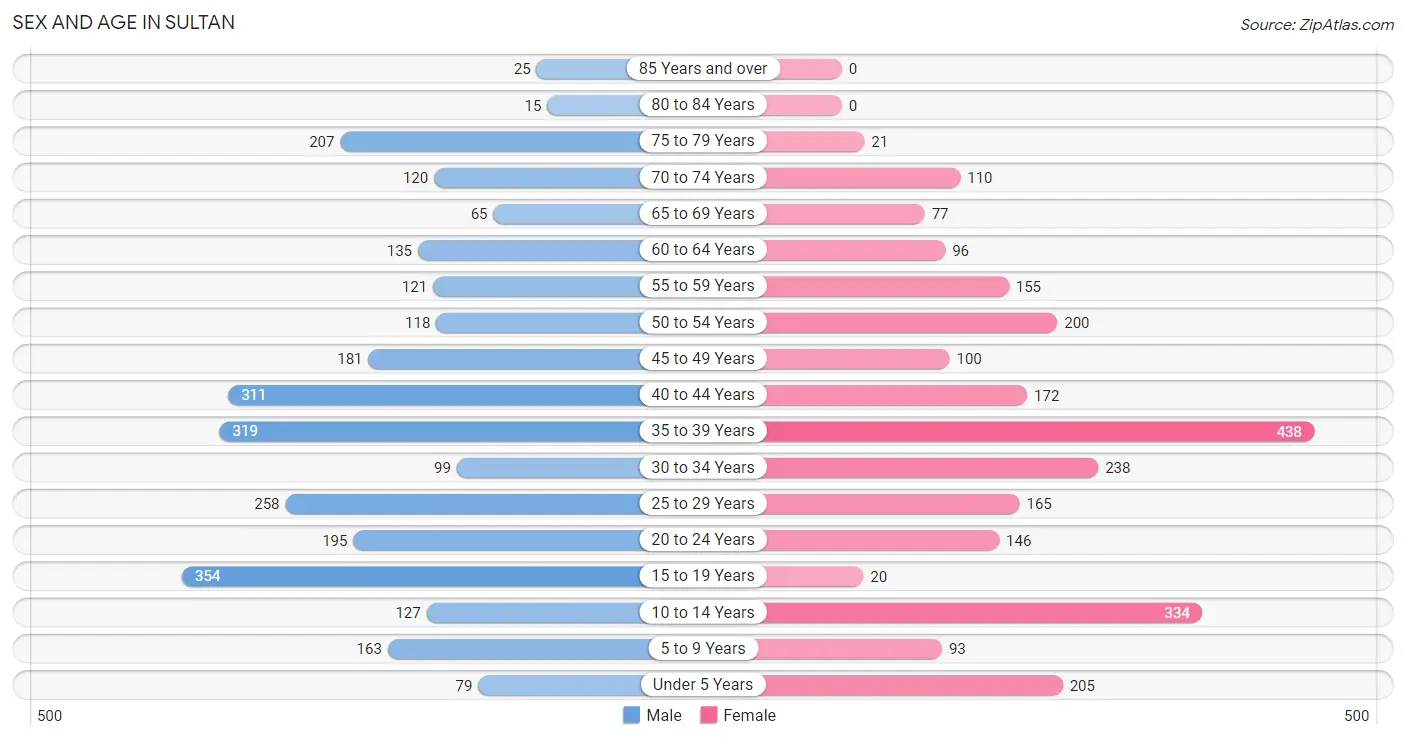
| Age Bracket | Male | Female |
| Under 5 Years | 79 (2.7%) | 205 (8.0%) |
| 5 to 9 Years | 163 (5.6%) | 93 (3.6%) |
| 10 to 14 Years | 127 (4.4%) | 334 (13.0%) |
| 15 to 19 Years | 354 (12.2%) | 20 (0.8%) |
| 20 to 24 Years | 195 (6.7%) | 146 (5.7%) |
| 25 to 29 Years | 258 (8.9%) | 165 (6.4%) |
| 30 to 34 Years | 99 (3.4%) | 238 (9.3%) |
| 35 to 39 Years | 319 (11.0%) | 438 (17.0%) |
| 40 to 44 Years | 311 (10.7%) | 172 (6.7%) |
| 45 to 49 Years | 181 (6.3%) | 100 (3.9%) |
| 50 to 54 Years | 118 (4.1%) | 200 (7.8%) |
| 55 to 59 Years | 121 (4.2%) | 155 (6.0%) |
| 60 to 64 Years | 135 (4.7%) | 96 (3.7%) |
| 65 to 69 Years | 65 (2.2%) | 77 (3.0%) |
| 70 to 74 Years | 120 (4.2%) | 110 (4.3%) |
| 75 to 79 Years | 207 (7.2%) | 21 (0.8%) |
| 80 to 84 Years | 15 (0.5%) | 0 (0.0%) |
| 85 Years and over | 25 (0.9%) | 0 (0.0%) |
| Total | 2,892 (100.0%) | 2,570 (100.0%) |
Families and Households in Sultan
Median Family Size in Sultan
The median family size in Sultan is 3.26 persons per family, with single male/father families (185 | 14.3%) accounting for the largest median family size of 3.65 persons per family. On the other hand, single female/mother families (171 | 13.2%) represent the smallest median family size with 2.63 persons per family.
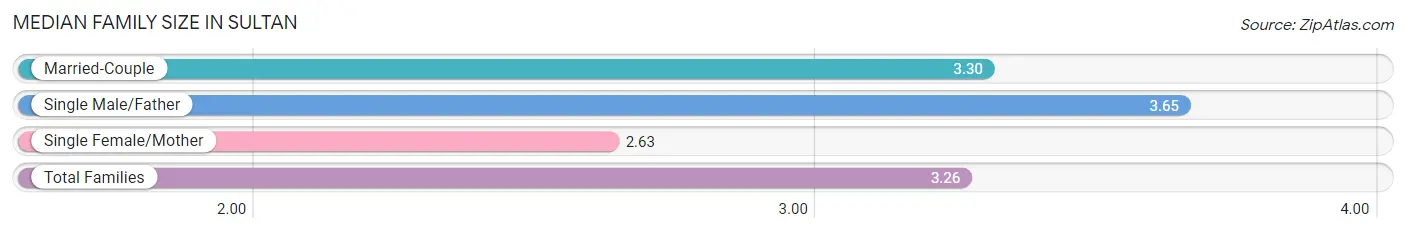
| Family Type | # Families | Family Size |
| Married-Couple | 939 (72.5%) | 3.30 |
| Single Male/Father | 185 (14.3%) | 3.65 |
| Single Female/Mother | 171 (13.2%) | 2.63 |
| Total Families | 1,295 (100.0%) | 3.26 |
Median Household Size in Sultan
The median household size in Sultan is 2.64 persons per household, with single male/father households (185 | 8.9%) accounting for the largest median household size of 3.65 persons per household. non-family households (776 | 37.5%) represent the smallest median household size with 1.40 persons per household.
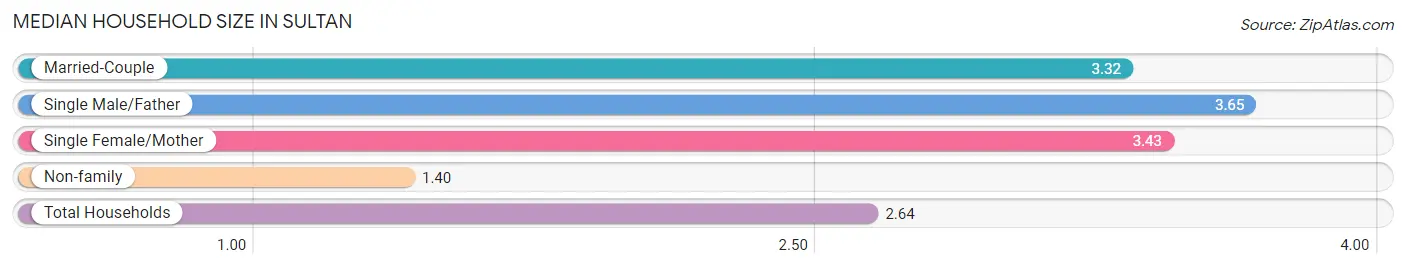
| Household Type | # Households | Household Size |
| Married-Couple | 939 (45.3%) | 3.32 |
| Single Male/Father | 185 (8.9%) | 3.65 |
| Single Female/Mother | 171 (8.3%) | 3.43 |
| Non-family | 776 (37.5%) | 1.40 |
| Total Households | 2,071 (100.0%) | 2.64 |
Household Size by Marriage Status in Sultan
Out of a total of 2,071 households in Sultan, 1,295 (62.5%) are family households, while 776 (37.5%) are nonfamily households. The most numerous type of family households are 2-person households, comprising 486, and the most common type of nonfamily households are 1-person households, comprising 590.
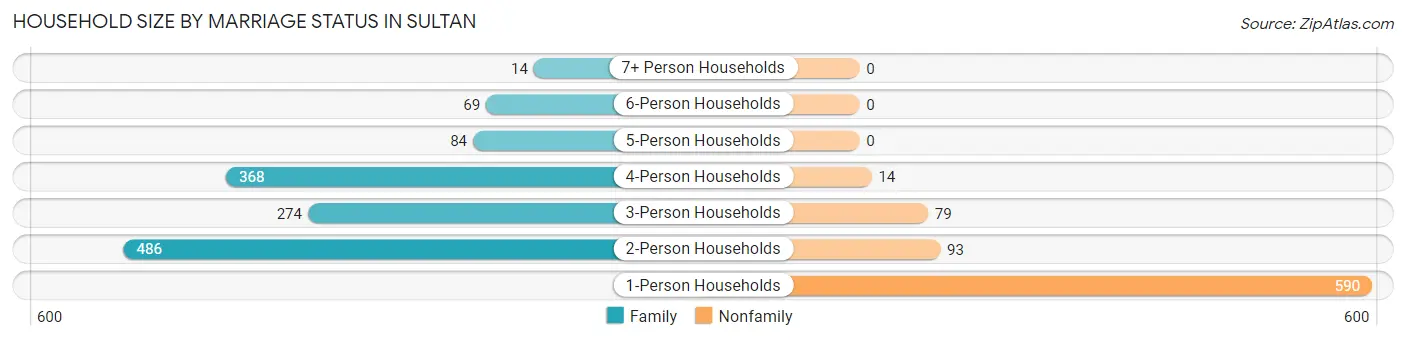
| Household Size | Family Households | Nonfamily Households |
| 1-Person Households | - | 590 (28.5%) |
| 2-Person Households | 486 (23.5%) | 93 (4.5%) |
| 3-Person Households | 274 (13.2%) | 79 (3.8%) |
| 4-Person Households | 368 (17.8%) | 14 (0.7%) |
| 5-Person Households | 84 (4.1%) | 0 (0.0%) |
| 6-Person Households | 69 (3.3%) | 0 (0.0%) |
| 7+ Person Households | 14 (0.7%) | 0 (0.0%) |
| Total | 1,295 (62.5%) | 776 (37.5%) |
Female Fertility in Sultan
Fertility by Age in Sultan
Average fertility rate in Sultan is 55.0 births per 1,000 women. Women in the age bracket of 20 to 34 years have the highest fertility rate with 78.0 births per 1,000 women. Women in the age bracket of 20 to 34 years acount for 58.9% of all women with births.
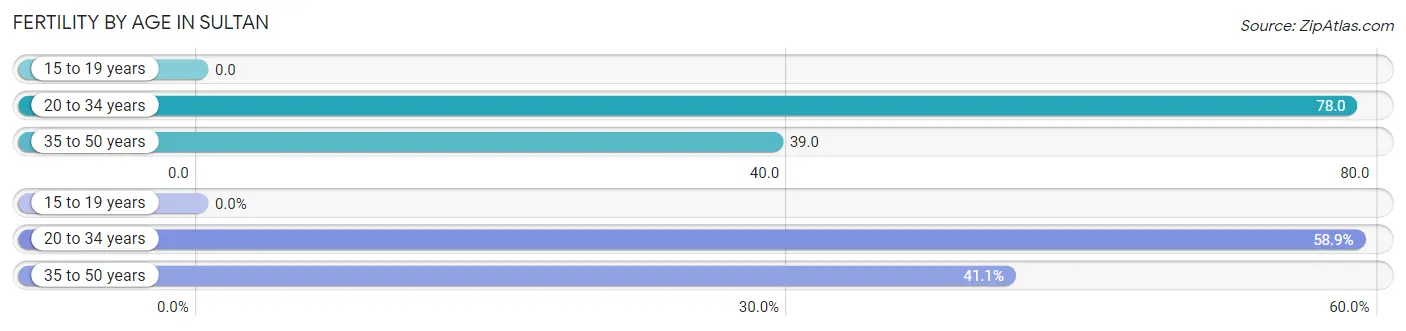
| Age Bracket | Women with Births | Births / 1,000 Women |
| 15 to 19 years | 0 (0.0%) | 0.0 |
| 20 to 34 years | 43 (58.9%) | 78.0 |
| 35 to 50 years | 30 (41.1%) | 39.0 |
| Total | 73 (100.0%) | 55.0 |
Fertility by Age by Marriage Status in Sultan
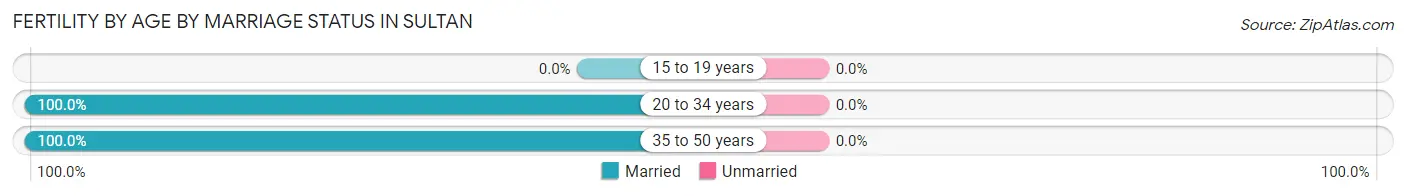
| Age Bracket | Married | Unmarried |
| 15 to 19 years | 0 (0.0%) | 0 (0.0%) |
| 20 to 34 years | 43 (100.0%) | 0 (0.0%) |
| 35 to 50 years | 30 (100.0%) | 0 (0.0%) |
| Total | 73 (100.0%) | 0 (0.0%) |
Fertility by Education in Sultan
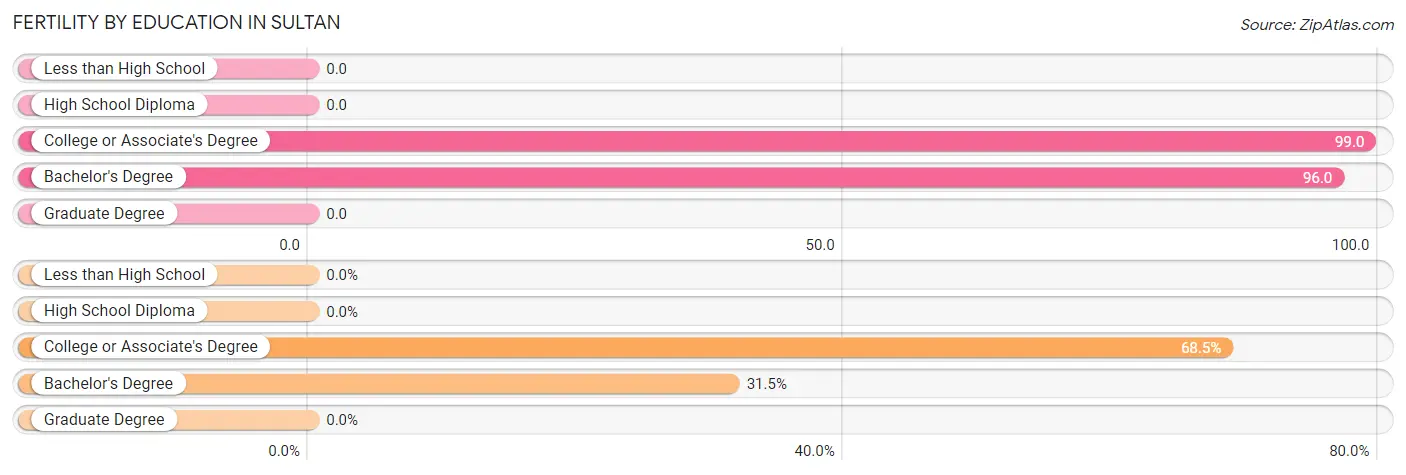
| Educational Attainment | Women with Births | Births / 1,000 Women |
| Less than High School | 0 (0.0%) | 0.0 |
| High School Diploma | 0 (0.0%) | 0.0 |
| College or Associate's Degree | 50 (68.5%) | 99.0 |
| Bachelor's Degree | 23 (31.5%) | 96.0 |
| Graduate Degree | 0 (0.0%) | 0.0 |
| Total | 73 (100.0%) | 55.0 |
Fertility by Education by Marriage Status in Sultan
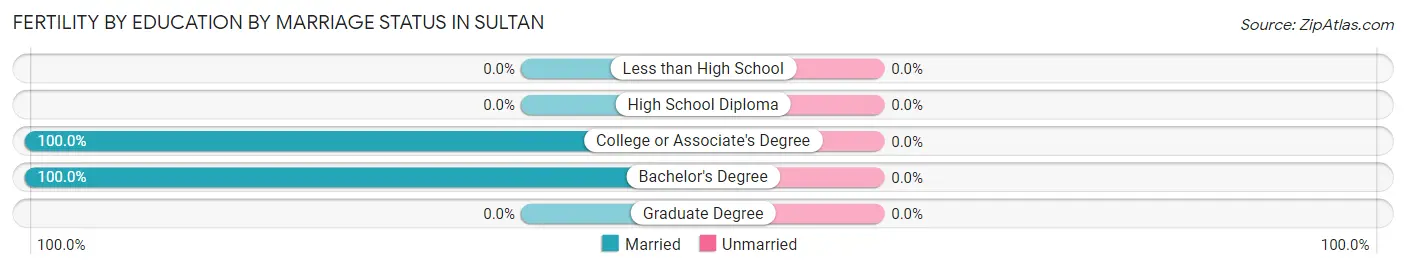
| Educational Attainment | Married | Unmarried |
| Less than High School | 0 (0.0%) | 0 (0.0%) |
| High School Diploma | 0 (0.0%) | 0 (0.0%) |
| College or Associate's Degree | 50 (100.0%) | 0 (0.0%) |
| Bachelor's Degree | 23 (100.0%) | 0 (0.0%) |
| Graduate Degree | 0 (0.0%) | 0 (0.0%) |
| Total | 73 (100.0%) | 0 (0.0%) |
Employment Characteristics in Sultan
Employment by Class of Employer in Sultan
Among the 2,866 employed individuals in Sultan, private company employees (1,994 | 69.6%), local government employees (280 | 9.8%), and self-employed (incorporated) (180 | 6.3%) make up the most common classes of employment.
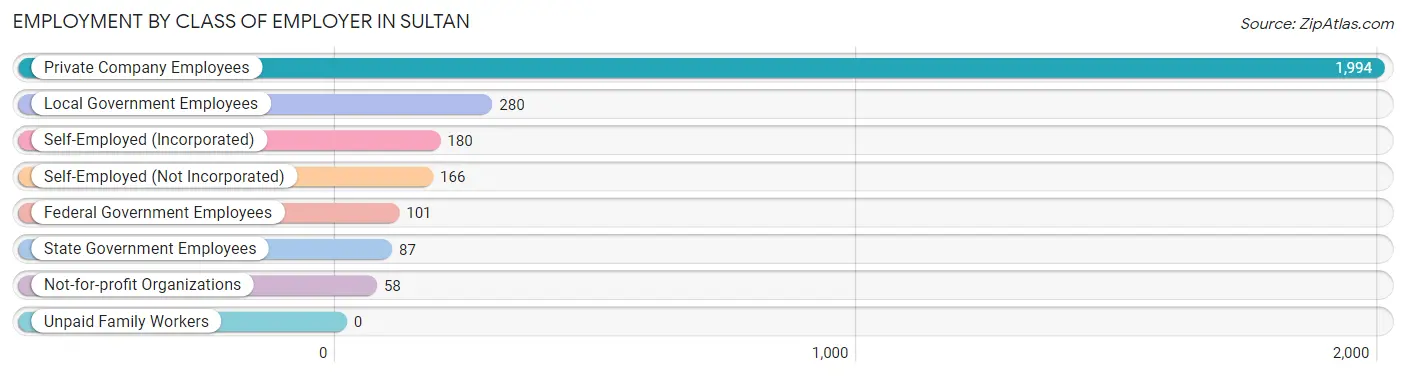
| Employer Class | # Employees | % Employees |
| Private Company Employees | 1,994 | 69.6% |
| Self-Employed (Incorporated) | 180 | 6.3% |
| Self-Employed (Not Incorporated) | 166 | 5.8% |
| Not-for-profit Organizations | 58 | 2.0% |
| Local Government Employees | 280 | 9.8% |
| State Government Employees | 87 | 3.0% |
| Federal Government Employees | 101 | 3.5% |
| Unpaid Family Workers | 0 | 0.0% |
| Total | 2,866 | 100.0% |
Employment Status by Age in Sultan
According to the labor force statistics for Sultan, out of the total population over 16 years of age (4,443), 69.4% or 3,083 individuals are in the labor force, with 5.4% or 166 of them unemployed. The age group with the highest labor force participation rate is 35 to 44 years, with 94.5% or 1,172 individuals in the labor force. Within the labor force, the 25 to 29 years age range has the highest percentage of unemployed individuals, with 21.2% or 70 of them being unemployed.
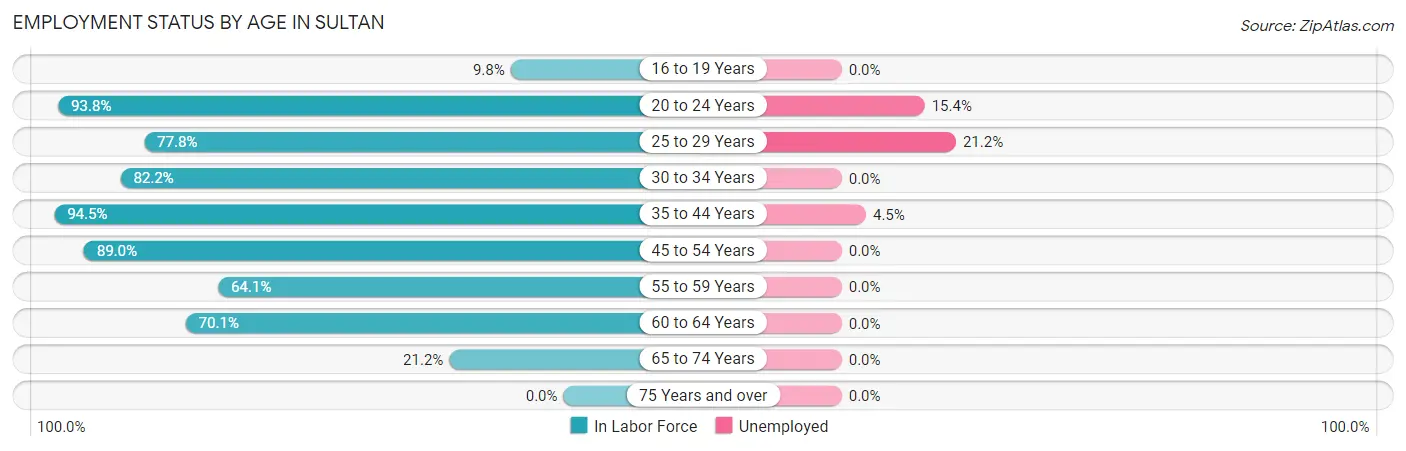
| Age Bracket | In Labor Force | Unemployed |
| 16 to 19 Years | 35 (9.8%) | 0 (0.0%) |
| 20 to 24 Years | 320 (93.8%) | 49 (15.4%) |
| 25 to 29 Years | 329 (77.8%) | 70 (21.2%) |
| 30 to 34 Years | 277 (82.2%) | 0 (0.0%) |
| 35 to 44 Years | 1,172 (94.5%) | 53 (4.5%) |
| 45 to 54 Years | 533 (89.0%) | 0 (0.0%) |
| 55 to 59 Years | 177 (64.1%) | 0 (0.0%) |
| 60 to 64 Years | 162 (70.1%) | 0 (0.0%) |
| 65 to 74 Years | 79 (21.2%) | 0 (0.0%) |
| 75 Years and over | 0 (0.0%) | 0 (0.0%) |
| Total | 3,083 (69.4%) | 166 (5.4%) |
Employment Status by Educational Attainment in Sultan
According to labor force statistics for Sultan, 85.3% of individuals (2,649) out of the total population between 25 and 64 years of age (3,106) are in the labor force, with 4.5% or 119 of them being unemployed. The group with the highest labor force participation rate are those with the educational attainment of bachelor's degree or higher, with 92.6% or 711 individuals in the labor force. Within the labor force, individuals with bachelor's degree or higher education have the highest percentage of unemployment, with 6.3% or 45 of them being unemployed.
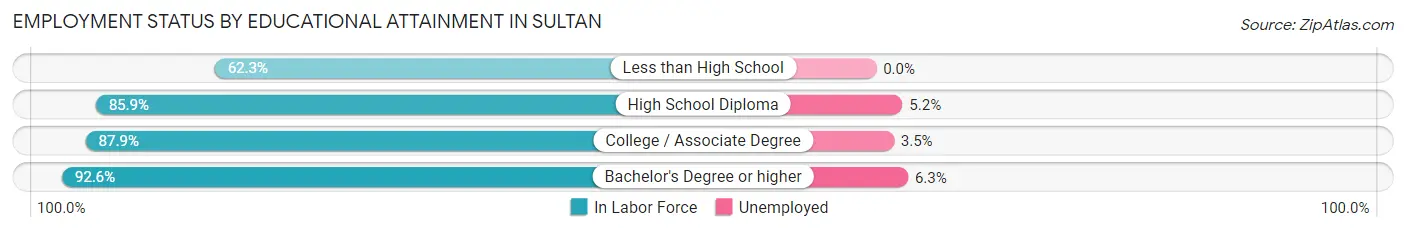
| Educational Attainment | In Labor Force | Unemployed |
| Less than High School | 233 (62.3%) | 0 (0.0%) |
| High School Diploma | 889 (85.9%) | 54 (5.2%) |
| College / Associate Degree | 817 (87.9%) | 33 (3.5%) |
| Bachelor's Degree or higher | 711 (92.6%) | 48 (6.3%) |
| Total | 2,649 (85.3%) | 140 (4.5%) |
Employment Occupations by Sex in Sultan
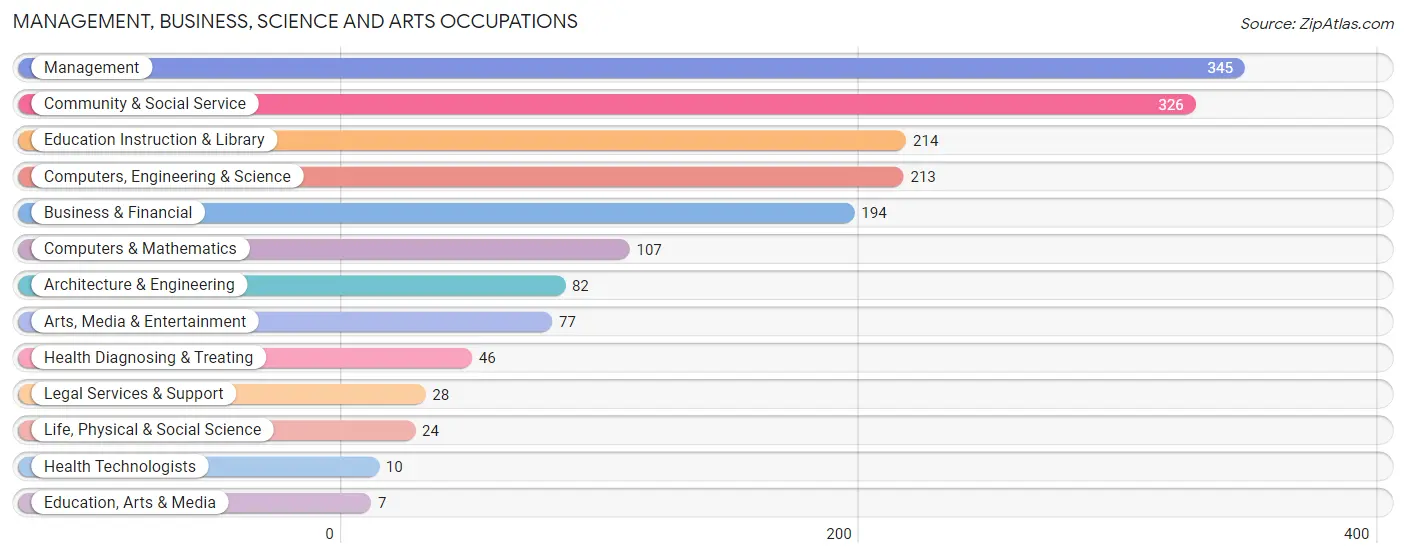
Management, Business, Science and Arts Occupations
The most common Management, Business, Science and Arts occupations in Sultan are Management (345 | 12.1%), Community & Social Service (326 | 11.4%), Education Instruction & Library (214 | 7.5%), Computers, Engineering & Science (213 | 7.4%), and Business & Financial (194 | 6.8%).
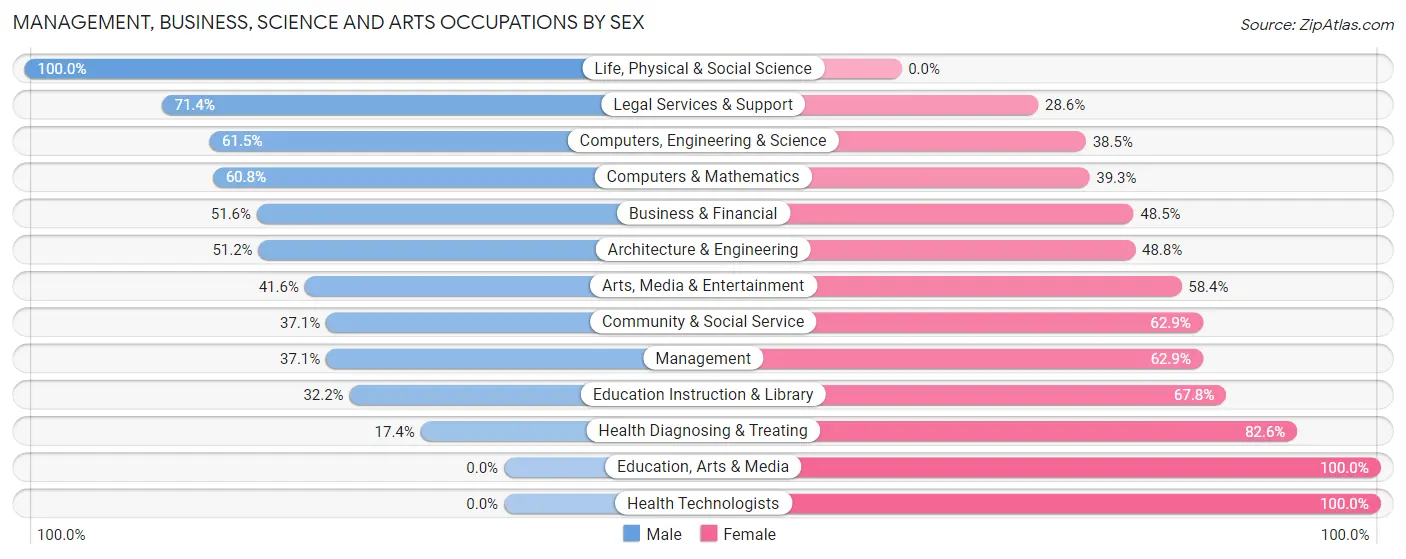
Management, Business, Science and Arts Occupations by Sex
Within the Management, Business, Science and Arts occupations in Sultan, the most male-oriented occupations are Life, Physical & Social Science (100.0%), Legal Services & Support (71.4%), and Computers, Engineering & Science (61.5%), while the most female-oriented occupations are Education, Arts & Media (100.0%), Health Technologists (100.0%), and Health Diagnosing & Treating (82.6%).
| Occupation | Male | Female |
| Management | 128 (37.1%) | 217 (62.9%) |
| Business & Financial | 100 (51.5%) | 94 (48.4%) |
| Computers, Engineering & Science | 131 (61.5%) | 82 (38.5%) |
| Computers & Mathematics | 65 (60.8%) | 42 (39.3%) |
| Architecture & Engineering | 42 (51.2%) | 40 (48.8%) |
| Life, Physical & Social Science | 24 (100.0%) | 0 (0.0%) |
| Community & Social Service | 121 (37.1%) | 205 (62.9%) |
| Education, Arts & Media | 0 (0.0%) | 7 (100.0%) |
| Legal Services & Support | 20 (71.4%) | 8 (28.6%) |
| Education Instruction & Library | 69 (32.2%) | 145 (67.8%) |
| Arts, Media & Entertainment | 32 (41.6%) | 45 (58.4%) |
| Health Diagnosing & Treating | 8 (17.4%) | 38 (82.6%) |
| Health Technologists | 0 (0.0%) | 10 (100.0%) |
| Total (Category) | 488 (43.4%) | 636 (56.6%) |
| Total (Overall) | 1,456 (50.9%) | 1,404 (49.1%) |
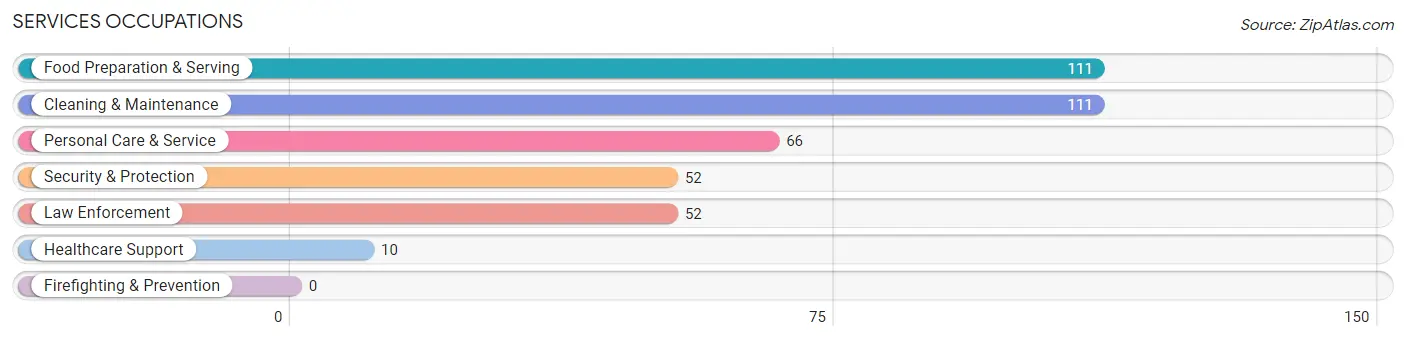
Services Occupations
The most common Services occupations in Sultan are Food Preparation & Serving (111 | 3.9%), Cleaning & Maintenance (111 | 3.9%), Personal Care & Service (66 | 2.3%), Security & Protection (52 | 1.8%), and Law Enforcement (52 | 1.8%).
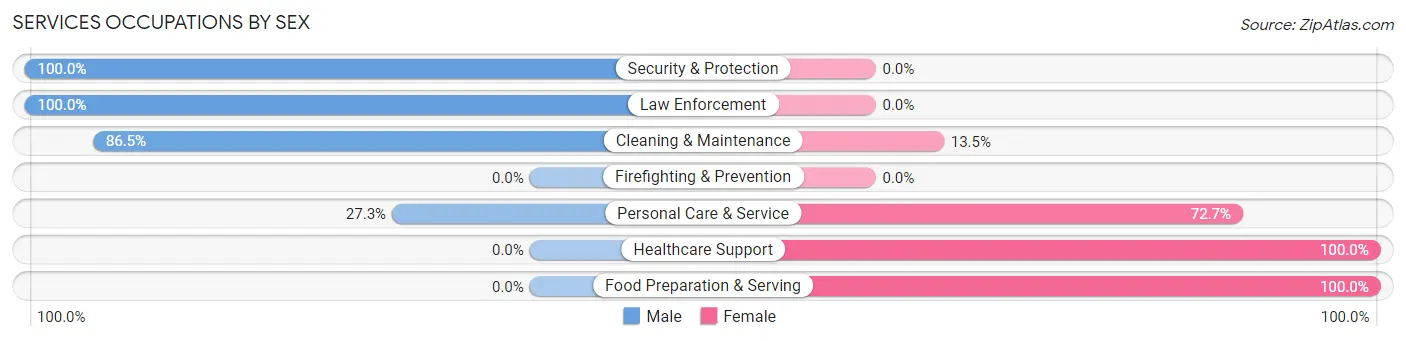
Services Occupations by Sex
Within the Services occupations in Sultan, the most male-oriented occupations are Security & Protection (100.0%), Law Enforcement (100.0%), and Cleaning & Maintenance (86.5%), while the most female-oriented occupations are Healthcare Support (100.0%), Food Preparation & Serving (100.0%), and Personal Care & Service (72.7%).
| Occupation | Male | Female |
| Healthcare Support | 0 (0.0%) | 10 (100.0%) |
| Security & Protection | 52 (100.0%) | 0 (0.0%) |
| Firefighting & Prevention | 0 (0.0%) | 0 (0.0%) |
| Law Enforcement | 52 (100.0%) | 0 (0.0%) |
| Food Preparation & Serving | 0 (0.0%) | 111 (100.0%) |
| Cleaning & Maintenance | 96 (86.5%) | 15 (13.5%) |
| Personal Care & Service | 18 (27.3%) | 48 (72.7%) |
| Total (Category) | 166 (47.4%) | 184 (52.6%) |
| Total (Overall) | 1,456 (50.9%) | 1,404 (49.1%) |
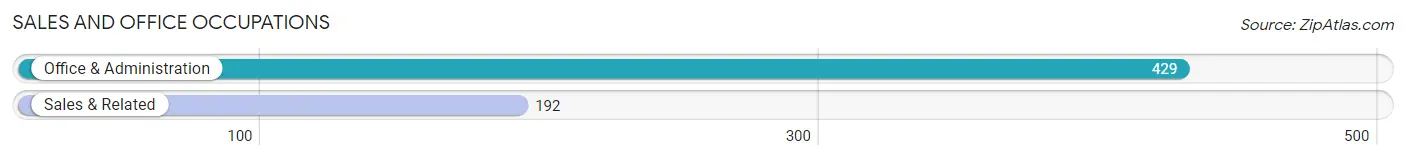
Sales and Office Occupations
The most common Sales and Office occupations in Sultan are Office & Administration (429 | 15.0%), and Sales & Related (192 | 6.7%).
Sales and Office Occupations by Sex
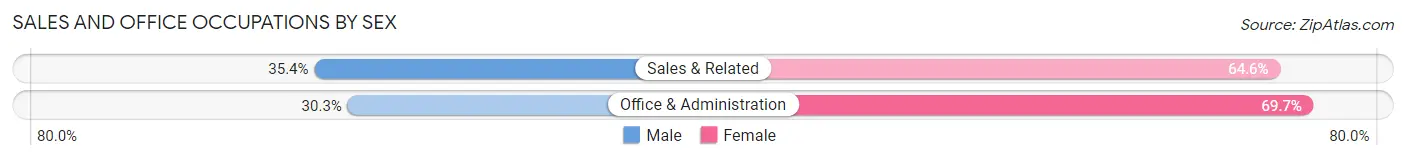
| Occupation | Male | Female |
| Sales & Related | 68 (35.4%) | 124 (64.6%) |
| Office & Administration | 130 (30.3%) | 299 (69.7%) |
| Total (Category) | 198 (31.9%) | 423 (68.1%) |
| Total (Overall) | 1,456 (50.9%) | 1,404 (49.1%) |
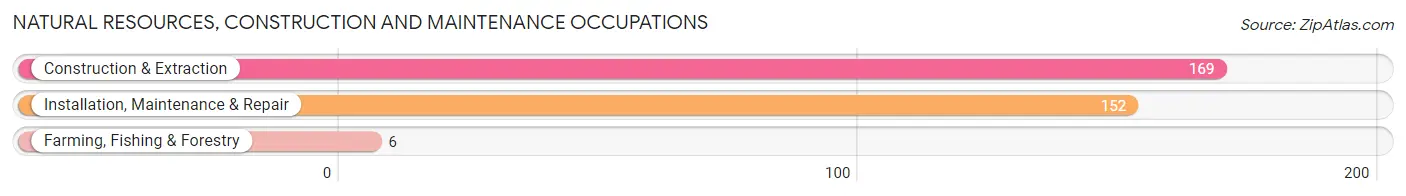
Natural Resources, Construction and Maintenance Occupations
The most common Natural Resources, Construction and Maintenance occupations in Sultan are Construction & Extraction (169 | 5.9%), Installation, Maintenance & Repair (152 | 5.3%), and Farming, Fishing & Forestry (6 | 0.2%).
Natural Resources, Construction and Maintenance Occupations by Sex
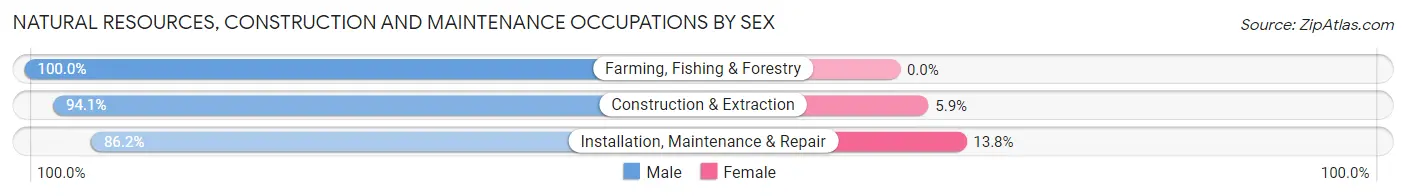
| Occupation | Male | Female |
| Farming, Fishing & Forestry | 6 (100.0%) | 0 (0.0%) |
| Construction & Extraction | 159 (94.1%) | 10 (5.9%) |
| Installation, Maintenance & Repair | 131 (86.2%) | 21 (13.8%) |
| Total (Category) | 296 (90.5%) | 31 (9.5%) |
| Total (Overall) | 1,456 (50.9%) | 1,404 (49.1%) |
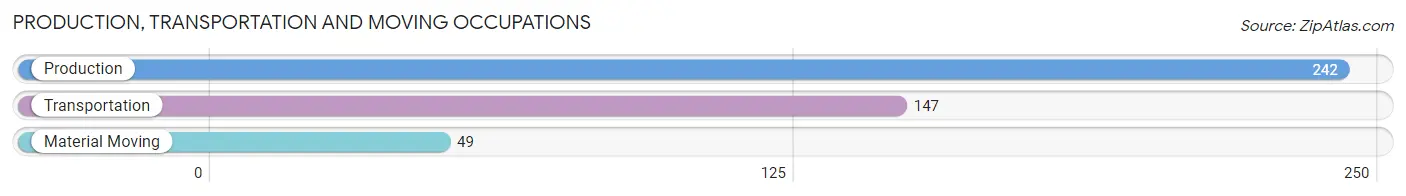
Production, Transportation and Moving Occupations
The most common Production, Transportation and Moving occupations in Sultan are Production (242 | 8.5%), Transportation (147 | 5.1%), and Material Moving (49 | 1.7%).
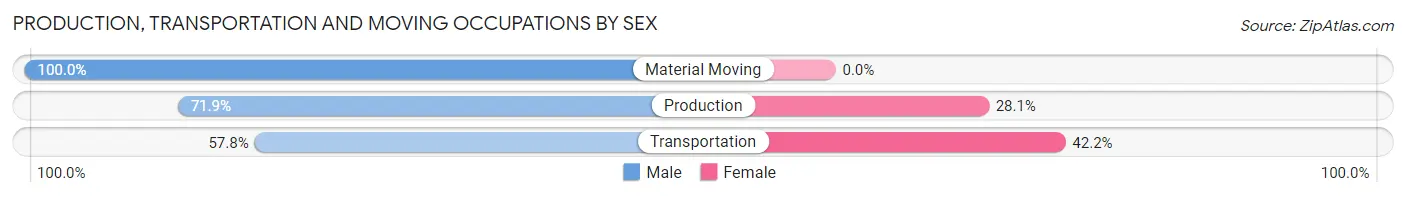
Production, Transportation and Moving Occupations by Sex
| Occupation | Male | Female |
| Production | 174 (71.9%) | 68 (28.1%) |
| Transportation | 85 (57.8%) | 62 (42.2%) |
| Material Moving | 49 (100.0%) | 0 (0.0%) |
| Total (Category) | 308 (70.3%) | 130 (29.7%) |
| Total (Overall) | 1,456 (50.9%) | 1,404 (49.1%) |
Employment Industries by Sex in Sultan
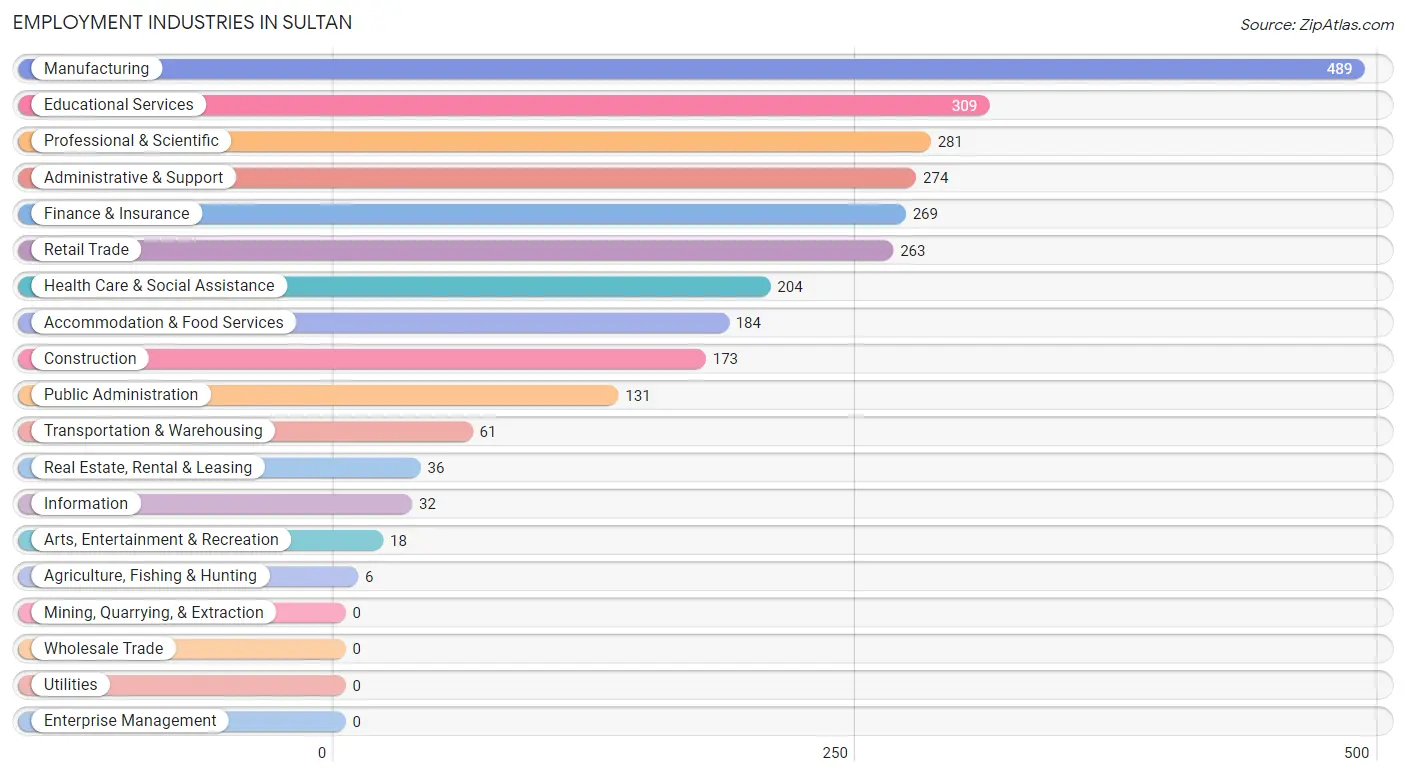
Employment Industries in Sultan
The major employment industries in Sultan include Manufacturing (489 | 17.1%), Educational Services (309 | 10.8%), Professional & Scientific (281 | 9.8%), Administrative & Support (274 | 9.6%), and Finance & Insurance (269 | 9.4%).
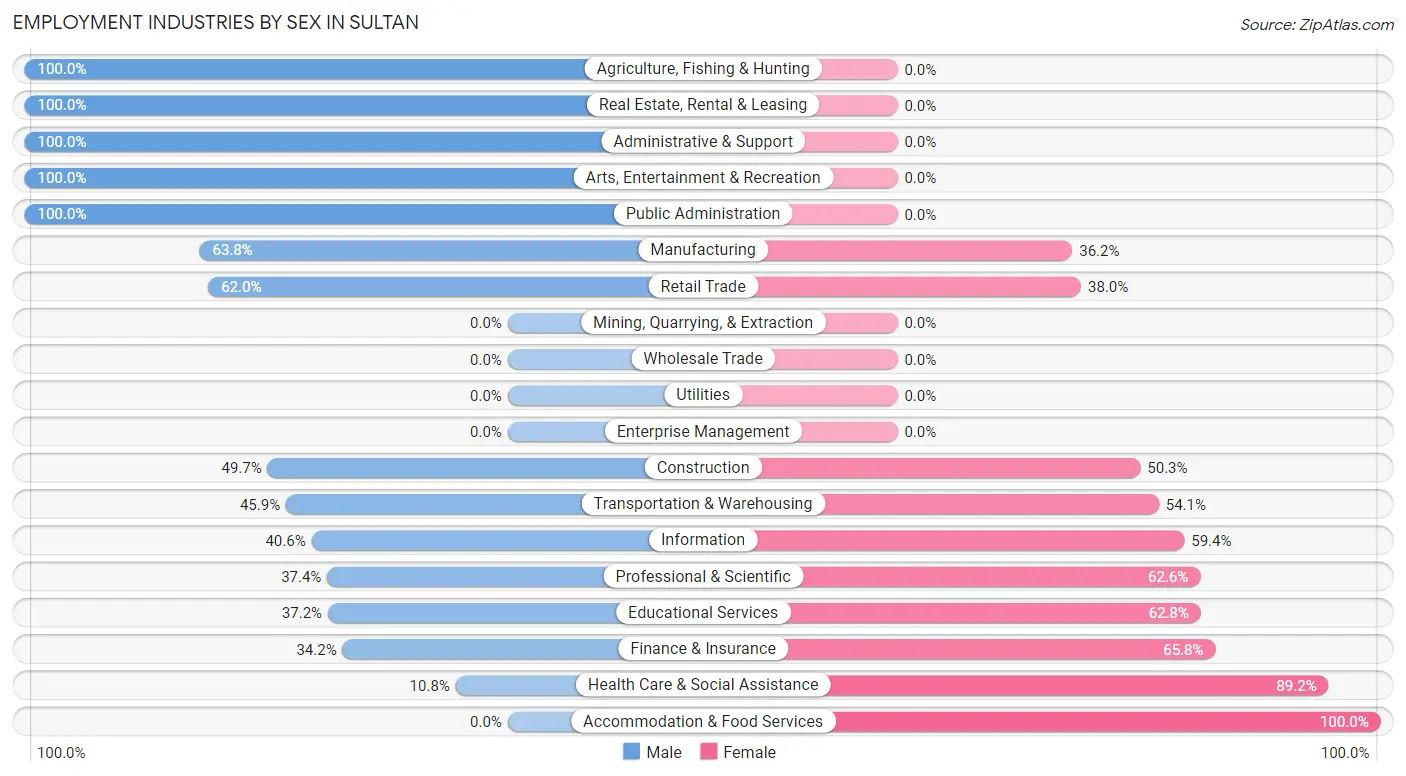
Employment Industries by Sex in Sultan
The Sultan industries that see more men than women are Agriculture, Fishing & Hunting (100.0%), Real Estate, Rental & Leasing (100.0%), and Administrative & Support (100.0%), whereas the industries that tend to have a higher number of women are Accommodation & Food Services (100.0%), Health Care & Social Assistance (89.2%), and Finance & Insurance (65.8%).
| Industry | Male | Female |
| Agriculture, Fishing & Hunting | 6 (100.0%) | 0 (0.0%) |
| Mining, Quarrying, & Extraction | 0 (0.0%) | 0 (0.0%) |
| Construction | 86 (49.7%) | 87 (50.3%) |
| Manufacturing | 312 (63.8%) | 177 (36.2%) |
| Wholesale Trade | 0 (0.0%) | 0 (0.0%) |
| Retail Trade | 163 (62.0%) | 100 (38.0%) |
| Transportation & Warehousing | 28 (45.9%) | 33 (54.1%) |
| Utilities | 0 (0.0%) | 0 (0.0%) |
| Information | 13 (40.6%) | 19 (59.4%) |
| Finance & Insurance | 92 (34.2%) | 177 (65.8%) |
| Real Estate, Rental & Leasing | 36 (100.0%) | 0 (0.0%) |
| Professional & Scientific | 105 (37.4%) | 176 (62.6%) |
| Enterprise Management | 0 (0.0%) | 0 (0.0%) |
| Administrative & Support | 274 (100.0%) | 0 (0.0%) |
| Educational Services | 115 (37.2%) | 194 (62.8%) |
| Health Care & Social Assistance | 22 (10.8%) | 182 (89.2%) |
| Arts, Entertainment & Recreation | 18 (100.0%) | 0 (0.0%) |
| Accommodation & Food Services | 0 (0.0%) | 184 (100.0%) |
| Public Administration | 131 (100.0%) | 0 (0.0%) |
| Total | 1,456 (50.9%) | 1,404 (49.1%) |
Education in Sultan
School Enrollment in Sultan
The most common levels of schooling among the 1,220 students in Sultan are middle school (409 | 33.5%), high school (339 | 27.8%), and elementary school (144 | 11.8%).
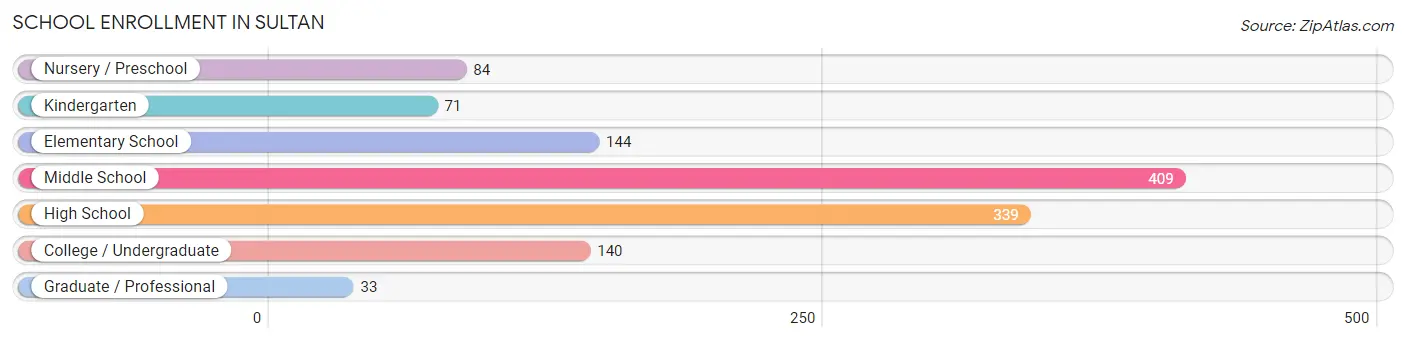
| School Level | # Students | % Students |
| Nursery / Preschool | 84 | 6.9% |
| Kindergarten | 71 | 5.8% |
| Elementary School | 144 | 11.8% |
| Middle School | 409 | 33.5% |
| High School | 339 | 27.8% |
| College / Undergraduate | 140 | 11.5% |
| Graduate / Professional | 33 | 2.7% |
| Total | 1,220 | 100.0% |
School Enrollment by Age by Funding Source in Sultan
Out of a total of 1,220 students who are enrolled in schools in Sultan, 101 (8.3%) attend a private institution, while the remaining 1,119 (91.7%) are enrolled in public schools. The age group of 3 to 4 year olds has the highest likelihood of being enrolled in private schools, with 40 (100.0% in the age bracket) enrolled. Conversely, the age group of 15 to 17 year olds has the lowest likelihood of being enrolled in a private school, with 273 (100.0% in the age bracket) attending a public institution.
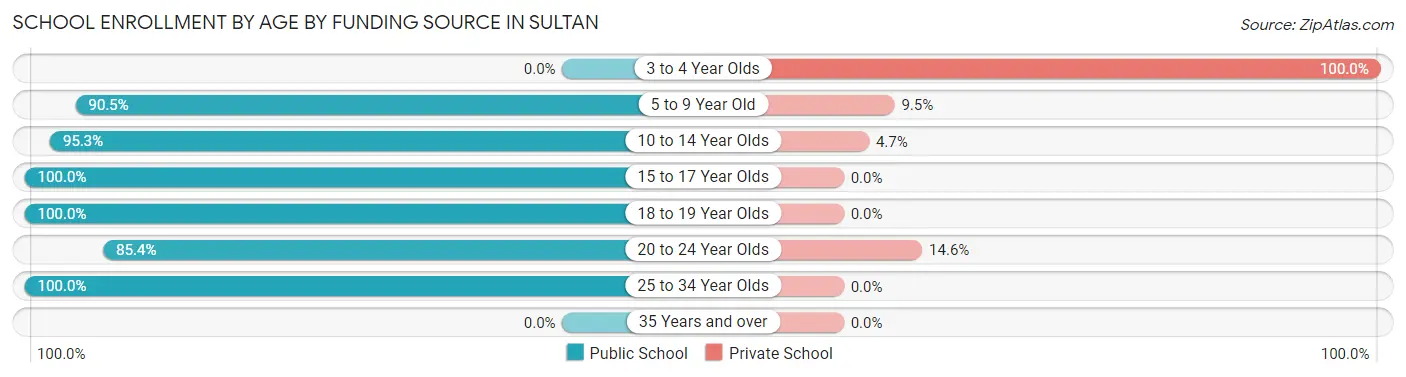
| Age Bracket | Public School | Private School |
| 3 to 4 Year Olds | 0 (0.0%) | 40 (100.0%) |
| 5 to 9 Year Old | 201 (90.5%) | 21 (9.5%) |
| 10 to 14 Year Olds | 425 (95.3%) | 21 (4.7%) |
| 15 to 17 Year Olds | 273 (100.0%) | 0 (0.0%) |
| 18 to 19 Year Olds | 66 (100.0%) | 0 (0.0%) |
| 20 to 24 Year Olds | 111 (85.4%) | 19 (14.6%) |
| 25 to 34 Year Olds | 43 (100.0%) | 0 (0.0%) |
| 35 Years and over | 0 (0.0%) | 0 (0.0%) |
| Total | 1,119 (91.7%) | 101 (8.3%) |
Educational Attainment by Field of Study in Sultan
Education (139 | 14.3%), science & technology (109 | 11.2%), communications (106 | 10.9%), business (103 | 10.6%), and liberal arts & history (91 | 9.3%) are the most common fields of study among 973 individuals in Sultan who have obtained a bachelor's degree or higher.
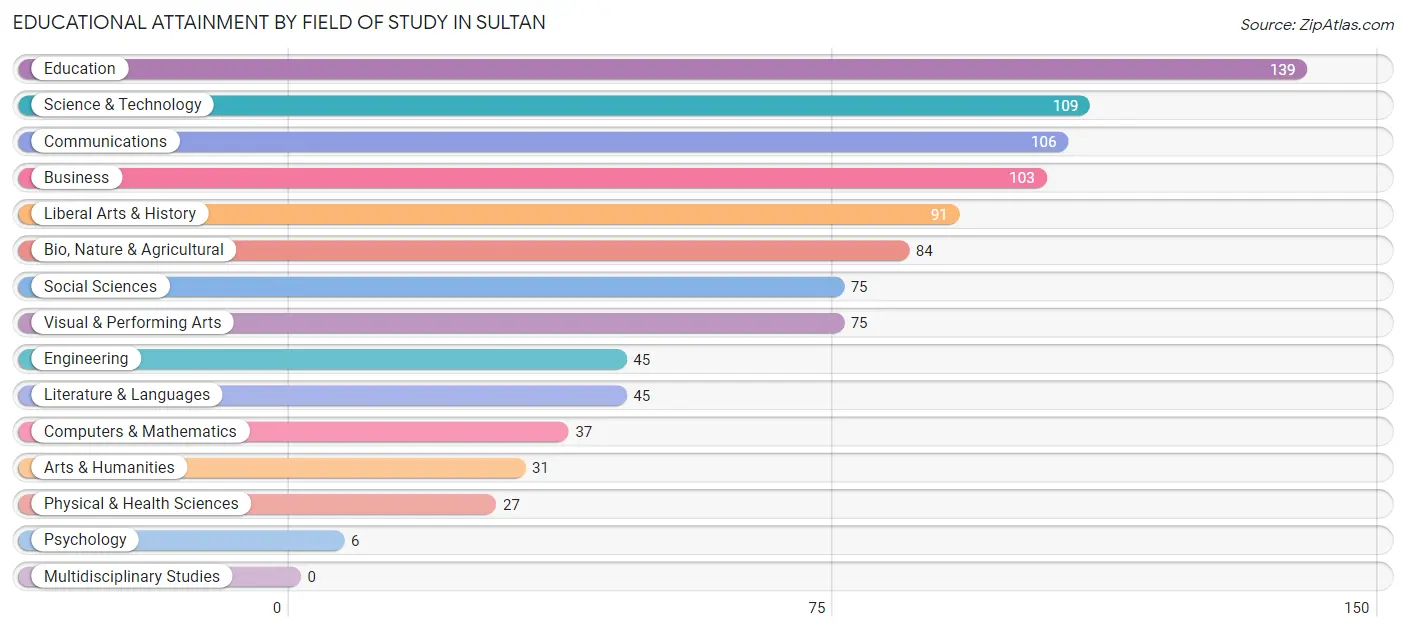
| Field of Study | # Graduates | % Graduates |
| Computers & Mathematics | 37 | 3.8% |
| Bio, Nature & Agricultural | 84 | 8.6% |
| Physical & Health Sciences | 27 | 2.8% |
| Psychology | 6 | 0.6% |
| Social Sciences | 75 | 7.7% |
| Engineering | 45 | 4.6% |
| Multidisciplinary Studies | 0 | 0.0% |
| Science & Technology | 109 | 11.2% |
| Business | 103 | 10.6% |
| Education | 139 | 14.3% |
| Literature & Languages | 45 | 4.6% |
| Liberal Arts & History | 91 | 9.3% |
| Visual & Performing Arts | 75 | 7.7% |
| Communications | 106 | 10.9% |
| Arts & Humanities | 31 | 3.2% |
| Total | 973 | 100.0% |
Transportation & Commute in Sultan
Vehicle Availability by Sex in Sultan
The most prevalent vehicle ownership categories in Sultan are males with 2 vehicles (661, accounting for 43.6%) and females with 2 vehicles (546, making up 49.0%).
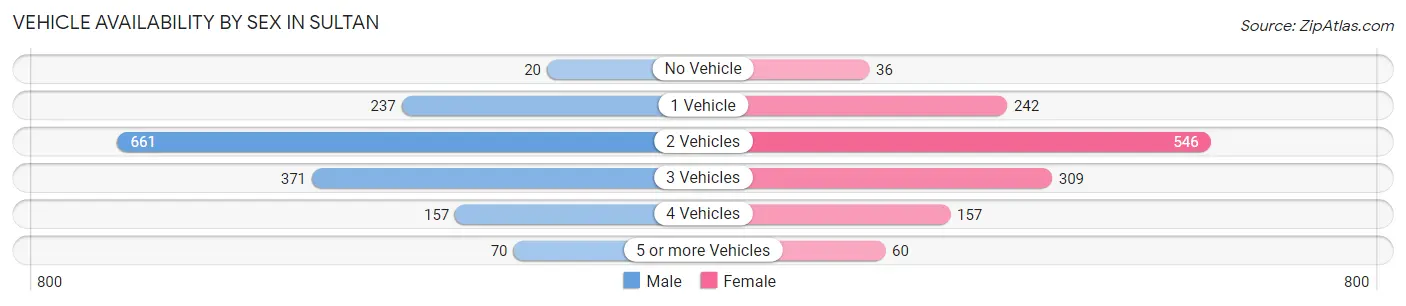
| Vehicles Available | Male | Female |
| No Vehicle | 20 (1.3%) | 36 (2.7%) |
| 1 Vehicle | 237 (15.6%) | 242 (17.9%) |
| 2 Vehicles | 661 (43.6%) | 546 (40.4%) |
| 3 Vehicles | 371 (24.5%) | 309 (22.9%) |
| 4 Vehicles | 157 (10.4%) | 157 (11.6%) |
| 5 or more Vehicles | 70 (4.6%) | 60 (4.4%) |
| Total | 1,516 (100.0%) | 1,350 (100.0%) |
Commute Time in Sultan
The most frequently occuring commute durations in Sultan are 45 to 59 minutes (623 commuters, 24.1%), 20 to 24 minutes (566 commuters, 21.9%), and 60 to 89 minutes (479 commuters, 18.6%).
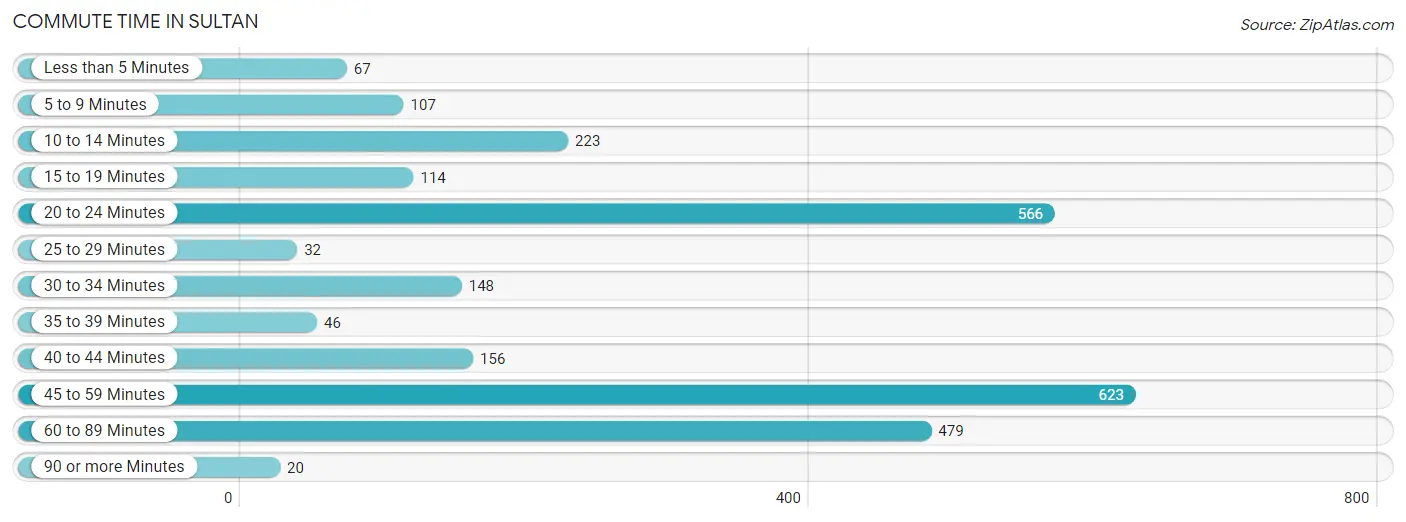
| Commute Time | # Commuters | % Commuters |
| Less than 5 Minutes | 67 | 2.6% |
| 5 to 9 Minutes | 107 | 4.2% |
| 10 to 14 Minutes | 223 | 8.6% |
| 15 to 19 Minutes | 114 | 4.4% |
| 20 to 24 Minutes | 566 | 21.9% |
| 25 to 29 Minutes | 32 | 1.2% |
| 30 to 34 Minutes | 148 | 5.7% |
| 35 to 39 Minutes | 46 | 1.8% |
| 40 to 44 Minutes | 156 | 6.0% |
| 45 to 59 Minutes | 623 | 24.1% |
| 60 to 89 Minutes | 479 | 18.6% |
| 90 or more Minutes | 20 | 0.8% |
Commute Time by Sex in Sultan
The most common commute times in Sultan are 60 to 89 minutes (369 commuters, 26.3%) for males and 45 to 59 minutes (308 commuters, 26.2%) for females.
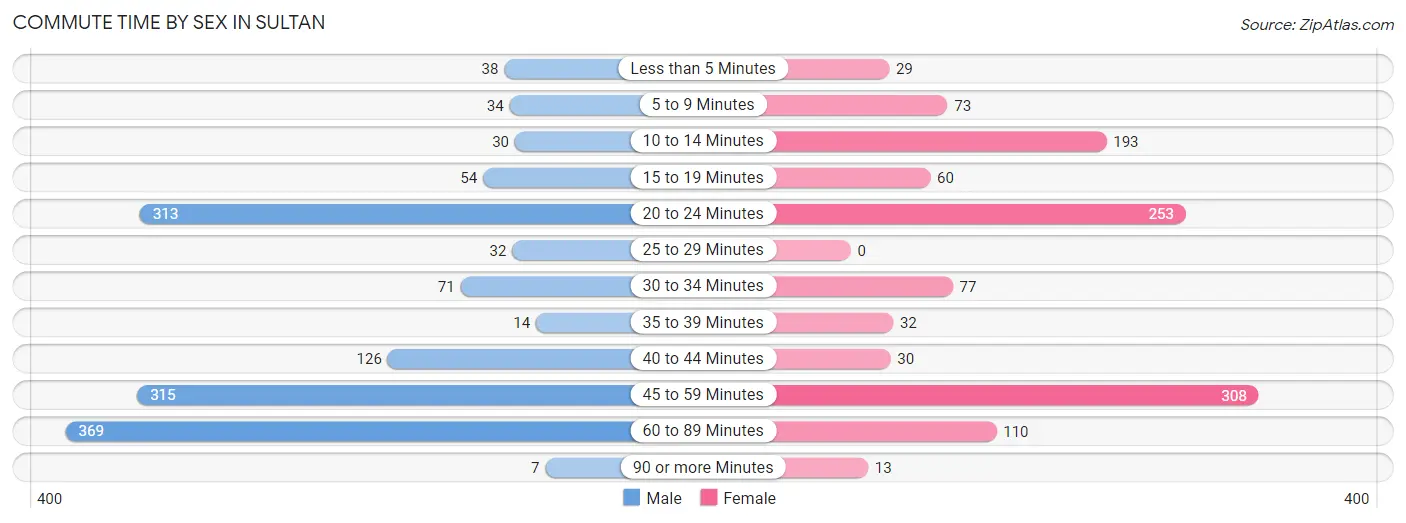
| Commute Time | Male | Female |
| Less than 5 Minutes | 38 (2.7%) | 29 (2.5%) |
| 5 to 9 Minutes | 34 (2.4%) | 73 (6.2%) |
| 10 to 14 Minutes | 30 (2.1%) | 193 (16.4%) |
| 15 to 19 Minutes | 54 (3.8%) | 60 (5.1%) |
| 20 to 24 Minutes | 313 (22.3%) | 253 (21.5%) |
| 25 to 29 Minutes | 32 (2.3%) | 0 (0.0%) |
| 30 to 34 Minutes | 71 (5.1%) | 77 (6.5%) |
| 35 to 39 Minutes | 14 (1.0%) | 32 (2.7%) |
| 40 to 44 Minutes | 126 (9.0%) | 30 (2.5%) |
| 45 to 59 Minutes | 315 (22.5%) | 308 (26.2%) |
| 60 to 89 Minutes | 369 (26.3%) | 110 (9.3%) |
| 90 or more Minutes | 7 (0.5%) | 13 (1.1%) |
Time of Departure to Work by Sex in Sultan
The most frequent times of departure to work in Sultan are 12:00 AM to 4:59 AM (265, 18.9%) for males and 7:00 AM to 7:29 AM (276, 23.4%) for females.
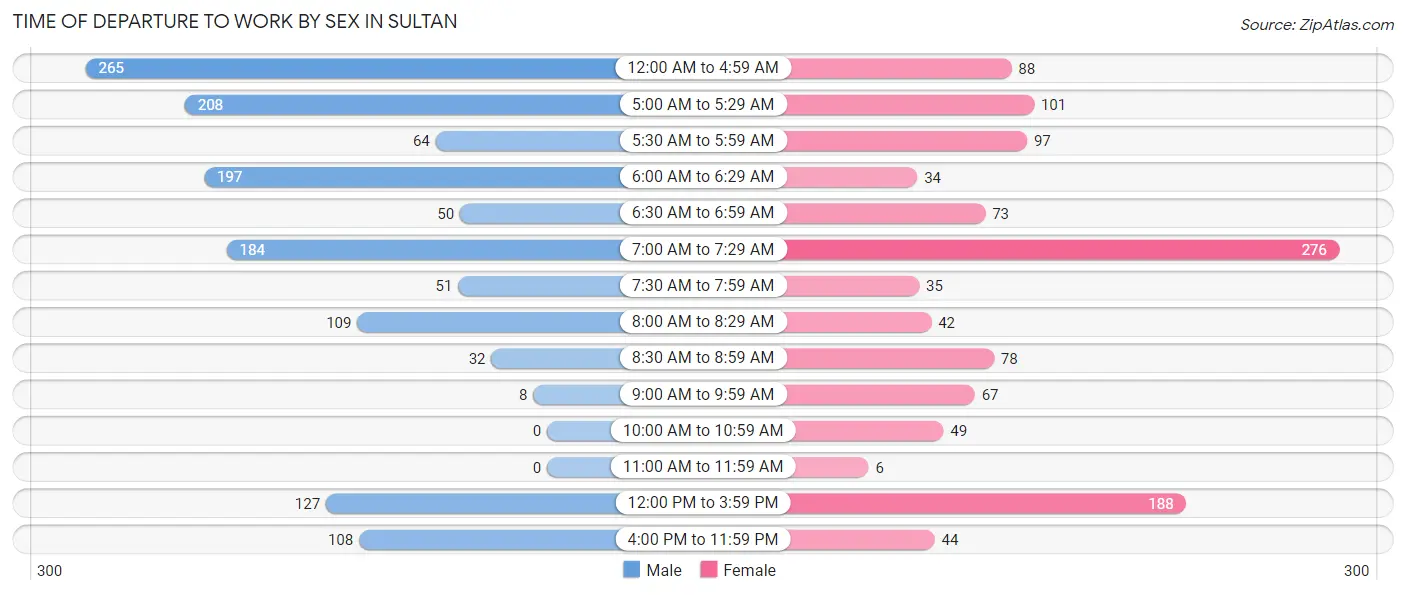
| Time of Departure | Male | Female |
| 12:00 AM to 4:59 AM | 265 (18.9%) | 88 (7.5%) |
| 5:00 AM to 5:29 AM | 208 (14.8%) | 101 (8.6%) |
| 5:30 AM to 5:59 AM | 64 (4.6%) | 97 (8.2%) |
| 6:00 AM to 6:29 AM | 197 (14.0%) | 34 (2.9%) |
| 6:30 AM to 6:59 AM | 50 (3.6%) | 73 (6.2%) |
| 7:00 AM to 7:29 AM | 184 (13.1%) | 276 (23.4%) |
| 7:30 AM to 7:59 AM | 51 (3.6%) | 35 (3.0%) |
| 8:00 AM to 8:29 AM | 109 (7.8%) | 42 (3.6%) |
| 8:30 AM to 8:59 AM | 32 (2.3%) | 78 (6.6%) |
| 9:00 AM to 9:59 AM | 8 (0.6%) | 67 (5.7%) |
| 10:00 AM to 10:59 AM | 0 (0.0%) | 49 (4.2%) |
| 11:00 AM to 11:59 AM | 0 (0.0%) | 6 (0.5%) |
| 12:00 PM to 3:59 PM | 127 (9.0%) | 188 (16.0%) |
| 4:00 PM to 11:59 PM | 108 (7.7%) | 44 (3.7%) |
| Total | 1,403 (100.0%) | 1,178 (100.0%) |
Housing Occupancy in Sultan
Occupancy by Ownership in Sultan
Of the total 2,071 dwellings in Sultan, owner-occupied units account for 1,615 (78.0%), while renter-occupied units make up 456 (22.0%).

| Occupancy | # Housing Units | % Housing Units |
| Owner Occupied Housing Units | 1,615 | 78.0% |
| Renter-Occupied Housing Units | 456 | 22.0% |
| Total Occupied Housing Units | 2,071 | 100.0% |
Occupancy by Household Size in Sultan
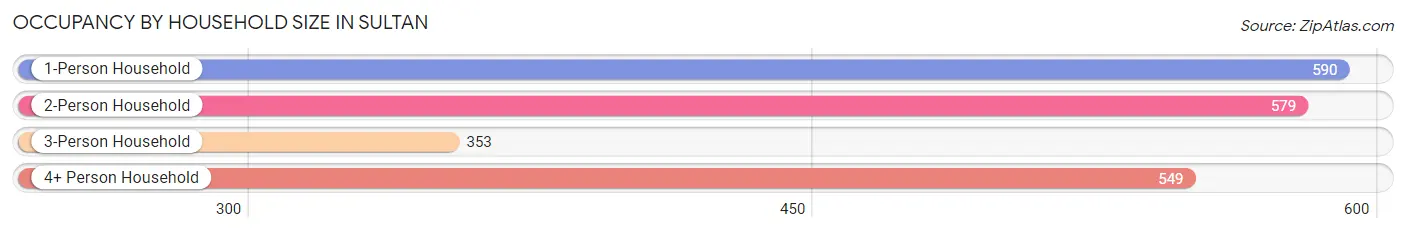
| Household Size | # Housing Units | % Housing Units |
| 1-Person Household | 590 | 28.5% |
| 2-Person Household | 579 | 28.0% |
| 3-Person Household | 353 | 17.0% |
| 4+ Person Household | 549 | 26.5% |
| Total Housing Units | 2,071 | 100.0% |
Occupancy by Ownership by Household Size in Sultan
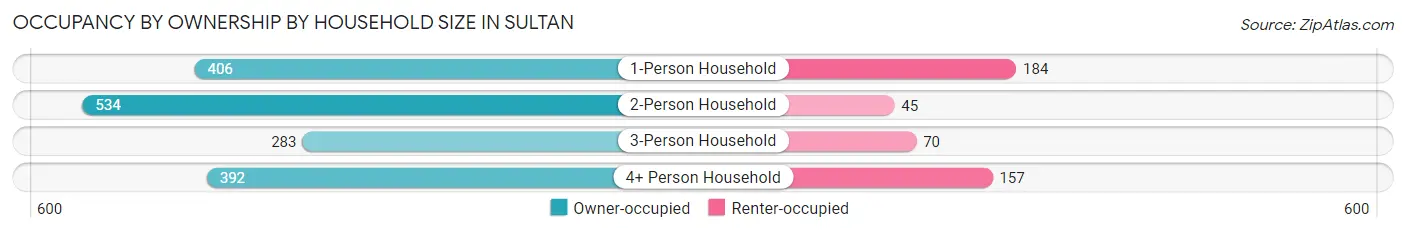
| Household Size | Owner-occupied | Renter-occupied |
| 1-Person Household | 406 (68.8%) | 184 (31.2%) |
| 2-Person Household | 534 (92.2%) | 45 (7.8%) |
| 3-Person Household | 283 (80.2%) | 70 (19.8%) |
| 4+ Person Household | 392 (71.4%) | 157 (28.6%) |
| Total Housing Units | 1,615 (78.0%) | 456 (22.0%) |
Occupancy by Educational Attainment in Sultan
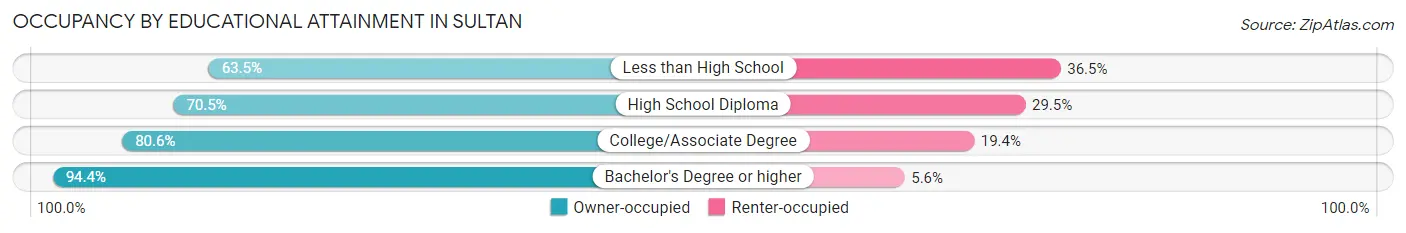
| Household Size | Owner-occupied | Renter-occupied |
| Less than High School | 200 (63.5%) | 115 (36.5%) |
| High School Diploma | 487 (70.5%) | 204 (29.5%) |
| College/Associate Degree | 454 (80.6%) | 109 (19.4%) |
| Bachelor's Degree or higher | 474 (94.4%) | 28 (5.6%) |
Occupancy by Age of Householder in Sultan
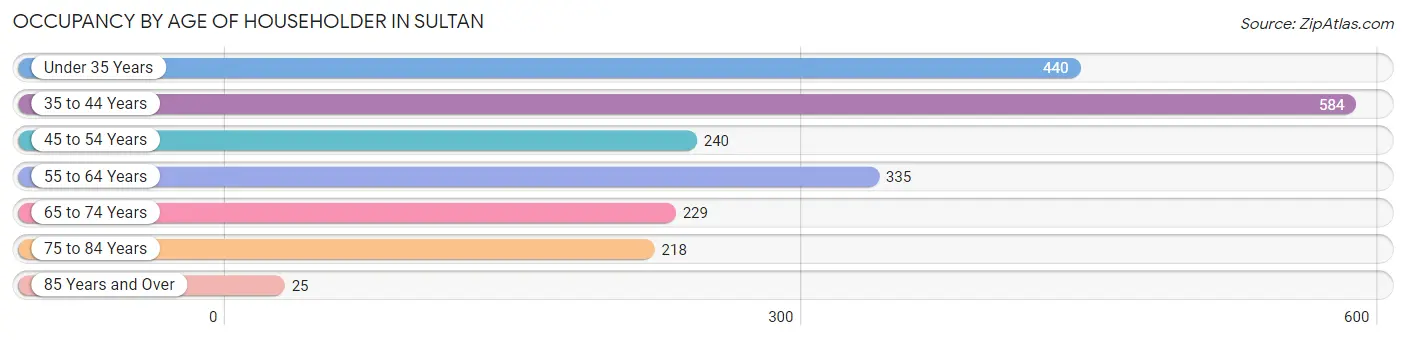
| Age Bracket | # Households | % Households |
| Under 35 Years | 440 | 21.2% |
| 35 to 44 Years | 584 | 28.2% |
| 45 to 54 Years | 240 | 11.6% |
| 55 to 64 Years | 335 | 16.2% |
| 65 to 74 Years | 229 | 11.1% |
| 75 to 84 Years | 218 | 10.5% |
| 85 Years and Over | 25 | 1.2% |
| Total | 2,071 | 100.0% |
Housing Finances in Sultan
Median Income by Occupancy in Sultan
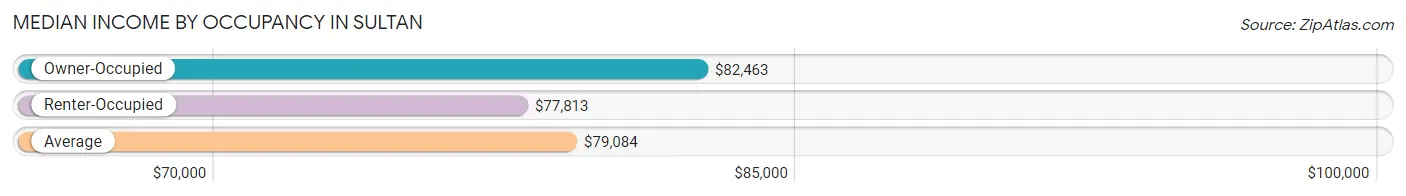
| Occupancy Type | # Households | Median Income |
| Owner-Occupied | 1,615 (78.0%) | $82,463 |
| Renter-Occupied | 456 (22.0%) | $77,813 |
| Average | 2,071 (100.0%) | $79,084 |
Occupancy by Householder Income Bracket in Sultan
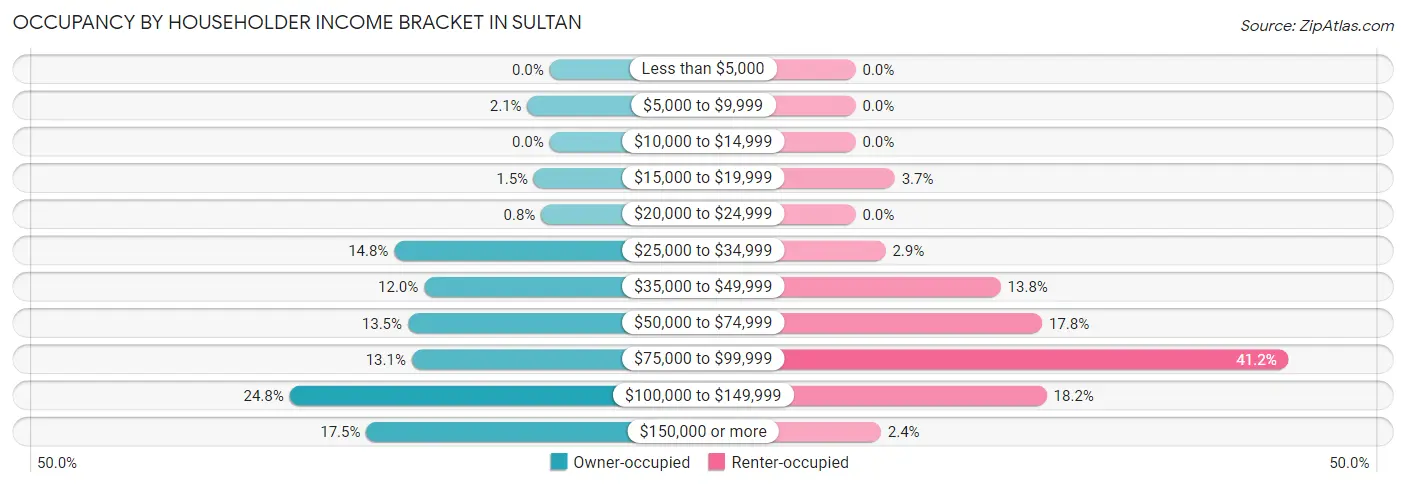
| Income Bracket | Owner-occupied | Renter-occupied |
| Less than $5,000 | 0 (0.0%) | 0 (0.0%) |
| $5,000 to $9,999 | 34 (2.1%) | 0 (0.0%) |
| $10,000 to $14,999 | 0 (0.0%) | 0 (0.0%) |
| $15,000 to $19,999 | 24 (1.5%) | 17 (3.7%) |
| $20,000 to $24,999 | 13 (0.8%) | 0 (0.0%) |
| $25,000 to $34,999 | 239 (14.8%) | 13 (2.9%) |
| $35,000 to $49,999 | 193 (11.9%) | 63 (13.8%) |
| $50,000 to $74,999 | 218 (13.5%) | 81 (17.8%) |
| $75,000 to $99,999 | 212 (13.1%) | 188 (41.2%) |
| $100,000 to $149,999 | 400 (24.8%) | 83 (18.2%) |
| $150,000 or more | 282 (17.5%) | 11 (2.4%) |
| Total | 1,615 (100.0%) | 456 (100.0%) |
Monthly Housing Cost Tiers in Sultan
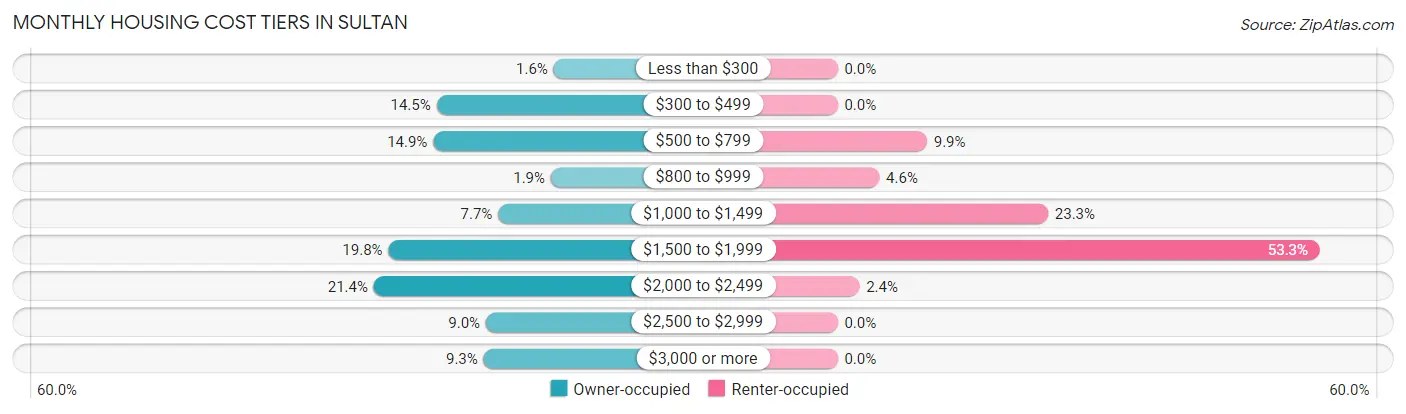
| Monthly Cost | Owner-occupied | Renter-occupied |
| Less than $300 | 25 (1.5%) | 0 (0.0%) |
| $300 to $499 | 234 (14.5%) | 0 (0.0%) |
| $500 to $799 | 240 (14.9%) | 45 (9.9%) |
| $800 to $999 | 30 (1.9%) | 21 (4.6%) |
| $1,000 to $1,499 | 124 (7.7%) | 106 (23.3%) |
| $1,500 to $1,999 | 320 (19.8%) | 243 (53.3%) |
| $2,000 to $2,499 | 346 (21.4%) | 11 (2.4%) |
| $2,500 to $2,999 | 146 (9.0%) | 0 (0.0%) |
| $3,000 or more | 150 (9.3%) | 0 (0.0%) |
| Total | 1,615 (100.0%) | 456 (100.0%) |
Physical Housing Characteristics in Sultan
Housing Structures in Sultan
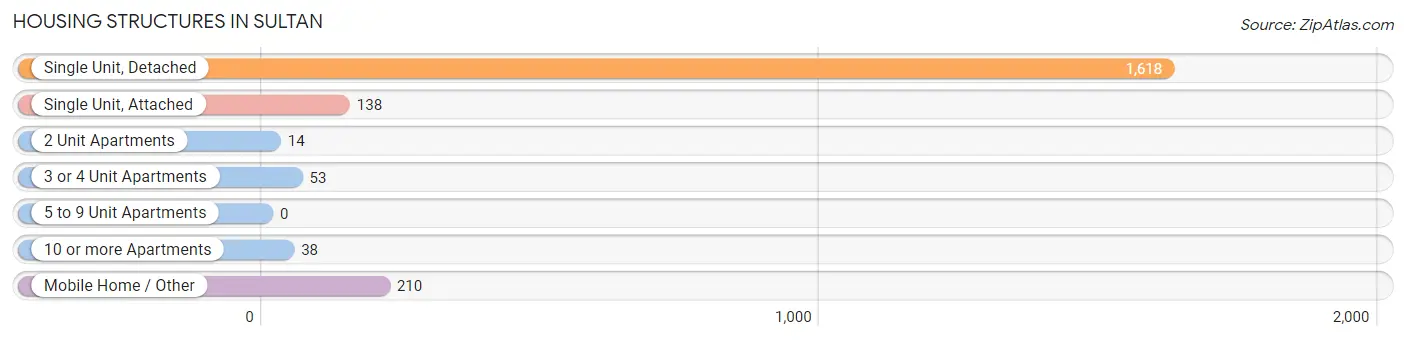
| Structure Type | # Housing Units | % Housing Units |
| Single Unit, Detached | 1,618 | 78.1% |
| Single Unit, Attached | 138 | 6.7% |
| 2 Unit Apartments | 14 | 0.7% |
| 3 or 4 Unit Apartments | 53 | 2.6% |
| 5 to 9 Unit Apartments | 0 | 0.0% |
| 10 or more Apartments | 38 | 1.8% |
| Mobile Home / Other | 210 | 10.1% |
| Total | 2,071 | 100.0% |
Housing Structures by Occupancy in Sultan
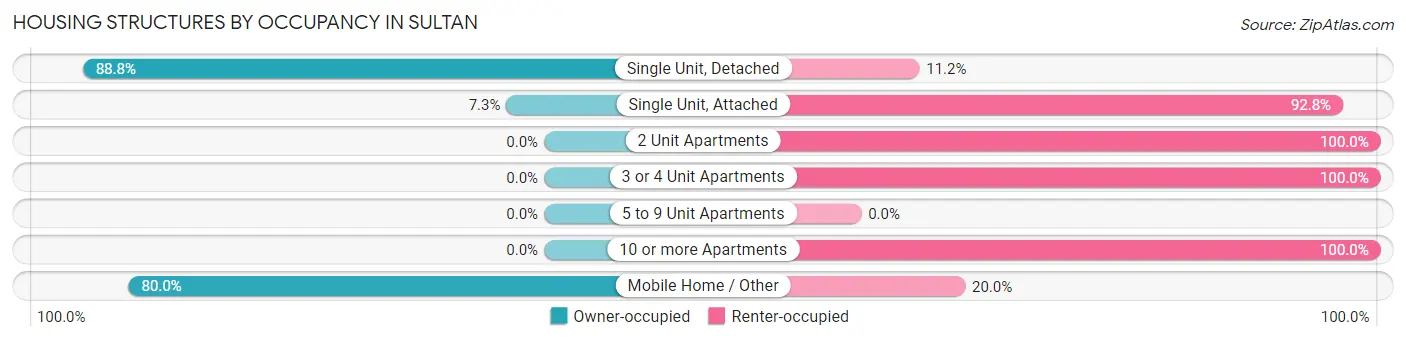
| Structure Type | Owner-occupied | Renter-occupied |
| Single Unit, Detached | 1,437 (88.8%) | 181 (11.2%) |
| Single Unit, Attached | 10 (7.2%) | 128 (92.7%) |
| 2 Unit Apartments | 0 (0.0%) | 14 (100.0%) |
| 3 or 4 Unit Apartments | 0 (0.0%) | 53 (100.0%) |
| 5 to 9 Unit Apartments | 0 (0.0%) | 0 (0.0%) |
| 10 or more Apartments | 0 (0.0%) | 38 (100.0%) |
| Mobile Home / Other | 168 (80.0%) | 42 (20.0%) |
| Total | 1,615 (78.0%) | 456 (22.0%) |
Housing Structures by Number of Rooms in Sultan
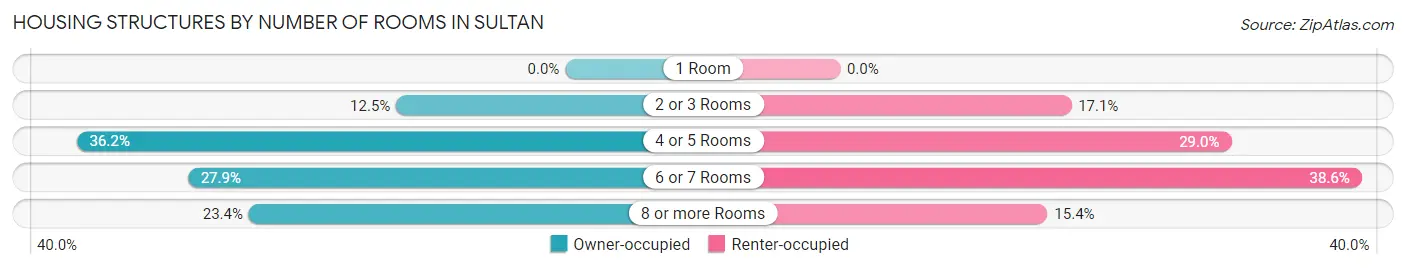
| Number of Rooms | Owner-occupied | Renter-occupied |
| 1 Room | 0 (0.0%) | 0 (0.0%) |
| 2 or 3 Rooms | 202 (12.5%) | 78 (17.1%) |
| 4 or 5 Rooms | 584 (36.2%) | 132 (28.9%) |
| 6 or 7 Rooms | 451 (27.9%) | 176 (38.6%) |
| 8 or more Rooms | 378 (23.4%) | 70 (15.3%) |
| Total | 1,615 (100.0%) | 456 (100.0%) |
Housing Structure by Heating Type in Sultan
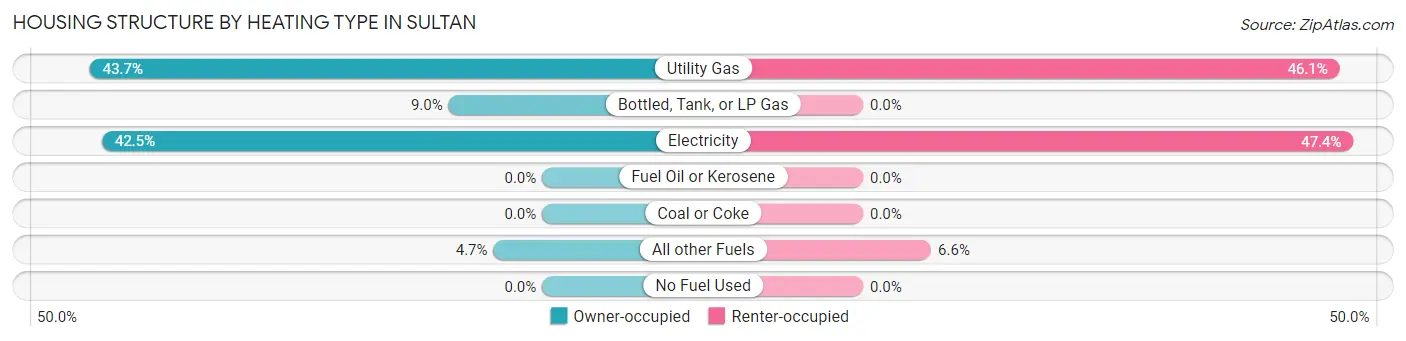
| Heating Type | Owner-occupied | Renter-occupied |
| Utility Gas | 706 (43.7%) | 210 (46.1%) |
| Bottled, Tank, or LP Gas | 146 (9.0%) | 0 (0.0%) |
| Electricity | 687 (42.5%) | 216 (47.4%) |
| Fuel Oil or Kerosene | 0 (0.0%) | 0 (0.0%) |
| Coal or Coke | 0 (0.0%) | 0 (0.0%) |
| All other Fuels | 76 (4.7%) | 30 (6.6%) |
| No Fuel Used | 0 (0.0%) | 0 (0.0%) |
| Total | 1,615 (100.0%) | 456 (100.0%) |
Household Vehicle Usage in Sultan
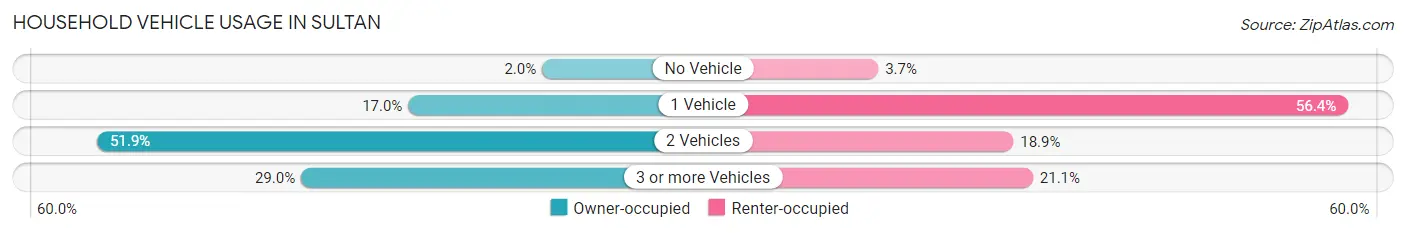
| Vehicles per Household | Owner-occupied | Renter-occupied |
| No Vehicle | 33 (2.0%) | 17 (3.7%) |
| 1 Vehicle | 275 (17.0%) | 257 (56.4%) |
| 2 Vehicles | 838 (51.9%) | 86 (18.9%) |
| 3 or more Vehicles | 469 (29.0%) | 96 (21.0%) |
| Total | 1,615 (100.0%) | 456 (100.0%) |
Real Estate & Mortgages in Sultan
Real Estate and Mortgage Overview in Sultan
| Characteristic | Without Mortgage | With Mortgage |
| Housing Units | 557 | 1,058 |
| Median Property Value | $164,800 | $433,300 |
| Median Household Income | $39,258 | $262 |
| Monthly Housing Costs | $518 | $134 |
| Real Estate Taxes | - | - |
Property Value by Mortgage Status in Sultan
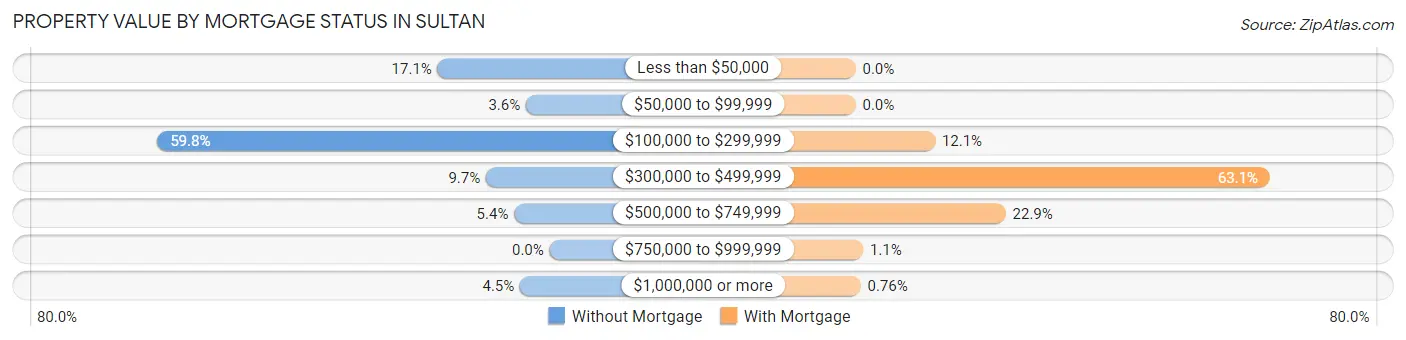
| Property Value | Without Mortgage | With Mortgage |
| Less than $50,000 | 95 (17.1%) | 0 (0.0%) |
| $50,000 to $99,999 | 20 (3.6%) | 0 (0.0%) |
| $100,000 to $299,999 | 333 (59.8%) | 128 (12.1%) |
| $300,000 to $499,999 | 54 (9.7%) | 668 (63.1%) |
| $500,000 to $749,999 | 30 (5.4%) | 242 (22.9%) |
| $750,000 to $999,999 | 0 (0.0%) | 12 (1.1%) |
| $1,000,000 or more | 25 (4.5%) | 8 (0.8%) |
| Total | 557 (100.0%) | 1,058 (100.0%) |
Household Income by Mortgage Status in Sultan
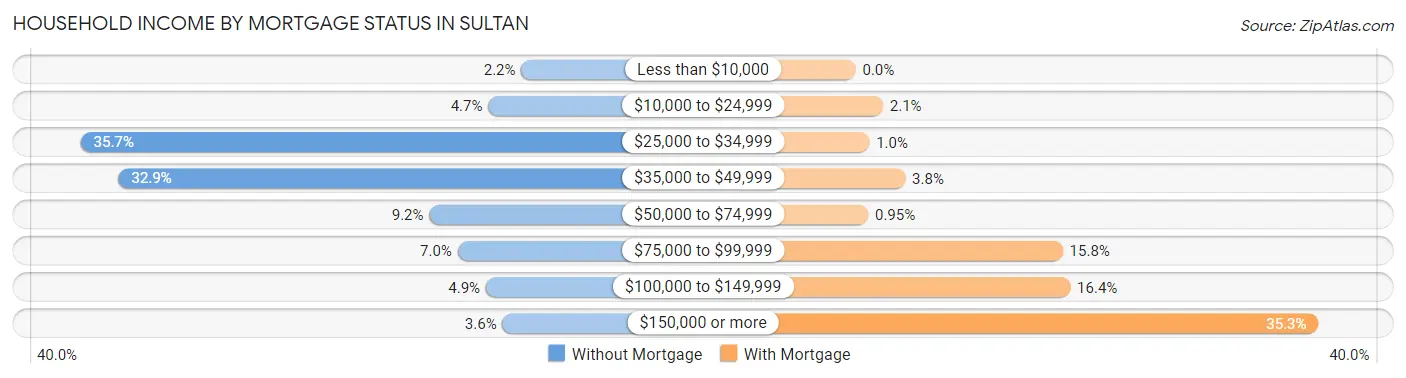
| Household Income | Without Mortgage | With Mortgage |
| Less than $10,000 | 12 (2.1%) | 0 (0.0%) |
| $10,000 to $24,999 | 26 (4.7%) | 22 (2.1%) |
| $25,000 to $34,999 | 199 (35.7%) | 11 (1.0%) |
| $35,000 to $49,999 | 183 (32.9%) | 40 (3.8%) |
| $50,000 to $74,999 | 51 (9.2%) | 10 (0.9%) |
| $75,000 to $99,999 | 39 (7.0%) | 167 (15.8%) |
| $100,000 to $149,999 | 27 (4.9%) | 173 (16.4%) |
| $150,000 or more | 20 (3.6%) | 373 (35.3%) |
| Total | 557 (100.0%) | 1,058 (100.0%) |
Property Value to Household Income Ratio in Sultan
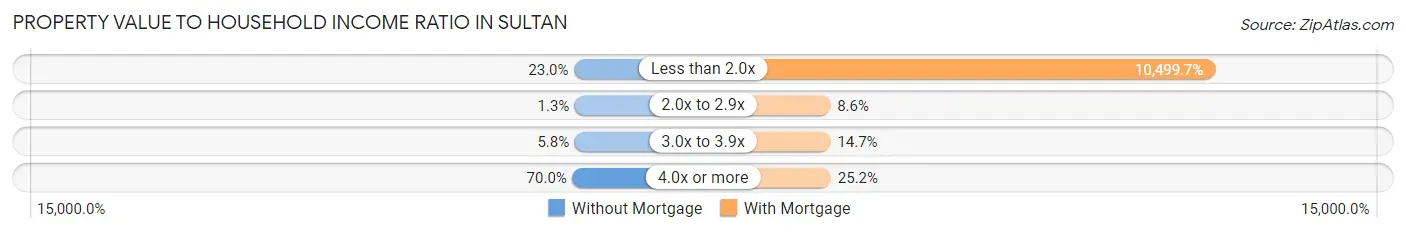
| Value-to-Income Ratio | Without Mortgage | With Mortgage |
| Less than 2.0x | 128 (23.0%) | 111,087 (10,499.7%) |
| 2.0x to 2.9x | 7 (1.3%) | 91 (8.6%) |
| 3.0x to 3.9x | 32 (5.8%) | 155 (14.6%) |
| 4.0x or more | 390 (70.0%) | 267 (25.2%) |
| Total | 557 (100.0%) | 1,058 (100.0%) |
Real Estate Taxes by Mortgage Status in Sultan
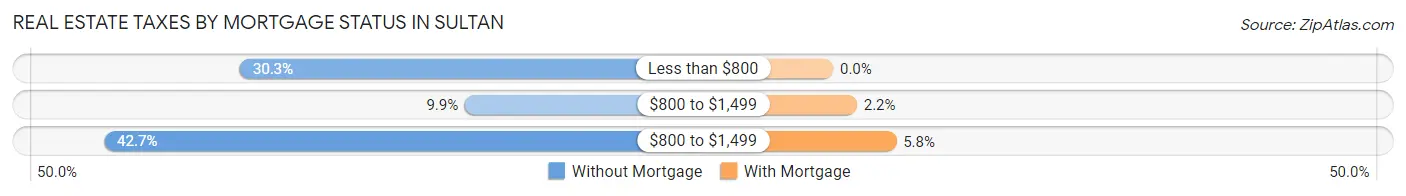
| Property Taxes | Without Mortgage | With Mortgage |
| Less than $800 | 169 (30.3%) | 0 (0.0%) |
| $800 to $1,499 | 55 (9.9%) | 23 (2.2%) |
| $800 to $1,499 | 238 (42.7%) | 61 (5.8%) |
| Total | 557 (100.0%) | 1,058 (100.0%) |
Health & Disability in Sultan
Health Insurance Coverage by Age in Sultan
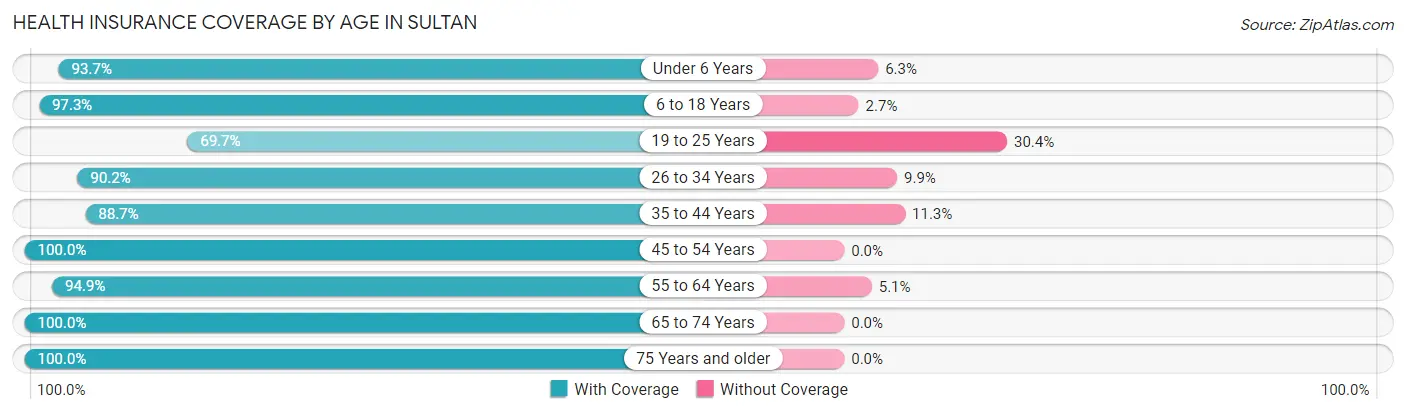
| Age Bracket | With Coverage | Without Coverage |
| Under 6 Years | 355 (93.7%) | 24 (6.3%) |
| 6 to 18 Years | 909 (97.3%) | 25 (2.7%) |
| 19 to 25 Years | 374 (69.7%) | 163 (30.3%) |
| 26 to 34 Years | 531 (90.1%) | 58 (9.9%) |
| 35 to 44 Years | 1,079 (88.7%) | 138 (11.3%) |
| 45 to 54 Years | 599 (100.0%) | 0 (0.0%) |
| 55 to 64 Years | 481 (94.9%) | 26 (5.1%) |
| 65 to 74 Years | 372 (100.0%) | 0 (0.0%) |
| 75 Years and older | 268 (100.0%) | 0 (0.0%) |
| Total | 4,968 (92.0%) | 434 (8.0%) |
Health Insurance Coverage by Citizenship Status in Sultan
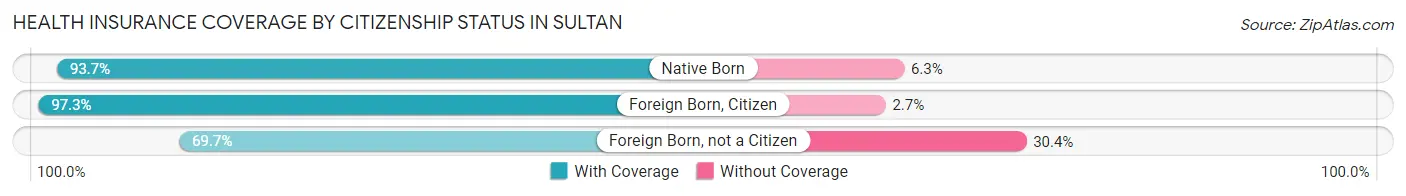
| Citizenship Status | With Coverage | Without Coverage |
| Native Born | 355 (93.7%) | 24 (6.3%) |
| Foreign Born, Citizen | 909 (97.3%) | 25 (2.7%) |
| Foreign Born, not a Citizen | 374 (69.7%) | 163 (30.3%) |
Health Insurance Coverage by Household Income in Sultan
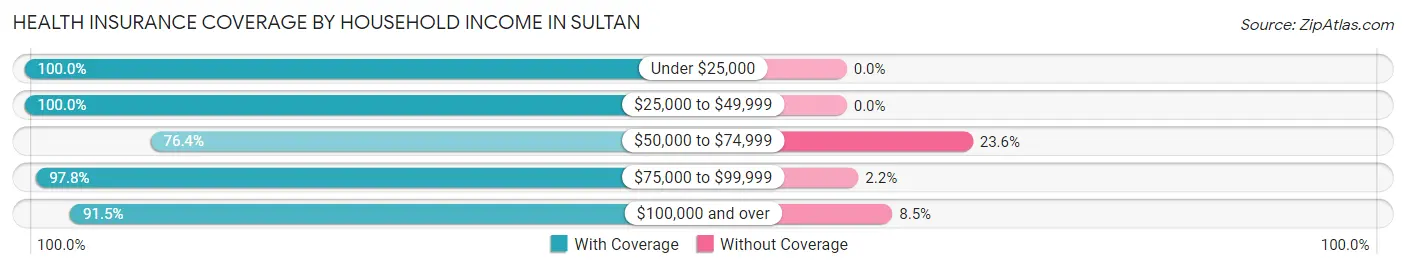
| Household Income | With Coverage | Without Coverage |
| Under $25,000 | 102 (100.0%) | 0 (0.0%) |
| $25,000 to $49,999 | 727 (100.0%) | 0 (0.0%) |
| $50,000 to $74,999 | 605 (76.4%) | 187 (23.6%) |
| $75,000 to $99,999 | 1,167 (97.8%) | 26 (2.2%) |
| $100,000 and over | 2,367 (91.5%) | 221 (8.5%) |
Public vs Private Health Insurance Coverage by Age in Sultan
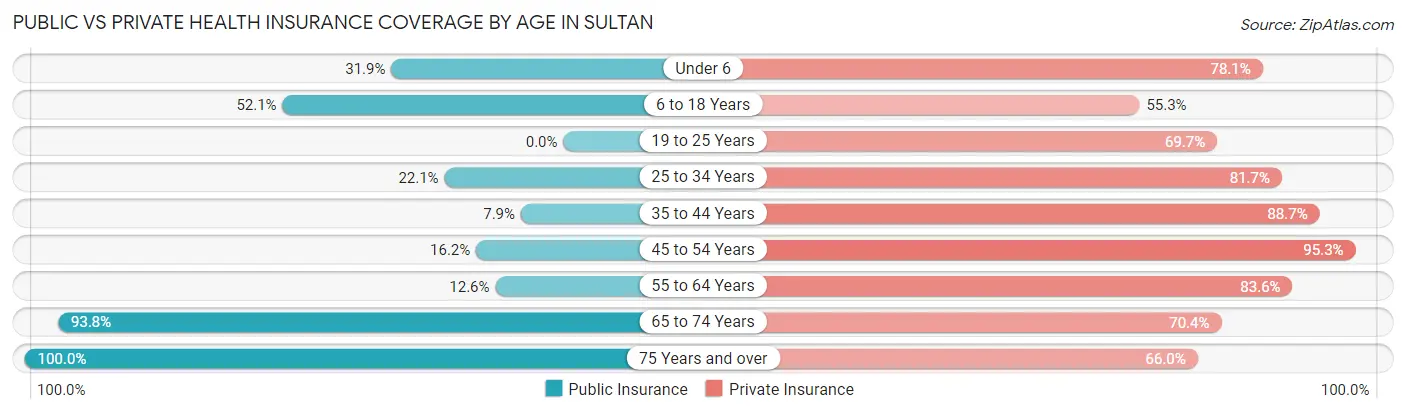
| Age Bracket | Public Insurance | Private Insurance |
| Under 6 | 121 (31.9%) | 296 (78.1%) |
| 6 to 18 Years | 487 (52.1%) | 516 (55.2%) |
| 19 to 25 Years | 0 (0.0%) | 374 (69.7%) |
| 25 to 34 Years | 130 (22.1%) | 481 (81.7%) |
| 35 to 44 Years | 96 (7.9%) | 1,079 (88.7%) |
| 45 to 54 Years | 97 (16.2%) | 571 (95.3%) |
| 55 to 64 Years | 64 (12.6%) | 424 (83.6%) |
| 65 to 74 Years | 349 (93.8%) | 262 (70.4%) |
| 75 Years and over | 268 (100.0%) | 177 (66.0%) |
| Total | 1,612 (29.8%) | 4,180 (77.4%) |
Disability Status by Sex by Age in Sultan
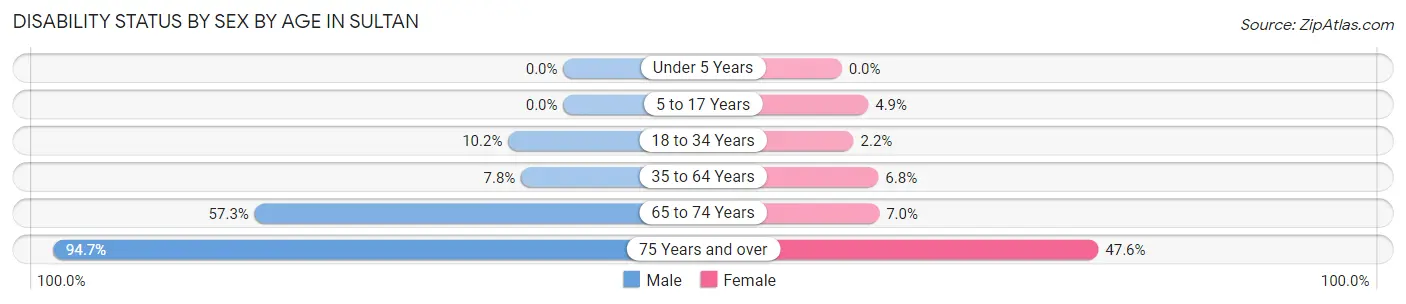
| Age Bracket | Male | Female |
| Under 5 Years | 0 (0.0%) | 0 (0.0%) |
| 5 to 17 Years | 0 (0.0%) | 22 (4.9%) |
| 18 to 34 Years | 63 (10.2%) | 12 (2.2%) |
| 35 to 64 Years | 91 (7.8%) | 79 (6.8%) |
| 65 to 74 Years | 106 (57.3%) | 13 (7.0%) |
| 75 Years and over | 234 (94.7%) | 10 (47.6%) |
Disability Class by Sex by Age in Sultan
Disability Class: Hearing Difficulty
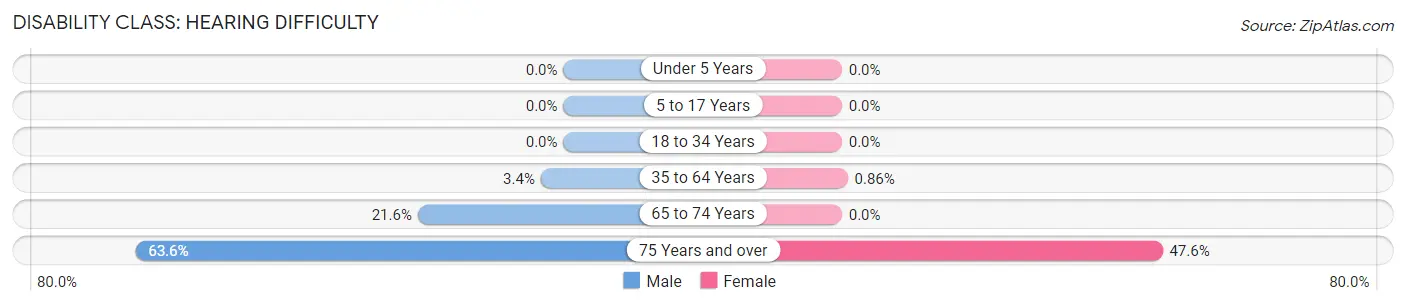
| Age Bracket | Male | Female |
| Under 5 Years | 0 (0.0%) | 0 (0.0%) |
| 5 to 17 Years | 0 (0.0%) | 0 (0.0%) |
| 18 to 34 Years | 0 (0.0%) | 0 (0.0%) |
| 35 to 64 Years | 39 (3.4%) | 10 (0.9%) |
| 65 to 74 Years | 40 (21.6%) | 0 (0.0%) |
| 75 Years and over | 157 (63.6%) | 10 (47.6%) |
Disability Class: Vision Difficulty
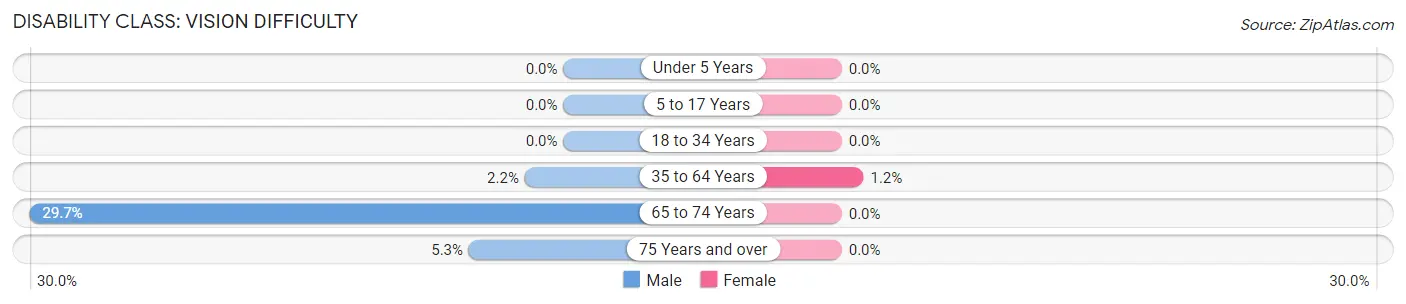
| Age Bracket | Male | Female |
| Under 5 Years | 0 (0.0%) | 0 (0.0%) |
| 5 to 17 Years | 0 (0.0%) | 0 (0.0%) |
| 18 to 34 Years | 0 (0.0%) | 0 (0.0%) |
| 35 to 64 Years | 25 (2.1%) | 14 (1.2%) |
| 65 to 74 Years | 55 (29.7%) | 0 (0.0%) |
| 75 Years and over | 13 (5.3%) | 0 (0.0%) |
Disability Class: Cognitive Difficulty
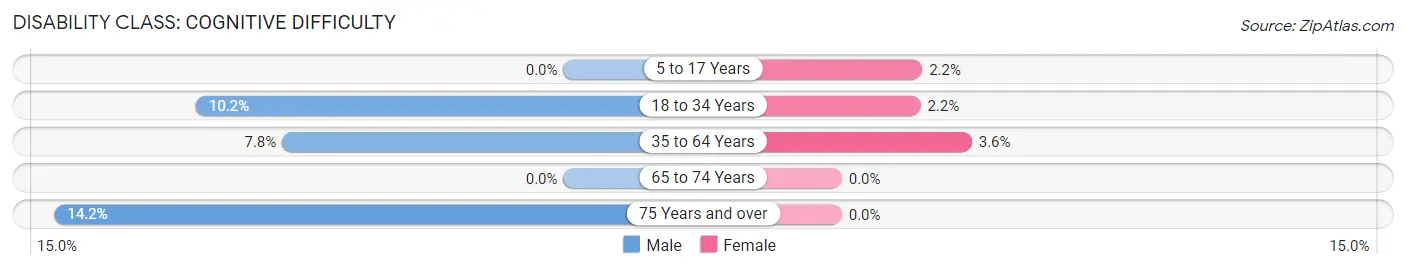
| Age Bracket | Male | Female |
| 5 to 17 Years | 0 (0.0%) | 10 (2.2%) |
| 18 to 34 Years | 63 (10.2%) | 12 (2.2%) |
| 35 to 64 Years | 91 (7.8%) | 42 (3.6%) |
| 65 to 74 Years | 0 (0.0%) | 0 (0.0%) |
| 75 Years and over | 35 (14.2%) | 0 (0.0%) |
Disability Class: Ambulatory Difficulty
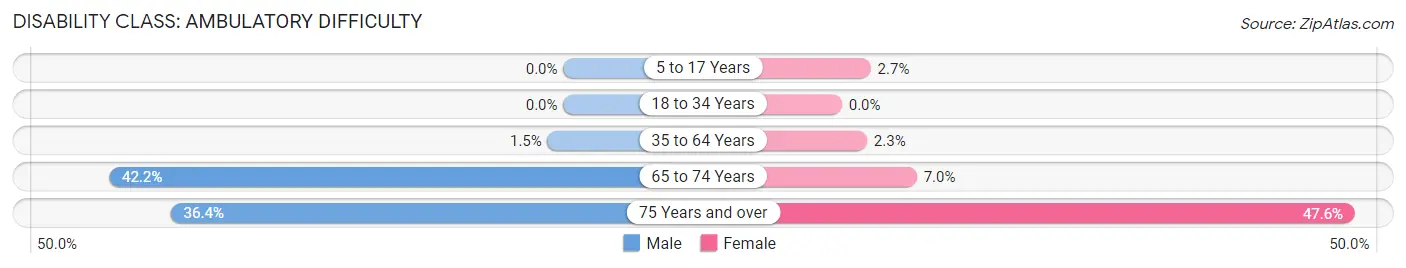
| Age Bracket | Male | Female |
| 5 to 17 Years | 0 (0.0%) | 12 (2.7%) |
| 18 to 34 Years | 0 (0.0%) | 0 (0.0%) |
| 35 to 64 Years | 17 (1.5%) | 27 (2.3%) |
| 65 to 74 Years | 78 (42.2%) | 13 (7.0%) |
| 75 Years and over | 90 (36.4%) | 10 (47.6%) |
Disability Class: Self-Care Difficulty
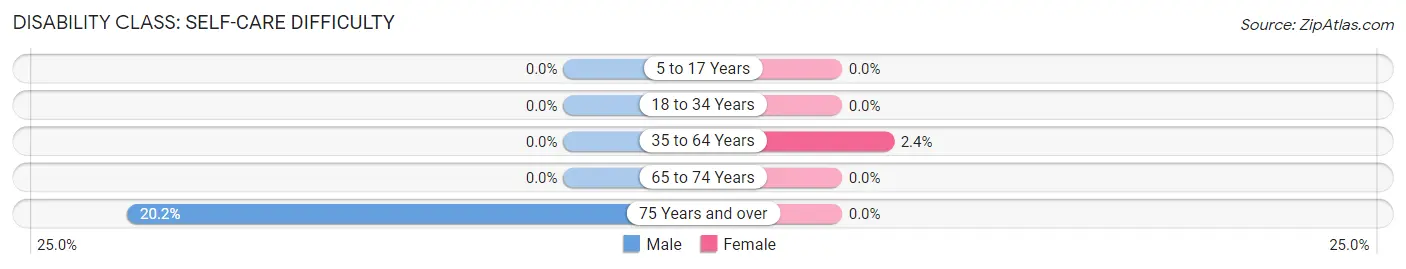
| Age Bracket | Male | Female |
| 5 to 17 Years | 0 (0.0%) | 0 (0.0%) |
| 18 to 34 Years | 0 (0.0%) | 0 (0.0%) |
| 35 to 64 Years | 0 (0.0%) | 28 (2.4%) |
| 65 to 74 Years | 0 (0.0%) | 0 (0.0%) |
| 75 Years and over | 50 (20.2%) | 0 (0.0%) |
Technology Access in Sultan
Computing Device Access in Sultan
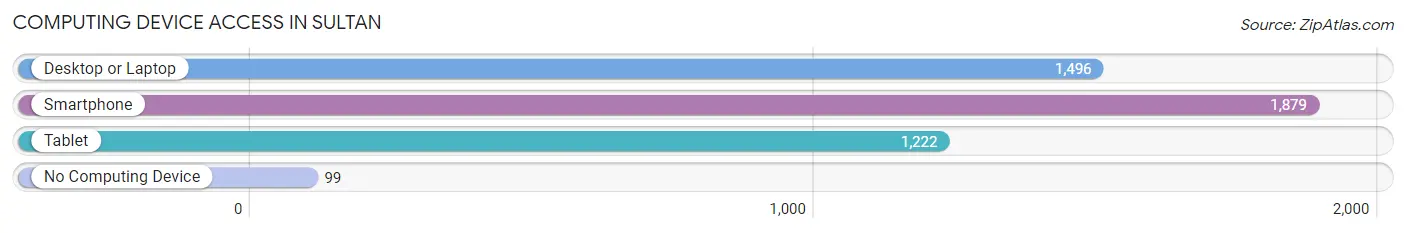
| Device Type | # Households | % Households |
| Desktop or Laptop | 1,496 | 72.2% |
| Smartphone | 1,879 | 90.7% |
| Tablet | 1,222 | 59.0% |
| No Computing Device | 99 | 4.8% |
| Total | 2,071 | 100.0% |
Internet Access in Sultan
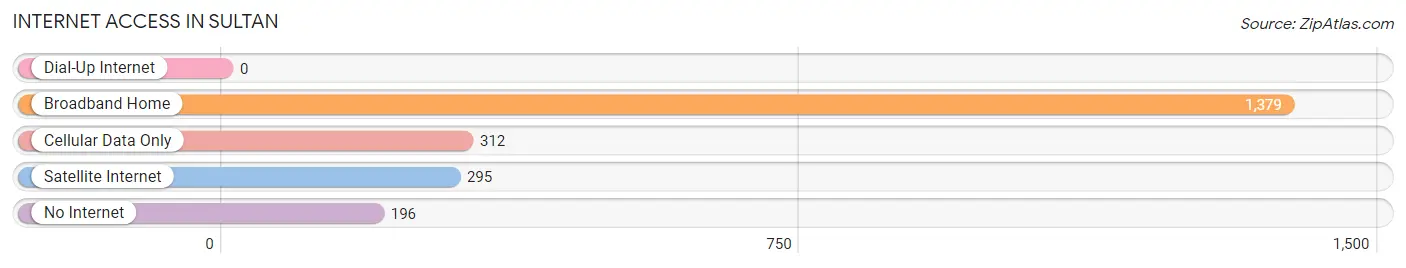
| Internet Type | # Households | % Households |
| Dial-Up Internet | 0 | 0.0% |
| Broadband Home | 1,379 | 66.6% |
| Cellular Data Only | 312 | 15.1% |
| Satellite Internet | 295 | 14.2% |
| No Internet | 196 | 9.5% |
| Total | 2,071 | 100.0% |
Sultan Summary
Sultan is a small city located in Snohomish County, Washington, United States. It is situated in the foothills of the Cascade Mountains, approximately 40 miles northeast of Seattle. The city has a population of 5,912 as of the 2010 census.
History
Sultan was founded in 1891 by a group of Swedish immigrants who had come to the area to work in the logging industry. The city was named after Sultan, a nearby creek. The first post office was established in 1892.
In the early 1900s, Sultan was a thriving logging town. The city was home to several sawmills, a shingle mill, and a box factory. The logging industry provided employment for many of the city’s residents.
In the 1920s, the logging industry began to decline and the city’s economy shifted to agriculture. The city was home to several dairy farms and fruit orchards.
In the 1950s, the city began to experience a population boom as people moved to the area from other parts of the country. The city’s population grew from 1,000 in 1950 to 5,912 in 2010.
Geography
Sultan is located in the foothills of the Cascade Mountains at an elevation of 545 feet. The city is situated on the Skykomish River, which flows through the city. The city is surrounded by forests and mountains, providing a picturesque backdrop.
The climate in Sultan is mild and temperate. The average high temperature in July is 78 degrees Fahrenheit and the average low temperature in January is 33 degrees Fahrenheit. The city receives an average of 37 inches of precipitation per year.
Economy
The economy of Sultan is largely based on tourism and agriculture. The city is home to several tourist attractions, including the Skykomish River, the Sultan River, and the Sultan Shores State Park. The city is also home to several wineries and breweries.
Agriculture is also an important part of the city’s economy. The city is home to several dairy farms and fruit orchards. The city is also home to several nurseries and greenhouses.
Demographics
As of the 2010 census, the population of Sultan was 5,912. The racial makeup of the city was 87.3% White, 0.7% African American, 1.2% Native American, 0.7% Asian, 0.1% Pacific Islander, 6.2% from other races, and 3.9% from two or more races. Hispanic or Latino of any race were 11.2% of the population.
The median household income in Sultan was $50,902 and the median family income was $58,958. The per capita income was $22,945. About 11.2% of families and 14.2% of the population were below the poverty line, including 19.2% of those under age 18 and 8.2% of those age 65 or over.
Common Questions
What is Per Capita Income in Sultan?
Per Capita income in Sultan is $36,641.
What is the Median Family Income in Sultan?
Median Family Income in Sultan is $89,208.
What is the Median Household income in Sultan?
Median Household Income in Sultan is $79,084.
What is Income or Wage Gap in Sultan?
Income or Wage Gap in Sultan is 23.2%.
Women in Sultan earn 76.8 cents for every dollar earned by a man.
What is Inequality or Gini Index in Sultan?
Inequality or Gini Index in Sultan is 0.35.
What is the Total Population of Sultan?
Total Population of Sultan is 5,462.
What is the Total Male Population of Sultan?
Total Male Population of Sultan is 2,892.
What is the Total Female Population of Sultan?
Total Female Population of Sultan is 2,570.
What is the Ratio of Males per 100 Females in Sultan?
There are 112.53 Males per 100 Females in Sultan.
What is the Ratio of Females per 100 Males in Sultan?
There are 88.87 Females per 100 Males in Sultan.
What is the Median Population Age in Sultan?
Median Population Age in Sultan is 36.8 Years.
What is the Average Family Size in Sultan
Average Family Size in Sultan is 3.3 People.
What is the Average Household Size in Sultan
Average Household Size in Sultan is 2.6 People.
How Large is the Labor Force in Sultan?
There are 3,083 People in the Labor Forcein in Sultan.
What is the Percentage of People in the Labor Force in Sultan?
69.4% of People are in the Labor Force in Sultan.
What is the Unemployment Rate in Sultan?
Unemployment Rate in Sultan is 5.4%.