Hyattsville, MD Map & Demographics
Hyattsville Map
Hyattsville Overview
$45,394
PER CAPITA INCOME
$100,492
AVG FAMILY INCOME
$90,329
AVG HOUSEHOLD INCOME
26.5%
WAGE / INCOME GAP [ % ]
73.5¢/ $1
WAGE / INCOME GAP [ $ ]
$17,349
FAMILY INCOME DEFICIT
0.42
INEQUALITY / GINI INDEX
20,851
TOTAL POPULATION
11,075
MALE POPULATION
9,776
FEMALE POPULATION
113.29
MALES / 100 FEMALES
88.27
FEMALES / 100 MALES
35.5
MEDIAN AGE
3.1
AVG FAMILY SIZE
2.5
AVG HOUSEHOLD SIZE
12,911
LABOR FORCE [ PEOPLE ]
76.3%
PERCENT IN LABOR FORCE
2.8%
UNEMPLOYMENT RATE
Income in Hyattsville
Income Overview in Hyattsville
Per Capita Income in Hyattsville is $45,394, while median incomes of families and households are $100,492 and $90,329 respectively.
| Characteristic | Number | Measure |
| Per Capita Income | 20,851 | $45,394 |
| Median Family Income | 4,665 | $100,492 |
| Mean Family Income | 4,665 | $118,802 |
| Median Household Income | 8,151 | $90,329 |
| Mean Household Income | 8,151 | $116,879 |
| Income Deficit | 4,665 | $17,349 |
| Wage / Income Gap (%) | 20,851 | 26.45% |
| Wage / Income Gap ($) | 20,851 | 73.55¢ per $1 |
| Gini / Inequality Index | 20,851 | 0.42 |
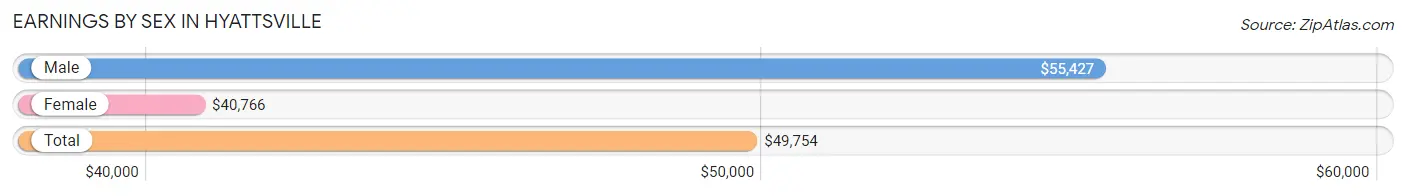
Earnings by Sex in Hyattsville
Average Earnings in Hyattsville are $49,754, $55,427 for men and $40,766 for women, a difference of 26.5%.
| Sex | Number | Average Earnings |
| Male | 7,382 (56.4%) | $55,427 |
| Female | 5,698 (43.6%) | $40,766 |
| Total | 13,080 (100.0%) | $49,754 |
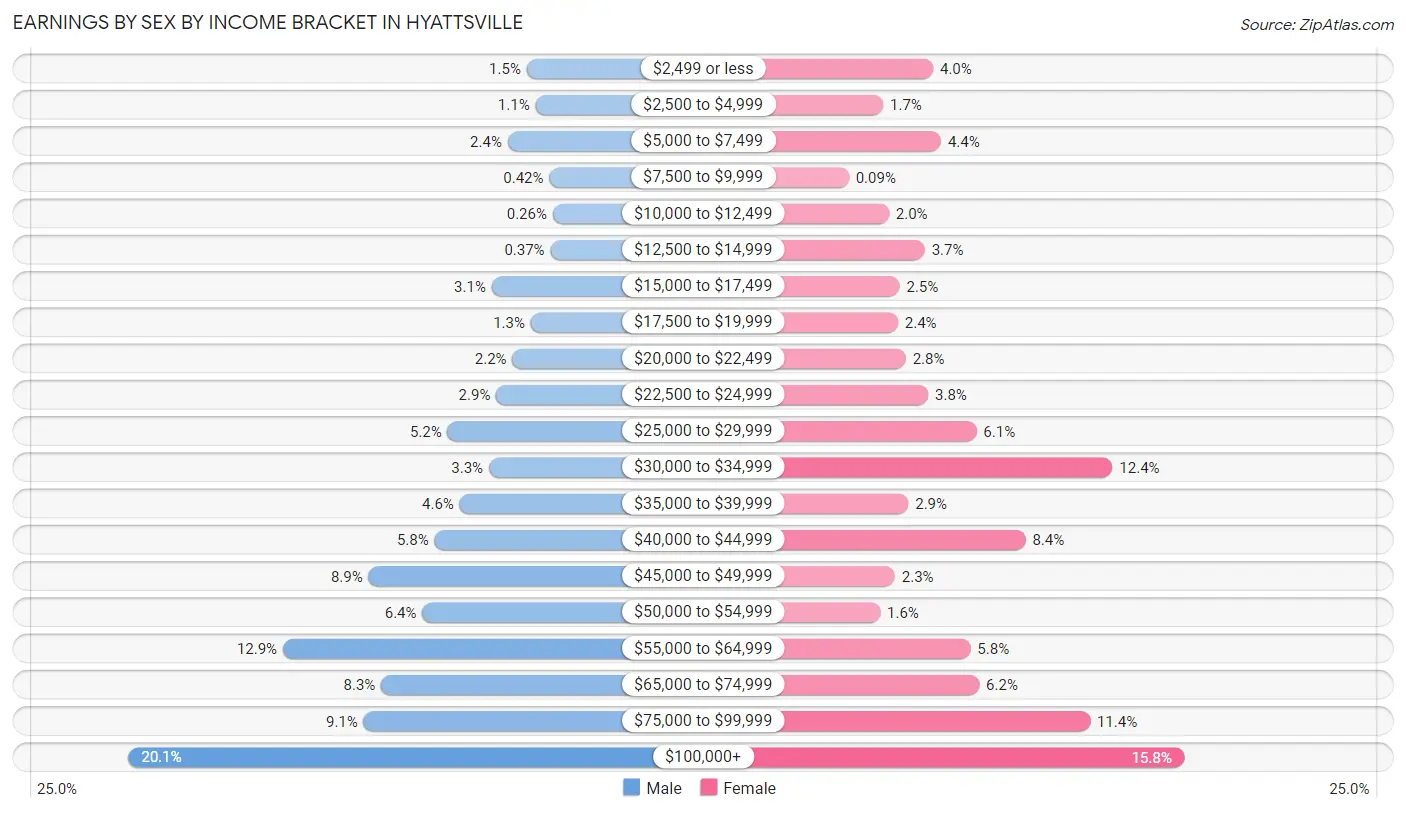
Earnings by Sex by Income Bracket in Hyattsville
The most common earnings brackets in Hyattsville are $100,000+ for men (1,487 | 20.1%) and $100,000+ for women (899 | 15.8%).
| Income | Male | Female |
| $2,499 or less | 109 (1.5%) | 230 (4.0%) |
| $2,500 to $4,999 | 79 (1.1%) | 97 (1.7%) |
| $5,000 to $7,499 | 175 (2.4%) | 251 (4.4%) |
| $7,500 to $9,999 | 31 (0.4%) | 5 (0.1%) |
| $10,000 to $12,499 | 19 (0.3%) | 112 (2.0%) |
| $12,500 to $14,999 | 27 (0.4%) | 208 (3.6%) |
| $15,000 to $17,499 | 230 (3.1%) | 141 (2.5%) |
| $17,500 to $19,999 | 95 (1.3%) | 136 (2.4%) |
| $20,000 to $22,499 | 159 (2.1%) | 157 (2.8%) |
| $22,500 to $24,999 | 215 (2.9%) | 217 (3.8%) |
| $25,000 to $29,999 | 383 (5.2%) | 346 (6.1%) |
| $30,000 to $34,999 | 240 (3.3%) | 709 (12.4%) |
| $35,000 to $39,999 | 341 (4.6%) | 164 (2.9%) |
| $40,000 to $44,999 | 428 (5.8%) | 477 (8.4%) |
| $45,000 to $49,999 | 656 (8.9%) | 128 (2.2%) |
| $50,000 to $54,999 | 470 (6.4%) | 89 (1.6%) |
| $55,000 to $64,999 | 952 (12.9%) | 330 (5.8%) |
| $65,000 to $74,999 | 613 (8.3%) | 353 (6.2%) |
| $75,000 to $99,999 | 673 (9.1%) | 649 (11.4%) |
| $100,000+ | 1,487 (20.1%) | 899 (15.8%) |
| Total | 7,382 (100.0%) | 5,698 (100.0%) |
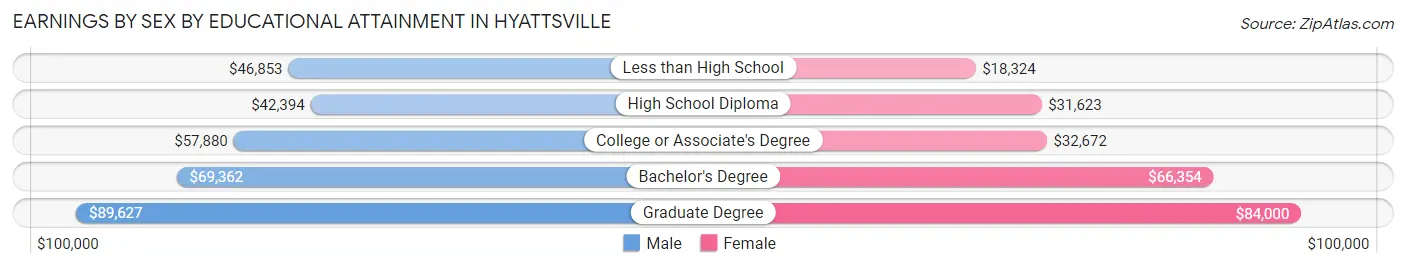
Earnings by Sex by Educational Attainment in Hyattsville
Average earnings in Hyattsville are $57,652 for men and $43,458 for women, a difference of 24.6%. Men with an educational attainment of graduate degree enjoy the highest average annual earnings of $89,627, while those with high school diploma education earn the least with $42,394. Women with an educational attainment of graduate degree earn the most with the average annual earnings of $84,000, while those with less than high school education have the smallest earnings of $18,324.
| Educational Attainment | Male Income | Female Income |
| Less than High School | $46,853 | $18,324 |
| High School Diploma | $42,394 | $31,623 |
| College or Associate's Degree | $57,880 | $32,672 |
| Bachelor's Degree | $69,362 | $66,354 |
| Graduate Degree | $89,627 | $84,000 |
| Total | $57,652 | $43,458 |
Family Income in Hyattsville
Family Income Brackets in Hyattsville
According to the Hyattsville family income data, there are 1,031 families falling into the $100,000 to $149,999 income range, which is the most common income bracket and makes up 22.1% of all families. Conversely, the $10,000 to $14,999 income bracket is the least frequent group with only 75 families (1.6%) belonging to this category.
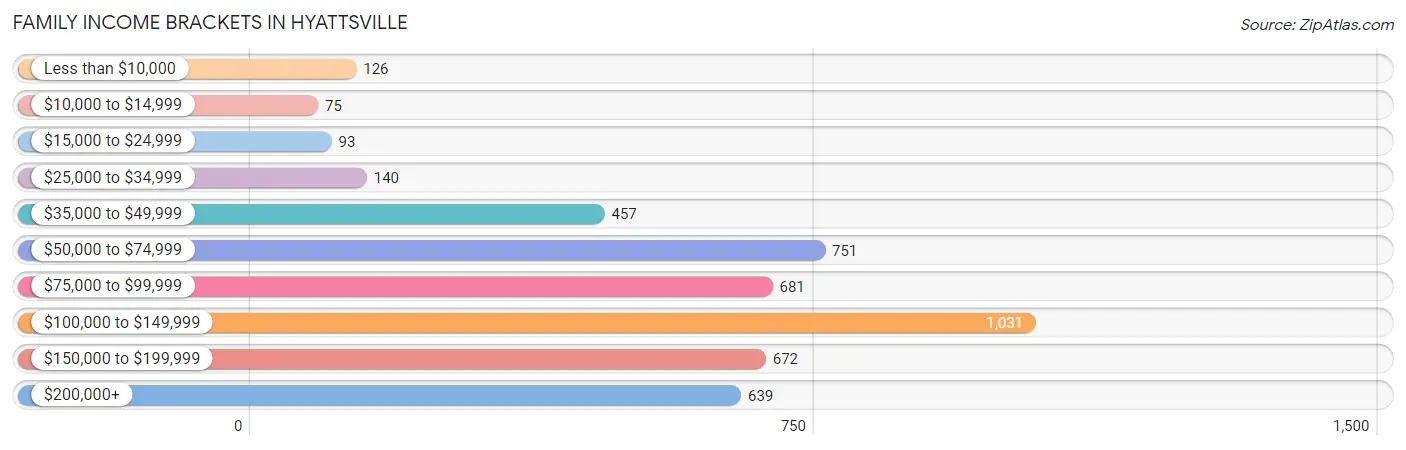
| Income Bracket | # Families | % Families |
| Less than $10,000 | 126 | 2.7% |
| $10,000 to $14,999 | 75 | 1.6% |
| $15,000 to $24,999 | 93 | 2.0% |
| $25,000 to $34,999 | 140 | 3.0% |
| $35,000 to $49,999 | 457 | 9.8% |
| $50,000 to $74,999 | 751 | 16.1% |
| $75,000 to $99,999 | 681 | 14.6% |
| $100,000 to $149,999 | 1,031 | 22.1% |
| $150,000 to $199,999 | 672 | 14.4% |
| $200,000+ | 639 | 13.7% |
Family Income by Famaliy Size in Hyattsville
7+ person families (164 | 3.5%) account for the highest median family income in Hyattsville with $138,906 per family, while 2-person families (2,272 | 48.7%) have the highest median income of $52,404 per family member.
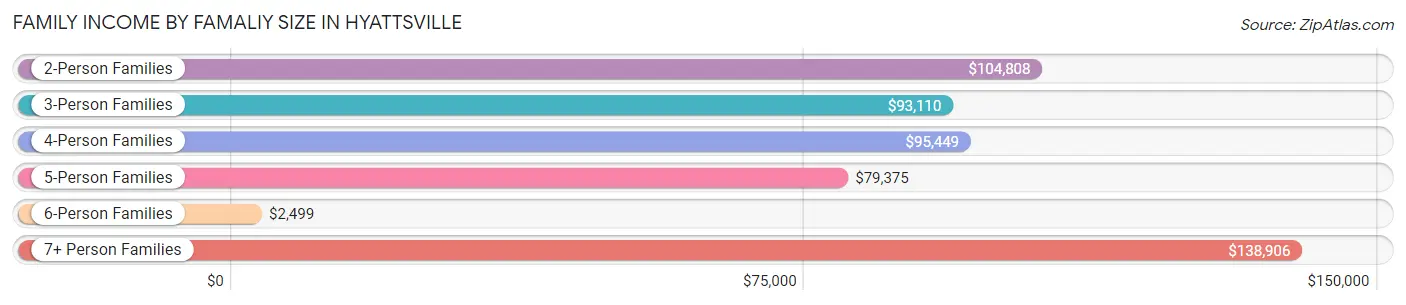
| Income Bracket | # Families | Median Income |
| 2-Person Families | 2,272 (48.7%) | $104,808 |
| 3-Person Families | 1,127 (24.2%) | $93,110 |
| 4-Person Families | 826 (17.7%) | $95,449 |
| 5-Person Families | 206 (4.4%) | $79,375 |
| 6-Person Families | 70 (1.5%) | $2,499 |
| 7+ Person Families | 164 (3.5%) | $138,906 |
| Total | 4,665 (100.0%) | $100,492 |
Family Income by Number of Earners in Hyattsville
The median family income in Hyattsville is $100,492, with families comprising 3+ earners (514) having the highest median family income of $153,553, while families with no earners (260) have the lowest median family income of $56,856, accounting for 11.0% and 5.6% of families, respectively.
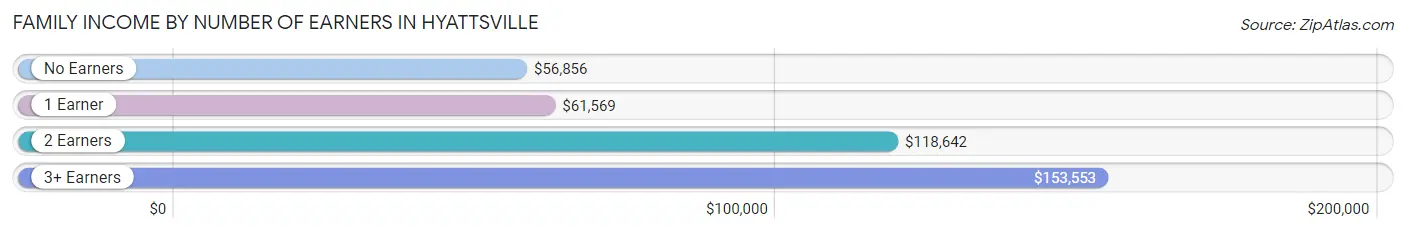
| Number of Earners | # Families | Median Income |
| No Earners | 260 (5.6%) | $56,856 |
| 1 Earner | 1,540 (33.0%) | $61,569 |
| 2 Earners | 2,351 (50.4%) | $118,642 |
| 3+ Earners | 514 (11.0%) | $153,553 |
| Total | 4,665 (100.0%) | $100,492 |
Household Income in Hyattsville
Household Income Brackets in Hyattsville
With 1,573 households falling in the category, the $100,000 to $149,999 income range is the most frequent in Hyattsville, accounting for 19.3% of all households. In contrast, only 130 households (1.6%) fall into the $10,000 to $14,999 income bracket, making it the least populous group.
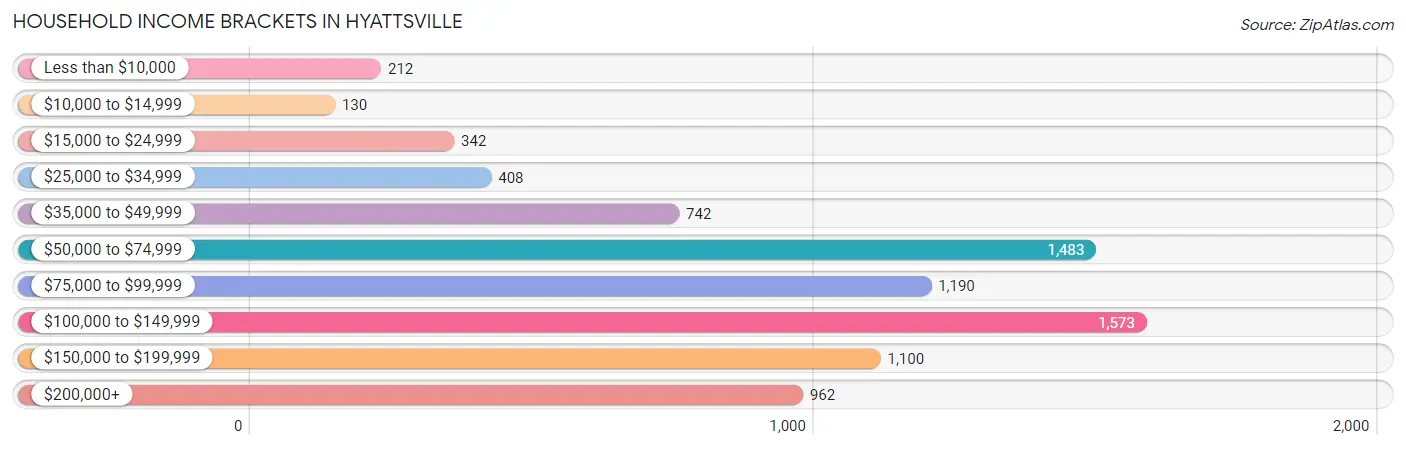
| Income Bracket | # Households | % Households |
| Less than $10,000 | 212 | 2.6% |
| $10,000 to $14,999 | 130 | 1.6% |
| $15,000 to $24,999 | 342 | 4.2% |
| $25,000 to $34,999 | 408 | 5.0% |
| $35,000 to $49,999 | 742 | 9.1% |
| $50,000 to $74,999 | 1,483 | 18.2% |
| $75,000 to $99,999 | 1,190 | 14.6% |
| $100,000 to $149,999 | 1,573 | 19.3% |
| $150,000 to $199,999 | 1,100 | 13.5% |
| $200,000+ | 962 | 11.8% |
Household Income by Householder Age in Hyattsville
The median household income in Hyattsville is $90,329, with the highest median household income of $96,461 found in the 25 to 44 years age bracket for the primary householder. A total of 3,699 households (45.4%) fall into this category. Meanwhile, the 65+ years age bracket for the primary householder has the lowest median household income of $57,149, with 1,423 households (17.5%) in this group.
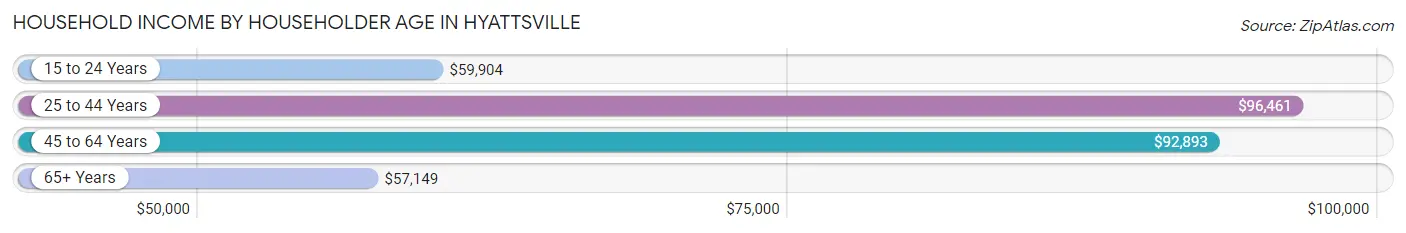
| Income Bracket | # Households | Median Income |
| 15 to 24 Years | 167 (2.1%) | $59,904 |
| 25 to 44 Years | 3,699 (45.4%) | $96,461 |
| 45 to 64 Years | 2,862 (35.1%) | $92,893 |
| 65+ Years | 1,423 (17.5%) | $57,149 |
| Total | 8,151 (100.0%) | $90,329 |
Poverty in Hyattsville
Income Below Poverty by Sex and Age in Hyattsville
With 8.3% poverty level for males and 8.6% for females among the residents of Hyattsville, 18 to 24 year old males and 45 to 54 year old females are the most vulnerable to poverty, with 113 males (21.2%) and 206 females (13.6%) in their respective age groups living below the poverty level.
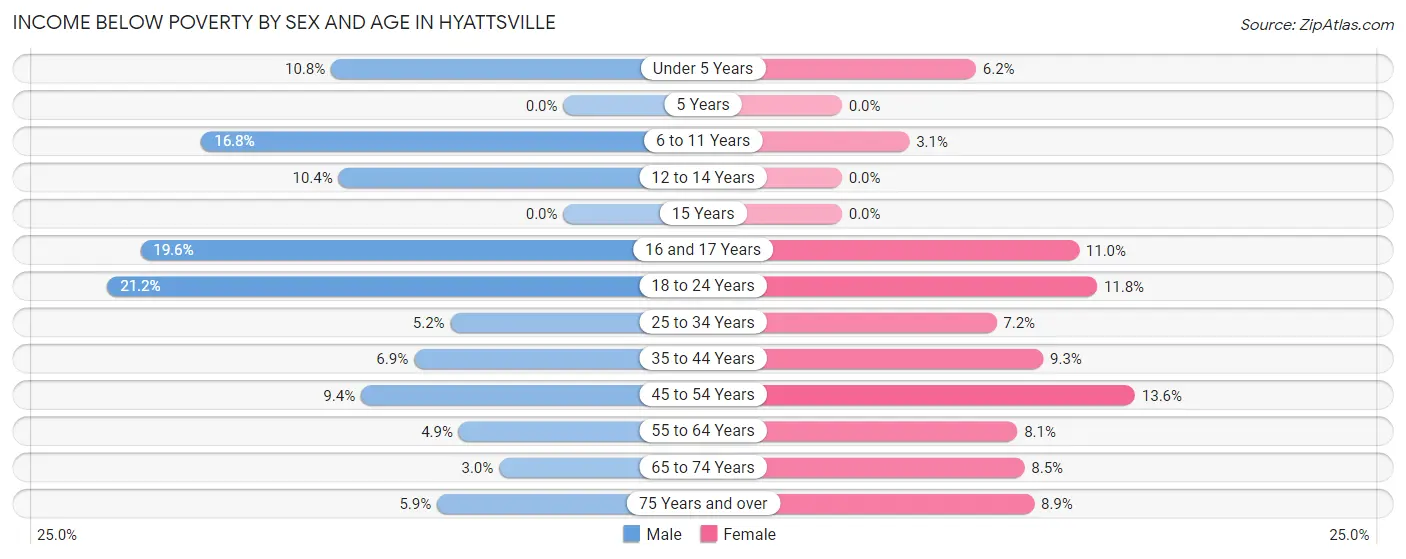
| Age Bracket | Male | Female |
| Under 5 Years | 86 (10.8%) | 38 (6.2%) |
| 5 Years | 0 (0.0%) | 0 (0.0%) |
| 6 to 11 Years | 108 (16.8%) | 23 (3.1%) |
| 12 to 14 Years | 36 (10.4%) | 0 (0.0%) |
| 15 Years | 0 (0.0%) | 0 (0.0%) |
| 16 and 17 Years | 64 (19.6%) | 11 (11.0%) |
| 18 to 24 Years | 113 (21.2%) | 85 (11.8%) |
| 25 to 34 Years | 137 (5.2%) | 139 (7.2%) |
| 35 to 44 Years | 141 (6.9%) | 135 (9.3%) |
| 45 to 54 Years | 134 (9.4%) | 206 (13.6%) |
| 55 to 64 Years | 45 (4.9%) | 93 (8.1%) |
| 65 to 74 Years | 21 (3.0%) | 72 (8.5%) |
| 75 Years and over | 17 (5.9%) | 28 (8.9%) |
| Total | 902 (8.3%) | 830 (8.6%) |
Income Above Poverty by Sex and Age in Hyattsville
According to the poverty statistics in Hyattsville, males aged 5 years and females aged 5 years are the age groups that are most secure financially, with 100.0% of males and 100.0% of females in these age groups living above the poverty line.
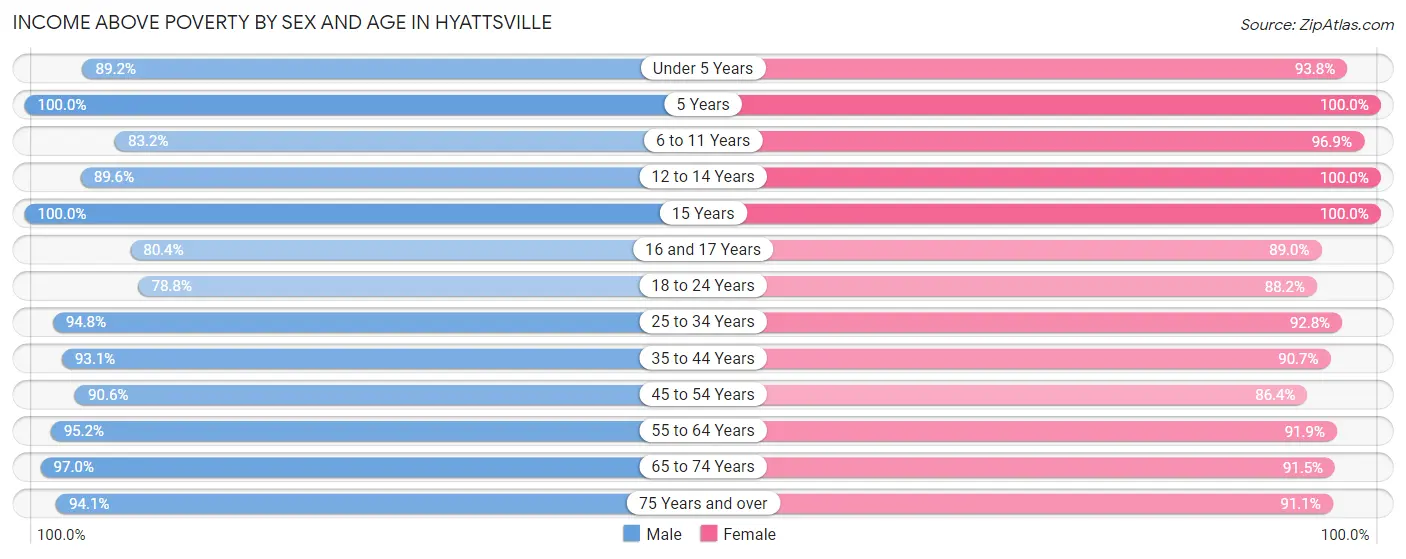
| Age Bracket | Male | Female |
| Under 5 Years | 712 (89.2%) | 573 (93.8%) |
| 5 Years | 114 (100.0%) | 16 (100.0%) |
| 6 to 11 Years | 535 (83.2%) | 712 (96.9%) |
| 12 to 14 Years | 309 (89.6%) | 214 (100.0%) |
| 15 Years | 84 (100.0%) | 16 (100.0%) |
| 16 and 17 Years | 262 (80.4%) | 89 (89.0%) |
| 18 to 24 Years | 421 (78.8%) | 633 (88.2%) |
| 25 to 34 Years | 2,479 (94.8%) | 1,800 (92.8%) |
| 35 to 44 Years | 1,893 (93.1%) | 1,310 (90.7%) |
| 45 to 54 Years | 1,293 (90.6%) | 1,309 (86.4%) |
| 55 to 64 Years | 883 (95.2%) | 1,049 (91.9%) |
| 65 to 74 Years | 684 (97.0%) | 778 (91.5%) |
| 75 Years and over | 273 (94.1%) | 286 (91.1%) |
| Total | 9,942 (91.7%) | 8,785 (91.4%) |
Income Below Poverty Among Married-Couple Families in Hyattsville
The poverty statistics for married-couple families in Hyattsville show that 3.9% or 116 of the total 2,977 families live below the poverty line. Families with 3 or 4 children have the highest poverty rate of 18.9%, comprising of 23 families. On the other hand, families with 5 or more children have the lowest poverty rate of 0.0%, which includes 0 families.
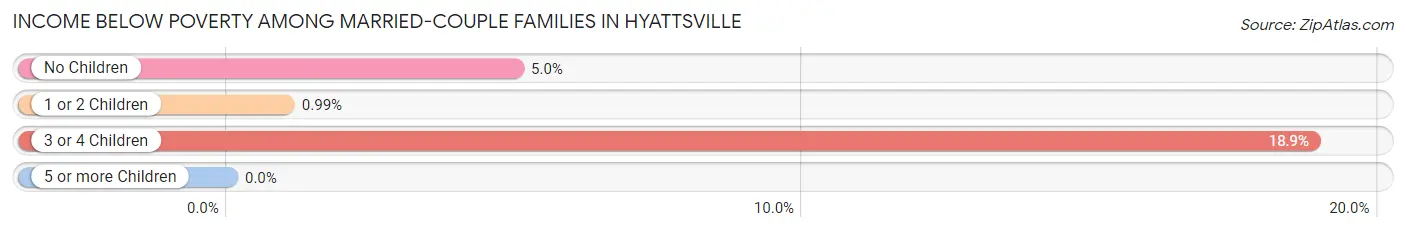
| Children | Above Poverty | Below Poverty |
| No Children | 1,547 (95.0%) | 81 (5.0%) |
| 1 or 2 Children | 1,199 (99.0%) | 12 (1.0%) |
| 3 or 4 Children | 99 (81.1%) | 23 (18.9%) |
| 5 or more Children | 16 (100.0%) | 0 (0.0%) |
| Total | 2,861 (96.1%) | 116 (3.9%) |
Income Below Poverty Among Single-Parent Households in Hyattsville
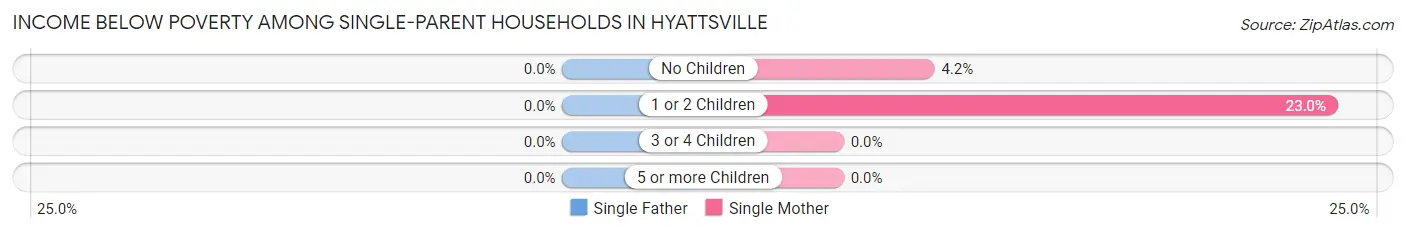
| Children | Single Father | Single Mother |
| No Children | 0 (0.0%) | 33 (4.2%) |
| 1 or 2 Children | 0 (0.0%) | 75 (23.0%) |
| 3 or 4 Children | 0 (0.0%) | 0 (0.0%) |
| 5 or more Children | 0 (0.0%) | 0 (0.0%) |
| Total | 0 (0.0%) | 108 (9.8%) |
Income Below Poverty Among Married-Couple vs Single-Parent Households in Hyattsville
The poverty data for Hyattsville shows that 116 of the married-couple family households (3.9%) and 108 of the single-parent households (6.4%) are living below the poverty level. Within the married-couple family households, those with 3 or 4 children have the highest poverty rate, with 23 households (18.9%) falling below the poverty line. Among the single-parent households, those with 1 or 2 children have the highest poverty rate, with 75 household (12.0%) living below poverty.
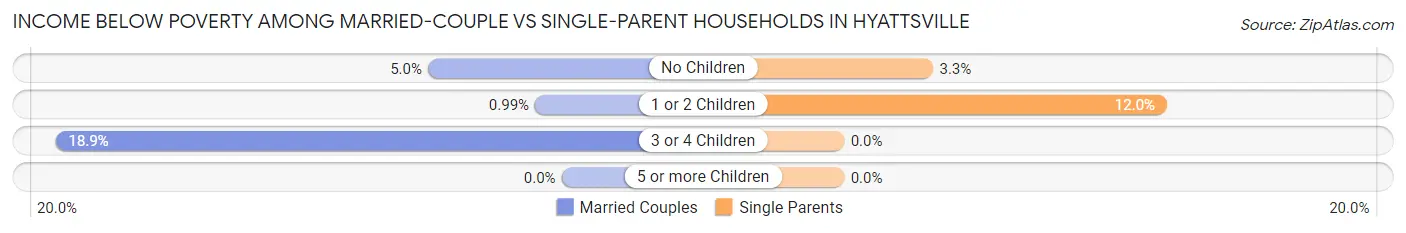
| Children | Married-Couple Families | Single-Parent Households |
| No Children | 81 (5.0%) | 33 (3.3%) |
| 1 or 2 Children | 12 (1.0%) | 75 (12.0%) |
| 3 or 4 Children | 23 (18.9%) | 0 (0.0%) |
| 5 or more Children | 0 (0.0%) | 0 (0.0%) |
| Total | 116 (3.9%) | 108 (6.4%) |
Race in Hyattsville
The most populous races in Hyattsville are Hispanic or Latino (7,351 | 35.2%), White / Caucasian (6,122 | 29.4%), and Black / African American (5,882 | 28.2%).
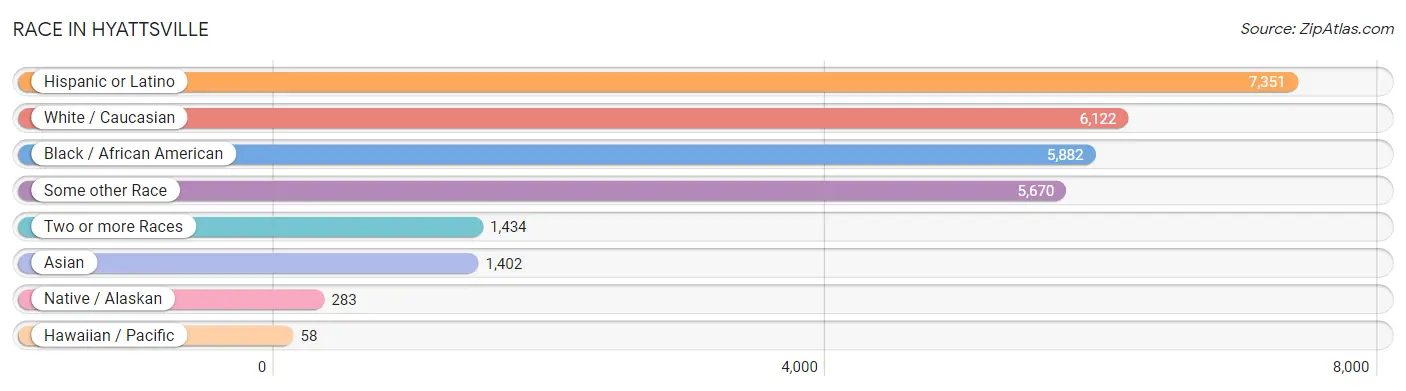
| Race | # Population | % Population |
| Asian | 1,402 | 6.7% |
| Black / African American | 5,882 | 28.2% |
| Hawaiian / Pacific | 58 | 0.3% |
| Hispanic or Latino | 7,351 | 35.2% |
| Native / Alaskan | 283 | 1.4% |
| White / Caucasian | 6,122 | 29.4% |
| Two or more Races | 1,434 | 6.9% |
| Some other Race | 5,670 | 27.2% |
| Total | 20,851 | 100.0% |
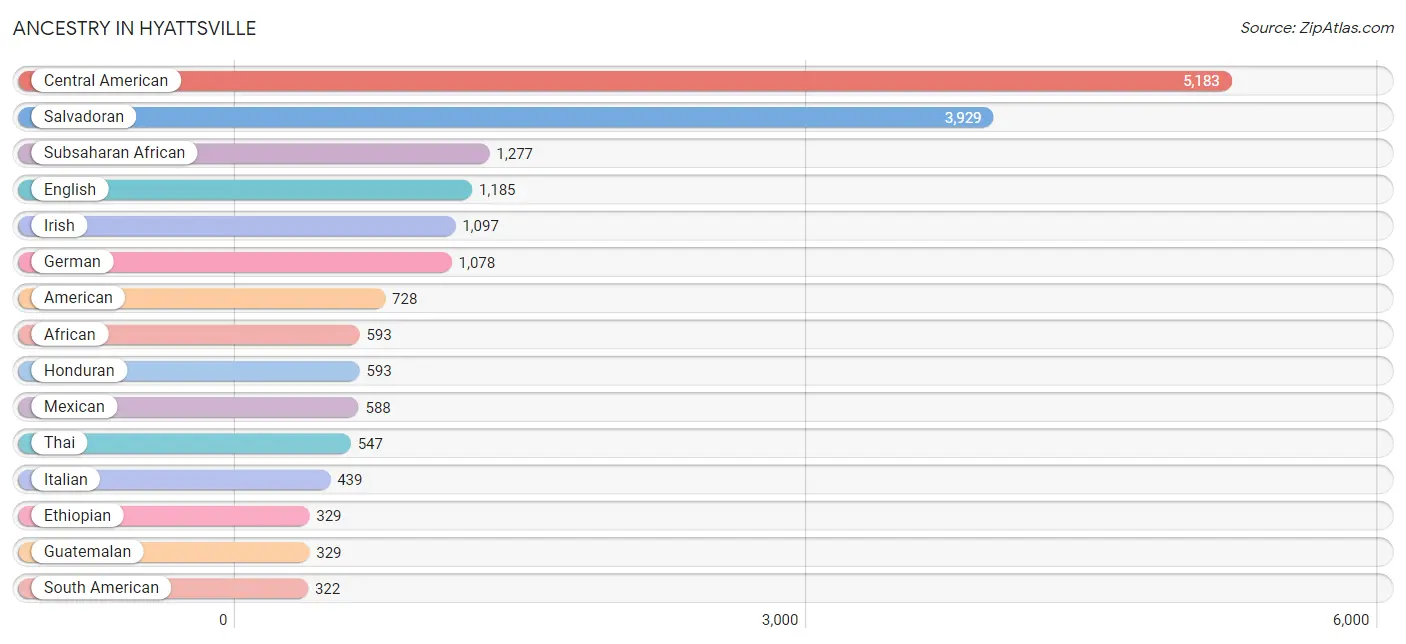
Ancestry in Hyattsville
The most populous ancestries reported in Hyattsville are Central American (5,183 | 24.9%), Salvadoran (3,929 | 18.8%), Subsaharan African (1,277 | 6.1%), English (1,185 | 5.7%), and Irish (1,097 | 5.3%), together accounting for 60.8% of all Hyattsville residents.
| Ancestry | # Population | % Population |
| African | 593 | 2.8% |
| American | 728 | 3.5% |
| Apache | 79 | 0.4% |
| Arab | 113 | 0.5% |
| Argentinean | 124 | 0.6% |
| Armenian | 14 | 0.1% |
| Australian | 16 | 0.1% |
| Austrian | 38 | 0.2% |
| Barbadian | 18 | 0.1% |
| Basque | 59 | 0.3% |
| Belgian | 11 | 0.1% |
| Bhutanese | 40 | 0.2% |
| Blackfeet | 19 | 0.1% |
| Bolivian | 41 | 0.2% |
| Brazilian | 58 | 0.3% |
| British | 127 | 0.6% |
| British West Indian | 58 | 0.3% |
| Burmese | 84 | 0.4% |
| Central American | 5,183 | 24.9% |
| Central American Indian | 179 | 0.9% |
| Cherokee | 14 | 0.1% |
| Choctaw | 20 | 0.1% |
| Colombian | 98 | 0.5% |
| Costa Rican | 24 | 0.1% |
| Cuban | 134 | 0.6% |
| Czech | 69 | 0.3% |
| Czechoslovakian | 11 | 0.1% |
| Danish | 112 | 0.5% |
| Delaware | 7 | 0.0% |
| Dominican | 168 | 0.8% |
| Dutch | 164 | 0.8% |
| Eastern European | 107 | 0.5% |
| English | 1,185 | 5.7% |
| Ethiopian | 329 | 1.6% |
| European | 215 | 1.0% |
| French | 189 | 0.9% |
| French Canadian | 35 | 0.2% |
| German | 1,078 | 5.2% |
| Greek | 5 | 0.0% |
| Guatemalan | 329 | 1.6% |
| Guyanese | 76 | 0.4% |
| Haitian | 46 | 0.2% |
| Honduran | 593 | 2.8% |
| Hungarian | 51 | 0.2% |
| Indian (Asian) | 185 | 0.9% |
| Iranian | 58 | 0.3% |
| Irish | 1,097 | 5.3% |
| Italian | 439 | 2.1% |
| Jamaican | 266 | 1.3% |
| Kenyan | 19 | 0.1% |
| Korean | 109 | 0.5% |
| Laotian | 7 | 0.0% |
| Lebanese | 20 | 0.1% |
| Lithuanian | 53 | 0.3% |
| Mexican | 588 | 2.8% |
| Mexican American Indian | 16 | 0.1% |
| Native Hawaiian | 3 | 0.0% |
| Nicaraguan | 308 | 1.5% |
| Nigerian | 293 | 1.4% |
| Northern European | 26 | 0.1% |
| Norwegian | 37 | 0.2% |
| Pakistani | 11 | 0.1% |
| Peruvian | 40 | 0.2% |
| Polish | 320 | 1.5% |
| Portuguese | 93 | 0.4% |
| Puerto Rican | 289 | 1.4% |
| Romanian | 18 | 0.1% |
| Russian | 78 | 0.4% |
| Salvadoran | 3,929 | 18.8% |
| Samoan | 69 | 0.3% |
| Scandinavian | 24 | 0.1% |
| Scotch-Irish | 134 | 0.6% |
| Scottish | 143 | 0.7% |
| Serbian | 54 | 0.3% |
| Sierra Leonean | 18 | 0.1% |
| South American | 322 | 1.5% |
| Spaniard | 159 | 0.8% |
| Spanish | 173 | 0.8% |
| Sri Lankan | 145 | 0.7% |
| Subsaharan African | 1,277 | 6.1% |
| Swedish | 47 | 0.2% |
| Swiss | 31 | 0.2% |
| Syrian | 9 | 0.0% |
| Thai | 547 | 2.6% |
| Trinidadian and Tobagonian | 87 | 0.4% |
| Ukrainian | 34 | 0.2% |
| Venezuelan | 19 | 0.1% |
| Vietnamese | 9 | 0.0% |
| Welsh | 22 | 0.1% | View All 89 Rows |
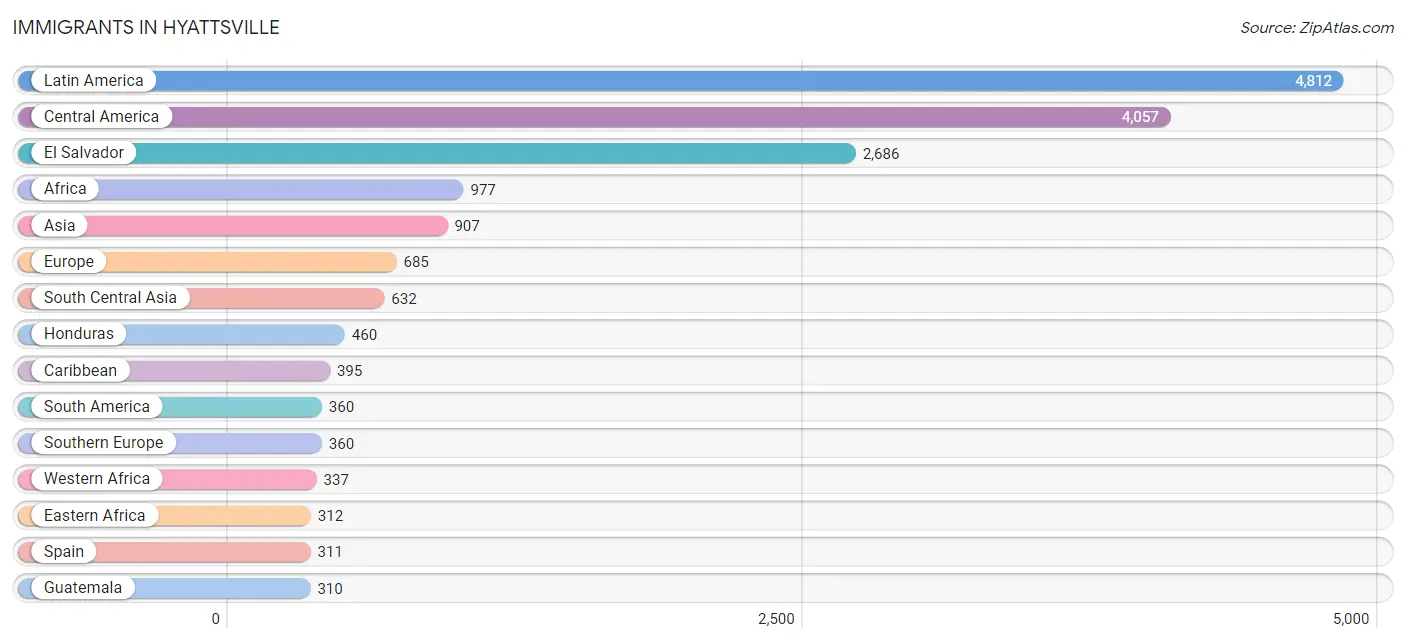
Immigrants in Hyattsville
The most numerous immigrant groups reported in Hyattsville came from Latin America (4,812 | 23.1%), Central America (4,057 | 19.5%), El Salvador (2,686 | 12.9%), Africa (977 | 4.7%), and Asia (907 | 4.3%), together accounting for 64.5% of all Hyattsville residents.
| Immigration Origin | # Population | % Population |
| Africa | 977 | 4.7% |
| Argentina | 83 | 0.4% |
| Asia | 907 | 4.3% |
| Australia | 16 | 0.1% |
| Bangladesh | 178 | 0.9% |
| Barbados | 18 | 0.1% |
| Belgium | 5 | 0.0% |
| Bolivia | 29 | 0.1% |
| Bosnia and Herzegovina | 39 | 0.2% |
| Brazil | 47 | 0.2% |
| Cameroon | 73 | 0.4% |
| Canada | 12 | 0.1% |
| Caribbean | 395 | 1.9% |
| Central America | 4,057 | 19.5% |
| China | 59 | 0.3% |
| Colombia | 83 | 0.4% |
| Dominican Republic | 89 | 0.4% |
| Eastern Africa | 312 | 1.5% |
| Eastern Asia | 77 | 0.4% |
| Eastern Europe | 114 | 0.5% |
| El Salvador | 2,686 | 12.9% |
| Ethiopia | 293 | 1.4% |
| Europe | 685 | 3.3% |
| Germany | 24 | 0.1% |
| Ghana | 126 | 0.6% |
| Guatemala | 310 | 1.5% |
| Guyana | 90 | 0.4% |
| Haiti | 40 | 0.2% |
| Honduras | 460 | 2.2% |
| Hong Kong | 12 | 0.1% |
| India | 151 | 0.7% |
| Indonesia | 7 | 0.0% |
| Ireland | 2 | 0.0% |
| Italy | 49 | 0.2% |
| Jamaica | 115 | 0.5% |
| Jordan | 38 | 0.2% |
| Kenya | 19 | 0.1% |
| Korea | 18 | 0.1% |
| Kuwait | 16 | 0.1% |
| Latin America | 4,812 | 23.1% |
| Lebanon | 15 | 0.1% |
| Mexico | 310 | 1.5% |
| Middle Africa | 73 | 0.4% |
| Nepal | 14 | 0.1% |
| Nicaragua | 291 | 1.4% |
| Nigeria | 151 | 0.7% |
| Northern Europe | 21 | 0.1% |
| Oceania | 16 | 0.1% |
| Pakistan | 289 | 1.4% |
| Peru | 28 | 0.1% |
| Philippines | 37 | 0.2% |
| Romania | 9 | 0.0% |
| Russia | 19 | 0.1% |
| Sierra Leone | 18 | 0.1% |
| South America | 360 | 1.7% |
| South Central Asia | 632 | 3.0% |
| South Eastern Asia | 114 | 0.5% |
| Southern Europe | 360 | 1.7% |
| Spain | 311 | 1.5% |
| Switzerland | 102 | 0.5% |
| Trinidad and Tobago | 93 | 0.4% |
| Vietnam | 66 | 0.3% |
| Western Africa | 337 | 1.6% |
| Western Asia | 69 | 0.3% |
| Western Europe | 190 | 0.9% | View All 65 Rows |
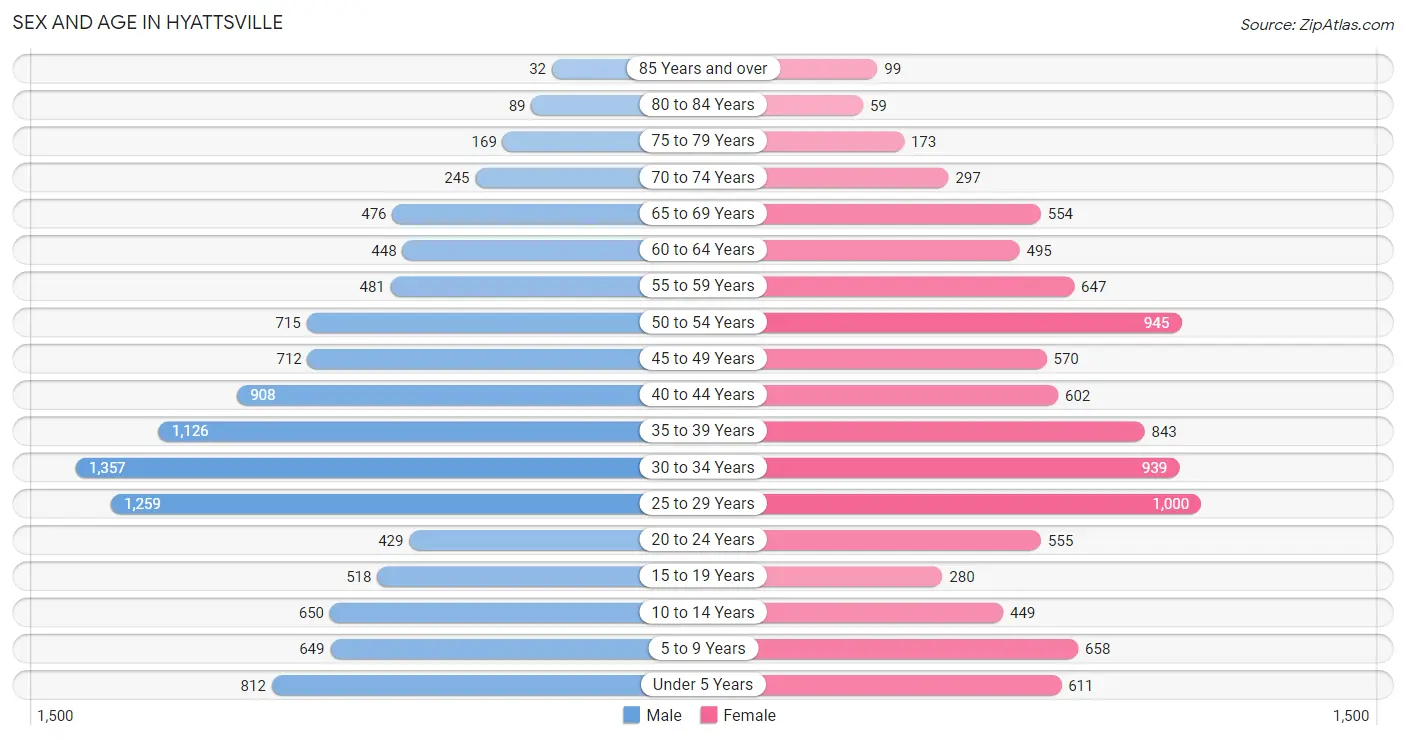
Sex and Age in Hyattsville
Sex and Age in Hyattsville
The most populous age groups in Hyattsville are 30 to 34 Years (1,357 | 12.2%) for men and 25 to 29 Years (1,000 | 10.2%) for women.
| Age Bracket | Male | Female |
| Under 5 Years | 812 (7.3%) | 611 (6.2%) |
| 5 to 9 Years | 649 (5.9%) | 658 (6.7%) |
| 10 to 14 Years | 650 (5.9%) | 449 (4.6%) |
| 15 to 19 Years | 518 (4.7%) | 280 (2.9%) |
| 20 to 24 Years | 429 (3.9%) | 555 (5.7%) |
| 25 to 29 Years | 1,259 (11.4%) | 1,000 (10.2%) |
| 30 to 34 Years | 1,357 (12.2%) | 939 (9.6%) |
| 35 to 39 Years | 1,126 (10.2%) | 843 (8.6%) |
| 40 to 44 Years | 908 (8.2%) | 602 (6.2%) |
| 45 to 49 Years | 712 (6.4%) | 570 (5.8%) |
| 50 to 54 Years | 715 (6.5%) | 945 (9.7%) |
| 55 to 59 Years | 481 (4.3%) | 647 (6.6%) |
| 60 to 64 Years | 448 (4.1%) | 495 (5.1%) |
| 65 to 69 Years | 476 (4.3%) | 554 (5.7%) |
| 70 to 74 Years | 245 (2.2%) | 297 (3.0%) |
| 75 to 79 Years | 169 (1.5%) | 173 (1.8%) |
| 80 to 84 Years | 89 (0.8%) | 59 (0.6%) |
| 85 Years and over | 32 (0.3%) | 99 (1.0%) |
| Total | 11,075 (100.0%) | 9,776 (100.0%) |
Families and Households in Hyattsville
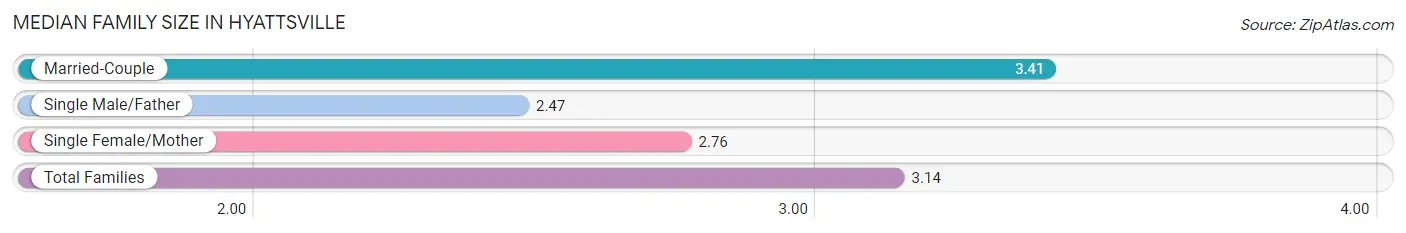
Median Family Size in Hyattsville
The median family size in Hyattsville is 3.14 persons per family, with married-couple families (2,977 | 63.8%) accounting for the largest median family size of 3.41 persons per family. On the other hand, single male/father families (580 | 12.4%) represent the smallest median family size with 2.47 persons per family.
| Family Type | # Families | Family Size |
| Married-Couple | 2,977 (63.8%) | 3.41 |
| Single Male/Father | 580 (12.4%) | 2.47 |
| Single Female/Mother | 1,108 (23.7%) | 2.76 |
| Total Families | 4,665 (100.0%) | 3.14 |
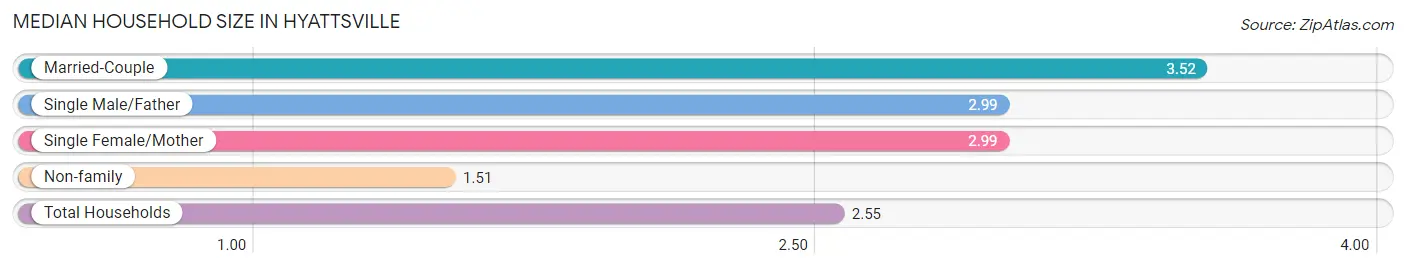
Median Household Size in Hyattsville
The median household size in Hyattsville is 2.55 persons per household, with married-couple households (2,977 | 36.5%) accounting for the largest median household size of 3.52 persons per household. non-family households (3,486 | 42.8%) represent the smallest median household size with 1.51 persons per household.
| Household Type | # Households | Household Size |
| Married-Couple | 2,977 (36.5%) | 3.52 |
| Single Male/Father | 580 (7.1%) | 2.99 |
| Single Female/Mother | 1,108 (13.6%) | 2.99 |
| Non-family | 3,486 (42.8%) | 1.51 |
| Total Households | 8,151 (100.0%) | 2.55 |
Household Size by Marriage Status in Hyattsville
Out of a total of 8,151 households in Hyattsville, 4,665 (57.2%) are family households, while 3,486 (42.8%) are nonfamily households. The most numerous type of family households are 2-person households, comprising 2,036, and the most common type of nonfamily households are 1-person households, comprising 2,456.
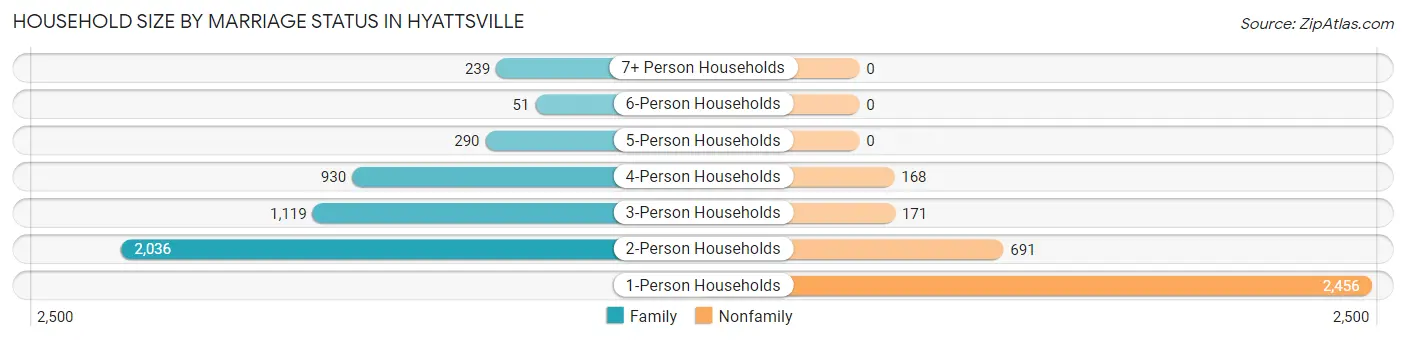
| Household Size | Family Households | Nonfamily Households |
| 1-Person Households | - | 2,456 (30.1%) |
| 2-Person Households | 2,036 (25.0%) | 691 (8.5%) |
| 3-Person Households | 1,119 (13.7%) | 171 (2.1%) |
| 4-Person Households | 930 (11.4%) | 168 (2.1%) |
| 5-Person Households | 290 (3.6%) | 0 (0.0%) |
| 6-Person Households | 51 (0.6%) | 0 (0.0%) |
| 7+ Person Households | 239 (2.9%) | 0 (0.0%) |
| Total | 4,665 (57.2%) | 3,486 (42.8%) |
Female Fertility in Hyattsville
Fertility by Age in Hyattsville
Average fertility rate in Hyattsville is 91.0 births per 1,000 women. Women in the age bracket of 20 to 34 years have the highest fertility rate with 143.0 births per 1,000 women. Women in the age bracket of 20 to 34 years acount for 80.6% of all women with births.
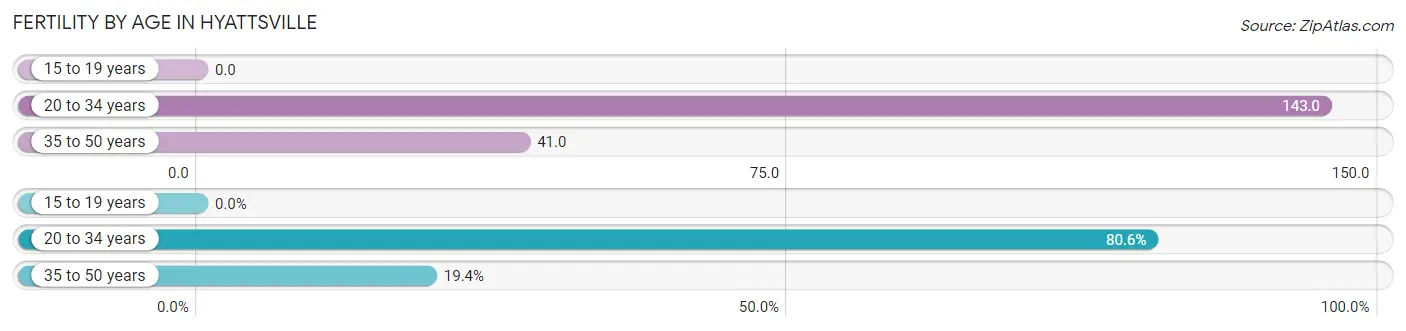
| Age Bracket | Women with Births | Births / 1,000 Women |
| 15 to 19 years | 0 (0.0%) | 0.0 |
| 20 to 34 years | 357 (80.6%) | 143.0 |
| 35 to 50 years | 86 (19.4%) | 41.0 |
| Total | 443 (100.0%) | 91.0 |
Fertility by Age by Marriage Status in Hyattsville
57.8% of women with births (443) in Hyattsville are married. The highest percentage of unmarried women with births falls into 20 to 34 years age bracket with 45.1% of them unmarried at the time of birth, while the lowest percentage of unmarried women with births belong to 35 to 50 years age bracket with 30.2% of them unmarried.
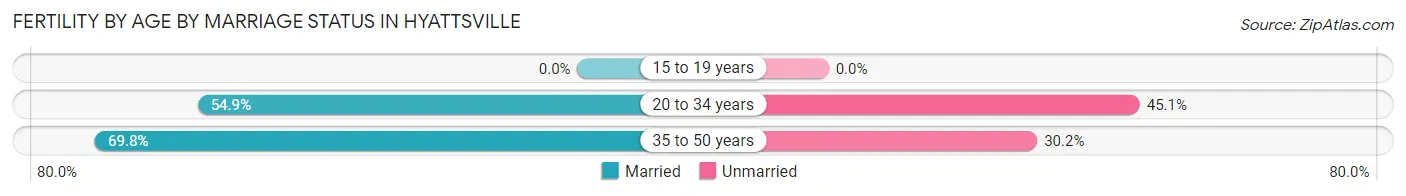
| Age Bracket | Married | Unmarried |
| 15 to 19 years | 0 (0.0%) | 0 (0.0%) |
| 20 to 34 years | 196 (54.9%) | 161 (45.1%) |
| 35 to 50 years | 60 (69.8%) | 26 (30.2%) |
| Total | 256 (57.8%) | 187 (42.2%) |
Fertility by Education in Hyattsville
Average fertility rate in Hyattsville is 91.0 births per 1,000 women. Women with the education attainment of high school diploma have the highest fertility rate of 115.0 births per 1,000 women, while women with the education attainment of less than high school have the lowest fertility at 35.0 births per 1,000 women. Women with the education attainment of bachelor's degree represent 32.7% of all women with births.
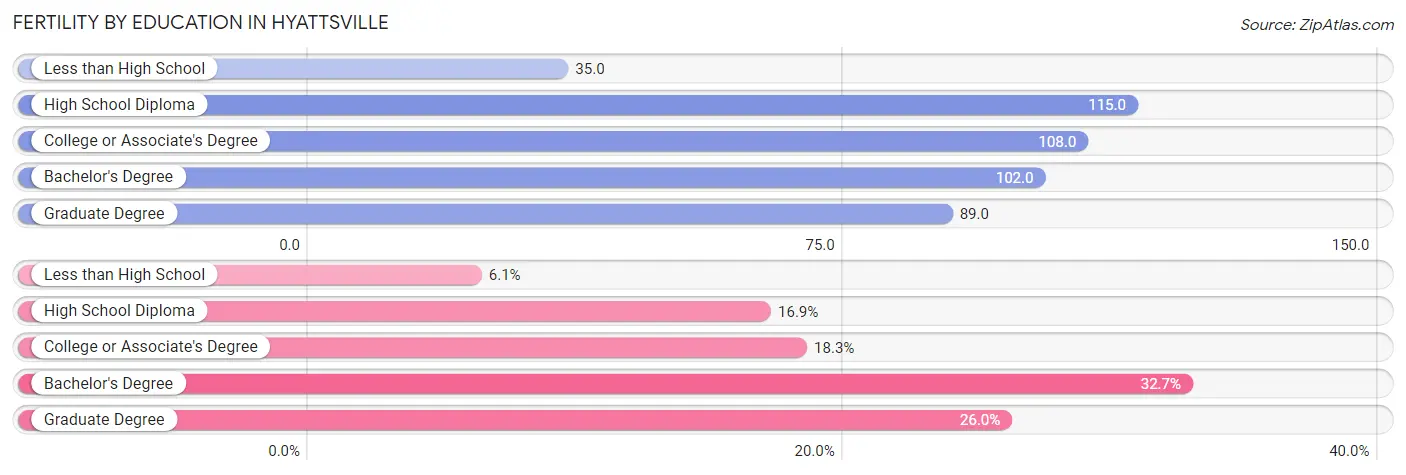
| Educational Attainment | Women with Births | Births / 1,000 Women |
| Less than High School | 27 (6.1%) | 35.0 |
| High School Diploma | 75 (16.9%) | 115.0 |
| College or Associate's Degree | 81 (18.3%) | 108.0 |
| Bachelor's Degree | 145 (32.7%) | 102.0 |
| Graduate Degree | 115 (26.0%) | 89.0 |
| Total | 443 (100.0%) | 91.0 |
Fertility by Education by Marriage Status in Hyattsville
42.2% of women with births in Hyattsville are unmarried. Women with the educational attainment of high school diploma are most likely to be married with 100.0% of them married at childbirth, while women with the educational attainment of college or associate's degree are least likely to be married with 100.0% of them unmarried at childbirth.
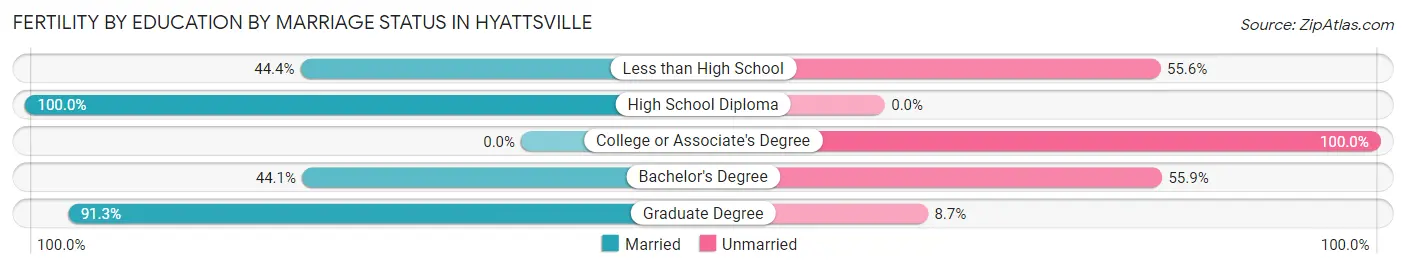
| Educational Attainment | Married | Unmarried |
| Less than High School | 12 (44.4%) | 15 (55.6%) |
| High School Diploma | 75 (100.0%) | 0 (0.0%) |
| College or Associate's Degree | 0 (0.0%) | 81 (100.0%) |
| Bachelor's Degree | 64 (44.1%) | 81 (55.9%) |
| Graduate Degree | 105 (91.3%) | 10 (8.7%) |
| Total | 256 (57.8%) | 187 (42.2%) |
Employment Characteristics in Hyattsville
Employment by Class of Employer in Hyattsville
Among the 12,138 employed individuals in Hyattsville, private company employees (7,204 | 59.4%), federal government employees (1,452 | 12.0%), and not-for-profit organizations (1,433 | 11.8%) make up the most common classes of employment.
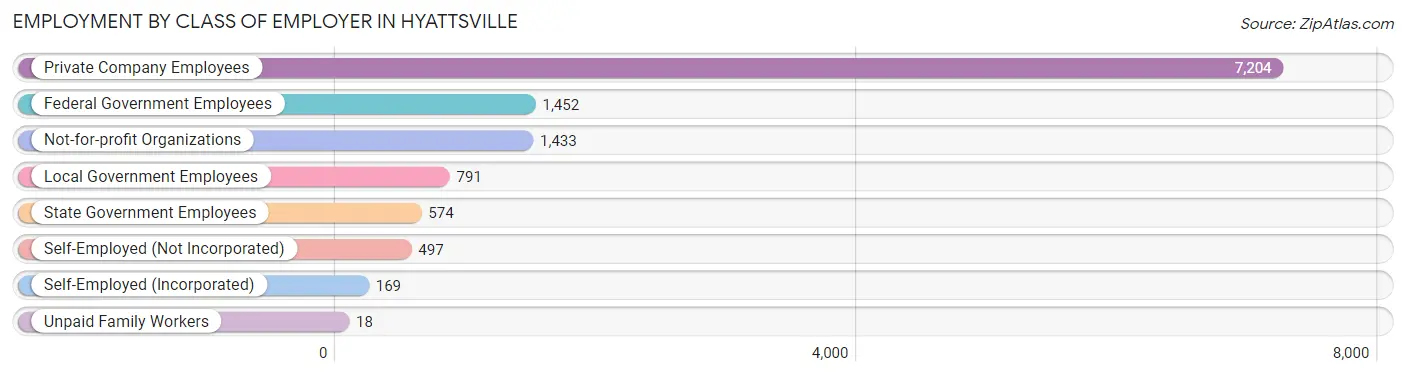
| Employer Class | # Employees | % Employees |
| Private Company Employees | 7,204 | 59.4% |
| Self-Employed (Incorporated) | 169 | 1.4% |
| Self-Employed (Not Incorporated) | 497 | 4.1% |
| Not-for-profit Organizations | 1,433 | 11.8% |
| Local Government Employees | 791 | 6.5% |
| State Government Employees | 574 | 4.7% |
| Federal Government Employees | 1,452 | 12.0% |
| Unpaid Family Workers | 18 | 0.2% |
| Total | 12,138 | 100.0% |
Employment Status by Age in Hyattsville
According to the labor force statistics for Hyattsville, out of the total population over 16 years of age (16,922), 76.3% or 12,911 individuals are in the labor force, with 2.8% or 362 of them unemployed. The age group with the highest labor force participation rate is 25 to 29 years, with 90.5% or 2,044 individuals in the labor force. Within the labor force, the 16 to 19 years age range has the highest percentage of unemployed individuals, with 12.6% or 25 of them being unemployed.
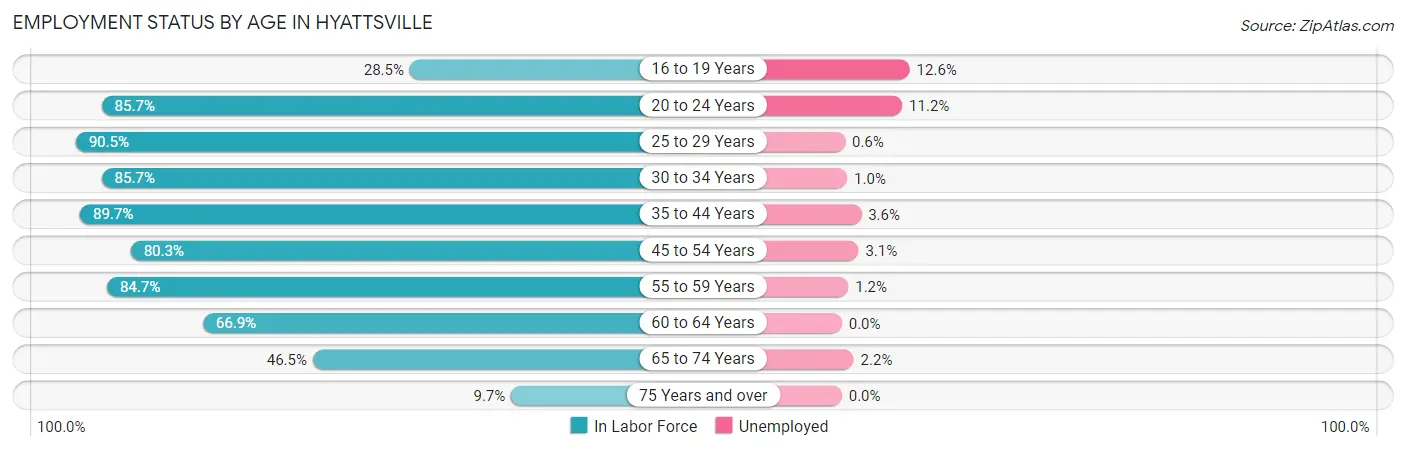
| Age Bracket | In Labor Force | Unemployed |
| 16 to 19 Years | 199 (28.5%) | 25 (12.6%) |
| 20 to 24 Years | 843 (85.7%) | 94 (11.2%) |
| 25 to 29 Years | 2,044 (90.5%) | 12 (0.6%) |
| 30 to 34 Years | 1,968 (85.7%) | 20 (1.0%) |
| 35 to 44 Years | 3,121 (89.7%) | 112 (3.6%) |
| 45 to 54 Years | 2,362 (80.3%) | 73 (3.1%) |
| 55 to 59 Years | 955 (84.7%) | 11 (1.2%) |
| 60 to 64 Years | 631 (66.9%) | 0 (0.0%) |
| 65 to 74 Years | 731 (46.5%) | 16 (2.2%) |
| 75 Years and over | 60 (9.7%) | 0 (0.0%) |
| Total | 12,911 (76.3%) | 362 (2.8%) |
Employment Status by Educational Attainment in Hyattsville
According to labor force statistics for Hyattsville, 84.9% of individuals (11,077) out of the total population between 25 and 64 years of age (13,047) are in the labor force, with 2.1% or 233 of them being unemployed. The group with the highest labor force participation rate are those with the educational attainment of bachelor's degree or higher, with 88.0% or 5,490 individuals in the labor force. Within the labor force, individuals with college / associate degree education have the highest percentage of unemployment, with 6.5% or 129 of them being unemployed.
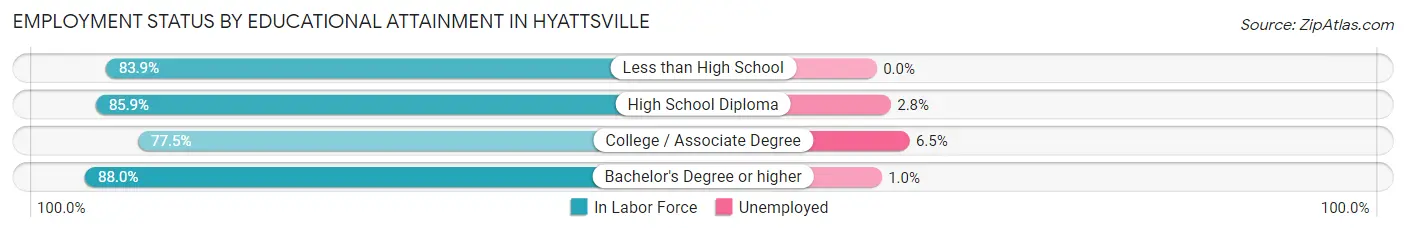
| Educational Attainment | In Labor Force | Unemployed |
| Less than High School | 2,015 (83.9%) | 0 (0.0%) |
| High School Diploma | 1,593 (85.9%) | 52 (2.8%) |
| College / Associate Degree | 1,977 (77.5%) | 166 (6.5%) |
| Bachelor's Degree or higher | 5,490 (88.0%) | 62 (1.0%) |
| Total | 11,077 (84.9%) | 274 (2.1%) |
Employment Occupations by Sex in Hyattsville
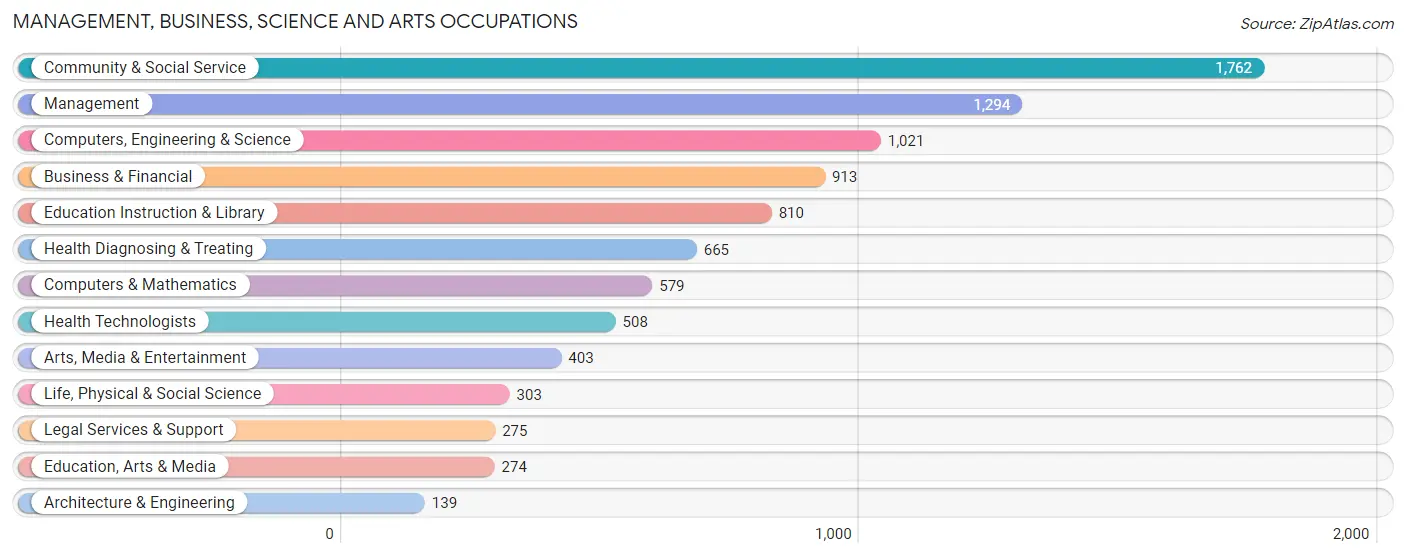
Management, Business, Science and Arts Occupations
The most common Management, Business, Science and Arts occupations in Hyattsville are Community & Social Service (1,762 | 14.1%), Management (1,294 | 10.3%), Computers, Engineering & Science (1,021 | 8.2%), Business & Financial (913 | 7.3%), and Education Instruction & Library (810 | 6.5%).
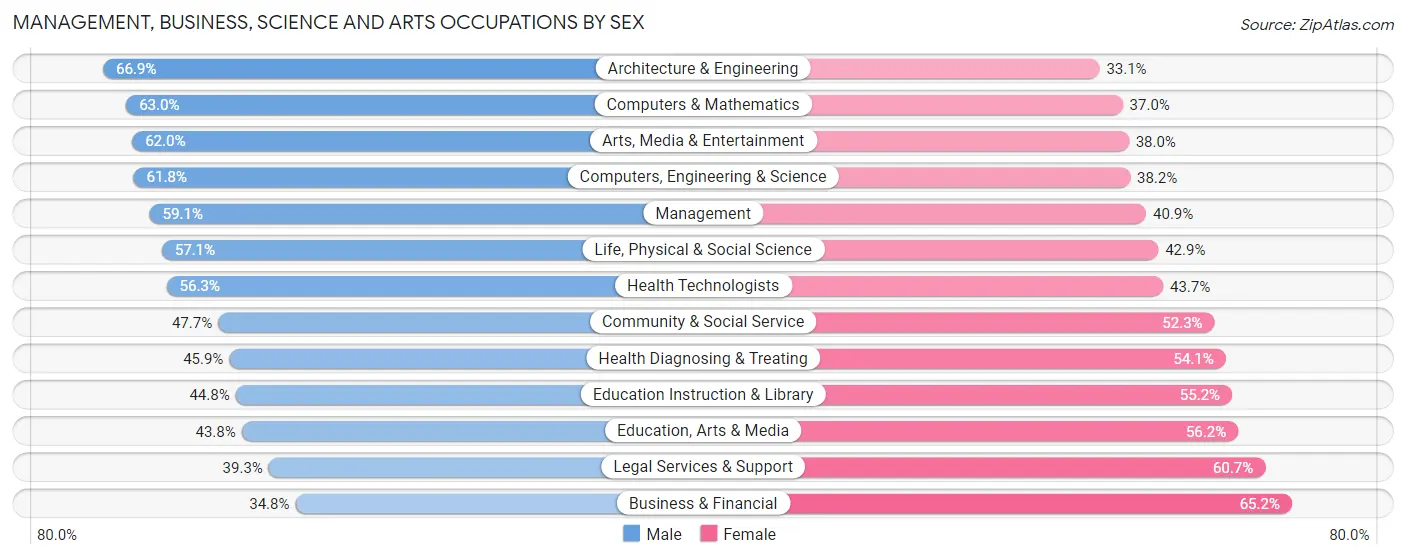
Management, Business, Science and Arts Occupations by Sex
Within the Management, Business, Science and Arts occupations in Hyattsville, the most male-oriented occupations are Architecture & Engineering (66.9%), Computers & Mathematics (63.0%), and Arts, Media & Entertainment (62.0%), while the most female-oriented occupations are Business & Financial (65.2%), Legal Services & Support (60.7%), and Education, Arts & Media (56.2%).
| Occupation | Male | Female |
| Management | 765 (59.1%) | 529 (40.9%) |
| Business & Financial | 318 (34.8%) | 595 (65.2%) |
| Computers, Engineering & Science | 631 (61.8%) | 390 (38.2%) |
| Computers & Mathematics | 365 (63.0%) | 214 (37.0%) |
| Architecture & Engineering | 93 (66.9%) | 46 (33.1%) |
| Life, Physical & Social Science | 173 (57.1%) | 130 (42.9%) |
| Community & Social Service | 841 (47.7%) | 921 (52.3%) |
| Education, Arts & Media | 120 (43.8%) | 154 (56.2%) |
| Legal Services & Support | 108 (39.3%) | 167 (60.7%) |
| Education Instruction & Library | 363 (44.8%) | 447 (55.2%) |
| Arts, Media & Entertainment | 250 (62.0%) | 153 (38.0%) |
| Health Diagnosing & Treating | 305 (45.9%) | 360 (54.1%) |
| Health Technologists | 286 (56.3%) | 222 (43.7%) |
| Total (Category) | 2,860 (50.6%) | 2,795 (49.4%) |
| Total (Overall) | 7,167 (57.2%) | 5,359 (42.8%) |
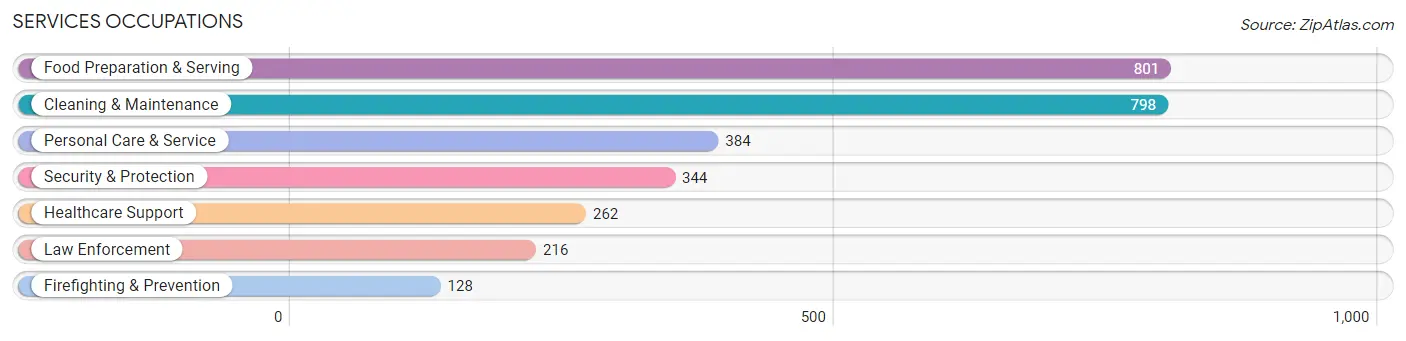
Services Occupations
The most common Services occupations in Hyattsville are Food Preparation & Serving (801 | 6.4%), Cleaning & Maintenance (798 | 6.4%), Personal Care & Service (384 | 3.1%), Security & Protection (344 | 2.8%), and Healthcare Support (262 | 2.1%).
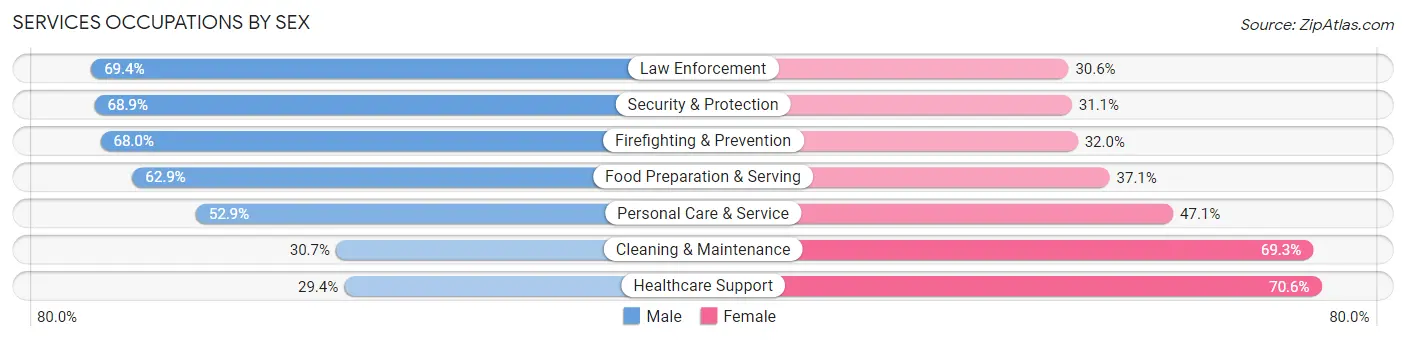
Services Occupations by Sex
Within the Services occupations in Hyattsville, the most male-oriented occupations are Law Enforcement (69.4%), Security & Protection (68.9%), and Firefighting & Prevention (68.0%), while the most female-oriented occupations are Healthcare Support (70.6%), Cleaning & Maintenance (69.3%), and Personal Care & Service (47.1%).
| Occupation | Male | Female |
| Healthcare Support | 77 (29.4%) | 185 (70.6%) |
| Security & Protection | 237 (68.9%) | 107 (31.1%) |
| Firefighting & Prevention | 87 (68.0%) | 41 (32.0%) |
| Law Enforcement | 150 (69.4%) | 66 (30.6%) |
| Food Preparation & Serving | 504 (62.9%) | 297 (37.1%) |
| Cleaning & Maintenance | 245 (30.7%) | 553 (69.3%) |
| Personal Care & Service | 203 (52.9%) | 181 (47.1%) |
| Total (Category) | 1,266 (48.9%) | 1,323 (51.1%) |
| Total (Overall) | 7,167 (57.2%) | 5,359 (42.8%) |
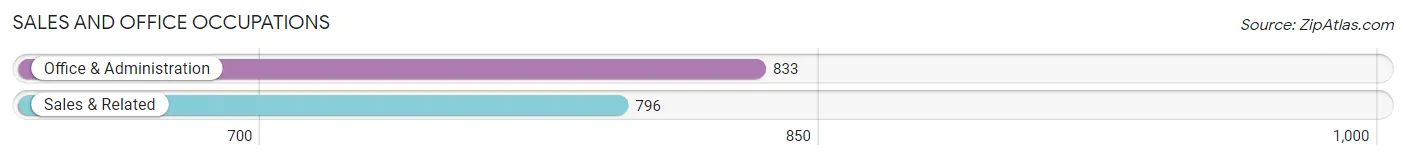
Sales and Office Occupations
The most common Sales and Office occupations in Hyattsville are Office & Administration (833 | 6.7%), and Sales & Related (796 | 6.4%).
Sales and Office Occupations by Sex
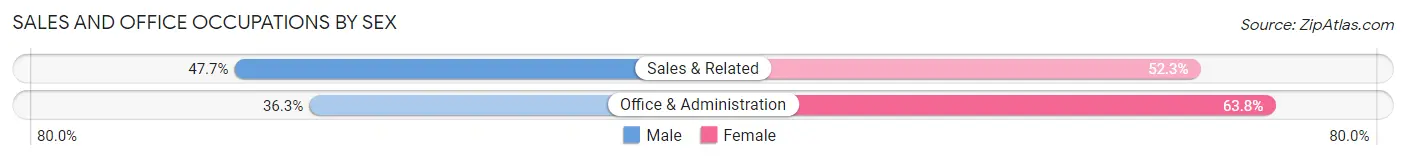
| Occupation | Male | Female |
| Sales & Related | 380 (47.7%) | 416 (52.3%) |
| Office & Administration | 302 (36.2%) | 531 (63.7%) |
| Total (Category) | 682 (41.9%) | 947 (58.1%) |
| Total (Overall) | 7,167 (57.2%) | 5,359 (42.8%) |
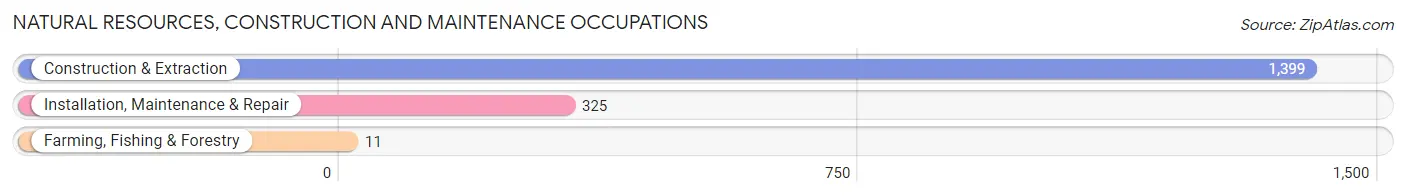
Natural Resources, Construction and Maintenance Occupations
The most common Natural Resources, Construction and Maintenance occupations in Hyattsville are Construction & Extraction (1,399 | 11.2%), Installation, Maintenance & Repair (325 | 2.6%), and Farming, Fishing & Forestry (11 | 0.1%).
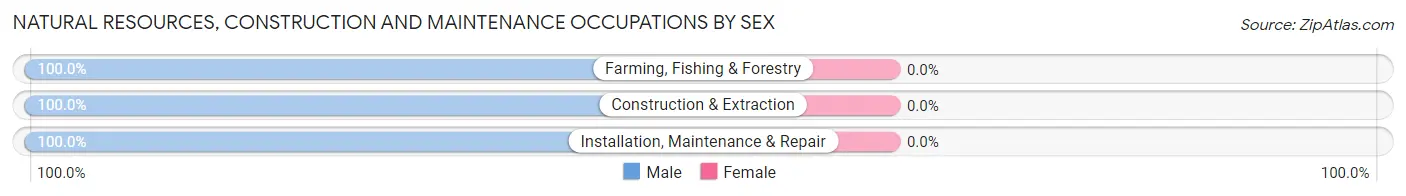
Natural Resources, Construction and Maintenance Occupations by Sex
| Occupation | Male | Female |
| Farming, Fishing & Forestry | 11 (100.0%) | 0 (0.0%) |
| Construction & Extraction | 1,399 (100.0%) | 0 (0.0%) |
| Installation, Maintenance & Repair | 325 (100.0%) | 0 (0.0%) |
| Total (Category) | 1,735 (100.0%) | 0 (0.0%) |
| Total (Overall) | 7,167 (57.2%) | 5,359 (42.8%) |
Production, Transportation and Moving Occupations
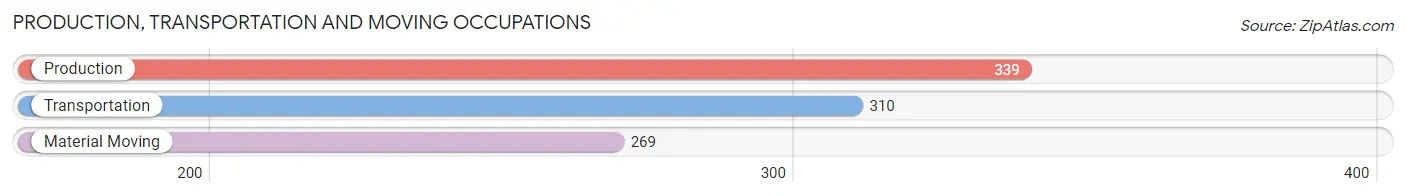
The most common Production, Transportation and Moving occupations in Hyattsville are Production (339 | 2.7%), Transportation (310 | 2.5%), and Material Moving (269 | 2.1%).
Production, Transportation and Moving Occupations by Sex
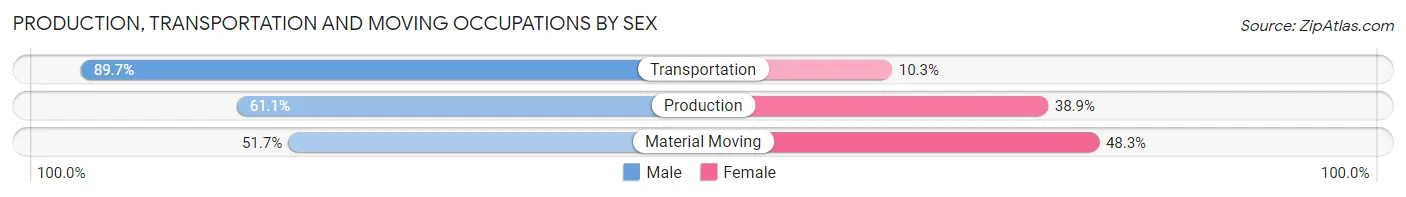
| Occupation | Male | Female |
| Production | 207 (61.1%) | 132 (38.9%) |
| Transportation | 278 (89.7%) | 32 (10.3%) |
| Material Moving | 139 (51.7%) | 130 (48.3%) |
| Total (Category) | 624 (68.0%) | 294 (32.0%) |
| Total (Overall) | 7,167 (57.2%) | 5,359 (42.8%) |
Employment Industries by Sex in Hyattsville
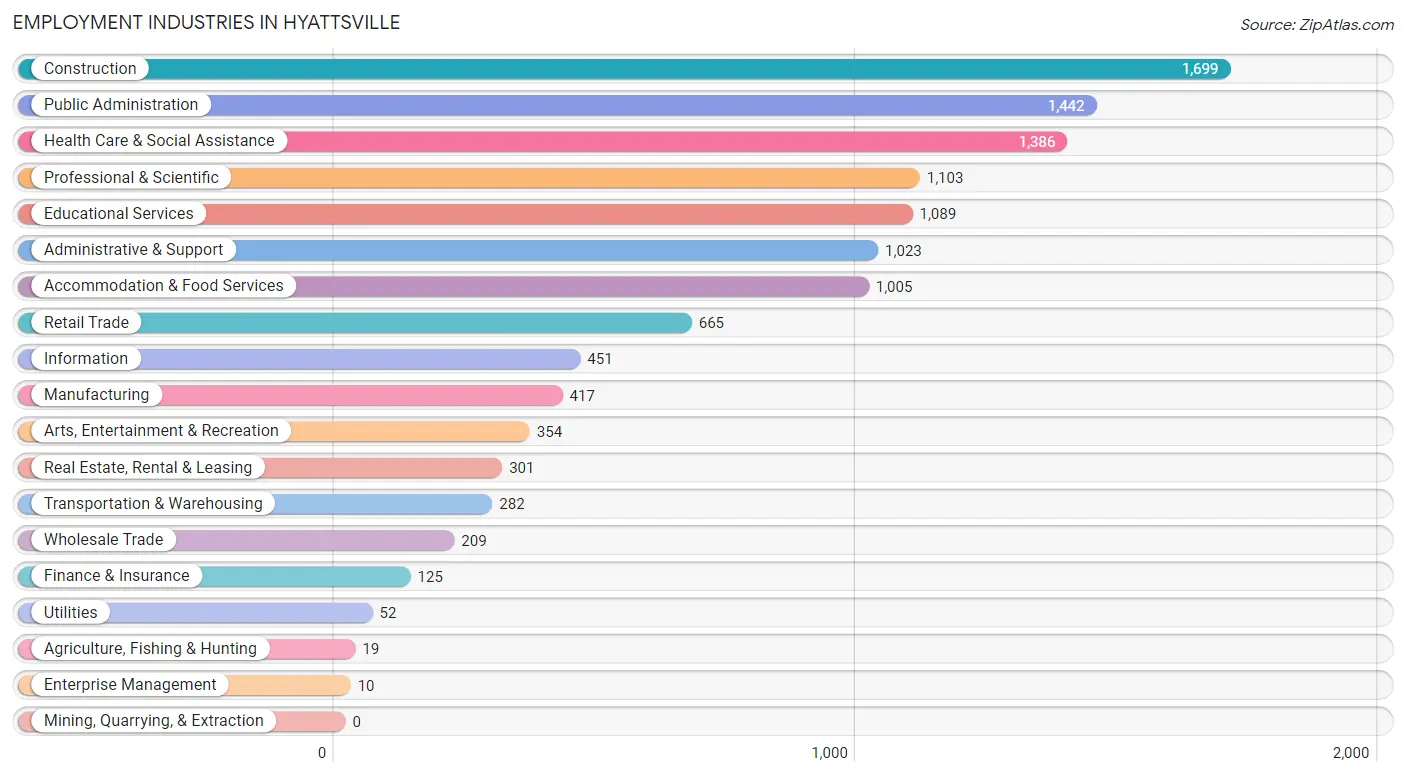
Employment Industries in Hyattsville
The major employment industries in Hyattsville include Construction (1,699 | 13.6%), Public Administration (1,442 | 11.5%), Health Care & Social Assistance (1,386 | 11.1%), Professional & Scientific (1,103 | 8.8%), and Educational Services (1,089 | 8.7%).
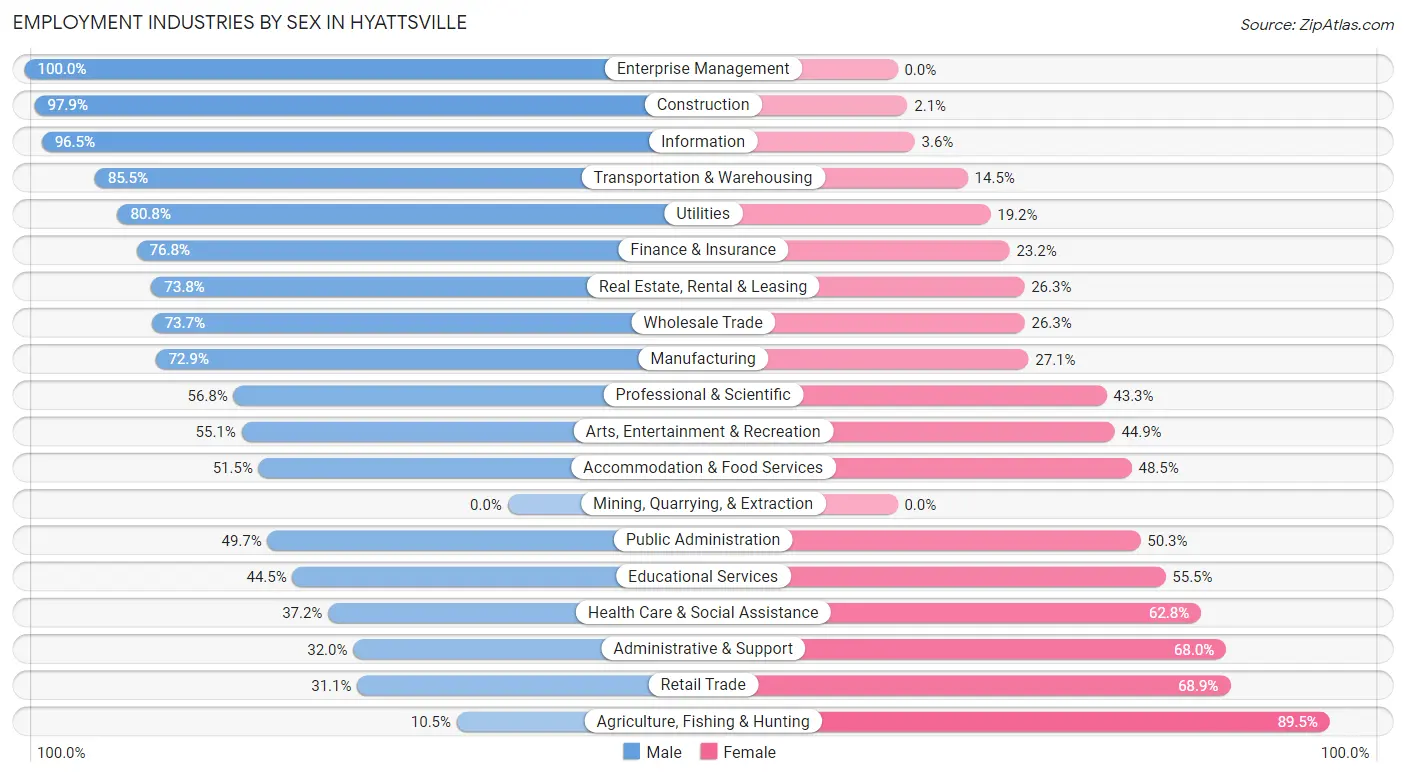
Employment Industries by Sex in Hyattsville
The Hyattsville industries that see more men than women are Enterprise Management (100.0%), Construction (97.9%), and Information (96.5%), whereas the industries that tend to have a higher number of women are Agriculture, Fishing & Hunting (89.5%), Retail Trade (68.9%), and Administrative & Support (68.0%).
| Industry | Male | Female |
| Agriculture, Fishing & Hunting | 2 (10.5%) | 17 (89.5%) |
| Mining, Quarrying, & Extraction | 0 (0.0%) | 0 (0.0%) |
| Construction | 1,664 (97.9%) | 35 (2.1%) |
| Manufacturing | 304 (72.9%) | 113 (27.1%) |
| Wholesale Trade | 154 (73.7%) | 55 (26.3%) |
| Retail Trade | 207 (31.1%) | 458 (68.9%) |
| Transportation & Warehousing | 241 (85.5%) | 41 (14.5%) |
| Utilities | 42 (80.8%) | 10 (19.2%) |
| Information | 435 (96.5%) | 16 (3.5%) |
| Finance & Insurance | 96 (76.8%) | 29 (23.2%) |
| Real Estate, Rental & Leasing | 222 (73.8%) | 79 (26.3%) |
| Professional & Scientific | 626 (56.8%) | 477 (43.2%) |
| Enterprise Management | 10 (100.0%) | 0 (0.0%) |
| Administrative & Support | 327 (32.0%) | 696 (68.0%) |
| Educational Services | 485 (44.5%) | 604 (55.5%) |
| Health Care & Social Assistance | 515 (37.2%) | 871 (62.8%) |
| Arts, Entertainment & Recreation | 195 (55.1%) | 159 (44.9%) |
| Accommodation & Food Services | 518 (51.5%) | 487 (48.5%) |
| Public Administration | 717 (49.7%) | 725 (50.3%) |
| Total | 7,167 (57.2%) | 5,359 (42.8%) |
Education in Hyattsville
School Enrollment in Hyattsville
The most common levels of schooling among the 4,786 students in Hyattsville are elementary school (1,229 | 25.7%), graduate / professional (1,058 | 22.1%), and middle school (768 | 16.1%).
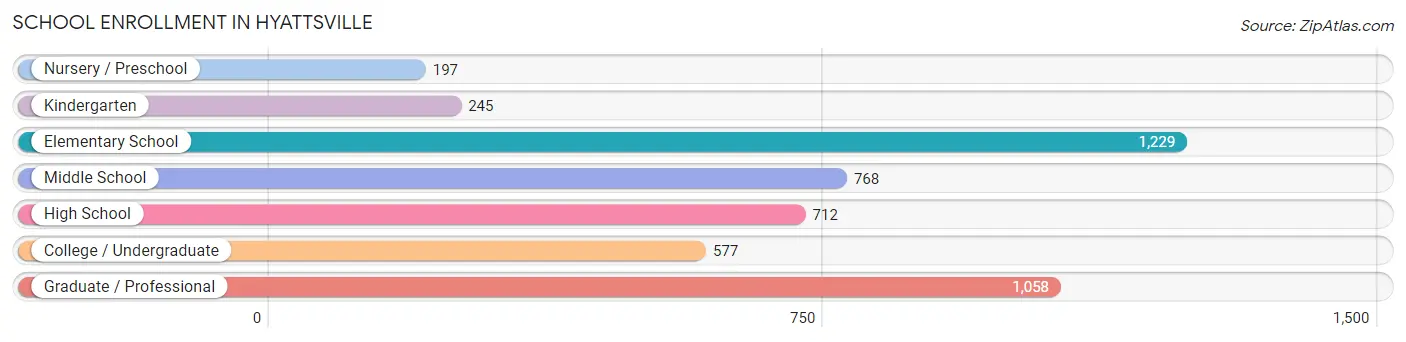
| School Level | # Students | % Students |
| Nursery / Preschool | 197 | 4.1% |
| Kindergarten | 245 | 5.1% |
| Elementary School | 1,229 | 25.7% |
| Middle School | 768 | 16.1% |
| High School | 712 | 14.9% |
| College / Undergraduate | 577 | 12.1% |
| Graduate / Professional | 1,058 | 22.1% |
| Total | 4,786 | 100.0% |
School Enrollment by Age by Funding Source in Hyattsville
Out of a total of 4,786 students who are enrolled in schools in Hyattsville, 1,024 (21.4%) attend a private institution, while the remaining 3,762 (78.6%) are enrolled in public schools. The age group of 35 years and over has the highest likelihood of being enrolled in private schools, with 229 (66.4% in the age bracket) enrolled. Conversely, the age group of 5 to 9 year old has the lowest likelihood of being enrolled in a private school, with 1,187 (90.8% in the age bracket) attending a public institution.
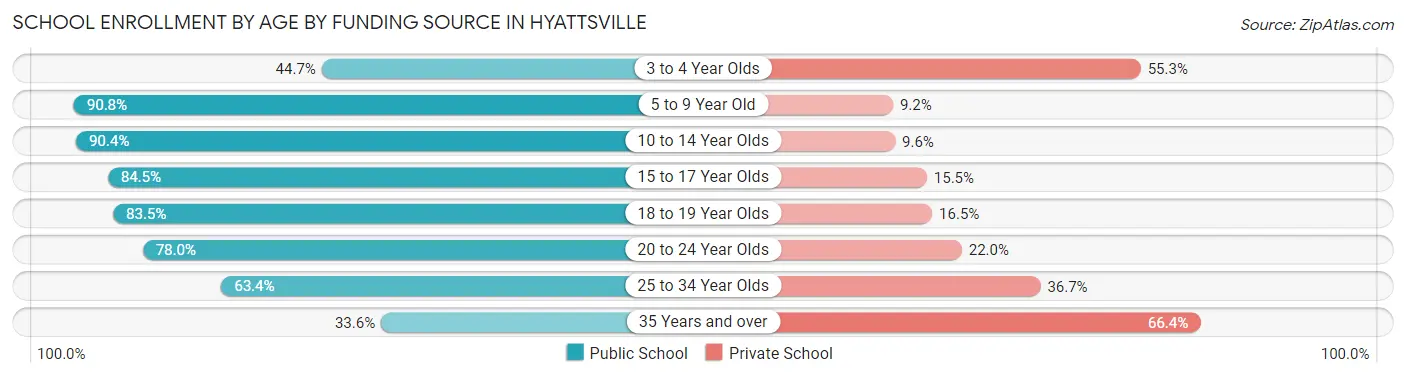
| Age Bracket | Public School | Private School |
| 3 to 4 Year Olds | 88 (44.7%) | 109 (55.3%) |
| 5 to 9 Year Old | 1,187 (90.8%) | 120 (9.2%) |
| 10 to 14 Year Olds | 953 (90.4%) | 101 (9.6%) |
| 15 to 17 Year Olds | 447 (84.5%) | 82 (15.5%) |
| 18 to 19 Year Olds | 152 (83.5%) | 30 (16.5%) |
| 20 to 24 Year Olds | 397 (78.0%) | 112 (22.0%) |
| 25 to 34 Year Olds | 420 (63.3%) | 243 (36.6%) |
| 35 Years and over | 116 (33.6%) | 229 (66.4%) |
| Total | 3,762 (78.6%) | 1,024 (21.4%) |
Educational Attainment by Field of Study in Hyattsville
Social sciences (1,257 | 16.4%), business (806 | 10.5%), liberal arts & history (737 | 9.6%), psychology (654 | 8.5%), and engineering (622 | 8.1%) are the most common fields of study among 7,666 individuals in Hyattsville who have obtained a bachelor's degree or higher.
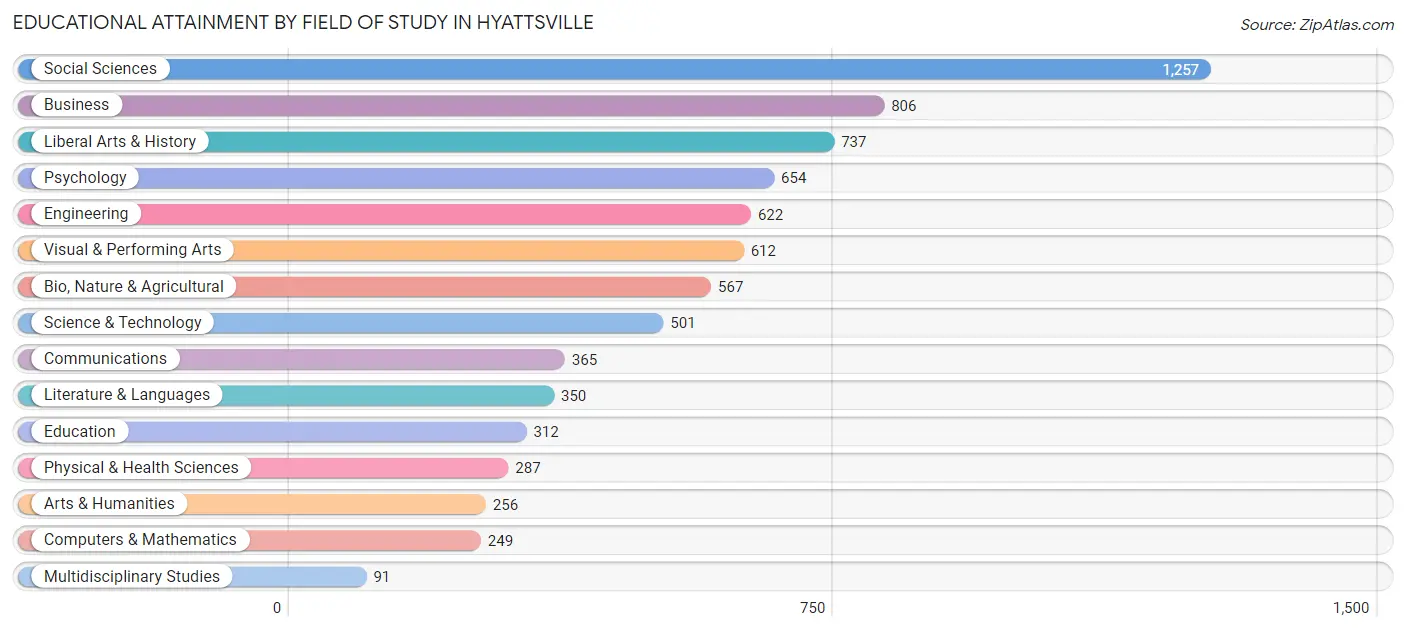
| Field of Study | # Graduates | % Graduates |
| Computers & Mathematics | 249 | 3.3% |
| Bio, Nature & Agricultural | 567 | 7.4% |
| Physical & Health Sciences | 287 | 3.7% |
| Psychology | 654 | 8.5% |
| Social Sciences | 1,257 | 16.4% |
| Engineering | 622 | 8.1% |
| Multidisciplinary Studies | 91 | 1.2% |
| Science & Technology | 501 | 6.5% |
| Business | 806 | 10.5% |
| Education | 312 | 4.1% |
| Literature & Languages | 350 | 4.6% |
| Liberal Arts & History | 737 | 9.6% |
| Visual & Performing Arts | 612 | 8.0% |
| Communications | 365 | 4.8% |
| Arts & Humanities | 256 | 3.3% |
| Total | 7,666 | 100.0% |
Transportation & Commute in Hyattsville
Vehicle Availability by Sex in Hyattsville
The most prevalent vehicle ownership categories in Hyattsville are males with 2 vehicles (2,665, accounting for 38.6%) and females with 2 vehicles (1,732, making up 51.0%).
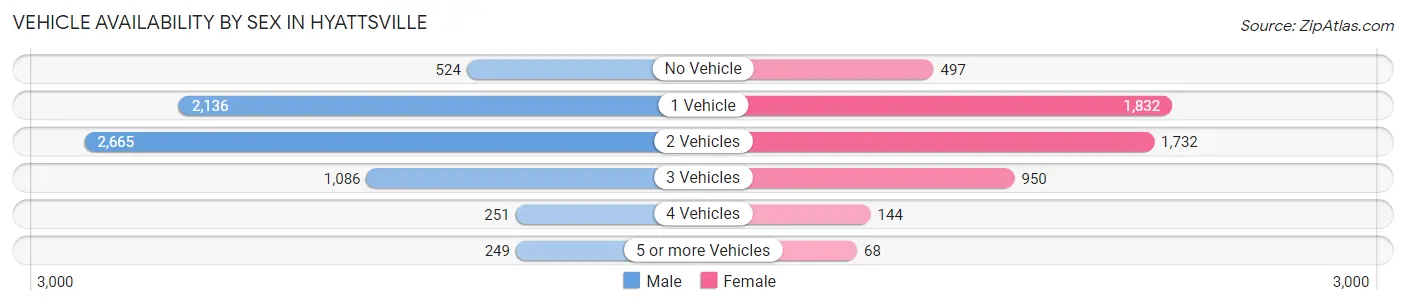
| Vehicles Available | Male | Female |
| No Vehicle | 524 (7.6%) | 497 (9.5%) |
| 1 Vehicle | 2,136 (30.9%) | 1,832 (35.1%) |
| 2 Vehicles | 2,665 (38.6%) | 1,732 (33.2%) |
| 3 Vehicles | 1,086 (15.7%) | 950 (18.2%) |
| 4 Vehicles | 251 (3.6%) | 144 (2.8%) |
| 5 or more Vehicles | 249 (3.6%) | 68 (1.3%) |
| Total | 6,911 (100.0%) | 5,223 (100.0%) |
Commute Time in Hyattsville
The most frequently occuring commute durations in Hyattsville are 20 to 24 minutes (1,675 commuters, 17.3%), 45 to 59 minutes (1,552 commuters, 16.0%), and 30 to 34 minutes (1,496 commuters, 15.4%).
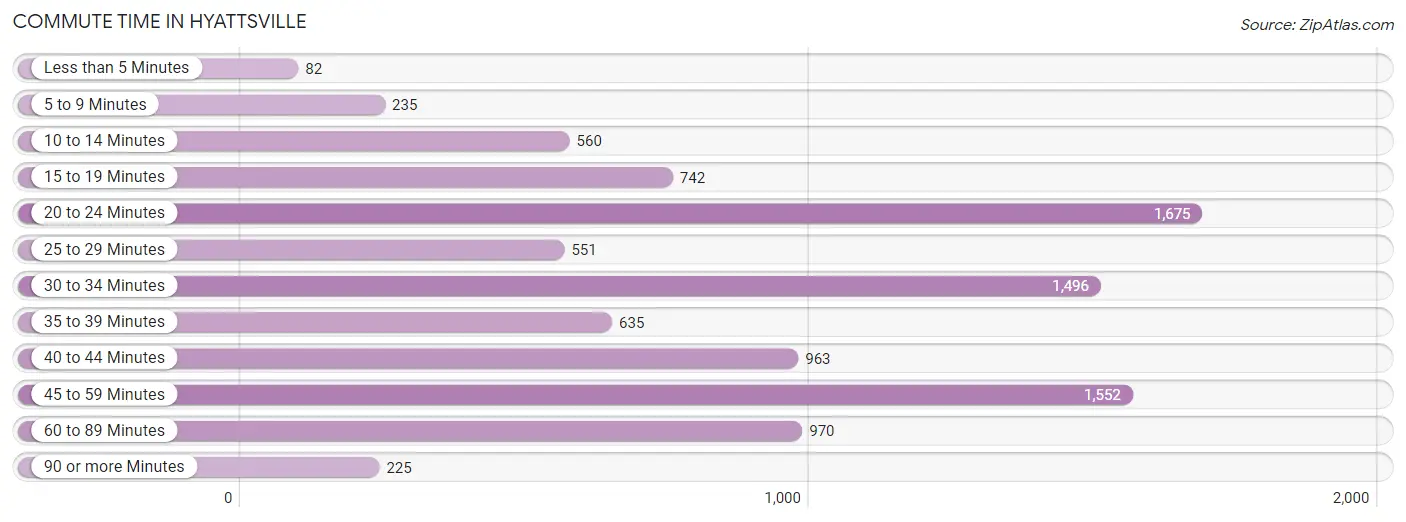
| Commute Time | # Commuters | % Commuters |
| Less than 5 Minutes | 82 | 0.9% |
| 5 to 9 Minutes | 235 | 2.4% |
| 10 to 14 Minutes | 560 | 5.8% |
| 15 to 19 Minutes | 742 | 7.7% |
| 20 to 24 Minutes | 1,675 | 17.3% |
| 25 to 29 Minutes | 551 | 5.7% |
| 30 to 34 Minutes | 1,496 | 15.4% |
| 35 to 39 Minutes | 635 | 6.6% |
| 40 to 44 Minutes | 963 | 9.9% |
| 45 to 59 Minutes | 1,552 | 16.0% |
| 60 to 89 Minutes | 970 | 10.0% |
| 90 or more Minutes | 225 | 2.3% |
Commute Time by Sex in Hyattsville
The most common commute times in Hyattsville are 20 to 24 minutes (989 commuters, 17.8%) for males and 30 to 34 minutes (756 commuters, 18.4%) for females.
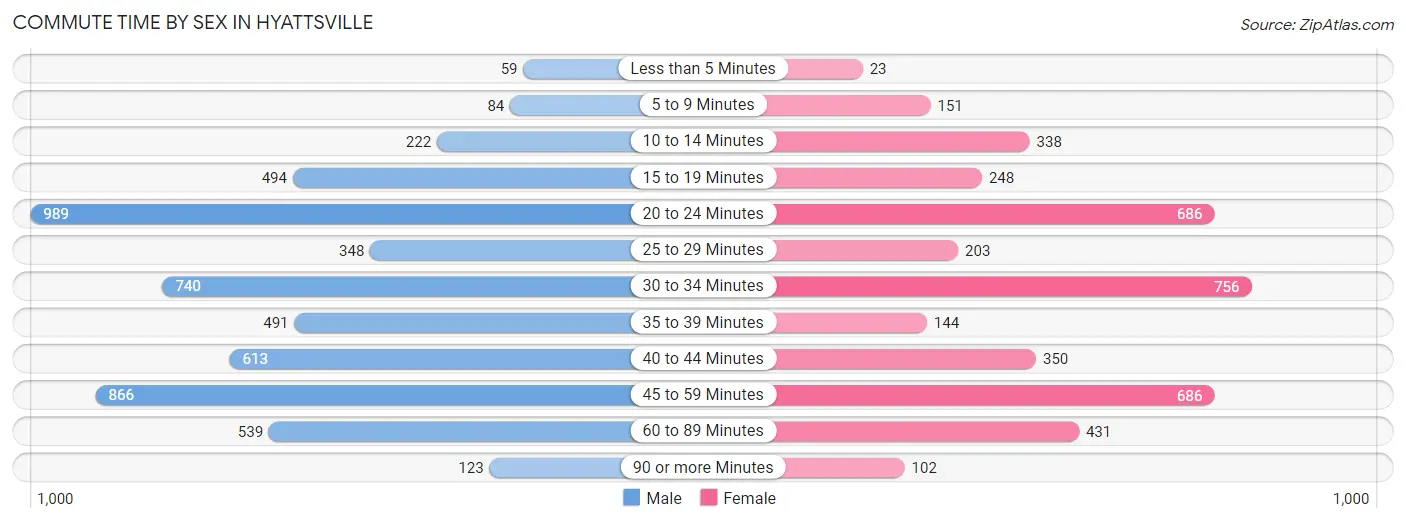
| Commute Time | Male | Female |
| Less than 5 Minutes | 59 (1.1%) | 23 (0.6%) |
| 5 to 9 Minutes | 84 (1.5%) | 151 (3.7%) |
| 10 to 14 Minutes | 222 (4.0%) | 338 (8.2%) |
| 15 to 19 Minutes | 494 (8.9%) | 248 (6.0%) |
| 20 to 24 Minutes | 989 (17.8%) | 686 (16.7%) |
| 25 to 29 Minutes | 348 (6.2%) | 203 (4.9%) |
| 30 to 34 Minutes | 740 (13.3%) | 756 (18.4%) |
| 35 to 39 Minutes | 491 (8.8%) | 144 (3.5%) |
| 40 to 44 Minutes | 613 (11.0%) | 350 (8.5%) |
| 45 to 59 Minutes | 866 (15.5%) | 686 (16.7%) |
| 60 to 89 Minutes | 539 (9.7%) | 431 (10.5%) |
| 90 or more Minutes | 123 (2.2%) | 102 (2.5%) |
Time of Departure to Work by Sex in Hyattsville
The most frequent times of departure to work in Hyattsville are 6:00 AM to 6:29 AM (880, 15.8%) for males and 7:00 AM to 7:29 AM (634, 15.4%) for females.
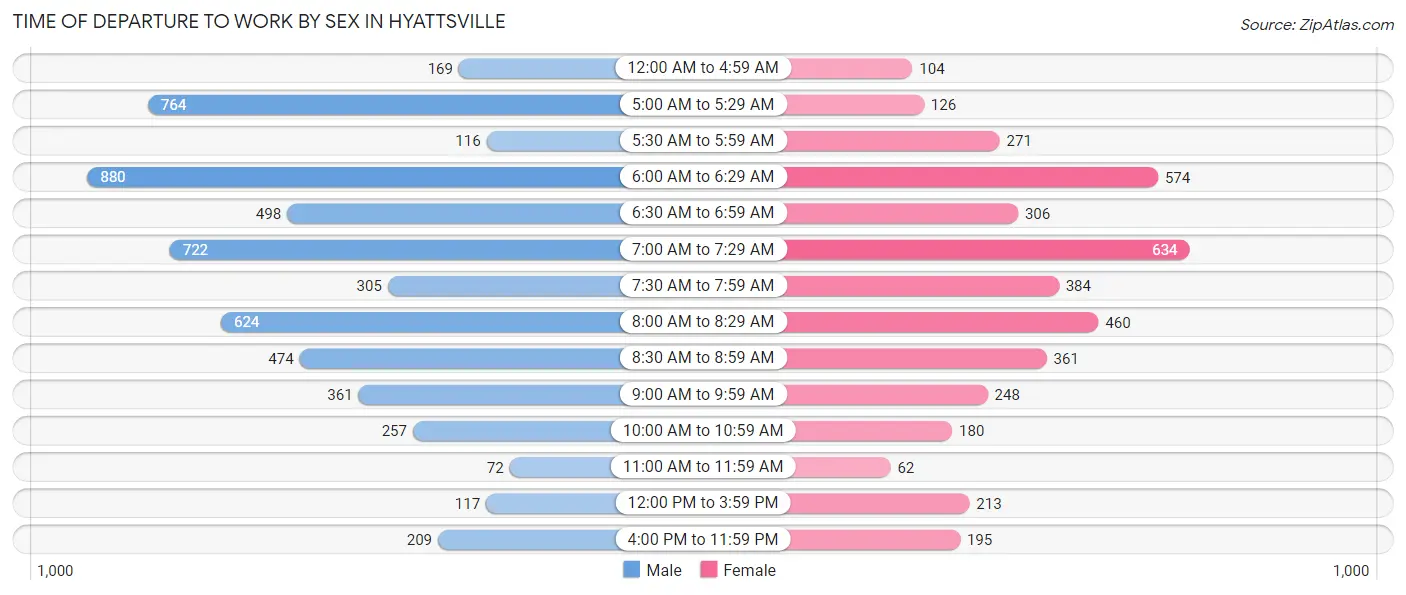
| Time of Departure | Male | Female |
| 12:00 AM to 4:59 AM | 169 (3.0%) | 104 (2.5%) |
| 5:00 AM to 5:29 AM | 764 (13.7%) | 126 (3.1%) |
| 5:30 AM to 5:59 AM | 116 (2.1%) | 271 (6.6%) |
| 6:00 AM to 6:29 AM | 880 (15.8%) | 574 (13.9%) |
| 6:30 AM to 6:59 AM | 498 (8.9%) | 306 (7.4%) |
| 7:00 AM to 7:29 AM | 722 (13.0%) | 634 (15.4%) |
| 7:30 AM to 7:59 AM | 305 (5.5%) | 384 (9.3%) |
| 8:00 AM to 8:29 AM | 624 (11.2%) | 460 (11.2%) |
| 8:30 AM to 8:59 AM | 474 (8.5%) | 361 (8.8%) |
| 9:00 AM to 9:59 AM | 361 (6.5%) | 248 (6.0%) |
| 10:00 AM to 10:59 AM | 257 (4.6%) | 180 (4.4%) |
| 11:00 AM to 11:59 AM | 72 (1.3%) | 62 (1.5%) |
| 12:00 PM to 3:59 PM | 117 (2.1%) | 213 (5.2%) |
| 4:00 PM to 11:59 PM | 209 (3.7%) | 195 (4.7%) |
| Total | 5,568 (100.0%) | 4,118 (100.0%) |
Housing Occupancy in Hyattsville
Occupancy by Ownership in Hyattsville
Of the total 8,151 dwellings in Hyattsville, owner-occupied units account for 4,116 (50.5%), while renter-occupied units make up 4,035 (49.5%).
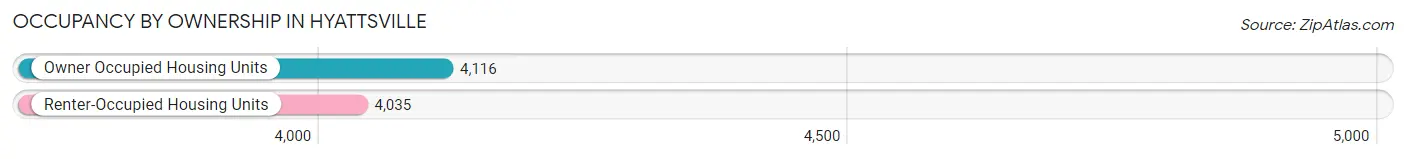
| Occupancy | # Housing Units | % Housing Units |
| Owner Occupied Housing Units | 4,116 | 50.5% |
| Renter-Occupied Housing Units | 4,035 | 49.5% |
| Total Occupied Housing Units | 8,151 | 100.0% |
Occupancy by Household Size in Hyattsville
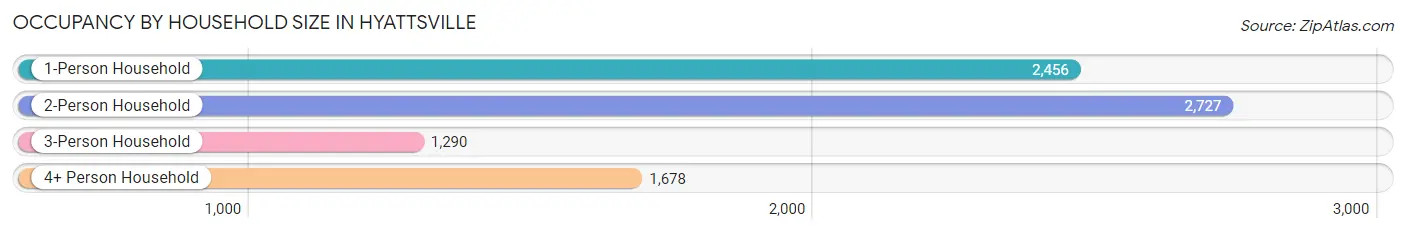
| Household Size | # Housing Units | % Housing Units |
| 1-Person Household | 2,456 | 30.1% |
| 2-Person Household | 2,727 | 33.5% |
| 3-Person Household | 1,290 | 15.8% |
| 4+ Person Household | 1,678 | 20.6% |
| Total Housing Units | 8,151 | 100.0% |
Occupancy by Ownership by Household Size in Hyattsville
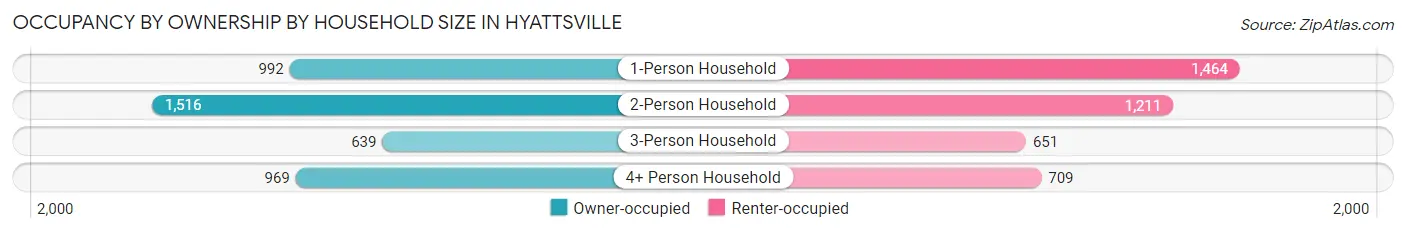
| Household Size | Owner-occupied | Renter-occupied |
| 1-Person Household | 992 (40.4%) | 1,464 (59.6%) |
| 2-Person Household | 1,516 (55.6%) | 1,211 (44.4%) |
| 3-Person Household | 639 (49.5%) | 651 (50.5%) |
| 4+ Person Household | 969 (57.8%) | 709 (42.2%) |
| Total Housing Units | 4,116 (50.5%) | 4,035 (49.5%) |
Occupancy by Educational Attainment in Hyattsville
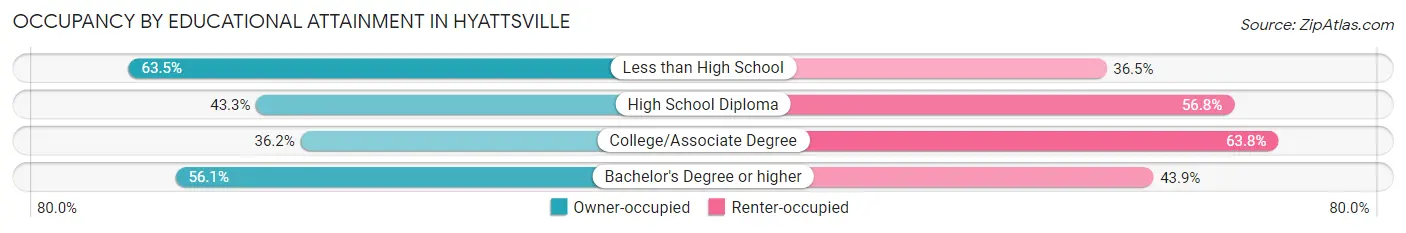
| Household Size | Owner-occupied | Renter-occupied |
| Less than High School | 722 (63.5%) | 415 (36.5%) |
| High School Diploma | 599 (43.2%) | 786 (56.8%) |
| College/Associate Degree | 659 (36.2%) | 1,160 (63.8%) |
| Bachelor's Degree or higher | 2,136 (56.1%) | 1,674 (43.9%) |
Occupancy by Age of Householder in Hyattsville
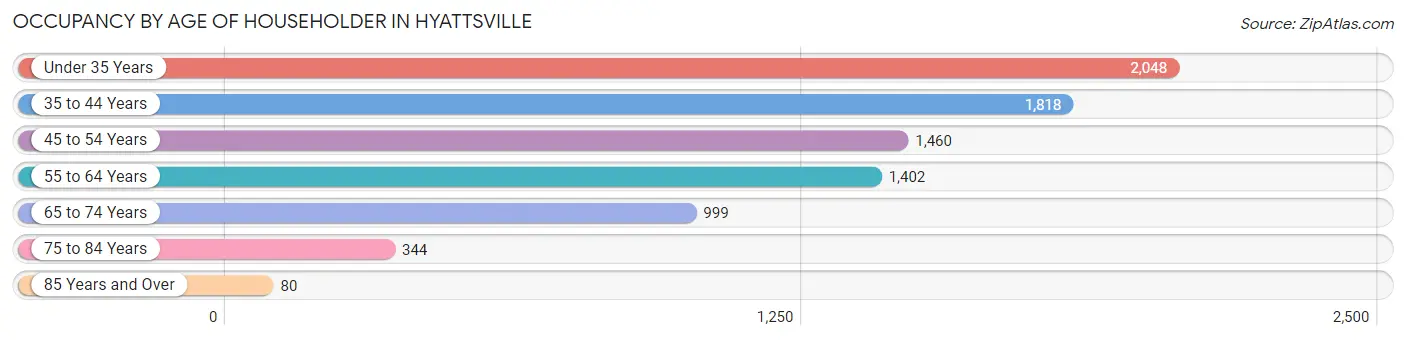
| Age Bracket | # Households | % Households |
| Under 35 Years | 2,048 | 25.1% |
| 35 to 44 Years | 1,818 | 22.3% |
| 45 to 54 Years | 1,460 | 17.9% |
| 55 to 64 Years | 1,402 | 17.2% |
| 65 to 74 Years | 999 | 12.3% |
| 75 to 84 Years | 344 | 4.2% |
| 85 Years and Over | 80 | 1.0% |
| Total | 8,151 | 100.0% |
Housing Finances in Hyattsville
Median Income by Occupancy in Hyattsville
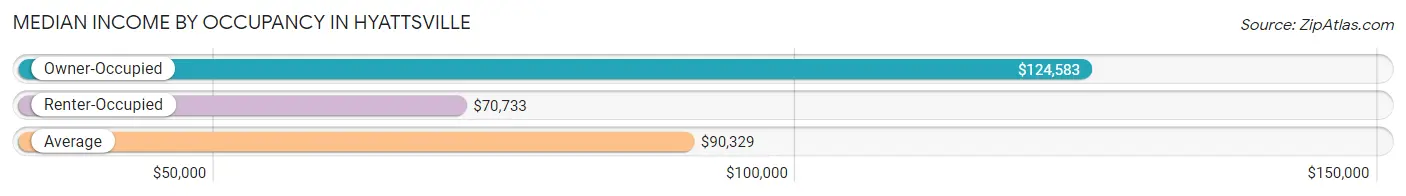
| Occupancy Type | # Households | Median Income |
| Owner-Occupied | 4,116 (50.5%) | $124,583 |
| Renter-Occupied | 4,035 (49.5%) | $70,733 |
| Average | 8,151 (100.0%) | $90,329 |
Occupancy by Householder Income Bracket in Hyattsville
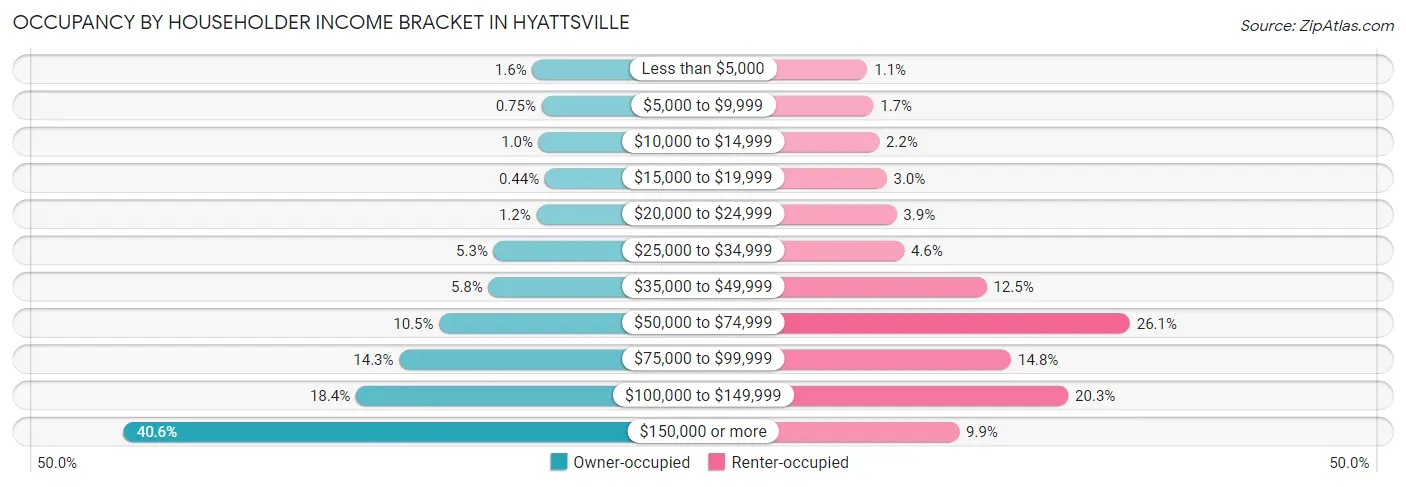
| Income Bracket | Owner-occupied | Renter-occupied |
| Less than $5,000 | 67 (1.6%) | 45 (1.1%) |
| $5,000 to $9,999 | 31 (0.7%) | 68 (1.7%) |
| $10,000 to $14,999 | 42 (1.0%) | 90 (2.2%) |
| $15,000 to $19,999 | 18 (0.4%) | 119 (2.9%) |
| $20,000 to $24,999 | 51 (1.2%) | 157 (3.9%) |
| $25,000 to $34,999 | 219 (5.3%) | 186 (4.6%) |
| $35,000 to $49,999 | 239 (5.8%) | 503 (12.5%) |
| $50,000 to $74,999 | 432 (10.5%) | 1,054 (26.1%) |
| $75,000 to $99,999 | 589 (14.3%) | 598 (14.8%) |
| $100,000 to $149,999 | 759 (18.4%) | 817 (20.3%) |
| $150,000 or more | 1,669 (40.6%) | 398 (9.9%) |
| Total | 4,116 (100.0%) | 4,035 (100.0%) |
Monthly Housing Cost Tiers in Hyattsville
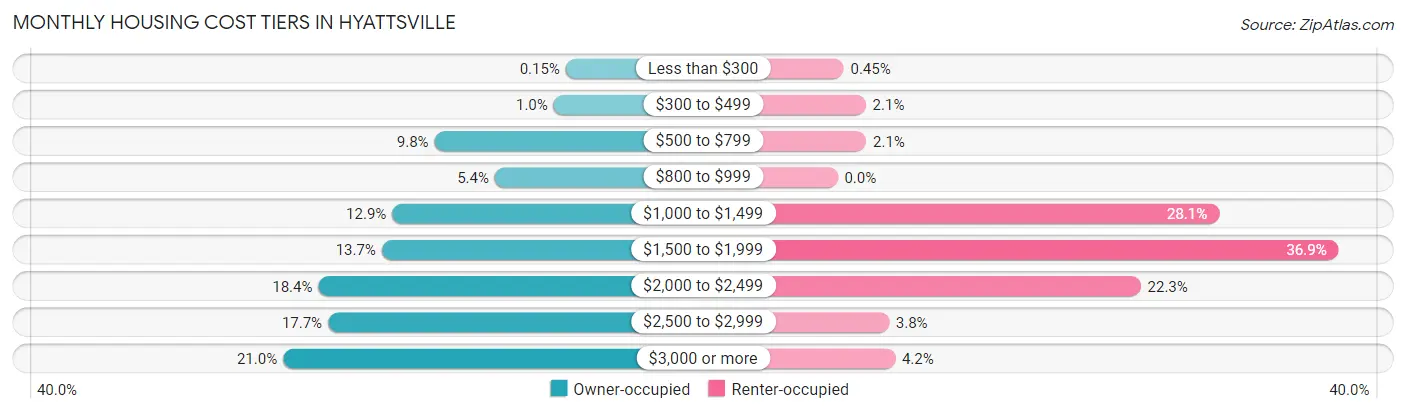
| Monthly Cost | Owner-occupied | Renter-occupied |
| Less than $300 | 6 (0.2%) | 18 (0.4%) |
| $300 to $499 | 43 (1.0%) | 84 (2.1%) |
| $500 to $799 | 404 (9.8%) | 85 (2.1%) |
| $800 to $999 | 221 (5.4%) | 0 (0.0%) |
| $1,000 to $1,499 | 532 (12.9%) | 1,134 (28.1%) |
| $1,500 to $1,999 | 564 (13.7%) | 1,489 (36.9%) |
| $2,000 to $2,499 | 756 (18.4%) | 901 (22.3%) |
| $2,500 to $2,999 | 727 (17.7%) | 153 (3.8%) |
| $3,000 or more | 863 (21.0%) | 171 (4.2%) |
| Total | 4,116 (100.0%) | 4,035 (100.0%) |
Physical Housing Characteristics in Hyattsville
Housing Structures in Hyattsville
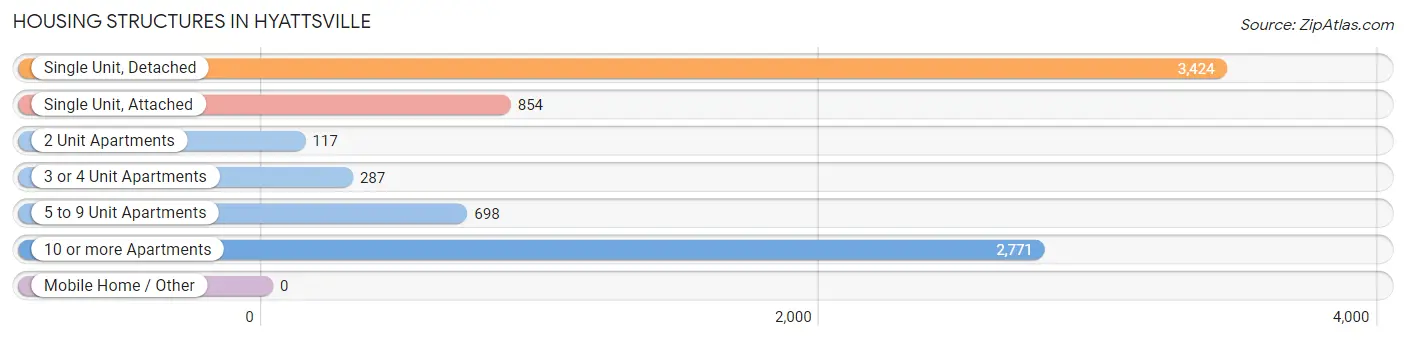
| Structure Type | # Housing Units | % Housing Units |
| Single Unit, Detached | 3,424 | 42.0% |
| Single Unit, Attached | 854 | 10.5% |
| 2 Unit Apartments | 117 | 1.4% |
| 3 or 4 Unit Apartments | 287 | 3.5% |
| 5 to 9 Unit Apartments | 698 | 8.6% |
| 10 or more Apartments | 2,771 | 34.0% |
| Mobile Home / Other | 0 | 0.0% |
| Total | 8,151 | 100.0% |
Housing Structures by Occupancy in Hyattsville
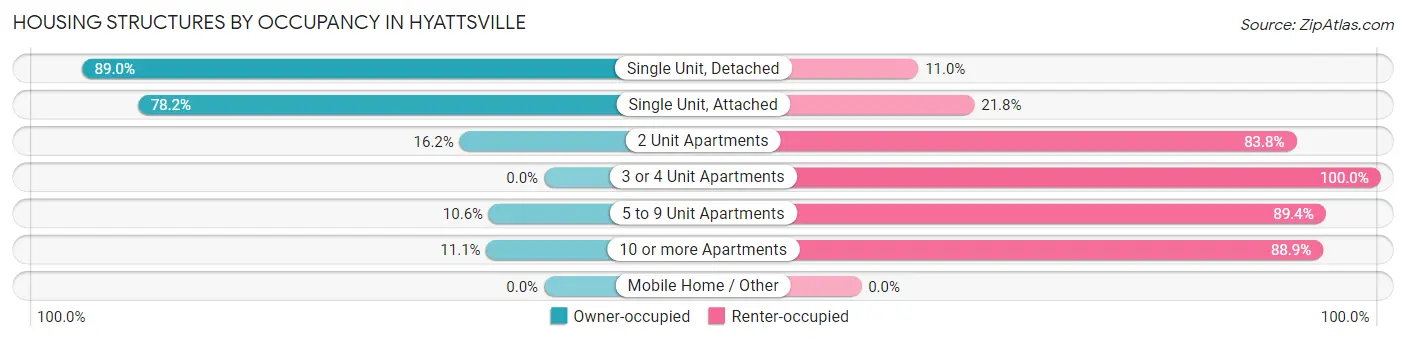
| Structure Type | Owner-occupied | Renter-occupied |
| Single Unit, Detached | 3,048 (89.0%) | 376 (11.0%) |
| Single Unit, Attached | 668 (78.2%) | 186 (21.8%) |
| 2 Unit Apartments | 19 (16.2%) | 98 (83.8%) |
| 3 or 4 Unit Apartments | 0 (0.0%) | 287 (100.0%) |
| 5 to 9 Unit Apartments | 74 (10.6%) | 624 (89.4%) |
| 10 or more Apartments | 307 (11.1%) | 2,464 (88.9%) |
| Mobile Home / Other | 0 (0.0%) | 0 (0.0%) |
| Total | 4,116 (50.5%) | 4,035 (49.5%) |
Housing Structures by Number of Rooms in Hyattsville
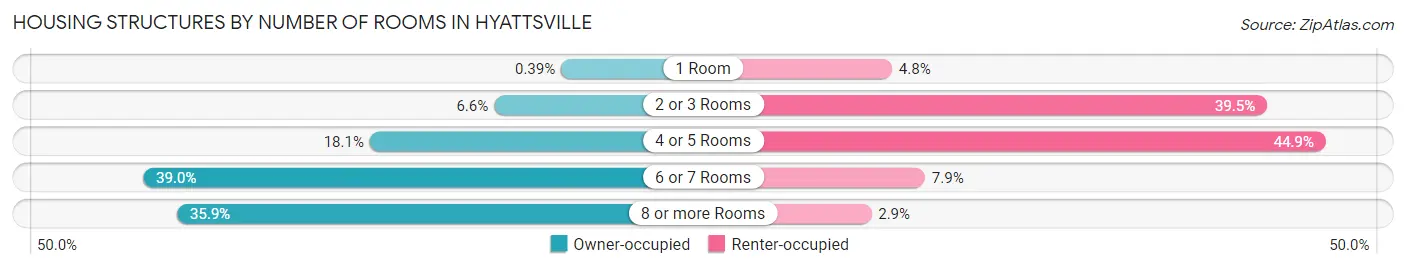
| Number of Rooms | Owner-occupied | Renter-occupied |
| 1 Room | 16 (0.4%) | 194 (4.8%) |
| 2 or 3 Rooms | 271 (6.6%) | 1,594 (39.5%) |
| 4 or 5 Rooms | 744 (18.1%) | 1,813 (44.9%) |
| 6 or 7 Rooms | 1,607 (39.0%) | 317 (7.9%) |
| 8 or more Rooms | 1,478 (35.9%) | 117 (2.9%) |
| Total | 4,116 (100.0%) | 4,035 (100.0%) |
Housing Structure by Heating Type in Hyattsville
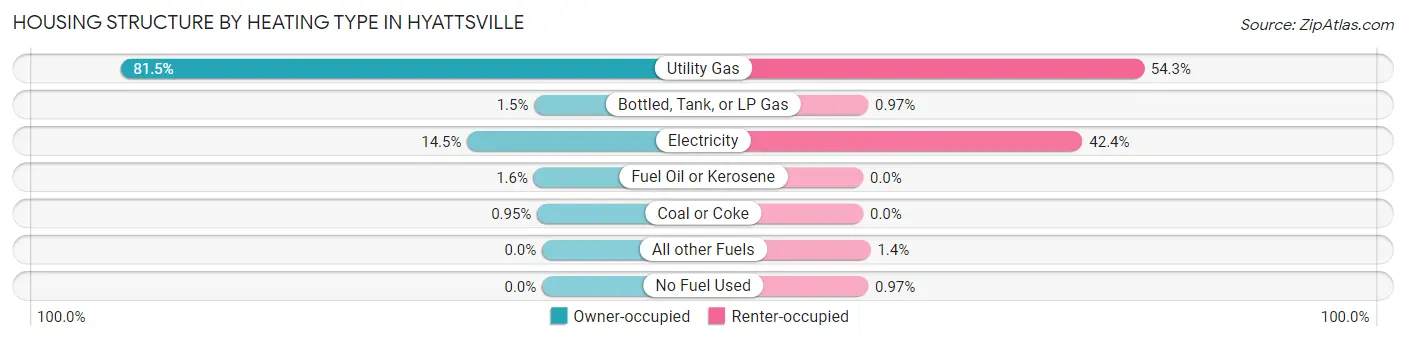
| Heating Type | Owner-occupied | Renter-occupied |
| Utility Gas | 3,354 (81.5%) | 2,189 (54.2%) |
| Bottled, Tank, or LP Gas | 62 (1.5%) | 39 (1.0%) |
| Electricity | 595 (14.5%) | 1,710 (42.4%) |
| Fuel Oil or Kerosene | 66 (1.6%) | 0 (0.0%) |
| Coal or Coke | 39 (0.9%) | 0 (0.0%) |
| All other Fuels | 0 (0.0%) | 58 (1.4%) |
| No Fuel Used | 0 (0.0%) | 39 (1.0%) |
| Total | 4,116 (100.0%) | 4,035 (100.0%) |
Household Vehicle Usage in Hyattsville
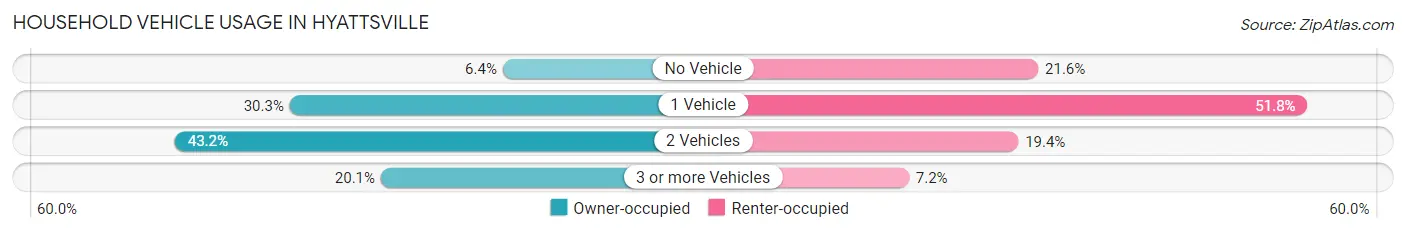
| Vehicles per Household | Owner-occupied | Renter-occupied |
| No Vehicle | 265 (6.4%) | 873 (21.6%) |
| 1 Vehicle | 1,247 (30.3%) | 2,090 (51.8%) |
| 2 Vehicles | 1,777 (43.2%) | 783 (19.4%) |
| 3 or more Vehicles | 827 (20.1%) | 289 (7.2%) |
| Total | 4,116 (100.0%) | 4,035 (100.0%) |
Real Estate & Mortgages in Hyattsville
Real Estate and Mortgage Overview in Hyattsville
| Characteristic | Without Mortgage | With Mortgage |
| Housing Units | 825 | 3,291 |
| Median Property Value | $397,200 | $434,800 |
| Median Household Income | $89,107 | $1,492 |
| Monthly Housing Costs | $832 | $863 |
| Real Estate Taxes | $5,627 | $70 |
Property Value by Mortgage Status in Hyattsville
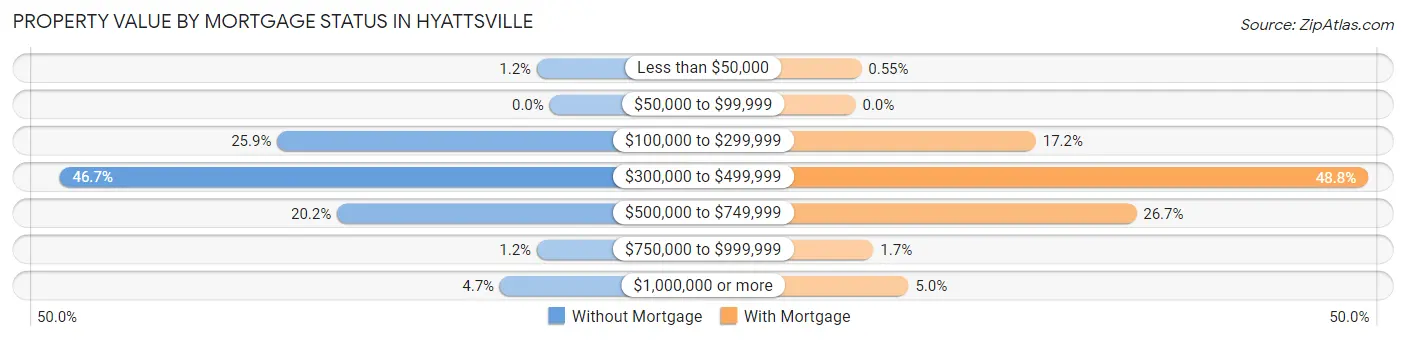
| Property Value | Without Mortgage | With Mortgage |
| Less than $50,000 | 10 (1.2%) | 18 (0.5%) |
| $50,000 to $99,999 | 0 (0.0%) | 0 (0.0%) |
| $100,000 to $299,999 | 214 (25.9%) | 565 (17.2%) |
| $300,000 to $499,999 | 385 (46.7%) | 1,606 (48.8%) |
| $500,000 to $749,999 | 167 (20.2%) | 880 (26.7%) |
| $750,000 to $999,999 | 10 (1.2%) | 56 (1.7%) |
| $1,000,000 or more | 39 (4.7%) | 166 (5.0%) |
| Total | 825 (100.0%) | 3,291 (100.0%) |
Household Income by Mortgage Status in Hyattsville
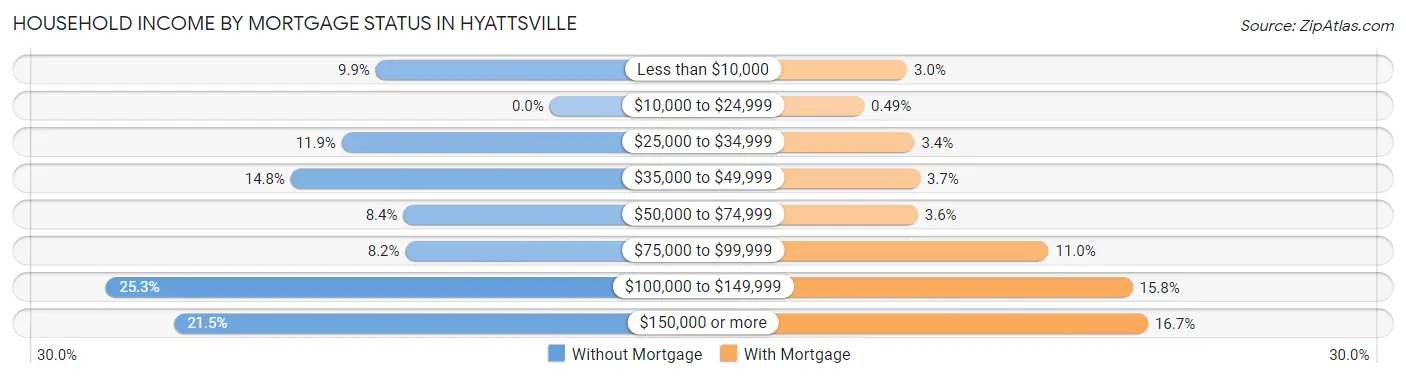
| Household Income | Without Mortgage | With Mortgage |
| Less than $10,000 | 82 (9.9%) | 97 (2.9%) |
| $10,000 to $24,999 | 0 (0.0%) | 16 (0.5%) |
| $25,000 to $34,999 | 98 (11.9%) | 111 (3.4%) |
| $35,000 to $49,999 | 122 (14.8%) | 121 (3.7%) |
| $50,000 to $74,999 | 69 (8.4%) | 117 (3.6%) |
| $75,000 to $99,999 | 68 (8.2%) | 363 (11.0%) |
| $100,000 to $149,999 | 209 (25.3%) | 521 (15.8%) |
| $150,000 or more | 177 (21.4%) | 550 (16.7%) |
| Total | 825 (100.0%) | 3,291 (100.0%) |
Property Value to Household Income Ratio in Hyattsville
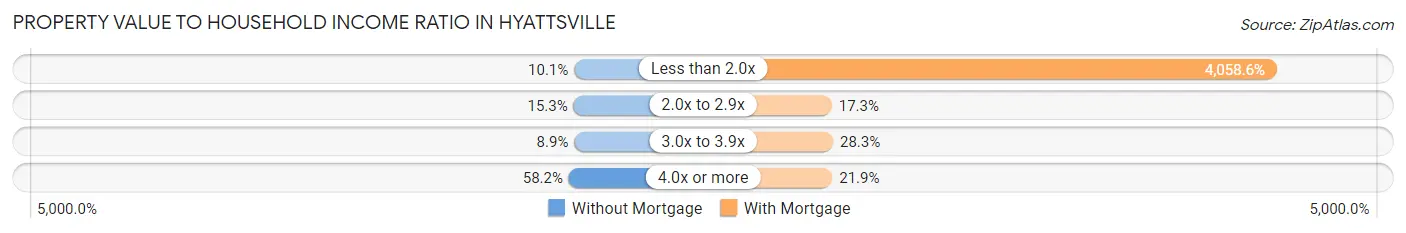
| Value-to-Income Ratio | Without Mortgage | With Mortgage |
| Less than 2.0x | 83 (10.1%) | 133,569 (4,058.6%) |
| 2.0x to 2.9x | 126 (15.3%) | 570 (17.3%) |
| 3.0x to 3.9x | 73 (8.8%) | 932 (28.3%) |
| 4.0x or more | 480 (58.2%) | 720 (21.9%) |
| Total | 825 (100.0%) | 3,291 (100.0%) |
Real Estate Taxes by Mortgage Status in Hyattsville
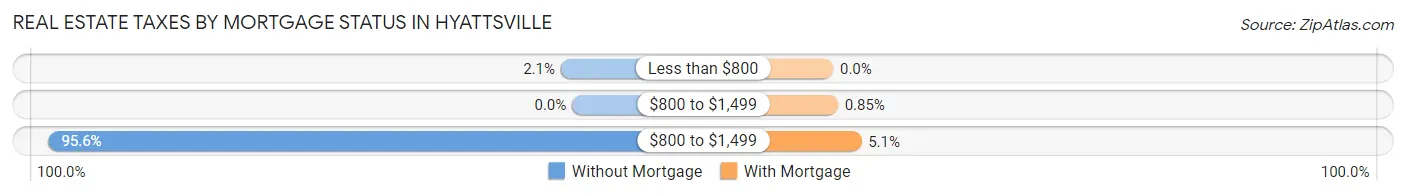
| Property Taxes | Without Mortgage | With Mortgage |
| Less than $800 | 17 (2.1%) | 0 (0.0%) |
| $800 to $1,499 | 0 (0.0%) | 28 (0.9%) |
| $800 to $1,499 | 789 (95.6%) | 169 (5.1%) |
| Total | 825 (100.0%) | 3,291 (100.0%) |
Health & Disability in Hyattsville
Health Insurance Coverage by Age in Hyattsville
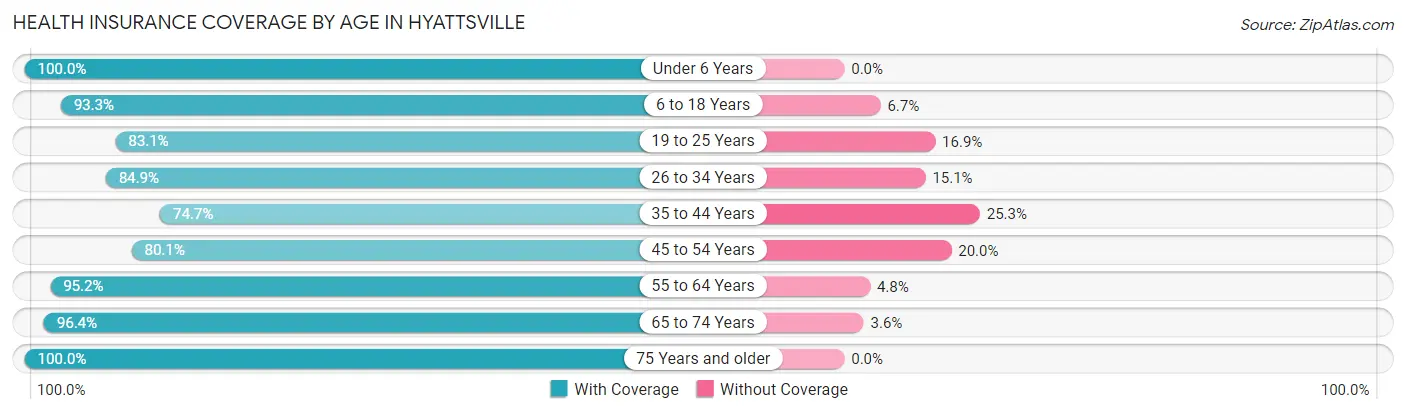
| Age Bracket | With Coverage | Without Coverage |
| Under 6 Years | 1,566 (100.0%) | 0 (0.0%) |
| 6 to 18 Years | 2,724 (93.3%) | 197 (6.7%) |
| 19 to 25 Years | 1,334 (83.1%) | 272 (16.9%) |
| 26 to 34 Years | 3,438 (84.9%) | 613 (15.1%) |
| 35 to 44 Years | 2,597 (74.7%) | 878 (25.3%) |
| 45 to 54 Years | 2,355 (80.0%) | 587 (20.0%) |
| 55 to 64 Years | 1,971 (95.2%) | 99 (4.8%) |
| 65 to 74 Years | 1,499 (96.4%) | 56 (3.6%) |
| 75 Years and older | 604 (100.0%) | 0 (0.0%) |
| Total | 18,088 (87.0%) | 2,702 (13.0%) |
Health Insurance Coverage by Citizenship Status in Hyattsville
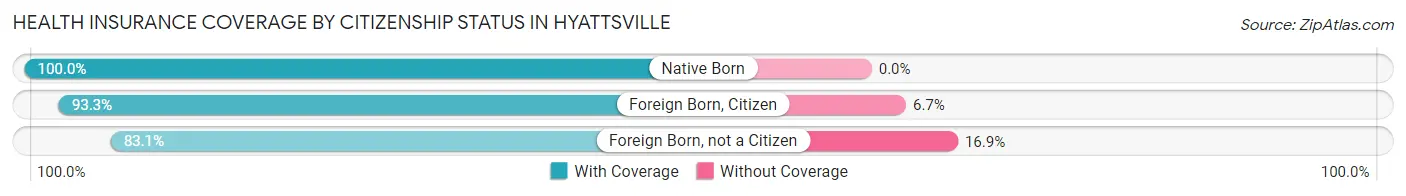
| Citizenship Status | With Coverage | Without Coverage |
| Native Born | 1,566 (100.0%) | 0 (0.0%) |
| Foreign Born, Citizen | 2,724 (93.3%) | 197 (6.7%) |
| Foreign Born, not a Citizen | 1,334 (83.1%) | 272 (16.9%) |
Health Insurance Coverage by Household Income in Hyattsville
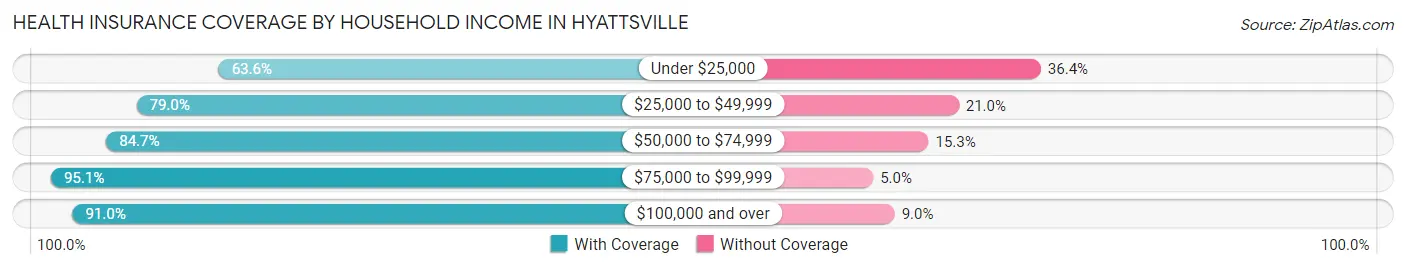
| Household Income | With Coverage | Without Coverage |
| Under $25,000 | 1,020 (63.6%) | 583 (36.4%) |
| $25,000 to $49,999 | 1,766 (79.0%) | 469 (21.0%) |
| $50,000 to $74,999 | 3,073 (84.7%) | 556 (15.3%) |
| $75,000 to $99,999 | 2,421 (95.1%) | 126 (5.0%) |
| $100,000 and over | 9,791 (91.0%) | 966 (9.0%) |
Public vs Private Health Insurance Coverage by Age in Hyattsville
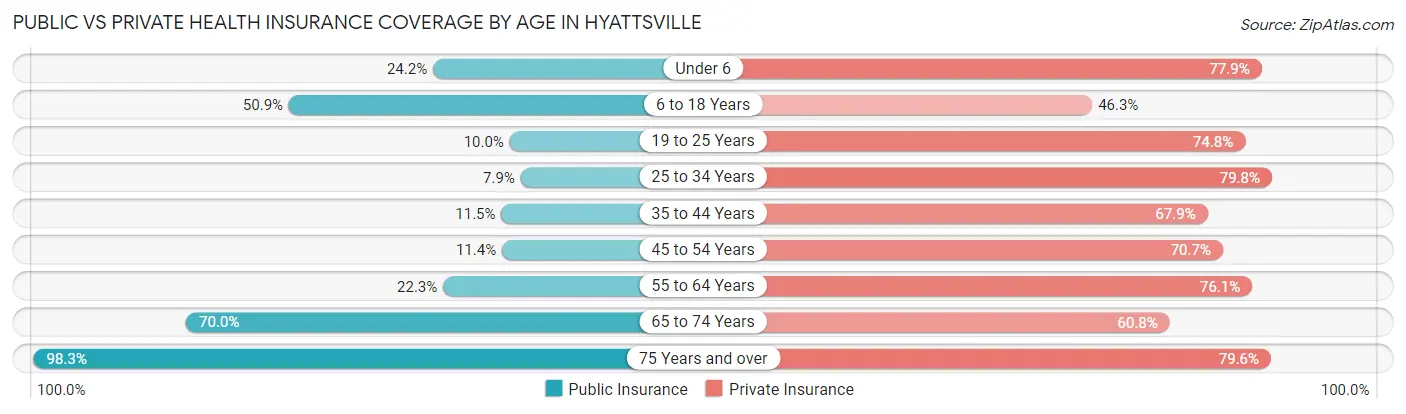
| Age Bracket | Public Insurance | Private Insurance |
| Under 6 | 379 (24.2%) | 1,220 (77.9%) |
| 6 to 18 Years | 1,488 (50.9%) | 1,352 (46.3%) |
| 19 to 25 Years | 160 (10.0%) | 1,202 (74.8%) |
| 25 to 34 Years | 321 (7.9%) | 3,233 (79.8%) |
| 35 to 44 Years | 400 (11.5%) | 2,359 (67.9%) |
| 45 to 54 Years | 335 (11.4%) | 2,080 (70.7%) |
| 55 to 64 Years | 462 (22.3%) | 1,576 (76.1%) |
| 65 to 74 Years | 1,089 (70.0%) | 946 (60.8%) |
| 75 Years and over | 594 (98.3%) | 481 (79.6%) |
| Total | 5,228 (25.2%) | 14,449 (69.5%) |
Disability Status by Sex by Age in Hyattsville
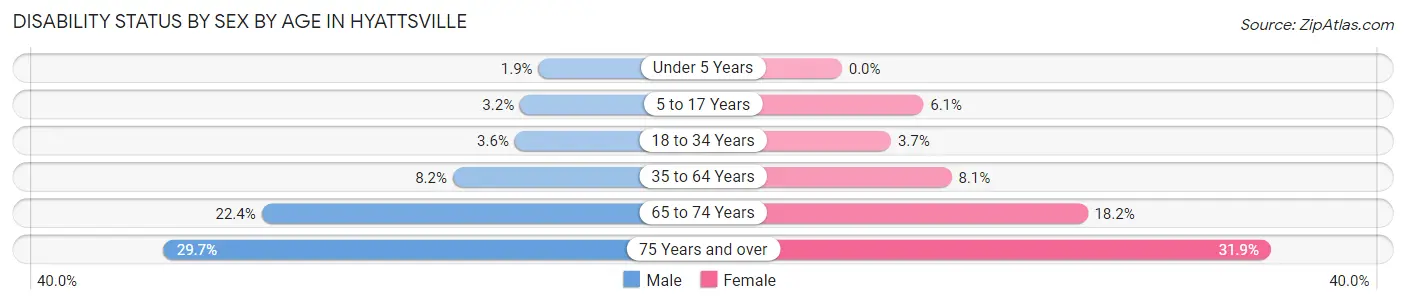
| Age Bracket | Male | Female |
| Under 5 Years | 15 (1.8%) | 0 (0.0%) |
| 5 to 17 Years | 55 (3.2%) | 74 (6.0%) |
| 18 to 34 Years | 113 (3.6%) | 97 (3.6%) |
| 35 to 64 Years | 360 (8.2%) | 334 (8.1%) |
| 65 to 74 Years | 158 (22.4%) | 155 (18.2%) |
| 75 Years and over | 86 (29.7%) | 100 (31.9%) |
Disability Class by Sex by Age in Hyattsville
Disability Class: Hearing Difficulty
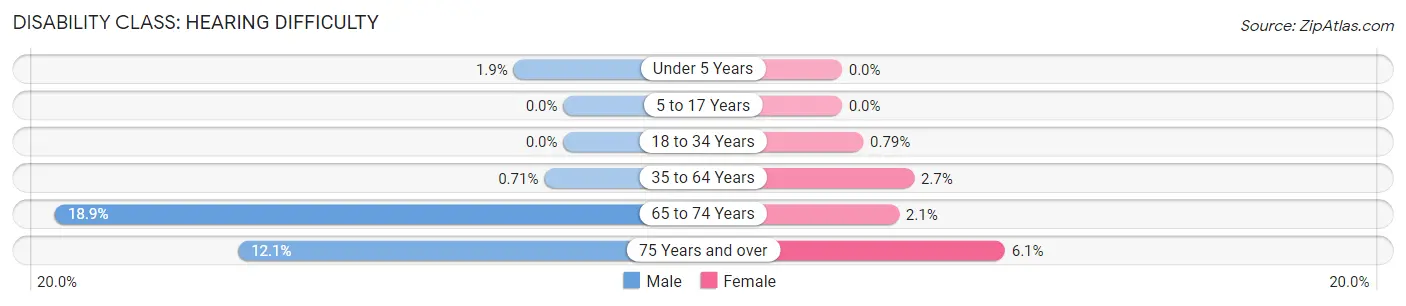
| Age Bracket | Male | Female |
| Under 5 Years | 15 (1.8%) | 0 (0.0%) |
| 5 to 17 Years | 0 (0.0%) | 0 (0.0%) |
| 18 to 34 Years | 0 (0.0%) | 21 (0.8%) |
| 35 to 64 Years | 31 (0.7%) | 110 (2.7%) |
| 65 to 74 Years | 133 (18.9%) | 18 (2.1%) |
| 75 Years and over | 35 (12.1%) | 19 (6.0%) |
Disability Class: Vision Difficulty
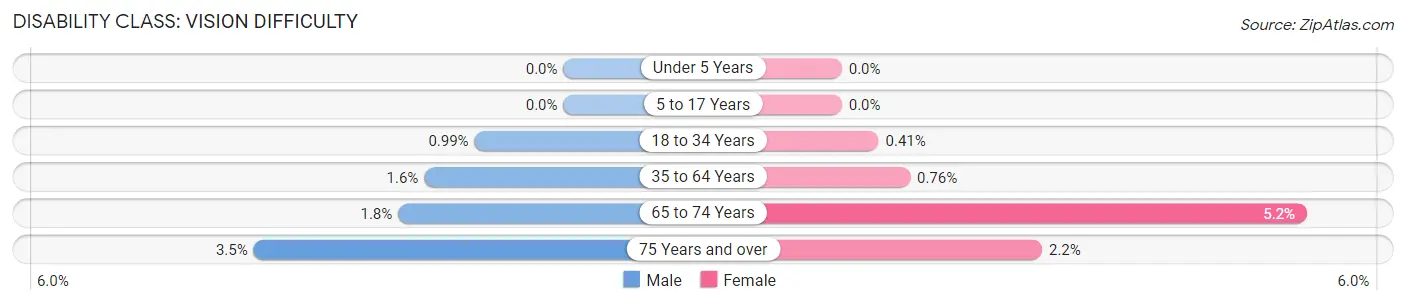
| Age Bracket | Male | Female |
| Under 5 Years | 0 (0.0%) | 0 (0.0%) |
| 5 to 17 Years | 0 (0.0%) | 0 (0.0%) |
| 18 to 34 Years | 31 (1.0%) | 11 (0.4%) |
| 35 to 64 Years | 68 (1.5%) | 31 (0.8%) |
| 65 to 74 Years | 13 (1.8%) | 44 (5.2%) |
| 75 Years and over | 10 (3.5%) | 7 (2.2%) |
Disability Class: Cognitive Difficulty
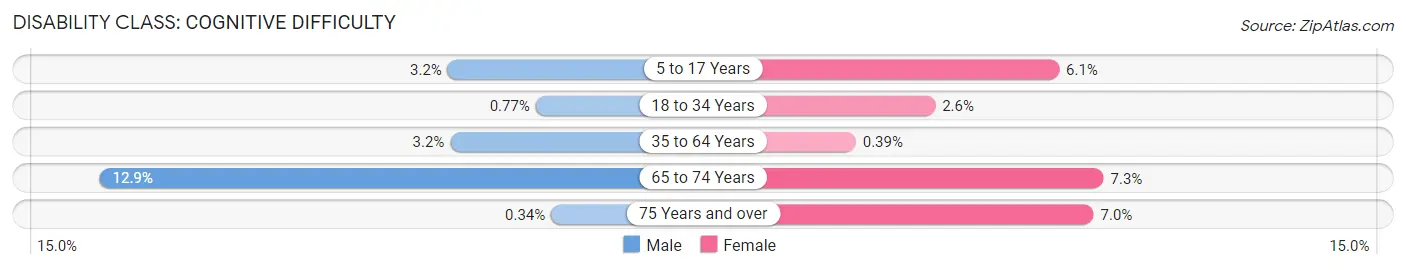
| Age Bracket | Male | Female |
| 5 to 17 Years | 55 (3.2%) | 74 (6.0%) |
| 18 to 34 Years | 24 (0.8%) | 69 (2.6%) |
| 35 to 64 Years | 138 (3.2%) | 16 (0.4%) |
| 65 to 74 Years | 91 (12.9%) | 62 (7.3%) |
| 75 Years and over | 1 (0.3%) | 22 (7.0%) |
Disability Class: Ambulatory Difficulty
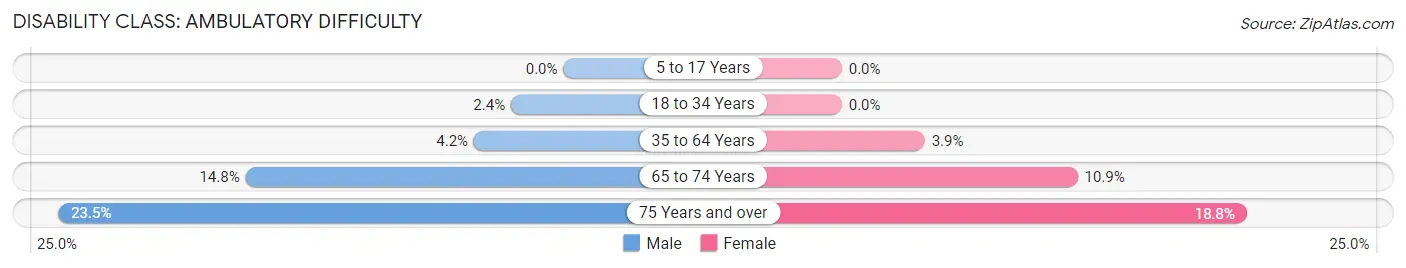
| Age Bracket | Male | Female |
| 5 to 17 Years | 0 (0.0%) | 0 (0.0%) |
| 18 to 34 Years | 76 (2.4%) | 0 (0.0%) |
| 35 to 64 Years | 182 (4.2%) | 158 (3.8%) |
| 65 to 74 Years | 104 (14.7%) | 93 (10.9%) |
| 75 Years and over | 68 (23.4%) | 59 (18.8%) |
Disability Class: Self-Care Difficulty
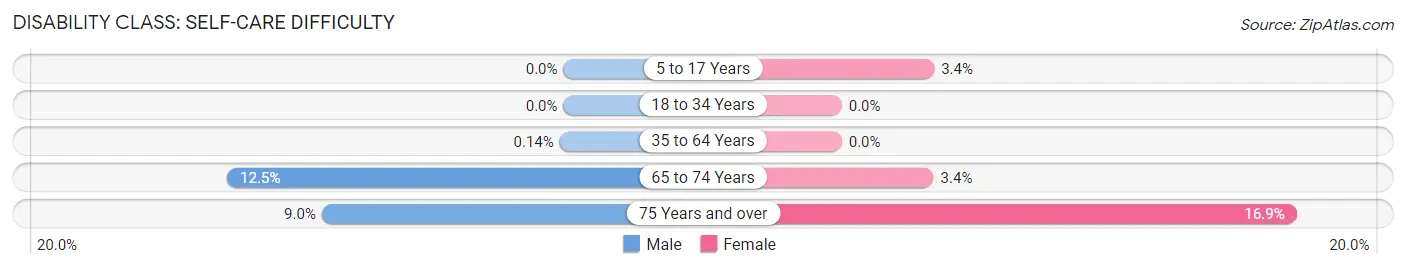
| Age Bracket | Male | Female |
| 5 to 17 Years | 0 (0.0%) | 42 (3.4%) |
| 18 to 34 Years | 0 (0.0%) | 0 (0.0%) |
| 35 to 64 Years | 6 (0.1%) | 0 (0.0%) |
| 65 to 74 Years | 88 (12.5%) | 29 (3.4%) |
| 75 Years and over | 26 (9.0%) | 53 (16.9%) |
Technology Access in Hyattsville
Computing Device Access in Hyattsville
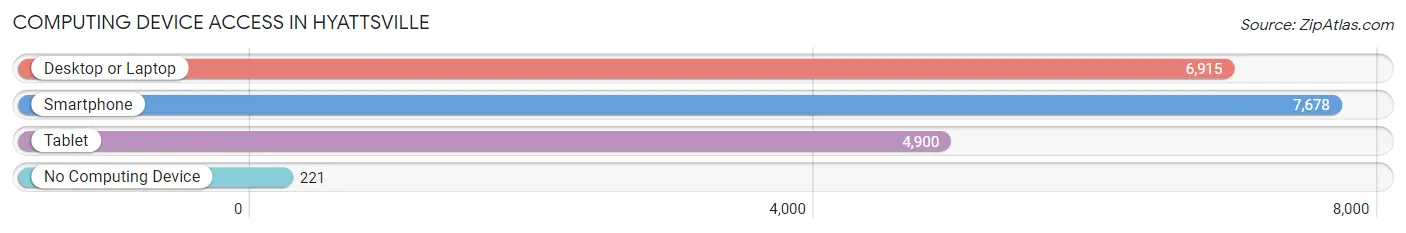
| Device Type | # Households | % Households |
| Desktop or Laptop | 6,915 | 84.8% |
| Smartphone | 7,678 | 94.2% |
| Tablet | 4,900 | 60.1% |
| No Computing Device | 221 | 2.7% |
| Total | 8,151 | 100.0% |
Internet Access in Hyattsville
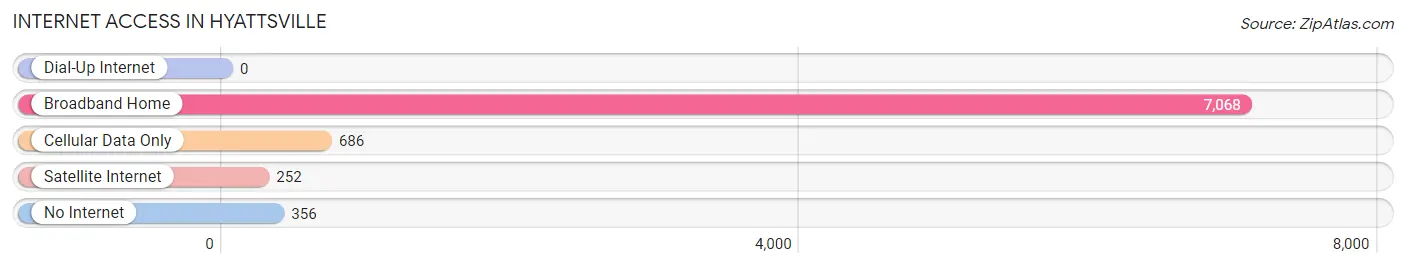
| Internet Type | # Households | % Households |
| Dial-Up Internet | 0 | 0.0% |
| Broadband Home | 7,068 | 86.7% |
| Cellular Data Only | 686 | 8.4% |
| Satellite Internet | 252 | 3.1% |
| No Internet | 356 | 4.4% |
| Total | 8,151 | 100.0% |
Hyattsville Summary
Hyattsville is a city located in Prince George’s County, Maryland, United States. It is situated just east of Washington, D.C. and is part of the Washington metropolitan area. The population of Hyattsville was 17,557 at the 2010 census.
History
Hyattsville was founded in 1883 by Christopher Clark Hyatt, who purchased a tract of land from the heirs of the Beall family. The land was part of an 800-acre (3.2 km2) parcel known as the Beall Estate. Hyatt opened a store and began mail delivery, officially naming the nascent community “Hyattsville” in his own honor. The community grew and was incorporated as a town in 1886. In the early 20th century, Hyattsville was a popular summer resort for Washington, D.C. residents, and it was connected to the city by the Washington, Baltimore and Annapolis Electric Railway in 1908.
In the mid-20th century, Hyattsville was a center for the development of the Washington suburbs. The town was transformed by the construction of the Capital Beltway, which bisected the town and connected it to Washington, D.C. and the rest of the suburbs. The construction of the beltway and the growth of the suburbs had a profound effect on the character of the town.
Geography
Hyattsville is located at 38°57′25″N 76°57′5″W (38.956890, -76.951390). According to the United States Census Bureau, the city has a total area of 2.70 square miles (7.00 km2), all of it land.
Economy
Hyattsville is home to a variety of businesses, including retail stores, restaurants, and professional services. The city is also home to the University of Maryland, College Park, which is the flagship campus of the University System of Maryland. The university is a major employer in the city and provides a significant economic boost to the local economy.
Demographics
As of the 2010 census, there were 17,557 people, 6,324 households, and 3,731 families residing in the city. The population density was 6,525.2 inhabitants per square mile (2,517.3/km2). There were 6,837 housing units at an average density of 2,560.2 per square mile (989.2/km2). The racial makeup of the city was 44.0% White, 29.2% African American, 0.8% Native American, 11.8% Asian, 0.1% Pacific Islander, 10.8% from other races, and 3.3% from two or more races. Hispanic or Latino of any race were 23.1% of the population.
There were 6,324 households, of which 33.2% had children under the age of 18 living with them, 37.8% were married couples living together, 16.9% had a female householder with no husband present, 6.9% had a male householder with no wife present, and 38.4% were non-families. 29.0% of all households were made up of individuals, and 7.5% had someone living alone who was 65 years of age or older. The average household size was 2.75 and the average family size was 3.41.
The median age in the city was 33.5 years. 24.5% of residents were under the age of 18; 11.7% were between the ages of 18 and 24; 30.3% were from 25 to 44; 24.6% were from 45 to 64; and 9.0% were 65 years of age or older. The gender makeup of the city was 48.3% male and 51.7% female.
Common Questions
What is Per Capita Income in Hyattsville?
Per Capita income in Hyattsville is $45,394.
What is the Median Family Income in Hyattsville?
Median Family Income in Hyattsville is $100,492.
What is the Median Household income in Hyattsville?
Median Household Income in Hyattsville is $90,329.
What is Income or Wage Gap in Hyattsville?
Income or Wage Gap in Hyattsville is 26.5%.
Women in Hyattsville earn 73.5 cents for every dollar earned by a man.
What is Family Income Deficit in Hyattsville?
Family Income Deficit in Hyattsville is $17,349.
Families that are below poverty line in Hyattsville earn $17,349 less on average than the poverty threshold level.
What is Inequality or Gini Index in Hyattsville?
Inequality or Gini Index in Hyattsville is 0.42.
What is the Total Population of Hyattsville?
Total Population of Hyattsville is 20,851.
What is the Total Male Population of Hyattsville?
Total Male Population of Hyattsville is 11,075.
What is the Total Female Population of Hyattsville?
Total Female Population of Hyattsville is 9,776.
What is the Ratio of Males per 100 Females in Hyattsville?
There are 113.29 Males per 100 Females in Hyattsville.
What is the Ratio of Females per 100 Males in Hyattsville?
There are 88.27 Females per 100 Males in Hyattsville.
What is the Median Population Age in Hyattsville?
Median Population Age in Hyattsville is 35.5 Years.
What is the Average Family Size in Hyattsville
Average Family Size in Hyattsville is 3.1 People.
What is the Average Household Size in Hyattsville
Average Household Size in Hyattsville is 2.5 People.
How Large is the Labor Force in Hyattsville?
There are 12,911 People in the Labor Forcein in Hyattsville.
What is the Percentage of People in the Labor Force in Hyattsville?
76.3% of People are in the Labor Force in Hyattsville.
What is the Unemployment Rate in Hyattsville?
Unemployment Rate in Hyattsville is 2.8%.