Cities with the Highest Percentage of Immigrants from Egypt in New York
RELATED REPORTS & OPTIONS
Egypt
New York
Compare Cities
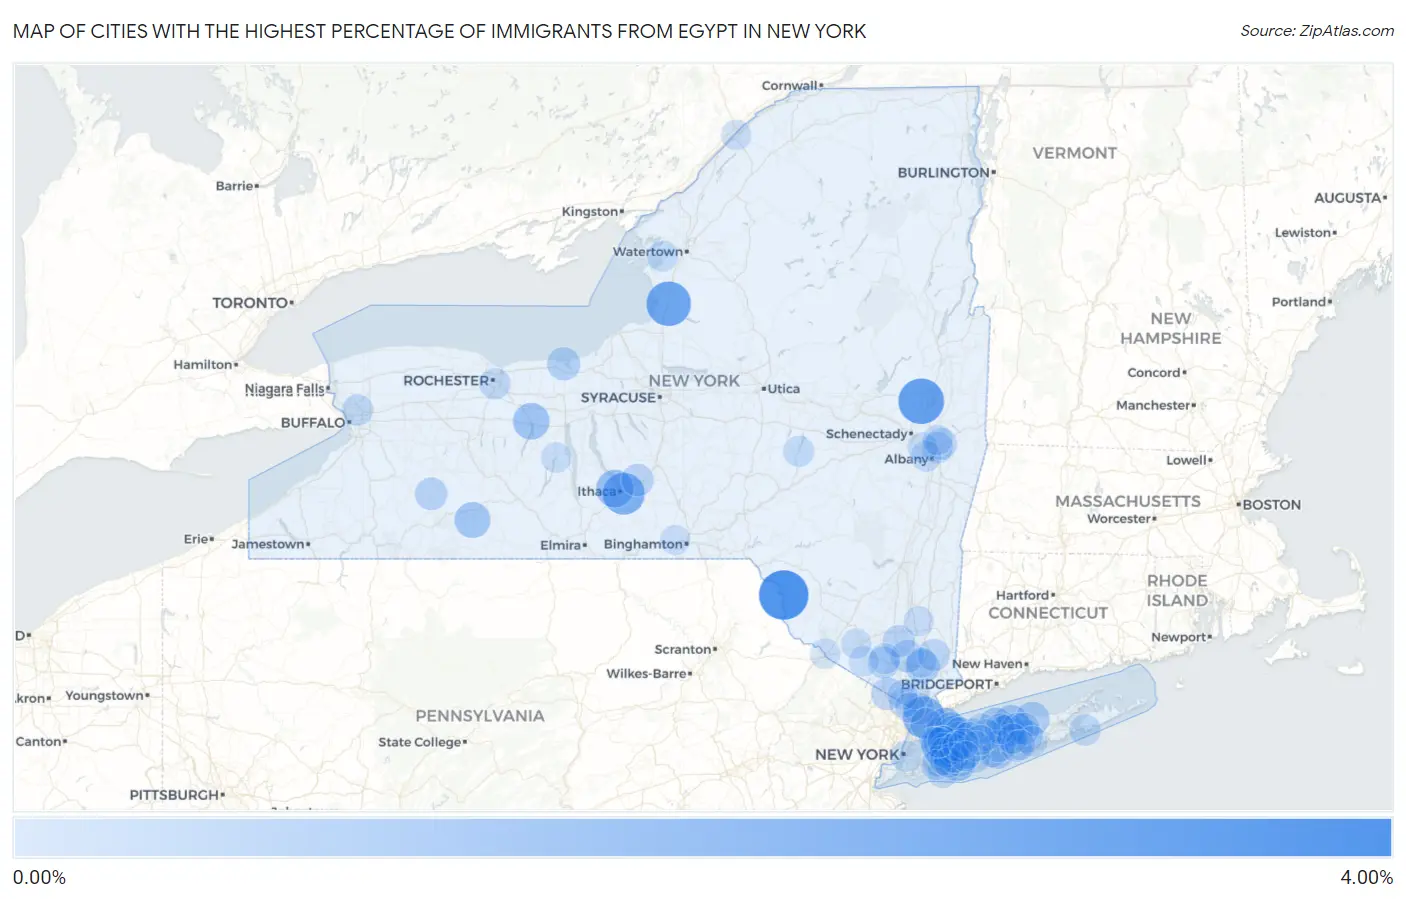
Map of Cities with the Highest Percentage of Immigrants from Egypt in New York
0.00%
4.00%
Cities with the Highest Percentage of Immigrants from Egypt in New York
| City | Egypt | vs State | vs National | |
| 1. | Callicoon | 3.11% | 0.14%(+2.97)#-1 | 0.067%(+3.04)#0 |
| 2. | North Ballston Spa | 2.49% | 0.14%(+2.36)#0 | 0.067%(+2.43)#1 |
| 3. | Schuyler Lake | 2.44% | 0.14%(+2.30)#1 | 0.067%(+2.37)#2 |
| 4. | Lacona | 2.30% | 0.14%(+2.16)#2 | 0.067%(+2.23)#3 |
| 5. | East Ithaca | 1.87% | 0.14%(+1.74)#3 | 0.067%(+1.81)#4 |
| 6. | Searingtown | 1.87% | 0.14%(+1.74)#4 | 0.067%(+1.81)#5 |
| 7. | Tuckahoe | 1.86% | 0.14%(+1.72)#5 | 0.067%(+1.79)#6 |
| 8. | Northwest Ithaca | 1.22% | 0.14%(+1.09)#6 | 0.067%(+1.16)#7 |
| 9. | Bellmore | 1.12% | 0.14%(+0.986)#7 | 0.067%(+1.06)#8 |
| 10. | Glen Cove | 1.12% | 0.14%(+0.983)#8 | 0.067%(+1.05)#9 |
| 11. | Canandaigua | 1.06% | 0.14%(+0.923)#9 | 0.067%(+0.994)#10 |
| 12. | New Cassel | 0.97% | 0.14%(+0.835)#10 | 0.067%(+0.905)#11 |
| 13. | Alfred | 0.94% | 0.14%(+0.803)#11 | 0.067%(+0.873)#12 |
| 14. | Upper Brookville | 0.90% | 0.14%(+0.767)#12 | 0.067%(+0.837)#13 |
| 15. | Port Jefferson Station | 0.85% | 0.14%(+0.716)#13 | 0.067%(+0.786)#14 |
| 16. | Nissequogue | 0.79% | 0.14%(+0.651)#14 | 0.067%(+0.721)#15 |
| 17. | Lake Grove | 0.79% | 0.14%(+0.649)#15 | 0.067%(+0.719)#16 |
| 18. | Crompond | 0.68% | 0.14%(+0.541)#16 | 0.067%(+0.612)#17 |
| 19. | East Shoreham | 0.65% | 0.14%(+0.515)#17 | 0.067%(+0.585)#18 |
| 20. | Syosset | 0.63% | 0.14%(+0.496)#18 | 0.067%(+0.566)#19 |
| 21. | Sodus Point | 0.55% | 0.14%(+0.410)#19 | 0.067%(+0.481)#20 |
| 22. | Locust Valley | 0.53% | 0.14%(+0.389)#20 | 0.067%(+0.459)#21 |
| 23. | Yaphank | 0.50% | 0.14%(+0.361)#21 | 0.067%(+0.431)#22 |
| 24. | East Islip | 0.49% | 0.14%(+0.357)#22 | 0.067%(+0.427)#23 |
| 25. | Suffern | 0.48% | 0.14%(+0.347)#23 | 0.067%(+0.417)#353 |
| 26. | Centereach | 0.47% | 0.14%(+0.337)#24 | 0.067%(+0.407)#354 |
| 27. | Highland Falls | 0.46% | 0.14%(+0.320)#25 | 0.067%(+0.390)#355 |
| 28. | Houghton | 0.45% | 0.14%(+0.315)#26 | 0.067%(+0.385)#356 |
| 29. | Freeville | 0.43% | 0.14%(+0.290)#27 | 0.067%(+0.361)#357 |
| 30. | Vails Gate | 0.42% | 0.14%(+0.280)#28 | 0.067%(+0.350)#358 |
| 31. | Garden City Park | 0.40% | 0.14%(+0.262)#29 | 0.067%(+0.332)#359 |
| 32. | Mahopac | 0.39% | 0.14%(+0.251)#30 | 0.067%(+0.321)#360 |
| 33. | Coram | 0.38% | 0.14%(+0.245)#31 | 0.067%(+0.315)#361 |
| 34. | Monroe | 0.37% | 0.14%(+0.235)#32 | 0.067%(+0.305)#362 |
| 35. | Islip | 0.36% | 0.14%(+0.222)#33 | 0.067%(+0.292)#363 |
| 36. | Middle Island | 0.35% | 0.14%(+0.217)#34 | 0.067%(+0.287)#364 |
| 37. | North Great River | 0.33% | 0.14%(+0.189)#35 | 0.067%(+0.259)#365 |
| 38. | Dobbs Ferry | 0.31% | 0.14%(+0.178)#36 | 0.067%(+0.248)#366 |
| 39. | North New Hyde Park | 0.31% | 0.14%(+0.170)#37 | 0.067%(+0.240)#367 |
| 40. | Commack | 0.30% | 0.14%(+0.159)#38 | 0.067%(+0.229)#368 |
| 41. | Troy | 0.29% | 0.14%(+0.156)#39 | 0.067%(+0.226)#369 |
| 42. | Pelham | 0.29% | 0.14%(+0.152)#40 | 0.067%(+0.222)#370 |
| 43. | West Hempstead | 0.28% | 0.14%(+0.147)#41 | 0.067%(+0.218)#371 |
| 44. | Great Neck Estates | 0.27% | 0.14%(+0.136)#42 | 0.067%(+0.206)#372 |
| 45. | Southampton | 0.27% | 0.14%(+0.131)#43 | 0.067%(+0.201)#373 |
| 46. | Garden City South | 0.27% | 0.14%(+0.130)#44 | 0.067%(+0.201)#374 |
| 47. | Watervliet | 0.26% | 0.14%(+0.125)#45 | 0.067%(+0.195)#375 |
| 48. | Brighton | 0.26% | 0.14%(+0.118)#46 | 0.067%(+0.188)#376 |
| 49. | Eggertsville | 0.25% | 0.14%(+0.115)#47 | 0.067%(+0.185)#377 |
| 50. | New York | 0.25% | 0.14%(+0.111)#48 | 0.067%(+0.181)#684 |
| 51. | Patchogue | 0.24% | 0.14%(+0.106)#49 | 0.067%(+0.176)#685 |
| 52. | Roslyn | 0.24% | 0.14%(+0.102)#50 | 0.067%(+0.172)#686 |
| 53. | Thomaston | 0.22% | 0.14%(+0.081)#51 | 0.067%(+0.151)#687 |
| 54. | Huntington Station | 0.21% | 0.14%(+0.077)#52 | 0.067%(+0.147)#688 |
| 55. | Oyster Bay Cove | 0.21% | 0.14%(+0.069)#53 | 0.067%(+0.139)#689 |
| 56. | Kiryas Joel | 0.20% | 0.14%(+0.061)#54 | 0.067%(+0.131)#690 |
| 57. | Cooperstown | 0.20% | 0.14%(+0.060)#55 | 0.067%(+0.130)#691 |
| 58. | Sackets Harbor | 0.20% | 0.14%(+0.059)#56 | 0.067%(+0.129)#692 |
| 59. | Mineola | 0.20% | 0.14%(+0.059)#57 | 0.067%(+0.129)#693 |
| 60. | Lindenhurst | 0.20% | 0.14%(+0.058)#58 | 0.067%(+0.128)#694 |
| 61. | West Hills | 0.19% | 0.14%(+0.058)#59 | 0.067%(+0.128)#695 |
| 62. | Long Beach | 0.19% | 0.14%(+0.053)#60 | 0.067%(+0.123)#696 |
| 63. | Wantagh | 0.18% | 0.14%(+0.041)#61 | 0.067%(+0.111)#697 |
| 64. | Valley Stream | 0.18% | 0.14%(+0.039)#62 | 0.067%(+0.109)#698 |
| 65. | East Northport | 0.17% | 0.14%(+0.036)#63 | 0.067%(+0.106)#699 |
| 66. | Albany | 0.16% | 0.14%(+0.025)#64 | 0.067%(+0.095)#700 |
| 67. | South Farmingdale | 0.15% | 0.14%(+0.016)#65 | 0.067%(+0.086)#701 |
| 68. | Roslyn Estates | 0.15% | 0.14%(+0.011)#66 | 0.067%(+0.081)#702 |
| 69. | North Bellmore | 0.15% | 0.14%(+0.010)#67 | 0.067%(+0.080)#703 |
| 70. | Rockville Centre | 0.14% | 0.14%(+0.007)#68 | 0.067%(+0.077)#704 |
| 71. | Garden City | 0.14% | 0.14%(-0.001)#69 | 0.067%(+0.069)#705 |
| 72. | Salisbury | 0.13% | 0.14%(-0.005)#70 | 0.067%(+0.065)#706 |
| 73. | St James | 0.13% | 0.14%(-0.006)#71 | 0.067%(+0.064)#707 |
| 74. | Colonie | 0.13% | 0.14%(-0.008)#72 | 0.067%(+0.062)#708 |
| 75. | Cohoes | 0.13% | 0.14%(-0.009)#73 | 0.067%(+0.061)#709 |
| 76. | Port Jervis | 0.13% | 0.14%(-0.011)#74 | 0.067%(+0.059)#710 |
| 77. | Shirley | 0.12% | 0.14%(-0.012)#75 | 0.067%(+0.058)#711 |
| 78. | North Merrick | 0.12% | 0.14%(-0.014)#76 | 0.067%(+0.056)#712 |
| 79. | Ogdensburg | 0.12% | 0.14%(-0.016)#77 | 0.067%(+0.054)#713 |
| 80. | Woodmere | 0.12% | 0.14%(-0.018)#78 | 0.067%(+0.052)#714 |
| 81. | Baldwin | 0.12% | 0.14%(-0.019)#79 | 0.067%(+0.052)#715 |
| 82. | Lake Mohegan | 0.12% | 0.14%(-0.019)#80 | 0.067%(+0.051)#716 |
| 83. | Penn Yan | 0.12% | 0.14%(-0.020)#81 | 0.067%(+0.050)#717 |
| 84. | Manhasset | 0.12% | 0.14%(-0.020)#82 | 0.067%(+0.050)#718 |
| 85. | Wheatley Heights | 0.11% | 0.14%(-0.025)#83 | 0.067%(+0.046)#719 |
| 86. | Hicksville | 0.11% | 0.14%(-0.026)#84 | 0.067%(+0.044)#720 |
| 87. | Pearl River | 0.11% | 0.14%(-0.027)#85 | 0.067%(+0.043)#721 |
| 88. | Dix Hills | 0.11% | 0.14%(-0.031)#86 | 0.067%(+0.039)#722 |
| 89. | Latham | 0.10% | 0.14%(-0.034)#87 | 0.067%(+0.036)#723 |
| 90. | Florida | 0.10% | 0.14%(-0.035)#88 | 0.067%(+0.035)#724 |
| 91. | Plainview | 0.094% | 0.14%(-0.043)#89 | 0.067%(+0.027)#725 |
| 92. | Myers Corner | 0.094% | 0.14%(-0.043)#90 | 0.067%(+0.027)#726 |
| 93. | Upper Nyack | 0.093% | 0.14%(-0.044)#91 | 0.067%(+0.027)#727 |
| 94. | Middletown | 0.093% | 0.14%(-0.044)#92 | 0.067%(+0.026)#728 |
| 95. | North Massapequa | 0.088% | 0.14%(-0.049)#93 | 0.067%(+0.021)#729 |
| 96. | Nanuet | 0.087% | 0.14%(-0.050)#94 | 0.067%(+0.021)#730 |
| 97. | Tappan | 0.086% | 0.14%(-0.051)#95 | 0.067%(+0.019)#731 |
| 98. | Endwell | 0.085% | 0.14%(-0.052)#96 | 0.067%(+0.018)#732 |
| 99. | Holtsville | 0.082% | 0.14%(-0.055)#97 | 0.067%(+0.015)#733 |
| 100. | East Patchogue | 0.079% | 0.14%(-0.058)#98 | 0.067%(+0.012)#734 |
Common Questions
What are the Top 10 Cities with the Highest Percentage of Immigrants from Egypt in New York?
Top 10 Cities with the Highest Percentage of Immigrants from Egypt in New York are:
#1
3.11%
#2
2.49%
#3
2.30%
#4
1.87%
#5
1.87%
#6
1.86%
#7
1.22%
#8
1.12%
#9
1.12%
#10
1.06%
What city has the Highest Percentage of Immigrants from Egypt in New York?
Callicoon has the Highest Percentage of Immigrants from Egypt in New York with 3.11%.
What is the Percentage of Immigrants from Egypt in the State of New York?
Percentage of Immigrants from Egypt in New York is 0.14%.
What is the Percentage of Immigrants from Egypt in the United States?
Percentage of Immigrants from Egypt in the United States is 0.067%.