Rocky Mount, VA Map & Demographics
Rocky Mount Map
Rocky Mount Overview
$24,271
PER CAPITA INCOME
$59,459
AVG FAMILY INCOME
$58,678
AVG HOUSEHOLD INCOME
21.6%
WAGE / INCOME GAP [ % ]
78.4¢/ $1
WAGE / INCOME GAP [ $ ]
0.35
INEQUALITY / GINI INDEX
4,916
TOTAL POPULATION
2,086
MALE POPULATION
2,830
FEMALE POPULATION
73.71
MALES / 100 FEMALES
135.67
FEMALES / 100 MALES
43.0
MEDIAN AGE
3.2
AVG FAMILY SIZE
2.6
AVG HOUSEHOLD SIZE
2,148
LABOR FORCE [ PEOPLE ]
54.1%
PERCENT IN LABOR FORCE
4.9%
UNEMPLOYMENT RATE
Rocky Mount Zip Codes
Rocky Mount Area Codes
Income in Rocky Mount
Income Overview in Rocky Mount
Per Capita Income in Rocky Mount is $24,271, while median incomes of families and households are $59,459 and $58,678 respectively.
| Characteristic | Number | Measure |
| Per Capita Income | 4,916 | $24,271 |
| Median Family Income | 1,168 | $59,459 |
| Mean Family Income | 1,168 | $65,117 |
| Median Household Income | 1,758 | $58,678 |
| Mean Household Income | 1,758 | $61,444 |
| Income Deficit | 1,168 | $0 |
| Wage / Income Gap (%) | 4,916 | 21.65% |
| Wage / Income Gap ($) | 4,916 | 78.35¢ per $1 |
| Gini / Inequality Index | 4,916 | 0.35 |
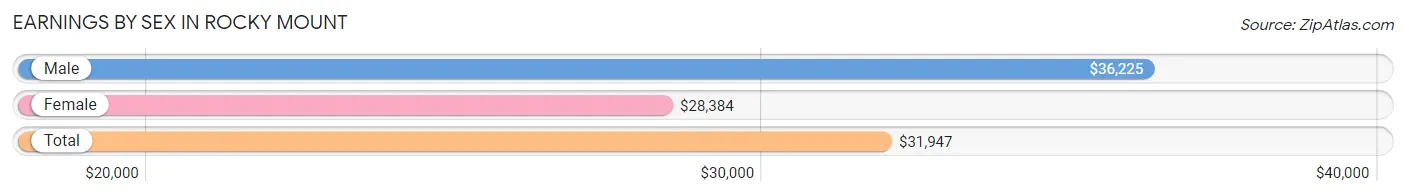
Earnings by Sex in Rocky Mount
Average Earnings in Rocky Mount are $31,947, $36,225 for men and $28,384 for women, a difference of 21.6%.
| Sex | Number | Average Earnings |
| Male | 1,003 (45.3%) | $36,225 |
| Female | 1,213 (54.7%) | $28,384 |
| Total | 2,216 (100.0%) | $31,947 |
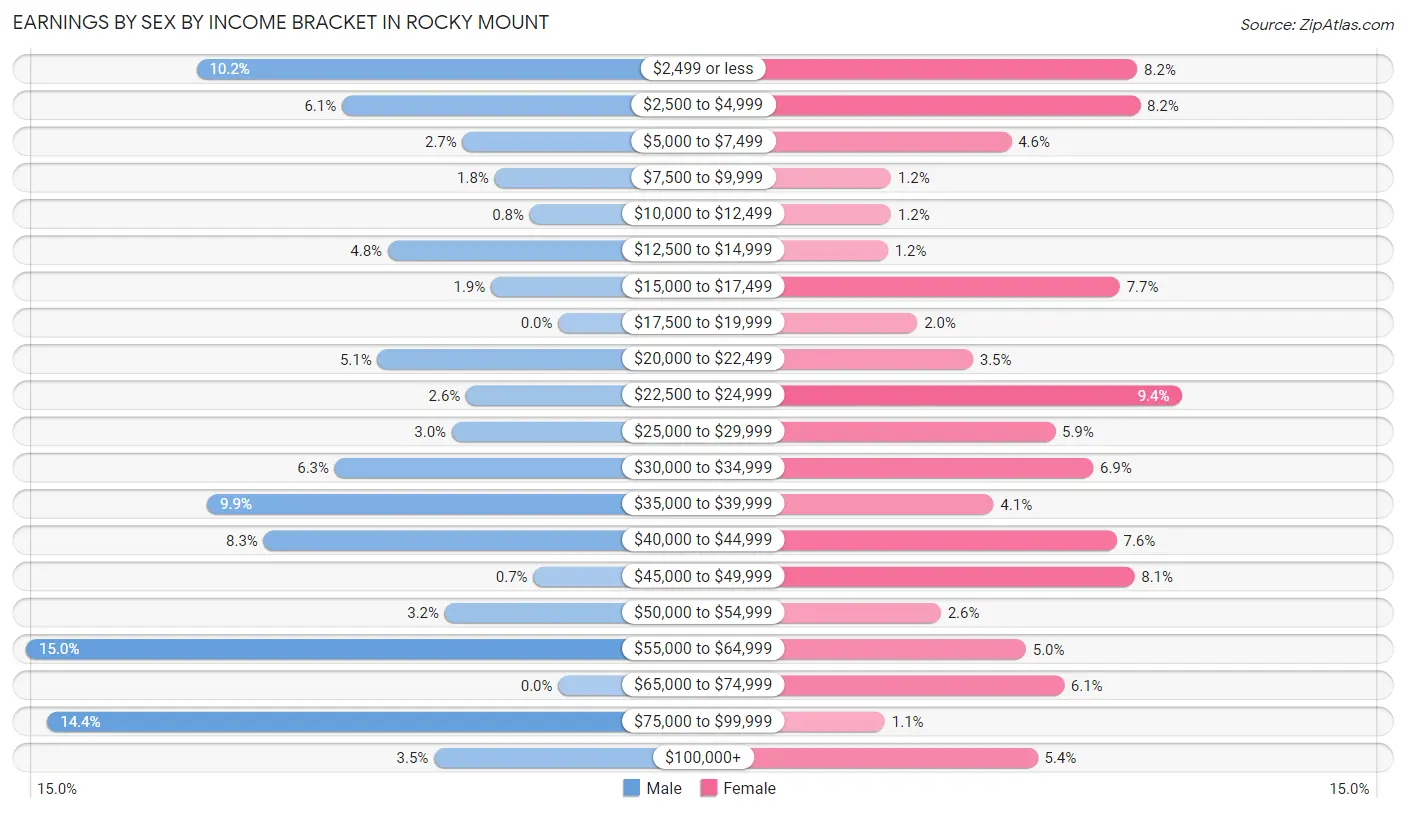
Earnings by Sex by Income Bracket in Rocky Mount
The most common earnings brackets in Rocky Mount are $55,000 to $64,999 for men (150 | 15.0%) and $22,500 to $24,999 for women (114 | 9.4%).
| Income | Male | Female |
| $2,499 or less | 102 (10.2%) | 99 (8.2%) |
| $2,500 to $4,999 | 61 (6.1%) | 100 (8.2%) |
| $5,000 to $7,499 | 27 (2.7%) | 56 (4.6%) |
| $7,500 to $9,999 | 18 (1.8%) | 15 (1.2%) |
| $10,000 to $12,499 | 8 (0.8%) | 15 (1.2%) |
| $12,500 to $14,999 | 48 (4.8%) | 14 (1.1%) |
| $15,000 to $17,499 | 19 (1.9%) | 93 (7.7%) |
| $17,500 to $19,999 | 0 (0.0%) | 24 (2.0%) |
| $20,000 to $22,499 | 51 (5.1%) | 43 (3.5%) |
| $22,500 to $24,999 | 26 (2.6%) | 114 (9.4%) |
| $25,000 to $29,999 | 30 (3.0%) | 71 (5.9%) |
| $30,000 to $34,999 | 63 (6.3%) | 84 (6.9%) |
| $35,000 to $39,999 | 99 (9.9%) | 50 (4.1%) |
| $40,000 to $44,999 | 83 (8.3%) | 92 (7.6%) |
| $45,000 to $49,999 | 7 (0.7%) | 98 (8.1%) |
| $50,000 to $54,999 | 32 (3.2%) | 32 (2.6%) |
| $55,000 to $64,999 | 150 (15.0%) | 61 (5.0%) |
| $65,000 to $74,999 | 0 (0.0%) | 74 (6.1%) |
| $75,000 to $99,999 | 144 (14.4%) | 13 (1.1%) |
| $100,000+ | 35 (3.5%) | 65 (5.4%) |
| Total | 1,003 (100.0%) | 1,213 (100.0%) |
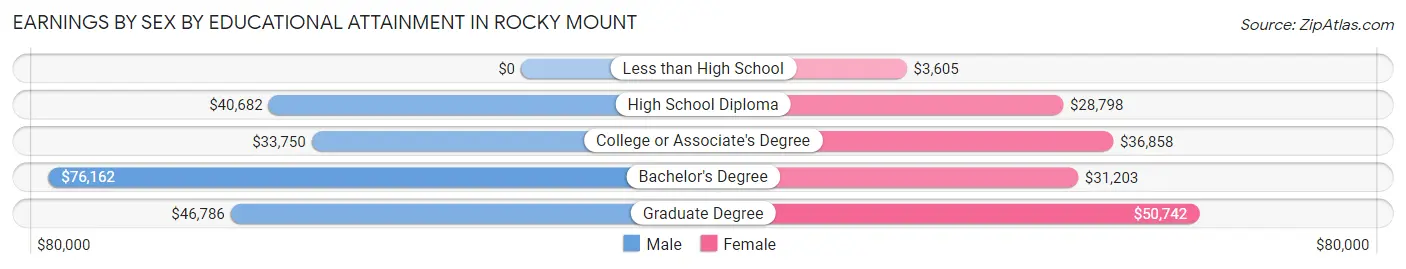
Earnings by Sex by Educational Attainment in Rocky Mount
Average earnings in Rocky Mount are $37,324 for men and $35,068 for women, a difference of 6.0%. Men with an educational attainment of bachelor's degree enjoy the highest average annual earnings of $76,162, while those with college or associate's degree education earn the least with $33,750. Women with an educational attainment of graduate degree earn the most with the average annual earnings of $50,742, while those with less than high school education have the smallest earnings of $3,605.
| Educational Attainment | Male Income | Female Income |
| Less than High School | - | - |
| High School Diploma | $40,682 | $28,798 |
| College or Associate's Degree | $33,750 | $36,858 |
| Bachelor's Degree | $76,162 | $31,203 |
| Graduate Degree | $46,786 | $50,742 |
| Total | $37,324 | $35,068 |
Family Income in Rocky Mount
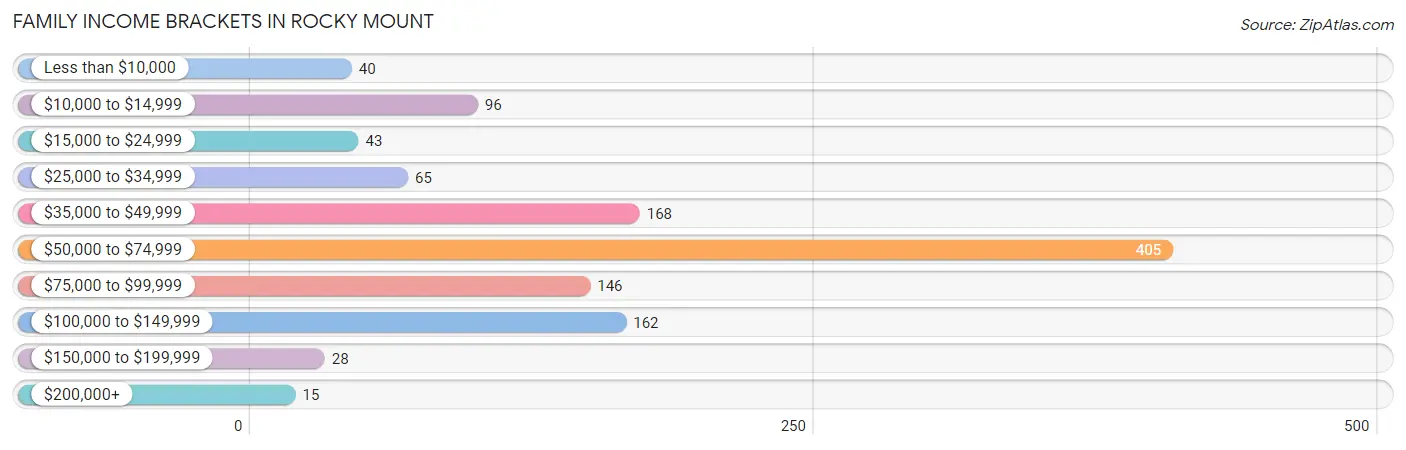
Family Income Brackets in Rocky Mount
According to the Rocky Mount family income data, there are 405 families falling into the $50,000 to $74,999 income range, which is the most common income bracket and makes up 34.7% of all families. Conversely, the $200,000+ income bracket is the least frequent group with only 15 families (1.3%) belonging to this category.
| Income Bracket | # Families | % Families |
| Less than $10,000 | 40 | 3.4% |
| $10,000 to $14,999 | 96 | 8.2% |
| $15,000 to $24,999 | 43 | 3.7% |
| $25,000 to $34,999 | 65 | 5.6% |
| $35,000 to $49,999 | 168 | 14.4% |
| $50,000 to $74,999 | 405 | 34.7% |
| $75,000 to $99,999 | 146 | 12.5% |
| $100,000 to $149,999 | 162 | 13.9% |
| $150,000 to $199,999 | 28 | 2.4% |
| $200,000+ | 15 | 1.3% |
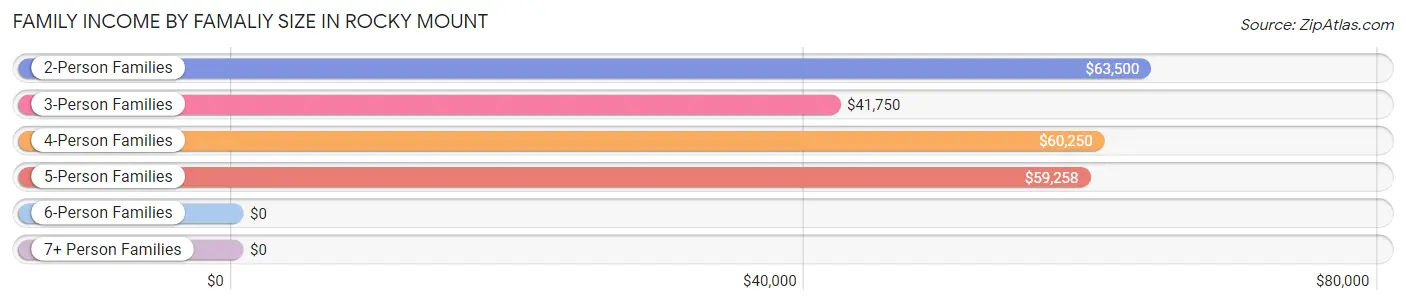
Family Income by Famaliy Size in Rocky Mount
2-person families (504 | 43.1%) account for the highest median family income in Rocky Mount with $63,500 per family, while 2-person families (504 | 43.1%) have the highest median income of $31,750 per family member.
| Income Bracket | # Families | Median Income |
| 2-Person Families | 504 (43.1%) | $63,500 |
| 3-Person Families | 207 (17.7%) | $41,750 |
| 4-Person Families | 301 (25.8%) | $60,250 |
| 5-Person Families | 114 (9.8%) | $59,258 |
| 6-Person Families | 26 (2.2%) | $0 |
| 7+ Person Families | 16 (1.4%) | $0 |
| Total | 1,168 (100.0%) | $59,459 |
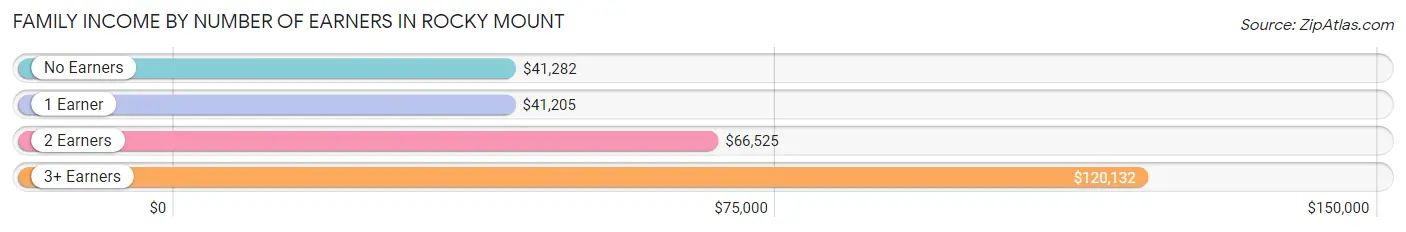
Family Income by Number of Earners in Rocky Mount
The median family income in Rocky Mount is $59,459, with families comprising 3+ earners (138) having the highest median family income of $120,132, while families with 1 earner (354) have the lowest median family income of $41,205, accounting for 11.8% and 30.3% of families, respectively.
| Number of Earners | # Families | Median Income |
| No Earners | 238 (20.4%) | $41,282 |
| 1 Earner | 354 (30.3%) | $41,205 |
| 2 Earners | 438 (37.5%) | $66,525 |
| 3+ Earners | 138 (11.8%) | $120,132 |
| Total | 1,168 (100.0%) | $59,459 |
Household Income in Rocky Mount
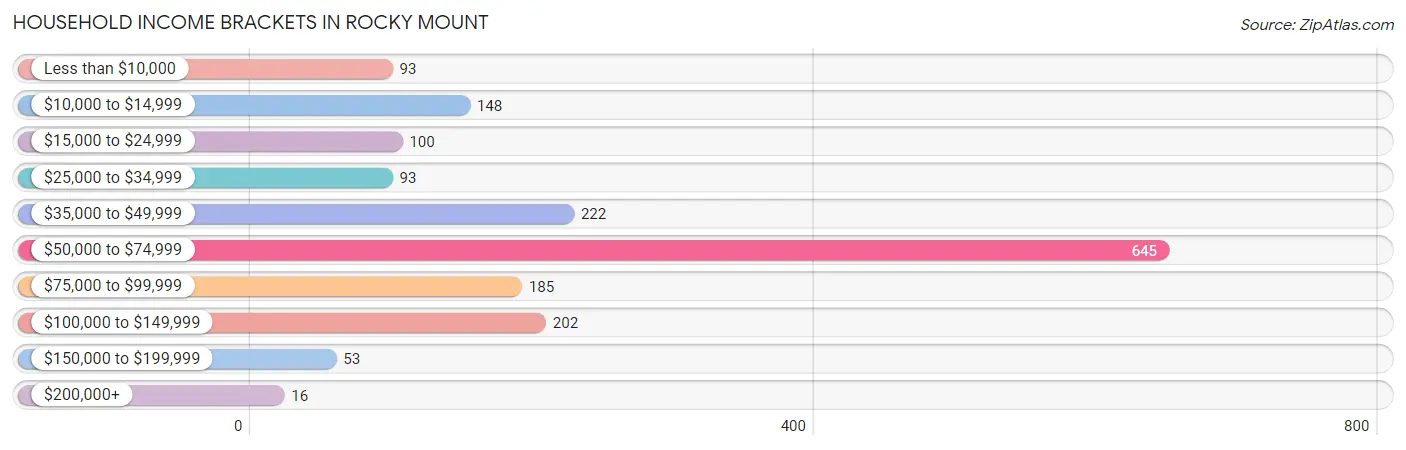
Household Income Brackets in Rocky Mount
With 645 households falling in the category, the $50,000 to $74,999 income range is the most frequent in Rocky Mount, accounting for 36.7% of all households. In contrast, only 16 households (0.9%) fall into the $200,000+ income bracket, making it the least populous group.
| Income Bracket | # Households | % Households |
| Less than $10,000 | 93 | 5.3% |
| $10,000 to $14,999 | 148 | 8.4% |
| $15,000 to $24,999 | 100 | 5.7% |
| $25,000 to $34,999 | 93 | 5.3% |
| $35,000 to $49,999 | 222 | 12.6% |
| $50,000 to $74,999 | 645 | 36.7% |
| $75,000 to $99,999 | 185 | 10.5% |
| $100,000 to $149,999 | 202 | 11.5% |
| $150,000 to $199,999 | 53 | 3.0% |
| $200,000+ | 16 | 0.9% |
Household Income by Householder Age in Rocky Mount
The median household income in Rocky Mount is $58,678, with the highest median household income of $61,579 found in the 45 to 64 years age bracket for the primary householder. A total of 676 households (38.5%) fall into this category. Meanwhile, the 15 to 24 years age bracket for the primary householder has the lowest median household income of $53,750, with 45 households (2.6%) in this group.
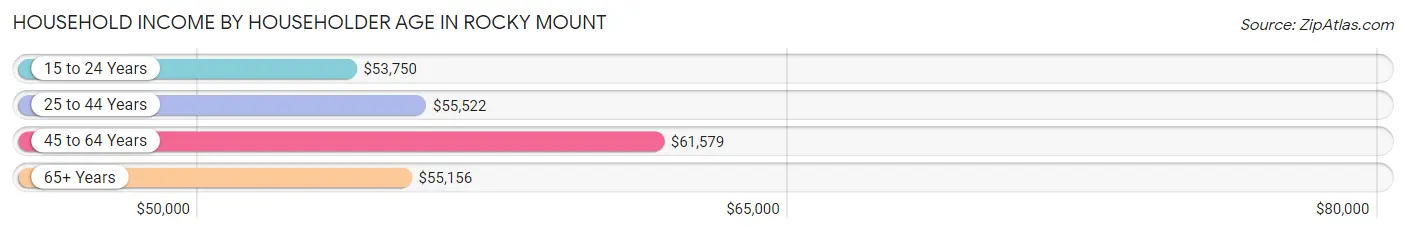
| Income Bracket | # Households | Median Income |
| 15 to 24 Years | 45 (2.6%) | $53,750 |
| 25 to 44 Years | 454 (25.8%) | $55,522 |
| 45 to 64 Years | 676 (38.5%) | $61,579 |
| 65+ Years | 583 (33.2%) | $55,156 |
| Total | 1,758 (100.0%) | $58,678 |
Poverty in Rocky Mount
Income Below Poverty by Sex and Age in Rocky Mount
With 16.2% poverty level for males and 15.7% for females among the residents of Rocky Mount, 6 to 11 year old males and 15 year old females are the most vulnerable to poverty, with 83 males (55.0%) and 27 females (100.0%) in their respective age groups living below the poverty level.
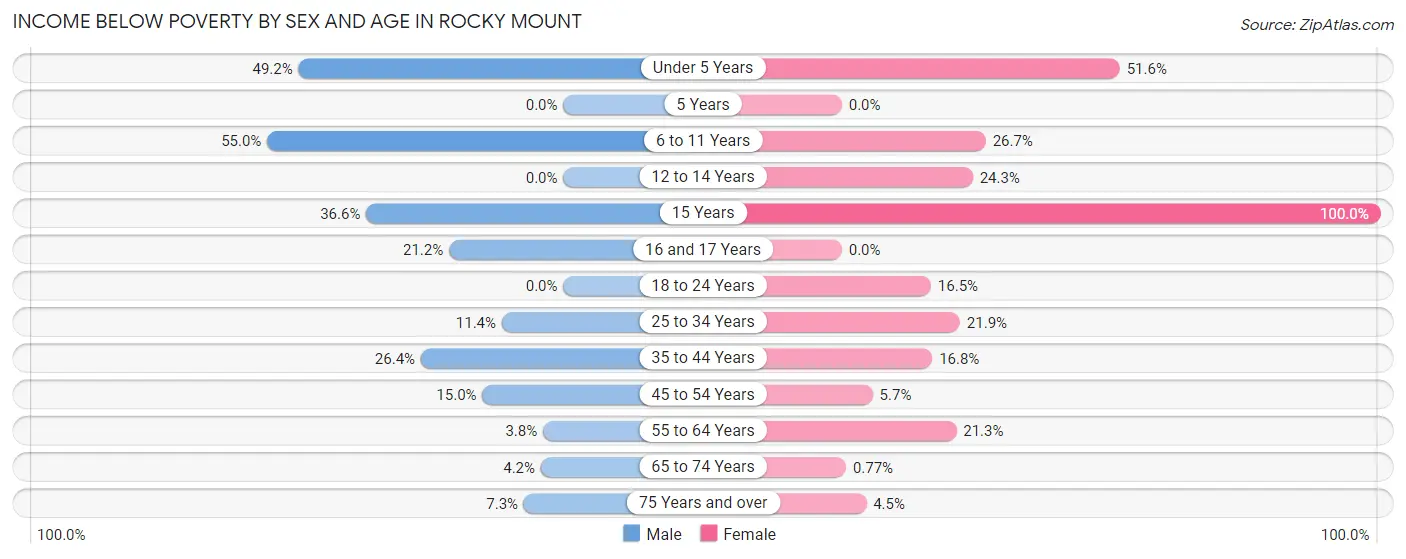
| Age Bracket | Male | Female |
| Under 5 Years | 29 (49.1%) | 81 (51.6%) |
| 5 Years | 0 (0.0%) | 0 (0.0%) |
| 6 to 11 Years | 83 (55.0%) | 39 (26.7%) |
| 12 to 14 Years | 0 (0.0%) | 26 (24.3%) |
| 15 Years | 15 (36.6%) | 27 (100.0%) |
| 16 and 17 Years | 14 (21.2%) | 0 (0.0%) |
| 18 to 24 Years | 0 (0.0%) | 42 (16.5%) |
| 25 to 34 Years | 21 (11.4%) | 89 (21.9%) |
| 35 to 44 Years | 69 (26.4%) | 25 (16.8%) |
| 45 to 54 Years | 61 (15.0%) | 26 (5.7%) |
| 55 to 64 Years | 5 (3.8%) | 51 (21.2%) |
| 65 to 74 Years | 6 (4.2%) | 2 (0.8%) |
| 75 Years and over | 12 (7.3%) | 15 (4.5%) |
| Total | 315 (16.2%) | 423 (15.7%) |
Income Above Poverty by Sex and Age in Rocky Mount
According to the poverty statistics in Rocky Mount, males aged 5 years and females aged 5 years are the age groups that are most secure financially, with 100.0% of males and 100.0% of females in these age groups living above the poverty line.
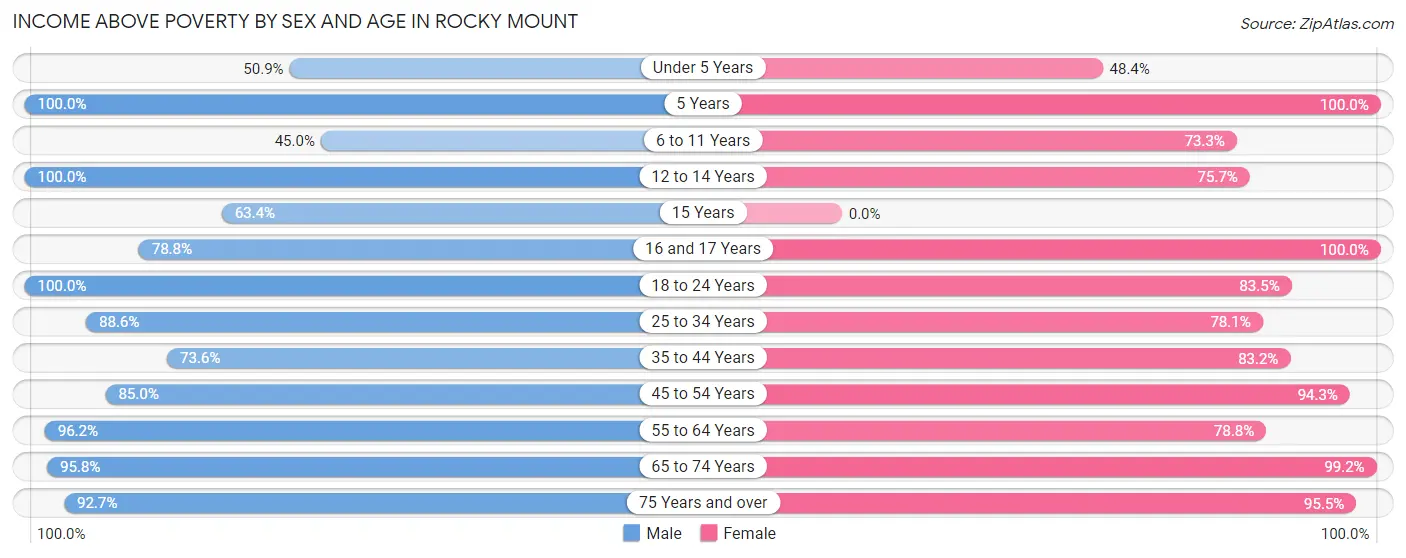
| Age Bracket | Male | Female |
| Under 5 Years | 30 (50.8%) | 76 (48.4%) |
| 5 Years | 51 (100.0%) | 56 (100.0%) |
| 6 to 11 Years | 68 (45.0%) | 107 (73.3%) |
| 12 to 14 Years | 151 (100.0%) | 81 (75.7%) |
| 15 Years | 26 (63.4%) | 0 (0.0%) |
| 16 and 17 Years | 52 (78.8%) | 100 (100.0%) |
| 18 to 24 Years | 129 (100.0%) | 212 (83.5%) |
| 25 to 34 Years | 163 (88.6%) | 317 (78.1%) |
| 35 to 44 Years | 192 (73.6%) | 124 (83.2%) |
| 45 to 54 Years | 345 (85.0%) | 428 (94.3%) |
| 55 to 64 Years | 128 (96.2%) | 189 (78.7%) |
| 65 to 74 Years | 138 (95.8%) | 258 (99.2%) |
| 75 Years and over | 152 (92.7%) | 316 (95.5%) |
| Total | 1,625 (83.8%) | 2,264 (84.3%) |
Income Below Poverty Among Married-Couple Families in Rocky Mount
The poverty statistics for married-couple families in Rocky Mount show that 2.2% or 18 of the total 808 families live below the poverty line. Families with no children have the highest poverty rate of 4.0%, comprising of 18 families. On the other hand, families with 1 or 2 children have the lowest poverty rate of 0.0%, which includes 0 families.
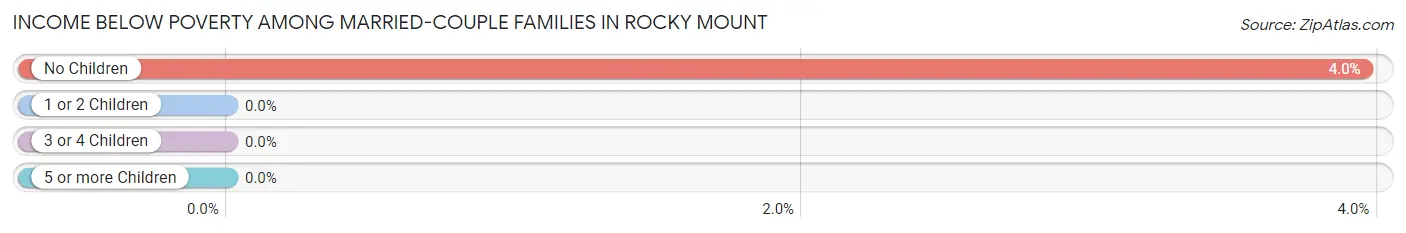
| Children | Above Poverty | Below Poverty |
| No Children | 438 (96.1%) | 18 (4.0%) |
| 1 or 2 Children | 301 (100.0%) | 0 (0.0%) |
| 3 or 4 Children | 35 (100.0%) | 0 (0.0%) |
| 5 or more Children | 16 (100.0%) | 0 (0.0%) |
| Total | 790 (97.8%) | 18 (2.2%) |
Income Below Poverty Among Single-Parent Households in Rocky Mount
According to the poverty data in Rocky Mount, 32.4% or 46 single-father households and 52.7% or 115 single-mother households are living below the poverty line. Among single-father households, those with 3 or 4 children have the highest poverty rate, with 31 households (100.0%) experiencing poverty. Likewise, among single-mother households, those with 5 or more children have the highest poverty rate, with 16 households (100.0%) falling below the poverty line.
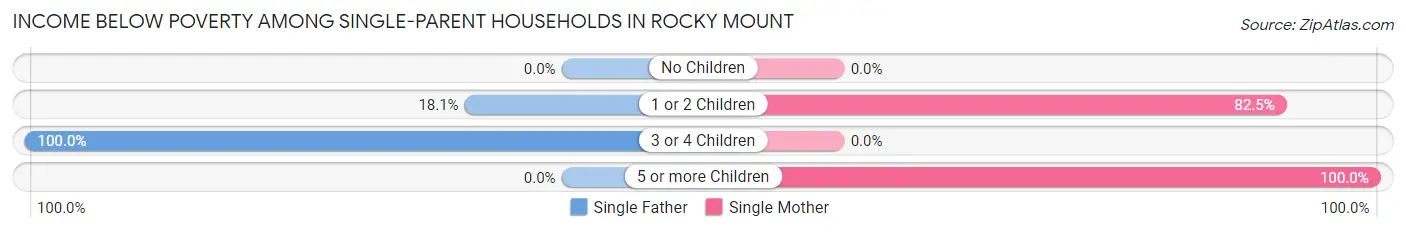
| Children | Single Father | Single Mother |
| No Children | 0 (0.0%) | 0 (0.0%) |
| 1 or 2 Children | 15 (18.1%) | 99 (82.5%) |
| 3 or 4 Children | 31 (100.0%) | 0 (0.0%) |
| 5 or more Children | 0 (0.0%) | 16 (100.0%) |
| Total | 46 (32.4%) | 115 (52.7%) |
Income Below Poverty Among Married-Couple vs Single-Parent Households in Rocky Mount
The poverty data for Rocky Mount shows that 18 of the married-couple family households (2.2%) and 161 of the single-parent households (44.7%) are living below the poverty level. Within the married-couple family households, those with no children have the highest poverty rate, with 18 households (4.0%) falling below the poverty line. Among the single-parent households, those with 5 or more children have the highest poverty rate, with 16 household (100.0%) living below poverty.
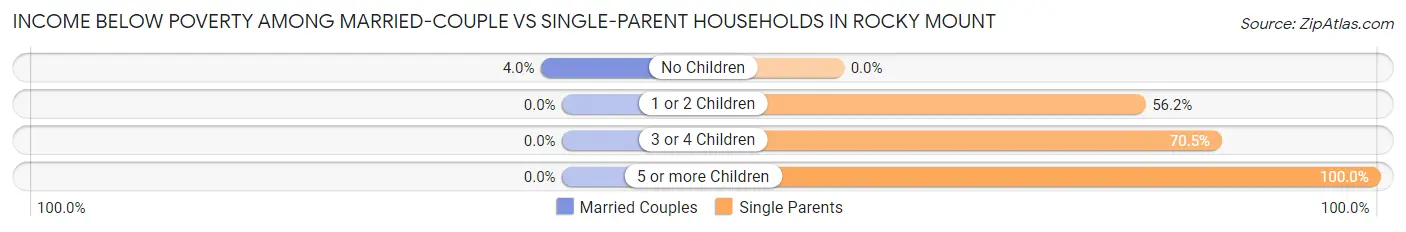
| Children | Married-Couple Families | Single-Parent Households |
| No Children | 18 (4.0%) | 0 (0.0%) |
| 1 or 2 Children | 0 (0.0%) | 114 (56.2%) |
| 3 or 4 Children | 0 (0.0%) | 31 (70.5%) |
| 5 or more Children | 0 (0.0%) | 16 (100.0%) |
| Total | 18 (2.2%) | 161 (44.7%) |
Race in Rocky Mount
The most populous races in Rocky Mount are White / Caucasian (3,166 | 64.4%), Black / African American (1,300 | 26.4%), and Two or more Races (404 | 8.2%).
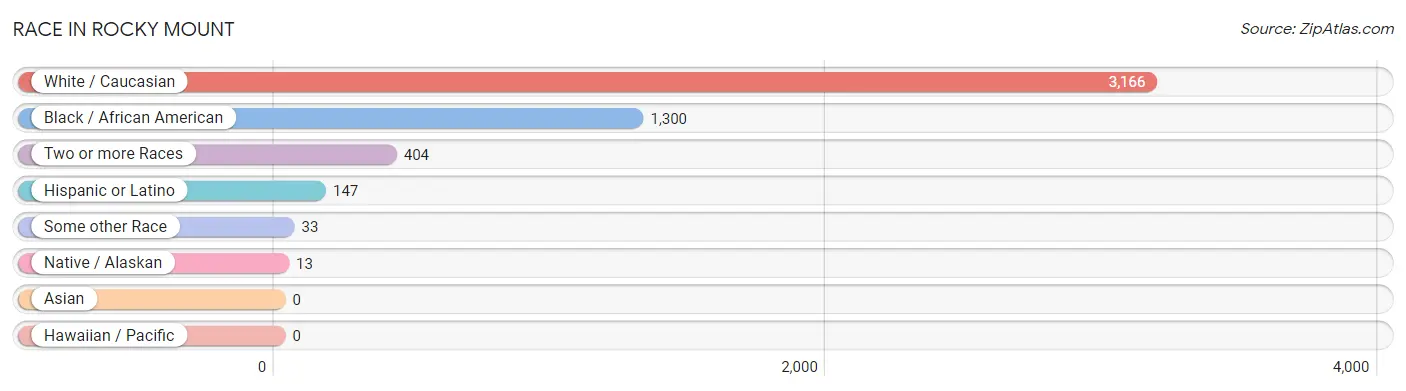
| Race | # Population | % Population |
| Asian | 0 | 0.0% |
| Black / African American | 1,300 | 26.4% |
| Hawaiian / Pacific | 0 | 0.0% |
| Hispanic or Latino | 147 | 3.0% |
| Native / Alaskan | 13 | 0.3% |
| White / Caucasian | 3,166 | 64.4% |
| Two or more Races | 404 | 8.2% |
| Some other Race | 33 | 0.7% |
| Total | 4,916 | 100.0% |
Ancestry in Rocky Mount
The most populous ancestries reported in Rocky Mount are American (1,110 | 22.6%), German (464 | 9.4%), Irish (334 | 6.8%), English (253 | 5.1%), and Dutch (158 | 3.2%), together accounting for 47.2% of all Rocky Mount residents.
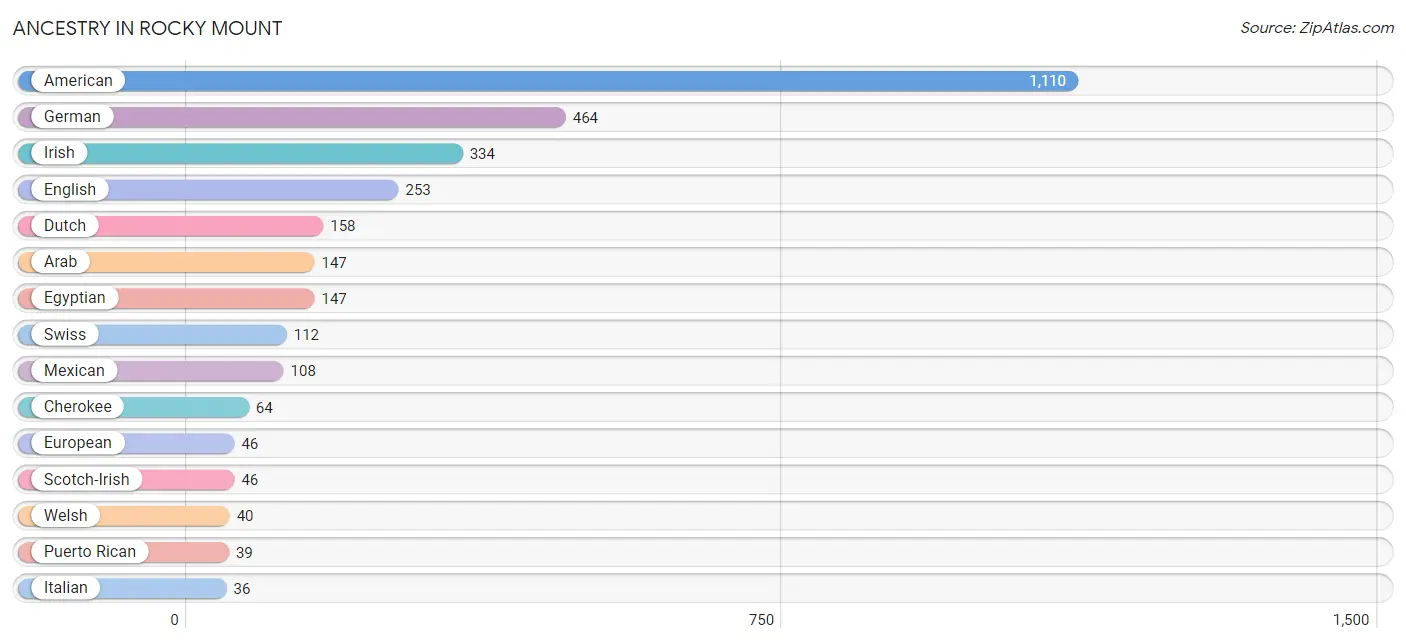
| Ancestry | # Population | % Population |
| African | 30 | 0.6% |
| American | 1,110 | 22.6% |
| Arab | 147 | 3.0% |
| British | 27 | 0.5% |
| Canadian | 7 | 0.1% |
| Cherokee | 64 | 1.3% |
| Dutch | 158 | 3.2% |
| Egyptian | 147 | 3.0% |
| English | 253 | 5.1% |
| European | 46 | 0.9% |
| French | 15 | 0.3% |
| German | 464 | 9.4% |
| Irish | 334 | 6.8% |
| Italian | 36 | 0.7% |
| Mexican | 108 | 2.2% |
| Mexican American Indian | 13 | 0.3% |
| Polish | 19 | 0.4% |
| Puerto Rican | 39 | 0.8% |
| Scotch-Irish | 46 | 0.9% |
| Scottish | 31 | 0.6% |
| Slavic | 13 | 0.3% |
| Subsaharan African | 30 | 0.6% |
| Swiss | 112 | 2.3% |
| Welsh | 40 | 0.8% | View All 24 Rows |
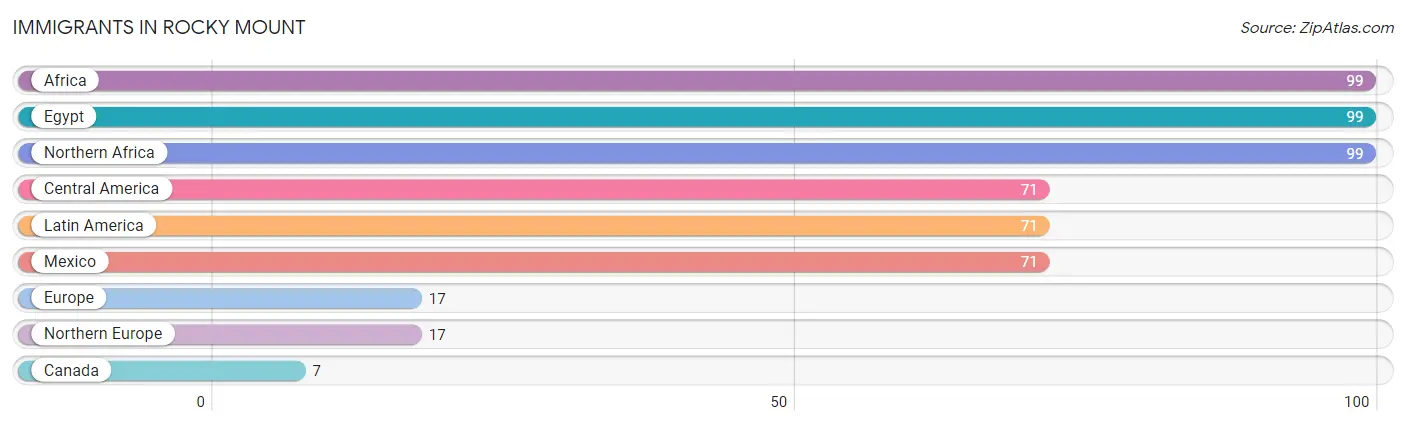
Immigrants in Rocky Mount
The most numerous immigrant groups reported in Rocky Mount came from Africa (99 | 2.0%), Egypt (99 | 2.0%), Northern Africa (99 | 2.0%), Central America (71 | 1.4%), and Latin America (71 | 1.4%), together accounting for 8.9% of all Rocky Mount residents.
| Immigration Origin | # Population | % Population |
| Africa | 99 | 2.0% |
| Canada | 7 | 0.1% |
| Central America | 71 | 1.4% |
| Egypt | 99 | 2.0% |
| Europe | 17 | 0.4% |
| Latin America | 71 | 1.4% |
| Mexico | 71 | 1.4% |
| Northern Africa | 99 | 2.0% |
| Northern Europe | 17 | 0.4% | View All 9 Rows |
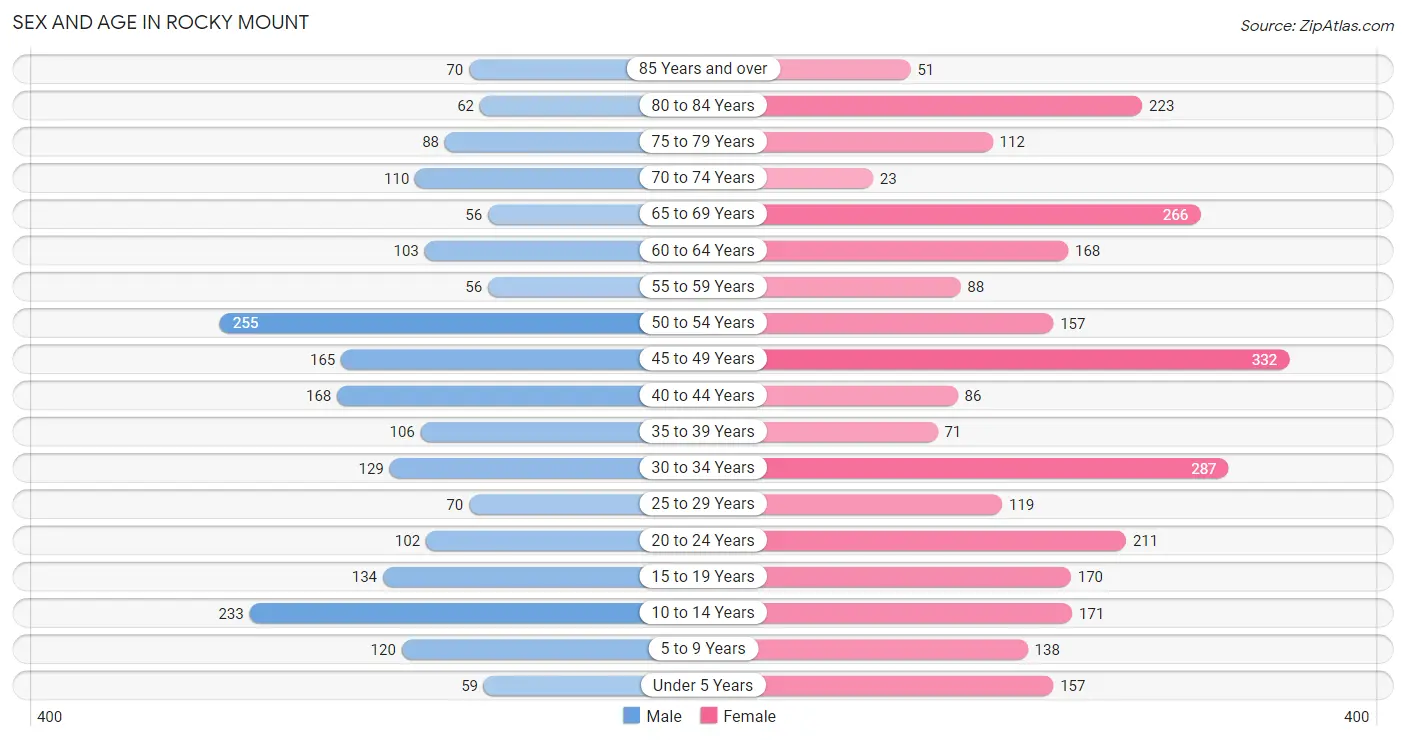
Sex and Age in Rocky Mount
Sex and Age in Rocky Mount
The most populous age groups in Rocky Mount are 50 to 54 Years (255 | 12.2%) for men and 45 to 49 Years (332 | 11.7%) for women.
| Age Bracket | Male | Female |
| Under 5 Years | 59 (2.8%) | 157 (5.6%) |
| 5 to 9 Years | 120 (5.8%) | 138 (4.9%) |
| 10 to 14 Years | 233 (11.2%) | 171 (6.0%) |
| 15 to 19 Years | 134 (6.4%) | 170 (6.0%) |
| 20 to 24 Years | 102 (4.9%) | 211 (7.5%) |
| 25 to 29 Years | 70 (3.4%) | 119 (4.2%) |
| 30 to 34 Years | 129 (6.2%) | 287 (10.1%) |
| 35 to 39 Years | 106 (5.1%) | 71 (2.5%) |
| 40 to 44 Years | 168 (8.1%) | 86 (3.0%) |
| 45 to 49 Years | 165 (7.9%) | 332 (11.7%) |
| 50 to 54 Years | 255 (12.2%) | 157 (5.6%) |
| 55 to 59 Years | 56 (2.7%) | 88 (3.1%) |
| 60 to 64 Years | 103 (4.9%) | 168 (5.9%) |
| 65 to 69 Years | 56 (2.7%) | 266 (9.4%) |
| 70 to 74 Years | 110 (5.3%) | 23 (0.8%) |
| 75 to 79 Years | 88 (4.2%) | 112 (4.0%) |
| 80 to 84 Years | 62 (3.0%) | 223 (7.9%) |
| 85 Years and over | 70 (3.4%) | 51 (1.8%) |
| Total | 2,086 (100.0%) | 2,830 (100.0%) |
Families and Households in Rocky Mount
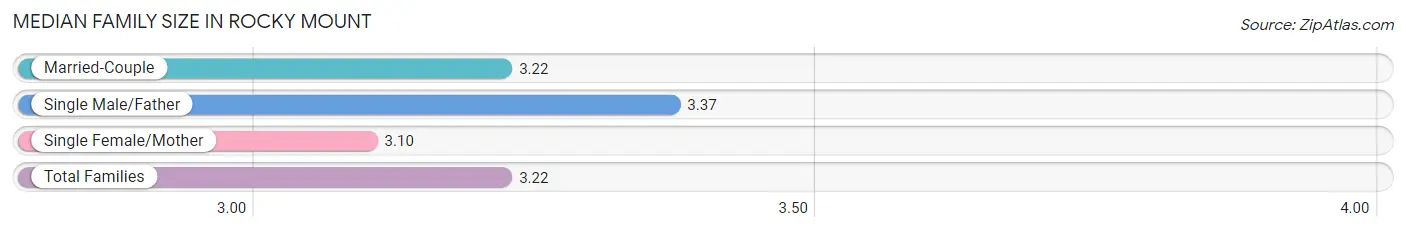
Median Family Size in Rocky Mount
The median family size in Rocky Mount is 3.22 persons per family, with single male/father families (142 | 12.2%) accounting for the largest median family size of 3.37 persons per family. On the other hand, single female/mother families (218 | 18.7%) represent the smallest median family size with 3.10 persons per family.
| Family Type | # Families | Family Size |
| Married-Couple | 808 (69.2%) | 3.22 |
| Single Male/Father | 142 (12.2%) | 3.37 |
| Single Female/Mother | 218 (18.7%) | 3.10 |
| Total Families | 1,168 (100.0%) | 3.22 |
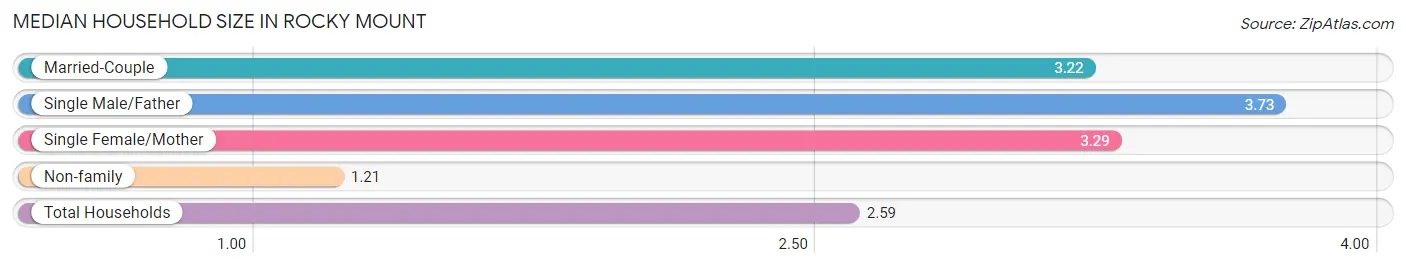
Median Household Size in Rocky Mount
The median household size in Rocky Mount is 2.59 persons per household, with single male/father households (142 | 8.1%) accounting for the largest median household size of 3.73 persons per household. non-family households (590 | 33.6%) represent the smallest median household size with 1.21 persons per household.
| Household Type | # Households | Household Size |
| Married-Couple | 808 (46.0%) | 3.22 |
| Single Male/Father | 142 (8.1%) | 3.73 |
| Single Female/Mother | 218 (12.4%) | 3.29 |
| Non-family | 590 (33.6%) | 1.21 |
| Total Households | 1,758 (100.0%) | 2.59 |
Household Size by Marriage Status in Rocky Mount
Out of a total of 1,758 households in Rocky Mount, 1,168 (66.4%) are family households, while 590 (33.6%) are nonfamily households. The most numerous type of family households are 2-person households, comprising 504, and the most common type of nonfamily households are 1-person households, comprising 488.
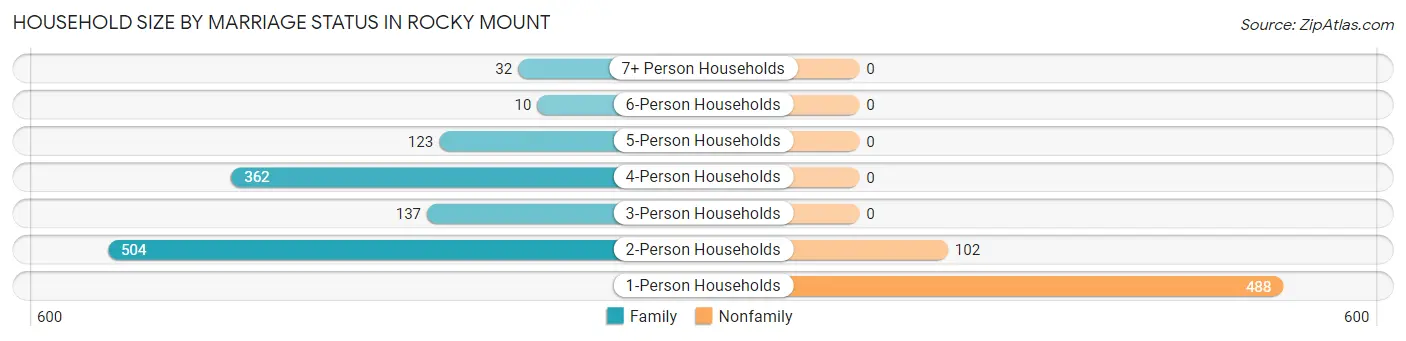
| Household Size | Family Households | Nonfamily Households |
| 1-Person Households | - | 488 (27.8%) |
| 2-Person Households | 504 (28.7%) | 102 (5.8%) |
| 3-Person Households | 137 (7.8%) | 0 (0.0%) |
| 4-Person Households | 362 (20.6%) | 0 (0.0%) |
| 5-Person Households | 123 (7.0%) | 0 (0.0%) |
| 6-Person Households | 10 (0.6%) | 0 (0.0%) |
| 7+ Person Households | 32 (1.8%) | 0 (0.0%) |
| Total | 1,168 (66.4%) | 590 (33.6%) |
Female Fertility in Rocky Mount
Fertility by Age in Rocky Mount
Average fertility rate in Rocky Mount is 77.0 births per 1,000 women. Women in the age bracket of 20 to 34 years have the highest fertility rate with 164.0 births per 1,000 women. Women in the age bracket of 20 to 34 years acount for 100.0% of all women with births.
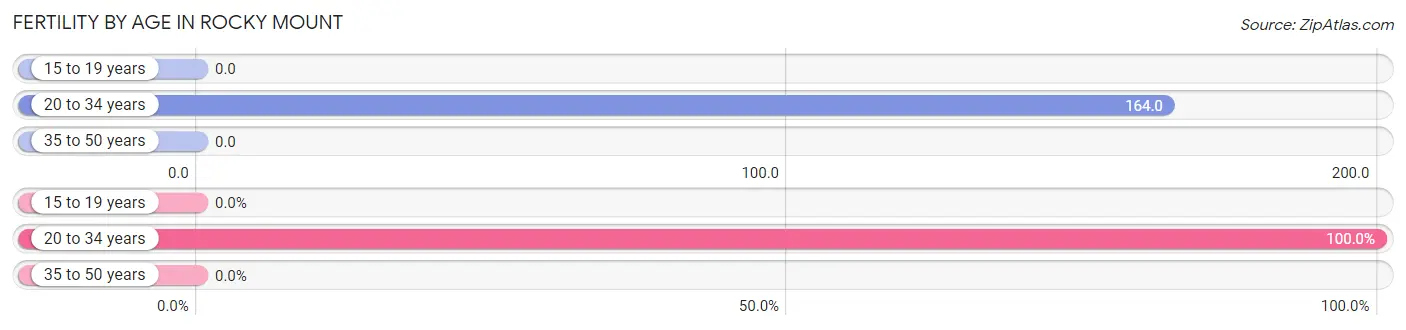
| Age Bracket | Women with Births | Births / 1,000 Women |
| 15 to 19 years | 0 (0.0%) | 0.0 |
| 20 to 34 years | 101 (100.0%) | 164.0 |
| 35 to 50 years | 0 (0.0%) | 0.0 |
| Total | 101 (100.0%) | 77.0 |
Fertility by Age by Marriage Status in Rocky Mount
42.6% of women with births (101) in Rocky Mount are married. The highest percentage of unmarried women with births falls into 20 to 34 years age bracket with 57.4% of them unmarried at the time of birth, while the lowest percentage of unmarried women with births belong to 20 to 34 years age bracket with 57.4% of them unmarried.
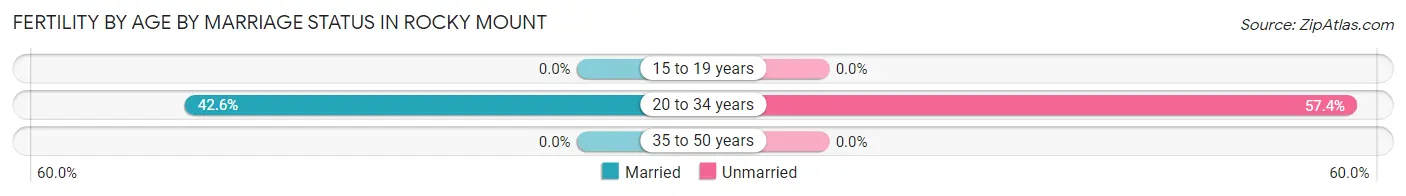
| Age Bracket | Married | Unmarried |
| 15 to 19 years | 0 (0.0%) | 0 (0.0%) |
| 20 to 34 years | 43 (42.6%) | 58 (57.4%) |
| 35 to 50 years | 0 (0.0%) | 0 (0.0%) |
| Total | 43 (42.6%) | 58 (57.4%) |
Fertility by Education in Rocky Mount
Average fertility rate in Rocky Mount is 77.0 births per 1,000 women. Women with the education attainment of graduate degree have the highest fertility rate of 213.0 births per 1,000 women, while women with the education attainment of college or associate's degree have the lowest fertility at 39.0 births per 1,000 women. Women with the education attainment of less than high school represent 42.6% of all women with births.
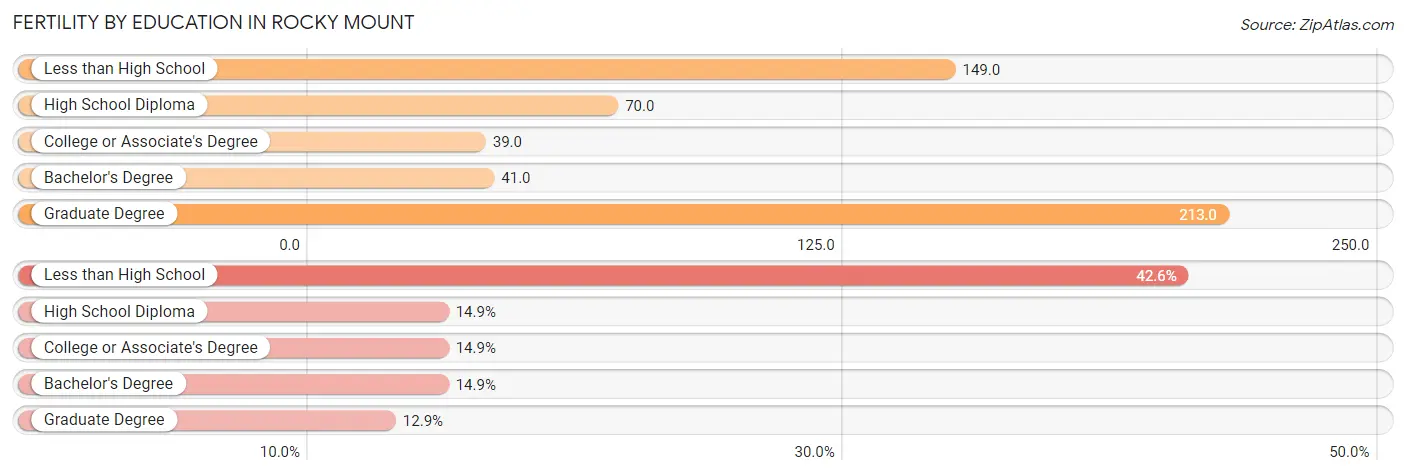
| Educational Attainment | Women with Births | Births / 1,000 Women |
| Less than High School | 43 (42.6%) | 149.0 |
| High School Diploma | 15 (14.8%) | 70.0 |
| College or Associate's Degree | 15 (14.8%) | 39.0 |
| Bachelor's Degree | 15 (14.8%) | 41.0 |
| Graduate Degree | 13 (12.9%) | 213.0 |
| Total | 101 (100.0%) | 77.0 |
Fertility by Education by Marriage Status in Rocky Mount
57.4% of women with births in Rocky Mount are unmarried. Women with the educational attainment of college or associate's degree are most likely to be married with 100.0% of them married at childbirth, while women with the educational attainment of less than high school are least likely to be married with 100.0% of them unmarried at childbirth.
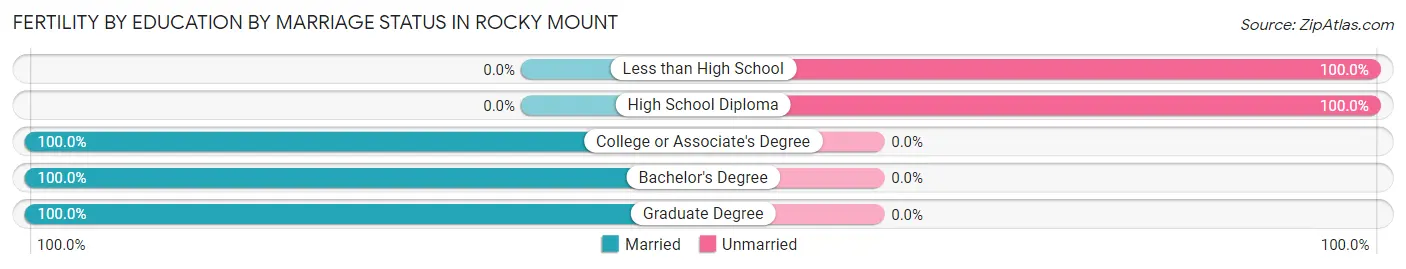
| Educational Attainment | Married | Unmarried |
| Less than High School | 0 (0.0%) | 43 (100.0%) |
| High School Diploma | 0 (0.0%) | 15 (100.0%) |
| College or Associate's Degree | 15 (100.0%) | 0 (0.0%) |
| Bachelor's Degree | 15 (100.0%) | 0 (0.0%) |
| Graduate Degree | 13 (100.0%) | 0 (0.0%) |
| Total | 43 (42.6%) | 58 (57.4%) |
Employment Characteristics in Rocky Mount
Employment by Class of Employer in Rocky Mount
Among the 2,027 employed individuals in Rocky Mount, private company employees (1,167 | 57.6%), not-for-profit organizations (269 | 13.3%), and state government employees (200 | 9.9%) make up the most common classes of employment.
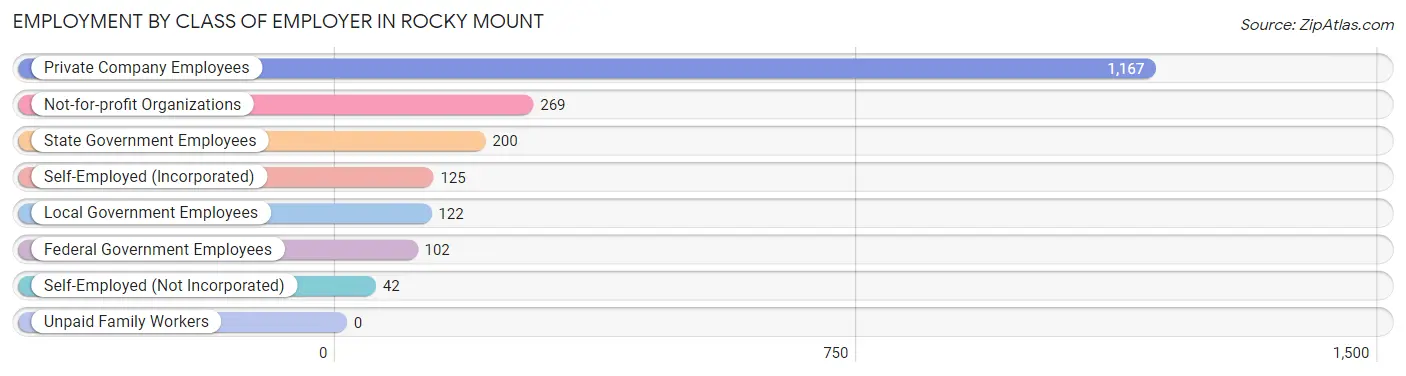
| Employer Class | # Employees | % Employees |
| Private Company Employees | 1,167 | 57.6% |
| Self-Employed (Incorporated) | 125 | 6.2% |
| Self-Employed (Not Incorporated) | 42 | 2.1% |
| Not-for-profit Organizations | 269 | 13.3% |
| Local Government Employees | 122 | 6.0% |
| State Government Employees | 200 | 9.9% |
| Federal Government Employees | 102 | 5.0% |
| Unpaid Family Workers | 0 | 0.0% |
| Total | 2,027 | 100.0% |
Employment Status by Age in Rocky Mount
According to the labor force statistics for Rocky Mount, out of the total population over 16 years of age (3,970), 54.1% or 2,148 individuals are in the labor force, with 4.9% or 105 of them unemployed. The age group with the highest labor force participation rate is 25 to 29 years, with 88.9% or 168 individuals in the labor force. Within the labor force, the 30 to 34 years age range has the highest percentage of unemployed individuals, with 16.1% or 56 of them being unemployed.
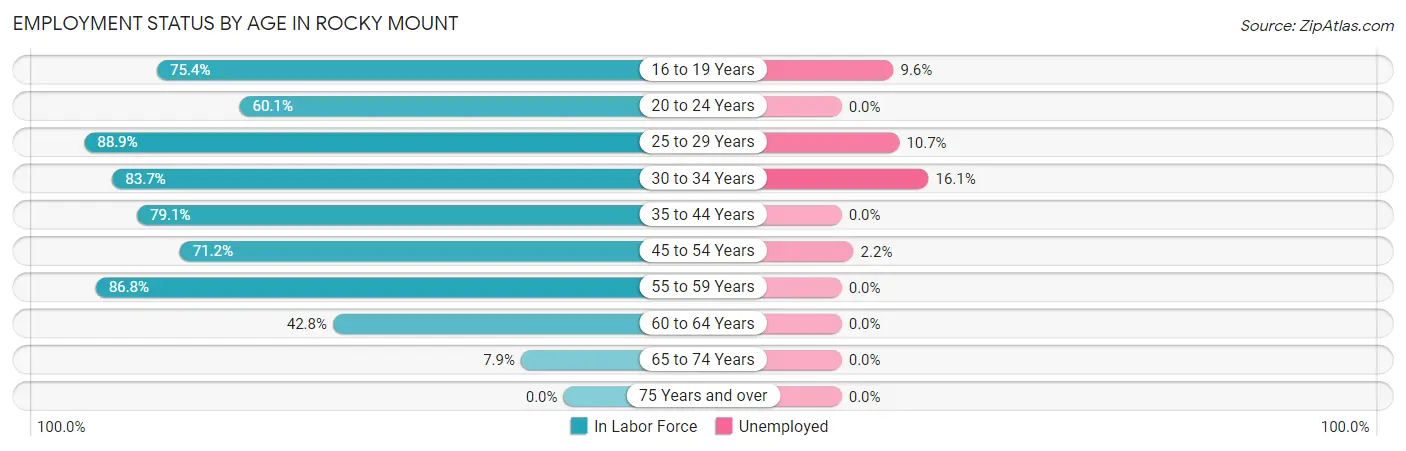
| Age Bracket | In Labor Force | Unemployed |
| 16 to 19 Years | 178 (75.4%) | 17 (9.6%) |
| 20 to 24 Years | 188 (60.1%) | 0 (0.0%) |
| 25 to 29 Years | 168 (88.9%) | 18 (10.7%) |
| 30 to 34 Years | 348 (83.7%) | 56 (16.1%) |
| 35 to 44 Years | 341 (79.1%) | 0 (0.0%) |
| 45 to 54 Years | 647 (71.2%) | 14 (2.2%) |
| 55 to 59 Years | 125 (86.8%) | 0 (0.0%) |
| 60 to 64 Years | 116 (42.8%) | 0 (0.0%) |
| 65 to 74 Years | 36 (7.9%) | 0 (0.0%) |
| 75 Years and over | 0 (0.0%) | 0 (0.0%) |
| Total | 2,148 (54.1%) | 105 (4.9%) |
Employment Status by Educational Attainment in Rocky Mount
According to labor force statistics for Rocky Mount, 73.9% of individuals (1,744) out of the total population between 25 and 64 years of age (2,360) are in the labor force, with 5.0% or 87 of them being unemployed. The group with the highest labor force participation rate are those with the educational attainment of bachelor's degree or higher, with 93.8% or 621 individuals in the labor force. Within the labor force, individuals with less than high school education have the highest percentage of unemployment, with 37.4% or 43 of them being unemployed.
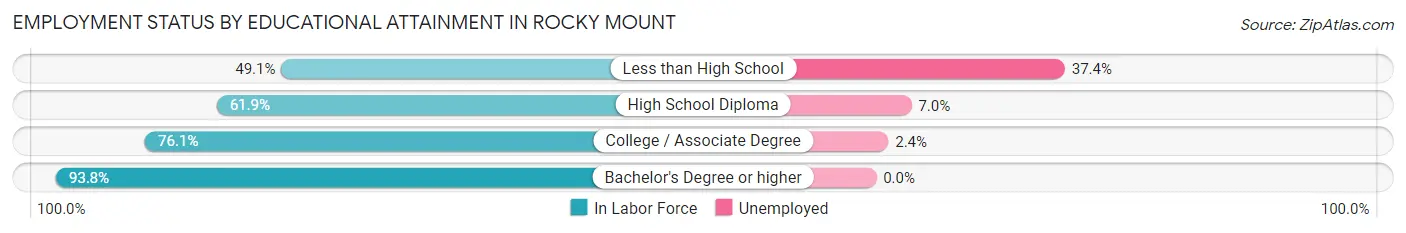
| Educational Attainment | In Labor Force | Unemployed |
| Less than High School | 115 (49.1%) | 88 (37.4%) |
| High School Diploma | 456 (61.9%) | 52 (7.0%) |
| College / Associate Degree | 553 (76.1%) | 17 (2.4%) |
| Bachelor's Degree or higher | 621 (93.8%) | 0 (0.0%) |
| Total | 1,744 (73.9%) | 118 (5.0%) |
Employment Occupations by Sex in Rocky Mount
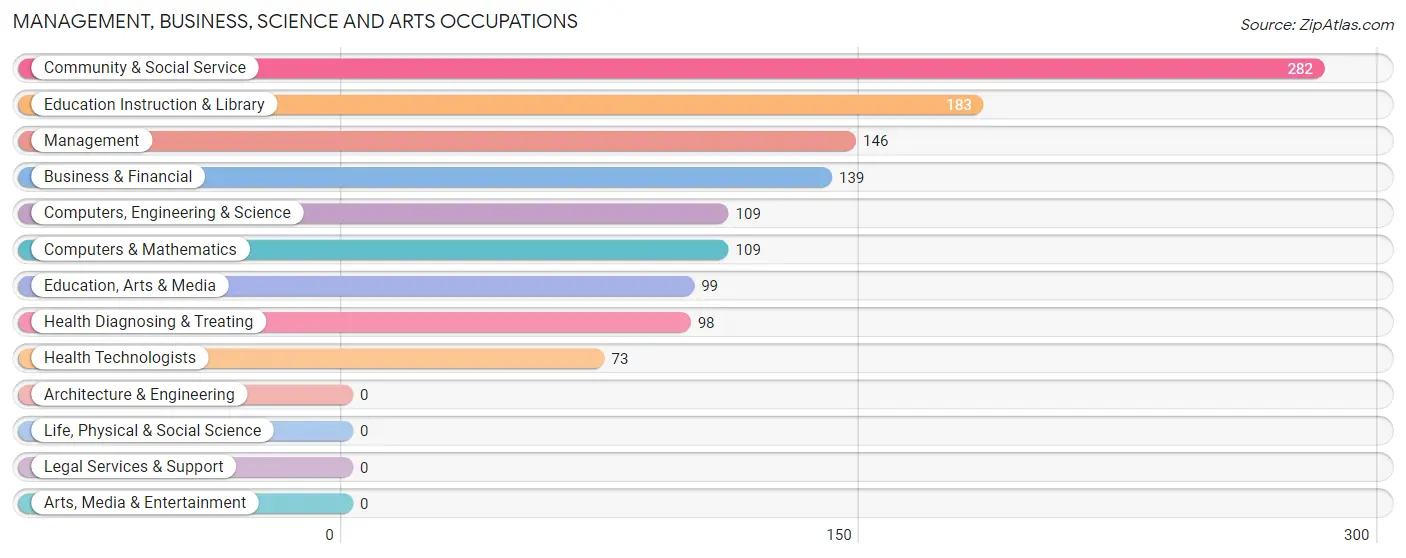
Management, Business, Science and Arts Occupations
The most common Management, Business, Science and Arts occupations in Rocky Mount are Community & Social Service (282 | 13.9%), Education Instruction & Library (183 | 9.0%), Management (146 | 7.2%), Business & Financial (139 | 6.9%), and Computers, Engineering & Science (109 | 5.4%).
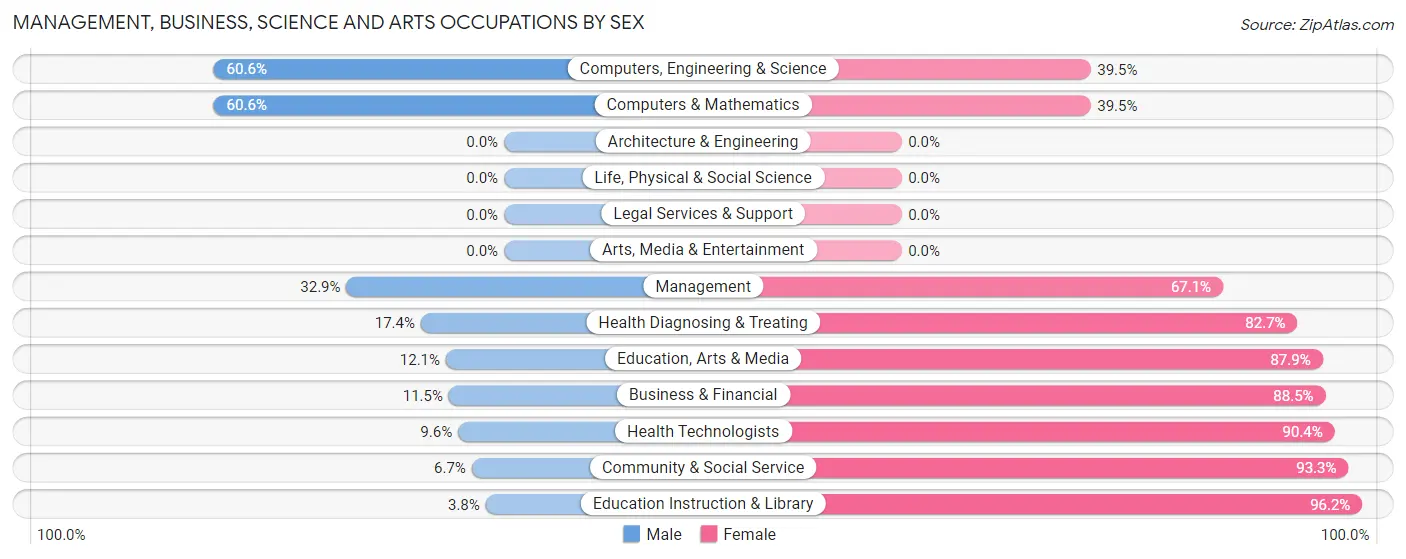
Management, Business, Science and Arts Occupations by Sex
Within the Management, Business, Science and Arts occupations in Rocky Mount, the most male-oriented occupations are Computers, Engineering & Science (60.6%), Computers & Mathematics (60.6%), and Management (32.9%), while the most female-oriented occupations are Education Instruction & Library (96.2%), Community & Social Service (93.3%), and Health Technologists (90.4%).
| Occupation | Male | Female |
| Management | 48 (32.9%) | 98 (67.1%) |
| Business & Financial | 16 (11.5%) | 123 (88.5%) |
| Computers, Engineering & Science | 66 (60.6%) | 43 (39.5%) |
| Computers & Mathematics | 66 (60.6%) | 43 (39.5%) |
| Architecture & Engineering | 0 (0.0%) | 0 (0.0%) |
| Life, Physical & Social Science | 0 (0.0%) | 0 (0.0%) |
| Community & Social Service | 19 (6.7%) | 263 (93.3%) |
| Education, Arts & Media | 12 (12.1%) | 87 (87.9%) |
| Legal Services & Support | 0 (0.0%) | 0 (0.0%) |
| Education Instruction & Library | 7 (3.8%) | 176 (96.2%) |
| Arts, Media & Entertainment | 0 (0.0%) | 0 (0.0%) |
| Health Diagnosing & Treating | 17 (17.3%) | 81 (82.7%) |
| Health Technologists | 7 (9.6%) | 66 (90.4%) |
| Total (Category) | 166 (21.4%) | 608 (78.5%) |
| Total (Overall) | 895 (44.1%) | 1,133 (55.9%) |
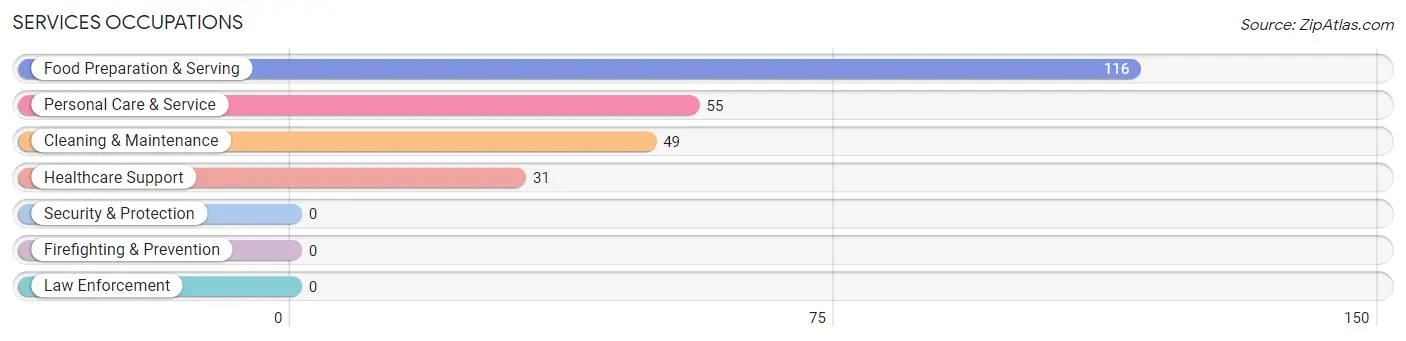
Services Occupations
The most common Services occupations in Rocky Mount are Food Preparation & Serving (116 | 5.7%), Personal Care & Service (55 | 2.7%), Cleaning & Maintenance (49 | 2.4%), and Healthcare Support (31 | 1.5%).
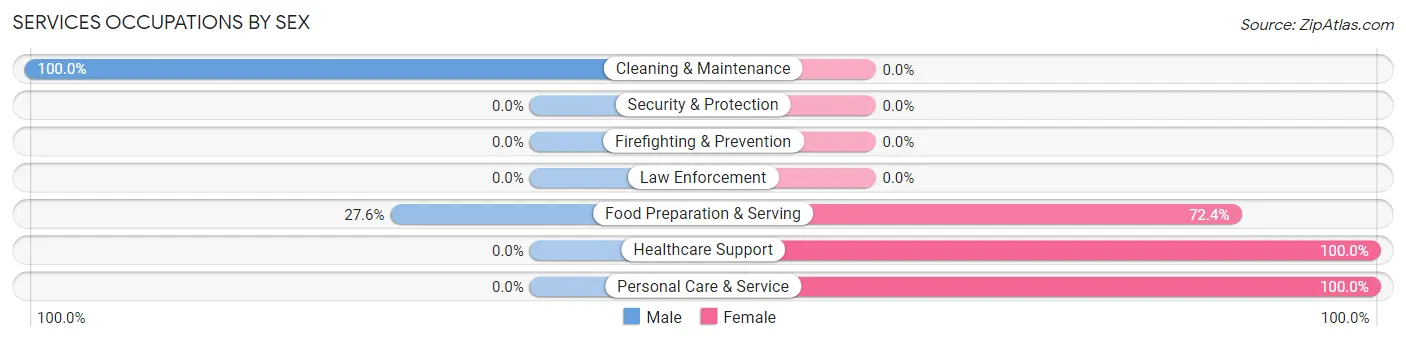
Services Occupations by Sex
Within the Services occupations in Rocky Mount, the most male-oriented occupations are Cleaning & Maintenance (100.0%), and Food Preparation & Serving (27.6%), while the most female-oriented occupations are Healthcare Support (100.0%), Personal Care & Service (100.0%), and Food Preparation & Serving (72.4%).
| Occupation | Male | Female |
| Healthcare Support | 0 (0.0%) | 31 (100.0%) |
| Security & Protection | 0 (0.0%) | 0 (0.0%) |
| Firefighting & Prevention | 0 (0.0%) | 0 (0.0%) |
| Law Enforcement | 0 (0.0%) | 0 (0.0%) |
| Food Preparation & Serving | 32 (27.6%) | 84 (72.4%) |
| Cleaning & Maintenance | 49 (100.0%) | 0 (0.0%) |
| Personal Care & Service | 0 (0.0%) | 55 (100.0%) |
| Total (Category) | 81 (32.3%) | 170 (67.7%) |
| Total (Overall) | 895 (44.1%) | 1,133 (55.9%) |
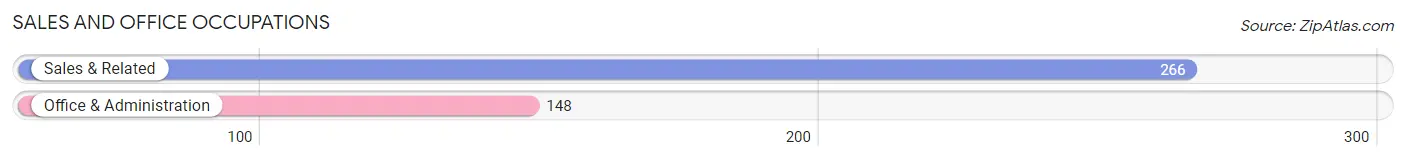
Sales and Office Occupations
The most common Sales and Office occupations in Rocky Mount are Sales & Related (266 | 13.1%), and Office & Administration (148 | 7.3%).
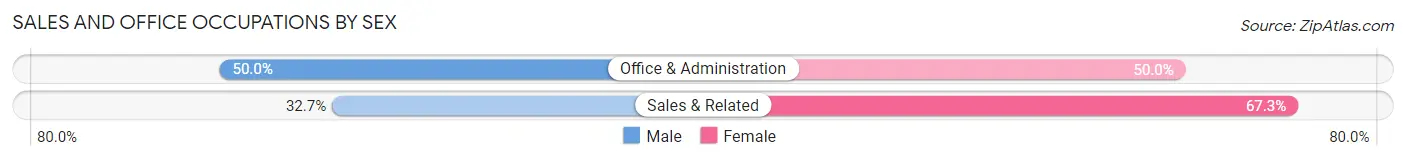
Sales and Office Occupations by Sex
| Occupation | Male | Female |
| Sales & Related | 87 (32.7%) | 179 (67.3%) |
| Office & Administration | 74 (50.0%) | 74 (50.0%) |
| Total (Category) | 161 (38.9%) | 253 (61.1%) |
| Total (Overall) | 895 (44.1%) | 1,133 (55.9%) |
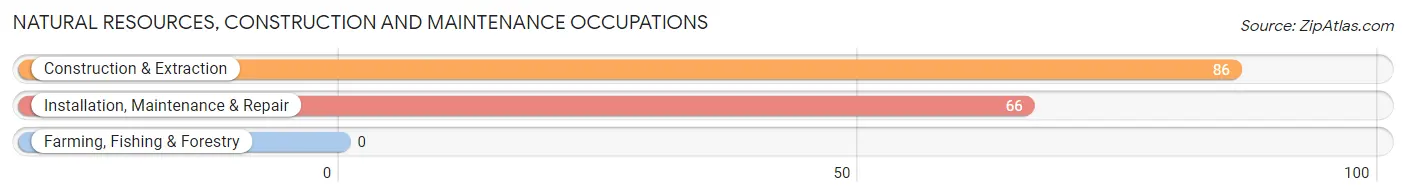
Natural Resources, Construction and Maintenance Occupations
The most common Natural Resources, Construction and Maintenance occupations in Rocky Mount are Construction & Extraction (86 | 4.2%), and Installation, Maintenance & Repair (66 | 3.3%).
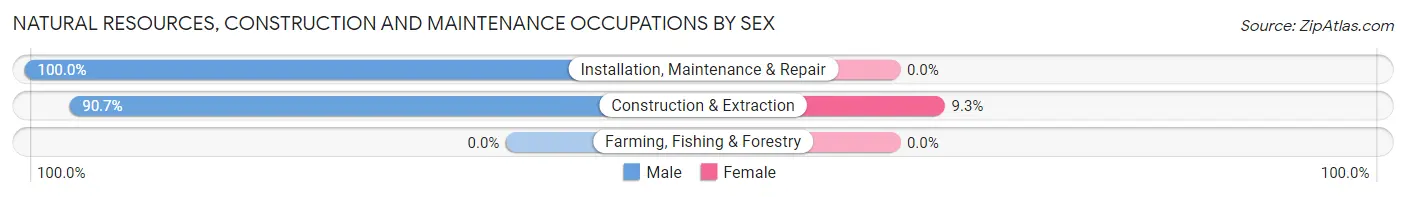
Natural Resources, Construction and Maintenance Occupations by Sex
| Occupation | Male | Female |
| Farming, Fishing & Forestry | 0 (0.0%) | 0 (0.0%) |
| Construction & Extraction | 78 (90.7%) | 8 (9.3%) |
| Installation, Maintenance & Repair | 66 (100.0%) | 0 (0.0%) |
| Total (Category) | 144 (94.7%) | 8 (5.3%) |
| Total (Overall) | 895 (44.1%) | 1,133 (55.9%) |
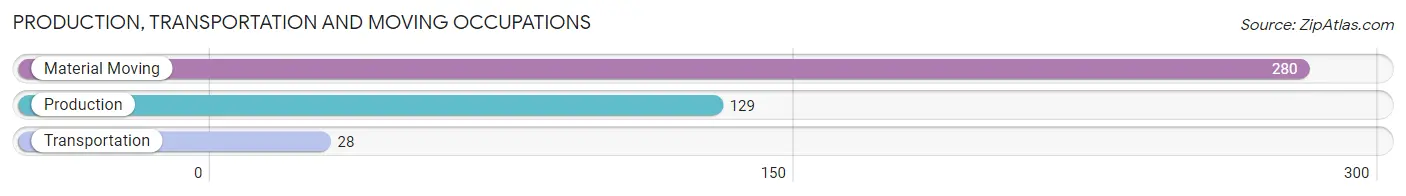
Production, Transportation and Moving Occupations
The most common Production, Transportation and Moving occupations in Rocky Mount are Material Moving (280 | 13.8%), Production (129 | 6.4%), and Transportation (28 | 1.4%).
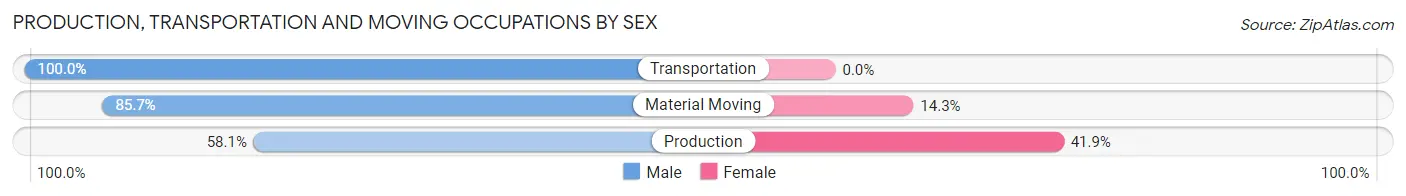
Production, Transportation and Moving Occupations by Sex
| Occupation | Male | Female |
| Production | 75 (58.1%) | 54 (41.9%) |
| Transportation | 28 (100.0%) | 0 (0.0%) |
| Material Moving | 240 (85.7%) | 40 (14.3%) |
| Total (Category) | 343 (78.5%) | 94 (21.5%) |
| Total (Overall) | 895 (44.1%) | 1,133 (55.9%) |
Employment Industries by Sex in Rocky Mount
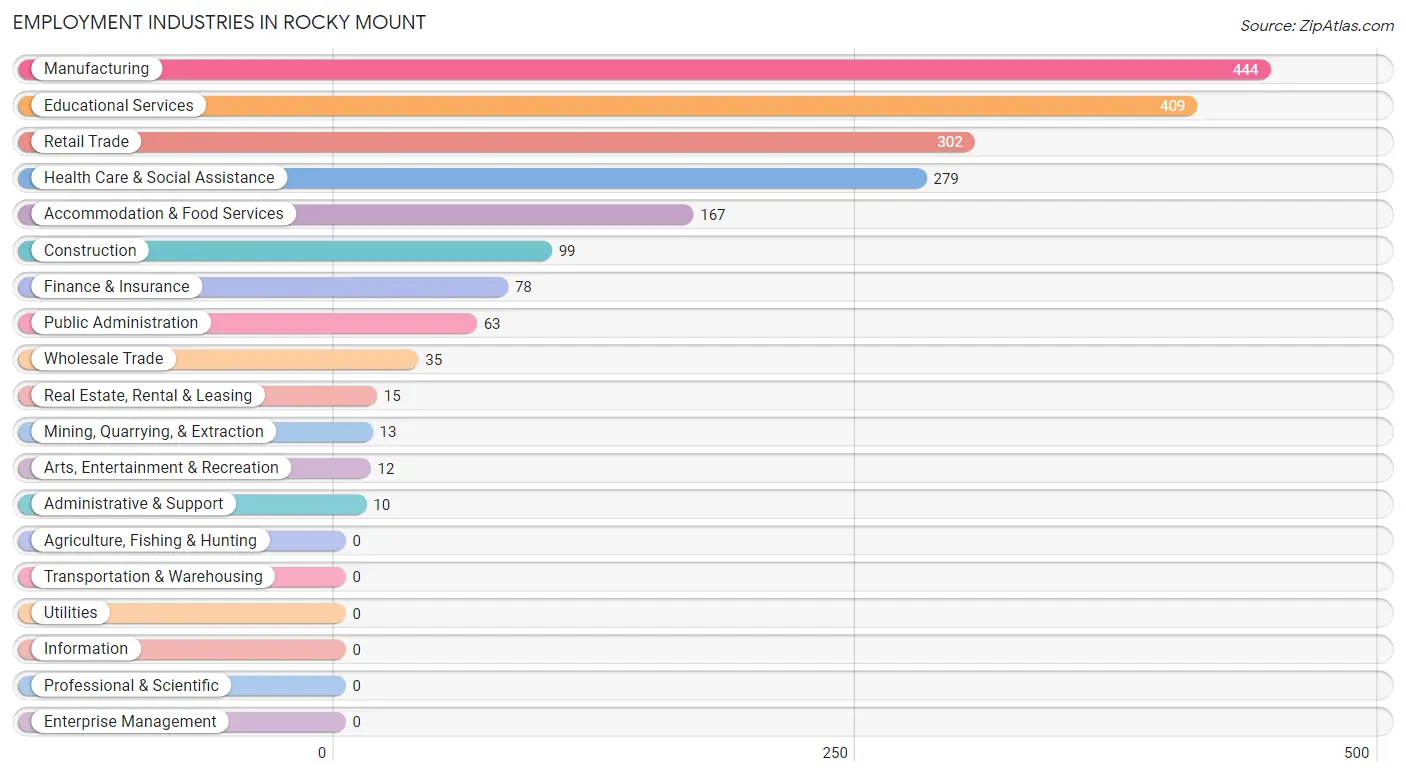
Employment Industries in Rocky Mount
The major employment industries in Rocky Mount include Manufacturing (444 | 21.9%), Educational Services (409 | 20.2%), Retail Trade (302 | 14.9%), Health Care & Social Assistance (279 | 13.8%), and Accommodation & Food Services (167 | 8.2%).
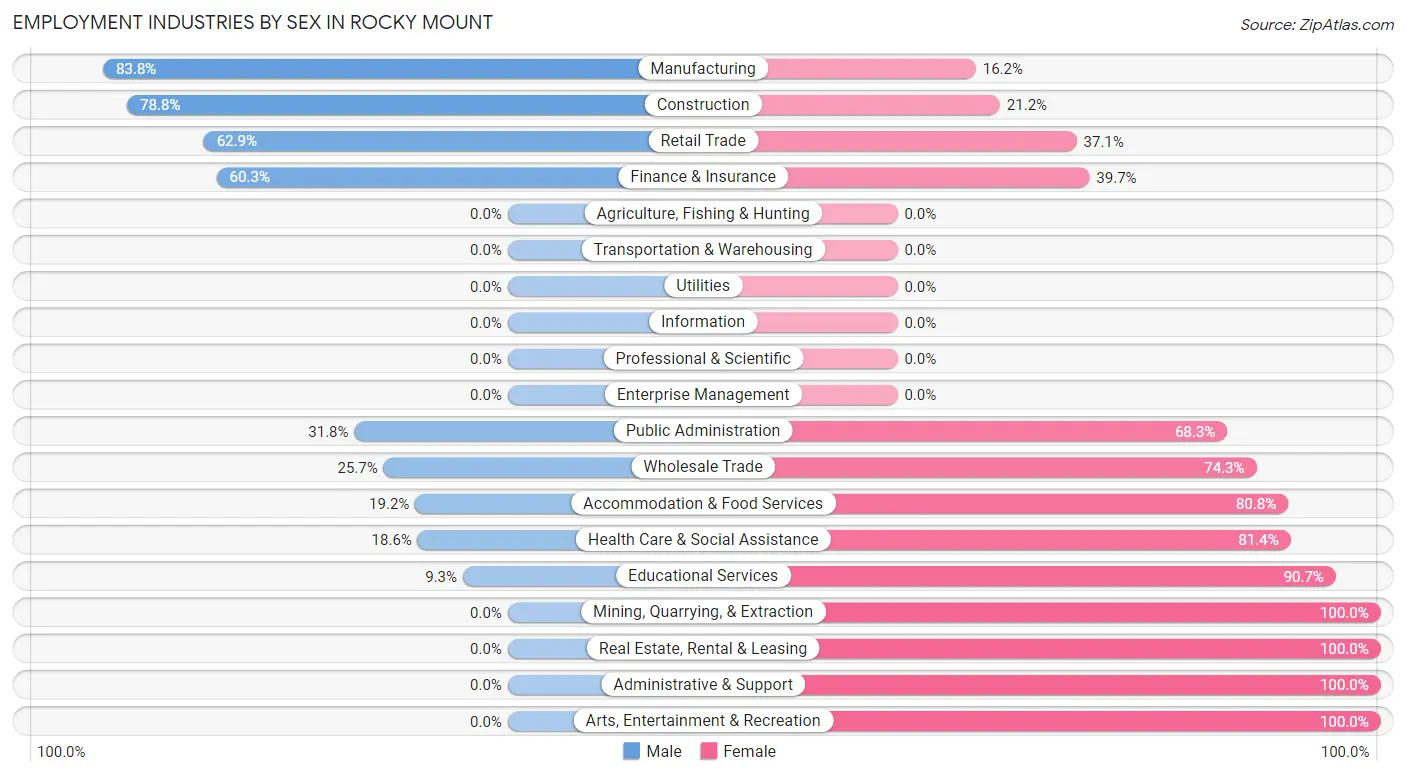
Employment Industries by Sex in Rocky Mount
The Rocky Mount industries that see more men than women are Manufacturing (83.8%), Construction (78.8%), and Retail Trade (62.9%), whereas the industries that tend to have a higher number of women are Mining, Quarrying, & Extraction (100.0%), Real Estate, Rental & Leasing (100.0%), and Administrative & Support (100.0%).
| Industry | Male | Female |
| Agriculture, Fishing & Hunting | 0 (0.0%) | 0 (0.0%) |
| Mining, Quarrying, & Extraction | 0 (0.0%) | 13 (100.0%) |
| Construction | 78 (78.8%) | 21 (21.2%) |
| Manufacturing | 372 (83.8%) | 72 (16.2%) |
| Wholesale Trade | 9 (25.7%) | 26 (74.3%) |
| Retail Trade | 190 (62.9%) | 112 (37.1%) |
| Transportation & Warehousing | 0 (0.0%) | 0 (0.0%) |
| Utilities | 0 (0.0%) | 0 (0.0%) |
| Information | 0 (0.0%) | 0 (0.0%) |
| Finance & Insurance | 47 (60.3%) | 31 (39.7%) |
| Real Estate, Rental & Leasing | 0 (0.0%) | 15 (100.0%) |
| Professional & Scientific | 0 (0.0%) | 0 (0.0%) |
| Enterprise Management | 0 (0.0%) | 0 (0.0%) |
| Administrative & Support | 0 (0.0%) | 10 (100.0%) |
| Educational Services | 38 (9.3%) | 371 (90.7%) |
| Health Care & Social Assistance | 52 (18.6%) | 227 (81.4%) |
| Arts, Entertainment & Recreation | 0 (0.0%) | 12 (100.0%) |
| Accommodation & Food Services | 32 (19.2%) | 135 (80.8%) |
| Public Administration | 20 (31.8%) | 43 (68.2%) |
| Total | 895 (44.1%) | 1,133 (55.9%) |
Education in Rocky Mount
School Enrollment in Rocky Mount
The most common levels of schooling among the 1,318 students in Rocky Mount are high school (450 | 34.1%), middle school (307 | 23.3%), and elementary school (189 | 14.3%).
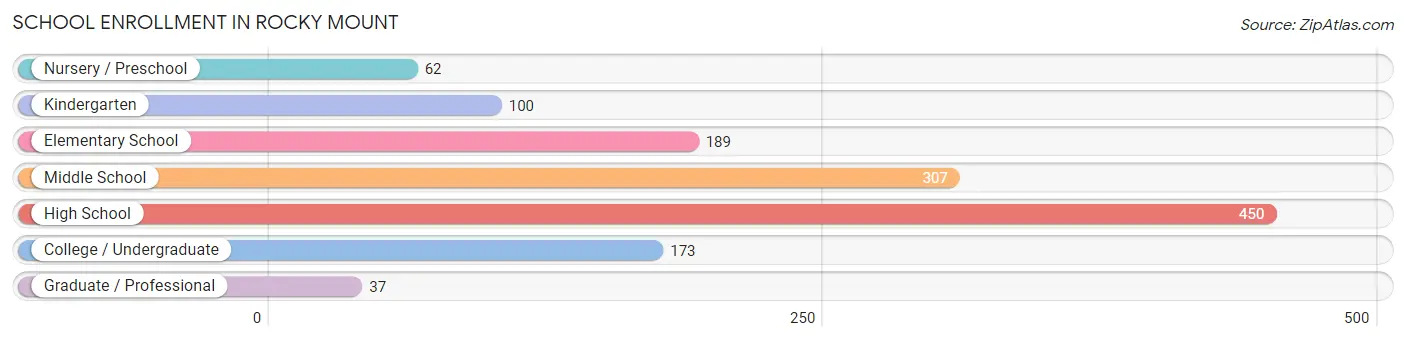
| School Level | # Students | % Students |
| Nursery / Preschool | 62 | 4.7% |
| Kindergarten | 100 | 7.6% |
| Elementary School | 189 | 14.3% |
| Middle School | 307 | 23.3% |
| High School | 450 | 34.1% |
| College / Undergraduate | 173 | 13.1% |
| Graduate / Professional | 37 | 2.8% |
| Total | 1,318 | 100.0% |
School Enrollment by Age by Funding Source in Rocky Mount
Out of a total of 1,318 students who are enrolled in schools in Rocky Mount, 136 (10.3%) attend a private institution, while the remaining 1,182 (89.7%) are enrolled in public schools. The age group of 18 to 19 year olds has the highest likelihood of being enrolled in private schools, with 20 (37.7% in the age bracket) enrolled. Conversely, the age group of 3 to 4 year olds has the lowest likelihood of being enrolled in a private school, with 29 (100.0% in the age bracket) attending a public institution.
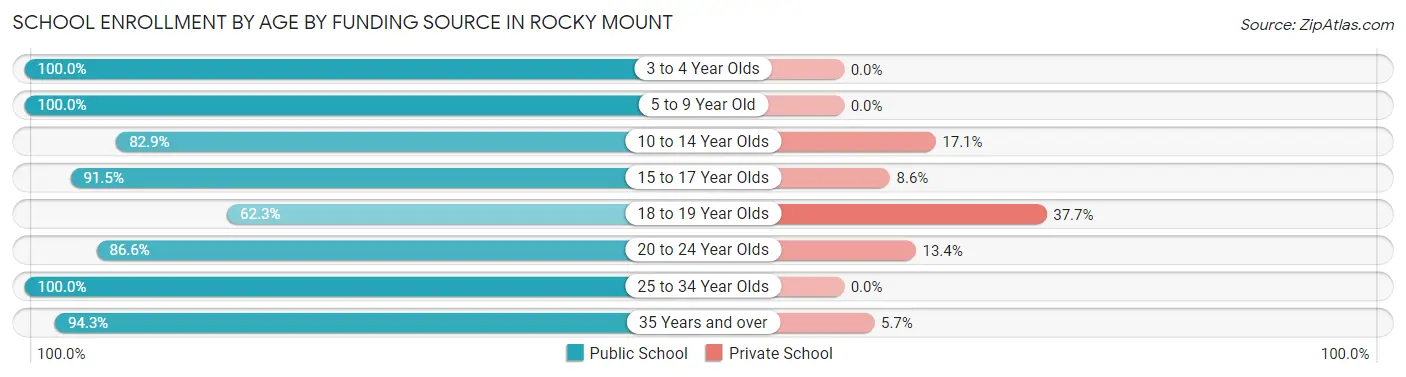
| Age Bracket | Public School | Private School |
| 3 to 4 Year Olds | 29 (100.0%) | 0 (0.0%) |
| 5 to 9 Year Old | 235 (100.0%) | 0 (0.0%) |
| 10 to 14 Year Olds | 335 (82.9%) | 69 (17.1%) |
| 15 to 17 Year Olds | 214 (91.4%) | 20 (8.6%) |
| 18 to 19 Year Olds | 33 (62.3%) | 20 (37.7%) |
| 20 to 24 Year Olds | 97 (86.6%) | 15 (13.4%) |
| 25 to 34 Year Olds | 39 (100.0%) | 0 (0.0%) |
| 35 Years and over | 200 (94.3%) | 12 (5.7%) |
| Total | 1,182 (89.7%) | 136 (10.3%) |
Educational Attainment by Field of Study in Rocky Mount
Education (315 | 35.4%), business (206 | 23.2%), science & technology (110 | 12.4%), social sciences (78 | 8.8%), and arts & humanities (74 | 8.3%) are the most common fields of study among 890 individuals in Rocky Mount who have obtained a bachelor's degree or higher.
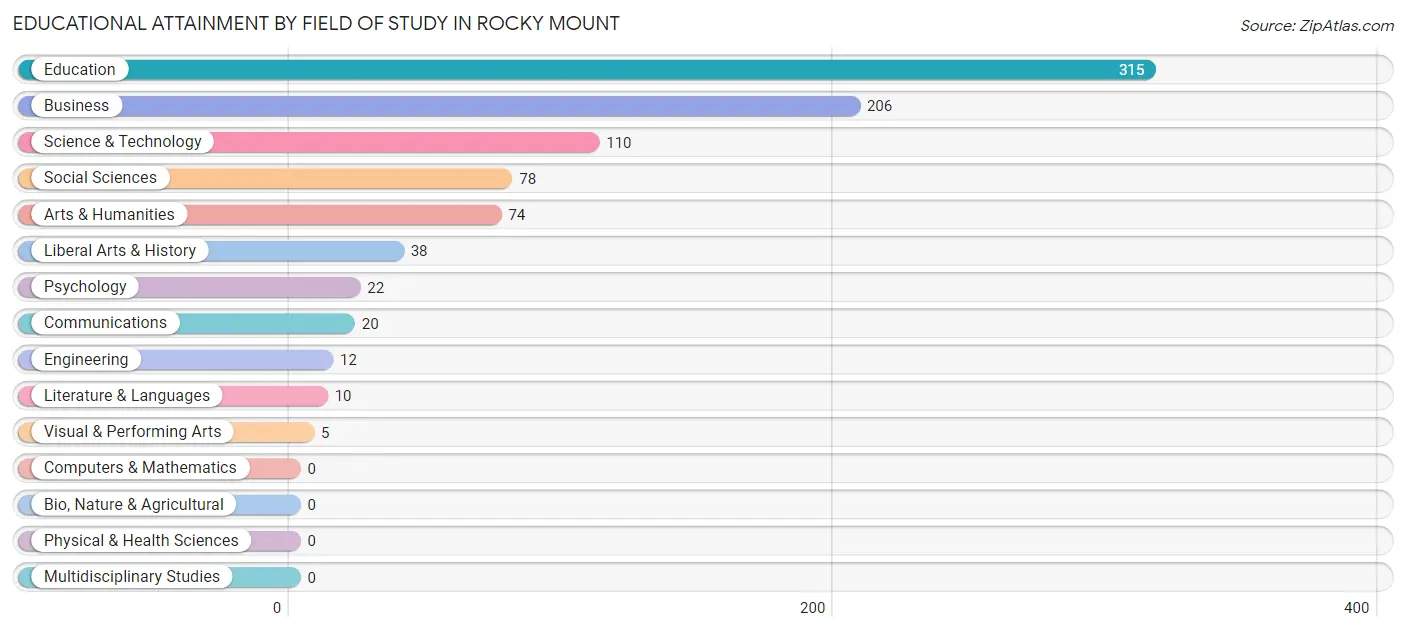
| Field of Study | # Graduates | % Graduates |
| Computers & Mathematics | 0 | 0.0% |
| Bio, Nature & Agricultural | 0 | 0.0% |
| Physical & Health Sciences | 0 | 0.0% |
| Psychology | 22 | 2.5% |
| Social Sciences | 78 | 8.8% |
| Engineering | 12 | 1.3% |
| Multidisciplinary Studies | 0 | 0.0% |
| Science & Technology | 110 | 12.4% |
| Business | 206 | 23.2% |
| Education | 315 | 35.4% |
| Literature & Languages | 10 | 1.1% |
| Liberal Arts & History | 38 | 4.3% |
| Visual & Performing Arts | 5 | 0.6% |
| Communications | 20 | 2.2% |
| Arts & Humanities | 74 | 8.3% |
| Total | 890 | 100.0% |
Transportation & Commute in Rocky Mount
Vehicle Availability by Sex in Rocky Mount
The most prevalent vehicle ownership categories in Rocky Mount are males with 2 vehicles (332, accounting for 36.5%) and females with 2 vehicles (299, making up 29.7%).
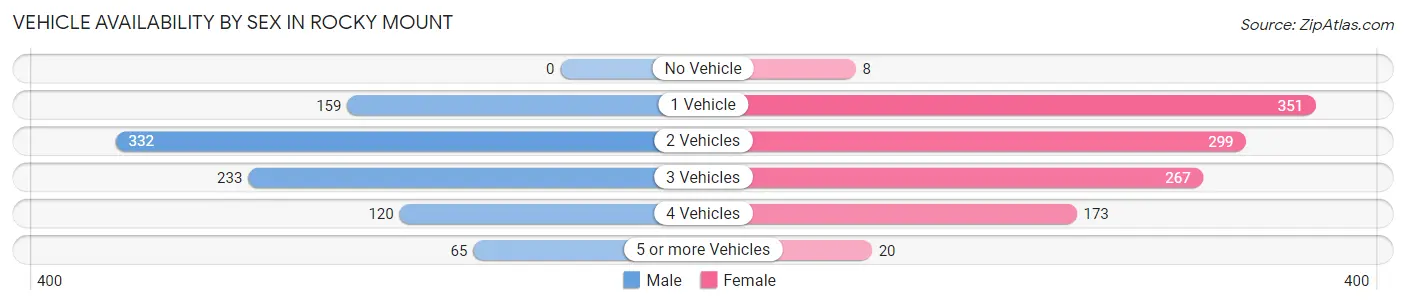
| Vehicles Available | Male | Female |
| No Vehicle | 0 (0.0%) | 8 (0.7%) |
| 1 Vehicle | 159 (17.5%) | 351 (31.4%) |
| 2 Vehicles | 332 (36.5%) | 299 (26.7%) |
| 3 Vehicles | 233 (25.6%) | 267 (23.9%) |
| 4 Vehicles | 120 (13.2%) | 173 (15.5%) |
| 5 or more Vehicles | 65 (7.1%) | 20 (1.8%) |
| Total | 909 (100.0%) | 1,118 (100.0%) |
Commute Time in Rocky Mount
The most frequently occuring commute durations in Rocky Mount are 5 to 9 minutes (470 commuters, 25.2%), less than 5 minutes (254 commuters, 13.6%), and 30 to 34 minutes (218 commuters, 11.7%).
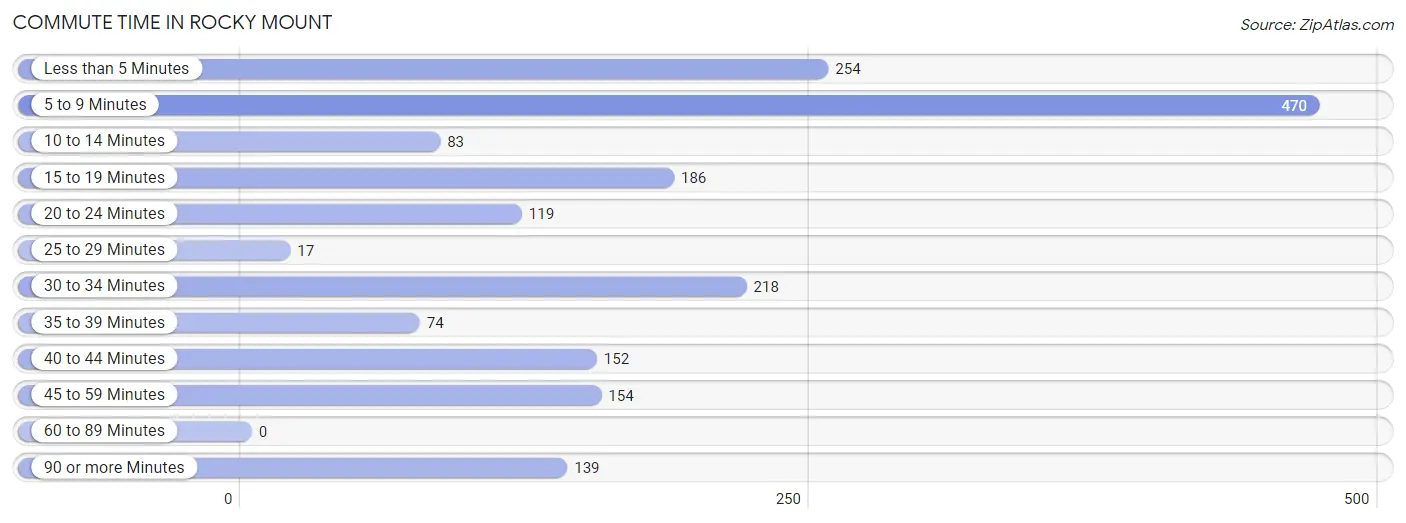
| Commute Time | # Commuters | % Commuters |
| Less than 5 Minutes | 254 | 13.6% |
| 5 to 9 Minutes | 470 | 25.2% |
| 10 to 14 Minutes | 83 | 4.4% |
| 15 to 19 Minutes | 186 | 10.0% |
| 20 to 24 Minutes | 119 | 6.4% |
| 25 to 29 Minutes | 17 | 0.9% |
| 30 to 34 Minutes | 218 | 11.7% |
| 35 to 39 Minutes | 74 | 4.0% |
| 40 to 44 Minutes | 152 | 8.2% |
| 45 to 59 Minutes | 154 | 8.3% |
| 60 to 89 Minutes | 0 | 0.0% |
| 90 or more Minutes | 139 | 7.4% |
Commute Time by Sex in Rocky Mount
The most common commute times in Rocky Mount are 5 to 9 minutes (195 commuters, 22.4%) for males and 5 to 9 minutes (275 commuters, 27.6%) for females.
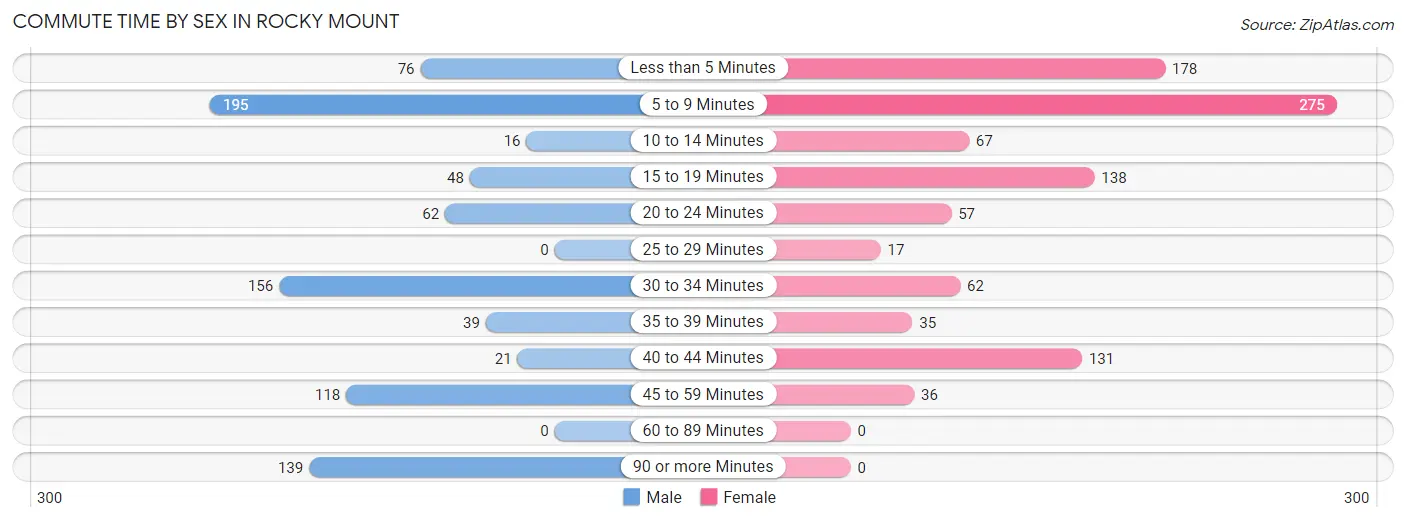
| Commute Time | Male | Female |
| Less than 5 Minutes | 76 (8.7%) | 178 (17.9%) |
| 5 to 9 Minutes | 195 (22.4%) | 275 (27.6%) |
| 10 to 14 Minutes | 16 (1.8%) | 67 (6.7%) |
| 15 to 19 Minutes | 48 (5.5%) | 138 (13.9%) |
| 20 to 24 Minutes | 62 (7.1%) | 57 (5.7%) |
| 25 to 29 Minutes | 0 (0.0%) | 17 (1.7%) |
| 30 to 34 Minutes | 156 (17.9%) | 62 (6.2%) |
| 35 to 39 Minutes | 39 (4.5%) | 35 (3.5%) |
| 40 to 44 Minutes | 21 (2.4%) | 131 (13.2%) |
| 45 to 59 Minutes | 118 (13.6%) | 36 (3.6%) |
| 60 to 89 Minutes | 0 (0.0%) | 0 (0.0%) |
| 90 or more Minutes | 139 (16.0%) | 0 (0.0%) |
Time of Departure to Work by Sex in Rocky Mount
The most frequent times of departure to work in Rocky Mount are 7:30 AM to 7:59 AM (185, 21.3%) for males and 7:30 AM to 7:59 AM (214, 21.5%) for females.
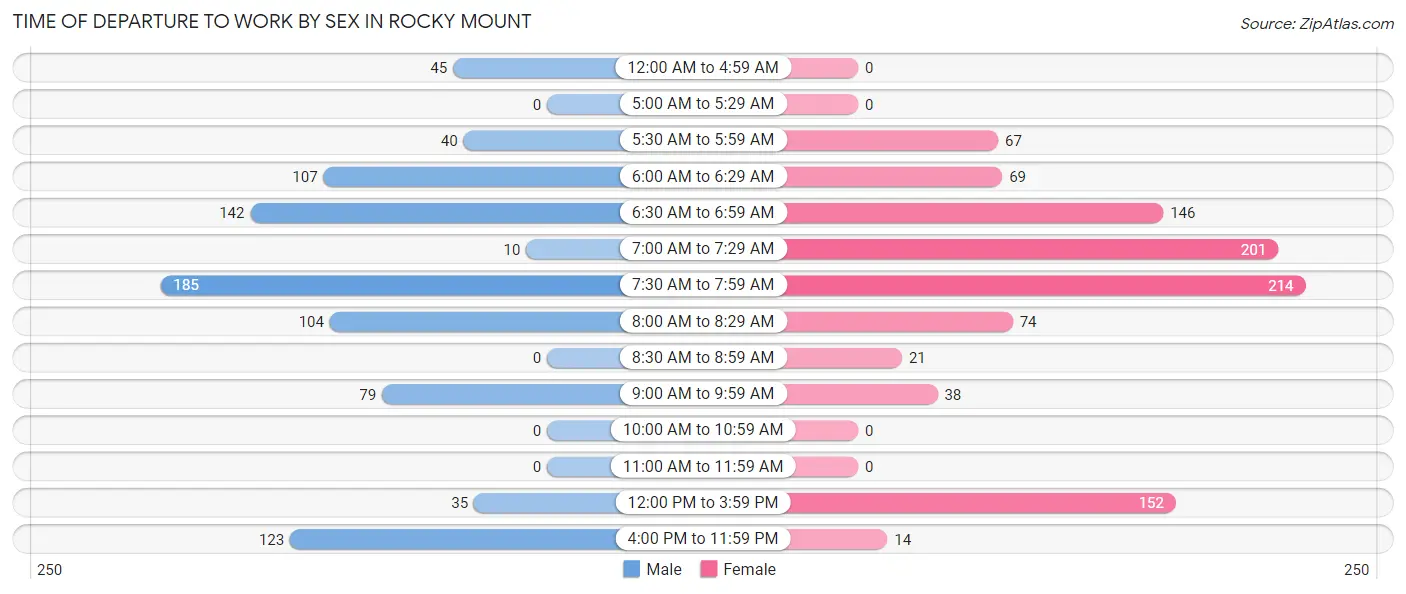
| Time of Departure | Male | Female |
| 12:00 AM to 4:59 AM | 45 (5.2%) | 0 (0.0%) |
| 5:00 AM to 5:29 AM | 0 (0.0%) | 0 (0.0%) |
| 5:30 AM to 5:59 AM | 40 (4.6%) | 67 (6.7%) |
| 6:00 AM to 6:29 AM | 107 (12.3%) | 69 (6.9%) |
| 6:30 AM to 6:59 AM | 142 (16.3%) | 146 (14.7%) |
| 7:00 AM to 7:29 AM | 10 (1.1%) | 201 (20.2%) |
| 7:30 AM to 7:59 AM | 185 (21.3%) | 214 (21.5%) |
| 8:00 AM to 8:29 AM | 104 (11.9%) | 74 (7.4%) |
| 8:30 AM to 8:59 AM | 0 (0.0%) | 21 (2.1%) |
| 9:00 AM to 9:59 AM | 79 (9.1%) | 38 (3.8%) |
| 10:00 AM to 10:59 AM | 0 (0.0%) | 0 (0.0%) |
| 11:00 AM to 11:59 AM | 0 (0.0%) | 0 (0.0%) |
| 12:00 PM to 3:59 PM | 35 (4.0%) | 152 (15.3%) |
| 4:00 PM to 11:59 PM | 123 (14.1%) | 14 (1.4%) |
| Total | 870 (100.0%) | 996 (100.0%) |
Housing Occupancy in Rocky Mount
Occupancy by Ownership in Rocky Mount
Of the total 1,758 dwellings in Rocky Mount, owner-occupied units account for 1,191 (67.7%), while renter-occupied units make up 567 (32.3%).
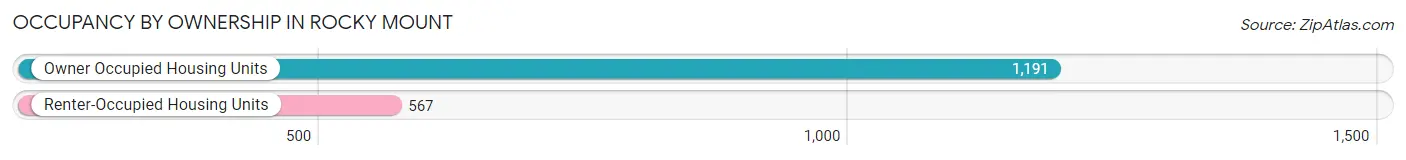
| Occupancy | # Housing Units | % Housing Units |
| Owner Occupied Housing Units | 1,191 | 67.7% |
| Renter-Occupied Housing Units | 567 | 32.3% |
| Total Occupied Housing Units | 1,758 | 100.0% |
Occupancy by Household Size in Rocky Mount
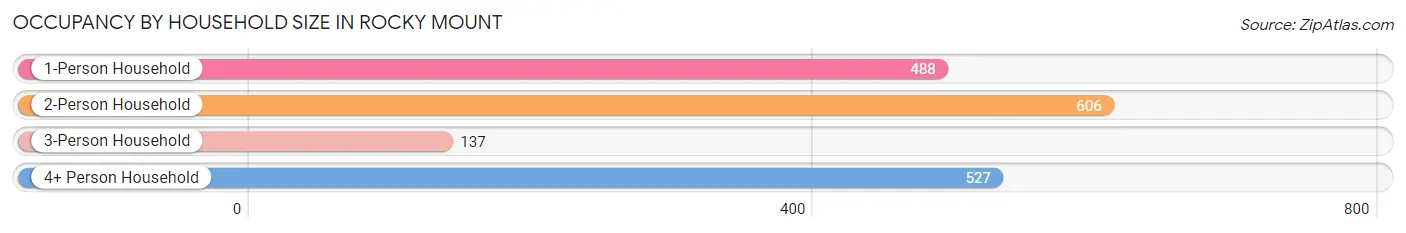
| Household Size | # Housing Units | % Housing Units |
| 1-Person Household | 488 | 27.8% |
| 2-Person Household | 606 | 34.5% |
| 3-Person Household | 137 | 7.8% |
| 4+ Person Household | 527 | 30.0% |
| Total Housing Units | 1,758 | 100.0% |
Occupancy by Ownership by Household Size in Rocky Mount
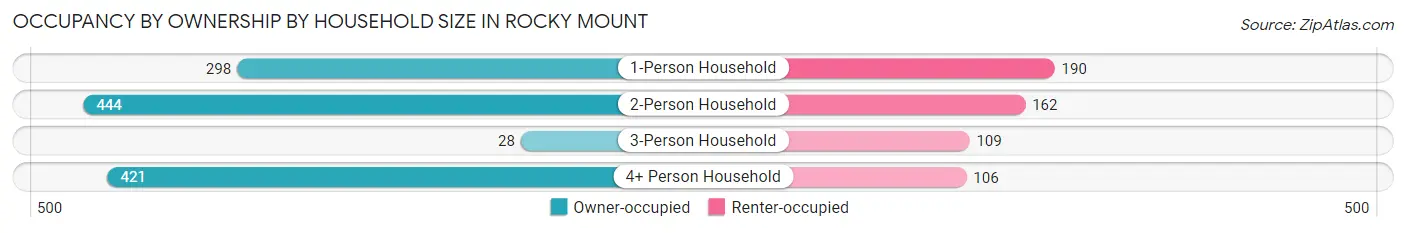
| Household Size | Owner-occupied | Renter-occupied |
| 1-Person Household | 298 (61.1%) | 190 (38.9%) |
| 2-Person Household | 444 (73.3%) | 162 (26.7%) |
| 3-Person Household | 28 (20.4%) | 109 (79.6%) |
| 4+ Person Household | 421 (79.9%) | 106 (20.1%) |
| Total Housing Units | 1,191 (67.7%) | 567 (32.3%) |
Occupancy by Educational Attainment in Rocky Mount
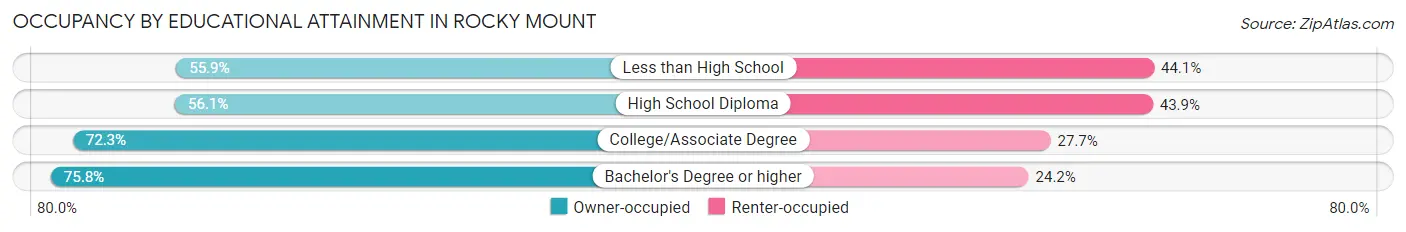
| Household Size | Owner-occupied | Renter-occupied |
| Less than High School | 99 (55.9%) | 78 (44.1%) |
| High School Diploma | 234 (56.1%) | 183 (43.9%) |
| College/Associate Degree | 510 (72.3%) | 195 (27.7%) |
| Bachelor's Degree or higher | 348 (75.8%) | 111 (24.2%) |
Occupancy by Age of Householder in Rocky Mount
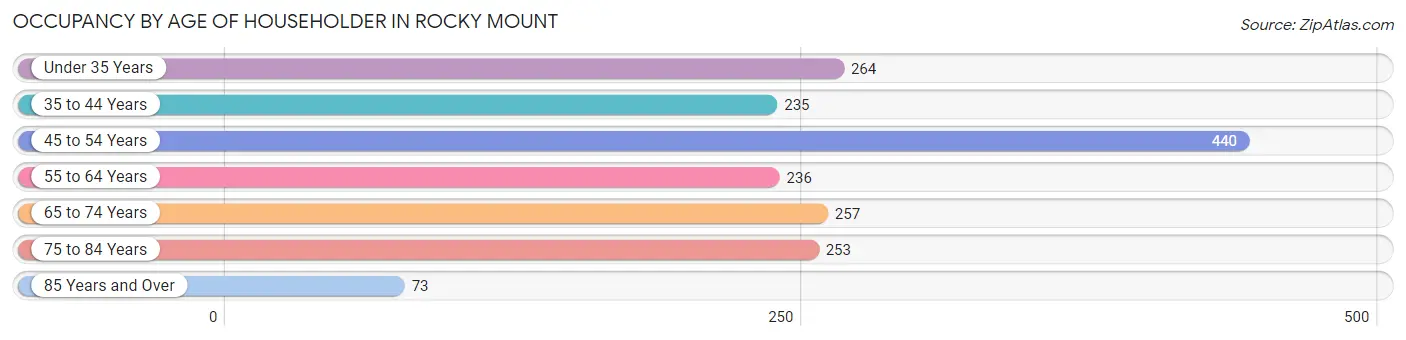
| Age Bracket | # Households | % Households |
| Under 35 Years | 264 | 15.0% |
| 35 to 44 Years | 235 | 13.4% |
| 45 to 54 Years | 440 | 25.0% |
| 55 to 64 Years | 236 | 13.4% |
| 65 to 74 Years | 257 | 14.6% |
| 75 to 84 Years | 253 | 14.4% |
| 85 Years and Over | 73 | 4.2% |
| Total | 1,758 | 100.0% |
Housing Finances in Rocky Mount
Median Income by Occupancy in Rocky Mount
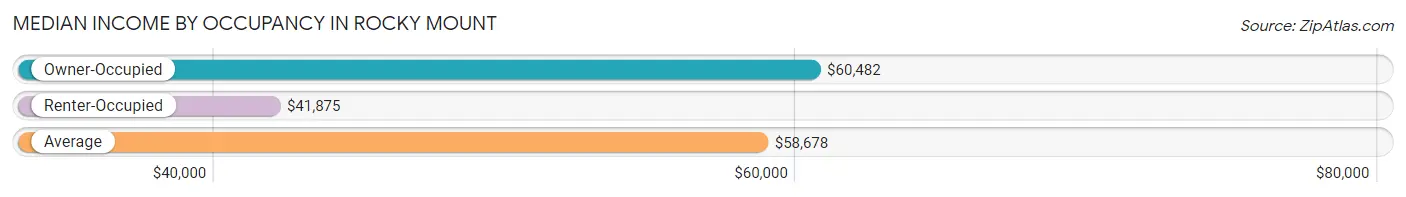
| Occupancy Type | # Households | Median Income |
| Owner-Occupied | 1,191 (67.7%) | $60,482 |
| Renter-Occupied | 567 (32.3%) | $41,875 |
| Average | 1,758 (100.0%) | $58,678 |
Occupancy by Householder Income Bracket in Rocky Mount
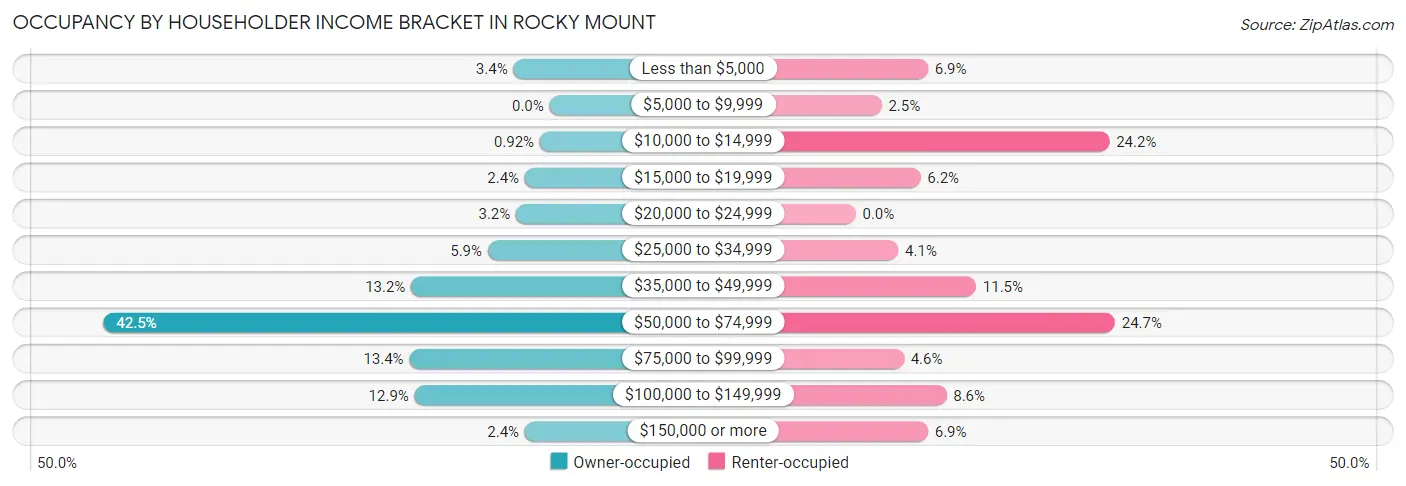
| Income Bracket | Owner-occupied | Renter-occupied |
| Less than $5,000 | 41 (3.4%) | 39 (6.9%) |
| $5,000 to $9,999 | 0 (0.0%) | 14 (2.5%) |
| $10,000 to $14,999 | 11 (0.9%) | 137 (24.2%) |
| $15,000 to $19,999 | 28 (2.4%) | 35 (6.2%) |
| $20,000 to $24,999 | 38 (3.2%) | 0 (0.0%) |
| $25,000 to $34,999 | 70 (5.9%) | 23 (4.1%) |
| $35,000 to $49,999 | 157 (13.2%) | 65 (11.5%) |
| $50,000 to $74,999 | 506 (42.5%) | 140 (24.7%) |
| $75,000 to $99,999 | 159 (13.4%) | 26 (4.6%) |
| $100,000 to $149,999 | 153 (12.9%) | 49 (8.6%) |
| $150,000 or more | 28 (2.4%) | 39 (6.9%) |
| Total | 1,191 (100.0%) | 567 (100.0%) |
Monthly Housing Cost Tiers in Rocky Mount
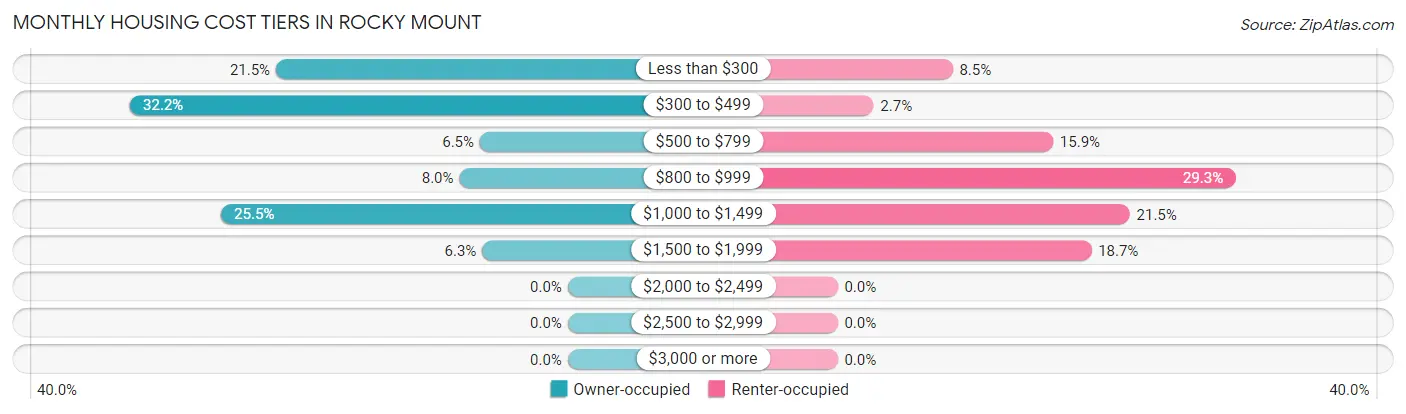
| Monthly Cost | Owner-occupied | Renter-occupied |
| Less than $300 | 256 (21.5%) | 48 (8.5%) |
| $300 to $499 | 384 (32.2%) | 15 (2.6%) |
| $500 to $799 | 77 (6.5%) | 90 (15.9%) |
| $800 to $999 | 95 (8.0%) | 166 (29.3%) |
| $1,000 to $1,499 | 304 (25.5%) | 122 (21.5%) |
| $1,500 to $1,999 | 75 (6.3%) | 106 (18.7%) |
| $2,000 to $2,499 | 0 (0.0%) | 0 (0.0%) |
| $2,500 to $2,999 | 0 (0.0%) | 0 (0.0%) |
| $3,000 or more | 0 (0.0%) | 0 (0.0%) |
| Total | 1,191 (100.0%) | 567 (100.0%) |
Physical Housing Characteristics in Rocky Mount
Housing Structures in Rocky Mount
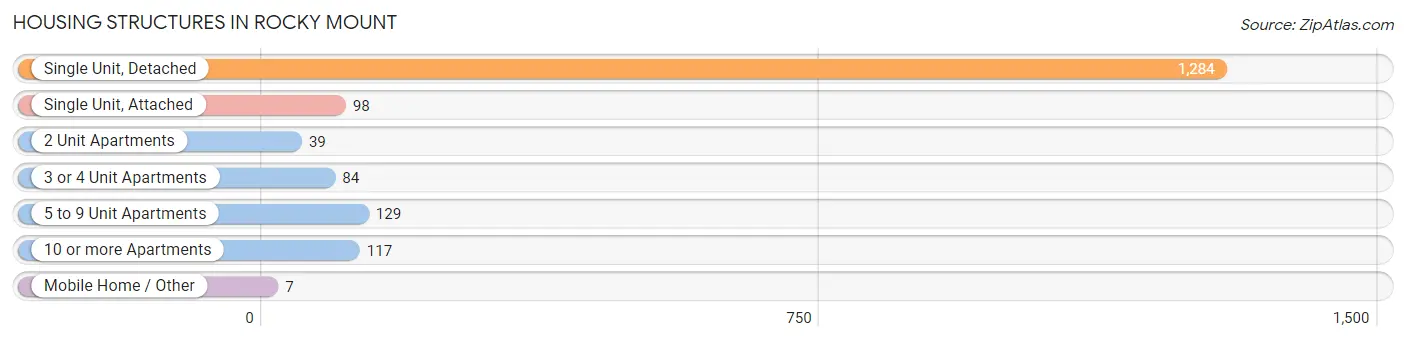
| Structure Type | # Housing Units | % Housing Units |
| Single Unit, Detached | 1,284 | 73.0% |
| Single Unit, Attached | 98 | 5.6% |
| 2 Unit Apartments | 39 | 2.2% |
| 3 or 4 Unit Apartments | 84 | 4.8% |
| 5 to 9 Unit Apartments | 129 | 7.3% |
| 10 or more Apartments | 117 | 6.7% |
| Mobile Home / Other | 7 | 0.4% |
| Total | 1,758 | 100.0% |
Housing Structures by Occupancy in Rocky Mount
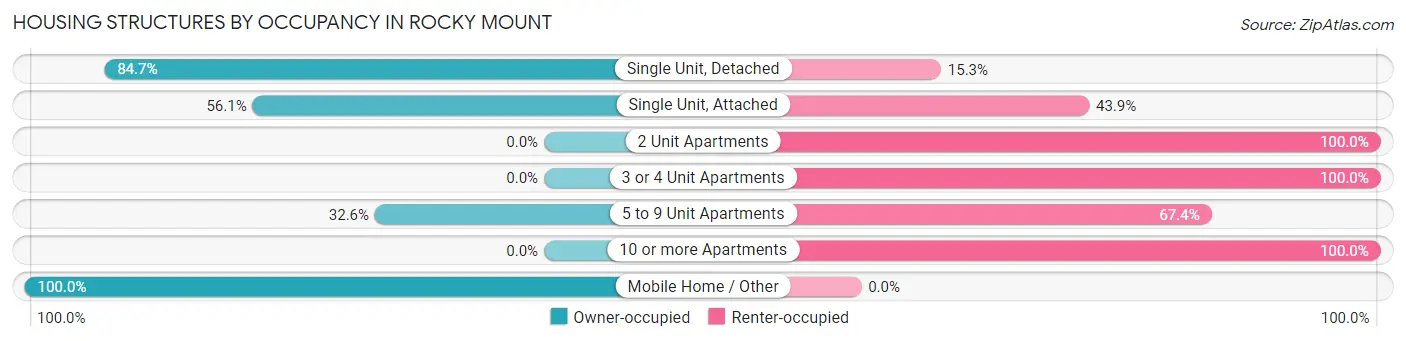
| Structure Type | Owner-occupied | Renter-occupied |
| Single Unit, Detached | 1,087 (84.7%) | 197 (15.3%) |
| Single Unit, Attached | 55 (56.1%) | 43 (43.9%) |
| 2 Unit Apartments | 0 (0.0%) | 39 (100.0%) |
| 3 or 4 Unit Apartments | 0 (0.0%) | 84 (100.0%) |
| 5 to 9 Unit Apartments | 42 (32.6%) | 87 (67.4%) |
| 10 or more Apartments | 0 (0.0%) | 117 (100.0%) |
| Mobile Home / Other | 7 (100.0%) | 0 (0.0%) |
| Total | 1,191 (67.7%) | 567 (32.3%) |
Housing Structures by Number of Rooms in Rocky Mount
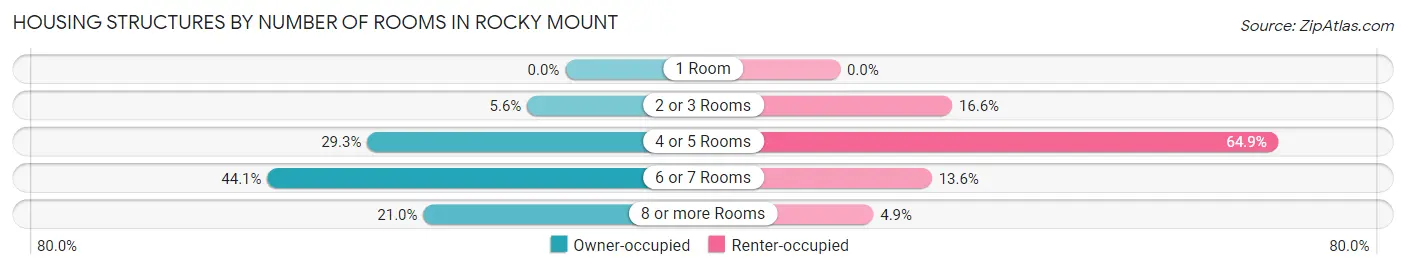
| Number of Rooms | Owner-occupied | Renter-occupied |
| 1 Room | 0 (0.0%) | 0 (0.0%) |
| 2 or 3 Rooms | 67 (5.6%) | 94 (16.6%) |
| 4 or 5 Rooms | 349 (29.3%) | 368 (64.9%) |
| 6 or 7 Rooms | 525 (44.1%) | 77 (13.6%) |
| 8 or more Rooms | 250 (21.0%) | 28 (4.9%) |
| Total | 1,191 (100.0%) | 567 (100.0%) |
Housing Structure by Heating Type in Rocky Mount
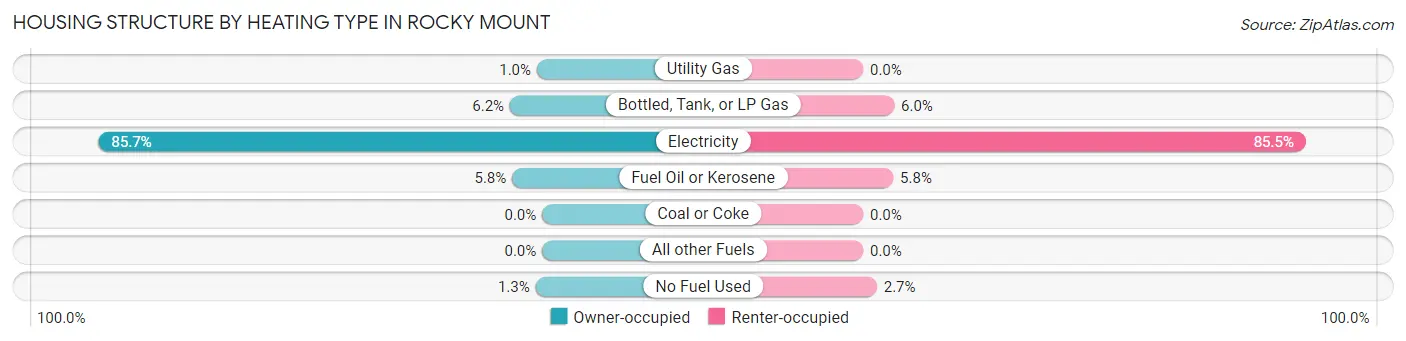
| Heating Type | Owner-occupied | Renter-occupied |
| Utility Gas | 12 (1.0%) | 0 (0.0%) |
| Bottled, Tank, or LP Gas | 74 (6.2%) | 34 (6.0%) |
| Electricity | 1,021 (85.7%) | 485 (85.5%) |
| Fuel Oil or Kerosene | 69 (5.8%) | 33 (5.8%) |
| Coal or Coke | 0 (0.0%) | 0 (0.0%) |
| All other Fuels | 0 (0.0%) | 0 (0.0%) |
| No Fuel Used | 15 (1.3%) | 15 (2.6%) |
| Total | 1,191 (100.0%) | 567 (100.0%) |
Household Vehicle Usage in Rocky Mount
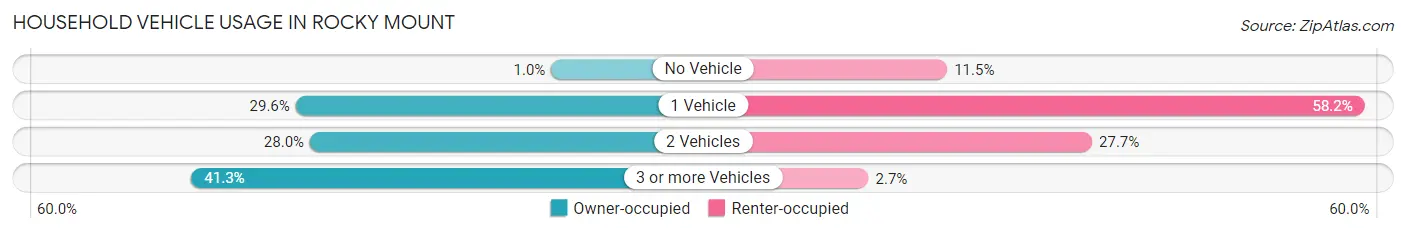
| Vehicles per Household | Owner-occupied | Renter-occupied |
| No Vehicle | 12 (1.0%) | 65 (11.5%) |
| 1 Vehicle | 353 (29.6%) | 330 (58.2%) |
| 2 Vehicles | 334 (28.0%) | 157 (27.7%) |
| 3 or more Vehicles | 492 (41.3%) | 15 (2.6%) |
| Total | 1,191 (100.0%) | 567 (100.0%) |
Real Estate & Mortgages in Rocky Mount
Real Estate and Mortgage Overview in Rocky Mount
| Characteristic | Without Mortgage | With Mortgage |
| Housing Units | 562 | 629 |
| Median Property Value | $198,300 | $159,600 |
| Median Household Income | $58,047 | $28 |
| Monthly Housing Costs | $371 | $0 |
| Real Estate Taxes | $899 | $25 |
Property Value by Mortgage Status in Rocky Mount
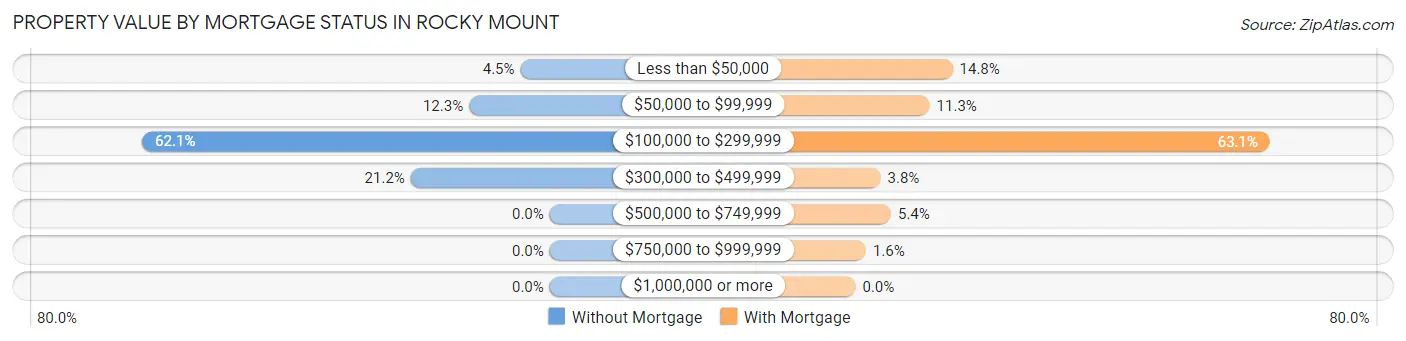
| Property Value | Without Mortgage | With Mortgage |
| Less than $50,000 | 25 (4.4%) | 93 (14.8%) |
| $50,000 to $99,999 | 69 (12.3%) | 71 (11.3%) |
| $100,000 to $299,999 | 349 (62.1%) | 397 (63.1%) |
| $300,000 to $499,999 | 119 (21.2%) | 24 (3.8%) |
| $500,000 to $749,999 | 0 (0.0%) | 34 (5.4%) |
| $750,000 to $999,999 | 0 (0.0%) | 10 (1.6%) |
| $1,000,000 or more | 0 (0.0%) | 0 (0.0%) |
| Total | 562 (100.0%) | 629 (100.0%) |
Household Income by Mortgage Status in Rocky Mount
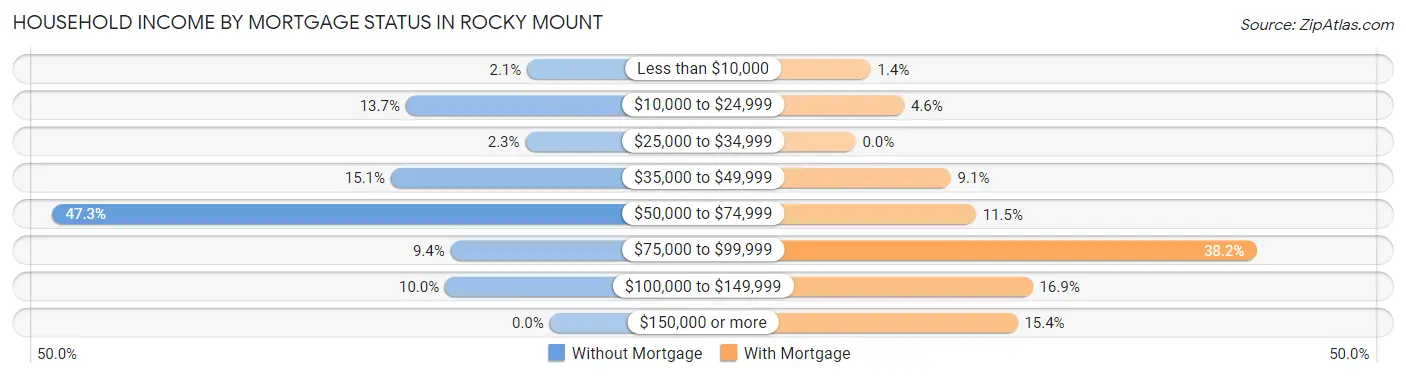
| Household Income | Without Mortgage | With Mortgage |
| Less than $10,000 | 12 (2.1%) | 9 (1.4%) |
| $10,000 to $24,999 | 77 (13.7%) | 29 (4.6%) |
| $25,000 to $34,999 | 13 (2.3%) | 0 (0.0%) |
| $35,000 to $49,999 | 85 (15.1%) | 57 (9.1%) |
| $50,000 to $74,999 | 266 (47.3%) | 72 (11.5%) |
| $75,000 to $99,999 | 53 (9.4%) | 240 (38.2%) |
| $100,000 to $149,999 | 56 (10.0%) | 106 (16.9%) |
| $150,000 or more | 0 (0.0%) | 97 (15.4%) |
| Total | 562 (100.0%) | 629 (100.0%) |
Property Value to Household Income Ratio in Rocky Mount
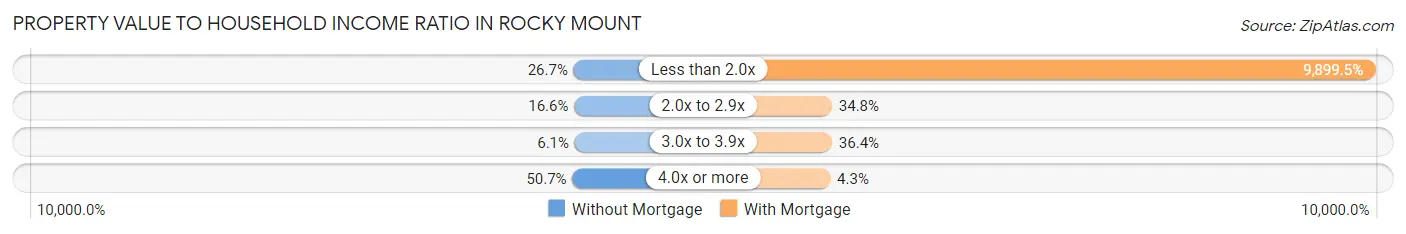
| Value-to-Income Ratio | Without Mortgage | With Mortgage |
| Less than 2.0x | 150 (26.7%) | 62,268 (9,899.5%) |
| 2.0x to 2.9x | 93 (16.6%) | 219 (34.8%) |
| 3.0x to 3.9x | 34 (6.0%) | 229 (36.4%) |
| 4.0x or more | 285 (50.7%) | 27 (4.3%) |
| Total | 562 (100.0%) | 629 (100.0%) |
Real Estate Taxes by Mortgage Status in Rocky Mount
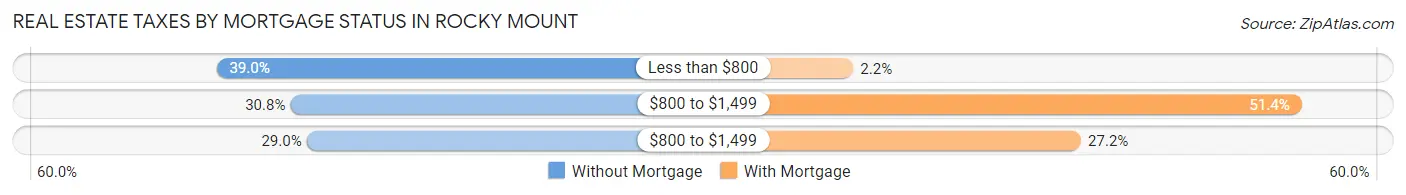
| Property Taxes | Without Mortgage | With Mortgage |
| Less than $800 | 219 (39.0%) | 14 (2.2%) |
| $800 to $1,499 | 173 (30.8%) | 323 (51.3%) |
| $800 to $1,499 | 163 (29.0%) | 171 (27.2%) |
| Total | 562 (100.0%) | 629 (100.0%) |
Health & Disability in Rocky Mount
Health Insurance Coverage by Age in Rocky Mount
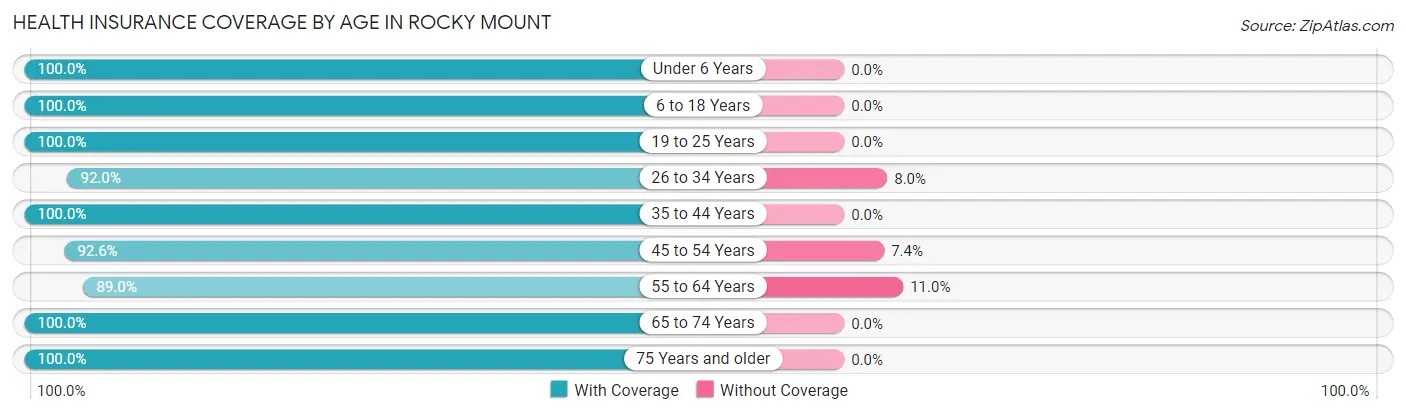
| Age Bracket | With Coverage | Without Coverage |
| Under 6 Years | 323 (100.0%) | 0 (0.0%) |
| 6 to 18 Years | 801 (100.0%) | 0 (0.0%) |
| 19 to 25 Years | 473 (100.0%) | 0 (0.0%) |
| 26 to 34 Years | 436 (92.0%) | 38 (8.0%) |
| 35 to 44 Years | 410 (100.0%) | 0 (0.0%) |
| 45 to 54 Years | 796 (92.6%) | 64 (7.4%) |
| 55 to 64 Years | 332 (89.0%) | 41 (11.0%) |
| 65 to 74 Years | 404 (100.0%) | 0 (0.0%) |
| 75 Years and older | 495 (100.0%) | 0 (0.0%) |
| Total | 4,470 (96.9%) | 143 (3.1%) |
Health Insurance Coverage by Citizenship Status in Rocky Mount
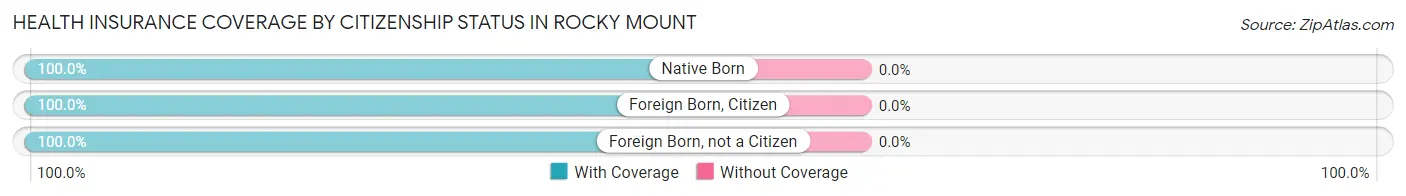
| Citizenship Status | With Coverage | Without Coverage |
| Native Born | 323 (100.0%) | 0 (0.0%) |
| Foreign Born, Citizen | 801 (100.0%) | 0 (0.0%) |
| Foreign Born, not a Citizen | 473 (100.0%) | 0 (0.0%) |
Health Insurance Coverage by Household Income in Rocky Mount
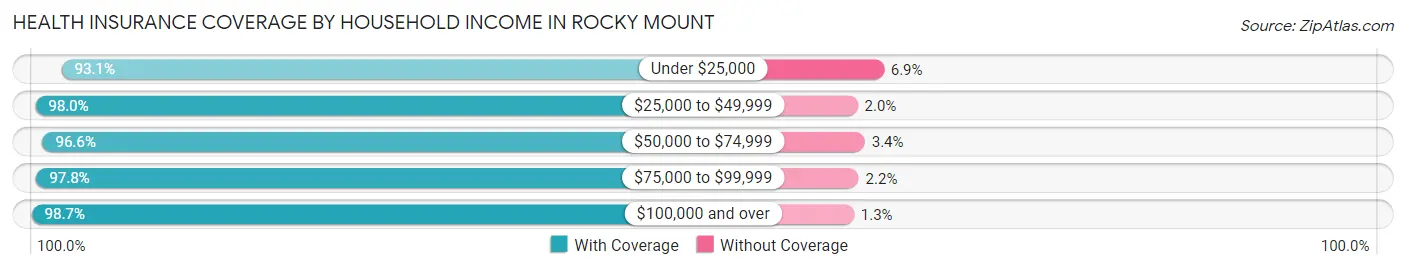
| Household Income | With Coverage | Without Coverage |
| Under $25,000 | 551 (93.1%) | 41 (6.9%) |
| $25,000 to $49,999 | 729 (98.0%) | 15 (2.0%) |
| $50,000 to $74,999 | 1,835 (96.6%) | 64 (3.4%) |
| $75,000 to $99,999 | 616 (97.8%) | 14 (2.2%) |
| $100,000 and over | 674 (98.7%) | 9 (1.3%) |
Public vs Private Health Insurance Coverage by Age in Rocky Mount
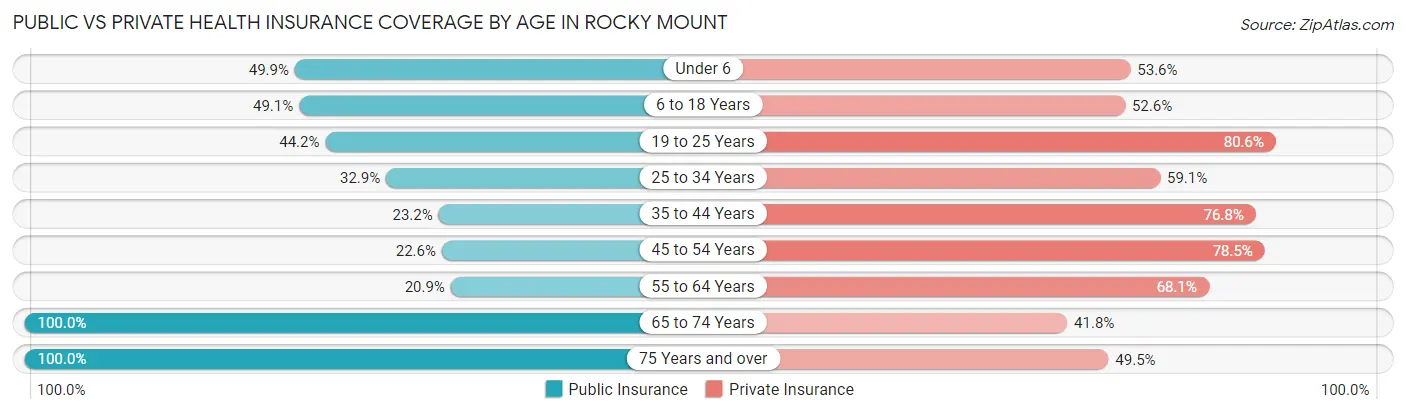
| Age Bracket | Public Insurance | Private Insurance |
| Under 6 | 161 (49.8%) | 173 (53.6%) |
| 6 to 18 Years | 393 (49.1%) | 421 (52.6%) |
| 19 to 25 Years | 209 (44.2%) | 381 (80.5%) |
| 25 to 34 Years | 156 (32.9%) | 280 (59.1%) |
| 35 to 44 Years | 95 (23.2%) | 315 (76.8%) |
| 45 to 54 Years | 194 (22.6%) | 675 (78.5%) |
| 55 to 64 Years | 78 (20.9%) | 254 (68.1%) |
| 65 to 74 Years | 404 (100.0%) | 169 (41.8%) |
| 75 Years and over | 495 (100.0%) | 245 (49.5%) |
| Total | 2,185 (47.4%) | 2,913 (63.1%) |
Disability Status by Sex by Age in Rocky Mount
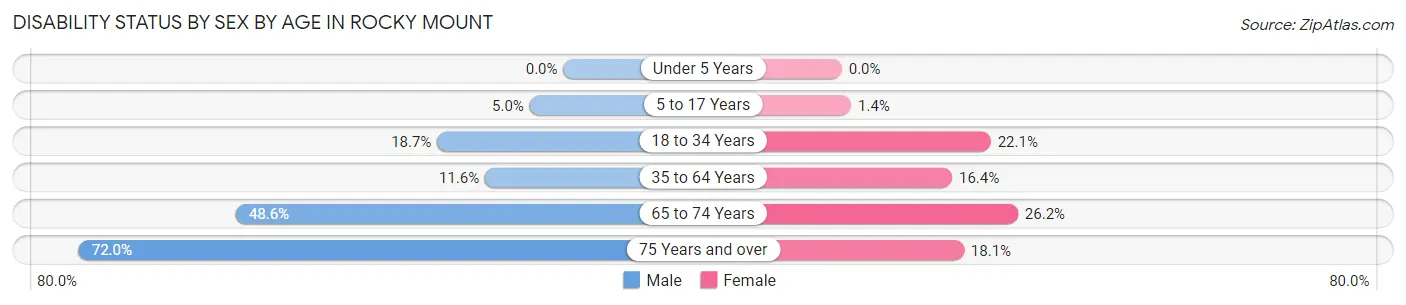
| Age Bracket | Male | Female |
| Under 5 Years | 0 (0.0%) | 0 (0.0%) |
| 5 to 17 Years | 23 (5.0%) | 6 (1.4%) |
| 18 to 34 Years | 56 (18.7%) | 146 (22.1%) |
| 35 to 64 Years | 93 (11.6%) | 138 (16.4%) |
| 65 to 74 Years | 70 (48.6%) | 68 (26.2%) |
| 75 Years and over | 118 (72.0%) | 60 (18.1%) |
Disability Class by Sex by Age in Rocky Mount
Disability Class: Hearing Difficulty
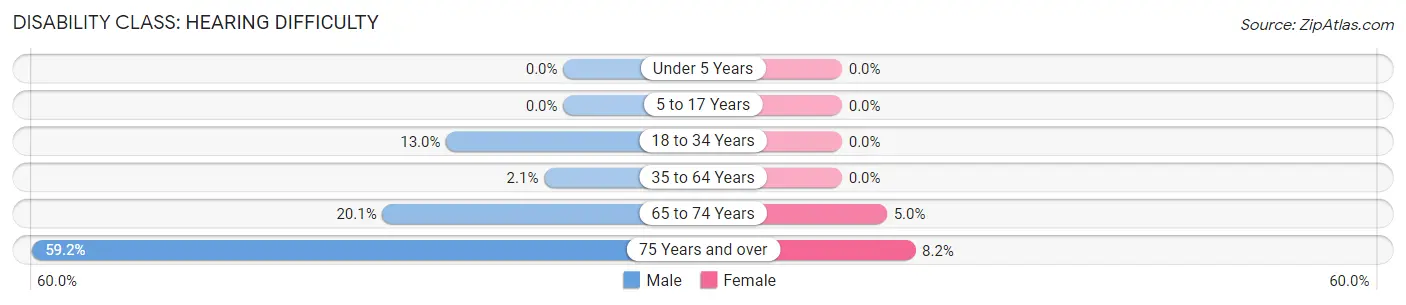
| Age Bracket | Male | Female |
| Under 5 Years | 0 (0.0%) | 0 (0.0%) |
| 5 to 17 Years | 0 (0.0%) | 0 (0.0%) |
| 18 to 34 Years | 39 (13.0%) | 0 (0.0%) |
| 35 to 64 Years | 17 (2.1%) | 0 (0.0%) |
| 65 to 74 Years | 29 (20.1%) | 13 (5.0%) |
| 75 Years and over | 97 (59.2%) | 27 (8.2%) |
Disability Class: Vision Difficulty
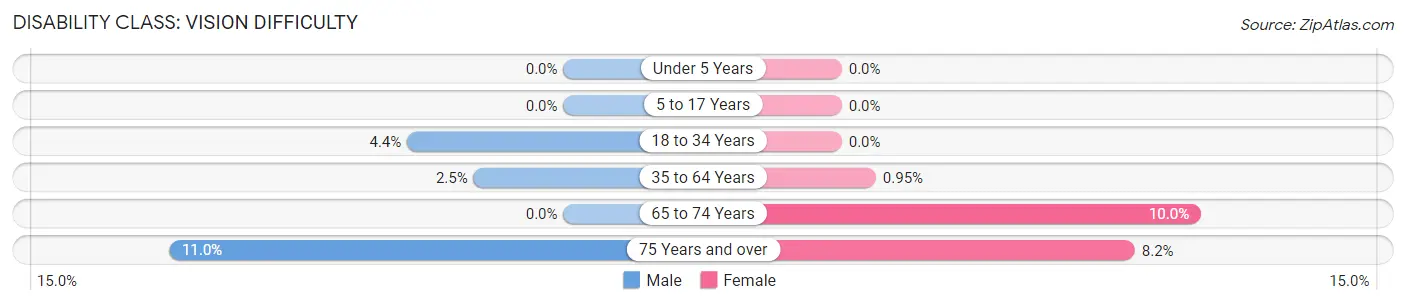
| Age Bracket | Male | Female |
| Under 5 Years | 0 (0.0%) | 0 (0.0%) |
| 5 to 17 Years | 0 (0.0%) | 0 (0.0%) |
| 18 to 34 Years | 13 (4.3%) | 0 (0.0%) |
| 35 to 64 Years | 20 (2.5%) | 8 (0.9%) |
| 65 to 74 Years | 0 (0.0%) | 26 (10.0%) |
| 75 Years and over | 18 (11.0%) | 27 (8.2%) |
Disability Class: Cognitive Difficulty
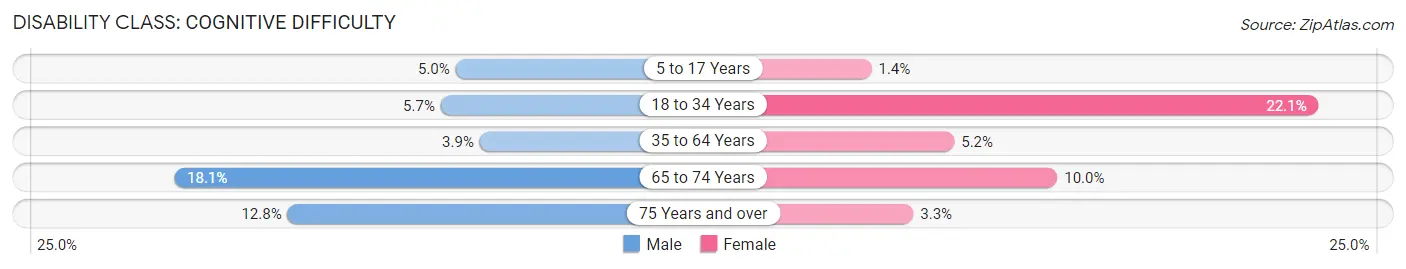
| Age Bracket | Male | Female |
| 5 to 17 Years | 23 (5.0%) | 6 (1.4%) |
| 18 to 34 Years | 17 (5.7%) | 146 (22.1%) |
| 35 to 64 Years | 31 (3.9%) | 44 (5.2%) |
| 65 to 74 Years | 26 (18.1%) | 26 (10.0%) |
| 75 Years and over | 21 (12.8%) | 11 (3.3%) |
Disability Class: Ambulatory Difficulty
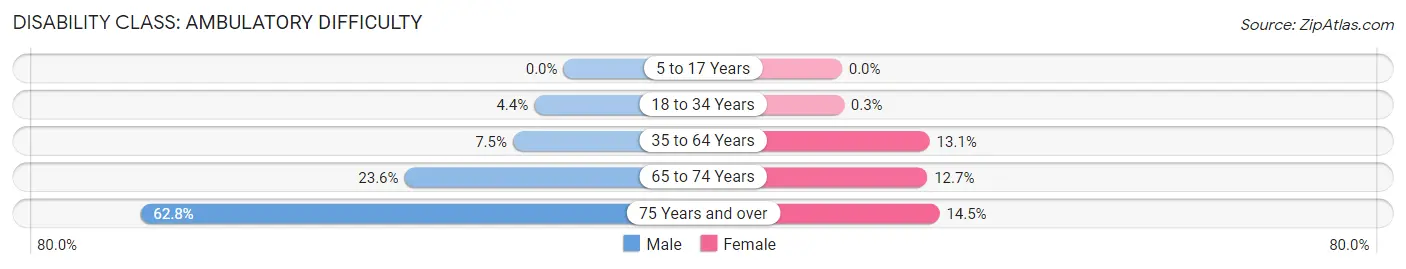
| Age Bracket | Male | Female |
| 5 to 17 Years | 0 (0.0%) | 0 (0.0%) |
| 18 to 34 Years | 13 (4.3%) | 2 (0.3%) |
| 35 to 64 Years | 60 (7.5%) | 110 (13.1%) |
| 65 to 74 Years | 34 (23.6%) | 33 (12.7%) |
| 75 Years and over | 103 (62.8%) | 48 (14.5%) |
Disability Class: Self-Care Difficulty
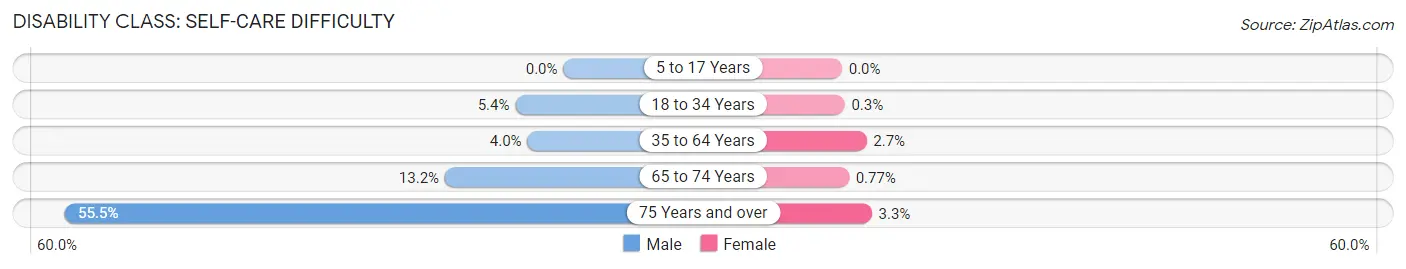
| Age Bracket | Male | Female |
| 5 to 17 Years | 0 (0.0%) | 0 (0.0%) |
| 18 to 34 Years | 16 (5.3%) | 2 (0.3%) |
| 35 to 64 Years | 32 (4.0%) | 23 (2.7%) |
| 65 to 74 Years | 19 (13.2%) | 2 (0.8%) |
| 75 Years and over | 91 (55.5%) | 11 (3.3%) |
Technology Access in Rocky Mount
Computing Device Access in Rocky Mount
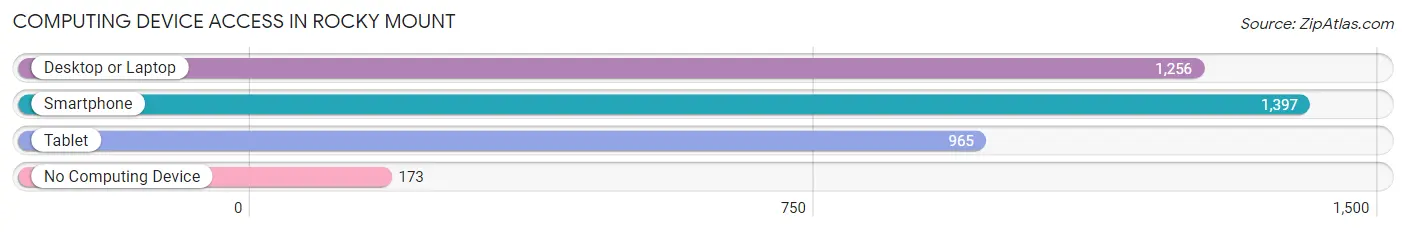
| Device Type | # Households | % Households |
| Desktop or Laptop | 1,256 | 71.4% |
| Smartphone | 1,397 | 79.5% |
| Tablet | 965 | 54.9% |
| No Computing Device | 173 | 9.8% |
| Total | 1,758 | 100.0% |
Internet Access in Rocky Mount
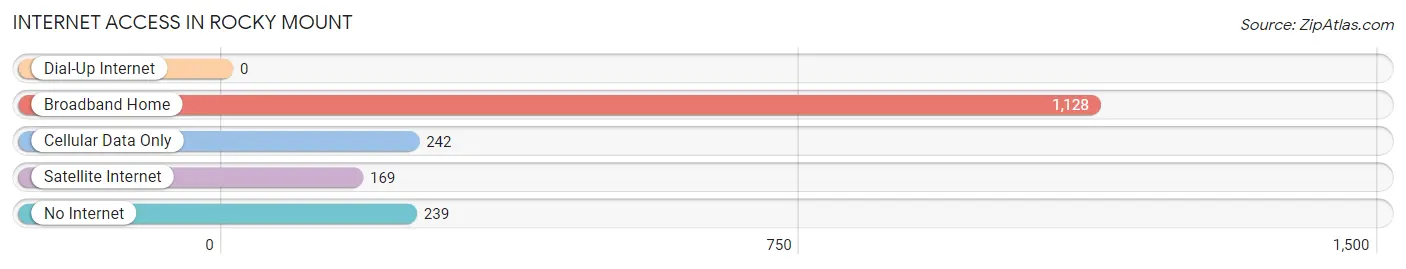
| Internet Type | # Households | % Households |
| Dial-Up Internet | 0 | 0.0% |
| Broadband Home | 1,128 | 64.2% |
| Cellular Data Only | 242 | 13.8% |
| Satellite Internet | 169 | 9.6% |
| No Internet | 239 | 13.6% |
| Total | 1,758 | 100.0% |
Rocky Mount Summary
Rocky Mount, Virginia is a small town located in Franklin County, Virginia. It is situated in the foothills of the Blue Ridge Mountains, and is part of the Roanoke Metropolitan Statistical Area. The town has a population of 5,819 as of the 2010 census, and is the county seat of Franklin County.
History
Rocky Mount was first settled in 1760 by William Ingles, who was the first settler in the area. The town was originally known as Ingles’ Ferry, and was later renamed Rocky Mount in 1813. The town was officially incorporated in 1818, and was named after the rocky terrain of the area.
The town was an important stop on the Great Wagon Road, which was a major route for settlers heading west. The town was also an important stop on the Virginia and Tennessee Railroad, which was built in 1856.
Geography
Rocky Mount is located in the foothills of the Blue Ridge Mountains, and is situated at an elevation of 1,068 feet. The town is located at the intersection of US Route 220 and US Route 221. The town is located approximately 25 miles south of Roanoke, Virginia, and is approximately 90 miles west of Richmond, Virginia.
The town is located in a rural area, and is surrounded by rolling hills and farmland. The town is located near the Smith Mountain Lake, which is a popular recreational area.
Economy
The economy of Rocky Mount is largely based on agriculture and tourism. The town is home to several farms, and is a popular destination for tourists who are looking to explore the area’s natural beauty.
The town is also home to several small businesses, including restaurants, retail stores, and other services. The town is also home to several manufacturing companies, including a furniture manufacturer and a plastics manufacturer.
Demographics
As of the 2010 census, the population of Rocky Mount was 5,819. The town has a median household income of $37,945, and a median family income of $45,945. The town has a poverty rate of 17.3%, and the unemployment rate is 5.3%.
The town is predominantly white, with 87.3% of the population identifying as white. The town also has a small African American population, with 8.3% of the population identifying as African American. The town also has a small Hispanic population, with 2.2% of the population identifying as Hispanic or Latino.
Conclusion
Rocky Mount, Virginia is a small town located in Franklin County, Virginia. The town has a population of 5,819 as of the 2010 census, and is the county seat of Franklin County. The town is situated in the foothills of the Blue Ridge Mountains, and is part of the Roanoke Metropolitan Statistical Area. The economy of Rocky Mount is largely based on agriculture and tourism, and the town is home to several small businesses. The town is predominantly white, with 87.3% of the population identifying as white.
Common Questions
What is Per Capita Income in Rocky Mount?
Per Capita income in Rocky Mount is $24,271.
What is the Median Family Income in Rocky Mount?
Median Family Income in Rocky Mount is $59,459.
What is the Median Household income in Rocky Mount?
Median Household Income in Rocky Mount is $58,678.
What is Income or Wage Gap in Rocky Mount?
Income or Wage Gap in Rocky Mount is 21.6%.
Women in Rocky Mount earn 78.4 cents for every dollar earned by a man.
What is Inequality or Gini Index in Rocky Mount?
Inequality or Gini Index in Rocky Mount is 0.35.
What is the Total Population of Rocky Mount?
Total Population of Rocky Mount is 4,916.
What is the Total Male Population of Rocky Mount?
Total Male Population of Rocky Mount is 2,086.
What is the Total Female Population of Rocky Mount?
Total Female Population of Rocky Mount is 2,830.
What is the Ratio of Males per 100 Females in Rocky Mount?
There are 73.71 Males per 100 Females in Rocky Mount.
What is the Ratio of Females per 100 Males in Rocky Mount?
There are 135.67 Females per 100 Males in Rocky Mount.
What is the Median Population Age in Rocky Mount?
Median Population Age in Rocky Mount is 43.0 Years.
What is the Average Family Size in Rocky Mount
Average Family Size in Rocky Mount is 3.2 People.
What is the Average Household Size in Rocky Mount
Average Household Size in Rocky Mount is 2.6 People.
How Large is the Labor Force in Rocky Mount?
There are 2,148 People in the Labor Forcein in Rocky Mount.
What is the Percentage of People in the Labor Force in Rocky Mount?
54.1% of People are in the Labor Force in Rocky Mount.
What is the Unemployment Rate in Rocky Mount?
Unemployment Rate in Rocky Mount is 4.9%.