Lemont, PA Map & Demographics
Lemont Map
Lemont Overview
$44,550
PER CAPITA INCOME
$94,383
AVG FAMILY INCOME
$63,945
AVG HOUSEHOLD INCOME
47.2%
WAGE / INCOME GAP [ % ]
52.8¢/ $1
WAGE / INCOME GAP [ $ ]
0.45
INEQUALITY / GINI INDEX
2,085
TOTAL POPULATION
1,198
MALE POPULATION
887
FEMALE POPULATION
135.06
MALES / 100 FEMALES
74.04
FEMALES / 100 MALES
40.5
MEDIAN AGE
2.9
AVG FAMILY SIZE
2.2
AVG HOUSEHOLD SIZE
983
LABOR FORCE [ PEOPLE ]
55.9%
PERCENT IN LABOR FORCE
8.9%
UNEMPLOYMENT RATE
Lemont Zip Codes
Lemont Area Codes
Income in Lemont
Income Overview in Lemont
Per Capita Income in Lemont is $44,550, while median incomes of families and households are $94,383 and $63,945 respectively.
| Characteristic | Number | Measure |
| Per Capita Income | 2,085 | $44,550 |
| Median Family Income | 528 | $94,383 |
| Mean Family Income | 528 | $127,668 |
| Median Household Income | 951 | $63,945 |
| Mean Household Income | 951 | $96,903 |
| Income Deficit | 528 | $0 |
| Wage / Income Gap (%) | 2,085 | 47.23% |
| Wage / Income Gap ($) | 2,085 | 52.77¢ per $1 |
| Gini / Inequality Index | 2,085 | 0.45 |
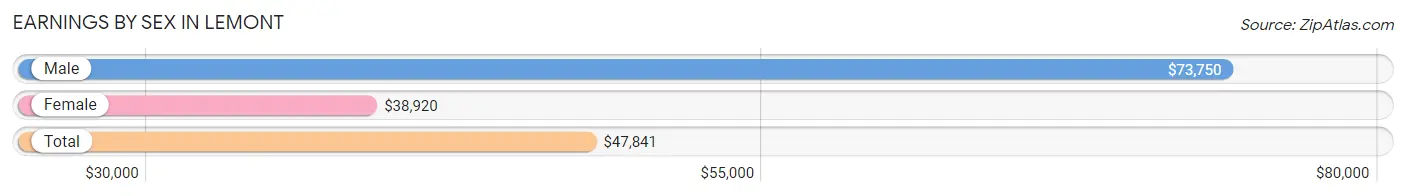
Earnings by Sex in Lemont
Average Earnings in Lemont are $47,841, $73,750 for men and $38,920 for women, a difference of 47.2%.
| Sex | Number | Average Earnings |
| Male | 506 (50.4%) | $73,750 |
| Female | 497 (49.5%) | $38,920 |
| Total | 1,003 (100.0%) | $47,841 |
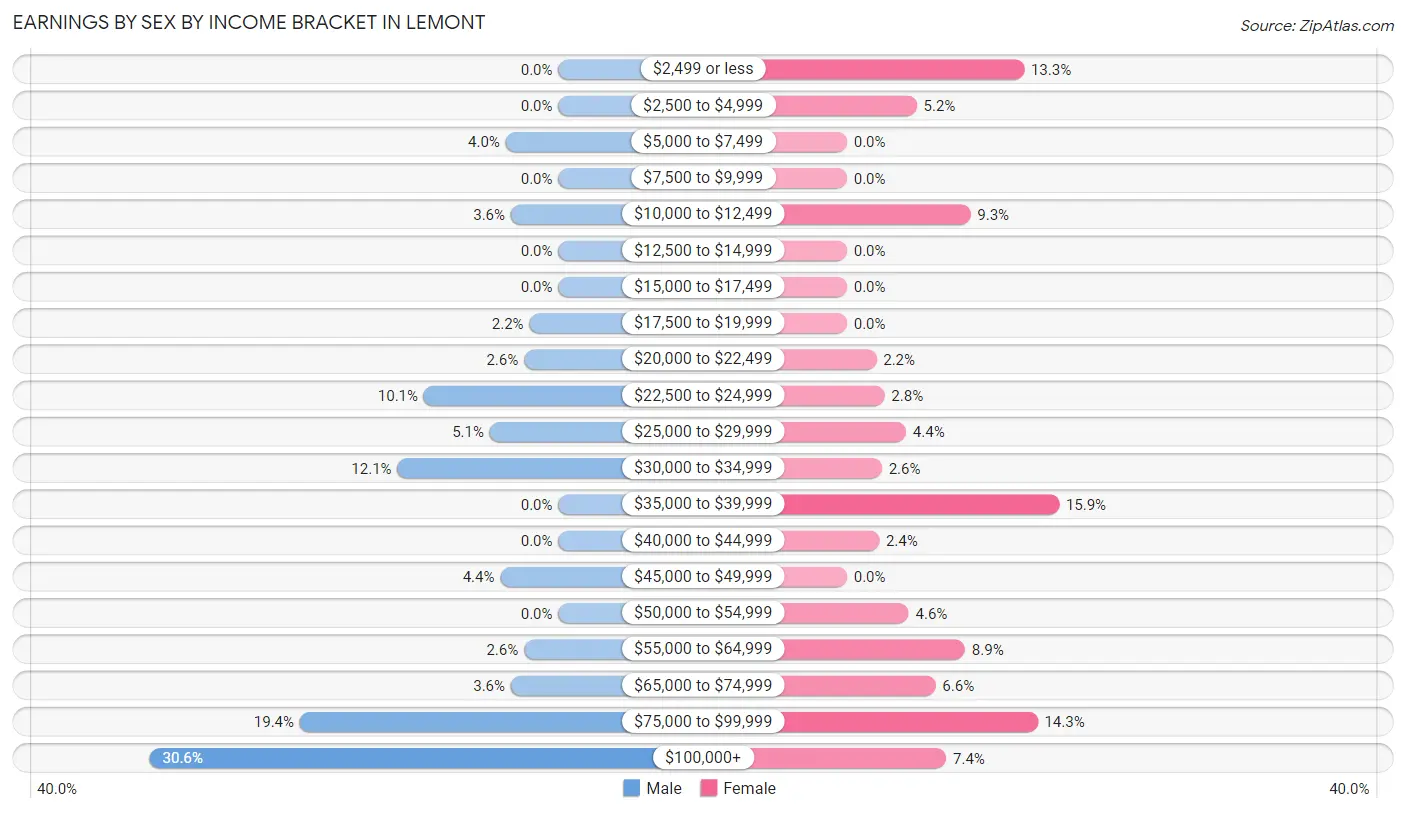
Earnings by Sex by Income Bracket in Lemont
The most common earnings brackets in Lemont are $100,000+ for men (155 | 30.6%) and $35,000 to $39,999 for women (79 | 15.9%).
| Income | Male | Female |
| $2,499 or less | 0 (0.0%) | 66 (13.3%) |
| $2,500 to $4,999 | 0 (0.0%) | 26 (5.2%) |
| $5,000 to $7,499 | 20 (4.0%) | 0 (0.0%) |
| $7,500 to $9,999 | 0 (0.0%) | 0 (0.0%) |
| $10,000 to $12,499 | 18 (3.6%) | 46 (9.3%) |
| $12,500 to $14,999 | 0 (0.0%) | 0 (0.0%) |
| $15,000 to $17,499 | 0 (0.0%) | 0 (0.0%) |
| $17,500 to $19,999 | 11 (2.2%) | 0 (0.0%) |
| $20,000 to $22,499 | 13 (2.6%) | 11 (2.2%) |
| $22,500 to $24,999 | 51 (10.1%) | 14 (2.8%) |
| $25,000 to $29,999 | 26 (5.1%) | 22 (4.4%) |
| $30,000 to $34,999 | 61 (12.1%) | 13 (2.6%) |
| $35,000 to $39,999 | 0 (0.0%) | 79 (15.9%) |
| $40,000 to $44,999 | 0 (0.0%) | 12 (2.4%) |
| $45,000 to $49,999 | 22 (4.3%) | 0 (0.0%) |
| $50,000 to $54,999 | 0 (0.0%) | 23 (4.6%) |
| $55,000 to $64,999 | 13 (2.6%) | 44 (8.8%) |
| $65,000 to $74,999 | 18 (3.6%) | 33 (6.6%) |
| $75,000 to $99,999 | 98 (19.4%) | 71 (14.3%) |
| $100,000+ | 155 (30.6%) | 37 (7.4%) |
| Total | 506 (100.0%) | 497 (100.0%) |
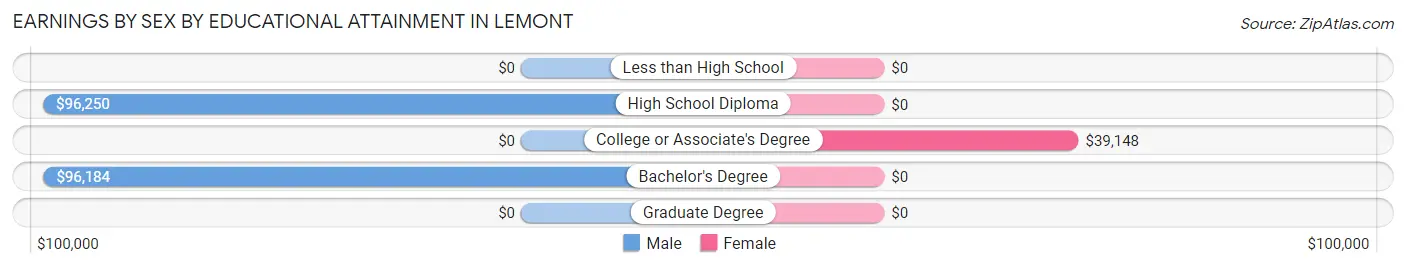
Earnings by Sex by Educational Attainment in Lemont
Average earnings in Lemont are $87,633 for men and $38,977 for women, a difference of 55.5%. Men with an educational attainment of high school diploma enjoy the highest average annual earnings of $96,250, while those with bachelor's degree education earn the least with $96,184. Women with an educational attainment of college or associate's degree earn the most with the average annual earnings of $39,148, while those with college or associate's degree education have the smallest earnings of $39,148.
| Educational Attainment | Male Income | Female Income |
| Less than High School | - | - |
| High School Diploma | $96,250 | $0 |
| College or Associate's Degree | - | - |
| Bachelor's Degree | $96,184 | $0 |
| Graduate Degree | - | - |
| Total | $87,633 | $38,977 |
Family Income in Lemont
Family Income Brackets in Lemont
According to the Lemont family income data, there are 125 families falling into the $75,000 to $99,999 income range, which is the most common income bracket and makes up 23.7% of all families.
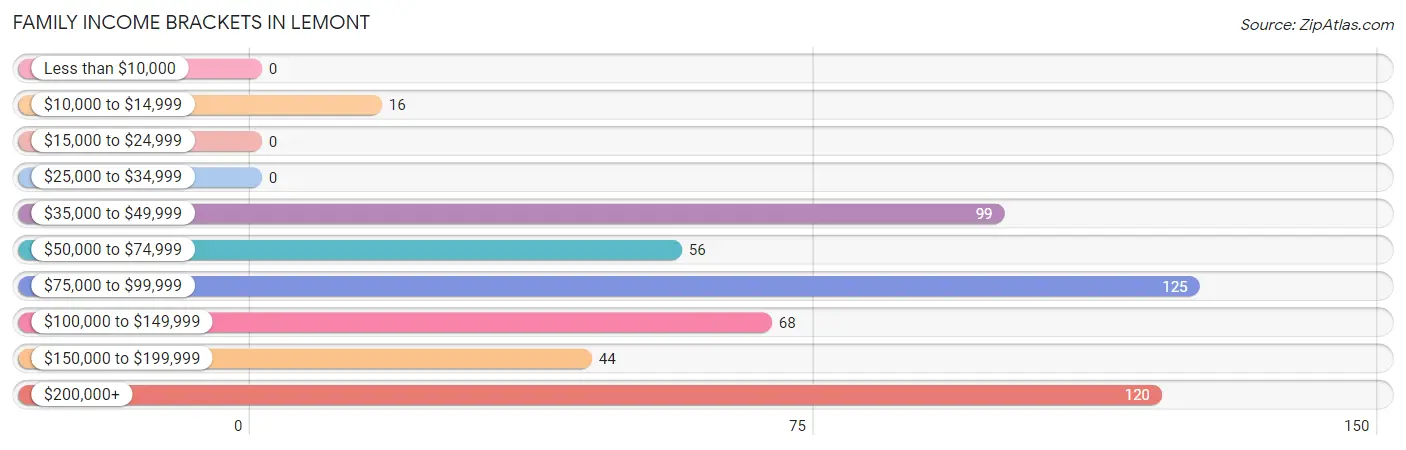
| Income Bracket | # Families | % Families |
| Less than $10,000 | 0 | 0.0% |
| $10,000 to $14,999 | 16 | 3.0% |
| $15,000 to $24,999 | 0 | 0.0% |
| $25,000 to $34,999 | 0 | 0.0% |
| $35,000 to $49,999 | 99 | 18.8% |
| $50,000 to $74,999 | 56 | 10.6% |
| $75,000 to $99,999 | 125 | 23.7% |
| $100,000 to $149,999 | 68 | 12.9% |
| $150,000 to $199,999 | 44 | 8.3% |
| $200,000+ | 120 | 22.7% |
Family Income by Famaliy Size in Lemont
2-person families (258 | 48.9%) account for the highest median family income in Lemont with $121,477 per family, while 2-person families (258 | 48.9%) have the highest median income of $60,738 per family member.
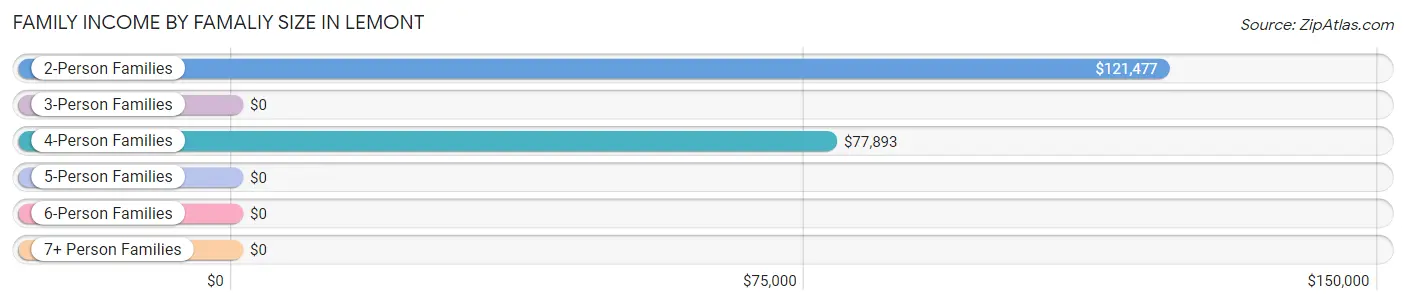
| Income Bracket | # Families | Median Income |
| 2-Person Families | 258 (48.9%) | $121,477 |
| 3-Person Families | 123 (23.3%) | $0 |
| 4-Person Families | 147 (27.8%) | $77,893 |
| 5-Person Families | 0 (0.0%) | $0 |
| 6-Person Families | 0 (0.0%) | $0 |
| 7+ Person Families | 0 (0.0%) | $0 |
| Total | 528 (100.0%) | $94,383 |
Family Income by Number of Earners in Lemont
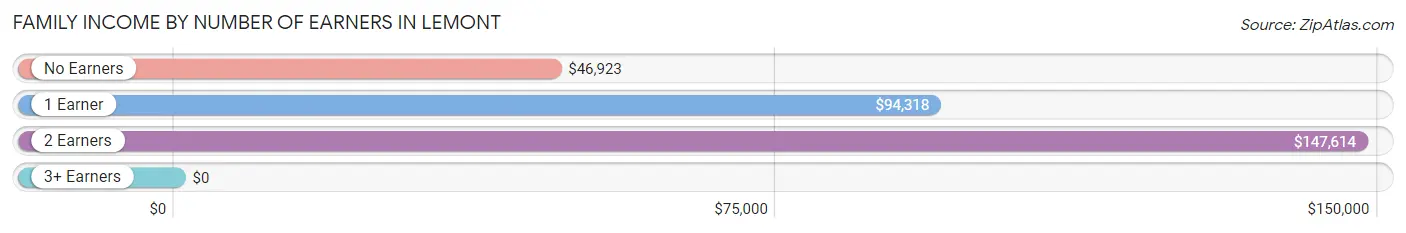
| Number of Earners | # Families | Median Income |
| No Earners | 88 (16.7%) | $46,923 |
| 1 Earner | 192 (36.4%) | $94,318 |
| 2 Earners | 231 (43.8%) | $147,614 |
| 3+ Earners | 17 (3.2%) | $0 |
| Total | 528 (100.0%) | $94,383 |
Household Income in Lemont
Household Income Brackets in Lemont
With 182 households falling in the category, the $35,000 to $49,999 income range is the most frequent in Lemont, accounting for 19.1% of all households. In contrast, only 16 households (1.7%) fall into the $10,000 to $14,999 income bracket, making it the least populous group.
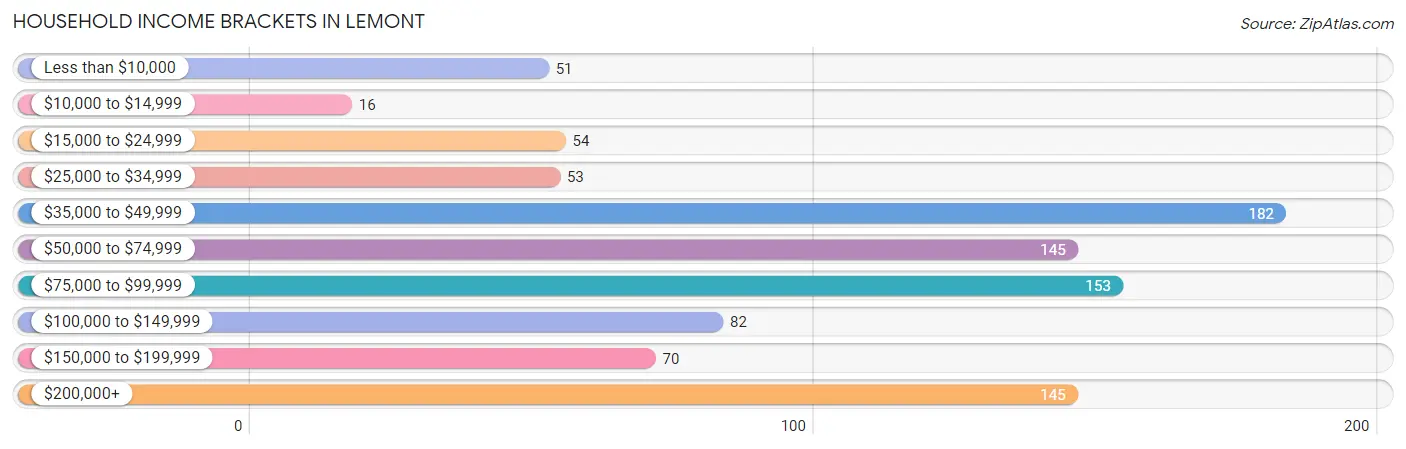
| Income Bracket | # Households | % Households |
| Less than $10,000 | 51 | 5.4% |
| $10,000 to $14,999 | 16 | 1.7% |
| $15,000 to $24,999 | 54 | 5.7% |
| $25,000 to $34,999 | 53 | 5.6% |
| $35,000 to $49,999 | 182 | 19.1% |
| $50,000 to $74,999 | 145 | 15.2% |
| $75,000 to $99,999 | 153 | 16.1% |
| $100,000 to $149,999 | 82 | 8.6% |
| $150,000 to $199,999 | 70 | 7.4% |
| $200,000+ | 145 | 15.2% |
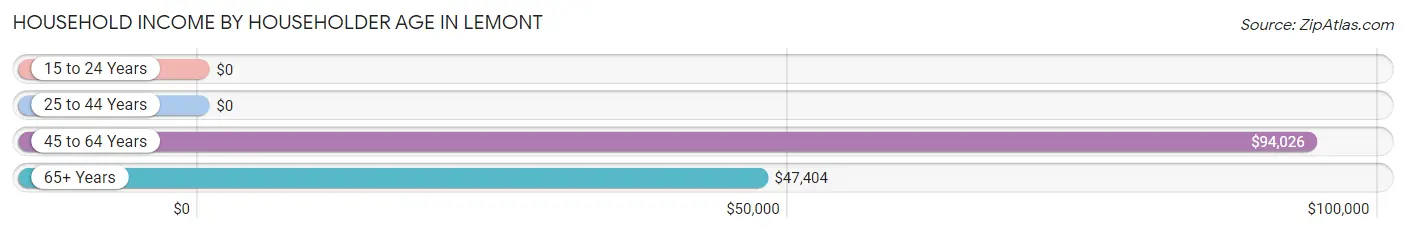
Household Income by Householder Age in Lemont
The median household income in Lemont is $63,945, with the highest median household income of $94,026 found in the 45 to 64 years age bracket for the primary householder. A total of 398 households (41.8%) fall into this category. Meanwhile, the 15 to 24 years age bracket for the primary householder has the lowest median household income of $0, with 16 households (1.7%) in this group.
| Income Bracket | # Households | Median Income |
| 15 to 24 Years | 16 (1.7%) | $0 |
| 25 to 44 Years | 282 (29.6%) | $0 |
| 45 to 64 Years | 398 (41.8%) | $94,026 |
| 65+ Years | 255 (26.8%) | $47,404 |
| Total | 951 (100.0%) | $63,945 |
Poverty in Lemont
Income Below Poverty by Sex and Age in Lemont
With 11.4% poverty level for males and 4.8% for females among the residents of Lemont, under 5 year old males and 25 to 34 year old females are the most vulnerable to poverty, with 64 males (57.7%) and 42 females (68.9%) in their respective age groups living below the poverty level.
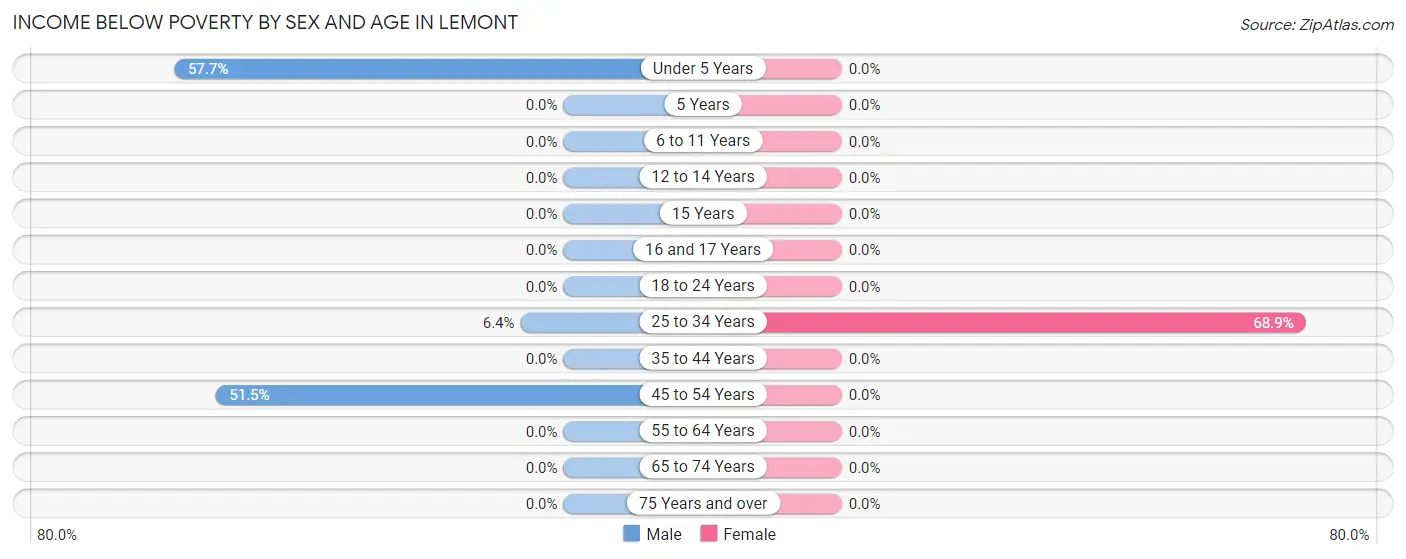
| Age Bracket | Male | Female |
| Under 5 Years | 64 (57.7%) | 0 (0.0%) |
| 5 Years | 0 (0.0%) | 0 (0.0%) |
| 6 to 11 Years | 0 (0.0%) | 0 (0.0%) |
| 12 to 14 Years | 0 (0.0%) | 0 (0.0%) |
| 15 Years | 0 (0.0%) | 0 (0.0%) |
| 16 and 17 Years | 0 (0.0%) | 0 (0.0%) |
| 18 to 24 Years | 0 (0.0%) | 0 (0.0%) |
| 25 to 34 Years | 18 (6.4%) | 42 (68.9%) |
| 35 to 44 Years | 0 (0.0%) | 0 (0.0%) |
| 45 to 54 Years | 51 (51.5%) | 0 (0.0%) |
| 55 to 64 Years | 0 (0.0%) | 0 (0.0%) |
| 65 to 74 Years | 0 (0.0%) | 0 (0.0%) |
| 75 Years and over | 0 (0.0%) | 0 (0.0%) |
| Total | 133 (11.4%) | 42 (4.8%) |
Income Above Poverty by Sex and Age in Lemont
According to the poverty statistics in Lemont, males aged 6 to 11 years and females aged under 5 years are the age groups that are most secure financially, with 100.0% of males and 100.0% of females in these age groups living above the poverty line.
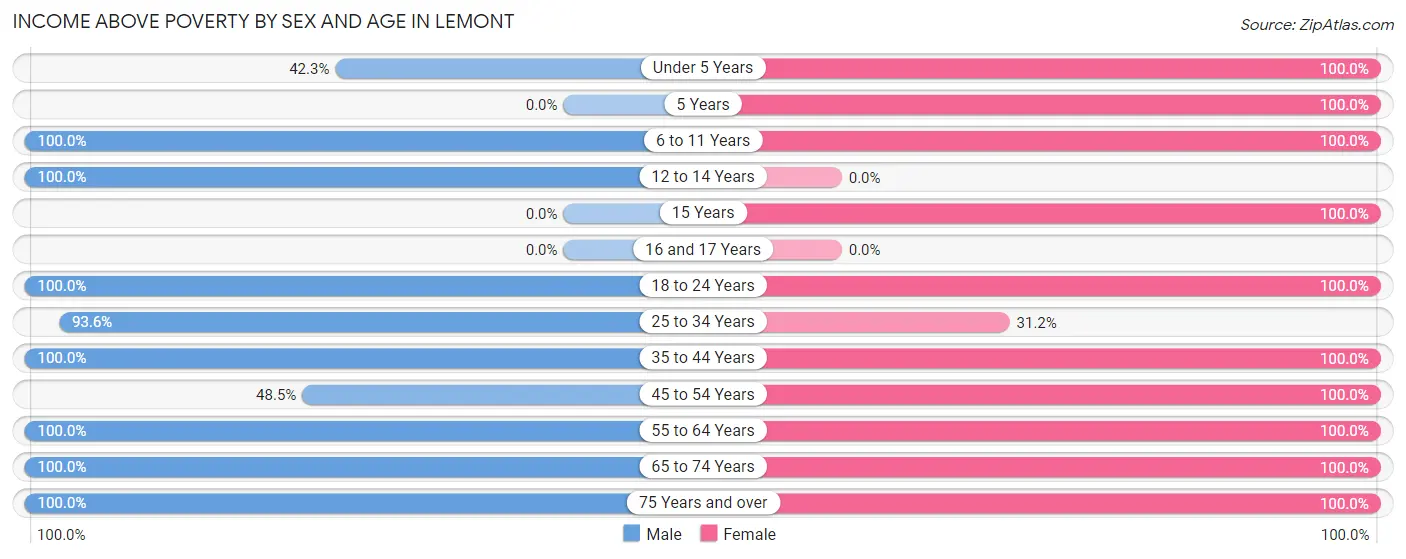
| Age Bracket | Male | Female |
| Under 5 Years | 47 (42.3%) | 16 (100.0%) |
| 5 Years | 0 (0.0%) | 42 (100.0%) |
| 6 to 11 Years | 17 (100.0%) | 53 (100.0%) |
| 12 to 14 Years | 16 (100.0%) | 0 (0.0%) |
| 15 Years | 0 (0.0%) | 28 (100.0%) |
| 16 and 17 Years | 0 (0.0%) | 0 (0.0%) |
| 18 to 24 Years | 51 (100.0%) | 10 (100.0%) |
| 25 to 34 Years | 264 (93.6%) | 19 (31.1%) |
| 35 to 44 Years | 179 (100.0%) | 233 (100.0%) |
| 45 to 54 Years | 48 (48.5%) | 80 (100.0%) |
| 55 to 64 Years | 228 (100.0%) | 144 (100.0%) |
| 65 to 74 Years | 120 (100.0%) | 116 (100.0%) |
| 75 Years and over | 60 (100.0%) | 96 (100.0%) |
| Total | 1,030 (88.6%) | 837 (95.2%) |
Income Below Poverty Among Married-Couple Families in Lemont
The poverty statistics for married-couple families in Lemont show that 3.6% or 16 of the total 442 families live below the poverty line. Families with 1 or 2 children have the highest poverty rate of 10.1%, comprising of 16 families. On the other hand, families with no children have the lowest poverty rate of 0.0%, which includes 0 families.
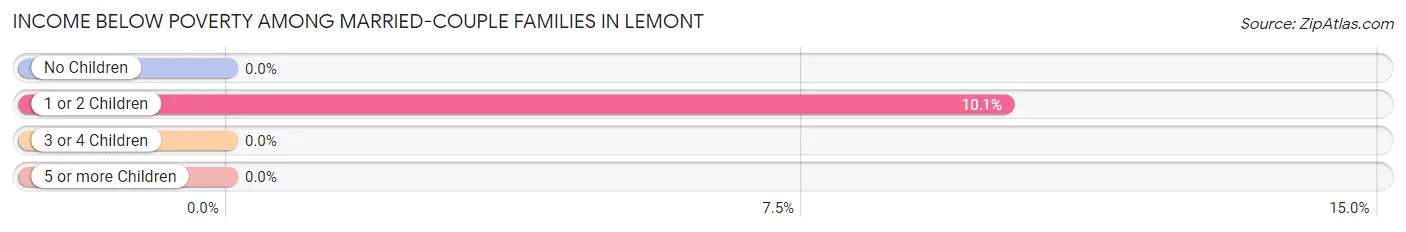
| Children | Above Poverty | Below Poverty |
| No Children | 284 (100.0%) | 0 (0.0%) |
| 1 or 2 Children | 142 (89.9%) | 16 (10.1%) |
| 3 or 4 Children | 0 (0.0%) | 0 (0.0%) |
| 5 or more Children | 0 (0.0%) | 0 (0.0%) |
| Total | 426 (96.4%) | 16 (3.6%) |
Income Below Poverty Among Single-Parent Households in Lemont
| Children | Single Father | Single Mother |
| No Children | 0 (0.0%) | 0 (0.0%) |
| 1 or 2 Children | 0 (0.0%) | 0 (0.0%) |
| 3 or 4 Children | 0 (0.0%) | 0 (0.0%) |
| 5 or more Children | 0 (0.0%) | 0 (0.0%) |
| Total | 0 (0.0%) | 0 (0.0%) |
Income Below Poverty Among Married-Couple vs Single-Parent Households in Lemont
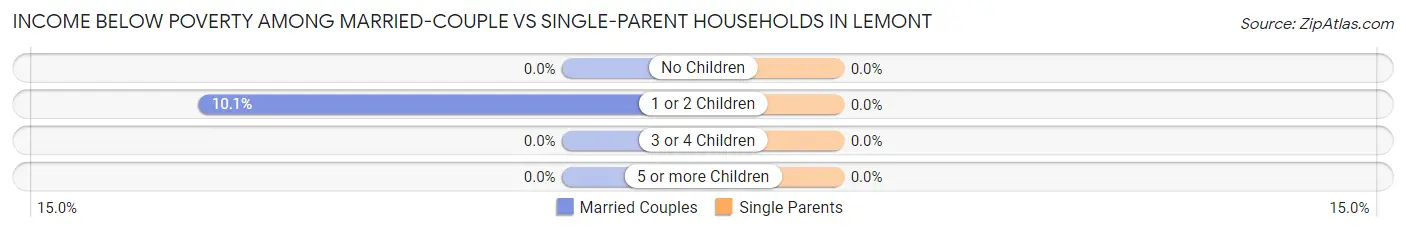
| Children | Married-Couple Families | Single-Parent Households |
| No Children | 0 (0.0%) | 0 (0.0%) |
| 1 or 2 Children | 16 (10.1%) | 0 (0.0%) |
| 3 or 4 Children | 0 (0.0%) | 0 (0.0%) |
| 5 or more Children | 0 (0.0%) | 0 (0.0%) |
| Total | 16 (3.6%) | 0 (0.0%) |
Race in Lemont
The most populous races in Lemont are White / Caucasian (1,820 | 87.3%), Two or more Races (230 | 11.0%), and Hispanic or Latino (146 | 7.0%).
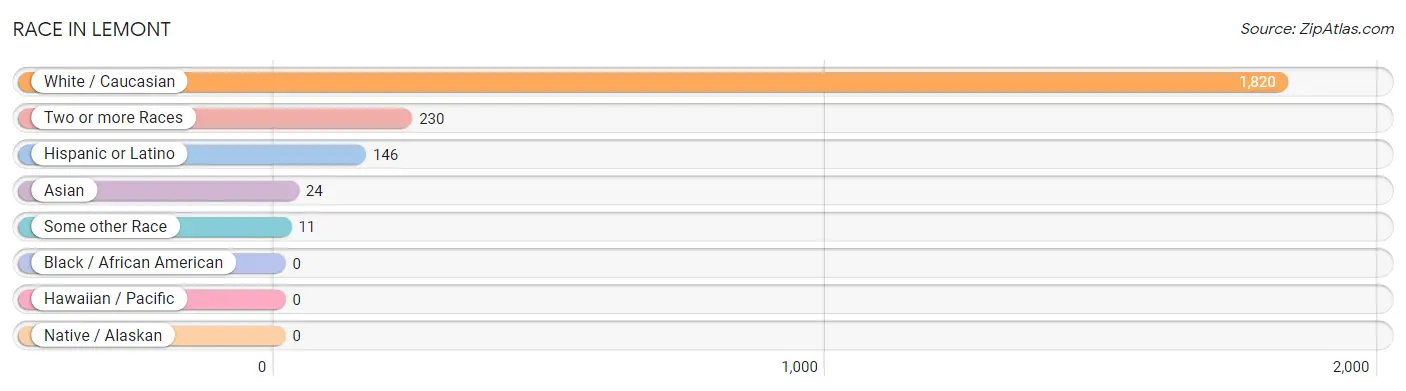
| Race | # Population | % Population |
| Asian | 24 | 1.1% |
| Black / African American | 0 | 0.0% |
| Hawaiian / Pacific | 0 | 0.0% |
| Hispanic or Latino | 146 | 7.0% |
| Native / Alaskan | 0 | 0.0% |
| White / Caucasian | 1,820 | 87.3% |
| Two or more Races | 230 | 11.0% |
| Some other Race | 11 | 0.5% |
| Total | 2,085 | 100.0% |
Ancestry in Lemont
The most populous ancestries reported in Lemont are German (640 | 30.7%), Italian (396 | 19.0%), Irish (258 | 12.4%), English (155 | 7.4%), and Polish (99 | 4.8%), together accounting for 74.2% of all Lemont residents.
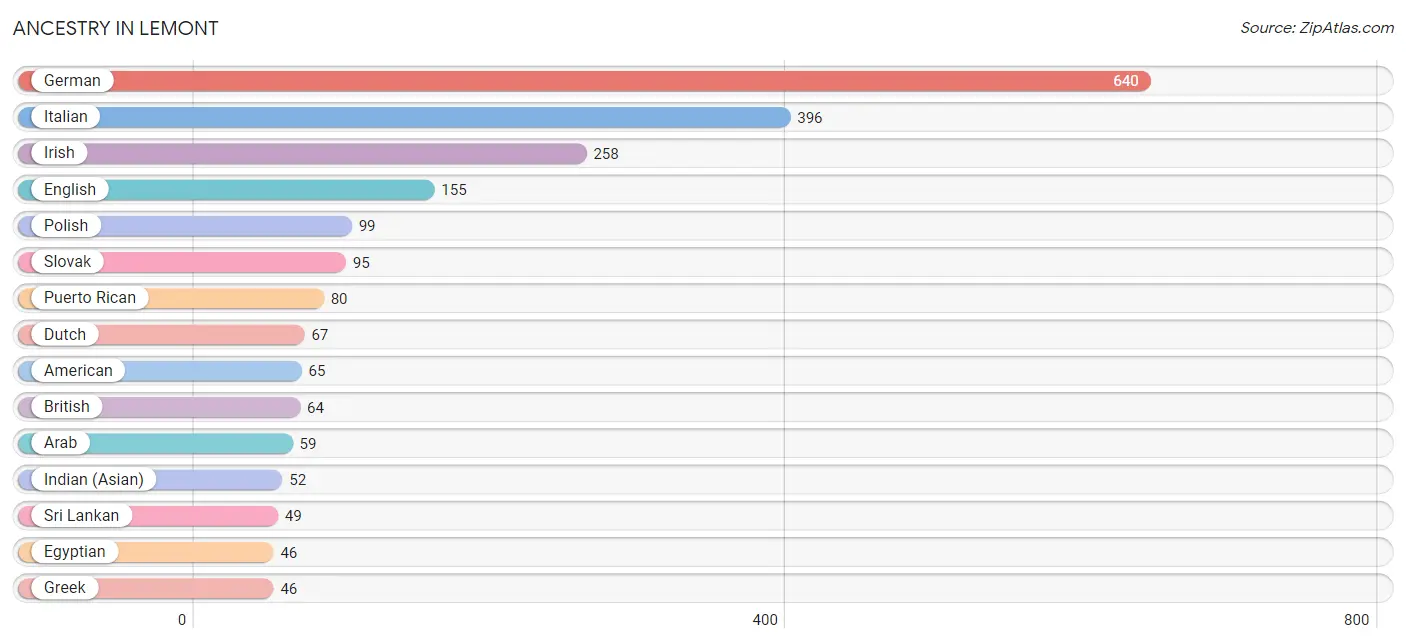
| Ancestry | # Population | % Population |
| American | 65 | 3.1% |
| Arab | 59 | 2.8% |
| British | 64 | 3.1% |
| Central American | 44 | 2.1% |
| Czech | 20 | 1.0% |
| Dutch | 67 | 3.2% |
| Eastern European | 12 | 0.6% |
| Egyptian | 46 | 2.2% |
| English | 155 | 7.4% |
| European | 20 | 1.0% |
| French | 31 | 1.5% |
| German | 640 | 30.7% |
| Greek | 46 | 2.2% |
| Indian (Asian) | 52 | 2.5% |
| Irish | 258 | 12.4% |
| Italian | 396 | 19.0% |
| Lithuanian | 11 | 0.5% |
| Nicaraguan | 13 | 0.6% |
| Peruvian | 22 | 1.1% |
| Polish | 99 | 4.8% |
| Portuguese | 18 | 0.9% |
| Puerto Rican | 80 | 3.8% |
| Salvadoran | 31 | 1.5% |
| Scotch-Irish | 13 | 0.6% |
| Slovak | 95 | 4.6% |
| South American | 22 | 1.1% |
| Sri Lankan | 49 | 2.4% |
| Swedish | 20 | 1.0% |
| Syrian | 13 | 0.6% |
| Welsh | 23 | 1.1% | View All 30 Rows |
Immigrants in Lemont
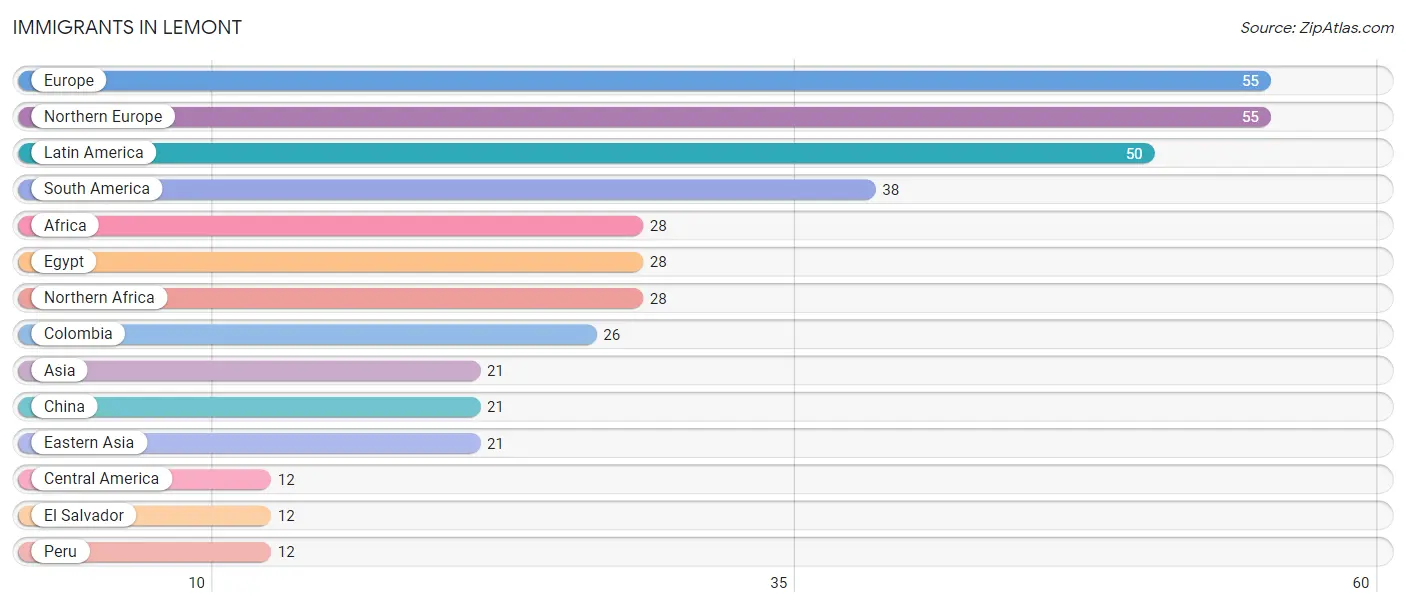
The most numerous immigrant groups reported in Lemont came from Europe (55 | 2.6%), Northern Europe (55 | 2.6%), Latin America (50 | 2.4%), South America (38 | 1.8%), and Africa (28 | 1.3%), together accounting for 10.8% of all Lemont residents.
| Immigration Origin | # Population | % Population |
| Africa | 28 | 1.3% |
| Asia | 21 | 1.0% |
| Central America | 12 | 0.6% |
| China | 21 | 1.0% |
| Colombia | 26 | 1.3% |
| Eastern Asia | 21 | 1.0% |
| Egypt | 28 | 1.3% |
| El Salvador | 12 | 0.6% |
| Europe | 55 | 2.6% |
| Latin America | 50 | 2.4% |
| Northern Africa | 28 | 1.3% |
| Northern Europe | 55 | 2.6% |
| Peru | 12 | 0.6% |
| South America | 38 | 1.8% | View All 14 Rows |
Sex and Age in Lemont
Sex and Age in Lemont
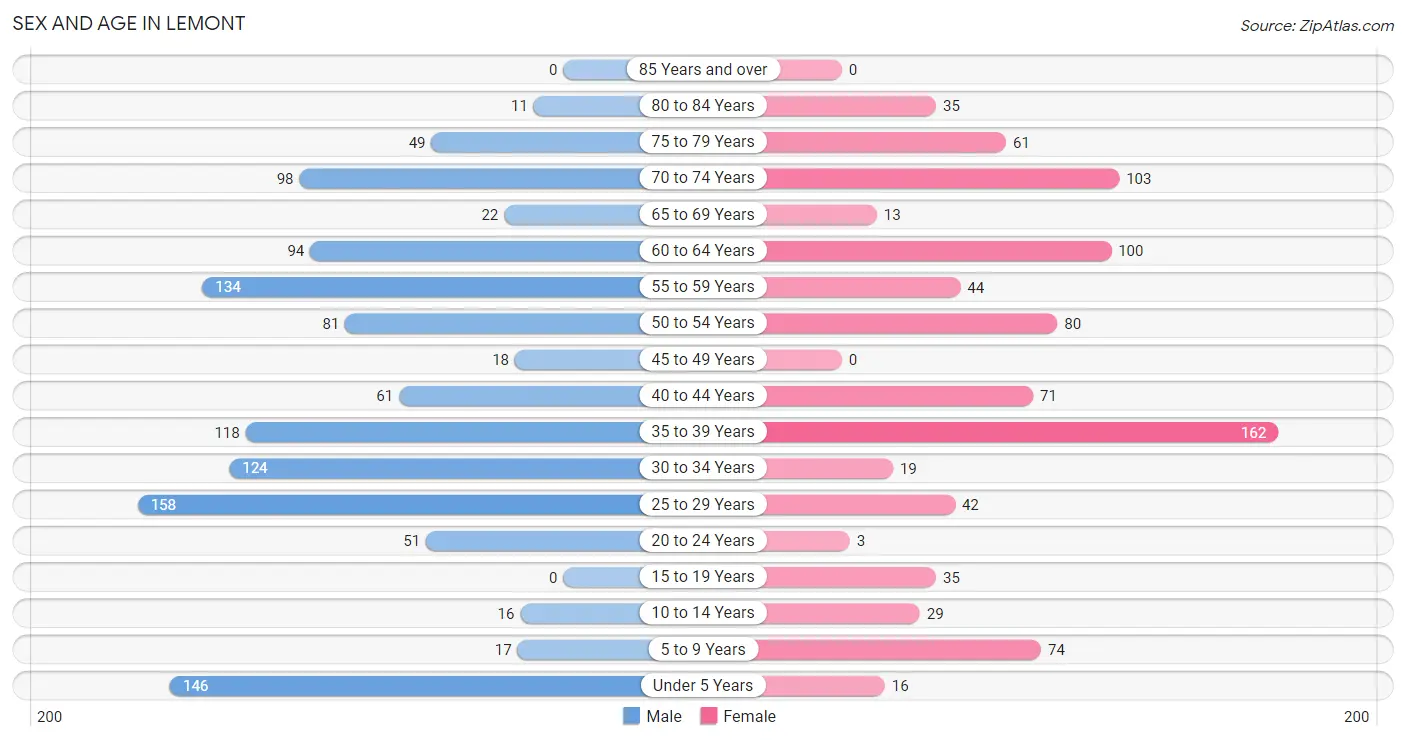
The most populous age groups in Lemont are 25 to 29 Years (158 | 13.2%) for men and 35 to 39 Years (162 | 18.3%) for women.
| Age Bracket | Male | Female |
| Under 5 Years | 146 (12.2%) | 16 (1.8%) |
| 5 to 9 Years | 17 (1.4%) | 74 (8.3%) |
| 10 to 14 Years | 16 (1.3%) | 29 (3.3%) |
| 15 to 19 Years | 0 (0.0%) | 35 (4.0%) |
| 20 to 24 Years | 51 (4.3%) | 3 (0.3%) |
| 25 to 29 Years | 158 (13.2%) | 42 (4.7%) |
| 30 to 34 Years | 124 (10.3%) | 19 (2.1%) |
| 35 to 39 Years | 118 (9.9%) | 162 (18.3%) |
| 40 to 44 Years | 61 (5.1%) | 71 (8.0%) |
| 45 to 49 Years | 18 (1.5%) | 0 (0.0%) |
| 50 to 54 Years | 81 (6.8%) | 80 (9.0%) |
| 55 to 59 Years | 134 (11.2%) | 44 (5.0%) |
| 60 to 64 Years | 94 (7.9%) | 100 (11.3%) |
| 65 to 69 Years | 22 (1.8%) | 13 (1.5%) |
| 70 to 74 Years | 98 (8.2%) | 103 (11.6%) |
| 75 to 79 Years | 49 (4.1%) | 61 (6.9%) |
| 80 to 84 Years | 11 (0.9%) | 35 (4.0%) |
| 85 Years and over | 0 (0.0%) | 0 (0.0%) |
| Total | 1,198 (100.0%) | 887 (100.0%) |
Families and Households in Lemont
Median Family Size in Lemont
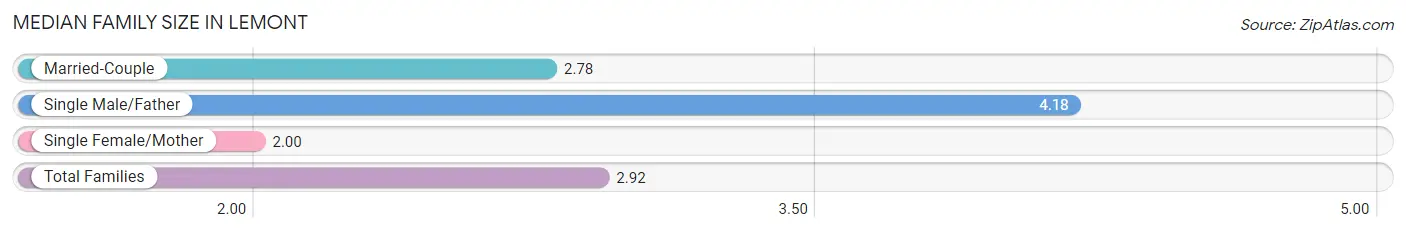
The median family size in Lemont is 2.92 persons per family, with single male/father families (66 | 12.5%) accounting for the largest median family size of 4.18 persons per family. On the other hand, single female/mother families (20 | 3.8%) represent the smallest median family size with 2.00 persons per family.
| Family Type | # Families | Family Size |
| Married-Couple | 442 (83.7%) | 2.78 |
| Single Male/Father | 66 (12.5%) | 4.18 |
| Single Female/Mother | 20 (3.8%) | 2.00 |
| Total Families | 528 (100.0%) | 2.92 |
Median Household Size in Lemont
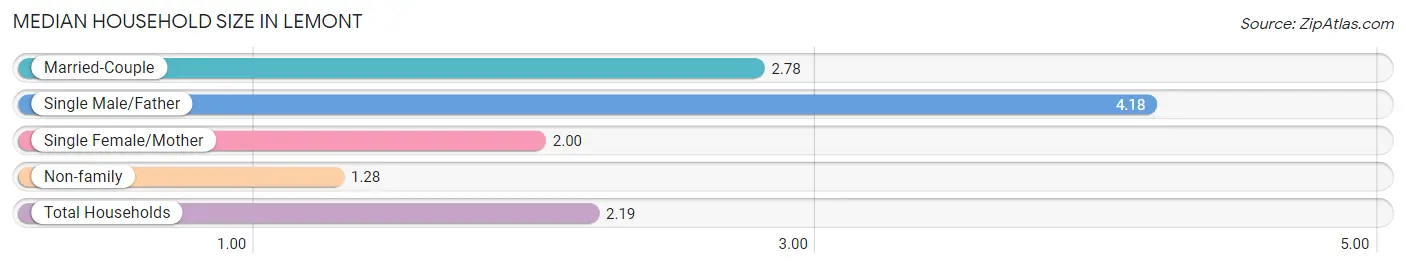
The median household size in Lemont is 2.19 persons per household, with single male/father households (66 | 6.9%) accounting for the largest median household size of 4.18 persons per household. non-family households (423 | 44.5%) represent the smallest median household size with 1.28 persons per household.
| Household Type | # Households | Household Size |
| Married-Couple | 442 (46.5%) | 2.78 |
| Single Male/Father | 66 (6.9%) | 4.18 |
| Single Female/Mother | 20 (2.1%) | 2.00 |
| Non-family | 423 (44.5%) | 1.28 |
| Total Households | 951 (100.0%) | 2.19 |
Household Size by Marriage Status in Lemont
Out of a total of 951 households in Lemont, 528 (55.5%) are family households, while 423 (44.5%) are nonfamily households. The most numerous type of family households are 2-person households, comprising 258, and the most common type of nonfamily households are 1-person households, comprising 375.
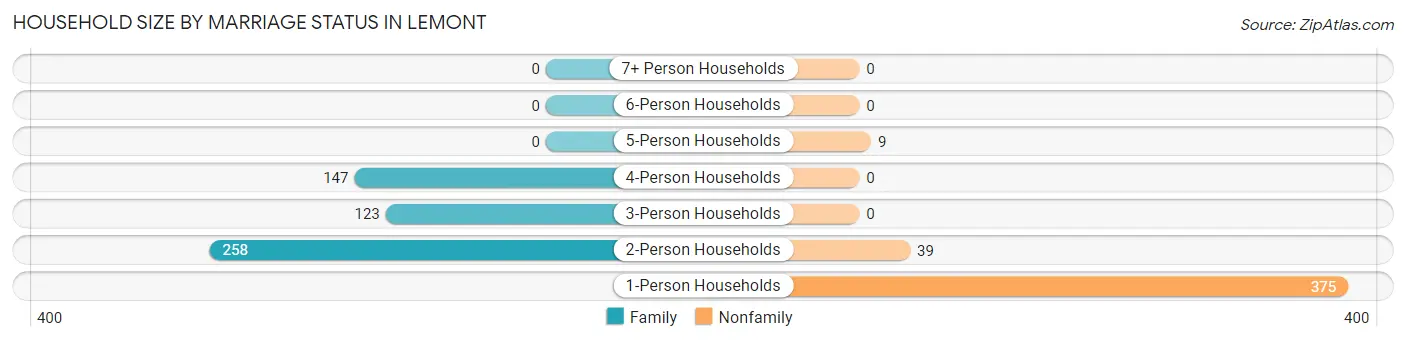
| Household Size | Family Households | Nonfamily Households |
| 1-Person Households | - | 375 (39.4%) |
| 2-Person Households | 258 (27.1%) | 39 (4.1%) |
| 3-Person Households | 123 (12.9%) | 0 (0.0%) |
| 4-Person Households | 147 (15.5%) | 0 (0.0%) |
| 5-Person Households | 0 (0.0%) | 9 (0.9%) |
| 6-Person Households | 0 (0.0%) | 0 (0.0%) |
| 7+ Person Households | 0 (0.0%) | 0 (0.0%) |
| Total | 528 (55.5%) | 423 (44.5%) |
Female Fertility in Lemont
Fertility by Age in Lemont
| Age Bracket | Women with Births | Births / 1,000 Women |
| 15 to 19 years | 0 (0.0%) | 0.0 |
| 20 to 34 years | 0 (0.0%) | 0.0 |
| 35 to 50 years | 0 (0.0%) | 0.0 |
| Total | 0 (0.0%) | 0.0 |
Fertility by Age by Marriage Status in Lemont
| Age Bracket | Married | Unmarried |
| 15 to 19 years | 0 (0.0%) | 0 (0.0%) |
| 20 to 34 years | 0 (0.0%) | 0 (0.0%) |
| 35 to 50 years | 0 (0.0%) | 0 (0.0%) |
| Total | 0 (0.0%) | 0 (0.0%) |
Fertility by Education in Lemont
| Educational Attainment | Women with Births | Births / 1,000 Women |
| Less than High School | 0 (0.0%) | 0.0 |
| High School Diploma | 0 (0.0%) | 0.0 |
| College or Associate's Degree | 0 (0.0%) | 0.0 |
| Bachelor's Degree | 0 (0.0%) | 0.0 |
| Graduate Degree | 0 (0.0%) | 0.0 |
| Total | 0 (0.0%) | 0.0 |
Fertility by Education by Marriage Status in Lemont
| Educational Attainment | Married | Unmarried |
| Less than High School | 0 (0.0%) | 0 (0.0%) |
| High School Diploma | 0 (0.0%) | 0 (0.0%) |
| College or Associate's Degree | 0 (0.0%) | 0 (0.0%) |
| Bachelor's Degree | 0 (0.0%) | 0 (0.0%) |
| Graduate Degree | 0 (0.0%) | 0 (0.0%) |
| Total | 0 (0.0%) | 0 (0.0%) |
Employment Characteristics in Lemont
Employment by Class of Employer in Lemont
Among the 857 employed individuals in Lemont, private company employees (435 | 50.8%), state government employees (237 | 27.7%), and local government employees (69 | 8.1%) make up the most common classes of employment.
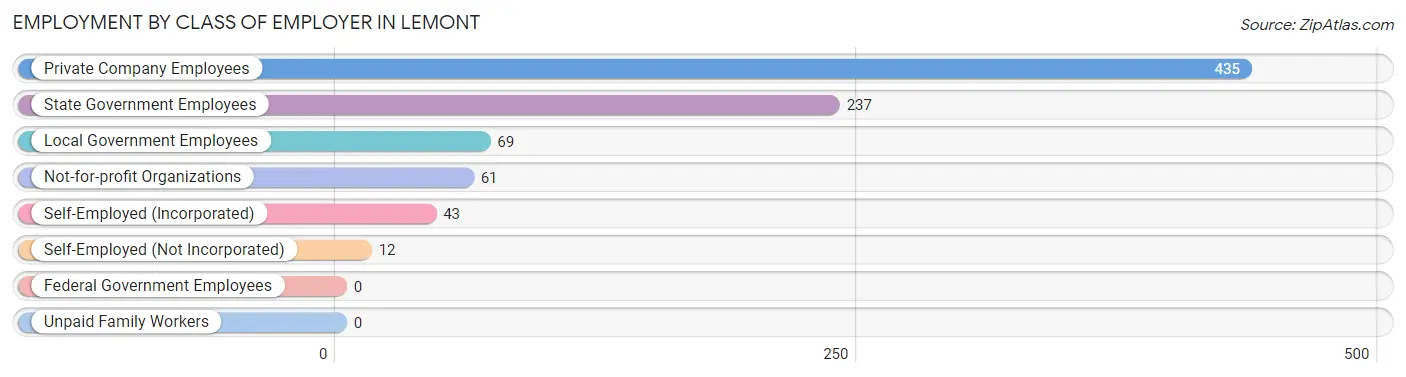
| Employer Class | # Employees | % Employees |
| Private Company Employees | 435 | 50.8% |
| Self-Employed (Incorporated) | 43 | 5.0% |
| Self-Employed (Not Incorporated) | 12 | 1.4% |
| Not-for-profit Organizations | 61 | 7.1% |
| Local Government Employees | 69 | 8.1% |
| State Government Employees | 237 | 27.7% |
| Federal Government Employees | 0 | 0.0% |
| Unpaid Family Workers | 0 | 0.0% |
| Total | 857 | 100.0% |
Employment Status by Age in Lemont
According to the labor force statistics for Lemont, out of the total population over 16 years of age (1,759), 55.9% or 983 individuals are in the labor force, with 8.9% or 87 of them unemployed. The age group with the highest labor force participation rate is 35 to 44 years, with 100.0% or 412 individuals in the labor force. Within the labor force, the 25 to 29 years age range has the highest percentage of unemployed individuals, with 44.2% or 23 of them being unemployed.
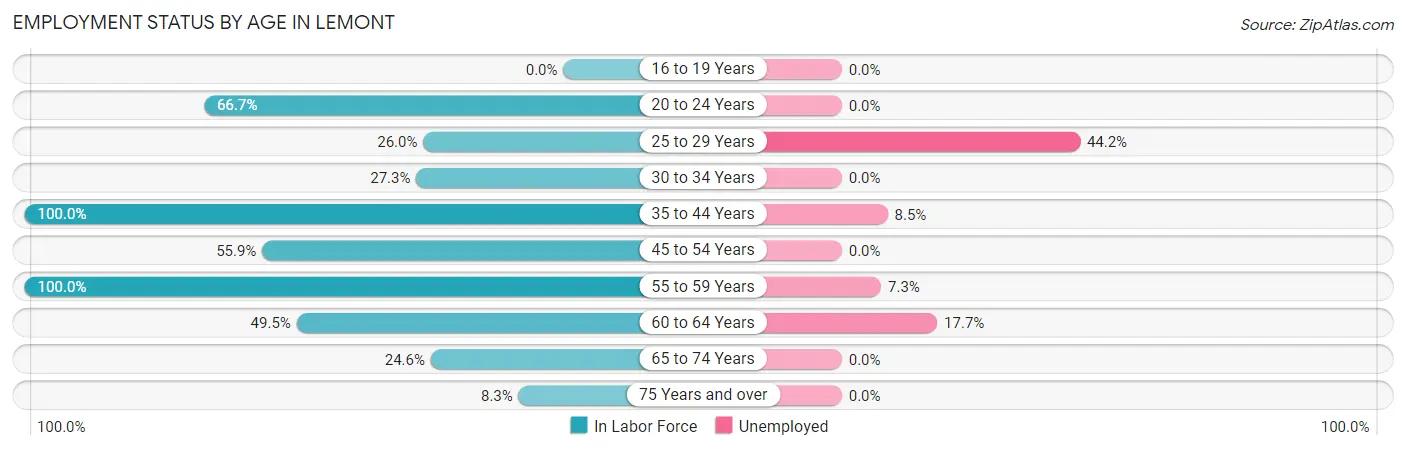
| Age Bracket | In Labor Force | Unemployed |
| 16 to 19 Years | 0 (0.0%) | 0 (0.0%) |
| 20 to 24 Years | 36 (66.7%) | 0 (0.0%) |
| 25 to 29 Years | 52 (26.0%) | 23 (44.2%) |
| 30 to 34 Years | 39 (27.3%) | 0 (0.0%) |
| 35 to 44 Years | 412 (100.0%) | 35 (8.5%) |
| 45 to 54 Years | 100 (55.9%) | 0 (0.0%) |
| 55 to 59 Years | 178 (100.0%) | 13 (7.3%) |
| 60 to 64 Years | 96 (49.5%) | 17 (17.7%) |
| 65 to 74 Years | 58 (24.6%) | 0 (0.0%) |
| 75 Years and over | 13 (8.3%) | 0 (0.0%) |
| Total | 983 (55.9%) | 87 (8.9%) |
Employment Status by Educational Attainment in Lemont
According to labor force statistics for Lemont, 67.2% of individuals (878) out of the total population between 25 and 64 years of age (1,306) are in the labor force, with 10.0% or 88 of them being unemployed. The group with the highest labor force participation rate are those with the educational attainment of less than high school, with 100.0% or 26 individuals in the labor force. Within the labor force, individuals with bachelor's degree or higher education have the highest percentage of unemployment, with 14.5% or 88 of them being unemployed.
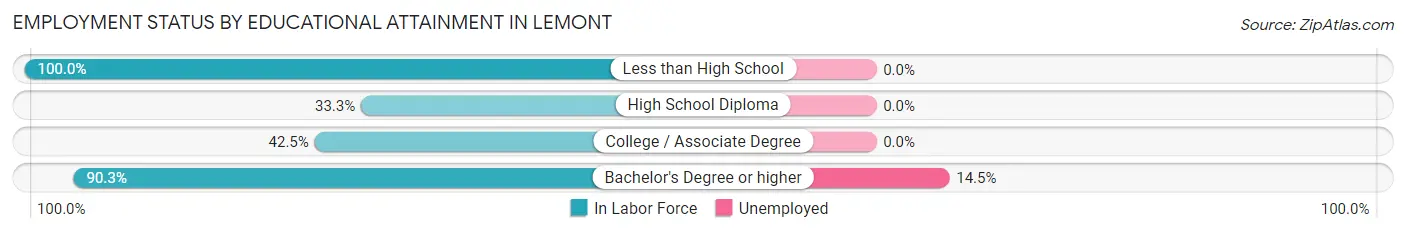
| Educational Attainment | In Labor Force | Unemployed |
| Less than High School | 26 (100.0%) | 0 (0.0%) |
| High School Diploma | 48 (33.3%) | 0 (0.0%) |
| College / Associate Degree | 198 (42.5%) | 0 (0.0%) |
| Bachelor's Degree or higher | 605 (90.3%) | 97 (14.5%) |
| Total | 878 (67.2%) | 131 (10.0%) |
Employment Occupations by Sex in Lemont
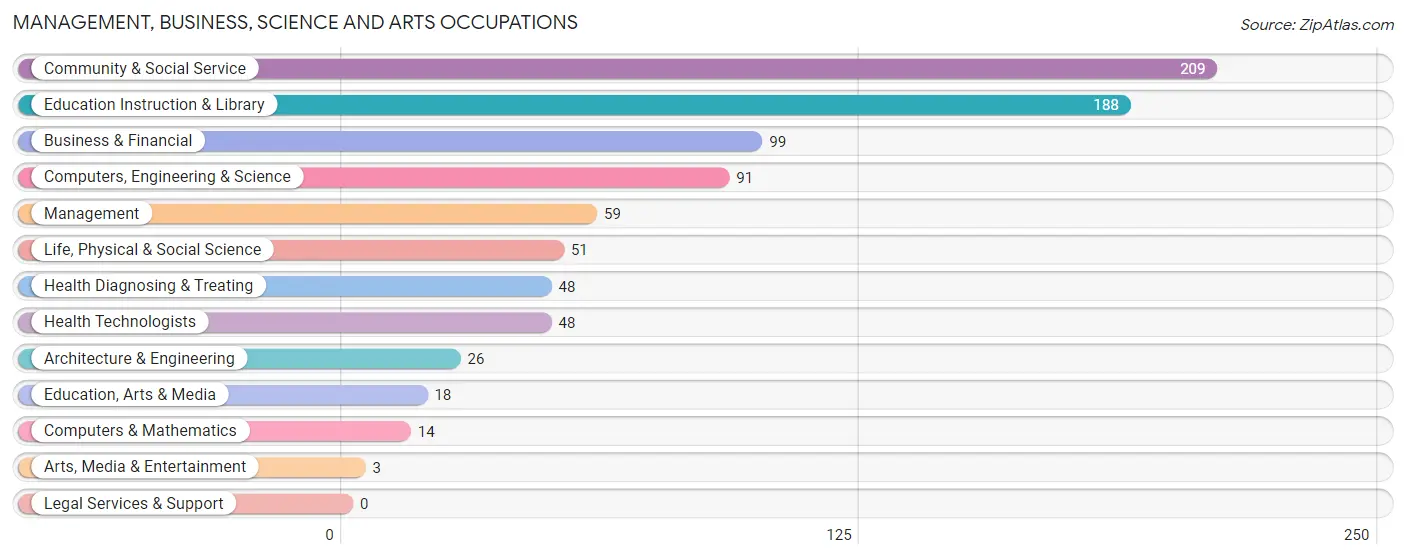
Management, Business, Science and Arts Occupations
The most common Management, Business, Science and Arts occupations in Lemont are Community & Social Service (209 | 23.3%), Education Instruction & Library (188 | 21.0%), Business & Financial (99 | 11.1%), Computers, Engineering & Science (91 | 10.2%), and Management (59 | 6.6%).
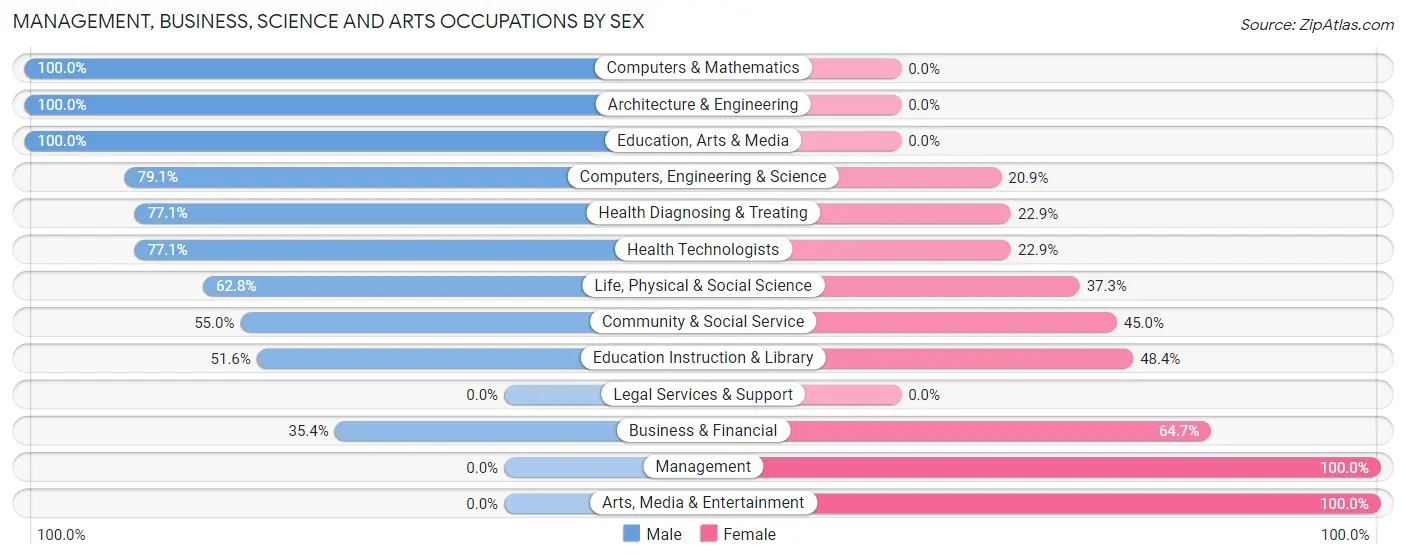
Management, Business, Science and Arts Occupations by Sex
Within the Management, Business, Science and Arts occupations in Lemont, the most male-oriented occupations are Computers & Mathematics (100.0%), Architecture & Engineering (100.0%), and Education, Arts & Media (100.0%), while the most female-oriented occupations are Management (100.0%), Arts, Media & Entertainment (100.0%), and Business & Financial (64.6%).
| Occupation | Male | Female |
| Management | 0 (0.0%) | 59 (100.0%) |
| Business & Financial | 35 (35.3%) | 64 (64.6%) |
| Computers, Engineering & Science | 72 (79.1%) | 19 (20.9%) |
| Computers & Mathematics | 14 (100.0%) | 0 (0.0%) |
| Architecture & Engineering | 26 (100.0%) | 0 (0.0%) |
| Life, Physical & Social Science | 32 (62.7%) | 19 (37.2%) |
| Community & Social Service | 115 (55.0%) | 94 (45.0%) |
| Education, Arts & Media | 18 (100.0%) | 0 (0.0%) |
| Legal Services & Support | 0 (0.0%) | 0 (0.0%) |
| Education Instruction & Library | 97 (51.6%) | 91 (48.4%) |
| Arts, Media & Entertainment | 0 (0.0%) | 3 (100.0%) |
| Health Diagnosing & Treating | 37 (77.1%) | 11 (22.9%) |
| Health Technologists | 37 (77.1%) | 11 (22.9%) |
| Total (Category) | 259 (51.2%) | 247 (48.8%) |
| Total (Overall) | 465 (51.9%) | 431 (48.1%) |
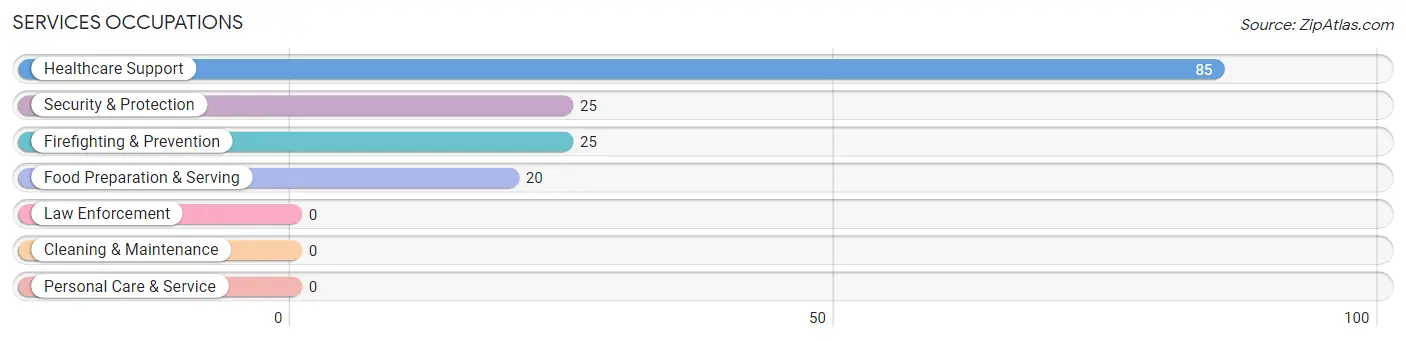
Services Occupations
The most common Services occupations in Lemont are Healthcare Support (85 | 9.5%), Security & Protection (25 | 2.8%), Firefighting & Prevention (25 | 2.8%), and Food Preparation & Serving (20 | 2.2%).
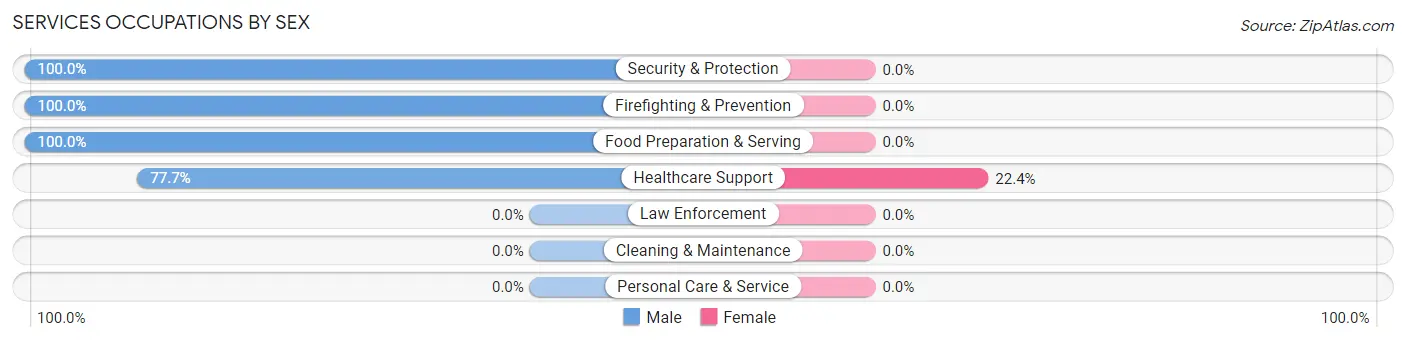
Services Occupations by Sex
| Occupation | Male | Female |
| Healthcare Support | 66 (77.6%) | 19 (22.4%) |
| Security & Protection | 25 (100.0%) | 0 (0.0%) |
| Firefighting & Prevention | 25 (100.0%) | 0 (0.0%) |
| Law Enforcement | 0 (0.0%) | 0 (0.0%) |
| Food Preparation & Serving | 20 (100.0%) | 0 (0.0%) |
| Cleaning & Maintenance | 0 (0.0%) | 0 (0.0%) |
| Personal Care & Service | 0 (0.0%) | 0 (0.0%) |
| Total (Category) | 111 (85.4%) | 19 (14.6%) |
| Total (Overall) | 465 (51.9%) | 431 (48.1%) |
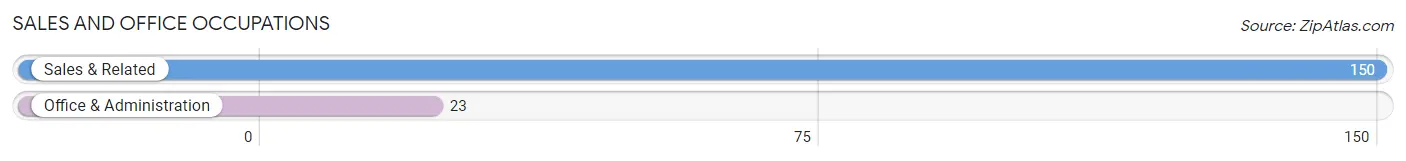
Sales and Office Occupations
The most common Sales and Office occupations in Lemont are Sales & Related (150 | 16.7%), and Office & Administration (23 | 2.6%).
Sales and Office Occupations by Sex
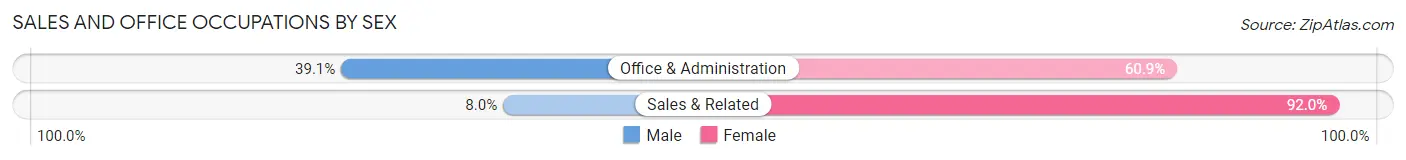
| Occupation | Male | Female |
| Sales & Related | 12 (8.0%) | 138 (92.0%) |
| Office & Administration | 9 (39.1%) | 14 (60.9%) |
| Total (Category) | 21 (12.1%) | 152 (87.9%) |
| Total (Overall) | 465 (51.9%) | 431 (48.1%) |
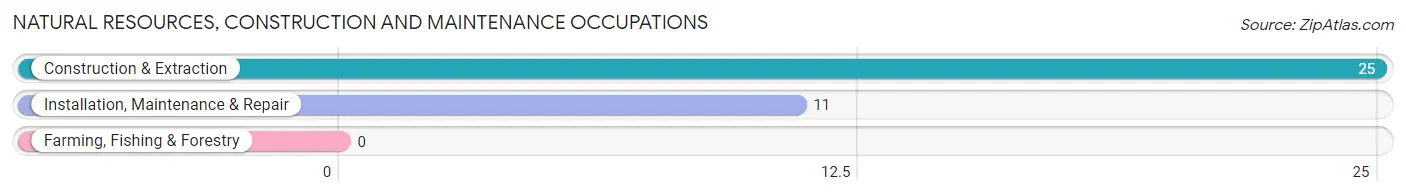
Natural Resources, Construction and Maintenance Occupations
The most common Natural Resources, Construction and Maintenance occupations in Lemont are Construction & Extraction (25 | 2.8%), and Installation, Maintenance & Repair (11 | 1.2%).
Natural Resources, Construction and Maintenance Occupations by Sex
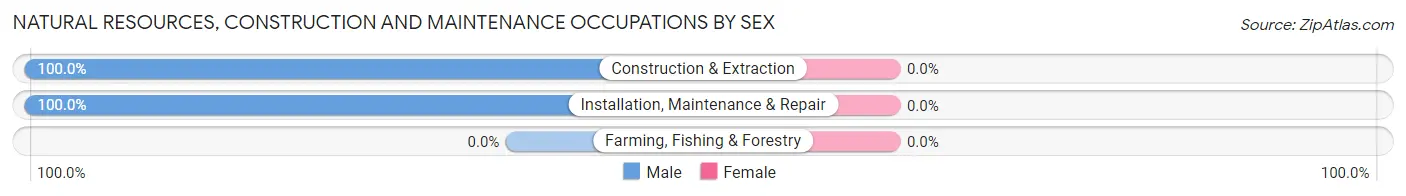
| Occupation | Male | Female |
| Farming, Fishing & Forestry | 0 (0.0%) | 0 (0.0%) |
| Construction & Extraction | 25 (100.0%) | 0 (0.0%) |
| Installation, Maintenance & Repair | 11 (100.0%) | 0 (0.0%) |
| Total (Category) | 36 (100.0%) | 0 (0.0%) |
| Total (Overall) | 465 (51.9%) | 431 (48.1%) |
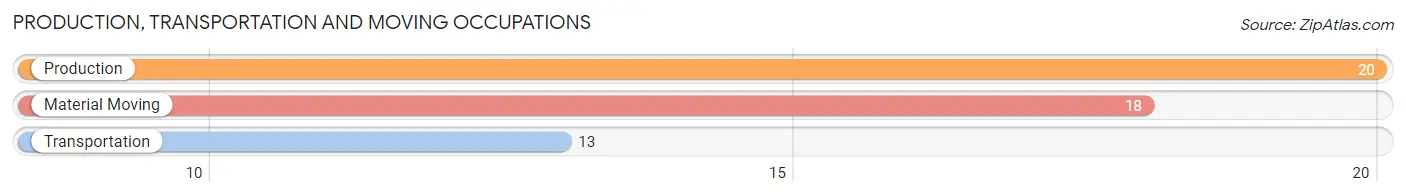
Production, Transportation and Moving Occupations
The most common Production, Transportation and Moving occupations in Lemont are Production (20 | 2.2%), Material Moving (18 | 2.0%), and Transportation (13 | 1.5%).
Production, Transportation and Moving Occupations by Sex
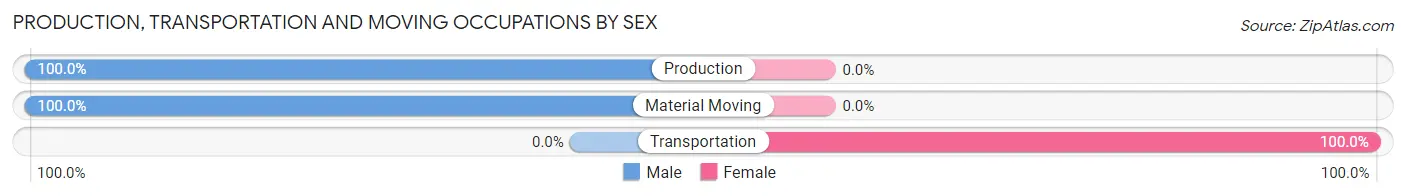
| Occupation | Male | Female |
| Production | 20 (100.0%) | 0 (0.0%) |
| Transportation | 0 (0.0%) | 13 (100.0%) |
| Material Moving | 18 (100.0%) | 0 (0.0%) |
| Total (Category) | 38 (74.5%) | 13 (25.5%) |
| Total (Overall) | 465 (51.9%) | 431 (48.1%) |
Employment Industries by Sex in Lemont
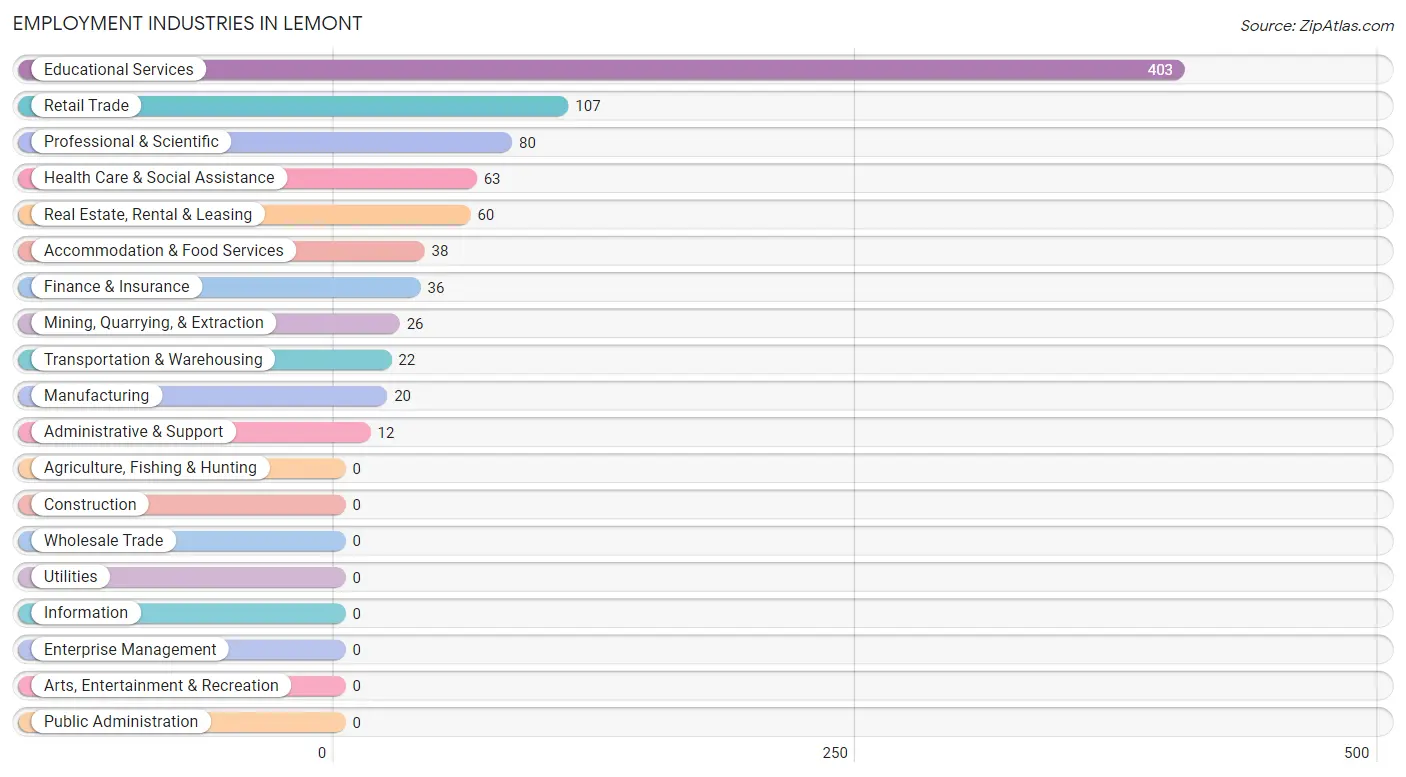
Employment Industries in Lemont
The major employment industries in Lemont include Educational Services (403 | 45.0%), Retail Trade (107 | 11.9%), Professional & Scientific (80 | 8.9%), Health Care & Social Assistance (63 | 7.0%), and Real Estate, Rental & Leasing (60 | 6.7%).
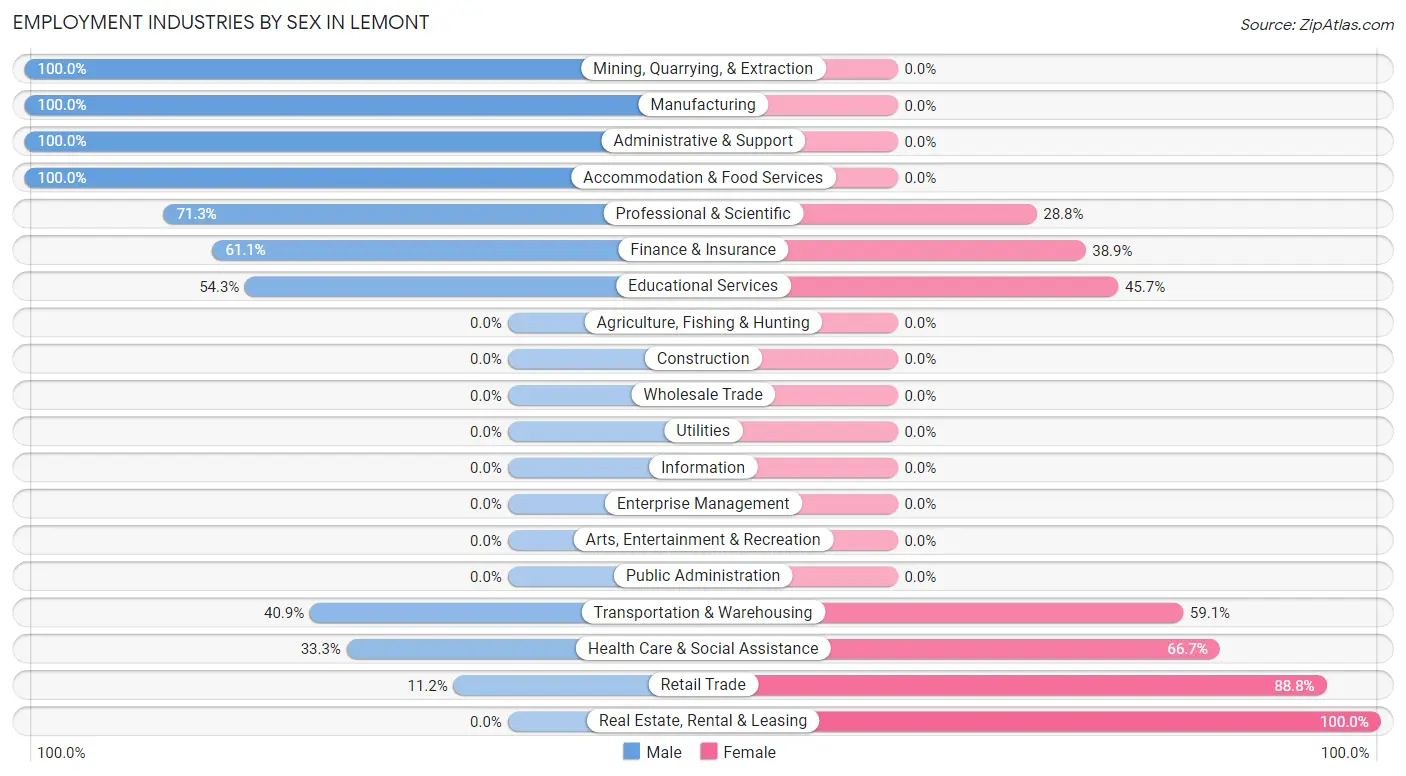
Employment Industries by Sex in Lemont
The Lemont industries that see more men than women are Mining, Quarrying, & Extraction (100.0%), Manufacturing (100.0%), and Administrative & Support (100.0%), whereas the industries that tend to have a higher number of women are Real Estate, Rental & Leasing (100.0%), Retail Trade (88.8%), and Health Care & Social Assistance (66.7%).
| Industry | Male | Female |
| Agriculture, Fishing & Hunting | 0 (0.0%) | 0 (0.0%) |
| Mining, Quarrying, & Extraction | 26 (100.0%) | 0 (0.0%) |
| Construction | 0 (0.0%) | 0 (0.0%) |
| Manufacturing | 20 (100.0%) | 0 (0.0%) |
| Wholesale Trade | 0 (0.0%) | 0 (0.0%) |
| Retail Trade | 12 (11.2%) | 95 (88.8%) |
| Transportation & Warehousing | 9 (40.9%) | 13 (59.1%) |
| Utilities | 0 (0.0%) | 0 (0.0%) |
| Information | 0 (0.0%) | 0 (0.0%) |
| Finance & Insurance | 22 (61.1%) | 14 (38.9%) |
| Real Estate, Rental & Leasing | 0 (0.0%) | 60 (100.0%) |
| Professional & Scientific | 57 (71.3%) | 23 (28.7%) |
| Enterprise Management | 0 (0.0%) | 0 (0.0%) |
| Administrative & Support | 12 (100.0%) | 0 (0.0%) |
| Educational Services | 219 (54.3%) | 184 (45.7%) |
| Health Care & Social Assistance | 21 (33.3%) | 42 (66.7%) |
| Arts, Entertainment & Recreation | 0 (0.0%) | 0 (0.0%) |
| Accommodation & Food Services | 38 (100.0%) | 0 (0.0%) |
| Public Administration | 0 (0.0%) | 0 (0.0%) |
| Total | 465 (51.9%) | 431 (48.1%) |
Education in Lemont
School Enrollment in Lemont
The most common levels of schooling among the 240 students in Lemont are elementary school (61 | 25.4%), college / undergraduate (57 | 23.7%), and graduate / professional (51 | 21.2%).
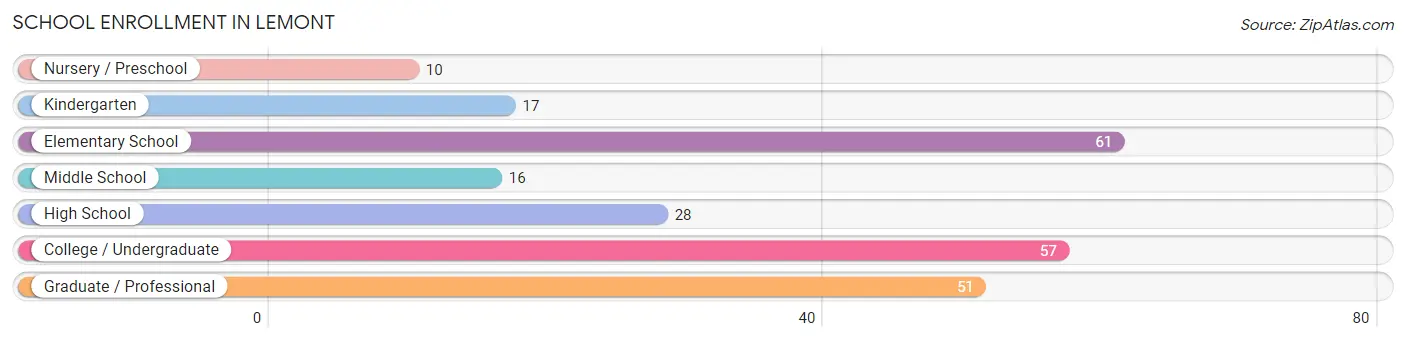
| School Level | # Students | % Students |
| Nursery / Preschool | 10 | 4.2% |
| Kindergarten | 17 | 7.1% |
| Elementary School | 61 | 25.4% |
| Middle School | 16 | 6.7% |
| High School | 28 | 11.7% |
| College / Undergraduate | 57 | 23.7% |
| Graduate / Professional | 51 | 21.2% |
| Total | 240 | 100.0% |
School Enrollment by Age by Funding Source in Lemont
Out of a total of 240 students who are enrolled in schools in Lemont, 13 (5.4%) attend a private institution, while the remaining 227 (94.6%) are enrolled in public schools. The age group of 3 to 4 year olds has the highest likelihood of being enrolled in private schools, with 10 (100.0% in the age bracket) enrolled. Conversely, the age group of 5 to 9 year old has the lowest likelihood of being enrolled in a private school, with 49 (100.0% in the age bracket) attending a public institution.
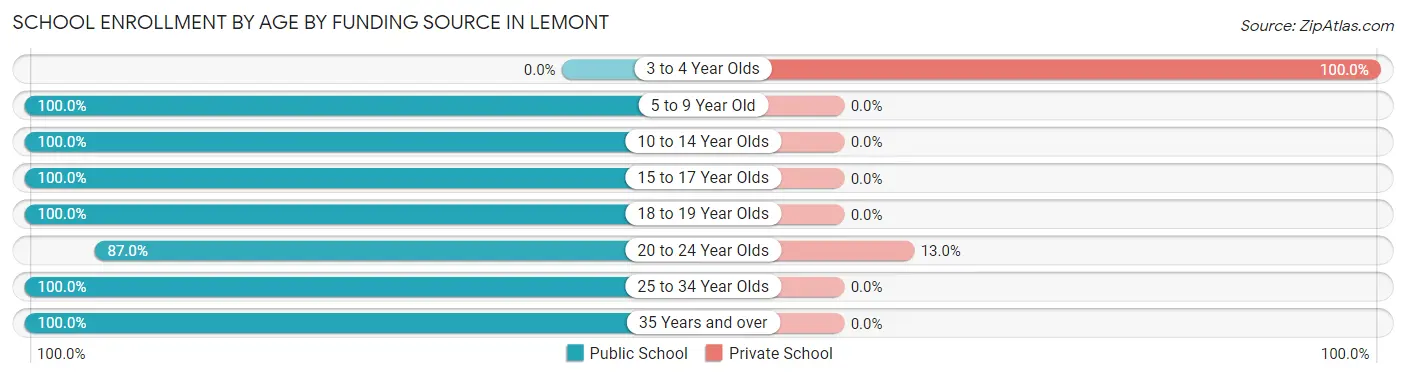
| Age Bracket | Public School | Private School |
| 3 to 4 Year Olds | 0 (0.0%) | 10 (100.0%) |
| 5 to 9 Year Old | 49 (100.0%) | 0 (0.0%) |
| 10 to 14 Year Olds | 45 (100.0%) | 0 (0.0%) |
| 15 to 17 Year Olds | 28 (100.0%) | 0 (0.0%) |
| 18 to 19 Year Olds | 7 (100.0%) | 0 (0.0%) |
| 20 to 24 Year Olds | 20 (87.0%) | 3 (13.0%) |
| 25 to 34 Year Olds | 16 (100.0%) | 0 (0.0%) |
| 35 Years and over | 62 (100.0%) | 0 (0.0%) |
| Total | 227 (94.6%) | 13 (5.4%) |
Educational Attainment by Field of Study in Lemont
Education (129 | 14.9%), science & technology (125 | 14.5%), business (115 | 13.3%), engineering (78 | 9.0%), and physical & health sciences (75 | 8.7%) are the most common fields of study among 864 individuals in Lemont who have obtained a bachelor's degree or higher.
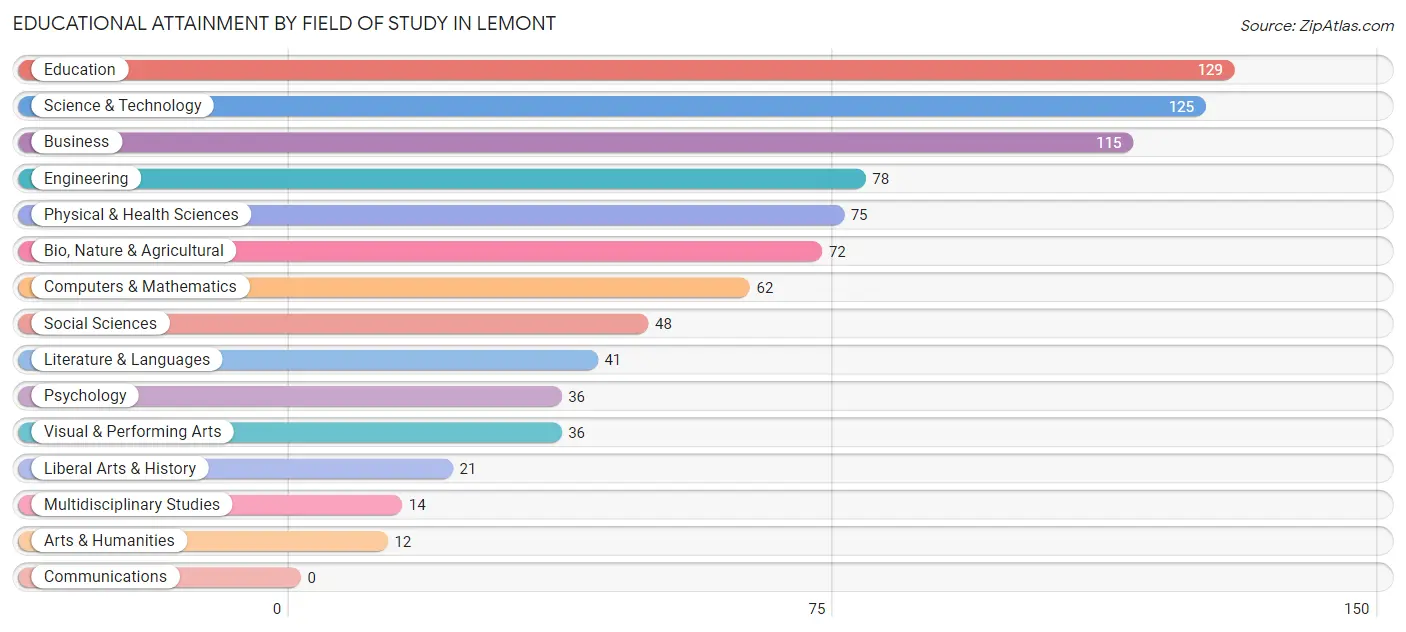
| Field of Study | # Graduates | % Graduates |
| Computers & Mathematics | 62 | 7.2% |
| Bio, Nature & Agricultural | 72 | 8.3% |
| Physical & Health Sciences | 75 | 8.7% |
| Psychology | 36 | 4.2% |
| Social Sciences | 48 | 5.6% |
| Engineering | 78 | 9.0% |
| Multidisciplinary Studies | 14 | 1.6% |
| Science & Technology | 125 | 14.5% |
| Business | 115 | 13.3% |
| Education | 129 | 14.9% |
| Literature & Languages | 41 | 4.8% |
| Liberal Arts & History | 21 | 2.4% |
| Visual & Performing Arts | 36 | 4.2% |
| Communications | 0 | 0.0% |
| Arts & Humanities | 12 | 1.4% |
| Total | 864 | 100.0% |
Transportation & Commute in Lemont
Vehicle Availability by Sex in Lemont
The most prevalent vehicle ownership categories in Lemont are males with 2 vehicles (201, accounting for 45.8%) and females with 2 vehicles (235, making up 48.1%).
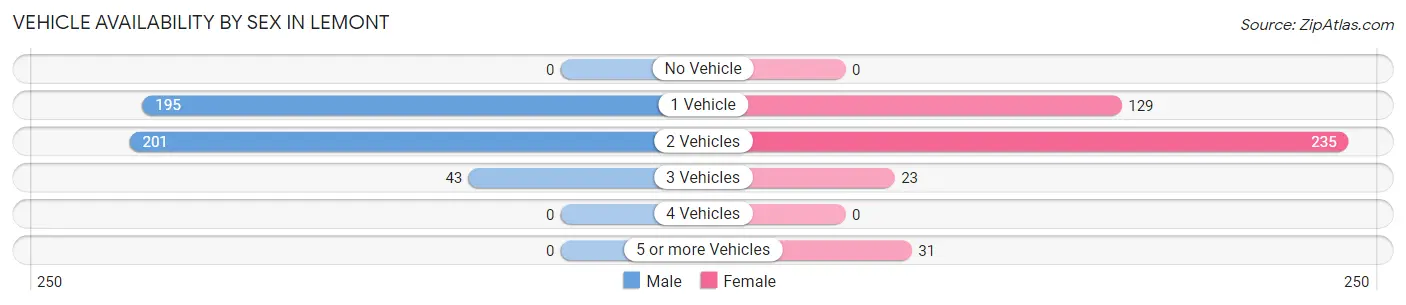
| Vehicles Available | Male | Female |
| No Vehicle | 0 (0.0%) | 0 (0.0%) |
| 1 Vehicle | 195 (44.4%) | 129 (30.9%) |
| 2 Vehicles | 201 (45.8%) | 235 (56.2%) |
| 3 Vehicles | 43 (9.8%) | 23 (5.5%) |
| 4 Vehicles | 0 (0.0%) | 0 (0.0%) |
| 5 or more Vehicles | 0 (0.0%) | 31 (7.4%) |
| Total | 439 (100.0%) | 418 (100.0%) |
Commute Time in Lemont
The most frequently occuring commute durations in Lemont are 15 to 19 minutes (181 commuters, 26.1%), 10 to 14 minutes (167 commuters, 24.1%), and 5 to 9 minutes (131 commuters, 18.9%).
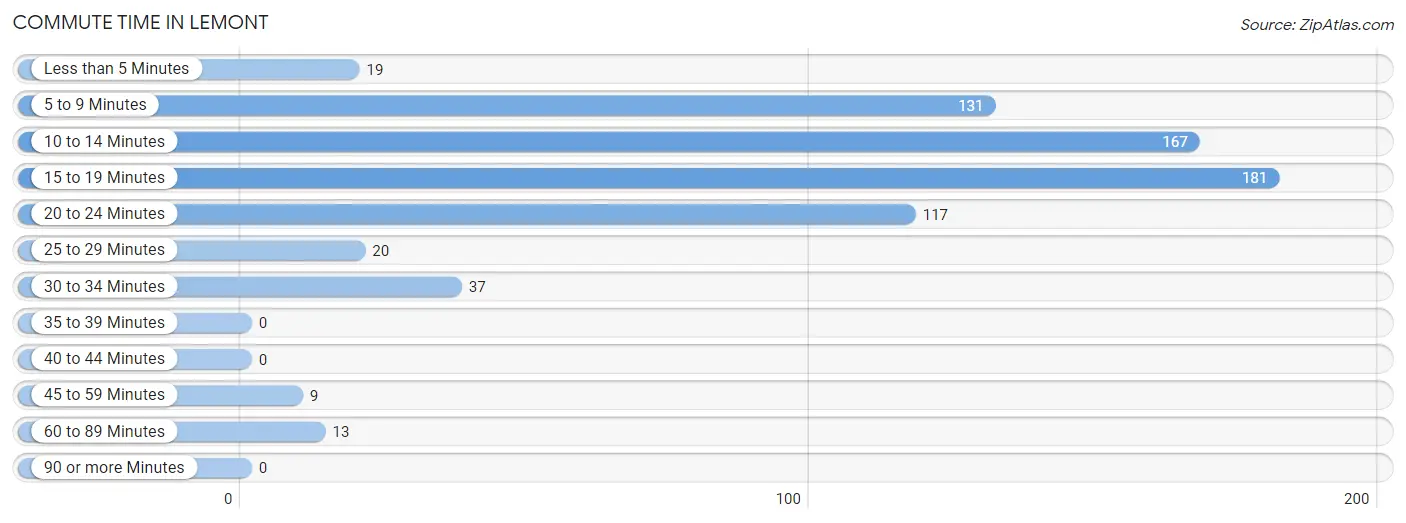
| Commute Time | # Commuters | % Commuters |
| Less than 5 Minutes | 19 | 2.7% |
| 5 to 9 Minutes | 131 | 18.9% |
| 10 to 14 Minutes | 167 | 24.1% |
| 15 to 19 Minutes | 181 | 26.1% |
| 20 to 24 Minutes | 117 | 16.9% |
| 25 to 29 Minutes | 20 | 2.9% |
| 30 to 34 Minutes | 37 | 5.3% |
| 35 to 39 Minutes | 0 | 0.0% |
| 40 to 44 Minutes | 0 | 0.0% |
| 45 to 59 Minutes | 9 | 1.3% |
| 60 to 89 Minutes | 13 | 1.9% |
| 90 or more Minutes | 0 | 0.0% |
Commute Time by Sex in Lemont
The most common commute times in Lemont are 15 to 19 minutes (83 commuters, 26.6%) for males and 10 to 14 minutes (136 commuters, 35.6%) for females.
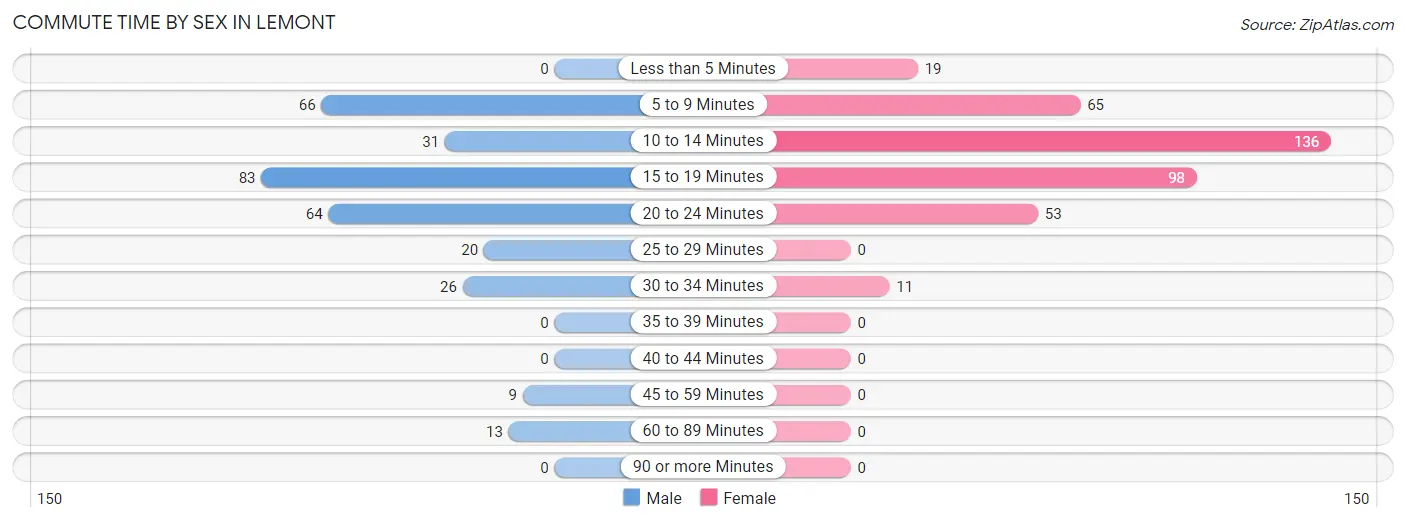
| Commute Time | Male | Female |
| Less than 5 Minutes | 0 (0.0%) | 19 (5.0%) |
| 5 to 9 Minutes | 66 (21.1%) | 65 (17.0%) |
| 10 to 14 Minutes | 31 (9.9%) | 136 (35.6%) |
| 15 to 19 Minutes | 83 (26.6%) | 98 (25.7%) |
| 20 to 24 Minutes | 64 (20.5%) | 53 (13.9%) |
| 25 to 29 Minutes | 20 (6.4%) | 0 (0.0%) |
| 30 to 34 Minutes | 26 (8.3%) | 11 (2.9%) |
| 35 to 39 Minutes | 0 (0.0%) | 0 (0.0%) |
| 40 to 44 Minutes | 0 (0.0%) | 0 (0.0%) |
| 45 to 59 Minutes | 9 (2.9%) | 0 (0.0%) |
| 60 to 89 Minutes | 13 (4.2%) | 0 (0.0%) |
| 90 or more Minutes | 0 (0.0%) | 0 (0.0%) |
Time of Departure to Work by Sex in Lemont
The most frequent times of departure to work in Lemont are 8:00 AM to 8:29 AM (117, 37.5%) for males and 8:00 AM to 8:29 AM (144, 37.7%) for females.
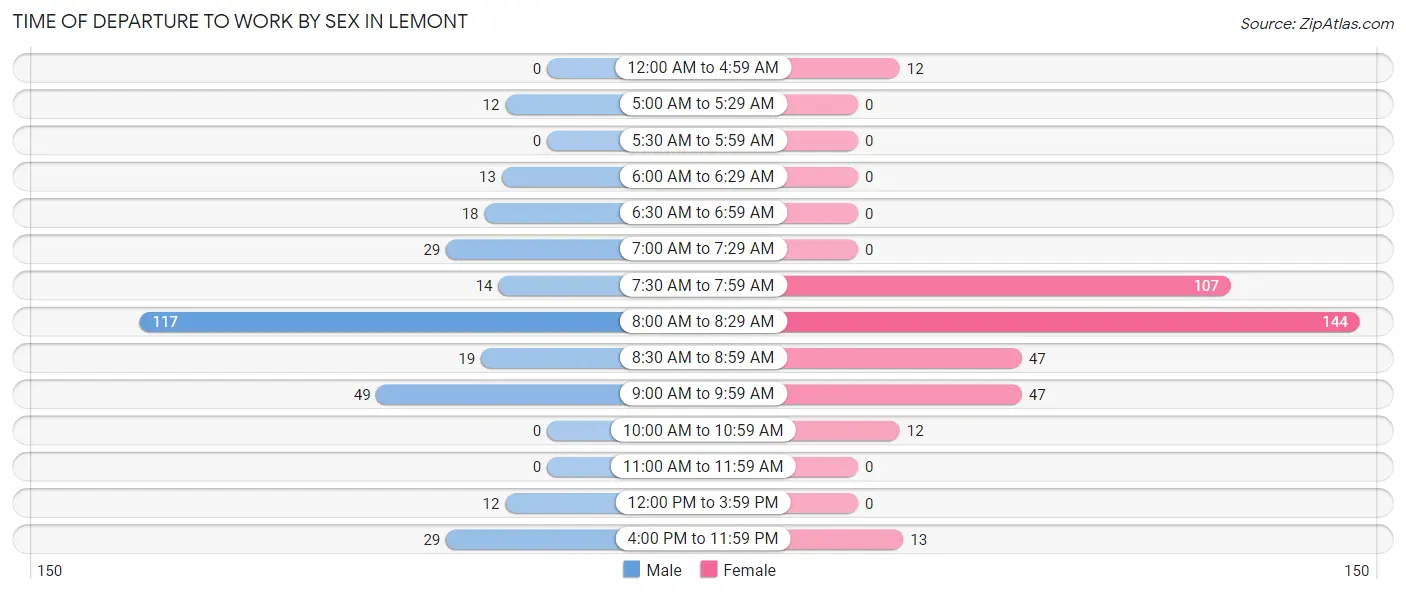
| Time of Departure | Male | Female |
| 12:00 AM to 4:59 AM | 0 (0.0%) | 12 (3.1%) |
| 5:00 AM to 5:29 AM | 12 (3.8%) | 0 (0.0%) |
| 5:30 AM to 5:59 AM | 0 (0.0%) | 0 (0.0%) |
| 6:00 AM to 6:29 AM | 13 (4.2%) | 0 (0.0%) |
| 6:30 AM to 6:59 AM | 18 (5.8%) | 0 (0.0%) |
| 7:00 AM to 7:29 AM | 29 (9.3%) | 0 (0.0%) |
| 7:30 AM to 7:59 AM | 14 (4.5%) | 107 (28.0%) |
| 8:00 AM to 8:29 AM | 117 (37.5%) | 144 (37.7%) |
| 8:30 AM to 8:59 AM | 19 (6.1%) | 47 (12.3%) |
| 9:00 AM to 9:59 AM | 49 (15.7%) | 47 (12.3%) |
| 10:00 AM to 10:59 AM | 0 (0.0%) | 12 (3.1%) |
| 11:00 AM to 11:59 AM | 0 (0.0%) | 0 (0.0%) |
| 12:00 PM to 3:59 PM | 12 (3.8%) | 0 (0.0%) |
| 4:00 PM to 11:59 PM | 29 (9.3%) | 13 (3.4%) |
| Total | 312 (100.0%) | 382 (100.0%) |
Housing Occupancy in Lemont
Occupancy by Ownership in Lemont
Of the total 951 dwellings in Lemont, owner-occupied units account for 756 (79.5%), while renter-occupied units make up 195 (20.5%).
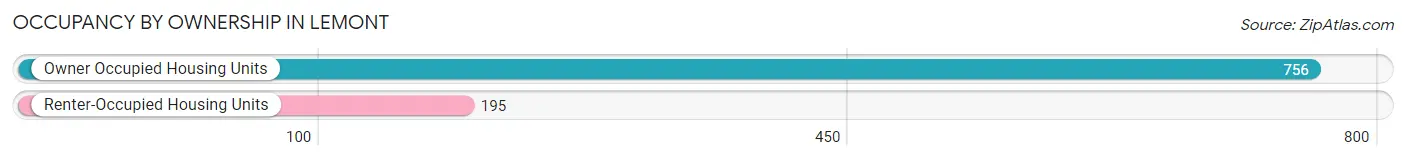
| Occupancy | # Housing Units | % Housing Units |
| Owner Occupied Housing Units | 756 | 79.5% |
| Renter-Occupied Housing Units | 195 | 20.5% |
| Total Occupied Housing Units | 951 | 100.0% |
Occupancy by Household Size in Lemont
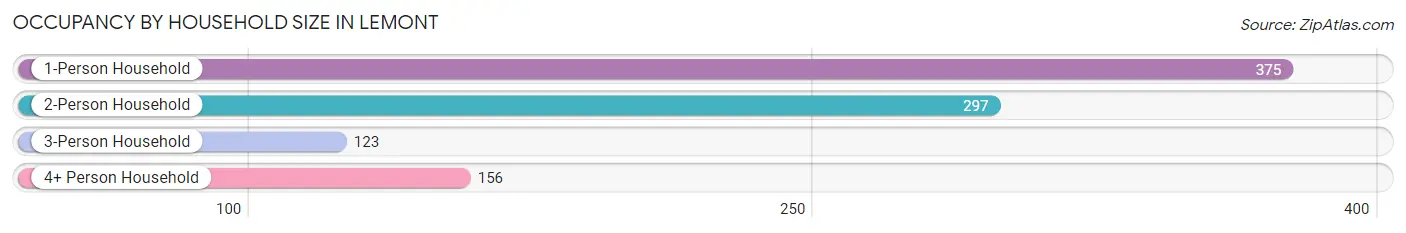
| Household Size | # Housing Units | % Housing Units |
| 1-Person Household | 375 | 39.4% |
| 2-Person Household | 297 | 31.2% |
| 3-Person Household | 123 | 12.9% |
| 4+ Person Household | 156 | 16.4% |
| Total Housing Units | 951 | 100.0% |
Occupancy by Ownership by Household Size in Lemont
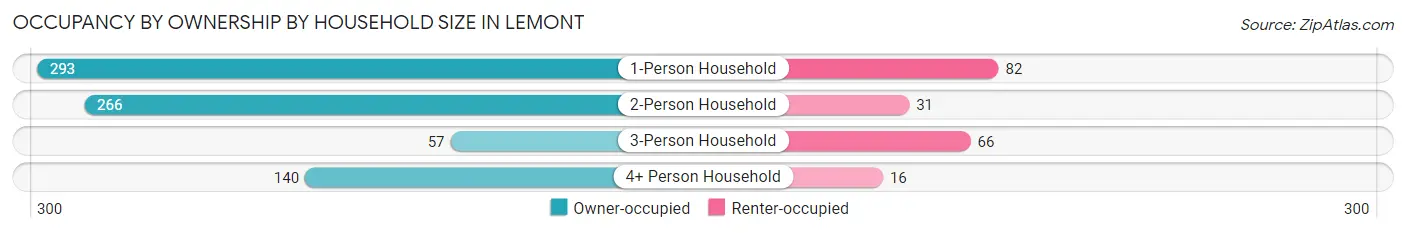
| Household Size | Owner-occupied | Renter-occupied |
| 1-Person Household | 293 (78.1%) | 82 (21.9%) |
| 2-Person Household | 266 (89.6%) | 31 (10.4%) |
| 3-Person Household | 57 (46.3%) | 66 (53.7%) |
| 4+ Person Household | 140 (89.7%) | 16 (10.3%) |
| Total Housing Units | 756 (79.5%) | 195 (20.5%) |
Occupancy by Educational Attainment in Lemont
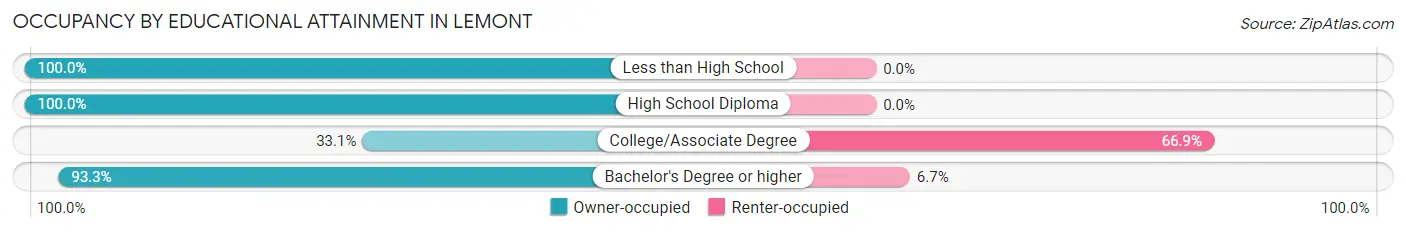
| Household Size | Owner-occupied | Renter-occupied |
| Less than High School | 57 (100.0%) | 0 (0.0%) |
| High School Diploma | 159 (100.0%) | 0 (0.0%) |
| College/Associate Degree | 80 (33.1%) | 162 (66.9%) |
| Bachelor's Degree or higher | 460 (93.3%) | 33 (6.7%) |
Occupancy by Age of Householder in Lemont
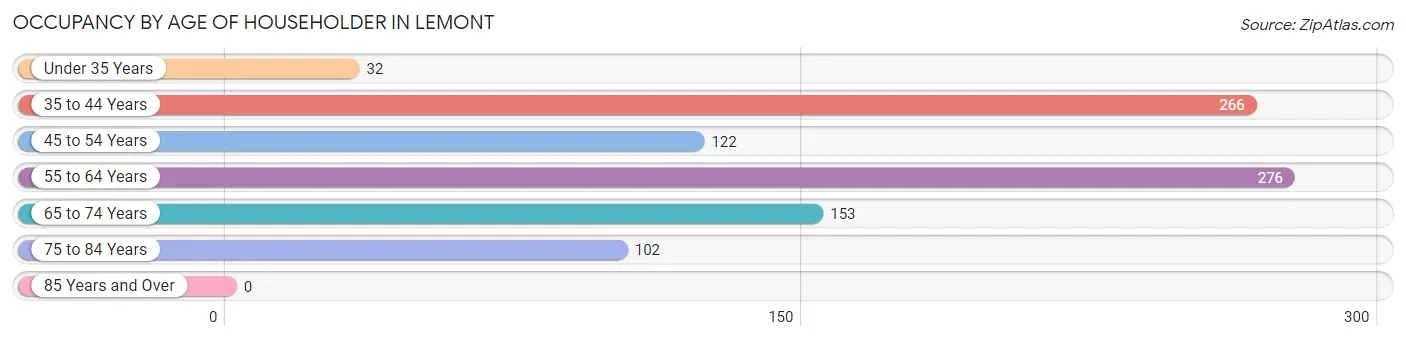
| Age Bracket | # Households | % Households |
| Under 35 Years | 32 | 3.4% |
| 35 to 44 Years | 266 | 28.0% |
| 45 to 54 Years | 122 | 12.8% |
| 55 to 64 Years | 276 | 29.0% |
| 65 to 74 Years | 153 | 16.1% |
| 75 to 84 Years | 102 | 10.7% |
| 85 Years and Over | 0 | 0.0% |
| Total | 951 | 100.0% |
Housing Finances in Lemont
Median Income by Occupancy in Lemont
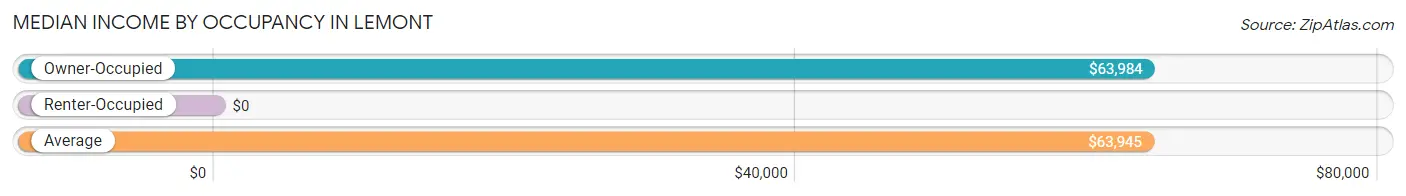
| Occupancy Type | # Households | Median Income |
| Owner-Occupied | 756 (79.5%) | $63,984 |
| Renter-Occupied | 195 (20.5%) | $0 |
| Average | 951 (100.0%) | $63,945 |
Occupancy by Householder Income Bracket in Lemont
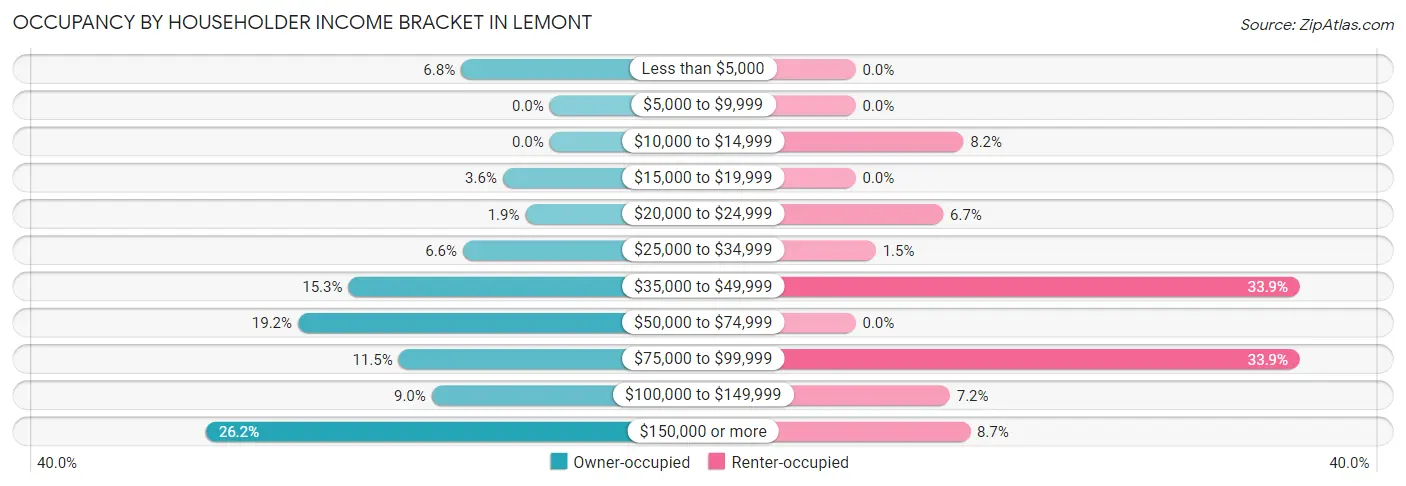
| Income Bracket | Owner-occupied | Renter-occupied |
| Less than $5,000 | 51 (6.8%) | 0 (0.0%) |
| $5,000 to $9,999 | 0 (0.0%) | 0 (0.0%) |
| $10,000 to $14,999 | 0 (0.0%) | 16 (8.2%) |
| $15,000 to $19,999 | 27 (3.6%) | 0 (0.0%) |
| $20,000 to $24,999 | 14 (1.8%) | 13 (6.7%) |
| $25,000 to $34,999 | 50 (6.6%) | 3 (1.5%) |
| $35,000 to $49,999 | 116 (15.3%) | 66 (33.9%) |
| $50,000 to $74,999 | 145 (19.2%) | 0 (0.0%) |
| $75,000 to $99,999 | 87 (11.5%) | 66 (33.9%) |
| $100,000 to $149,999 | 68 (9.0%) | 14 (7.2%) |
| $150,000 or more | 198 (26.2%) | 17 (8.7%) |
| Total | 756 (100.0%) | 195 (100.0%) |
Monthly Housing Cost Tiers in Lemont
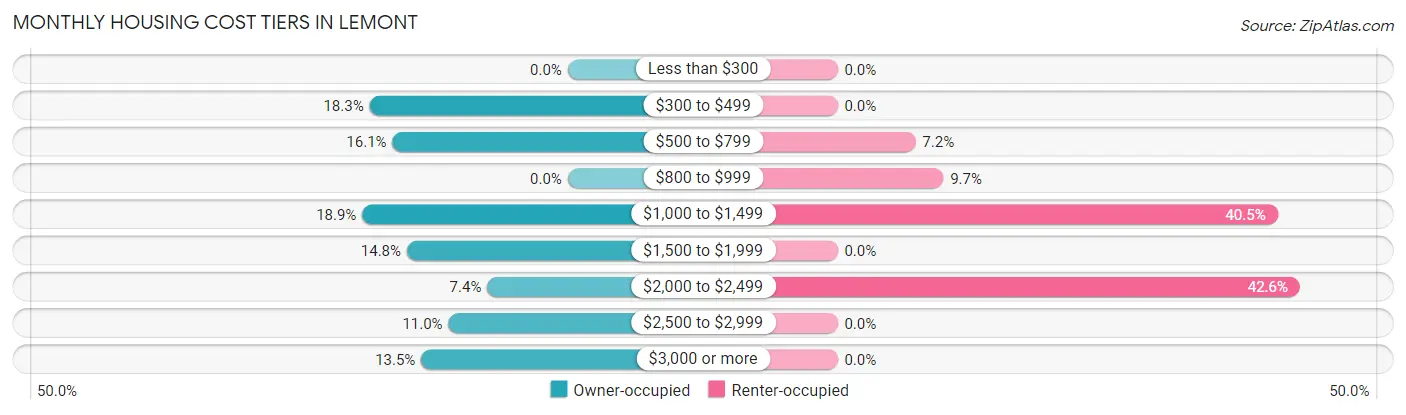
| Monthly Cost | Owner-occupied | Renter-occupied |
| Less than $300 | 0 (0.0%) | 0 (0.0%) |
| $300 to $499 | 138 (18.2%) | 0 (0.0%) |
| $500 to $799 | 122 (16.1%) | 14 (7.2%) |
| $800 to $999 | 0 (0.0%) | 19 (9.7%) |
| $1,000 to $1,499 | 143 (18.9%) | 79 (40.5%) |
| $1,500 to $1,999 | 112 (14.8%) | 0 (0.0%) |
| $2,000 to $2,499 | 56 (7.4%) | 83 (42.6%) |
| $2,500 to $2,999 | 83 (11.0%) | 0 (0.0%) |
| $3,000 or more | 102 (13.5%) | 0 (0.0%) |
| Total | 756 (100.0%) | 195 (100.0%) |
Physical Housing Characteristics in Lemont
Housing Structures in Lemont
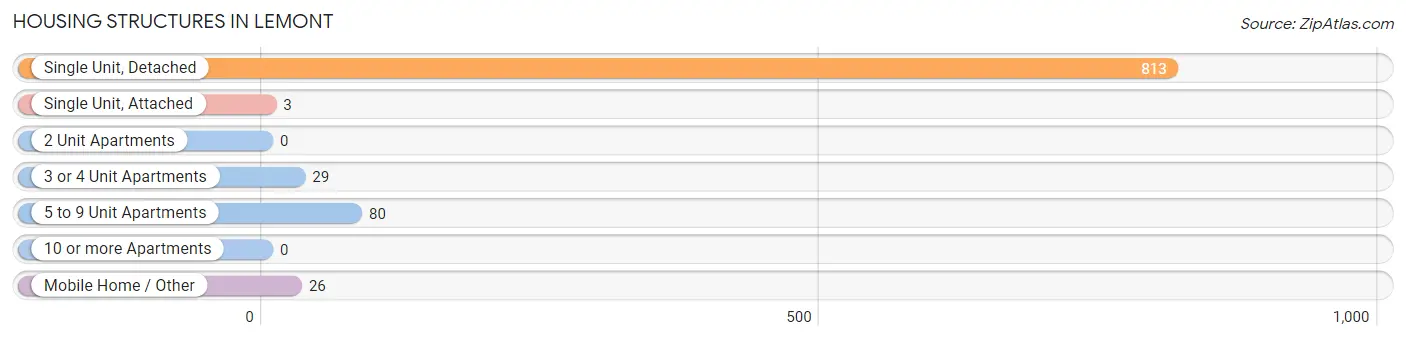
| Structure Type | # Housing Units | % Housing Units |
| Single Unit, Detached | 813 | 85.5% |
| Single Unit, Attached | 3 | 0.3% |
| 2 Unit Apartments | 0 | 0.0% |
| 3 or 4 Unit Apartments | 29 | 3.0% |
| 5 to 9 Unit Apartments | 80 | 8.4% |
| 10 or more Apartments | 0 | 0.0% |
| Mobile Home / Other | 26 | 2.7% |
| Total | 951 | 100.0% |
Housing Structures by Occupancy in Lemont
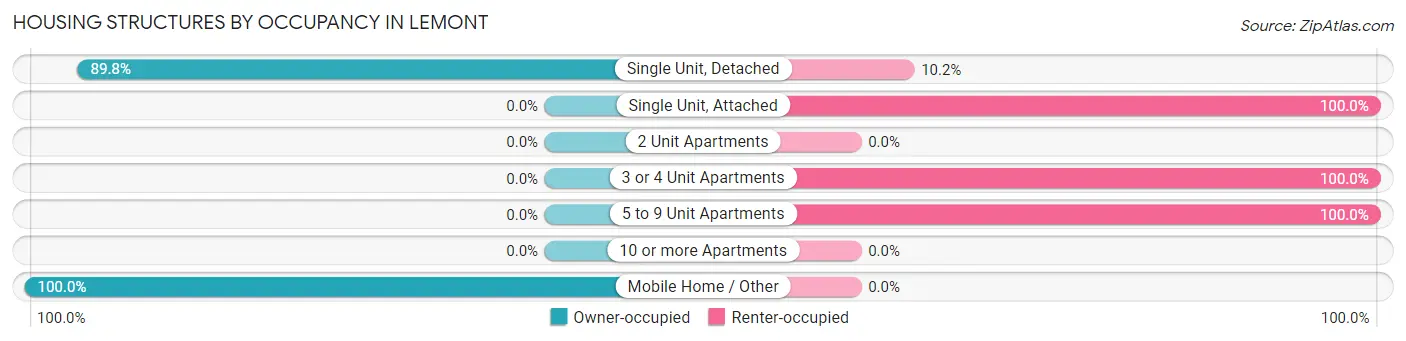
| Structure Type | Owner-occupied | Renter-occupied |
| Single Unit, Detached | 730 (89.8%) | 83 (10.2%) |
| Single Unit, Attached | 0 (0.0%) | 3 (100.0%) |
| 2 Unit Apartments | 0 (0.0%) | 0 (0.0%) |
| 3 or 4 Unit Apartments | 0 (0.0%) | 29 (100.0%) |
| 5 to 9 Unit Apartments | 0 (0.0%) | 80 (100.0%) |
| 10 or more Apartments | 0 (0.0%) | 0 (0.0%) |
| Mobile Home / Other | 26 (100.0%) | 0 (0.0%) |
| Total | 756 (79.5%) | 195 (20.5%) |
Housing Structures by Number of Rooms in Lemont
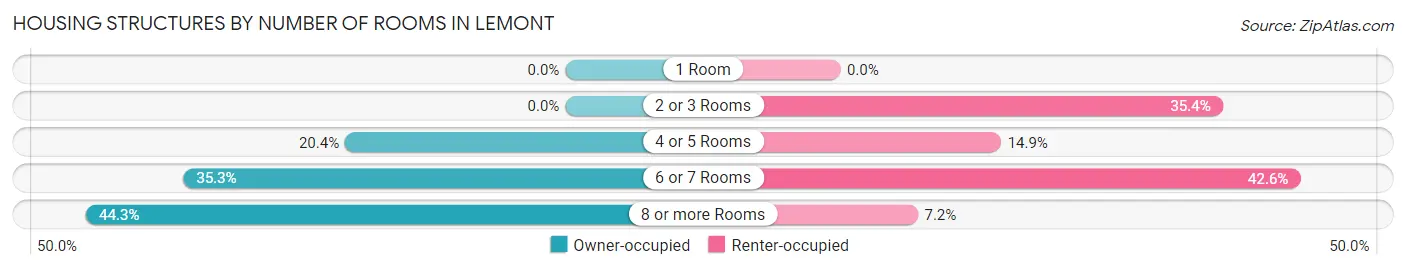
| Number of Rooms | Owner-occupied | Renter-occupied |
| 1 Room | 0 (0.0%) | 0 (0.0%) |
| 2 or 3 Rooms | 0 (0.0%) | 69 (35.4%) |
| 4 or 5 Rooms | 154 (20.4%) | 29 (14.9%) |
| 6 or 7 Rooms | 267 (35.3%) | 83 (42.6%) |
| 8 or more Rooms | 335 (44.3%) | 14 (7.2%) |
| Total | 756 (100.0%) | 195 (100.0%) |
Housing Structure by Heating Type in Lemont
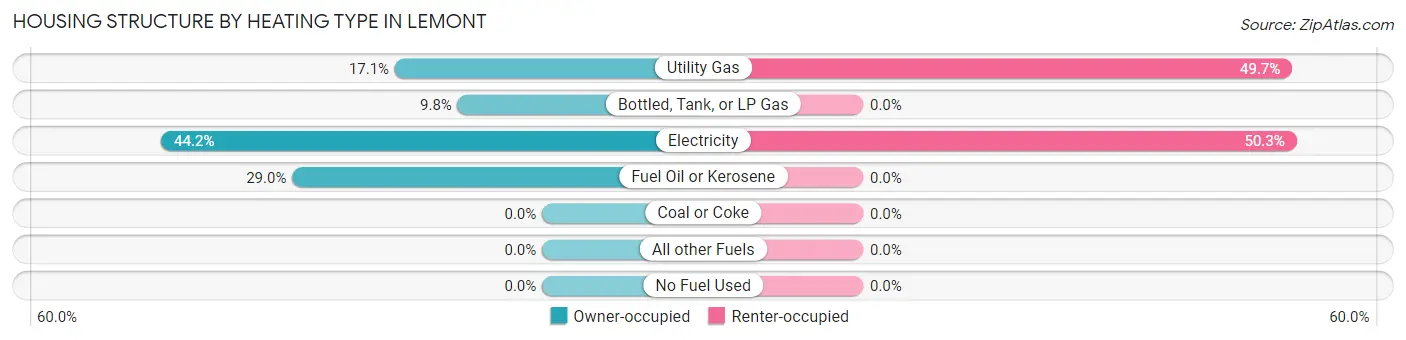
| Heating Type | Owner-occupied | Renter-occupied |
| Utility Gas | 129 (17.1%) | 97 (49.7%) |
| Bottled, Tank, or LP Gas | 74 (9.8%) | 0 (0.0%) |
| Electricity | 334 (44.2%) | 98 (50.3%) |
| Fuel Oil or Kerosene | 219 (29.0%) | 0 (0.0%) |
| Coal or Coke | 0 (0.0%) | 0 (0.0%) |
| All other Fuels | 0 (0.0%) | 0 (0.0%) |
| No Fuel Used | 0 (0.0%) | 0 (0.0%) |
| Total | 756 (100.0%) | 195 (100.0%) |
Household Vehicle Usage in Lemont
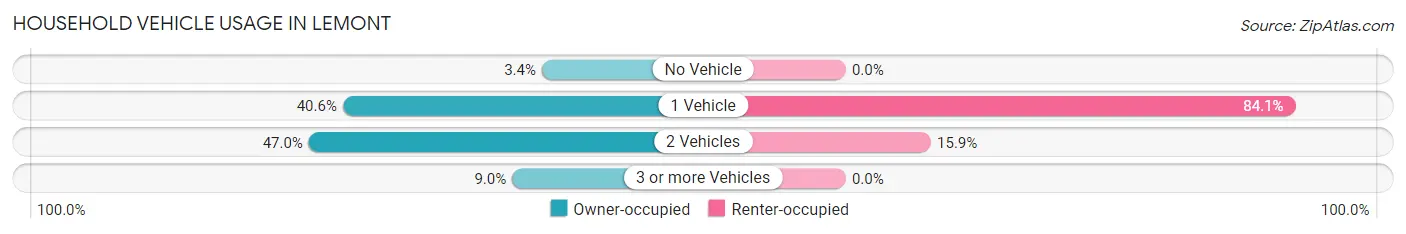
| Vehicles per Household | Owner-occupied | Renter-occupied |
| No Vehicle | 26 (3.4%) | 0 (0.0%) |
| 1 Vehicle | 307 (40.6%) | 164 (84.1%) |
| 2 Vehicles | 355 (47.0%) | 31 (15.9%) |
| 3 or more Vehicles | 68 (9.0%) | 0 (0.0%) |
| Total | 756 (100.0%) | 195 (100.0%) |
Real Estate & Mortgages in Lemont
Real Estate and Mortgage Overview in Lemont
| Characteristic | Without Mortgage | With Mortgage |
| Housing Units | 280 | 476 |
| Median Property Value | $302,700 | $329,500 |
| Median Household Income | $43,846 | $168 |
| Monthly Housing Costs | $506 | $102 |
| Real Estate Taxes | $2,476 | $0 |
Property Value by Mortgage Status in Lemont
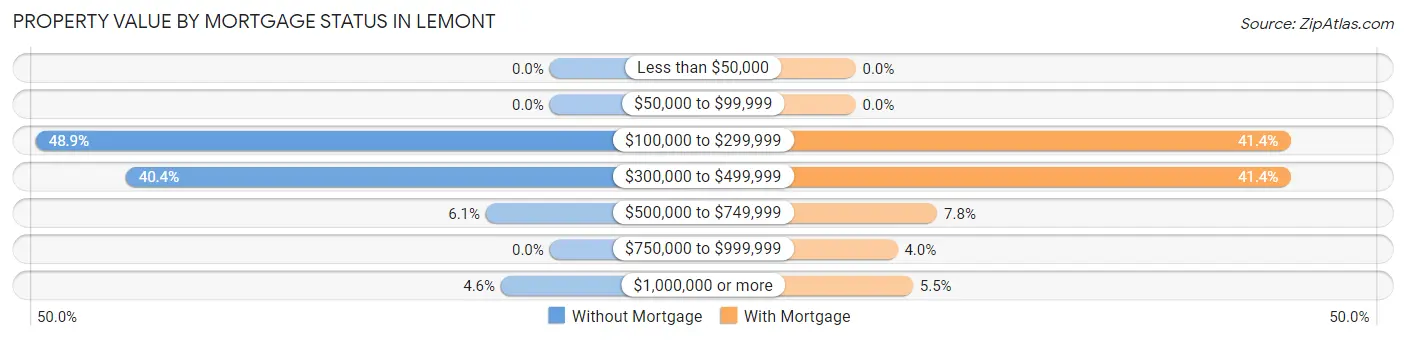
| Property Value | Without Mortgage | With Mortgage |
| Less than $50,000 | 0 (0.0%) | 0 (0.0%) |
| $50,000 to $99,999 | 0 (0.0%) | 0 (0.0%) |
| $100,000 to $299,999 | 137 (48.9%) | 197 (41.4%) |
| $300,000 to $499,999 | 113 (40.4%) | 197 (41.4%) |
| $500,000 to $749,999 | 17 (6.1%) | 37 (7.8%) |
| $750,000 to $999,999 | 0 (0.0%) | 19 (4.0%) |
| $1,000,000 or more | 13 (4.6%) | 26 (5.5%) |
| Total | 280 (100.0%) | 476 (100.0%) |
Household Income by Mortgage Status in Lemont
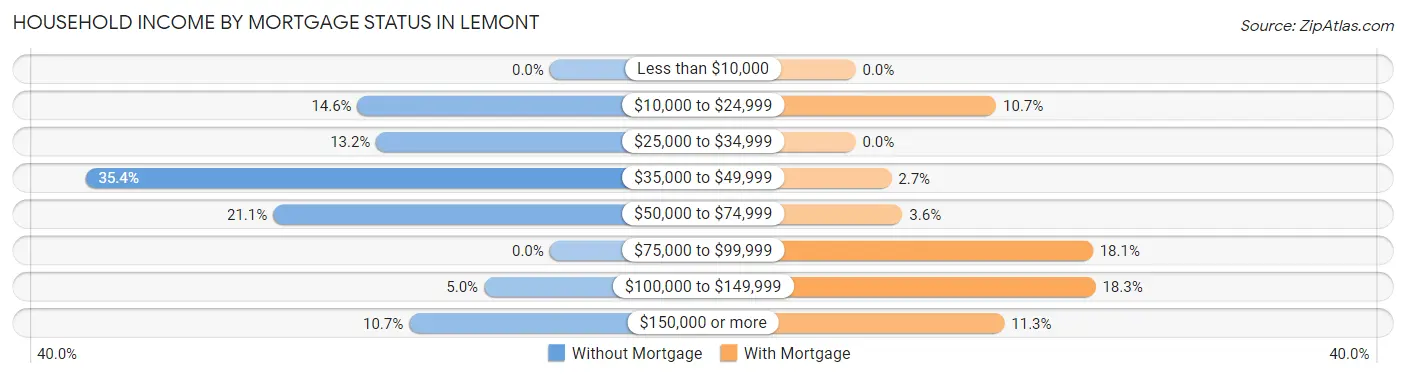
| Household Income | Without Mortgage | With Mortgage |
| Less than $10,000 | 0 (0.0%) | 0 (0.0%) |
| $10,000 to $24,999 | 41 (14.6%) | 51 (10.7%) |
| $25,000 to $34,999 | 37 (13.2%) | 0 (0.0%) |
| $35,000 to $49,999 | 99 (35.4%) | 13 (2.7%) |
| $50,000 to $74,999 | 59 (21.1%) | 17 (3.6%) |
| $75,000 to $99,999 | 0 (0.0%) | 86 (18.1%) |
| $100,000 to $149,999 | 14 (5.0%) | 87 (18.3%) |
| $150,000 or more | 30 (10.7%) | 54 (11.3%) |
| Total | 280 (100.0%) | 476 (100.0%) |
Property Value to Household Income Ratio in Lemont
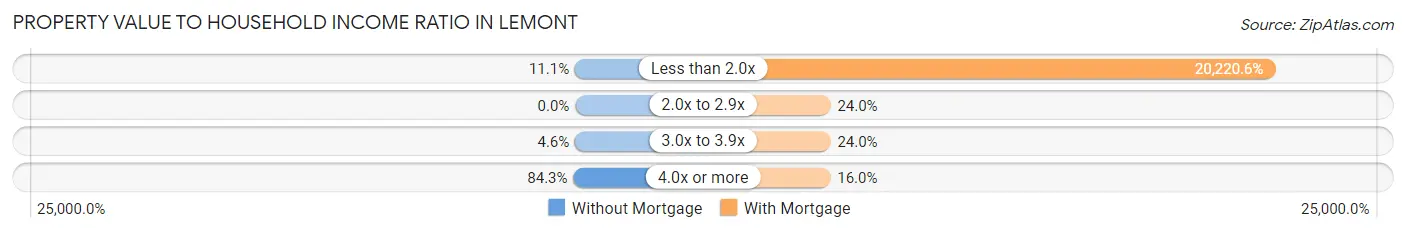
| Value-to-Income Ratio | Without Mortgage | With Mortgage |
| Less than 2.0x | 31 (11.1%) | 96,250 (20,220.6%) |
| 2.0x to 2.9x | 0 (0.0%) | 114 (23.9%) |
| 3.0x to 3.9x | 13 (4.6%) | 114 (23.9%) |
| 4.0x or more | 236 (84.3%) | 76 (16.0%) |
| Total | 280 (100.0%) | 476 (100.0%) |
Real Estate Taxes by Mortgage Status in Lemont
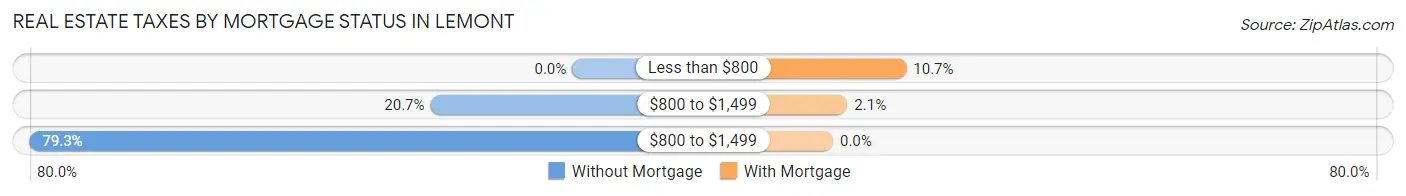
| Property Taxes | Without Mortgage | With Mortgage |
| Less than $800 | 0 (0.0%) | 51 (10.7%) |
| $800 to $1,499 | 58 (20.7%) | 10 (2.1%) |
| $800 to $1,499 | 222 (79.3%) | 0 (0.0%) |
| Total | 280 (100.0%) | 476 (100.0%) |
Health & Disability in Lemont
Health Insurance Coverage by Age in Lemont
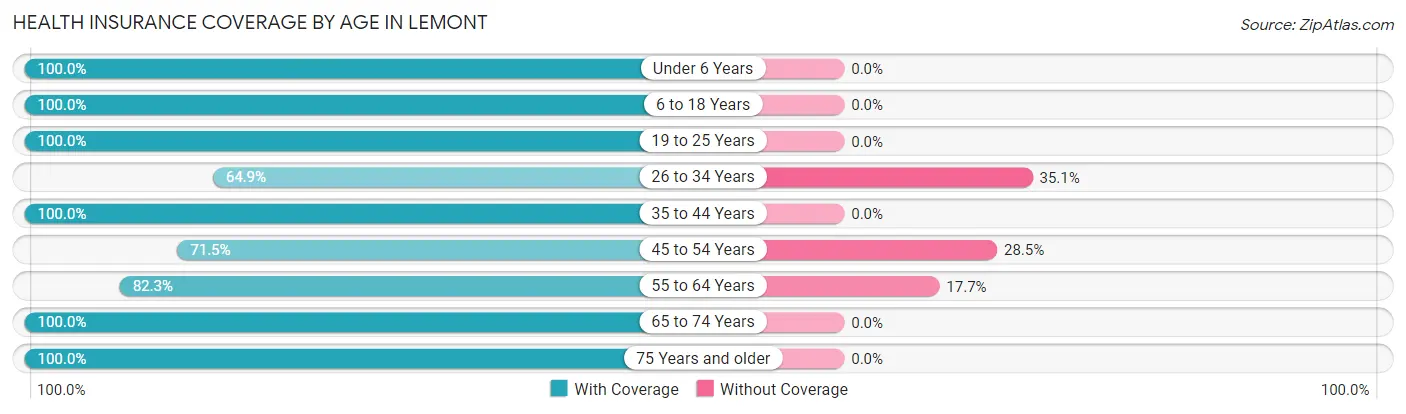
| Age Bracket | With Coverage | Without Coverage |
| Under 6 Years | 204 (100.0%) | 0 (0.0%) |
| 6 to 18 Years | 122 (100.0%) | 0 (0.0%) |
| 19 to 25 Years | 102 (100.0%) | 0 (0.0%) |
| 26 to 34 Years | 196 (64.9%) | 106 (35.1%) |
| 35 to 44 Years | 412 (100.0%) | 0 (0.0%) |
| 45 to 54 Years | 128 (71.5%) | 51 (28.5%) |
| 55 to 64 Years | 306 (82.3%) | 66 (17.7%) |
| 65 to 74 Years | 236 (100.0%) | 0 (0.0%) |
| 75 Years and older | 156 (100.0%) | 0 (0.0%) |
| Total | 1,862 (89.3%) | 223 (10.7%) |
Health Insurance Coverage by Citizenship Status in Lemont
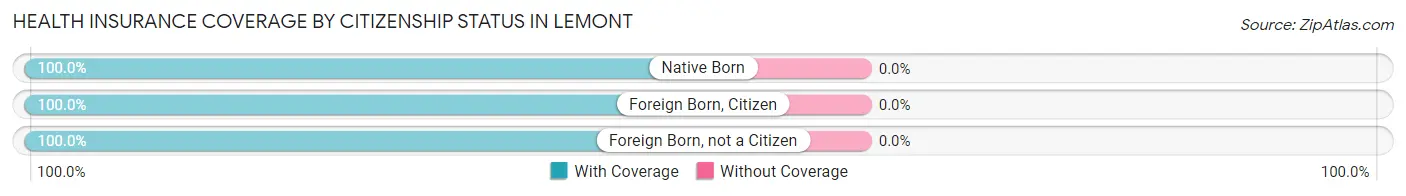
| Citizenship Status | With Coverage | Without Coverage |
| Native Born | 204 (100.0%) | 0 (0.0%) |
| Foreign Born, Citizen | 122 (100.0%) | 0 (0.0%) |
| Foreign Born, not a Citizen | 102 (100.0%) | 0 (0.0%) |
Health Insurance Coverage by Household Income in Lemont
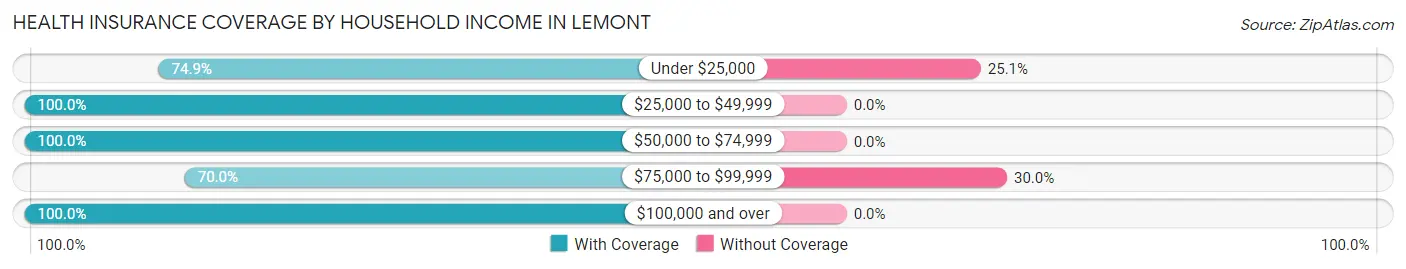
| Household Income | With Coverage | Without Coverage |
| Under $25,000 | 152 (74.9%) | 51 (25.1%) |
| $25,000 to $49,999 | 408 (100.0%) | 0 (0.0%) |
| $50,000 to $74,999 | 199 (100.0%) | 0 (0.0%) |
| $75,000 to $99,999 | 401 (70.0%) | 172 (30.0%) |
| $100,000 and over | 702 (100.0%) | 0 (0.0%) |
Public vs Private Health Insurance Coverage by Age in Lemont

| Age Bracket | Public Insurance | Private Insurance |
| Under 6 | 109 (53.4%) | 95 (46.6%) |
| 6 to 18 Years | 8 (6.6%) | 122 (100.0%) |
| 19 to 25 Years | 43 (42.2%) | 77 (75.5%) |
| 25 to 34 Years | 140 (46.4%) | 56 (18.5%) |
| 35 to 44 Years | 0 (0.0%) | 412 (100.0%) |
| 45 to 54 Years | 0 (0.0%) | 128 (71.5%) |
| 55 to 64 Years | 19 (5.1%) | 287 (77.1%) |
| 65 to 74 Years | 236 (100.0%) | 201 (85.2%) |
| 75 Years and over | 156 (100.0%) | 156 (100.0%) |
| Total | 711 (34.1%) | 1,534 (73.6%) |
Disability Status by Sex by Age in Lemont
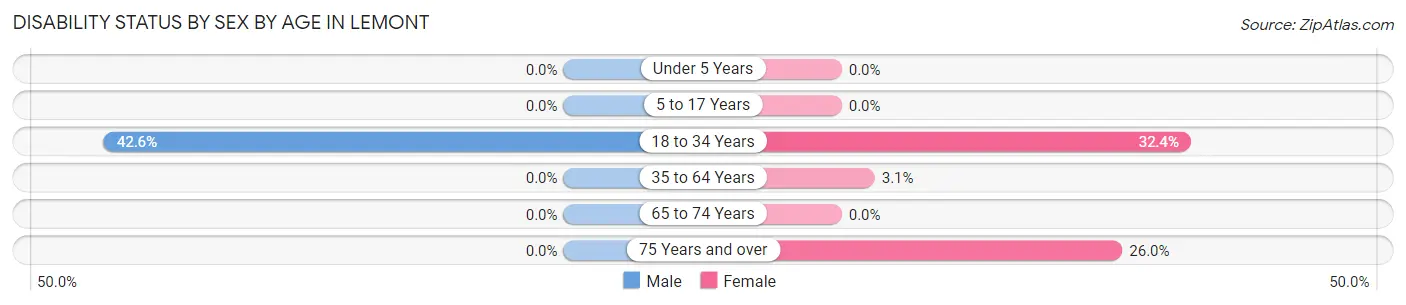
| Age Bracket | Male | Female |
| Under 5 Years | 0 (0.0%) | 0 (0.0%) |
| 5 to 17 Years | 0 (0.0%) | 0 (0.0%) |
| 18 to 34 Years | 142 (42.6%) | 23 (32.4%) |
| 35 to 64 Years | 0 (0.0%) | 14 (3.1%) |
| 65 to 74 Years | 0 (0.0%) | 0 (0.0%) |
| 75 Years and over | 0 (0.0%) | 25 (26.0%) |
Disability Class by Sex by Age in Lemont
Disability Class: Hearing Difficulty
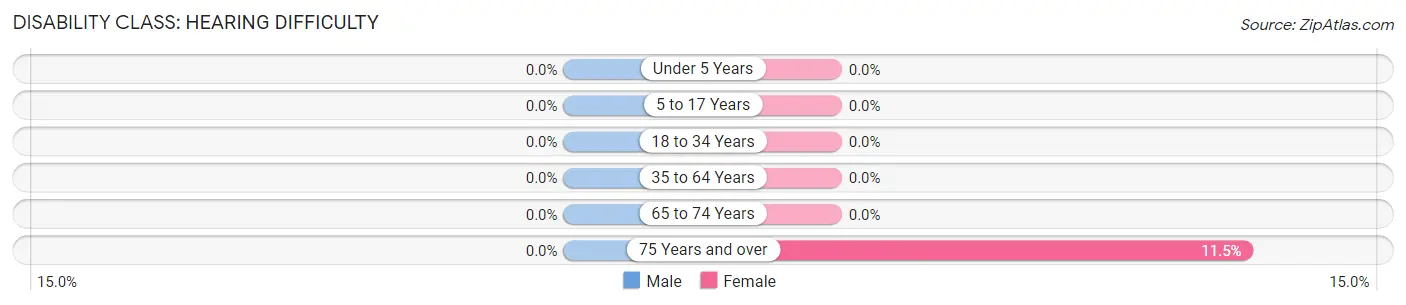
| Age Bracket | Male | Female |
| Under 5 Years | 0 (0.0%) | 0 (0.0%) |
| 5 to 17 Years | 0 (0.0%) | 0 (0.0%) |
| 18 to 34 Years | 0 (0.0%) | 0 (0.0%) |
| 35 to 64 Years | 0 (0.0%) | 0 (0.0%) |
| 65 to 74 Years | 0 (0.0%) | 0 (0.0%) |
| 75 Years and over | 0 (0.0%) | 11 (11.5%) |
Disability Class: Vision Difficulty
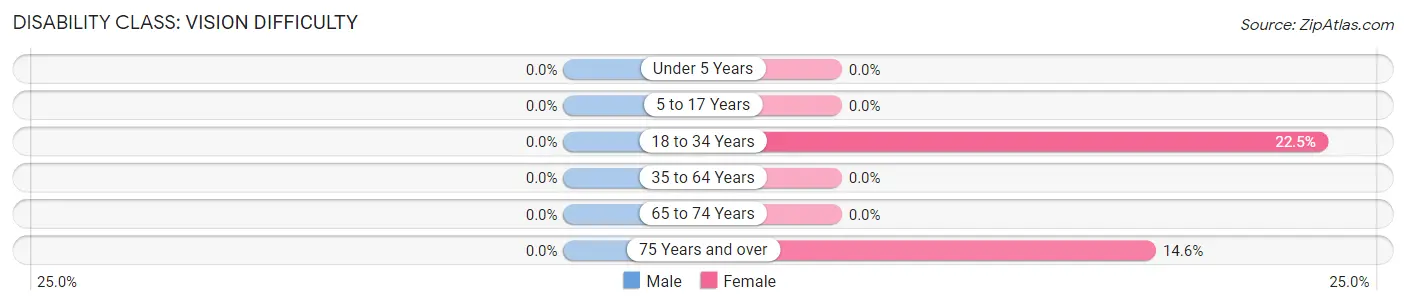
| Age Bracket | Male | Female |
| Under 5 Years | 0 (0.0%) | 0 (0.0%) |
| 5 to 17 Years | 0 (0.0%) | 0 (0.0%) |
| 18 to 34 Years | 0 (0.0%) | 16 (22.5%) |
| 35 to 64 Years | 0 (0.0%) | 0 (0.0%) |
| 65 to 74 Years | 0 (0.0%) | 0 (0.0%) |
| 75 Years and over | 0 (0.0%) | 14 (14.6%) |
Disability Class: Cognitive Difficulty
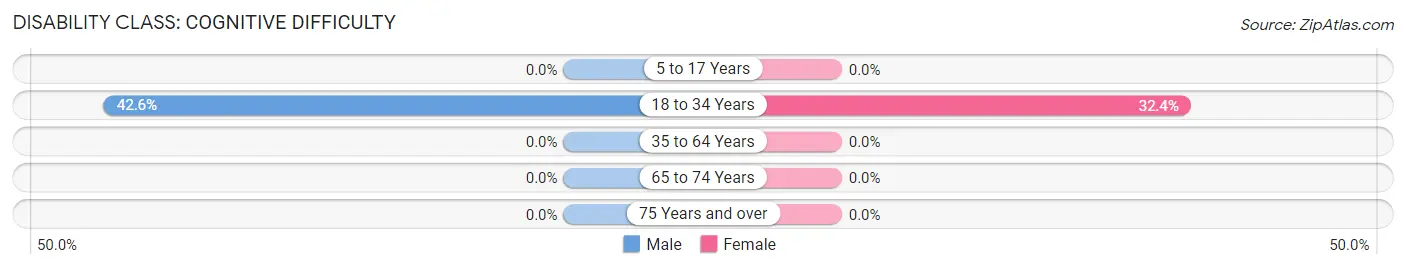
| Age Bracket | Male | Female |
| 5 to 17 Years | 0 (0.0%) | 0 (0.0%) |
| 18 to 34 Years | 142 (42.6%) | 23 (32.4%) |
| 35 to 64 Years | 0 (0.0%) | 0 (0.0%) |
| 65 to 74 Years | 0 (0.0%) | 0 (0.0%) |
| 75 Years and over | 0 (0.0%) | 0 (0.0%) |
Disability Class: Ambulatory Difficulty
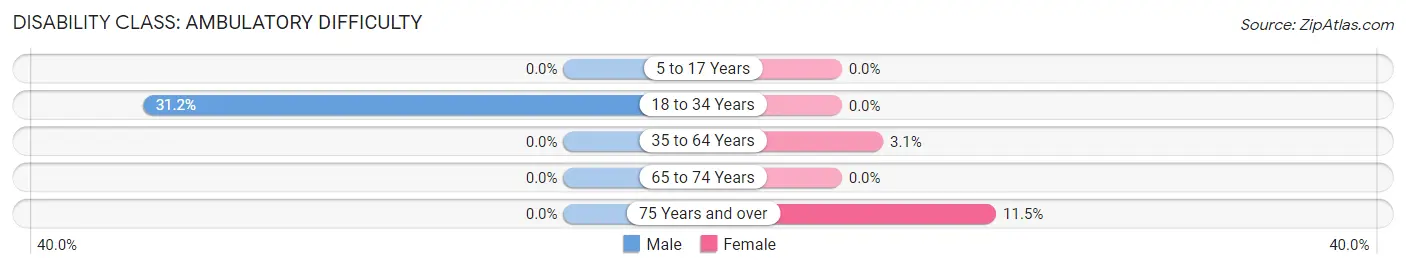
| Age Bracket | Male | Female |
| 5 to 17 Years | 0 (0.0%) | 0 (0.0%) |
| 18 to 34 Years | 104 (31.2%) | 0 (0.0%) |
| 35 to 64 Years | 0 (0.0%) | 14 (3.1%) |
| 65 to 74 Years | 0 (0.0%) | 0 (0.0%) |
| 75 Years and over | 0 (0.0%) | 11 (11.5%) |
Disability Class: Self-Care Difficulty
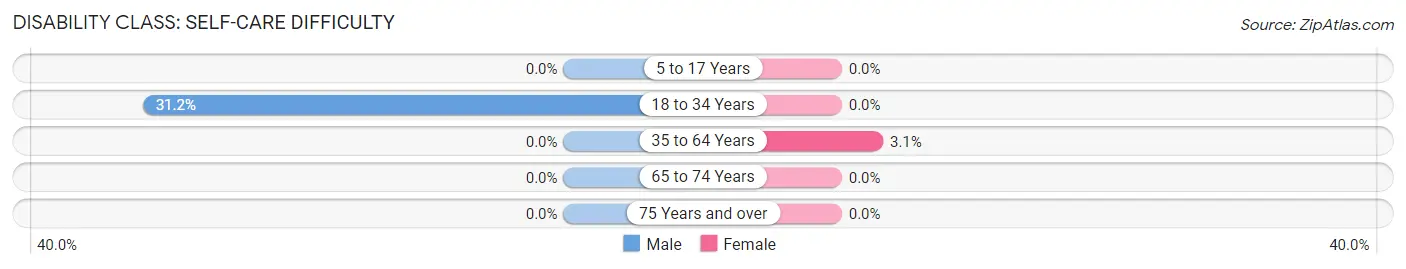
| Age Bracket | Male | Female |
| 5 to 17 Years | 0 (0.0%) | 0 (0.0%) |
| 18 to 34 Years | 104 (31.2%) | 0 (0.0%) |
| 35 to 64 Years | 0 (0.0%) | 14 (3.1%) |
| 65 to 74 Years | 0 (0.0%) | 0 (0.0%) |
| 75 Years and over | 0 (0.0%) | 0 (0.0%) |
Technology Access in Lemont
Computing Device Access in Lemont
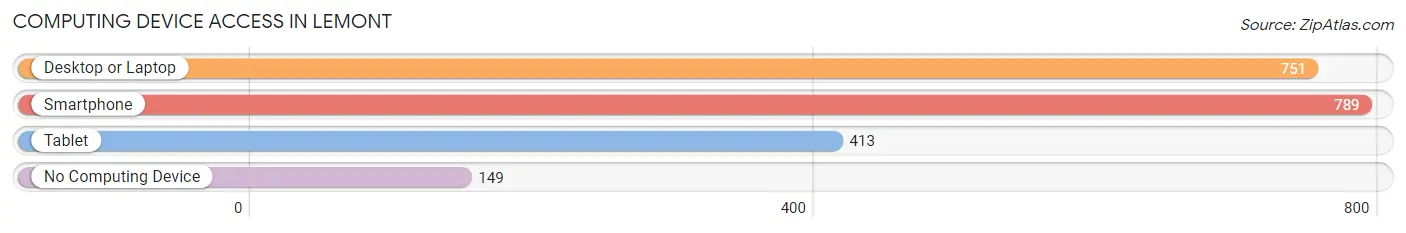
| Device Type | # Households | % Households |
| Desktop or Laptop | 751 | 79.0% |
| Smartphone | 789 | 83.0% |
| Tablet | 413 | 43.4% |
| No Computing Device | 149 | 15.7% |
| Total | 951 | 100.0% |
Internet Access in Lemont
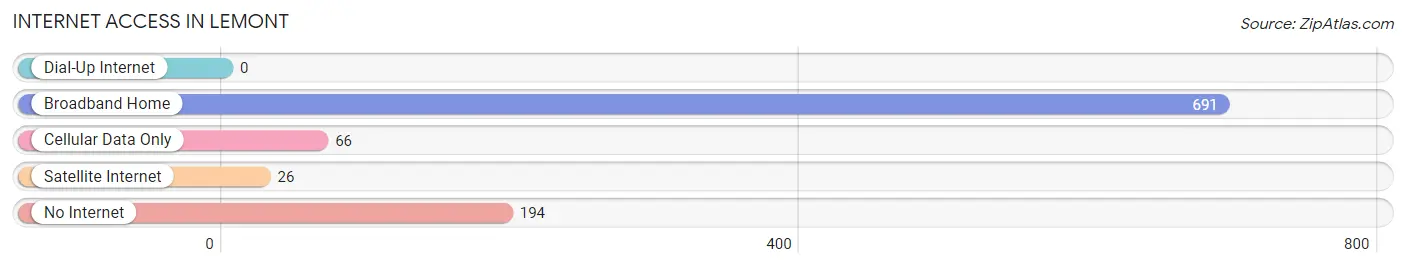
| Internet Type | # Households | % Households |
| Dial-Up Internet | 0 | 0.0% |
| Broadband Home | 691 | 72.7% |
| Cellular Data Only | 66 | 6.9% |
| Satellite Internet | 26 | 2.7% |
| No Internet | 194 | 20.4% |
| Total | 951 | 100.0% |
Lemont Summary
Lemont is a small borough located in Centre County, Pennsylvania. It is situated in the Nittany Valley, a region of the Appalachian Mountains. The population of Lemont was 1,093 at the 2010 census.
History
Lemont was founded in 1845 by a group of settlers from the nearby town of Bellefonte. The town was named after the nearby mountain, which was named after the French word for mountain, “le mont.” The town was originally a farming community, but it soon became a center for the coal and iron industries. The first coal mine in the area was opened in 1854, and the first iron furnace was built in 1856.
The town grew rapidly in the late 19th century, and by the early 20th century, it had become a bustling industrial center. The town was home to several coal mines, iron furnaces, and other industries. The town also had a thriving business district, with several stores, banks, and other businesses.
In the late 20th century, the coal and iron industries began to decline, and the town’s economy shifted to a more service-based economy. The town is now home to several small businesses, including a few restaurants, a grocery store, and a few other shops.
Geography
Lemont is located in the Nittany Valley, a region of the Appalachian Mountains. The town is situated in the Nittany Valley, which is a narrow valley that runs through the mountains. The town is located at the intersection of two major highways, US Route 322 and PA Route 26.
The town is surrounded by rolling hills and mountains, and the nearby Nittany Mountain is a popular destination for hikers and outdoor enthusiasts. The town is also located near several state parks, including Bald Eagle State Park and Rothrock State Forest.
Economy
Lemont’s economy is largely based on the service industry. The town is home to several small businesses, including restaurants, a grocery store, and other shops. The town also has a few manufacturing businesses, including a furniture factory and a metal fabrication plant.
The town is also home to several educational institutions, including a community college and a technical school. The town is also home to a few medical facilities, including a hospital and a nursing home.
Demographics
As of the 2010 census, the population of Lemont was 1,093. The racial makeup of the town was 97.3% White, 0.7% African American, 0.2% Native American, 0.2% Asian, 0.2% from other races, and 1.6% from two or more races. Hispanic or Latino of any race were 0.7% of the population.
The median income for a household in the town was $37,500, and the median income for a family was $45,000. The per capita income for the town was $19,000. About 8.3% of families and 10.2% of the population were below the poverty line, including 14.3% of those under age 18 and 8.3% of those age 65 or over.
Common Questions
What is Per Capita Income in Lemont?
Per Capita income in Lemont is $44,550.
What is the Median Family Income in Lemont?
Median Family Income in Lemont is $94,383.
What is the Median Household income in Lemont?
Median Household Income in Lemont is $63,945.
What is Income or Wage Gap in Lemont?
Income or Wage Gap in Lemont is 47.2%.
Women in Lemont earn 52.8 cents for every dollar earned by a man.
What is Inequality or Gini Index in Lemont?
Inequality or Gini Index in Lemont is 0.45.
What is the Total Population of Lemont?
Total Population of Lemont is 2,085.
What is the Total Male Population of Lemont?
Total Male Population of Lemont is 1,198.
What is the Total Female Population of Lemont?
Total Female Population of Lemont is 887.
What is the Ratio of Males per 100 Females in Lemont?
There are 135.06 Males per 100 Females in Lemont.
What is the Ratio of Females per 100 Males in Lemont?
There are 74.04 Females per 100 Males in Lemont.
What is the Median Population Age in Lemont?
Median Population Age in Lemont is 40.5 Years.
What is the Average Family Size in Lemont
Average Family Size in Lemont is 2.9 People.
What is the Average Household Size in Lemont
Average Household Size in Lemont is 2.2 People.
How Large is the Labor Force in Lemont?
There are 983 People in the Labor Forcein in Lemont.
What is the Percentage of People in the Labor Force in Lemont?
55.9% of People are in the Labor Force in Lemont.
What is the Unemployment Rate in Lemont?
Unemployment Rate in Lemont is 8.9%.