Holly Hill, SC Map & Demographics
Holly Hill Map
Holly Hill Overview
$18,715
PER CAPITA INCOME
$59,342
AVG FAMILY INCOME
$24,185
AVG HOUSEHOLD INCOME
59.3%
WAGE / INCOME GAP [ % ]
40.7¢/ $1
WAGE / INCOME GAP [ $ ]
0.51
INEQUALITY / GINI INDEX
1,384
TOTAL POPULATION
684
MALE POPULATION
700
FEMALE POPULATION
97.71
MALES / 100 FEMALES
102.34
FEMALES / 100 MALES
32.5
MEDIAN AGE
3.9
AVG FAMILY SIZE
3.0
AVG HOUSEHOLD SIZE
356
LABOR FORCE [ PEOPLE ]
35.5%
PERCENT IN LABOR FORCE
6.5%
UNEMPLOYMENT RATE
Holly Hill Zip Codes
Holly Hill Area Codes
Income in Holly Hill
Income Overview in Holly Hill
Per Capita Income in Holly Hill is $18,715, while median incomes of families and households are $59,342 and $24,185 respectively.
| Characteristic | Number | Measure |
| Per Capita Income | 1,384 | $18,715 |
| Median Family Income | 310 | $59,342 |
| Mean Family Income | 310 | $70,410 |
| Median Household Income | 461 | $24,185 |
| Mean Household Income | 461 | $53,190 |
| Income Deficit | 310 | $0 |
| Wage / Income Gap (%) | 1,384 | 59.27% |
| Wage / Income Gap ($) | 1,384 | 40.73¢ per $1 |
| Gini / Inequality Index | 1,384 | 0.51 |
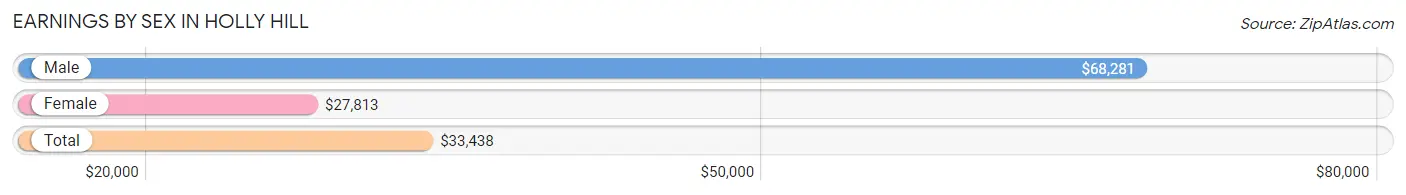
Earnings by Sex in Holly Hill
Average Earnings in Holly Hill are $33,438, $68,281 for men and $27,813 for women, a difference of 59.3%.
| Sex | Number | Average Earnings |
| Male | 168 (44.9%) | $68,281 |
| Female | 206 (55.1%) | $27,813 |
| Total | 374 (100.0%) | $33,438 |
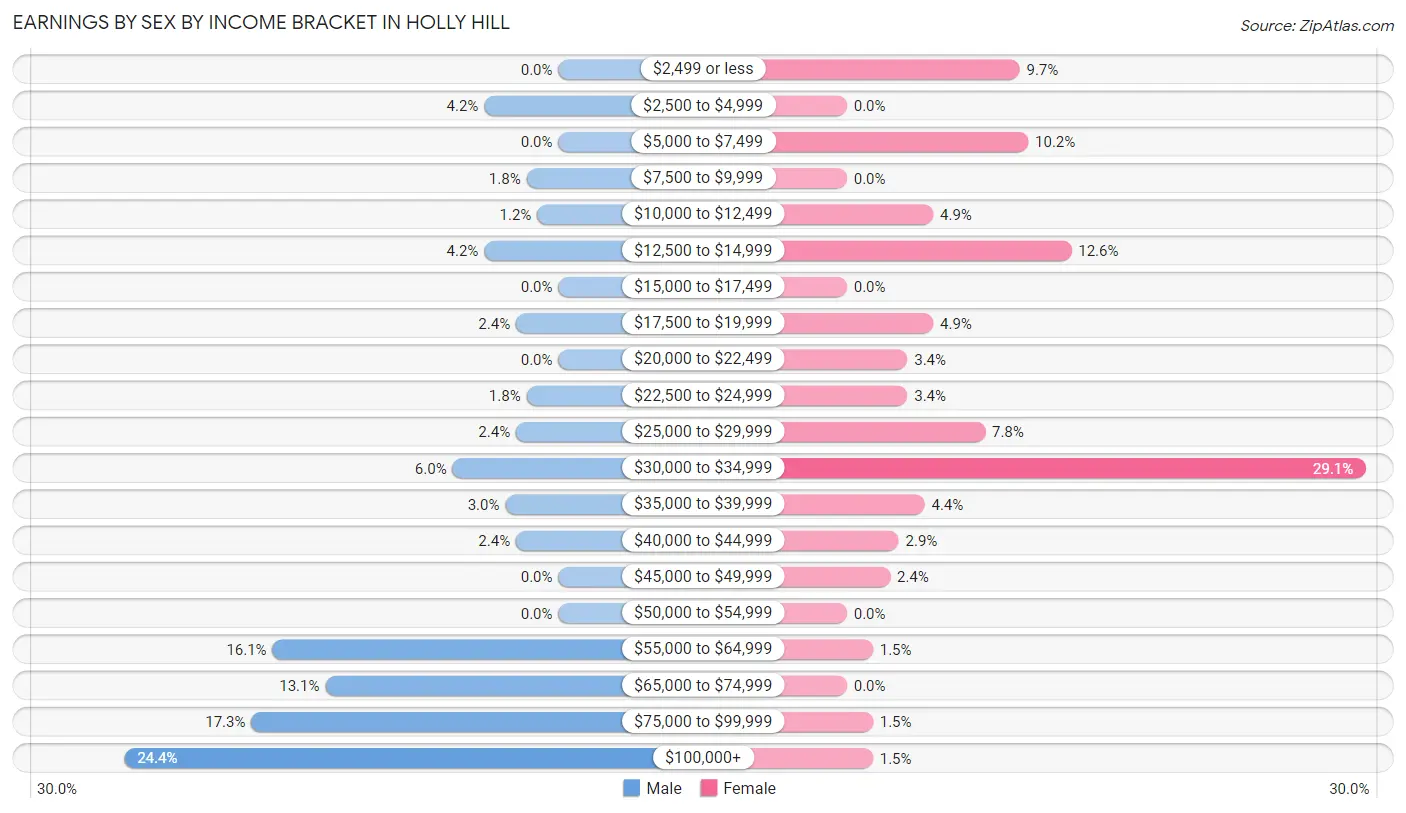
Earnings by Sex by Income Bracket in Holly Hill
The most common earnings brackets in Holly Hill are $100,000+ for men (41 | 24.4%) and $30,000 to $34,999 for women (60 | 29.1%).
| Income | Male | Female |
| $2,499 or less | 0 (0.0%) | 20 (9.7%) |
| $2,500 to $4,999 | 7 (4.2%) | 0 (0.0%) |
| $5,000 to $7,499 | 0 (0.0%) | 21 (10.2%) |
| $7,500 to $9,999 | 3 (1.8%) | 0 (0.0%) |
| $10,000 to $12,499 | 2 (1.2%) | 10 (4.9%) |
| $12,500 to $14,999 | 7 (4.2%) | 26 (12.6%) |
| $15,000 to $17,499 | 0 (0.0%) | 0 (0.0%) |
| $17,500 to $19,999 | 4 (2.4%) | 10 (4.9%) |
| $20,000 to $22,499 | 0 (0.0%) | 7 (3.4%) |
| $22,500 to $24,999 | 3 (1.8%) | 7 (3.4%) |
| $25,000 to $29,999 | 4 (2.4%) | 16 (7.8%) |
| $30,000 to $34,999 | 10 (5.9%) | 60 (29.1%) |
| $35,000 to $39,999 | 5 (3.0%) | 9 (4.4%) |
| $40,000 to $44,999 | 4 (2.4%) | 6 (2.9%) |
| $45,000 to $49,999 | 0 (0.0%) | 5 (2.4%) |
| $50,000 to $54,999 | 0 (0.0%) | 0 (0.0%) |
| $55,000 to $64,999 | 27 (16.1%) | 3 (1.5%) |
| $65,000 to $74,999 | 22 (13.1%) | 0 (0.0%) |
| $75,000 to $99,999 | 29 (17.3%) | 3 (1.5%) |
| $100,000+ | 41 (24.4%) | 3 (1.5%) |
| Total | 168 (100.0%) | 206 (100.0%) |
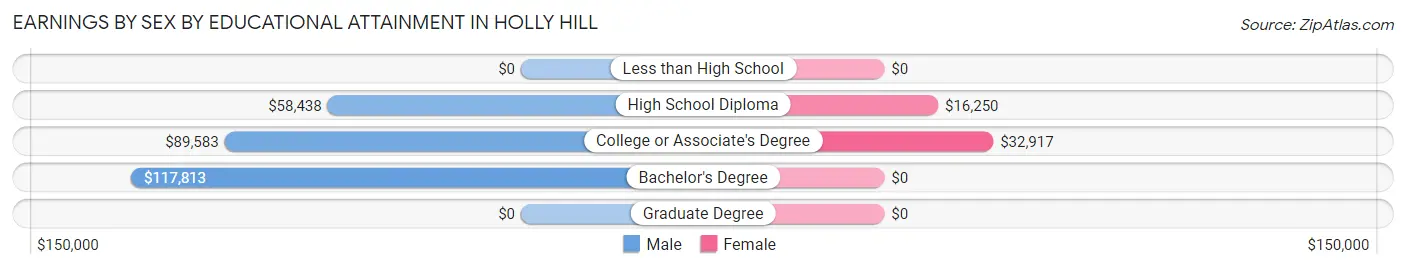
Earnings by Sex by Educational Attainment in Holly Hill
Average earnings in Holly Hill are $69,063 for men and $28,516 for women, a difference of 58.7%. Men with an educational attainment of bachelor's degree enjoy the highest average annual earnings of $117,813, while those with high school diploma education earn the least with $58,438. Women with an educational attainment of college or associate's degree earn the most with the average annual earnings of $32,917, while those with high school diploma education have the smallest earnings of $16,250.
| Educational Attainment | Male Income | Female Income |
| Less than High School | - | - |
| High School Diploma | $58,438 | $16,250 |
| College or Associate's Degree | $89,583 | $32,917 |
| Bachelor's Degree | $117,813 | $0 |
| Graduate Degree | - | - |
| Total | $69,063 | $28,516 |
Family Income in Holly Hill
Family Income Brackets in Holly Hill
According to the Holly Hill family income data, there are 69 families falling into the $50,000 to $74,999 income range, which is the most common income bracket and makes up 22.3% of all families. Conversely, the $200,000+ income bracket is the least frequent group with only 3 families (1.0%) belonging to this category.
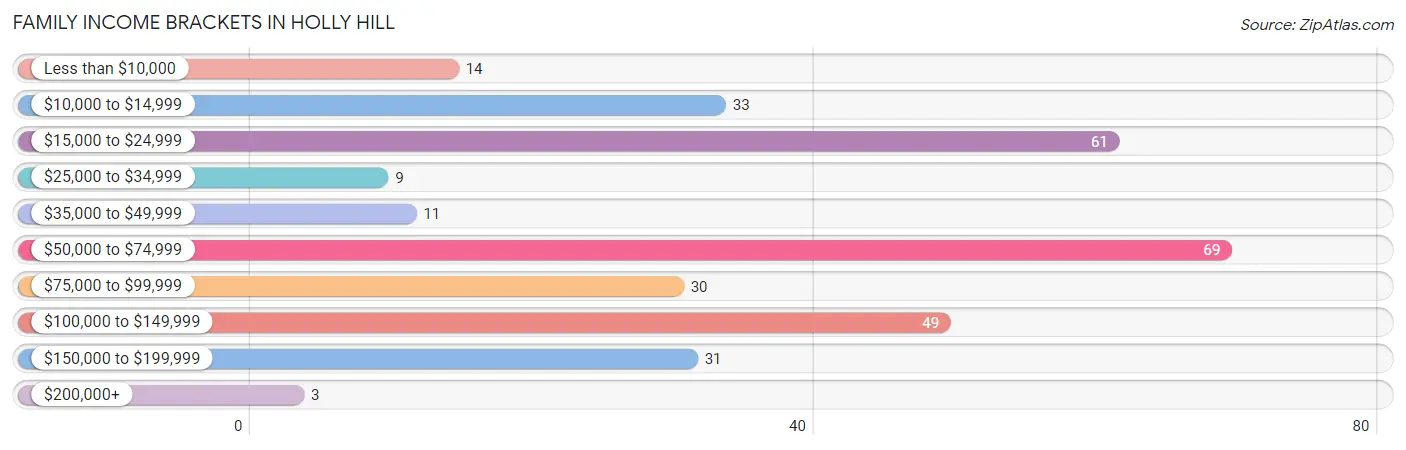
| Income Bracket | # Families | % Families |
| Less than $10,000 | 14 | 4.5% |
| $10,000 to $14,999 | 33 | 10.6% |
| $15,000 to $24,999 | 61 | 19.7% |
| $25,000 to $34,999 | 9 | 2.9% |
| $35,000 to $49,999 | 11 | 3.5% |
| $50,000 to $74,999 | 69 | 22.3% |
| $75,000 to $99,999 | 30 | 9.7% |
| $100,000 to $149,999 | 49 | 15.8% |
| $150,000 to $199,999 | 31 | 10.0% |
| $200,000+ | 3 | 1.0% |
Family Income by Famaliy Size in Holly Hill
6-person families (20 | 6.5%) account for the highest median family income in Holly Hill with $90,714 per family, while 2-person families (151 | 48.7%) have the highest median income of $28,542 per family member.
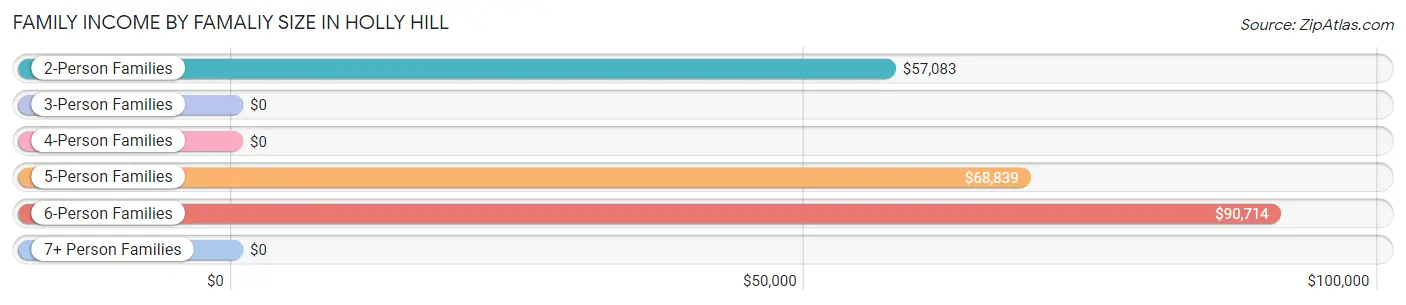
| Income Bracket | # Families | Median Income |
| 2-Person Families | 151 (48.7%) | $57,083 |
| 3-Person Families | 55 (17.7%) | $0 |
| 4-Person Families | 47 (15.2%) | $0 |
| 5-Person Families | 37 (11.9%) | $68,839 |
| 6-Person Families | 20 (6.5%) | $90,714 |
| 7+ Person Families | 0 (0.0%) | $0 |
| Total | 310 (100.0%) | $59,342 |
Family Income by Number of Earners in Holly Hill
The median family income in Holly Hill is $59,342, with families comprising 3+ earners (23) having the highest median family income of $154,271, while families with no earners (102) have the lowest median family income of $22,639, accounting for 7.4% and 32.9% of families, respectively.
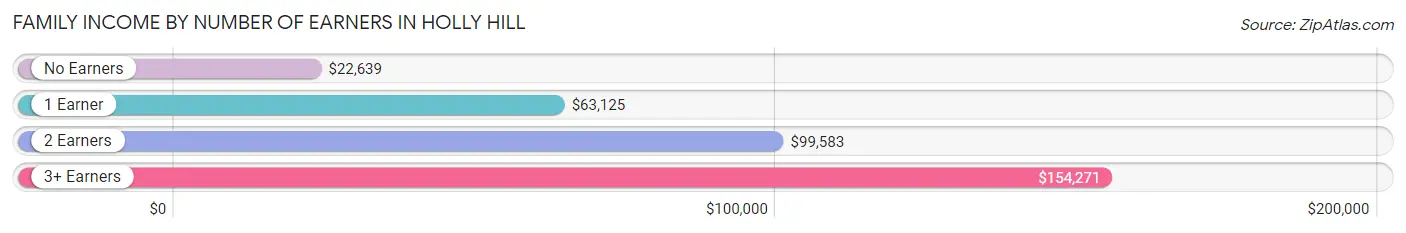
| Number of Earners | # Families | Median Income |
| No Earners | 102 (32.9%) | $22,639 |
| 1 Earner | 115 (37.1%) | $63,125 |
| 2 Earners | 70 (22.6%) | $99,583 |
| 3+ Earners | 23 (7.4%) | $154,271 |
| Total | 310 (100.0%) | $59,342 |
Household Income in Holly Hill
Household Income Brackets in Holly Hill
With 92 households falling in the category, the $15,000 to $24,999 income range is the most frequent in Holly Hill, accounting for 20.0% of all households. In contrast, only 3 households (0.6%) fall into the $200,000+ income bracket, making it the least populous group.
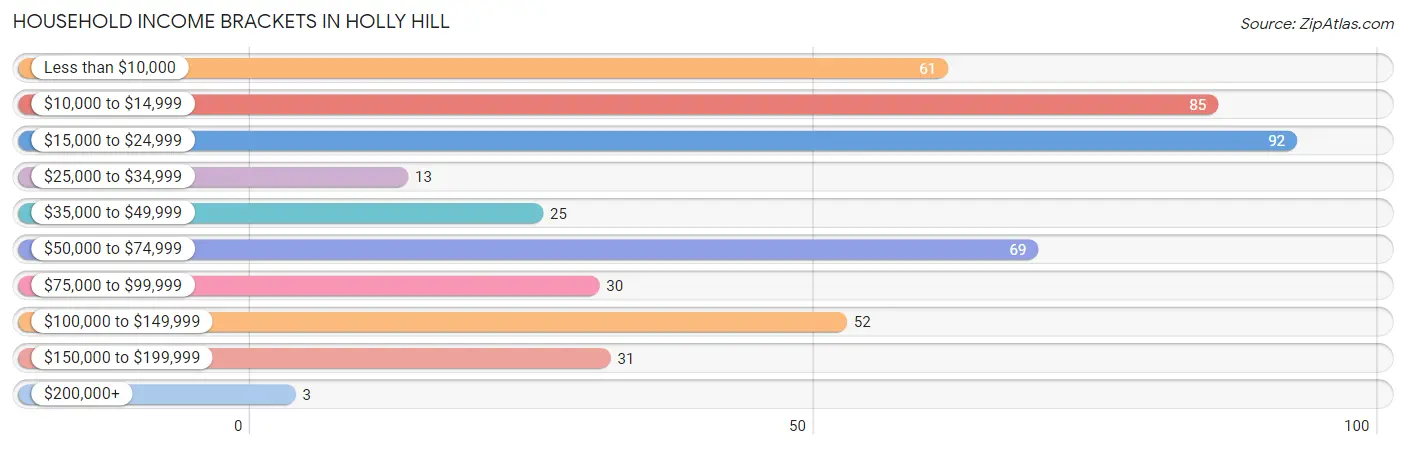
| Income Bracket | # Households | % Households |
| Less than $10,000 | 61 | 13.2% |
| $10,000 to $14,999 | 85 | 18.4% |
| $15,000 to $24,999 | 92 | 20.0% |
| $25,000 to $34,999 | 13 | 2.8% |
| $35,000 to $49,999 | 25 | 5.4% |
| $50,000 to $74,999 | 69 | 15.0% |
| $75,000 to $99,999 | 30 | 6.5% |
| $100,000 to $149,999 | 52 | 11.3% |
| $150,000 to $199,999 | 31 | 6.7% |
| $200,000+ | 3 | 0.7% |
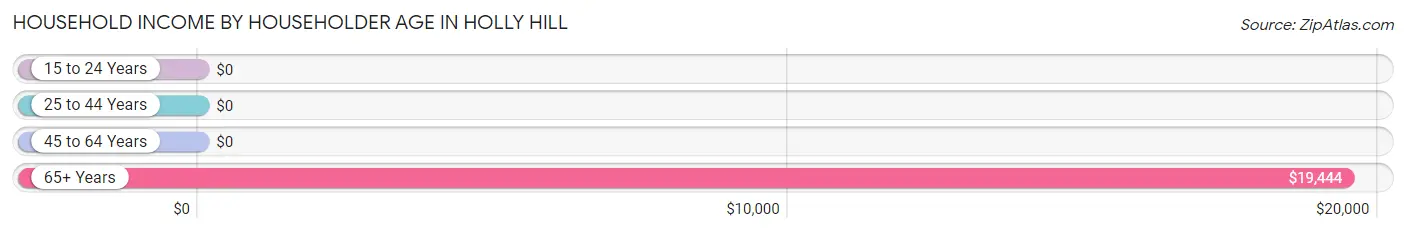
Household Income by Householder Age in Holly Hill
The median household income in Holly Hill is $24,185, with the highest median household income of $19,444 found in the 65+ years age bracket for the primary householder. A total of 188 households (40.8%) fall into this category.
| Income Bracket | # Households | Median Income |
| 15 to 24 Years | 0 (0.0%) | $0 |
| 25 to 44 Years | 132 (28.6%) | $0 |
| 45 to 64 Years | 141 (30.6%) | $0 |
| 65+ Years | 188 (40.8%) | $19,444 |
| Total | 461 (100.0%) | $24,185 |
Poverty in Holly Hill
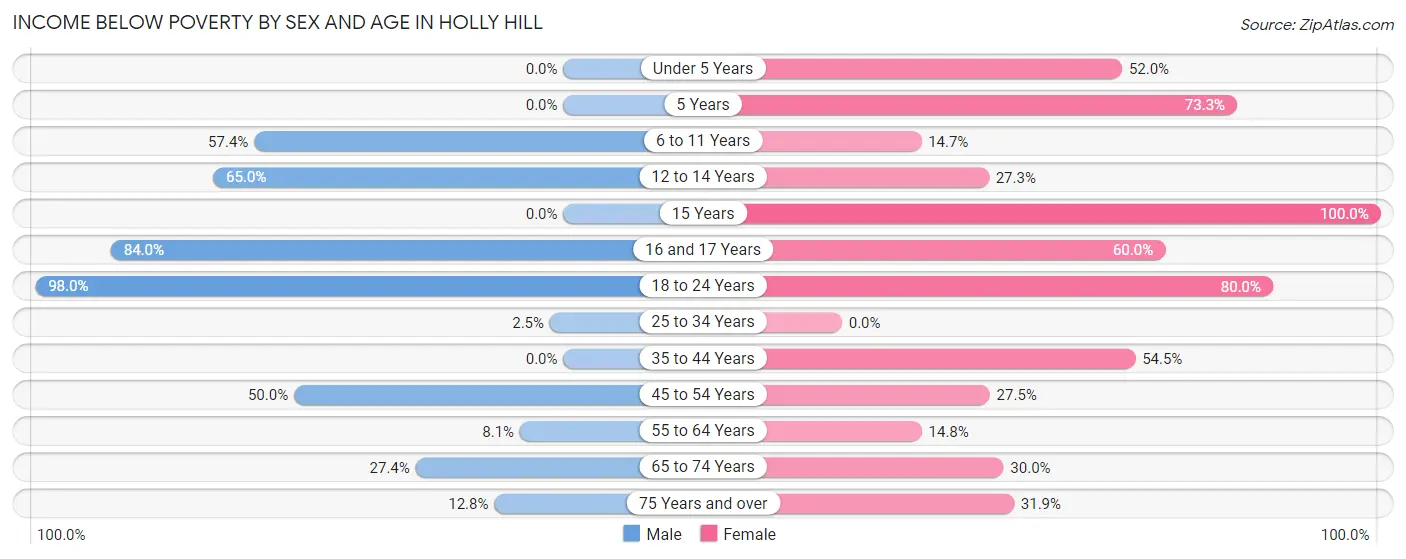
Income Below Poverty by Sex and Age in Holly Hill
With 47.7% poverty level for males and 32.6% for females among the residents of Holly Hill, 18 to 24 year old males and 15 year old females are the most vulnerable to poverty, with 149 males (98.0%) and 30 females (100.0%) in their respective age groups living below the poverty level.
| Age Bracket | Male | Female |
| Under 5 Years | 0 (0.0%) | 13 (52.0%) |
| 5 Years | 0 (0.0%) | 11 (73.3%) |
| 6 to 11 Years | 66 (57.4%) | 14 (14.7%) |
| 12 to 14 Years | 26 (65.0%) | 3 (27.3%) |
| 15 Years | 0 (0.0%) | 30 (100.0%) |
| 16 and 17 Years | 21 (84.0%) | 12 (60.0%) |
| 18 to 24 Years | 149 (98.0%) | 16 (80.0%) |
| 25 to 34 Years | 1 (2.5%) | 0 (0.0%) |
| 35 to 44 Years | 0 (0.0%) | 55 (54.5%) |
| 45 to 54 Years | 36 (50.0%) | 14 (27.5%) |
| 55 to 64 Years | 5 (8.1%) | 16 (14.8%) |
| 65 to 74 Years | 17 (27.4%) | 21 (30.0%) |
| 75 Years and over | 5 (12.8%) | 23 (31.9%) |
| Total | 326 (47.7%) | 228 (32.6%) |
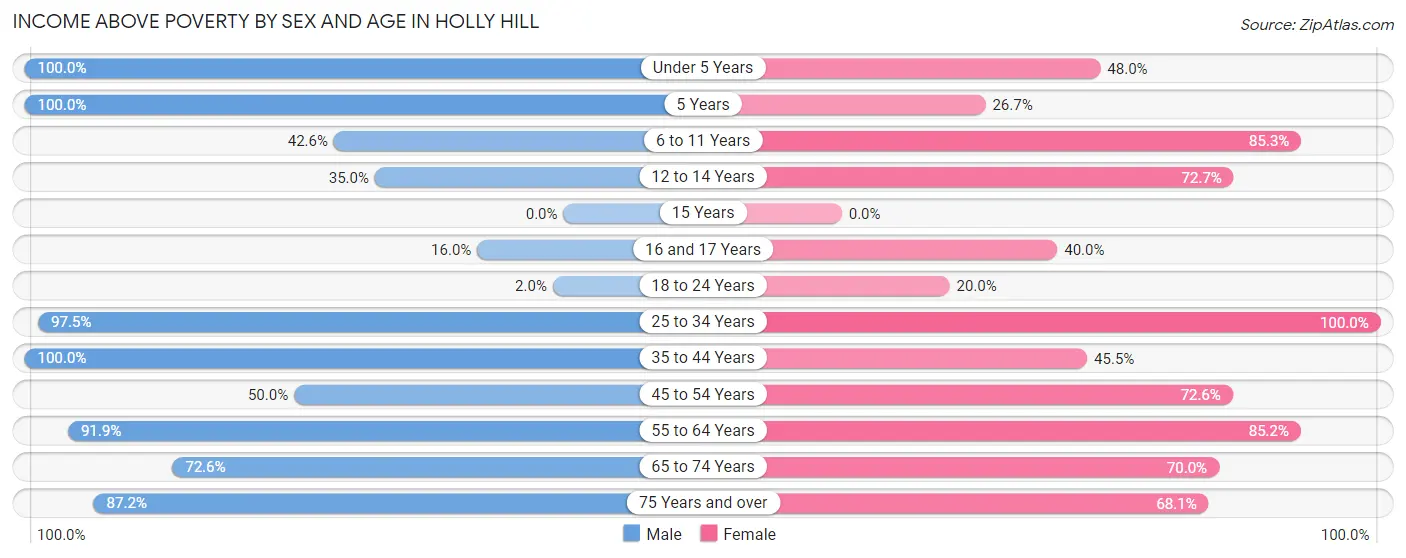
Income Above Poverty by Sex and Age in Holly Hill
According to the poverty statistics in Holly Hill, males aged under 5 years and females aged 25 to 34 years are the age groups that are most secure financially, with 100.0% of males and 100.0% of females in these age groups living above the poverty line.
| Age Bracket | Male | Female |
| Under 5 Years | 42 (100.0%) | 12 (48.0%) |
| 5 Years | 8 (100.0%) | 4 (26.7%) |
| 6 to 11 Years | 49 (42.6%) | 81 (85.3%) |
| 12 to 14 Years | 14 (35.0%) | 8 (72.7%) |
| 15 Years | 0 (0.0%) | 0 (0.0%) |
| 16 and 17 Years | 4 (16.0%) | 8 (40.0%) |
| 18 to 24 Years | 3 (2.0%) | 4 (20.0%) |
| 25 to 34 Years | 39 (97.5%) | 82 (100.0%) |
| 35 to 44 Years | 27 (100.0%) | 46 (45.5%) |
| 45 to 54 Years | 36 (50.0%) | 37 (72.6%) |
| 55 to 64 Years | 57 (91.9%) | 92 (85.2%) |
| 65 to 74 Years | 45 (72.6%) | 49 (70.0%) |
| 75 Years and over | 34 (87.2%) | 49 (68.1%) |
| Total | 358 (52.3%) | 472 (67.4%) |
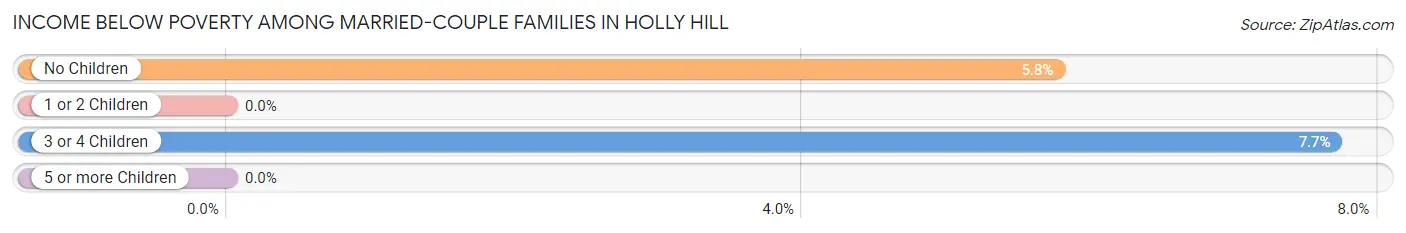
Income Below Poverty Among Married-Couple Families in Holly Hill
The poverty statistics for married-couple families in Holly Hill show that 4.9% or 11 of the total 224 families live below the poverty line. Families with 3 or 4 children have the highest poverty rate of 7.7%, comprising of 3 families. On the other hand, families with 1 or 2 children have the lowest poverty rate of 0.0%, which includes 0 families.
| Children | Above Poverty | Below Poverty |
| No Children | 131 (94.2%) | 8 (5.8%) |
| 1 or 2 Children | 46 (100.0%) | 0 (0.0%) |
| 3 or 4 Children | 36 (92.3%) | 3 (7.7%) |
| 5 or more Children | 0 (0.0%) | 0 (0.0%) |
| Total | 213 (95.1%) | 11 (4.9%) |
Income Below Poverty Among Single-Parent Households in Holly Hill
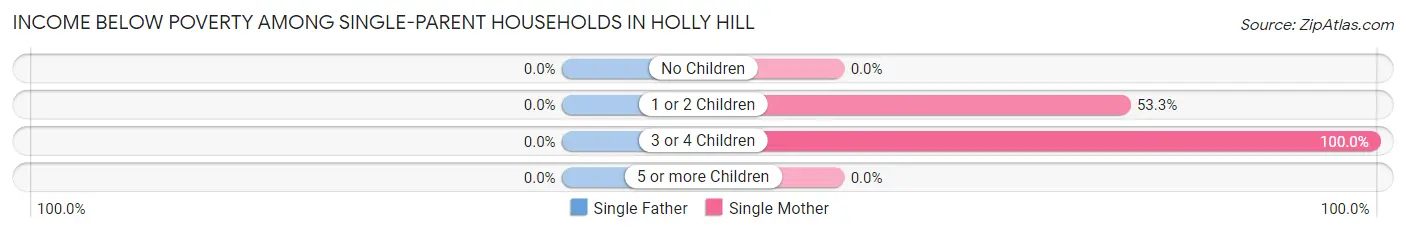
| Children | Single Father | Single Mother |
| No Children | 0 (0.0%) | 0 (0.0%) |
| 1 or 2 Children | 0 (0.0%) | 32 (53.3%) |
| 3 or 4 Children | 0 (0.0%) | 22 (100.0%) |
| 5 or more Children | 0 (0.0%) | 0 (0.0%) |
| Total | 0 (0.0%) | 54 (65.8%) |
Income Below Poverty Among Married-Couple vs Single-Parent Households in Holly Hill
The poverty data for Holly Hill shows that 11 of the married-couple family households (4.9%) and 54 of the single-parent households (62.8%) are living below the poverty level. Within the married-couple family households, those with 3 or 4 children have the highest poverty rate, with 3 households (7.7%) falling below the poverty line. Among the single-parent households, those with 3 or 4 children have the highest poverty rate, with 22 household (100.0%) living below poverty.
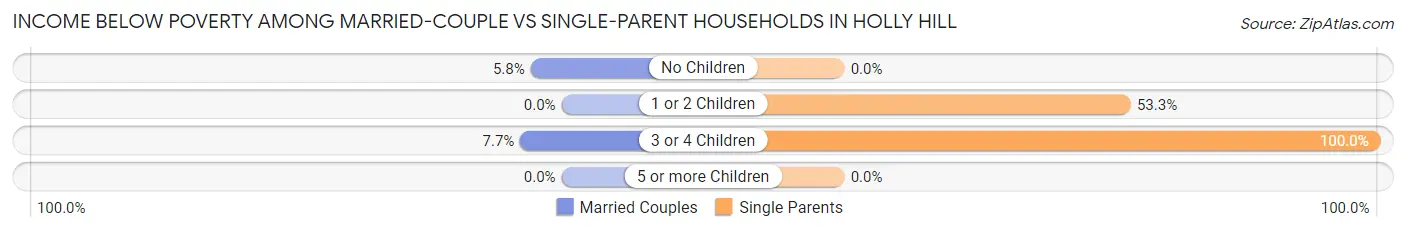
| Children | Married-Couple Families | Single-Parent Households |
| No Children | 8 (5.8%) | 0 (0.0%) |
| 1 or 2 Children | 0 (0.0%) | 32 (53.3%) |
| 3 or 4 Children | 3 (7.7%) | 22 (100.0%) |
| 5 or more Children | 0 (0.0%) | 0 (0.0%) |
| Total | 11 (4.9%) | 54 (62.8%) |
Race in Holly Hill
The most populous races in Holly Hill are Black / African American (701 | 50.6%), White / Caucasian (649 | 46.9%), and Two or more Races (23 | 1.7%).
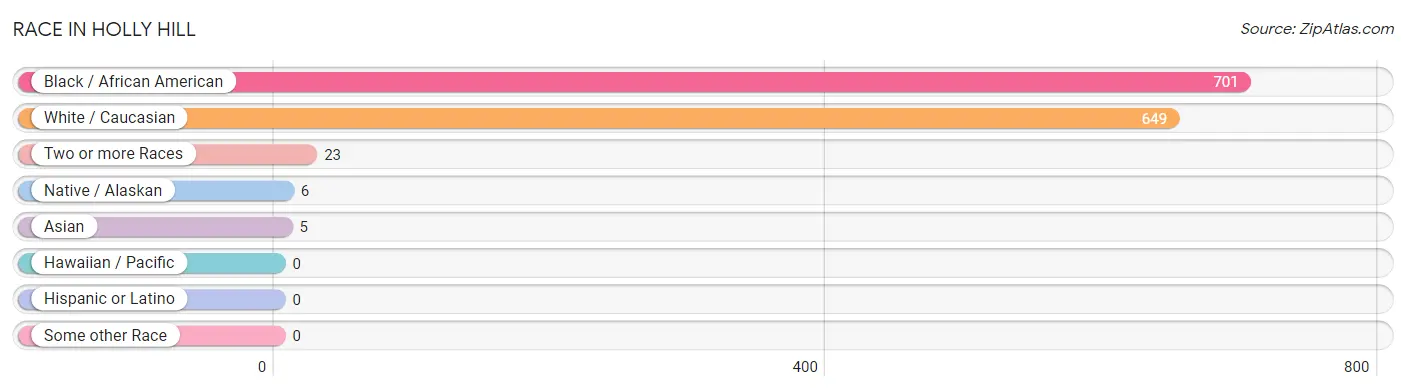
| Race | # Population | % Population |
| Asian | 5 | 0.4% |
| Black / African American | 701 | 50.6% |
| Hawaiian / Pacific | 0 | 0.0% |
| Hispanic or Latino | 0 | 0.0% |
| Native / Alaskan | 6 | 0.4% |
| White / Caucasian | 649 | 46.9% |
| Two or more Races | 23 | 1.7% |
| Some other Race | 0 | 0.0% |
| Total | 1,384 | 100.0% |
Ancestry in Holly Hill
The most populous ancestries reported in Holly Hill are English (100 | 7.2%), Irish (85 | 6.1%), Arab (33 | 2.4%), Egyptian (33 | 2.4%), and German (31 | 2.2%), together accounting for 20.4% of all Holly Hill residents.
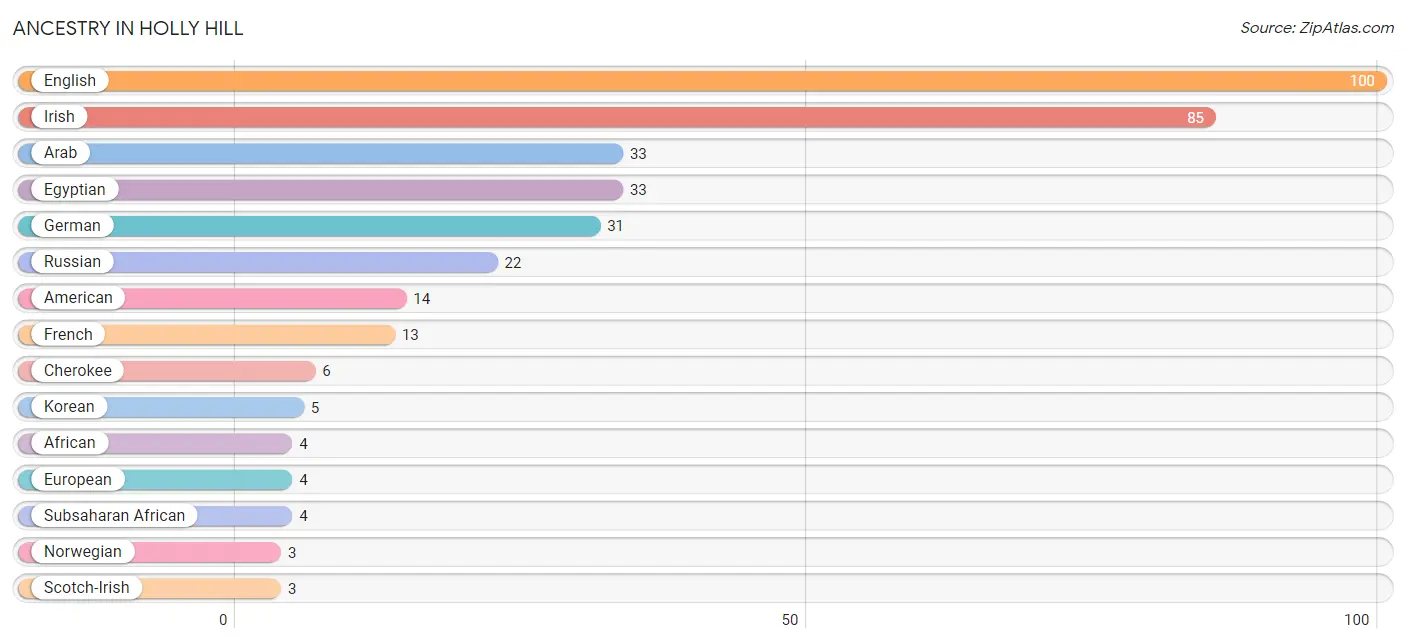
| Ancestry | # Population | % Population |
| African | 4 | 0.3% |
| American | 14 | 1.0% |
| Arab | 33 | 2.4% |
| Cherokee | 6 | 0.4% |
| Egyptian | 33 | 2.4% |
| English | 100 | 7.2% |
| European | 4 | 0.3% |
| French | 13 | 0.9% |
| German | 31 | 2.2% |
| Irish | 85 | 6.1% |
| Korean | 5 | 0.4% |
| Norwegian | 3 | 0.2% |
| Russian | 22 | 1.6% |
| Scotch-Irish | 3 | 0.2% |
| Scottish | 3 | 0.2% |
| Subsaharan African | 4 | 0.3% |
| Swedish | 3 | 0.2% | View All 17 Rows |
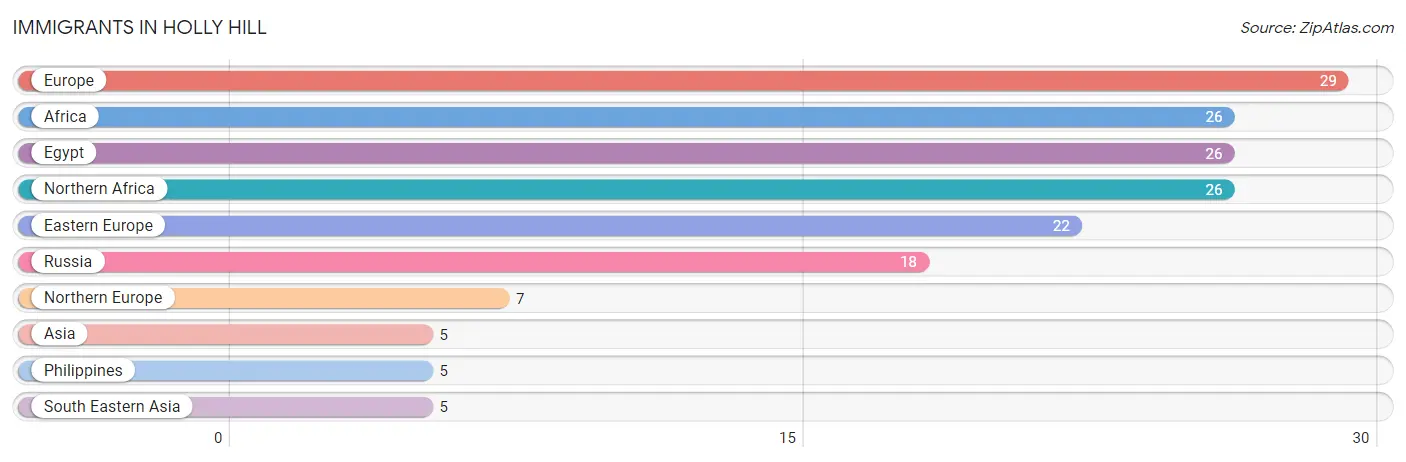
Immigrants in Holly Hill
The most numerous immigrant groups reported in Holly Hill came from Europe (29 | 2.1%), Africa (26 | 1.9%), Egypt (26 | 1.9%), Northern Africa (26 | 1.9%), and Eastern Europe (22 | 1.6%), together accounting for 9.3% of all Holly Hill residents.
| Immigration Origin | # Population | % Population |
| Africa | 26 | 1.9% |
| Asia | 5 | 0.4% |
| Eastern Europe | 22 | 1.6% |
| Egypt | 26 | 1.9% |
| Europe | 29 | 2.1% |
| Northern Africa | 26 | 1.9% |
| Northern Europe | 7 | 0.5% |
| Philippines | 5 | 0.4% |
| Russia | 18 | 1.3% |
| South Eastern Asia | 5 | 0.4% | View All 10 Rows |
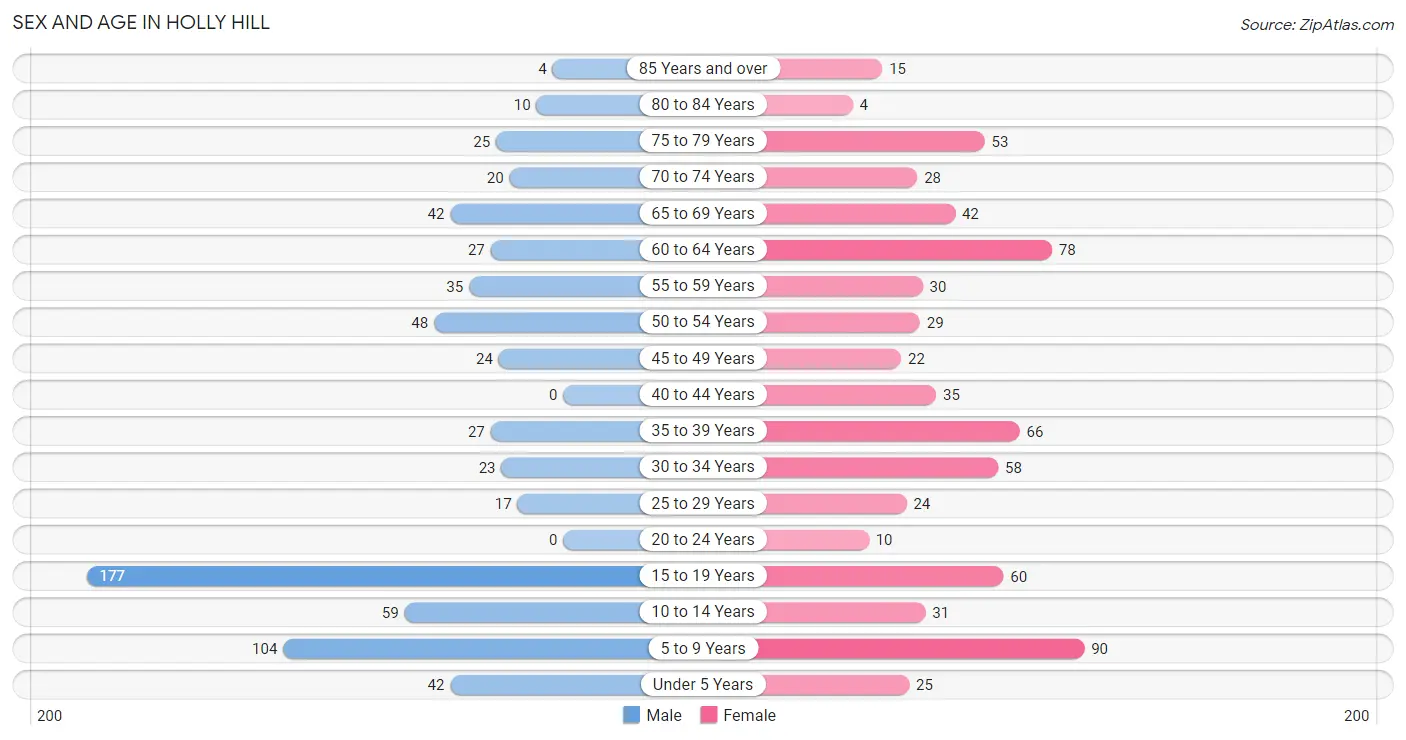
Sex and Age in Holly Hill
Sex and Age in Holly Hill
The most populous age groups in Holly Hill are 15 to 19 Years (177 | 25.9%) for men and 5 to 9 Years (90 | 12.9%) for women.
| Age Bracket | Male | Female |
| Under 5 Years | 42 (6.1%) | 25 (3.6%) |
| 5 to 9 Years | 104 (15.2%) | 90 (12.9%) |
| 10 to 14 Years | 59 (8.6%) | 31 (4.4%) |
| 15 to 19 Years | 177 (25.9%) | 60 (8.6%) |
| 20 to 24 Years | 0 (0.0%) | 10 (1.4%) |
| 25 to 29 Years | 17 (2.5%) | 24 (3.4%) |
| 30 to 34 Years | 23 (3.4%) | 58 (8.3%) |
| 35 to 39 Years | 27 (4.0%) | 66 (9.4%) |
| 40 to 44 Years | 0 (0.0%) | 35 (5.0%) |
| 45 to 49 Years | 24 (3.5%) | 22 (3.1%) |
| 50 to 54 Years | 48 (7.0%) | 29 (4.1%) |
| 55 to 59 Years | 35 (5.1%) | 30 (4.3%) |
| 60 to 64 Years | 27 (4.0%) | 78 (11.1%) |
| 65 to 69 Years | 42 (6.1%) | 42 (6.0%) |
| 70 to 74 Years | 20 (2.9%) | 28 (4.0%) |
| 75 to 79 Years | 25 (3.6%) | 53 (7.6%) |
| 80 to 84 Years | 10 (1.5%) | 4 (0.6%) |
| 85 Years and over | 4 (0.6%) | 15 (2.1%) |
| Total | 684 (100.0%) | 700 (100.0%) |
Families and Households in Holly Hill
Median Family Size in Holly Hill
The median family size in Holly Hill is 3.85 persons per family, with single female/mother families (82 | 26.5%) accounting for the largest median family size of 5.83 persons per family. On the other hand, single male/father families (4 | 1.3%) represent the smallest median family size with 1.75 persons per family.
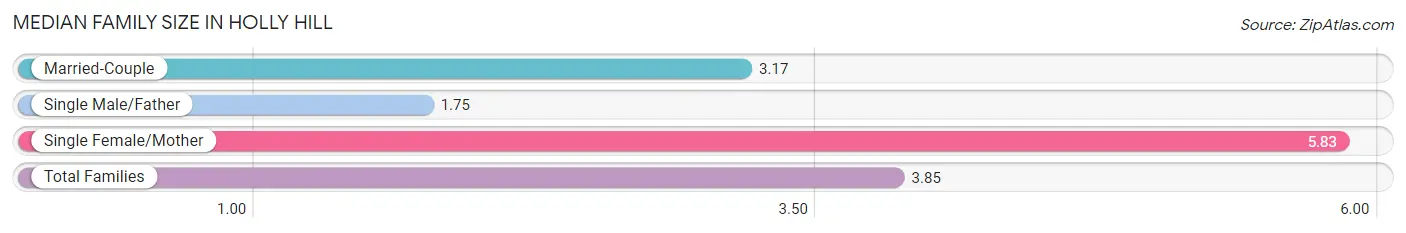
| Family Type | # Families | Family Size |
| Married-Couple | 224 (72.3%) | 3.17 |
| Single Male/Father | 4 (1.3%) | 1.75 |
| Single Female/Mother | 82 (26.5%) | 5.83 |
| Total Families | 310 (100.0%) | 3.85 |
Median Household Size in Holly Hill
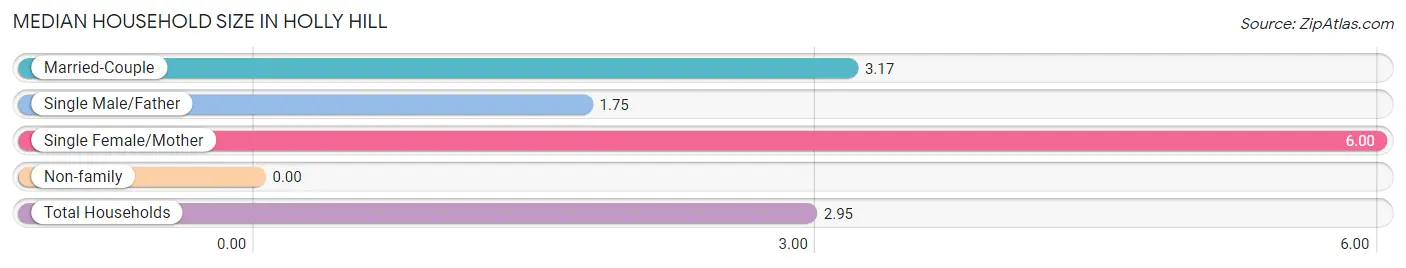
| Household Type | # Households | Household Size |
| Married-Couple | 224 (48.6%) | 3.17 |
| Single Male/Father | 4 (0.9%) | 1.75 |
| Single Female/Mother | 82 (17.8%) | 6.00 |
| Non-family | 151 (32.8%) | - |
| Total Households | 461 (100.0%) | 2.95 |
Household Size by Marriage Status in Holly Hill
Out of a total of 461 households in Holly Hill, 310 (67.2%) are family households, while 151 (32.8%) are nonfamily households. The most numerous type of family households are 2-person households, comprising 151, and the most common type of nonfamily households are 1-person households, comprising 151.
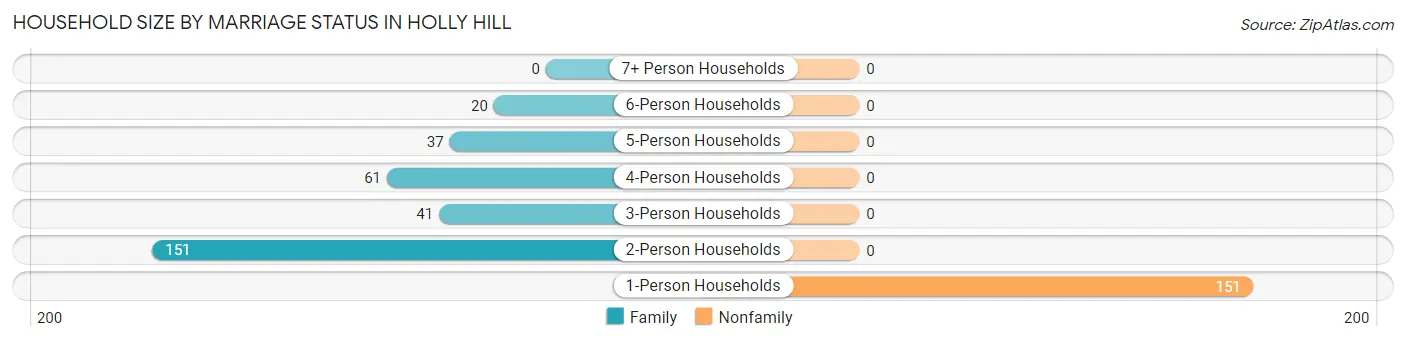
| Household Size | Family Households | Nonfamily Households |
| 1-Person Households | - | 151 (32.8%) |
| 2-Person Households | 151 (32.8%) | 0 (0.0%) |
| 3-Person Households | 41 (8.9%) | 0 (0.0%) |
| 4-Person Households | 61 (13.2%) | 0 (0.0%) |
| 5-Person Households | 37 (8.0%) | 0 (0.0%) |
| 6-Person Households | 20 (4.3%) | 0 (0.0%) |
| 7+ Person Households | 0 (0.0%) | 0 (0.0%) |
| Total | 310 (67.2%) | 151 (32.8%) |
Female Fertility in Holly Hill
Fertility by Age in Holly Hill
Average fertility rate in Holly Hill is 61.0 births per 1,000 women. Women in the age bracket of 35 to 50 years have the highest fertility rate with 87.0 births per 1,000 women. Women in the age bracket of 35 to 50 years acount for 64.7% of all women with births.
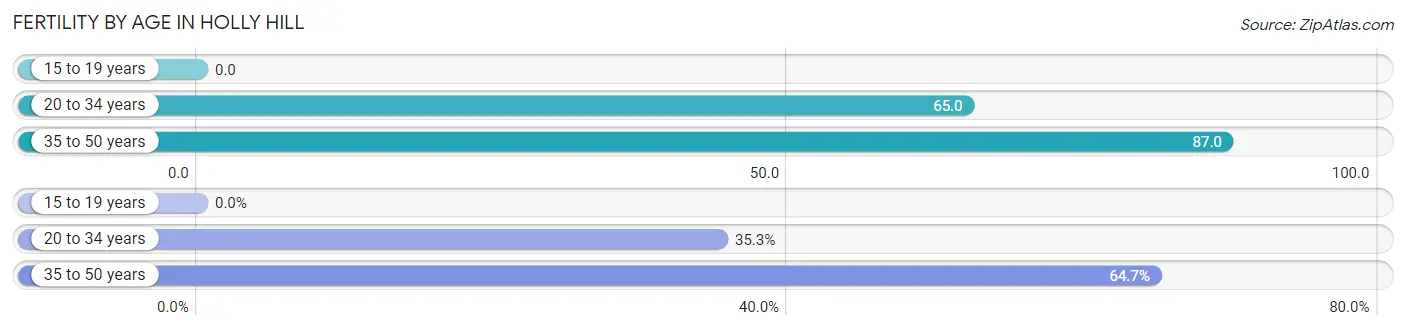
| Age Bracket | Women with Births | Births / 1,000 Women |
| 15 to 19 years | 0 (0.0%) | 0.0 |
| 20 to 34 years | 6 (35.3%) | 65.0 |
| 35 to 50 years | 11 (64.7%) | 87.0 |
| Total | 17 (100.0%) | 61.0 |
Fertility by Age by Marriage Status in Holly Hill
35.3% of women with births (17) in Holly Hill are married. The highest percentage of unmarried women with births falls into 35 to 50 years age bracket with 100.0% of them unmarried at the time of birth, while the lowest percentage of unmarried women with births belong to 20 to 34 years age bracket with 0.0% of them unmarried.
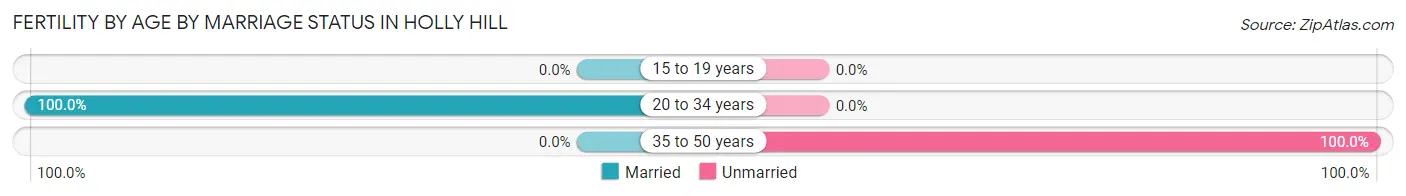
| Age Bracket | Married | Unmarried |
| 15 to 19 years | 0 (0.0%) | 0 (0.0%) |
| 20 to 34 years | 6 (100.0%) | 0 (0.0%) |
| 35 to 50 years | 0 (0.0%) | 11 (100.0%) |
| Total | 6 (35.3%) | 11 (64.7%) |
Fertility by Education in Holly Hill
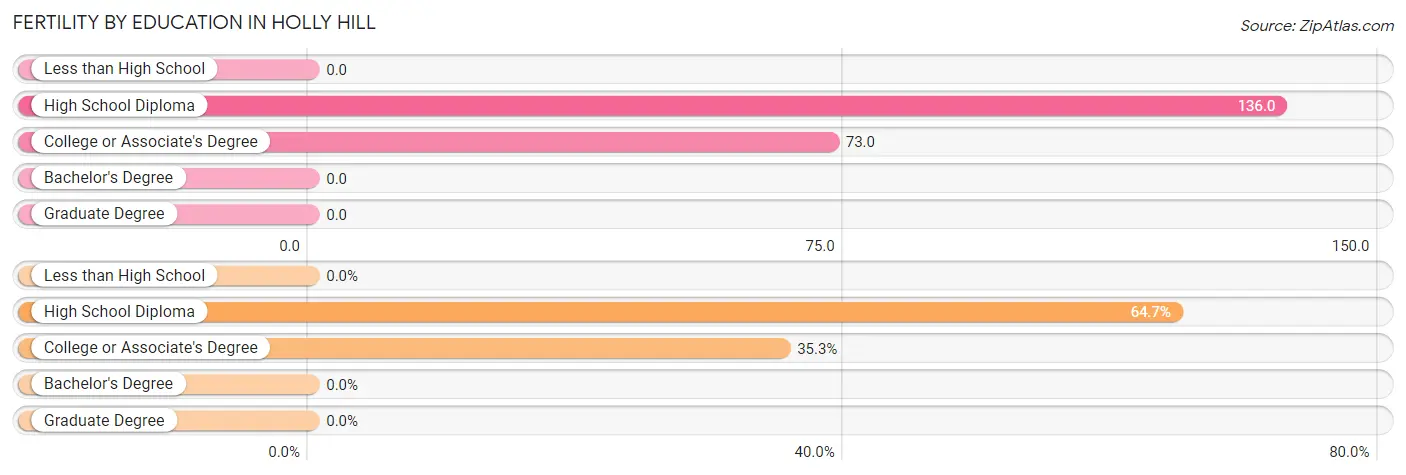
| Educational Attainment | Women with Births | Births / 1,000 Women |
| Less than High School | 0 (0.0%) | 0.0 |
| High School Diploma | 11 (64.7%) | 136.0 |
| College or Associate's Degree | 6 (35.3%) | 73.0 |
| Bachelor's Degree | 0 (0.0%) | 0.0 |
| Graduate Degree | 0 (0.0%) | 0.0 |
| Total | 17 (100.0%) | 61.0 |
Fertility by Education by Marriage Status in Holly Hill
64.7% of women with births in Holly Hill are unmarried. Women with the educational attainment of college or associate's degree are most likely to be married with 100.0% of them married at childbirth, while women with the educational attainment of high school diploma are least likely to be married with 100.0% of them unmarried at childbirth.
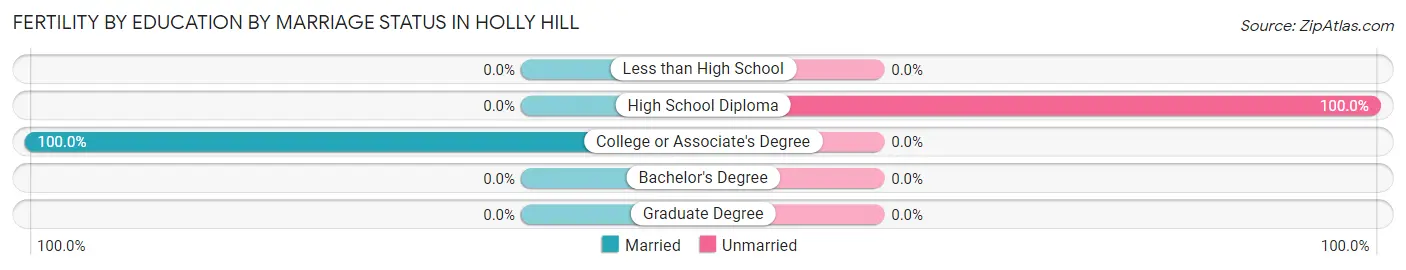
| Educational Attainment | Married | Unmarried |
| Less than High School | 0 (0.0%) | 0 (0.0%) |
| High School Diploma | 0 (0.0%) | 11 (100.0%) |
| College or Associate's Degree | 6 (100.0%) | 0 (0.0%) |
| Bachelor's Degree | 0 (0.0%) | 0 (0.0%) |
| Graduate Degree | 0 (0.0%) | 0 (0.0%) |
| Total | 6 (35.3%) | 11 (64.7%) |
Employment Characteristics in Holly Hill
Employment by Class of Employer in Holly Hill
Among the 323 employed individuals in Holly Hill, private company employees (240 | 74.3%), local government employees (21 | 6.5%), and federal government employees (21 | 6.5%) make up the most common classes of employment.
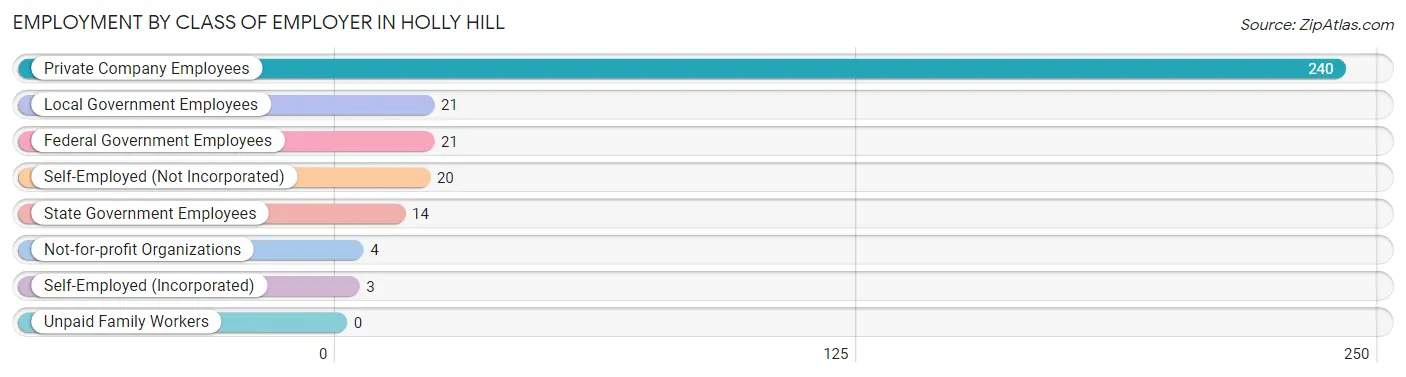
| Employer Class | # Employees | % Employees |
| Private Company Employees | 240 | 74.3% |
| Self-Employed (Incorporated) | 3 | 0.9% |
| Self-Employed (Not Incorporated) | 20 | 6.2% |
| Not-for-profit Organizations | 4 | 1.2% |
| Local Government Employees | 21 | 6.5% |
| State Government Employees | 14 | 4.3% |
| Federal Government Employees | 21 | 6.5% |
| Unpaid Family Workers | 0 | 0.0% |
| Total | 323 | 100.0% |
Employment Status by Age in Holly Hill
According to the labor force statistics for Holly Hill, out of the total population over 16 years of age (1,003), 35.5% or 356 individuals are in the labor force, with 6.5% or 23 of them unemployed. The age group with the highest labor force participation rate is 25 to 29 years, with 97.6% or 40 individuals in the labor force. Within the labor force, the 60 to 64 years age range has the highest percentage of unemployed individuals, with 30.3% or 10 of them being unemployed.
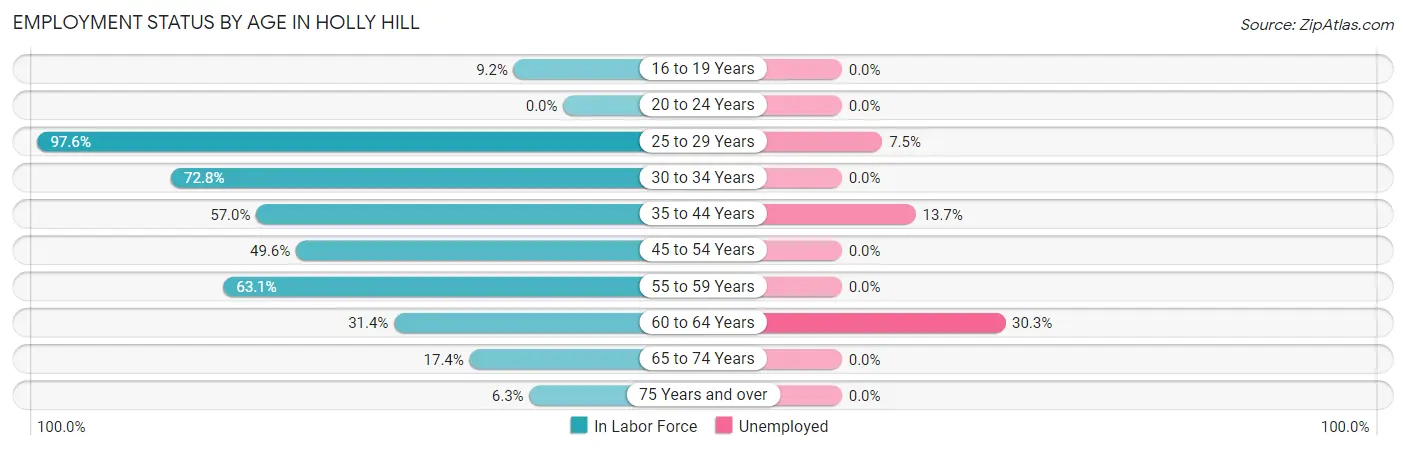
| Age Bracket | In Labor Force | Unemployed |
| 16 to 19 Years | 19 (9.2%) | 0 (0.0%) |
| 20 to 24 Years | 0 (0.0%) | 0 (0.0%) |
| 25 to 29 Years | 40 (97.6%) | 3 (7.5%) |
| 30 to 34 Years | 59 (72.8%) | 0 (0.0%) |
| 35 to 44 Years | 73 (57.0%) | 10 (13.7%) |
| 45 to 54 Years | 61 (49.6%) | 0 (0.0%) |
| 55 to 59 Years | 41 (63.1%) | 0 (0.0%) |
| 60 to 64 Years | 33 (31.4%) | 10 (30.3%) |
| 65 to 74 Years | 23 (17.4%) | 0 (0.0%) |
| 75 Years and over | 7 (6.3%) | 0 (0.0%) |
| Total | 356 (35.5%) | 23 (6.5%) |
Employment Status by Educational Attainment in Holly Hill
According to labor force statistics for Holly Hill, 56.5% of individuals (307) out of the total population between 25 and 64 years of age (543) are in the labor force, with 7.5% or 23 of them being unemployed. The group with the highest labor force participation rate are those with the educational attainment of college / associate degree, with 76.0% or 152 individuals in the labor force. Within the labor force, individuals with bachelor's degree or higher education have the highest percentage of unemployment, with 21.3% or 10 of them being unemployed.
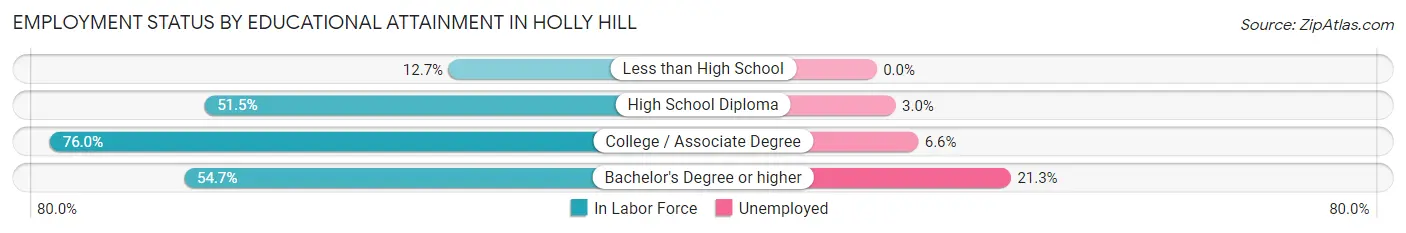
| Educational Attainment | In Labor Force | Unemployed |
| Less than High School | 8 (12.7%) | 0 (0.0%) |
| High School Diploma | 100 (51.5%) | 6 (3.0%) |
| College / Associate Degree | 152 (76.0%) | 13 (6.6%) |
| Bachelor's Degree or higher | 47 (54.7%) | 18 (21.3%) |
| Total | 307 (56.5%) | 41 (7.5%) |
Employment Occupations by Sex in Holly Hill
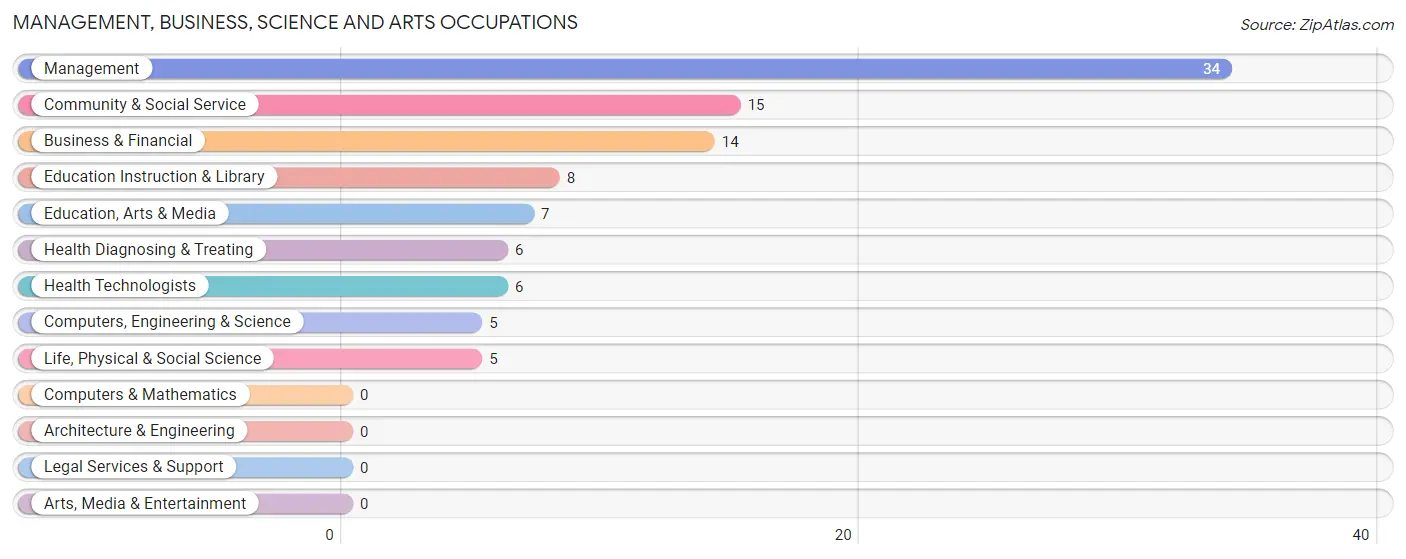
Management, Business, Science and Arts Occupations
The most common Management, Business, Science and Arts occupations in Holly Hill are Management (34 | 10.2%), Community & Social Service (15 | 4.5%), Business & Financial (14 | 4.2%), Education Instruction & Library (8 | 2.4%), and Education, Arts & Media (7 | 2.1%).
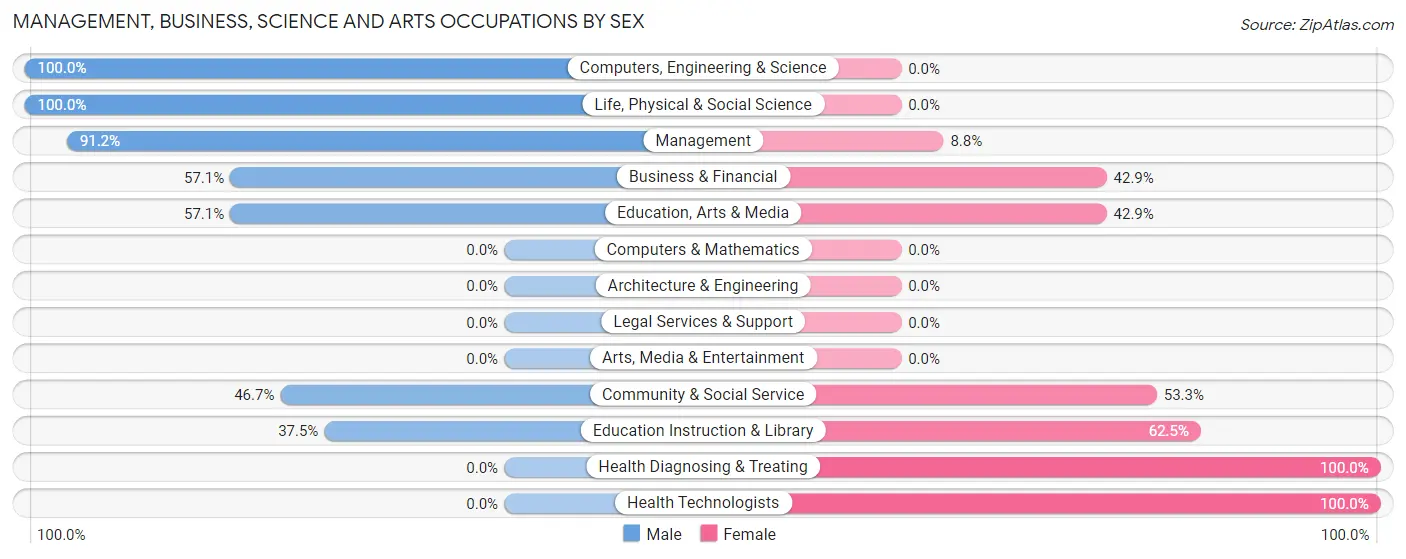
Management, Business, Science and Arts Occupations by Sex
Within the Management, Business, Science and Arts occupations in Holly Hill, the most male-oriented occupations are Computers, Engineering & Science (100.0%), Life, Physical & Social Science (100.0%), and Management (91.2%), while the most female-oriented occupations are Health Diagnosing & Treating (100.0%), Health Technologists (100.0%), and Education Instruction & Library (62.5%).
| Occupation | Male | Female |
| Management | 31 (91.2%) | 3 (8.8%) |
| Business & Financial | 8 (57.1%) | 6 (42.9%) |
| Computers, Engineering & Science | 5 (100.0%) | 0 (0.0%) |
| Computers & Mathematics | 0 (0.0%) | 0 (0.0%) |
| Architecture & Engineering | 0 (0.0%) | 0 (0.0%) |
| Life, Physical & Social Science | 5 (100.0%) | 0 (0.0%) |
| Community & Social Service | 7 (46.7%) | 8 (53.3%) |
| Education, Arts & Media | 4 (57.1%) | 3 (42.9%) |
| Legal Services & Support | 0 (0.0%) | 0 (0.0%) |
| Education Instruction & Library | 3 (37.5%) | 5 (62.5%) |
| Arts, Media & Entertainment | 0 (0.0%) | 0 (0.0%) |
| Health Diagnosing & Treating | 0 (0.0%) | 6 (100.0%) |
| Health Technologists | 0 (0.0%) | 6 (100.0%) |
| Total (Category) | 51 (68.9%) | 23 (31.1%) |
| Total (Overall) | 158 (47.4%) | 175 (52.5%) |
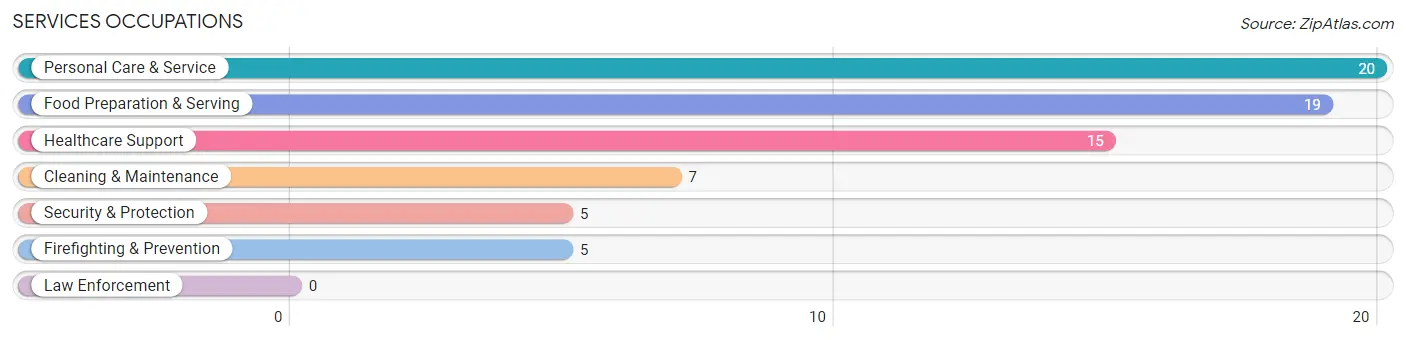
Services Occupations
The most common Services occupations in Holly Hill are Personal Care & Service (20 | 6.0%), Food Preparation & Serving (19 | 5.7%), Healthcare Support (15 | 4.5%), Cleaning & Maintenance (7 | 2.1%), and Security & Protection (5 | 1.5%).
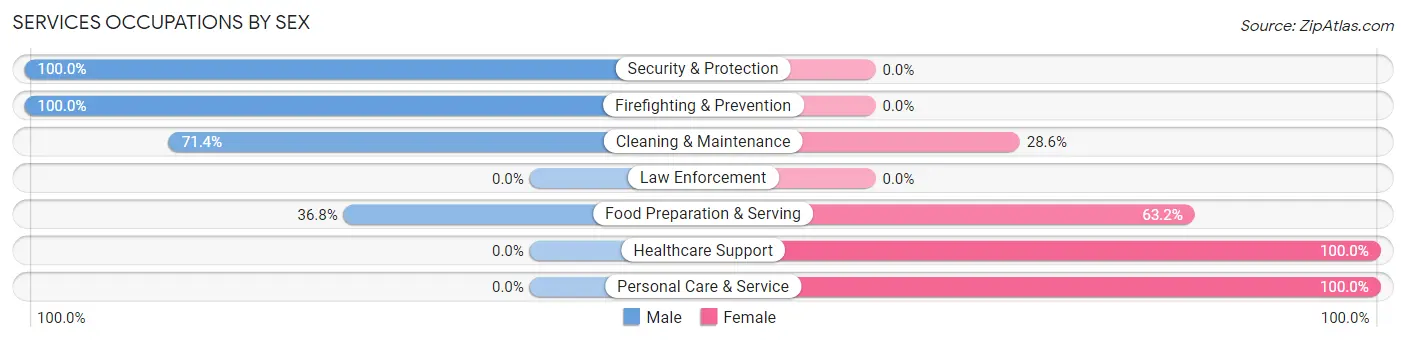
Services Occupations by Sex
Within the Services occupations in Holly Hill, the most male-oriented occupations are Security & Protection (100.0%), Firefighting & Prevention (100.0%), and Cleaning & Maintenance (71.4%), while the most female-oriented occupations are Healthcare Support (100.0%), Personal Care & Service (100.0%), and Food Preparation & Serving (63.2%).
| Occupation | Male | Female |
| Healthcare Support | 0 (0.0%) | 15 (100.0%) |
| Security & Protection | 5 (100.0%) | 0 (0.0%) |
| Firefighting & Prevention | 5 (100.0%) | 0 (0.0%) |
| Law Enforcement | 0 (0.0%) | 0 (0.0%) |
| Food Preparation & Serving | 7 (36.8%) | 12 (63.2%) |
| Cleaning & Maintenance | 5 (71.4%) | 2 (28.6%) |
| Personal Care & Service | 0 (0.0%) | 20 (100.0%) |
| Total (Category) | 17 (25.8%) | 49 (74.2%) |
| Total (Overall) | 158 (47.4%) | 175 (52.5%) |
Sales and Office Occupations
The most common Sales and Office occupations in Holly Hill are Office & Administration (61 | 18.3%), and Sales & Related (37 | 11.1%).
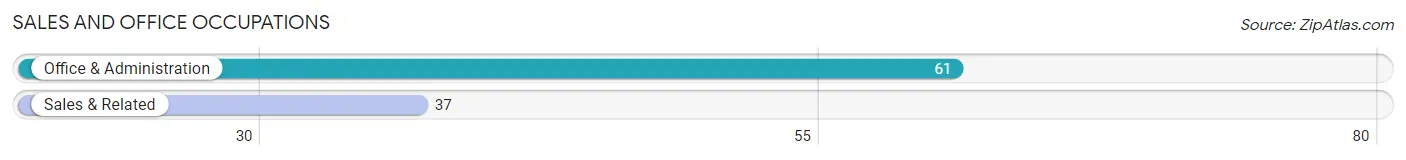
Sales and Office Occupations by Sex
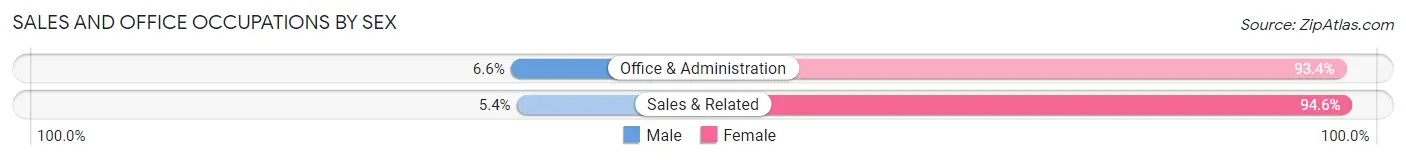
| Occupation | Male | Female |
| Sales & Related | 2 (5.4%) | 35 (94.6%) |
| Office & Administration | 4 (6.6%) | 57 (93.4%) |
| Total (Category) | 6 (6.1%) | 92 (93.9%) |
| Total (Overall) | 158 (47.4%) | 175 (52.5%) |
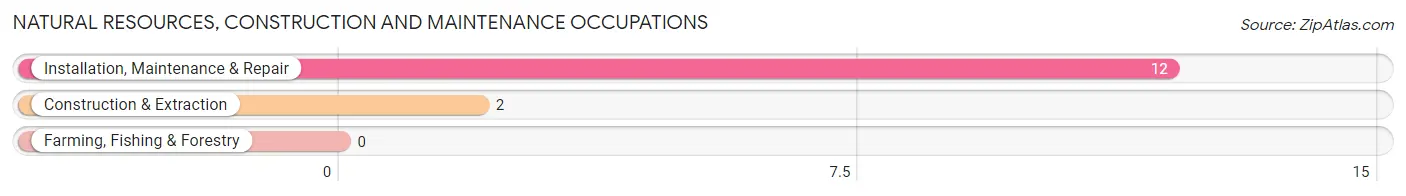
Natural Resources, Construction and Maintenance Occupations
The most common Natural Resources, Construction and Maintenance occupations in Holly Hill are Installation, Maintenance & Repair (12 | 3.6%), and Construction & Extraction (2 | 0.6%).
Natural Resources, Construction and Maintenance Occupations by Sex
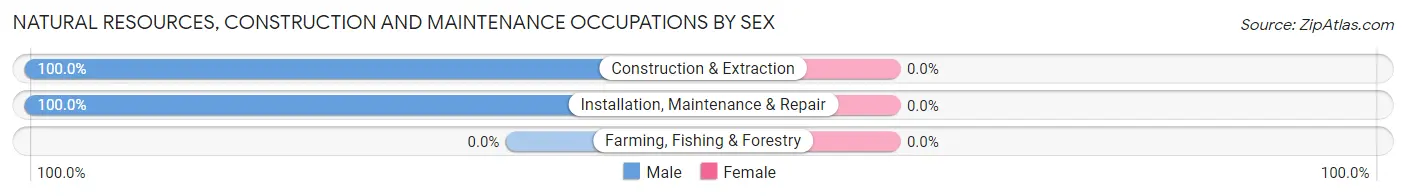
| Occupation | Male | Female |
| Farming, Fishing & Forestry | 0 (0.0%) | 0 (0.0%) |
| Construction & Extraction | 2 (100.0%) | 0 (0.0%) |
| Installation, Maintenance & Repair | 12 (100.0%) | 0 (0.0%) |
| Total (Category) | 14 (100.0%) | 0 (0.0%) |
| Total (Overall) | 158 (47.4%) | 175 (52.5%) |
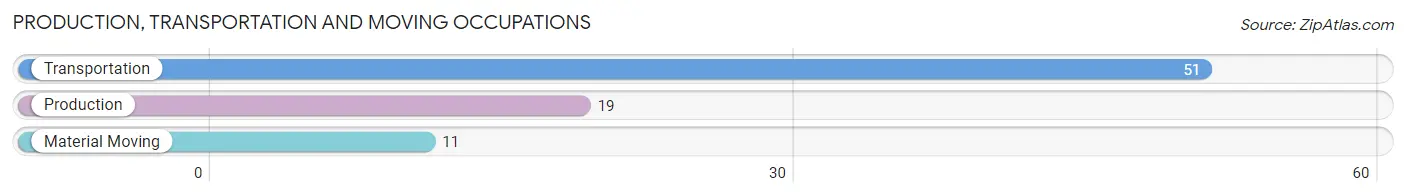
Production, Transportation and Moving Occupations
The most common Production, Transportation and Moving occupations in Holly Hill are Transportation (51 | 15.3%), Production (19 | 5.7%), and Material Moving (11 | 3.3%).
Production, Transportation and Moving Occupations by Sex
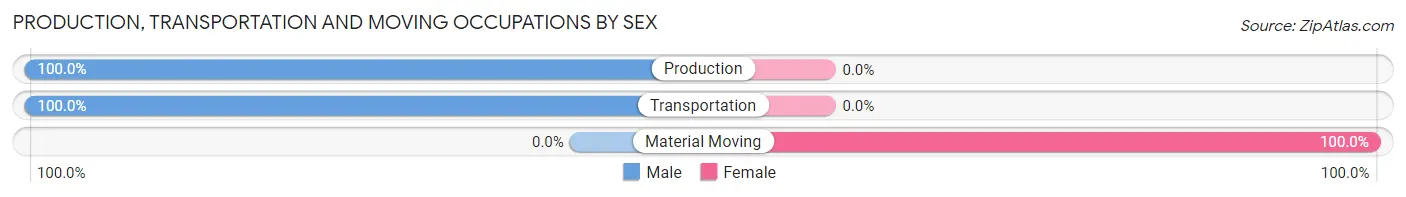
| Occupation | Male | Female |
| Production | 19 (100.0%) | 0 (0.0%) |
| Transportation | 51 (100.0%) | 0 (0.0%) |
| Material Moving | 0 (0.0%) | 11 (100.0%) |
| Total (Category) | 70 (86.4%) | 11 (13.6%) |
| Total (Overall) | 158 (47.4%) | 175 (52.5%) |
Employment Industries by Sex in Holly Hill
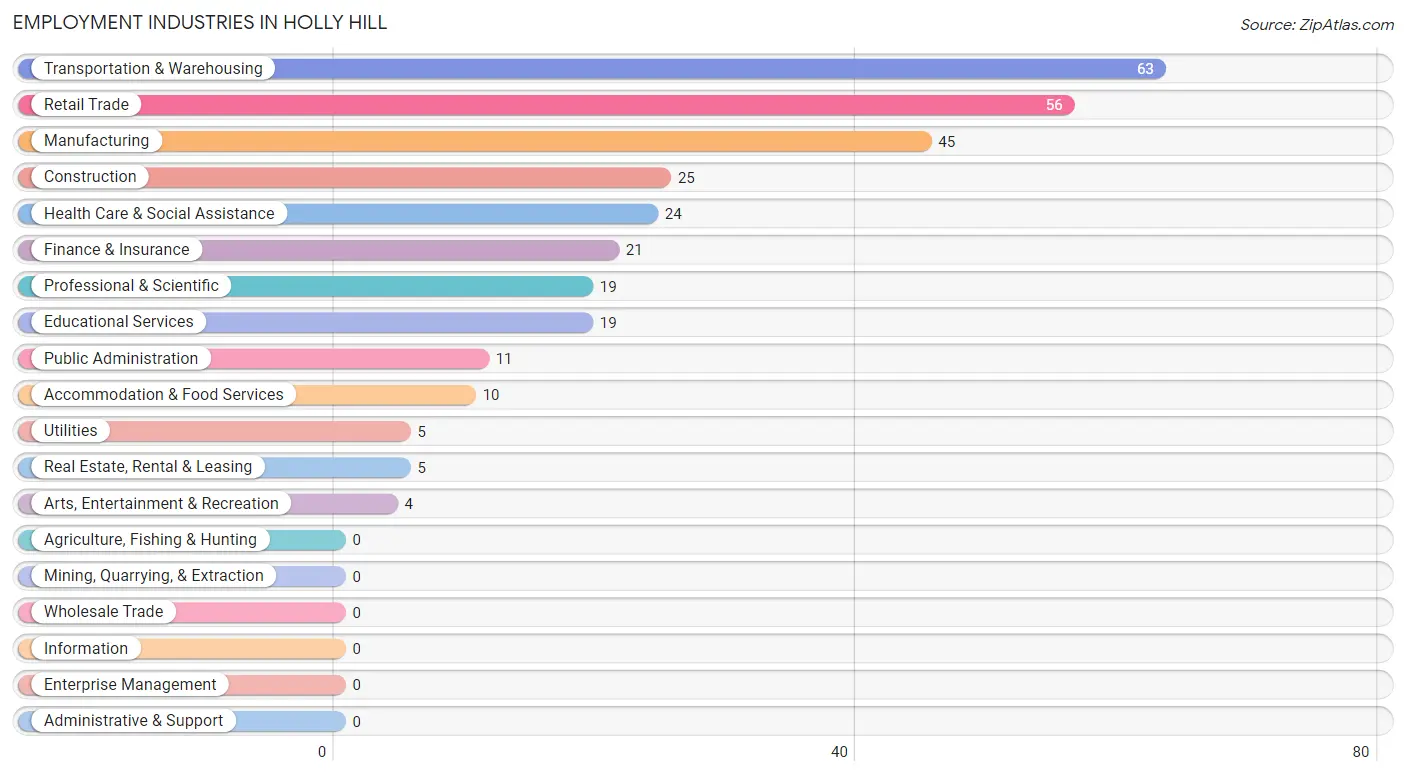
Employment Industries in Holly Hill
The major employment industries in Holly Hill include Transportation & Warehousing (63 | 18.9%), Retail Trade (56 | 16.8%), Manufacturing (45 | 13.5%), Construction (25 | 7.5%), and Health Care & Social Assistance (24 | 7.2%).
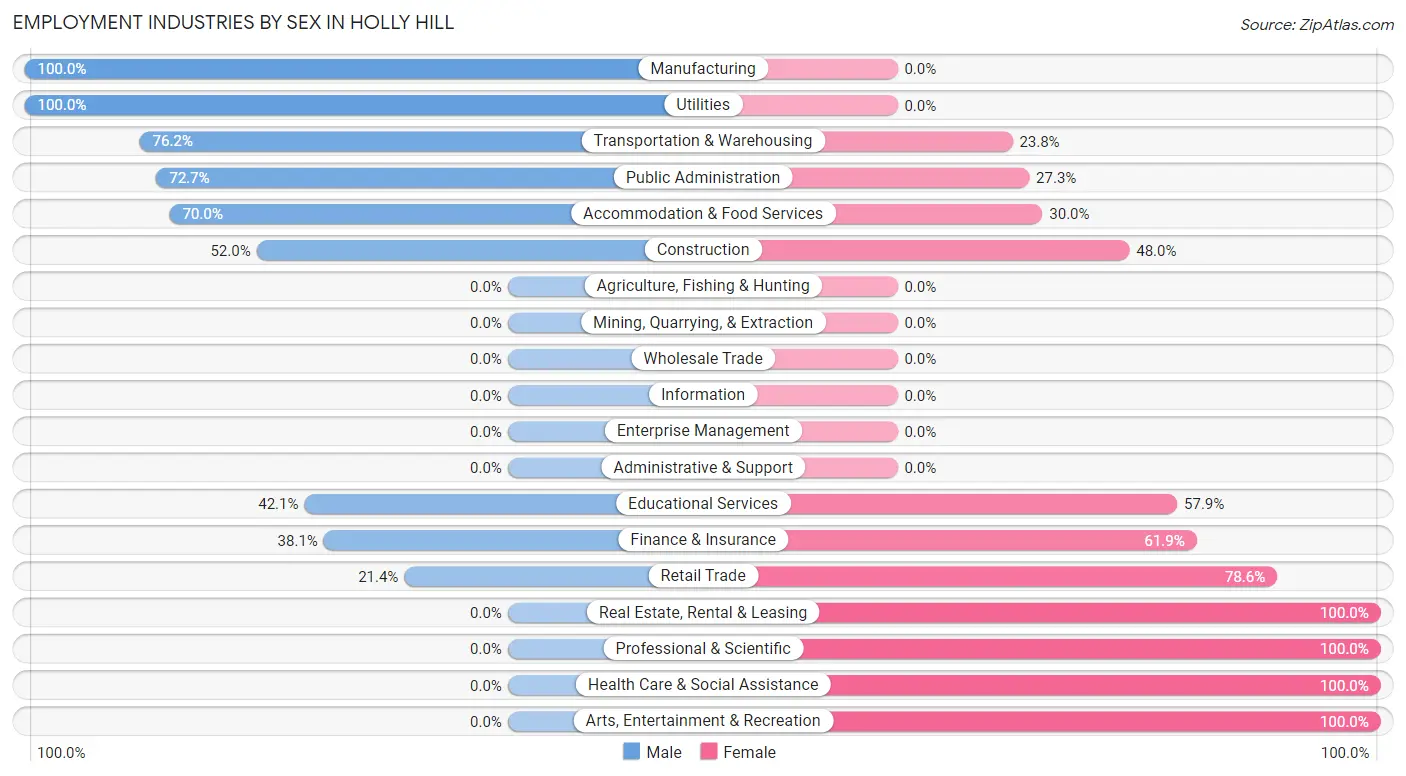
Employment Industries by Sex in Holly Hill
The Holly Hill industries that see more men than women are Manufacturing (100.0%), Utilities (100.0%), and Transportation & Warehousing (76.2%), whereas the industries that tend to have a higher number of women are Real Estate, Rental & Leasing (100.0%), Professional & Scientific (100.0%), and Health Care & Social Assistance (100.0%).
| Industry | Male | Female |
| Agriculture, Fishing & Hunting | 0 (0.0%) | 0 (0.0%) |
| Mining, Quarrying, & Extraction | 0 (0.0%) | 0 (0.0%) |
| Construction | 13 (52.0%) | 12 (48.0%) |
| Manufacturing | 45 (100.0%) | 0 (0.0%) |
| Wholesale Trade | 0 (0.0%) | 0 (0.0%) |
| Retail Trade | 12 (21.4%) | 44 (78.6%) |
| Transportation & Warehousing | 48 (76.2%) | 15 (23.8%) |
| Utilities | 5 (100.0%) | 0 (0.0%) |
| Information | 0 (0.0%) | 0 (0.0%) |
| Finance & Insurance | 8 (38.1%) | 13 (61.9%) |
| Real Estate, Rental & Leasing | 0 (0.0%) | 5 (100.0%) |
| Professional & Scientific | 0 (0.0%) | 19 (100.0%) |
| Enterprise Management | 0 (0.0%) | 0 (0.0%) |
| Administrative & Support | 0 (0.0%) | 0 (0.0%) |
| Educational Services | 8 (42.1%) | 11 (57.9%) |
| Health Care & Social Assistance | 0 (0.0%) | 24 (100.0%) |
| Arts, Entertainment & Recreation | 0 (0.0%) | 4 (100.0%) |
| Accommodation & Food Services | 7 (70.0%) | 3 (30.0%) |
| Public Administration | 8 (72.7%) | 3 (27.3%) |
| Total | 158 (47.4%) | 175 (52.5%) |
Education in Holly Hill
School Enrollment in Holly Hill
The most common levels of schooling among the 545 students in Holly Hill are high school (209 | 38.4%), elementary school (179 | 32.8%), and middle school (77 | 14.1%).
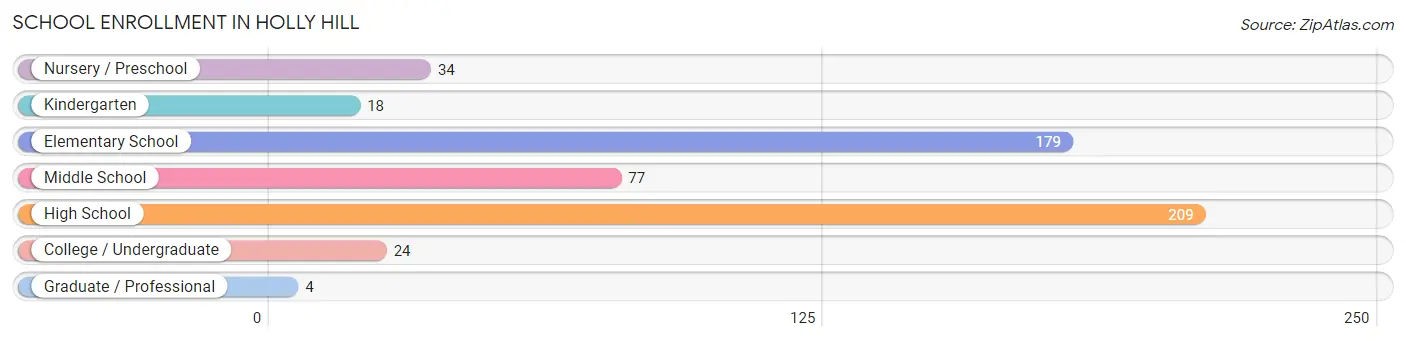
| School Level | # Students | % Students |
| Nursery / Preschool | 34 | 6.2% |
| Kindergarten | 18 | 3.3% |
| Elementary School | 179 | 32.8% |
| Middle School | 77 | 14.1% |
| High School | 209 | 38.4% |
| College / Undergraduate | 24 | 4.4% |
| Graduate / Professional | 4 | 0.7% |
| Total | 545 | 100.0% |
School Enrollment by Age by Funding Source in Holly Hill
Out of a total of 545 students who are enrolled in schools in Holly Hill, 93 (17.1%) attend a private institution, while the remaining 452 (82.9%) are enrolled in public schools. The age group of 3 to 4 year olds has the highest likelihood of being enrolled in private schools, with 34 (100.0% in the age bracket) enrolled. Conversely, the age group of 15 to 17 year olds has the lowest likelihood of being enrolled in a private school, with 71 (100.0% in the age bracket) attending a public institution.
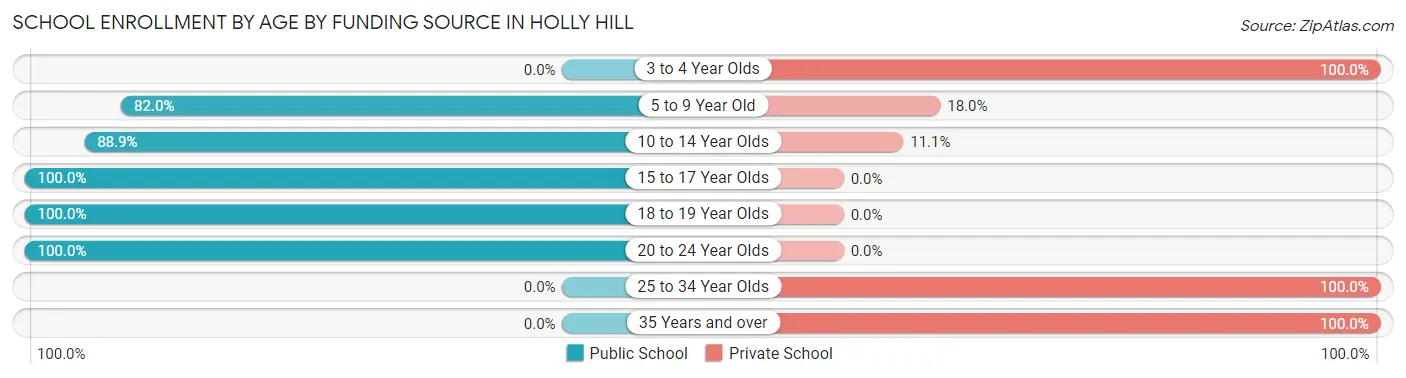
| Age Bracket | Public School | Private School |
| 3 to 4 Year Olds | 0 (0.0%) | 34 (100.0%) |
| 5 to 9 Year Old | 155 (82.0%) | 34 (18.0%) |
| 10 to 14 Year Olds | 80 (88.9%) | 10 (11.1%) |
| 15 to 17 Year Olds | 71 (100.0%) | 0 (0.0%) |
| 18 to 19 Year Olds | 136 (100.0%) | 0 (0.0%) |
| 20 to 24 Year Olds | 10 (100.0%) | 0 (0.0%) |
| 25 to 34 Year Olds | 0 (0.0%) | 11 (100.0%) |
| 35 Years and over | 0 (0.0%) | 4 (100.0%) |
| Total | 452 (82.9%) | 93 (17.1%) |
Educational Attainment by Field of Study in Holly Hill
Education (67 | 41.4%), science & technology (23 | 14.2%), arts & humanities (17 | 10.5%), physical & health sciences (12 | 7.4%), and psychology (11 | 6.8%) are the most common fields of study among 162 individuals in Holly Hill who have obtained a bachelor's degree or higher.
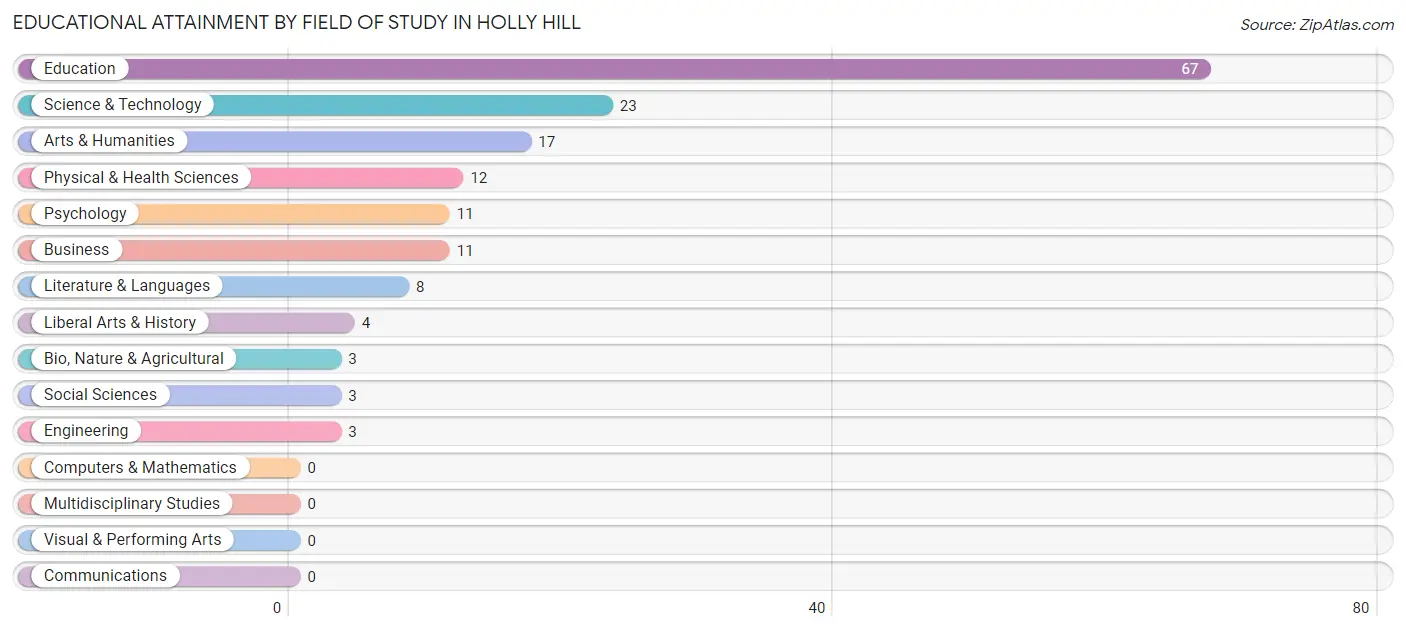
| Field of Study | # Graduates | % Graduates |
| Computers & Mathematics | 0 | 0.0% |
| Bio, Nature & Agricultural | 3 | 1.8% |
| Physical & Health Sciences | 12 | 7.4% |
| Psychology | 11 | 6.8% |
| Social Sciences | 3 | 1.8% |
| Engineering | 3 | 1.8% |
| Multidisciplinary Studies | 0 | 0.0% |
| Science & Technology | 23 | 14.2% |
| Business | 11 | 6.8% |
| Education | 67 | 41.4% |
| Literature & Languages | 8 | 4.9% |
| Liberal Arts & History | 4 | 2.5% |
| Visual & Performing Arts | 0 | 0.0% |
| Communications | 0 | 0.0% |
| Arts & Humanities | 17 | 10.5% |
| Total | 162 | 100.0% |
Transportation & Commute in Holly Hill
Vehicle Availability by Sex in Holly Hill
The most prevalent vehicle ownership categories in Holly Hill are males with 2 vehicles (74, accounting for 50.0%) and females with 2 vehicles (47, making up 42.3%).
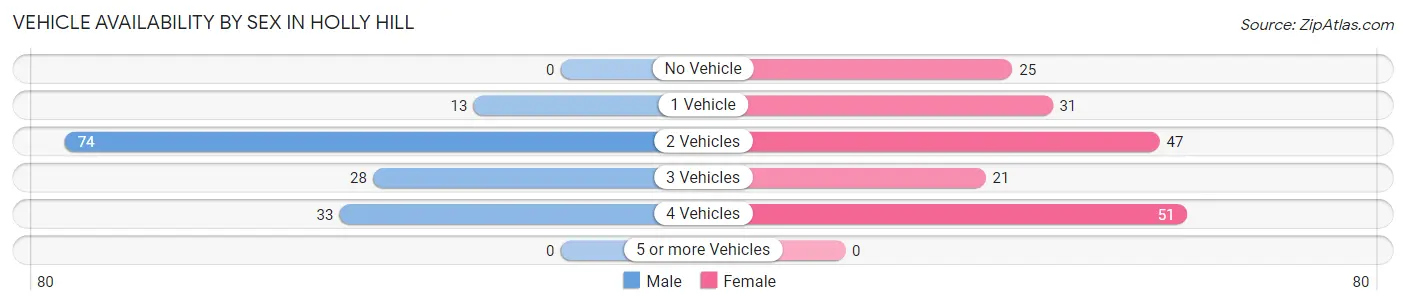
| Vehicles Available | Male | Female |
| No Vehicle | 0 (0.0%) | 25 (14.3%) |
| 1 Vehicle | 13 (8.8%) | 31 (17.7%) |
| 2 Vehicles | 74 (50.0%) | 47 (26.9%) |
| 3 Vehicles | 28 (18.9%) | 21 (12.0%) |
| 4 Vehicles | 33 (22.3%) | 51 (29.1%) |
| 5 or more Vehicles | 0 (0.0%) | 0 (0.0%) |
| Total | 148 (100.0%) | 175 (100.0%) |
Commute Time in Holly Hill
The most frequently occuring commute durations in Holly Hill are 45 to 59 minutes (97 commuters, 30.5%), 5 to 9 minutes (71 commuters, 22.3%), and 60 to 89 minutes (26 commuters, 8.2%).
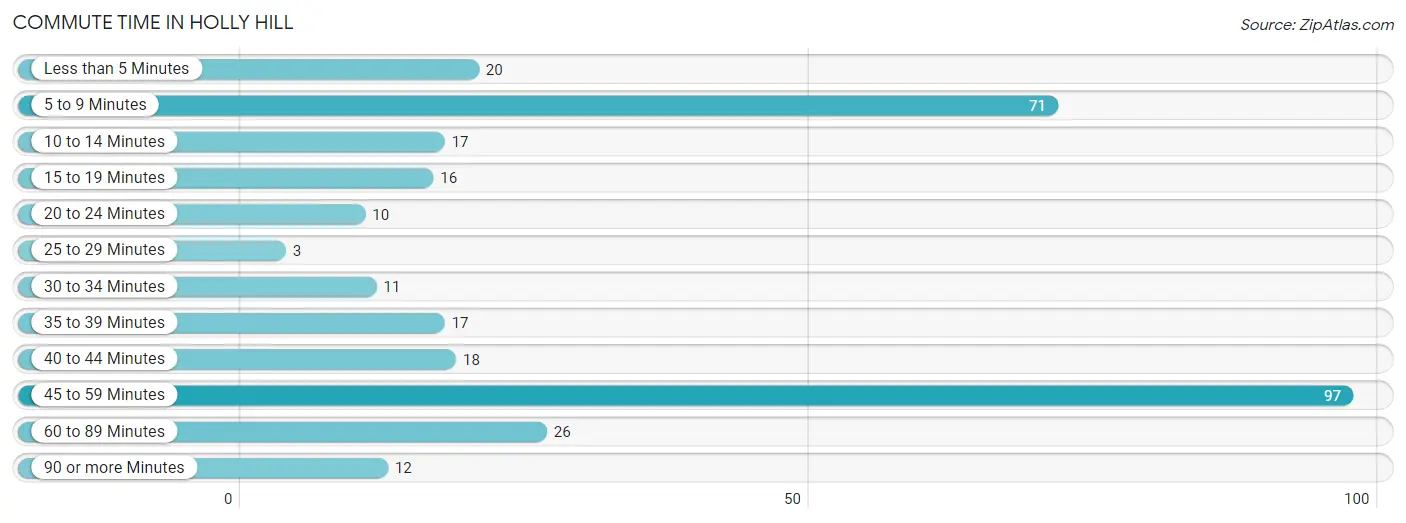
| Commute Time | # Commuters | % Commuters |
| Less than 5 Minutes | 20 | 6.3% |
| 5 to 9 Minutes | 71 | 22.3% |
| 10 to 14 Minutes | 17 | 5.3% |
| 15 to 19 Minutes | 16 | 5.0% |
| 20 to 24 Minutes | 10 | 3.1% |
| 25 to 29 Minutes | 3 | 0.9% |
| 30 to 34 Minutes | 11 | 3.5% |
| 35 to 39 Minutes | 17 | 5.3% |
| 40 to 44 Minutes | 18 | 5.7% |
| 45 to 59 Minutes | 97 | 30.5% |
| 60 to 89 Minutes | 26 | 8.2% |
| 90 or more Minutes | 12 | 3.8% |
Commute Time by Sex in Holly Hill
The most common commute times in Holly Hill are 45 to 59 minutes (56 commuters, 37.8%) for males and 5 to 9 minutes (46 commuters, 27.1%) for females.
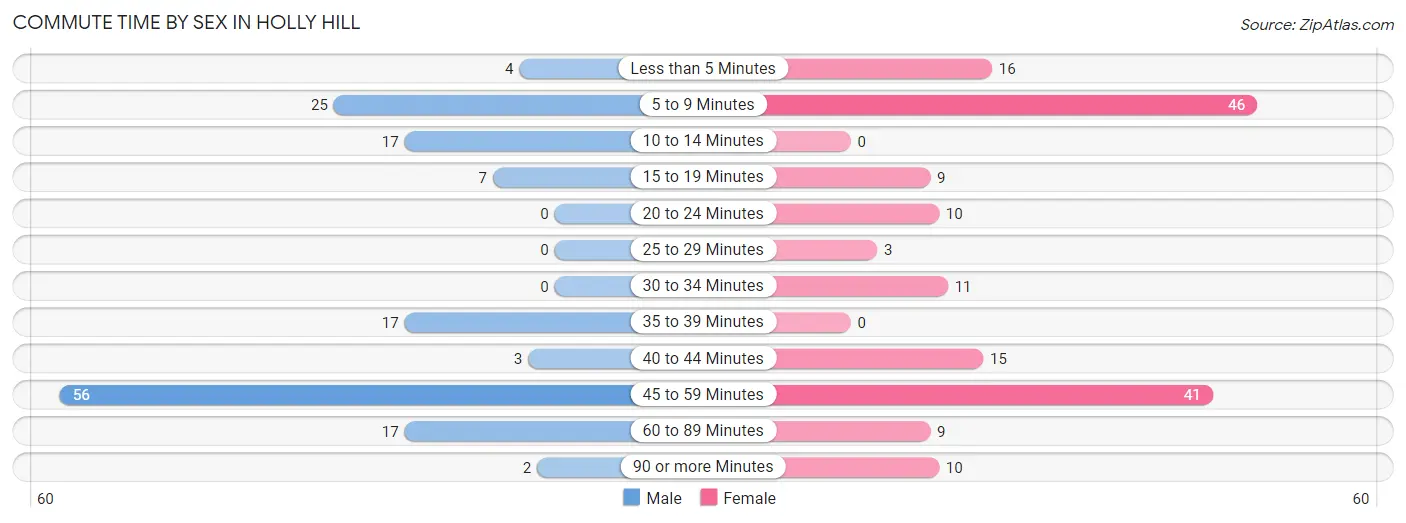
| Commute Time | Male | Female |
| Less than 5 Minutes | 4 (2.7%) | 16 (9.4%) |
| 5 to 9 Minutes | 25 (16.9%) | 46 (27.1%) |
| 10 to 14 Minutes | 17 (11.5%) | 0 (0.0%) |
| 15 to 19 Minutes | 7 (4.7%) | 9 (5.3%) |
| 20 to 24 Minutes | 0 (0.0%) | 10 (5.9%) |
| 25 to 29 Minutes | 0 (0.0%) | 3 (1.8%) |
| 30 to 34 Minutes | 0 (0.0%) | 11 (6.5%) |
| 35 to 39 Minutes | 17 (11.5%) | 0 (0.0%) |
| 40 to 44 Minutes | 3 (2.0%) | 15 (8.8%) |
| 45 to 59 Minutes | 56 (37.8%) | 41 (24.1%) |
| 60 to 89 Minutes | 17 (11.5%) | 9 (5.3%) |
| 90 or more Minutes | 2 (1.3%) | 10 (5.9%) |
Time of Departure to Work by Sex in Holly Hill
The most frequent times of departure to work in Holly Hill are 6:00 AM to 6:29 AM (28, 18.9%) for males and 8:00 AM to 8:29 AM (46, 27.1%) for females.
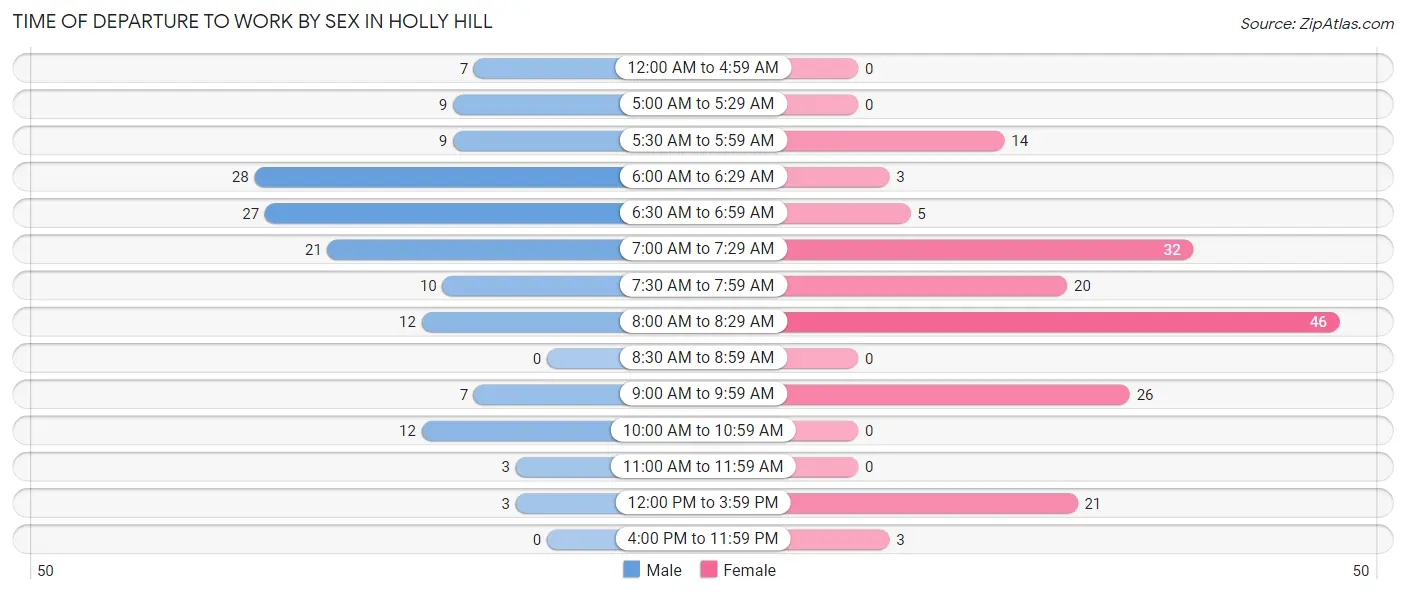
| Time of Departure | Male | Female |
| 12:00 AM to 4:59 AM | 7 (4.7%) | 0 (0.0%) |
| 5:00 AM to 5:29 AM | 9 (6.1%) | 0 (0.0%) |
| 5:30 AM to 5:59 AM | 9 (6.1%) | 14 (8.2%) |
| 6:00 AM to 6:29 AM | 28 (18.9%) | 3 (1.8%) |
| 6:30 AM to 6:59 AM | 27 (18.2%) | 5 (2.9%) |
| 7:00 AM to 7:29 AM | 21 (14.2%) | 32 (18.8%) |
| 7:30 AM to 7:59 AM | 10 (6.8%) | 20 (11.8%) |
| 8:00 AM to 8:29 AM | 12 (8.1%) | 46 (27.1%) |
| 8:30 AM to 8:59 AM | 0 (0.0%) | 0 (0.0%) |
| 9:00 AM to 9:59 AM | 7 (4.7%) | 26 (15.3%) |
| 10:00 AM to 10:59 AM | 12 (8.1%) | 0 (0.0%) |
| 11:00 AM to 11:59 AM | 3 (2.0%) | 0 (0.0%) |
| 12:00 PM to 3:59 PM | 3 (2.0%) | 21 (12.3%) |
| 4:00 PM to 11:59 PM | 0 (0.0%) | 3 (1.8%) |
| Total | 148 (100.0%) | 170 (100.0%) |
Housing Occupancy in Holly Hill
Occupancy by Ownership in Holly Hill
Of the total 461 dwellings in Holly Hill, owner-occupied units account for 239 (51.8%), while renter-occupied units make up 222 (48.2%).
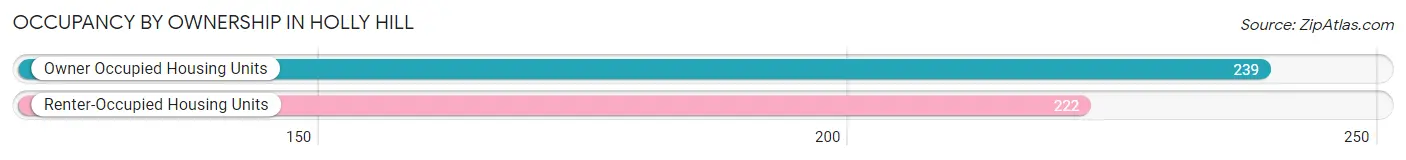
| Occupancy | # Housing Units | % Housing Units |
| Owner Occupied Housing Units | 239 | 51.8% |
| Renter-Occupied Housing Units | 222 | 48.2% |
| Total Occupied Housing Units | 461 | 100.0% |
Occupancy by Household Size in Holly Hill
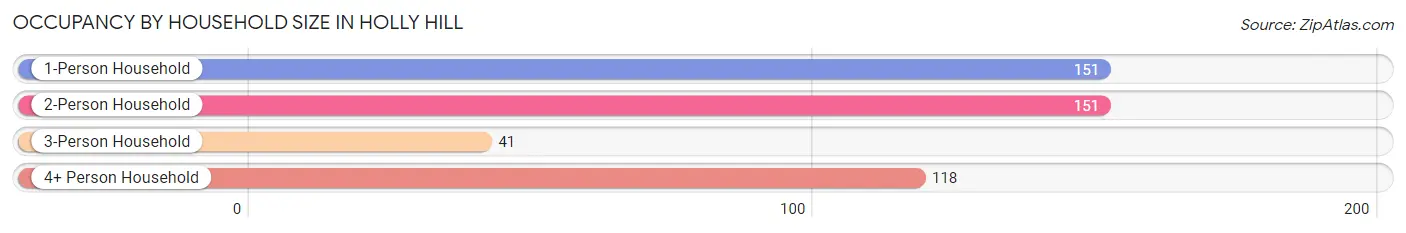
| Household Size | # Housing Units | % Housing Units |
| 1-Person Household | 151 | 32.8% |
| 2-Person Household | 151 | 32.8% |
| 3-Person Household | 41 | 8.9% |
| 4+ Person Household | 118 | 25.6% |
| Total Housing Units | 461 | 100.0% |
Occupancy by Ownership by Household Size in Holly Hill
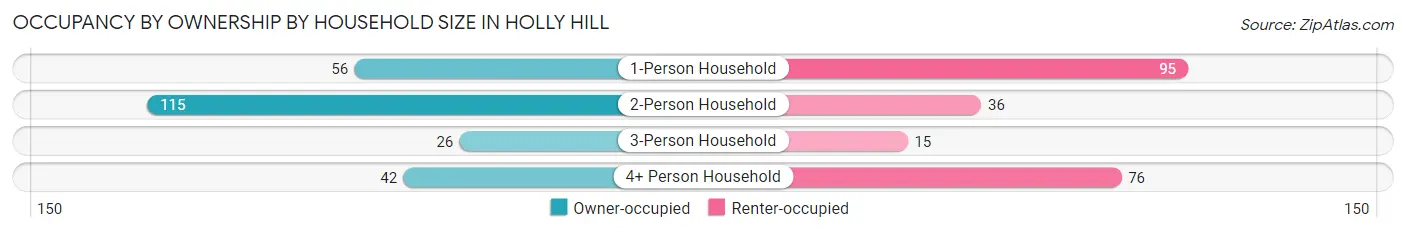
| Household Size | Owner-occupied | Renter-occupied |
| 1-Person Household | 56 (37.1%) | 95 (62.9%) |
| 2-Person Household | 115 (76.2%) | 36 (23.8%) |
| 3-Person Household | 26 (63.4%) | 15 (36.6%) |
| 4+ Person Household | 42 (35.6%) | 76 (64.4%) |
| Total Housing Units | 239 (51.8%) | 222 (48.2%) |
Occupancy by Educational Attainment in Holly Hill
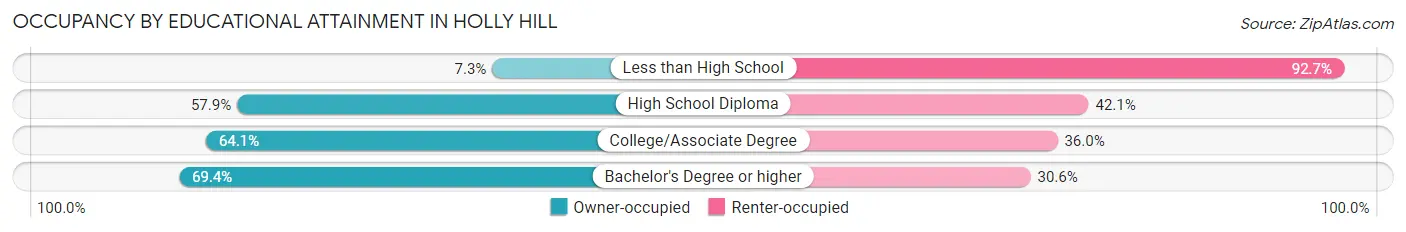
| Household Size | Owner-occupied | Renter-occupied |
| Less than High School | 7 (7.3%) | 89 (92.7%) |
| High School Diploma | 66 (57.9%) | 48 (42.1%) |
| College/Associate Degree | 98 (64.0%) | 55 (35.9%) |
| Bachelor's Degree or higher | 68 (69.4%) | 30 (30.6%) |
Occupancy by Age of Householder in Holly Hill
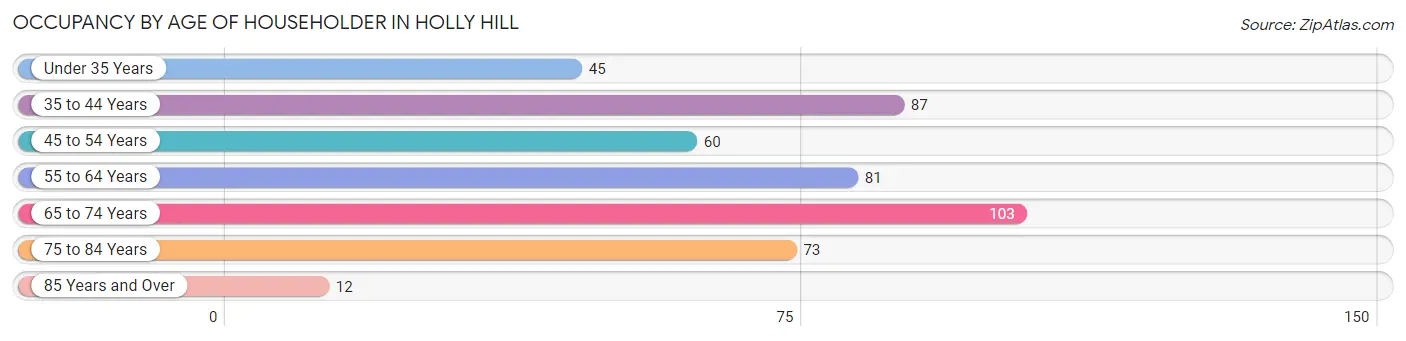
| Age Bracket | # Households | % Households |
| Under 35 Years | 45 | 9.8% |
| 35 to 44 Years | 87 | 18.9% |
| 45 to 54 Years | 60 | 13.0% |
| 55 to 64 Years | 81 | 17.6% |
| 65 to 74 Years | 103 | 22.3% |
| 75 to 84 Years | 73 | 15.8% |
| 85 Years and Over | 12 | 2.6% |
| Total | 461 | 100.0% |
Housing Finances in Holly Hill
Median Income by Occupancy in Holly Hill
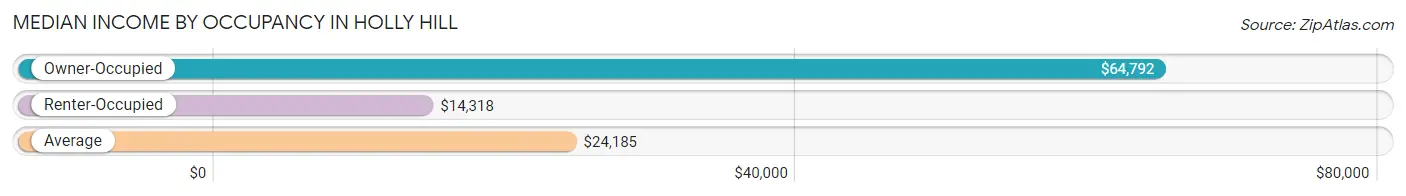
| Occupancy Type | # Households | Median Income |
| Owner-Occupied | 239 (51.8%) | $64,792 |
| Renter-Occupied | 222 (48.2%) | $14,318 |
| Average | 461 (100.0%) | $24,185 |
Occupancy by Householder Income Bracket in Holly Hill
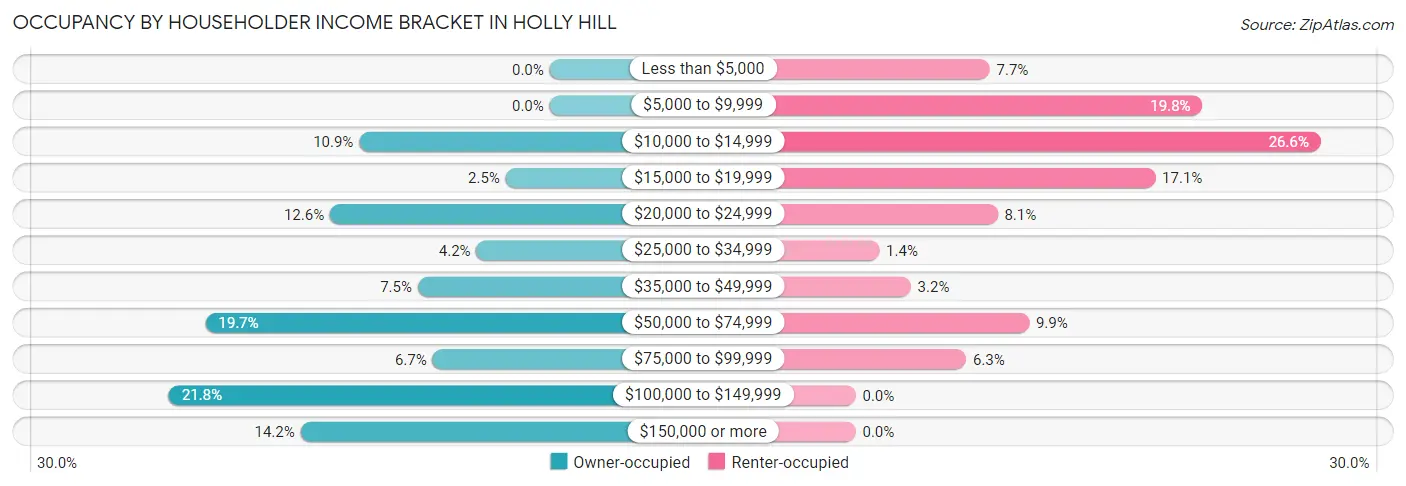
| Income Bracket | Owner-occupied | Renter-occupied |
| Less than $5,000 | 0 (0.0%) | 17 (7.7%) |
| $5,000 to $9,999 | 0 (0.0%) | 44 (19.8%) |
| $10,000 to $14,999 | 26 (10.9%) | 59 (26.6%) |
| $15,000 to $19,999 | 6 (2.5%) | 38 (17.1%) |
| $20,000 to $24,999 | 30 (12.6%) | 18 (8.1%) |
| $25,000 to $34,999 | 10 (4.2%) | 3 (1.3%) |
| $35,000 to $49,999 | 18 (7.5%) | 7 (3.2%) |
| $50,000 to $74,999 | 47 (19.7%) | 22 (9.9%) |
| $75,000 to $99,999 | 16 (6.7%) | 14 (6.3%) |
| $100,000 to $149,999 | 52 (21.8%) | 0 (0.0%) |
| $150,000 or more | 34 (14.2%) | 0 (0.0%) |
| Total | 239 (100.0%) | 222 (100.0%) |
Monthly Housing Cost Tiers in Holly Hill
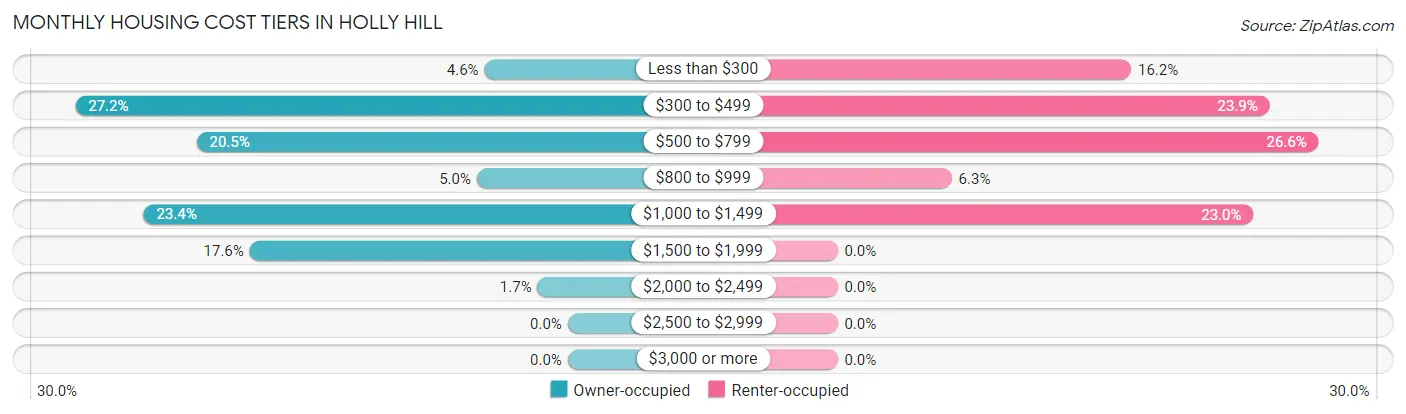
| Monthly Cost | Owner-occupied | Renter-occupied |
| Less than $300 | 11 (4.6%) | 36 (16.2%) |
| $300 to $499 | 65 (27.2%) | 53 (23.9%) |
| $500 to $799 | 49 (20.5%) | 59 (26.6%) |
| $800 to $999 | 12 (5.0%) | 14 (6.3%) |
| $1,000 to $1,499 | 56 (23.4%) | 51 (23.0%) |
| $1,500 to $1,999 | 42 (17.6%) | 0 (0.0%) |
| $2,000 to $2,499 | 4 (1.7%) | 0 (0.0%) |
| $2,500 to $2,999 | 0 (0.0%) | 0 (0.0%) |
| $3,000 or more | 0 (0.0%) | 0 (0.0%) |
| Total | 239 (100.0%) | 222 (100.0%) |
Physical Housing Characteristics in Holly Hill
Housing Structures in Holly Hill
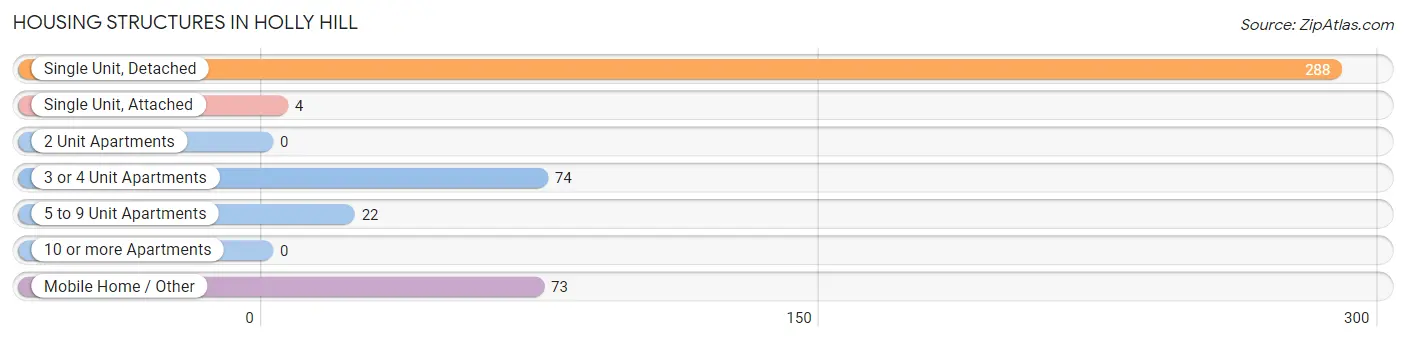
| Structure Type | # Housing Units | % Housing Units |
| Single Unit, Detached | 288 | 62.5% |
| Single Unit, Attached | 4 | 0.9% |
| 2 Unit Apartments | 0 | 0.0% |
| 3 or 4 Unit Apartments | 74 | 16.1% |
| 5 to 9 Unit Apartments | 22 | 4.8% |
| 10 or more Apartments | 0 | 0.0% |
| Mobile Home / Other | 73 | 15.8% |
| Total | 461 | 100.0% |
Housing Structures by Occupancy in Holly Hill
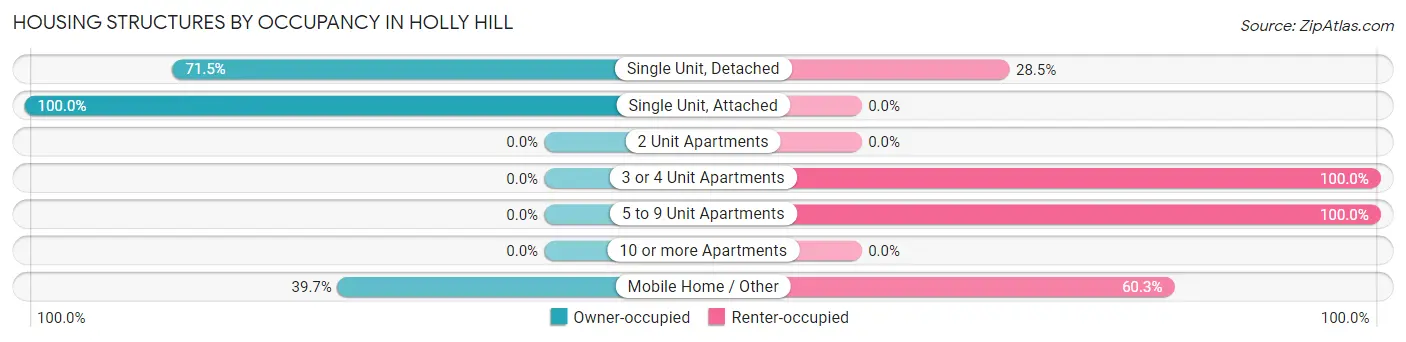
| Structure Type | Owner-occupied | Renter-occupied |
| Single Unit, Detached | 206 (71.5%) | 82 (28.5%) |
| Single Unit, Attached | 4 (100.0%) | 0 (0.0%) |
| 2 Unit Apartments | 0 (0.0%) | 0 (0.0%) |
| 3 or 4 Unit Apartments | 0 (0.0%) | 74 (100.0%) |
| 5 to 9 Unit Apartments | 0 (0.0%) | 22 (100.0%) |
| 10 or more Apartments | 0 (0.0%) | 0 (0.0%) |
| Mobile Home / Other | 29 (39.7%) | 44 (60.3%) |
| Total | 239 (51.8%) | 222 (48.2%) |
Housing Structures by Number of Rooms in Holly Hill
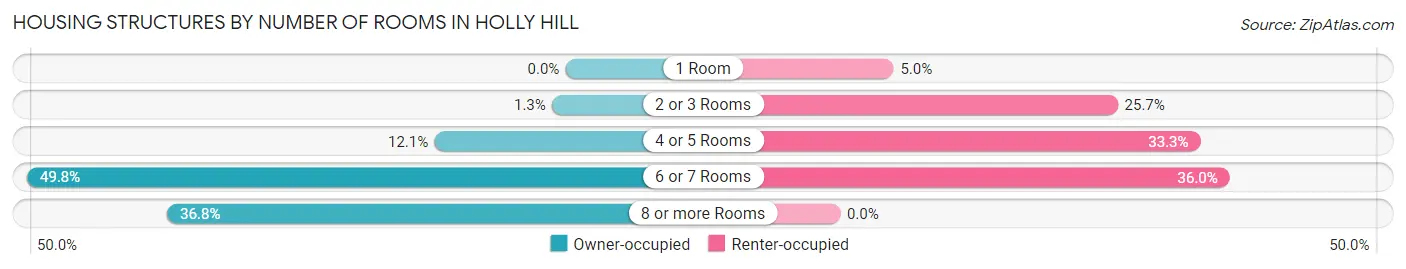
| Number of Rooms | Owner-occupied | Renter-occupied |
| 1 Room | 0 (0.0%) | 11 (5.0%) |
| 2 or 3 Rooms | 3 (1.3%) | 57 (25.7%) |
| 4 or 5 Rooms | 29 (12.1%) | 74 (33.3%) |
| 6 or 7 Rooms | 119 (49.8%) | 80 (36.0%) |
| 8 or more Rooms | 88 (36.8%) | 0 (0.0%) |
| Total | 239 (100.0%) | 222 (100.0%) |
Housing Structure by Heating Type in Holly Hill
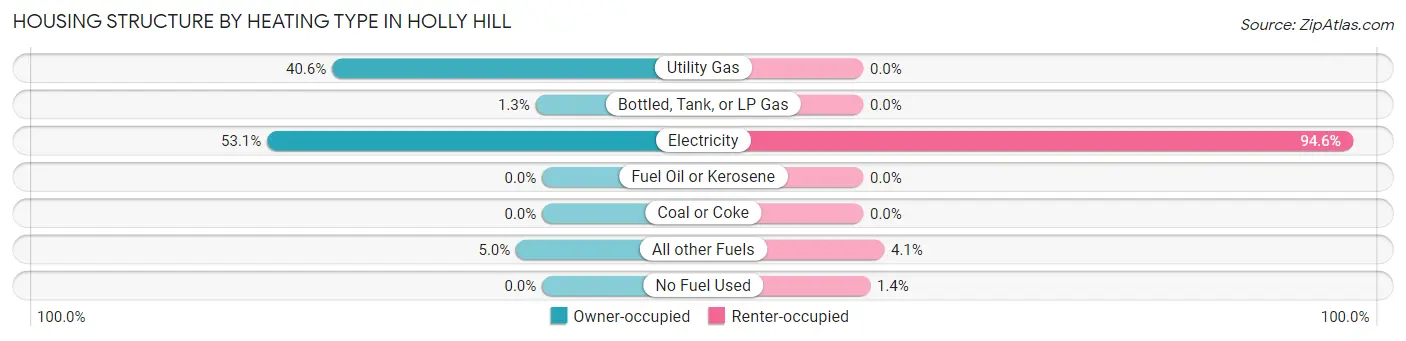
| Heating Type | Owner-occupied | Renter-occupied |
| Utility Gas | 97 (40.6%) | 0 (0.0%) |
| Bottled, Tank, or LP Gas | 3 (1.3%) | 0 (0.0%) |
| Electricity | 127 (53.1%) | 210 (94.6%) |
| Fuel Oil or Kerosene | 0 (0.0%) | 0 (0.0%) |
| Coal or Coke | 0 (0.0%) | 0 (0.0%) |
| All other Fuels | 12 (5.0%) | 9 (4.1%) |
| No Fuel Used | 0 (0.0%) | 3 (1.3%) |
| Total | 239 (100.0%) | 222 (100.0%) |
Household Vehicle Usage in Holly Hill
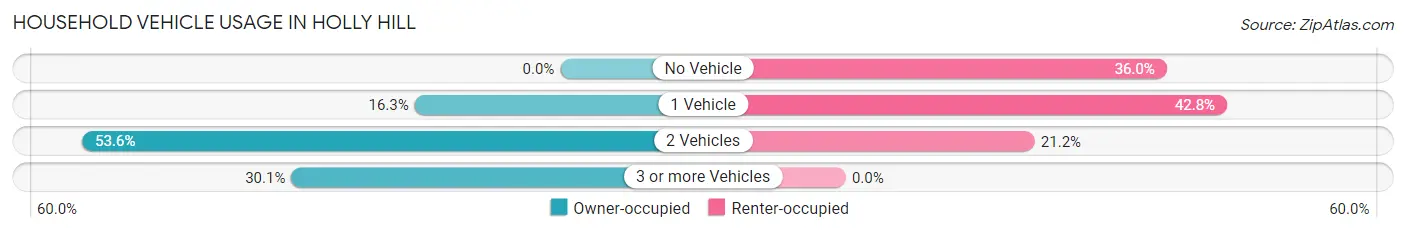
| Vehicles per Household | Owner-occupied | Renter-occupied |
| No Vehicle | 0 (0.0%) | 80 (36.0%) |
| 1 Vehicle | 39 (16.3%) | 95 (42.8%) |
| 2 Vehicles | 128 (53.6%) | 47 (21.2%) |
| 3 or more Vehicles | 72 (30.1%) | 0 (0.0%) |
| Total | 239 (100.0%) | 222 (100.0%) |
Real Estate & Mortgages in Holly Hill
Real Estate and Mortgage Overview in Holly Hill
| Characteristic | Without Mortgage | With Mortgage |
| Housing Units | 134 | 105 |
| Median Property Value | $137,500 | $186,400 |
| Median Household Income | $36,250 | $32 |
| Monthly Housing Costs | $480 | $0 |
| Real Estate Taxes | $1,120 | $9 |
Property Value by Mortgage Status in Holly Hill
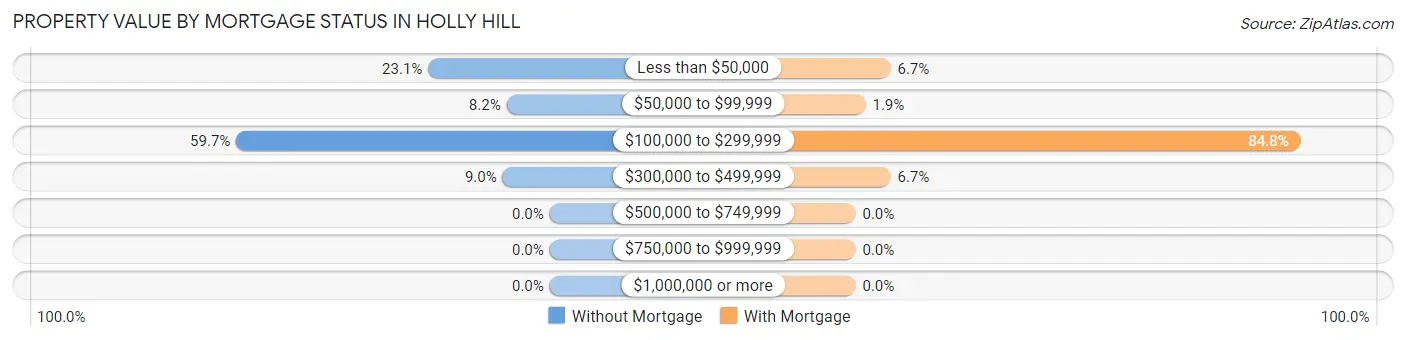
| Property Value | Without Mortgage | With Mortgage |
| Less than $50,000 | 31 (23.1%) | 7 (6.7%) |
| $50,000 to $99,999 | 11 (8.2%) | 2 (1.9%) |
| $100,000 to $299,999 | 80 (59.7%) | 89 (84.8%) |
| $300,000 to $499,999 | 12 (9.0%) | 7 (6.7%) |
| $500,000 to $749,999 | 0 (0.0%) | 0 (0.0%) |
| $750,000 to $999,999 | 0 (0.0%) | 0 (0.0%) |
| $1,000,000 or more | 0 (0.0%) | 0 (0.0%) |
| Total | 134 (100.0%) | 105 (100.0%) |
Household Income by Mortgage Status in Holly Hill
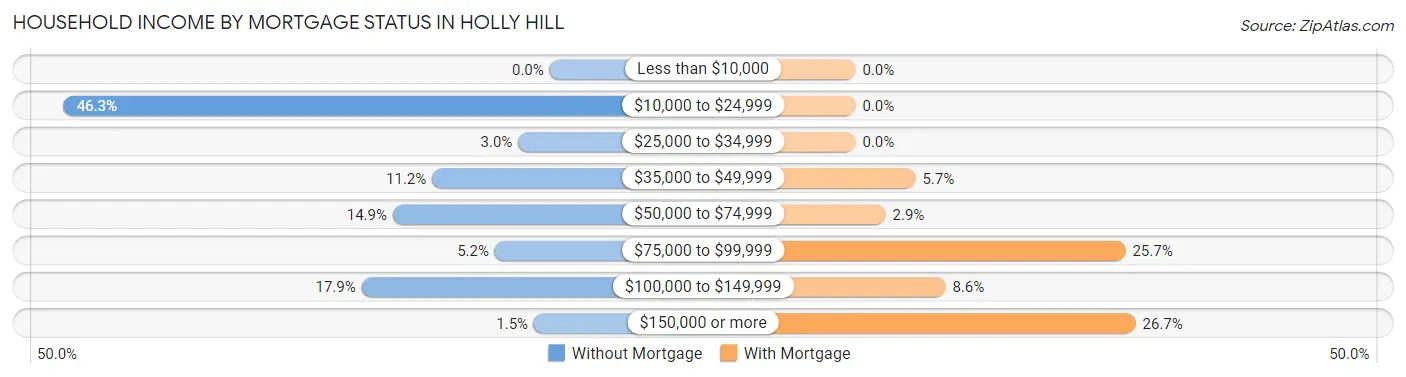
| Household Income | Without Mortgage | With Mortgage |
| Less than $10,000 | 0 (0.0%) | 0 (0.0%) |
| $10,000 to $24,999 | 62 (46.3%) | 0 (0.0%) |
| $25,000 to $34,999 | 4 (3.0%) | 0 (0.0%) |
| $35,000 to $49,999 | 15 (11.2%) | 6 (5.7%) |
| $50,000 to $74,999 | 20 (14.9%) | 3 (2.9%) |
| $75,000 to $99,999 | 7 (5.2%) | 27 (25.7%) |
| $100,000 to $149,999 | 24 (17.9%) | 9 (8.6%) |
| $150,000 or more | 2 (1.5%) | 28 (26.7%) |
| Total | 134 (100.0%) | 105 (100.0%) |
Property Value to Household Income Ratio in Holly Hill
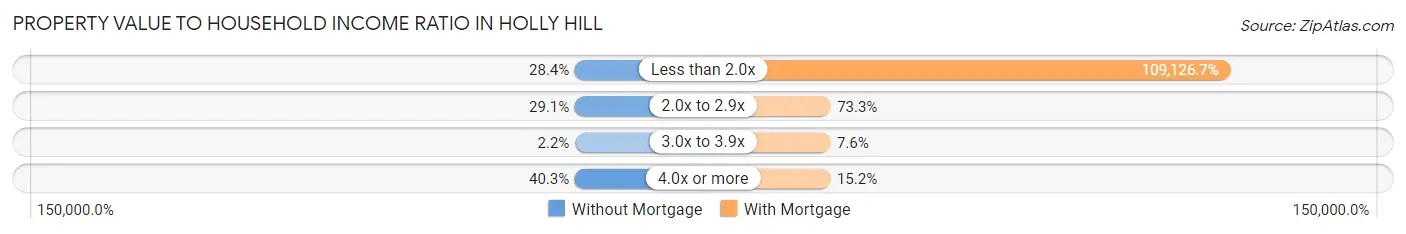
| Value-to-Income Ratio | Without Mortgage | With Mortgage |
| Less than 2.0x | 38 (28.4%) | 114,583 (109,126.7%) |
| 2.0x to 2.9x | 39 (29.1%) | 77 (73.3%) |
| 3.0x to 3.9x | 3 (2.2%) | 8 (7.6%) |
| 4.0x or more | 54 (40.3%) | 16 (15.2%) |
| Total | 134 (100.0%) | 105 (100.0%) |
Real Estate Taxes by Mortgage Status in Holly Hill
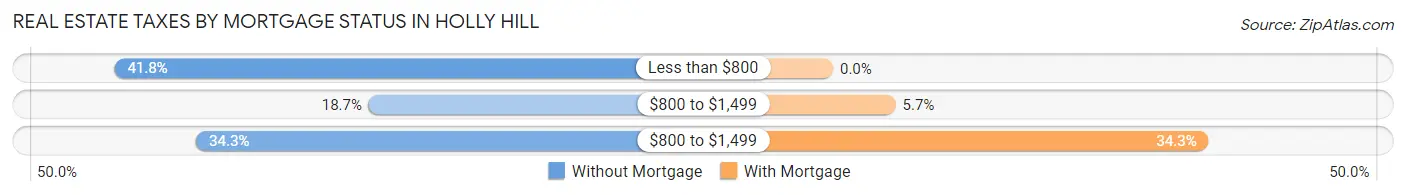
| Property Taxes | Without Mortgage | With Mortgage |
| Less than $800 | 56 (41.8%) | 0 (0.0%) |
| $800 to $1,499 | 25 (18.7%) | 6 (5.7%) |
| $800 to $1,499 | 46 (34.3%) | 36 (34.3%) |
| Total | 134 (100.0%) | 105 (100.0%) |
Health & Disability in Holly Hill
Health Insurance Coverage by Age in Holly Hill
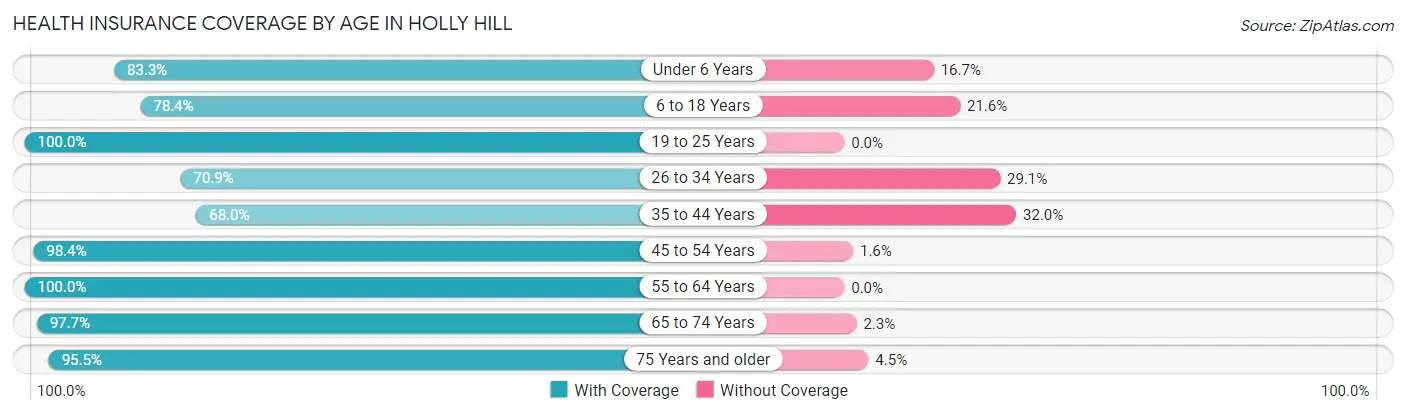
| Age Bracket | With Coverage | Without Coverage |
| Under 6 Years | 75 (83.3%) | 15 (16.7%) |
| 6 to 18 Years | 276 (78.4%) | 76 (21.6%) |
| 19 to 25 Years | 161 (100.0%) | 0 (0.0%) |
| 26 to 34 Years | 83 (70.9%) | 34 (29.1%) |
| 35 to 44 Years | 87 (68.0%) | 41 (32.0%) |
| 45 to 54 Years | 121 (98.4%) | 2 (1.6%) |
| 55 to 64 Years | 170 (100.0%) | 0 (0.0%) |
| 65 to 74 Years | 129 (97.7%) | 3 (2.3%) |
| 75 Years and older | 106 (95.5%) | 5 (4.5%) |
| Total | 1,208 (87.3%) | 176 (12.7%) |
Health Insurance Coverage by Citizenship Status in Holly Hill
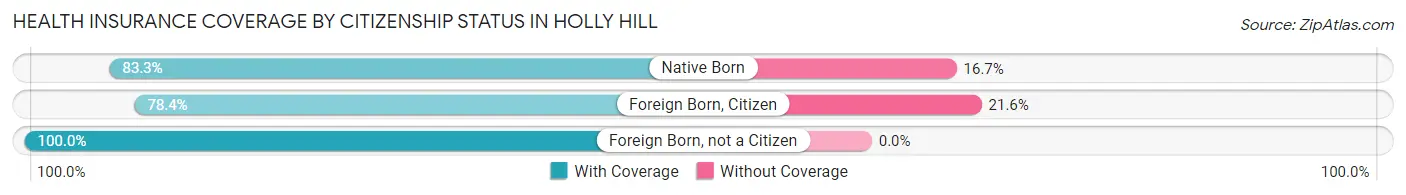
| Citizenship Status | With Coverage | Without Coverage |
| Native Born | 75 (83.3%) | 15 (16.7%) |
| Foreign Born, Citizen | 276 (78.4%) | 76 (21.6%) |
| Foreign Born, not a Citizen | 161 (100.0%) | 0 (0.0%) |
Health Insurance Coverage by Household Income in Holly Hill
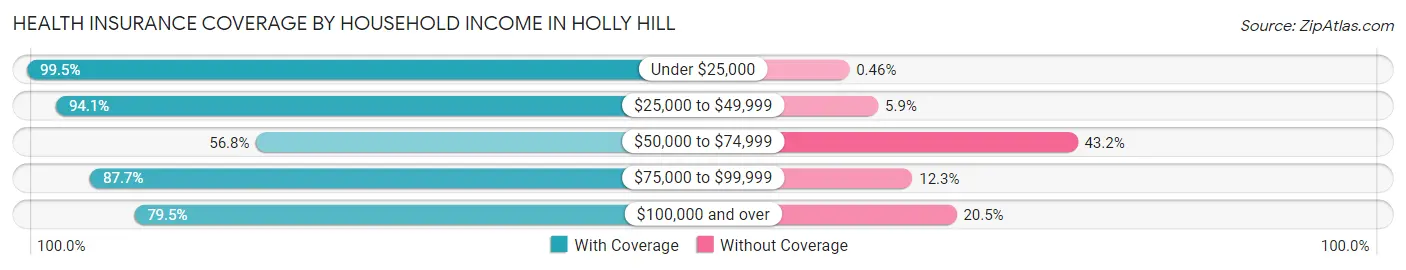
| Household Income | With Coverage | Without Coverage |
| Under $25,000 | 644 (99.5%) | 3 (0.5%) |
| $25,000 to $49,999 | 96 (94.1%) | 6 (5.9%) |
| $50,000 to $74,999 | 113 (56.8%) | 86 (43.2%) |
| $75,000 to $99,999 | 100 (87.7%) | 14 (12.3%) |
| $100,000 and over | 236 (79.5%) | 61 (20.5%) |
Public vs Private Health Insurance Coverage by Age in Holly Hill
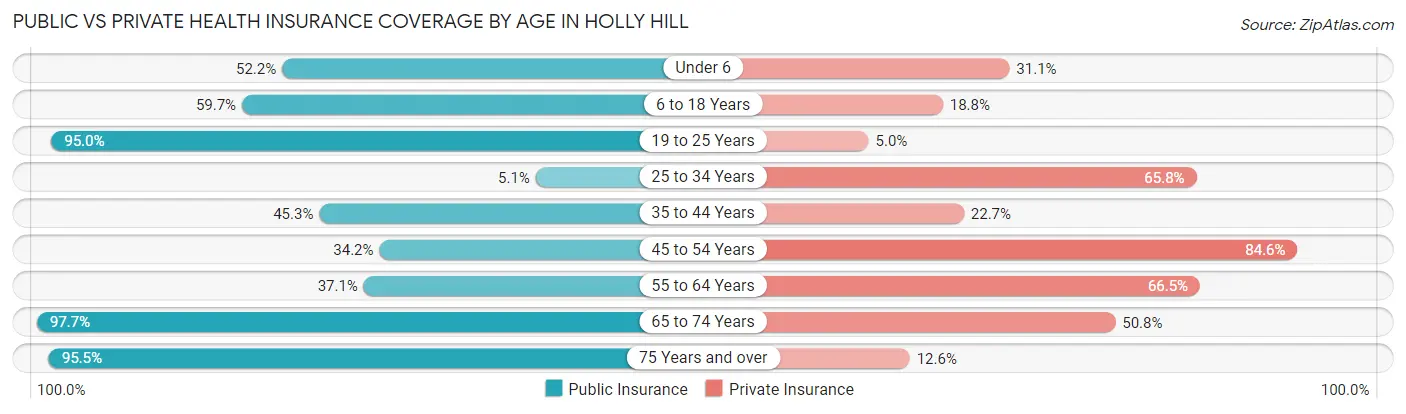
| Age Bracket | Public Insurance | Private Insurance |
| Under 6 | 47 (52.2%) | 28 (31.1%) |
| 6 to 18 Years | 210 (59.7%) | 66 (18.8%) |
| 19 to 25 Years | 153 (95.0%) | 8 (5.0%) |
| 25 to 34 Years | 6 (5.1%) | 77 (65.8%) |
| 35 to 44 Years | 58 (45.3%) | 29 (22.7%) |
| 45 to 54 Years | 42 (34.2%) | 104 (84.6%) |
| 55 to 64 Years | 63 (37.1%) | 113 (66.5%) |
| 65 to 74 Years | 129 (97.7%) | 67 (50.8%) |
| 75 Years and over | 106 (95.5%) | 14 (12.6%) |
| Total | 814 (58.8%) | 506 (36.6%) |
Disability Status by Sex by Age in Holly Hill
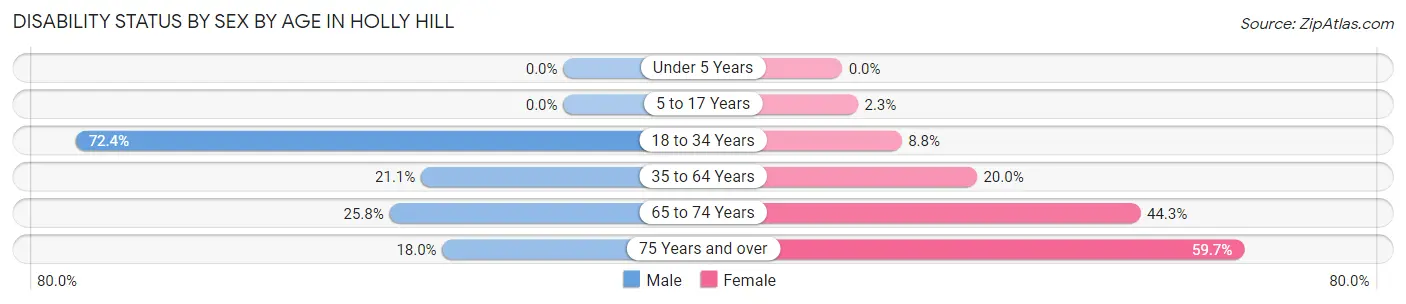
| Age Bracket | Male | Female |
| Under 5 Years | 0 (0.0%) | 0 (0.0%) |
| 5 to 17 Years | 0 (0.0%) | 4 (2.3%) |
| 18 to 34 Years | 139 (72.4%) | 9 (8.8%) |
| 35 to 64 Years | 34 (21.1%) | 52 (20.0%) |
| 65 to 74 Years | 16 (25.8%) | 31 (44.3%) |
| 75 Years and over | 7 (17.9%) | 43 (59.7%) |
Disability Class by Sex by Age in Holly Hill
Disability Class: Hearing Difficulty
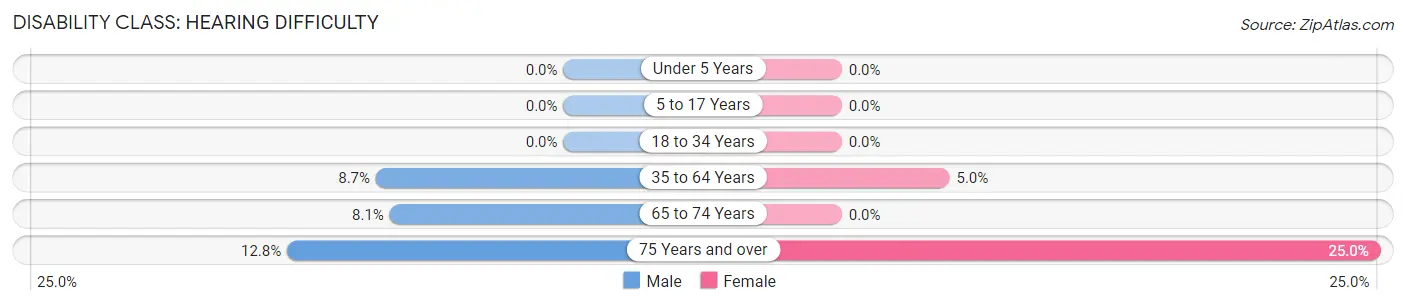
| Age Bracket | Male | Female |
| Under 5 Years | 0 (0.0%) | 0 (0.0%) |
| 5 to 17 Years | 0 (0.0%) | 0 (0.0%) |
| 18 to 34 Years | 0 (0.0%) | 0 (0.0%) |
| 35 to 64 Years | 14 (8.7%) | 13 (5.0%) |
| 65 to 74 Years | 5 (8.1%) | 0 (0.0%) |
| 75 Years and over | 5 (12.8%) | 18 (25.0%) |
Disability Class: Vision Difficulty
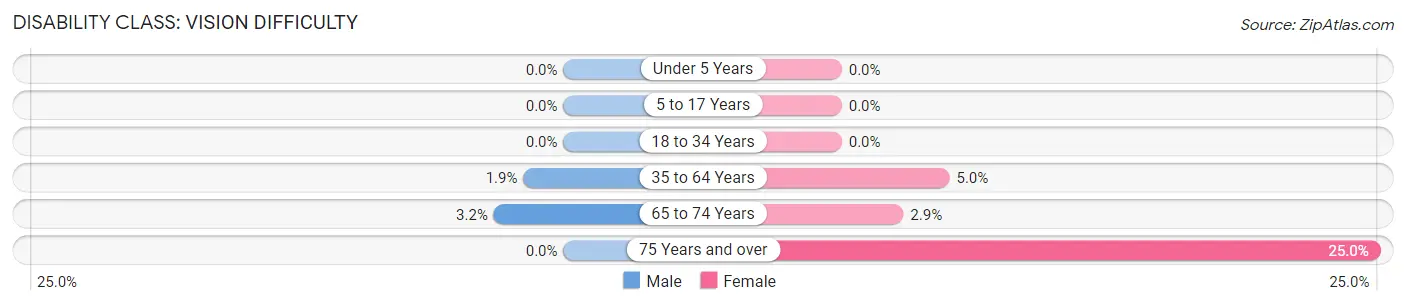
| Age Bracket | Male | Female |
| Under 5 Years | 0 (0.0%) | 0 (0.0%) |
| 5 to 17 Years | 0 (0.0%) | 0 (0.0%) |
| 18 to 34 Years | 0 (0.0%) | 0 (0.0%) |
| 35 to 64 Years | 3 (1.9%) | 13 (5.0%) |
| 65 to 74 Years | 2 (3.2%) | 2 (2.9%) |
| 75 Years and over | 0 (0.0%) | 18 (25.0%) |
Disability Class: Cognitive Difficulty
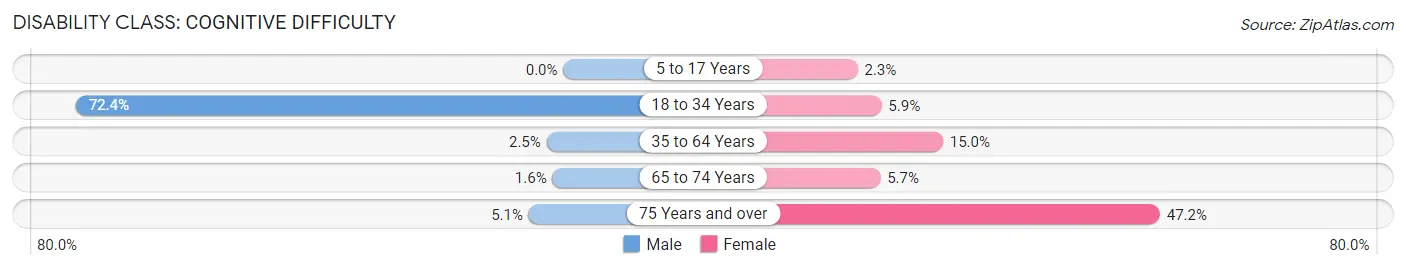
| Age Bracket | Male | Female |
| 5 to 17 Years | 0 (0.0%) | 4 (2.3%) |
| 18 to 34 Years | 139 (72.4%) | 6 (5.9%) |
| 35 to 64 Years | 4 (2.5%) | 39 (15.0%) |
| 65 to 74 Years | 1 (1.6%) | 4 (5.7%) |
| 75 Years and over | 2 (5.1%) | 34 (47.2%) |
Disability Class: Ambulatory Difficulty
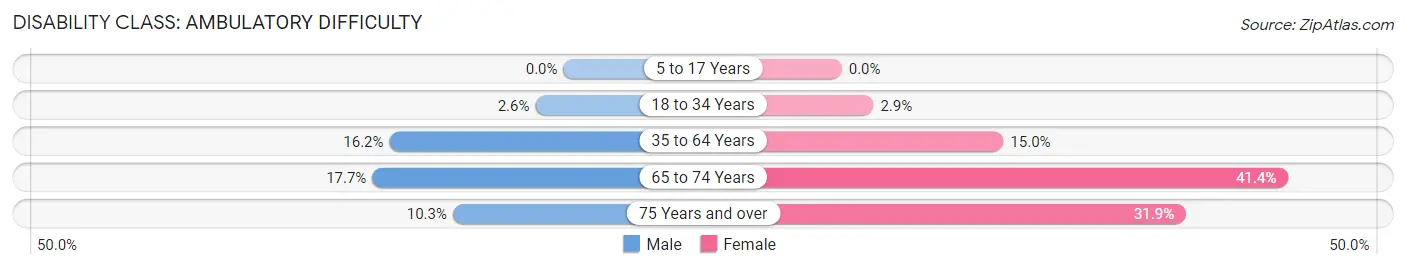
| Age Bracket | Male | Female |
| 5 to 17 Years | 0 (0.0%) | 0 (0.0%) |
| 18 to 34 Years | 5 (2.6%) | 3 (2.9%) |
| 35 to 64 Years | 26 (16.2%) | 39 (15.0%) |
| 65 to 74 Years | 11 (17.7%) | 29 (41.4%) |
| 75 Years and over | 4 (10.3%) | 23 (31.9%) |
Disability Class: Self-Care Difficulty
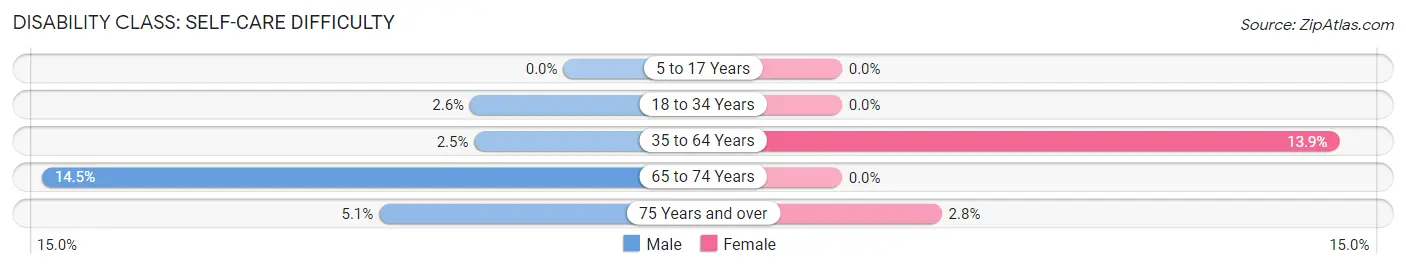
| Age Bracket | Male | Female |
| 5 to 17 Years | 0 (0.0%) | 0 (0.0%) |
| 18 to 34 Years | 5 (2.6%) | 0 (0.0%) |
| 35 to 64 Years | 4 (2.5%) | 36 (13.9%) |
| 65 to 74 Years | 9 (14.5%) | 0 (0.0%) |
| 75 Years and over | 2 (5.1%) | 2 (2.8%) |
Technology Access in Holly Hill
Computing Device Access in Holly Hill
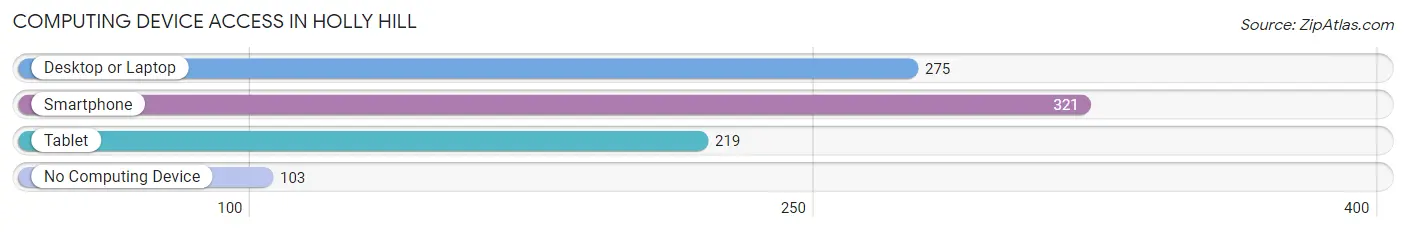
| Device Type | # Households | % Households |
| Desktop or Laptop | 275 | 59.7% |
| Smartphone | 321 | 69.6% |
| Tablet | 219 | 47.5% |
| No Computing Device | 103 | 22.3% |
| Total | 461 | 100.0% |
Internet Access in Holly Hill
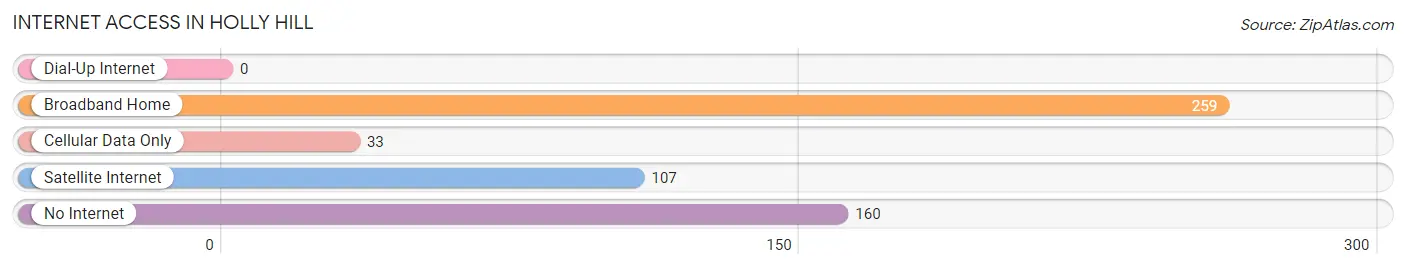
| Internet Type | # Households | % Households |
| Dial-Up Internet | 0 | 0.0% |
| Broadband Home | 259 | 56.2% |
| Cellular Data Only | 33 | 7.2% |
| Satellite Internet | 107 | 23.2% |
| No Internet | 160 | 34.7% |
| Total | 461 | 100.0% |
Holly Hill Summary
Holly Hill is a small town located in Orangeburg County, South Carolina. It is situated on the banks of the Edisto River, approximately 20 miles south of Columbia, the state capital. The town has a population of 1,845 people, according to the 2010 census.
Geography
Holly Hill is located in the Midlands region of South Carolina, in the heart of the Piedmont region. The town is situated on the banks of the Edisto River, which flows through the town and provides a scenic backdrop. The town is surrounded by rolling hills and forests, and is located in a rural area. The town is located approximately 20 miles south of Columbia, the state capital, and is accessible by US Highway 176.
History
Holly Hill was founded in 1883 by a group of settlers from North Carolina. The town was named after the holly trees that grew in abundance in the area. The town was incorporated in 1887, and the first mayor was elected in 1888. The town grew slowly, and by the early 1900s, it had a population of around 500 people.
The town experienced a period of growth in the 1950s and 1960s, when the population increased to over 1,000 people. The town was home to several businesses, including a cotton mill, a sawmill, and a brickyard. The town also had a railroad station, which was used to transport goods and passengers.
Economy
Holly Hill is a small, rural town, and the economy is largely based on agriculture. The town is home to several farms, which produce a variety of crops, including corn, soybeans, and cotton. The town also has a few small businesses, including a grocery store, a hardware store, and a few restaurants.
Demographics
According to the 2010 census, the population of Holly Hill was 1,845 people. The population is predominantly white, with African Americans making up the second largest racial group. The median household income is $31,250, and the median age is 41. The town has a high rate of poverty, with nearly 30% of the population living below the poverty line.
Conclusion
Holly Hill is a small, rural town located in Orangeburg County, South Carolina. The town has a population of 1,845 people, and the economy is largely based on agriculture. The town is predominantly white, with African Americans making up the second largest racial group. The town has a high rate of poverty, with nearly 30% of the population living below the poverty line. Despite its small size, Holly Hill is a vibrant community with a rich history and a bright future.
Common Questions
What is Per Capita Income in Holly Hill?
Per Capita income in Holly Hill is $18,715.
What is the Median Family Income in Holly Hill?
Median Family Income in Holly Hill is $59,342.
What is the Median Household income in Holly Hill?
Median Household Income in Holly Hill is $24,185.
What is Income or Wage Gap in Holly Hill?
Income or Wage Gap in Holly Hill is 59.3%.
Women in Holly Hill earn 40.7 cents for every dollar earned by a man.
What is Inequality or Gini Index in Holly Hill?
Inequality or Gini Index in Holly Hill is 0.51.
What is the Total Population of Holly Hill?
Total Population of Holly Hill is 1,384.
What is the Total Male Population of Holly Hill?
Total Male Population of Holly Hill is 684.
What is the Total Female Population of Holly Hill?
Total Female Population of Holly Hill is 700.
What is the Ratio of Males per 100 Females in Holly Hill?
There are 97.71 Males per 100 Females in Holly Hill.
What is the Ratio of Females per 100 Males in Holly Hill?
There are 102.34 Females per 100 Males in Holly Hill.
What is the Median Population Age in Holly Hill?
Median Population Age in Holly Hill is 32.5 Years.
What is the Average Family Size in Holly Hill
Average Family Size in Holly Hill is 3.9 People.
What is the Average Household Size in Holly Hill
Average Household Size in Holly Hill is 3.0 People.
How Large is the Labor Force in Holly Hill?
There are 356 People in the Labor Forcein in Holly Hill.
What is the Percentage of People in the Labor Force in Holly Hill?
35.5% of People are in the Labor Force in Holly Hill.
What is the Unemployment Rate in Holly Hill?
Unemployment Rate in Holly Hill is 6.5%.