Bellaire, TX Map & Demographics
Bellaire Map
Bellaire Overview
$104,552
PER CAPITA INCOME
$243,866
AVG FAMILY INCOME
$215,636
AVG HOUSEHOLD INCOME
56.0%
WAGE / INCOME GAP [ % ]
44.0¢/ $1
WAGE / INCOME GAP [ $ ]
$11,816
FAMILY INCOME DEFICIT
0.47
INEQUALITY / GINI INDEX
17,163
TOTAL POPULATION
8,635
MALE POPULATION
8,528
FEMALE POPULATION
101.25
MALES / 100 FEMALES
98.76
FEMALES / 100 MALES
44.3
MEDIAN AGE
3.1
AVG FAMILY SIZE
2.8
AVG HOUSEHOLD SIZE
8,383
LABOR FORCE [ PEOPLE ]
62.9%
PERCENT IN LABOR FORCE
2.5%
UNEMPLOYMENT RATE
Bellaire Zip Codes
Bellaire Area Codes
Income in Bellaire
Income Overview in Bellaire
Per Capita Income in Bellaire is $104,552, while median incomes of families and households are $243,866 and $215,636 respectively.
| Characteristic | Number | Measure |
| Per Capita Income | 17,163 | $104,552 |
| Median Family Income | 5,109 | $243,866 |
| Mean Family Income | 5,109 | $331,278 |
| Median Household Income | 6,087 | $215,636 |
| Mean Household Income | 6,087 | $294,605 |
| Income Deficit | 5,109 | $11,816 |
| Wage / Income Gap (%) | 17,163 | 56.02% |
| Wage / Income Gap ($) | 17,163 | 43.98¢ per $1 |
| Gini / Inequality Index | 17,163 | 0.47 |
Earnings by Sex in Bellaire
Average Earnings in Bellaire are $101,187, $150,552 for men and $66,208 for women, a difference of 56.0%.
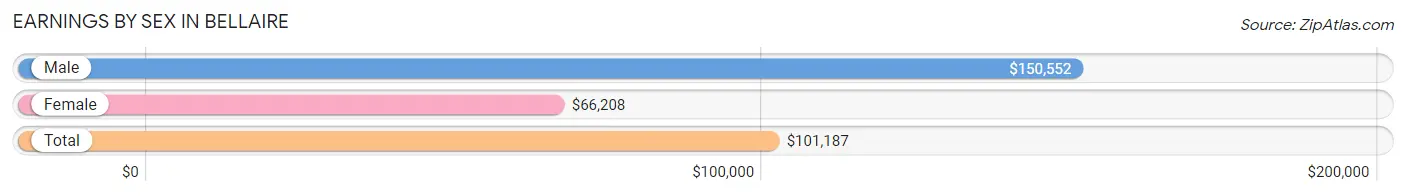
| Sex | Number | Average Earnings |
| Male | 4,739 (53.5%) | $150,552 |
| Female | 4,124 (46.5%) | $66,208 |
| Total | 8,863 (100.0%) | $101,187 |
Earnings by Sex by Income Bracket in Bellaire
The most common earnings brackets in Bellaire are $100,000+ for men (3,086 | 65.1%) and $100,000+ for women (1,411 | 34.2%).
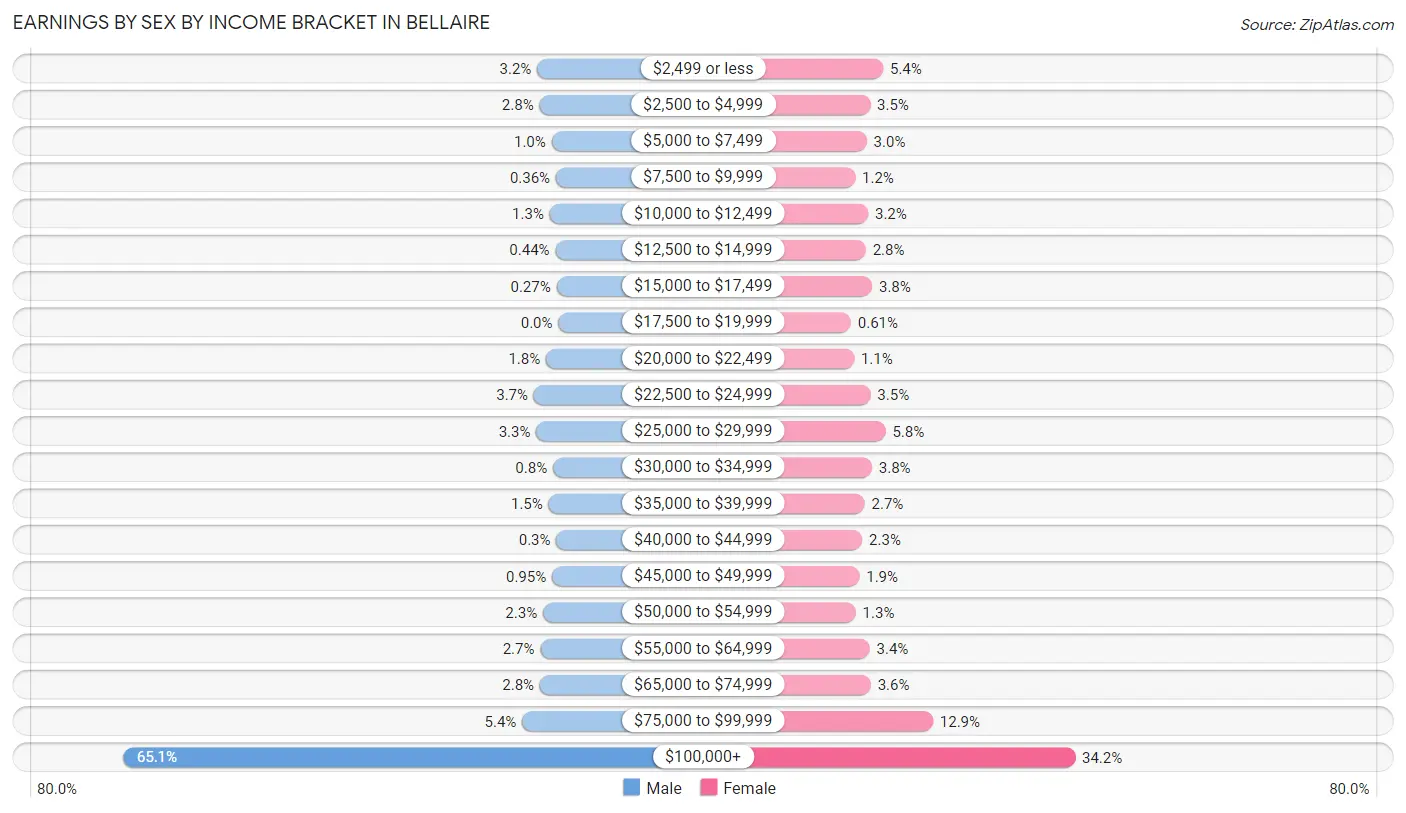
| Income | Male | Female |
| $2,499 or less | 150 (3.2%) | 224 (5.4%) |
| $2,500 to $4,999 | 134 (2.8%) | 144 (3.5%) |
| $5,000 to $7,499 | 48 (1.0%) | 123 (3.0%) |
| $7,500 to $9,999 | 17 (0.4%) | 51 (1.2%) |
| $10,000 to $12,499 | 61 (1.3%) | 131 (3.2%) |
| $12,500 to $14,999 | 21 (0.4%) | 117 (2.8%) |
| $15,000 to $17,499 | 13 (0.3%) | 156 (3.8%) |
| $17,500 to $19,999 | 0 (0.0%) | 25 (0.6%) |
| $20,000 to $22,499 | 87 (1.8%) | 44 (1.1%) |
| $22,500 to $24,999 | 174 (3.7%) | 146 (3.5%) |
| $25,000 to $29,999 | 157 (3.3%) | 239 (5.8%) |
| $30,000 to $34,999 | 38 (0.8%) | 155 (3.8%) |
| $35,000 to $39,999 | 69 (1.5%) | 110 (2.7%) |
| $40,000 to $44,999 | 14 (0.3%) | 95 (2.3%) |
| $45,000 to $49,999 | 45 (0.9%) | 77 (1.9%) |
| $50,000 to $54,999 | 109 (2.3%) | 55 (1.3%) |
| $55,000 to $64,999 | 128 (2.7%) | 141 (3.4%) |
| $65,000 to $74,999 | 131 (2.8%) | 148 (3.6%) |
| $75,000 to $99,999 | 257 (5.4%) | 532 (12.9%) |
| $100,000+ | 3,086 (65.1%) | 1,411 (34.2%) |
| Total | 4,739 (100.0%) | 4,124 (100.0%) |
Earnings by Sex by Educational Attainment in Bellaire
Average earnings in Bellaire are $170,536 for men and $76,768 for women, a difference of 55.0%. Men with an educational attainment of graduate degree enjoy the highest average annual earnings of $229,565, while those with less than high school education earn the least with $27,222. Women with an educational attainment of graduate degree earn the most with the average annual earnings of $126,858, while those with high school diploma education have the smallest earnings of $14,138.
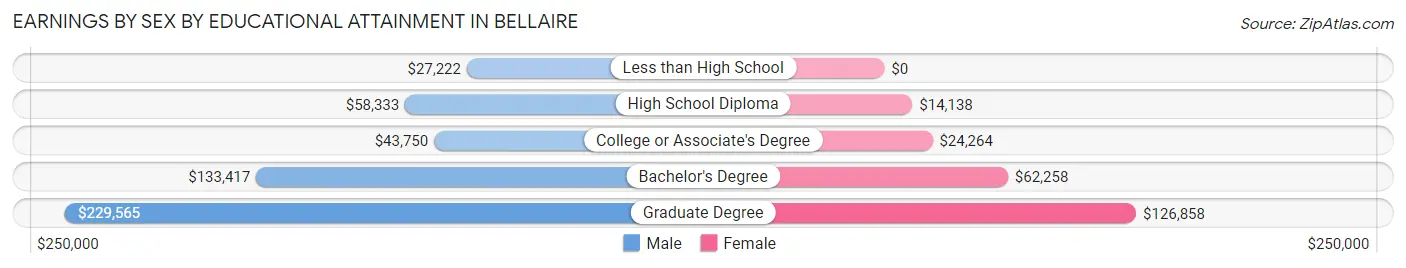
| Educational Attainment | Male Income | Female Income |
| Less than High School | $27,222 | $0 |
| High School Diploma | $58,333 | $14,138 |
| College or Associate's Degree | $43,750 | $24,264 |
| Bachelor's Degree | $133,417 | $62,258 |
| Graduate Degree | $229,565 | $126,858 |
| Total | $170,536 | $76,768 |
Family Income in Bellaire
Family Income Brackets in Bellaire
According to the Bellaire family income data, there are 3,091 families falling into the $200,000+ income range, which is the most common income bracket and makes up 60.5% of all families.
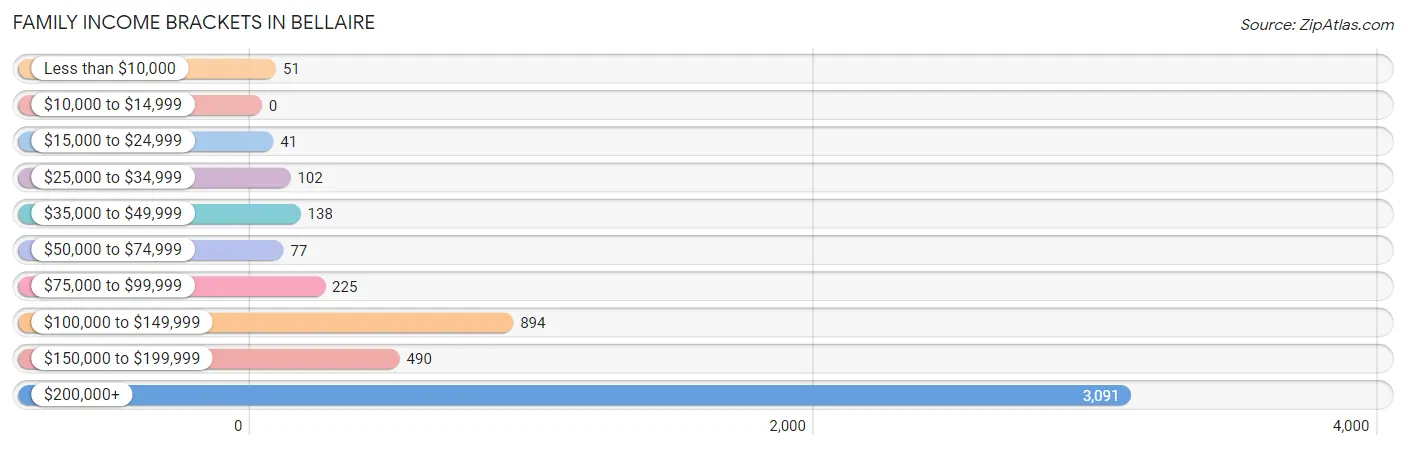
| Income Bracket | # Families | % Families |
| Less than $10,000 | 51 | 1.0% |
| $10,000 to $14,999 | 0 | 0.0% |
| $15,000 to $24,999 | 41 | 0.8% |
| $25,000 to $34,999 | 102 | 2.0% |
| $35,000 to $49,999 | 138 | 2.7% |
| $50,000 to $74,999 | 77 | 1.5% |
| $75,000 to $99,999 | 225 | 4.4% |
| $100,000 to $149,999 | 894 | 17.5% |
| $150,000 to $199,999 | 490 | 9.6% |
| $200,000+ | 3,091 | 60.5% |
Family Income by Famaliy Size in Bellaire
4-person families (1,060 | 20.7%) account for the highest median family income in Bellaire with $250,001 per family, while 3-person families (1,181 | 23.1%) have the highest median income of $81,308 per family member.
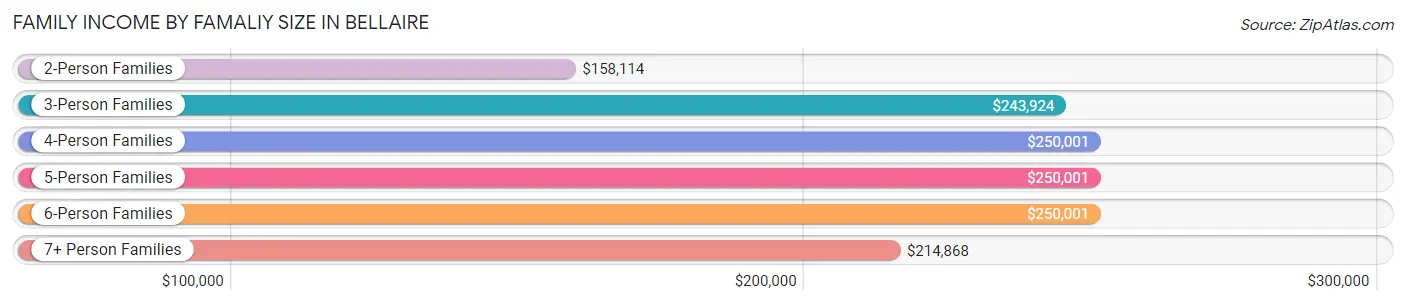
| Income Bracket | # Families | Median Income |
| 2-Person Families | 2,172 (42.5%) | $158,114 |
| 3-Person Families | 1,181 (23.1%) | $243,924 |
| 4-Person Families | 1,060 (20.7%) | $250,001 |
| 5-Person Families | 560 (11.0%) | $250,001 |
| 6-Person Families | 100 (2.0%) | $250,001 |
| 7+ Person Families | 36 (0.7%) | $214,868 |
| Total | 5,109 (100.0%) | $243,866 |
Family Income by Number of Earners in Bellaire
The median family income in Bellaire is $243,866, with families comprising 1 earner (1,408) having the highest median family income of $250,001, while families with no earners (667) have the lowest median family income of $136,334, accounting for 27.6% and 13.1% of families, respectively.
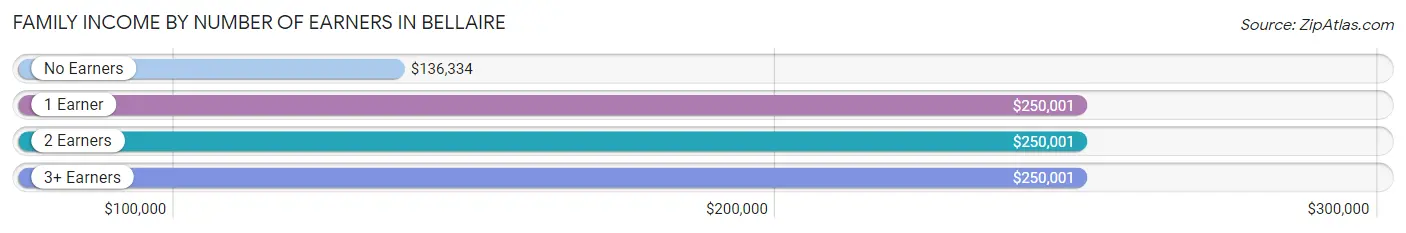
| Number of Earners | # Families | Median Income |
| No Earners | 667 (13.1%) | $136,334 |
| 1 Earner | 1,408 (27.6%) | $250,001 |
| 2 Earners | 2,614 (51.2%) | $250,001 |
| 3+ Earners | 420 (8.2%) | $250,001 |
| Total | 5,109 (100.0%) | $243,866 |
Household Income in Bellaire
Household Income Brackets in Bellaire
With 3,257 households falling in the category, the $200,000+ income range is the most frequent in Bellaire, accounting for 53.5% of all households. In contrast, only 24 households (0.4%) fall into the $10,000 to $14,999 income bracket, making it the least populous group.
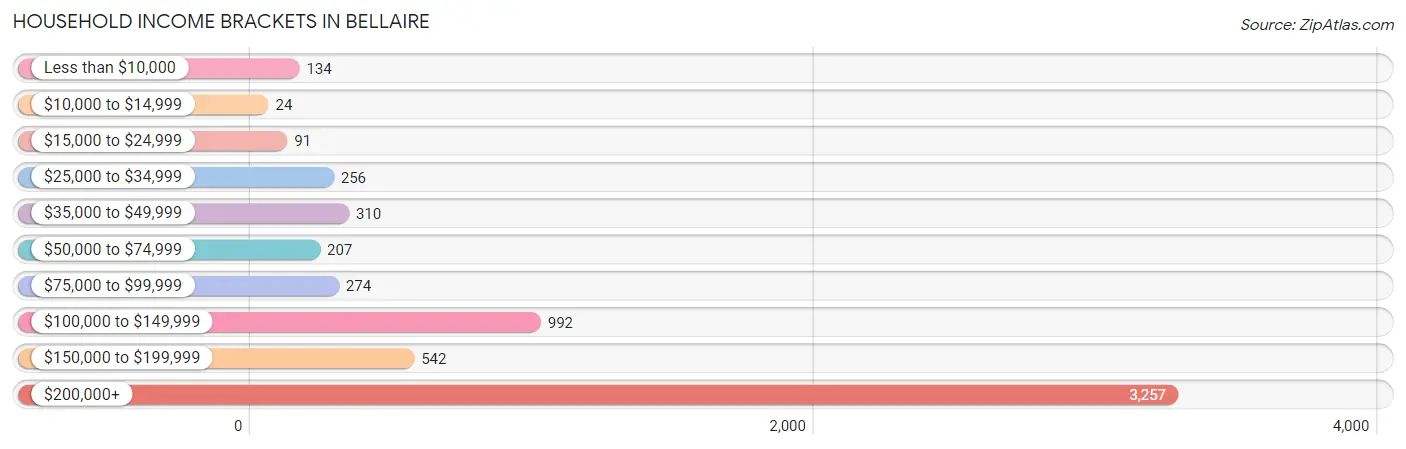
| Income Bracket | # Households | % Households |
| Less than $10,000 | 134 | 2.2% |
| $10,000 to $14,999 | 24 | 0.4% |
| $15,000 to $24,999 | 91 | 1.5% |
| $25,000 to $34,999 | 256 | 4.2% |
| $35,000 to $49,999 | 310 | 5.1% |
| $50,000 to $74,999 | 207 | 3.4% |
| $75,000 to $99,999 | 274 | 4.5% |
| $100,000 to $149,999 | 992 | 16.3% |
| $150,000 to $199,999 | 542 | 8.9% |
| $200,000+ | 3,257 | 53.5% |
Household Income by Householder Age in Bellaire
The median household income in Bellaire is $215,636, with the highest median household income of $250,001 found in the 45 to 64 years age bracket for the primary householder. A total of 2,817 households (46.3%) fall into this category. Meanwhile, the 15 to 24 years age bracket for the primary householder has the lowest median household income of $0, with 26 households (0.4%) in this group.
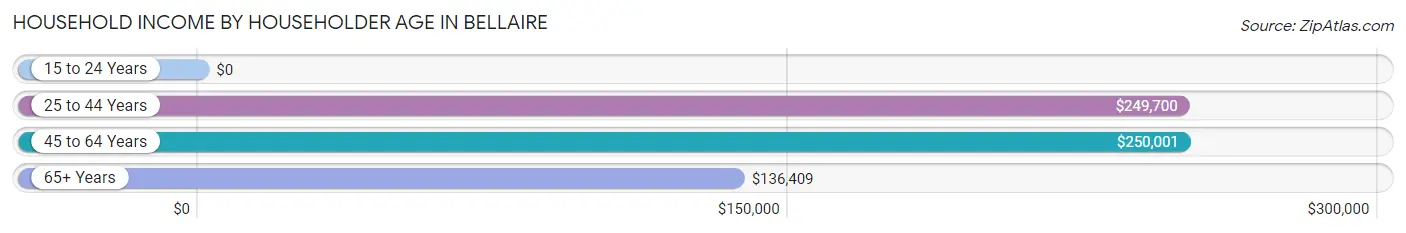
| Income Bracket | # Households | Median Income |
| 15 to 24 Years | 26 (0.4%) | $0 |
| 25 to 44 Years | 1,400 (23.0%) | $249,700 |
| 45 to 64 Years | 2,817 (46.3%) | $250,001 |
| 65+ Years | 1,844 (30.3%) | $136,409 |
| Total | 6,087 (100.0%) | $215,636 |
Poverty in Bellaire
Income Below Poverty by Sex and Age in Bellaire
With 2.1% poverty level for males and 2.3% for females among the residents of Bellaire, 15 year old males and 18 to 24 year old females are the most vulnerable to poverty, with 10 males (11.2%) and 35 females (9.3%) in their respective age groups living below the poverty level.
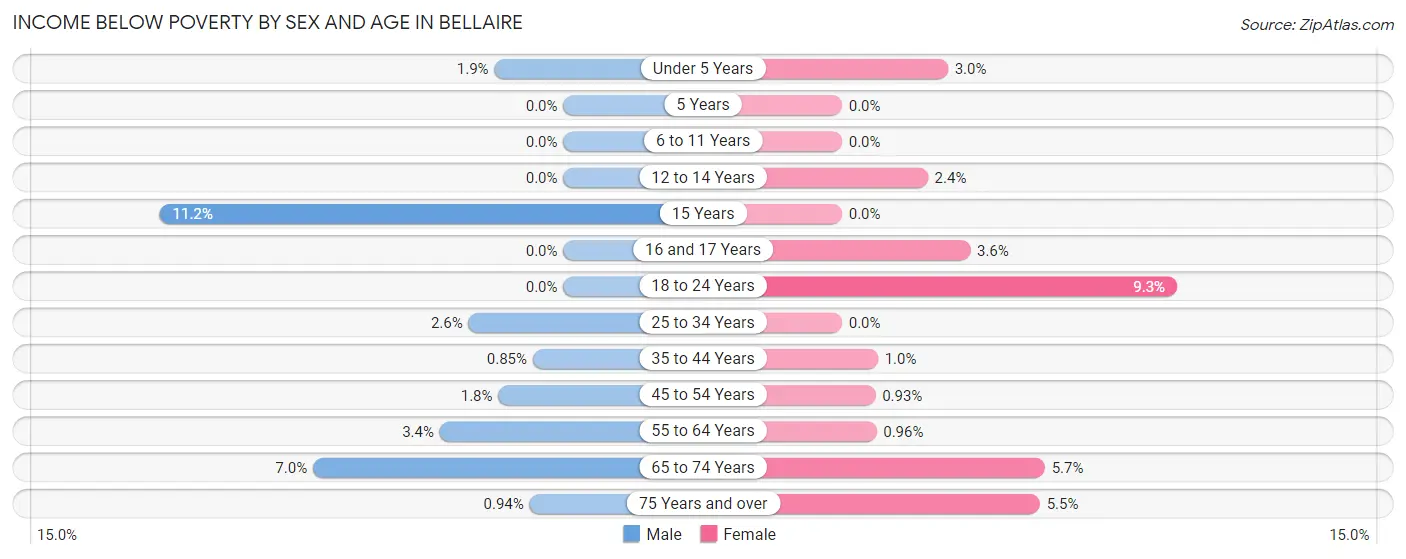
| Age Bracket | Male | Female |
| Under 5 Years | 9 (1.9%) | 11 (2.9%) |
| 5 Years | 0 (0.0%) | 0 (0.0%) |
| 6 to 11 Years | 0 (0.0%) | 0 (0.0%) |
| 12 to 14 Years | 0 (0.0%) | 11 (2.4%) |
| 15 Years | 10 (11.2%) | 0 (0.0%) |
| 16 and 17 Years | 0 (0.0%) | 9 (3.6%) |
| 18 to 24 Years | 0 (0.0%) | 35 (9.3%) |
| 25 to 34 Years | 13 (2.6%) | 0 (0.0%) |
| 35 to 44 Years | 9 (0.9%) | 12 (1.0%) |
| 45 to 54 Years | 23 (1.8%) | 11 (0.9%) |
| 55 to 64 Years | 50 (3.4%) | 14 (1.0%) |
| 65 to 74 Years | 58 (7.0%) | 49 (5.7%) |
| 75 Years and over | 6 (0.9%) | 40 (5.5%) |
| Total | 178 (2.1%) | 192 (2.3%) |
Income Above Poverty by Sex and Age in Bellaire
According to the poverty statistics in Bellaire, males aged 5 years and females aged 5 years are the age groups that are most secure financially, with 100.0% of males and 100.0% of females in these age groups living above the poverty line.
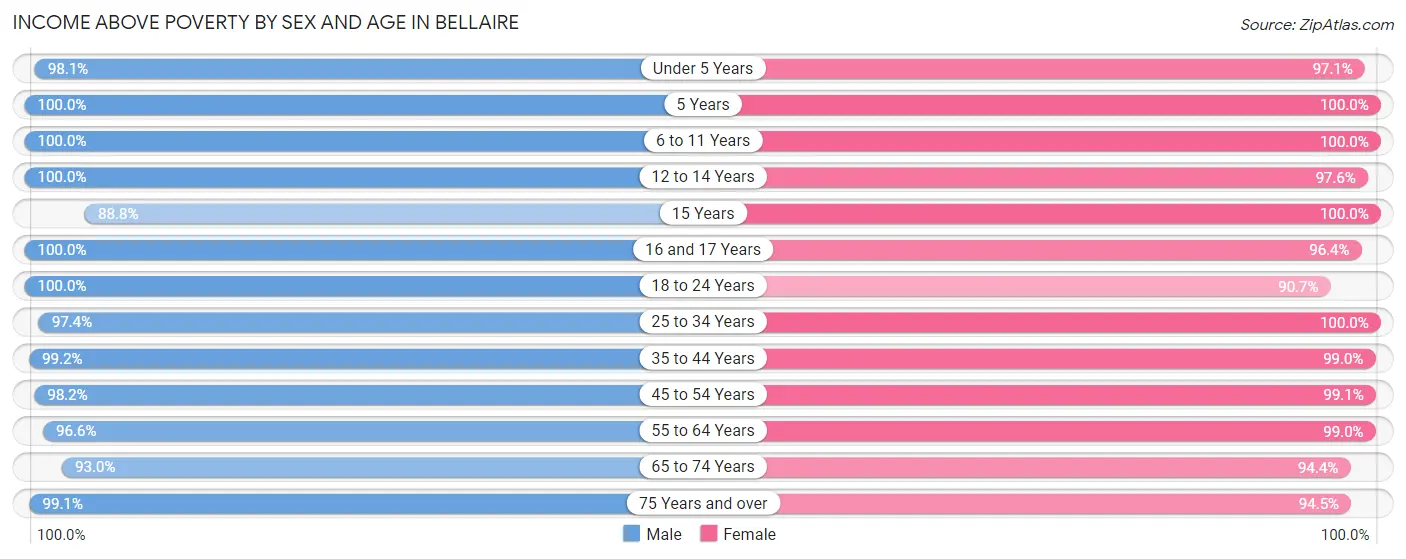
| Age Bracket | Male | Female |
| Under 5 Years | 460 (98.1%) | 362 (97.1%) |
| 5 Years | 65 (100.0%) | 92 (100.0%) |
| 6 to 11 Years | 1,000 (100.0%) | 716 (100.0%) |
| 12 to 14 Years | 405 (100.0%) | 449 (97.6%) |
| 15 Years | 79 (88.8%) | 166 (100.0%) |
| 16 and 17 Years | 357 (100.0%) | 243 (96.4%) |
| 18 to 24 Years | 493 (100.0%) | 340 (90.7%) |
| 25 to 34 Years | 479 (97.4%) | 639 (100.0%) |
| 35 to 44 Years | 1,046 (99.2%) | 1,183 (99.0%) |
| 45 to 54 Years | 1,250 (98.2%) | 1,169 (99.1%) |
| 55 to 64 Years | 1,405 (96.6%) | 1,451 (99.0%) |
| 65 to 74 Years | 774 (93.0%) | 819 (94.4%) |
| 75 Years and over | 632 (99.1%) | 686 (94.5%) |
| Total | 8,445 (97.9%) | 8,315 (97.7%) |
Income Below Poverty Among Married-Couple Families in Bellaire
The poverty statistics for married-couple families in Bellaire show that 1.5% or 69 of the total 4,557 families live below the poverty line. Families with 1 or 2 children have the highest poverty rate of 1.8%, comprising of 31 families. On the other hand, families with 3 or 4 children have the lowest poverty rate of 0.0%, which includes 0 families.
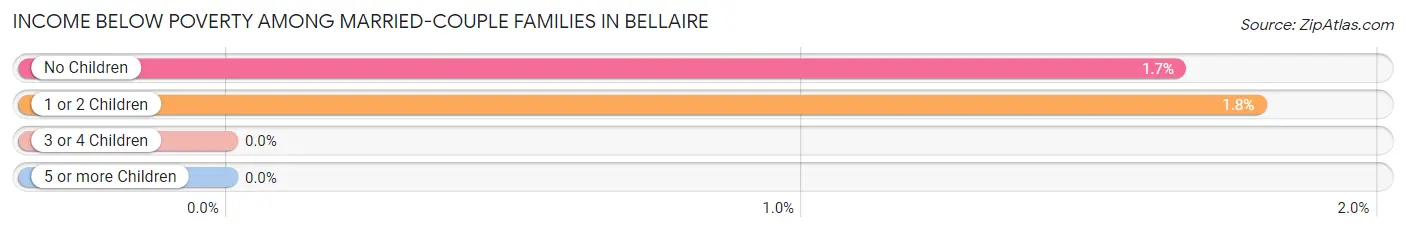
| Children | Above Poverty | Below Poverty |
| No Children | 2,268 (98.4%) | 38 (1.7%) |
| 1 or 2 Children | 1,702 (98.2%) | 31 (1.8%) |
| 3 or 4 Children | 511 (100.0%) | 0 (0.0%) |
| 5 or more Children | 7 (100.0%) | 0 (0.0%) |
| Total | 4,488 (98.5%) | 69 (1.5%) |
Income Below Poverty Among Single-Parent Households in Bellaire
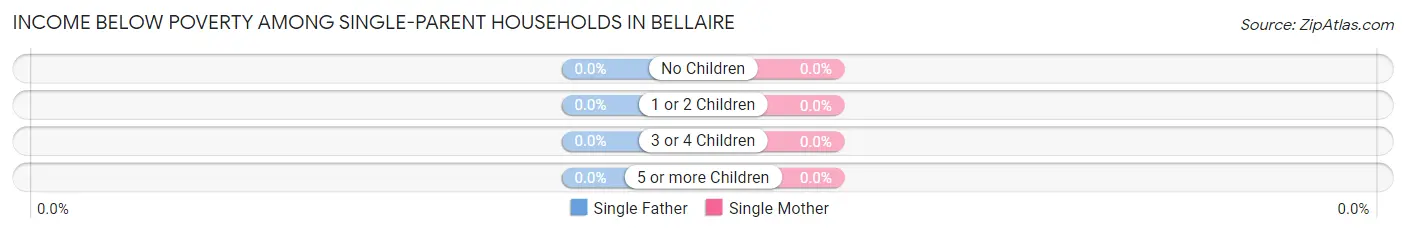
| Children | Single Father | Single Mother |
| No Children | 0 (0.0%) | 0 (0.0%) |
| 1 or 2 Children | 0 (0.0%) | 0 (0.0%) |
| 3 or 4 Children | 0 (0.0%) | 0 (0.0%) |
| 5 or more Children | 0 (0.0%) | 0 (0.0%) |
| Total | 0 (0.0%) | 0 (0.0%) |
Income Below Poverty Among Married-Couple vs Single-Parent Households in Bellaire
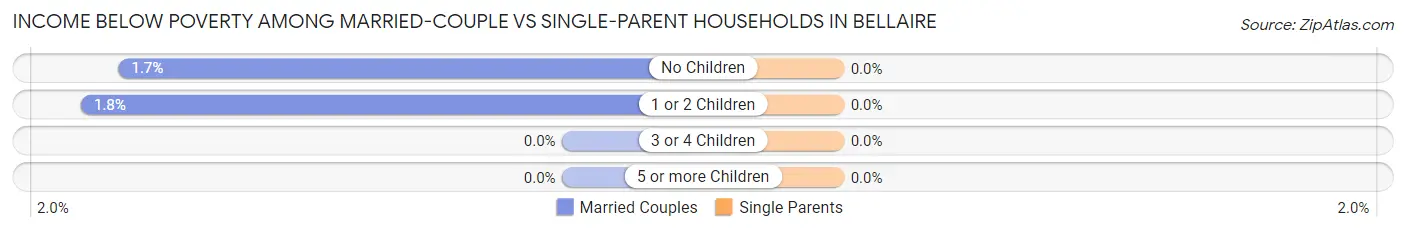
| Children | Married-Couple Families | Single-Parent Households |
| No Children | 38 (1.7%) | 0 (0.0%) |
| 1 or 2 Children | 31 (1.8%) | 0 (0.0%) |
| 3 or 4 Children | 0 (0.0%) | 0 (0.0%) |
| 5 or more Children | 0 (0.0%) | 0 (0.0%) |
| Total | 69 (1.5%) | 0 (0.0%) |
Race in Bellaire
The most populous races in Bellaire are White / Caucasian (11,688 | 68.1%), Asian (3,634 | 21.2%), and Hispanic or Latino (1,869 | 10.9%).
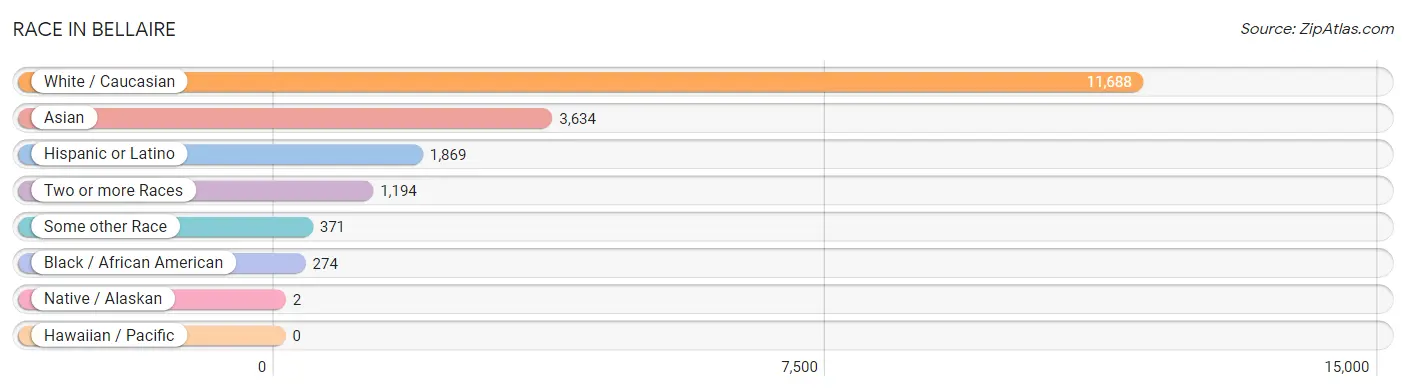
| Race | # Population | % Population |
| Asian | 3,634 | 21.2% |
| Black / African American | 274 | 1.6% |
| Hawaiian / Pacific | 0 | 0.0% |
| Hispanic or Latino | 1,869 | 10.9% |
| Native / Alaskan | 2 | 0.0% |
| White / Caucasian | 11,688 | 68.1% |
| Two or more Races | 1,194 | 7.0% |
| Some other Race | 371 | 2.2% |
| Total | 17,163 | 100.0% |
Ancestry in Bellaire
The most populous ancestries reported in Bellaire are English (2,328 | 13.6%), Indian (Asian) (1,955 | 11.4%), Irish (1,697 | 9.9%), German (1,503 | 8.8%), and Thai (969 | 5.7%), together accounting for 49.2% of all Bellaire residents.
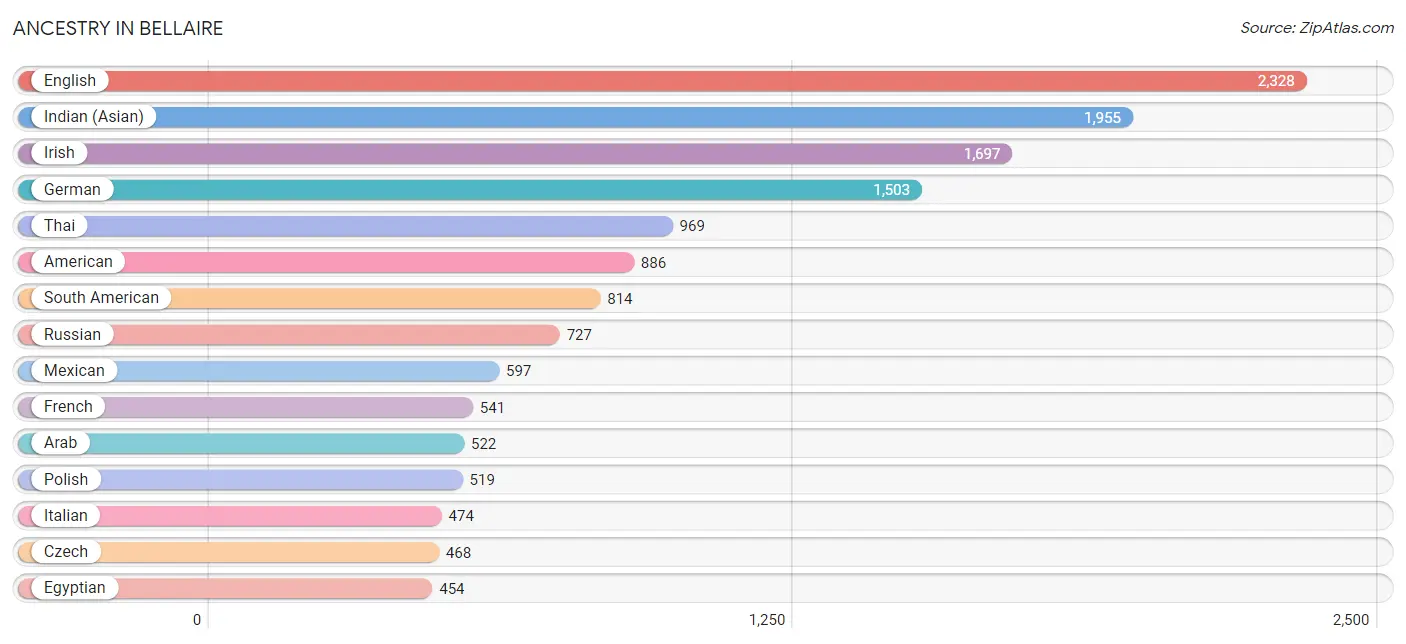
| Ancestry | # Population | % Population |
| American | 886 | 5.2% |
| Arab | 522 | 3.0% |
| Armenian | 20 | 0.1% |
| Australian | 7 | 0.0% |
| Austrian | 62 | 0.4% |
| Belgian | 95 | 0.5% |
| Bhutanese | 44 | 0.3% |
| Bolivian | 20 | 0.1% |
| British | 151 | 0.9% |
| Burmese | 131 | 0.8% |
| Cajun | 17 | 0.1% |
| Canadian | 4 | 0.0% |
| Central American | 70 | 0.4% |
| Central American Indian | 12 | 0.1% |
| Chilean | 134 | 0.8% |
| Chippewa | 14 | 0.1% |
| Choctaw | 2 | 0.0% |
| Colombian | 80 | 0.5% |
| Croatian | 175 | 1.0% |
| Cuban | 131 | 0.8% |
| Czech | 468 | 2.7% |
| Czechoslovakian | 7 | 0.0% |
| Danish | 35 | 0.2% |
| Dominican | 5 | 0.0% |
| Dutch | 218 | 1.3% |
| Eastern European | 320 | 1.9% |
| Ecuadorian | 90 | 0.5% |
| Egyptian | 454 | 2.6% |
| English | 2,328 | 13.6% |
| Ethiopian | 9 | 0.1% |
| European | 185 | 1.1% |
| Filipino | 146 | 0.9% |
| Finnish | 37 | 0.2% |
| French | 541 | 3.2% |
| French Canadian | 16 | 0.1% |
| German | 1,503 | 8.8% |
| Greek | 72 | 0.4% |
| Guatemalan | 7 | 0.0% |
| Haitian | 23 | 0.1% |
| Honduran | 10 | 0.1% |
| Indian (Asian) | 1,955 | 11.4% |
| Iranian | 36 | 0.2% |
| Irish | 1,697 | 9.9% |
| Israeli | 14 | 0.1% |
| Italian | 474 | 2.8% |
| Korean | 104 | 0.6% |
| Laotian | 100 | 0.6% |
| Lebanese | 44 | 0.3% |
| Lithuanian | 45 | 0.3% |
| Mexican | 597 | 3.5% |
| Moroccan | 5 | 0.0% |
| Nigerian | 34 | 0.2% |
| Northern European | 47 | 0.3% |
| Norwegian | 279 | 1.6% |
| Pakistani | 2 | 0.0% |
| Panamanian | 33 | 0.2% |
| Peruvian | 351 | 2.1% |
| Polish | 519 | 3.0% |
| Portuguese | 24 | 0.1% |
| Puerto Rican | 39 | 0.2% |
| Romanian | 32 | 0.2% |
| Russian | 727 | 4.2% |
| Salvadoran | 20 | 0.1% |
| Scandinavian | 16 | 0.1% |
| Scotch-Irish | 95 | 0.5% |
| Scottish | 268 | 1.6% |
| Slavic | 18 | 0.1% |
| South African | 7 | 0.0% |
| South American | 814 | 4.7% |
| Spaniard | 160 | 0.9% |
| Spanish | 53 | 0.3% |
| Sri Lankan | 392 | 2.3% |
| Subsaharan African | 51 | 0.3% |
| Swedish | 145 | 0.8% |
| Swiss | 50 | 0.3% |
| Syrian | 19 | 0.1% |
| Thai | 969 | 5.7% |
| Turkish | 53 | 0.3% |
| Ukrainian | 51 | 0.3% |
| Uruguayan | 15 | 0.1% |
| Venezuelan | 124 | 0.7% |
| Vietnamese | 50 | 0.3% |
| Welsh | 147 | 0.9% | View All 83 Rows |
Immigrants in Bellaire
The most numerous immigrant groups reported in Bellaire came from Asia (2,077 | 12.1%), Eastern Asia (1,178 | 6.9%), China (1,092 | 6.4%), Europe (639 | 3.7%), and Latin America (580 | 3.4%), together accounting for 32.4% of all Bellaire residents.
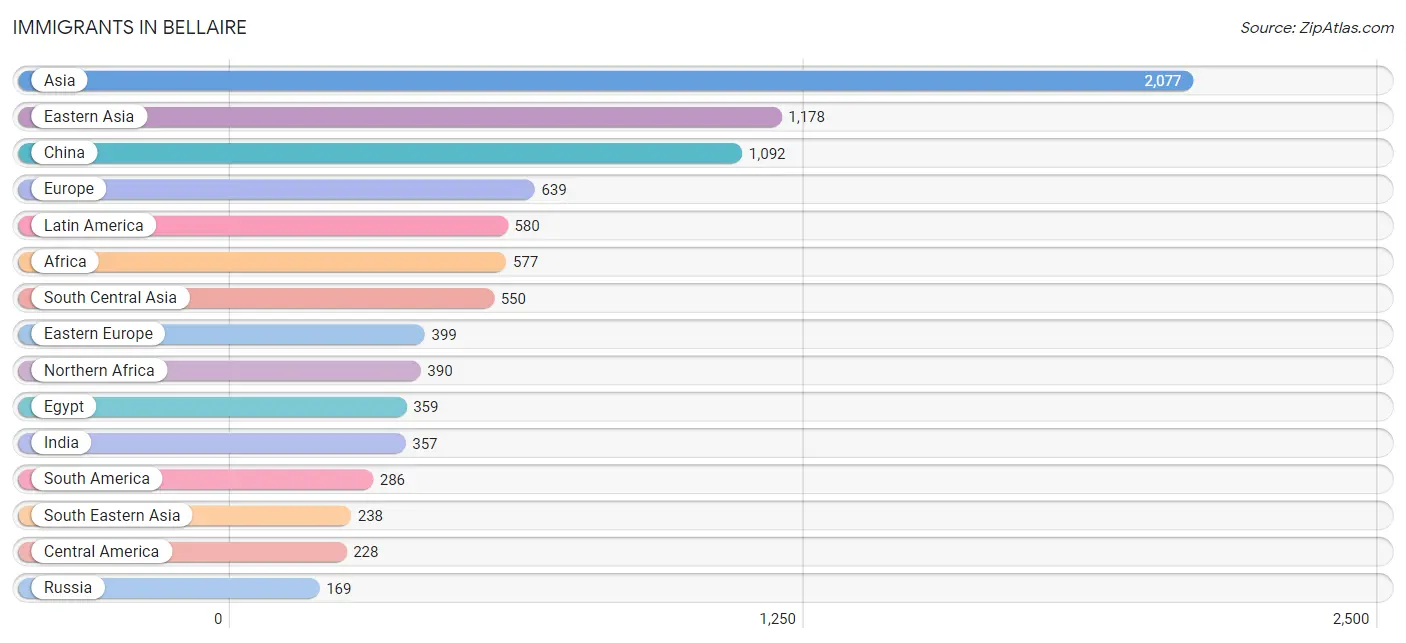
| Immigration Origin | # Population | % Population |
| Africa | 577 | 3.4% |
| Armenia | 39 | 0.2% |
| Asia | 2,077 | 12.1% |
| Australia | 17 | 0.1% |
| Bangladesh | 2 | 0.0% |
| Belarus | 18 | 0.1% |
| Bolivia | 13 | 0.1% |
| Brazil | 83 | 0.5% |
| Canada | 22 | 0.1% |
| Caribbean | 66 | 0.4% |
| Central America | 228 | 1.3% |
| Chile | 8 | 0.1% |
| China | 1,092 | 6.4% |
| Colombia | 12 | 0.1% |
| Costa Rica | 25 | 0.2% |
| Cuba | 66 | 0.4% |
| Denmark | 9 | 0.1% |
| Eastern Africa | 59 | 0.3% |
| Eastern Asia | 1,178 | 6.9% |
| Eastern Europe | 399 | 2.3% |
| Ecuador | 40 | 0.2% |
| Egypt | 359 | 2.1% |
| El Salvador | 20 | 0.1% |
| England | 101 | 0.6% |
| Ethiopia | 9 | 0.1% |
| Europe | 639 | 3.7% |
| France | 23 | 0.1% |
| Germany | 38 | 0.2% |
| Guatemala | 9 | 0.1% |
| Honduras | 10 | 0.1% |
| Hong Kong | 78 | 0.4% |
| India | 357 | 2.1% |
| Indonesia | 34 | 0.2% |
| Ireland | 9 | 0.1% |
| Israel | 5 | 0.0% |
| Italy | 10 | 0.1% |
| Japan | 40 | 0.2% |
| Korea | 46 | 0.3% |
| Latin America | 580 | 3.4% |
| Lebanon | 38 | 0.2% |
| Malaysia | 34 | 0.2% |
| Mexico | 157 | 0.9% |
| Nepal | 55 | 0.3% |
| Netherlands | 13 | 0.1% |
| Nigeria | 14 | 0.1% |
| Northern Africa | 390 | 2.3% |
| Northern Europe | 156 | 0.9% |
| Oceania | 17 | 0.1% |
| Pakistan | 126 | 0.7% |
| Panama | 7 | 0.0% |
| Peru | 59 | 0.3% |
| Philippines | 9 | 0.1% |
| Poland | 34 | 0.2% |
| Romania | 5 | 0.0% |
| Russia | 169 | 1.0% |
| Singapore | 22 | 0.1% |
| South Africa | 114 | 0.7% |
| South America | 286 | 1.7% |
| South Central Asia | 550 | 3.2% |
| South Eastern Asia | 238 | 1.4% |
| Southern Europe | 10 | 0.1% |
| Sri Lanka | 10 | 0.1% |
| Sudan | 31 | 0.2% |
| Sweden | 6 | 0.0% |
| Taiwan | 132 | 0.8% |
| Thailand | 2 | 0.0% |
| Turkey | 16 | 0.1% |
| Uganda | 25 | 0.2% |
| Ukraine | 133 | 0.8% |
| Uruguay | 15 | 0.1% |
| Venezuela | 56 | 0.3% |
| Vietnam | 137 | 0.8% |
| Western Africa | 14 | 0.1% |
| Western Asia | 98 | 0.6% |
| Western Europe | 74 | 0.4% |
| Zimbabwe | 25 | 0.2% | View All 76 Rows |
Sex and Age in Bellaire
Sex and Age in Bellaire
The most populous age groups in Bellaire are 55 to 59 Years (767 | 8.9%) for men and 55 to 59 Years (916 | 10.7%) for women.
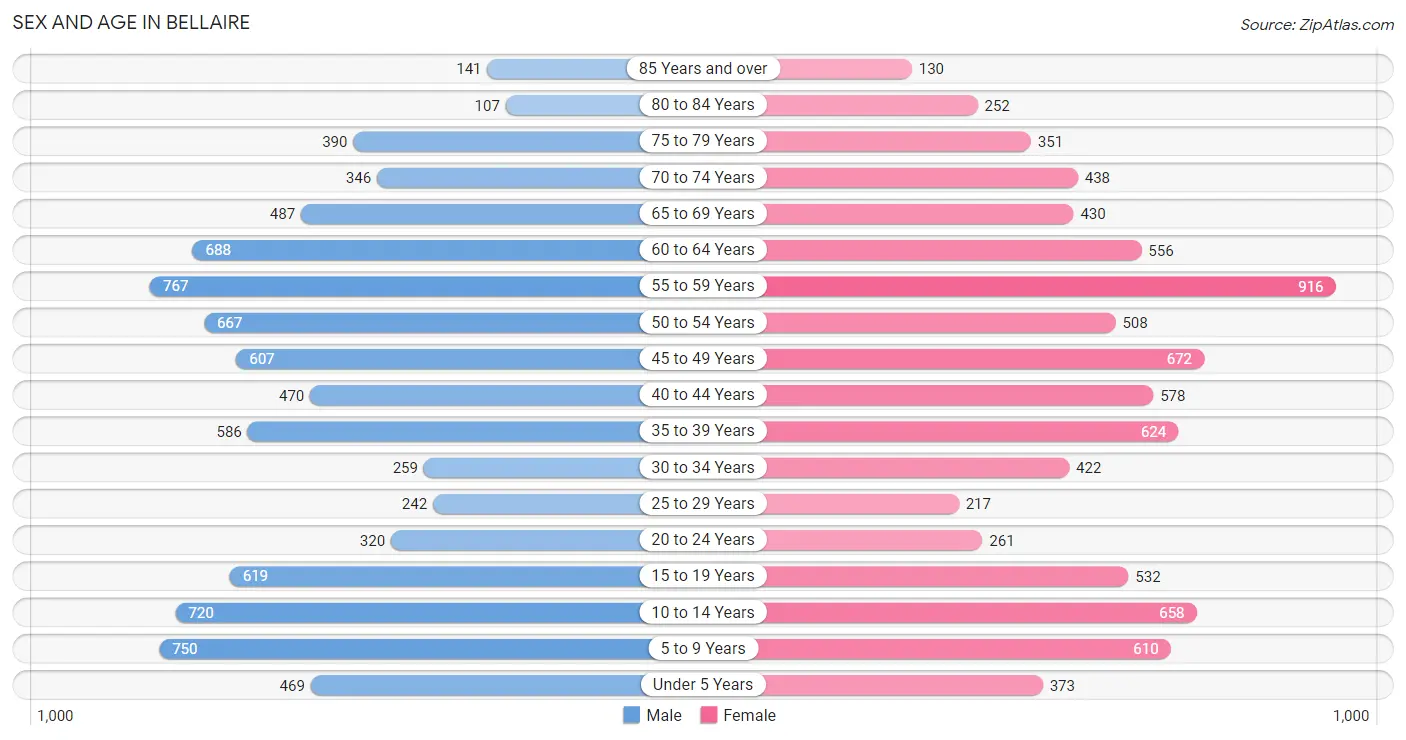
| Age Bracket | Male | Female |
| Under 5 Years | 469 (5.4%) | 373 (4.4%) |
| 5 to 9 Years | 750 (8.7%) | 610 (7.1%) |
| 10 to 14 Years | 720 (8.3%) | 658 (7.7%) |
| 15 to 19 Years | 619 (7.2%) | 532 (6.2%) |
| 20 to 24 Years | 320 (3.7%) | 261 (3.1%) |
| 25 to 29 Years | 242 (2.8%) | 217 (2.5%) |
| 30 to 34 Years | 259 (3.0%) | 422 (5.0%) |
| 35 to 39 Years | 586 (6.8%) | 624 (7.3%) |
| 40 to 44 Years | 470 (5.4%) | 578 (6.8%) |
| 45 to 49 Years | 607 (7.0%) | 672 (7.9%) |
| 50 to 54 Years | 667 (7.7%) | 508 (6.0%) |
| 55 to 59 Years | 767 (8.9%) | 916 (10.7%) |
| 60 to 64 Years | 688 (8.0%) | 556 (6.5%) |
| 65 to 69 Years | 487 (5.6%) | 430 (5.0%) |
| 70 to 74 Years | 346 (4.0%) | 438 (5.1%) |
| 75 to 79 Years | 390 (4.5%) | 351 (4.1%) |
| 80 to 84 Years | 107 (1.2%) | 252 (2.9%) |
| 85 Years and over | 141 (1.6%) | 130 (1.5%) |
| Total | 8,635 (100.0%) | 8,528 (100.0%) |
Families and Households in Bellaire
Median Family Size in Bellaire
The median family size in Bellaire is 3.12 persons per family, with married-couple families (4,557 | 89.2%) accounting for the largest median family size of 3.21 persons per family. On the other hand, single male/father families (126 | 2.5%) represent the smallest median family size with 2.26 persons per family.
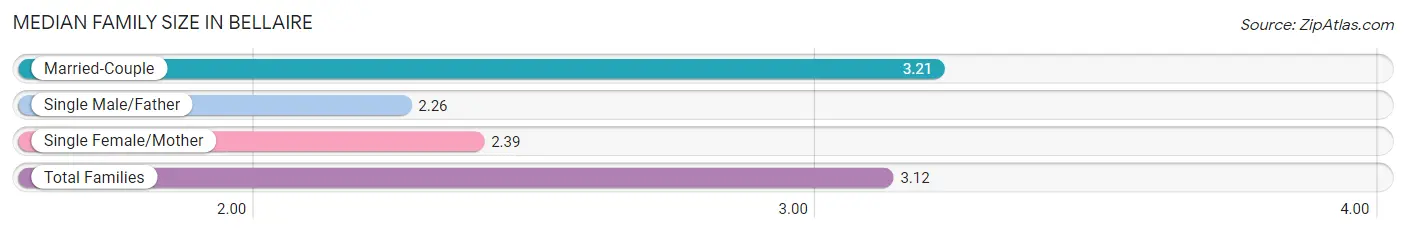
| Family Type | # Families | Family Size |
| Married-Couple | 4,557 (89.2%) | 3.21 |
| Single Male/Father | 126 (2.5%) | 2.26 |
| Single Female/Mother | 426 (8.3%) | 2.39 |
| Total Families | 5,109 (100.0%) | 3.12 |
Median Household Size in Bellaire
The median household size in Bellaire is 2.81 persons per household, with married-couple households (4,557 | 74.9%) accounting for the largest median household size of 3.21 persons per household. non-family households (978 | 16.1%) represent the smallest median household size with 1.15 persons per household.
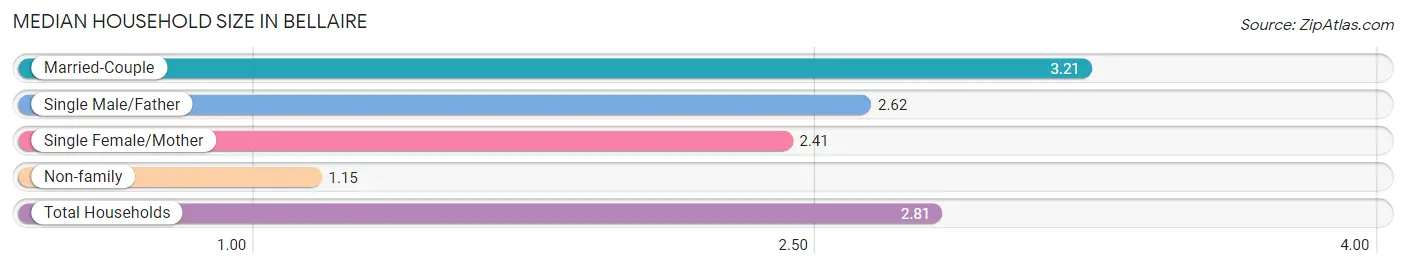
| Household Type | # Households | Household Size |
| Married-Couple | 4,557 (74.9%) | 3.21 |
| Single Male/Father | 126 (2.1%) | 2.62 |
| Single Female/Mother | 426 (7.0%) | 2.41 |
| Non-family | 978 (16.1%) | 1.15 |
| Total Households | 6,087 (100.0%) | 2.81 |
Household Size by Marriage Status in Bellaire
Out of a total of 6,087 households in Bellaire, 5,109 (83.9%) are family households, while 978 (16.1%) are nonfamily households. The most numerous type of family households are 2-person households, comprising 2,147, and the most common type of nonfamily households are 1-person households, comprising 845.
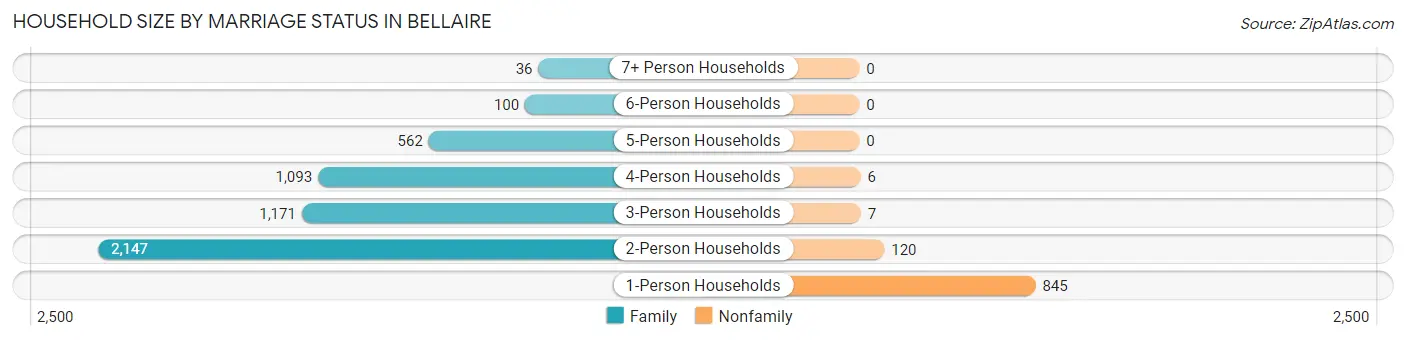
| Household Size | Family Households | Nonfamily Households |
| 1-Person Households | - | 845 (13.9%) |
| 2-Person Households | 2,147 (35.3%) | 120 (2.0%) |
| 3-Person Households | 1,171 (19.2%) | 7 (0.1%) |
| 4-Person Households | 1,093 (18.0%) | 6 (0.1%) |
| 5-Person Households | 562 (9.2%) | 0 (0.0%) |
| 6-Person Households | 100 (1.6%) | 0 (0.0%) |
| 7+ Person Households | 36 (0.6%) | 0 (0.0%) |
| Total | 5,109 (83.9%) | 978 (16.1%) |
Female Fertility in Bellaire
Fertility by Age in Bellaire
Average fertility rate in Bellaire is 13.0 births per 1,000 women. Women in the age bracket of 20 to 34 years have the highest fertility rate with 29.0 births per 1,000 women. Women in the age bracket of 20 to 34 years acount for 60.5% of all women with births.
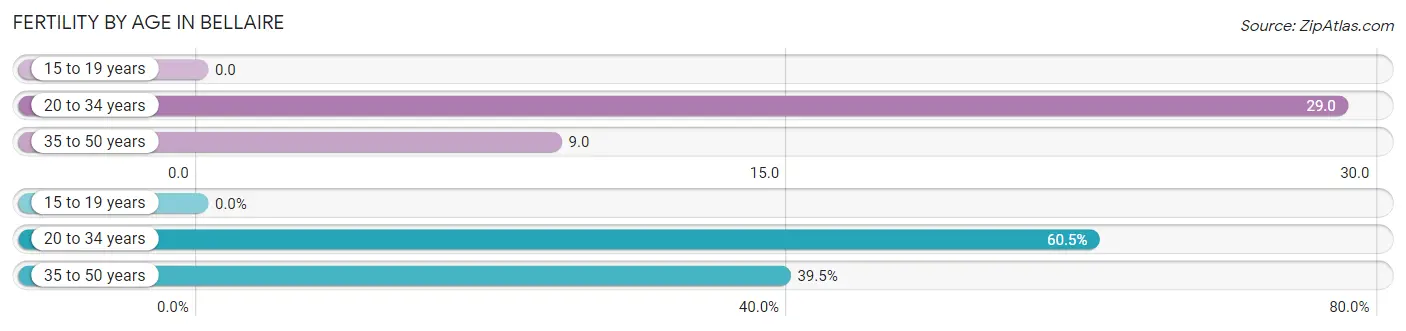
| Age Bracket | Women with Births | Births / 1,000 Women |
| 15 to 19 years | 0 (0.0%) | 0.0 |
| 20 to 34 years | 26 (60.5%) | 29.0 |
| 35 to 50 years | 17 (39.5%) | 9.0 |
| Total | 43 (100.0%) | 13.0 |
Fertility by Age by Marriage Status in Bellaire
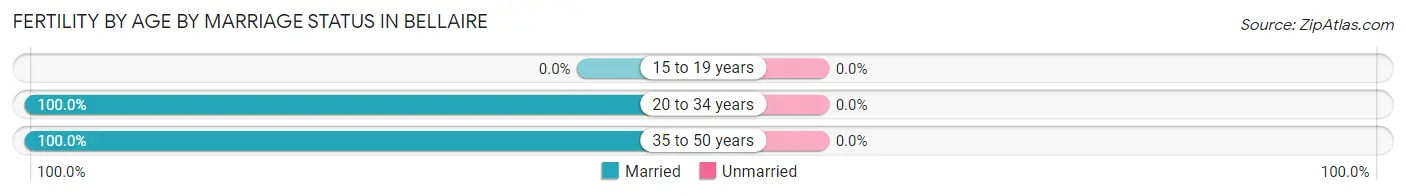
| Age Bracket | Married | Unmarried |
| 15 to 19 years | 0 (0.0%) | 0 (0.0%) |
| 20 to 34 years | 26 (100.0%) | 0 (0.0%) |
| 35 to 50 years | 17 (100.0%) | 0 (0.0%) |
| Total | 43 (100.0%) | 0 (0.0%) |
Fertility by Education in Bellaire
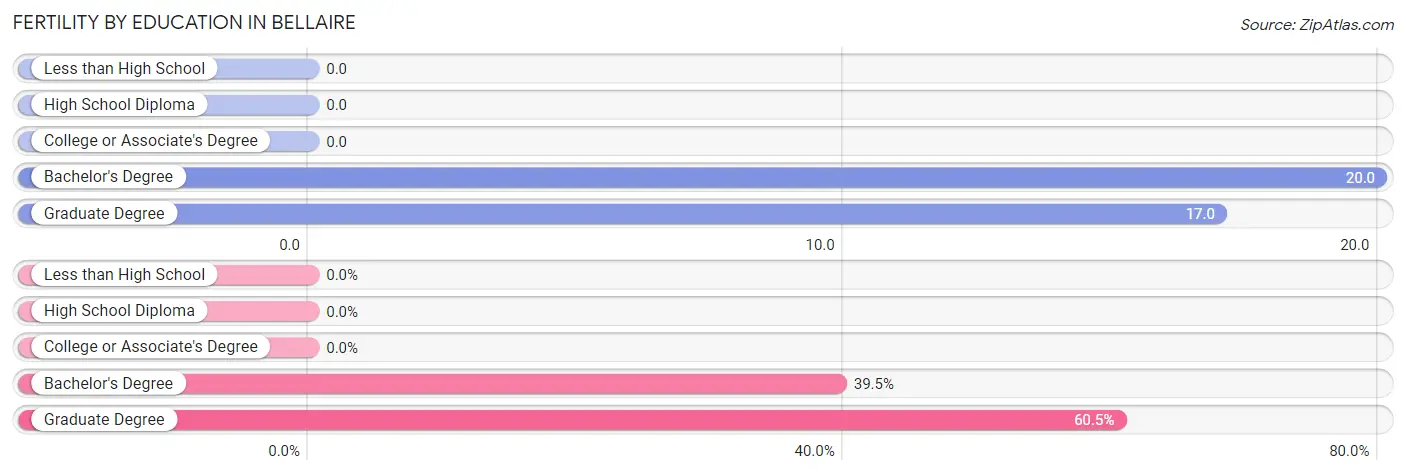
| Educational Attainment | Women with Births | Births / 1,000 Women |
| Less than High School | 0 (0.0%) | 0.0 |
| High School Diploma | 0 (0.0%) | 0.0 |
| College or Associate's Degree | 0 (0.0%) | 0.0 |
| Bachelor's Degree | 17 (39.5%) | 20.0 |
| Graduate Degree | 26 (60.5%) | 17.0 |
| Total | 43 (100.0%) | 13.0 |
Fertility by Education by Marriage Status in Bellaire
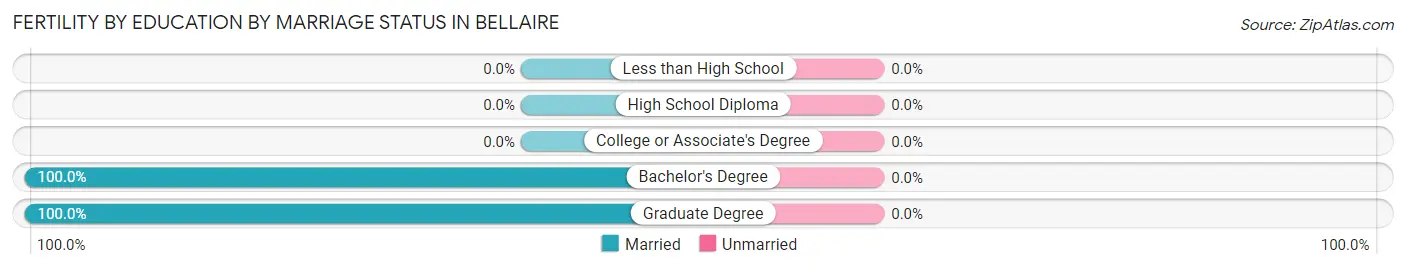
| Educational Attainment | Married | Unmarried |
| Less than High School | 0 (0.0%) | 0 (0.0%) |
| High School Diploma | 0 (0.0%) | 0 (0.0%) |
| College or Associate's Degree | 0 (0.0%) | 0 (0.0%) |
| Bachelor's Degree | 17 (100.0%) | 0 (0.0%) |
| Graduate Degree | 26 (100.0%) | 0 (0.0%) |
| Total | 43 (100.0%) | 0 (0.0%) |
Employment Characteristics in Bellaire
Employment by Class of Employer in Bellaire
Among the 8,148 employed individuals in Bellaire, private company employees (4,853 | 59.6%), not-for-profit organizations (1,154 | 14.2%), and self-employed (not incorporated) (746 | 9.2%) make up the most common classes of employment.
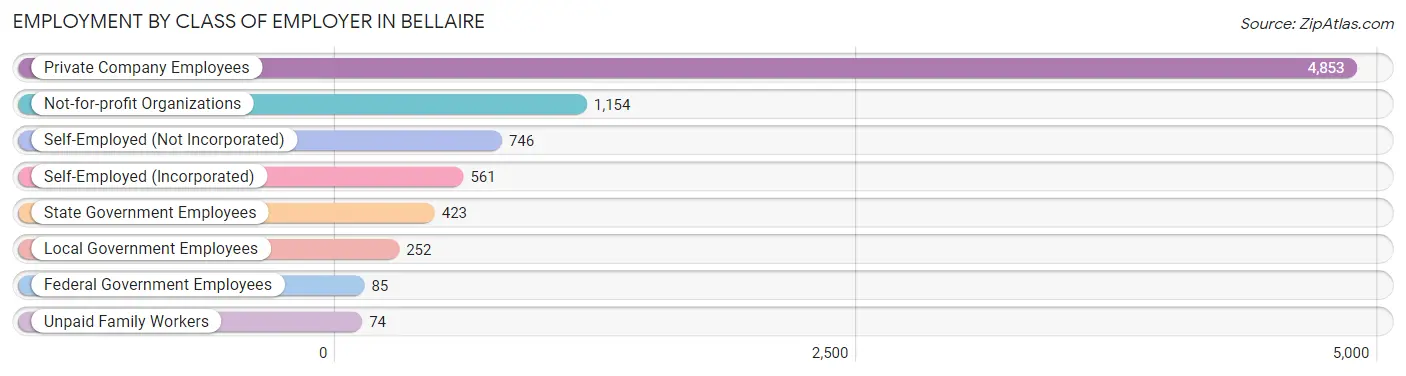
| Employer Class | # Employees | % Employees |
| Private Company Employees | 4,853 | 59.6% |
| Self-Employed (Incorporated) | 561 | 6.9% |
| Self-Employed (Not Incorporated) | 746 | 9.2% |
| Not-for-profit Organizations | 1,154 | 14.2% |
| Local Government Employees | 252 | 3.1% |
| State Government Employees | 423 | 5.2% |
| Federal Government Employees | 85 | 1.0% |
| Unpaid Family Workers | 74 | 0.9% |
| Total | 8,148 | 100.0% |
Employment Status by Age in Bellaire
According to the labor force statistics for Bellaire, out of the total population over 16 years of age (13,328), 62.9% or 8,383 individuals are in the labor force, with 2.5% or 210 of them unemployed. The age group with the highest labor force participation rate is 25 to 29 years, with 86.7% or 398 individuals in the labor force. Within the labor force, the 75 years and over age range has the highest percentage of unemployed individuals, with 25.4% or 18 of them being unemployed.
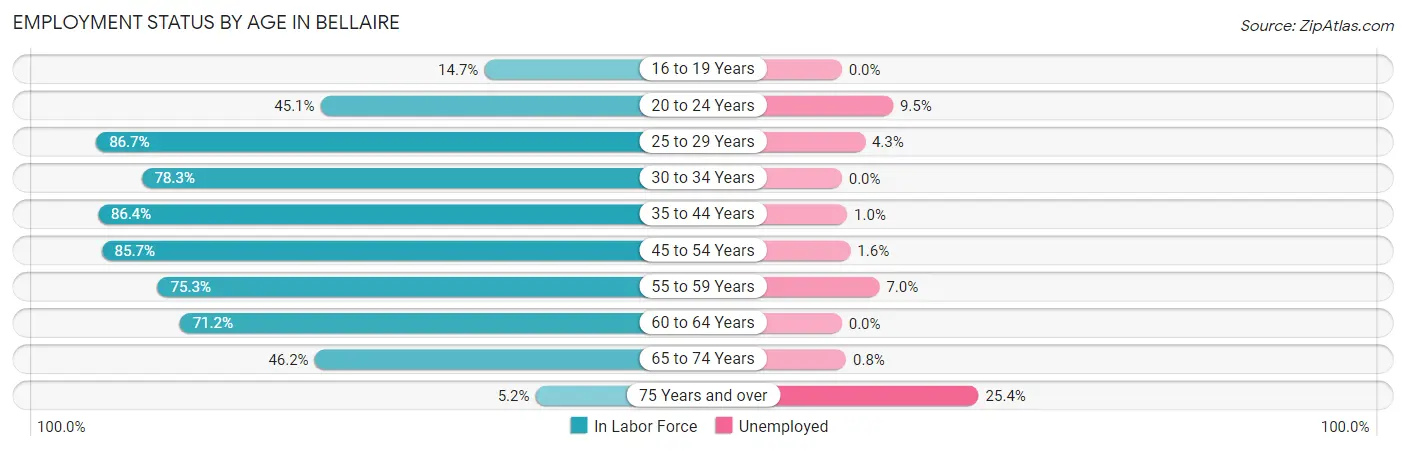
| Age Bracket | In Labor Force | Unemployed |
| 16 to 19 Years | 132 (14.7%) | 0 (0.0%) |
| 20 to 24 Years | 262 (45.1%) | 25 (9.5%) |
| 25 to 29 Years | 398 (86.7%) | 17 (4.3%) |
| 30 to 34 Years | 533 (78.3%) | 0 (0.0%) |
| 35 to 44 Years | 1,951 (86.4%) | 20 (1.0%) |
| 45 to 54 Years | 2,103 (85.7%) | 34 (1.6%) |
| 55 to 59 Years | 1,267 (75.3%) | 89 (7.0%) |
| 60 to 64 Years | 886 (71.2%) | 0 (0.0%) |
| 65 to 74 Years | 786 (46.2%) | 6 (0.8%) |
| 75 Years and over | 71 (5.2%) | 18 (25.4%) |
| Total | 8,383 (62.9%) | 210 (2.5%) |
Employment Status by Educational Attainment in Bellaire
According to labor force statistics for Bellaire, 81.3% of individuals (7,137) out of the total population between 25 and 64 years of age (8,779) are in the labor force, with 2.2% or 157 of them being unemployed. The group with the highest labor force participation rate are those with the educational attainment of bachelor's degree or higher, with 84.1% or 6,149 individuals in the labor force. Within the labor force, individuals with bachelor's degree or higher education have the highest percentage of unemployment, with 2.5% or 154 of them being unemployed.
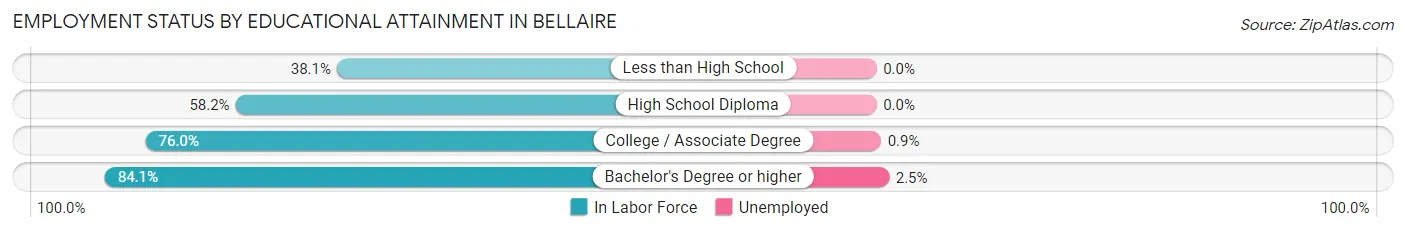
| Educational Attainment | In Labor Force | Unemployed |
| Less than High School | 43 (38.1%) | 0 (0.0%) |
| High School Diploma | 271 (58.2%) | 0 (0.0%) |
| College / Associate Degree | 675 (76.0%) | 8 (0.9%) |
| Bachelor's Degree or higher | 6,149 (84.1%) | 183 (2.5%) |
| Total | 7,137 (81.3%) | 193 (2.2%) |
Employment Occupations by Sex in Bellaire
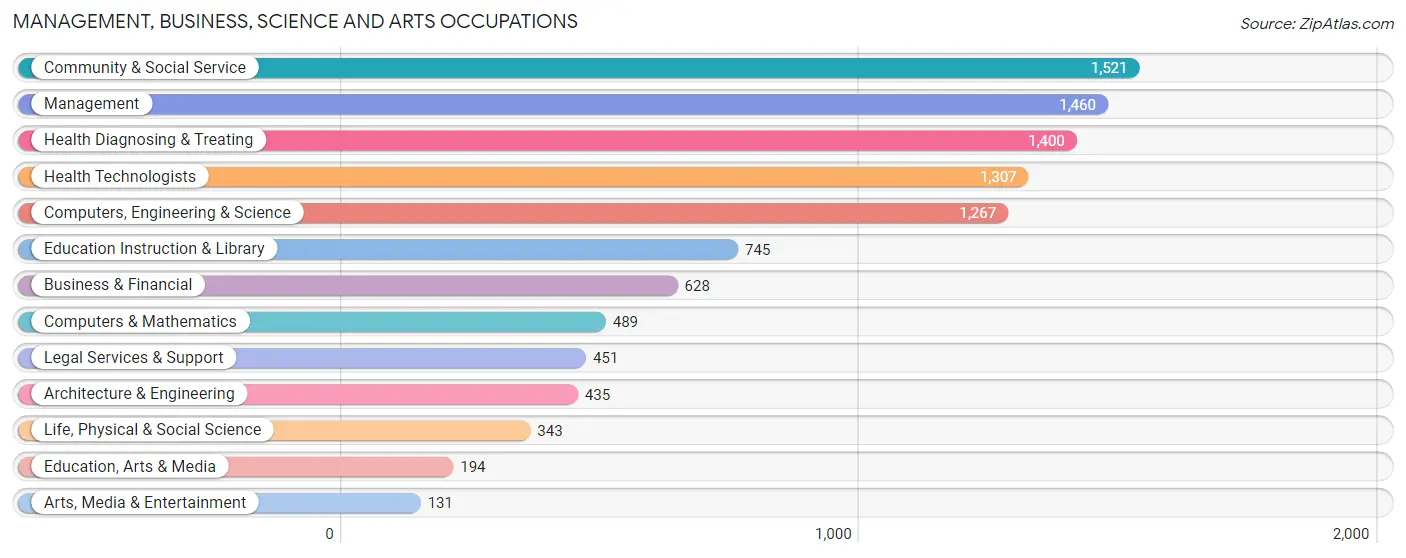
Management, Business, Science and Arts Occupations
The most common Management, Business, Science and Arts occupations in Bellaire are Community & Social Service (1,521 | 18.6%), Management (1,460 | 17.8%), Health Diagnosing & Treating (1,400 | 17.1%), Health Technologists (1,307 | 16.0%), and Computers, Engineering & Science (1,267 | 15.5%).
Management, Business, Science and Arts Occupations by Sex
Within the Management, Business, Science and Arts occupations in Bellaire, the most male-oriented occupations are Architecture & Engineering (83.9%), Legal Services & Support (76.5%), and Computers & Mathematics (72.0%), while the most female-oriented occupations are Education Instruction & Library (78.1%), Education, Arts & Media (69.1%), and Community & Social Service (57.5%).
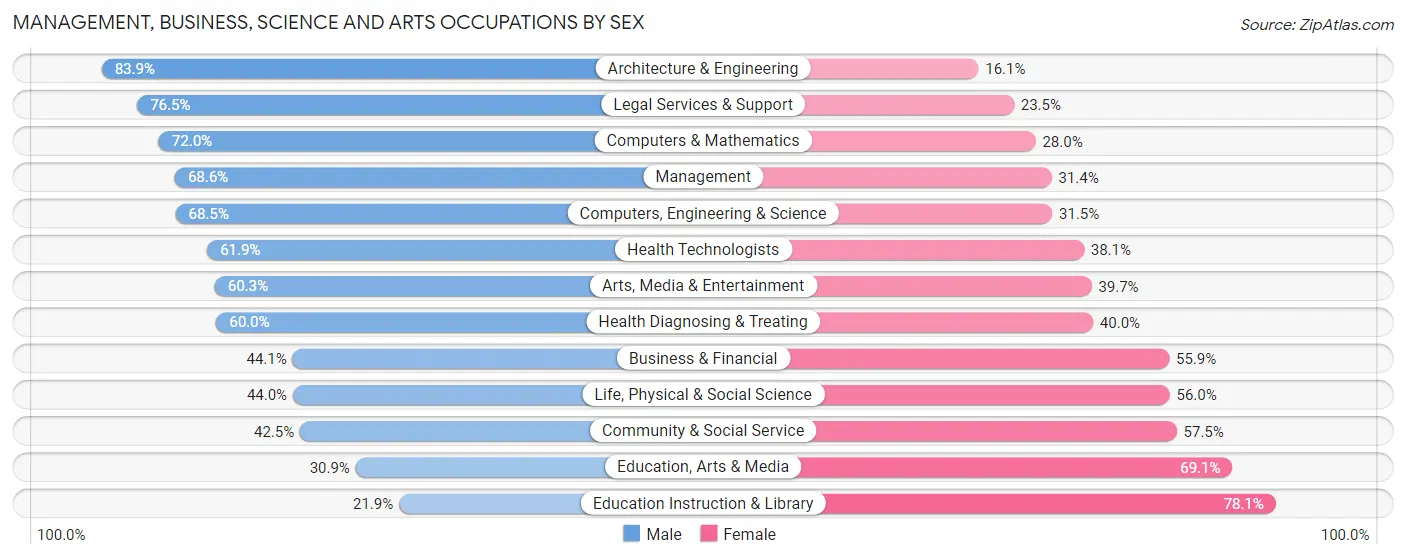
| Occupation | Male | Female |
| Management | 1,002 (68.6%) | 458 (31.4%) |
| Business & Financial | 277 (44.1%) | 351 (55.9%) |
| Computers, Engineering & Science | 868 (68.5%) | 399 (31.5%) |
| Computers & Mathematics | 352 (72.0%) | 137 (28.0%) |
| Architecture & Engineering | 365 (83.9%) | 70 (16.1%) |
| Life, Physical & Social Science | 151 (44.0%) | 192 (56.0%) |
| Community & Social Service | 647 (42.5%) | 874 (57.5%) |
| Education, Arts & Media | 60 (30.9%) | 134 (69.1%) |
| Legal Services & Support | 345 (76.5%) | 106 (23.5%) |
| Education Instruction & Library | 163 (21.9%) | 582 (78.1%) |
| Arts, Media & Entertainment | 79 (60.3%) | 52 (39.7%) |
| Health Diagnosing & Treating | 840 (60.0%) | 560 (40.0%) |
| Health Technologists | 809 (61.9%) | 498 (38.1%) |
| Total (Category) | 3,634 (57.9%) | 2,642 (42.1%) |
| Total (Overall) | 4,502 (55.0%) | 3,679 (45.0%) |
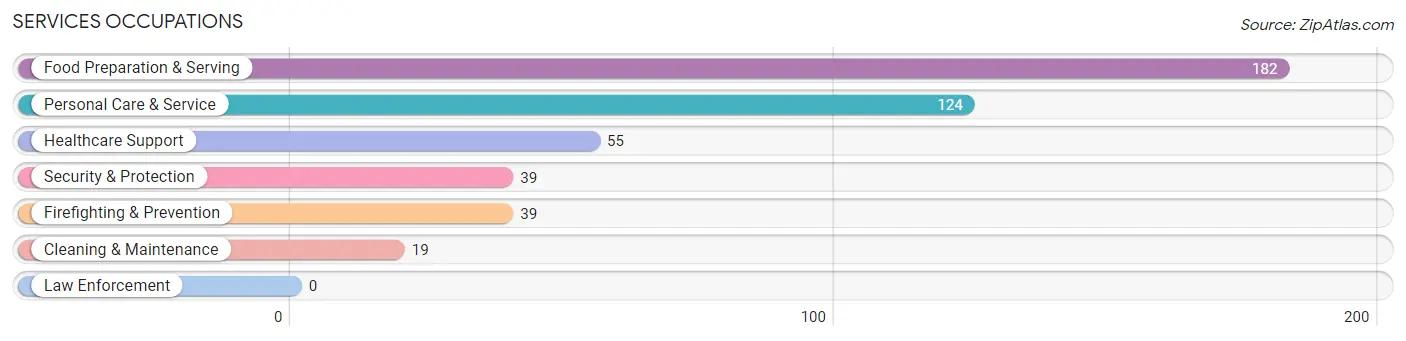
Services Occupations
The most common Services occupations in Bellaire are Food Preparation & Serving (182 | 2.2%), Personal Care & Service (124 | 1.5%), Healthcare Support (55 | 0.7%), Security & Protection (39 | 0.5%), and Firefighting & Prevention (39 | 0.5%).
Services Occupations by Sex
Within the Services occupations in Bellaire, the most male-oriented occupations are Security & Protection (100.0%), Firefighting & Prevention (100.0%), and Cleaning & Maintenance (100.0%), while the most female-oriented occupations are Personal Care & Service (90.3%), Healthcare Support (87.3%), and Food Preparation & Serving (78.6%).
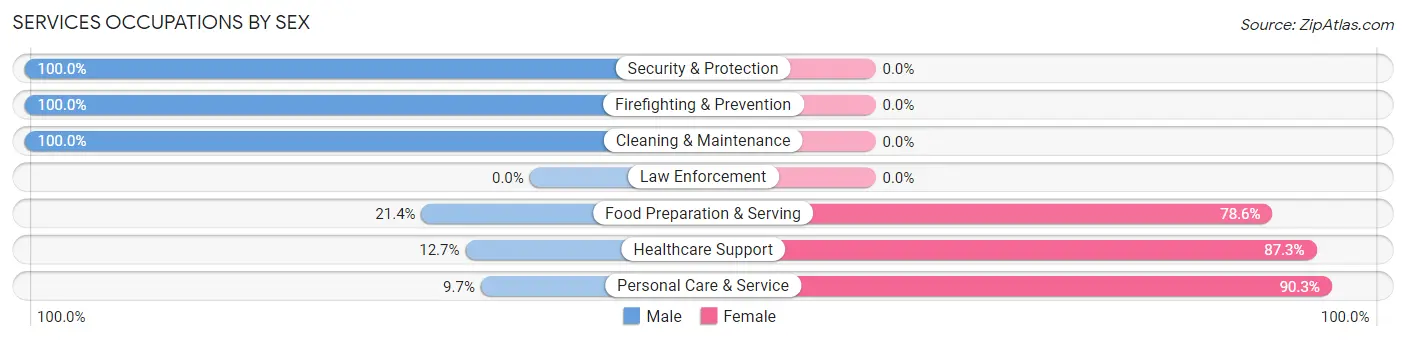
| Occupation | Male | Female |
| Healthcare Support | 7 (12.7%) | 48 (87.3%) |
| Security & Protection | 39 (100.0%) | 0 (0.0%) |
| Firefighting & Prevention | 39 (100.0%) | 0 (0.0%) |
| Law Enforcement | 0 (0.0%) | 0 (0.0%) |
| Food Preparation & Serving | 39 (21.4%) | 143 (78.6%) |
| Cleaning & Maintenance | 19 (100.0%) | 0 (0.0%) |
| Personal Care & Service | 12 (9.7%) | 112 (90.3%) |
| Total (Category) | 116 (27.7%) | 303 (72.3%) |
| Total (Overall) | 4,502 (55.0%) | 3,679 (45.0%) |
Sales and Office Occupations
The most common Sales and Office occupations in Bellaire are Sales & Related (814 | 10.0%), and Office & Administration (320 | 3.9%).

Sales and Office Occupations by Sex
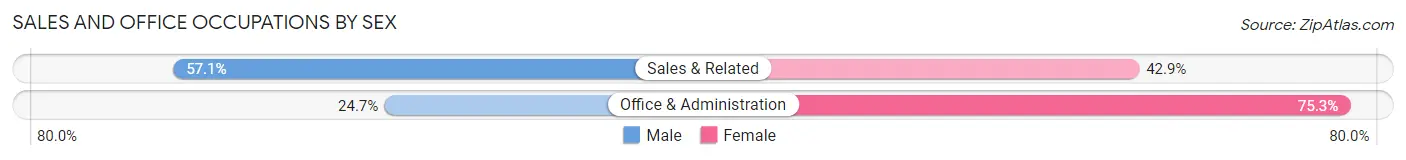
| Occupation | Male | Female |
| Sales & Related | 465 (57.1%) | 349 (42.9%) |
| Office & Administration | 79 (24.7%) | 241 (75.3%) |
| Total (Category) | 544 (48.0%) | 590 (52.0%) |
| Total (Overall) | 4,502 (55.0%) | 3,679 (45.0%) |
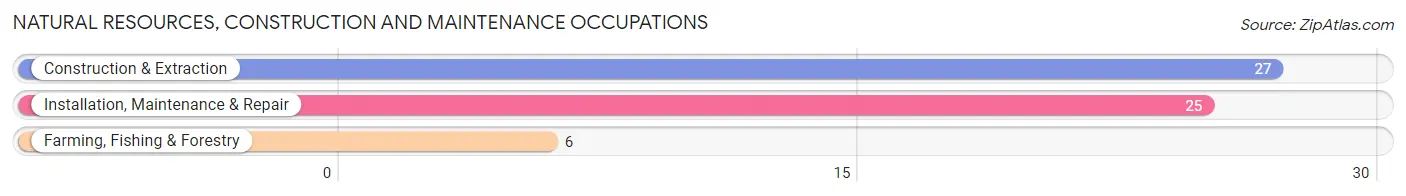
Natural Resources, Construction and Maintenance Occupations
The most common Natural Resources, Construction and Maintenance occupations in Bellaire are Construction & Extraction (27 | 0.3%), Installation, Maintenance & Repair (25 | 0.3%), and Farming, Fishing & Forestry (6 | 0.1%).
Natural Resources, Construction and Maintenance Occupations by Sex
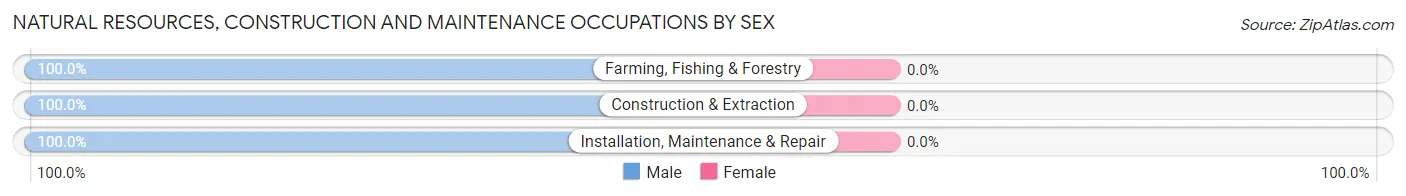
| Occupation | Male | Female |
| Farming, Fishing & Forestry | 6 (100.0%) | 0 (0.0%) |
| Construction & Extraction | 27 (100.0%) | 0 (0.0%) |
| Installation, Maintenance & Repair | 25 (100.0%) | 0 (0.0%) |
| Total (Category) | 58 (100.0%) | 0 (0.0%) |
| Total (Overall) | 4,502 (55.0%) | 3,679 (45.0%) |
Production, Transportation and Moving Occupations
The most common Production, Transportation and Moving occupations in Bellaire are Production (148 | 1.8%), Transportation (82 | 1.0%), and Material Moving (64 | 0.8%).
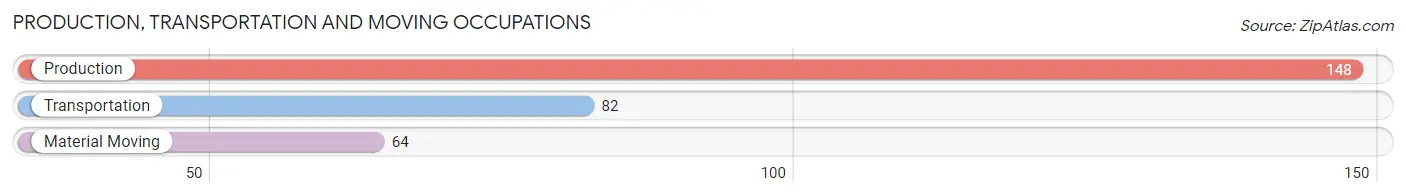
Production, Transportation and Moving Occupations by Sex
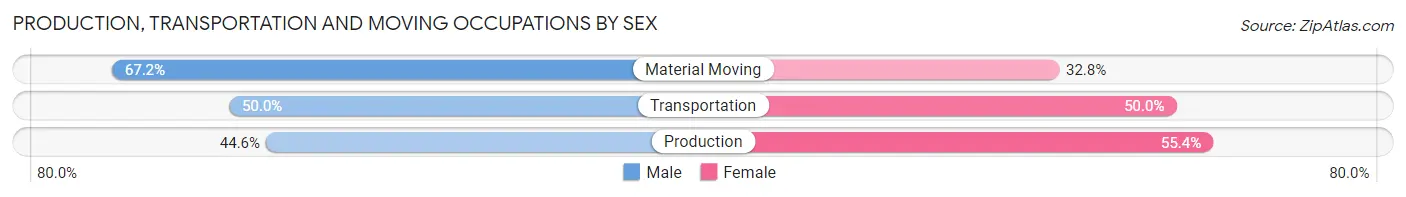
| Occupation | Male | Female |
| Production | 66 (44.6%) | 82 (55.4%) |
| Transportation | 41 (50.0%) | 41 (50.0%) |
| Material Moving | 43 (67.2%) | 21 (32.8%) |
| Total (Category) | 150 (51.0%) | 144 (49.0%) |
| Total (Overall) | 4,502 (55.0%) | 3,679 (45.0%) |
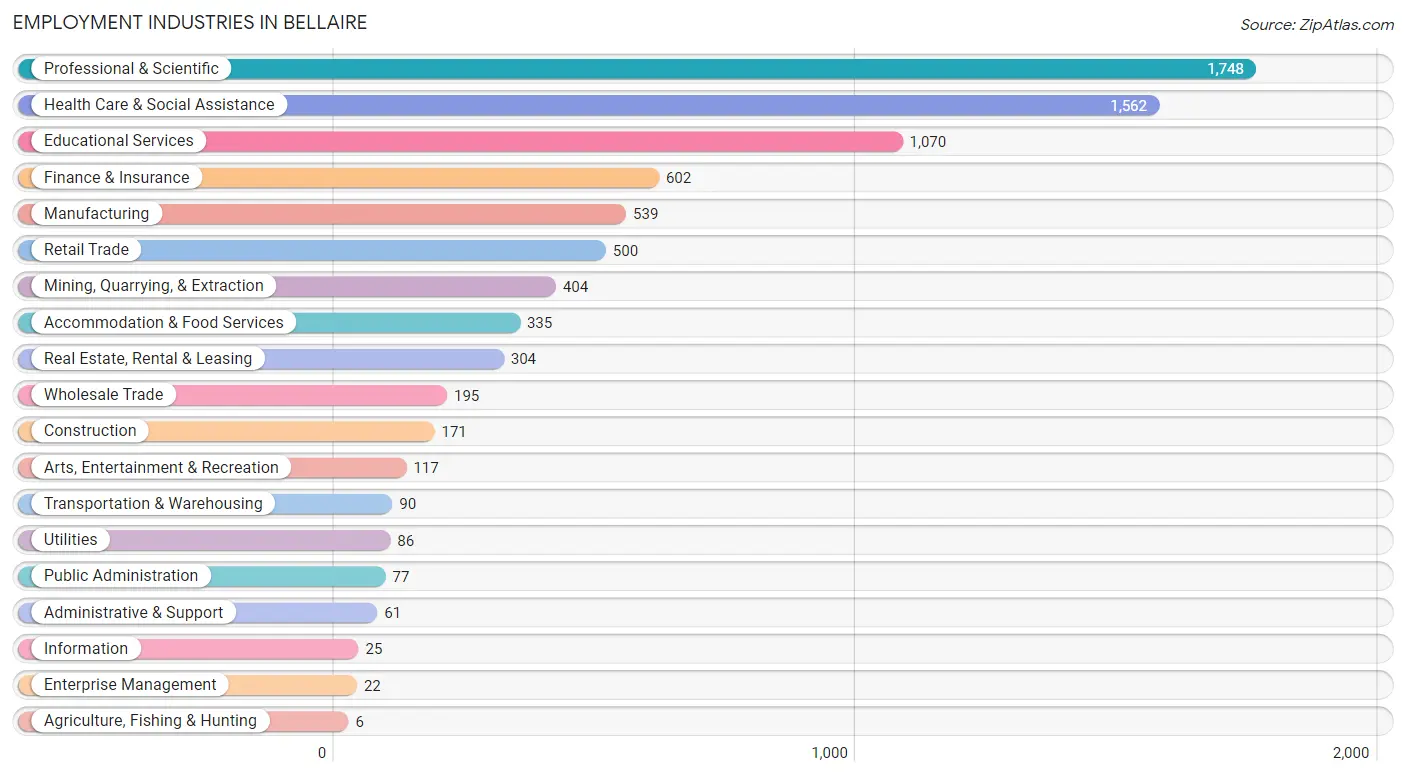
Employment Industries by Sex in Bellaire
Employment Industries in Bellaire
The major employment industries in Bellaire include Professional & Scientific (1,748 | 21.4%), Health Care & Social Assistance (1,562 | 19.1%), Educational Services (1,070 | 13.1%), Finance & Insurance (602 | 7.4%), and Manufacturing (539 | 6.6%).
Employment Industries by Sex in Bellaire
The Bellaire industries that see more men than women are Agriculture, Fishing & Hunting (100.0%), Construction (85.4%), and Utilities (82.6%), whereas the industries that tend to have a higher number of women are Educational Services (68.3%), Real Estate, Rental & Leasing (64.8%), and Health Care & Social Assistance (52.7%).
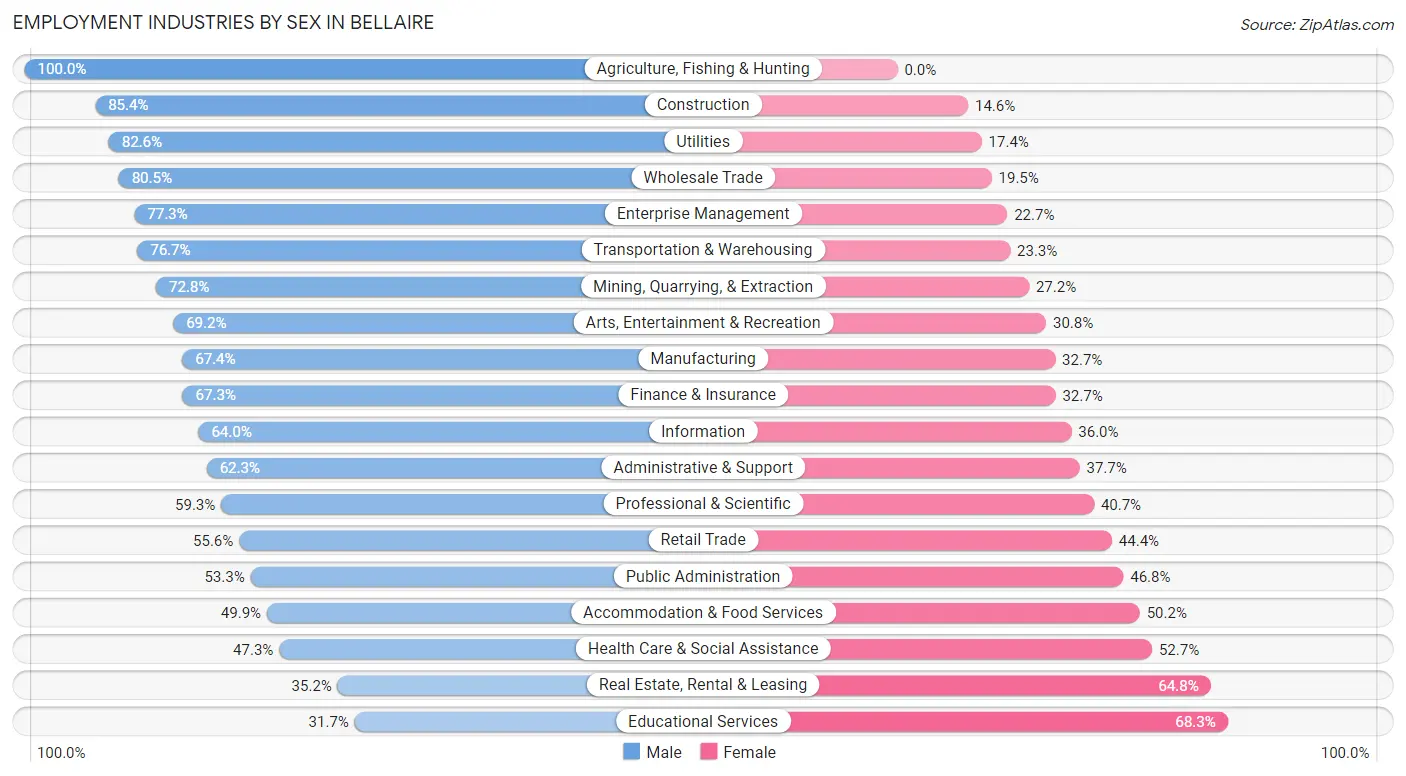
| Industry | Male | Female |
| Agriculture, Fishing & Hunting | 6 (100.0%) | 0 (0.0%) |
| Mining, Quarrying, & Extraction | 294 (72.8%) | 110 (27.2%) |
| Construction | 146 (85.4%) | 25 (14.6%) |
| Manufacturing | 363 (67.3%) | 176 (32.7%) |
| Wholesale Trade | 157 (80.5%) | 38 (19.5%) |
| Retail Trade | 278 (55.6%) | 222 (44.4%) |
| Transportation & Warehousing | 69 (76.7%) | 21 (23.3%) |
| Utilities | 71 (82.6%) | 15 (17.4%) |
| Information | 16 (64.0%) | 9 (36.0%) |
| Finance & Insurance | 405 (67.3%) | 197 (32.7%) |
| Real Estate, Rental & Leasing | 107 (35.2%) | 197 (64.8%) |
| Professional & Scientific | 1,037 (59.3%) | 711 (40.7%) |
| Enterprise Management | 17 (77.3%) | 5 (22.7%) |
| Administrative & Support | 38 (62.3%) | 23 (37.7%) |
| Educational Services | 339 (31.7%) | 731 (68.3%) |
| Health Care & Social Assistance | 739 (47.3%) | 823 (52.7%) |
| Arts, Entertainment & Recreation | 81 (69.2%) | 36 (30.8%) |
| Accommodation & Food Services | 167 (49.8%) | 168 (50.1%) |
| Public Administration | 41 (53.2%) | 36 (46.8%) |
| Total | 4,502 (55.0%) | 3,679 (45.0%) |
Education in Bellaire
School Enrollment in Bellaire
The most common levels of schooling among the 4,812 students in Bellaire are high school (1,288 | 26.8%), elementary school (1,095 | 22.8%), and middle school (1,021 | 21.2%).
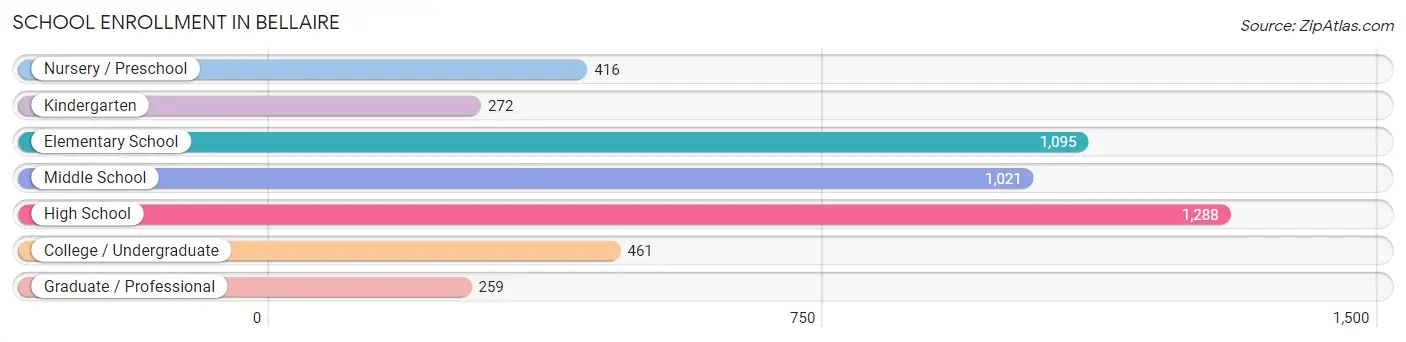
| School Level | # Students | % Students |
| Nursery / Preschool | 416 | 8.6% |
| Kindergarten | 272 | 5.7% |
| Elementary School | 1,095 | 22.8% |
| Middle School | 1,021 | 21.2% |
| High School | 1,288 | 26.8% |
| College / Undergraduate | 461 | 9.6% |
| Graduate / Professional | 259 | 5.4% |
| Total | 4,812 | 100.0% |
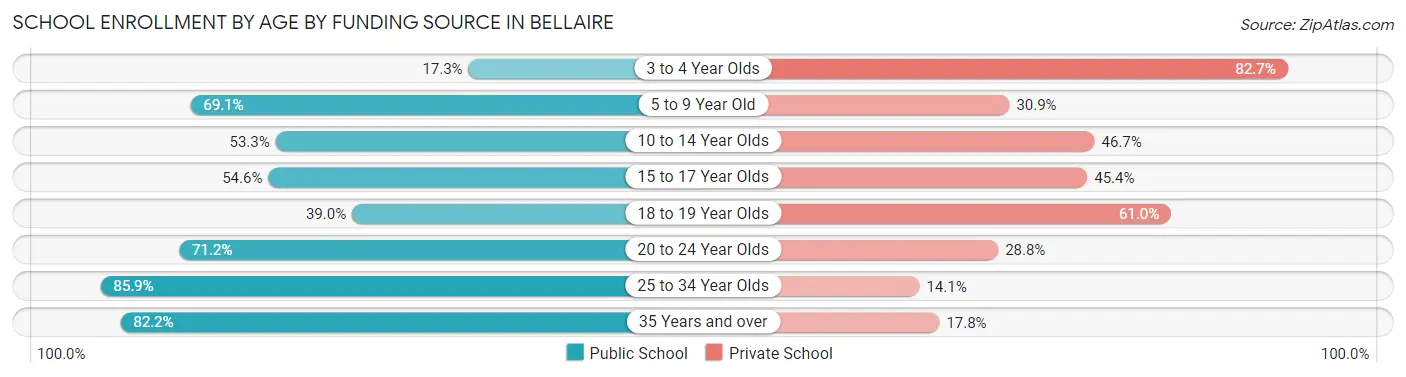
School Enrollment by Age by Funding Source in Bellaire
Out of a total of 4,812 students who are enrolled in schools in Bellaire, 2,007 (41.7%) attend a private institution, while the remaining 2,805 (58.3%) are enrolled in public schools. The age group of 3 to 4 year olds has the highest likelihood of being enrolled in private schools, with 248 (82.7% in the age bracket) enrolled. Conversely, the age group of 25 to 34 year olds has the lowest likelihood of being enrolled in a private school, with 73 (85.9% in the age bracket) attending a public institution.
| Age Bracket | Public School | Private School |
| 3 to 4 Year Olds | 52 (17.3%) | 248 (82.7%) |
| 5 to 9 Year Old | 940 (69.1%) | 420 (30.9%) |
| 10 to 14 Year Olds | 719 (53.3%) | 631 (46.7%) |
| 15 to 17 Year Olds | 437 (54.6%) | 363 (45.4%) |
| 18 to 19 Year Olds | 112 (39.0%) | 175 (61.0%) |
| 20 to 24 Year Olds | 297 (71.2%) | 120 (28.8%) |
| 25 to 34 Year Olds | 73 (85.9%) | 12 (14.1%) |
| 35 Years and over | 175 (82.2%) | 38 (17.8%) |
| Total | 2,805 (58.3%) | 2,007 (41.7%) |
Educational Attainment by Field of Study in Bellaire
Business (1,762 | 17.1%), engineering (1,452 | 14.1%), bio, nature & agricultural (1,320 | 12.8%), social sciences (911 | 8.8%), and science & technology (727 | 7.0%) are the most common fields of study among 10,307 individuals in Bellaire who have obtained a bachelor's degree or higher.
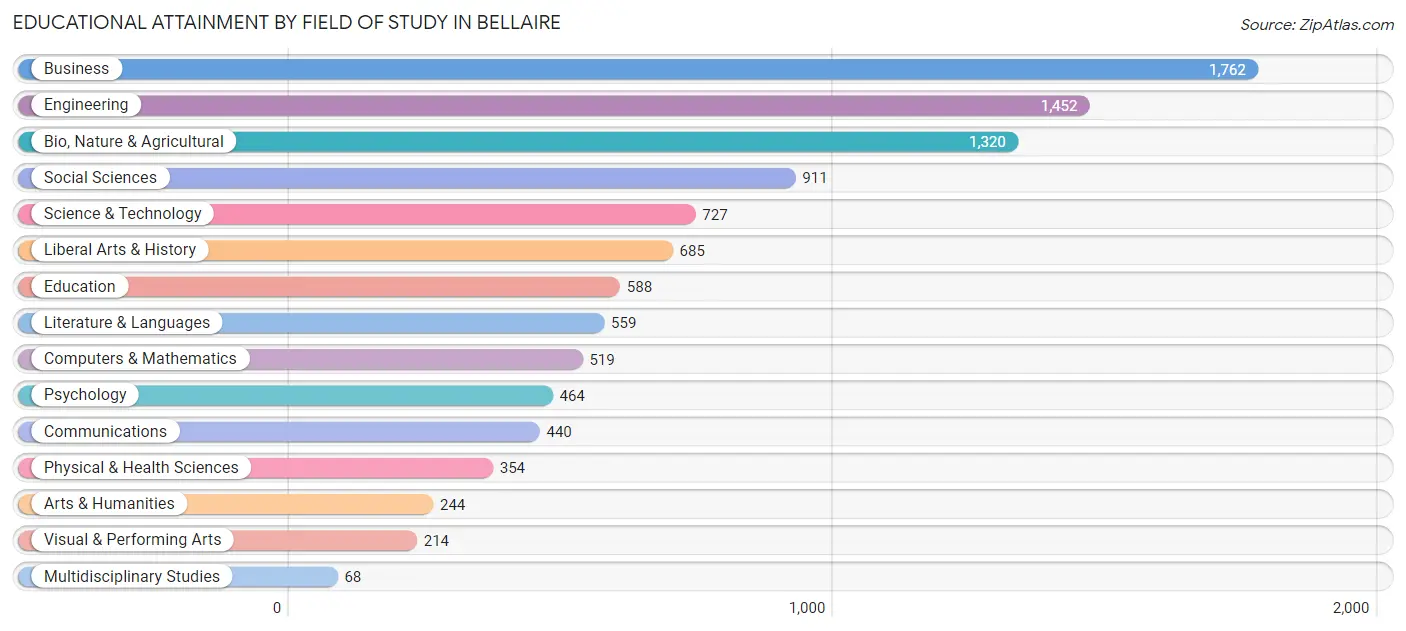
| Field of Study | # Graduates | % Graduates |
| Computers & Mathematics | 519 | 5.0% |
| Bio, Nature & Agricultural | 1,320 | 12.8% |
| Physical & Health Sciences | 354 | 3.4% |
| Psychology | 464 | 4.5% |
| Social Sciences | 911 | 8.8% |
| Engineering | 1,452 | 14.1% |
| Multidisciplinary Studies | 68 | 0.7% |
| Science & Technology | 727 | 7.0% |
| Business | 1,762 | 17.1% |
| Education | 588 | 5.7% |
| Literature & Languages | 559 | 5.4% |
| Liberal Arts & History | 685 | 6.7% |
| Visual & Performing Arts | 214 | 2.1% |
| Communications | 440 | 4.3% |
| Arts & Humanities | 244 | 2.4% |
| Total | 10,307 | 100.0% |
Transportation & Commute in Bellaire
Vehicle Availability by Sex in Bellaire
The most prevalent vehicle ownership categories in Bellaire are males with 2 vehicles (2,563, accounting for 57.4%) and females with 2 vehicles (1,955, making up 69.7%).
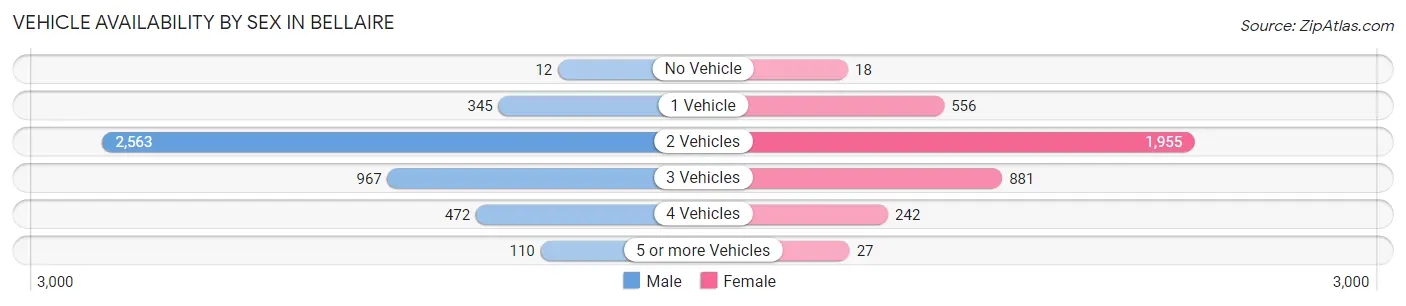
| Vehicles Available | Male | Female |
| No Vehicle | 12 (0.3%) | 18 (0.5%) |
| 1 Vehicle | 345 (7.7%) | 556 (15.1%) |
| 2 Vehicles | 2,563 (57.4%) | 1,955 (53.1%) |
| 3 Vehicles | 967 (21.6%) | 881 (23.9%) |
| 4 Vehicles | 472 (10.6%) | 242 (6.6%) |
| 5 or more Vehicles | 110 (2.5%) | 27 (0.7%) |
| Total | 4,469 (100.0%) | 3,679 (100.0%) |
Commute Time in Bellaire
The most frequently occuring commute durations in Bellaire are 15 to 19 minutes (1,446 commuters, 21.7%), 20 to 24 minutes (1,386 commuters, 20.8%), and 30 to 34 minutes (1,211 commuters, 18.2%).
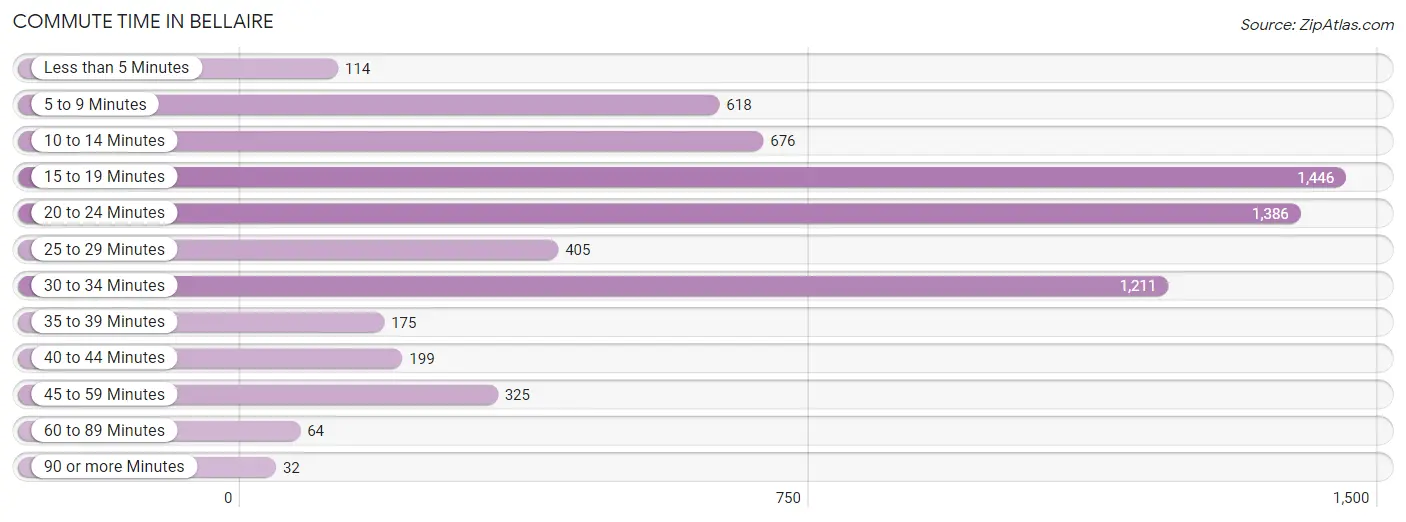
| Commute Time | # Commuters | % Commuters |
| Less than 5 Minutes | 114 | 1.7% |
| 5 to 9 Minutes | 618 | 9.3% |
| 10 to 14 Minutes | 676 | 10.2% |
| 15 to 19 Minutes | 1,446 | 21.7% |
| 20 to 24 Minutes | 1,386 | 20.8% |
| 25 to 29 Minutes | 405 | 6.1% |
| 30 to 34 Minutes | 1,211 | 18.2% |
| 35 to 39 Minutes | 175 | 2.6% |
| 40 to 44 Minutes | 199 | 3.0% |
| 45 to 59 Minutes | 325 | 4.9% |
| 60 to 89 Minutes | 64 | 1.0% |
| 90 or more Minutes | 32 | 0.5% |
Commute Time by Sex in Bellaire
The most common commute times in Bellaire are 15 to 19 minutes (1,000 commuters, 27.2%) for males and 20 to 24 minutes (865 commuters, 29.1%) for females.
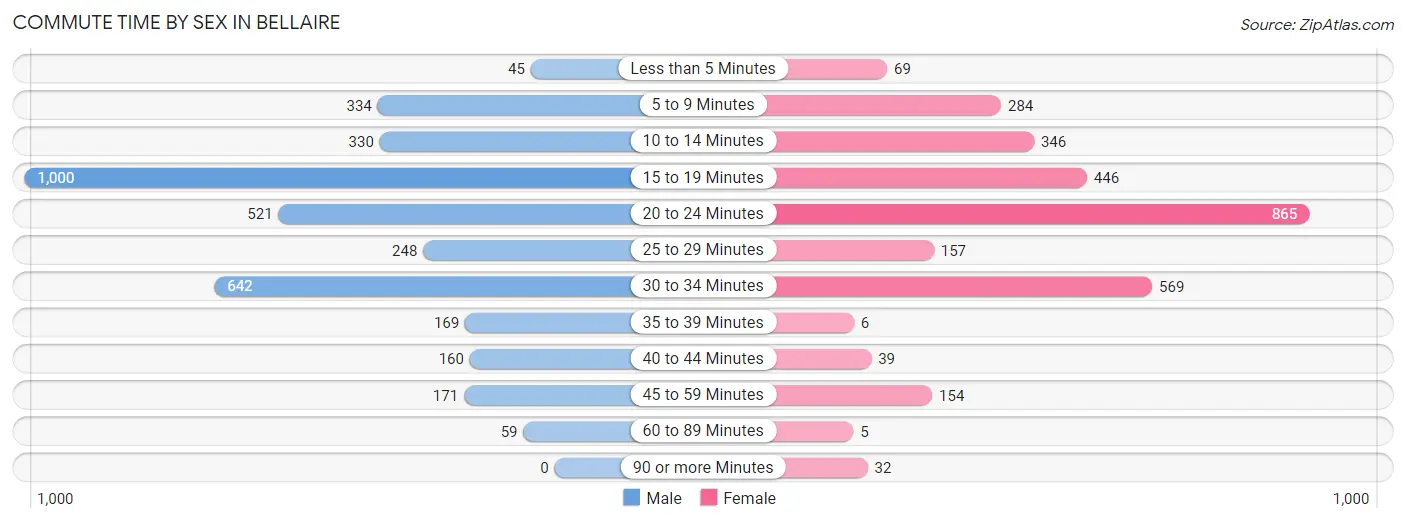
| Commute Time | Male | Female |
| Less than 5 Minutes | 45 (1.2%) | 69 (2.3%) |
| 5 to 9 Minutes | 334 (9.1%) | 284 (9.6%) |
| 10 to 14 Minutes | 330 (9.0%) | 346 (11.6%) |
| 15 to 19 Minutes | 1,000 (27.2%) | 446 (15.0%) |
| 20 to 24 Minutes | 521 (14.2%) | 865 (29.1%) |
| 25 to 29 Minutes | 248 (6.7%) | 157 (5.3%) |
| 30 to 34 Minutes | 642 (17.4%) | 569 (19.2%) |
| 35 to 39 Minutes | 169 (4.6%) | 6 (0.2%) |
| 40 to 44 Minutes | 160 (4.3%) | 39 (1.3%) |
| 45 to 59 Minutes | 171 (4.6%) | 154 (5.2%) |
| 60 to 89 Minutes | 59 (1.6%) | 5 (0.2%) |
| 90 or more Minutes | 0 (0.0%) | 32 (1.1%) |
Time of Departure to Work by Sex in Bellaire
The most frequent times of departure to work in Bellaire are 8:00 AM to 8:29 AM (752, 20.4%) for males and 7:00 AM to 7:29 AM (521, 17.5%) for females.
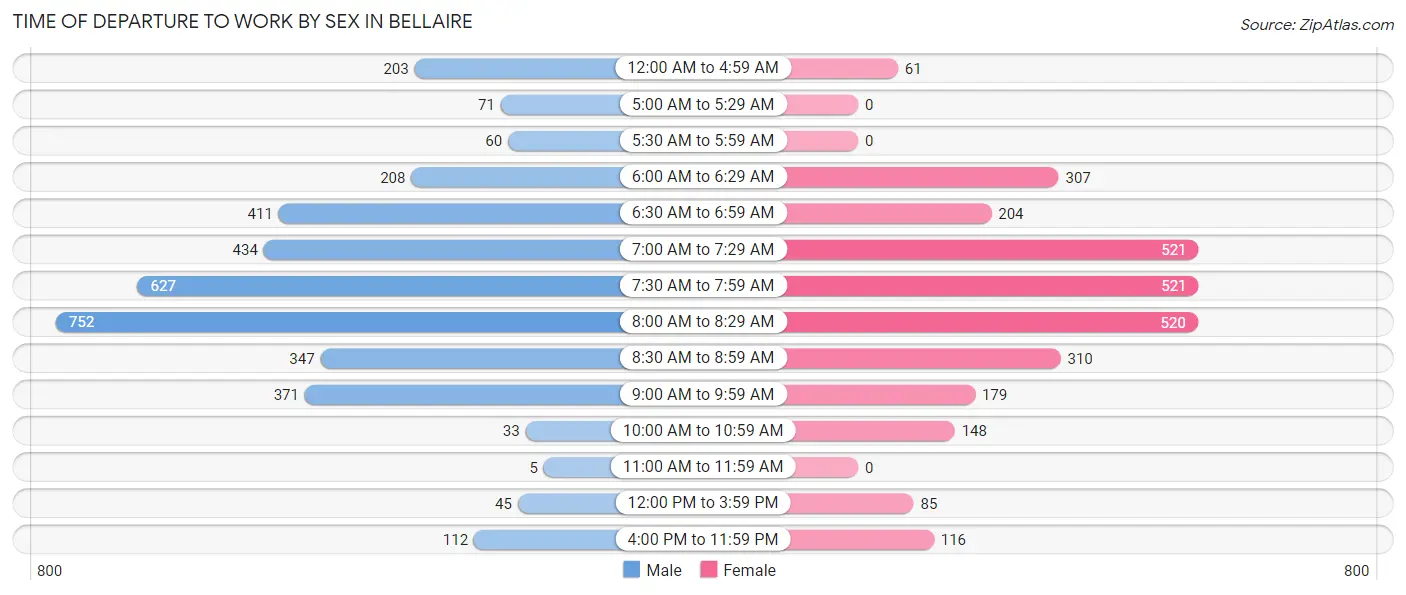
| Time of Departure | Male | Female |
| 12:00 AM to 4:59 AM | 203 (5.5%) | 61 (2.1%) |
| 5:00 AM to 5:29 AM | 71 (1.9%) | 0 (0.0%) |
| 5:30 AM to 5:59 AM | 60 (1.6%) | 0 (0.0%) |
| 6:00 AM to 6:29 AM | 208 (5.7%) | 307 (10.3%) |
| 6:30 AM to 6:59 AM | 411 (11.2%) | 204 (6.9%) |
| 7:00 AM to 7:29 AM | 434 (11.8%) | 521 (17.5%) |
| 7:30 AM to 7:59 AM | 627 (17.0%) | 521 (17.5%) |
| 8:00 AM to 8:29 AM | 752 (20.4%) | 520 (17.5%) |
| 8:30 AM to 8:59 AM | 347 (9.4%) | 310 (10.4%) |
| 9:00 AM to 9:59 AM | 371 (10.1%) | 179 (6.0%) |
| 10:00 AM to 10:59 AM | 33 (0.9%) | 148 (5.0%) |
| 11:00 AM to 11:59 AM | 5 (0.1%) | 0 (0.0%) |
| 12:00 PM to 3:59 PM | 45 (1.2%) | 85 (2.9%) |
| 4:00 PM to 11:59 PM | 112 (3.0%) | 116 (3.9%) |
| Total | 3,679 (100.0%) | 2,972 (100.0%) |
Housing Occupancy in Bellaire
Occupancy by Ownership in Bellaire
Of the total 6,087 dwellings in Bellaire, owner-occupied units account for 5,322 (87.4%), while renter-occupied units make up 765 (12.6%).
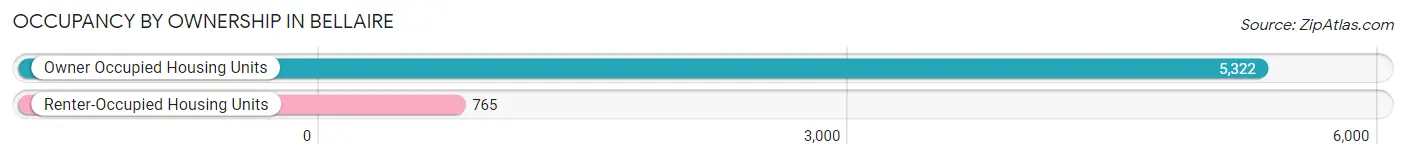
| Occupancy | # Housing Units | % Housing Units |
| Owner Occupied Housing Units | 5,322 | 87.4% |
| Renter-Occupied Housing Units | 765 | 12.6% |
| Total Occupied Housing Units | 6,087 | 100.0% |
Occupancy by Household Size in Bellaire
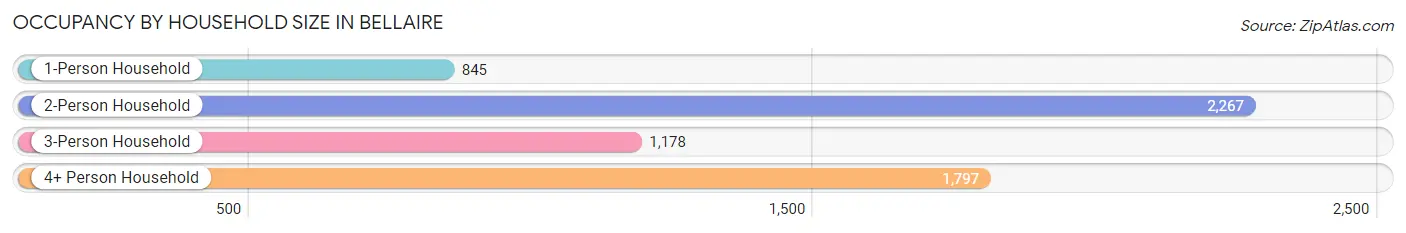
| Household Size | # Housing Units | % Housing Units |
| 1-Person Household | 845 | 13.9% |
| 2-Person Household | 2,267 | 37.2% |
| 3-Person Household | 1,178 | 19.4% |
| 4+ Person Household | 1,797 | 29.5% |
| Total Housing Units | 6,087 | 100.0% |
Occupancy by Ownership by Household Size in Bellaire
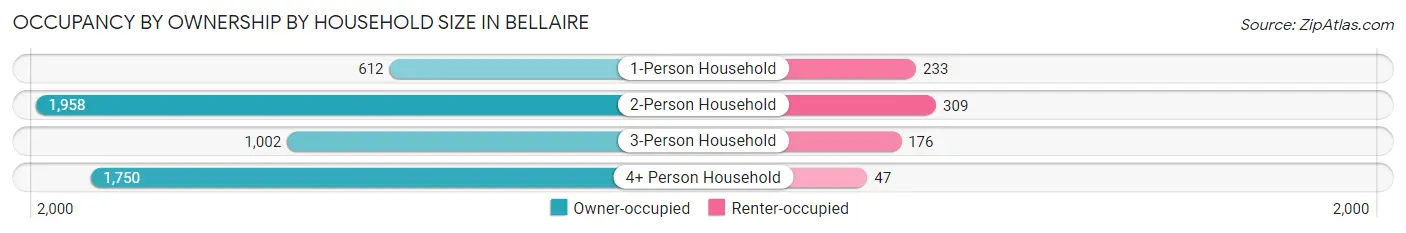
| Household Size | Owner-occupied | Renter-occupied |
| 1-Person Household | 612 (72.4%) | 233 (27.6%) |
| 2-Person Household | 1,958 (86.4%) | 309 (13.6%) |
| 3-Person Household | 1,002 (85.1%) | 176 (14.9%) |
| 4+ Person Household | 1,750 (97.4%) | 47 (2.6%) |
| Total Housing Units | 5,322 (87.4%) | 765 (12.6%) |
Occupancy by Educational Attainment in Bellaire
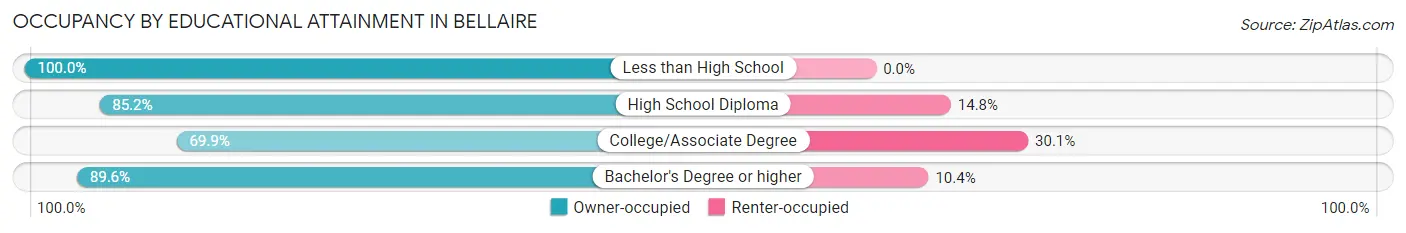
| Household Size | Owner-occupied | Renter-occupied |
| Less than High School | 42 (100.0%) | 0 (0.0%) |
| High School Diploma | 138 (85.2%) | 24 (14.8%) |
| College/Associate Degree | 464 (69.9%) | 200 (30.1%) |
| Bachelor's Degree or higher | 4,678 (89.6%) | 541 (10.4%) |
Occupancy by Age of Householder in Bellaire
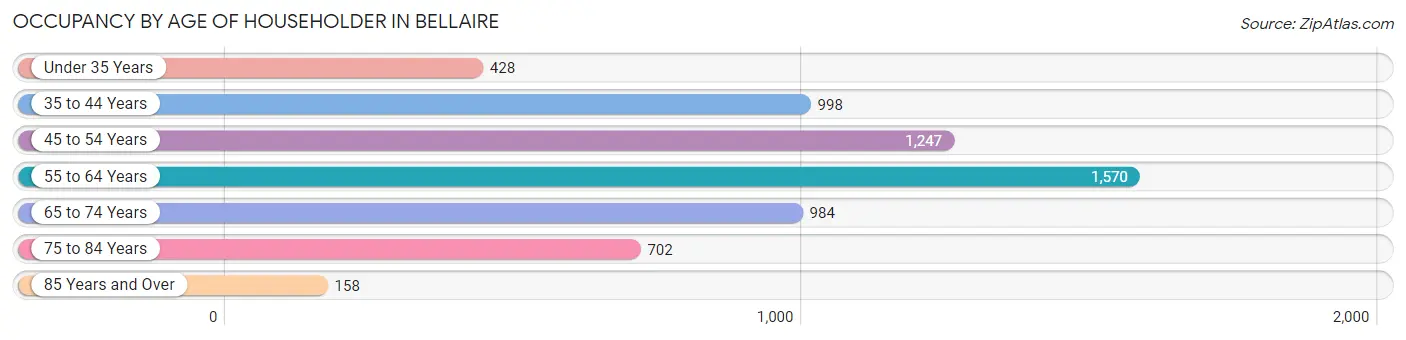
| Age Bracket | # Households | % Households |
| Under 35 Years | 428 | 7.0% |
| 35 to 44 Years | 998 | 16.4% |
| 45 to 54 Years | 1,247 | 20.5% |
| 55 to 64 Years | 1,570 | 25.8% |
| 65 to 74 Years | 984 | 16.2% |
| 75 to 84 Years | 702 | 11.5% |
| 85 Years and Over | 158 | 2.6% |
| Total | 6,087 | 100.0% |
Housing Finances in Bellaire
Median Income by Occupancy in Bellaire
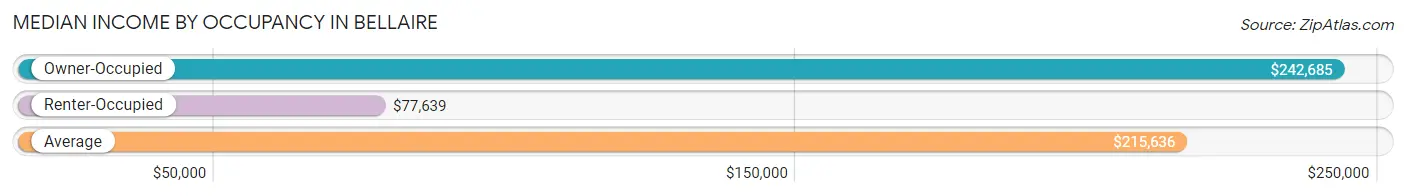
| Occupancy Type | # Households | Median Income |
| Owner-Occupied | 5,322 (87.4%) | $242,685 |
| Renter-Occupied | 765 (12.6%) | $77,639 |
| Average | 6,087 (100.0%) | $215,636 |
Occupancy by Householder Income Bracket in Bellaire
| Income Bracket | Owner-occupied | Renter-occupied |
| Less than $5,000 | 48 (0.9%) | 42 (5.5%) |
| $5,000 to $9,999 | 41 (0.8%) | 0 (0.0%) |
| $10,000 to $14,999 | 14 (0.3%) | 9 (1.2%) |
| $15,000 to $19,999 | 17 (0.3%) | 6 (0.8%) |
| $20,000 to $24,999 | 37 (0.7%) | 30 (3.9%) |
| $25,000 to $34,999 | 204 (3.8%) | 53 (6.9%) |
| $35,000 to $49,999 | 188 (3.5%) | 123 (16.1%) |
| $50,000 to $74,999 | 159 (3.0%) | 48 (6.3%) |
| $75,000 to $99,999 | 187 (3.5%) | 87 (11.4%) |
| $100,000 to $149,999 | 761 (14.3%) | 231 (30.2%) |
| $150,000 or more | 3,666 (68.9%) | 136 (17.8%) |
| Total | 5,322 (100.0%) | 765 (100.0%) |
Monthly Housing Cost Tiers in Bellaire
| Monthly Cost | Owner-occupied | Renter-occupied |
| Less than $300 | 16 (0.3%) | 0 (0.0%) |
| $300 to $499 | 64 (1.2%) | 0 (0.0%) |
| $500 to $799 | 242 (4.5%) | 9 (1.2%) |
| $800 to $999 | 145 (2.7%) | 14 (1.8%) |
| $1,000 to $1,499 | 358 (6.7%) | 95 (12.4%) |
| $1,500 to $1,999 | 694 (13.0%) | 111 (14.5%) |
| $2,000 to $2,499 | 851 (16.0%) | 168 (22.0%) |
| $2,500 to $2,999 | 287 (5.4%) | 46 (6.0%) |
| $3,000 or more | 2,665 (50.1%) | 299 (39.1%) |
| Total | 5,322 (100.0%) | 765 (100.0%) |
Physical Housing Characteristics in Bellaire
Housing Structures in Bellaire
| Structure Type | # Housing Units | % Housing Units |
| Single Unit, Detached | 5,549 | 91.2% |
| Single Unit, Attached | 385 | 6.3% |
| 2 Unit Apartments | 0 | 0.0% |
| 3 or 4 Unit Apartments | 15 | 0.3% |
| 5 to 9 Unit Apartments | 72 | 1.2% |
| 10 or more Apartments | 66 | 1.1% |
| Mobile Home / Other | 0 | 0.0% |
| Total | 6,087 | 100.0% |
Housing Structures by Occupancy in Bellaire
| Structure Type | Owner-occupied | Renter-occupied |
| Single Unit, Detached | 4,999 (90.1%) | 550 (9.9%) |
| Single Unit, Attached | 310 (80.5%) | 75 (19.5%) |
| 2 Unit Apartments | 0 (0.0%) | 0 (0.0%) |
| 3 or 4 Unit Apartments | 0 (0.0%) | 15 (100.0%) |
| 5 to 9 Unit Apartments | 6 (8.3%) | 66 (91.7%) |
| 10 or more Apartments | 7 (10.6%) | 59 (89.4%) |
| Mobile Home / Other | 0 (0.0%) | 0 (0.0%) |
| Total | 5,322 (87.4%) | 765 (12.6%) |
Housing Structures by Number of Rooms in Bellaire
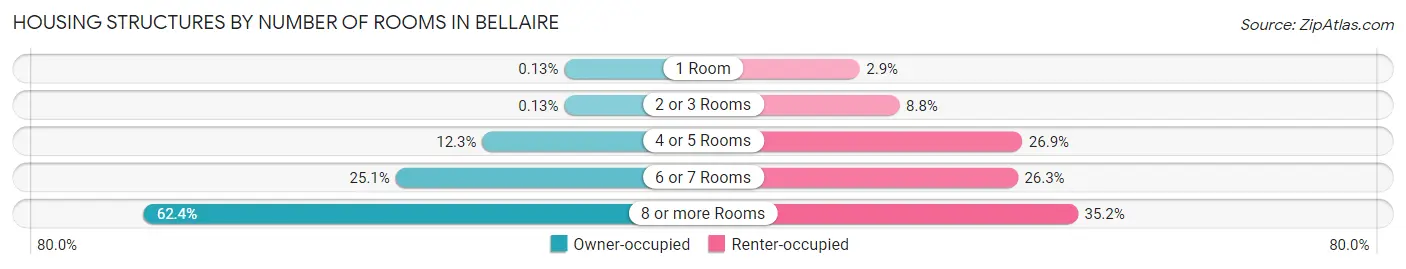
| Number of Rooms | Owner-occupied | Renter-occupied |
| 1 Room | 7 (0.1%) | 22 (2.9%) |
| 2 or 3 Rooms | 7 (0.1%) | 67 (8.8%) |
| 4 or 5 Rooms | 653 (12.3%) | 206 (26.9%) |
| 6 or 7 Rooms | 1,336 (25.1%) | 201 (26.3%) |
| 8 or more Rooms | 3,319 (62.4%) | 269 (35.2%) |
| Total | 5,322 (100.0%) | 765 (100.0%) |
Housing Structure by Heating Type in Bellaire
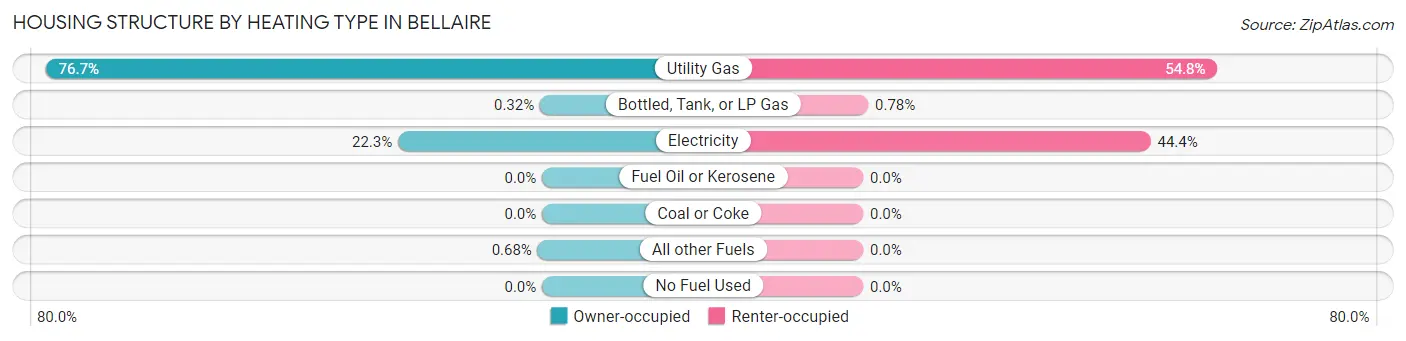
| Heating Type | Owner-occupied | Renter-occupied |
| Utility Gas | 4,084 (76.7%) | 419 (54.8%) |
| Bottled, Tank, or LP Gas | 17 (0.3%) | 6 (0.8%) |
| Electricity | 1,185 (22.3%) | 340 (44.4%) |
| Fuel Oil or Kerosene | 0 (0.0%) | 0 (0.0%) |
| Coal or Coke | 0 (0.0%) | 0 (0.0%) |
| All other Fuels | 36 (0.7%) | 0 (0.0%) |
| No Fuel Used | 0 (0.0%) | 0 (0.0%) |
| Total | 5,322 (100.0%) | 765 (100.0%) |
Household Vehicle Usage in Bellaire
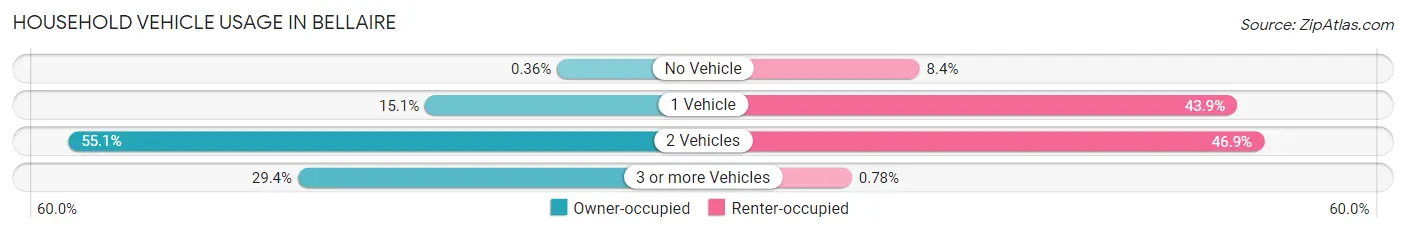
| Vehicles per Household | Owner-occupied | Renter-occupied |
| No Vehicle | 19 (0.4%) | 64 (8.4%) |
| 1 Vehicle | 806 (15.1%) | 336 (43.9%) |
| 2 Vehicles | 2,933 (55.1%) | 359 (46.9%) |
| 3 or more Vehicles | 1,564 (29.4%) | 6 (0.8%) |
| Total | 5,322 (100.0%) | 765 (100.0%) |
Real Estate & Mortgages in Bellaire
Real Estate and Mortgage Overview in Bellaire
| Characteristic | Without Mortgage | With Mortgage |
| Housing Units | 2,479 | 2,843 |
| Median Property Value | $913,000 | $994,700 |
| Median Household Income | $217,470 | $2,117 |
| Monthly Housing Costs | $1,501 | $2,303 |
| Real Estate Taxes | $10,001 | $4 |
Property Value by Mortgage Status in Bellaire
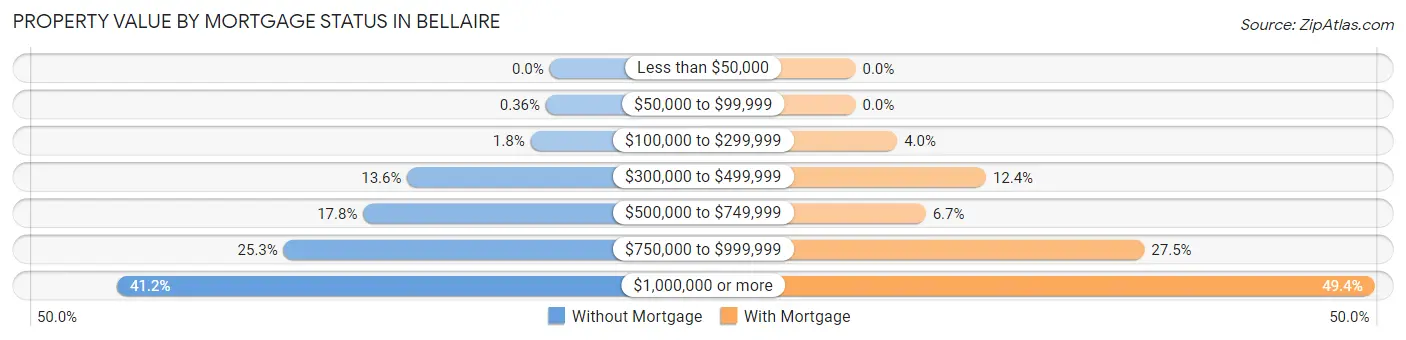
| Property Value | Without Mortgage | With Mortgage |
| Less than $50,000 | 0 (0.0%) | 0 (0.0%) |
| $50,000 to $99,999 | 9 (0.4%) | 0 (0.0%) |
| $100,000 to $299,999 | 45 (1.8%) | 113 (4.0%) |
| $300,000 to $499,999 | 336 (13.6%) | 353 (12.4%) |
| $500,000 to $749,999 | 440 (17.7%) | 190 (6.7%) |
| $750,000 to $999,999 | 628 (25.3%) | 782 (27.5%) |
| $1,000,000 or more | 1,021 (41.2%) | 1,405 (49.4%) |
| Total | 2,479 (100.0%) | 2,843 (100.0%) |
Household Income by Mortgage Status in Bellaire
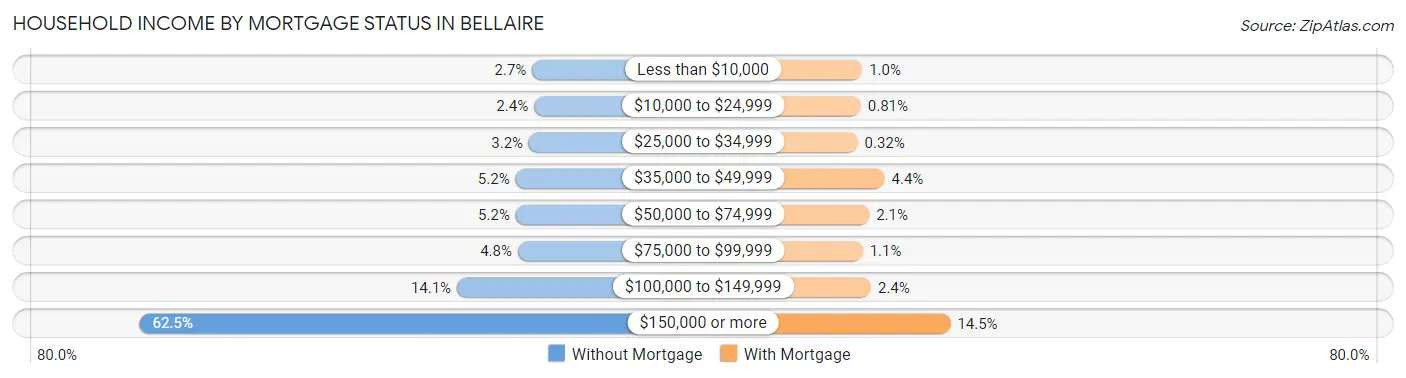
| Household Income | Without Mortgage | With Mortgage |
| Less than $10,000 | 66 (2.7%) | 29 (1.0%) |
| $10,000 to $24,999 | 59 (2.4%) | 23 (0.8%) |
| $25,000 to $34,999 | 78 (3.2%) | 9 (0.3%) |
| $35,000 to $49,999 | 129 (5.2%) | 126 (4.4%) |
| $50,000 to $74,999 | 128 (5.2%) | 59 (2.1%) |
| $75,000 to $99,999 | 120 (4.8%) | 31 (1.1%) |
| $100,000 to $149,999 | 350 (14.1%) | 67 (2.4%) |
| $150,000 or more | 1,549 (62.5%) | 411 (14.5%) |
| Total | 2,479 (100.0%) | 2,843 (100.0%) |
Property Value to Household Income Ratio in Bellaire
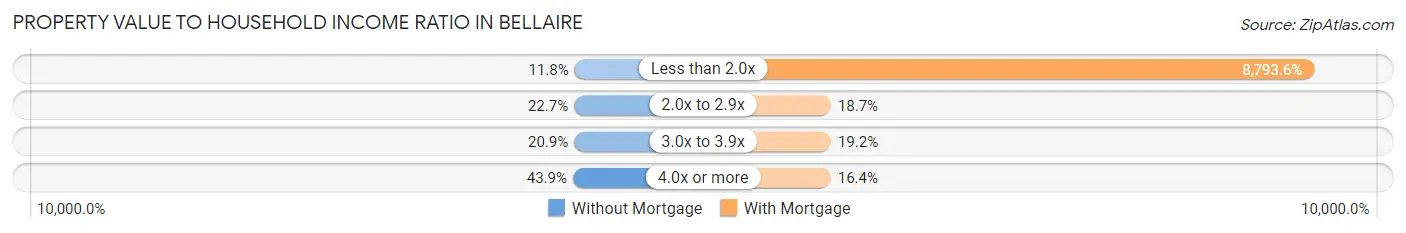
| Value-to-Income Ratio | Without Mortgage | With Mortgage |
| Less than 2.0x | 292 (11.8%) | 250,001 (8,793.6%) |
| 2.0x to 2.9x | 562 (22.7%) | 531 (18.7%) |
| 3.0x to 3.9x | 517 (20.9%) | 546 (19.2%) |
| 4.0x or more | 1,088 (43.9%) | 467 (16.4%) |
| Total | 2,479 (100.0%) | 2,843 (100.0%) |
Real Estate Taxes by Mortgage Status in Bellaire
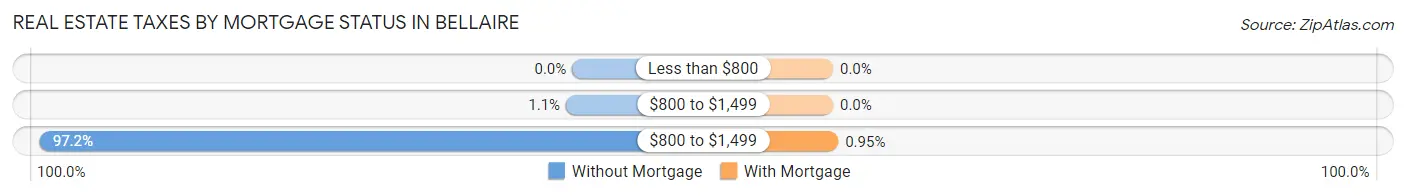
| Property Taxes | Without Mortgage | With Mortgage |
| Less than $800 | 0 (0.0%) | 0 (0.0%) |
| $800 to $1,499 | 28 (1.1%) | 0 (0.0%) |
| $800 to $1,499 | 2,410 (97.2%) | 27 (0.9%) |
| Total | 2,479 (100.0%) | 2,843 (100.0%) |
Health & Disability in Bellaire
Health Insurance Coverage by Age in Bellaire
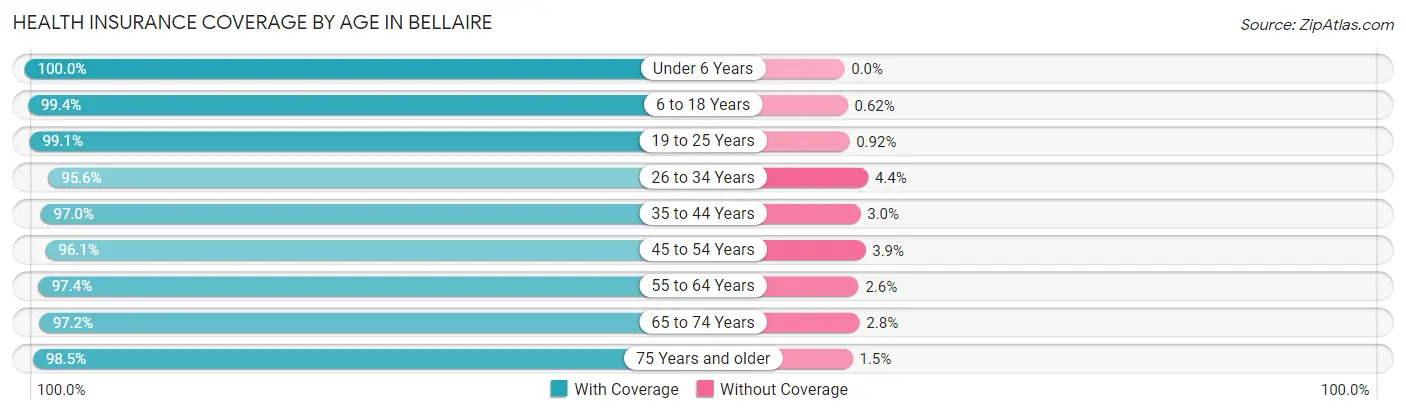
| Age Bracket | With Coverage | Without Coverage |
| Under 6 Years | 999 (100.0%) | 0 (0.0%) |
| 6 to 18 Years | 3,709 (99.4%) | 23 (0.6%) |
| 19 to 25 Years | 754 (99.1%) | 7 (0.9%) |
| 26 to 34 Years | 909 (95.6%) | 42 (4.4%) |
| 35 to 44 Years | 2,183 (97.0%) | 67 (3.0%) |
| 45 to 54 Years | 2,357 (96.1%) | 96 (3.9%) |
| 55 to 64 Years | 2,843 (97.4%) | 77 (2.6%) |
| 65 to 74 Years | 1,652 (97.2%) | 48 (2.8%) |
| 75 Years and older | 1,343 (98.5%) | 21 (1.5%) |
| Total | 16,749 (97.8%) | 381 (2.2%) |
Health Insurance Coverage by Citizenship Status in Bellaire
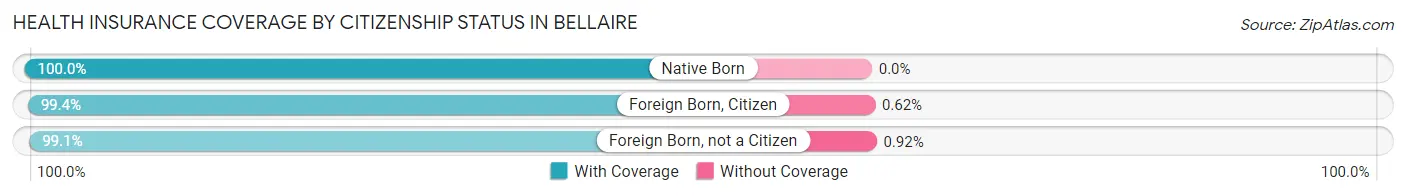
| Citizenship Status | With Coverage | Without Coverage |
| Native Born | 999 (100.0%) | 0 (0.0%) |
| Foreign Born, Citizen | 3,709 (99.4%) | 23 (0.6%) |
| Foreign Born, not a Citizen | 754 (99.1%) | 7 (0.9%) |
Health Insurance Coverage by Household Income in Bellaire
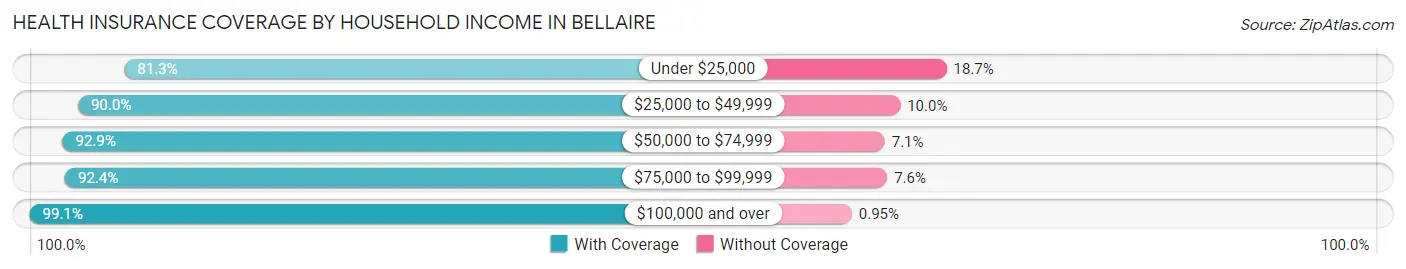
| Household Income | With Coverage | Without Coverage |
| Under $25,000 | 313 (81.3%) | 72 (18.7%) |
| $25,000 to $49,999 | 845 (90.0%) | 94 (10.0%) |
| $50,000 to $74,999 | 313 (92.9%) | 24 (7.1%) |
| $75,000 to $99,999 | 622 (92.4%) | 51 (7.6%) |
| $100,000 and over | 14,647 (99.1%) | 140 (0.9%) |
Public vs Private Health Insurance Coverage by Age in Bellaire
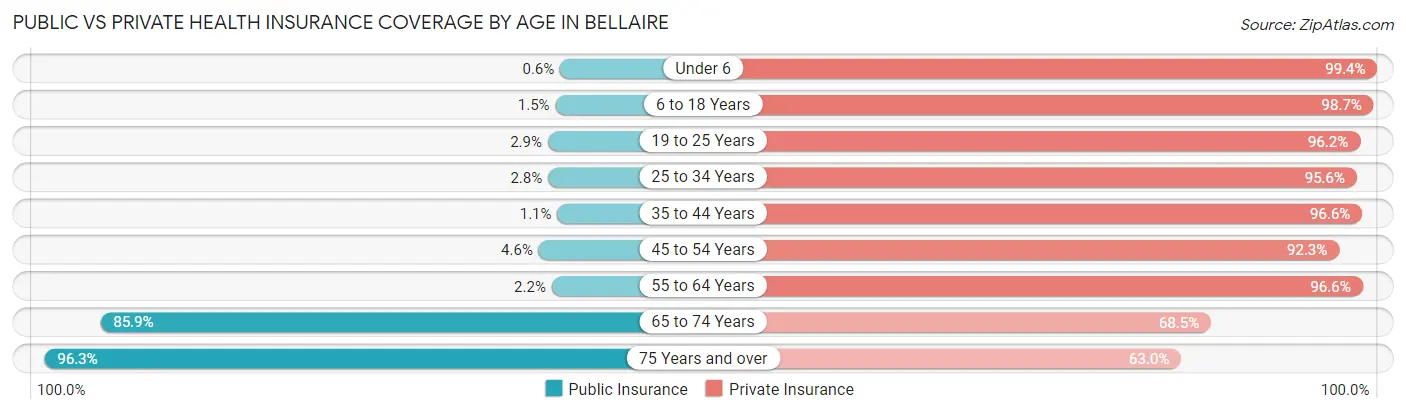
| Age Bracket | Public Insurance | Private Insurance |
| Under 6 | 6 (0.6%) | 993 (99.4%) |
| 6 to 18 Years | 55 (1.5%) | 3,684 (98.7%) |
| 19 to 25 Years | 22 (2.9%) | 732 (96.2%) |
| 25 to 34 Years | 27 (2.8%) | 909 (95.6%) |
| 35 to 44 Years | 25 (1.1%) | 2,173 (96.6%) |
| 45 to 54 Years | 112 (4.6%) | 2,264 (92.3%) |
| 55 to 64 Years | 63 (2.2%) | 2,822 (96.6%) |
| 65 to 74 Years | 1,461 (85.9%) | 1,165 (68.5%) |
| 75 Years and over | 1,314 (96.3%) | 859 (63.0%) |
| Total | 3,085 (18.0%) | 15,601 (91.1%) |
Disability Status by Sex by Age in Bellaire
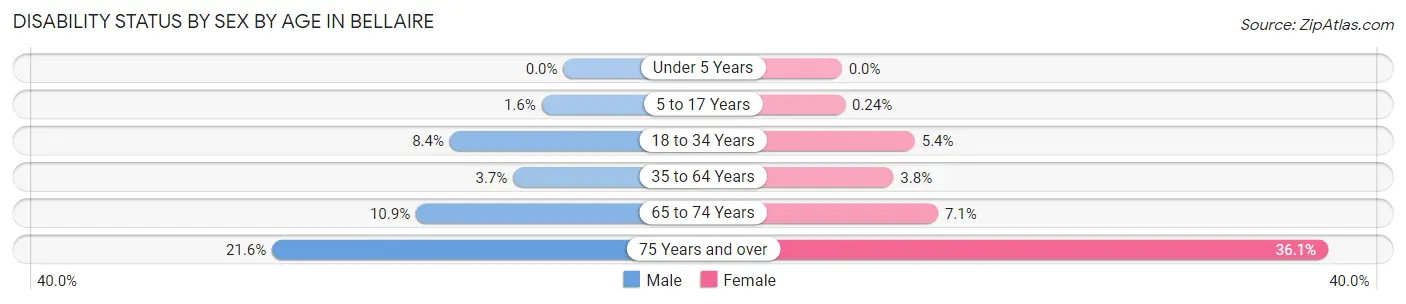
| Age Bracket | Male | Female |
| Under 5 Years | 0 (0.0%) | 0 (0.0%) |
| 5 to 17 Years | 31 (1.6%) | 4 (0.2%) |
| 18 to 34 Years | 83 (8.4%) | 55 (5.4%) |
| 35 to 64 Years | 141 (3.7%) | 147 (3.8%) |
| 65 to 74 Years | 91 (10.9%) | 62 (7.1%) |
| 75 Years and over | 138 (21.6%) | 262 (36.1%) |
Disability Class by Sex by Age in Bellaire
Disability Class: Hearing Difficulty
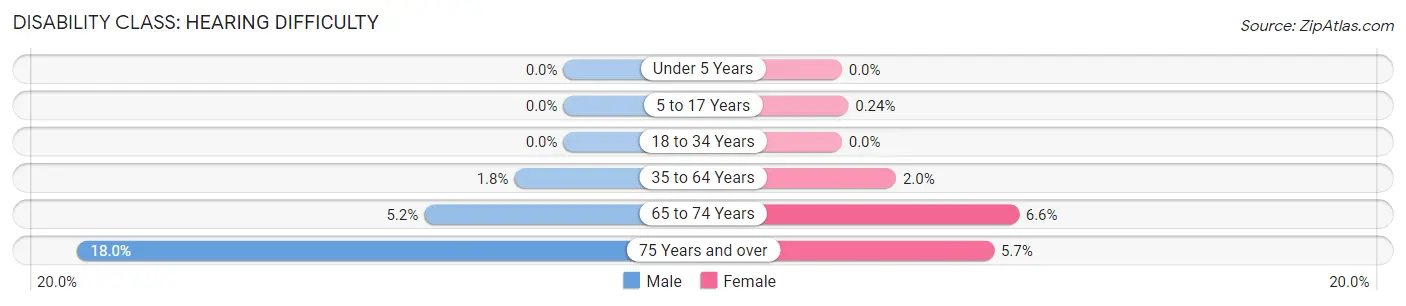
| Age Bracket | Male | Female |
| Under 5 Years | 0 (0.0%) | 0 (0.0%) |
| 5 to 17 Years | 0 (0.0%) | 4 (0.2%) |
| 18 to 34 Years | 0 (0.0%) | 0 (0.0%) |
| 35 to 64 Years | 69 (1.8%) | 77 (2.0%) |
| 65 to 74 Years | 43 (5.2%) | 57 (6.6%) |
| 75 Years and over | 115 (18.0%) | 41 (5.7%) |
Disability Class: Vision Difficulty
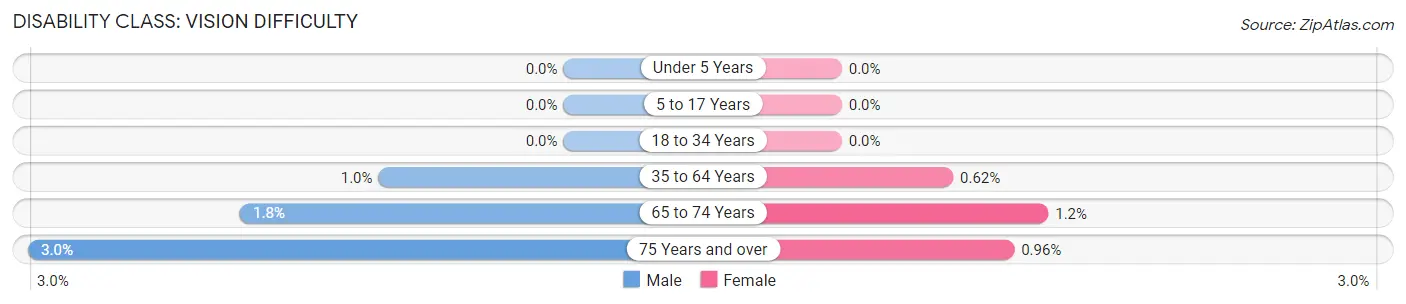
| Age Bracket | Male | Female |
| Under 5 Years | 0 (0.0%) | 0 (0.0%) |
| 5 to 17 Years | 0 (0.0%) | 0 (0.0%) |
| 18 to 34 Years | 0 (0.0%) | 0 (0.0%) |
| 35 to 64 Years | 39 (1.0%) | 24 (0.6%) |
| 65 to 74 Years | 15 (1.8%) | 10 (1.1%) |
| 75 Years and over | 19 (3.0%) | 7 (1.0%) |
Disability Class: Cognitive Difficulty
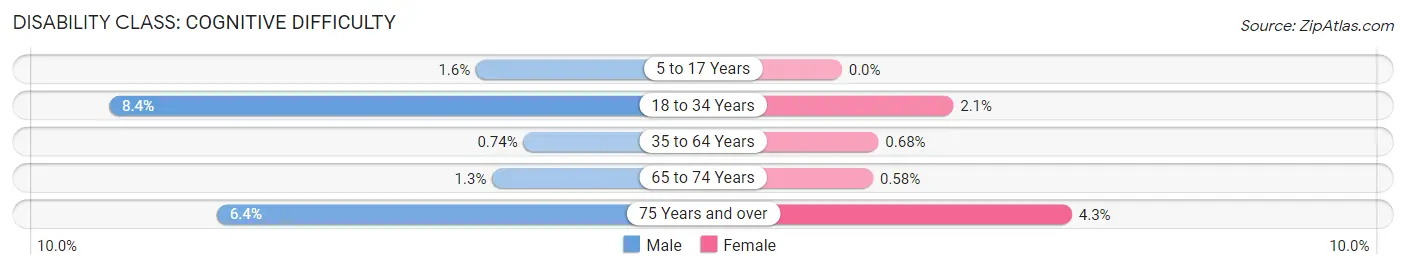
| Age Bracket | Male | Female |
| 5 to 17 Years | 31 (1.6%) | 0 (0.0%) |
| 18 to 34 Years | 83 (8.4%) | 21 (2.1%) |
| 35 to 64 Years | 28 (0.7%) | 26 (0.7%) |
| 65 to 74 Years | 11 (1.3%) | 5 (0.6%) |
| 75 Years and over | 41 (6.4%) | 31 (4.3%) |
Disability Class: Ambulatory Difficulty
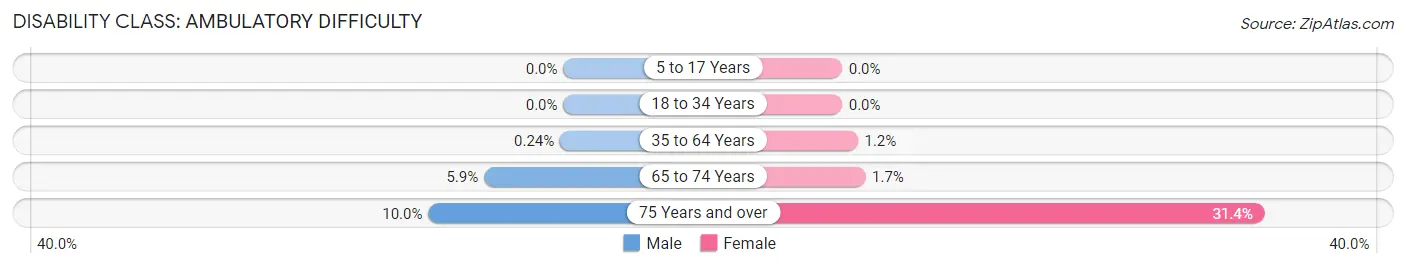
| Age Bracket | Male | Female |
| 5 to 17 Years | 0 (0.0%) | 0 (0.0%) |
| 18 to 34 Years | 0 (0.0%) | 0 (0.0%) |
| 35 to 64 Years | 9 (0.2%) | 45 (1.2%) |
| 65 to 74 Years | 49 (5.9%) | 15 (1.7%) |
| 75 Years and over | 64 (10.0%) | 228 (31.4%) |
Disability Class: Self-Care Difficulty
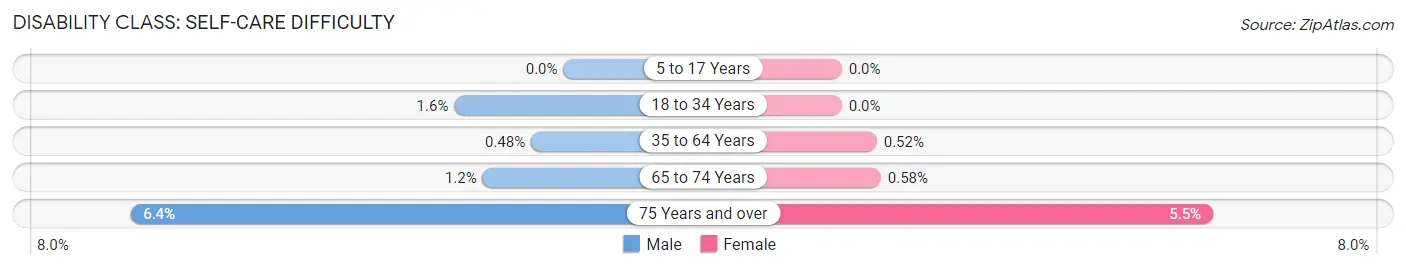
| Age Bracket | Male | Female |
| 5 to 17 Years | 0 (0.0%) | 0 (0.0%) |
| 18 to 34 Years | 16 (1.6%) | 0 (0.0%) |
| 35 to 64 Years | 18 (0.5%) | 20 (0.5%) |
| 65 to 74 Years | 10 (1.2%) | 5 (0.6%) |
| 75 Years and over | 41 (6.4%) | 40 (5.5%) |
Technology Access in Bellaire
Computing Device Access in Bellaire
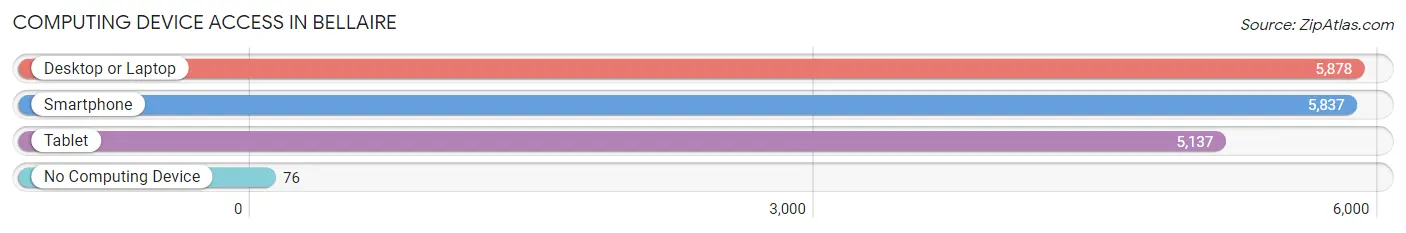
| Device Type | # Households | % Households |
| Desktop or Laptop | 5,878 | 96.6% |
| Smartphone | 5,837 | 95.9% |
| Tablet | 5,137 | 84.4% |
| No Computing Device | 76 | 1.3% |
| Total | 6,087 | 100.0% |
Internet Access in Bellaire
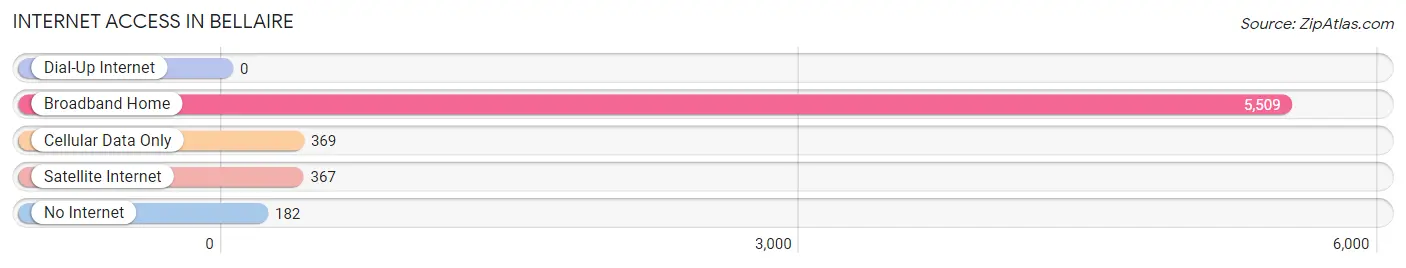
| Internet Type | # Households | % Households |
| Dial-Up Internet | 0 | 0.0% |
| Broadband Home | 5,509 | 90.5% |
| Cellular Data Only | 369 | 6.1% |
| Satellite Internet | 367 | 6.0% |
| No Internet | 182 | 3.0% |
| Total | 6,087 | 100.0% |
Bellaire Summary
Bellaire, Texas is a city located in the southwestern part of Harris County, Texas, United States. It is a suburb of Houston and is part of the Greater Houston metropolitan area. The city is located within the Houston–The Woodlands–Sugar Land metropolitan area. As of the 2010 U.S. Census, the city had a population of 17,049.
History
Bellaire was founded in 1908 by William Wright Baldwin, who named the city after Bellaire, Ohio, a town he had previously lived in. The town was incorporated in 1918. The city was originally developed as a residential community for the wealthy. It was known as the “City of Homes” because of its many large, stately homes.
In the 1950s, Bellaire experienced a population boom due to the growth of the Houston area. The city was annexed by Houston in 1954, and the population continued to grow. By the 1970s, Bellaire had become a popular destination for middle-class families.
Geography
Bellaire is located in southwestern Harris County at 29°42′N 95°27′W (29.7, -95.45). It is bordered to the north by the city of Houston, to the east by Southside Place, to the south by West University Place, and to the west by the city of Bellaire.
Bellaire is located in the Houston–The Woodlands–Sugar Land metropolitan area. The city is located approximately 15 miles (24 km) southwest of downtown Houston.
Economy
Bellaire is home to a variety of businesses, including retail stores, restaurants, and professional services. The city is also home to several corporate headquarters, including the headquarters of the Houston-based oil and gas company, Apache Corporation.
The city is also home to several medical facilities, including the Texas Children’s Hospital, the Houston Methodist Hospital, and the Memorial Hermann Hospital.
Demographics
As of the 2010 U.S. Census, the city had a population of 17,049. The racial makeup of the city was 73.2% White, 11.2% African American, 0.3% Native American, 8.3% Asian, 0.1% Pacific Islander, 4.2% from other races, and 2.9% from two or more races. Hispanic or Latino of any race were 18.2% of the population.
The median income for a household in the city was $90,945, and the median income for a family was $103,945. The per capita income for the city was $45,945. About 4.2% of families and 5.3% of the population were below the poverty line, including 6.2% of those under age 18 and 4.2% of those age 65 or over.
Bellaire is served by the Houston Independent School District. The city is home to several public schools, including Bellaire High School, Bellaire Middle School, and Condit Elementary School. The city is also home to several private schools, including St. Thomas Episcopal School and St. Vincent de Paul Catholic School.
Common Questions
What is Per Capita Income in Bellaire?
Per Capita income in Bellaire is $104,552.
What is the Median Family Income in Bellaire?
Median Family Income in Bellaire is $243,866.
What is the Median Household income in Bellaire?
Median Household Income in Bellaire is $215,636.
What is Income or Wage Gap in Bellaire?
Income or Wage Gap in Bellaire is 56.0%.
Women in Bellaire earn 44.0 cents for every dollar earned by a man.
What is Family Income Deficit in Bellaire?
Family Income Deficit in Bellaire is $11,816.
Families that are below poverty line in Bellaire earn $11,816 less on average than the poverty threshold level.
What is Inequality or Gini Index in Bellaire?
Inequality or Gini Index in Bellaire is 0.47.
What is the Total Population of Bellaire?
Total Population of Bellaire is 17,163.
What is the Total Male Population of Bellaire?
Total Male Population of Bellaire is 8,635.
What is the Total Female Population of Bellaire?
Total Female Population of Bellaire is 8,528.
What is the Ratio of Males per 100 Females in Bellaire?
There are 101.25 Males per 100 Females in Bellaire.
What is the Ratio of Females per 100 Males in Bellaire?
There are 98.76 Females per 100 Males in Bellaire.
What is the Median Population Age in Bellaire?
Median Population Age in Bellaire is 44.3 Years.
What is the Average Family Size in Bellaire
Average Family Size in Bellaire is 3.1 People.
What is the Average Household Size in Bellaire
Average Household Size in Bellaire is 2.8 People.
How Large is the Labor Force in Bellaire?
There are 8,383 People in the Labor Forcein in Bellaire.
What is the Percentage of People in the Labor Force in Bellaire?
62.9% of People are in the Labor Force in Bellaire.
What is the Unemployment Rate in Bellaire?
Unemployment Rate in Bellaire is 2.5%.