Dayton, NJ Map & Demographics
Dayton Map
Dayton Overview
$55,080
PER CAPITA INCOME
$139,889
AVG FAMILY INCOME
$136,130
AVG HOUSEHOLD INCOME
56.2%
WAGE / INCOME GAP [ % ]
43.8¢/ $1
WAGE / INCOME GAP [ $ ]
0.35
INEQUALITY / GINI INDEX
8,361
TOTAL POPULATION
4,254
MALE POPULATION
4,107
FEMALE POPULATION
103.58
MALES / 100 FEMALES
96.54
FEMALES / 100 MALES
41.2
MEDIAN AGE
3.2
AVG FAMILY SIZE
3.0
AVG HOUSEHOLD SIZE
4,614
LABOR FORCE [ PEOPLE ]
69.1%
PERCENT IN LABOR FORCE
7.7%
UNEMPLOYMENT RATE
Dayton Zip Codes
Dayton Area Codes
Income in Dayton
Income Overview in Dayton
Per Capita Income in Dayton is $55,080, while median incomes of families and households are $139,889 and $136,130 respectively.
| Characteristic | Number | Measure |
| Per Capita Income | 8,361 | $55,080 |
| Median Family Income | 2,506 | $139,889 |
| Mean Family Income | 2,506 | $172,588 |
| Median Household Income | 2,804 | $136,130 |
| Mean Household Income | 2,804 | $165,632 |
| Income Deficit | 2,506 | $0 |
| Wage / Income Gap (%) | 8,361 | 56.15% |
| Wage / Income Gap ($) | 8,361 | 43.85¢ per $1 |
| Gini / Inequality Index | 8,361 | 0.35 |
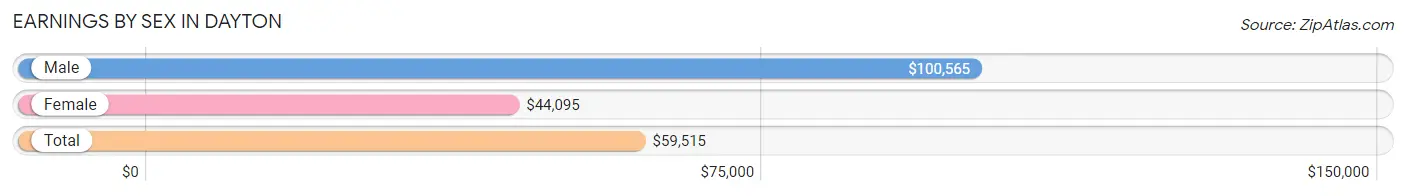
Earnings by Sex in Dayton
Average Earnings in Dayton are $59,515, $100,565 for men and $44,095 for women, a difference of 56.1%.
| Sex | Number | Average Earnings |
| Male | 2,534 (52.3%) | $100,565 |
| Female | 2,315 (47.7%) | $44,095 |
| Total | 4,849 (100.0%) | $59,515 |
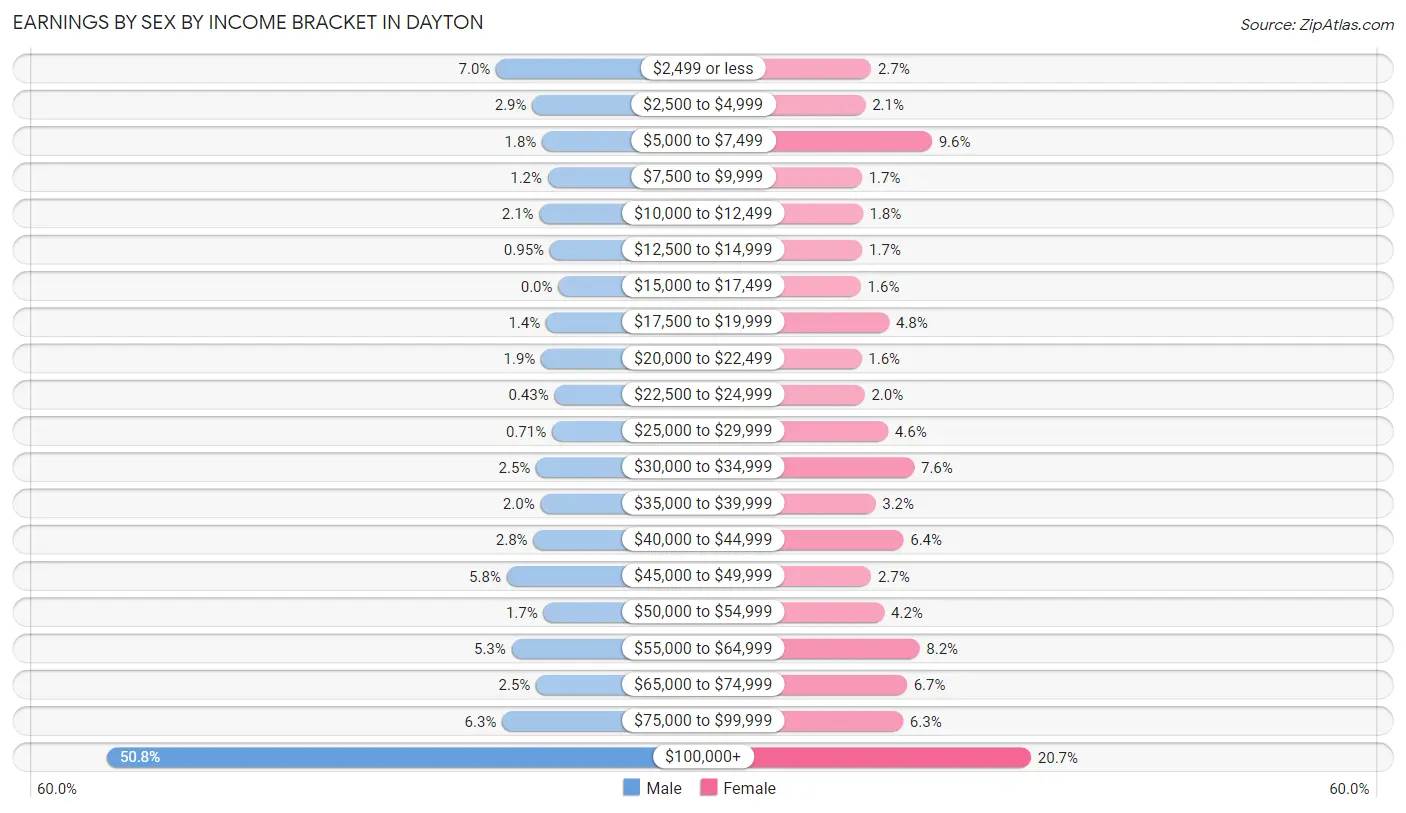
Earnings by Sex by Income Bracket in Dayton
The most common earnings brackets in Dayton are $100,000+ for men (1,286 | 50.7%) and $100,000+ for women (479 | 20.7%).
| Income | Male | Female |
| $2,499 or less | 177 (7.0%) | 63 (2.7%) |
| $2,500 to $4,999 | 74 (2.9%) | 48 (2.1%) |
| $5,000 to $7,499 | 46 (1.8%) | 221 (9.6%) |
| $7,500 to $9,999 | 30 (1.2%) | 39 (1.7%) |
| $10,000 to $12,499 | 54 (2.1%) | 41 (1.8%) |
| $12,500 to $14,999 | 24 (0.9%) | 40 (1.7%) |
| $15,000 to $17,499 | 0 (0.0%) | 36 (1.6%) |
| $17,500 to $19,999 | 35 (1.4%) | 110 (4.8%) |
| $20,000 to $22,499 | 49 (1.9%) | 38 (1.6%) |
| $22,500 to $24,999 | 11 (0.4%) | 46 (2.0%) |
| $25,000 to $29,999 | 18 (0.7%) | 107 (4.6%) |
| $30,000 to $34,999 | 63 (2.5%) | 175 (7.6%) |
| $35,000 to $39,999 | 51 (2.0%) | 74 (3.2%) |
| $40,000 to $44,999 | 71 (2.8%) | 147 (6.4%) |
| $45,000 to $49,999 | 147 (5.8%) | 63 (2.7%) |
| $50,000 to $54,999 | 42 (1.7%) | 97 (4.2%) |
| $55,000 to $64,999 | 133 (5.2%) | 189 (8.2%) |
| $65,000 to $74,999 | 63 (2.5%) | 156 (6.7%) |
| $75,000 to $99,999 | 160 (6.3%) | 146 (6.3%) |
| $100,000+ | 1,286 (50.7%) | 479 (20.7%) |
| Total | 2,534 (100.0%) | 2,315 (100.0%) |
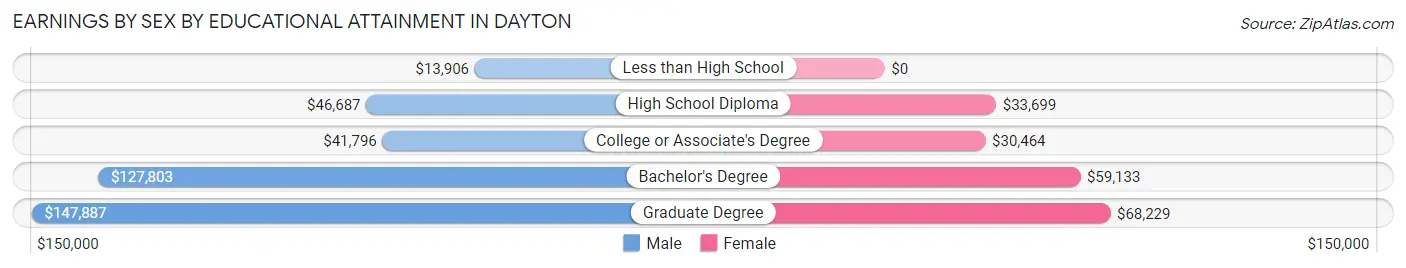
Earnings by Sex by Educational Attainment in Dayton
Average earnings in Dayton are $108,241 for men and $51,563 for women, a difference of 52.4%. Men with an educational attainment of graduate degree enjoy the highest average annual earnings of $147,887, while those with less than high school education earn the least with $13,906. Women with an educational attainment of graduate degree earn the most with the average annual earnings of $68,229, while those with college or associate's degree education have the smallest earnings of $30,464.
| Educational Attainment | Male Income | Female Income |
| Less than High School | $13,906 | $0 |
| High School Diploma | $46,687 | $33,699 |
| College or Associate's Degree | $41,796 | $30,464 |
| Bachelor's Degree | $127,803 | $59,133 |
| Graduate Degree | $147,887 | $68,229 |
| Total | $108,241 | $51,563 |
Family Income in Dayton
Family Income Brackets in Dayton
According to the Dayton family income data, there are 787 families falling into the $200,000+ income range, which is the most common income bracket and makes up 31.4% of all families.
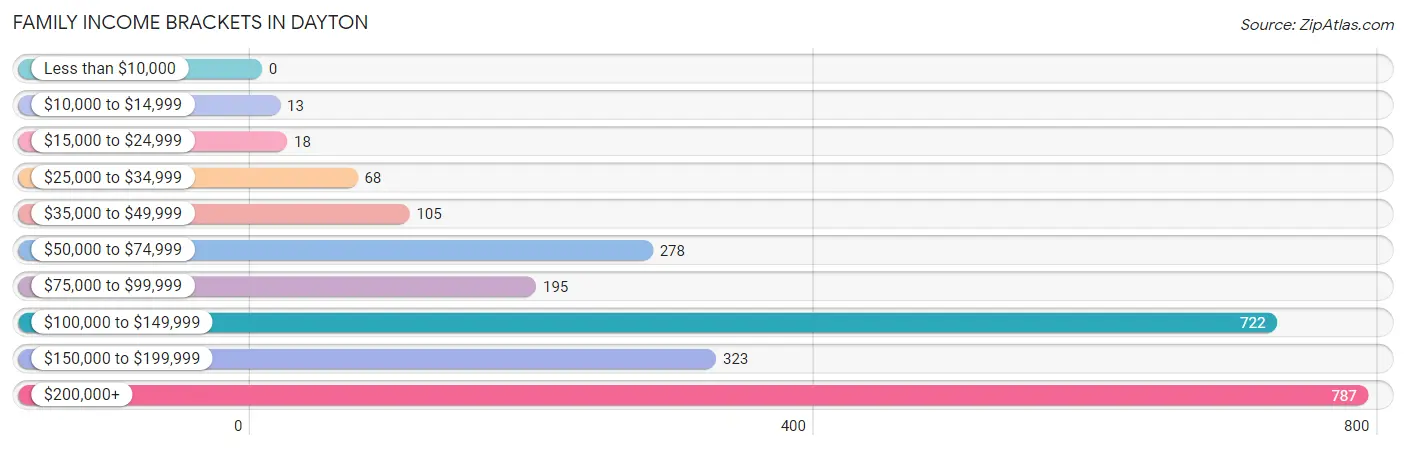
| Income Bracket | # Families | % Families |
| Less than $10,000 | 0 | 0.0% |
| $10,000 to $14,999 | 13 | 0.5% |
| $15,000 to $24,999 | 18 | 0.7% |
| $25,000 to $34,999 | 68 | 2.7% |
| $35,000 to $49,999 | 105 | 4.2% |
| $50,000 to $74,999 | 278 | 11.1% |
| $75,000 to $99,999 | 195 | 7.8% |
| $100,000 to $149,999 | 722 | 28.8% |
| $150,000 to $199,999 | 323 | 12.9% |
| $200,000+ | 787 | 31.4% |
Family Income by Famaliy Size in Dayton
5-person families (168 | 6.7%) account for the highest median family income in Dayton with $250,001 per family, while 2-person families (777 | 31.0%) have the highest median income of $52,564 per family member.
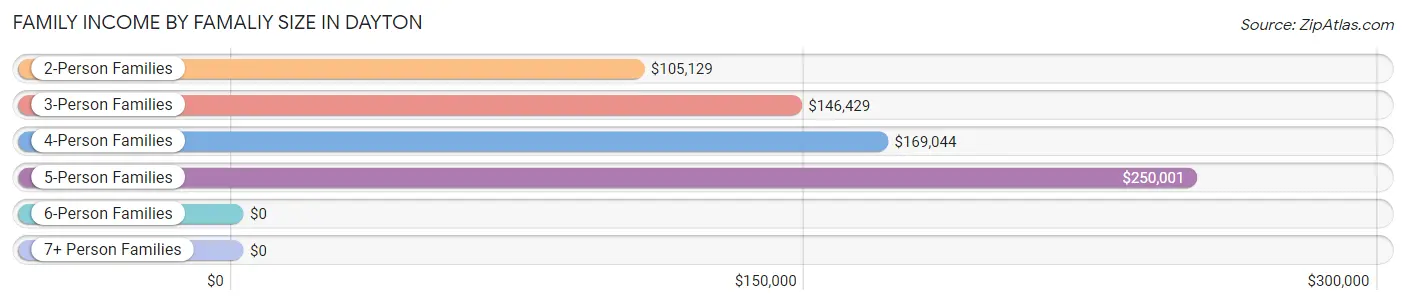
| Income Bracket | # Families | Median Income |
| 2-Person Families | 777 (31.0%) | $105,129 |
| 3-Person Families | 766 (30.6%) | $146,429 |
| 4-Person Families | 752 (30.0%) | $169,044 |
| 5-Person Families | 168 (6.7%) | $250,001 |
| 6-Person Families | 30 (1.2%) | $0 |
| 7+ Person Families | 13 (0.5%) | $0 |
| Total | 2,506 (100.0%) | $139,889 |
Family Income by Number of Earners in Dayton
The median family income in Dayton is $139,889, with families comprising 3+ earners (446) having the highest median family income of $235,714, while families with no earners (161) have the lowest median family income of $74,962, accounting for 17.8% and 6.4% of families, respectively.
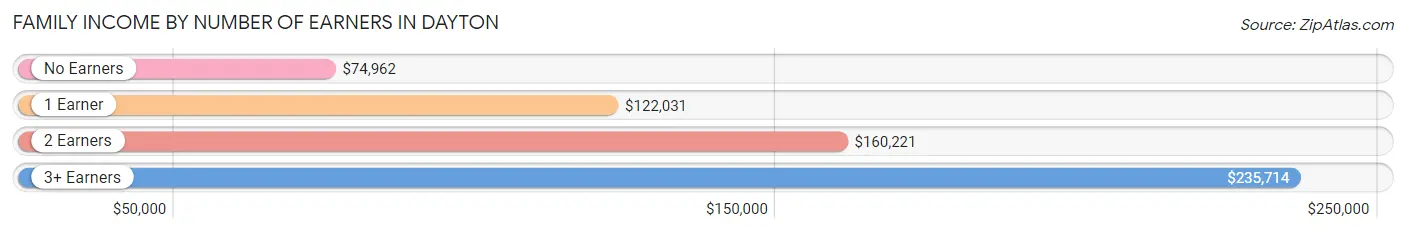
| Number of Earners | # Families | Median Income |
| No Earners | 161 (6.4%) | $74,962 |
| 1 Earner | 696 (27.8%) | $122,031 |
| 2 Earners | 1,203 (48.0%) | $160,221 |
| 3+ Earners | 446 (17.8%) | $235,714 |
| Total | 2,506 (100.0%) | $139,889 |
Household Income in Dayton
Household Income Brackets in Dayton
With 824 households falling in the category, the $100,000 to $149,999 income range is the most frequent in Dayton, accounting for 29.4% of all households. In contrast, only 14 households (0.5%) fall into the less than $10,000 income bracket, making it the least populous group.
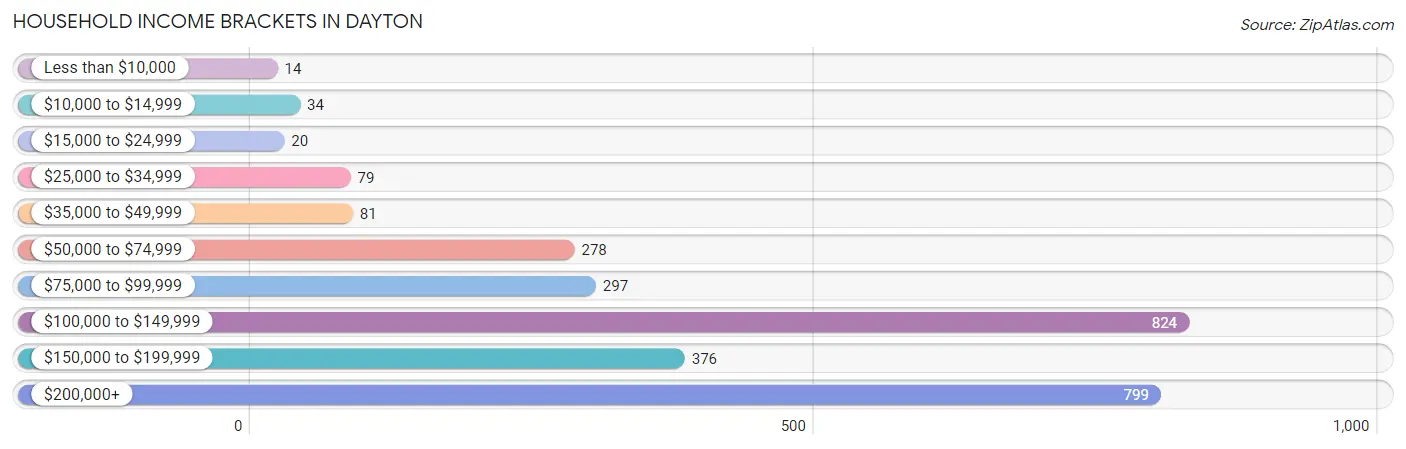
| Income Bracket | # Households | % Households |
| Less than $10,000 | 14 | 0.5% |
| $10,000 to $14,999 | 34 | 1.2% |
| $15,000 to $24,999 | 20 | 0.7% |
| $25,000 to $34,999 | 79 | 2.8% |
| $35,000 to $49,999 | 81 | 2.9% |
| $50,000 to $74,999 | 278 | 9.9% |
| $75,000 to $99,999 | 297 | 10.6% |
| $100,000 to $149,999 | 824 | 29.4% |
| $150,000 to $199,999 | 376 | 13.4% |
| $200,000+ | 799 | 28.5% |
Household Income by Householder Age in Dayton
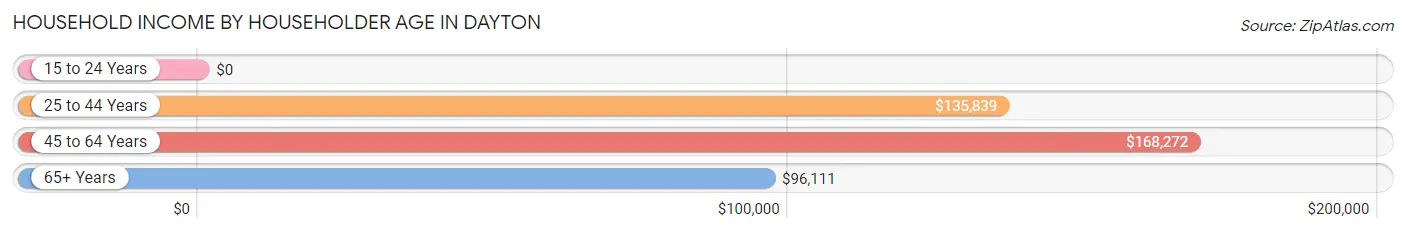
The median household income in Dayton is $136,130, with the highest median household income of $168,272 found in the 45 to 64 years age bracket for the primary householder. A total of 1,645 households (58.7%) fall into this category.
| Income Bracket | # Households | Median Income |
| 15 to 24 Years | 0 (0.0%) | $0 |
| 25 to 44 Years | 687 (24.5%) | $135,839 |
| 45 to 64 Years | 1,645 (58.7%) | $168,272 |
| 65+ Years | 472 (16.8%) | $96,111 |
| Total | 2,804 (100.0%) | $136,130 |
Poverty in Dayton
Income Below Poverty by Sex and Age in Dayton
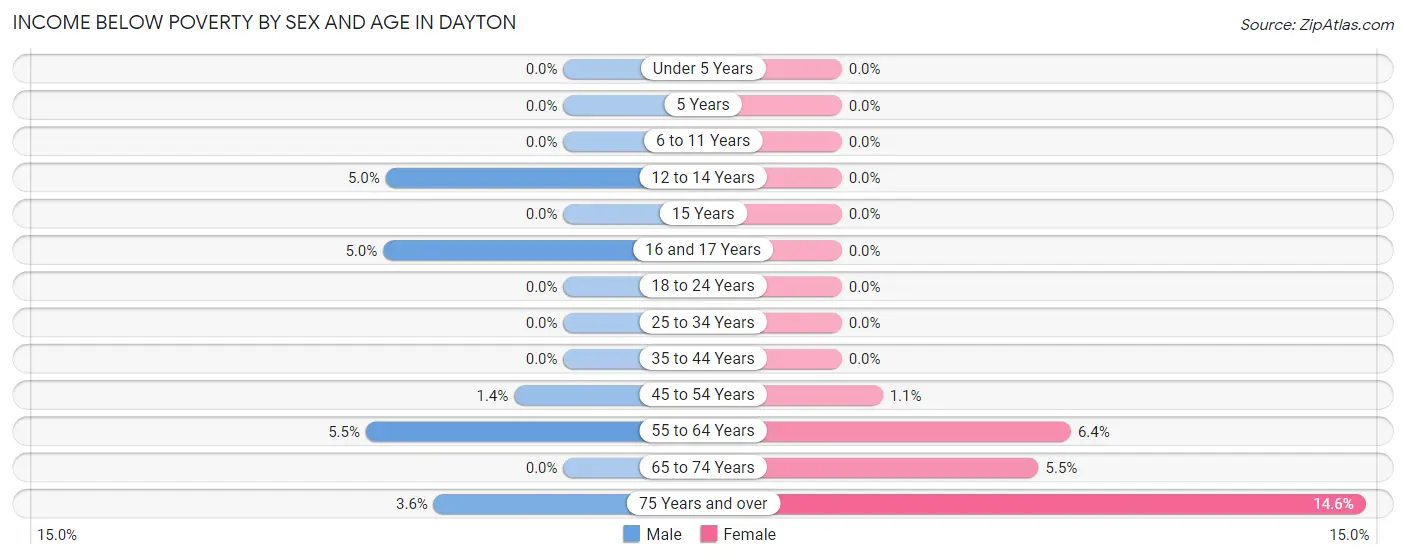
With 1.7% poverty level for males and 1.9% for females among the residents of Dayton, 55 to 64 year old males and 75 year old and over females are the most vulnerable to poverty, with 33 males (5.5%) and 21 females (14.6%) in their respective age groups living below the poverty level.
| Age Bracket | Male | Female |
| Under 5 Years | 0 (0.0%) | 0 (0.0%) |
| 5 Years | 0 (0.0%) | 0 (0.0%) |
| 6 to 11 Years | 0 (0.0%) | 0 (0.0%) |
| 12 to 14 Years | 11 (5.0%) | 0 (0.0%) |
| 15 Years | 0 (0.0%) | 0 (0.0%) |
| 16 and 17 Years | 11 (5.0%) | 0 (0.0%) |
| 18 to 24 Years | 0 (0.0%) | 0 (0.0%) |
| 25 to 34 Years | 0 (0.0%) | 0 (0.0%) |
| 35 to 44 Years | 0 (0.0%) | 0 (0.0%) |
| 45 to 54 Years | 12 (1.4%) | 11 (1.1%) |
| 55 to 64 Years | 33 (5.5%) | 27 (6.4%) |
| 65 to 74 Years | 0 (0.0%) | 21 (5.5%) |
| 75 Years and over | 6 (3.6%) | 21 (14.6%) |
| Total | 73 (1.7%) | 80 (1.9%) |
Income Above Poverty by Sex and Age in Dayton
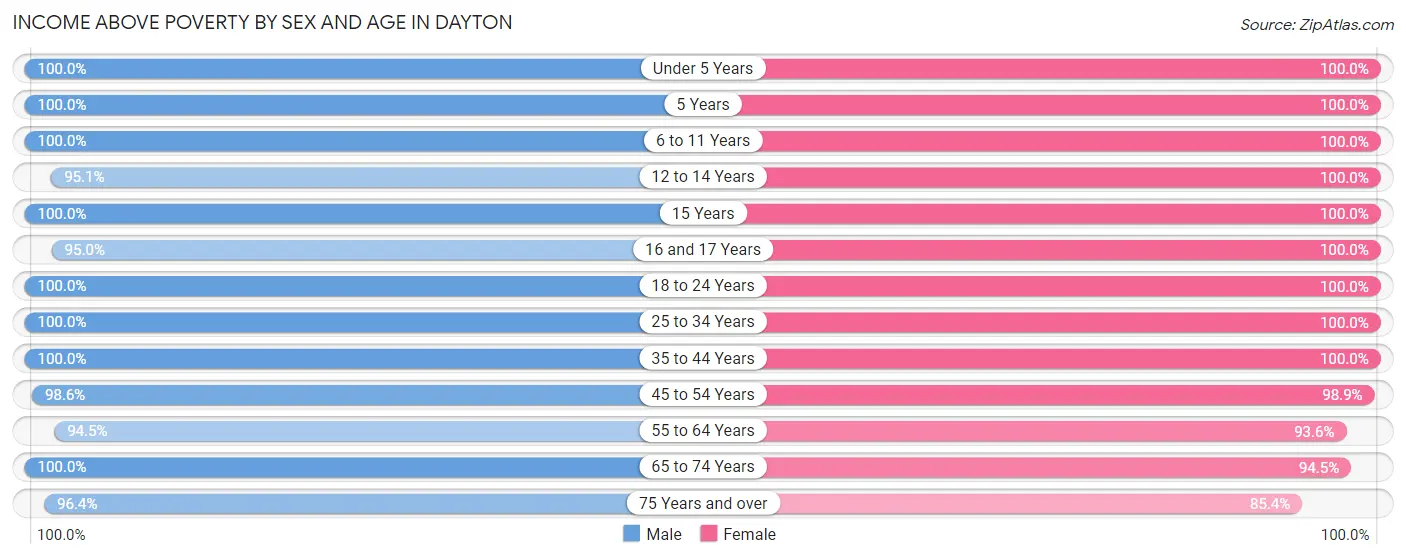
According to the poverty statistics in Dayton, males aged under 5 years and females aged under 5 years are the age groups that are most secure financially, with 100.0% of males and 100.0% of females in these age groups living above the poverty line.
| Age Bracket | Male | Female |
| Under 5 Years | 119 (100.0%) | 151 (100.0%) |
| 5 Years | 55 (100.0%) | 19 (100.0%) |
| 6 to 11 Years | 442 (100.0%) | 228 (100.0%) |
| 12 to 14 Years | 211 (95.1%) | 206 (100.0%) |
| 15 Years | 184 (100.0%) | 58 (100.0%) |
| 16 and 17 Years | 208 (95.0%) | 77 (100.0%) |
| 18 to 24 Years | 385 (100.0%) | 310 (100.0%) |
| 25 to 34 Years | 341 (100.0%) | 566 (100.0%) |
| 35 to 44 Years | 406 (100.0%) | 581 (100.0%) |
| 45 to 54 Years | 867 (98.6%) | 950 (98.9%) |
| 55 to 64 Years | 567 (94.5%) | 396 (93.6%) |
| 65 to 74 Years | 236 (100.0%) | 362 (94.5%) |
| 75 Years and over | 160 (96.4%) | 123 (85.4%) |
| Total | 4,181 (98.3%) | 4,027 (98.1%) |
Income Below Poverty Among Married-Couple Families in Dayton
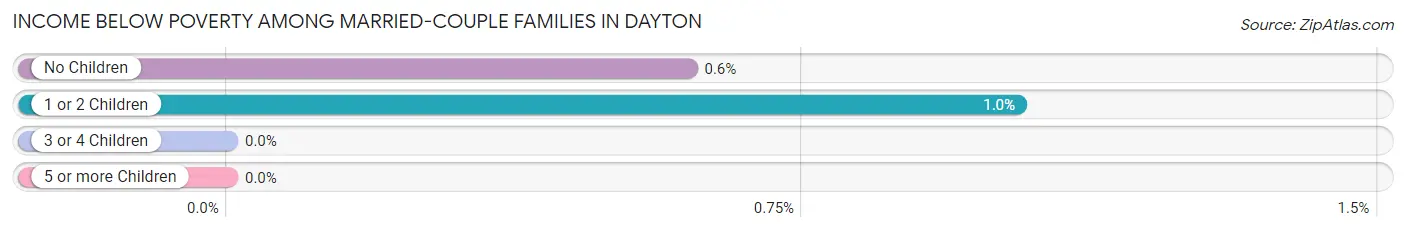
The poverty statistics for married-couple families in Dayton show that 0.8% or 18 of the total 2,207 families live below the poverty line. Families with 1 or 2 children have the highest poverty rate of 1.0%, comprising of 12 families. On the other hand, families with 3 or 4 children have the lowest poverty rate of 0.0%, which includes 0 families.
| Children | Above Poverty | Below Poverty |
| No Children | 987 (99.4%) | 6 (0.6%) |
| 1 or 2 Children | 1,154 (99.0%) | 12 (1.0%) |
| 3 or 4 Children | 48 (100.0%) | 0 (0.0%) |
| 5 or more Children | 0 (0.0%) | 0 (0.0%) |
| Total | 2,189 (99.2%) | 18 (0.8%) |
Income Below Poverty Among Single-Parent Households in Dayton
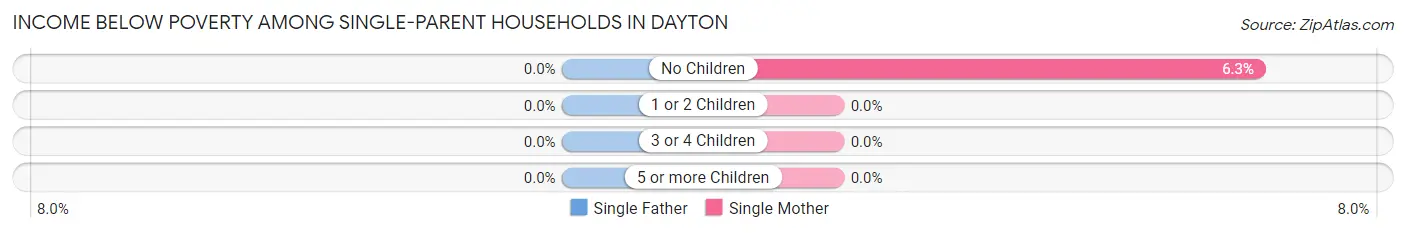
| Children | Single Father | Single Mother |
| No Children | 0 (0.0%) | 11 (6.3%) |
| 1 or 2 Children | 0 (0.0%) | 0 (0.0%) |
| 3 or 4 Children | 0 (0.0%) | 0 (0.0%) |
| 5 or more Children | 0 (0.0%) | 0 (0.0%) |
| Total | 0 (0.0%) | 11 (4.3%) |
Income Below Poverty Among Married-Couple vs Single-Parent Households in Dayton
The poverty data for Dayton shows that 18 of the married-couple family households (0.8%) and 11 of the single-parent households (3.7%) are living below the poverty level. Within the married-couple family households, those with 1 or 2 children have the highest poverty rate, with 12 households (1.0%) falling below the poverty line. Among the single-parent households, those with no children have the highest poverty rate, with 11 household (6.3%) living below poverty.
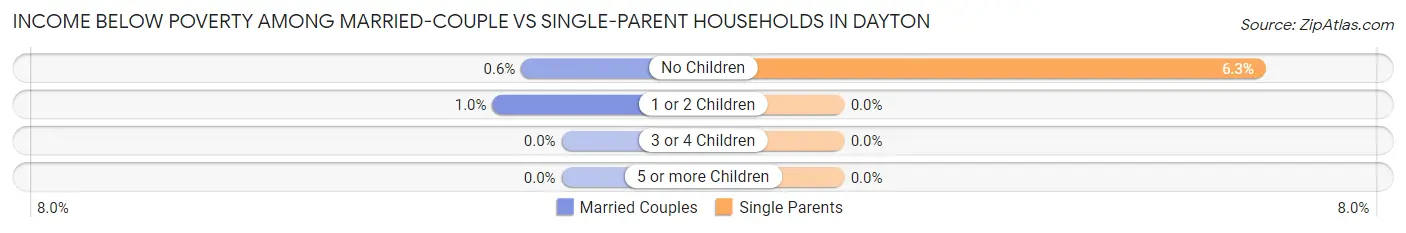
| Children | Married-Couple Families | Single-Parent Households |
| No Children | 6 (0.6%) | 11 (6.3%) |
| 1 or 2 Children | 12 (1.0%) | 0 (0.0%) |
| 3 or 4 Children | 0 (0.0%) | 0 (0.0%) |
| 5 or more Children | 0 (0.0%) | 0 (0.0%) |
| Total | 18 (0.8%) | 11 (3.7%) |
Race in Dayton
The most populous races in Dayton are Asian (4,683 | 56.0%), White / Caucasian (2,520 | 30.1%), and Black / African American (633 | 7.6%).
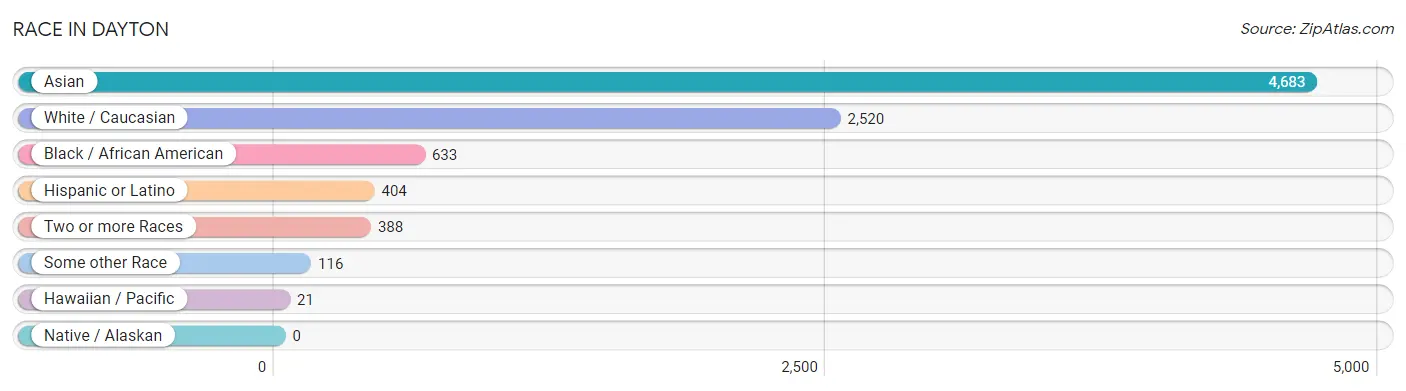
| Race | # Population | % Population |
| Asian | 4,683 | 56.0% |
| Black / African American | 633 | 7.6% |
| Hawaiian / Pacific | 21 | 0.3% |
| Hispanic or Latino | 404 | 4.8% |
| Native / Alaskan | 0 | 0.0% |
| White / Caucasian | 2,520 | 30.1% |
| Two or more Races | 388 | 4.6% |
| Some other Race | 116 | 1.4% |
| Total | 8,361 | 100.0% |
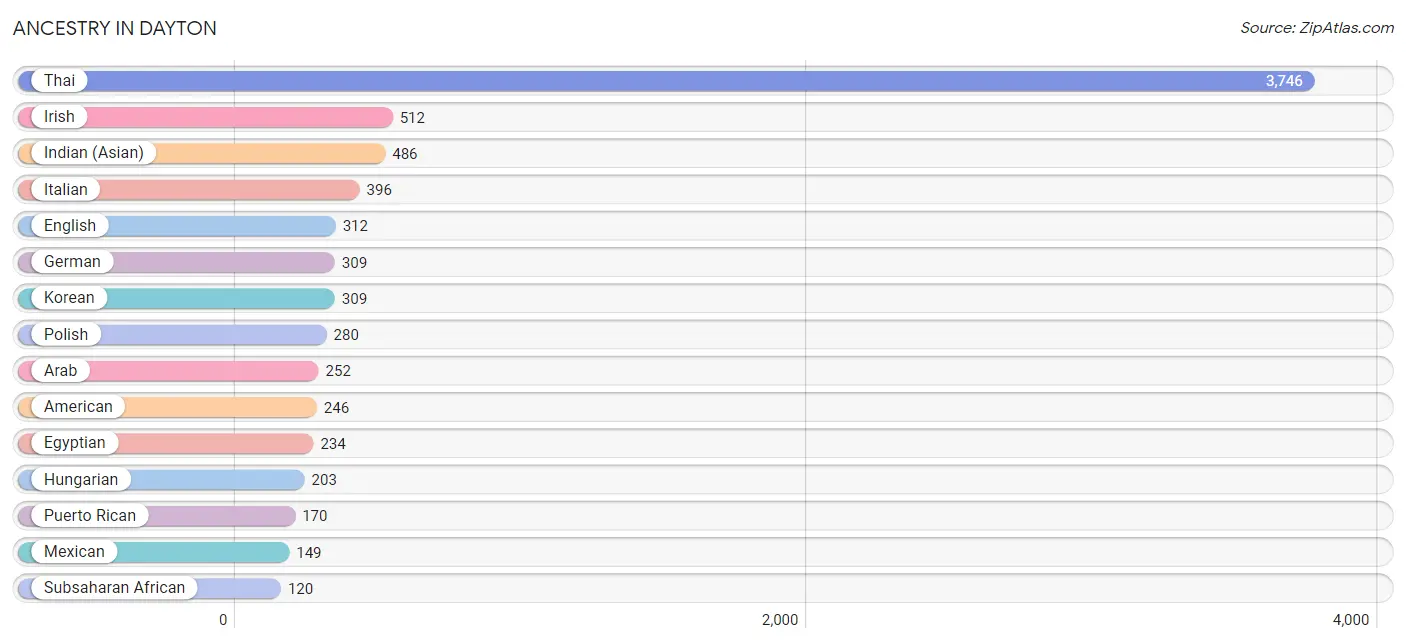
Ancestry in Dayton
The most populous ancestries reported in Dayton are Thai (3,746 | 44.8%), Irish (512 | 6.1%), Indian (Asian) (486 | 5.8%), Italian (396 | 4.7%), and English (312 | 3.7%), together accounting for 65.2% of all Dayton residents.
| Ancestry | # Population | % Population |
| African | 110 | 1.3% |
| American | 246 | 2.9% |
| Arab | 252 | 3.0% |
| British | 19 | 0.2% |
| Colombian | 38 | 0.4% |
| Cuban | 47 | 0.6% |
| Egyptian | 234 | 2.8% |
| English | 312 | 3.7% |
| European | 42 | 0.5% |
| Filipino | 18 | 0.2% |
| French | 54 | 0.6% |
| German | 309 | 3.7% |
| Greek | 78 | 0.9% |
| Guamanian / Chamorro | 84 | 1.0% |
| Guyanese | 48 | 0.6% |
| Haitian | 12 | 0.1% |
| Hungarian | 203 | 2.4% |
| Indian (Asian) | 486 | 5.8% |
| Irish | 512 | 6.1% |
| Italian | 396 | 4.7% |
| Jamaican | 12 | 0.1% |
| Korean | 309 | 3.7% |
| Lebanese | 18 | 0.2% |
| Lithuanian | 36 | 0.4% |
| Mexican | 149 | 1.8% |
| Pakistani | 27 | 0.3% |
| Polish | 280 | 3.4% |
| Puerto Rican | 170 | 2.0% |
| Russian | 111 | 1.3% |
| Scandinavian | 19 | 0.2% |
| Sierra Leonean | 10 | 0.1% |
| South American | 38 | 0.4% |
| Sri Lankan | 33 | 0.4% |
| Subsaharan African | 120 | 1.4% |
| Swedish | 45 | 0.5% |
| Thai | 3,746 | 44.8% |
| Ukrainian | 38 | 0.4% |
| West Indian | 14 | 0.2% | View All 38 Rows |
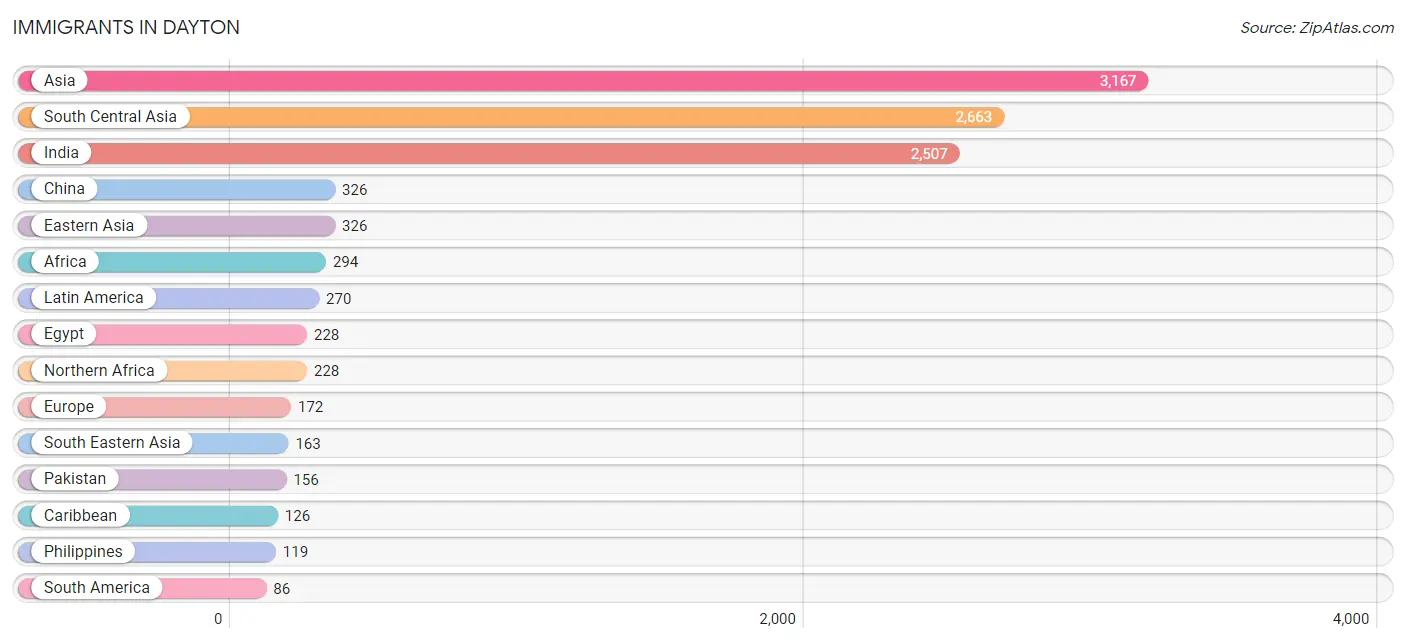
Immigrants in Dayton
The most numerous immigrant groups reported in Dayton came from Asia (3,167 | 37.9%), South Central Asia (2,663 | 31.9%), India (2,507 | 30.0%), China (326 | 3.9%), and Eastern Asia (326 | 3.9%), together accounting for 107.5% of all Dayton residents.
| Immigration Origin | # Population | % Population |
| Africa | 294 | 3.5% |
| Asia | 3,167 | 37.9% |
| Canada | 63 | 0.7% |
| Caribbean | 126 | 1.5% |
| Central America | 58 | 0.7% |
| China | 326 | 3.9% |
| Colombia | 38 | 0.4% |
| Cuba | 47 | 0.6% |
| Eastern Africa | 35 | 0.4% |
| Eastern Asia | 326 | 3.9% |
| Eastern Europe | 81 | 1.0% |
| Egypt | 228 | 2.7% |
| Ethiopia | 14 | 0.2% |
| Europe | 172 | 2.1% |
| Germany | 27 | 0.3% |
| Guyana | 48 | 0.6% |
| Hong Kong | 8 | 0.1% |
| Hungary | 51 | 0.6% |
| India | 2,507 | 30.0% |
| Jamaica | 12 | 0.1% |
| Latin America | 270 | 3.2% |
| Mexico | 42 | 0.5% |
| Northern Africa | 228 | 2.7% |
| Northern Europe | 64 | 0.8% |
| Pakistan | 156 | 1.9% |
| Panama | 16 | 0.2% |
| Philippines | 119 | 1.4% |
| Poland | 19 | 0.2% |
| Russia | 11 | 0.1% |
| Sierra Leone | 31 | 0.4% |
| South America | 86 | 1.0% |
| South Central Asia | 2,663 | 31.9% |
| South Eastern Asia | 163 | 1.9% |
| Taiwan | 63 | 0.7% |
| Thailand | 27 | 0.3% |
| Trinidad and Tobago | 67 | 0.8% |
| Uganda | 21 | 0.3% |
| Vietnam | 17 | 0.2% |
| Western Africa | 31 | 0.4% |
| Western Asia | 15 | 0.2% |
| Western Europe | 27 | 0.3% |
| Yemen | 15 | 0.2% | View All 42 Rows |
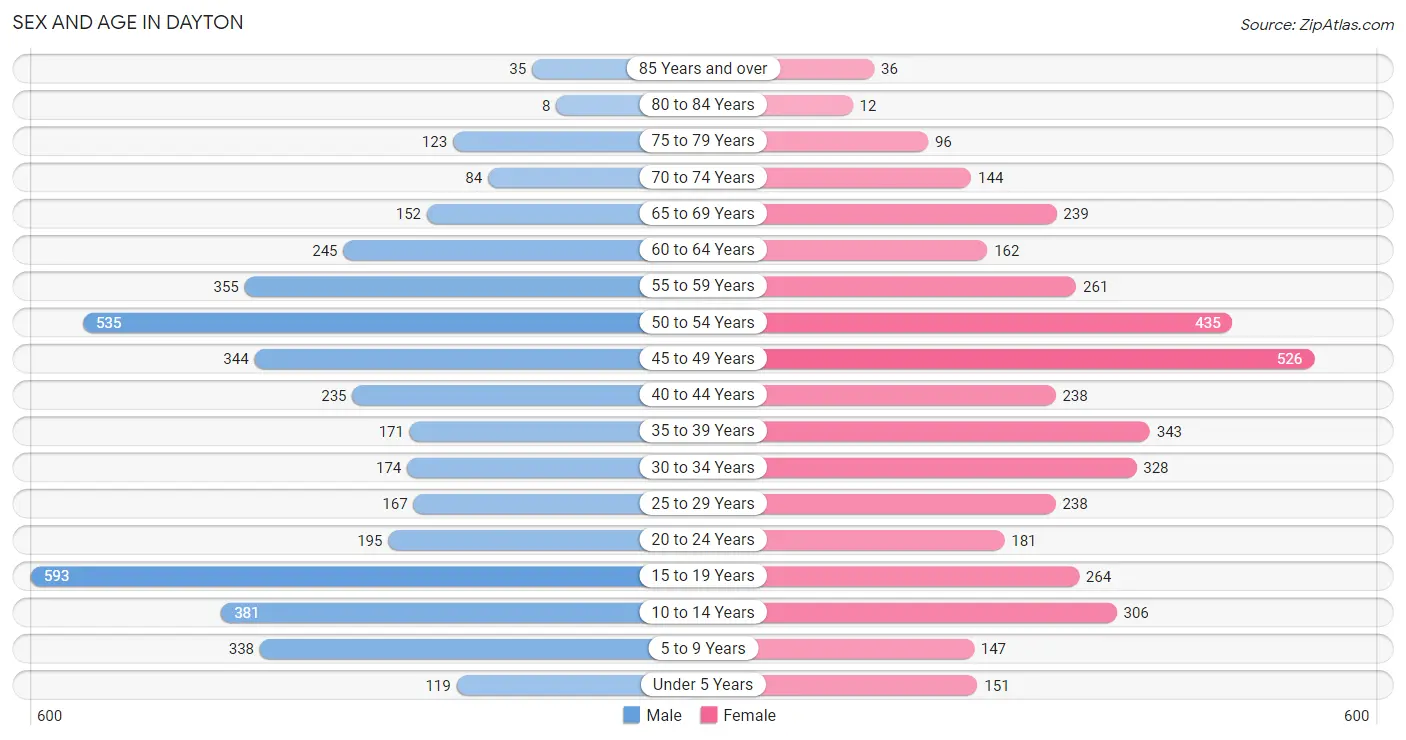
Sex and Age in Dayton
Sex and Age in Dayton
The most populous age groups in Dayton are 15 to 19 Years (593 | 13.9%) for men and 45 to 49 Years (526 | 12.8%) for women.
| Age Bracket | Male | Female |
| Under 5 Years | 119 (2.8%) | 151 (3.7%) |
| 5 to 9 Years | 338 (8.0%) | 147 (3.6%) |
| 10 to 14 Years | 381 (9.0%) | 306 (7.4%) |
| 15 to 19 Years | 593 (13.9%) | 264 (6.4%) |
| 20 to 24 Years | 195 (4.6%) | 181 (4.4%) |
| 25 to 29 Years | 167 (3.9%) | 238 (5.8%) |
| 30 to 34 Years | 174 (4.1%) | 328 (8.0%) |
| 35 to 39 Years | 171 (4.0%) | 343 (8.4%) |
| 40 to 44 Years | 235 (5.5%) | 238 (5.8%) |
| 45 to 49 Years | 344 (8.1%) | 526 (12.8%) |
| 50 to 54 Years | 535 (12.6%) | 435 (10.6%) |
| 55 to 59 Years | 355 (8.4%) | 261 (6.4%) |
| 60 to 64 Years | 245 (5.8%) | 162 (3.9%) |
| 65 to 69 Years | 152 (3.6%) | 239 (5.8%) |
| 70 to 74 Years | 84 (2.0%) | 144 (3.5%) |
| 75 to 79 Years | 123 (2.9%) | 96 (2.3%) |
| 80 to 84 Years | 8 (0.2%) | 12 (0.3%) |
| 85 Years and over | 35 (0.8%) | 36 (0.9%) |
| Total | 4,254 (100.0%) | 4,107 (100.0%) |
Families and Households in Dayton
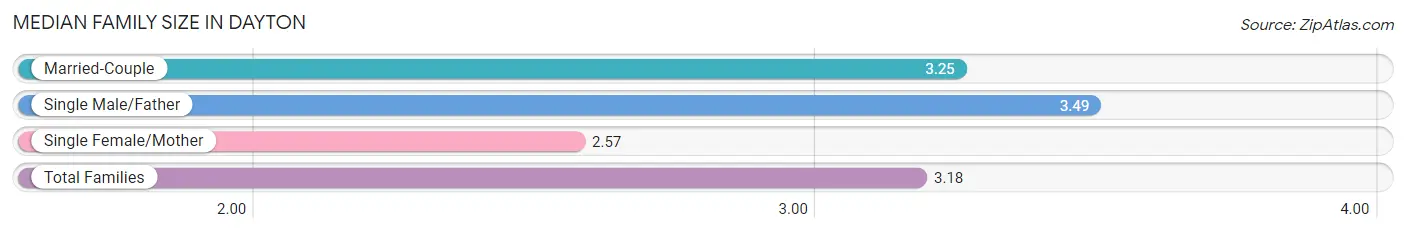
Median Family Size in Dayton
The median family size in Dayton is 3.18 persons per family, with single male/father families (41 | 1.6%) accounting for the largest median family size of 3.49 persons per family. On the other hand, single female/mother families (258 | 10.3%) represent the smallest median family size with 2.57 persons per family.
| Family Type | # Families | Family Size |
| Married-Couple | 2,207 (88.1%) | 3.25 |
| Single Male/Father | 41 (1.6%) | 3.49 |
| Single Female/Mother | 258 (10.3%) | 2.57 |
| Total Families | 2,506 (100.0%) | 3.18 |
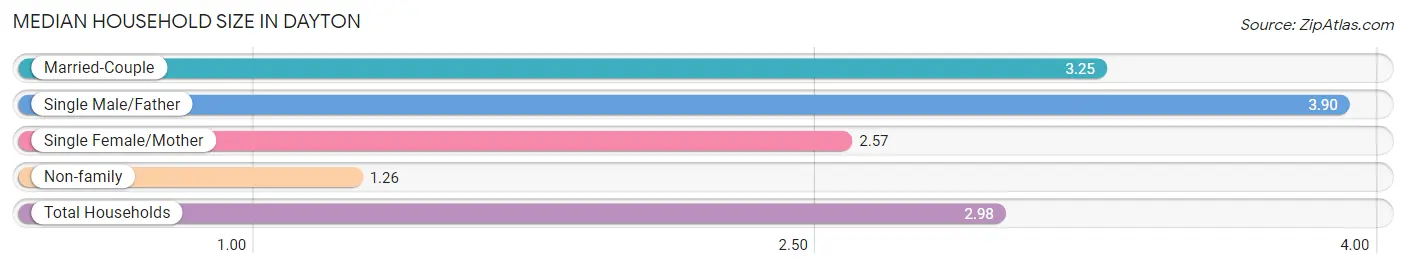
Median Household Size in Dayton
The median household size in Dayton is 2.98 persons per household, with single male/father households (41 | 1.5%) accounting for the largest median household size of 3.9 persons per household. non-family households (298 | 10.6%) represent the smallest median household size with 1.26 persons per household.
| Household Type | # Households | Household Size |
| Married-Couple | 2,207 (78.7%) | 3.25 |
| Single Male/Father | 41 (1.5%) | 3.90 |
| Single Female/Mother | 258 (9.2%) | 2.57 |
| Non-family | 298 (10.6%) | 1.26 |
| Total Households | 2,804 (100.0%) | 2.98 |
Household Size by Marriage Status in Dayton
Out of a total of 2,804 households in Dayton, 2,506 (89.4%) are family households, while 298 (10.6%) are nonfamily households. The most numerous type of family households are 4-person households, comprising 785, and the most common type of nonfamily households are 1-person households, comprising 239.
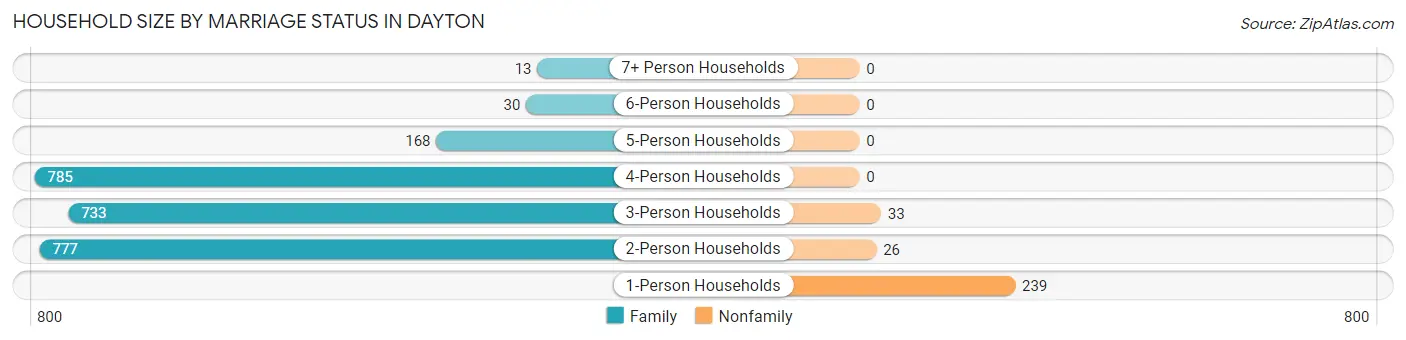
| Household Size | Family Households | Nonfamily Households |
| 1-Person Households | - | 239 (8.5%) |
| 2-Person Households | 777 (27.7%) | 26 (0.9%) |
| 3-Person Households | 733 (26.1%) | 33 (1.2%) |
| 4-Person Households | 785 (28.0%) | 0 (0.0%) |
| 5-Person Households | 168 (6.0%) | 0 (0.0%) |
| 6-Person Households | 30 (1.1%) | 0 (0.0%) |
| 7+ Person Households | 13 (0.5%) | 0 (0.0%) |
| Total | 2,506 (89.4%) | 298 (10.6%) |
Female Fertility in Dayton
Fertility by Age in Dayton
| Age Bracket | Women with Births | Births / 1,000 Women |
| 15 to 19 years | 0 (0.0%) | 0.0 |
| 20 to 34 years | 0 (0.0%) | 0.0 |
| 35 to 50 years | 0 (0.0%) | 0.0 |
| Total | 0 (0.0%) | 0.0 |
Fertility by Age by Marriage Status in Dayton
| Age Bracket | Married | Unmarried |
| 15 to 19 years | 0 (0.0%) | 0 (0.0%) |
| 20 to 34 years | 0 (0.0%) | 0 (0.0%) |
| 35 to 50 years | 0 (0.0%) | 0 (0.0%) |
| Total | 0 (0.0%) | 0 (0.0%) |
Fertility by Education in Dayton
| Educational Attainment | Women with Births | Births / 1,000 Women |
| Less than High School | 0 (0.0%) | 0.0 |
| High School Diploma | 0 (0.0%) | 0.0 |
| College or Associate's Degree | 0 (0.0%) | 0.0 |
| Bachelor's Degree | 0 (0.0%) | 0.0 |
| Graduate Degree | 0 (0.0%) | 0.0 |
| Total | 0 (0.0%) | 0.0 |
Fertility by Education by Marriage Status in Dayton
| Educational Attainment | Married | Unmarried |
| Less than High School | 0 (0.0%) | 0 (0.0%) |
| High School Diploma | 0 (0.0%) | 0 (0.0%) |
| College or Associate's Degree | 0 (0.0%) | 0 (0.0%) |
| Bachelor's Degree | 0 (0.0%) | 0 (0.0%) |
| Graduate Degree | 0 (0.0%) | 0 (0.0%) |
| Total | 0 (0.0%) | 0 (0.0%) |
Employment Characteristics in Dayton
Employment by Class of Employer in Dayton
Among the 4,192 employed individuals in Dayton, private company employees (2,994 | 71.4%), state government employees (329 | 7.9%), and local government employees (256 | 6.1%) make up the most common classes of employment.
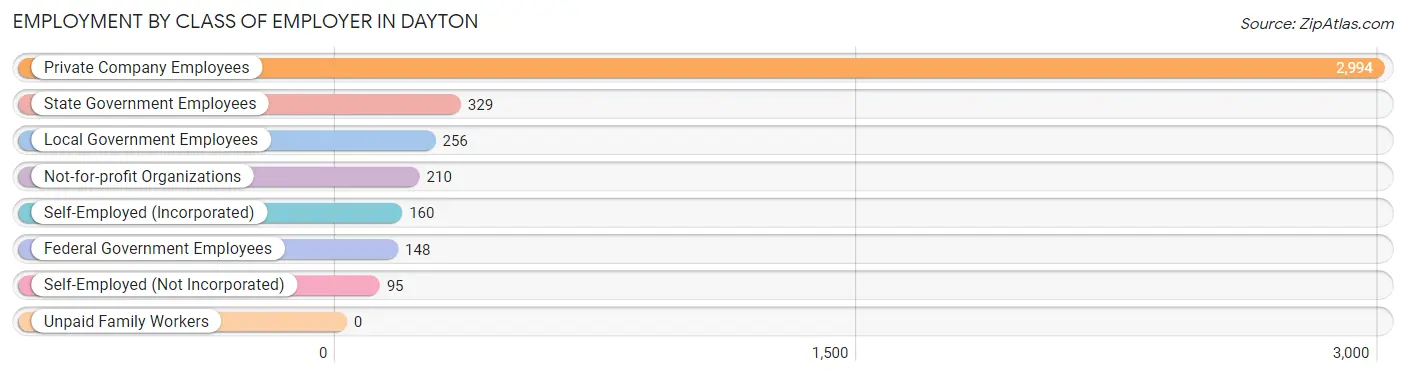
| Employer Class | # Employees | % Employees |
| Private Company Employees | 2,994 | 71.4% |
| Self-Employed (Incorporated) | 160 | 3.8% |
| Self-Employed (Not Incorporated) | 95 | 2.3% |
| Not-for-profit Organizations | 210 | 5.0% |
| Local Government Employees | 256 | 6.1% |
| State Government Employees | 329 | 7.9% |
| Federal Government Employees | 148 | 3.5% |
| Unpaid Family Workers | 0 | 0.0% |
| Total | 4,192 | 100.0% |
Employment Status by Age in Dayton
According to the labor force statistics for Dayton, out of the total population over 16 years of age (6,677), 69.1% or 4,614 individuals are in the labor force, with 7.7% or 355 of them unemployed. The age group with the highest labor force participation rate is 25 to 29 years, with 88.4% or 358 individuals in the labor force. Within the labor force, the 16 to 19 years age range has the highest percentage of unemployed individuals, with 48.9% or 133 of them being unemployed.
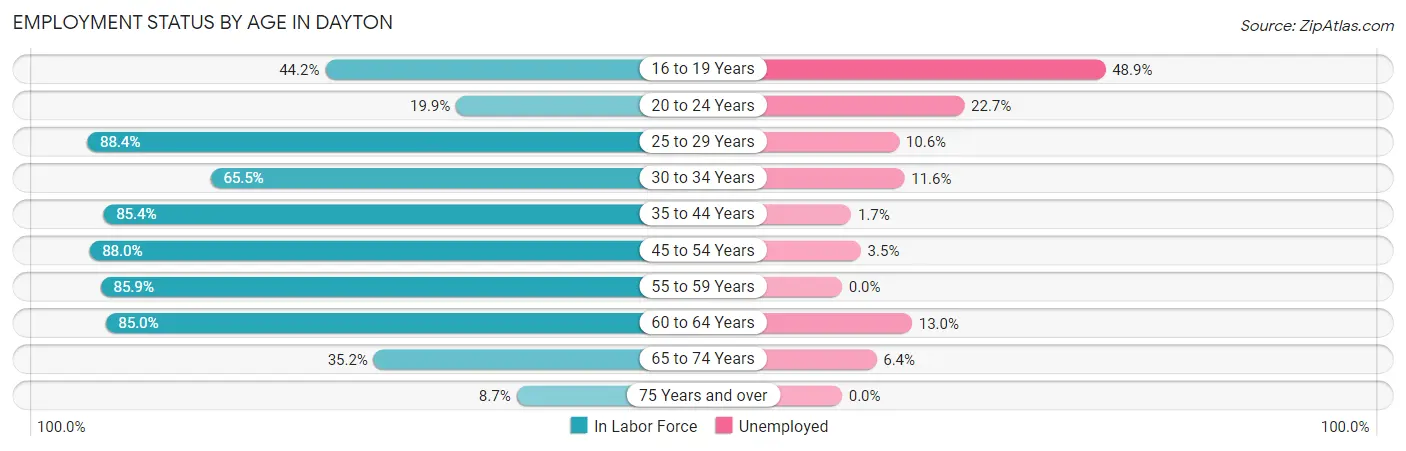
| Age Bracket | In Labor Force | Unemployed |
| 16 to 19 Years | 272 (44.2%) | 133 (48.9%) |
| 20 to 24 Years | 75 (19.9%) | 17 (22.7%) |
| 25 to 29 Years | 358 (88.4%) | 38 (10.6%) |
| 30 to 34 Years | 329 (65.5%) | 38 (11.6%) |
| 35 to 44 Years | 843 (85.4%) | 14 (1.7%) |
| 45 to 54 Years | 1,619 (88.0%) | 57 (3.5%) |
| 55 to 59 Years | 529 (85.9%) | 0 (0.0%) |
| 60 to 64 Years | 346 (85.0%) | 45 (13.0%) |
| 65 to 74 Years | 218 (35.2%) | 14 (6.4%) |
| 75 Years and over | 27 (8.7%) | 0 (0.0%) |
| Total | 4,614 (69.1%) | 355 (7.7%) |
Employment Status by Educational Attainment in Dayton
According to labor force statistics for Dayton, 84.6% of individuals (4,024) out of the total population between 25 and 64 years of age (4,757) are in the labor force, with 4.7% or 189 of them being unemployed. The group with the highest labor force participation rate are those with the educational attainment of college / associate degree, with 89.2% or 428 individuals in the labor force. Within the labor force, individuals with high school diploma education have the highest percentage of unemployment, with 6.0% or 22 of them being unemployed.
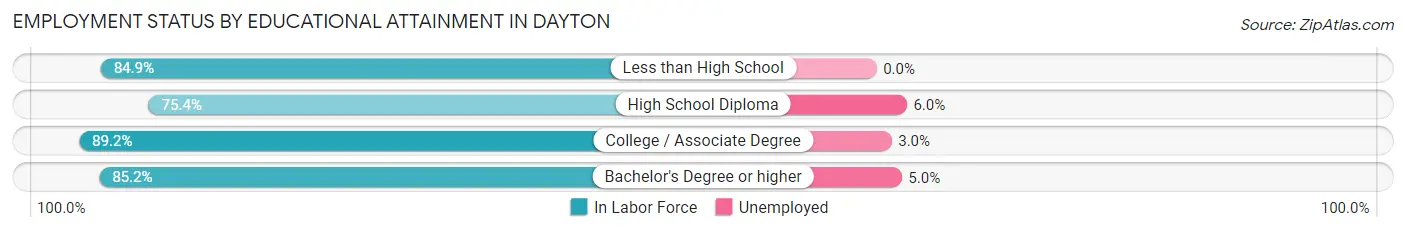
| Educational Attainment | In Labor Force | Unemployed |
| Less than High School | 79 (84.9%) | 0 (0.0%) |
| High School Diploma | 367 (75.4%) | 29 (6.0%) |
| College / Associate Degree | 428 (89.2%) | 14 (3.0%) |
| Bachelor's Degree or higher | 3,150 (85.2%) | 185 (5.0%) |
| Total | 4,024 (84.6%) | 224 (4.7%) |
Employment Occupations by Sex in Dayton
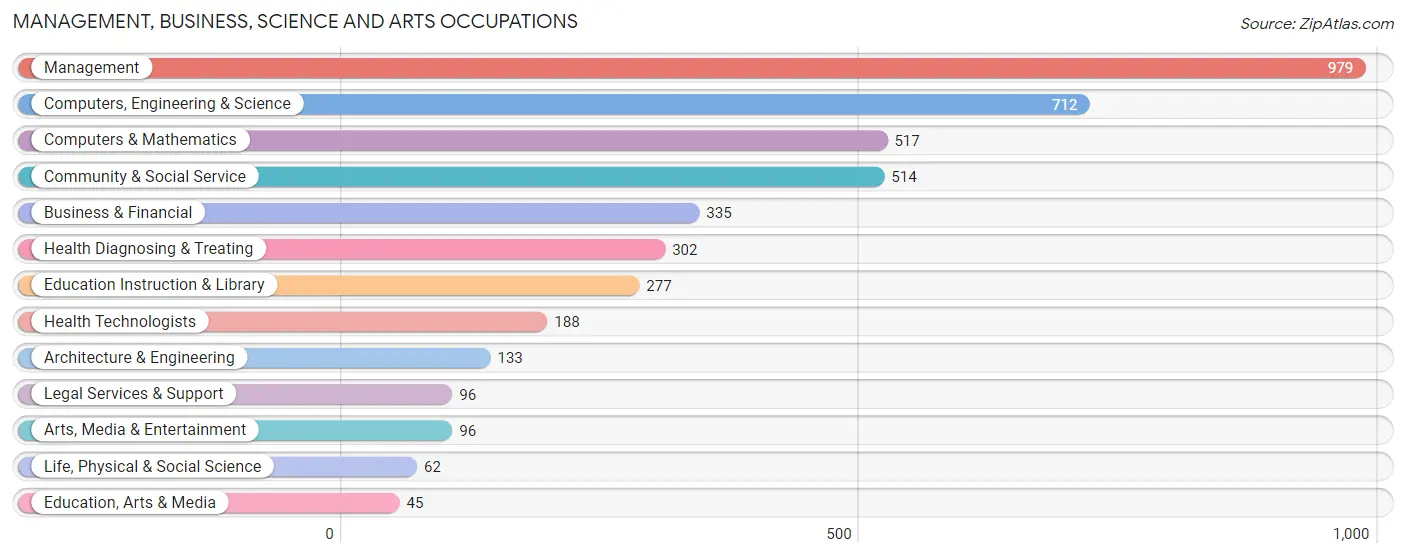
Management, Business, Science and Arts Occupations
The most common Management, Business, Science and Arts occupations in Dayton are Management (979 | 23.0%), Computers, Engineering & Science (712 | 16.7%), Computers & Mathematics (517 | 12.1%), Community & Social Service (514 | 12.1%), and Business & Financial (335 | 7.9%).
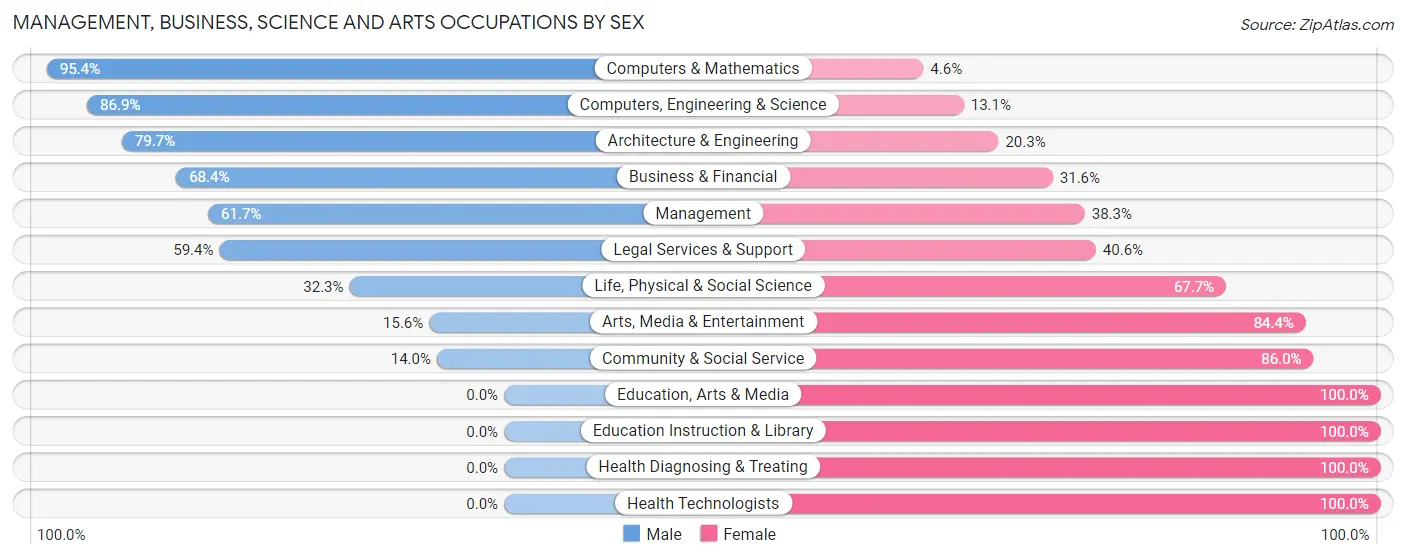
Management, Business, Science and Arts Occupations by Sex
Within the Management, Business, Science and Arts occupations in Dayton, the most male-oriented occupations are Computers & Mathematics (95.4%), Computers, Engineering & Science (86.9%), and Architecture & Engineering (79.7%), while the most female-oriented occupations are Education, Arts & Media (100.0%), Education Instruction & Library (100.0%), and Health Diagnosing & Treating (100.0%).
| Occupation | Male | Female |
| Management | 604 (61.7%) | 375 (38.3%) |
| Business & Financial | 229 (68.4%) | 106 (31.6%) |
| Computers, Engineering & Science | 619 (86.9%) | 93 (13.1%) |
| Computers & Mathematics | 493 (95.4%) | 24 (4.6%) |
| Architecture & Engineering | 106 (79.7%) | 27 (20.3%) |
| Life, Physical & Social Science | 20 (32.3%) | 42 (67.7%) |
| Community & Social Service | 72 (14.0%) | 442 (86.0%) |
| Education, Arts & Media | 0 (0.0%) | 45 (100.0%) |
| Legal Services & Support | 57 (59.4%) | 39 (40.6%) |
| Education Instruction & Library | 0 (0.0%) | 277 (100.0%) |
| Arts, Media & Entertainment | 15 (15.6%) | 81 (84.4%) |
| Health Diagnosing & Treating | 0 (0.0%) | 302 (100.0%) |
| Health Technologists | 0 (0.0%) | 188 (100.0%) |
| Total (Category) | 1,524 (53.6%) | 1,318 (46.4%) |
| Total (Overall) | 2,211 (51.9%) | 2,050 (48.1%) |
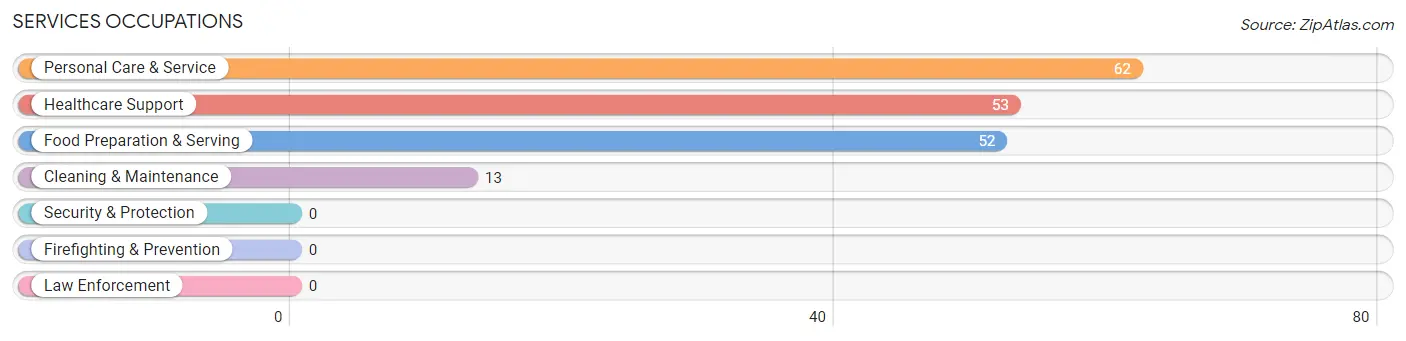
Services Occupations
The most common Services occupations in Dayton are Personal Care & Service (62 | 1.5%), Healthcare Support (53 | 1.2%), Food Preparation & Serving (52 | 1.2%), and Cleaning & Maintenance (13 | 0.3%).
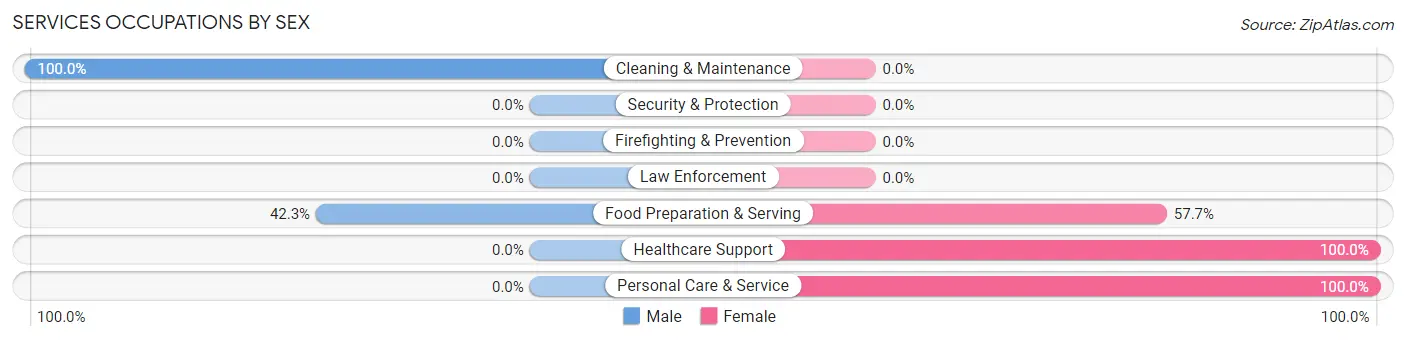
Services Occupations by Sex
Within the Services occupations in Dayton, the most male-oriented occupations are Cleaning & Maintenance (100.0%), and Food Preparation & Serving (42.3%), while the most female-oriented occupations are Healthcare Support (100.0%), Personal Care & Service (100.0%), and Food Preparation & Serving (57.7%).
| Occupation | Male | Female |
| Healthcare Support | 0 (0.0%) | 53 (100.0%) |
| Security & Protection | 0 (0.0%) | 0 (0.0%) |
| Firefighting & Prevention | 0 (0.0%) | 0 (0.0%) |
| Law Enforcement | 0 (0.0%) | 0 (0.0%) |
| Food Preparation & Serving | 22 (42.3%) | 30 (57.7%) |
| Cleaning & Maintenance | 13 (100.0%) | 0 (0.0%) |
| Personal Care & Service | 0 (0.0%) | 62 (100.0%) |
| Total (Category) | 35 (19.4%) | 145 (80.6%) |
| Total (Overall) | 2,211 (51.9%) | 2,050 (48.1%) |
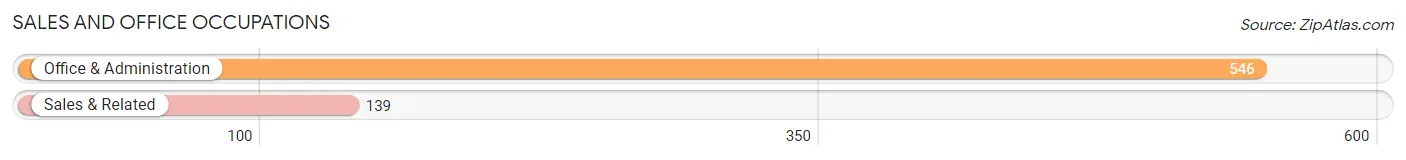
Sales and Office Occupations
The most common Sales and Office occupations in Dayton are Office & Administration (546 | 12.8%), and Sales & Related (139 | 3.3%).
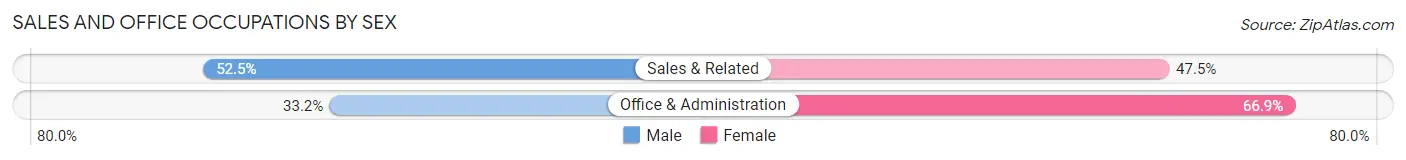
Sales and Office Occupations by Sex
| Occupation | Male | Female |
| Sales & Related | 73 (52.5%) | 66 (47.5%) |
| Office & Administration | 181 (33.2%) | 365 (66.8%) |
| Total (Category) | 254 (37.1%) | 431 (62.9%) |
| Total (Overall) | 2,211 (51.9%) | 2,050 (48.1%) |
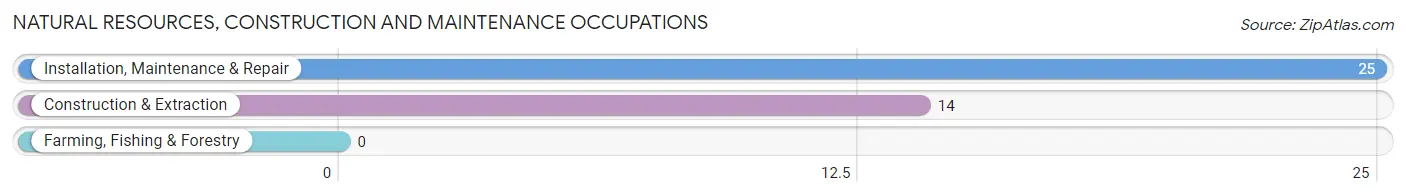
Natural Resources, Construction and Maintenance Occupations
The most common Natural Resources, Construction and Maintenance occupations in Dayton are Installation, Maintenance & Repair (25 | 0.6%), and Construction & Extraction (14 | 0.3%).
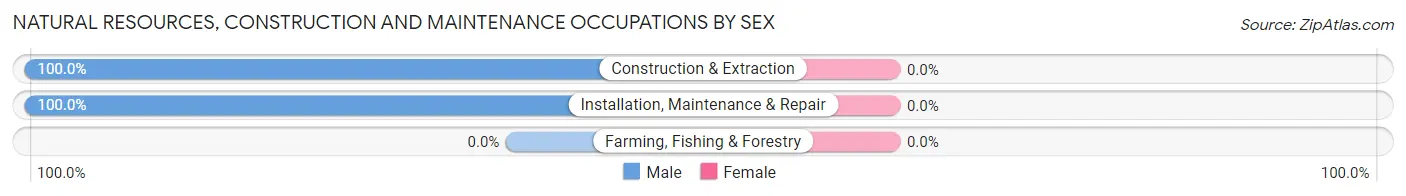
Natural Resources, Construction and Maintenance Occupations by Sex
| Occupation | Male | Female |
| Farming, Fishing & Forestry | 0 (0.0%) | 0 (0.0%) |
| Construction & Extraction | 14 (100.0%) | 0 (0.0%) |
| Installation, Maintenance & Repair | 25 (100.0%) | 0 (0.0%) |
| Total (Category) | 39 (100.0%) | 0 (0.0%) |
| Total (Overall) | 2,211 (51.9%) | 2,050 (48.1%) |
Production, Transportation and Moving Occupations
The most common Production, Transportation and Moving occupations in Dayton are Production (254 | 6.0%), Transportation (133 | 3.1%), and Material Moving (128 | 3.0%).
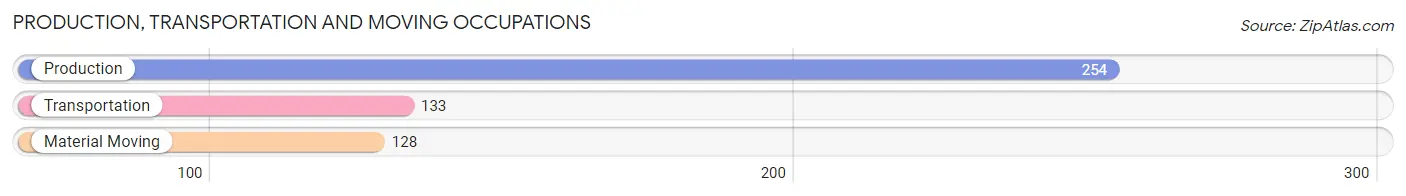
Production, Transportation and Moving Occupations by Sex
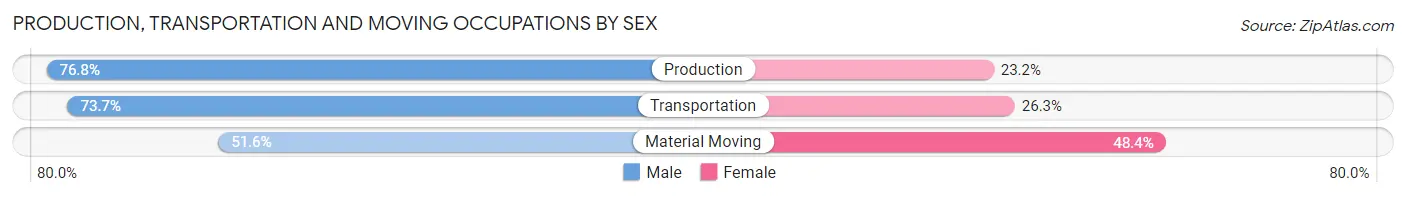
| Occupation | Male | Female |
| Production | 195 (76.8%) | 59 (23.2%) |
| Transportation | 98 (73.7%) | 35 (26.3%) |
| Material Moving | 66 (51.6%) | 62 (48.4%) |
| Total (Category) | 359 (69.7%) | 156 (30.3%) |
| Total (Overall) | 2,211 (51.9%) | 2,050 (48.1%) |
Employment Industries by Sex in Dayton
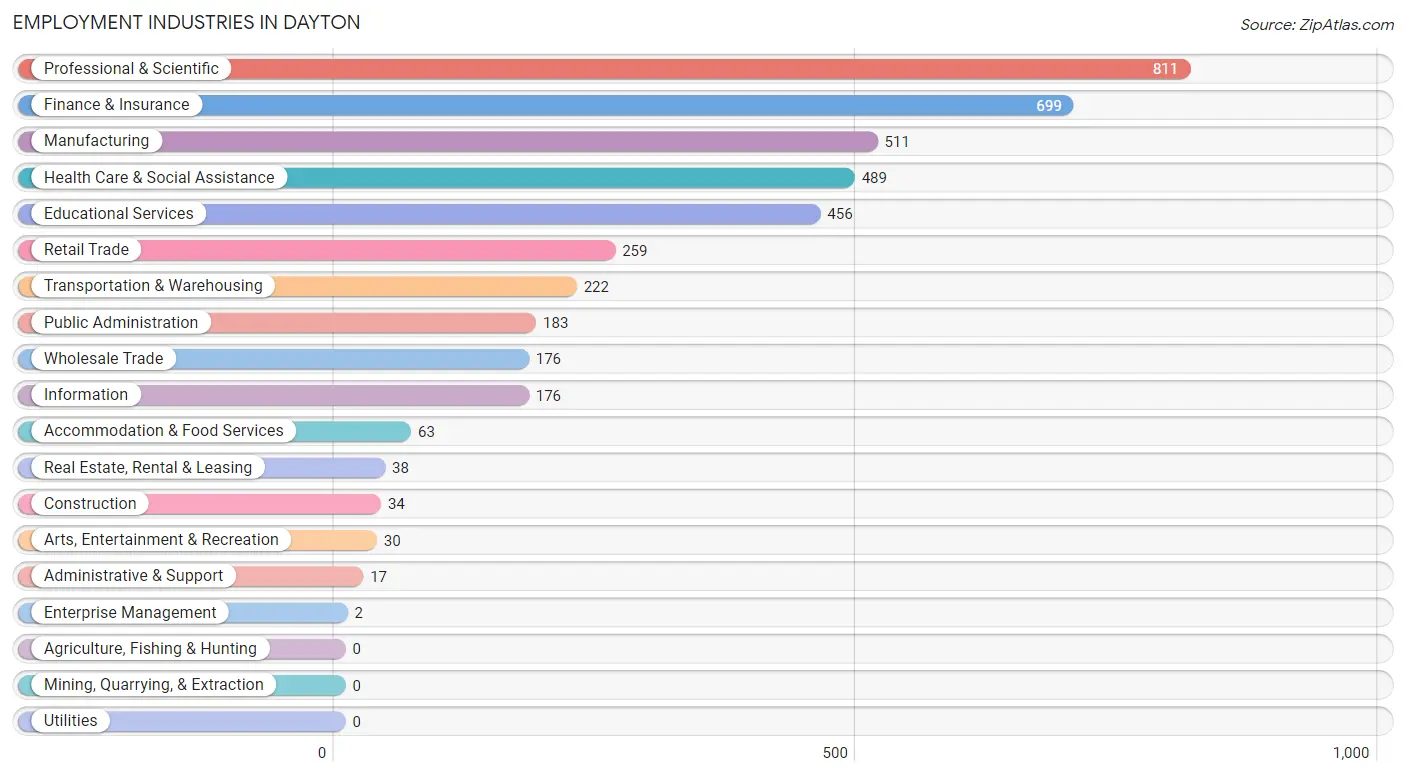
Employment Industries in Dayton
The major employment industries in Dayton include Professional & Scientific (811 | 19.0%), Finance & Insurance (699 | 16.4%), Manufacturing (511 | 12.0%), Health Care & Social Assistance (489 | 11.5%), and Educational Services (456 | 10.7%).
Employment Industries by Sex in Dayton
The Dayton industries that see more men than women are Construction (100.0%), Real Estate, Rental & Leasing (100.0%), and Enterprise Management (100.0%), whereas the industries that tend to have a higher number of women are Health Care & Social Assistance (100.0%), Arts, Entertainment & Recreation (100.0%), and Educational Services (75.4%).
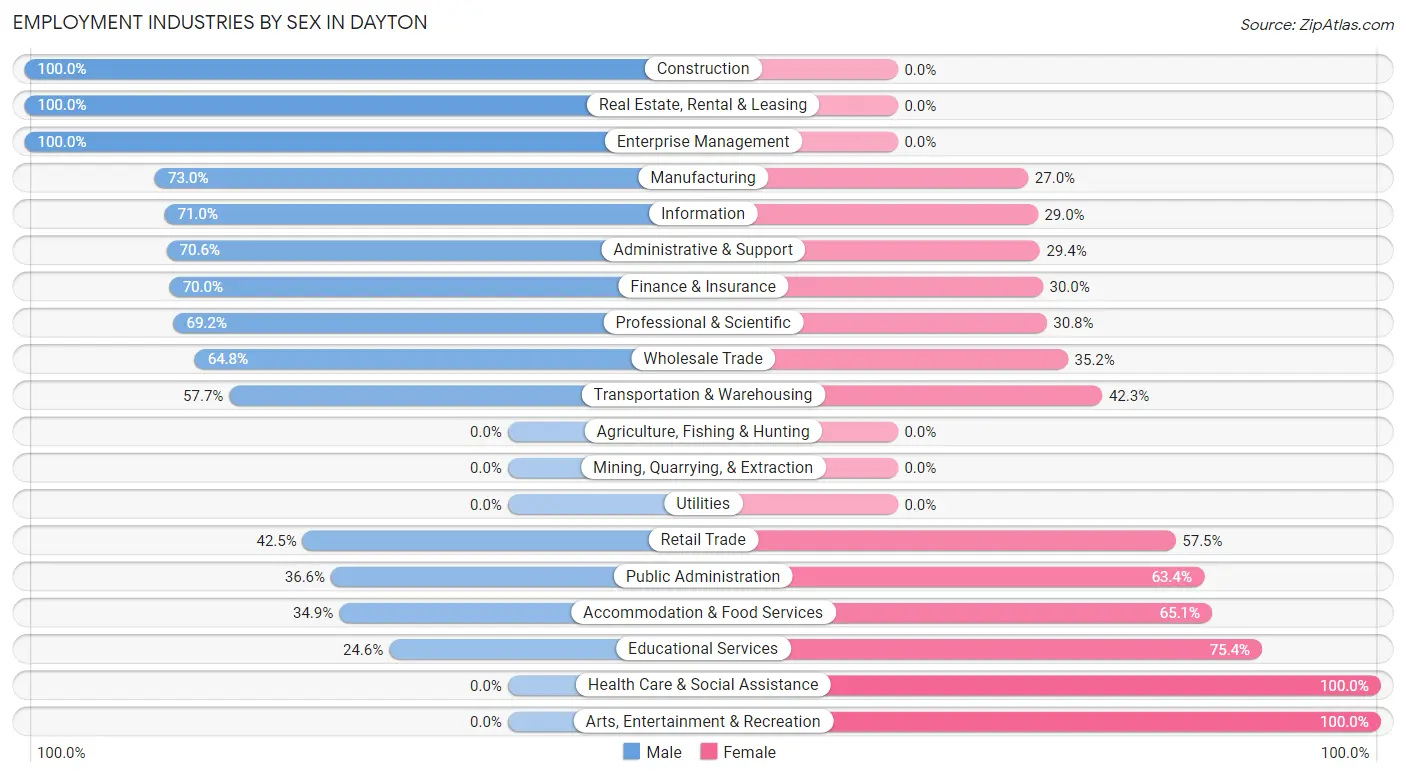
| Industry | Male | Female |
| Agriculture, Fishing & Hunting | 0 (0.0%) | 0 (0.0%) |
| Mining, Quarrying, & Extraction | 0 (0.0%) | 0 (0.0%) |
| Construction | 34 (100.0%) | 0 (0.0%) |
| Manufacturing | 373 (73.0%) | 138 (27.0%) |
| Wholesale Trade | 114 (64.8%) | 62 (35.2%) |
| Retail Trade | 110 (42.5%) | 149 (57.5%) |
| Transportation & Warehousing | 128 (57.7%) | 94 (42.3%) |
| Utilities | 0 (0.0%) | 0 (0.0%) |
| Information | 125 (71.0%) | 51 (29.0%) |
| Finance & Insurance | 489 (70.0%) | 210 (30.0%) |
| Real Estate, Rental & Leasing | 38 (100.0%) | 0 (0.0%) |
| Professional & Scientific | 561 (69.2%) | 250 (30.8%) |
| Enterprise Management | 2 (100.0%) | 0 (0.0%) |
| Administrative & Support | 12 (70.6%) | 5 (29.4%) |
| Educational Services | 112 (24.6%) | 344 (75.4%) |
| Health Care & Social Assistance | 0 (0.0%) | 489 (100.0%) |
| Arts, Entertainment & Recreation | 0 (0.0%) | 30 (100.0%) |
| Accommodation & Food Services | 22 (34.9%) | 41 (65.1%) |
| Public Administration | 67 (36.6%) | 116 (63.4%) |
| Total | 2,211 (51.9%) | 2,050 (48.1%) |
Education in Dayton
School Enrollment in Dayton
The most common levels of schooling among the 2,534 students in Dayton are high school (697 | 27.5%), college / undergraduate (620 | 24.5%), and middle school (544 | 21.5%).
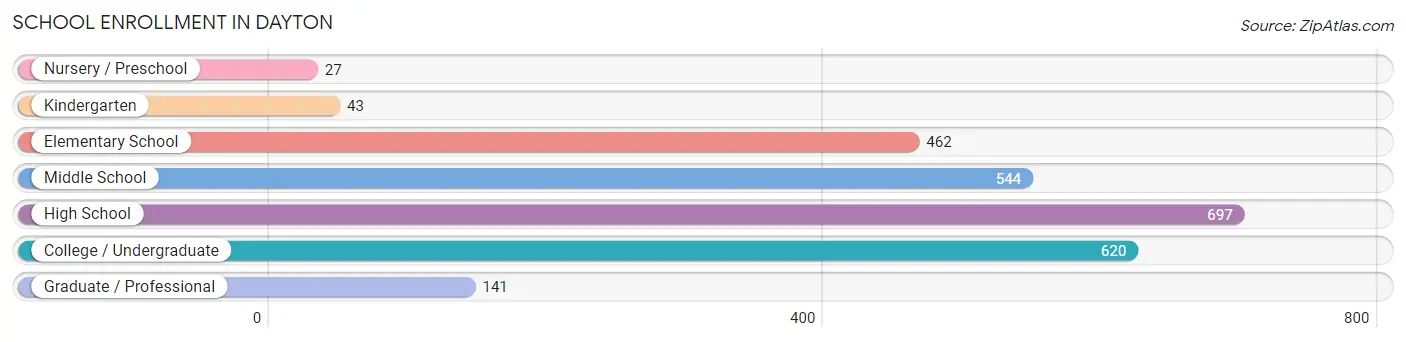
| School Level | # Students | % Students |
| Nursery / Preschool | 27 | 1.1% |
| Kindergarten | 43 | 1.7% |
| Elementary School | 462 | 18.2% |
| Middle School | 544 | 21.5% |
| High School | 697 | 27.5% |
| College / Undergraduate | 620 | 24.5% |
| Graduate / Professional | 141 | 5.6% |
| Total | 2,534 | 100.0% |
School Enrollment by Age by Funding Source in Dayton
Out of a total of 2,534 students who are enrolled in schools in Dayton, 167 (6.6%) attend a private institution, while the remaining 2,367 (93.4%) are enrolled in public schools. The age group of 20 to 24 year olds has the highest likelihood of being enrolled in private schools, with 61 (21.7% in the age bracket) enrolled. Conversely, the age group of 5 to 9 year old has the lowest likelihood of being enrolled in a private school, with 421 (100.0% in the age bracket) attending a public institution.
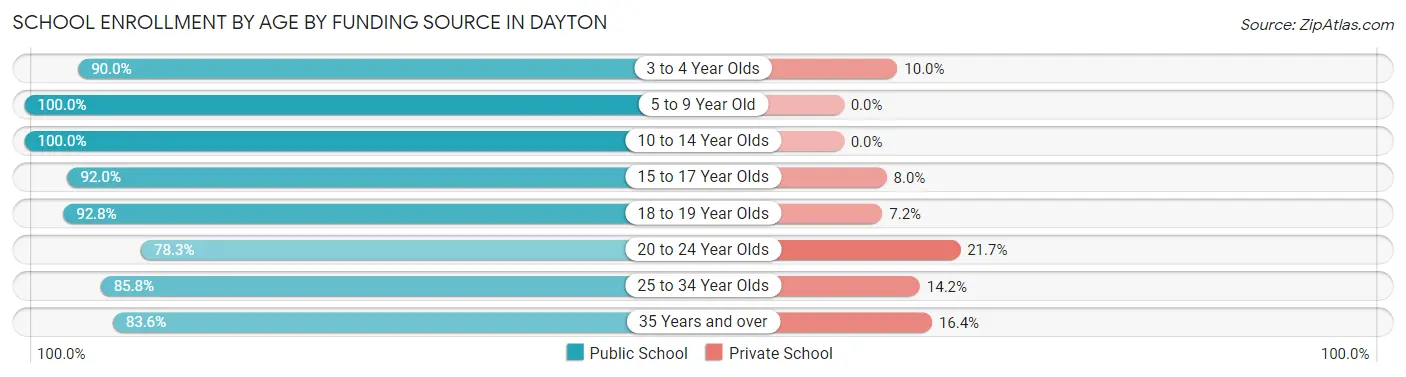
| Age Bracket | Public School | Private School |
| 3 to 4 Year Olds | 54 (90.0%) | 6 (10.0%) |
| 5 to 9 Year Old | 421 (100.0%) | 0 (0.0%) |
| 10 to 14 Year Olds | 687 (100.0%) | 0 (0.0%) |
| 15 to 17 Year Olds | 495 (92.0%) | 43 (8.0%) |
| 18 to 19 Year Olds | 296 (92.8%) | 23 (7.2%) |
| 20 to 24 Year Olds | 220 (78.3%) | 61 (21.7%) |
| 25 to 34 Year Olds | 133 (85.8%) | 22 (14.2%) |
| 35 Years and over | 61 (83.6%) | 12 (16.4%) |
| Total | 2,367 (93.4%) | 167 (6.6%) |
Educational Attainment by Field of Study in Dayton
Business (923 | 22.2%), engineering (799 | 19.3%), computers & mathematics (664 | 16.0%), physical & health sciences (332 | 8.0%), and social sciences (291 | 7.0%) are the most common fields of study among 4,150 individuals in Dayton who have obtained a bachelor's degree or higher.
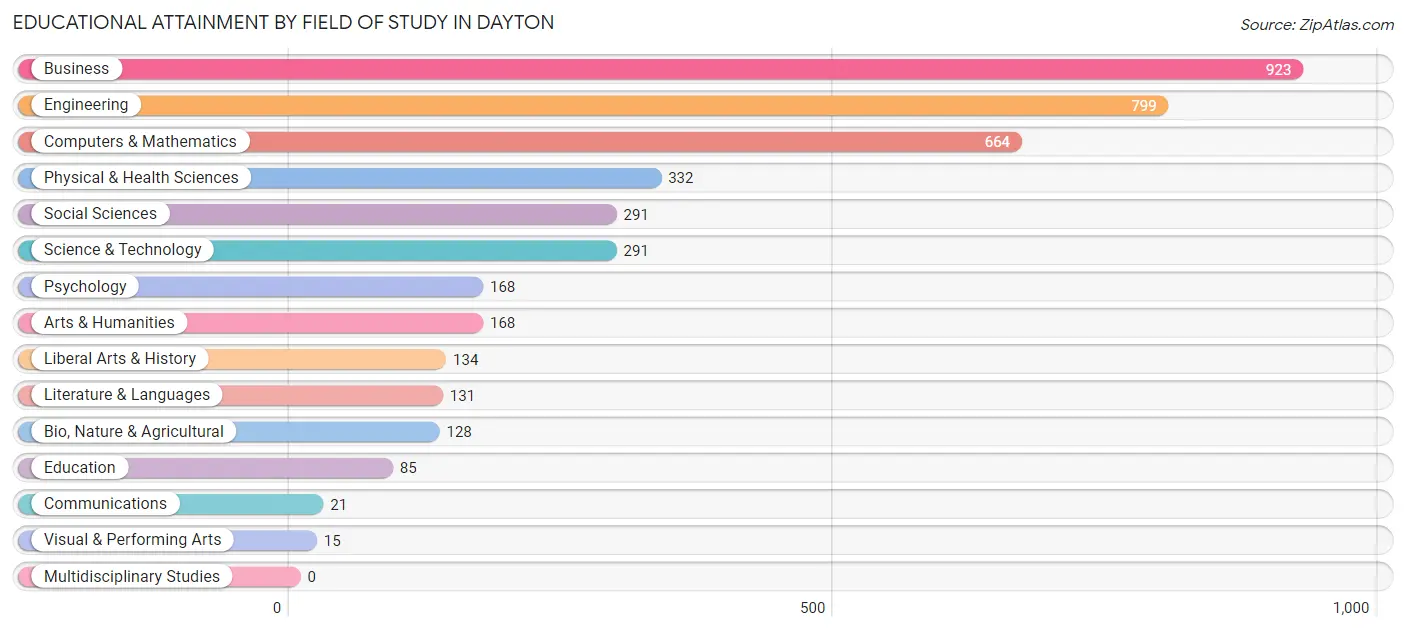
| Field of Study | # Graduates | % Graduates |
| Computers & Mathematics | 664 | 16.0% |
| Bio, Nature & Agricultural | 128 | 3.1% |
| Physical & Health Sciences | 332 | 8.0% |
| Psychology | 168 | 4.1% |
| Social Sciences | 291 | 7.0% |
| Engineering | 799 | 19.3% |
| Multidisciplinary Studies | 0 | 0.0% |
| Science & Technology | 291 | 7.0% |
| Business | 923 | 22.2% |
| Education | 85 | 2.1% |
| Literature & Languages | 131 | 3.2% |
| Liberal Arts & History | 134 | 3.2% |
| Visual & Performing Arts | 15 | 0.4% |
| Communications | 21 | 0.5% |
| Arts & Humanities | 168 | 4.1% |
| Total | 4,150 | 100.0% |
Transportation & Commute in Dayton
Vehicle Availability by Sex in Dayton
The most prevalent vehicle ownership categories in Dayton are males with 2 vehicles (1,285, accounting for 58.4%) and females with 2 vehicles (1,162, making up 64.5%).
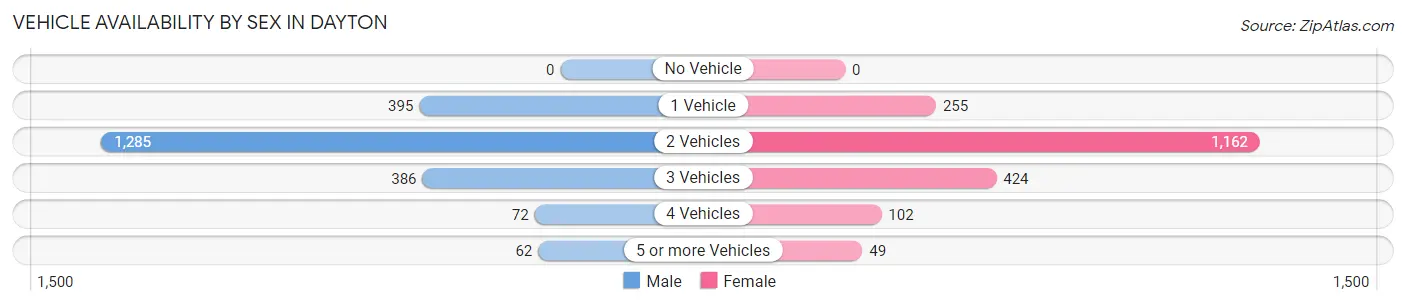
| Vehicles Available | Male | Female |
| No Vehicle | 0 (0.0%) | 0 (0.0%) |
| 1 Vehicle | 395 (17.9%) | 255 (12.8%) |
| 2 Vehicles | 1,285 (58.4%) | 1,162 (58.3%) |
| 3 Vehicles | 386 (17.5%) | 424 (21.3%) |
| 4 Vehicles | 72 (3.3%) | 102 (5.1%) |
| 5 or more Vehicles | 62 (2.8%) | 49 (2.5%) |
| Total | 2,200 (100.0%) | 1,992 (100.0%) |
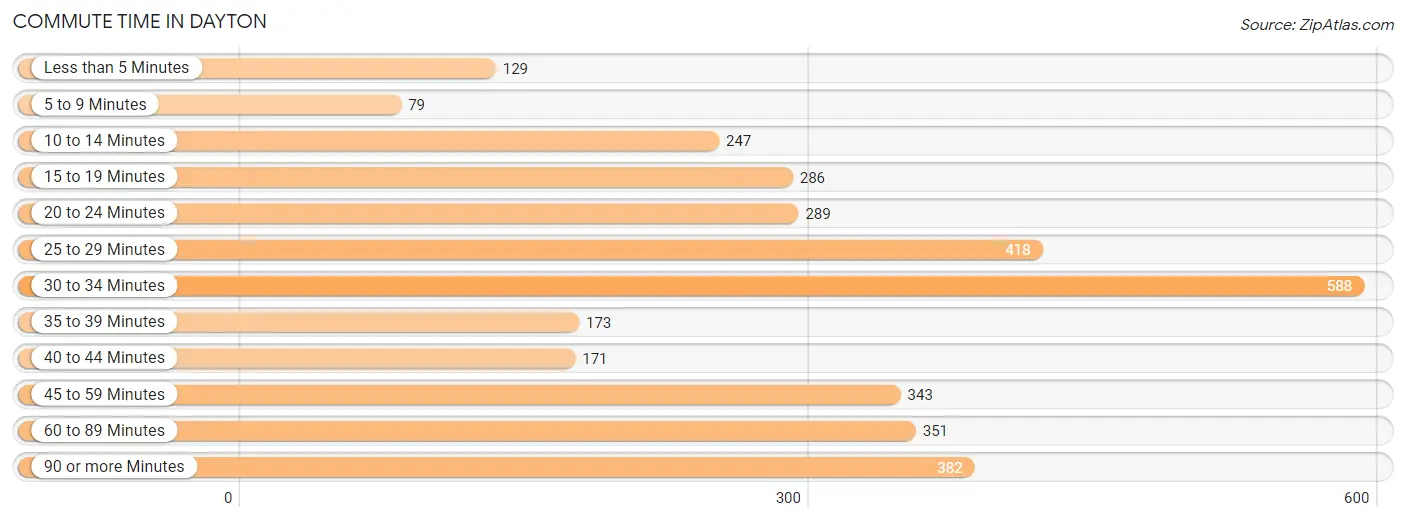
Commute Time in Dayton
The most frequently occuring commute durations in Dayton are 30 to 34 minutes (588 commuters, 17.0%), 25 to 29 minutes (418 commuters, 12.1%), and 90 or more minutes (382 commuters, 11.1%).
| Commute Time | # Commuters | % Commuters |
| Less than 5 Minutes | 129 | 3.7% |
| 5 to 9 Minutes | 79 | 2.3% |
| 10 to 14 Minutes | 247 | 7.1% |
| 15 to 19 Minutes | 286 | 8.3% |
| 20 to 24 Minutes | 289 | 8.4% |
| 25 to 29 Minutes | 418 | 12.1% |
| 30 to 34 Minutes | 588 | 17.0% |
| 35 to 39 Minutes | 173 | 5.0% |
| 40 to 44 Minutes | 171 | 5.0% |
| 45 to 59 Minutes | 343 | 9.9% |
| 60 to 89 Minutes | 351 | 10.2% |
| 90 or more Minutes | 382 | 11.1% |
Commute Time by Sex in Dayton
The most common commute times in Dayton are 90 or more minutes (294 commuters, 16.8%) for males and 30 to 34 minutes (377 commuters, 22.1%) for females.
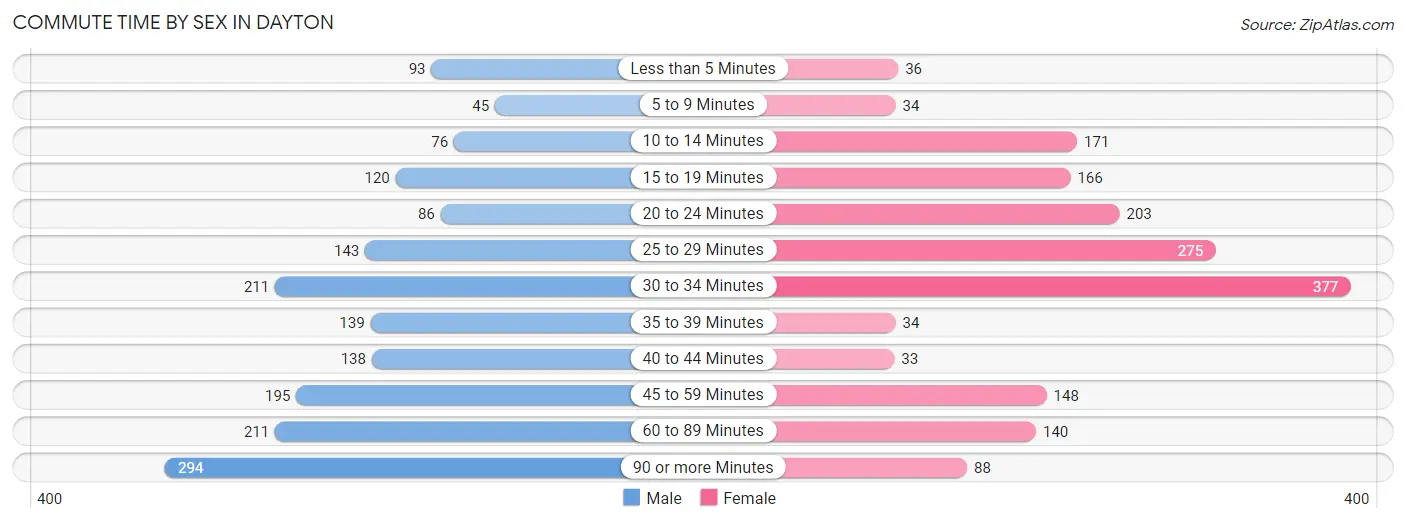
| Commute Time | Male | Female |
| Less than 5 Minutes | 93 (5.3%) | 36 (2.1%) |
| 5 to 9 Minutes | 45 (2.6%) | 34 (2.0%) |
| 10 to 14 Minutes | 76 (4.3%) | 171 (10.0%) |
| 15 to 19 Minutes | 120 (6.9%) | 166 (9.7%) |
| 20 to 24 Minutes | 86 (4.9%) | 203 (11.9%) |
| 25 to 29 Minutes | 143 (8.2%) | 275 (16.1%) |
| 30 to 34 Minutes | 211 (12.0%) | 377 (22.1%) |
| 35 to 39 Minutes | 139 (7.9%) | 34 (2.0%) |
| 40 to 44 Minutes | 138 (7.9%) | 33 (1.9%) |
| 45 to 59 Minutes | 195 (11.1%) | 148 (8.7%) |
| 60 to 89 Minutes | 211 (12.0%) | 140 (8.2%) |
| 90 or more Minutes | 294 (16.8%) | 88 (5.2%) |
Time of Departure to Work by Sex in Dayton
The most frequent times of departure to work in Dayton are 8:00 AM to 8:29 AM (333, 19.0%) for males and 8:00 AM to 8:29 AM (358, 21.0%) for females.
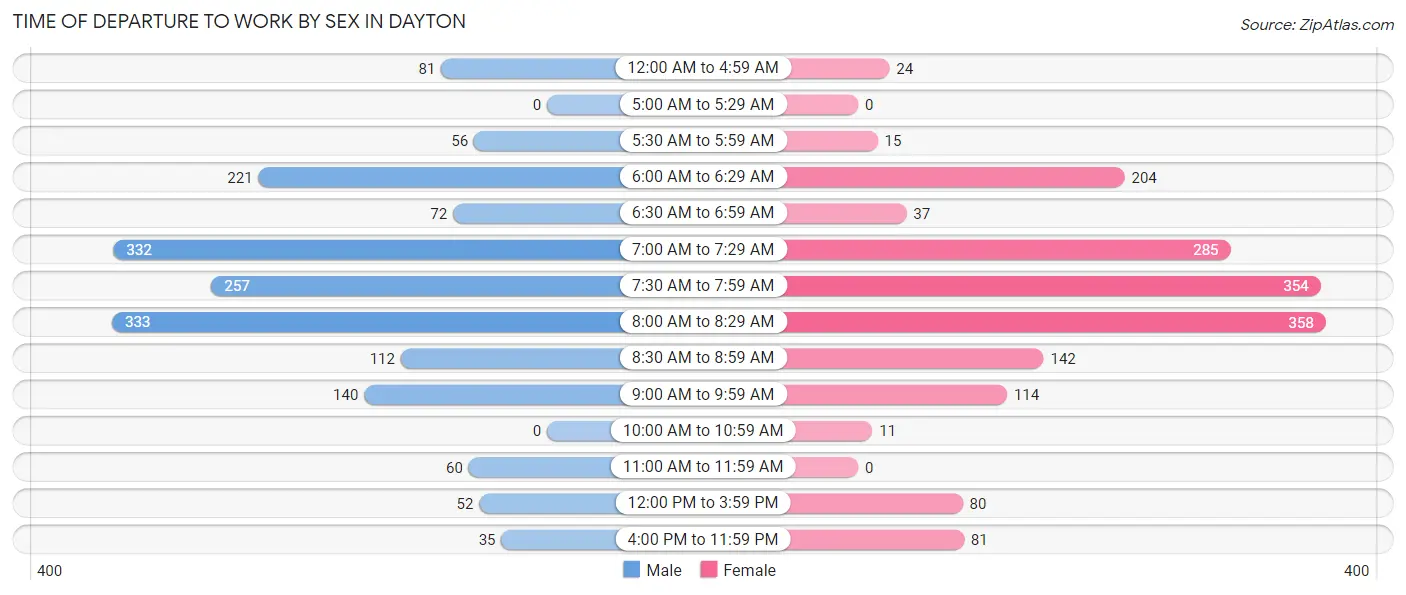
| Time of Departure | Male | Female |
| 12:00 AM to 4:59 AM | 81 (4.6%) | 24 (1.4%) |
| 5:00 AM to 5:29 AM | 0 (0.0%) | 0 (0.0%) |
| 5:30 AM to 5:59 AM | 56 (3.2%) | 15 (0.9%) |
| 6:00 AM to 6:29 AM | 221 (12.6%) | 204 (12.0%) |
| 6:30 AM to 6:59 AM | 72 (4.1%) | 37 (2.2%) |
| 7:00 AM to 7:29 AM | 332 (19.0%) | 285 (16.7%) |
| 7:30 AM to 7:59 AM | 257 (14.7%) | 354 (20.8%) |
| 8:00 AM to 8:29 AM | 333 (19.0%) | 358 (21.0%) |
| 8:30 AM to 8:59 AM | 112 (6.4%) | 142 (8.3%) |
| 9:00 AM to 9:59 AM | 140 (8.0%) | 114 (6.7%) |
| 10:00 AM to 10:59 AM | 0 (0.0%) | 11 (0.6%) |
| 11:00 AM to 11:59 AM | 60 (3.4%) | 0 (0.0%) |
| 12:00 PM to 3:59 PM | 52 (3.0%) | 80 (4.7%) |
| 4:00 PM to 11:59 PM | 35 (2.0%) | 81 (4.8%) |
| Total | 1,751 (100.0%) | 1,705 (100.0%) |
Housing Occupancy in Dayton
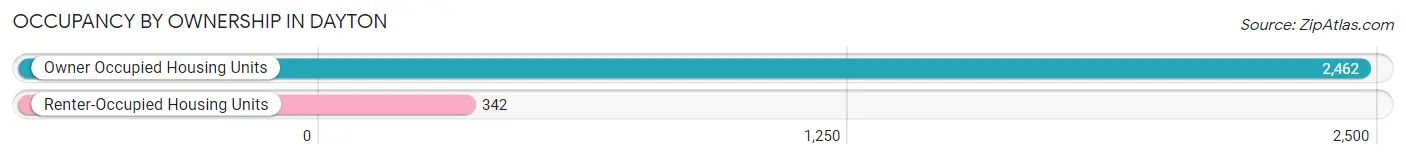
Occupancy by Ownership in Dayton
Of the total 2,804 dwellings in Dayton, owner-occupied units account for 2,462 (87.8%), while renter-occupied units make up 342 (12.2%).
| Occupancy | # Housing Units | % Housing Units |
| Owner Occupied Housing Units | 2,462 | 87.8% |
| Renter-Occupied Housing Units | 342 | 12.2% |
| Total Occupied Housing Units | 2,804 | 100.0% |
Occupancy by Household Size in Dayton
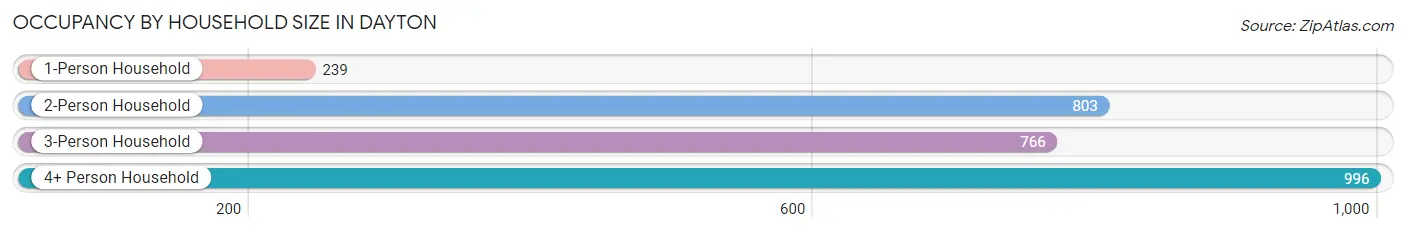
| Household Size | # Housing Units | % Housing Units |
| 1-Person Household | 239 | 8.5% |
| 2-Person Household | 803 | 28.6% |
| 3-Person Household | 766 | 27.3% |
| 4+ Person Household | 996 | 35.5% |
| Total Housing Units | 2,804 | 100.0% |
Occupancy by Ownership by Household Size in Dayton
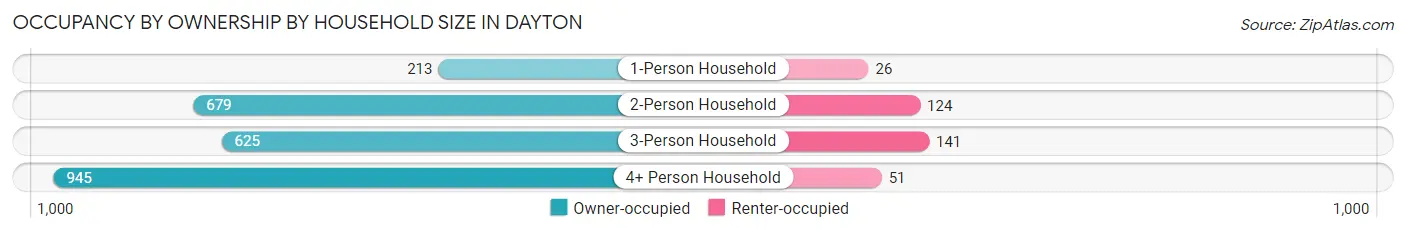
| Household Size | Owner-occupied | Renter-occupied |
| 1-Person Household | 213 (89.1%) | 26 (10.9%) |
| 2-Person Household | 679 (84.6%) | 124 (15.4%) |
| 3-Person Household | 625 (81.6%) | 141 (18.4%) |
| 4+ Person Household | 945 (94.9%) | 51 (5.1%) |
| Total Housing Units | 2,462 (87.8%) | 342 (12.2%) |
Occupancy by Educational Attainment in Dayton
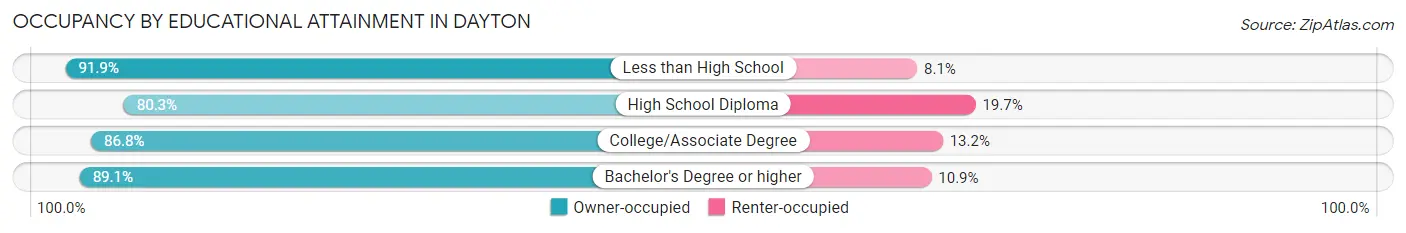
| Household Size | Owner-occupied | Renter-occupied |
| Less than High School | 68 (91.9%) | 6 (8.1%) |
| High School Diploma | 257 (80.3%) | 63 (19.7%) |
| College/Associate Degree | 355 (86.8%) | 54 (13.2%) |
| Bachelor's Degree or higher | 1,782 (89.1%) | 219 (10.9%) |
Occupancy by Age of Householder in Dayton
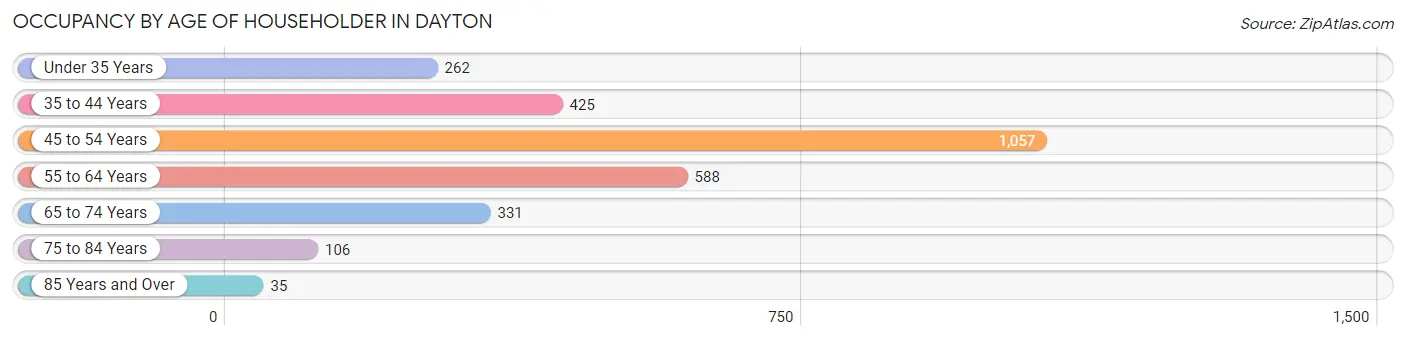
| Age Bracket | # Households | % Households |
| Under 35 Years | 262 | 9.3% |
| 35 to 44 Years | 425 | 15.2% |
| 45 to 54 Years | 1,057 | 37.7% |
| 55 to 64 Years | 588 | 21.0% |
| 65 to 74 Years | 331 | 11.8% |
| 75 to 84 Years | 106 | 3.8% |
| 85 Years and Over | 35 | 1.3% |
| Total | 2,804 | 100.0% |
Housing Finances in Dayton
Median Income by Occupancy in Dayton
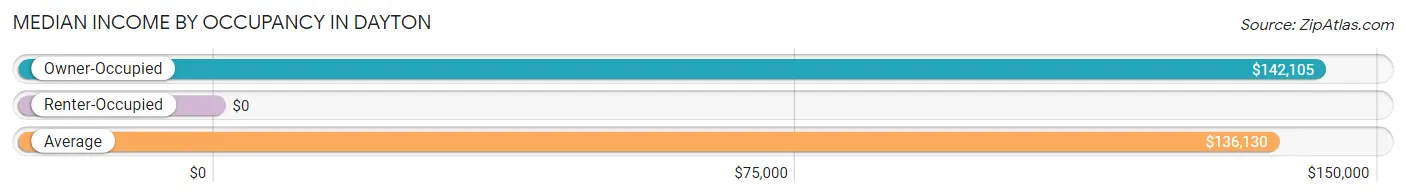
| Occupancy Type | # Households | Median Income |
| Owner-Occupied | 2,462 (87.8%) | $142,105 |
| Renter-Occupied | 342 (12.2%) | $0 |
| Average | 2,804 (100.0%) | $136,130 |
Occupancy by Householder Income Bracket in Dayton
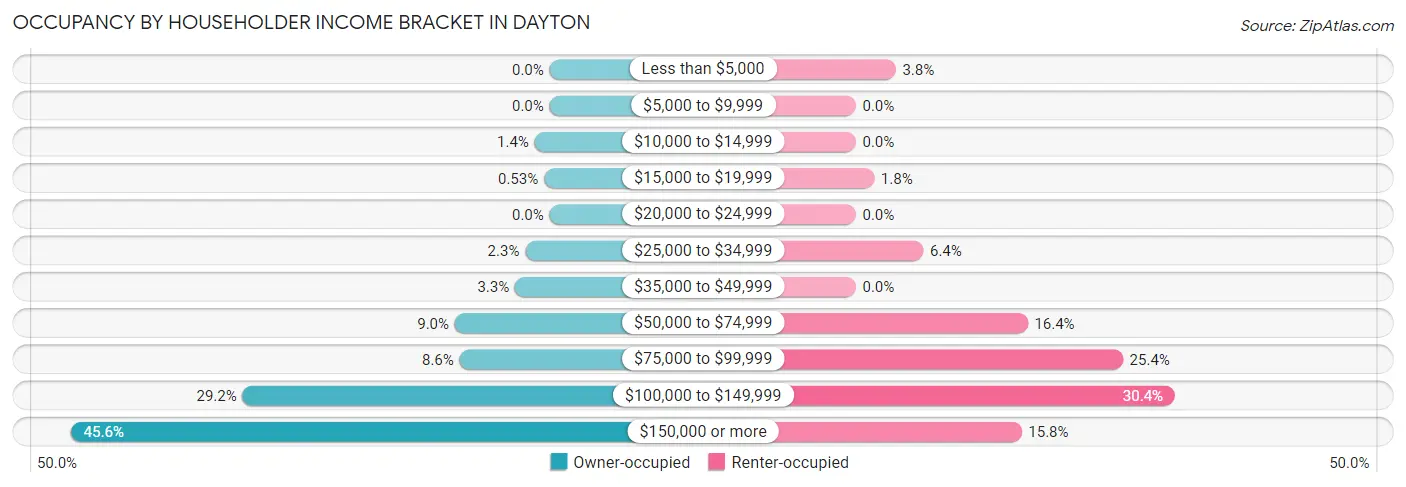
| Income Bracket | Owner-occupied | Renter-occupied |
| Less than $5,000 | 0 (0.0%) | 13 (3.8%) |
| $5,000 to $9,999 | 0 (0.0%) | 0 (0.0%) |
| $10,000 to $14,999 | 35 (1.4%) | 0 (0.0%) |
| $15,000 to $19,999 | 13 (0.5%) | 6 (1.8%) |
| $20,000 to $24,999 | 0 (0.0%) | 0 (0.0%) |
| $25,000 to $34,999 | 57 (2.3%) | 22 (6.4%) |
| $35,000 to $49,999 | 81 (3.3%) | 0 (0.0%) |
| $50,000 to $74,999 | 222 (9.0%) | 56 (16.4%) |
| $75,000 to $99,999 | 211 (8.6%) | 87 (25.4%) |
| $100,000 to $149,999 | 720 (29.2%) | 104 (30.4%) |
| $150,000 or more | 1,123 (45.6%) | 54 (15.8%) |
| Total | 2,462 (100.0%) | 342 (100.0%) |
Monthly Housing Cost Tiers in Dayton
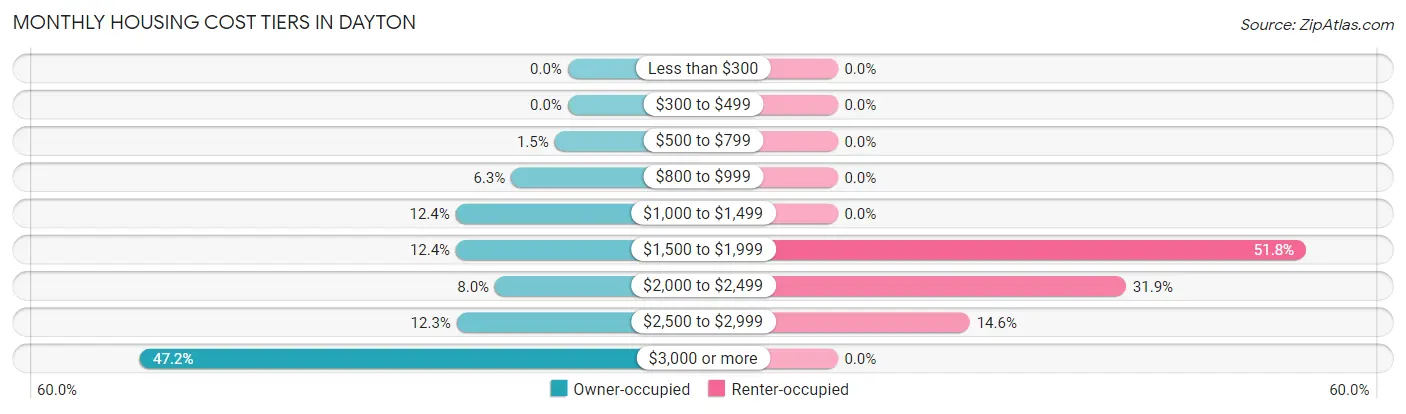
| Monthly Cost | Owner-occupied | Renter-occupied |
| Less than $300 | 0 (0.0%) | 0 (0.0%) |
| $300 to $499 | 0 (0.0%) | 0 (0.0%) |
| $500 to $799 | 36 (1.5%) | 0 (0.0%) |
| $800 to $999 | 154 (6.3%) | 0 (0.0%) |
| $1,000 to $1,499 | 305 (12.4%) | 0 (0.0%) |
| $1,500 to $1,999 | 304 (12.3%) | 177 (51.7%) |
| $2,000 to $2,499 | 198 (8.0%) | 109 (31.9%) |
| $2,500 to $2,999 | 302 (12.3%) | 50 (14.6%) |
| $3,000 or more | 1,163 (47.2%) | 0 (0.0%) |
| Total | 2,462 (100.0%) | 342 (100.0%) |
Physical Housing Characteristics in Dayton
Housing Structures in Dayton
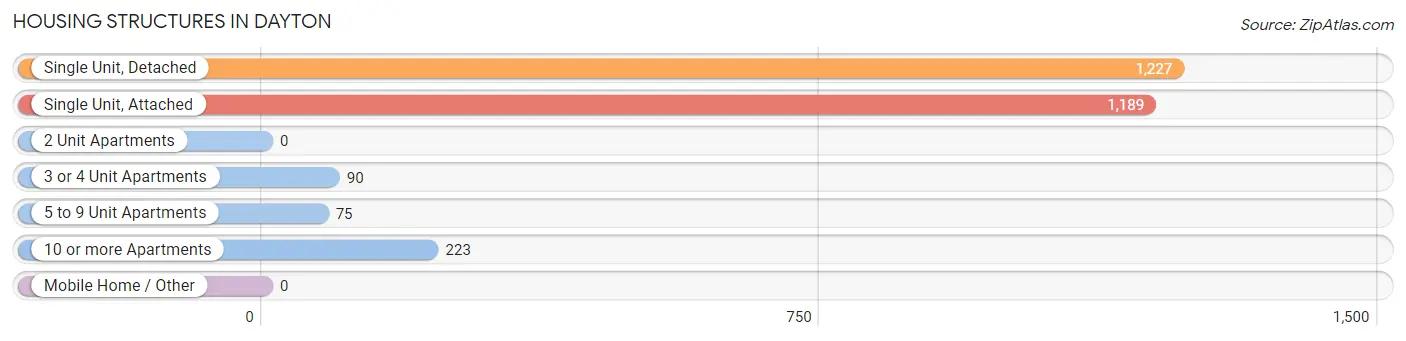
| Structure Type | # Housing Units | % Housing Units |
| Single Unit, Detached | 1,227 | 43.8% |
| Single Unit, Attached | 1,189 | 42.4% |
| 2 Unit Apartments | 0 | 0.0% |
| 3 or 4 Unit Apartments | 90 | 3.2% |
| 5 to 9 Unit Apartments | 75 | 2.7% |
| 10 or more Apartments | 223 | 8.0% |
| Mobile Home / Other | 0 | 0.0% |
| Total | 2,804 | 100.0% |
Housing Structures by Occupancy in Dayton
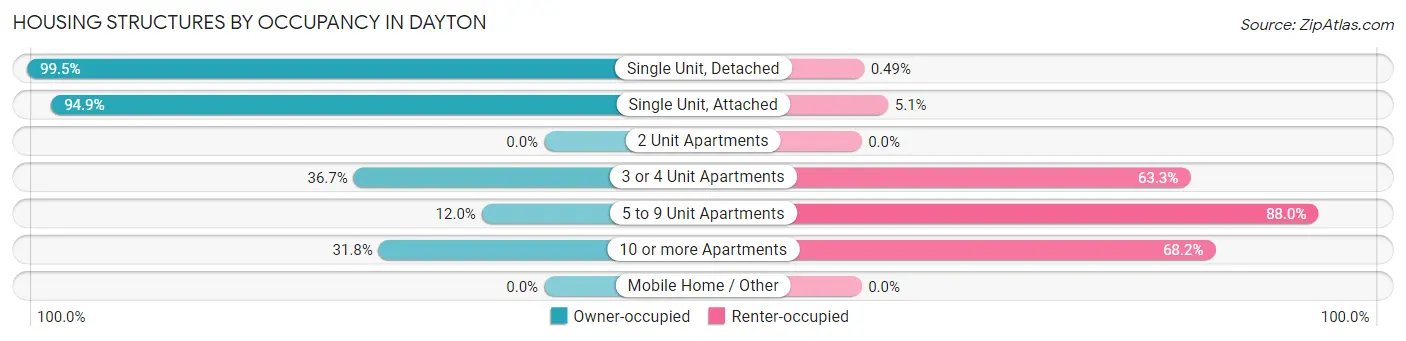
| Structure Type | Owner-occupied | Renter-occupied |
| Single Unit, Detached | 1,221 (99.5%) | 6 (0.5%) |
| Single Unit, Attached | 1,128 (94.9%) | 61 (5.1%) |
| 2 Unit Apartments | 0 (0.0%) | 0 (0.0%) |
| 3 or 4 Unit Apartments | 33 (36.7%) | 57 (63.3%) |
| 5 to 9 Unit Apartments | 9 (12.0%) | 66 (88.0%) |
| 10 or more Apartments | 71 (31.8%) | 152 (68.2%) |
| Mobile Home / Other | 0 (0.0%) | 0 (0.0%) |
| Total | 2,462 (87.8%) | 342 (12.2%) |
Housing Structures by Number of Rooms in Dayton
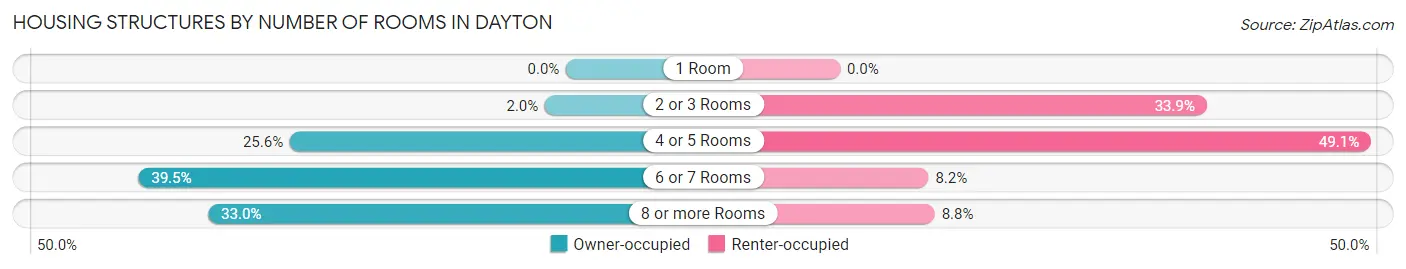
| Number of Rooms | Owner-occupied | Renter-occupied |
| 1 Room | 0 (0.0%) | 0 (0.0%) |
| 2 or 3 Rooms | 48 (1.9%) | 116 (33.9%) |
| 4 or 5 Rooms | 629 (25.6%) | 168 (49.1%) |
| 6 or 7 Rooms | 972 (39.5%) | 28 (8.2%) |
| 8 or more Rooms | 813 (33.0%) | 30 (8.8%) |
| Total | 2,462 (100.0%) | 342 (100.0%) |
Housing Structure by Heating Type in Dayton
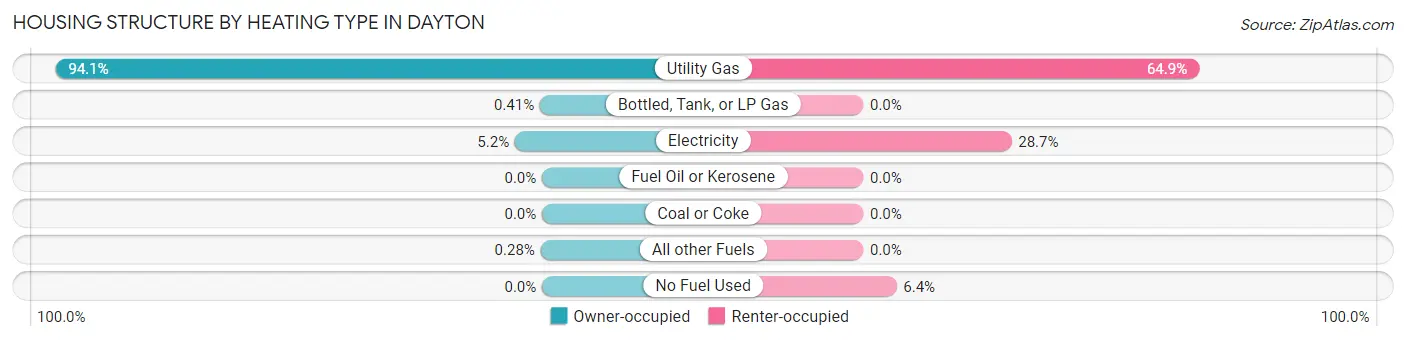
| Heating Type | Owner-occupied | Renter-occupied |
| Utility Gas | 2,316 (94.1%) | 222 (64.9%) |
| Bottled, Tank, or LP Gas | 10 (0.4%) | 0 (0.0%) |
| Electricity | 129 (5.2%) | 98 (28.6%) |
| Fuel Oil or Kerosene | 0 (0.0%) | 0 (0.0%) |
| Coal or Coke | 0 (0.0%) | 0 (0.0%) |
| All other Fuels | 7 (0.3%) | 0 (0.0%) |
| No Fuel Used | 0 (0.0%) | 22 (6.4%) |
| Total | 2,462 (100.0%) | 342 (100.0%) |
Household Vehicle Usage in Dayton
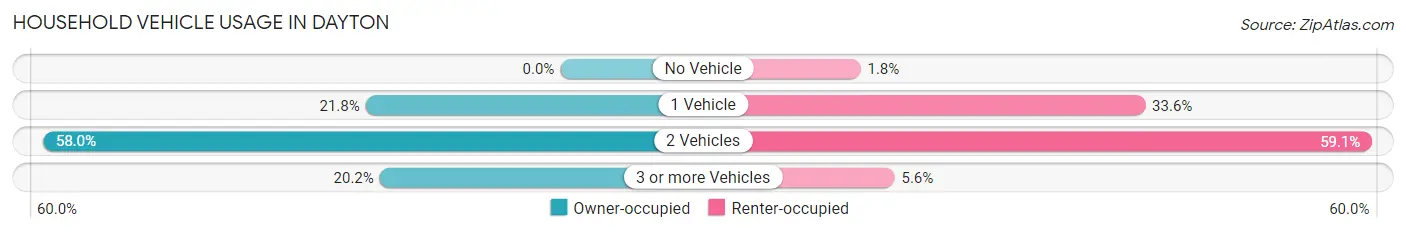
| Vehicles per Household | Owner-occupied | Renter-occupied |
| No Vehicle | 0 (0.0%) | 6 (1.8%) |
| 1 Vehicle | 537 (21.8%) | 115 (33.6%) |
| 2 Vehicles | 1,427 (58.0%) | 202 (59.1%) |
| 3 or more Vehicles | 498 (20.2%) | 19 (5.6%) |
| Total | 2,462 (100.0%) | 342 (100.0%) |
Real Estate & Mortgages in Dayton
Real Estate and Mortgage Overview in Dayton
| Characteristic | Without Mortgage | With Mortgage |
| Housing Units | 595 | 1,867 |
| Median Property Value | $449,200 | $473,500 |
| Median Household Income | $119,366 | $894 |
| Monthly Housing Costs | $1,219 | $1,163 |
| Real Estate Taxes | $9,363 | $11 |
Property Value by Mortgage Status in Dayton
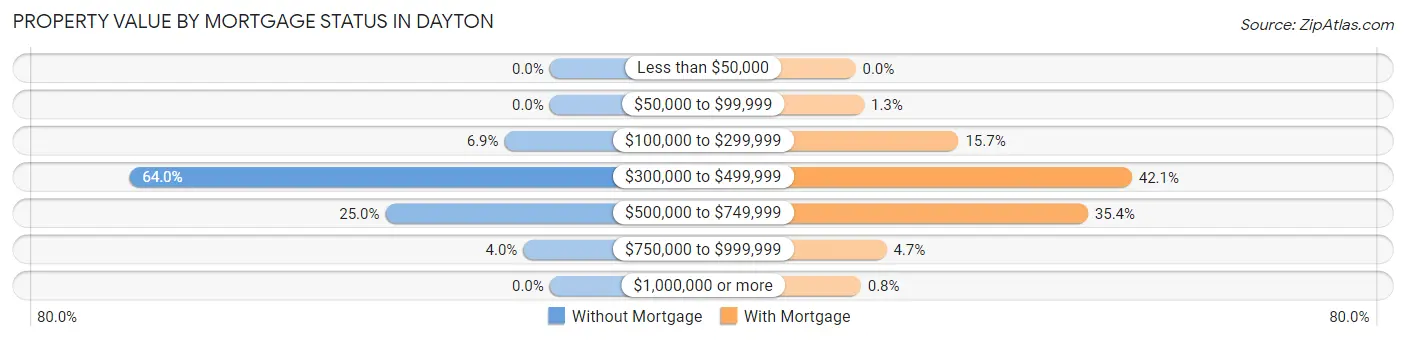
| Property Value | Without Mortgage | With Mortgage |
| Less than $50,000 | 0 (0.0%) | 0 (0.0%) |
| $50,000 to $99,999 | 0 (0.0%) | 24 (1.3%) |
| $100,000 to $299,999 | 41 (6.9%) | 293 (15.7%) |
| $300,000 to $499,999 | 381 (64.0%) | 786 (42.1%) |
| $500,000 to $749,999 | 149 (25.0%) | 661 (35.4%) |
| $750,000 to $999,999 | 24 (4.0%) | 88 (4.7%) |
| $1,000,000 or more | 0 (0.0%) | 15 (0.8%) |
| Total | 595 (100.0%) | 1,867 (100.0%) |
Household Income by Mortgage Status in Dayton
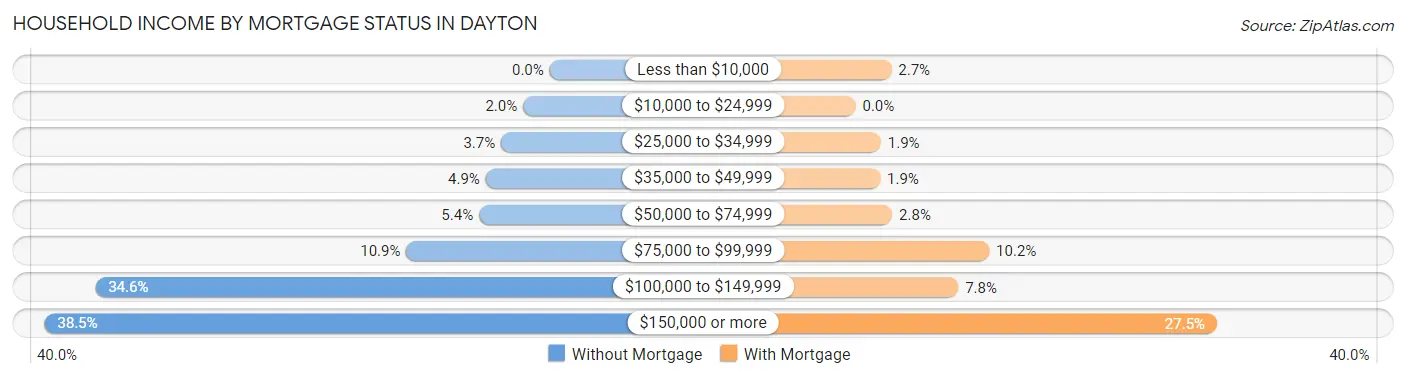
| Household Income | Without Mortgage | With Mortgage |
| Less than $10,000 | 0 (0.0%) | 51 (2.7%) |
| $10,000 to $24,999 | 12 (2.0%) | 0 (0.0%) |
| $25,000 to $34,999 | 22 (3.7%) | 36 (1.9%) |
| $35,000 to $49,999 | 29 (4.9%) | 35 (1.9%) |
| $50,000 to $74,999 | 32 (5.4%) | 52 (2.8%) |
| $75,000 to $99,999 | 65 (10.9%) | 190 (10.2%) |
| $100,000 to $149,999 | 206 (34.6%) | 146 (7.8%) |
| $150,000 or more | 229 (38.5%) | 514 (27.5%) |
| Total | 595 (100.0%) | 1,867 (100.0%) |
Property Value to Household Income Ratio in Dayton
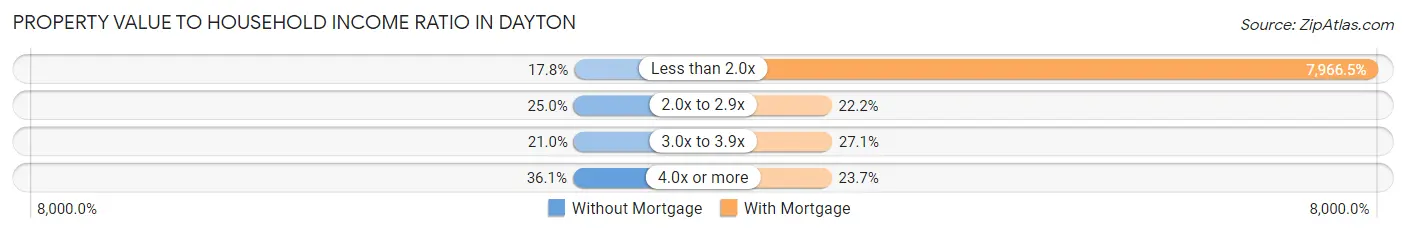
| Value-to-Income Ratio | Without Mortgage | With Mortgage |
| Less than 2.0x | 106 (17.8%) | 148,734 (7,966.5%) |
| 2.0x to 2.9x | 149 (25.0%) | 415 (22.2%) |
| 3.0x to 3.9x | 125 (21.0%) | 505 (27.1%) |
| 4.0x or more | 215 (36.1%) | 442 (23.7%) |
| Total | 595 (100.0%) | 1,867 (100.0%) |
Real Estate Taxes by Mortgage Status in Dayton
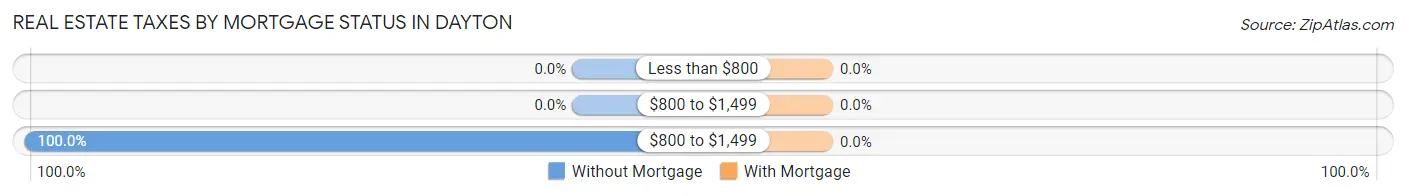
| Property Taxes | Without Mortgage | With Mortgage |
| Less than $800 | 0 (0.0%) | 0 (0.0%) |
| $800 to $1,499 | 0 (0.0%) | 0 (0.0%) |
| $800 to $1,499 | 595 (100.0%) | 0 (0.0%) |
| Total | 595 (100.0%) | 1,867 (100.0%) |
Health & Disability in Dayton
Health Insurance Coverage by Age in Dayton
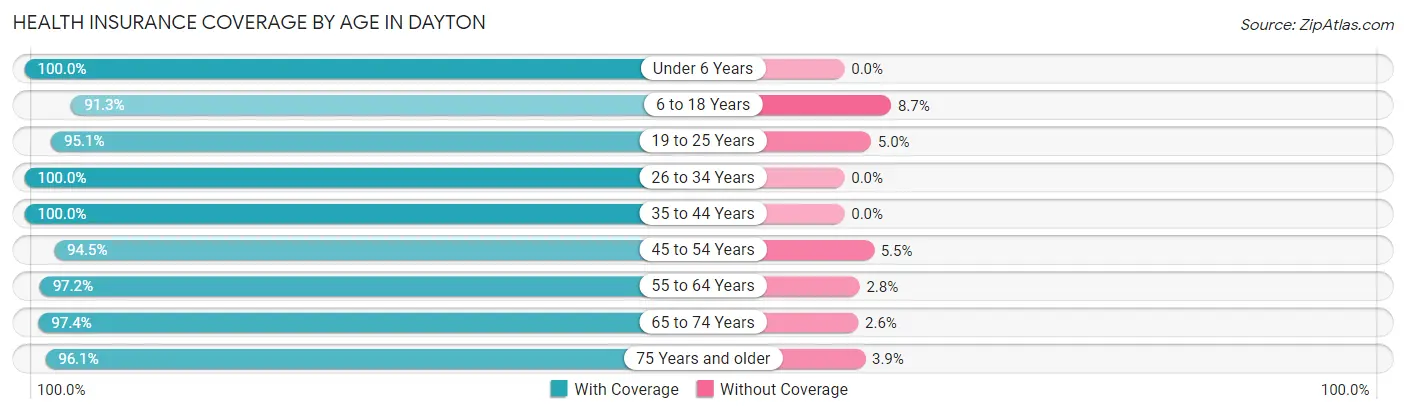
| Age Bracket | With Coverage | Without Coverage |
| Under 6 Years | 344 (100.0%) | 0 (0.0%) |
| 6 to 18 Years | 1,656 (91.3%) | 158 (8.7%) |
| 19 to 25 Years | 614 (95.1%) | 32 (5.0%) |
| 26 to 34 Years | 778 (100.0%) | 0 (0.0%) |
| 35 to 44 Years | 987 (100.0%) | 0 (0.0%) |
| 45 to 54 Years | 1,739 (94.5%) | 101 (5.5%) |
| 55 to 64 Years | 994 (97.2%) | 29 (2.8%) |
| 65 to 74 Years | 603 (97.4%) | 16 (2.6%) |
| 75 Years and older | 298 (96.1%) | 12 (3.9%) |
| Total | 8,013 (95.8%) | 348 (4.2%) |
Health Insurance Coverage by Citizenship Status in Dayton
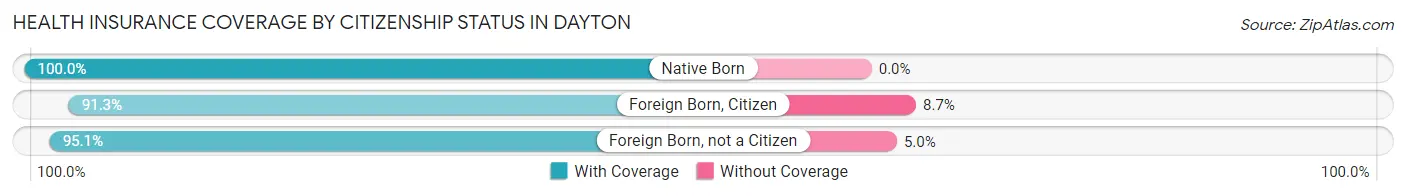
| Citizenship Status | With Coverage | Without Coverage |
| Native Born | 344 (100.0%) | 0 (0.0%) |
| Foreign Born, Citizen | 1,656 (91.3%) | 158 (8.7%) |
| Foreign Born, not a Citizen | 614 (95.1%) | 32 (5.0%) |
Health Insurance Coverage by Household Income in Dayton
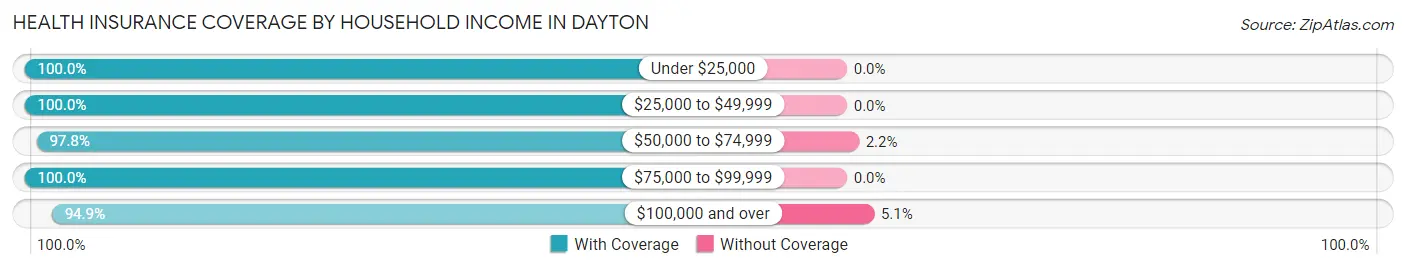
| Household Income | With Coverage | Without Coverage |
| Under $25,000 | 135 (100.0%) | 0 (0.0%) |
| $25,000 to $49,999 | 406 (100.0%) | 0 (0.0%) |
| $50,000 to $74,999 | 658 (97.8%) | 15 (2.2%) |
| $75,000 to $99,999 | 603 (100.0%) | 0 (0.0%) |
| $100,000 and over | 6,211 (94.9%) | 333 (5.1%) |
Public vs Private Health Insurance Coverage by Age in Dayton
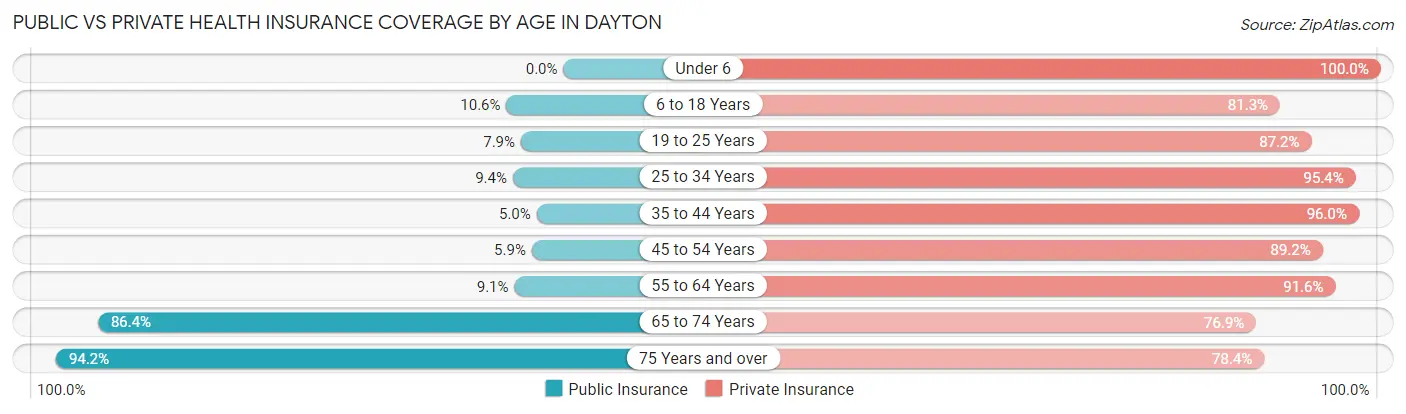
| Age Bracket | Public Insurance | Private Insurance |
| Under 6 | 0 (0.0%) | 344 (100.0%) |
| 6 to 18 Years | 192 (10.6%) | 1,475 (81.3%) |
| 19 to 25 Years | 51 (7.9%) | 563 (87.2%) |
| 25 to 34 Years | 73 (9.4%) | 742 (95.4%) |
| 35 to 44 Years | 49 (5.0%) | 947 (96.0%) |
| 45 to 54 Years | 108 (5.9%) | 1,642 (89.2%) |
| 55 to 64 Years | 93 (9.1%) | 937 (91.6%) |
| 65 to 74 Years | 535 (86.4%) | 476 (76.9%) |
| 75 Years and over | 292 (94.2%) | 243 (78.4%) |
| Total | 1,393 (16.7%) | 7,369 (88.1%) |
Disability Status by Sex by Age in Dayton
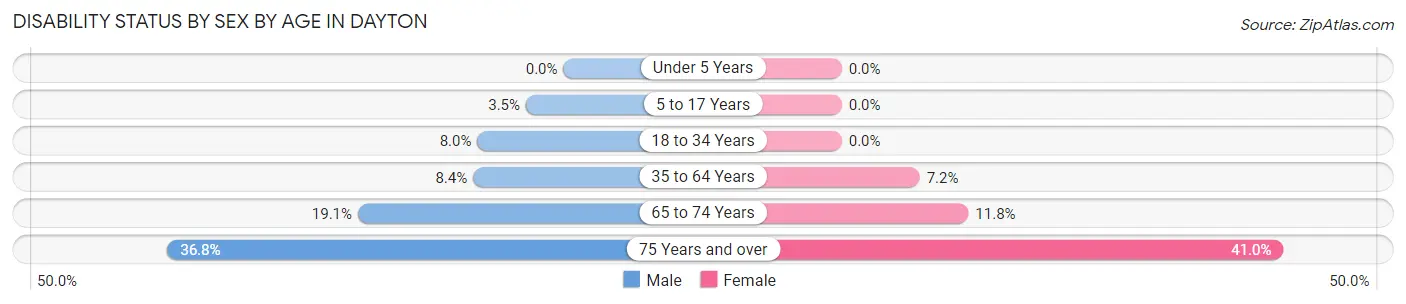
| Age Bracket | Male | Female |
| Under 5 Years | 0 (0.0%) | 0 (0.0%) |
| 5 to 17 Years | 39 (3.5%) | 0 (0.0%) |
| 18 to 34 Years | 58 (8.0%) | 0 (0.0%) |
| 35 to 64 Years | 158 (8.4%) | 142 (7.2%) |
| 65 to 74 Years | 45 (19.1%) | 45 (11.7%) |
| 75 Years and over | 61 (36.7%) | 59 (41.0%) |
Disability Class by Sex by Age in Dayton
Disability Class: Hearing Difficulty
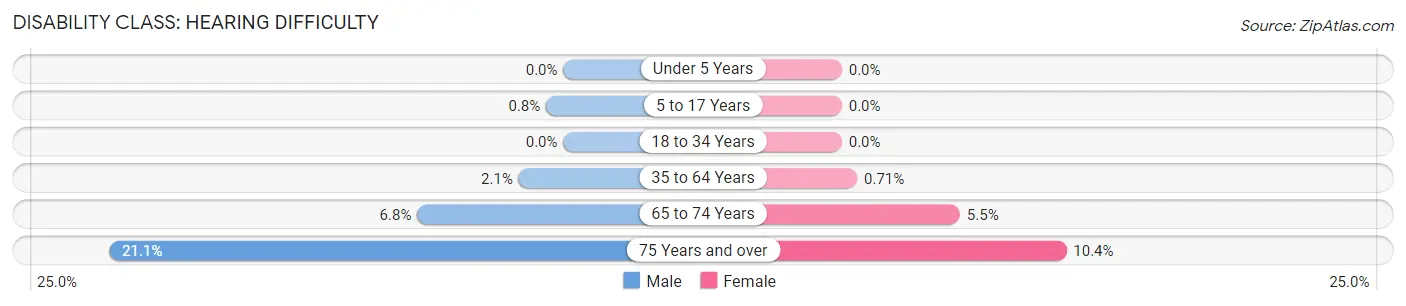
| Age Bracket | Male | Female |
| Under 5 Years | 0 (0.0%) | 0 (0.0%) |
| 5 to 17 Years | 9 (0.8%) | 0 (0.0%) |
| 18 to 34 Years | 0 (0.0%) | 0 (0.0%) |
| 35 to 64 Years | 39 (2.1%) | 14 (0.7%) |
| 65 to 74 Years | 16 (6.8%) | 21 (5.5%) |
| 75 Years and over | 35 (21.1%) | 15 (10.4%) |
Disability Class: Vision Difficulty
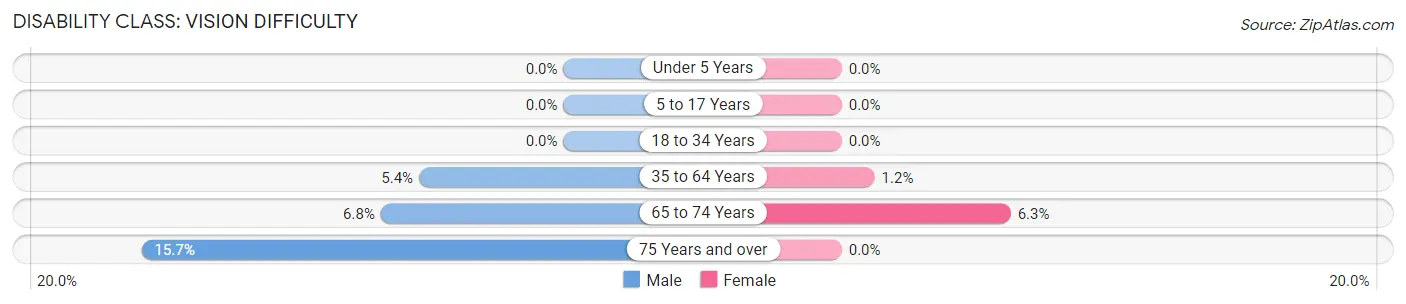
| Age Bracket | Male | Female |
| Under 5 Years | 0 (0.0%) | 0 (0.0%) |
| 5 to 17 Years | 0 (0.0%) | 0 (0.0%) |
| 18 to 34 Years | 0 (0.0%) | 0 (0.0%) |
| 35 to 64 Years | 101 (5.4%) | 24 (1.2%) |
| 65 to 74 Years | 16 (6.8%) | 24 (6.3%) |
| 75 Years and over | 26 (15.7%) | 0 (0.0%) |
Disability Class: Cognitive Difficulty
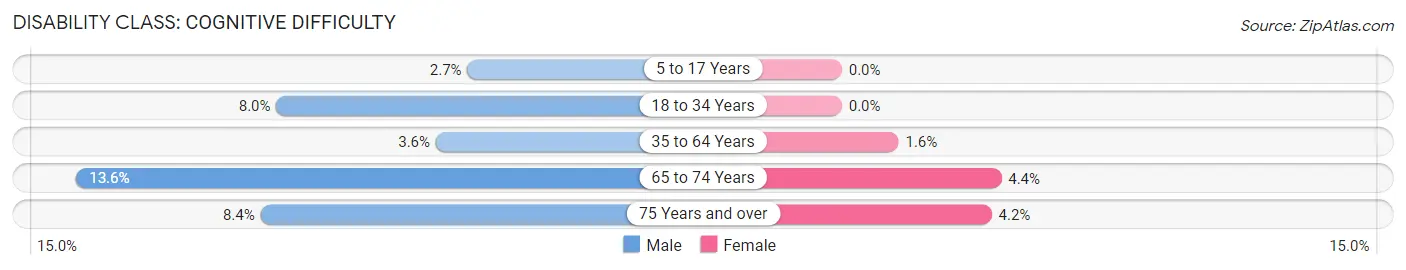
| Age Bracket | Male | Female |
| 5 to 17 Years | 30 (2.7%) | 0 (0.0%) |
| 18 to 34 Years | 58 (8.0%) | 0 (0.0%) |
| 35 to 64 Years | 67 (3.5%) | 31 (1.6%) |
| 65 to 74 Years | 32 (13.6%) | 17 (4.4%) |
| 75 Years and over | 14 (8.4%) | 6 (4.2%) |
Disability Class: Ambulatory Difficulty
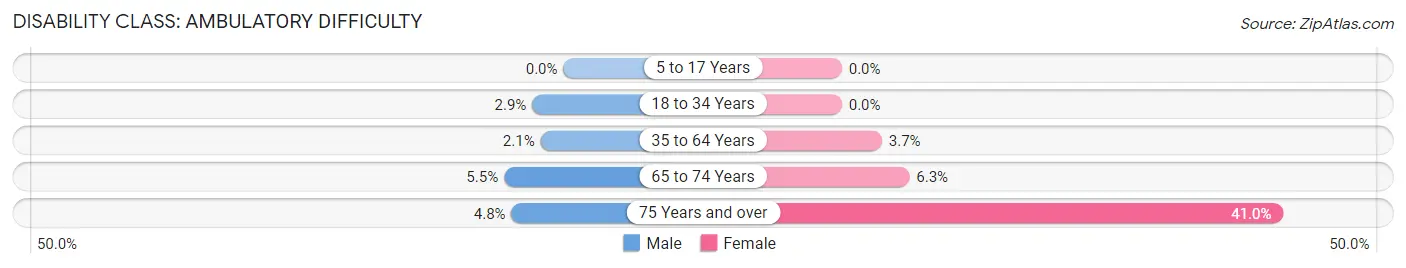
| Age Bracket | Male | Female |
| 5 to 17 Years | 0 (0.0%) | 0 (0.0%) |
| 18 to 34 Years | 21 (2.9%) | 0 (0.0%) |
| 35 to 64 Years | 40 (2.1%) | 73 (3.7%) |
| 65 to 74 Years | 13 (5.5%) | 24 (6.3%) |
| 75 Years and over | 8 (4.8%) | 59 (41.0%) |
Disability Class: Self-Care Difficulty
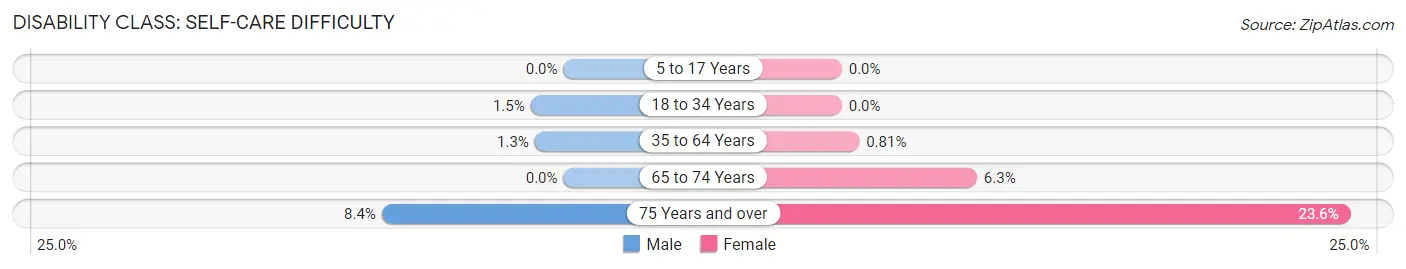
| Age Bracket | Male | Female |
| 5 to 17 Years | 0 (0.0%) | 0 (0.0%) |
| 18 to 34 Years | 11 (1.5%) | 0 (0.0%) |
| 35 to 64 Years | 25 (1.3%) | 16 (0.8%) |
| 65 to 74 Years | 0 (0.0%) | 24 (6.3%) |
| 75 Years and over | 14 (8.4%) | 34 (23.6%) |
Technology Access in Dayton
Computing Device Access in Dayton
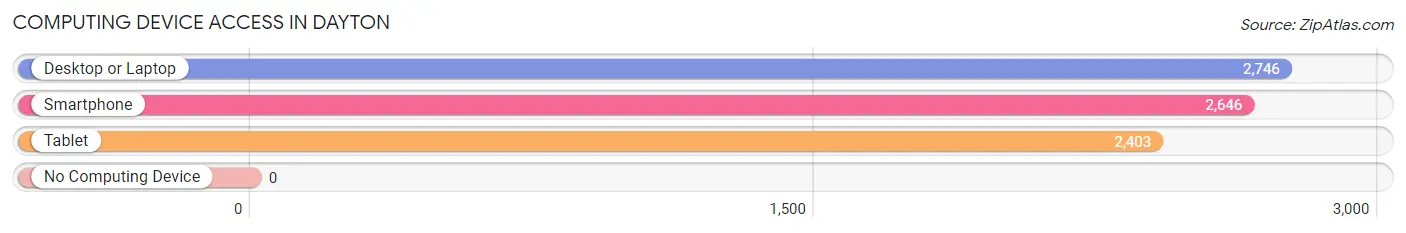
| Device Type | # Households | % Households |
| Desktop or Laptop | 2,746 | 97.9% |
| Smartphone | 2,646 | 94.4% |
| Tablet | 2,403 | 85.7% |
| No Computing Device | 0 | 0.0% |
| Total | 2,804 | 100.0% |
Internet Access in Dayton
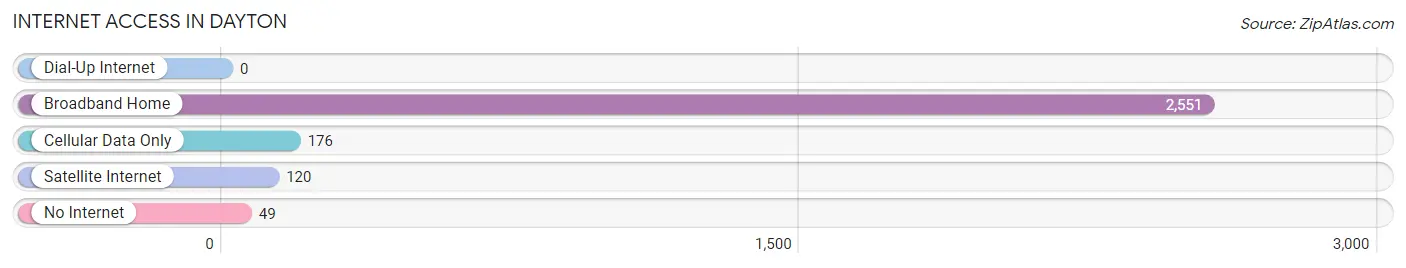
| Internet Type | # Households | % Households |
| Dial-Up Internet | 0 | 0.0% |
| Broadband Home | 2,551 | 91.0% |
| Cellular Data Only | 176 | 6.3% |
| Satellite Internet | 120 | 4.3% |
| No Internet | 49 | 1.8% |
| Total | 2,804 | 100.0% |
Dayton Summary
Dayton, NJ is a small borough located in Middlesex County, New Jersey. It is situated in the Raritan Valley region of Central New Jersey, and is bordered by South Brunswick Township to the north, Franklin Township to the east, and Manville to the south. The population of Dayton was 5,945 as of the 2010 census.
Geography
Dayton is located at 40°31'17" North, 74°32'45" West (40.5214, -74.5457). According to the United States Census Bureau, the borough has a total area of 1.9 square miles (4.9 km2), all of which is land.
Demographics
As of the 2010 census, there were 5,945 people, 2,093 households, and 1,541 families residing in the borough. The population density was 3,097.9 people per square mile (1,196.2/km2). There were 2,209 housing units at an average density of 1,154.2 per square mile (445.3/km2). The racial makeup of the borough was 79.2% White, 8.2% African American, 0.2% Native American, 8.2% Asian, 0.0% Pacific Islander, 1.7% from other races, and 2.6% from two or more races. Hispanic or Latino of any race were 6.7% of the population.
Economy
Dayton is home to several small businesses, including a few restaurants, a bakery, a hardware store, and a few small retail stores. The borough also has a few industrial parks, which are home to a variety of businesses, including a printing company, a plastics manufacturer, and a few other light industrial businesses.
The borough is also home to a few large employers, including Johnson & Johnson, which has a large research and development facility in the borough. The facility employs over 1,000 people. The borough is also home to a few other large employers, including a pharmaceutical company, a medical device manufacturer, and a few other companies.
Education
Dayton is served by the South Brunswick School District. The district operates four elementary schools, one middle school, and one high school. The district also operates a few alternative education programs, including a virtual academy and a special education program.
The borough is also home to a few private schools, including a Catholic school and a few other religious schools.
Conclusion
Dayton, NJ is a small borough located in Middlesex County, New Jersey. It is situated in the Raritan Valley region of Central New Jersey, and is bordered by South Brunswick Township to the north, Franklin Township to the east, and Manville to the south. The population of Dayton was 5,945 as of the 2010 census. The borough is home to several small businesses, including a few restaurants, a bakery, a hardware store, and a few small retail stores. The borough is also home to a few large employers, including Johnson & Johnson, which has a large research and development facility in the borough. The borough is served by the South Brunswick School District, and is also home to a few private schools, including a Catholic school and a few other religious schools.
Common Questions
What is Per Capita Income in Dayton?
Per Capita income in Dayton is $55,080.
What is the Median Family Income in Dayton?
Median Family Income in Dayton is $139,889.
What is the Median Household income in Dayton?
Median Household Income in Dayton is $136,130.
What is Income or Wage Gap in Dayton?
Income or Wage Gap in Dayton is 56.2%.
Women in Dayton earn 43.8 cents for every dollar earned by a man.
What is Inequality or Gini Index in Dayton?
Inequality or Gini Index in Dayton is 0.35.
What is the Total Population of Dayton?
Total Population of Dayton is 8,361.
What is the Total Male Population of Dayton?
Total Male Population of Dayton is 4,254.
What is the Total Female Population of Dayton?
Total Female Population of Dayton is 4,107.
What is the Ratio of Males per 100 Females in Dayton?
There are 103.58 Males per 100 Females in Dayton.
What is the Ratio of Females per 100 Males in Dayton?
There are 96.54 Females per 100 Males in Dayton.
What is the Median Population Age in Dayton?
Median Population Age in Dayton is 41.2 Years.
What is the Average Family Size in Dayton
Average Family Size in Dayton is 3.2 People.
What is the Average Household Size in Dayton
Average Household Size in Dayton is 3.0 People.
How Large is the Labor Force in Dayton?
There are 4,614 People in the Labor Forcein in Dayton.
What is the Percentage of People in the Labor Force in Dayton?
69.1% of People are in the Labor Force in Dayton.
What is the Unemployment Rate in Dayton?
Unemployment Rate in Dayton is 7.7%.