Cape May, NJ Map & Demographics
Cape May Map
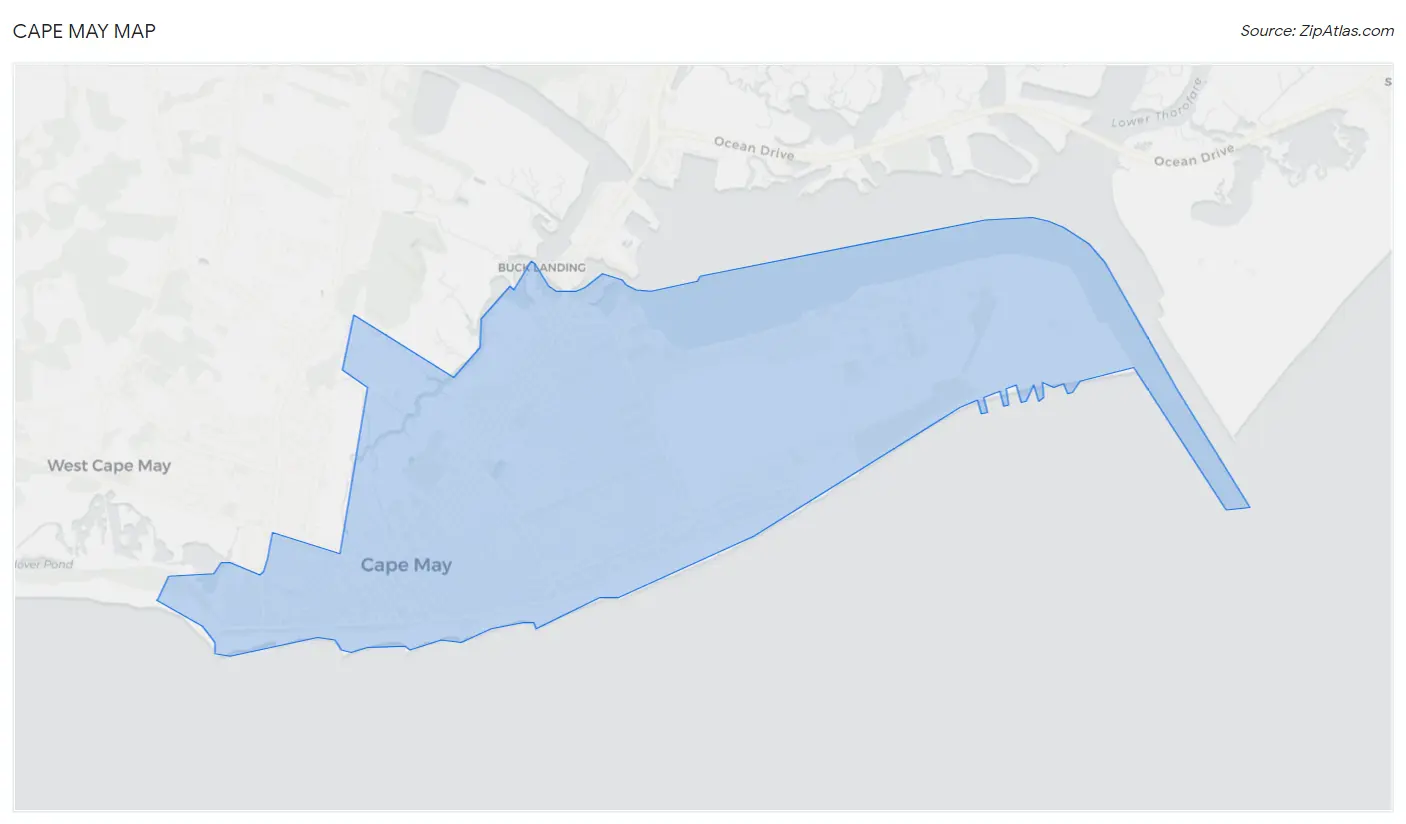
Cape May Overview
$64,513
PER CAPITA INCOME
$104,356
AVG FAMILY INCOME
$69,896
AVG HOUSEHOLD INCOME
2.3%
WAGE / INCOME GAP [ % ]
97.7¢/ $1
WAGE / INCOME GAP [ $ ]
0.58
INEQUALITY / GINI INDEX
2,815
TOTAL POPULATION
1,595
MALE POPULATION
1,220
FEMALE POPULATION
130.74
MALES / 100 FEMALES
76.49
FEMALES / 100 MALES
39.6
MEDIAN AGE
2.7
AVG FAMILY SIZE
2.1
AVG HOUSEHOLD SIZE
1,373
LABOR FORCE [ PEOPLE ]
56.3%
PERCENT IN LABOR FORCE
4.7%
UNEMPLOYMENT RATE
Cape May Zip Codes
Cape May Area Codes
Income in Cape May
Income Overview in Cape May
Per Capita Income in Cape May is $64,513, while median incomes of families and households are $104,356 and $69,896 respectively.
| Characteristic | Number | Measure |
| Per Capita Income | 2,815 | $64,513 |
| Median Family Income | 746 | $104,356 |
| Mean Family Income | 746 | $187,653 |
| Median Household Income | 1,233 | $69,896 |
| Mean Household Income | 1,233 | $138,415 |
| Income Deficit | 746 | $0 |
| Wage / Income Gap (%) | 2,815 | 2.35% |
| Wage / Income Gap ($) | 2,815 | 97.65¢ per $1 |
| Gini / Inequality Index | 2,815 | 0.58 |
Earnings by Sex in Cape May
Average Earnings in Cape May are $41,024, $40,441 for men and $41,414 for women, a difference of 2.4%.
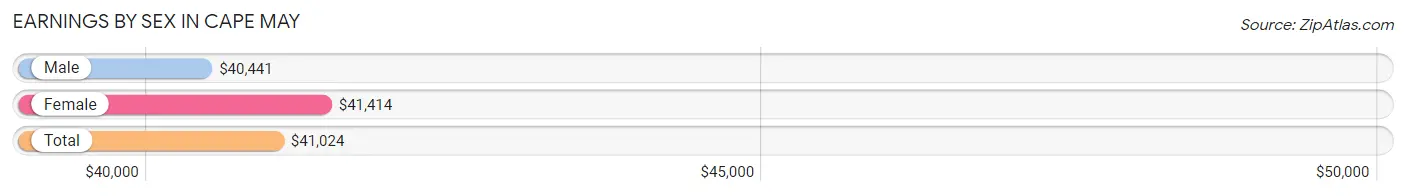
| Sex | Number | Average Earnings |
| Male | 892 (62.7%) | $40,441 |
| Female | 530 (37.3%) | $41,414 |
| Total | 1,422 (100.0%) | $41,024 |
Earnings by Sex by Income Bracket in Cape May
The most common earnings brackets in Cape May are $100,000+ for men (148 | 16.6%) and $100,000+ for women (125 | 23.6%).
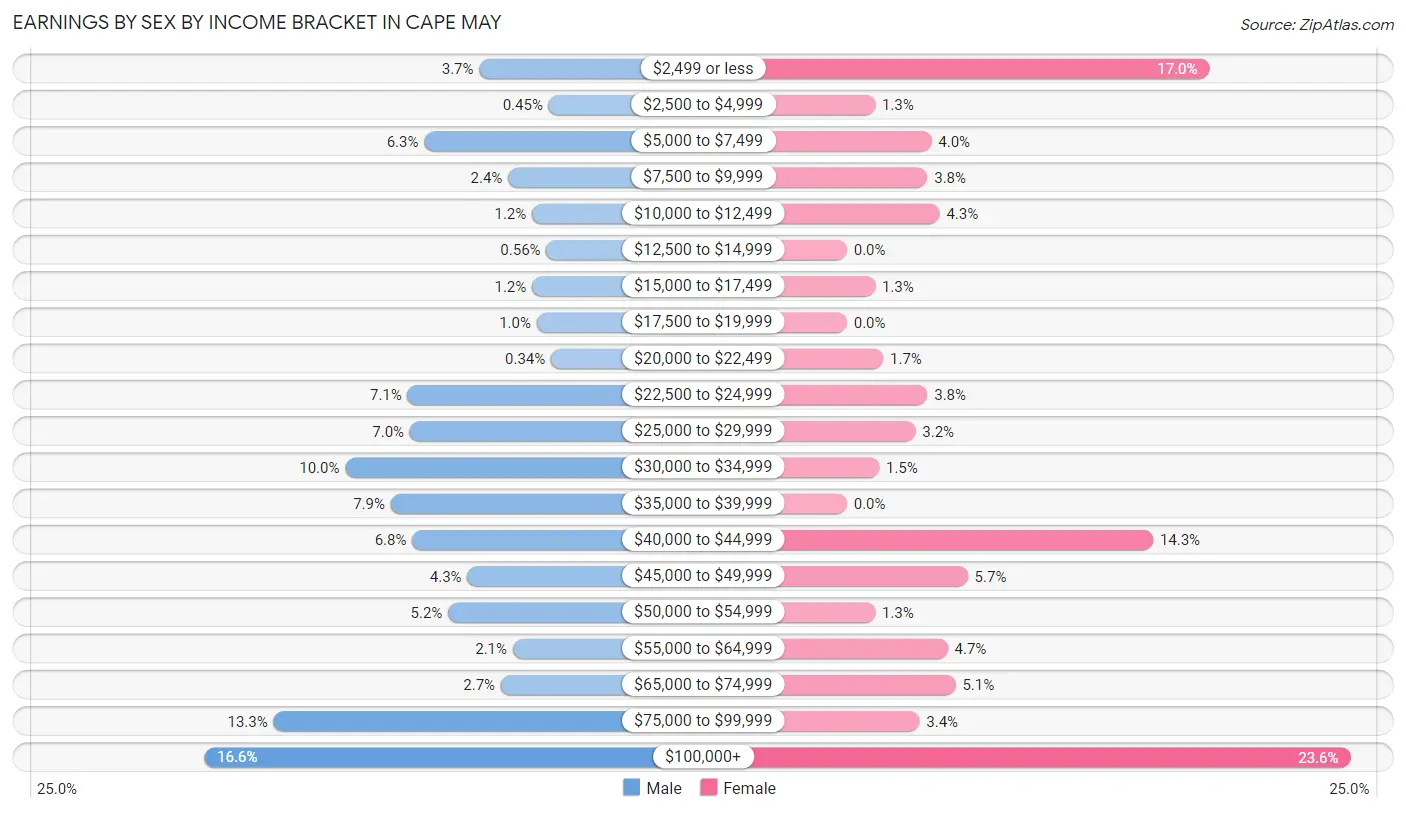
| Income | Male | Female |
| $2,499 or less | 33 (3.7%) | 90 (17.0%) |
| $2,500 to $4,999 | 4 (0.4%) | 7 (1.3%) |
| $5,000 to $7,499 | 56 (6.3%) | 21 (4.0%) |
| $7,500 to $9,999 | 21 (2.4%) | 20 (3.8%) |
| $10,000 to $12,499 | 11 (1.2%) | 23 (4.3%) |
| $12,500 to $14,999 | 5 (0.6%) | 0 (0.0%) |
| $15,000 to $17,499 | 11 (1.2%) | 7 (1.3%) |
| $17,500 to $19,999 | 9 (1.0%) | 0 (0.0%) |
| $20,000 to $22,499 | 3 (0.3%) | 9 (1.7%) |
| $22,500 to $24,999 | 63 (7.1%) | 20 (3.8%) |
| $25,000 to $29,999 | 62 (7.0%) | 17 (3.2%) |
| $30,000 to $34,999 | 89 (10.0%) | 8 (1.5%) |
| $35,000 to $39,999 | 70 (7.9%) | 0 (0.0%) |
| $40,000 to $44,999 | 61 (6.8%) | 76 (14.3%) |
| $45,000 to $49,999 | 38 (4.3%) | 30 (5.7%) |
| $50,000 to $54,999 | 46 (5.2%) | 7 (1.3%) |
| $55,000 to $64,999 | 19 (2.1%) | 25 (4.7%) |
| $65,000 to $74,999 | 24 (2.7%) | 27 (5.1%) |
| $75,000 to $99,999 | 119 (13.3%) | 18 (3.4%) |
| $100,000+ | 148 (16.6%) | 125 (23.6%) |
| Total | 892 (100.0%) | 530 (100.0%) |
Earnings by Sex by Educational Attainment in Cape May
Average earnings in Cape May are $52,083 for men and $42,155 for women, a difference of 19.1%. Men with an educational attainment of bachelor's degree enjoy the highest average annual earnings of $74,167, while those with college or associate's degree education earn the least with $53,713. Women with an educational attainment of graduate degree earn the most with the average annual earnings of $98,750, while those with high school diploma education have the smallest earnings of $29,706.
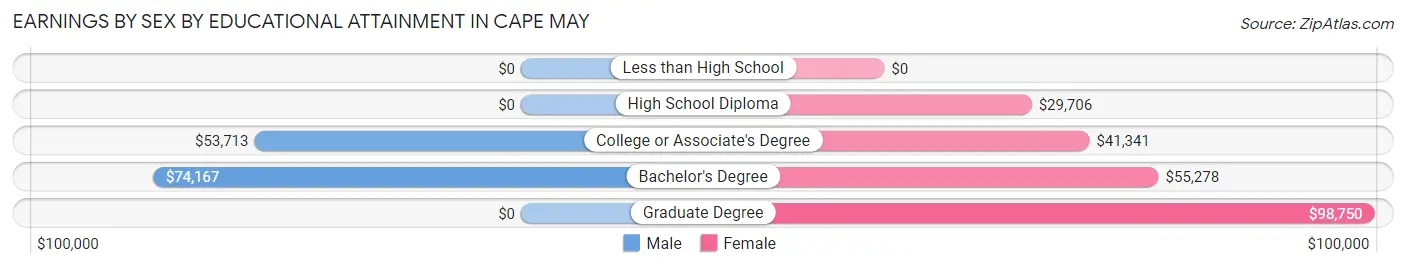
| Educational Attainment | Male Income | Female Income |
| Less than High School | - | - |
| High School Diploma | - | - |
| College or Associate's Degree | $53,713 | $41,341 |
| Bachelor's Degree | $74,167 | $55,278 |
| Graduate Degree | - | - |
| Total | $52,083 | $42,155 |
Family Income in Cape May
Family Income Brackets in Cape May
According to the Cape May family income data, there are 246 families falling into the $100,000 to $149,999 income range, which is the most common income bracket and makes up 33.0% of all families.
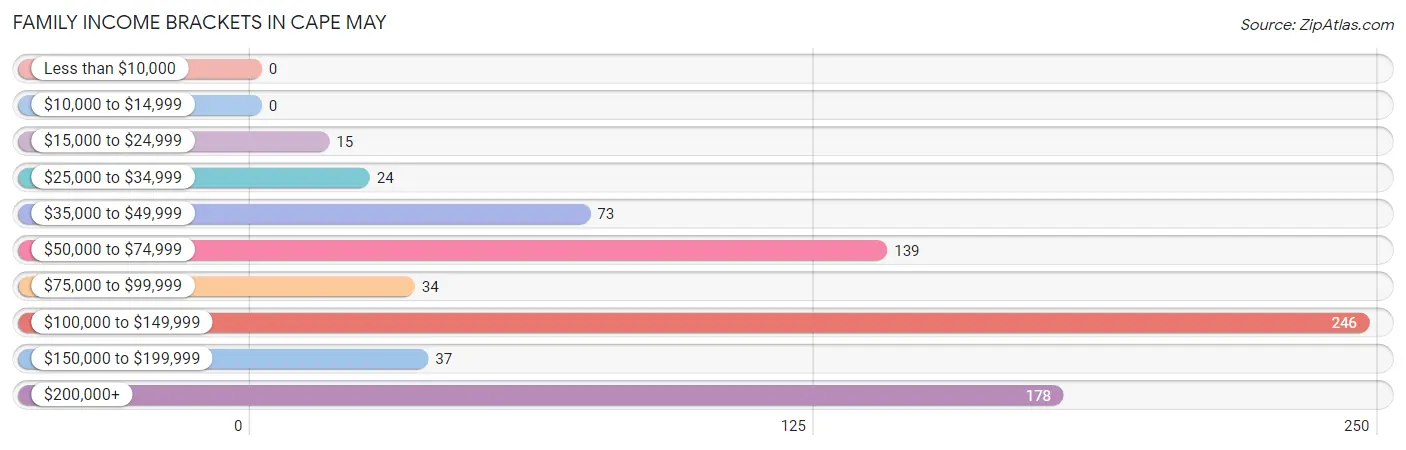
| Income Bracket | # Families | % Families |
| Less than $10,000 | 0 | 0.0% |
| $10,000 to $14,999 | 0 | 0.0% |
| $15,000 to $24,999 | 15 | 2.0% |
| $25,000 to $34,999 | 24 | 3.2% |
| $35,000 to $49,999 | 73 | 9.8% |
| $50,000 to $74,999 | 139 | 18.6% |
| $75,000 to $99,999 | 34 | 4.6% |
| $100,000 to $149,999 | 246 | 33.0% |
| $150,000 to $199,999 | 37 | 5.0% |
| $200,000+ | 178 | 23.9% |
Family Income by Famaliy Size in Cape May
2-person families (416 | 55.8%) account for the highest median family income in Cape May with $117,422 per family, while 2-person families (416 | 55.8%) have the highest median income of $58,711 per family member.
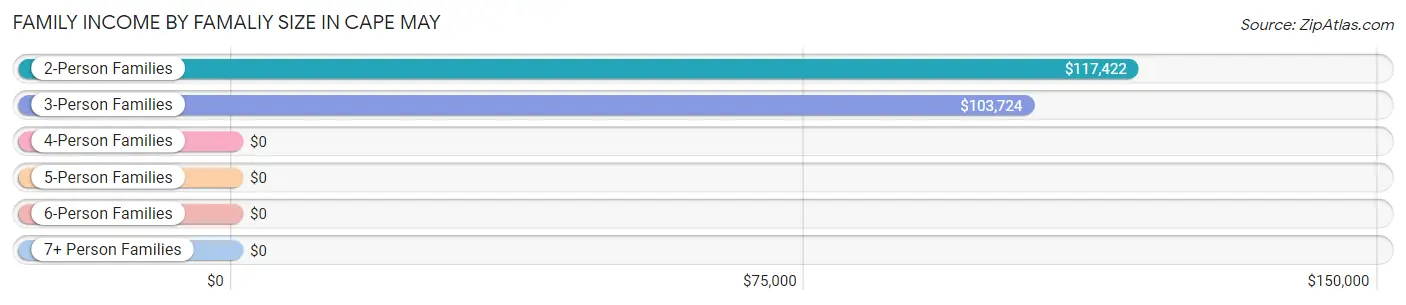
| Income Bracket | # Families | Median Income |
| 2-Person Families | 416 (55.8%) | $117,422 |
| 3-Person Families | 205 (27.5%) | $103,724 |
| 4-Person Families | 54 (7.2%) | $0 |
| 5-Person Families | 14 (1.9%) | $0 |
| 6-Person Families | 57 (7.6%) | $0 |
| 7+ Person Families | 0 (0.0%) | $0 |
| Total | 746 (100.0%) | $104,356 |
Family Income by Number of Earners in Cape May
The median family income in Cape May is $104,356, with families comprising 3+ earners (42) having the highest median family income of $181,071, while families with no earners (134) have the lowest median family income of $58,906, accounting for 5.6% and 18.0% of families, respectively.
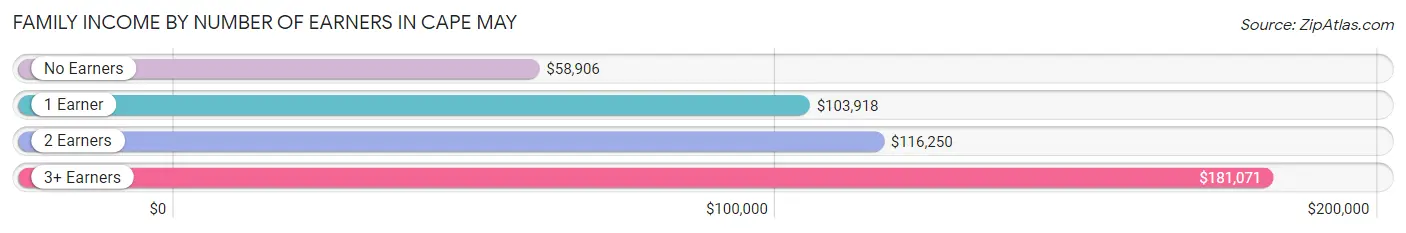
| Number of Earners | # Families | Median Income |
| No Earners | 134 (18.0%) | $58,906 |
| 1 Earner | 332 (44.5%) | $103,918 |
| 2 Earners | 238 (31.9%) | $116,250 |
| 3+ Earners | 42 (5.6%) | $181,071 |
| Total | 746 (100.0%) | $104,356 |
Household Income in Cape May
Household Income Brackets in Cape May
With 289 households falling in the category, the $100,000 to $149,999 income range is the most frequent in Cape May, accounting for 23.4% of all households.
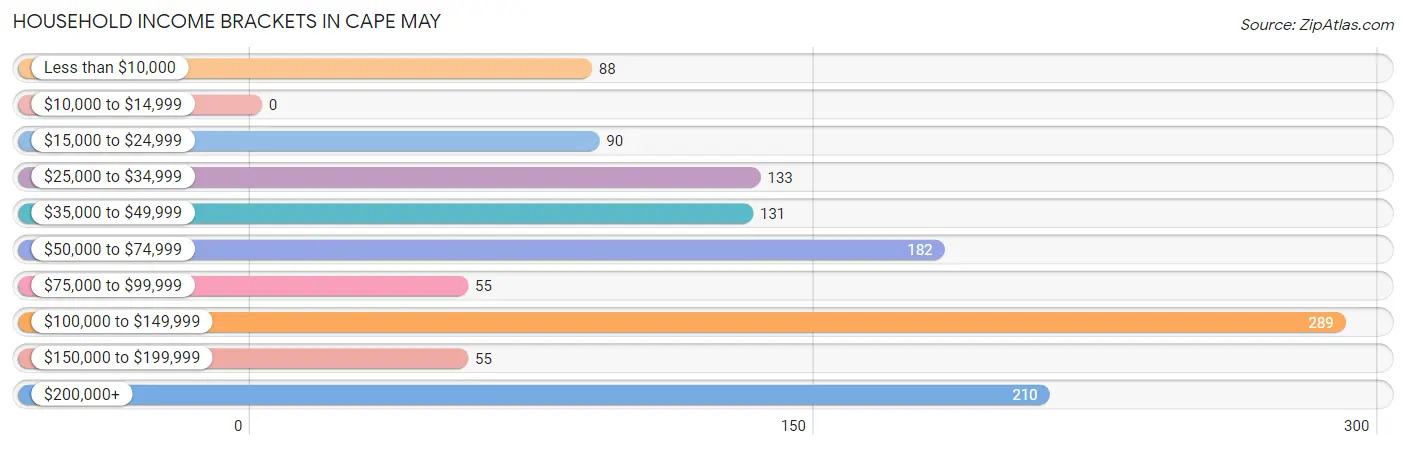
| Income Bracket | # Households | % Households |
| Less than $10,000 | 88 | 7.1% |
| $10,000 to $14,999 | 0 | 0.0% |
| $15,000 to $24,999 | 90 | 7.3% |
| $25,000 to $34,999 | 133 | 10.8% |
| $35,000 to $49,999 | 131 | 10.6% |
| $50,000 to $74,999 | 182 | 14.8% |
| $75,000 to $99,999 | 55 | 4.5% |
| $100,000 to $149,999 | 289 | 23.4% |
| $150,000 to $199,999 | 55 | 4.5% |
| $200,000+ | 210 | 17.0% |
Household Income by Householder Age in Cape May
The median household income in Cape May is $69,896, with the highest median household income of $143,594 found in the 45 to 64 years age bracket for the primary householder. A total of 343 households (27.8%) fall into this category. Meanwhile, the 15 to 24 years age bracket for the primary householder has the lowest median household income of $0, with 29 households (2.4%) in this group.
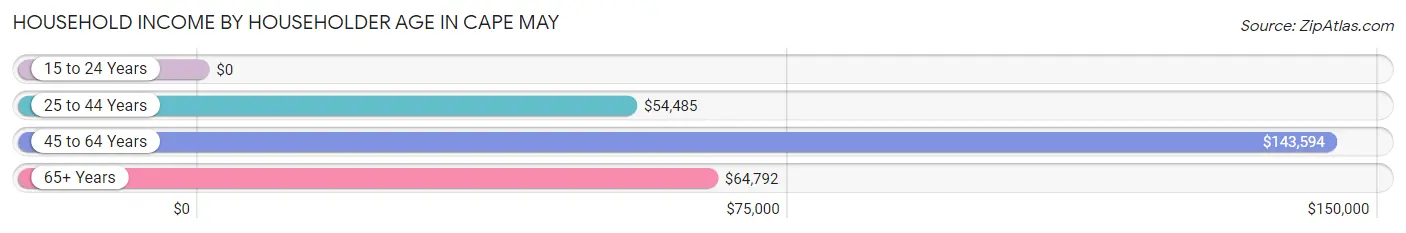
| Income Bracket | # Households | Median Income |
| 15 to 24 Years | 29 (2.4%) | $0 |
| 25 to 44 Years | 324 (26.3%) | $54,485 |
| 45 to 64 Years | 343 (27.8%) | $143,594 |
| 65+ Years | 537 (43.5%) | $64,792 |
| Total | 1,233 (100.0%) | $69,896 |
Poverty in Cape May
Income Below Poverty by Sex and Age in Cape May
With 5.5% poverty level for males and 5.2% for females among the residents of Cape May, 18 to 24 year old males and 18 to 24 year old females are the most vulnerable to poverty, with 32 males (32.0%) and 12 females (66.7%) in their respective age groups living below the poverty level.
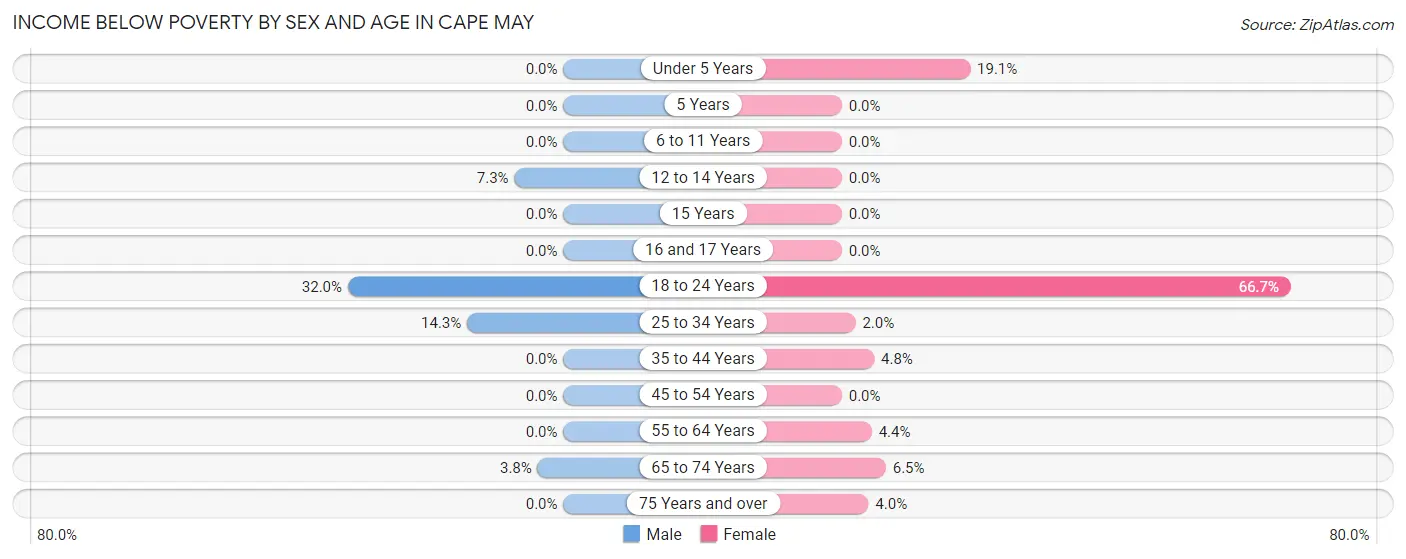
| Age Bracket | Male | Female |
| Under 5 Years | 0 (0.0%) | 4 (19.1%) |
| 5 Years | 0 (0.0%) | 0 (0.0%) |
| 6 to 11 Years | 0 (0.0%) | 0 (0.0%) |
| 12 to 14 Years | 4 (7.3%) | 0 (0.0%) |
| 15 Years | 0 (0.0%) | 0 (0.0%) |
| 16 and 17 Years | 0 (0.0%) | 0 (0.0%) |
| 18 to 24 Years | 32 (32.0%) | 12 (66.7%) |
| 25 to 34 Years | 35 (14.3%) | 4 (2.0%) |
| 35 to 44 Years | 0 (0.0%) | 6 (4.8%) |
| 45 to 54 Years | 0 (0.0%) | 0 (0.0%) |
| 55 to 64 Years | 0 (0.0%) | 8 (4.4%) |
| 65 to 74 Years | 6 (3.8%) | 22 (6.5%) |
| 75 Years and over | 0 (0.0%) | 6 (4.0%) |
| Total | 77 (5.5%) | 62 (5.2%) |
Income Above Poverty by Sex and Age in Cape May
According to the poverty statistics in Cape May, males aged under 5 years and females aged 5 years are the age groups that are most secure financially, with 100.0% of males and 100.0% of females in these age groups living above the poverty line.
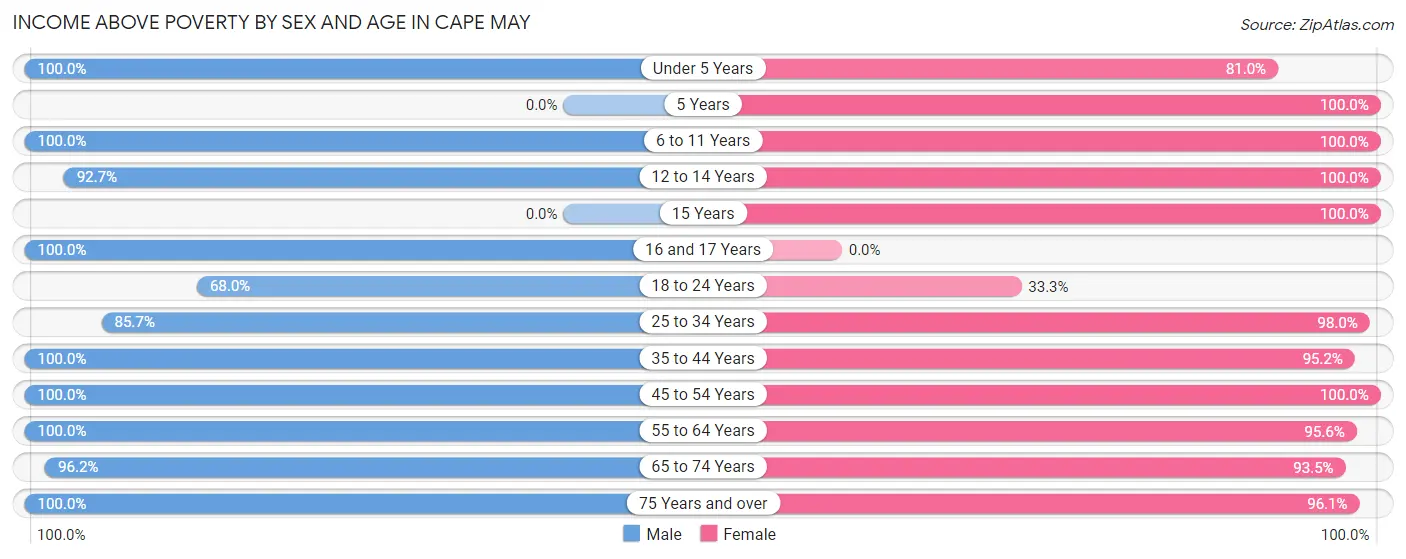
| Age Bracket | Male | Female |
| Under 5 Years | 118 (100.0%) | 17 (80.9%) |
| 5 Years | 0 (0.0%) | 14 (100.0%) |
| 6 to 11 Years | 110 (100.0%) | 45 (100.0%) |
| 12 to 14 Years | 51 (92.7%) | 5 (100.0%) |
| 15 Years | 0 (0.0%) | 9 (100.0%) |
| 16 and 17 Years | 80 (100.0%) | 0 (0.0%) |
| 18 to 24 Years | 68 (68.0%) | 6 (33.3%) |
| 25 to 34 Years | 210 (85.7%) | 193 (98.0%) |
| 35 to 44 Years | 111 (100.0%) | 119 (95.2%) |
| 45 to 54 Years | 68 (100.0%) | 78 (100.0%) |
| 55 to 64 Years | 222 (100.0%) | 172 (95.6%) |
| 65 to 74 Years | 151 (96.2%) | 315 (93.5%) |
| 75 Years and over | 128 (100.0%) | 146 (96.1%) |
| Total | 1,317 (94.5%) | 1,119 (94.8%) |
Income Below Poverty Among Married-Couple Families in Cape May
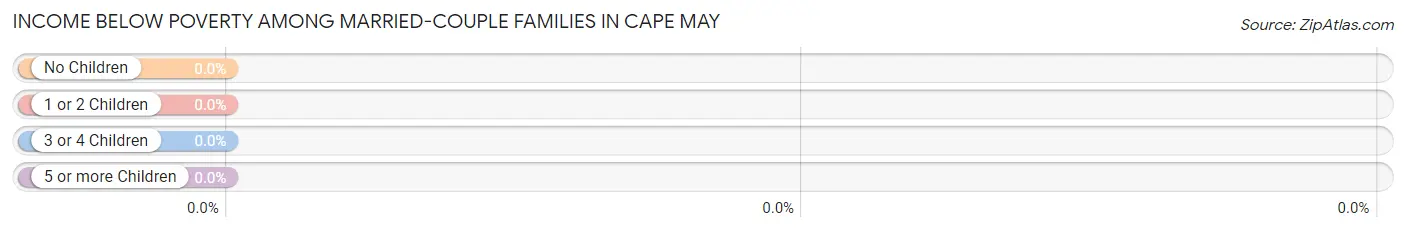
| Children | Above Poverty | Below Poverty |
| No Children | 375 (100.0%) | 0 (0.0%) |
| 1 or 2 Children | 200 (100.0%) | 0 (0.0%) |
| 3 or 4 Children | 67 (100.0%) | 0 (0.0%) |
| 5 or more Children | 0 (0.0%) | 0 (0.0%) |
| Total | 642 (100.0%) | 0 (0.0%) |
Income Below Poverty Among Single-Parent Households in Cape May
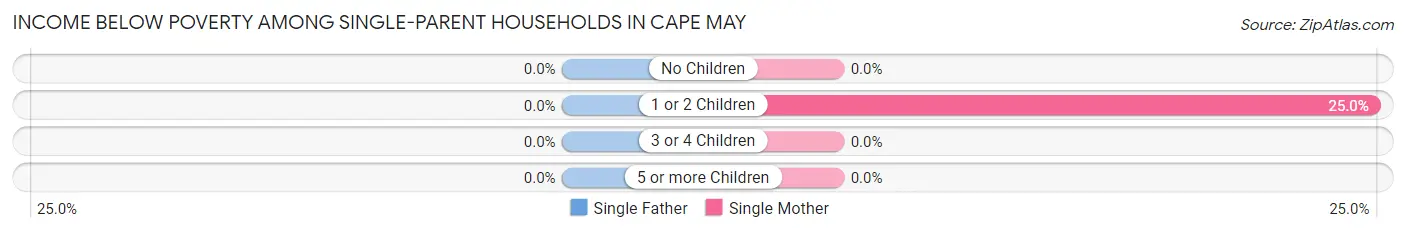
| Children | Single Father | Single Mother |
| No Children | 0 (0.0%) | 0 (0.0%) |
| 1 or 2 Children | 0 (0.0%) | 6 (25.0%) |
| 3 or 4 Children | 0 (0.0%) | 0 (0.0%) |
| 5 or more Children | 0 (0.0%) | 0 (0.0%) |
| Total | 0 (0.0%) | 6 (5.8%) |
Income Below Poverty Among Married-Couple vs Single-Parent Households in Cape May
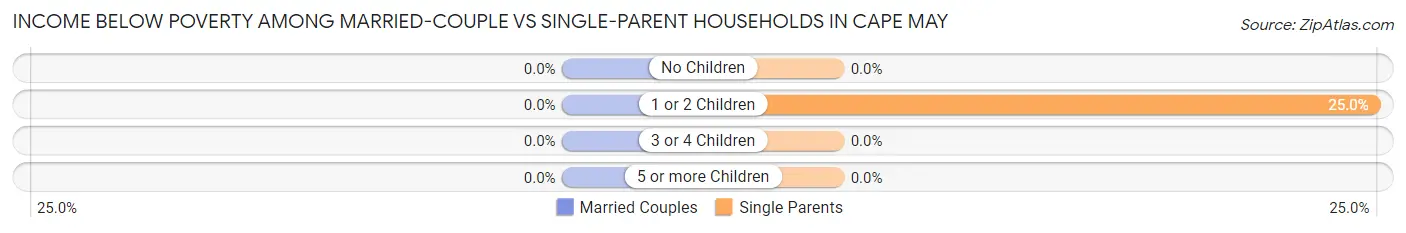
| Children | Married-Couple Families | Single-Parent Households |
| No Children | 0 (0.0%) | 0 (0.0%) |
| 1 or 2 Children | 0 (0.0%) | 6 (25.0%) |
| 3 or 4 Children | 0 (0.0%) | 0 (0.0%) |
| 5 or more Children | 0 (0.0%) | 0 (0.0%) |
| Total | 0 (0.0%) | 6 (5.8%) |
Race in Cape May
The most populous races in Cape May are White / Caucasian (2,296 | 81.6%), Hispanic or Latino (518 | 18.4%), and Some other Race (281 | 10.0%).
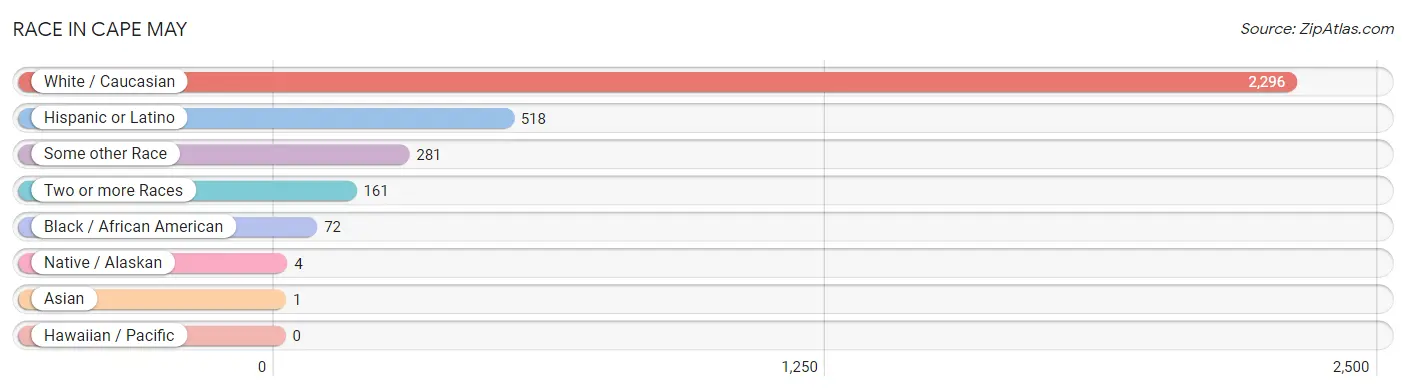
| Race | # Population | % Population |
| Asian | 1 | 0.0% |
| Black / African American | 72 | 2.6% |
| Hawaiian / Pacific | 0 | 0.0% |
| Hispanic or Latino | 518 | 18.4% |
| Native / Alaskan | 4 | 0.1% |
| White / Caucasian | 2,296 | 81.6% |
| Two or more Races | 161 | 5.7% |
| Some other Race | 281 | 10.0% |
| Total | 2,815 | 100.0% |
Ancestry in Cape May
The most populous ancestries reported in Cape May are Irish (778 | 27.6%), German (315 | 11.2%), Italian (299 | 10.6%), English (252 | 8.9%), and American (228 | 8.1%), together accounting for 66.5% of all Cape May residents.
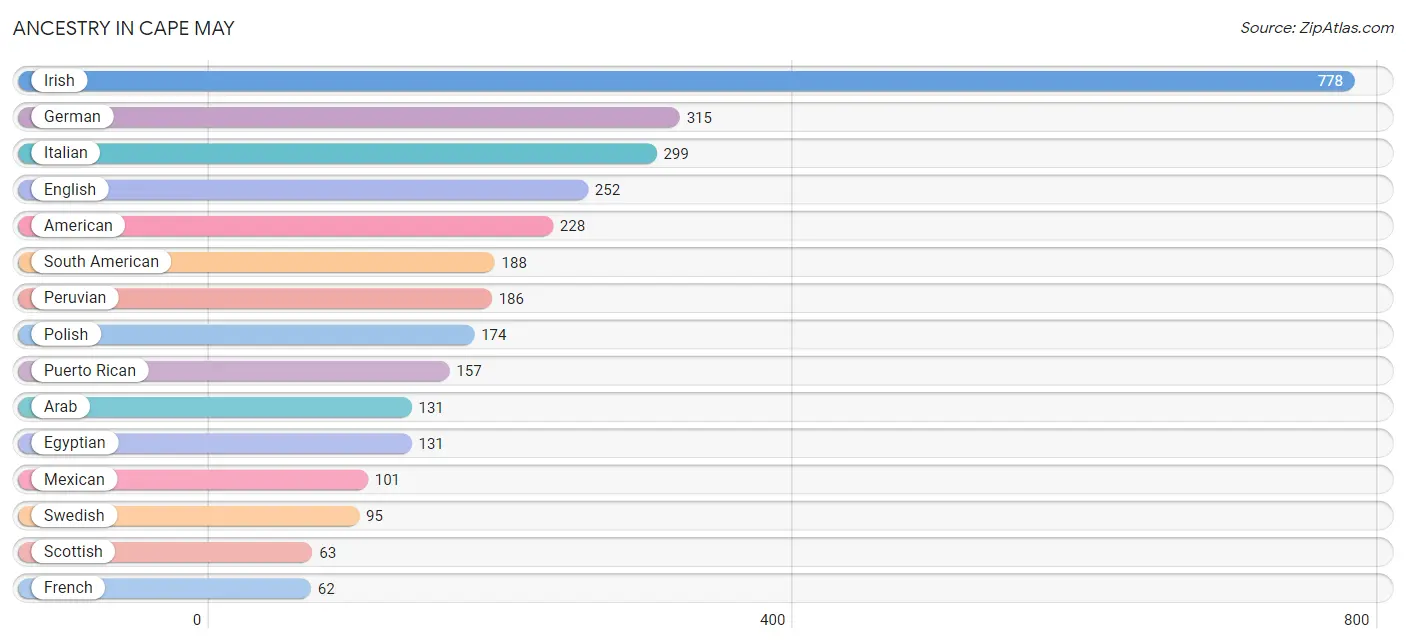
| Ancestry | # Population | % Population |
| American | 228 | 8.1% |
| Arab | 131 | 4.6% |
| Austrian | 14 | 0.5% |
| Blackfeet | 43 | 1.5% |
| British | 10 | 0.4% |
| Central American | 49 | 1.7% |
| Cherokee | 2 | 0.1% |
| Dominican | 6 | 0.2% |
| Dutch | 17 | 0.6% |
| Eastern European | 12 | 0.4% |
| Ecuadorian | 2 | 0.1% |
| Egyptian | 131 | 4.6% |
| English | 252 | 8.9% |
| European | 9 | 0.3% |
| French | 62 | 2.2% |
| French Canadian | 18 | 0.6% |
| German | 315 | 11.2% |
| Greek | 15 | 0.5% |
| Guatemalan | 26 | 0.9% |
| Hungarian | 23 | 0.8% |
| Indian (Asian) | 43 | 1.5% |
| Irish | 778 | 27.6% |
| Israeli | 3 | 0.1% |
| Italian | 299 | 10.6% |
| Jamaican | 45 | 1.6% |
| Lithuanian | 7 | 0.3% |
| Mexican | 101 | 3.6% |
| Norwegian | 34 | 1.2% |
| Osage | 8 | 0.3% |
| Panamanian | 19 | 0.7% |
| Pennsylvania German | 8 | 0.3% |
| Peruvian | 186 | 6.6% |
| Polish | 174 | 6.2% |
| Puerto Rican | 157 | 5.6% |
| Russian | 36 | 1.3% |
| Salvadoran | 4 | 0.1% |
| Scandinavian | 7 | 0.3% |
| Scottish | 63 | 2.2% |
| Slavic | 8 | 0.3% |
| South African | 27 | 1.0% |
| South American | 188 | 6.7% |
| Spaniard | 10 | 0.4% |
| Subsaharan African | 27 | 1.0% |
| Swedish | 95 | 3.4% |
| Thai | 1 | 0.0% |
| Trinidadian and Tobagonian | 5 | 0.2% |
| Ukrainian | 21 | 0.7% |
| Welsh | 41 | 1.5% | View All 48 Rows |
Immigrants in Cape May
The most numerous immigrant groups reported in Cape May came from Africa (179 | 6.4%), Latin America (153 | 5.4%), Egypt (152 | 5.4%), Northern Africa (152 | 5.4%), and Central America (111 | 3.9%), together accounting for 26.5% of all Cape May residents.
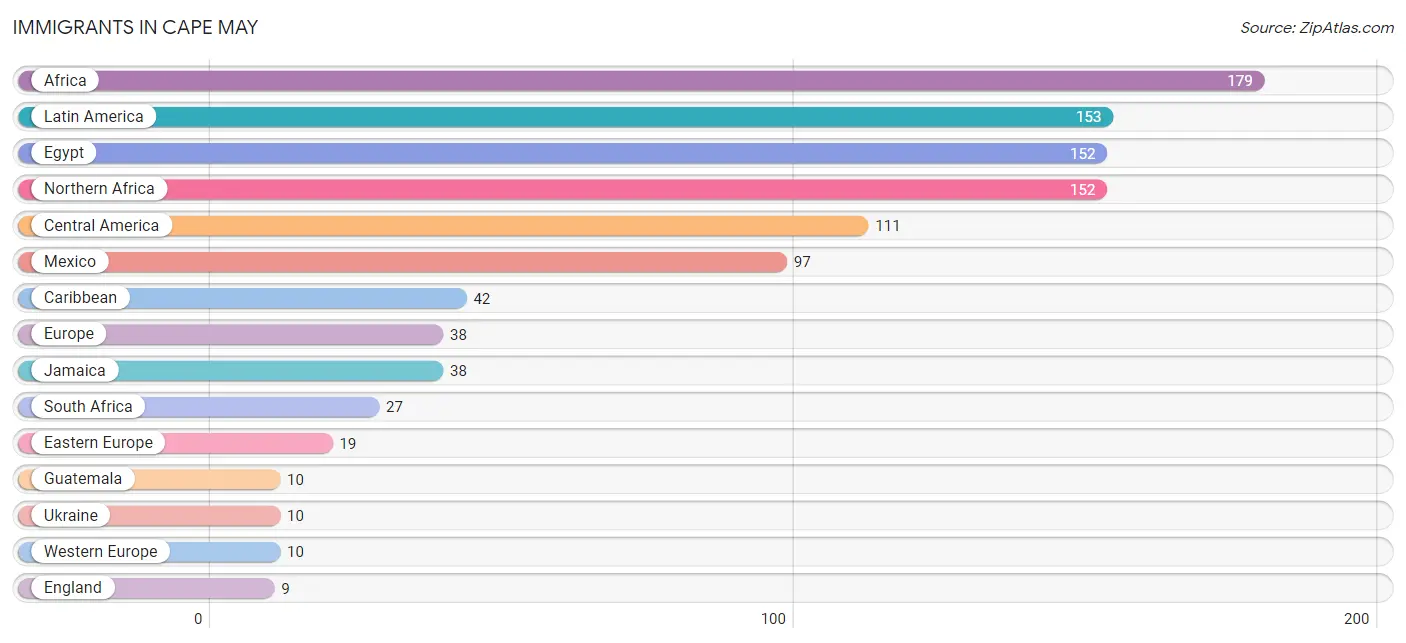
| Immigration Origin | # Population | % Population |
| Africa | 179 | 6.4% |
| Bahamas | 4 | 0.1% |
| Caribbean | 42 | 1.5% |
| Central America | 111 | 3.9% |
| Eastern Europe | 19 | 0.7% |
| Egypt | 152 | 5.4% |
| El Salvador | 4 | 0.1% |
| England | 9 | 0.3% |
| Europe | 38 | 1.3% |
| France | 7 | 0.3% |
| Germany | 3 | 0.1% |
| Guatemala | 10 | 0.4% |
| Jamaica | 38 | 1.3% |
| Latin America | 153 | 5.4% |
| Mexico | 97 | 3.5% |
| Northern Africa | 152 | 5.4% |
| Northern Europe | 9 | 0.3% |
| Russia | 9 | 0.3% |
| South Africa | 27 | 1.0% |
| Ukraine | 10 | 0.4% |
| Western Europe | 10 | 0.4% | View All 21 Rows |
Sex and Age in Cape May
Sex and Age in Cape May
The most populous age groups in Cape May are 25 to 29 Years (236 | 14.8%) for men and 65 to 69 Years (186 | 15.2%) for women.
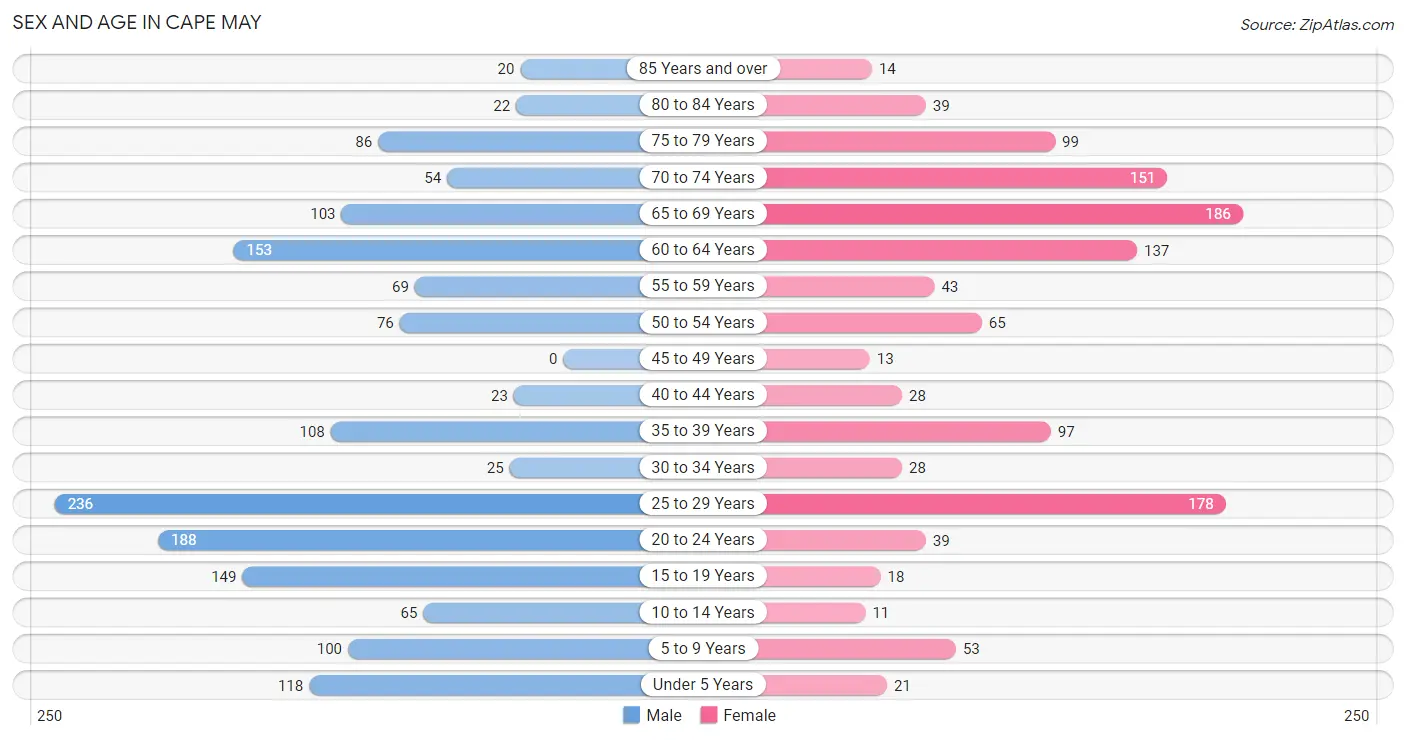
| Age Bracket | Male | Female |
| Under 5 Years | 118 (7.4%) | 21 (1.7%) |
| 5 to 9 Years | 100 (6.3%) | 53 (4.3%) |
| 10 to 14 Years | 65 (4.1%) | 11 (0.9%) |
| 15 to 19 Years | 149 (9.3%) | 18 (1.5%) |
| 20 to 24 Years | 188 (11.8%) | 39 (3.2%) |
| 25 to 29 Years | 236 (14.8%) | 178 (14.6%) |
| 30 to 34 Years | 25 (1.6%) | 28 (2.3%) |
| 35 to 39 Years | 108 (6.8%) | 97 (8.0%) |
| 40 to 44 Years | 23 (1.4%) | 28 (2.3%) |
| 45 to 49 Years | 0 (0.0%) | 13 (1.1%) |
| 50 to 54 Years | 76 (4.8%) | 65 (5.3%) |
| 55 to 59 Years | 69 (4.3%) | 43 (3.5%) |
| 60 to 64 Years | 153 (9.6%) | 137 (11.2%) |
| 65 to 69 Years | 103 (6.5%) | 186 (15.2%) |
| 70 to 74 Years | 54 (3.4%) | 151 (12.4%) |
| 75 to 79 Years | 86 (5.4%) | 99 (8.1%) |
| 80 to 84 Years | 22 (1.4%) | 39 (3.2%) |
| 85 Years and over | 20 (1.3%) | 14 (1.1%) |
| Total | 1,595 (100.0%) | 1,220 (100.0%) |
Families and Households in Cape May
Median Family Size in Cape May
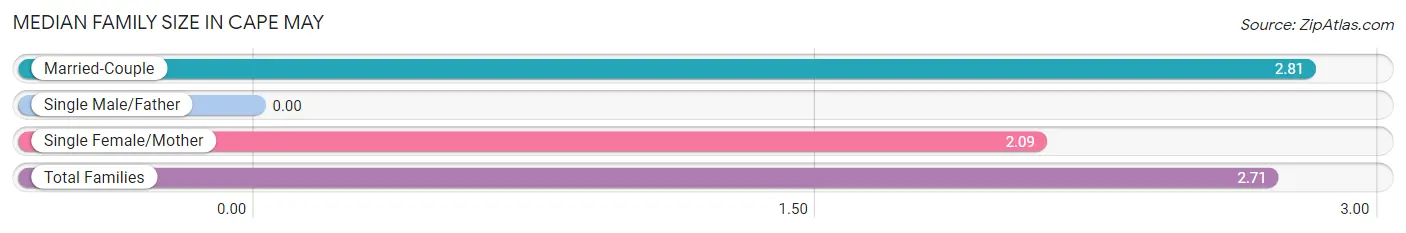
| Family Type | # Families | Family Size |
| Married-Couple | 642 (86.1%) | 2.81 |
| Single Male/Father | 0 (0.0%) | - |
| Single Female/Mother | 104 (13.9%) | 2.09 |
| Total Families | 746 (100.0%) | 2.71 |
Median Household Size in Cape May
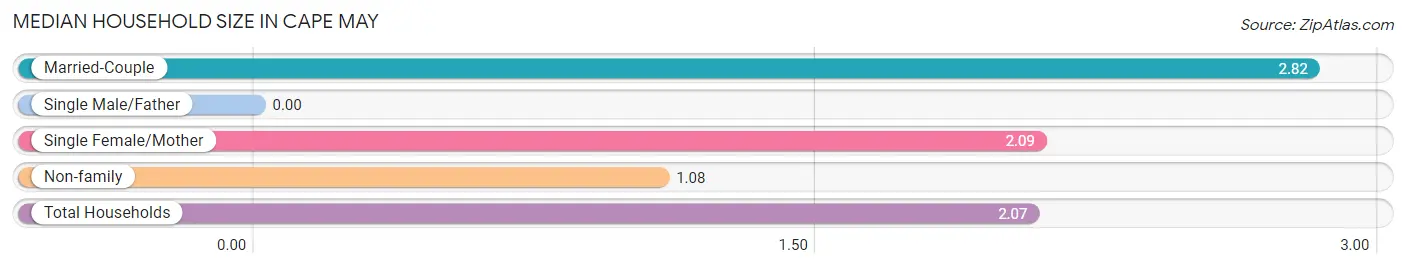
| Household Type | # Households | Household Size |
| Married-Couple | 642 (52.1%) | 2.82 |
| Single Male/Father | 0 (0.0%) | - |
| Single Female/Mother | 104 (8.4%) | 2.09 |
| Non-family | 487 (39.5%) | 1.08 |
| Total Households | 1,233 (100.0%) | 2.07 |
Household Size by Marriage Status in Cape May
Out of a total of 1,233 households in Cape May, 746 (60.5%) are family households, while 487 (39.5%) are nonfamily households. The most numerous type of family households are 2-person households, comprising 416, and the most common type of nonfamily households are 1-person households, comprising 455.
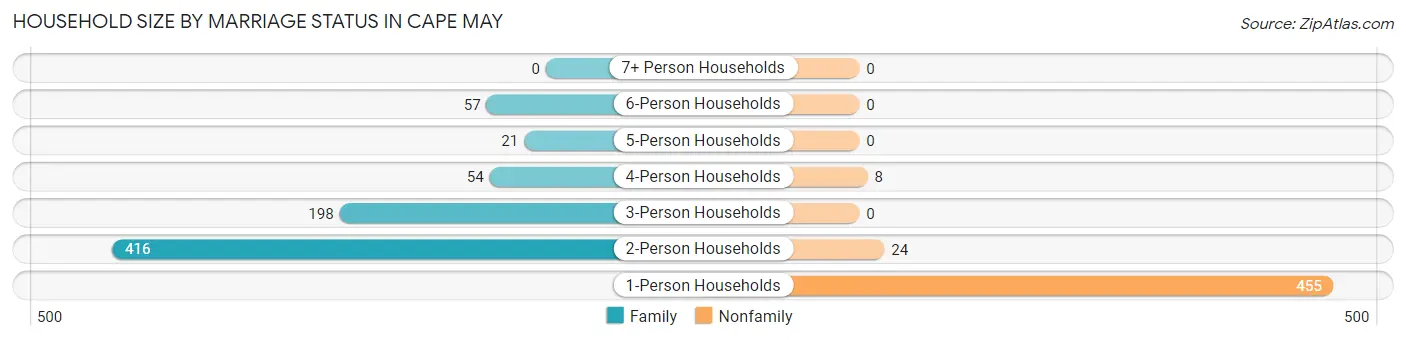
| Household Size | Family Households | Nonfamily Households |
| 1-Person Households | - | 455 (36.9%) |
| 2-Person Households | 416 (33.7%) | 24 (1.9%) |
| 3-Person Households | 198 (16.1%) | 0 (0.0%) |
| 4-Person Households | 54 (4.4%) | 8 (0.6%) |
| 5-Person Households | 21 (1.7%) | 0 (0.0%) |
| 6-Person Households | 57 (4.6%) | 0 (0.0%) |
| 7+ Person Households | 0 (0.0%) | 0 (0.0%) |
| Total | 746 (60.5%) | 487 (39.5%) |
Female Fertility in Cape May
Fertility by Age in Cape May
Average fertility rate in Cape May is 70.0 births per 1,000 women. Women in the age bracket of 20 to 34 years have the highest fertility rate with 102.0 births per 1,000 women. Women in the age bracket of 20 to 34 years acount for 80.6% of all women with births.
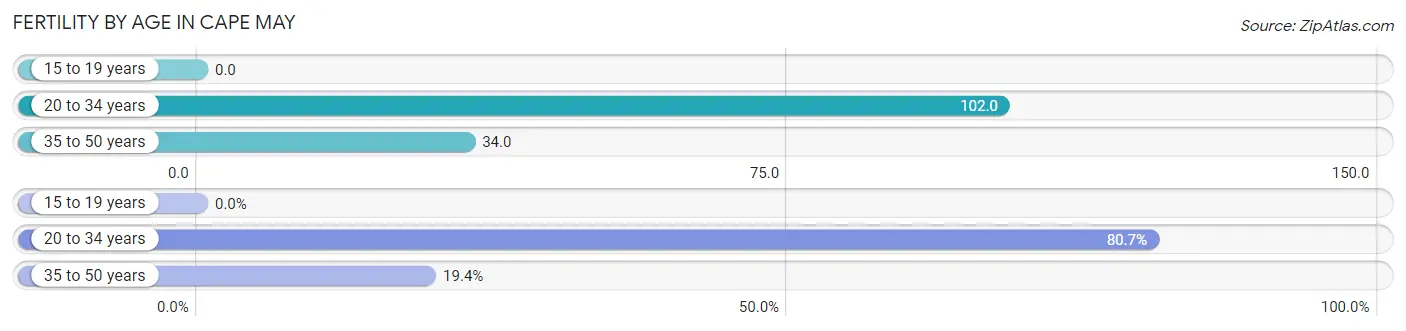
| Age Bracket | Women with Births | Births / 1,000 Women |
| 15 to 19 years | 0 (0.0%) | 0.0 |
| 20 to 34 years | 25 (80.6%) | 102.0 |
| 35 to 50 years | 6 (19.4%) | 34.0 |
| Total | 31 (100.0%) | 70.0 |
Fertility by Age by Marriage Status in Cape May
80.6% of women with births (31) in Cape May are married. The highest percentage of unmarried women with births falls into 35 to 50 years age bracket with 100.0% of them unmarried at the time of birth, while the lowest percentage of unmarried women with births belong to 20 to 34 years age bracket with 0.0% of them unmarried.
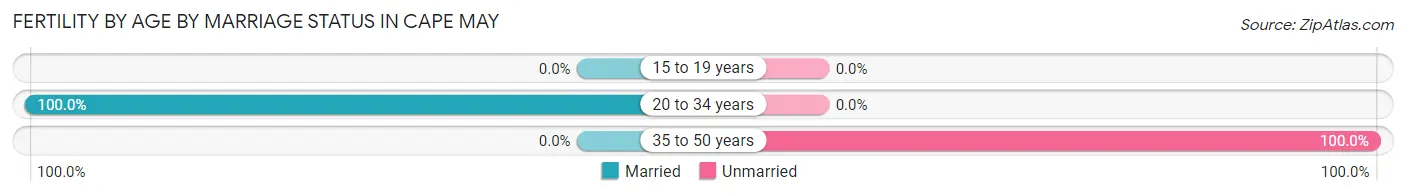
| Age Bracket | Married | Unmarried |
| 15 to 19 years | 0 (0.0%) | 0 (0.0%) |
| 20 to 34 years | 25 (100.0%) | 0 (0.0%) |
| 35 to 50 years | 0 (0.0%) | 6 (100.0%) |
| Total | 25 (80.6%) | 6 (19.4%) |
Fertility by Education in Cape May
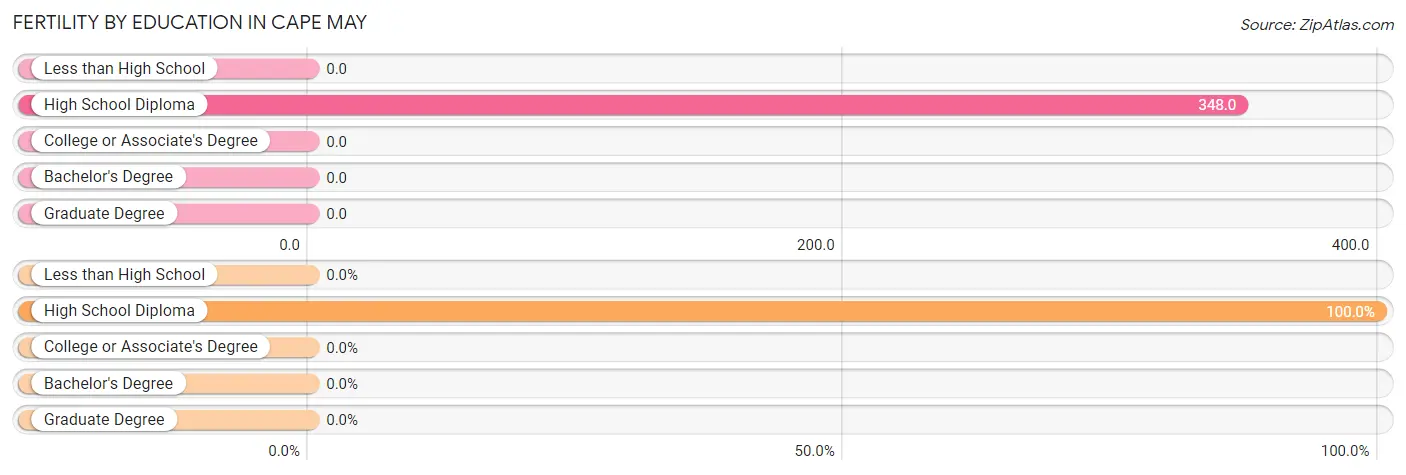
| Educational Attainment | Women with Births | Births / 1,000 Women |
| Less than High School | 0 (0.0%) | 0.0 |
| High School Diploma | 31 (100.0%) | 348.0 |
| College or Associate's Degree | 0 (0.0%) | 0.0 |
| Bachelor's Degree | 0 (0.0%) | 0.0 |
| Graduate Degree | 0 (0.0%) | 0.0 |
| Total | 31 (100.0%) | 70.0 |
Fertility by Education by Marriage Status in Cape May
19.4% of women with births in Cape May are unmarried. Women with the educational attainment of high school diploma are most likely to be married with 80.6% of them married at childbirth, while women with the educational attainment of high school diploma are least likely to be married with 19.4% of them unmarried at childbirth.
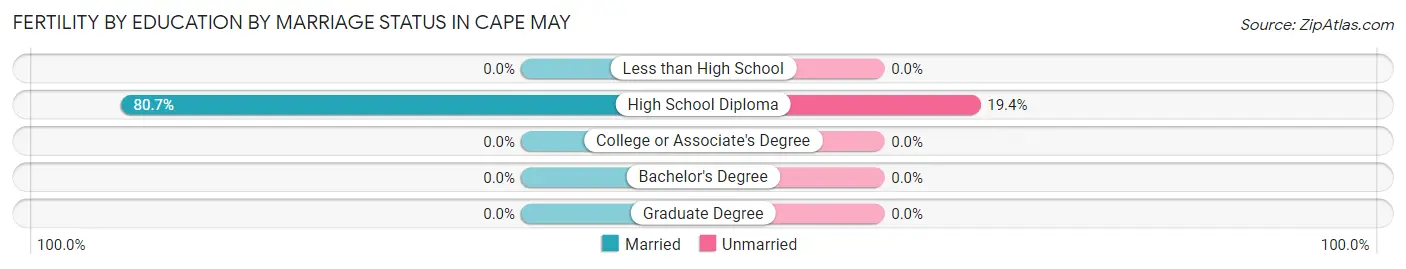
| Educational Attainment | Married | Unmarried |
| Less than High School | 0 (0.0%) | 0 (0.0%) |
| High School Diploma | 25 (80.6%) | 6 (19.4%) |
| College or Associate's Degree | 0 (0.0%) | 0 (0.0%) |
| Bachelor's Degree | 0 (0.0%) | 0 (0.0%) |
| Graduate Degree | 0 (0.0%) | 0 (0.0%) |
| Total | 25 (80.6%) | 6 (19.4%) |
Employment Characteristics in Cape May
Employment by Class of Employer in Cape May
Among the 1,294 employed individuals in Cape May, federal government employees (501 | 38.7%), private company employees (389 | 30.1%), and not-for-profit organizations (165 | 12.8%) make up the most common classes of employment.
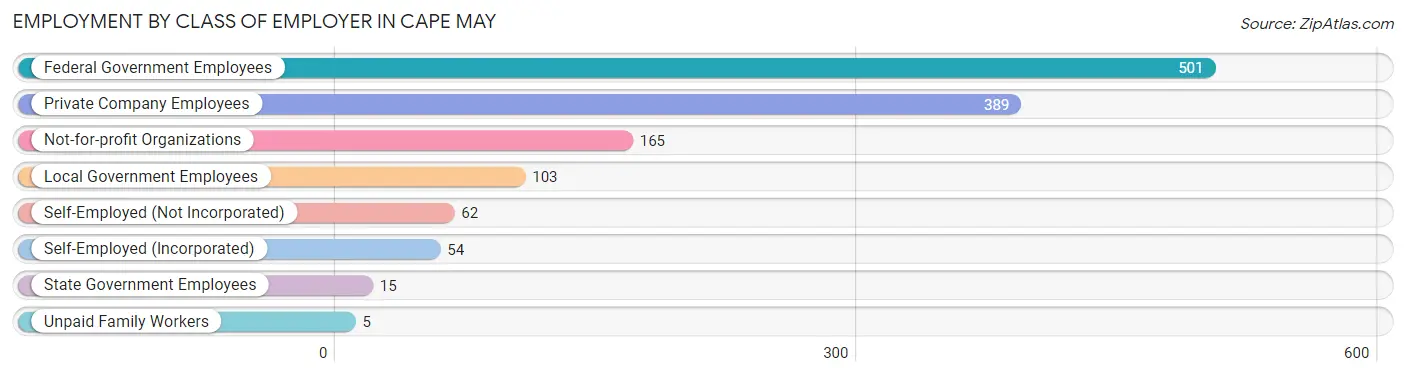
| Employer Class | # Employees | % Employees |
| Private Company Employees | 389 | 30.1% |
| Self-Employed (Incorporated) | 54 | 4.2% |
| Self-Employed (Not Incorporated) | 62 | 4.8% |
| Not-for-profit Organizations | 165 | 12.8% |
| Local Government Employees | 103 | 8.0% |
| State Government Employees | 15 | 1.2% |
| Federal Government Employees | 501 | 38.7% |
| Unpaid Family Workers | 5 | 0.4% |
| Total | 1,294 | 100.0% |
Employment Status by Age in Cape May
According to the labor force statistics for Cape May, out of the total population over 16 years of age (2,438), 56.3% or 1,373 individuals are in the labor force, with 4.7% or 65 of them unemployed. The age group with the highest labor force participation rate is 30 to 34 years, with 100.0% or 53 individuals in the labor force. Within the labor force, the 20 to 24 years age range has the highest percentage of unemployed individuals, with 27.8% or 55 of them being unemployed.
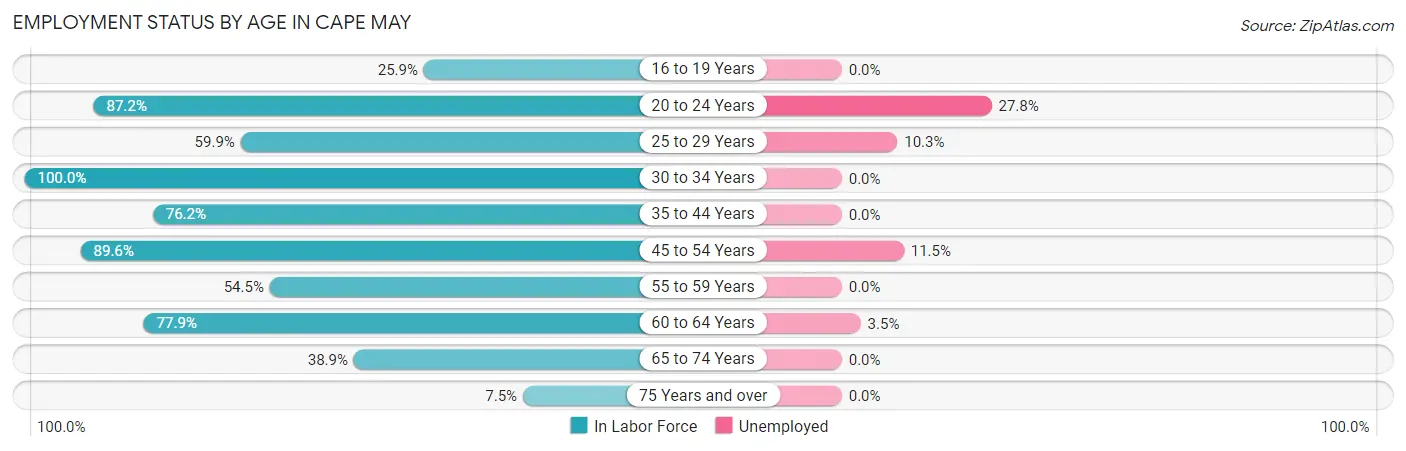
| Age Bracket | In Labor Force | Unemployed |
| 16 to 19 Years | 41 (25.9%) | 0 (0.0%) |
| 20 to 24 Years | 198 (87.2%) | 55 (27.8%) |
| 25 to 29 Years | 248 (59.9%) | 26 (10.3%) |
| 30 to 34 Years | 53 (100.0%) | 0 (0.0%) |
| 35 to 44 Years | 195 (76.2%) | 0 (0.0%) |
| 45 to 54 Years | 138 (89.6%) | 16 (11.5%) |
| 55 to 59 Years | 61 (54.5%) | 0 (0.0%) |
| 60 to 64 Years | 226 (77.9%) | 8 (3.5%) |
| 65 to 74 Years | 192 (38.9%) | 0 (0.0%) |
| 75 Years and over | 21 (7.5%) | 0 (0.0%) |
| Total | 1,373 (56.3%) | 65 (4.7%) |
Employment Status by Educational Attainment in Cape May
According to labor force statistics for Cape May, 72.0% of individuals (921) out of the total population between 25 and 64 years of age (1,279) are in the labor force, with 5.1% or 47 of them being unemployed. The group with the highest labor force participation rate are those with the educational attainment of college / associate degree, with 79.6% or 324 individuals in the labor force. Within the labor force, individuals with high school diploma education have the highest percentage of unemployment, with 7.8% or 10 of them being unemployed.
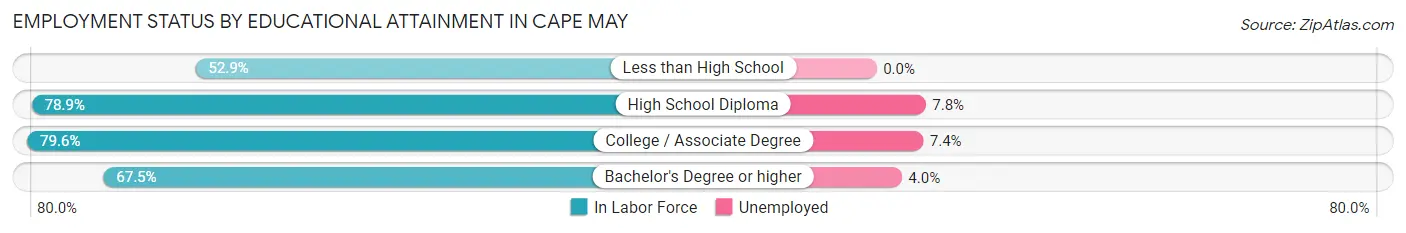
| Educational Attainment | In Labor Force | Unemployed |
| Less than High School | 37 (52.9%) | 0 (0.0%) |
| High School Diploma | 131 (78.9%) | 13 (7.8%) |
| College / Associate Degree | 324 (79.6%) | 30 (7.4%) |
| Bachelor's Degree or higher | 429 (67.5%) | 25 (4.0%) |
| Total | 921 (72.0%) | 65 (5.1%) |
Employment Occupations by Sex in Cape May
Management, Business, Science and Arts Occupations
The most common Management, Business, Science and Arts occupations in Cape May are Management (133 | 15.0%), Business & Financial (123 | 13.9%), Health Diagnosing & Treating (94 | 10.6%), Community & Social Service (80 | 9.0%), and Health Technologists (79 | 8.9%).
Management, Business, Science and Arts Occupations by Sex
Within the Management, Business, Science and Arts occupations in Cape May, the most male-oriented occupations are Architecture & Engineering (100.0%), Legal Services & Support (100.0%), and Business & Financial (87.8%), while the most female-oriented occupations are Computers & Mathematics (100.0%), Life, Physical & Social Science (100.0%), and Education, Arts & Media (100.0%).
| Occupation | Male | Female |
| Management | 96 (72.2%) | 37 (27.8%) |
| Business & Financial | 108 (87.8%) | 15 (12.2%) |
| Computers, Engineering & Science | 8 (28.6%) | 20 (71.4%) |
| Computers & Mathematics | 0 (0.0%) | 3 (100.0%) |
| Architecture & Engineering | 8 (100.0%) | 0 (0.0%) |
| Life, Physical & Social Science | 0 (0.0%) | 17 (100.0%) |
| Community & Social Service | 31 (38.8%) | 49 (61.3%) |
| Education, Arts & Media | 0 (0.0%) | 20 (100.0%) |
| Legal Services & Support | 14 (100.0%) | 0 (0.0%) |
| Education Instruction & Library | 17 (43.6%) | 22 (56.4%) |
| Arts, Media & Entertainment | 0 (0.0%) | 7 (100.0%) |
| Health Diagnosing & Treating | 17 (18.1%) | 77 (81.9%) |
| Health Technologists | 17 (21.5%) | 62 (78.5%) |
| Total (Category) | 260 (56.8%) | 198 (43.2%) |
| Total (Overall) | 430 (48.5%) | 457 (51.5%) |
Services Occupations
The most common Services occupations in Cape May are Food Preparation & Serving (63 | 7.1%), Cleaning & Maintenance (36 | 4.1%), Personal Care & Service (29 | 3.3%), and Healthcare Support (3 | 0.3%).
Services Occupations by Sex
Within the Services occupations in Cape May, the most male-oriented occupations are Healthcare Support (100.0%), Food Preparation & Serving (52.4%), and Personal Care & Service (34.5%), while the most female-oriented occupations are Cleaning & Maintenance (100.0%), Personal Care & Service (65.5%), and Food Preparation & Serving (47.6%).
| Occupation | Male | Female |
| Healthcare Support | 3 (100.0%) | 0 (0.0%) |
| Security & Protection | 0 (0.0%) | 0 (0.0%) |
| Firefighting & Prevention | 0 (0.0%) | 0 (0.0%) |
| Law Enforcement | 0 (0.0%) | 0 (0.0%) |
| Food Preparation & Serving | 33 (52.4%) | 30 (47.6%) |
| Cleaning & Maintenance | 0 (0.0%) | 36 (100.0%) |
| Personal Care & Service | 10 (34.5%) | 19 (65.5%) |
| Total (Category) | 46 (35.1%) | 85 (64.9%) |
| Total (Overall) | 430 (48.5%) | 457 (51.5%) |
Sales and Office Occupations
The most common Sales and Office occupations in Cape May are Office & Administration (110 | 12.4%), and Sales & Related (109 | 12.3%).

Sales and Office Occupations by Sex
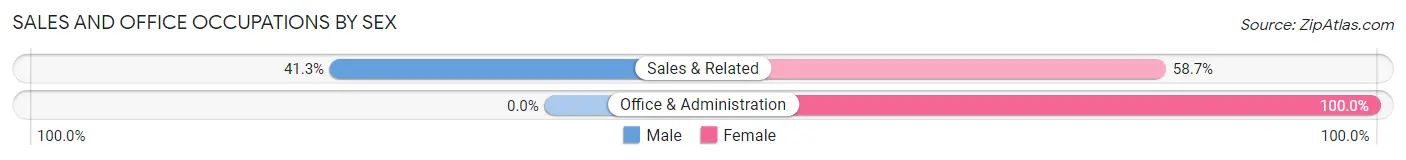
| Occupation | Male | Female |
| Sales & Related | 45 (41.3%) | 64 (58.7%) |
| Office & Administration | 0 (0.0%) | 110 (100.0%) |
| Total (Category) | 45 (20.5%) | 174 (79.4%) |
| Total (Overall) | 430 (48.5%) | 457 (51.5%) |
Natural Resources, Construction and Maintenance Occupations
The most common Natural Resources, Construction and Maintenance occupations in Cape May are Construction & Extraction (29 | 3.3%), and Farming, Fishing & Forestry (7 | 0.8%).
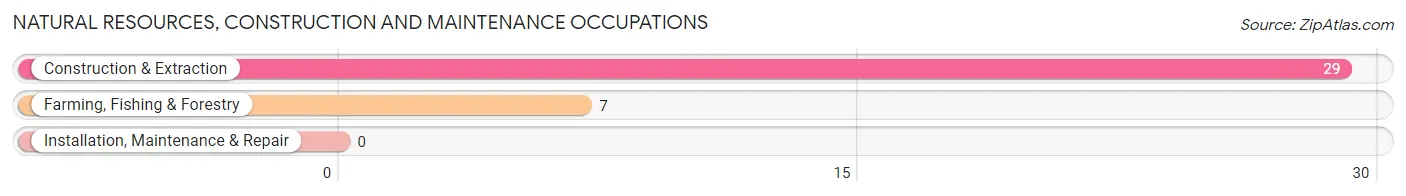
Natural Resources, Construction and Maintenance Occupations by Sex
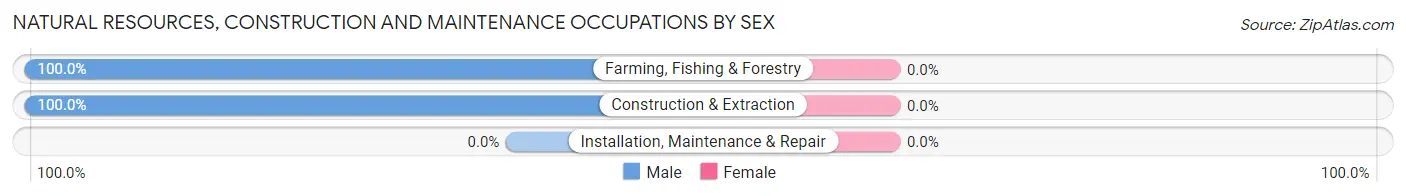
| Occupation | Male | Female |
| Farming, Fishing & Forestry | 7 (100.0%) | 0 (0.0%) |
| Construction & Extraction | 29 (100.0%) | 0 (0.0%) |
| Installation, Maintenance & Repair | 0 (0.0%) | 0 (0.0%) |
| Total (Category) | 36 (100.0%) | 0 (0.0%) |
| Total (Overall) | 430 (48.5%) | 457 (51.5%) |
Production, Transportation and Moving Occupations
The most common Production, Transportation and Moving occupations in Cape May are , and Production (43 | 4.9%).
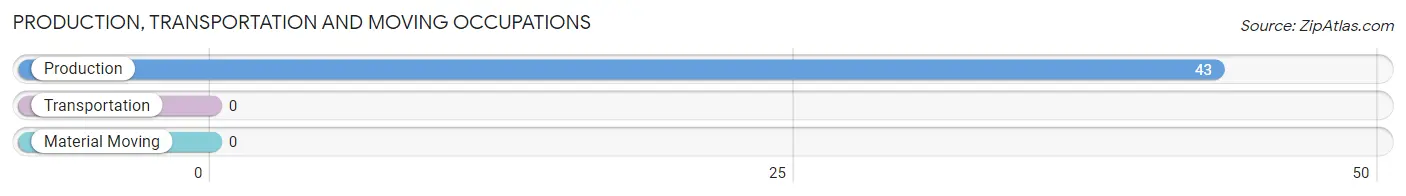
Production, Transportation and Moving Occupations by Sex
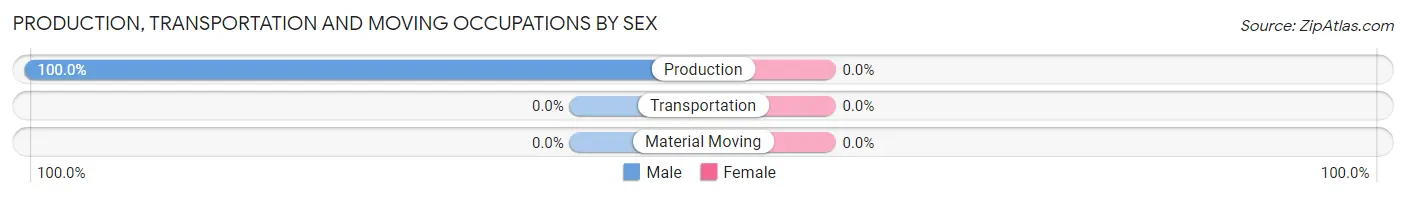
| Occupation | Male | Female |
| Production | 43 (100.0%) | 0 (0.0%) |
| Transportation | 0 (0.0%) | 0 (0.0%) |
| Material Moving | 0 (0.0%) | 0 (0.0%) |
| Total (Category) | 43 (100.0%) | 0 (0.0%) |
| Total (Overall) | 430 (48.5%) | 457 (51.5%) |
Employment Industries by Sex in Cape May
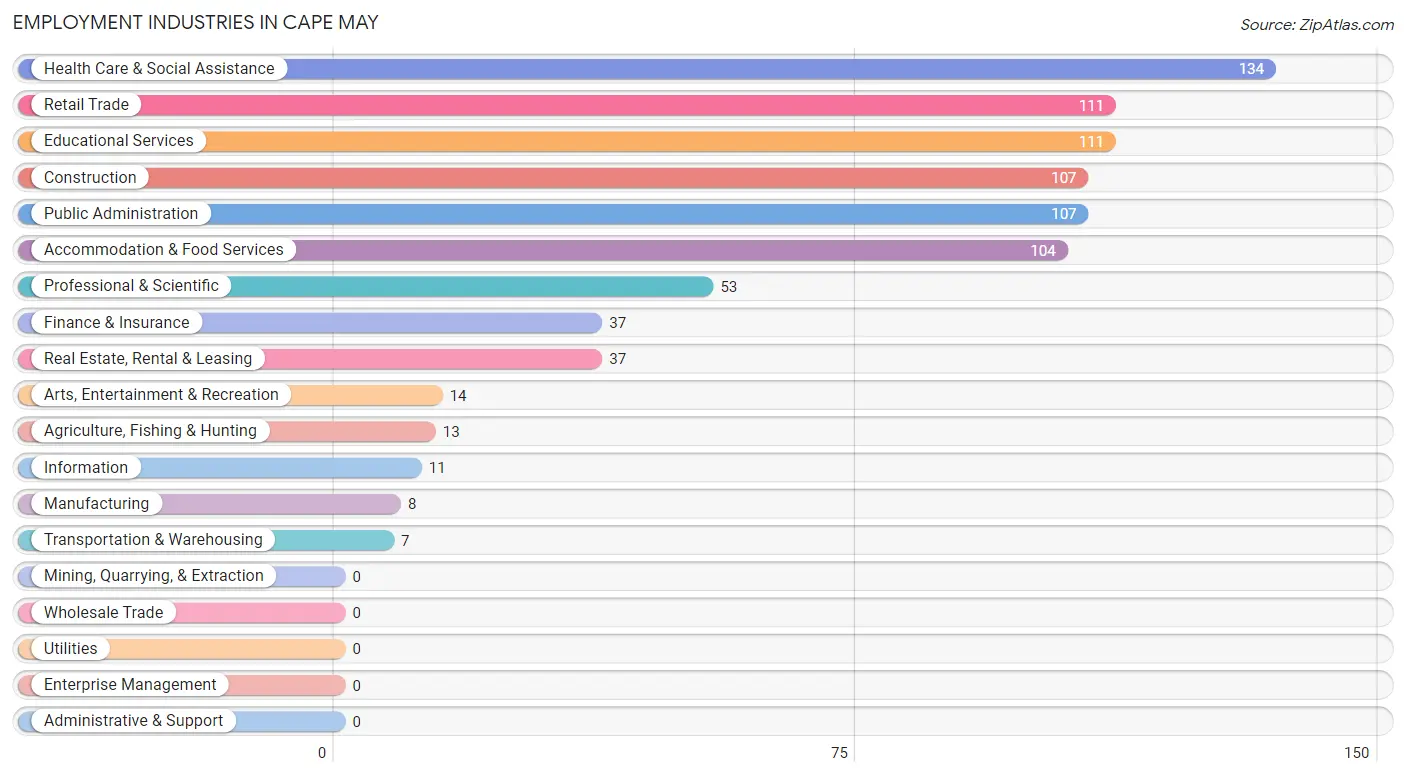
Employment Industries in Cape May
The major employment industries in Cape May include Health Care & Social Assistance (134 | 15.1%), Retail Trade (111 | 12.5%), Educational Services (111 | 12.5%), Construction (107 | 12.1%), and Public Administration (107 | 12.1%).
Employment Industries by Sex in Cape May
The Cape May industries that see more men than women are Construction (100.0%), Transportation & Warehousing (100.0%), and Information (100.0%), whereas the industries that tend to have a higher number of women are Manufacturing (100.0%), Arts, Entertainment & Recreation (100.0%), and Health Care & Social Assistance (85.1%).
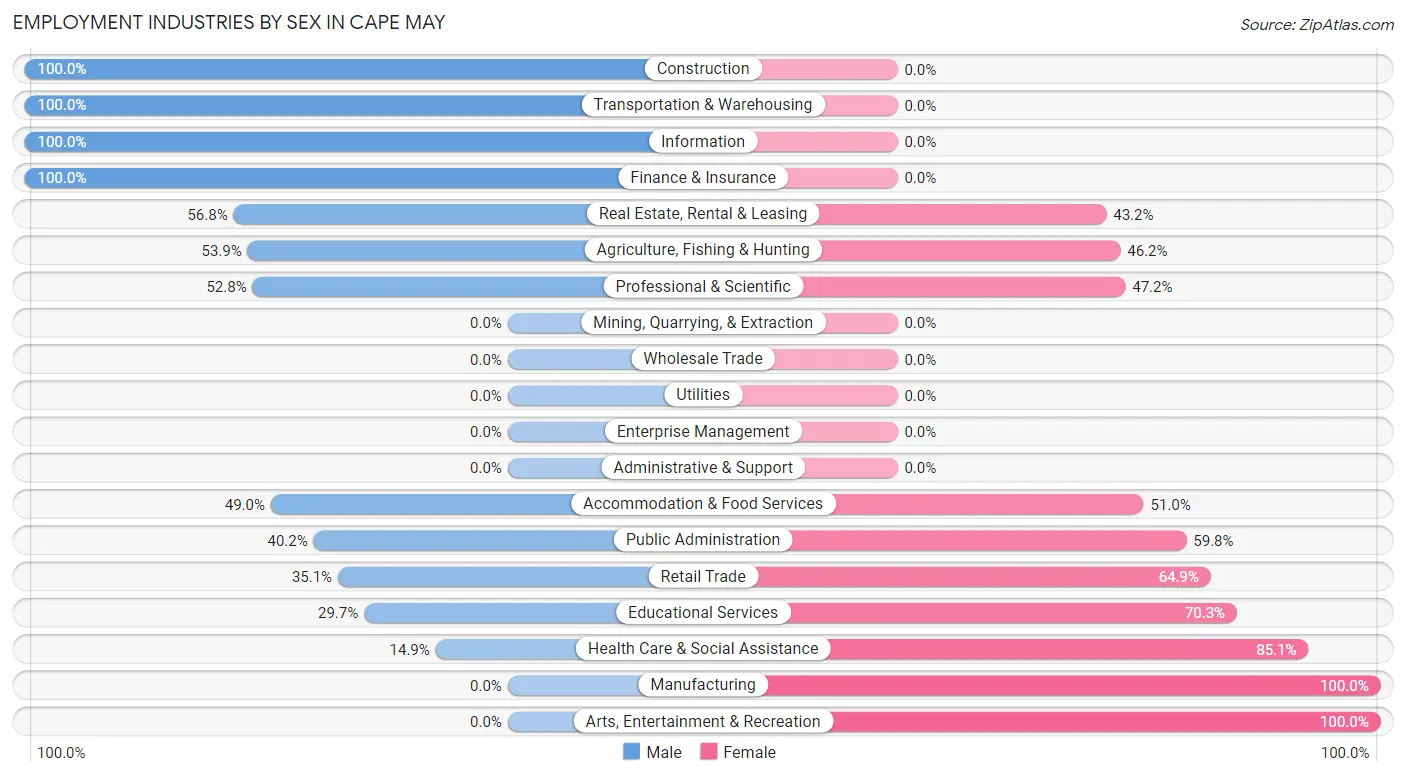
| Industry | Male | Female |
| Agriculture, Fishing & Hunting | 7 (53.8%) | 6 (46.2%) |
| Mining, Quarrying, & Extraction | 0 (0.0%) | 0 (0.0%) |
| Construction | 107 (100.0%) | 0 (0.0%) |
| Manufacturing | 0 (0.0%) | 8 (100.0%) |
| Wholesale Trade | 0 (0.0%) | 0 (0.0%) |
| Retail Trade | 39 (35.1%) | 72 (64.9%) |
| Transportation & Warehousing | 7 (100.0%) | 0 (0.0%) |
| Utilities | 0 (0.0%) | 0 (0.0%) |
| Information | 11 (100.0%) | 0 (0.0%) |
| Finance & Insurance | 37 (100.0%) | 0 (0.0%) |
| Real Estate, Rental & Leasing | 21 (56.8%) | 16 (43.2%) |
| Professional & Scientific | 28 (52.8%) | 25 (47.2%) |
| Enterprise Management | 0 (0.0%) | 0 (0.0%) |
| Administrative & Support | 0 (0.0%) | 0 (0.0%) |
| Educational Services | 33 (29.7%) | 78 (70.3%) |
| Health Care & Social Assistance | 20 (14.9%) | 114 (85.1%) |
| Arts, Entertainment & Recreation | 0 (0.0%) | 14 (100.0%) |
| Accommodation & Food Services | 51 (49.0%) | 53 (51.0%) |
| Public Administration | 43 (40.2%) | 64 (59.8%) |
| Total | 430 (48.5%) | 457 (51.5%) |
Education in Cape May
School Enrollment in Cape May
The most common levels of schooling among the 491 students in Cape May are college / undergraduate (120 | 24.4%), elementary school (104 | 21.2%), and high school (89 | 18.1%).
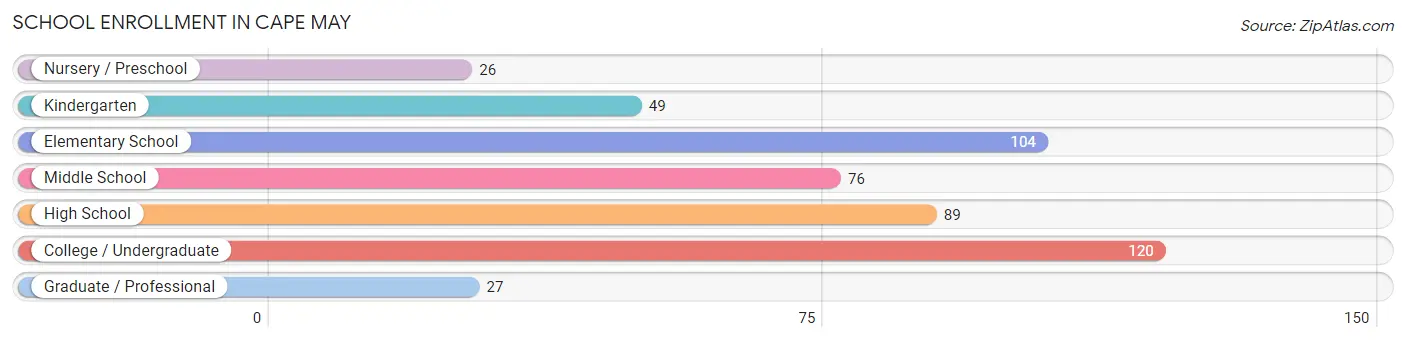
| School Level | # Students | % Students |
| Nursery / Preschool | 26 | 5.3% |
| Kindergarten | 49 | 10.0% |
| Elementary School | 104 | 21.2% |
| Middle School | 76 | 15.5% |
| High School | 89 | 18.1% |
| College / Undergraduate | 120 | 24.4% |
| Graduate / Professional | 27 | 5.5% |
| Total | 491 | 100.0% |
School Enrollment by Age by Funding Source in Cape May
Out of a total of 491 students who are enrolled in schools in Cape May, 232 (47.3%) attend a private institution, while the remaining 259 (52.7%) are enrolled in public schools. The age group of 3 to 4 year olds has the highest likelihood of being enrolled in private schools, with 26 (100.0% in the age bracket) enrolled. Conversely, the age group of 18 to 19 year olds has the lowest likelihood of being enrolled in a private school, with 57 (100.0% in the age bracket) attending a public institution.
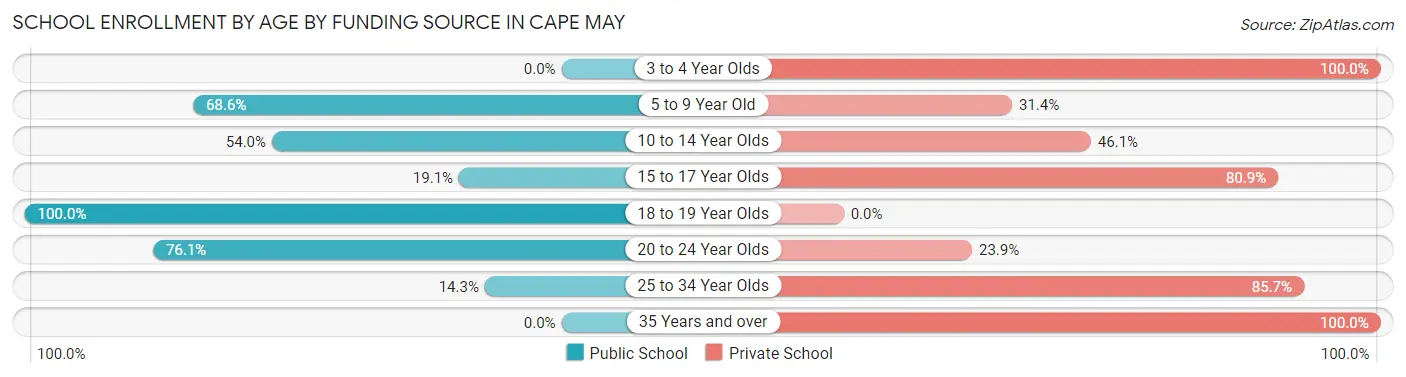
| Age Bracket | Public School | Private School |
| 3 to 4 Year Olds | 0 (0.0%) | 26 (100.0%) |
| 5 to 9 Year Old | 105 (68.6%) | 48 (31.4%) |
| 10 to 14 Year Olds | 41 (53.9%) | 35 (46.1%) |
| 15 to 17 Year Olds | 17 (19.1%) | 72 (80.9%) |
| 18 to 19 Year Olds | 57 (100.0%) | 0 (0.0%) |
| 20 to 24 Year Olds | 35 (76.1%) | 11 (23.9%) |
| 25 to 34 Year Olds | 4 (14.3%) | 24 (85.7%) |
| 35 Years and over | 0 (0.0%) | 16 (100.0%) |
| Total | 259 (52.7%) | 232 (47.3%) |
Educational Attainment by Field of Study in Cape May
Education (201 | 17.7%), business (179 | 15.7%), engineering (111 | 9.8%), arts & humanities (105 | 9.2%), and social sciences (104 | 9.1%) are the most common fields of study among 1,138 individuals in Cape May who have obtained a bachelor's degree or higher.
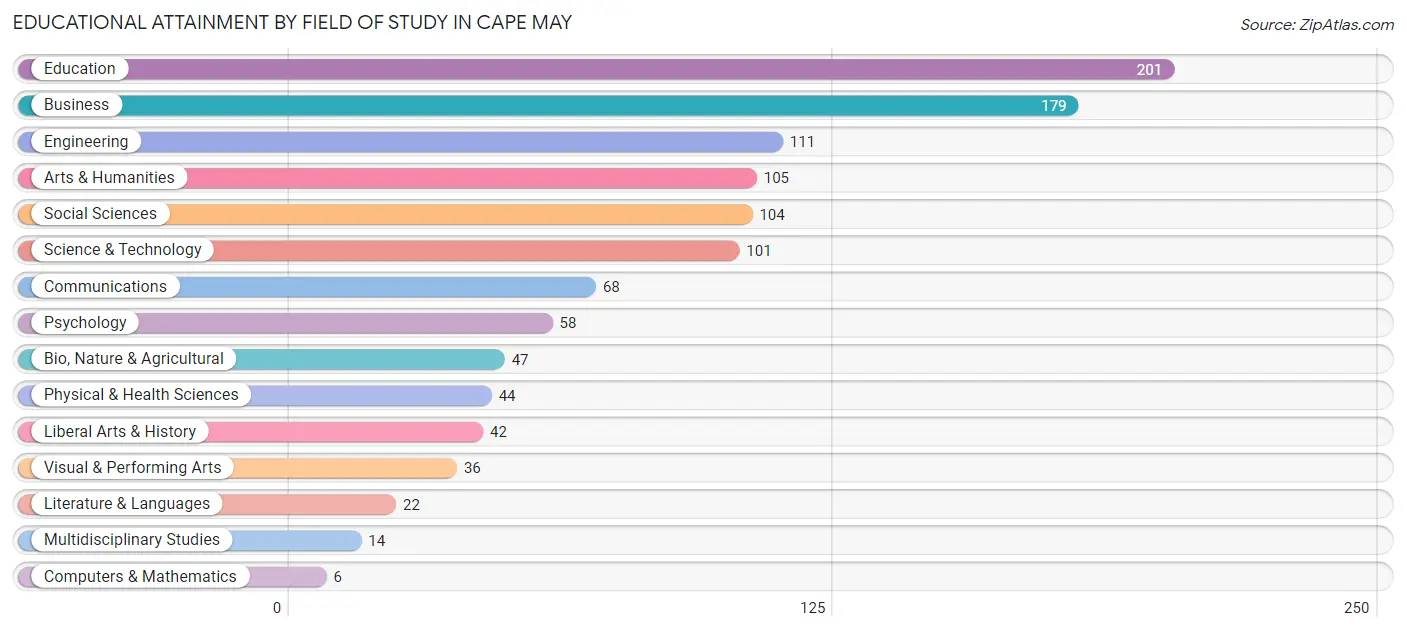
| Field of Study | # Graduates | % Graduates |
| Computers & Mathematics | 6 | 0.5% |
| Bio, Nature & Agricultural | 47 | 4.1% |
| Physical & Health Sciences | 44 | 3.9% |
| Psychology | 58 | 5.1% |
| Social Sciences | 104 | 9.1% |
| Engineering | 111 | 9.8% |
| Multidisciplinary Studies | 14 | 1.2% |
| Science & Technology | 101 | 8.9% |
| Business | 179 | 15.7% |
| Education | 201 | 17.7% |
| Literature & Languages | 22 | 1.9% |
| Liberal Arts & History | 42 | 3.7% |
| Visual & Performing Arts | 36 | 3.2% |
| Communications | 68 | 6.0% |
| Arts & Humanities | 105 | 9.2% |
| Total | 1,138 | 100.0% |
Transportation & Commute in Cape May
Vehicle Availability by Sex in Cape May
The most prevalent vehicle ownership categories in Cape May are males with 2 vehicles (340, accounting for 54.7%) and females with 2 vehicles (166, making up 80.6%).
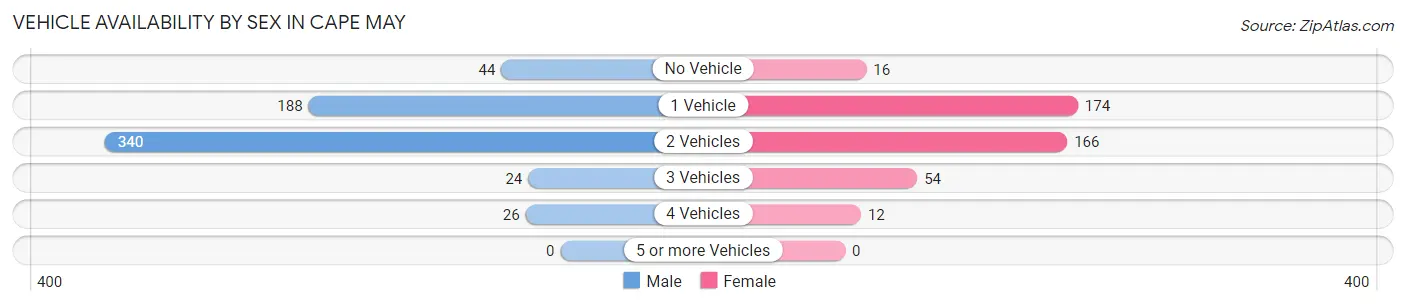
| Vehicles Available | Male | Female |
| No Vehicle | 44 (7.1%) | 16 (3.8%) |
| 1 Vehicle | 188 (30.2%) | 174 (41.2%) |
| 2 Vehicles | 340 (54.7%) | 166 (39.3%) |
| 3 Vehicles | 24 (3.9%) | 54 (12.8%) |
| 4 Vehicles | 26 (4.2%) | 12 (2.8%) |
| 5 or more Vehicles | 0 (0.0%) | 0 (0.0%) |
| Total | 622 (100.0%) | 422 (100.0%) |
Commute Time in Cape May
The most frequently occuring commute durations in Cape May are 5 to 9 minutes (403 commuters, 33.4%), less than 5 minutes (239 commuters, 19.8%), and 10 to 14 minutes (144 commuters, 11.9%).
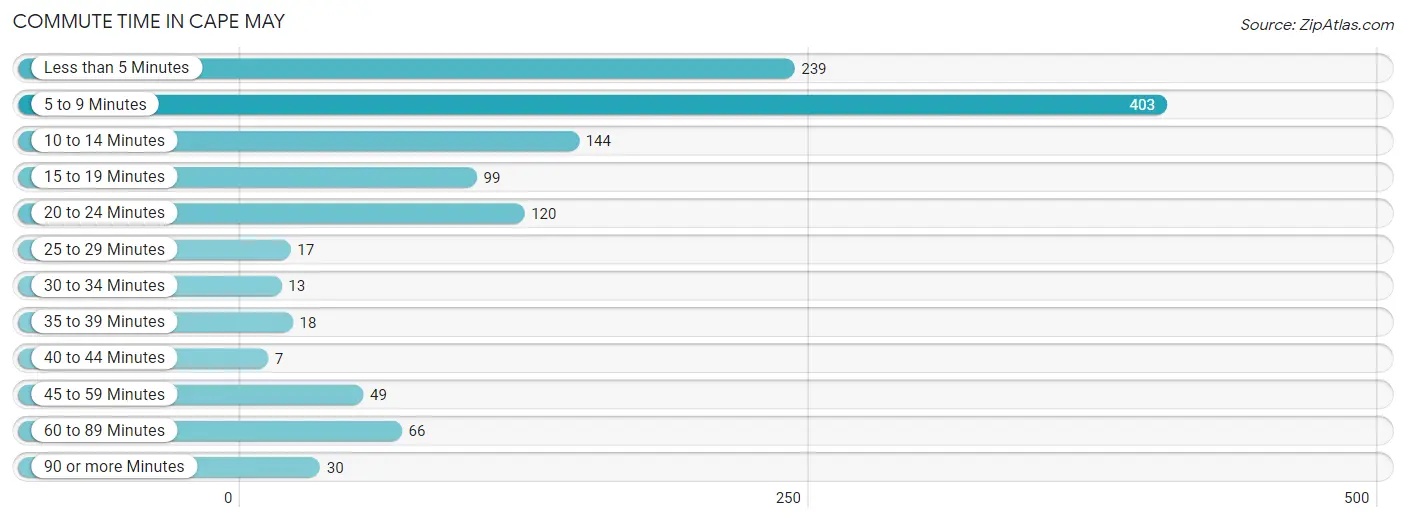
| Commute Time | # Commuters | % Commuters |
| Less than 5 Minutes | 239 | 19.8% |
| 5 to 9 Minutes | 403 | 33.4% |
| 10 to 14 Minutes | 144 | 11.9% |
| 15 to 19 Minutes | 99 | 8.2% |
| 20 to 24 Minutes | 120 | 10.0% |
| 25 to 29 Minutes | 17 | 1.4% |
| 30 to 34 Minutes | 13 | 1.1% |
| 35 to 39 Minutes | 18 | 1.5% |
| 40 to 44 Minutes | 7 | 0.6% |
| 45 to 59 Minutes | 49 | 4.1% |
| 60 to 89 Minutes | 66 | 5.5% |
| 90 or more Minutes | 30 | 2.5% |
Commute Time by Sex in Cape May
The most common commute times in Cape May are 5 to 9 minutes (315 commuters, 39.9%) for males and 20 to 24 minutes (108 commuters, 26.0%) for females.
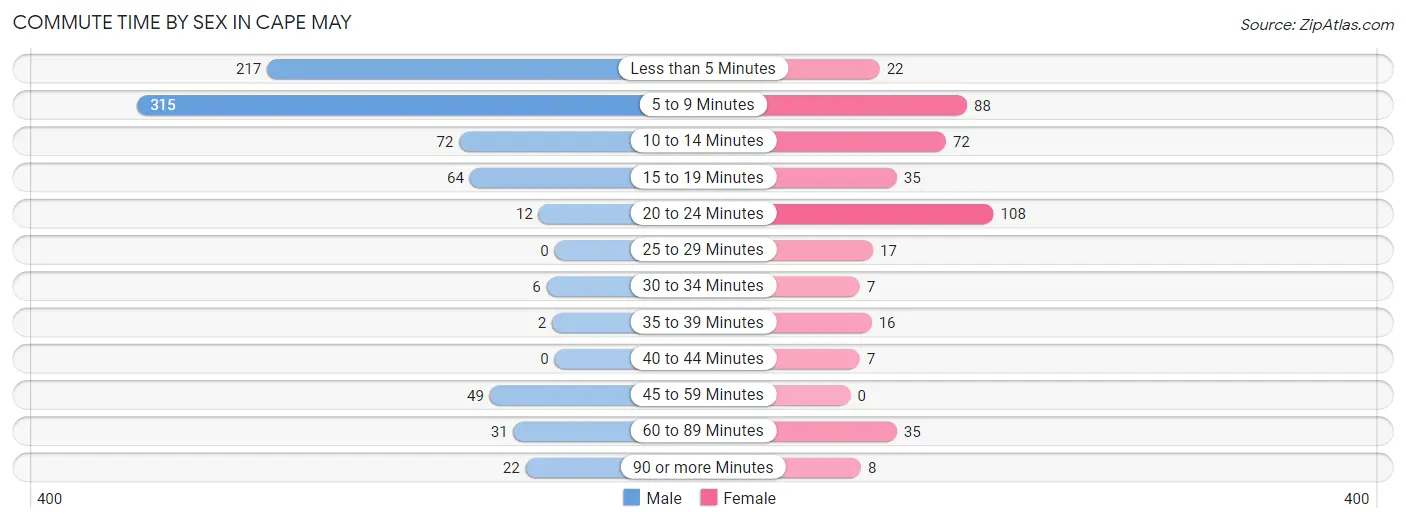
| Commute Time | Male | Female |
| Less than 5 Minutes | 217 (27.5%) | 22 (5.3%) |
| 5 to 9 Minutes | 315 (39.9%) | 88 (21.2%) |
| 10 to 14 Minutes | 72 (9.1%) | 72 (17.3%) |
| 15 to 19 Minutes | 64 (8.1%) | 35 (8.4%) |
| 20 to 24 Minutes | 12 (1.5%) | 108 (26.0%) |
| 25 to 29 Minutes | 0 (0.0%) | 17 (4.1%) |
| 30 to 34 Minutes | 6 (0.8%) | 7 (1.7%) |
| 35 to 39 Minutes | 2 (0.3%) | 16 (3.9%) |
| 40 to 44 Minutes | 0 (0.0%) | 7 (1.7%) |
| 45 to 59 Minutes | 49 (6.2%) | 0 (0.0%) |
| 60 to 89 Minutes | 31 (3.9%) | 35 (8.4%) |
| 90 or more Minutes | 22 (2.8%) | 8 (1.9%) |
Time of Departure to Work by Sex in Cape May
The most frequent times of departure to work in Cape May are 7:30 AM to 7:59 AM (197, 24.9%) for males and 8:00 AM to 8:29 AM (140, 33.7%) for females.
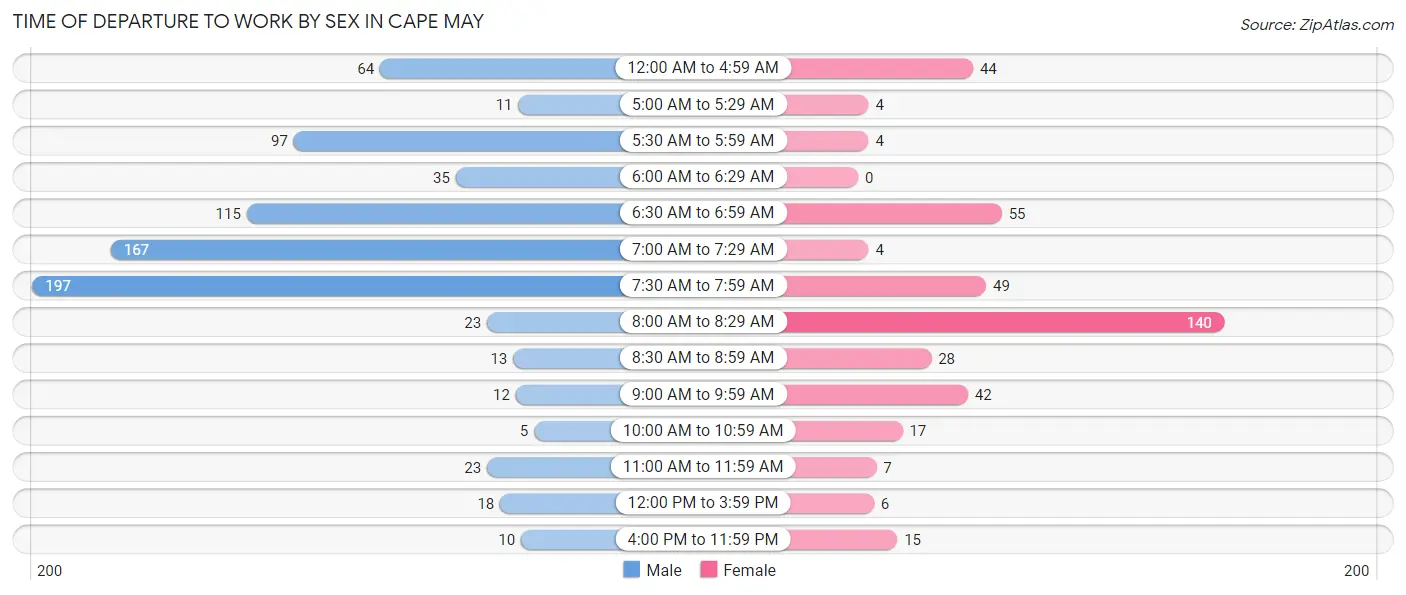
| Time of Departure | Male | Female |
| 12:00 AM to 4:59 AM | 64 (8.1%) | 44 (10.6%) |
| 5:00 AM to 5:29 AM | 11 (1.4%) | 4 (1.0%) |
| 5:30 AM to 5:59 AM | 97 (12.3%) | 4 (1.0%) |
| 6:00 AM to 6:29 AM | 35 (4.4%) | 0 (0.0%) |
| 6:30 AM to 6:59 AM | 115 (14.6%) | 55 (13.3%) |
| 7:00 AM to 7:29 AM | 167 (21.1%) | 4 (1.0%) |
| 7:30 AM to 7:59 AM | 197 (24.9%) | 49 (11.8%) |
| 8:00 AM to 8:29 AM | 23 (2.9%) | 140 (33.7%) |
| 8:30 AM to 8:59 AM | 13 (1.7%) | 28 (6.8%) |
| 9:00 AM to 9:59 AM | 12 (1.5%) | 42 (10.1%) |
| 10:00 AM to 10:59 AM | 5 (0.6%) | 17 (4.1%) |
| 11:00 AM to 11:59 AM | 23 (2.9%) | 7 (1.7%) |
| 12:00 PM to 3:59 PM | 18 (2.3%) | 6 (1.5%) |
| 4:00 PM to 11:59 PM | 10 (1.3%) | 15 (3.6%) |
| Total | 790 (100.0%) | 415 (100.0%) |
Housing Occupancy in Cape May
Occupancy by Ownership in Cape May
Of the total 1,233 dwellings in Cape May, owner-occupied units account for 719 (58.3%), while renter-occupied units make up 514 (41.7%).
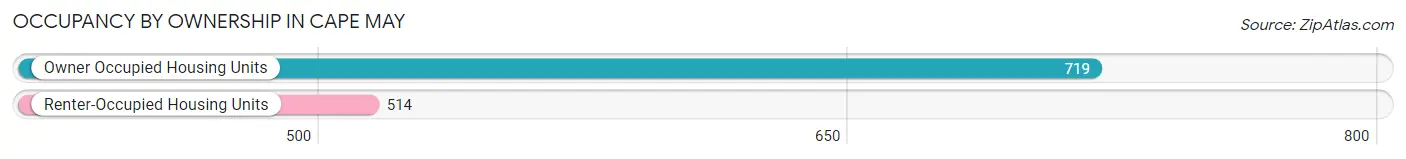
| Occupancy | # Housing Units | % Housing Units |
| Owner Occupied Housing Units | 719 | 58.3% |
| Renter-Occupied Housing Units | 514 | 41.7% |
| Total Occupied Housing Units | 1,233 | 100.0% |
Occupancy by Household Size in Cape May
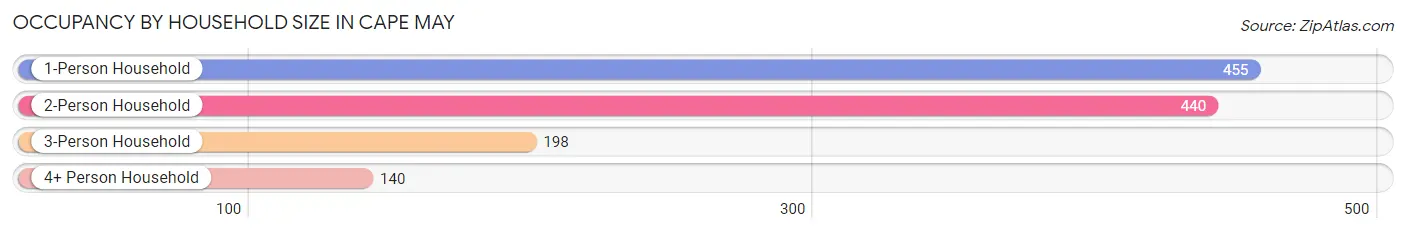
| Household Size | # Housing Units | % Housing Units |
| 1-Person Household | 455 | 36.9% |
| 2-Person Household | 440 | 35.7% |
| 3-Person Household | 198 | 16.1% |
| 4+ Person Household | 140 | 11.4% |
| Total Housing Units | 1,233 | 100.0% |
Occupancy by Ownership by Household Size in Cape May
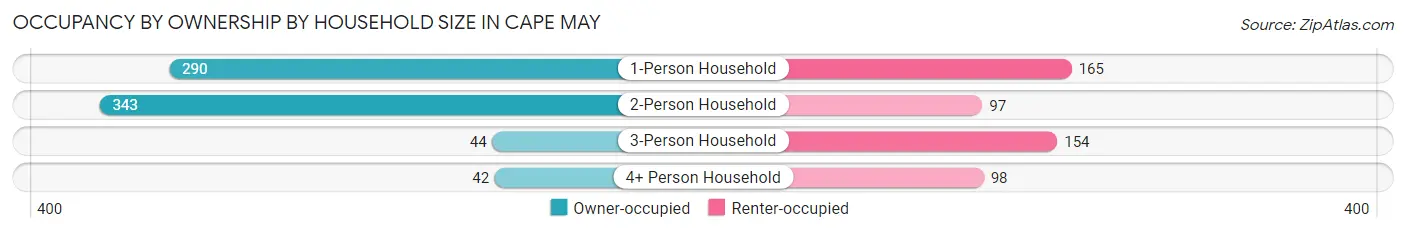
| Household Size | Owner-occupied | Renter-occupied |
| 1-Person Household | 290 (63.7%) | 165 (36.3%) |
| 2-Person Household | 343 (77.9%) | 97 (22.1%) |
| 3-Person Household | 44 (22.2%) | 154 (77.8%) |
| 4+ Person Household | 42 (30.0%) | 98 (70.0%) |
| Total Housing Units | 719 (58.3%) | 514 (41.7%) |
Occupancy by Educational Attainment in Cape May
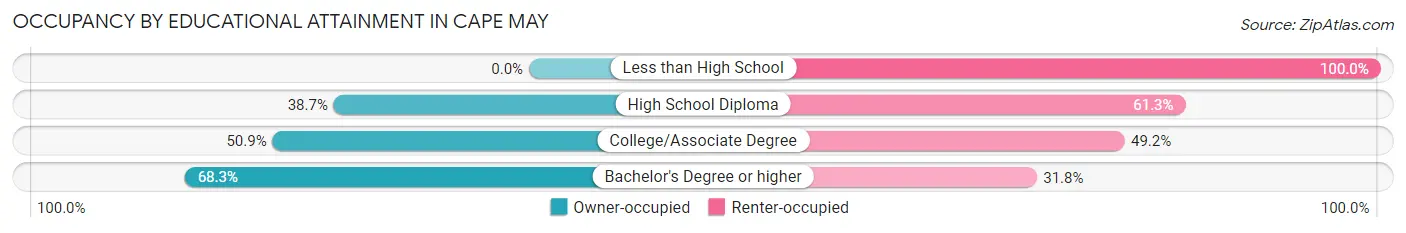
| Household Size | Owner-occupied | Renter-occupied |
| Less than High School | 0 (0.0%) | 34 (100.0%) |
| High School Diploma | 36 (38.7%) | 57 (61.3%) |
| College/Associate Degree | 210 (50.8%) | 203 (49.1%) |
| Bachelor's Degree or higher | 473 (68.2%) | 220 (31.8%) |
Occupancy by Age of Householder in Cape May
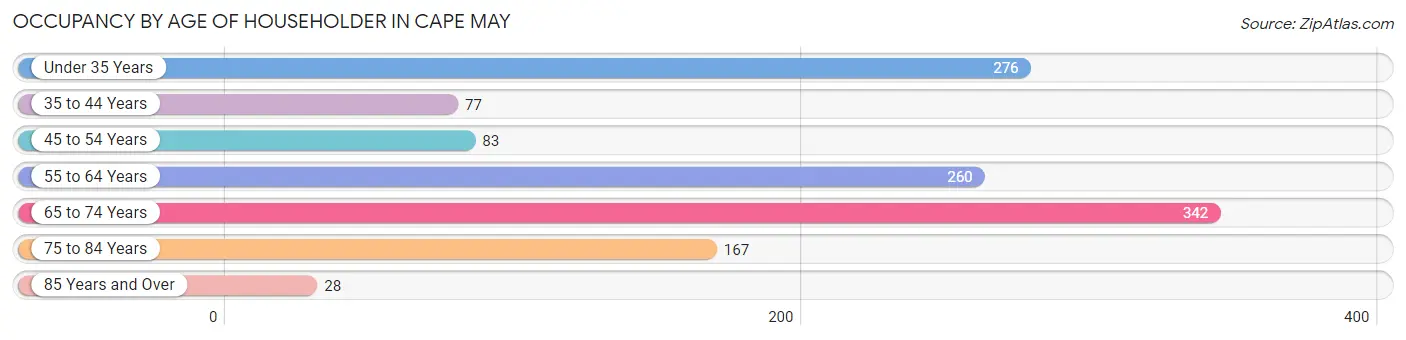
| Age Bracket | # Households | % Households |
| Under 35 Years | 276 | 22.4% |
| 35 to 44 Years | 77 | 6.2% |
| 45 to 54 Years | 83 | 6.7% |
| 55 to 64 Years | 260 | 21.1% |
| 65 to 74 Years | 342 | 27.7% |
| 75 to 84 Years | 167 | 13.5% |
| 85 Years and Over | 28 | 2.3% |
| Total | 1,233 | 100.0% |
Housing Finances in Cape May
Median Income by Occupancy in Cape May
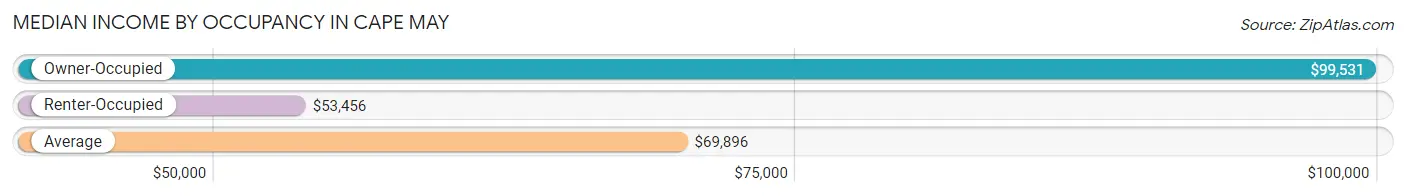
| Occupancy Type | # Households | Median Income |
| Owner-Occupied | 719 (58.3%) | $99,531 |
| Renter-Occupied | 514 (41.7%) | $53,456 |
| Average | 1,233 (100.0%) | $69,896 |
Occupancy by Householder Income Bracket in Cape May
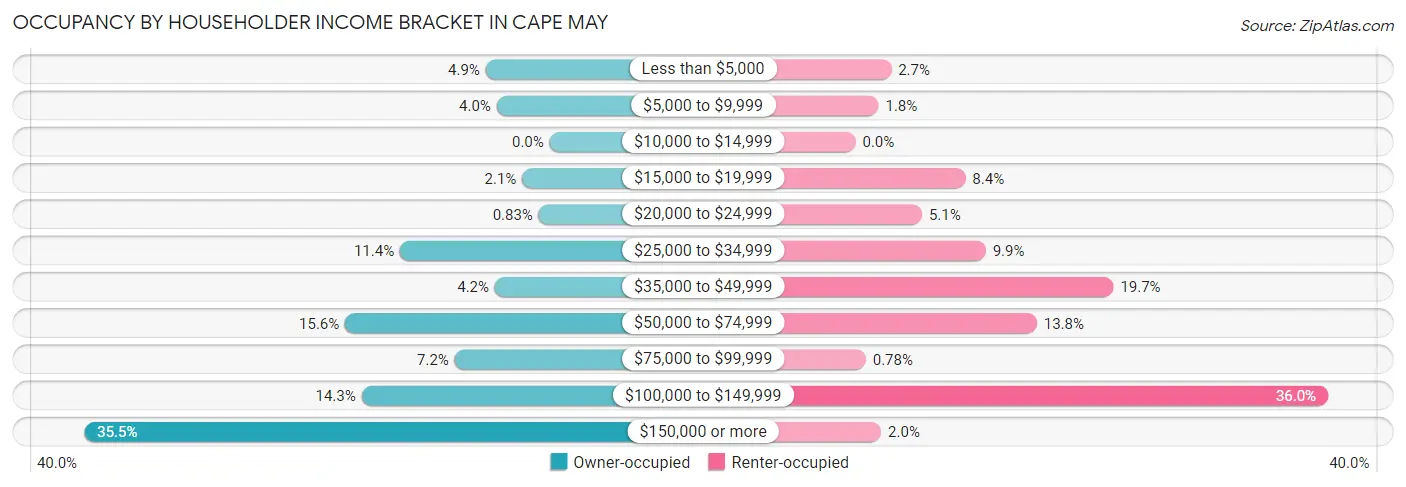
| Income Bracket | Owner-occupied | Renter-occupied |
| Less than $5,000 | 35 (4.9%) | 14 (2.7%) |
| $5,000 to $9,999 | 29 (4.0%) | 9 (1.8%) |
| $10,000 to $14,999 | 0 (0.0%) | 0 (0.0%) |
| $15,000 to $19,999 | 15 (2.1%) | 43 (8.4%) |
| $20,000 to $24,999 | 6 (0.8%) | 26 (5.1%) |
| $25,000 to $34,999 | 82 (11.4%) | 51 (9.9%) |
| $35,000 to $49,999 | 30 (4.2%) | 101 (19.7%) |
| $50,000 to $74,999 | 112 (15.6%) | 71 (13.8%) |
| $75,000 to $99,999 | 52 (7.2%) | 4 (0.8%) |
| $100,000 to $149,999 | 103 (14.3%) | 185 (36.0%) |
| $150,000 or more | 255 (35.5%) | 10 (1.9%) |
| Total | 719 (100.0%) | 514 (100.0%) |
Monthly Housing Cost Tiers in Cape May
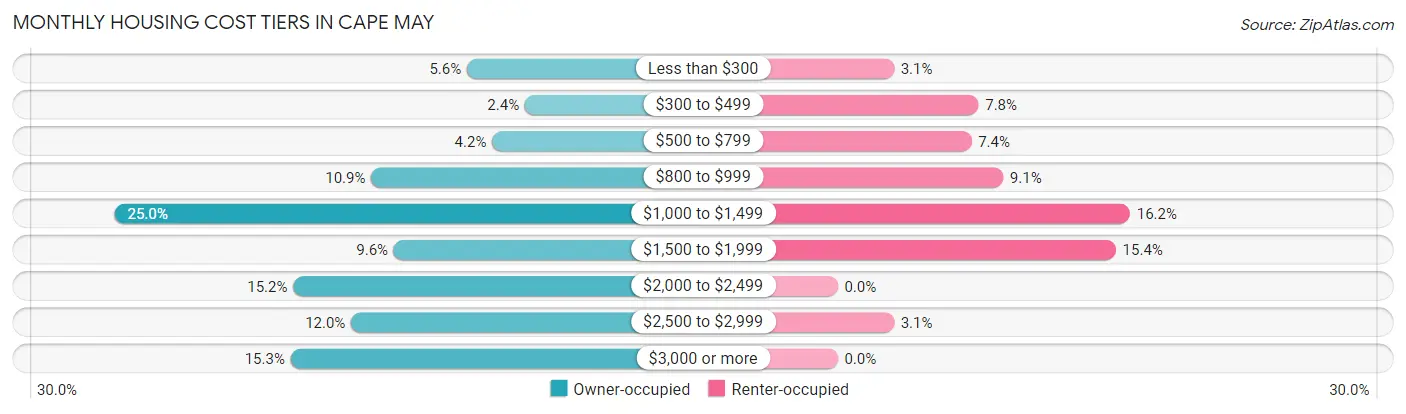
| Monthly Cost | Owner-occupied | Renter-occupied |
| Less than $300 | 40 (5.6%) | 16 (3.1%) |
| $300 to $499 | 17 (2.4%) | 40 (7.8%) |
| $500 to $799 | 30 (4.2%) | 38 (7.4%) |
| $800 to $999 | 78 (10.8%) | 47 (9.1%) |
| $1,000 to $1,499 | 180 (25.0%) | 83 (16.2%) |
| $1,500 to $1,999 | 69 (9.6%) | 79 (15.4%) |
| $2,000 to $2,499 | 109 (15.2%) | 0 (0.0%) |
| $2,500 to $2,999 | 86 (12.0%) | 16 (3.1%) |
| $3,000 or more | 110 (15.3%) | 0 (0.0%) |
| Total | 719 (100.0%) | 514 (100.0%) |
Physical Housing Characteristics in Cape May
Housing Structures in Cape May
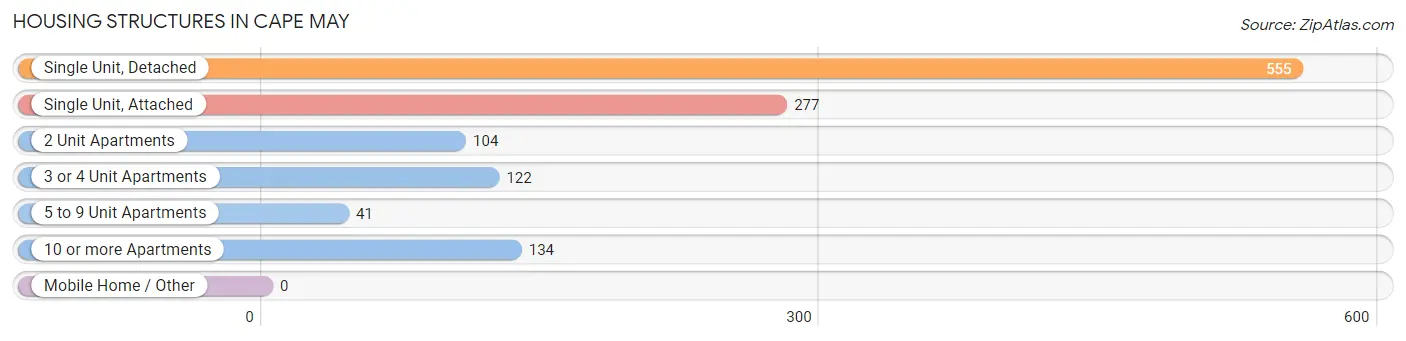
| Structure Type | # Housing Units | % Housing Units |
| Single Unit, Detached | 555 | 45.0% |
| Single Unit, Attached | 277 | 22.5% |
| 2 Unit Apartments | 104 | 8.4% |
| 3 or 4 Unit Apartments | 122 | 9.9% |
| 5 to 9 Unit Apartments | 41 | 3.3% |
| 10 or more Apartments | 134 | 10.9% |
| Mobile Home / Other | 0 | 0.0% |
| Total | 1,233 | 100.0% |
Housing Structures by Occupancy in Cape May
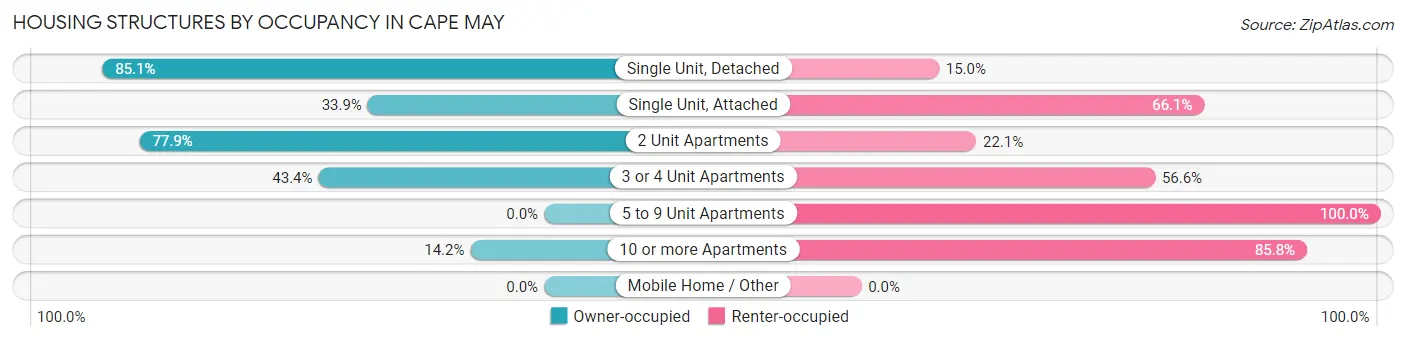
| Structure Type | Owner-occupied | Renter-occupied |
| Single Unit, Detached | 472 (85.1%) | 83 (14.9%) |
| Single Unit, Attached | 94 (33.9%) | 183 (66.1%) |
| 2 Unit Apartments | 81 (77.9%) | 23 (22.1%) |
| 3 or 4 Unit Apartments | 53 (43.4%) | 69 (56.6%) |
| 5 to 9 Unit Apartments | 0 (0.0%) | 41 (100.0%) |
| 10 or more Apartments | 19 (14.2%) | 115 (85.8%) |
| Mobile Home / Other | 0 (0.0%) | 0 (0.0%) |
| Total | 719 (58.3%) | 514 (41.7%) |
Housing Structures by Number of Rooms in Cape May
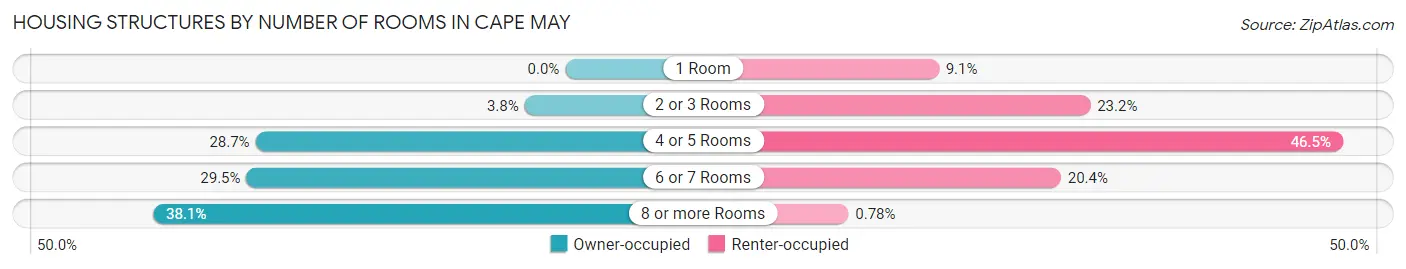
| Number of Rooms | Owner-occupied | Renter-occupied |
| 1 Room | 0 (0.0%) | 47 (9.1%) |
| 2 or 3 Rooms | 27 (3.8%) | 119 (23.2%) |
| 4 or 5 Rooms | 206 (28.6%) | 239 (46.5%) |
| 6 or 7 Rooms | 212 (29.5%) | 105 (20.4%) |
| 8 or more Rooms | 274 (38.1%) | 4 (0.8%) |
| Total | 719 (100.0%) | 514 (100.0%) |
Housing Structure by Heating Type in Cape May
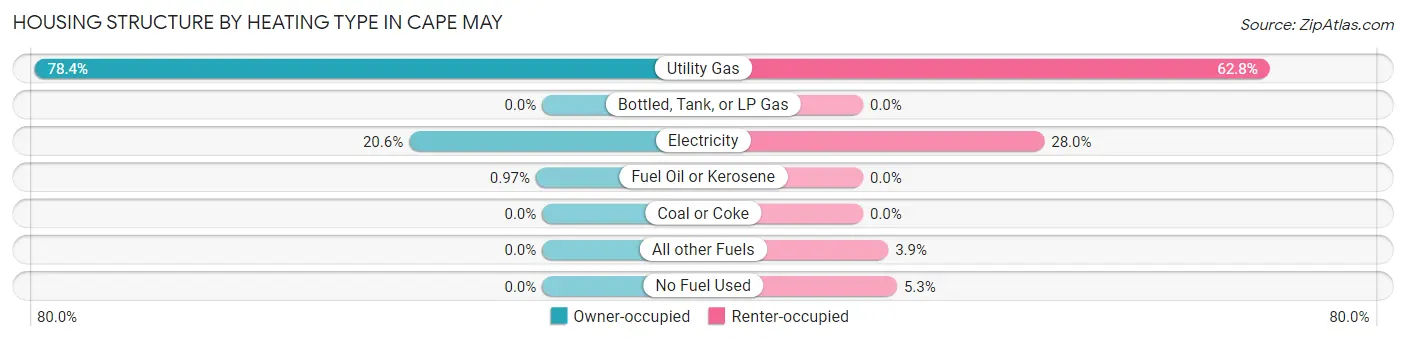
| Heating Type | Owner-occupied | Renter-occupied |
| Utility Gas | 564 (78.4%) | 323 (62.8%) |
| Bottled, Tank, or LP Gas | 0 (0.0%) | 0 (0.0%) |
| Electricity | 148 (20.6%) | 144 (28.0%) |
| Fuel Oil or Kerosene | 7 (1.0%) | 0 (0.0%) |
| Coal or Coke | 0 (0.0%) | 0 (0.0%) |
| All other Fuels | 0 (0.0%) | 20 (3.9%) |
| No Fuel Used | 0 (0.0%) | 27 (5.2%) |
| Total | 719 (100.0%) | 514 (100.0%) |
Household Vehicle Usage in Cape May
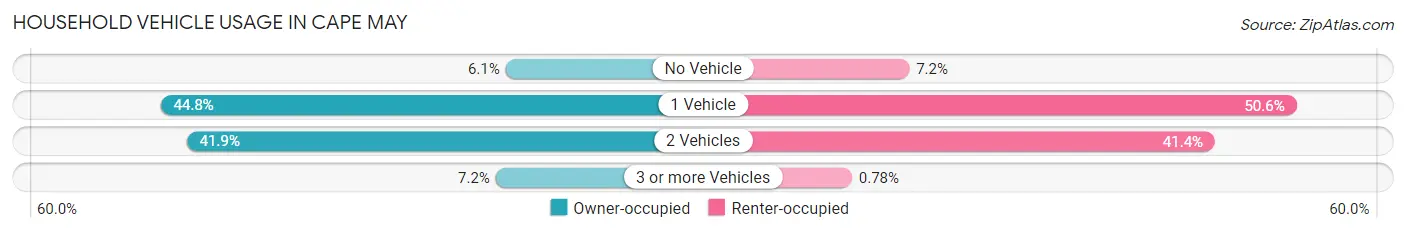
| Vehicles per Household | Owner-occupied | Renter-occupied |
| No Vehicle | 44 (6.1%) | 37 (7.2%) |
| 1 Vehicle | 322 (44.8%) | 260 (50.6%) |
| 2 Vehicles | 301 (41.9%) | 213 (41.4%) |
| 3 or more Vehicles | 52 (7.2%) | 4 (0.8%) |
| Total | 719 (100.0%) | 514 (100.0%) |
Real Estate & Mortgages in Cape May
Real Estate and Mortgage Overview in Cape May
| Characteristic | Without Mortgage | With Mortgage |
| Housing Units | 390 | 329 |
| Median Property Value | $747,200 | $803,600 |
| Median Household Income | $61,250 | $156 |
| Monthly Housing Costs | $1,091 | $96 |
| Real Estate Taxes | $7,270 | $0 |
Property Value by Mortgage Status in Cape May
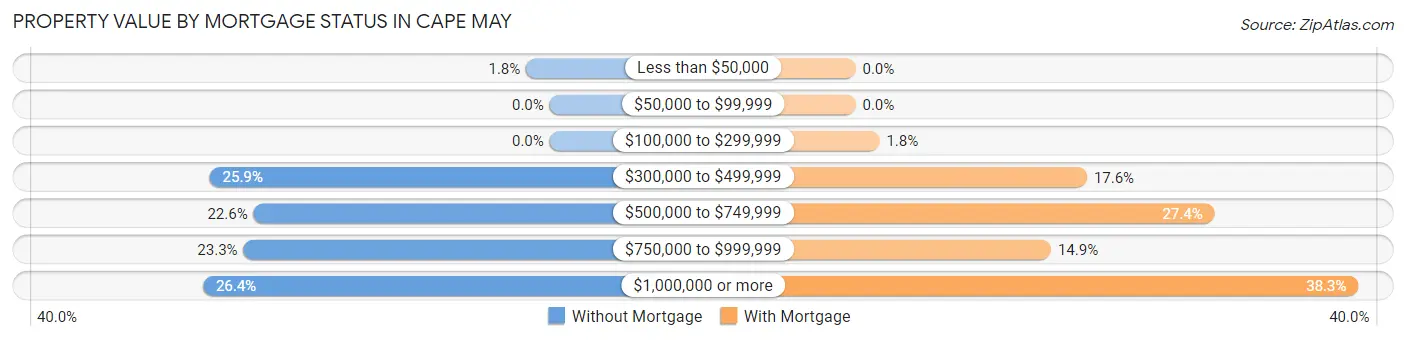
| Property Value | Without Mortgage | With Mortgage |
| Less than $50,000 | 7 (1.8%) | 0 (0.0%) |
| $50,000 to $99,999 | 0 (0.0%) | 0 (0.0%) |
| $100,000 to $299,999 | 0 (0.0%) | 6 (1.8%) |
| $300,000 to $499,999 | 101 (25.9%) | 58 (17.6%) |
| $500,000 to $749,999 | 88 (22.6%) | 90 (27.4%) |
| $750,000 to $999,999 | 91 (23.3%) | 49 (14.9%) |
| $1,000,000 or more | 103 (26.4%) | 126 (38.3%) |
| Total | 390 (100.0%) | 329 (100.0%) |
Household Income by Mortgage Status in Cape May
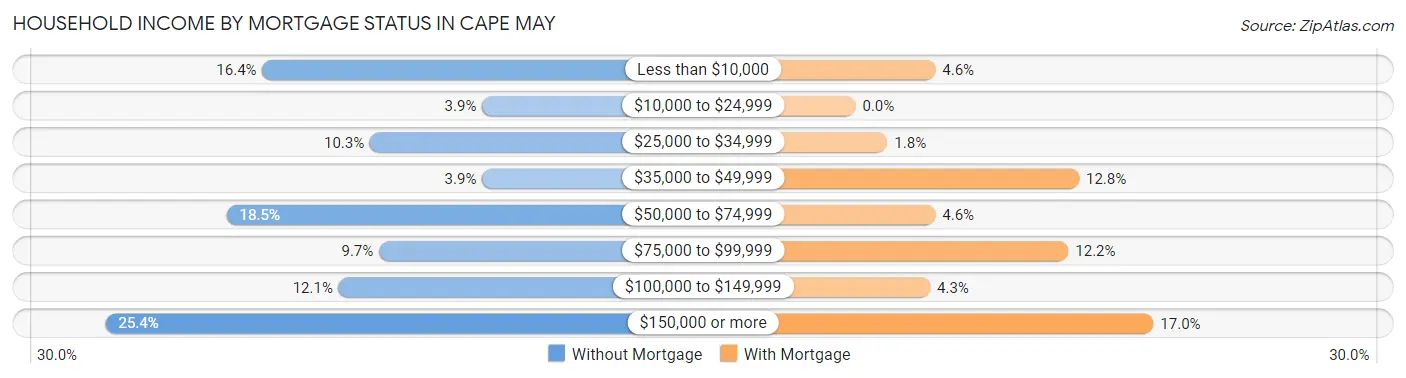
| Household Income | Without Mortgage | With Mortgage |
| Less than $10,000 | 64 (16.4%) | 15 (4.6%) |
| $10,000 to $24,999 | 15 (3.8%) | 0 (0.0%) |
| $25,000 to $34,999 | 40 (10.3%) | 6 (1.8%) |
| $35,000 to $49,999 | 15 (3.8%) | 42 (12.8%) |
| $50,000 to $74,999 | 72 (18.5%) | 15 (4.6%) |
| $75,000 to $99,999 | 38 (9.7%) | 40 (12.2%) |
| $100,000 to $149,999 | 47 (12.0%) | 14 (4.3%) |
| $150,000 or more | 99 (25.4%) | 56 (17.0%) |
| Total | 390 (100.0%) | 329 (100.0%) |
Property Value to Household Income Ratio in Cape May
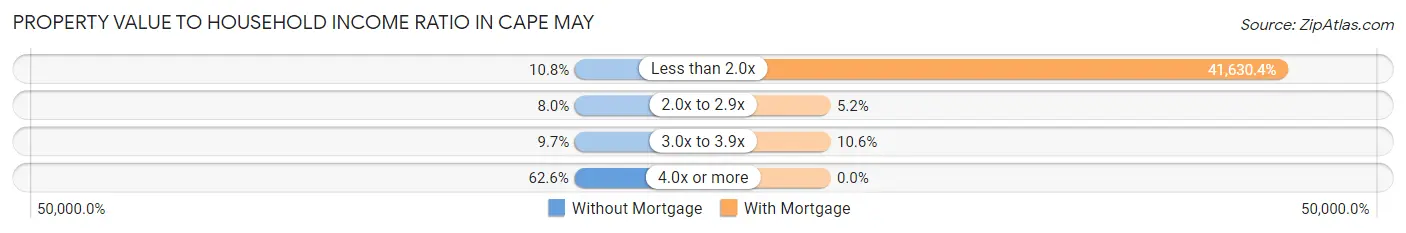
| Value-to-Income Ratio | Without Mortgage | With Mortgage |
| Less than 2.0x | 42 (10.8%) | 136,964 (41,630.4%) |
| 2.0x to 2.9x | 31 (8.0%) | 17 (5.2%) |
| 3.0x to 3.9x | 38 (9.7%) | 35 (10.6%) |
| 4.0x or more | 244 (62.6%) | 0 (0.0%) |
| Total | 390 (100.0%) | 329 (100.0%) |
Real Estate Taxes by Mortgage Status in Cape May
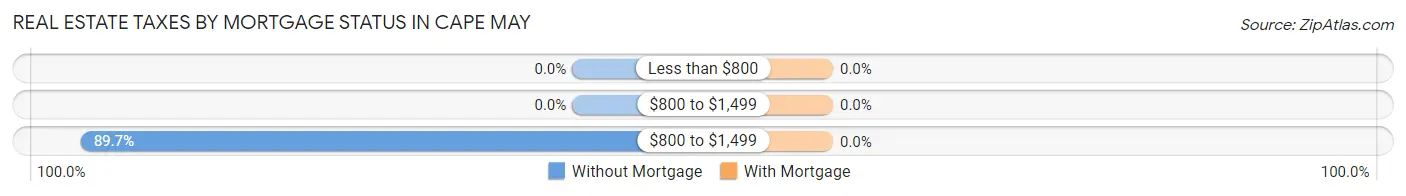
| Property Taxes | Without Mortgage | With Mortgage |
| Less than $800 | 0 (0.0%) | 0 (0.0%) |
| $800 to $1,499 | 0 (0.0%) | 0 (0.0%) |
| $800 to $1,499 | 350 (89.7%) | 0 (0.0%) |
| Total | 390 (100.0%) | 329 (100.0%) |
Health & Disability in Cape May
Health Insurance Coverage by Age in Cape May
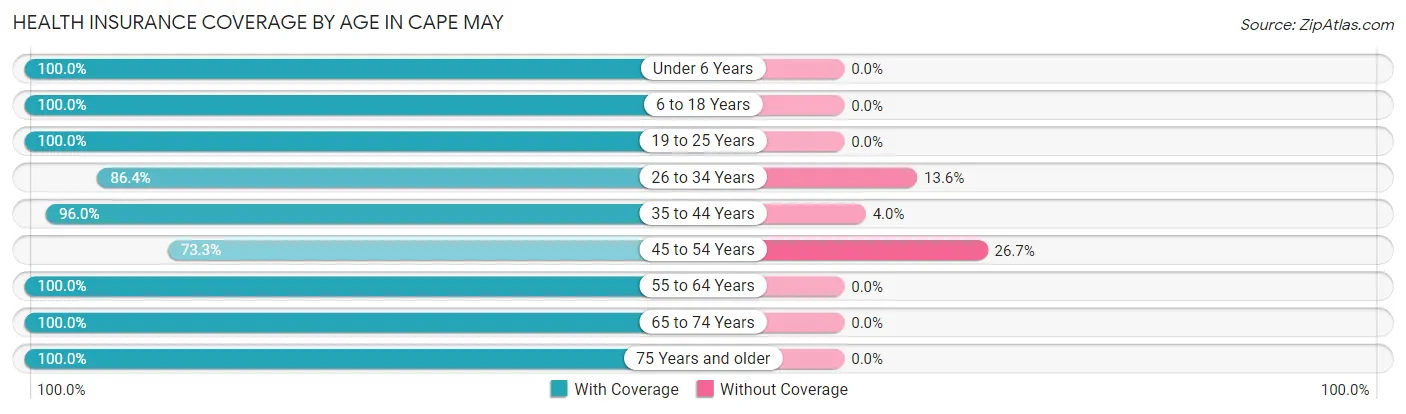
| Age Bracket | With Coverage | Without Coverage |
| Under 6 Years | 153 (100.0%) | 0 (0.0%) |
| 6 to 18 Years | 354 (100.0%) | 0 (0.0%) |
| 19 to 25 Years | 104 (100.0%) | 0 (0.0%) |
| 26 to 34 Years | 229 (86.4%) | 36 (13.6%) |
| 35 to 44 Years | 168 (96.0%) | 7 (4.0%) |
| 45 to 54 Years | 107 (73.3%) | 39 (26.7%) |
| 55 to 64 Years | 402 (100.0%) | 0 (0.0%) |
| 65 to 74 Years | 494 (100.0%) | 0 (0.0%) |
| 75 Years and older | 280 (100.0%) | 0 (0.0%) |
| Total | 2,291 (96.5%) | 82 (3.5%) |
Health Insurance Coverage by Citizenship Status in Cape May
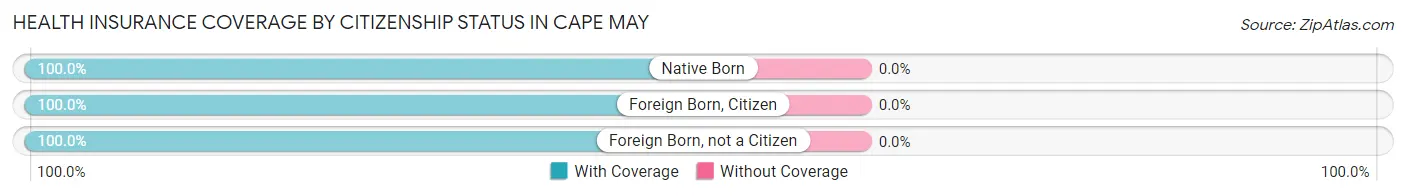
| Citizenship Status | With Coverage | Without Coverage |
| Native Born | 153 (100.0%) | 0 (0.0%) |
| Foreign Born, Citizen | 354 (100.0%) | 0 (0.0%) |
| Foreign Born, not a Citizen | 104 (100.0%) | 0 (0.0%) |
Health Insurance Coverage by Household Income in Cape May
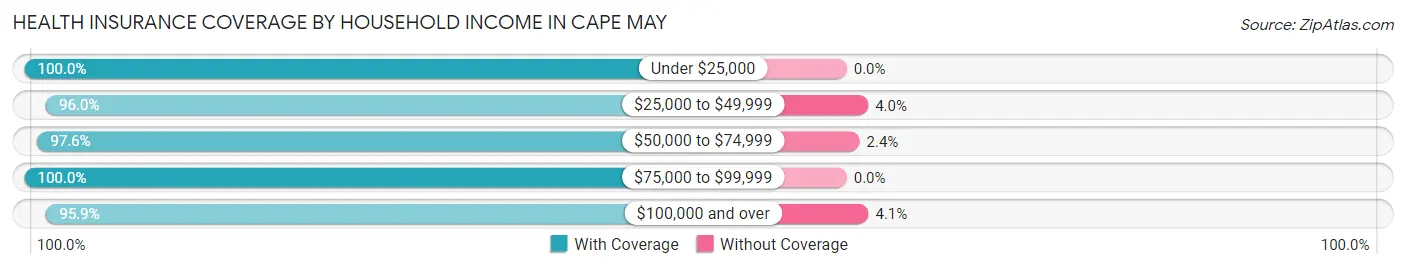
| Household Income | With Coverage | Without Coverage |
| Under $25,000 | 196 (100.0%) | 0 (0.0%) |
| $25,000 to $49,999 | 454 (96.0%) | 19 (4.0%) |
| $50,000 to $74,999 | 488 (97.6%) | 12 (2.4%) |
| $75,000 to $99,999 | 102 (100.0%) | 0 (0.0%) |
| $100,000 and over | 1,038 (95.9%) | 44 (4.1%) |
Public vs Private Health Insurance Coverage by Age in Cape May
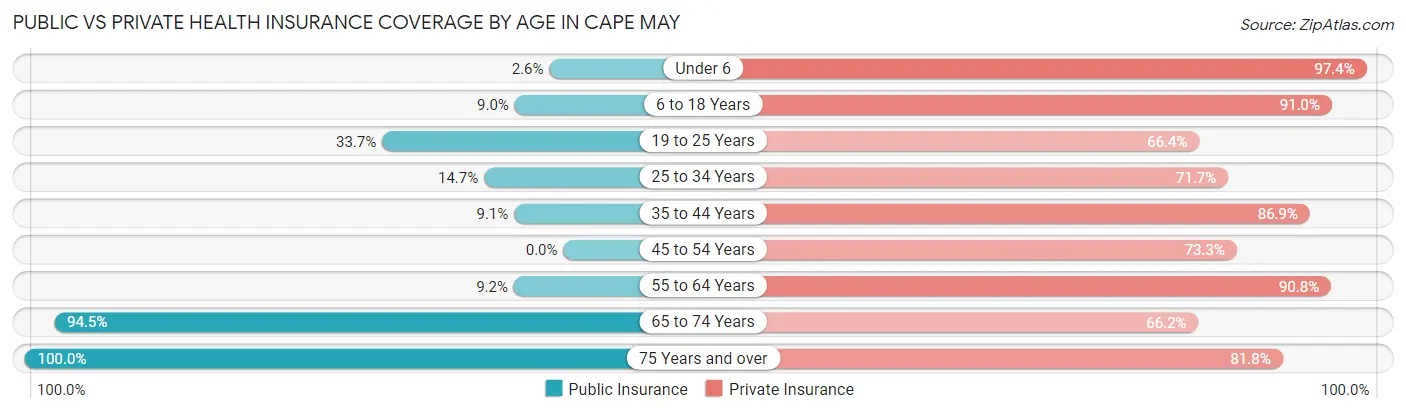
| Age Bracket | Public Insurance | Private Insurance |
| Under 6 | 4 (2.6%) | 149 (97.4%) |
| 6 to 18 Years | 32 (9.0%) | 322 (91.0%) |
| 19 to 25 Years | 35 (33.7%) | 69 (66.3%) |
| 25 to 34 Years | 39 (14.7%) | 190 (71.7%) |
| 35 to 44 Years | 16 (9.1%) | 152 (86.9%) |
| 45 to 54 Years | 0 (0.0%) | 107 (73.3%) |
| 55 to 64 Years | 37 (9.2%) | 365 (90.8%) |
| 65 to 74 Years | 467 (94.5%) | 327 (66.2%) |
| 75 Years and over | 280 (100.0%) | 229 (81.8%) |
| Total | 910 (38.4%) | 1,910 (80.5%) |
Disability Status by Sex by Age in Cape May
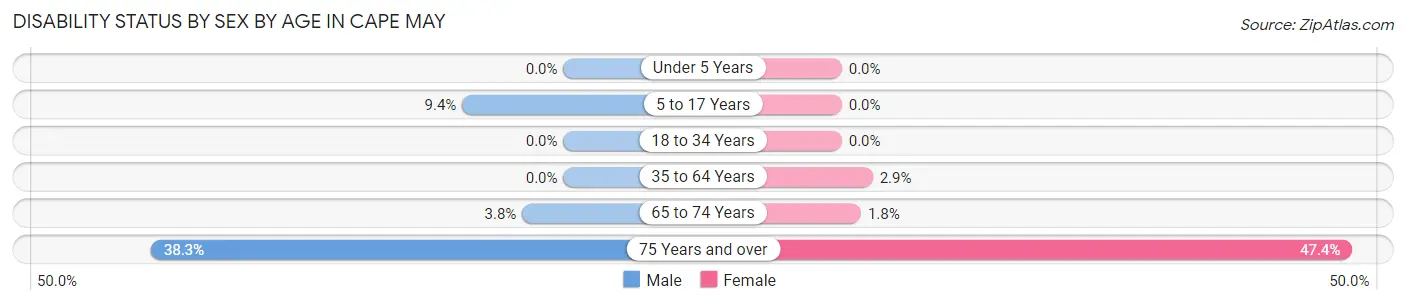
| Age Bracket | Male | Female |
| Under 5 Years | 0 (0.0%) | 0 (0.0%) |
| 5 to 17 Years | 23 (9.4%) | 0 (0.0%) |
| 18 to 34 Years | 0 (0.0%) | 0 (0.0%) |
| 35 to 64 Years | 0 (0.0%) | 11 (2.9%) |
| 65 to 74 Years | 6 (3.8%) | 6 (1.8%) |
| 75 Years and over | 49 (38.3%) | 72 (47.4%) |
Disability Class by Sex by Age in Cape May
Disability Class: Hearing Difficulty
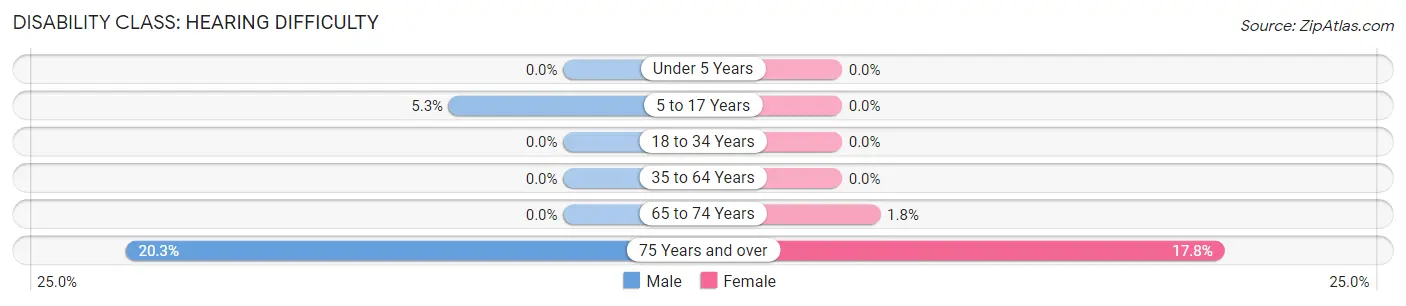
| Age Bracket | Male | Female |
| Under 5 Years | 0 (0.0%) | 0 (0.0%) |
| 5 to 17 Years | 13 (5.3%) | 0 (0.0%) |
| 18 to 34 Years | 0 (0.0%) | 0 (0.0%) |
| 35 to 64 Years | 0 (0.0%) | 0 (0.0%) |
| 65 to 74 Years | 0 (0.0%) | 6 (1.8%) |
| 75 Years and over | 26 (20.3%) | 27 (17.8%) |
Disability Class: Vision Difficulty
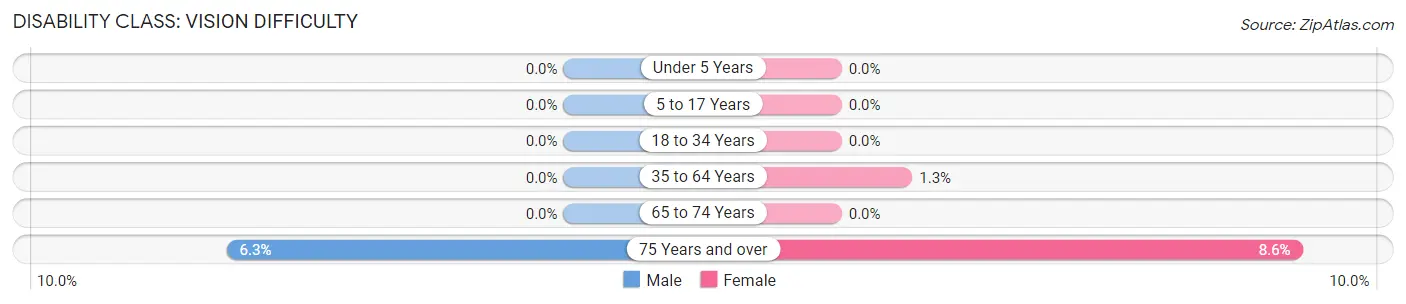
| Age Bracket | Male | Female |
| Under 5 Years | 0 (0.0%) | 0 (0.0%) |
| 5 to 17 Years | 0 (0.0%) | 0 (0.0%) |
| 18 to 34 Years | 0 (0.0%) | 0 (0.0%) |
| 35 to 64 Years | 0 (0.0%) | 5 (1.3%) |
| 65 to 74 Years | 0 (0.0%) | 0 (0.0%) |
| 75 Years and over | 8 (6.2%) | 13 (8.6%) |
Disability Class: Cognitive Difficulty
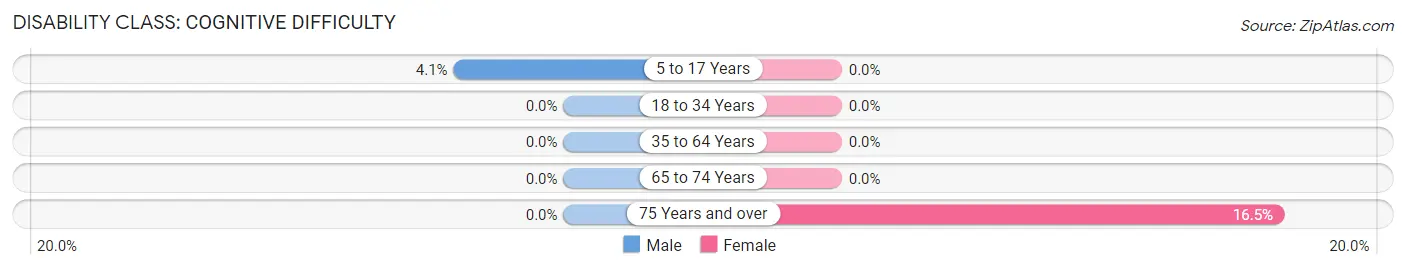
| Age Bracket | Male | Female |
| 5 to 17 Years | 10 (4.1%) | 0 (0.0%) |
| 18 to 34 Years | 0 (0.0%) | 0 (0.0%) |
| 35 to 64 Years | 0 (0.0%) | 0 (0.0%) |
| 65 to 74 Years | 0 (0.0%) | 0 (0.0%) |
| 75 Years and over | 0 (0.0%) | 25 (16.5%) |
Disability Class: Ambulatory Difficulty
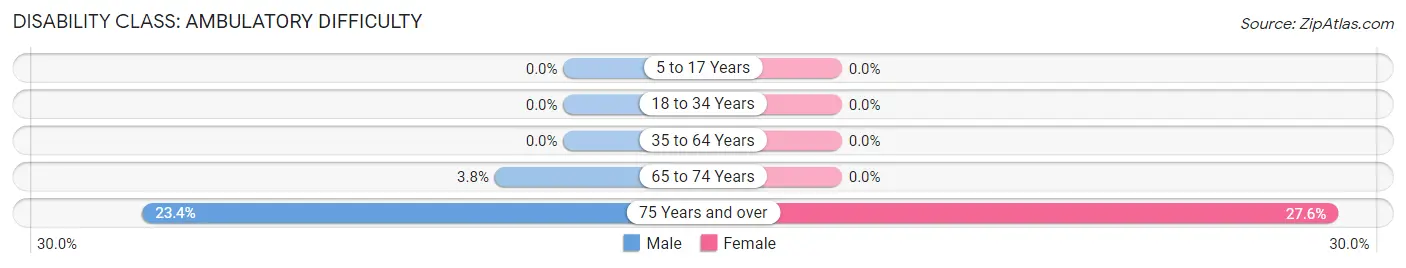
| Age Bracket | Male | Female |
| 5 to 17 Years | 0 (0.0%) | 0 (0.0%) |
| 18 to 34 Years | 0 (0.0%) | 0 (0.0%) |
| 35 to 64 Years | 0 (0.0%) | 0 (0.0%) |
| 65 to 74 Years | 6 (3.8%) | 0 (0.0%) |
| 75 Years and over | 30 (23.4%) | 42 (27.6%) |
Disability Class: Self-Care Difficulty
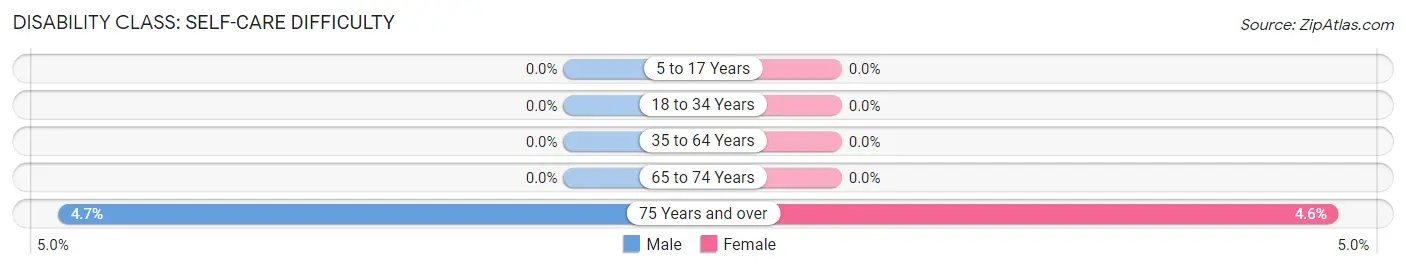
| Age Bracket | Male | Female |
| 5 to 17 Years | 0 (0.0%) | 0 (0.0%) |
| 18 to 34 Years | 0 (0.0%) | 0 (0.0%) |
| 35 to 64 Years | 0 (0.0%) | 0 (0.0%) |
| 65 to 74 Years | 0 (0.0%) | 0 (0.0%) |
| 75 Years and over | 6 (4.7%) | 7 (4.6%) |
Technology Access in Cape May
Computing Device Access in Cape May
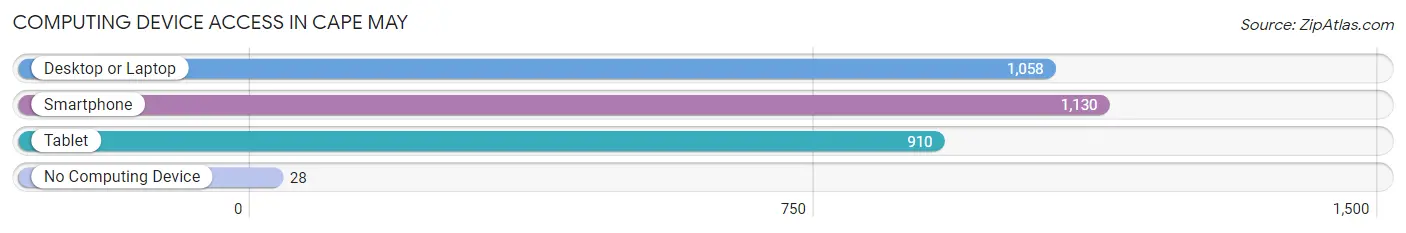
| Device Type | # Households | % Households |
| Desktop or Laptop | 1,058 | 85.8% |
| Smartphone | 1,130 | 91.6% |
| Tablet | 910 | 73.8% |
| No Computing Device | 28 | 2.3% |
| Total | 1,233 | 100.0% |
Internet Access in Cape May
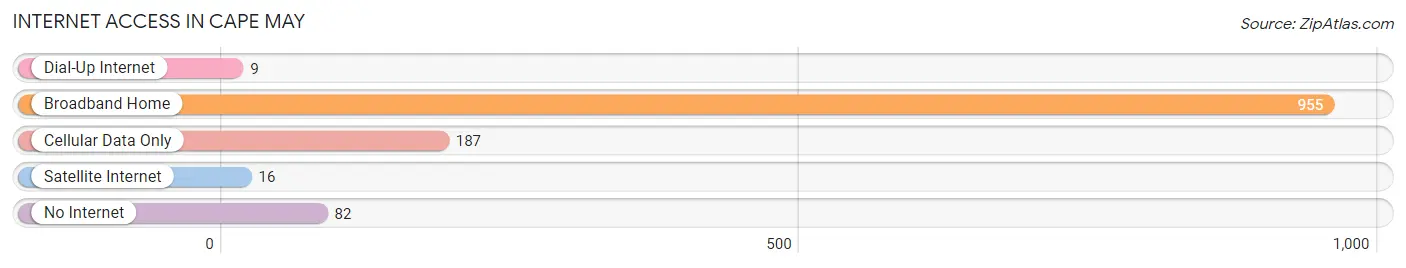
| Internet Type | # Households | % Households |
| Dial-Up Internet | 9 | 0.7% |
| Broadband Home | 955 | 77.4% |
| Cellular Data Only | 187 | 15.2% |
| Satellite Internet | 16 | 1.3% |
| No Internet | 82 | 6.7% |
| Total | 1,233 | 100.0% |
Cape May Summary
Cape May, NJ is a small city located in the southernmost tip of New Jersey, at the very end of the Jersey Shore. It is a popular tourist destination, known for its beautiful beaches, historic sites, and charming Victorian architecture. The city has a rich history, a unique geography, and a vibrant economy.
History
Cape May was first settled by the Dutch in 1620, and was later taken over by the English in 1664. The city was named after Cornelius Jacobsen Mey, a Dutch explorer who sailed along the coast in 1614. In the late 1700s, the city became a popular destination for wealthy Philadelphians, who built grand Victorian homes along the beach. The city was incorporated in 1848, and by the late 1800s, it had become a popular resort town.
In the early 1900s, the city was a popular destination for wealthy families from Philadelphia and New York. The city was also a popular destination for the military during World War II, and many of the military personnel who visited the city stayed after the war.
Geography
Cape May is located at the southernmost tip of New Jersey, at the very end of the Jersey Shore. It is bordered by the Atlantic Ocean to the east, Delaware Bay to the west, and the Cape May Canal to the south. The city is located on a peninsula, with the Cape May Harbor to the north.
The city has a total area of 8.3 square miles, of which 7.9 square miles is land and 0.4 square miles is water. The city is located in a temperate climate zone, with mild winters and warm summers.
Economy
Cape May’s economy is largely driven by tourism. The city is a popular destination for beachgoers, and it is also home to a number of historic sites, including the Cape May Lighthouse and the World War II Lookout Tower. The city also has a vibrant arts and culture scene, with a number of galleries, museums, and theaters.
The city is also home to a number of businesses, including restaurants, retail stores, and hotels. The city’s economy is also supported by the fishing industry, which is centered around the Cape May Harbor.
Demographics
As of the 2010 census, the population of Cape May was 3,607. The city has a population density of 437.3 people per square mile. The median age of the population is 48.7 years, and the median household income is $50,945.
The city is predominantly white, with 87.3% of the population identifying as white. The city also has a small African American population (4.2%), as well as a small Hispanic population (3.2%). The city also has a small Asian population (2.2%).
Conclusion
Cape May, NJ is a small city located in the southernmost tip of New Jersey, at the very end of the Jersey Shore. It is a popular tourist destination, known for its beautiful beaches, historic sites, and charming Victorian architecture. The city has a rich history, a unique geography, and a vibrant economy. The city’s economy is largely driven by tourism, and it is also home to a number of businesses, including restaurants, retail stores, and hotels. The city has a predominantly white population, with a small African American, Hispanic, and Asian population.
Common Questions
What is Per Capita Income in Cape May?
Per Capita income in Cape May is $64,513.
What is the Median Family Income in Cape May?
Median Family Income in Cape May is $104,356.
What is the Median Household income in Cape May?
Median Household Income in Cape May is $69,896.
What is Income or Wage Gap in Cape May?
Income or Wage Gap in Cape May is 2.3%.
Women in Cape May earn 97.7 cents for every dollar earned by a man.
What is Inequality or Gini Index in Cape May?
Inequality or Gini Index in Cape May is 0.58.
What is the Total Population of Cape May?
Total Population of Cape May is 2,815.
What is the Total Male Population of Cape May?
Total Male Population of Cape May is 1,595.
What is the Total Female Population of Cape May?
Total Female Population of Cape May is 1,220.
What is the Ratio of Males per 100 Females in Cape May?
There are 130.74 Males per 100 Females in Cape May.
What is the Ratio of Females per 100 Males in Cape May?
There are 76.49 Females per 100 Males in Cape May.
What is the Median Population Age in Cape May?
Median Population Age in Cape May is 39.6 Years.
What is the Average Family Size in Cape May
Average Family Size in Cape May is 2.7 People.
What is the Average Household Size in Cape May
Average Household Size in Cape May is 2.1 People.
How Large is the Labor Force in Cape May?
There are 1,373 People in the Labor Forcein in Cape May.
What is the Percentage of People in the Labor Force in Cape May?
56.3% of People are in the Labor Force in Cape May.
What is the Unemployment Rate in Cape May?
Unemployment Rate in Cape May is 4.7%.