Panama City Beach, FL Map & Demographics
Panama City Beach Map
Panama City Beach Overview
$47,615
PER CAPITA INCOME
$88,041
AVG FAMILY INCOME
$76,091
AVG HOUSEHOLD INCOME
28.1%
WAGE / INCOME GAP [ % ]
71.9¢/ $1
WAGE / INCOME GAP [ $ ]
0.43
INEQUALITY / GINI INDEX
18,281
TOTAL POPULATION
9,229
MALE POPULATION
9,052
FEMALE POPULATION
101.96
MALES / 100 FEMALES
98.08
FEMALES / 100 MALES
45.3
MEDIAN AGE
2.6
AVG FAMILY SIZE
2.2
AVG HOUSEHOLD SIZE
10,730
LABOR FORCE [ PEOPLE ]
67.6%
PERCENT IN LABOR FORCE
2.8%
UNEMPLOYMENT RATE
Panama City Beach Area Codes
Income in Panama City Beach
Income Overview in Panama City Beach
Per Capita Income in Panama City Beach is $47,615, while median incomes of families and households are $88,041 and $76,091 respectively.
| Characteristic | Number | Measure |
| Per Capita Income | 18,281 | $47,615 |
| Median Family Income | 5,085 | $88,041 |
| Mean Family Income | 5,085 | $117,518 |
| Median Household Income | 8,163 | $76,091 |
| Mean Household Income | 8,163 | $105,373 |
| Income Deficit | 5,085 | $0 |
| Wage / Income Gap (%) | 18,281 | 28.12% |
| Wage / Income Gap ($) | 18,281 | 71.88¢ per $1 |
| Gini / Inequality Index | 18,281 | 0.43 |
Earnings by Sex in Panama City Beach
Average Earnings in Panama City Beach are $40,865, $47,081 for men and $33,842 for women, a difference of 28.1%.
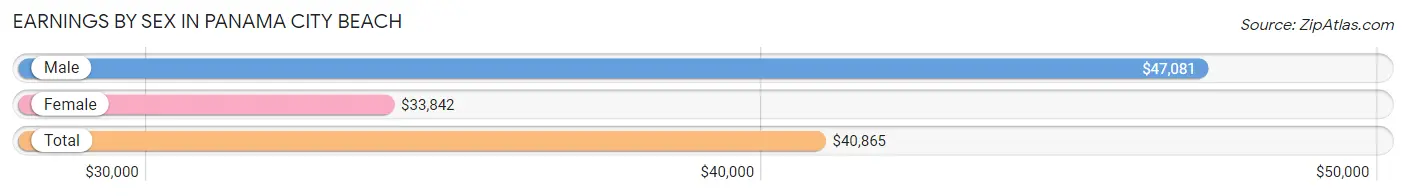
| Sex | Number | Average Earnings |
| Male | 6,097 (55.0%) | $47,081 |
| Female | 4,989 (45.0%) | $33,842 |
| Total | 11,086 (100.0%) | $40,865 |
Earnings by Sex by Income Bracket in Panama City Beach
The most common earnings brackets in Panama City Beach are $100,000+ for men (1,364 | 22.4%) and $30,000 to $34,999 for women (483 | 9.7%).
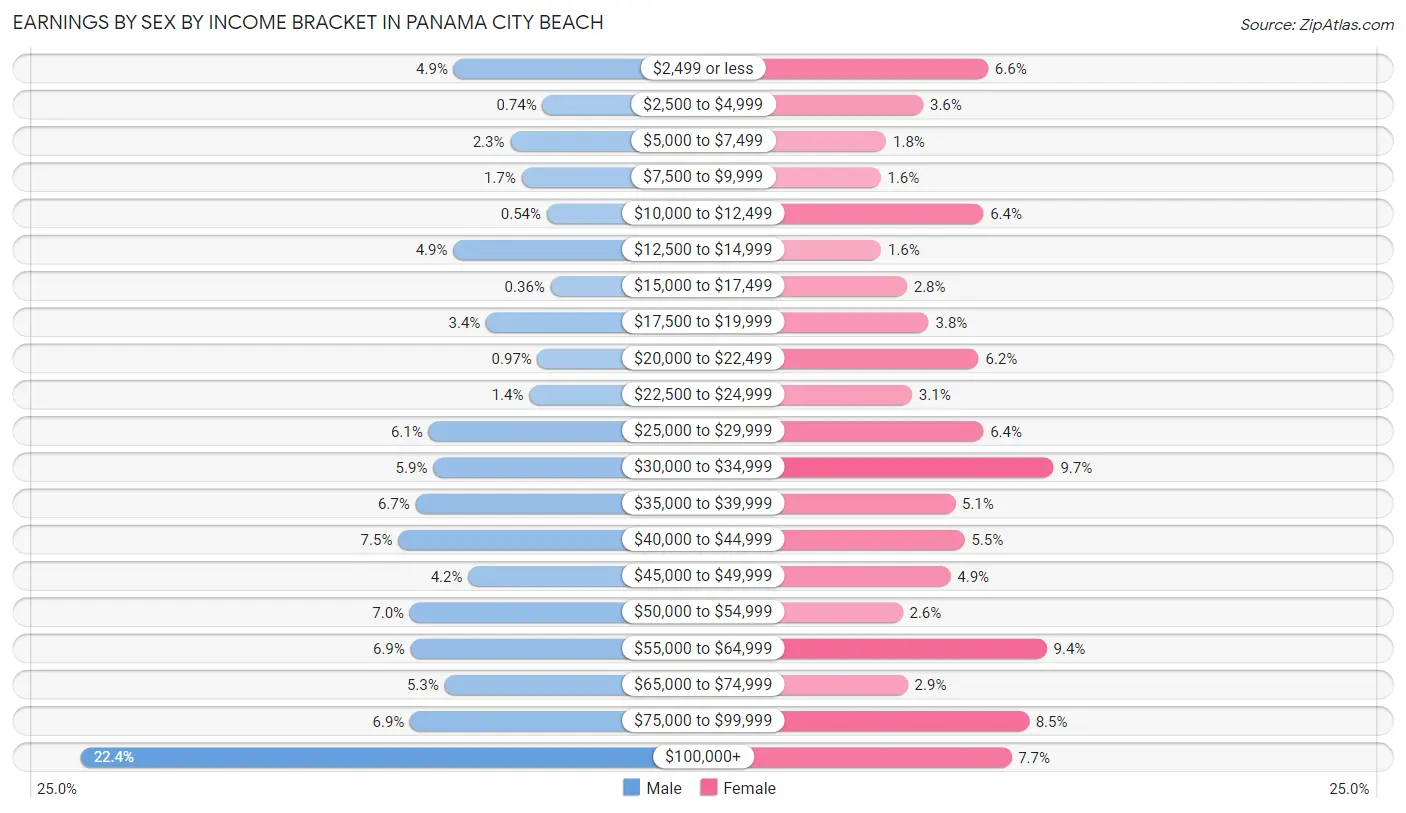
| Income | Male | Female |
| $2,499 or less | 299 (4.9%) | 330 (6.6%) |
| $2,500 to $4,999 | 45 (0.7%) | 178 (3.6%) |
| $5,000 to $7,499 | 137 (2.2%) | 92 (1.8%) |
| $7,500 to $9,999 | 105 (1.7%) | 79 (1.6%) |
| $10,000 to $12,499 | 33 (0.5%) | 319 (6.4%) |
| $12,500 to $14,999 | 300 (4.9%) | 80 (1.6%) |
| $15,000 to $17,499 | 22 (0.4%) | 140 (2.8%) |
| $17,500 to $19,999 | 206 (3.4%) | 191 (3.8%) |
| $20,000 to $22,499 | 59 (1.0%) | 308 (6.2%) |
| $22,500 to $24,999 | 83 (1.4%) | 152 (3.0%) |
| $25,000 to $29,999 | 371 (6.1%) | 319 (6.4%) |
| $30,000 to $34,999 | 357 (5.9%) | 483 (9.7%) |
| $35,000 to $39,999 | 408 (6.7%) | 253 (5.1%) |
| $40,000 to $44,999 | 457 (7.5%) | 275 (5.5%) |
| $45,000 to $49,999 | 257 (4.2%) | 242 (4.9%) |
| $50,000 to $54,999 | 424 (7.0%) | 130 (2.6%) |
| $55,000 to $64,999 | 422 (6.9%) | 467 (9.4%) |
| $65,000 to $74,999 | 325 (5.3%) | 142 (2.9%) |
| $75,000 to $99,999 | 423 (6.9%) | 425 (8.5%) |
| $100,000+ | 1,364 (22.4%) | 384 (7.7%) |
| Total | 6,097 (100.0%) | 4,989 (100.0%) |
Earnings by Sex by Educational Attainment in Panama City Beach
Average earnings in Panama City Beach are $52,007 for men and $35,904 for women, a difference of 31.0%. Men with an educational attainment of graduate degree enjoy the highest average annual earnings of $126,741, while those with less than high school education earn the least with $33,695. Women with an educational attainment of graduate degree earn the most with the average annual earnings of $70,476, while those with high school diploma education have the smallest earnings of $34,000.
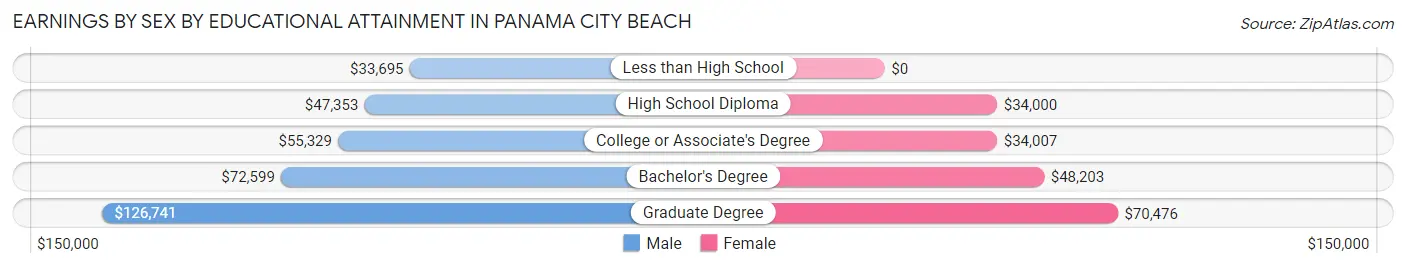
| Educational Attainment | Male Income | Female Income |
| Less than High School | $33,695 | $0 |
| High School Diploma | $47,353 | $34,000 |
| College or Associate's Degree | $55,329 | $34,007 |
| Bachelor's Degree | $72,599 | $48,203 |
| Graduate Degree | $126,741 | $70,476 |
| Total | $52,007 | $35,904 |
Family Income in Panama City Beach
Family Income Brackets in Panama City Beach
According to the Panama City Beach family income data, there are 1,180 families falling into the $50,000 to $74,999 income range, which is the most common income bracket and makes up 23.2% of all families. Conversely, the $10,000 to $14,999 income bracket is the least frequent group with only 66 families (1.3%) belonging to this category.
| Income Bracket | # Families | % Families |
| Less than $10,000 | 117 | 2.3% |
| $10,000 to $14,999 | 66 | 1.3% |
| $15,000 to $24,999 | 275 | 5.4% |
| $25,000 to $34,999 | 158 | 3.1% |
| $35,000 to $49,999 | 447 | 8.8% |
| $50,000 to $74,999 | 1,180 | 23.2% |
| $75,000 to $99,999 | 519 | 10.2% |
| $100,000 to $149,999 | 1,022 | 20.1% |
| $150,000 to $199,999 | 666 | 13.1% |
| $200,000+ | 636 | 12.5% |
Family Income by Famaliy Size in Panama City Beach
4-person families (647 | 12.7%) account for the highest median family income in Panama City Beach with $132,631 per family, while 3-person families (767 | 15.1%) have the highest median income of $42,041 per family member.
| Income Bracket | # Families | Median Income |
| 2-Person Families | 3,327 (65.4%) | $73,053 |
| 3-Person Families | 767 (15.1%) | $126,122 |
| 4-Person Families | 647 (12.7%) | $132,631 |
| 5-Person Families | 250 (4.9%) | $126,548 |
| 6-Person Families | 71 (1.4%) | $101,563 |
| 7+ Person Families | 23 (0.4%) | $0 |
| Total | 5,085 (100.0%) | $88,041 |
Family Income by Number of Earners in Panama City Beach
The median family income in Panama City Beach is $88,041, with families comprising 3+ earners (435) having the highest median family income of $179,219, while families with no earners (891) have the lowest median family income of $66,105, accounting for 8.6% and 17.5% of families, respectively.
| Number of Earners | # Families | Median Income |
| No Earners | 891 (17.5%) | $66,105 |
| 1 Earner | 1,569 (30.9%) | $67,732 |
| 2 Earners | 2,190 (43.1%) | $112,083 |
| 3+ Earners | 435 (8.6%) | $179,219 |
| Total | 5,085 (100.0%) | $88,041 |
Household Income in Panama City Beach
Household Income Brackets in Panama City Beach
With 1,706 households falling in the category, the $50,000 to $74,999 income range is the most frequent in Panama City Beach, accounting for 20.9% of all households. In contrast, only 98 households (1.2%) fall into the $10,000 to $14,999 income bracket, making it the least populous group.
| Income Bracket | # Households | % Households |
| Less than $10,000 | 335 | 4.1% |
| $10,000 to $14,999 | 98 | 1.2% |
| $15,000 to $24,999 | 441 | 5.4% |
| $25,000 to $34,999 | 514 | 6.3% |
| $35,000 to $49,999 | 816 | 10.0% |
| $50,000 to $74,999 | 1,706 | 20.9% |
| $75,000 to $99,999 | 1,290 | 15.8% |
| $100,000 to $149,999 | 1,339 | 16.4% |
| $150,000 to $199,999 | 800 | 9.8% |
| $200,000+ | 824 | 10.1% |
Household Income by Householder Age in Panama City Beach
The median household income in Panama City Beach is $76,091, with the highest median household income of $87,629 found in the 25 to 44 years age bracket for the primary householder. A total of 2,407 households (29.5%) fall into this category. Meanwhile, the 15 to 24 years age bracket for the primary householder has the lowest median household income of $37,300, with 302 households (3.7%) in this group.
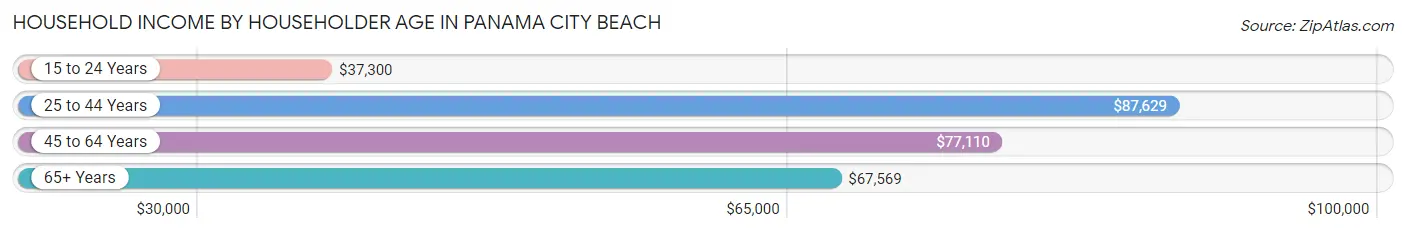
| Income Bracket | # Households | Median Income |
| 15 to 24 Years | 302 (3.7%) | $37,300 |
| 25 to 44 Years | 2,407 (29.5%) | $87,629 |
| 45 to 64 Years | 3,525 (43.2%) | $77,110 |
| 65+ Years | 1,929 (23.6%) | $67,569 |
| Total | 8,163 (100.0%) | $76,091 |
Poverty in Panama City Beach
Income Below Poverty by Sex and Age in Panama City Beach
With 5.4% poverty level for males and 12.9% for females among the residents of Panama City Beach, 12 to 14 year old males and 65 to 74 year old females are the most vulnerable to poverty, with 31 males (14.3%) and 194 females (18.7%) in their respective age groups living below the poverty level.
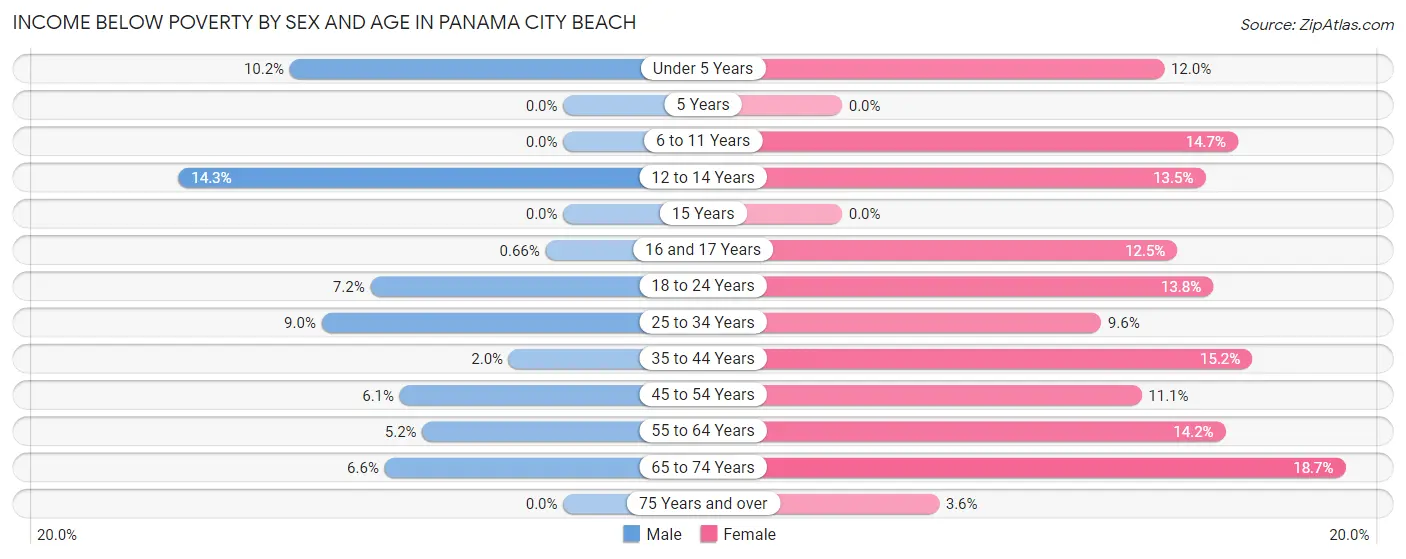
| Age Bracket | Male | Female |
| Under 5 Years | 40 (10.2%) | 25 (12.0%) |
| 5 Years | 0 (0.0%) | 0 (0.0%) |
| 6 to 11 Years | 0 (0.0%) | 87 (14.7%) |
| 12 to 14 Years | 31 (14.3%) | 34 (13.5%) |
| 15 Years | 0 (0.0%) | 0 (0.0%) |
| 16 and 17 Years | 2 (0.7%) | 33 (12.4%) |
| 18 to 24 Years | 62 (7.2%) | 70 (13.8%) |
| 25 to 34 Years | 107 (9.0%) | 113 (9.6%) |
| 35 to 44 Years | 22 (2.0%) | 189 (15.2%) |
| 45 to 54 Years | 89 (6.1%) | 140 (11.1%) |
| 55 to 64 Years | 77 (5.2%) | 254 (14.2%) |
| 65 to 74 Years | 72 (6.6%) | 194 (18.7%) |
| 75 Years and over | 0 (0.0%) | 20 (3.6%) |
| Total | 502 (5.4%) | 1,159 (12.9%) |
Income Above Poverty by Sex and Age in Panama City Beach
According to the poverty statistics in Panama City Beach, males aged 5 years and females aged 5 years are the age groups that are most secure financially, with 100.0% of males and 100.0% of females in these age groups living above the poverty line.
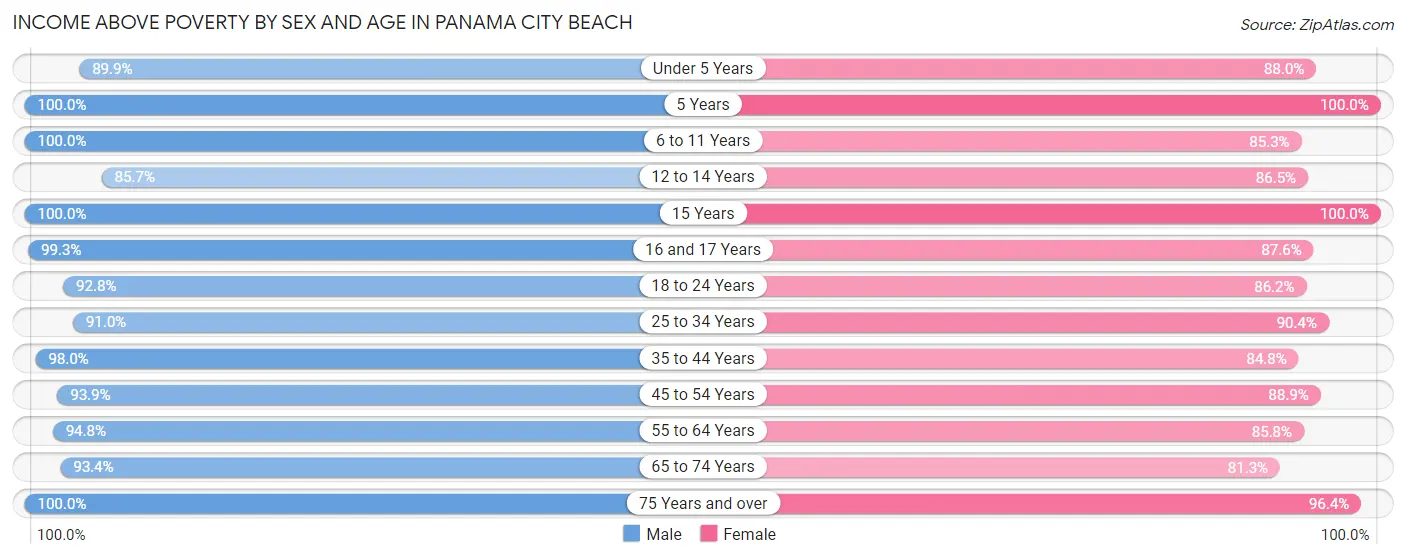
| Age Bracket | Male | Female |
| Under 5 Years | 354 (89.8%) | 184 (88.0%) |
| 5 Years | 33 (100.0%) | 113 (100.0%) |
| 6 to 11 Years | 501 (100.0%) | 505 (85.3%) |
| 12 to 14 Years | 186 (85.7%) | 218 (86.5%) |
| 15 Years | 48 (100.0%) | 30 (100.0%) |
| 16 and 17 Years | 300 (99.3%) | 232 (87.5%) |
| 18 to 24 Years | 804 (92.8%) | 438 (86.2%) |
| 25 to 34 Years | 1,086 (91.0%) | 1,062 (90.4%) |
| 35 to 44 Years | 1,065 (98.0%) | 1,052 (84.8%) |
| 45 to 54 Years | 1,378 (93.9%) | 1,119 (88.9%) |
| 55 to 64 Years | 1,396 (94.8%) | 1,530 (85.8%) |
| 65 to 74 Years | 1,014 (93.4%) | 844 (81.3%) |
| 75 Years and over | 540 (100.0%) | 535 (96.4%) |
| Total | 8,705 (94.6%) | 7,862 (87.2%) |
Income Below Poverty Among Married-Couple Families in Panama City Beach
The poverty statistics for married-couple families in Panama City Beach show that 3.8% or 148 of the total 3,892 families live below the poverty line. Families with no children have the highest poverty rate of 5.0%, comprising of 139 families. On the other hand, families with 3 or 4 children have the lowest poverty rate of 0.0%, which includes 0 families.
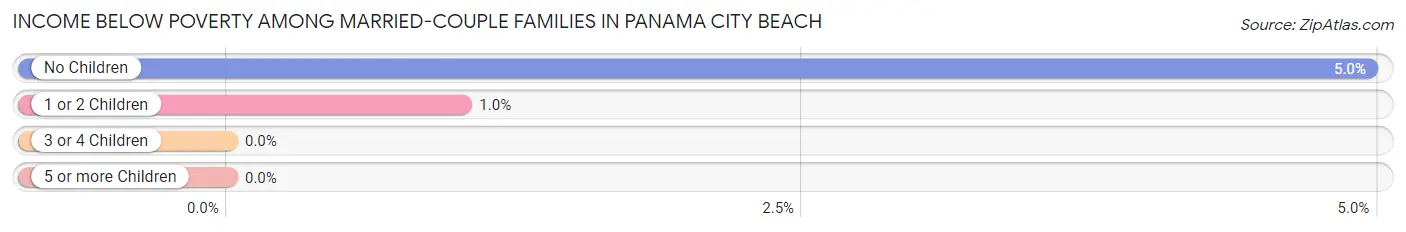
| Children | Above Poverty | Below Poverty |
| No Children | 2,661 (95.0%) | 139 (5.0%) |
| 1 or 2 Children | 872 (99.0%) | 9 (1.0%) |
| 3 or 4 Children | 211 (100.0%) | 0 (0.0%) |
| 5 or more Children | 0 (0.0%) | 0 (0.0%) |
| Total | 3,744 (96.2%) | 148 (3.8%) |
Income Below Poverty Among Single-Parent Households in Panama City Beach
According to the poverty data in Panama City Beach, 2.8% or 12 single-father households and 12.0% or 91 single-mother households are living below the poverty line. Among single-father households, those with no children have the highest poverty rate, with 12 households (4.1%) experiencing poverty. Likewise, among single-mother households, those with 3 or 4 children have the highest poverty rate, with 65 households (100.0%) falling below the poverty line.
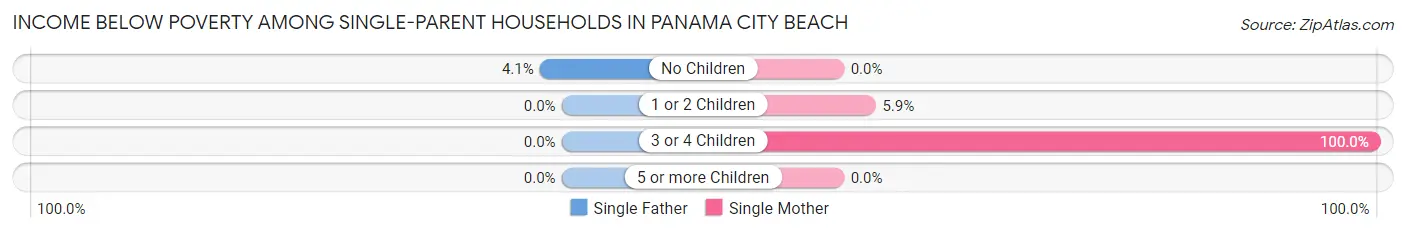
| Children | Single Father | Single Mother |
| No Children | 12 (4.1%) | 0 (0.0%) |
| 1 or 2 Children | 0 (0.0%) | 26 (5.9%) |
| 3 or 4 Children | 0 (0.0%) | 65 (100.0%) |
| 5 or more Children | 0 (0.0%) | 0 (0.0%) |
| Total | 12 (2.8%) | 91 (12.0%) |
Income Below Poverty Among Married-Couple vs Single-Parent Households in Panama City Beach
The poverty data for Panama City Beach shows that 148 of the married-couple family households (3.8%) and 103 of the single-parent households (8.6%) are living below the poverty level. Within the married-couple family households, those with no children have the highest poverty rate, with 139 households (5.0%) falling below the poverty line. Among the single-parent households, those with 3 or 4 children have the highest poverty rate, with 65 household (100.0%) living below poverty.
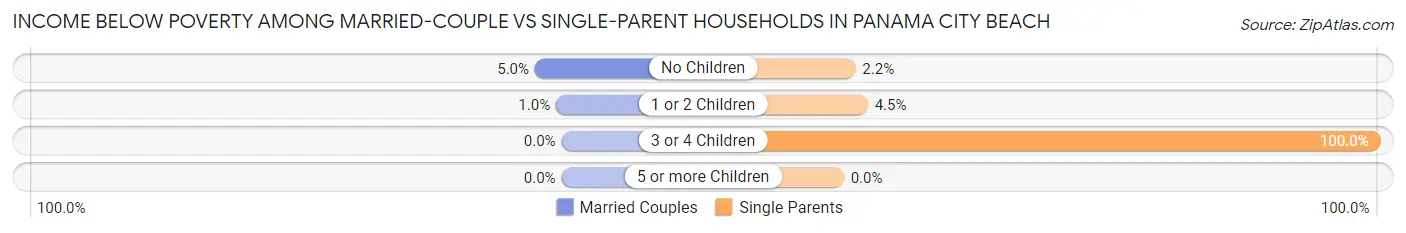
| Children | Married-Couple Families | Single-Parent Households |
| No Children | 139 (5.0%) | 12 (2.2%) |
| 1 or 2 Children | 9 (1.0%) | 26 (4.5%) |
| 3 or 4 Children | 0 (0.0%) | 65 (100.0%) |
| 5 or more Children | 0 (0.0%) | 0 (0.0%) |
| Total | 148 (3.8%) | 103 (8.6%) |
Race in Panama City Beach
The most populous races in Panama City Beach are White / Caucasian (15,099 | 82.6%), Hispanic or Latino (1,547 | 8.5%), and Black / African American (1,475 | 8.1%).
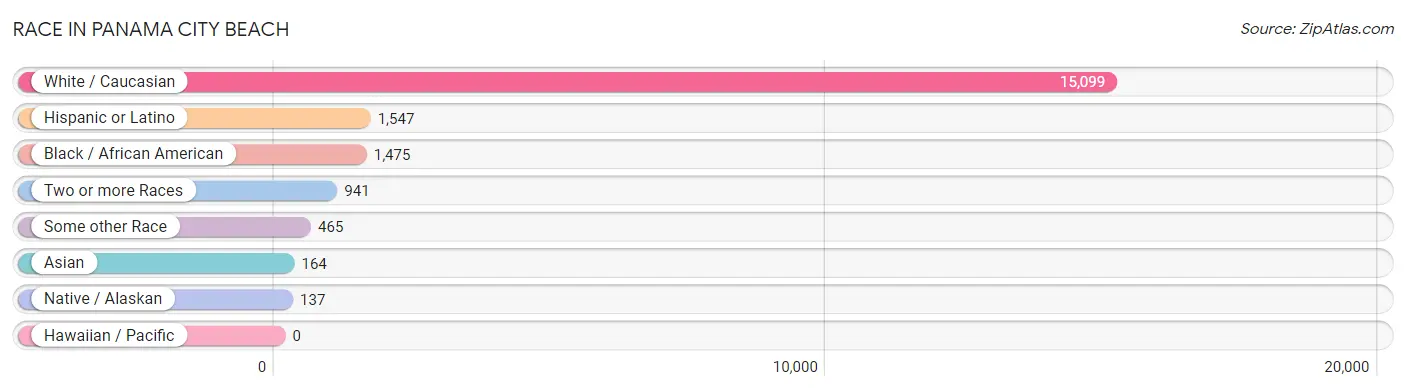
| Race | # Population | % Population |
| Asian | 164 | 0.9% |
| Black / African American | 1,475 | 8.1% |
| Hawaiian / Pacific | 0 | 0.0% |
| Hispanic or Latino | 1,547 | 8.5% |
| Native / Alaskan | 137 | 0.7% |
| White / Caucasian | 15,099 | 82.6% |
| Two or more Races | 941 | 5.1% |
| Some other Race | 465 | 2.5% |
| Total | 18,281 | 100.0% |
Ancestry in Panama City Beach
The most populous ancestries reported in Panama City Beach are Irish (3,336 | 18.2%), English (2,627 | 14.4%), German (2,433 | 13.3%), American (1,155 | 6.3%), and French (595 | 3.3%), together accounting for 55.5% of all Panama City Beach residents.
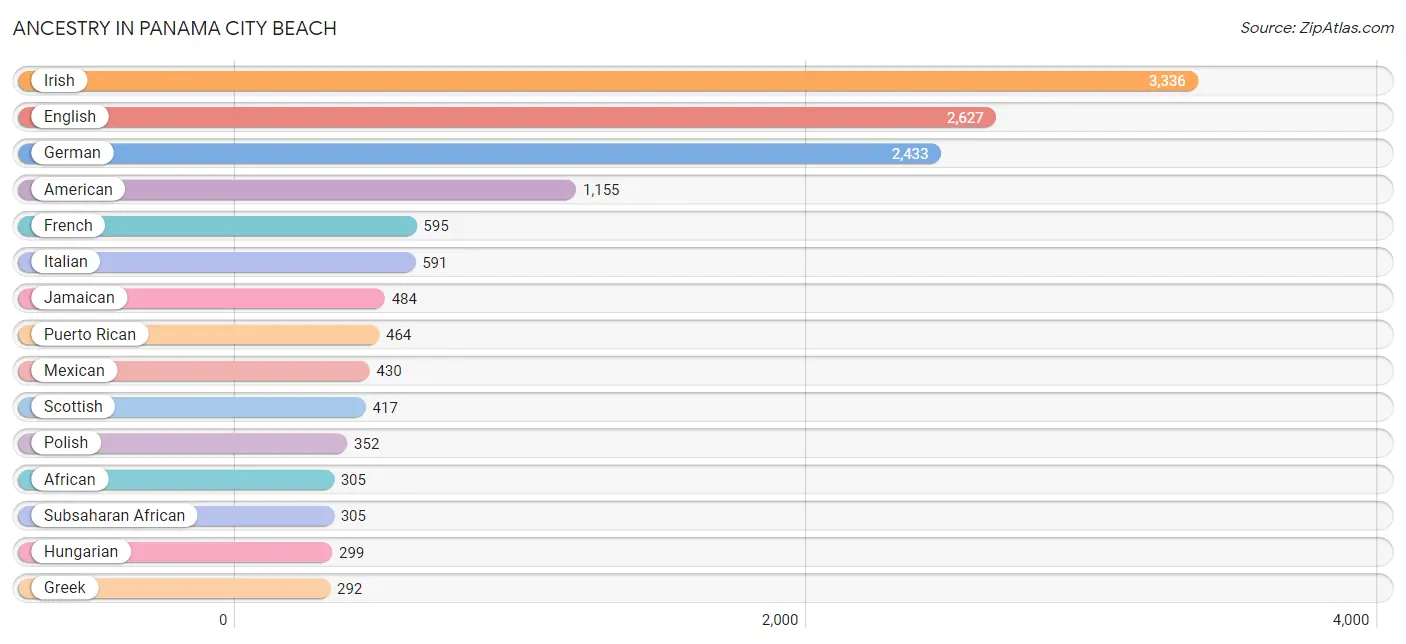
| Ancestry | # Population | % Population |
| African | 305 | 1.7% |
| American | 1,155 | 6.3% |
| Arab | 56 | 0.3% |
| Argentinean | 9 | 0.1% |
| Austrian | 11 | 0.1% |
| Belgian | 11 | 0.1% |
| Bhutanese | 22 | 0.1% |
| Brazilian | 72 | 0.4% |
| British | 143 | 0.8% |
| Burmese | 13 | 0.1% |
| Canadian | 108 | 0.6% |
| Central American | 234 | 1.3% |
| Central American Indian | 123 | 0.7% |
| Cherokee | 41 | 0.2% |
| Chilean | 109 | 0.6% |
| Chippewa | 59 | 0.3% |
| Colombian | 66 | 0.4% |
| Croatian | 30 | 0.2% |
| Cuban | 104 | 0.6% |
| Czech | 267 | 1.5% |
| Danish | 49 | 0.3% |
| Dutch | 68 | 0.4% |
| Eastern European | 36 | 0.2% |
| English | 2,627 | 14.4% |
| Estonian | 18 | 0.1% |
| European | 184 | 1.0% |
| Finnish | 8 | 0.0% |
| French | 595 | 3.3% |
| French Canadian | 258 | 1.4% |
| German | 2,433 | 13.3% |
| Greek | 292 | 1.6% |
| Guatemalan | 8 | 0.0% |
| Honduran | 180 | 1.0% |
| Hungarian | 299 | 1.6% |
| Indian (Asian) | 40 | 0.2% |
| Irish | 3,336 | 18.2% |
| Iroquois | 32 | 0.2% |
| Italian | 591 | 3.2% |
| Jamaican | 484 | 2.6% |
| Korean | 61 | 0.3% |
| Latvian | 44 | 0.2% |
| Lebanese | 56 | 0.3% |
| Lithuanian | 93 | 0.5% |
| Luxembourger | 19 | 0.1% |
| Mexican | 430 | 2.4% |
| Mexican American Indian | 86 | 0.5% |
| Native Hawaiian | 25 | 0.1% |
| Nicaraguan | 46 | 0.3% |
| Norwegian | 45 | 0.3% |
| Polish | 352 | 1.9% |
| Portuguese | 109 | 0.6% |
| Puerto Rican | 464 | 2.5% |
| Romanian | 80 | 0.4% |
| Russian | 9 | 0.1% |
| Scandinavian | 21 | 0.1% |
| Scotch-Irish | 123 | 0.7% |
| Scottish | 417 | 2.3% |
| Seminole | 11 | 0.1% |
| Slovak | 64 | 0.4% |
| South American | 204 | 1.1% |
| Spaniard | 20 | 0.1% |
| Spanish | 10 | 0.1% |
| Spanish American | 30 | 0.2% |
| Subsaharan African | 305 | 1.7% |
| Swedish | 180 | 1.0% |
| Thai | 96 | 0.5% |
| Turkish | 22 | 0.1% |
| Ukrainian | 173 | 0.9% |
| Venezuelan | 20 | 0.1% |
| Welsh | 110 | 0.6% |
| Yugoslavian | 15 | 0.1% | View All 71 Rows |
Immigrants in Panama City Beach
The most numerous immigrant groups reported in Panama City Beach came from Latin America (1,094 | 6.0%), Europe (581 | 3.2%), Central America (448 | 2.5%), Caribbean (410 | 2.2%), and Eastern Europe (393 | 2.1%), together accounting for 16.0% of all Panama City Beach residents.
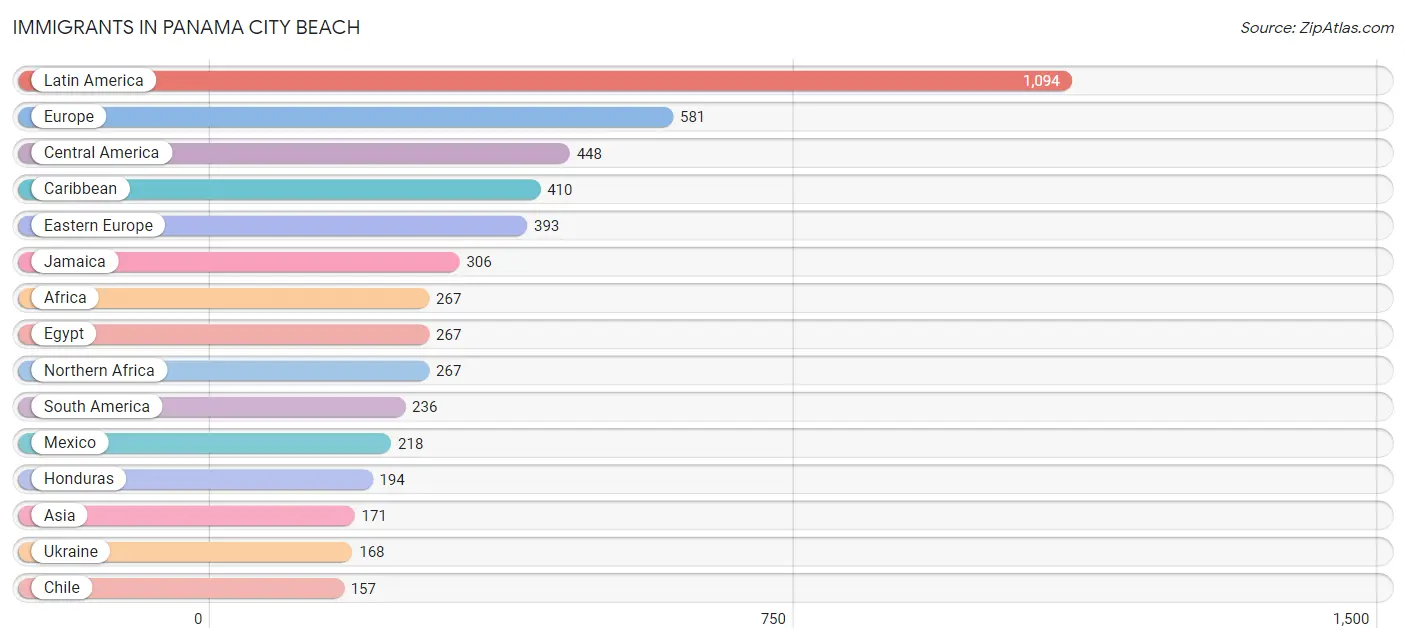
| Immigration Origin | # Population | % Population |
| Africa | 267 | 1.5% |
| Asia | 171 | 0.9% |
| Azores | 15 | 0.1% |
| Brazil | 12 | 0.1% |
| Canada | 39 | 0.2% |
| Caribbean | 410 | 2.2% |
| Central America | 448 | 2.5% |
| Chile | 157 | 0.9% |
| China | 19 | 0.1% |
| Colombia | 54 | 0.3% |
| Cuba | 104 | 0.6% |
| Czechoslovakia | 19 | 0.1% |
| Eastern Asia | 32 | 0.2% |
| Eastern Europe | 393 | 2.1% |
| Egypt | 267 | 1.5% |
| England | 49 | 0.3% |
| Europe | 581 | 3.2% |
| France | 11 | 0.1% |
| Honduras | 194 | 1.1% |
| Hungary | 73 | 0.4% |
| India | 63 | 0.3% |
| Italy | 20 | 0.1% |
| Jamaica | 306 | 1.7% |
| Korea | 13 | 0.1% |
| Latin America | 1,094 | 6.0% |
| Latvia | 72 | 0.4% |
| Mexico | 218 | 1.2% |
| Moldova | 31 | 0.2% |
| Netherlands | 11 | 0.1% |
| Nicaragua | 36 | 0.2% |
| Northern Africa | 267 | 1.5% |
| Northern Europe | 101 | 0.5% |
| Philippines | 15 | 0.1% |
| Portugal | 45 | 0.3% |
| Russia | 30 | 0.2% |
| Scotland | 9 | 0.1% |
| South America | 236 | 1.3% |
| South Central Asia | 63 | 0.3% |
| South Eastern Asia | 15 | 0.1% |
| Southern Europe | 65 | 0.4% |
| Sweden | 13 | 0.1% |
| Turkey | 61 | 0.3% |
| Ukraine | 168 | 0.9% |
| Venezuela | 13 | 0.1% |
| Western Asia | 61 | 0.3% |
| Western Europe | 22 | 0.1% | View All 46 Rows |
Sex and Age in Panama City Beach
Sex and Age in Panama City Beach
The most populous age groups in Panama City Beach are 50 to 54 Years (915 | 9.9%) for men and 60 to 64 Years (918 | 10.1%) for women.
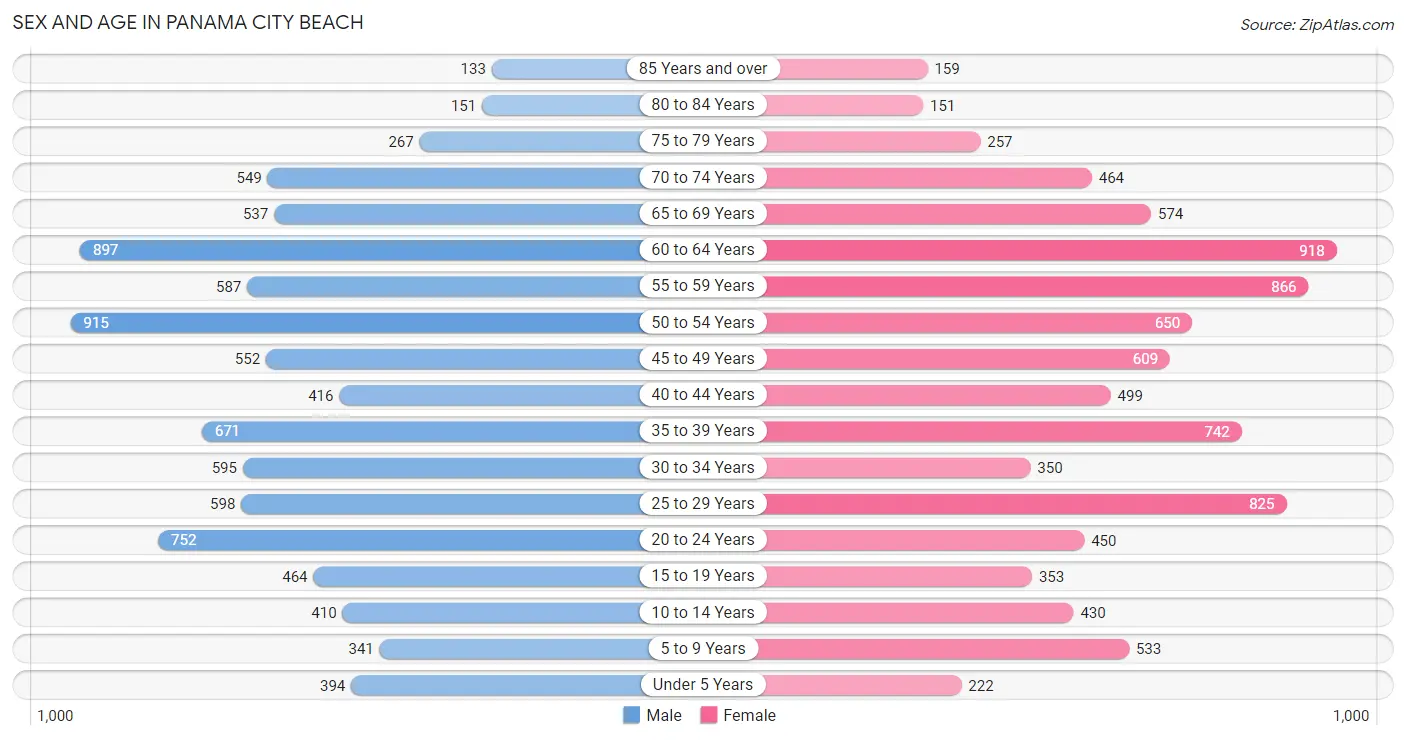
| Age Bracket | Male | Female |
| Under 5 Years | 394 (4.3%) | 222 (2.5%) |
| 5 to 9 Years | 341 (3.7%) | 533 (5.9%) |
| 10 to 14 Years | 410 (4.4%) | 430 (4.8%) |
| 15 to 19 Years | 464 (5.0%) | 353 (3.9%) |
| 20 to 24 Years | 752 (8.2%) | 450 (5.0%) |
| 25 to 29 Years | 598 (6.5%) | 825 (9.1%) |
| 30 to 34 Years | 595 (6.5%) | 350 (3.9%) |
| 35 to 39 Years | 671 (7.3%) | 742 (8.2%) |
| 40 to 44 Years | 416 (4.5%) | 499 (5.5%) |
| 45 to 49 Years | 552 (6.0%) | 609 (6.7%) |
| 50 to 54 Years | 915 (9.9%) | 650 (7.2%) |
| 55 to 59 Years | 587 (6.4%) | 866 (9.6%) |
| 60 to 64 Years | 897 (9.7%) | 918 (10.1%) |
| 65 to 69 Years | 537 (5.8%) | 574 (6.3%) |
| 70 to 74 Years | 549 (5.9%) | 464 (5.1%) |
| 75 to 79 Years | 267 (2.9%) | 257 (2.8%) |
| 80 to 84 Years | 151 (1.6%) | 151 (1.7%) |
| 85 Years and over | 133 (1.4%) | 159 (1.8%) |
| Total | 9,229 (100.0%) | 9,052 (100.0%) |
Families and Households in Panama City Beach
Median Family Size in Panama City Beach
The median family size in Panama City Beach is 2.62 persons per family, with married-couple families (3,892 | 76.5%) accounting for the largest median family size of 2.69 persons per family. On the other hand, single male/father families (435 | 8.6%) represent the smallest median family size with 2.25 persons per family.
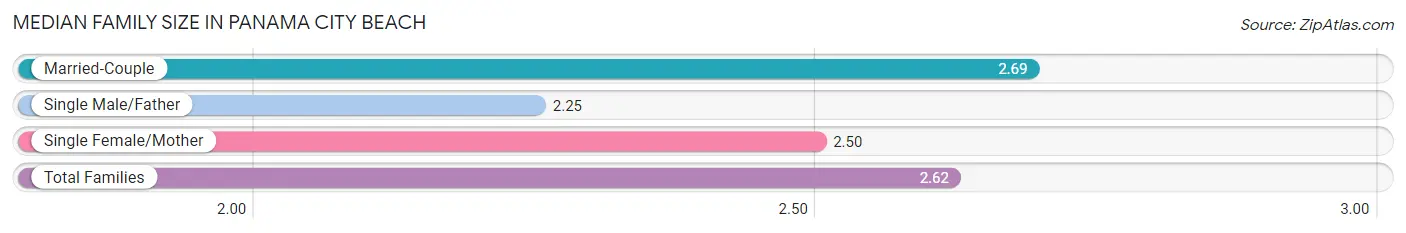
| Family Type | # Families | Family Size |
| Married-Couple | 3,892 (76.5%) | 2.69 |
| Single Male/Father | 435 (8.6%) | 2.25 |
| Single Female/Mother | 758 (14.9%) | 2.50 |
| Total Families | 5,085 (100.0%) | 2.62 |
Median Household Size in Panama City Beach
The median household size in Panama City Beach is 2.23 persons per household, with single male/father households (435 | 5.3%) accounting for the largest median household size of 3.29 persons per household. non-family households (3,078 | 37.7%) represent the smallest median household size with 1.37 persons per household.
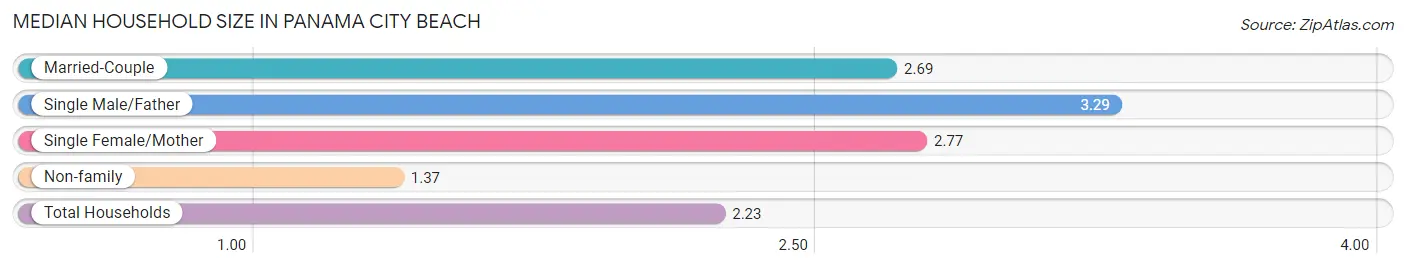
| Household Type | # Households | Household Size |
| Married-Couple | 3,892 (47.7%) | 2.69 |
| Single Male/Father | 435 (5.3%) | 3.29 |
| Single Female/Mother | 758 (9.3%) | 2.77 |
| Non-family | 3,078 (37.7%) | 1.37 |
| Total Households | 8,163 (100.0%) | 2.23 |
Household Size by Marriage Status in Panama City Beach
Out of a total of 8,163 households in Panama City Beach, 5,085 (62.3%) are family households, while 3,078 (37.7%) are nonfamily households. The most numerous type of family households are 2-person households, comprising 2,940, and the most common type of nonfamily households are 1-person households, comprising 2,177.
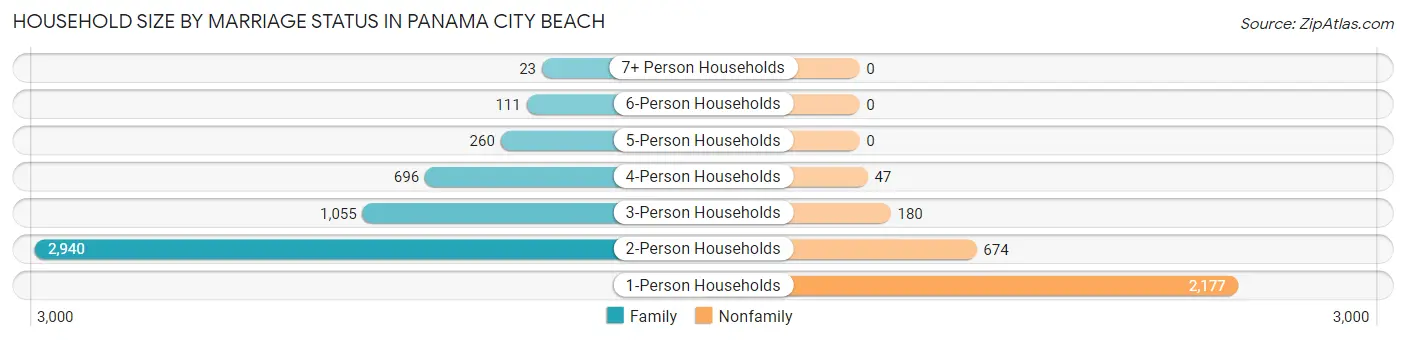
| Household Size | Family Households | Nonfamily Households |
| 1-Person Households | - | 2,177 (26.7%) |
| 2-Person Households | 2,940 (36.0%) | 674 (8.3%) |
| 3-Person Households | 1,055 (12.9%) | 180 (2.2%) |
| 4-Person Households | 696 (8.5%) | 47 (0.6%) |
| 5-Person Households | 260 (3.2%) | 0 (0.0%) |
| 6-Person Households | 111 (1.4%) | 0 (0.0%) |
| 7+ Person Households | 23 (0.3%) | 0 (0.0%) |
| Total | 5,085 (62.3%) | 3,078 (37.7%) |
Female Fertility in Panama City Beach
Fertility by Age in Panama City Beach
Average fertility rate in Panama City Beach is 40.0 births per 1,000 women. Women in the age bracket of 20 to 34 years have the highest fertility rate with 97.0 births per 1,000 women. Women in the age bracket of 20 to 34 years acount for 95.7% of all women with births.
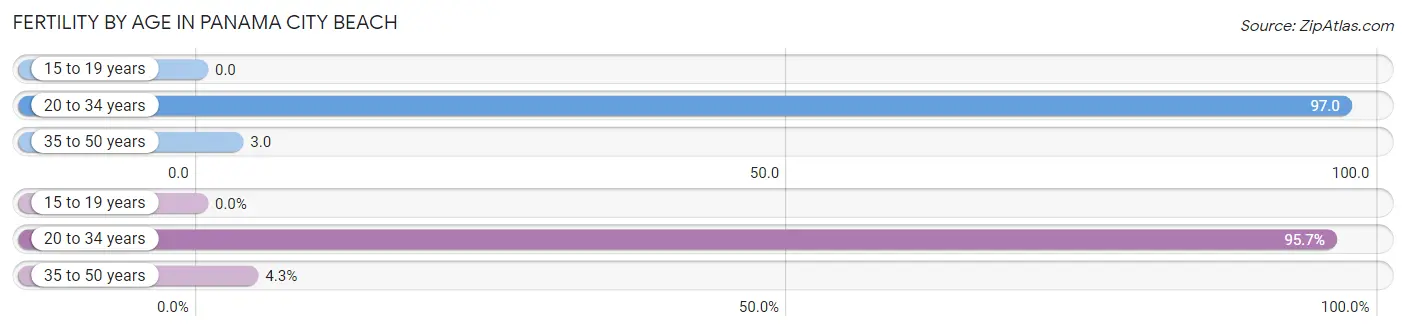
| Age Bracket | Women with Births | Births / 1,000 Women |
| 15 to 19 years | 0 (0.0%) | 0.0 |
| 20 to 34 years | 157 (95.7%) | 97.0 |
| 35 to 50 years | 7 (4.3%) | 3.0 |
| Total | 164 (100.0%) | 40.0 |
Fertility by Age by Marriage Status in Panama City Beach
80.5% of women with births (164) in Panama City Beach are married. The highest percentage of unmarried women with births falls into 20 to 34 years age bracket with 20.4% of them unmarried at the time of birth, while the lowest percentage of unmarried women with births belong to 35 to 50 years age bracket with 0.0% of them unmarried.
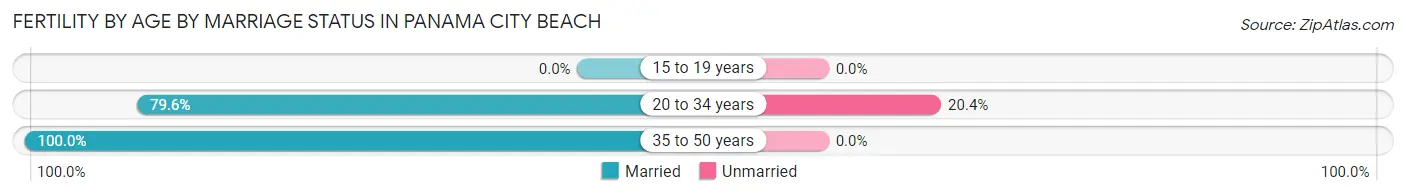
| Age Bracket | Married | Unmarried |
| 15 to 19 years | 0 (0.0%) | 0 (0.0%) |
| 20 to 34 years | 125 (79.6%) | 32 (20.4%) |
| 35 to 50 years | 7 (100.0%) | 0 (0.0%) |
| Total | 132 (80.5%) | 32 (19.5%) |
Fertility by Education in Panama City Beach
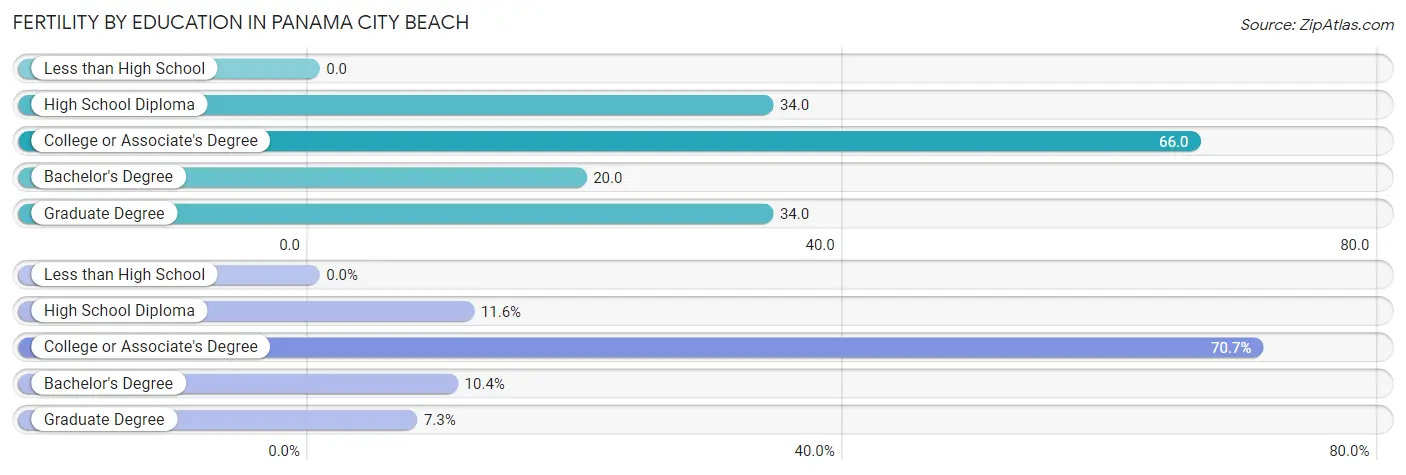
| Educational Attainment | Women with Births | Births / 1,000 Women |
| Less than High School | 0 (0.0%) | 0.0 |
| High School Diploma | 19 (11.6%) | 34.0 |
| College or Associate's Degree | 116 (70.7%) | 66.0 |
| Bachelor's Degree | 17 (10.4%) | 20.0 |
| Graduate Degree | 12 (7.3%) | 34.0 |
| Total | 164 (100.0%) | 40.0 |
Fertility by Education by Marriage Status in Panama City Beach
19.5% of women with births in Panama City Beach are unmarried. Women with the educational attainment of high school diploma are most likely to be married with 100.0% of them married at childbirth, while women with the educational attainment of college or associate's degree are least likely to be married with 27.6% of them unmarried at childbirth.
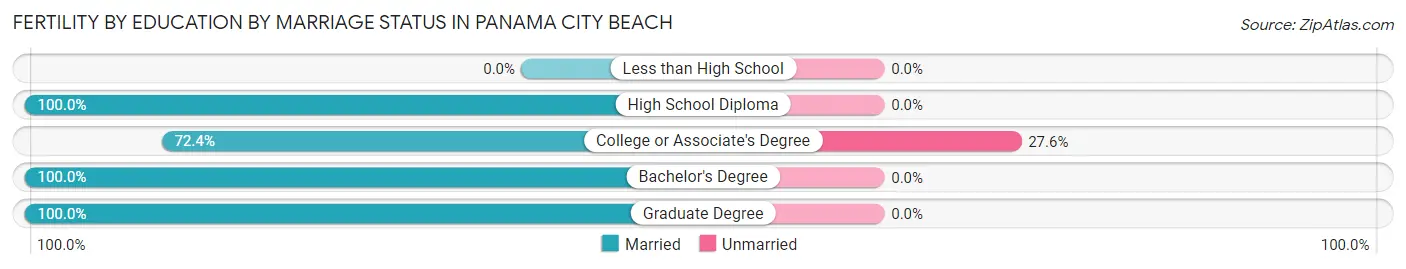
| Educational Attainment | Married | Unmarried |
| Less than High School | 0 (0.0%) | 0 (0.0%) |
| High School Diploma | 19 (100.0%) | 0 (0.0%) |
| College or Associate's Degree | 84 (72.4%) | 32 (27.6%) |
| Bachelor's Degree | 17 (100.0%) | 0 (0.0%) |
| Graduate Degree | 12 (100.0%) | 0 (0.0%) |
| Total | 132 (80.5%) | 32 (19.5%) |
Employment Characteristics in Panama City Beach
Employment by Class of Employer in Panama City Beach
Among the 10,260 employed individuals in Panama City Beach, private company employees (6,382 | 62.2%), federal government employees (845 | 8.2%), and self-employed (not incorporated) (842 | 8.2%) make up the most common classes of employment.
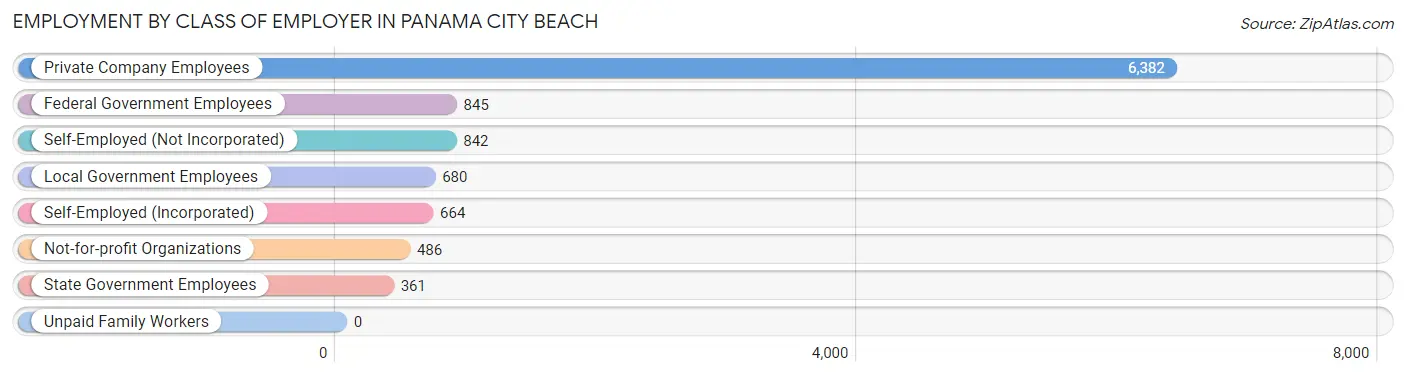
| Employer Class | # Employees | % Employees |
| Private Company Employees | 6,382 | 62.2% |
| Self-Employed (Incorporated) | 664 | 6.5% |
| Self-Employed (Not Incorporated) | 842 | 8.2% |
| Not-for-profit Organizations | 486 | 4.7% |
| Local Government Employees | 680 | 6.6% |
| State Government Employees | 361 | 3.5% |
| Federal Government Employees | 845 | 8.2% |
| Unpaid Family Workers | 0 | 0.0% |
| Total | 10,260 | 100.0% |
Employment Status by Age in Panama City Beach
According to the labor force statistics for Panama City Beach, out of the total population over 16 years of age (15,873), 67.6% or 10,730 individuals are in the labor force, with 2.8% or 300 of them unemployed. The age group with the highest labor force participation rate is 20 to 24 years, with 90.3% or 1,085 individuals in the labor force. Within the labor force, the 16 to 19 years age range has the highest percentage of unemployed individuals, with 35.8% or 113 of them being unemployed.
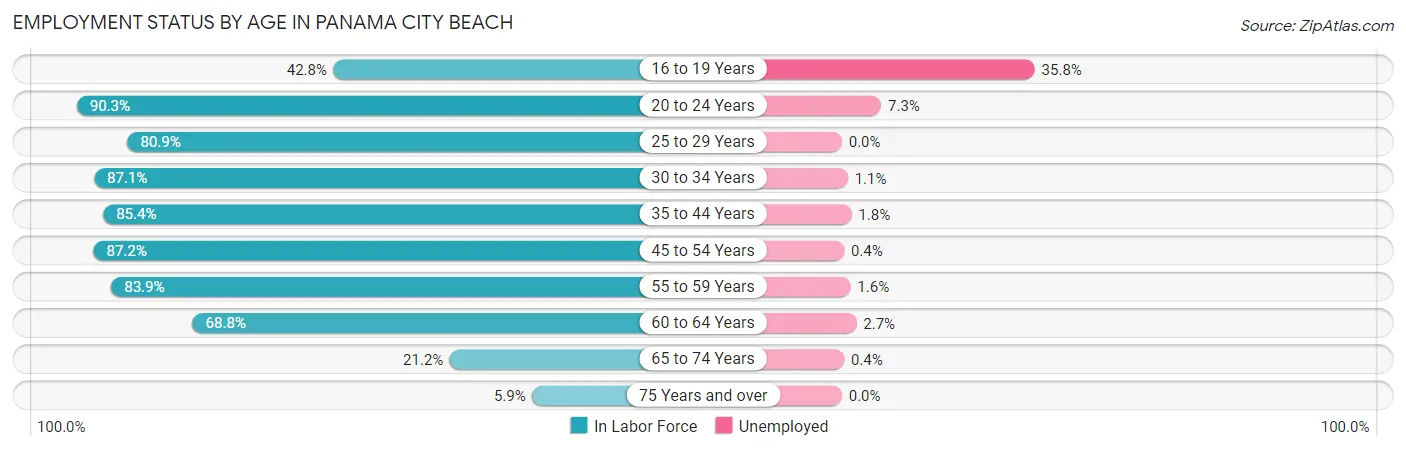
| Age Bracket | In Labor Force | Unemployed |
| 16 to 19 Years | 316 (42.8%) | 113 (35.8%) |
| 20 to 24 Years | 1,085 (90.3%) | 79 (7.3%) |
| 25 to 29 Years | 1,151 (80.9%) | 0 (0.0%) |
| 30 to 34 Years | 823 (87.1%) | 9 (1.1%) |
| 35 to 44 Years | 1,988 (85.4%) | 36 (1.8%) |
| 45 to 54 Years | 2,377 (87.2%) | 10 (0.4%) |
| 55 to 59 Years | 1,219 (83.9%) | 20 (1.6%) |
| 60 to 64 Years | 1,249 (68.8%) | 34 (2.7%) |
| 65 to 74 Years | 450 (21.2%) | 2 (0.4%) |
| 75 Years and over | 66 (5.9%) | 0 (0.0%) |
| Total | 10,730 (67.6%) | 300 (2.8%) |
Employment Status by Educational Attainment in Panama City Beach
According to labor force statistics for Panama City Beach, 82.4% of individuals (8,809) out of the total population between 25 and 64 years of age (10,690) are in the labor force, with 1.2% or 106 of them being unemployed. The group with the highest labor force participation rate are those with the educational attainment of less than high school, with 87.9% or 786 individuals in the labor force. Within the labor force, individuals with college / associate degree education have the highest percentage of unemployment, with 2.5% or 86 of them being unemployed.
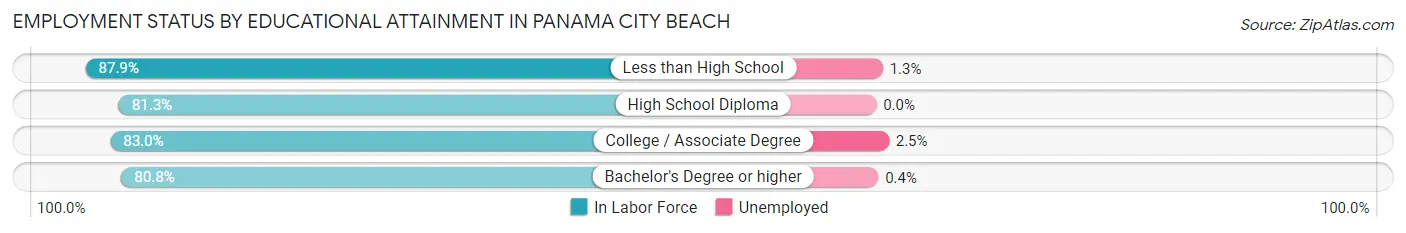
| Educational Attainment | In Labor Force | Unemployed |
| Less than High School | 786 (87.9%) | 12 (1.3%) |
| High School Diploma | 1,725 (81.3%) | 0 (0.0%) |
| College / Associate Degree | 3,447 (83.0%) | 104 (2.5%) |
| Bachelor's Degree or higher | 2,845 (80.8%) | 14 (0.4%) |
| Total | 8,809 (82.4%) | 128 (1.2%) |
Employment Occupations by Sex in Panama City Beach
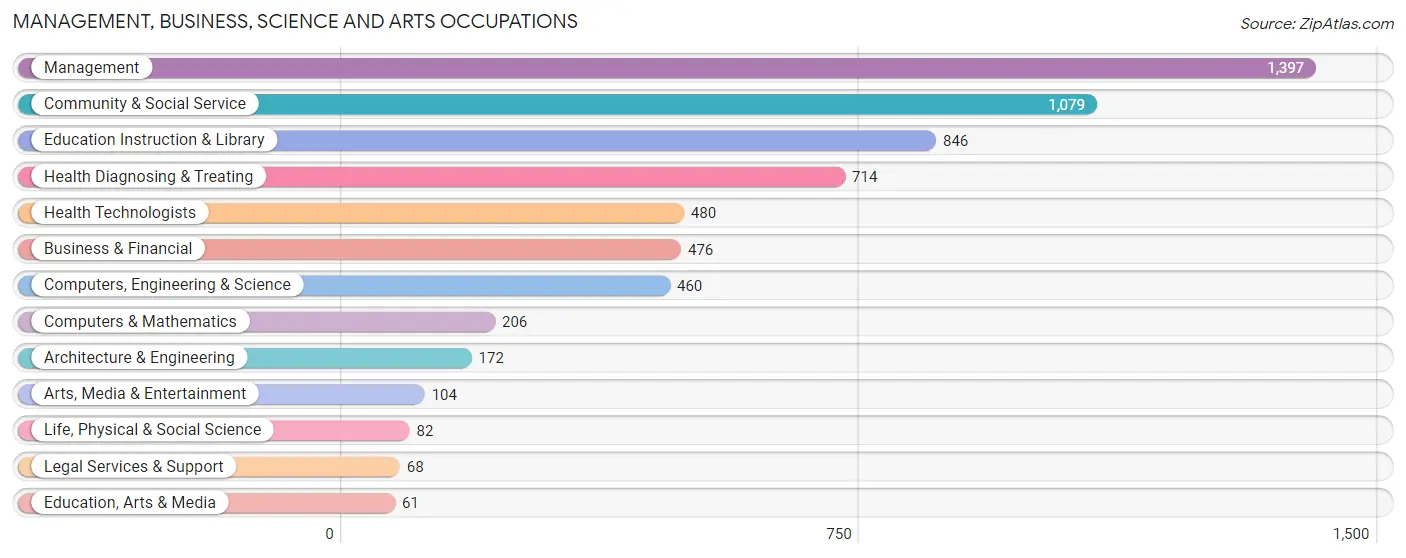
Management, Business, Science and Arts Occupations
The most common Management, Business, Science and Arts occupations in Panama City Beach are Management (1,397 | 13.8%), Community & Social Service (1,079 | 10.6%), Education Instruction & Library (846 | 8.3%), Health Diagnosing & Treating (714 | 7.0%), and Health Technologists (480 | 4.7%).
Management, Business, Science and Arts Occupations by Sex
Within the Management, Business, Science and Arts occupations in Panama City Beach, the most male-oriented occupations are Computers & Mathematics (96.6%), Architecture & Engineering (87.2%), and Computers, Engineering & Science (83.7%), while the most female-oriented occupations are Health Diagnosing & Treating (72.6%), Health Technologists (70.8%), and Education Instruction & Library (67.4%).
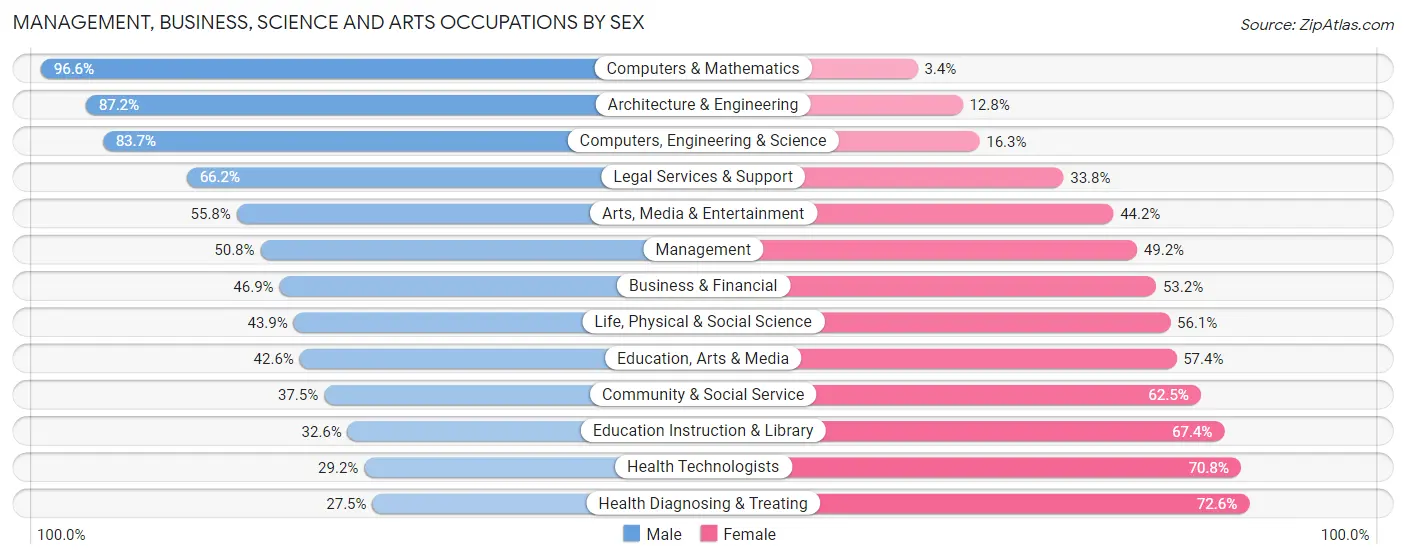
| Occupation | Male | Female |
| Management | 710 (50.8%) | 687 (49.2%) |
| Business & Financial | 223 (46.9%) | 253 (53.1%) |
| Computers, Engineering & Science | 385 (83.7%) | 75 (16.3%) |
| Computers & Mathematics | 199 (96.6%) | 7 (3.4%) |
| Architecture & Engineering | 150 (87.2%) | 22 (12.8%) |
| Life, Physical & Social Science | 36 (43.9%) | 46 (56.1%) |
| Community & Social Service | 405 (37.5%) | 674 (62.5%) |
| Education, Arts & Media | 26 (42.6%) | 35 (57.4%) |
| Legal Services & Support | 45 (66.2%) | 23 (33.8%) |
| Education Instruction & Library | 276 (32.6%) | 570 (67.4%) |
| Arts, Media & Entertainment | 58 (55.8%) | 46 (44.2%) |
| Health Diagnosing & Treating | 196 (27.5%) | 518 (72.6%) |
| Health Technologists | 140 (29.2%) | 340 (70.8%) |
| Total (Category) | 1,919 (46.5%) | 2,207 (53.5%) |
| Total (Overall) | 5,546 (54.6%) | 4,611 (45.4%) |
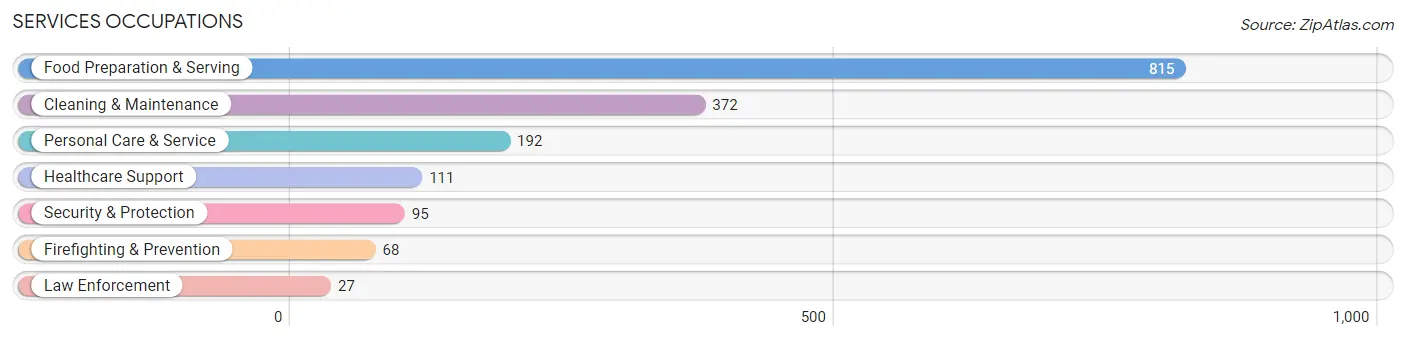
Services Occupations
The most common Services occupations in Panama City Beach are Food Preparation & Serving (815 | 8.0%), Cleaning & Maintenance (372 | 3.7%), Personal Care & Service (192 | 1.9%), Healthcare Support (111 | 1.1%), and Security & Protection (95 | 0.9%).
Services Occupations by Sex
Within the Services occupations in Panama City Beach, the most male-oriented occupations are Firefighting & Prevention (51.5%), Personal Care & Service (49.0%), and Cleaning & Maintenance (47.3%), while the most female-oriented occupations are Healthcare Support (100.0%), Law Enforcement (85.2%), and Security & Protection (59.0%).
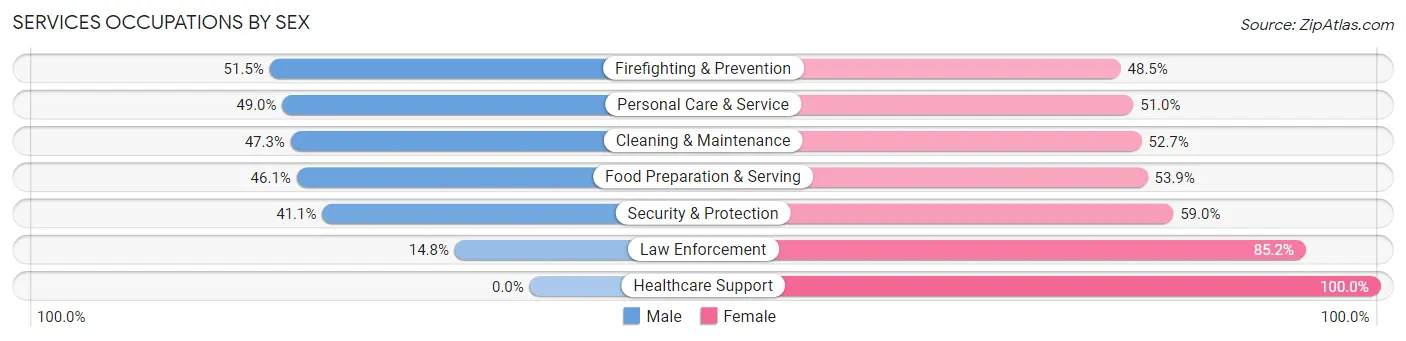
| Occupation | Male | Female |
| Healthcare Support | 0 (0.0%) | 111 (100.0%) |
| Security & Protection | 39 (41.0%) | 56 (59.0%) |
| Firefighting & Prevention | 35 (51.5%) | 33 (48.5%) |
| Law Enforcement | 4 (14.8%) | 23 (85.2%) |
| Food Preparation & Serving | 376 (46.1%) | 439 (53.9%) |
| Cleaning & Maintenance | 176 (47.3%) | 196 (52.7%) |
| Personal Care & Service | 94 (49.0%) | 98 (51.0%) |
| Total (Category) | 685 (43.2%) | 900 (56.8%) |
| Total (Overall) | 5,546 (54.6%) | 4,611 (45.4%) |
Sales and Office Occupations
The most common Sales and Office occupations in Panama City Beach are Sales & Related (2,070 | 20.4%), and Office & Administration (925 | 9.1%).
Sales and Office Occupations by Sex
| Occupation | Male | Female |
| Sales & Related | 1,398 (67.5%) | 672 (32.5%) |
| Office & Administration | 207 (22.4%) | 718 (77.6%) |
| Total (Category) | 1,605 (53.6%) | 1,390 (46.4%) |
| Total (Overall) | 5,546 (54.6%) | 4,611 (45.4%) |
Natural Resources, Construction and Maintenance Occupations
The most common Natural Resources, Construction and Maintenance occupations in Panama City Beach are Construction & Extraction (651 | 6.4%), and Installation, Maintenance & Repair (236 | 2.3%).
Natural Resources, Construction and Maintenance Occupations by Sex
| Occupation | Male | Female |
| Farming, Fishing & Forestry | 0 (0.0%) | 0 (0.0%) |
| Construction & Extraction | 615 (94.5%) | 36 (5.5%) |
| Installation, Maintenance & Repair | 236 (100.0%) | 0 (0.0%) |
| Total (Category) | 851 (95.9%) | 36 (4.1%) |
| Total (Overall) | 5,546 (54.6%) | 4,611 (45.4%) |
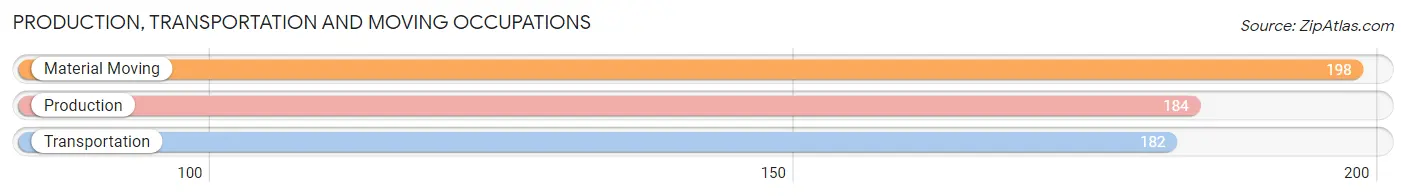
Production, Transportation and Moving Occupations
The most common Production, Transportation and Moving occupations in Panama City Beach are Material Moving (198 | 1.9%), Production (184 | 1.8%), and Transportation (182 | 1.8%).
Production, Transportation and Moving Occupations by Sex
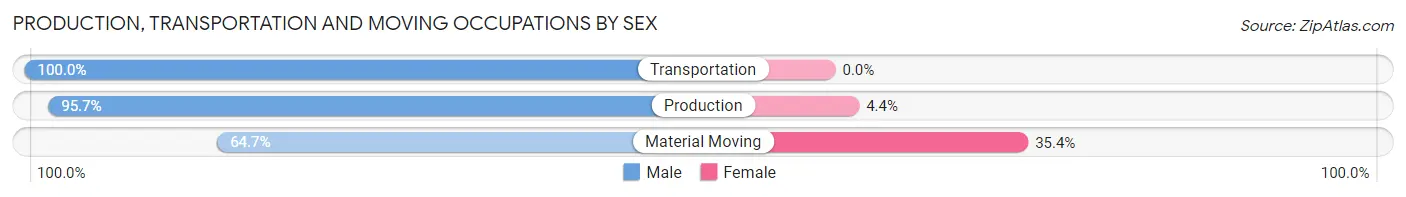
| Occupation | Male | Female |
| Production | 176 (95.7%) | 8 (4.3%) |
| Transportation | 182 (100.0%) | 0 (0.0%) |
| Material Moving | 128 (64.6%) | 70 (35.3%) |
| Total (Category) | 486 (86.2%) | 78 (13.8%) |
| Total (Overall) | 5,546 (54.6%) | 4,611 (45.4%) |
Employment Industries by Sex in Panama City Beach
Employment Industries in Panama City Beach
The major employment industries in Panama City Beach include Retail Trade (2,093 | 20.6%), Accommodation & Food Services (1,493 | 14.7%), Educational Services (958 | 9.4%), Health Care & Social Assistance (907 | 8.9%), and Construction (896 | 8.8%).
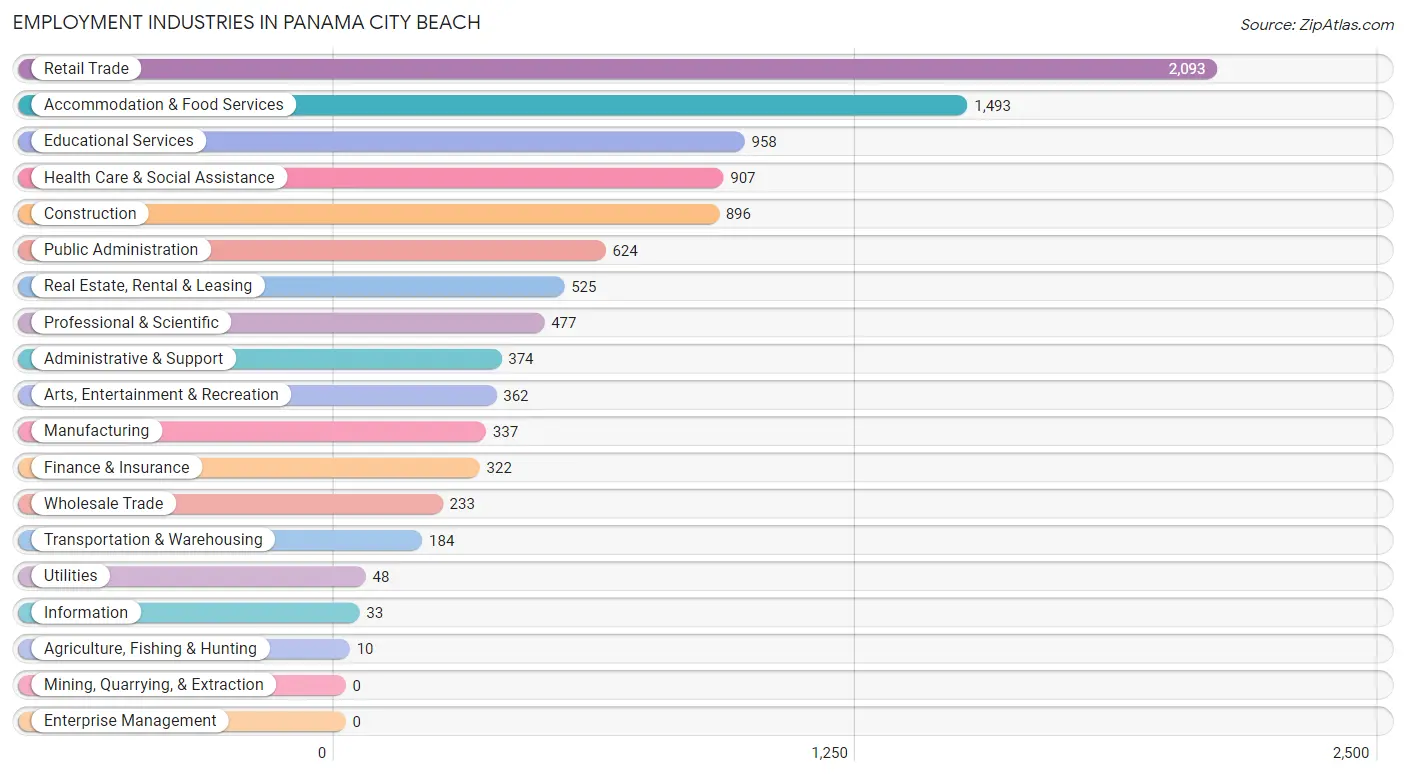
Employment Industries by Sex in Panama City Beach
The Panama City Beach industries that see more men than women are Agriculture, Fishing & Hunting (100.0%), Transportation & Warehousing (94.0%), and Construction (92.6%), whereas the industries that tend to have a higher number of women are Health Care & Social Assistance (83.7%), Real Estate, Rental & Leasing (69.0%), and Finance & Insurance (67.4%).
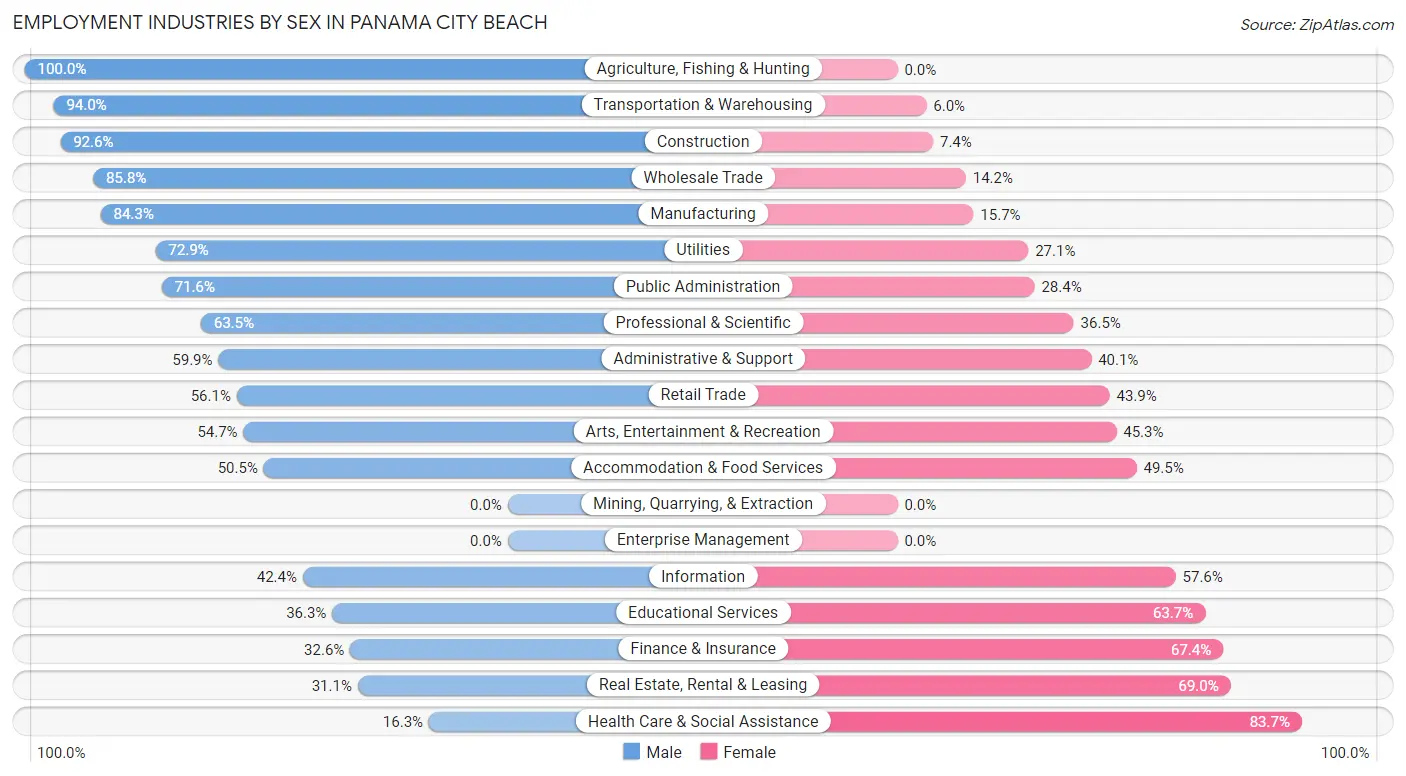
| Industry | Male | Female |
| Agriculture, Fishing & Hunting | 10 (100.0%) | 0 (0.0%) |
| Mining, Quarrying, & Extraction | 0 (0.0%) | 0 (0.0%) |
| Construction | 830 (92.6%) | 66 (7.4%) |
| Manufacturing | 284 (84.3%) | 53 (15.7%) |
| Wholesale Trade | 200 (85.8%) | 33 (14.2%) |
| Retail Trade | 1,174 (56.1%) | 919 (43.9%) |
| Transportation & Warehousing | 173 (94.0%) | 11 (6.0%) |
| Utilities | 35 (72.9%) | 13 (27.1%) |
| Information | 14 (42.4%) | 19 (57.6%) |
| Finance & Insurance | 105 (32.6%) | 217 (67.4%) |
| Real Estate, Rental & Leasing | 163 (31.0%) | 362 (69.0%) |
| Professional & Scientific | 303 (63.5%) | 174 (36.5%) |
| Enterprise Management | 0 (0.0%) | 0 (0.0%) |
| Administrative & Support | 224 (59.9%) | 150 (40.1%) |
| Educational Services | 348 (36.3%) | 610 (63.7%) |
| Health Care & Social Assistance | 148 (16.3%) | 759 (83.7%) |
| Arts, Entertainment & Recreation | 198 (54.7%) | 164 (45.3%) |
| Accommodation & Food Services | 754 (50.5%) | 739 (49.5%) |
| Public Administration | 447 (71.6%) | 177 (28.4%) |
| Total | 5,546 (54.6%) | 4,611 (45.4%) |
Education in Panama City Beach
School Enrollment in Panama City Beach
The most common levels of schooling among the 3,398 students in Panama City Beach are elementary school (831 | 24.5%), high school (769 | 22.6%), and college / undergraduate (733 | 21.6%).
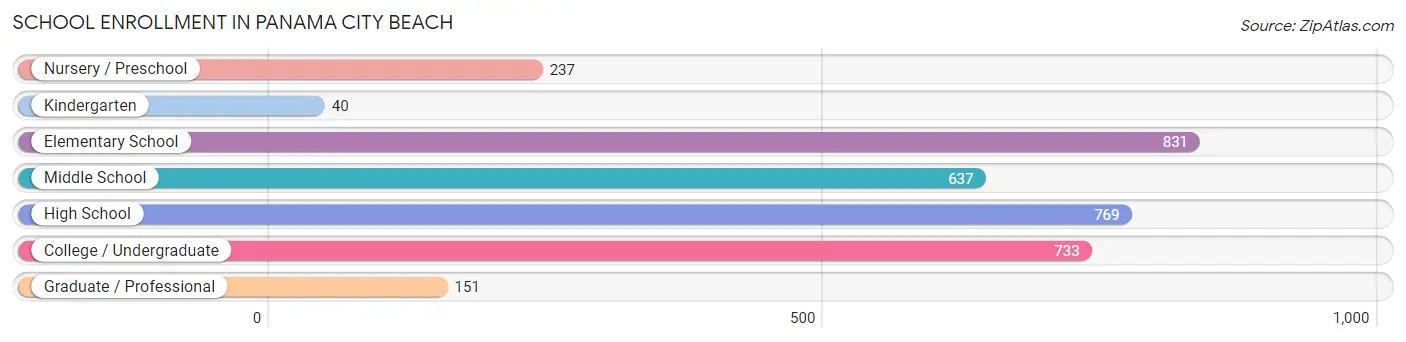
| School Level | # Students | % Students |
| Nursery / Preschool | 237 | 7.0% |
| Kindergarten | 40 | 1.2% |
| Elementary School | 831 | 24.5% |
| Middle School | 637 | 18.8% |
| High School | 769 | 22.6% |
| College / Undergraduate | 733 | 21.6% |
| Graduate / Professional | 151 | 4.4% |
| Total | 3,398 | 100.0% |
School Enrollment by Age by Funding Source in Panama City Beach
Out of a total of 3,398 students who are enrolled in schools in Panama City Beach, 479 (14.1%) attend a private institution, while the remaining 2,919 (85.9%) are enrolled in public schools. The age group of 3 to 4 year olds has the highest likelihood of being enrolled in private schools, with 69 (48.2% in the age bracket) enrolled. Conversely, the age group of 18 to 19 year olds has the lowest likelihood of being enrolled in a private school, with 168 (100.0% in the age bracket) attending a public institution.
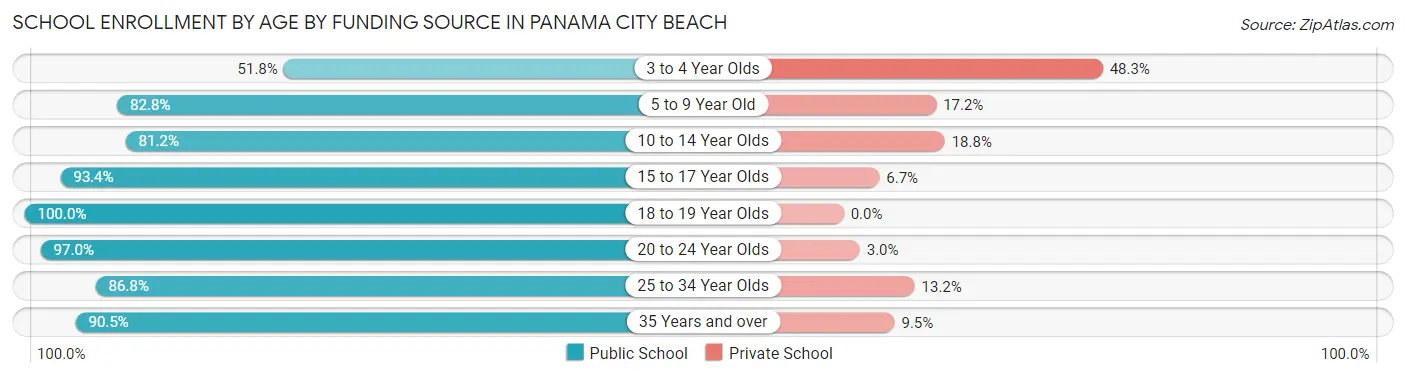
| Age Bracket | Public School | Private School |
| 3 to 4 Year Olds | 74 (51.7%) | 69 (48.2%) |
| 5 to 9 Year Old | 682 (82.8%) | 142 (17.2%) |
| 10 to 14 Year Olds | 673 (81.2%) | 156 (18.8%) |
| 15 to 17 Year Olds | 576 (93.3%) | 41 (6.7%) |
| 18 to 19 Year Olds | 168 (100.0%) | 0 (0.0%) |
| 20 to 24 Year Olds | 259 (97.0%) | 8 (3.0%) |
| 25 to 34 Year Olds | 276 (86.8%) | 42 (13.2%) |
| 35 Years and over | 210 (90.5%) | 22 (9.5%) |
| Total | 2,919 (85.9%) | 479 (14.1%) |
Educational Attainment by Field of Study in Panama City Beach
Business (940 | 19.0%), education (713 | 14.4%), science & technology (629 | 12.7%), engineering (443 | 9.0%), and arts & humanities (432 | 8.7%) are the most common fields of study among 4,937 individuals in Panama City Beach who have obtained a bachelor's degree or higher.
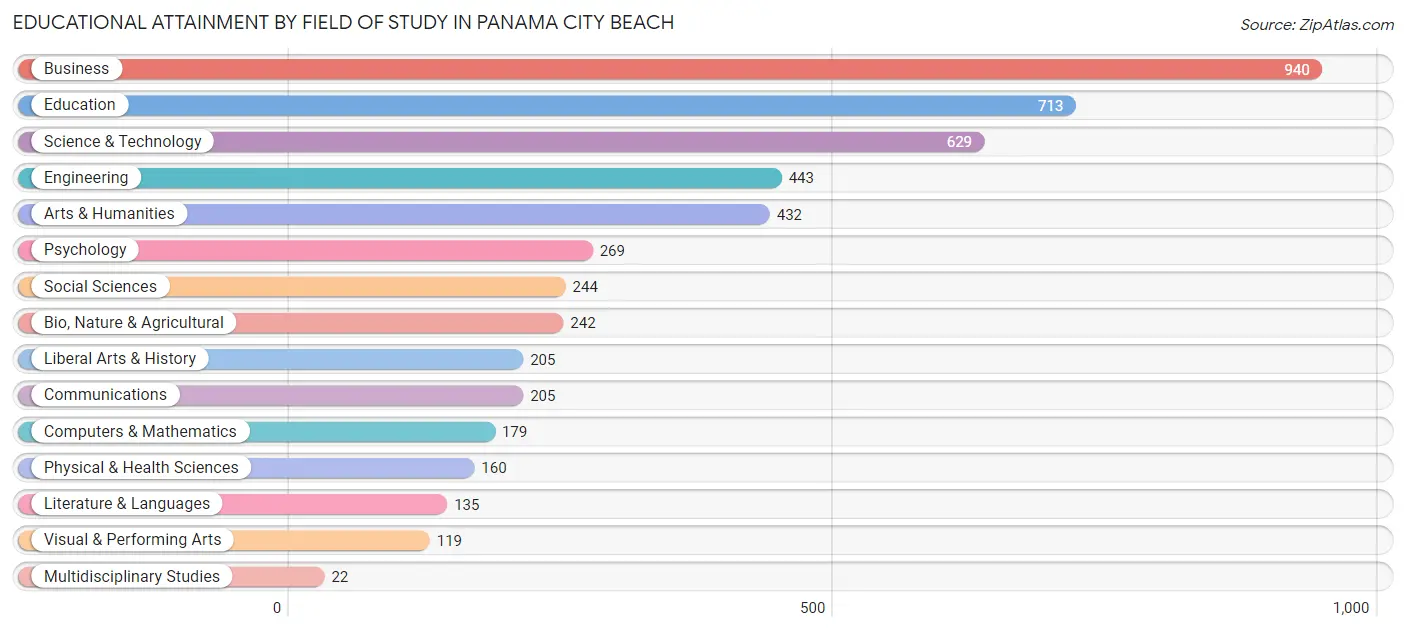
| Field of Study | # Graduates | % Graduates |
| Computers & Mathematics | 179 | 3.6% |
| Bio, Nature & Agricultural | 242 | 4.9% |
| Physical & Health Sciences | 160 | 3.2% |
| Psychology | 269 | 5.4% |
| Social Sciences | 244 | 4.9% |
| Engineering | 443 | 9.0% |
| Multidisciplinary Studies | 22 | 0.4% |
| Science & Technology | 629 | 12.7% |
| Business | 940 | 19.0% |
| Education | 713 | 14.4% |
| Literature & Languages | 135 | 2.7% |
| Liberal Arts & History | 205 | 4.2% |
| Visual & Performing Arts | 119 | 2.4% |
| Communications | 205 | 4.2% |
| Arts & Humanities | 432 | 8.7% |
| Total | 4,937 | 100.0% |
Transportation & Commute in Panama City Beach
Vehicle Availability by Sex in Panama City Beach
The most prevalent vehicle ownership categories in Panama City Beach are males with 2 vehicles (2,532, accounting for 44.3%) and females with 2 vehicles (2,228, making up 55.7%).
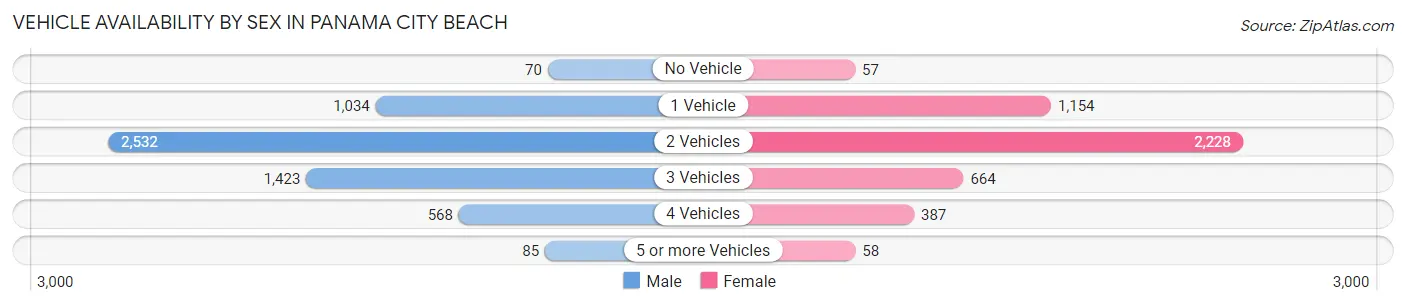
| Vehicles Available | Male | Female |
| No Vehicle | 70 (1.2%) | 57 (1.3%) |
| 1 Vehicle | 1,034 (18.1%) | 1,154 (25.4%) |
| 2 Vehicles | 2,532 (44.3%) | 2,228 (49.0%) |
| 3 Vehicles | 1,423 (24.9%) | 664 (14.6%) |
| 4 Vehicles | 568 (9.9%) | 387 (8.5%) |
| 5 or more Vehicles | 85 (1.5%) | 58 (1.3%) |
| Total | 5,712 (100.0%) | 4,548 (100.0%) |
Commute Time in Panama City Beach
The most frequently occuring commute durations in Panama City Beach are 15 to 19 minutes (1,853 commuters, 19.6%), 10 to 14 minutes (1,589 commuters, 16.8%), and 20 to 24 minutes (1,540 commuters, 16.3%).
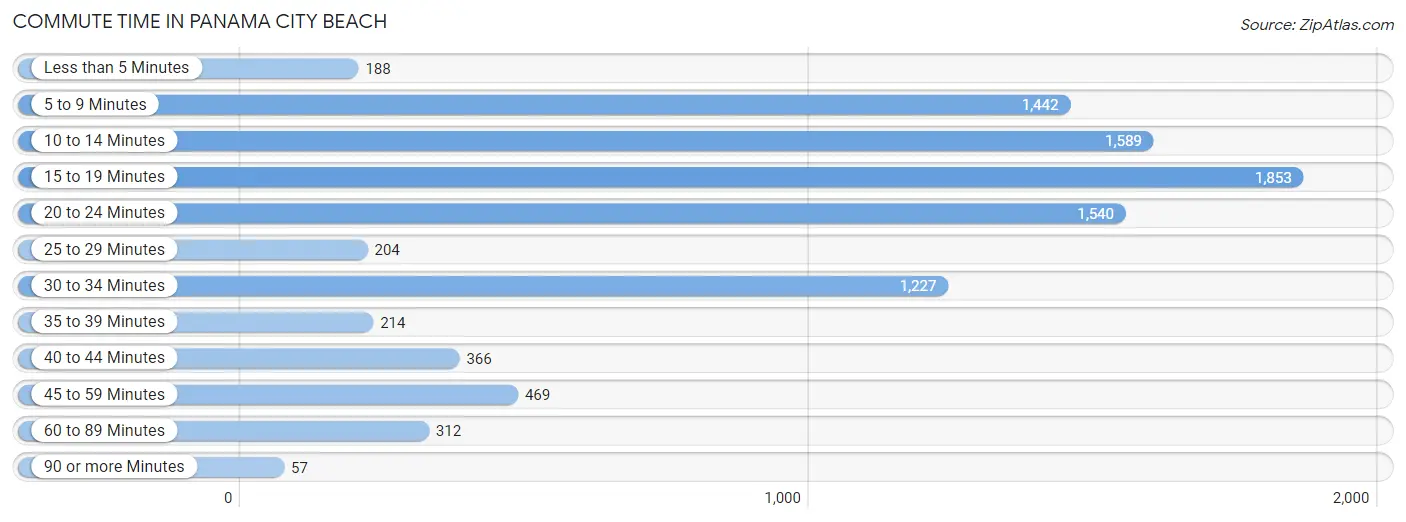
| Commute Time | # Commuters | % Commuters |
| Less than 5 Minutes | 188 | 2.0% |
| 5 to 9 Minutes | 1,442 | 15.2% |
| 10 to 14 Minutes | 1,589 | 16.8% |
| 15 to 19 Minutes | 1,853 | 19.6% |
| 20 to 24 Minutes | 1,540 | 16.3% |
| 25 to 29 Minutes | 204 | 2.2% |
| 30 to 34 Minutes | 1,227 | 13.0% |
| 35 to 39 Minutes | 214 | 2.3% |
| 40 to 44 Minutes | 366 | 3.9% |
| 45 to 59 Minutes | 469 | 5.0% |
| 60 to 89 Minutes | 312 | 3.3% |
| 90 or more Minutes | 57 | 0.6% |
Commute Time by Sex in Panama City Beach
The most common commute times in Panama City Beach are 15 to 19 minutes (1,145 commuters, 21.3%) for males and 10 to 14 minutes (879 commuters, 21.5%) for females.
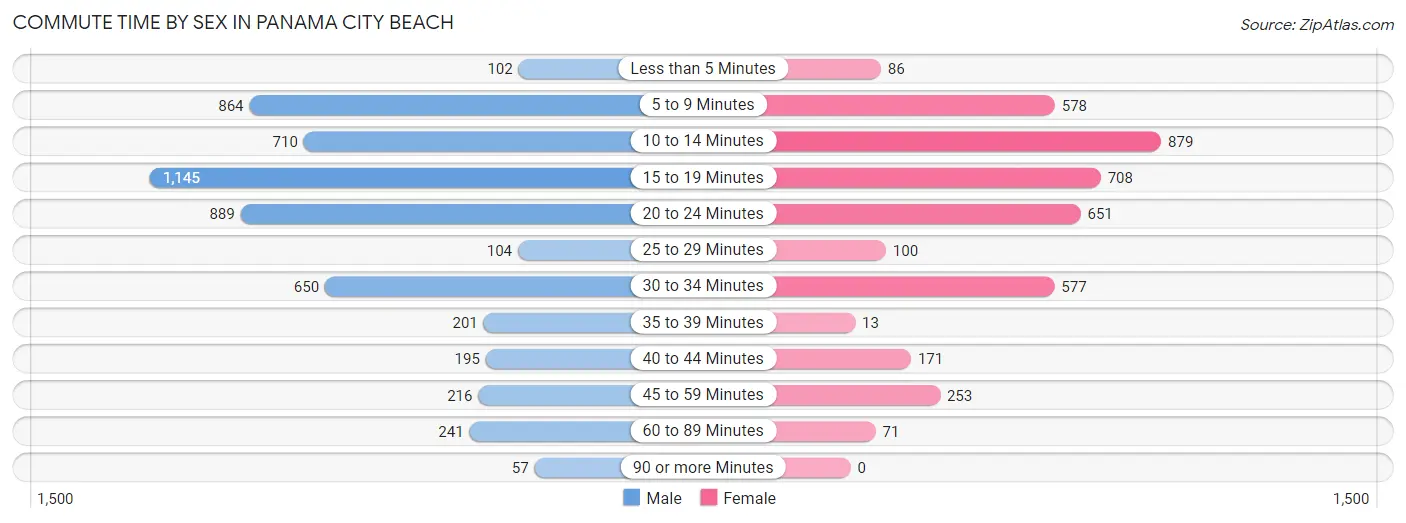
| Commute Time | Male | Female |
| Less than 5 Minutes | 102 (1.9%) | 86 (2.1%) |
| 5 to 9 Minutes | 864 (16.1%) | 578 (14.1%) |
| 10 to 14 Minutes | 710 (13.2%) | 879 (21.5%) |
| 15 to 19 Minutes | 1,145 (21.3%) | 708 (17.3%) |
| 20 to 24 Minutes | 889 (16.5%) | 651 (15.9%) |
| 25 to 29 Minutes | 104 (1.9%) | 100 (2.5%) |
| 30 to 34 Minutes | 650 (12.1%) | 577 (14.1%) |
| 35 to 39 Minutes | 201 (3.7%) | 13 (0.3%) |
| 40 to 44 Minutes | 195 (3.6%) | 171 (4.2%) |
| 45 to 59 Minutes | 216 (4.0%) | 253 (6.2%) |
| 60 to 89 Minutes | 241 (4.5%) | 71 (1.7%) |
| 90 or more Minutes | 57 (1.1%) | 0 (0.0%) |
Time of Departure to Work by Sex in Panama City Beach
The most frequent times of departure to work in Panama City Beach are 6:30 AM to 6:59 AM (788, 14.7%) for males and 7:00 AM to 7:29 AM (699, 17.1%) for females.
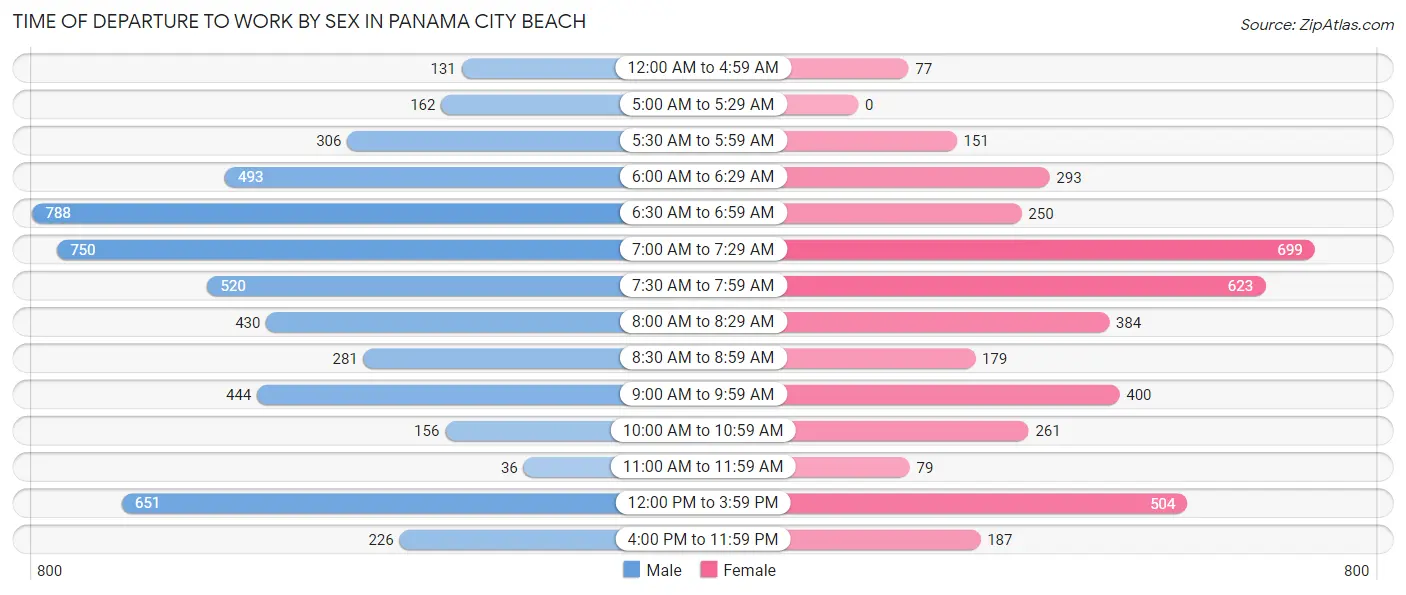
| Time of Departure | Male | Female |
| 12:00 AM to 4:59 AM | 131 (2.4%) | 77 (1.9%) |
| 5:00 AM to 5:29 AM | 162 (3.0%) | 0 (0.0%) |
| 5:30 AM to 5:59 AM | 306 (5.7%) | 151 (3.7%) |
| 6:00 AM to 6:29 AM | 493 (9.2%) | 293 (7.2%) |
| 6:30 AM to 6:59 AM | 788 (14.7%) | 250 (6.1%) |
| 7:00 AM to 7:29 AM | 750 (14.0%) | 699 (17.1%) |
| 7:30 AM to 7:59 AM | 520 (9.7%) | 623 (15.2%) |
| 8:00 AM to 8:29 AM | 430 (8.0%) | 384 (9.4%) |
| 8:30 AM to 8:59 AM | 281 (5.2%) | 179 (4.4%) |
| 9:00 AM to 9:59 AM | 444 (8.3%) | 400 (9.8%) |
| 10:00 AM to 10:59 AM | 156 (2.9%) | 261 (6.4%) |
| 11:00 AM to 11:59 AM | 36 (0.7%) | 79 (1.9%) |
| 12:00 PM to 3:59 PM | 651 (12.1%) | 504 (12.3%) |
| 4:00 PM to 11:59 PM | 226 (4.2%) | 187 (4.6%) |
| Total | 5,374 (100.0%) | 4,087 (100.0%) |
Housing Occupancy in Panama City Beach
Occupancy by Ownership in Panama City Beach
Of the total 8,163 dwellings in Panama City Beach, owner-occupied units account for 4,969 (60.9%), while renter-occupied units make up 3,194 (39.1%).
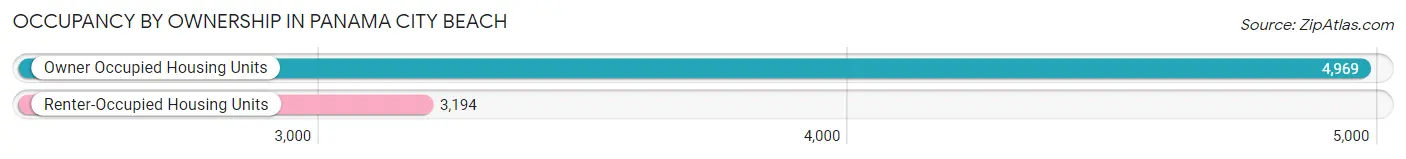
| Occupancy | # Housing Units | % Housing Units |
| Owner Occupied Housing Units | 4,969 | 60.9% |
| Renter-Occupied Housing Units | 3,194 | 39.1% |
| Total Occupied Housing Units | 8,163 | 100.0% |
Occupancy by Household Size in Panama City Beach
| Household Size | # Housing Units | % Housing Units |
| 1-Person Household | 2,177 | 26.7% |
| 2-Person Household | 3,614 | 44.3% |
| 3-Person Household | 1,235 | 15.1% |
| 4+ Person Household | 1,137 | 13.9% |
| Total Housing Units | 8,163 | 100.0% |
Occupancy by Ownership by Household Size in Panama City Beach
| Household Size | Owner-occupied | Renter-occupied |
| 1-Person Household | 1,226 (56.3%) | 951 (43.7%) |
| 2-Person Household | 2,212 (61.2%) | 1,402 (38.8%) |
| 3-Person Household | 776 (62.8%) | 459 (37.2%) |
| 4+ Person Household | 755 (66.4%) | 382 (33.6%) |
| Total Housing Units | 4,969 (60.9%) | 3,194 (39.1%) |
Occupancy by Educational Attainment in Panama City Beach
| Household Size | Owner-occupied | Renter-occupied |
| Less than High School | 128 (25.2%) | 380 (74.8%) |
| High School Diploma | 798 (62.7%) | 475 (37.3%) |
| College/Associate Degree | 1,697 (51.2%) | 1,614 (48.7%) |
| Bachelor's Degree or higher | 2,346 (76.4%) | 725 (23.6%) |
Occupancy by Age of Householder in Panama City Beach
| Age Bracket | # Households | % Households |
| Under 35 Years | 1,569 | 19.2% |
| 35 to 44 Years | 1,140 | 14.0% |
| 45 to 54 Years | 1,524 | 18.7% |
| 55 to 64 Years | 2,001 | 24.5% |
| 65 to 74 Years | 1,241 | 15.2% |
| 75 to 84 Years | 514 | 6.3% |
| 85 Years and Over | 174 | 2.1% |
| Total | 8,163 | 100.0% |
Housing Finances in Panama City Beach
Median Income by Occupancy in Panama City Beach
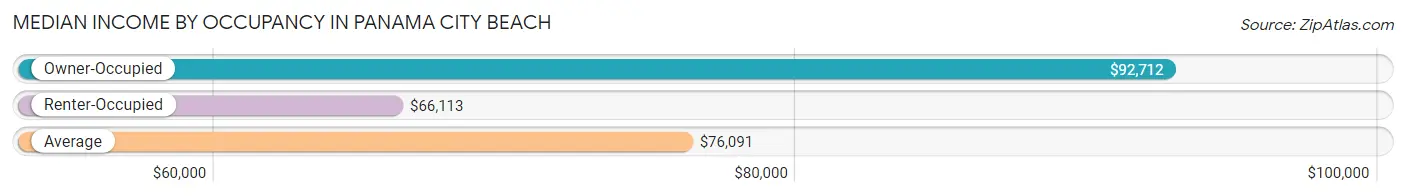
| Occupancy Type | # Households | Median Income |
| Owner-Occupied | 4,969 (60.9%) | $92,712 |
| Renter-Occupied | 3,194 (39.1%) | $66,113 |
| Average | 8,163 (100.0%) | $76,091 |
Occupancy by Householder Income Bracket in Panama City Beach
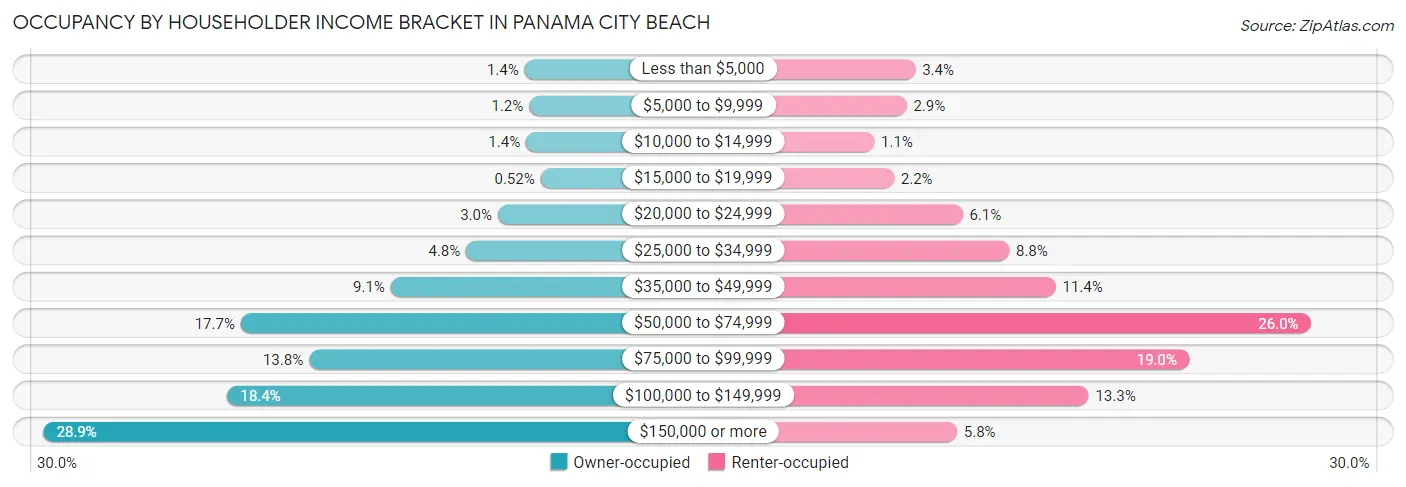
| Income Bracket | Owner-occupied | Renter-occupied |
| Less than $5,000 | 71 (1.4%) | 109 (3.4%) |
| $5,000 to $9,999 | 58 (1.2%) | 93 (2.9%) |
| $10,000 to $14,999 | 67 (1.3%) | 34 (1.1%) |
| $15,000 to $19,999 | 26 (0.5%) | 70 (2.2%) |
| $20,000 to $24,999 | 147 (3.0%) | 195 (6.1%) |
| $25,000 to $34,999 | 237 (4.8%) | 280 (8.8%) |
| $35,000 to $49,999 | 451 (9.1%) | 365 (11.4%) |
| $50,000 to $74,999 | 877 (17.6%) | 830 (26.0%) |
| $75,000 to $99,999 | 683 (13.8%) | 608 (19.0%) |
| $100,000 to $149,999 | 915 (18.4%) | 425 (13.3%) |
| $150,000 or more | 1,437 (28.9%) | 185 (5.8%) |
| Total | 4,969 (100.0%) | 3,194 (100.0%) |
Monthly Housing Cost Tiers in Panama City Beach
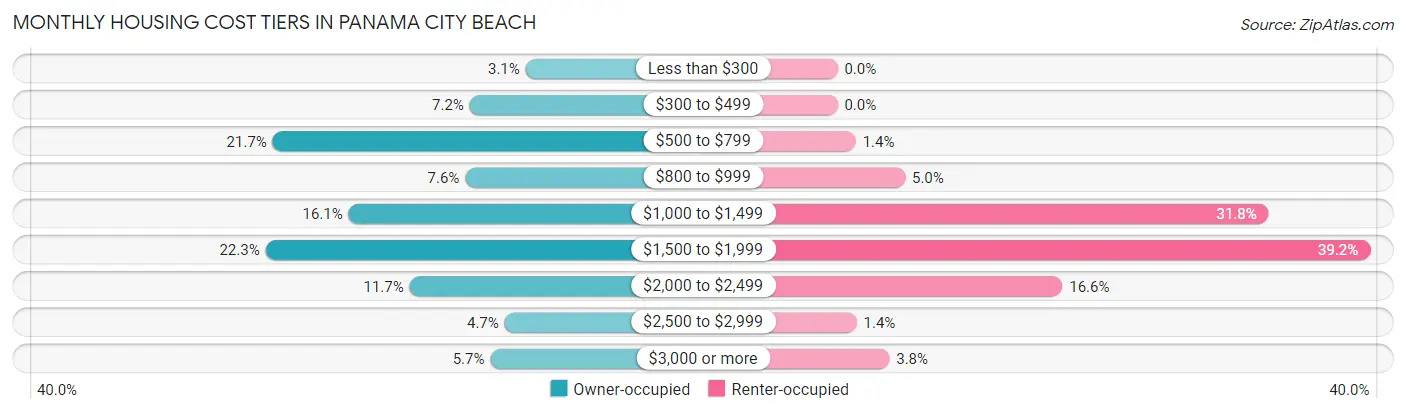
| Monthly Cost | Owner-occupied | Renter-occupied |
| Less than $300 | 154 (3.1%) | 0 (0.0%) |
| $300 to $499 | 359 (7.2%) | 0 (0.0%) |
| $500 to $799 | 1,080 (21.7%) | 43 (1.3%) |
| $800 to $999 | 375 (7.5%) | 159 (5.0%) |
| $1,000 to $1,499 | 802 (16.1%) | 1,014 (31.8%) |
| $1,500 to $1,999 | 1,106 (22.3%) | 1,253 (39.2%) |
| $2,000 to $2,499 | 579 (11.7%) | 529 (16.6%) |
| $2,500 to $2,999 | 231 (4.6%) | 45 (1.4%) |
| $3,000 or more | 283 (5.7%) | 122 (3.8%) |
| Total | 4,969 (100.0%) | 3,194 (100.0%) |
Physical Housing Characteristics in Panama City Beach
Housing Structures in Panama City Beach
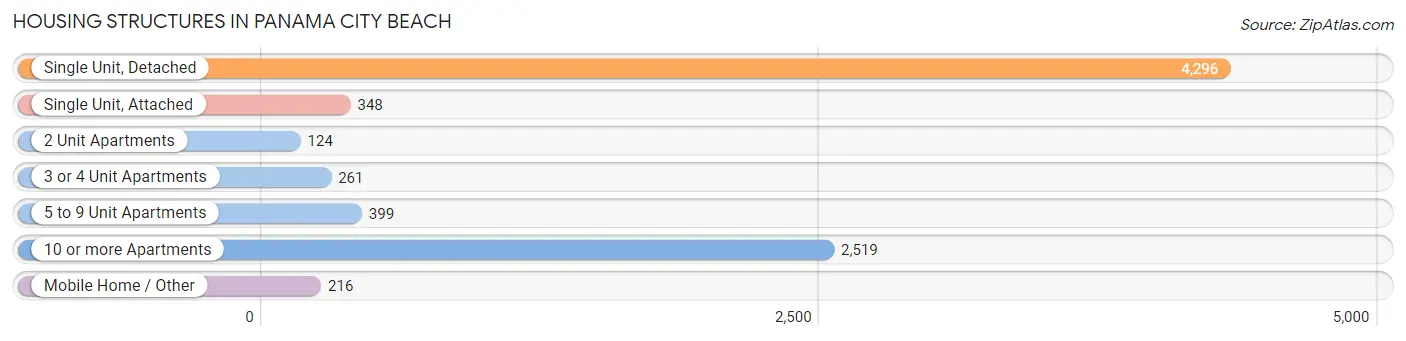
| Structure Type | # Housing Units | % Housing Units |
| Single Unit, Detached | 4,296 | 52.6% |
| Single Unit, Attached | 348 | 4.3% |
| 2 Unit Apartments | 124 | 1.5% |
| 3 or 4 Unit Apartments | 261 | 3.2% |
| 5 to 9 Unit Apartments | 399 | 4.9% |
| 10 or more Apartments | 2,519 | 30.9% |
| Mobile Home / Other | 216 | 2.6% |
| Total | 8,163 | 100.0% |
Housing Structures by Occupancy in Panama City Beach
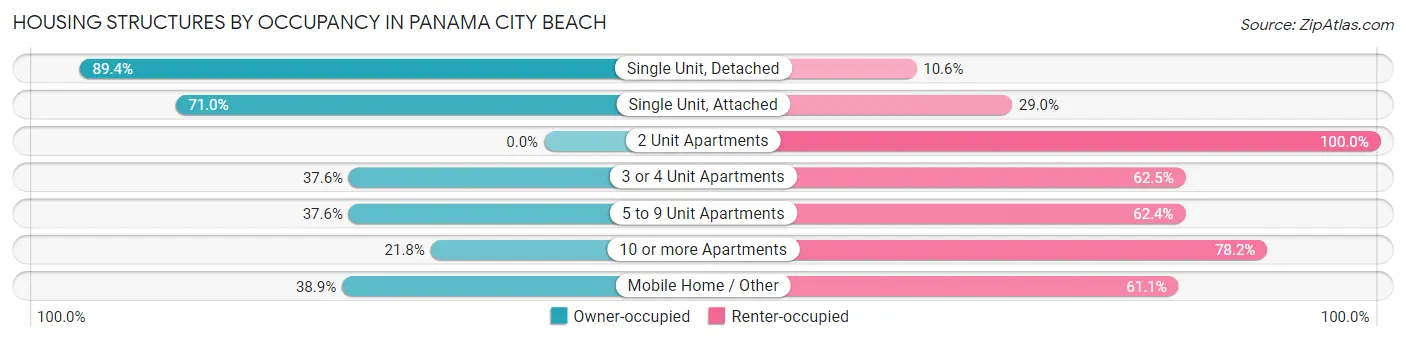
| Structure Type | Owner-occupied | Renter-occupied |
| Single Unit, Detached | 3,840 (89.4%) | 456 (10.6%) |
| Single Unit, Attached | 247 (71.0%) | 101 (29.0%) |
| 2 Unit Apartments | 0 (0.0%) | 124 (100.0%) |
| 3 or 4 Unit Apartments | 98 (37.6%) | 163 (62.5%) |
| 5 to 9 Unit Apartments | 150 (37.6%) | 249 (62.4%) |
| 10 or more Apartments | 550 (21.8%) | 1,969 (78.2%) |
| Mobile Home / Other | 84 (38.9%) | 132 (61.1%) |
| Total | 4,969 (60.9%) | 3,194 (39.1%) |
Housing Structures by Number of Rooms in Panama City Beach
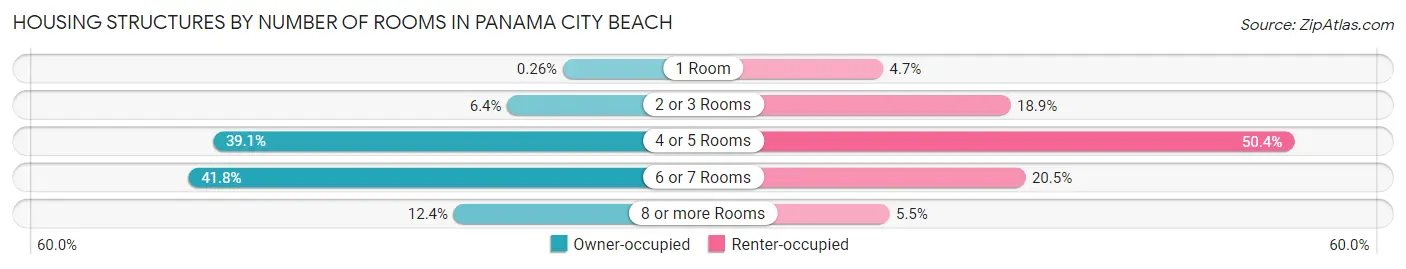
| Number of Rooms | Owner-occupied | Renter-occupied |
| 1 Room | 13 (0.3%) | 151 (4.7%) |
| 2 or 3 Rooms | 319 (6.4%) | 603 (18.9%) |
| 4 or 5 Rooms | 1,944 (39.1%) | 1,610 (50.4%) |
| 6 or 7 Rooms | 2,079 (41.8%) | 656 (20.5%) |
| 8 or more Rooms | 614 (12.4%) | 174 (5.4%) |
| Total | 4,969 (100.0%) | 3,194 (100.0%) |
Housing Structure by Heating Type in Panama City Beach
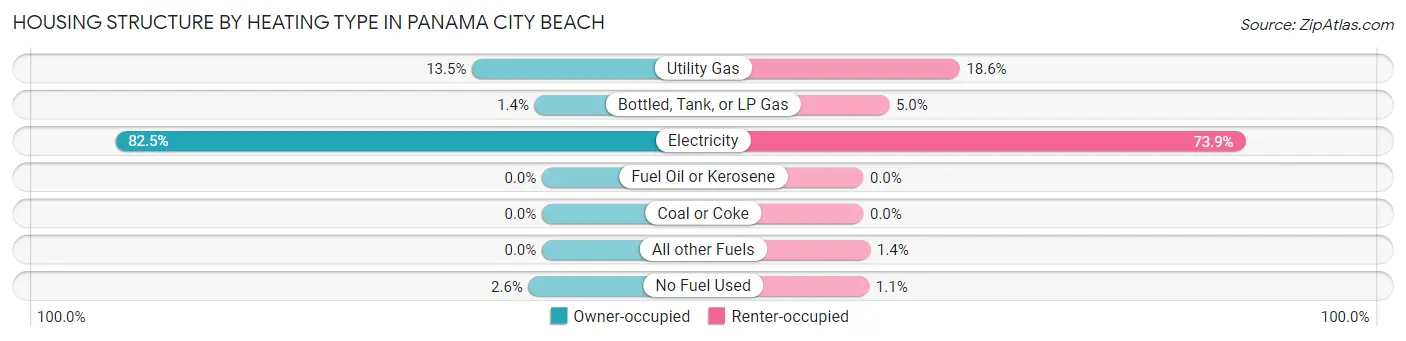
| Heating Type | Owner-occupied | Renter-occupied |
| Utility Gas | 671 (13.5%) | 595 (18.6%) |
| Bottled, Tank, or LP Gas | 70 (1.4%) | 160 (5.0%) |
| Electricity | 4,099 (82.5%) | 2,360 (73.9%) |
| Fuel Oil or Kerosene | 0 (0.0%) | 0 (0.0%) |
| Coal or Coke | 0 (0.0%) | 0 (0.0%) |
| All other Fuels | 0 (0.0%) | 43 (1.3%) |
| No Fuel Used | 129 (2.6%) | 36 (1.1%) |
| Total | 4,969 (100.0%) | 3,194 (100.0%) |
Household Vehicle Usage in Panama City Beach
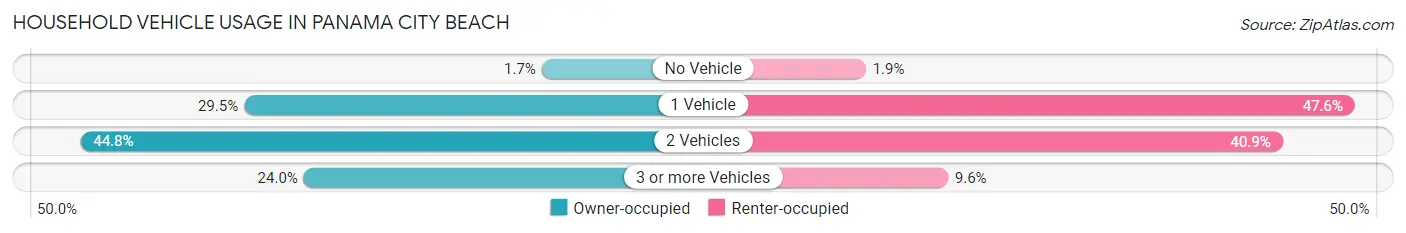
| Vehicles per Household | Owner-occupied | Renter-occupied |
| No Vehicle | 86 (1.7%) | 62 (1.9%) |
| 1 Vehicle | 1,467 (29.5%) | 1,520 (47.6%) |
| 2 Vehicles | 2,226 (44.8%) | 1,305 (40.9%) |
| 3 or more Vehicles | 1,190 (23.9%) | 307 (9.6%) |
| Total | 4,969 (100.0%) | 3,194 (100.0%) |
Real Estate & Mortgages in Panama City Beach
Real Estate and Mortgage Overview in Panama City Beach
| Characteristic | Without Mortgage | With Mortgage |
| Housing Units | 2,206 | 2,763 |
| Median Property Value | $366,700 | $361,900 |
| Median Household Income | $79,688 | $877 |
| Monthly Housing Costs | $691 | $283 |
| Real Estate Taxes | $1,915 | $78 |
Property Value by Mortgage Status in Panama City Beach
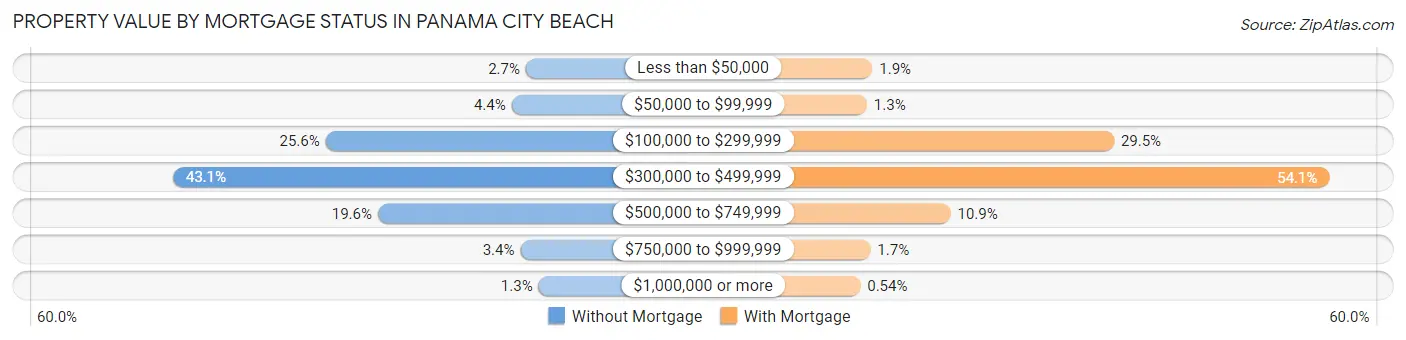
| Property Value | Without Mortgage | With Mortgage |
| Less than $50,000 | 60 (2.7%) | 53 (1.9%) |
| $50,000 to $99,999 | 96 (4.3%) | 36 (1.3%) |
| $100,000 to $299,999 | 565 (25.6%) | 816 (29.5%) |
| $300,000 to $499,999 | 950 (43.1%) | 1,496 (54.1%) |
| $500,000 to $749,999 | 433 (19.6%) | 300 (10.9%) |
| $750,000 to $999,999 | 74 (3.4%) | 47 (1.7%) |
| $1,000,000 or more | 28 (1.3%) | 15 (0.5%) |
| Total | 2,206 (100.0%) | 2,763 (100.0%) |
Household Income by Mortgage Status in Panama City Beach
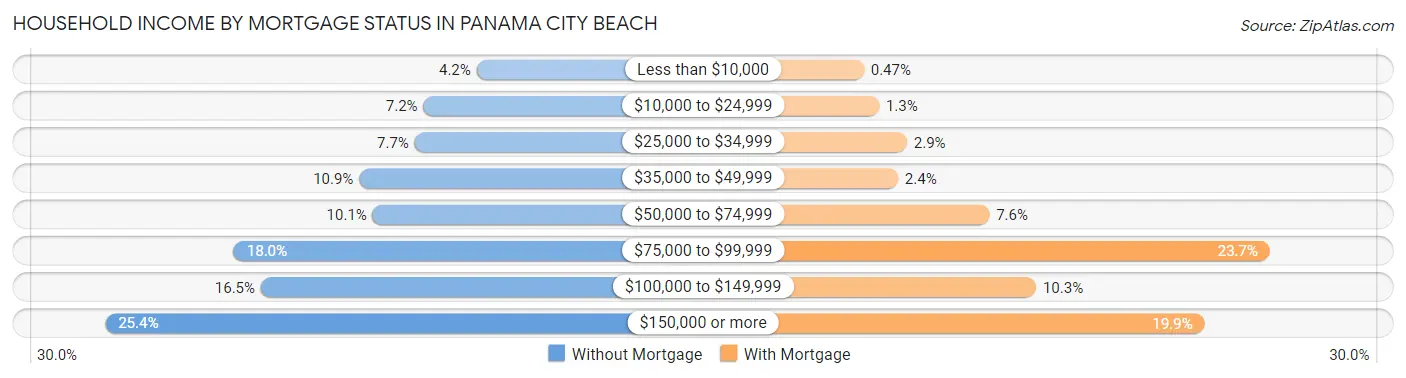
| Household Income | Without Mortgage | With Mortgage |
| Less than $10,000 | 92 (4.2%) | 13 (0.5%) |
| $10,000 to $24,999 | 159 (7.2%) | 37 (1.3%) |
| $25,000 to $34,999 | 170 (7.7%) | 81 (2.9%) |
| $35,000 to $49,999 | 240 (10.9%) | 67 (2.4%) |
| $50,000 to $74,999 | 223 (10.1%) | 211 (7.6%) |
| $75,000 to $99,999 | 398 (18.0%) | 654 (23.7%) |
| $100,000 to $149,999 | 364 (16.5%) | 285 (10.3%) |
| $150,000 or more | 560 (25.4%) | 551 (19.9%) |
| Total | 2,206 (100.0%) | 2,763 (100.0%) |
Property Value to Household Income Ratio in Panama City Beach
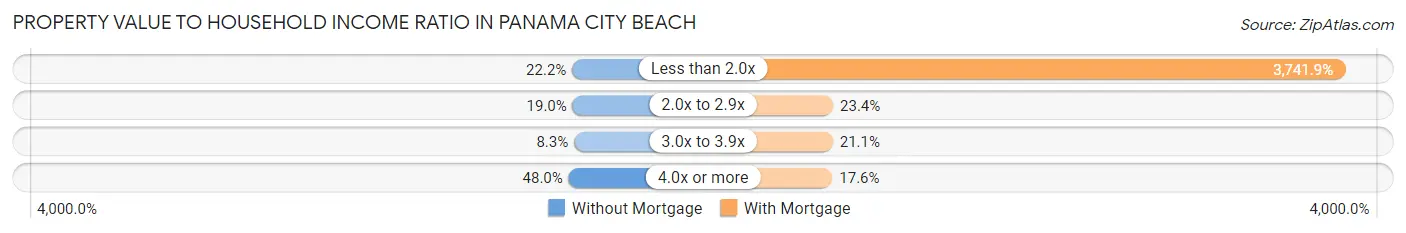
| Value-to-Income Ratio | Without Mortgage | With Mortgage |
| Less than 2.0x | 489 (22.2%) | 103,389 (3,741.9%) |
| 2.0x to 2.9x | 418 (19.0%) | 646 (23.4%) |
| 3.0x to 3.9x | 183 (8.3%) | 583 (21.1%) |
| 4.0x or more | 1,058 (48.0%) | 487 (17.6%) |
| Total | 2,206 (100.0%) | 2,763 (100.0%) |
Real Estate Taxes by Mortgage Status in Panama City Beach
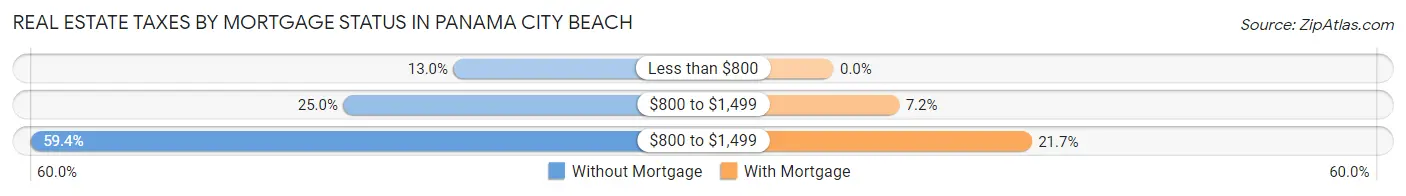
| Property Taxes | Without Mortgage | With Mortgage |
| Less than $800 | 286 (13.0%) | 0 (0.0%) |
| $800 to $1,499 | 552 (25.0%) | 199 (7.2%) |
| $800 to $1,499 | 1,310 (59.4%) | 600 (21.7%) |
| Total | 2,206 (100.0%) | 2,763 (100.0%) |
Health & Disability in Panama City Beach
Health Insurance Coverage by Age in Panama City Beach
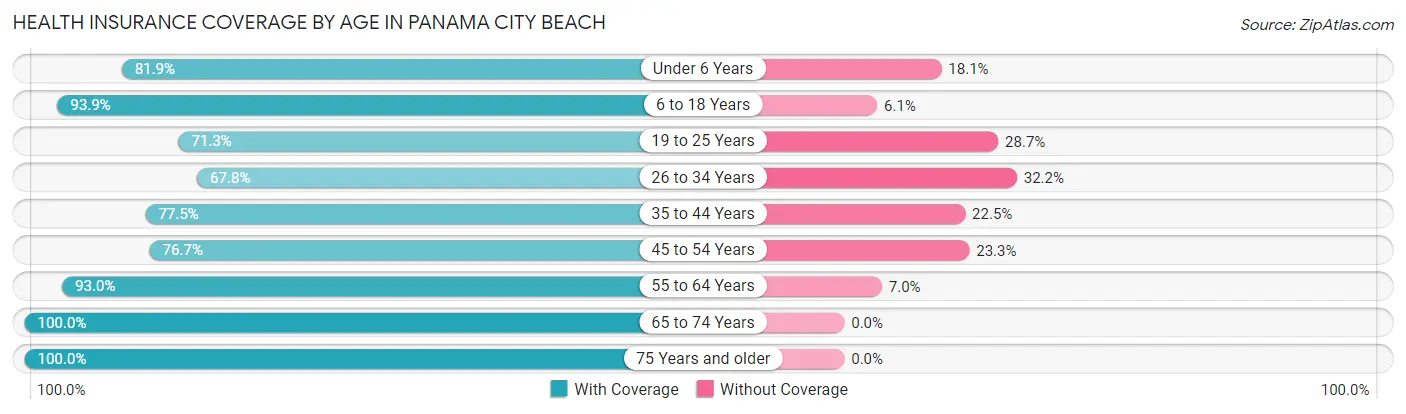
| Age Bracket | With Coverage | Without Coverage |
| Under 6 Years | 624 (81.9%) | 138 (18.1%) |
| 6 to 18 Years | 2,163 (93.9%) | 141 (6.1%) |
| 19 to 25 Years | 1,101 (71.3%) | 443 (28.7%) |
| 26 to 34 Years | 1,385 (67.8%) | 657 (32.2%) |
| 35 to 44 Years | 1,670 (77.5%) | 486 (22.5%) |
| 45 to 54 Years | 2,066 (76.7%) | 628 (23.3%) |
| 55 to 64 Years | 3,029 (93.0%) | 228 (7.0%) |
| 65 to 74 Years | 2,124 (100.0%) | 0 (0.0%) |
| 75 Years and older | 1,095 (100.0%) | 0 (0.0%) |
| Total | 15,257 (84.9%) | 2,721 (15.1%) |
Health Insurance Coverage by Citizenship Status in Panama City Beach
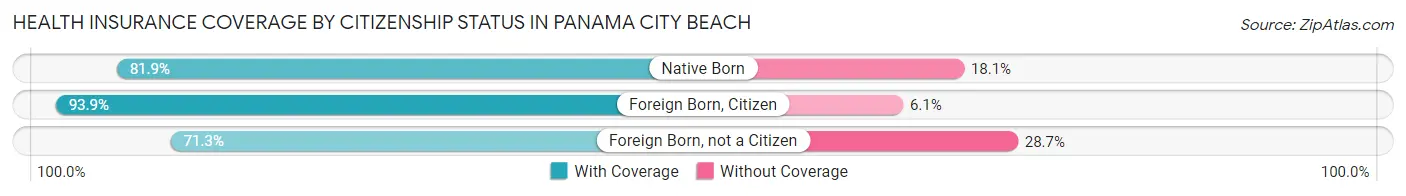
| Citizenship Status | With Coverage | Without Coverage |
| Native Born | 624 (81.9%) | 138 (18.1%) |
| Foreign Born, Citizen | 2,163 (93.9%) | 141 (6.1%) |
| Foreign Born, not a Citizen | 1,101 (71.3%) | 443 (28.7%) |
Health Insurance Coverage by Household Income in Panama City Beach
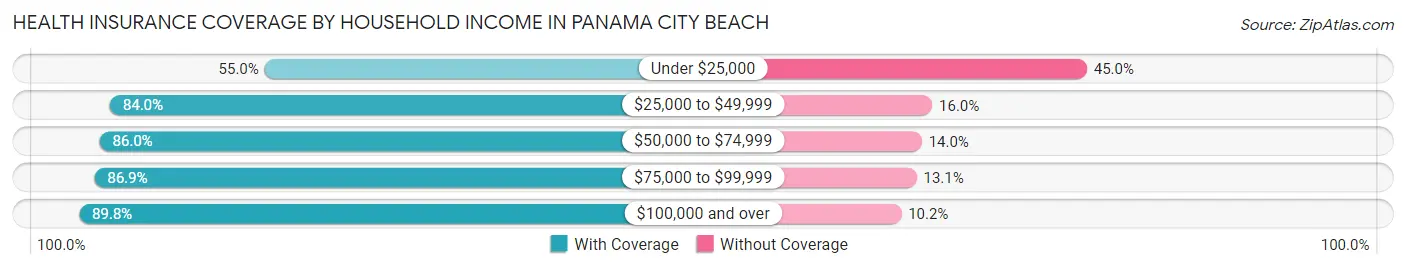
| Household Income | With Coverage | Without Coverage |
| Under $25,000 | 854 (55.0%) | 698 (45.0%) |
| $25,000 to $49,999 | 2,134 (84.0%) | 406 (16.0%) |
| $50,000 to $74,999 | 2,610 (86.0%) | 426 (14.0%) |
| $75,000 to $99,999 | 2,589 (86.9%) | 389 (13.1%) |
| $100,000 and over | 7,067 (89.8%) | 802 (10.2%) |
Public vs Private Health Insurance Coverage by Age in Panama City Beach
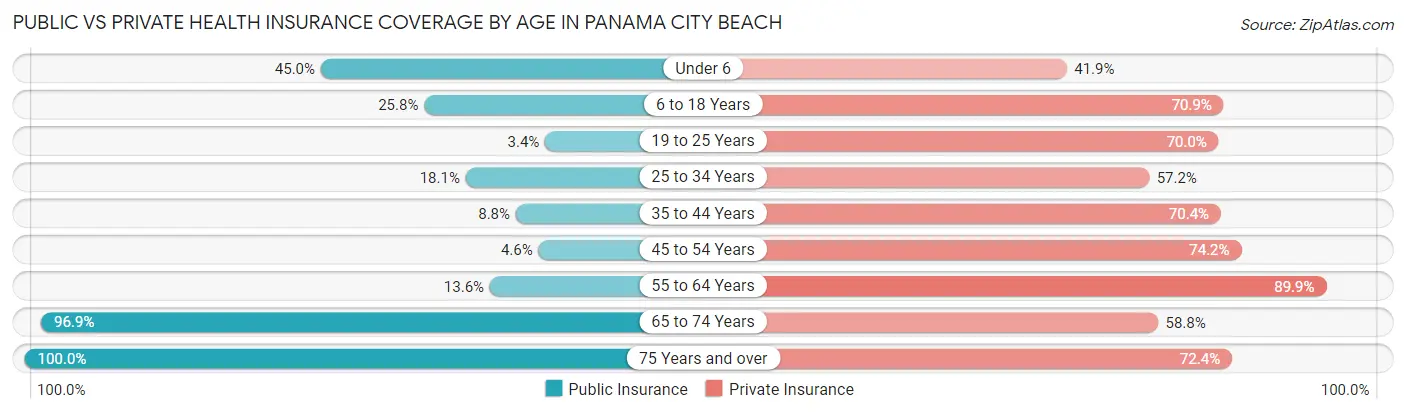
| Age Bracket | Public Insurance | Private Insurance |
| Under 6 | 343 (45.0%) | 319 (41.9%) |
| 6 to 18 Years | 595 (25.8%) | 1,633 (70.9%) |
| 19 to 25 Years | 52 (3.4%) | 1,080 (70.0%) |
| 25 to 34 Years | 370 (18.1%) | 1,167 (57.2%) |
| 35 to 44 Years | 190 (8.8%) | 1,517 (70.4%) |
| 45 to 54 Years | 124 (4.6%) | 1,998 (74.2%) |
| 55 to 64 Years | 444 (13.6%) | 2,929 (89.9%) |
| 65 to 74 Years | 2,059 (96.9%) | 1,249 (58.8%) |
| 75 Years and over | 1,095 (100.0%) | 793 (72.4%) |
| Total | 5,272 (29.3%) | 12,685 (70.6%) |
Disability Status by Sex by Age in Panama City Beach
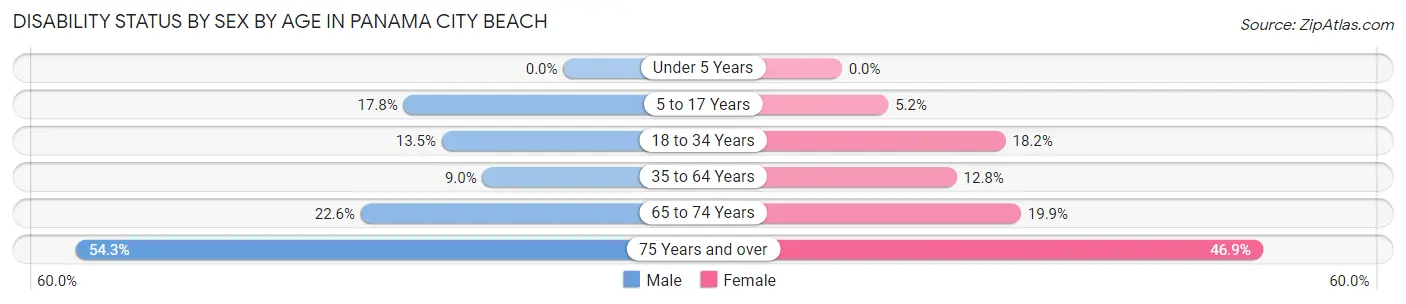
| Age Bracket | Male | Female |
| Under 5 Years | 0 (0.0%) | 0 (0.0%) |
| 5 to 17 Years | 196 (17.8%) | 65 (5.2%) |
| 18 to 34 Years | 273 (13.5%) | 303 (18.2%) |
| 35 to 64 Years | 347 (9.0%) | 544 (12.8%) |
| 65 to 74 Years | 245 (22.6%) | 207 (19.9%) |
| 75 Years and over | 293 (54.3%) | 260 (46.9%) |
Disability Class by Sex by Age in Panama City Beach
Disability Class: Hearing Difficulty
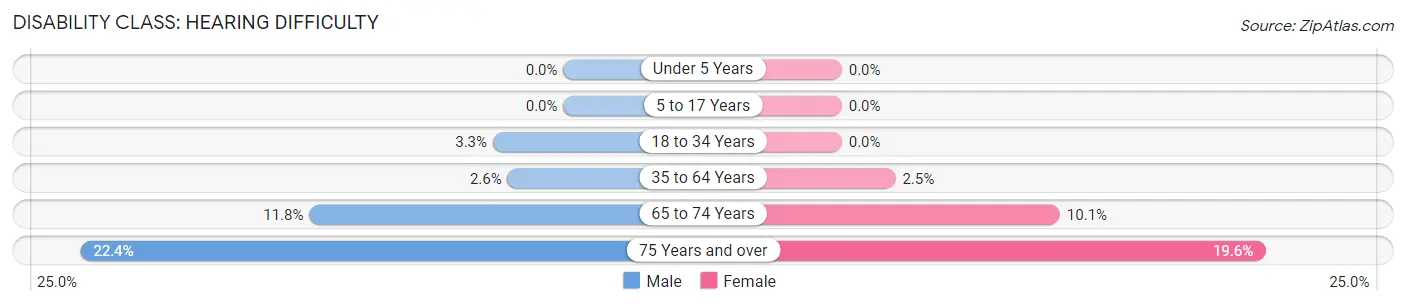
| Age Bracket | Male | Female |
| Under 5 Years | 0 (0.0%) | 0 (0.0%) |
| 5 to 17 Years | 0 (0.0%) | 0 (0.0%) |
| 18 to 34 Years | 66 (3.3%) | 0 (0.0%) |
| 35 to 64 Years | 100 (2.6%) | 106 (2.5%) |
| 65 to 74 Years | 128 (11.8%) | 105 (10.1%) |
| 75 Years and over | 121 (22.4%) | 109 (19.6%) |
Disability Class: Vision Difficulty
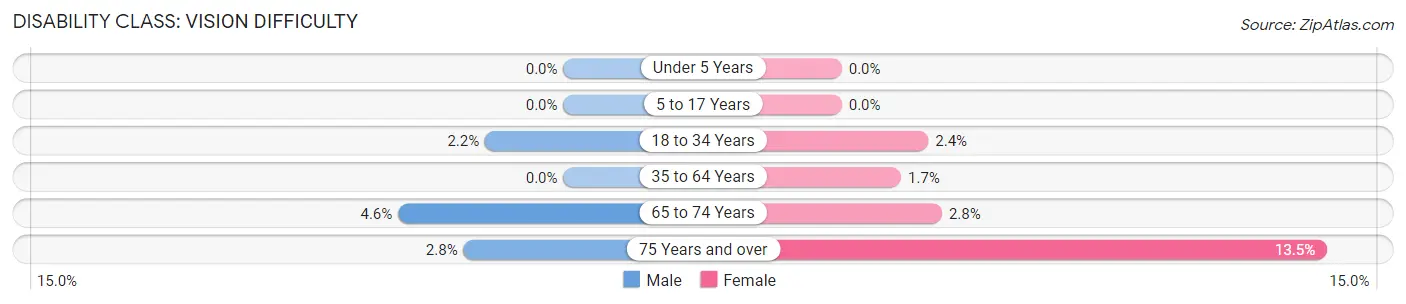
| Age Bracket | Male | Female |
| Under 5 Years | 0 (0.0%) | 0 (0.0%) |
| 5 to 17 Years | 0 (0.0%) | 0 (0.0%) |
| 18 to 34 Years | 44 (2.2%) | 40 (2.4%) |
| 35 to 64 Years | 0 (0.0%) | 70 (1.7%) |
| 65 to 74 Years | 50 (4.6%) | 29 (2.8%) |
| 75 Years and over | 15 (2.8%) | 75 (13.5%) |
Disability Class: Cognitive Difficulty
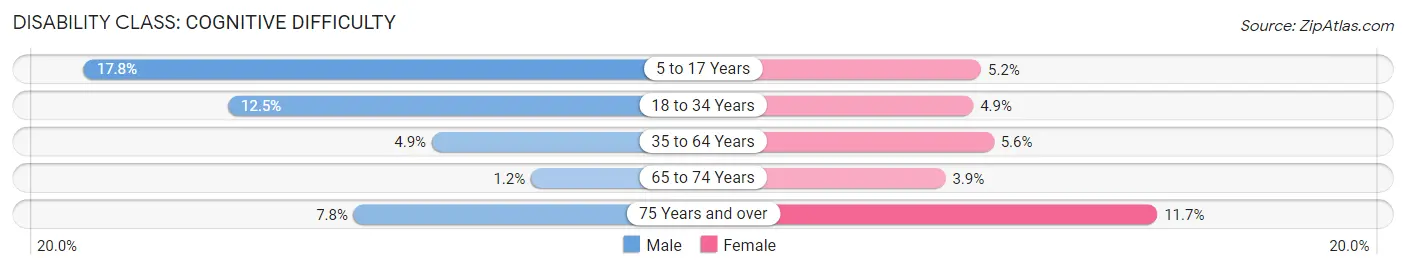
| Age Bracket | Male | Female |
| 5 to 17 Years | 196 (17.8%) | 65 (5.2%) |
| 18 to 34 Years | 251 (12.4%) | 81 (4.9%) |
| 35 to 64 Years | 188 (4.9%) | 240 (5.6%) |
| 65 to 74 Years | 13 (1.2%) | 40 (3.8%) |
| 75 Years and over | 42 (7.8%) | 65 (11.7%) |
Disability Class: Ambulatory Difficulty
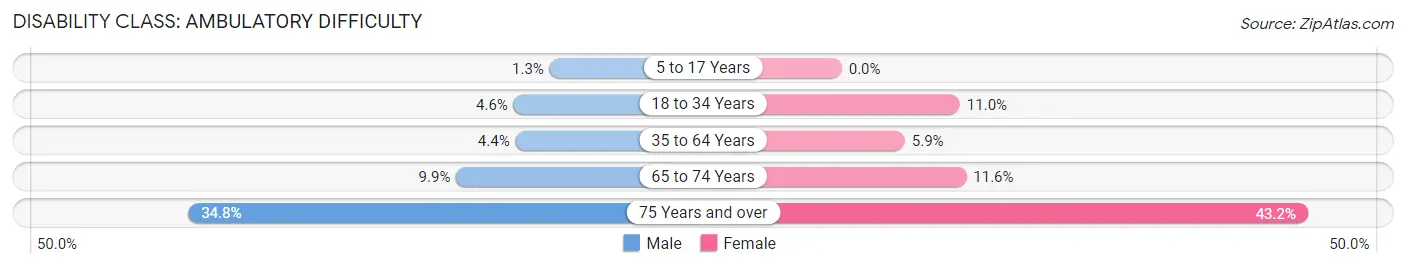
| Age Bracket | Male | Female |
| 5 to 17 Years | 14 (1.3%) | 0 (0.0%) |
| 18 to 34 Years | 93 (4.6%) | 182 (11.0%) |
| 35 to 64 Years | 171 (4.4%) | 249 (5.9%) |
| 65 to 74 Years | 108 (9.9%) | 120 (11.6%) |
| 75 Years and over | 188 (34.8%) | 240 (43.2%) |
Disability Class: Self-Care Difficulty
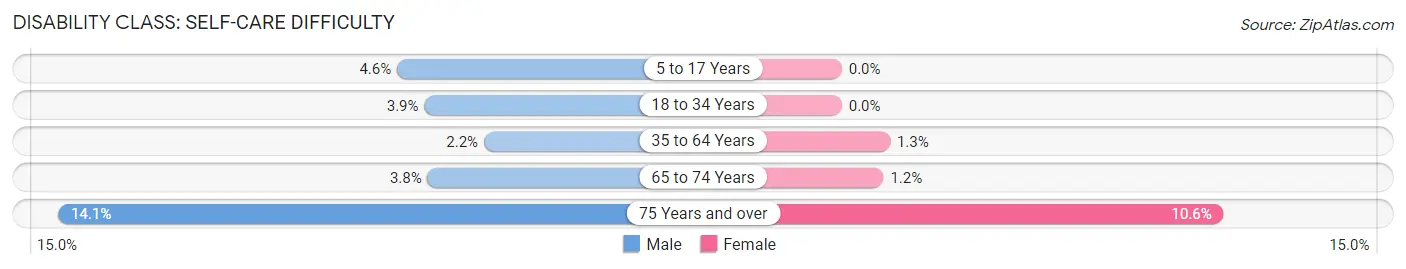
| Age Bracket | Male | Female |
| 5 to 17 Years | 51 (4.6%) | 0 (0.0%) |
| 18 to 34 Years | 78 (3.9%) | 0 (0.0%) |
| 35 to 64 Years | 85 (2.2%) | 57 (1.3%) |
| 65 to 74 Years | 41 (3.8%) | 12 (1.2%) |
| 75 Years and over | 76 (14.1%) | 59 (10.6%) |
Technology Access in Panama City Beach
Computing Device Access in Panama City Beach
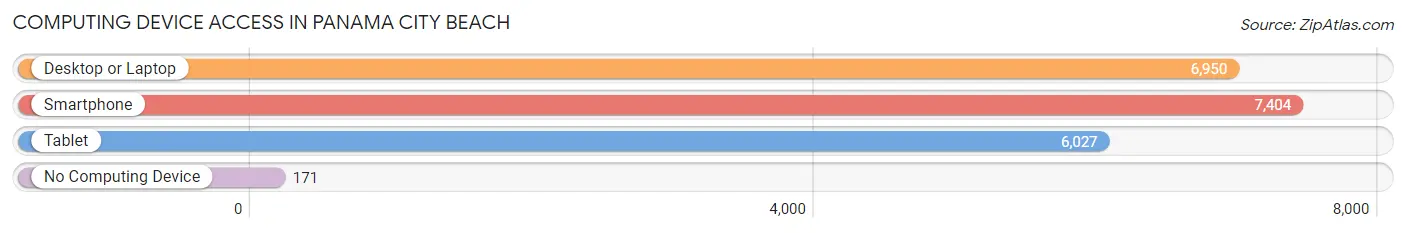
| Device Type | # Households | % Households |
| Desktop or Laptop | 6,950 | 85.1% |
| Smartphone | 7,404 | 90.7% |
| Tablet | 6,027 | 73.8% |
| No Computing Device | 171 | 2.1% |
| Total | 8,163 | 100.0% |
Internet Access in Panama City Beach
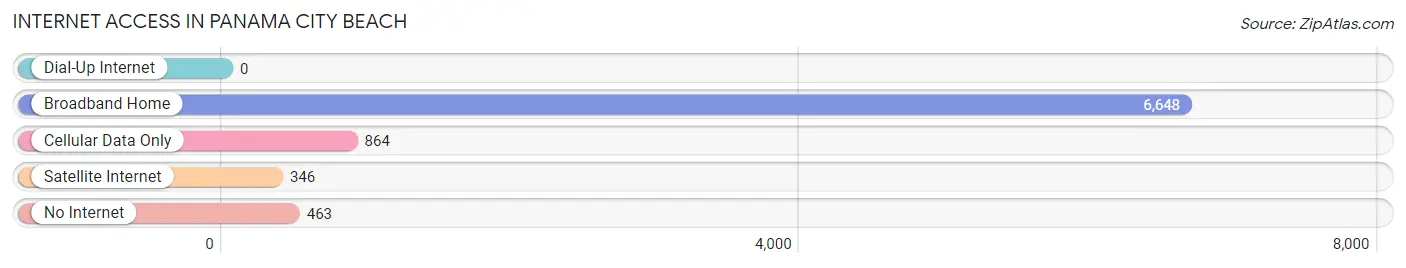
| Internet Type | # Households | % Households |
| Dial-Up Internet | 0 | 0.0% |
| Broadband Home | 6,648 | 81.4% |
| Cellular Data Only | 864 | 10.6% |
| Satellite Internet | 346 | 4.2% |
| No Internet | 463 | 5.7% |
| Total | 8,163 | 100.0% |
Panama City Beach Summary
Panama City Beach is a city located in Bay County, Florida, United States, on the Gulf of Mexico coast. As of the 2010 census, the population was 12,018. The city is often referred to under the umbrella term of "Panama City", despite being a distinct municipality from the older and larger inland Panama City to the east, making Panama City and Panama City Beach two separate cities. Panama City Beach's slogan is "The World's Most Beautiful Beaches" due to the unique, sugar-white sandy beaches of northwest Florida.
History
The area now known as Panama City Beach has been inhabited for thousands of years by indigenous peoples. The first Europeans to visit the area were Spanish explorers in the 16th century, who named the area "Panama City" after the nearby Panama Canal. The area remained largely undeveloped until the late 19th century, when it began to attract settlers from the United States and other countries.
In the early 20th century, the area was developed as a resort destination, with the construction of several hotels and other tourist attractions. The area was incorporated as a city in 1959, and has since grown to become one of the most popular beach destinations in the United States.
Geography
Panama City Beach is located in Bay County, Florida, on the Gulf of Mexico coast. It is bordered to the east by Panama City, to the north by the unincorporated community of Laguna Beach, and to the south by the unincorporated community of Southport. The city covers an area of approximately 16 square miles, with a population density of 745 people per square mile.
The city is located on a barrier island, with the Gulf of Mexico to the south and St. Andrews Bay to the north. The city is characterized by its white sand beaches, which are among the finest in the world. The city is also home to several state parks, including St. Andrews State Park and Camp Helen State Park.
Economy
The economy of Panama City Beach is largely driven by tourism. The city is home to several large resorts, as well as numerous smaller hotels, motels, and vacation rental properties. The city is also home to several attractions, including the Gulf World Marine Park, Shipwreck Island Waterpark, and WonderWorks.
The city is also home to several retail and dining establishments, as well as a variety of entertainment venues. The city is home to several marinas, which provide access to fishing, boating, and other water activities.
Demographics
As of the 2010 census, the population of Panama City Beach was 12,018. The racial makeup of the city was 92.3% White, 4.2% African American, 0.5% Native American, 0.7% Asian, 0.1% Pacific Islander, 0.9% from other races, and 1.3% from two or more races. Hispanic or Latino of any race were 3.2% of the population.
The median household income in Panama City Beach was $45,837, and the median family income was $51,837. The per capita income for the city was $25,945. About 8.3% of families and 11.2% of the population were below the poverty line, including 16.2% of those under age 18 and 5.2% of those age 65 or over.
Common Questions
What is Per Capita Income in Panama City Beach?
Per Capita income in Panama City Beach is $47,615.
What is the Median Family Income in Panama City Beach?
Median Family Income in Panama City Beach is $88,041.
What is the Median Household income in Panama City Beach?
Median Household Income in Panama City Beach is $76,091.
What is Income or Wage Gap in Panama City Beach?
Income or Wage Gap in Panama City Beach is 28.1%.
Women in Panama City Beach earn 71.9 cents for every dollar earned by a man.
What is Inequality or Gini Index in Panama City Beach?
Inequality or Gini Index in Panama City Beach is 0.43.
What is the Total Population of Panama City Beach?
Total Population of Panama City Beach is 18,281.
What is the Total Male Population of Panama City Beach?
Total Male Population of Panama City Beach is 9,229.
What is the Total Female Population of Panama City Beach?
Total Female Population of Panama City Beach is 9,052.
What is the Ratio of Males per 100 Females in Panama City Beach?
There are 101.96 Males per 100 Females in Panama City Beach.
What is the Ratio of Females per 100 Males in Panama City Beach?
There are 98.08 Females per 100 Males in Panama City Beach.
What is the Median Population Age in Panama City Beach?
Median Population Age in Panama City Beach is 45.3 Years.
What is the Average Family Size in Panama City Beach
Average Family Size in Panama City Beach is 2.6 People.
What is the Average Household Size in Panama City Beach
Average Household Size in Panama City Beach is 2.2 People.
How Large is the Labor Force in Panama City Beach?
There are 10,730 People in the Labor Forcein in Panama City Beach.
What is the Percentage of People in the Labor Force in Panama City Beach?
67.6% of People are in the Labor Force in Panama City Beach.
What is the Unemployment Rate in Panama City Beach?
Unemployment Rate in Panama City Beach is 2.8%.